United
States
SECURITIES
AND EXCHANGE COMMISSION
Washington,
D.C. 20549
FORM
20-F
|
[ ]
|
|
REGISTRATION
STATEMENT PURSUANT TO SECTION 12(b) OR (g) OF THE SECURITIES
EXCHANGE ACT OF 1934
|
OR
|
[X]
|
|
ANNUAL
REPORT PURSUANT TO SECTION 13 OR 15(d) OF THE SECURITIES EXCHANGE
ACT OF 1934
|
For
the fiscal year ended: June 30, 2016
OR
|
[ ]
|
|
TRANSITION
REPORT PURSUANT TO SECTION 13 OR 15(d) OF THE SECURITIES EXCHANGE
ACT OF 1934
|
OR
|
[ ]
|
|
SHELL
COMPANY REPORT PURSUANT TO SECTION 13 OR 15(d) OF THE SECURITIES
EXCHANGE ACT OF 1934
Date
of event requiring this shell company report ___
For
the transition period from ___ to___
|
Commission
file number: 001-29190
CRESUD
SOCIEDAD ANONIMA COMERCIAL INMOBILIARIA FINANCIERA Y
AGROPECUARIA
(Exact
name of Registrant as specified in its charter)
CRESUD
INC.
(Translation
of Registrant’s name into English)
Republic
of Argentina
(Jurisdiction
of incorporation or organization)
Moreno
877, 23 Floor,
(C1091AAQ)
City of Buenos Aires, Argentina
(Address
of principal executive offices)
Matías
Gaivironsky
Chief
Financial and Administrative Officer
Tel
+(5411) 4323-7449 – finanzas@cresud.com.ar
Moreno
877, 24 Floor,
(C1091AAQ)
City of Buenos Aires, Argentina
(Name,
Telephone, E-mail and/or Facsimile number and Address of Company
Contact Person)
Securities
registered or to be registered pursuant to Section 12(b) of the
Act:
|
Title
of each class
|
|
|
|
Name
of each exchange on which registered
|
|
|
|
|
||
|
American
Depositary Shares, each representing
ten
shares of Common Stock
|
|
|
|
Nasdaq
National Market of the
Nasdaq
Stock Market
|
|
|
|
|
||
|
Common
Stock, par value one Peso per share
|
|
|
|
Nasdaq
National Market of the
Nasdaq
Stock Market*
|
|
*
|
Not for trading,
but only in connection with the registration of American Depositary
Shares, pursuant to the requirements of the Securities and Exchange
Commission.
|
Securities
registered or to be registered pursuant to Section 12(g) of the
Act: None
Securities
for which there is a reporting obligation pursuant to
Section 15(d) of the Act: None
The number of
outstanding shares of the issuer’s common stock as of June
30, 2016 was 501,642,804.
Indicate by check
mark if the registrant is a well known seasoned issuer, as defined
in Rule 405 of the Securities Act:
☐
Yes
☒
No
If this report is
an annual or transition report, indicate by check mark if the
registrant is not required to file reports pursuant to Section 13
or 15 (d) of the Securities Exchange Act of 1934.
☒
Yes
☐
No
Indicate by check
mark whether the registrant (1) has filed all reports required to
be filed by Section 13 or 15(d) of the Securities Exchange Act of
1934 during the preceding 12 months (or for such shorter period
that the registrant was required to file such reports), and (2) has
been subject to such filing requirements for the past 90
days.
☒
Yes
☐
No
Indicate by check
mark whether the registrant has submitted electronically and posted
on its corporate Web site, if any, every Interactive Date File
required to be submitted and posted pursuant to Rule 405 of
Regulation S-T (232.405 of this chapter) during the preceding 12
months (or for such shorter period that the registrant was required
to submit and post such files).
☐
Yes
☒
No
Indicate by check
mark whether the registrant is a large accelerated filer, an
accelerated filer, or a non-accelerated filer. See definition of
“accelerated filer and large accelerated filer” in Rule
12b-2 of the Exchange Act. (check one):
Large accelerated
filer
☐
Accelerated filer
☒
Non-accelerated filer ☐
Indicate by check
mark which basis of accounting the registrant has used to prepare
the financial statements included in this filing:
|
|
|
|
|
|
|
U.S. GAAP
|
☐
|
International
Financial Reporting Standards as issued by the International
Accounting Standards Board
|
☒
|
Other
☐
|
If
“Other” has been checked in response to the previous
question, indicate by check mark which financial statement item the
registrant has elected to follow.
☐
Item
17
☐
Item 18
If this is an
annual report, indicate by check mark whether the registrant is a
shell company (as defined in Rule 12b-2 of the Exchange
Act).
☐
Yes
☒
No
TABLE
OF CONTENTS
|
|
Page No.
|
|
|
|
|
Disclosure Regarding Forward-Looking Information
|
iii
|
|
Certain Measures and Terms
|
iii
|
|
Presentation of Financial and Certain Other
Information
|
iii
|
|
Market Data
|
iv
|
|
Part I
|
1
|
|
Item 1. Identity of Directors, Senior Management and
Advisers
|
1
|
|
Item 2. Offer Statistics and Expected Timetable
|
1
|
|
Item 3. Key Information
|
1
|
|
A. Selected Consolidated Financial Data
|
1
|
|
B. Capitalization and Indebtedness
|
6
|
|
C. Reasons for the Offer and Use of Proceeds
|
6
|
|
D. Risk Factors
|
6
|
|
Item 4. Information on the Company
|
36
|
|
A. History and Development of the Company
|
36
|
|
B. Business Overview
|
42
|
|
C. Organizational Structure
|
103
|
|
D. Property, Plants and Equipment
|
104
|
|
Item 4A. Unresolved Staff Comments
|
107
|
|
Item 5. Operating and Financial Review and Prospects
|
107
|
|
A. Consolidated Operating Results
|
107
|
|
B. Liquidity and Capital Resources
|
175
|
|
C. Research and Developments, Patents and Licenses
|
181
|
|
D. Trend Information
|
181
|
|
E. Off-Balance Sheet Arrangements
|
183
|
|
F. Tabular Disclosure of Contractual Obligations
|
184
|
|
G. Safe Harbor
|
184
|
|
Item 6. Directors, Senior Management and Employees
|
184
|
|
A. Directors and Senior Management
|
184
|
|
B. Compensation
|
187
|
|
C. Board Practices
|
188
|
|
D. Employees
|
188
|
|
E. Share Ownership
|
189
|
|
Item 7. Major shareholders and related party
transactions
|
190
|
|
A. Major Shareholders
|
190
|
|
B. Related Party Transactions
|
191
|
|
C. Interests of Experts and Counsel
|
194
|
|
Item 8. Financial Information
|
194
|
|
A. Audited Consolidated Statements and Other Financial
Information
|
194
|
|
B. Significant Changes
|
199
|
|
Item 9. The Offer and Listing
|
199
|
|
A. Offer and Listing Details
|
199
|
|
B. Plan of Distribution
|
200
|
|
C. Markets
|
200
|
|
D. Selling Shareholders
|
202
|
|
E. Dilution
|
202
|
|
F. Expenses of the Issue
|
202
|
|
Item 10. Additional Information
|
202
|
|
A. Share Capital
|
202
|
|
B. Memorandum and Articles of Association
|
202
|
|
C. Material Contracts
|
206
|
|
D. EXCHANGE CONTROLS
|
206
|
|
E. Taxation
|
208
|
|
F. Dividends and Paying Agents
|
213
|
|
G. Statement by Experts
|
213
|
|
H. Documents on Display
|
213
|
|
I. Subsidiary Information
|
213
|
|
Item 11. Quantitative and Qualitative Disclosures about Market
Risk
|
213
|
|
Item 12. Description of Securities Other than Equity
Securities
|
213
|
|
Part II
|
214
|
|
Item 13. Defaults, Dividend Arrearages and
Delinquencies
|
214
|
|
Item 14. Material Modifications to the Rights of Security Holders
and Use of Proceeds
|
214
|
|
Item 15. Controls and Procedures
|
214
|
|
A. Disclosure Controls and Procedures
|
214
|
|
B. Management´s Annual Report on Internal Control Over
Financial Reporting
|
214
|
|
C. Attestation Report of the Registered Public Accounting
Firm
|
214
|
|
D. Changes in Internal Control Over Financial
Reporting
|
214
|
|
Item 16.
|
214
|
|
A. Audit Committee Financial Expert
|
214
|
|
B. Code of Ethics
|
215
|
|
C. Principal Accountant Fees and Services
|
215
|
|
D. Exemption from the Listing Standards for Audit
Committees
|
215
|
|
E. Purchases of Equity Securities by the Issuer and Affiliated
Purchasers
|
215
|
|
F. Change in Registrant’s Certifying Accountant
|
216
|
|
G. Corporate Governance
|
216
|
|
H. Mine Safety Disclosures
|
218
|
i
|
Part III
|
218
|
|
Item 17. Financial Statements
|
218
|
|
Item 18. Financial Statements
|
218
|
|
Item 19. Exhibits
|
218
|
ii
DISCLOSURE
REGARDING FORWARD-LOOKING INFORMATION
The U.S. Private
Securities Litigation Reform Act of 1995 provides a “safe
harbor” for forward-looking statements.
This annual report
includes forward-looking statements, principally under the captions
“Summary”, “Item 3.D. Risk
Factors”, “Item 4. Information on the
Company” and “Item 5. Operating and Financial
Review and Prospects”. We have based these forward-looking
statements largely on our current beliefs, expectations and
projections about future events and financial trends affecting our
business. Many important factors, in addition to those discussed
elsewhere in this annual report, could cause our actual results to
differ substantially from those anticipated in our forward-looking
statements, including, among other things:
·
changes in general
economic, business, political, legal, social or other conditions in
Argentina or elsewhere in Latin America or in Israel or changes in
developed or emerging markets
·
changes in capital
markets in general that may affect policies or attitudes toward
lending to Argentina or Argentine companies;
·
inflation and
deflation;
·
fluctuations in
prevailing interest rates;
·
current and future
government regulation;
·
adverse legal or
regulatory disputes or proceedings;
·
fluctuations and
declines in the value of Argentine public debt;
·
political events,
civil strife and armed conflicts;
·
government
intervention in the private sector, including through
nationalization, expropriation, labor regulation or other
actions;
·
restrictions on
transfer of foreign currencies;
·
competition in the
shopping center sector, office or other commercial properties and
related industries;
·
potential loss of
significant tenants at our shopping centers, offices or other
commercial properties;
·
our ability to
timely transact in the real estate market in Argentina or
Israel;
·
our ability to meet
our debt obligations;
·
shifts in consumer
purchasing habits and trends;
·
technological
changes and our potential inability to implement new
technologies;
·
deterioration in
regional, national or global businesses and economic
conditions;
·
fluctuations and
declines in the exchange rate of the Peso and the NIS against other
currencies;
·
risks related to
our investment in Israel; and
·
the risk factors
discussed under “Item 3.D. Risk
Factors”.
The words
“believe”, “may”, “will”,
“aim”, “estimate”, “continue”,
“anticipate”, “intend”,
“expect”, “forecast”,
“foresee”, “understand” and similar other
words identify forward-looking statements. Forward-looking
statements include information concerning our possible or assumed
future results of operations, business strategies, financing plans,
competitive position, industry environment, potential growth
opportunities, the effects of future regulation and the effects of
competition. Forward-looking statements speak only as of the date
they were made, and we undertake no obligation to update publicly
or to revise any forward-looking statements after we distribute
this annual report because of new information, future events or
other factors. In light of the risks and uncertainties described
above, the forward-looking events and circumstances discussed in
this annual report might not occur and are not guarantees of future
performance.
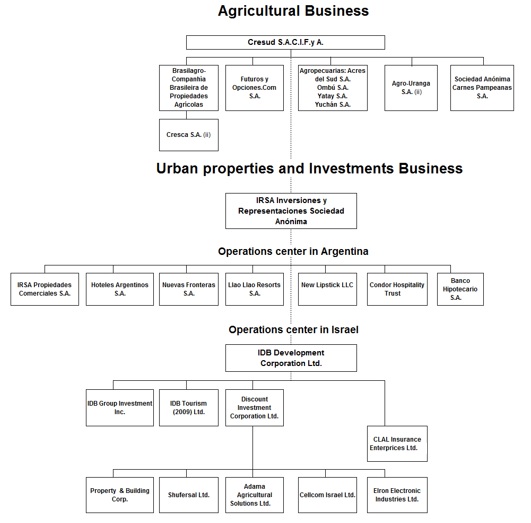
As of June 30,
2016, the Company has established two operations centers to manage
its global business, “Operations Center in Argentina”
and “Operations Center in Israel
”
.
You should not
place undue reliance on such statements which speak only as of the
date that they were made. These cautionary statements should be
considered in connection with any written or oral forward-looking
statements that we may issue in the future.
CERTAIN
MEASURES AND TERMS
As used throughout
this annual report, the terms “Cresud”,
“Company”, “we”, “us”, and
“our” refer to Cresud Sociedad Anónima Comercial,
Inmobiliaria, Financiera y Agropecuaria, together with our
consolidated subsidiaries, except where we make clear that such
terms refer only to the parent company.
References to
“Tons”, “tons” or “Tns.” are to
metric tons, to “kgs” are to kilograms, to
“ltrs” are to liters, “Hct” are to
hectares, “m2” and “square meters” are to
square meters, while in the United States and certain other
jurisdictions, the standard measure of area is the square foot
(sq.ft). A metric ton is equal to 1,000 kilograms. A kilogram is
equal to approximately 2.2 pounds. A metric ton of wheat is equal
to approximately 36.74 bushels. A metric ton of corn is equal to
approximately 39.37 bushels. A metric ton of soybean is equal to
approximately 36.74 bushels. A square meter is equal to 10.77 sq.
ft. One gallon is equal to 3.7854 liters. One hectare is equal to
approximately 2.47 acres and 10,000 square meters. One square meter
is equal to approximately 10.764 square feet. One kilogram of live
weight cattle is equal to approximately 0.5 to 0.6 kilogram of
carcass (meat and bones).
As used herein:
“GLA or gross leasable area”, in the case of shopping
centers, refers to the total leasable area of the property,
regardless of our ownership interest in such property (excluding
common areas and parking and space occupied by supermarkets,
hypermarkets, gas stations and co-owners, except where specifically
stated).
PRESENTATION
OF FINANCIAL AND CERTAIN OTHER INFORMATION
FINANCIAL
STATEMENTS
This annual report
contains our Audited Consolidated Financial Statements as of June
30, 2016 and 2015 for our fiscal years ended June 30, 2016, 2015
and 2014 (our “Audited Consolidated Financial
Statements”). Our Audited Consolidated Financial Statements
included elsewhere herein have been audited by
Price Waterhouse
& Co S.R.L. City of Buenos Aires, Argentina, member of
PriceWaterhouseCoopers International Limited, an independent
registered public accounting firm whose report is included
herein.
iii
Pursuant to
Resolution N° 562/09 issued by the Argentine
Comisión Nacional de Valores
(“CNV”), as subsequently amended by Resolution N°
576/10, and further amended and restated by Resolution N°
622/13 (the “CNV Rules”), all listed companies in
Argentina with certain exceptions (i.e. financial institutions and
insurance entities) were required to present their consolidated
financial statements for accounting periods beginning on or after
January 1, 2012 in accordance with International Financial
Reporting Standards (“IFRS”) as issued by the
International Accounting Standards Board (“IASB”).
Therefore, in 2013 we prepared for the first time our Consolidated
Financial Statements under IFRS for our financial year ended June
30, 2013, which included comparative financial information for the
year ended June 30, 2012. All IFRS issued by the IASB effective at
the time of preparing the Audited Consolidated Financial Statements
have been applied. The opening IFRS statement of financial position
was prepared as of our transition date of July 1,
2011.
On October 11,
2015, the Company, through its subsidiaries, obtained control of
IDB Development Corporation (“IDBD”). IDBD’s
fiscal year ends on December 31 each year and the Company’s
fiscal year ends on June 30. IDBD’s quarterly and annual
reporting follows the guidelines of Israeli accounting standards,
which means that the information is only available to IRSA after
the applicable statutory periods expire. Therefore, the Company has
started to consolidate IDBD’s results of operations with a
three-month lag, adjusted for the effects of material transactions
that may have taken place during the reported period. Hence,
IDBD’s results of operations for the period beginning on
October 11, 2015 (the date the Company obtained control of IDBD)
through March 31, 2016, are included in the Company’s
consolidated statement of comprehensive income for the fiscal year
ended June 30, 2016, adjusted by such material transactions that
occurred between April 1 and June 30, 2016, mainly due to the
decrease of the market price of Clal’s shares and the impact
of such decrease in our registration of the investment in
Clal.
Given the
materiality of IDBD’s results on the Company’s
consolidated results, the Company had to make changes on the
presentation format of its financial information for ease of
analysis. The most significant change is in line with the new
organizational structure, which was split into two large operations
centers in Argentina and Israel. In this regard, changes have been
made to certain notes and tables and their respective order,
classification and content, on a geographic basis and taking into
consideration the significance of the Company’s global
operations following IDBD’s consolidation.
As of June 30,
2016, IRSA has established two Operations Centers to manage its
global business, mainly through the following
companies:
MARKET
DATA
Market data used
throughout this annual report was derived from reports prepared by
unaffiliated third-party sources. Such reports generally state that
the information contained therein has been obtained from sources
believed by such sources to be reliable. Certain market data which
appears herein (including percentage amounts) may not sum due to
rounding.
In this annual
report where we refer to “Peso”, “Pesos”,
or “Ps.” we mean Argentine Pesos, the lawful currency
in Argentina; when we refer to “U.S. Dollars”, or
“US$” we mean United States Dollars, the lawful
currency of the United States of America; when we refer to
“
Real
”,
“
Real
s”,
“Rs.” or “R$” we mean Brazilian
Real
, the lawful currency
in the Federative Republic of Brazil; when we refer to
“NIS”, we mean New Israeli Shekels, the lawful currency
of Israel; and when we refer to “Central Bank” we mean
the
Banco Central de la
República Argentina
(Argentine Central
Bank).
Solely for the
convenience of the reader, we have translated certain Peso amounts
into U.S. Dollars at the offer exchange rate quoted by Banco de la
Nación Argentina for June 30, 2016, which was Ps. 15.04 = US$
1.00. We have also translated certain NIS amounts into U.S. dollars
at the offer exchange rate for June 30, 2016 which was NIS 3.8575=
US$ 1.00. We make no representation that the Peso, NIS or U.S.
dollar amounts actually represent or could have been or could be
converted into U.S. dollars at the rates indicated, at any
particular rate or at all.
iv
This item is not
applicable.
This item is not
applicable.
A.
SELECTED CONSOLIDATED FINANCIAL DATA
The following selected
consolidated financial data has been derived from our Audited
Consolidated Financial Statements as of the dates and for each of
the periods indicated below. This information should also be read
in conjunction with our Audited Consolidated Financial Statements
included under Item 8. “Financial Information”, and the
discussion in Item 5. “Operating and Financial Review and
Prospects”.
The selected
consolidated statements of (operations)/income and comprehensive
(loss)/income data for the years ended June 30, 2016, 2015 and 2014
and the selected consolidated statements of financial position data
as of June 30, 2016 and 2015 have been derived from our Audited
Consolidated Financial Statements included in this annual report
which have been audited by Price Waterhouse & Co S.R.L. City of
Buenos Aires, Argentina, member of PriceWaterhouseCoopers
International Limited, an independent registered public accounting
firm.
On October 11, 2015, we
acquired, through our subsidiary IRSA, control of IDBD. In
conformity with IFRS 3, IDBD’s information is included in our
financial statements since the acquisition date, without affecting
the information from previous years. Therefore, the consolidated
financial information for periods after the acquisition date is not
comparable to previous periods. For more information see Item 5.
“Operating and Financial Review and Prospects-Factors
Affecting Comparability of our Results.”
|
|
IFRS
|
|||||
|
|
For the
fiscal year ended June 30,
|
|||||
|
|
2016
(1)
|
2016
|
2015
|
2014
|
2013
|
2012
|
|
|
(in
millions of US$)
|
(in
millions of Ps.)
|
||||
|
Consolidated Statements of
(Operations)/Income
|
|
|
|
|
|
|
|
|
|
|
|
|
|
|
|
Revenues
|
2,353
|
35,384
|
5,652
|
4,604
|
3,529
|
2,860
|
|
Costs
|
(1,735)
|
(26,090)
|
(4,770)
|
(3,913)
|
(3,121)
|
(2,464)
|
|
Initial recognition and
changes in fair value of biological assets and agricultural produce
at the point of harvest
|
110
|
1,660
|
1,324
|
1,152
|
887
|
701
|
|
Changes in net
realizable value of agricultural produce after harvest
|
14
|
208
|
(34)
|
(18)
|
12
|
3
|
|
Gross Profit
|
742
|
11,162
|
2,172
|
1,825
|
1,307
|
1,100
|
|
|
|
|
|
|
|
|
|
Gain from disposal of
investment properties
|
73
|
1,101
|
1,150
|
231
|
178
|
117
|
|
Gain from disposal of
farmlands
|
-
|
(2)
|
550
|
91
|
150
|
45
|
|
General and
administrative expenses
|
(149)
|
(2,244)
|
(618)
|
(533)
|
(346)
|
(321)
|
|
Selling
expenses
|
(417)
|
(6,279)
|
(474)
|
(354)
|
(280)
|
(201)
|
|
Other operating
results, net
|
(3)
|
(44)
|
12
|
(75)
|
98
|
(93)
|
|
Profit from operations
|
246
|
3,694
|
2,792
|
1,185
|
1,107
|
647
|
|
|
|
|
|
|
|
|
|
Share of (loss)/profit
of associates and joint ventures
|
31
|
473
|
(1,025)
|
(409)
|
(10)
|
3
|
|
Profit from operations before financing and
taxation
|
277
|
4,167
|
1,767
|
776
|
1,097
|
650
|
|
|
|
|
|
|
|
|
|
Finance
income
|
131
|
1,974
|
241
|
288
|
201
|
139
|
|
Finance
cost
|
(513)
|
(7,719)
|
(1,685)
|
(2,852)
|
(1,125)
|
(757)
|
|
Other Financial
results
|
(34)
|
(510)
|
155
|
(10)
|
15
|
49
|
|
Financial results,
net
|
(416)
|
(6,255)
|
(1,289)
|
(2,574)
|
(909)
|
(569)
|
|
(Loss)/Profit before income
tax
|
(139)
|
(2,088)
|
478
|
(1,798)
|
188
|
81
|
|
Income tax
(expense)/benefit
|
13
|
197
|
(303)
|
389
|
(34)
|
(22)
|
|
(Loss)/Profit for the year
|
(126)
|
(1,891)
|
175
|
(1,409)
|
154
|
59
|
|
Attributable to:
|
|
|
|
|
|
|
|
Equity holders of the
parent
|
(69)
|
(1,038)
|
(250)
|
(1,068)
|
(27)
|
(21)
|
|
Non-controlling
interest
|
(57)
|
(853)
|
425
|
(341)
|
181
|
80
|
|
|
|
|
|
|
|
|
1
|
|
|
IFRS
|
||||
|
|
|
For the
fiscal year ended June 30,
|
||||
|
|
2016
(1)
|
2016
|
2015
|
2014
|
2013
|
2012
|
|
|
(in
millions of US$)
|
(in
millions of Ps.)
|
||||
|
Consolidated Statements of
Comprehensive (Operations)/Income
|
|
|
|
|
|
|
|
|
|
|
|
|
|
|
|
(Loss)/Profit for the
year
|
(126)
|
(1,891)
|
175
|
(1,409)
|
154
|
58
|
|
Other comprehensive
income:
|
|
|
|
|
||
|
Items that may be
reclassified subsequently to profit or loss:
|
|
|
|
|
|
|
|
Currency translation
adjustment
|
3
|
37
|
(521)
|
1,285
|
181
|
(231)
|
|
Share of currency
translation adjustment of joint ventures and associates accounted
for using the equity method
|
320
|
4,818
|
82
|
(17)
|
2
|
(3)
|
|
Share of change in the
fair value of hedging instruments of associates and joint ventures
accounted for using the equity method
|
(6)
|
(93)
|
-
|
-
|
-
|
-
|
|
Items that may not be
reclassified subsequently to profit or loss, net of income
tax:
|
|
|
|
|
|
|
|
Actuarial loss from
defined benefit plans net of income taxes
|
(3)
|
(42)
|
-
|
-
|
-
|
-
|
|
Other comprehensive
income/(loss) for the year
|
314
|
4,720
|
(439)
|
1,268
|
183
|
(234)
|
|
Total comprehensive income/(loss) for the
year
|
188
|
2,829
|
(264)
|
(141)
|
337
|
(176)
|
|
Attributable to:
|
|
|
|
|
|
|
|
Equity holders of the
parent
|
(43)
|
(646)
|
(440)
|
(437)
|
66
|
(103)
|
|
Non-controlling
interest
|
231
|
3,475
|
176
|
296
|
271
|
(73)
|
|
|
|
|
|
|
|
|
|
|
|
IFRS
|
||||
|
|
|
For the
fiscal year ended June 30,
|
||||
|
|
2016
(1)
|
2016
|
2015
|
2014
|
2013
|
2012
|
|
|
(in
millions of US$)
|
(in
millions of Ps.)
|
||||
|
CASH
FLOW DATA
|
|
|
|
|
|
|
|
Net cash generated from
operating activities
|
270
|
4,055
|
494
|
883
|
648
|
668
|
|
Net cash generated
from/(used in) investing activities
|
575
|
8,652
|
872
|
(886)
|
(93)
|
(354)
|
|
Net cash used in
financing activities
|
(299)
|
(4,495)
|
(1,776)
|
(446)
|
(17)
|
(479)
|
|
|
IFRS
|
|||||
|
|
As of
fiscal year ended June 30,
|
|||||
|
|
2016
(1)
|
2016
|
2015
|
2014
|
2013
|
2012
|
|
|
(in
millions of US$)
|
(in
millions of Ps.)
|
||||
|
Consolidated Statements of
Financial Position
|
|
|
|
|
|
|
|
ASSETS
|
|
|
|
|
|
|
|
Non-Current
Assets
|
|
|
|
|
|
|
|
Investment
properties
|
3,309
|
49,766
|
3,475
|
3,455
|
4,171
|
3,455
|
|
Property, plant and
equipment
|
1,749
|
26,300
|
1,977
|
2,382
|
1,841
|
1,873
|
|
Trading
properties
|
297
|
4,472
|
130
|
132
|
98
|
87
|
|
Intangible
assets
|
786
|
11,814
|
176
|
175
|
219
|
168
|
|
Biological
assets
|
45
|
677
|
459
|
445
|
303
|
278
|
|
Investments in
associates and joint ventures
|
1,099
|
16,534
|
2,389
|
2,375
|
1,487
|
1,501
|
|
Deferred income tax
assets
|
110
|
1,658
|
653
|
853
|
179
|
81
|
|
Income tax
credit
|
12
|
173
|
160
|
178
|
199
|
157
|
|
Restricted
assets
|
9
|
129
|
4
|
51
|
55
|
-
|
|
Trade and other
receivables
|
251
|
3,773
|
427
|
475
|
291
|
297
|
|
Assets held for
sale
|
222
|
3,346
|
-
|
-
|
-
|
-
|
|
Investment in financial
assets
|
148
|
2,226
|
623
|
275
|
254
|
626
|
|
Derivative financial
instruments
|
1
|
8
|
208
|
-
|
25
|
18
|
|
Employee
benefits
|
-
|
4
|
-
|
-
|
-
|
-
|
|
Total Non-Current Assets
|
8,038
|
120,880
|
10,681
|
10,796
|
9,122
|
8,541
|
|
Current Assets
|
|
|
|
|
|
|
|
Trading
properties
|
16
|
241
|
3
|
4
|
12
|
11
|
|
Biological
assets
|
30
|
455
|
120
|
196
|
98
|
85
|
|
Inventories
|
259
|
3,900
|
511
|
440
|
252
|
253
|
|
Restricted
assets
|
50
|
748
|
607
|
-
|
1
|
-
|
|
Income tax
credit
|
36
|
541
|
31
|
20
|
5
|
29
|
|
Assets held for
sale
|
84
|
1,256
|
-
|
1,358
|
-
|
-
|
|
Trade and other
receivables
|
941
|
14,158
|
1,772
|
1,438
|
1,480
|
859
|
|
Investment in financial
assets
|
643
|
9,673
|
504
|
496
|
386
|
72
|
|
Derivative financial
instruments
|
4
|
53
|
30
|
33
|
7
|
3
|
|
Cash and cash
equivalents
|
937
|
14,096
|
634
|
1,003
|
1,048
|
472
|
|
Total Current Assets
|
3,000
|
45,121
|
4,212
|
4,988
|
3,289
|
1,784
|
|
|
|
|
|
|
|
|
|
TOTAL ASSETS
|
11,038
|
166,001
|
14,893
|
15,784
|
12,411
|
10,325
|
2
|
|
As of
fiscal year ended June 30,
|
|||||
|
|
2016
(1)
|
2016
|
2015
|
2014
|
2013
|
2012
|
|
|
(in
millions of US$)
|
(in millions of
Ps.)
|
|
|||
|
SHAREHOLDERS’
EQUITY
|
|
|
|
|
|
|
|
|
|
|
|
|
|
|
|
Capital and Reserves
Attributable to Equity Holders of the Parent
|
|
|
|
|
|
|
|
Share
capital
|
33
|
495
|
495
|
491
|
497
|
497
|
|
Treasury
shares
|
-
|
7
|
7
|
11
|
5
|
5
|
|
Inflation adjustment of
share capital
|
4
|
65
|
64
|
64
|
65
|
165
|
|
Inflation adjustment of
treasury shares
|
-
|
-
|
-
|
1
|
1
|
1
|
|
Share
premium
|
44
|
659
|
659
|
773
|
773
|
773
|
|
Additional paid-in
capital from treasury shares
|
1
|
16
|
13
|
-
|
-
|
-
|
|
Cost of treasury
shares
|
-
|
-
|
(32)
|
(55)
|
-
|
-
|
|
Share
warrants
|
-
|
-
|
-
|
106
|
106
|
106
|
|
Cumulative translation
adjustment
|
-
|
-
|
-
|
-
|
-
|
-
|
|
Equity-settled
compensation
|
-
|
-
|
-
|
-
|
-
|
-
|
|
Changes in
non-controlling interest
|
-
|
-
|
-
|
-
|
-
|
-
|
|
Other
reserve
|
72
|
1,086
|
548
|
688
|
(12)
|
(87)
|
|
Legal
reserve
|
6
|
83
|
-
|
82
|
47
|
43
|
|
Reserve for new
developments
|
-
|
-
|
-
|
17
|
337
|
389
|
|
Special
reserve
|
-
|
-
|
-
|
634
|
696
|
-
|
|
Reserve for the
repurchase of securities
|
-
|
-
|
32
|
200
|
-
|
-
|
|
(Accumalated deficit) /
Retained Earnings
|
(90)
|
(1,390)
|
(806)
|
(1,066)
|
(27)
|
667
|
|
Equity Attributable to equity holders of the
parent
|
70
|
1,021
|
980
|
1,946
|
2,488
|
2,559
|
|
Non-controlling
interest
|
945
|
14,211
|
2,539
|
2,489
|
2,231
|
2,133
|
|
TOTAL SHAREHOLDERS’
EQUITY
|
1,015
|
15,232
|
3,519
|
4,435
|
4,719
|
4,692
|
|
|
|
|
|
|
|
|
|
LIABILITIES
|
|
|
|
|
|
|
|
Non-current
liabilities
|
|
|
|
|
|
|
|
Trade and other
payables
|
102
|
1,528
|
264
|
217
|
228
|
169
|
|
Borrowings
|
6,237
|
93,808
|
5,833
|
5,315
|
4,190
|
2,770
|
|
Deferred income tax
liabilities
|
509
|
7,662
|
151
|
470
|
530
|
630
|
|
Derivative financial
instruments
|
8
|
121
|
270
|
321
|
3
|
23
|
|
Payroll and social
security liabilities
|
1
|
21
|
5
|
5
|
4
|
1
|
|
Provisions
|
89
|
1,341
|
387
|
221
|
72
|
22
|
|
Employee
benefits
|
46
|
689
|
-
|
-
|
-
|
-
|
|
Total non-current
liabilities
|
6,992
|
105,170
|
6,910
|
6,549
|
5,027
|
3,615
|
|
Current
Liabilities
|
|
|
|
|
|
|
|
Trade and other
payables
|
1,226
|
18,443
|
1,307
|
1,004
|
900
|
587
|
|
Income tax
liabilities
|
41
|
624
|
142
|
73
|
92
|
118
|
|
Payroll and social
security liabilities
|
123
|
1,856
|
230
|
203
|
121
|
104
|
|
Borrowings
|
1,562
|
23,488
|
2,467
|
2,639
|
1,527
|
1,187
|
|
Derivative financial
instruments
|
10
|
147
|
263
|
53
|
9
|
18
|
|
Provisions
|
69
|
1,041
|
55
|
21
|
16
|
4
|
|
Liabilities directly
associated with assets classified as held for sale
|
-
|
-
|
-
|
807
|
-
|
-
|
|
Total current liabilities
|
3,031
|
45,599
|
4,464
|
4,800
|
2,665
|
2,018
|
|
TOTAL LIABILITIES
|
10,023
|
150,769
|
11,374
|
11,349
|
7,692
|
5,633
|
|
|
|
|
|
|
|
|
|
TOTAL SHAREHOLDERS’ EQUITY AND
LIABILITIES
|
11,038
|
166,001
|
14,893
|
15,784
|
12,411
|
10,325
|
|
|
|
|
|
|
|
|
|
|
|
IFRS
As
of fiscal year ended June 30,
|
|||||||
|
|
2016
(1)
|
2016
|
2015
|
2014
|
2013
|
2012
|
|||
|
Other
Financial Data
|
(in
US$, except for percentages, ratios and number of
shares)
|
(in
Ps, except for percentages, ratios, number of shares, per share and
per ADS data)
|
|||||||
|
|
|
|
|
|
|
|
|||
|
|
Basic net income
per share
(2)
|
(0.00)
|
(2.83)
|
0.23
|
(2.15)
|
(0.05)
|
(0.04)
|
||
|
|
Diluted net income
per share
(3)
|
(0.00)
|
(2.83)
|
0.21
|
(2.15)
|
(0.05)
|
(0.04)
|
||
|
|
Basic net income
per ADS
(2)(4)
|
(0.00)
|
(28.30)
|
2.30
|
(21.50)
|
(0.54)
|
(0.43)
|
||
|
|
Diluted net income
per ADS
(3)(4)
|
(0.00)
|
(28.30)
|
2.10
|
(21.50)
|
(0.54)
|
(0.43)
|
||
|
|
Capital
stock
|
33
|
502
|
502
|
502
|
502
|
502
|
||
|
|
Number of common
shares
|
501,642,804
|
501,642,804
|
501,642,804
|
501,562,730
|
501,562,730
|
501,562,534
|
||
|
|
Weighted –
average number of common shares outstanding
|
494,991,778
|
494,991,778
|
492,020,463
|
496,132,488
|
496,561,931
|
496,561,780
|
||
|
|
Diluted weighted
– average number of common shares
(5)
|
554,375,631
|
554,375,631
|
554,375,631
|
558,487,656
|
558,917,099
|
558,916,948
|
||
|
|
Dividends paid
(6)
|
-
|
-
|
-
|
-
|
120
|
120
|
||
3
|
|
Dividends per
share
|
-
|
-
|
-
|
-
|
-
|
-
|
||
|
|
Dividends per ADS
(4)
|
-
|
-
|
-
|
-
|
-
|
-
|
||
|
|
Depreciation and
amortization
|
184
|
2,769
|
259
|
297
|
280
|
233
|
||
|
|
Capital
expenditure
|
163
|
2,458
|
488
|
436
|
1,048
|
243
|
||
|
|
Working
capital
|
(32)
|
(478)
|
(252)
|
188
|
624
|
(234)
|
||
|
|
Gross margin
(7)
|
0.30
|
0.30
|
0.31
|
0.32
|
0.30
|
0.31
|
||
|
|
Operating margin
(8)
|
0.10
|
0.10
|
0.40
|
0.21
|
0.25
|
0.18
|
||
|
|
Net margin
(9)
|
(0.05)
|
(0.05)
|
0.03
|
(0.24)
|
0.03
|
0.02
|
||
|
|
Ratio of current
assets to current liabilities
(10)
|
0.99
|
0.99
|
0.94
|
1.04
|
1.23
|
0.88
|
||
|
|
Ratio of
shareholders’ equity to total liabilities
(11)
|
0.10
|
0.10
|
0.31
|
0.39
|
0.61
|
0.83
|
||
|
|
Ratio of non
current assets to total assets
(12)
|
0.73
|
0.73
|
0.73
|
0.68
|
0.73
|
0.83
|
||
|
|
Ratio of
“Return on Equity” – ROE
(13)
|
(0.19)
|
(0.19)
|
0.17
|
(0.31)
|
0.03
|
0.01
|
||
|
(1)
|
Solely for the
convenience of the reader, we have translated Peso amounts into
U.S. Dollars at the exchange rate quoted by Banco de La Nación
Argentina for June 30, 2016 which was Ps.15.04 = US$1.00. We make
no representation that the Peso or U.S. Dollar amounts actually
represent, could have been or could be converted into U.S. Dollars
at the rates indicated, at any particular rate or at
all.
|
|||
|
(2)
|
Basic net income
per share is computed by dividing the net income available to
common shareholders for the period by the weighted average common
shares outstanding during the period.
|
|||
|
(3)
|
Diluted net income
per share is computed by dividing the net income for the period by
the weighted average number of common shares assuming the total
conversion of outstanding notes and exercise of outstanding
options. Due to the loss for the years 2016, 2015, 2014, 2013 and
2012, there is no diluted effect on this result.
|
|||
|
(4)
|
Determined by
multiplying per share amounts by ten (one ADS equals ten common
shares).
|
|||
|
(5)
|
Assuming exercise
of all outstanding warrants to purchase our common
shares.
|
|||
|
(6)
|
The
shareholders’ meeting held in October 2013 approved the
distribution of a cash dividend for an amount of Ps.120 million for
the fiscal year ended June 30, 2013.
|
|||
|
(7)
|
Gross profit
divided by the sum of revenues and initial recognition and changes
in fair value of biological assets and agricultural produce at the
point of harvest.
|
|||
|
(8)
|
Operating income
divided by the sum of revenues and initial recognition and changes
in fair value of biological assets and agricultural produce at the
point of harvest.
|
|||
|
(9)
|
Net income divided
by the sum of revenues and initial recognition and changes in fair
value of biological assets and agricultural produce at the point of
harvest.
|
|||
|
(10)
|
Current assets over
current liabilities.
|
|||
|
(11)
|
Shareholders’
equity over total liabilities.
|
|||
|
(12)
|
Non-current assets
over total assets.
|
|||
|
(13)
|
Profitability
refers to Income for the year divided by average
Shareholders’ equity.
|
|||
|
|
|
|
|
|
LOCAL
EXCHANGE MARKET AND EXCHANGE RATES
During 2001 and
2015, Argentine government had established a series of exchange
control measures that restricted the free disposition of funds and
the transfer of funds abroad. In 2011, the Argentine government had
significantly curtailed access to foreign exchange by individuals
and private sector entities, making it necessary, among other
things, to obtain prior approval from the Central Bank to enter
into certain foreign exchange transactions such as payments
relating to royalties, services or fees payable to related parties
of Argentine companies outside Argentina.
With the change of
government, and political color, in December 2015, one of the first
measures taken by the Argentine government was to lift the
principal restrictions that limited access to individuals to
foreign exchange market. In this connection, Communication
“A” 5850 of the Central Bank admitted again the
possibility for individuals to have access to the local market,
however, up to a certain amount of money. As local economy became
stable in Argentina, and local markets reopened to foreign
commerce, the Central Bank issued on August 2016 Communication
“A” 6037 that lifted all remaining limitations.
Nowadays, all individuals have unrestrictive access to the local
exchange market, according to the conditions and procedures that
are explained in this document.
The following table
shows the maximum, minimum, average and closing exchange rates for
each period applicable to purchases of U.S. dollars.
|
|
Maximum
(1)(2)
|
Minimum
(1)(3)
|
Average
(1)(4)
|
At
closing
(1)
|
|
Fiscal year ended
June 30, 2012
|
4.5070
|
4.1250
|
4.3016
|
4.5070
|
|
Fiscal year ended
June 30, 2013
|
5.3680
|
4.5650
|
4.9339
|
5.3680
|
|
Fiscal year ended
June 30, 2014
|
8.0830
|
5.4850
|
6.9333
|
8.0830
|
|
Fiscal year ended
June 30, 2015
|
9.0380
|
8.1630
|
8.5748
|
9.0380
|
|
Fiscal year ended
June 30, 2016
|
15.7500
|
9.1400
|
12.2769
|
14.9900
|
|
April
2016
|
14.7400
|
14.0000
|
14.3367
|
14.2000
|
|
May
2016
|
14.1900
|
13.8700
|
14.0720
|
13.9410
|
|
June
2016
|
15.2500
|
13.6950
|
14.1343
|
14.9900
|
|
July
2016
|
15.1000
|
14.510
|
14.8410
|
14.9600
|
|
August
2016
|
15.0500
|
14.6100
|
14.7899
|
14.8800
|
|
September
2016
|
15.3400
|
14.8500
|
15.0666
|
15.2600
|
|
October 2016
(through October 13, 2016)
|
15.1600
|
15.0200
|
15.1153
|
15.0820
|
Source: Central
Bank
(1)
Average between the
offer exchange rate and the bid exchange rate according to Banco de
la Nación Argentina “foreign currency exchange
rate”, against Pesos.
(2)
The maximum
exchange rate appearing in the table was the highest end-of-month
exchange rate in the year or shorter period, as
indicated.
(3)
The minimum
exchange rate appearing in the table was the lowest end-of-month
exchange rate in the year or shorter period, as
indicated.
(4)
Average exchange
rates at the end of the month.
4
Although exchange
control regulations were lifted on August 2016, certain regulations
regarding the registration, disbursement, payment of principal and
interest and prepayments, among other exchange control measures
related to foreign indebtedness, remain in place, and we cannot
give you any assurance that additional exchange control regulations
will not be adopted in the future. See “Risk Factors—
Risks Relating to Argentina—Exchange controls and
restrictions on transfers abroad and capital inflow restrictions
have been limited in the past and may limit the availability of
international credit.”
Exchange controls
regulations currently in effect in Argentina include those
described below.
Registration Requirements
A debtor must
inform the Central Bank of any foreign indebtedness (financial and
commercial) it incurs and must register and validate such
indebtedness in accordance with Communication “A” 3602.
Compliance with such information with the Central Bank is required
in order to enable such debtor to purchase foreign currency in the
Argentine foreign exchange market for the purpose of servicing such
foreign indebtedness, among others.
In addition, all
new foreign indebtedness of Argentine residents, as well as any
refinancing of existing foreign debt, must provide that principal
repayments thereunder are subject to a 120-day waiting period in
which principal cannot be paid.
Disbursements
Pursuant to
Communication “A” 5850, Argentine residents are no
longer obliged to settle proceeds received from foreign
indebtedness through the local exchange market.
According to
Communication “A” 6037, Argentine residents will have
access to the local exchange money also at the time of
repayment of principal and interests.
Principal and Interest Payments
Foreign currency
necessary to pay principal and interest on foreign indebtedness,
according to Communication “A” 5850 and Communication
“A” 6037 can be purchased in the local exchange
market.
Corporate Profits and Dividends
Pursuant to foreign
exchange regulations, Argentine companies may freely access the
MULC for remittances abroad to pay earnings and dividends in-so-far
as they arise from closed and fully audited balance sheets and have
satisfied applicable certification requirements.
Restrictions on Foreign Indebtedness
In June 2005, the
Argentine government imposed certain additional restrictions on
inflows and outflows of foreign currency to the Argentine foreign
exchange market through Decree No. 616/2005 as amended and
supplemented by Resolution 3/2015, such as:
Minimum Term of Indebtedness
Financial
indebtedness incurred by Argentine residents with foreign creditors
(including refinancing of existing indebtedness) must be agreed
upon and cancelled within terms of no less than 120 calendar days
(waiting period), whatever the form of repayment thereof.
Additionally, no prepayment of such indebtedness may be made prior
to the expiration of such term, irrespective of the payment method
and whether or not termination entails the execution of a foreign
exchange trade in the local market.
Local Bank Account
The results of
inflows in the local exchange market required to be credited in an
account opened by a local financial entity, which can be
denominated in either local or foreign currency.
No Restrictions on Residents on the Purchase of Foreign
Currency
Other Exchange Control Measures
Subject to certain
conditions, Central Bank regulations allow the purchase of foreign
currency in the Argentine foreign exchange market for purposes of
making payments on account of financial derivatives.
The following table
shows the maximum, minimum, average and closing exchange rates for
each period applicable to purchases of New Israeli Shekels
(NIS).
|
|
Maximum
(1)(2)
|
|
Minimum
(1)(3)
|
|
Average
(1)(4)
|
|
At
closing
(1)
|
|
Fiscal year ended
June 30, 2014
|
3.6213
|
|
3.4320
|
|
3.5075
|
|
3.4320
|
|
Fiscal year ended
June 30, 2015
|
3.9831
|
|
3.4260
|
|
3.8064
|
|
3.7747
|
|
Fiscal year ended
June 30, 2016
|
3.9604
|
|
3.7364
|
|
3.8599
|
|
3.8596
|
|
Month ended April
30, 2016
|
3.8139
|
|
3.7364
|
|
3.7722
|
|
3.7364
|
|
Month ended May 31,
2016
|
3.8869
|
|
3.7511
|
|
3.8156
|
|
3.8526
|
|
Month ended June
30, 2016
|
3.8905
|
|
3.8141
|
|
3.8558
|
|
3.8596
|
|
Month ended July
31, 2016
|
3.8875
|
|
3.8131
|
|
3.8570
|
|
3.8131
|
|
Month ended August
31, 2016
|
3.8362
|
|
3.7592
|
|
3.7946
|
|
3.7768
|
|
Month ended
September 30, 2016
|
3.7853
|
|
3.7464
|
|
3.7642
|
|
3.7464
|
|
October 2016
(through October 13, 2016)
|
3.8155
|
|
3.7464
|
|
3.7901
|
|
3.8042
|
Source:
Bloomberg
(1)
Average between the
offer exchange rate and the bid exchange rate of the New Israeli
Shekel against the U.S. dollar.
(2)
The maximum
exchange rate appearing in the table was the highest end-of-month
exchange rate in the year or shorter period, as
indicated.
(3)
The minimum
exchange rate appearing in the table was the lowest end-of-month
exchange rate in the year or shorter period, as
indicated.
(4)
Average exchange
rates at the end of the month.
5
This section is not
applicable.
C.
REASONS FOR THE OFFER AND USE OF PROCEEDS
This section is not
applicable.
D.
RISK FACTORS
You should
carefully consider the risks described below, in addition to the
other information contained in this annual report, before making an
investment decision. We also may face additional risks and
uncertainties not currently known to us, or which as of the date of
this annual report we might not consider significant, which may
adversely affect our business. In general, you take more risk when
you invest in securities of issuers in emerging markets such as
Argentina than when you invest in securities of issuers in the
United States, and certain other markets. You should understand
that an investment in our common shares and American Depositary
Shares (“ADSs”) involves a high degree of risk,
including the possibility of loss of your entire
investment.
Operations Center in
Argentina
Risks Relating to Argentina
We are exposed to
economic conditions in Argentina, considering that as of the date
of this annual report, substantially all of our assets were located
in Argentina and all of our activities are conducted in Argentina.
The Argentine economy has experienced significant volatility in
recent decades, characterized by periods of low or negative growth,
high levels of inflation and currency devaluation, and may
experience further volatility in the future.
The ongoing
economic slowdown suggests uncertainty as to whether the economic
growth experienced in the past decade is sustainable. This is
mainly because economic growth was initially dependent on a
significant devaluation of the Peso, excess production capacity
resulting from a long period of deep recession and high commodity
prices. Furthermore, the economy has suffered from a sustained
erosion of direct investment and capital investment. After the 2001
economic crisis, Argentina recovered with significant increases in
gross domestic product (“GDP”) at an average of 8.5% on
an annual basis between 2003 and 2008. As a result of the 2008
global financial crisis, Argentina GDP’s growth rate
decreased to 0.9% in 2009, though growth rebounded to 9.2% in 2010
and 8.9% in 2011. During 2012, the Argentine economy experienced a
slowdown, with GDP increasing at a rate of 1.9%. In March 2014, the
Argentine government announced a new method of calculating GDP as
requested by the International Monetary Fund (“IMF”)
(using 2004 as the base year instead of 1993, which was the base
reference year used in the prior method of GDP calculation).
Following changes in the methodology used in calculating GDP, the
National Institute of Statistics (Instituto Nacional de
Estadisticas y Censos or “INDEC” as per its acronym in
Spanish) reported that Argentina’s GDP’s growth rate
for 2013 was 3%, 0.5% for 2014, this decrease was principally due
to the deceleration of the global economy and prevailing
macroeconomic conditions in Argentina during 2014, and 2.3% for
2015. As of July 31, 2016, the Monthly Economic Activity Estimator
(Estimador Mensual de Actividad Económica, or the
“EMAE”) decreased 5.9%, relative to the same period in
the prior year, according to data published by the INDEC.
Argentina’s relative stability since 2002 has been affected
by increased social and political tension and government
intervention in the economy.
Our business
depends to a significant extent on macroeconomic and political
conditions in Argentina. In early December 2015 Mr. Mauricio Macri,
was elected in Argentina. The President is expected, that hindered
economic worth to continue promoting legal measures to reverse some
of the previous presidential administrations, especially economic
policies and exchange control regulations. However, until any
changes in laws and regulations are enacted, we are uncertain how
any such changes may affect our business and results of operations.
Deterioration of the country’s economy would likely have a
significant adverse effect on our business, financial condition and
results of operations.
There are concerns about the accuracy of Argentina’s official
inflation statistics.
In January 2007,
the INDEC began to calculate the CPI, based on the monthly average
of a weighted basket of consumer goods and services to reflect the
pattern of consumption of Argentine households. At the time that
the INDEC adopted this change in methodology the Argentine
government also replaced several key officers at the INDEC,
prompting complaints of governmental interference from the
technical staff at the INDEC. In addition, the IMF requested a
number of times that INDEC clarify its methodology for measuring
inflation rates.
On November 23,
2010, the Argentine government began consulting with the IMF for
technical assistance in order to prepare a new national CPI data
with the aim of modernizing the current statistical system. During
the first quarter of 2011, a team from the IMF started
collaborating with the INDEC in order to create such an index.
Notwithstanding such efforts, reports published by the IMF stated
that its staff also used alternative measures of inflation for
macroeconomic surveillance, including data produced by private
sources, and such measures have shown inflation rates that are
considerably higher than those published by the INDEC since 2007.
Consequently, the IMF called on Argentina to adopt measures to
improve the quality of data used by the INDEC. At a meeting held on
February 1, 2013, the Executive Board of the IMF emphasized that
the progress in implementing remedial measures since September 2012
had been insufficient. As a result, the IMF has issued a
declaration of censure against Argentina in connection with the
breach of its related obligations to the IMF and called on
Argentina to adopt remedial measures to address the inaccuracy of
inflation and GDP data without further delay.
In order to address
the quality of official data, a new consumer price index
denominated Urban National Consumer’s Price Index (Indice de
Precios al Consumidor Nacional urbano, or the “IPCNu”),
was enacted on February 13, 2014. For the year ended December 31,
2014, the IPCNu was 23.9%. The IPCNu represents the first national
indicator in Argentina to measure changes in prices of household
goods for final consumption. While the previous price index only
measured inflation in the Greater Buenos Aires area, the IPCNu is
calculated by measuring prices of goods across the entire urban
population of the 23 provinces of Argentina and the City of Buenos
Aires. In addition, in February 2014, the INDEC released a new GDP
index for 2013, equal to 3.0%, which differs from the GDP index
originally released by the INDEC for the same period which was
5.5%. On December 15, 2014, the IMF recognized the progress of
Argentine authorities to remedy the inaccurate provision of data,
but has delayed the definitive evaluation of the new index. If the
IMF finds that the methodology of INDEC for calculating a new
measure of CPI or GDP is inaccurate, or concludes that its
methodology should be adjusted, that could result in financial and
economic consequences for Argentina, including a lack of access to
financing from IMF. If the IMF adopts any measures that are adverse
to Argentina, the Argentine economy could suffer adverse effects,
either by limiting access to international financial markets or
increasing the financing cost associated therewith, which in turn
would adversely affect our financial condition and results of
operations.
On January 8, 2016,
as a result of the INDEC’s historical inability to produce
reliable statistical data, the Macri administration issued an
emergency decree and ceased publication of national statistics. The
INDEC suspended all publications of statistical data until the
technical reorganization process was completed and the
administrative structure of the INDEC was recomposed.
6
After this process
of reorganization and recovery, the INDEC began to gradually
publish official data. In this regard, on June 15, 2016, July 13,
2016, August 12, 2016, September 13, 2016 and October 13, 2016 the
INDEC published inflation data of the months of in May, June, July,
August and September reflecting a monthly increase of 4.2%, 3.1%,
2.0%, 0.2% and 1.1%, respectively; however, at the date hereof, the
CPI for the first four months of 2016 has not been
published.
In addition, on
June 29, 2016, the INDEC recalculated historical GDP data dating
back to 2014, and GDP was estimated at 2.3% in 2013, a contraction
of 2.6% in 2014, an increase to 2.4% in 2015 and an increase to
0.5% the first six month of 2016. Uncertainty still remains
regarding the reliability related to the inaccuracy of the economic
indicators remains a factor that negatively affects the economy of
Argentina and our business. However, on October 5, 2016, concluded
the first IMF audit over the Argentine’s public accounts,
saying that the new government has achieved an important progress.
As of the date of this annual report, the Argentine government was
waiting for the final report of the IMF, which will possibly
include the lifting of the censure against Argentina.
Notwithstanding
these measures to address appropriate inflation statistics, there
are private reports implying significantly higher inflation rates
than the official reports of the INDEC. Despite the changes adopted
by the INDEC to the measurement procedure with the IPCNu, there are
still some differences between the figures resulting from this
indicator and those recorded by private consultants, the Argentine
Congress and the provincial statistic agencies. If it is determined
that it is necessary to unfavorably adjust the consumer price index
and other INDEC indices, there could be a significant decrease in
confidence in the Argentine economy, which could, in turn, have a
material adverse effect on us.
Continuing high inflation may impact the Argentine economy and
adversely affect our results of operations.
Inflation has, in
the past, materially undermined the Argentine economy and the
government’s ability to foster conditions that would permit
stable growth. In recent years, Argentina has confronted
inflationary pressures, evidenced by significantly higher fuel,
energy and food prices, among other factors. According
to data published by the INDEC, the rate of inflation reached 10.9%
in 2010, 9.5% in 2011, 10.8% in 2012, 10.9% in 2013, 23.9% in 2014,
11.9% in the ten-month period ended October, 31 2015. In response,
the prior Argentine administration implemented programs to control
inflation and monitor prices for essential goods and services,
including freezing the prices of key products and services, and
price support arrangements agreed between the Argentine government
and private sector companies in several industries and
markets.
In November 2015,
the INDEC suspended the publication of the CPI. According to the
most recent publicly available information based on data from the
Province of San Luis, the CPI grew by 31.6% in 2015 and the
inflation rate was 6.5%, 4.2%, 2.7%, 3.0% and 3.4% in December 2015
and January, February, March and April 2016, respectively.
According to the most recent publicly available information based
on data from the City of Buenos Aires, the CPI grew by 26.9% in
2015 and the inflation rate was 3.9%, 4.1%, 4.0%, 3.3% and 6.5% in
December 2015 and January, February, March and April 2016,
respectively. After implementing certain methodological reforms and
adjusting certain macroeconomic statistics on the basis of these
reforms, in June 2016 the INDEC resumed its CPI publications.
According to the INDEC, Argentina’s rate of inflation rate
was 4.2%, 3.1%, 2.0%, 0.2% and 1.1% in May, June, July, August and
September 2016, respectively.
A high inflation
environment would undermine Argentina’s foreign
competitiveness by diluting the effects of a peso devaluation,
negatively impact the level of economic activity and employment and
undermine confidence in Argentina’s banking system, which
could further limit the availability of domestic and international
credit to businesses. In turn, a portion of the Argentine debt is
adjusted by the Stabilization Coefficient (“Coeficiente de
Estabilización de Referencia”, or “CER”), a
currency index, that is strongly related to inflation. Therefore,
any significant increase in inflation would cause an increase in
the Argentine external debt and consequently in Argentina’s
financial obligations, which could exacerbate the stress on the
Argentine economy. A high level of uncertainty and a general lack
of stability in terms of inflation could also lead to shortened
contractual terms and affect the ability to plan and make
decisions.
Inflation rates
could escalate in the future, and there is uncertainty regarding
the effects that the measures adopted, or that may be adopted in
the future, by the Argentine government to control inflation may
have. If inflation remains high or continues to rise,
Argentina’s economy may be negatively impacted and our
results of operations could be materially affected.
Foreign shareholders of companies operating in Argentina have
initiated investment arbitration proceedings against Argentina that
have resulted and could result in arbitral awards and/or
injunctions against Argentina and its assets and, in turn, limit
its financial resources.
In response to the
emergency measures implemented by the Argentine government during
the 2001-2002 economic crisis, a number of claims were filed before
the International Centre for Settlement of Investment Disputes (the
“ICSID”) against Argentina. Claimants allege that the
emergency measures were inconsistent with the fair and equitable
treatment standards set forth in various bilateral investment
treaties by which Argentina was bound at the time.
As of the date of
this annual report, there are four final awards issued by ICSID
tribunals against Argentina for an aggregate total amount of
US$470.66 million and Argentina is seeking the annulment of four
additional awards for an aggregate total amount of US$831.73
million. There are six ongoing cases against Argentina before ICSID
with claims totaling US$2.15 billion (including two cases with
claims for amounts that are currently undetermined), and in three
of these cases (with aggregate claims for US$2.08 billion) the
ICSID tribunal has already ruled that it has jurisdiction. There
are eight additional cases with claims totaling US$6.17 billion in
which the parties agreed to suspend the proceedings pending
settlement discussions (including the proceedings initiated by Task
Force Argentina, an Italian bondholder association known as
“TFA”). A successful completion of these negotiations
could lead additional ICSID claimants to withdraw their claims,
although Argentina can offer no assurance to this
effect.
It is not certain
that Argentina will prevail in having any or all of those cases
dismissed, or that if awards in favor of the plaintiffs are
granted, that it will succeed in having those awards
annulled.
Claimants have also
filed claims before arbitral tribunals under the rules of the
United Nations Commission on International Trade Law
(“UNCITRAL”) and under the rules of the International
Chamber of Commerce (“ICC”). As of the date of this
annual report, there are three final awards against Argentina for
an aggregate total amount of US$246.27 million and Argentina is
seeking the annulment of an additional award for US$96,509 million.
There are three ongoing cases against Argentina before UNCITRAL and
ICC tribunals with claims totaling US$625.08 million, including one
case with a US$507.80 million claim in which the tribunal has
already ruled that it has jurisdiction. There is one additional
case with a claim of US$168.69 million in which the parties agreed
to suspend the proceedings pending settlement
discussions.
We cannot give any
assurance that Argentina will prevail in having any or all of those
cases dismissed, or that if awards in favor of the plaintiffs are
granted, that it will succeed in having those awards
annulled.
Ongoing claims
before the ICSID tribunal and other arbitral tribunals could lead
to new awards against Argentina, which could have a material
adverse effect on our capacity to access to international
credit.
7
Significant fluctuation in the value of the Peso may adversely
affect the Argentine economy as well as our financial
performance.
Since the
strengthening of exchange controls began in late 2011, and upon the
introduction of measures that have limited access to foreign
currency by private companies and individuals (such as requiring an
authorization of tax authorities to access the foreign currency
exchange market), the implied exchange rate, as reflected in the
quotations for Argentine securities that trade in foreign markets
compared to the corresponding quotations in the local market, has
increased significantly over the official exchange rate. These
measures were lifted on December 16, 2015. However, any reenactment
of these measures may prevent or limit us from offsetting the risk
derived from our exposure to the U.S. dollar and, if so, we cannot
predict the impact of these changes on our financial condition and
results of operations.
If the Peso
continues to depreciate, all of the negative effects on the
Argentine economy related to such devaluation could reappear, with
adverse consequences on our business. Moreover, it would likely
result in a material adverse effect in our business as a result of
the exposure to financial commitments denominated in U.S. Dollar.
While certain of our office space leases are denominated in U.S.
dollars, we are only partially protected against depreciation of
the Peso as payment is fixed in Pesos and there can be no assurance
we will be able to maintain our U.S. Dollar-denominated
leases.
On the other hand,
a substantial increase in the value of the Peso against the U.S.
Dollar also presents risks for the Argentine economy. The
appreciation of the Peso against the U.S. Dollar negatively impacts
the financial condition of entities whose foreign currency
denominated assets exceed their foreign currency-denominated
liabilities, such as us. In addition, in the short term, a
significant real appreciation of the Peso would adversely affect
exports. This could have a negative effect on GDP growth and
employment as well as reduce the Argentine public sector’s
revenues by reducing tax collection in real terms, given its
current heavy reliance on taxes on exports. The appreciation of the
Peso against the U.S. Dollar could have an adverse effect on the
Argentine economy and our business.
Certain measures that may be taken by the Argentine government may
adversely affect the Argentine economy and, as a result, our
business and results of operations.
In the past, the
Argentine government has increased its direct intervention in the
economy through the implementation or change of laws and
regulations, such as, nationalizations or expropriations;
restrictions on production, imports and exports; exchange and/or
transfer restrictions; direct and indirect price controls; tax
increases, changes in the interpretation or application of tax laws
and other retroactive tax claims or challenges; cancellation of
contract rights; or delays or denials of governmental
approvals.
In November 2008,
the Argentine government enacted Law No. 26,425 which provided for
the nationalization of the Administradoras de Fondos de
Jubilaciones y Pensiones. More recently, beginning in April 2012,
the Argentine government provided for the nationalization of YPF
S.A. and imposed major changes to the system under which oil
companies operate, principally through the enactment of Law No.
26,741 and Decree No. 1277/2012. In February 2014, the Argentine
government and Repsol S.A. (the former principal shareholder of YPF
S.A.) announced that they had reached agreement on the terms of the
compensation payable to Repsol for the expropriation of the YPF
S.A. shares. Such compensation totaled US$5 billion, payable by
delivery of Argentine sovereign bonds with various maturities. In
April 23, 2014, the agreement with Repsol was approved by the
Argentine Congress and accordingly, in May 8, 2014, Repsol, S.A.
received the relevant Argentine government bonds.
Additionally, on
December 19, 2012, the Argentine government issued Decree
No.2552/12, which, ordered the expropriation of the “Predio
Rural de Palermo.” However, on January 4, 2013, the Federal
Civil and Commercial Chamber granted an injunction that momentarily
blocked the enforceability of Decree N° 2,552/2012;
notwithstanding the foregoing on June 1, 2015, the injunction was
released. On June 2, 2015, this decision was appealed, and as a
result the aforementioned injunction is still effective and the
effects of the Decree No.2552/12 remain blocked as of the date
hereof. The Argentine government filed a motion to revoke the
injuction which was rejected by the Federal Civil and Commercial
Chamber and as a consequence the Argentine government filed an
extraordinary motion with the Supreme Court, which was rejected and
therefore the injunction remains effective. as of the date of this
annual report the Argentine government has answered the claim and
requested the registration of the litis. The court granted the
registration of the litis and ordered to notify the plaintiff of
the answer of the claim filed by the Argentine Government however
the notification has not been received by the plaintiff. The Decree
No.2552/12 may indirectly affect IRSA’s investment in
Entertainment Holding S.A. (“EHSA”).
Furthermore, on May
18, 2015, we were notified that the Agencia de Administración
de Bienes del Estado (“AABE”), revoked the concession
agreement granted to our subsidiary Arcos del Gourmet S.A, through
Resolution No.170/2014. On June 2, 2015, we filed before the AABE a
request to declare the notification void, as certain formal
proceedings required under Argentine law have not been complied by
the AABE. Furthermore, we filed an administrative appeal requesting
the dismissal of the revocation of the agreement and a lawsuit
seeking to declare the Resolution No. 170/2014 void. IRSA also
filed a lawsuit in order to judicially pay the monthly rental fees
of the property. As of the date of this annual report, the
“Distrito Arcos” shopping center continues to operate
normally.
There are other
recent examples of government intervention. In December 2012 and
August 2013, the Argentine Congress established new regulations
relating to domestic capital markets. The new regulations generally
provide for increased intervention in the capital markets by the
government, authorizing, for example, the CNV to appoint observers
with the ability to veto the decisions of the board of directors of
companies admitted to the public offering regime under certain
circumstances and suspend the board of directors for a period of up
to 180 days. Notwithstanding, the new government is working on an
amendment to the Capital Markets Law, which will, among other
things, take off the CNV the authorization to appoint observers
mentioned before.
We cannot assure
you that these or other measures that may be adopted by the
Argentine government, such as expropriation, nationalization,
forced renegotiation or modification of existing contracts, new
taxation policies, changes in laws, regulations and policies
affecting foreign trade, investment, etc., will not have a material
adverse effect on the Argentine economy and, as a consequence,
adversely affect our financial condition, our results of operations
and the market value of our securities.
The Argentine
presidential, congressional and certain municipal and state
government elections that were held in October and November 2015
generated political uncertainty as to whether the new Argentine
government, which took office on December 10, 2015, would implement
changes in policy or regulation that could adversely affect the
Argentine economy. As of the date of this annual report, the
Argentine government has adopted a series of economic actions and
foreign exchange regulations whose effects will be seen in the
coming months. The President of Argentina and the Congress each
have considerable power to determine governmental policies and
actions that relate to the Argentine economy and, consequently, may
affect our results of operations or financial condition. We can
offer no assurances that the policies that may be implemented by
the new Argentine government will not adversely affect our
business, results of operations or financial
condition.
The Argentine government may order salary increases to be paid to
employees in the private sector, which would increase our operating
costs.
In the past, the
Argentine government has passed laws, regulations and decrees
requiring companies in the private sector to maintain minimum wage
levels and provide specified benefits to employees and may do so
again in the future. In the aftermath of the Argentine economic
crisis, employers both in the public and private sectors
experienced significant pressure from their employees and labor
organizations to increase wages and to provide additional employee
benefits. In August 2012, the Argentine government established a
25% increase in minimum monthly salary to Ps.2,875, effective as of
February 2013. The Argentine government increased the minimum
monthly salary to Ps.3,300 in August 2013, to Ps.3,600 in January
2014, to Ps.4,400 in September 2014, to Ps.4,716 in January 2015,
to Ps.5,588 in August 2015 and to Ps.6,060 from January 2016. Due
to ongoing high levels of inflation, employers in both the public
and private sectors continue to experience significant pressure
from unions and their employees to increase salaries. During the
first months of the year 2016, various unions have agreed with
employers’ associations on salary increases between 30% and
35%.
In the future, the
government could take new measures requiring salary increases or
additional benefits for workers, and the labor force and labor
unions may apply pressure for such measures. As of the date of this
annual report, the government and labor representatives were
engaged in negotiations to set national guidelines for salary
increases during 2016. Any such increase in wage or worker benefit
could result in added costs and reduced results operations for
Argentine companies, including us.
8
Property values are
influenced by multiple factors that are beyond our control, such as
a decrease in the demand for real estate properties due to a
deterioration of macroeconomic conditions or an increase in supply
of real estate properties that could adversely affect the value of
real estate properties. We cannot assure you that property values
will increase or that they will not be reduced. Most of the
properties we own are located in Argentina. As a result, a
reduction in the value of properties in Argentina could materially
affect our business.
Restrictions on transfers of foreign currency and the repatriation
of capital from Argentina may impair our ability to pay dividends
and distributions.
According to
current Argentine practices the Argentine government may impose
restrictions on the exchange of Argentine currency into foreign
currencies and on the remittance to foreign investors of proceeds
from investments in Argentina in circumstances where a serious
imbalance develops in Argentina’s balance of payments or
where there are reasons to foresee such an imbalance. Beginning in
December 2001, the Argentine government implemented a number of
monetary and foreign exchange control measures that included
restrictions on the free disposition of funds deposited with banks
and on the transfer of funds abroad without prior approval by the
Central Bank, some of which are still in effect. With the
administration of President Macri, many of the ongoing restrictions
were lifted.
On January 7, 2003,
the Central Bank issued communication “A” 3859, which
is still in force and pursuant to which there are no limitations on
companies’ ability to purchase foreign currency and transfer
it outside Argentina to pay dividends, provided that those
dividends arise from net earnings corresponding to approved and
audited financial statements. The transfer of funds abroad by local
companies to pay annual dividends only to foreign shareholders,
based on approved and fully audited financial statements, does not
require formal approval by the Central Bank.
Notwithstanding the
above, for many years, and as a consequence of a decrease in
availability of U.S. dollars in Argentina, the previous Argentine
government imposed informal restrictions on certain local companies
and individuals for purchasing foreign currency. These restrictions
on foreign currency purchases started in October 2011 and tightened
thereafter through the date of this annual report. As a result of
these informal restrictions, local residents and companies may be
prevented from purchasing foreign currency through the foreign
exchange market (“Mercado Único y Libre de
Cambios” or “Exchange Market”) for the purpose of
making payments abroad, such as dividends, capital reductions, and
payment for importation of goods and services.
Together with the
new government administration, such restrictions and other foreign
exchange control measures were lifted, towards opening
Argentina’s foreign exchange market. In this sense, on
December 17, 2015, Communication “A” 5850 of the
Central Bank reestablished the possibility for non-Argentinean
residents to repatriate their investment capital and, recently,
Communication “A” 6037 of the Central Bank defined the
new regulations that apply to the acquisition of foreign currency
and the elimination of all other restrictions that impair residents
and non-residents to have access to the FX market.
However, in the
future, the Argentine government or the Central Bank may impose
formal restrictions to the payment of dividends abroad and
established additional requirements. Any restrictions on
transferring funds abroad imposed by the government could undermine
our ability to pay dividends on our ADSs in U.S.
Dollars.
The Rural Land Law and its application.
On December 22,
2011, the Argentine Congress passed the Rural Land Law in order to
protect the ownership and sovereignty of certain rural areas of
Argentina (the “Rural Land Law”). The Rural Land Law
sets limits on the ownership of rural land by foreign individuals
or legal entities acting in Argentina ("Foreign Persons"), setting
a maximum allowable percentage ownership for foreigners of 20%.
Additionally, only 30% of the aforementioned 20% may be held by
Foreign Persons of the same nationality, and from the date of
enactment of the Rural Land Act, a Foreign Person may not own more
than 1,000 hectares of rural land in total throughout Argentine
territory. The Rural Land Law states that it will not affect any
rights previously acquired by Foreign Persons.
For the purposes of
the Rural Land Law, the definition of Foreign Person includes
Argentine companies in which a percentage higher than 51% of the
outstanding capital stock is owned by foreign individuals or legal
entities, or lower rates if the entity meets the proportions
necessary to form the social will. The following also falls within
the definition of Foreign Person (among others): (a) entities
controlled by a percentage greater than 25% by a foreign company,
or regardless of participation when such company holds enough votes
to form the social will of that company; (b) companies that issued
convertible notes, where a Foreign Person may exert over 25% of the
voting power necessary to form the social will; (c) transfers for
trusts whose beneficiaries are Foreign Persons in a percentage
higher than 25%, (d) joint ventures, holding companies and any
other legal persons present or in the future, and (e) foreign legal
persons under public law.
On February 29,
2012, Executive Branch Decree No. 274/12 was published regulating
the Rural Land Law. The aforementioned decree established a
deadline of 60 days to the provinces to report the total area of
their departments, municipalities or political divisions equivalent
discriminating rural and urban land and rural properties subject to
the Rural Land Law and consequently owned by Foreign Persons.
Additionally, provinces should report the complete list of foreign
companies registered in their respective jurisdictions. The decree
also provides that foreign holders must report their holdings
within 180 days from the date of enactment of regulations in the
national register of rural land.
In addition, on
June 30, 2016, Executive Branch Decree No. 820/16 was published
modifying the Executive Branch Decree No. 274/12. For the purpose
of determining the ownership of the rural land, the Decree No.
820/16 defines how to compute the acquisition of rural land, when
they occur as a result of transfers of share packages and how soon
transfer; and solves how to estimate equivalence with respect to
the core area, depending on the limits for each type of
exploitation, municipality, department and province.
We cannot assure
you that these or other measures, that may be adopted by the
Argentine government in the future, such as further
restrictions or regulations, will not have a material adverse
effect on our operations, if our access to the acquisition or
holding of our actual or future properties is limited.
Exchange controls and restrictions on transfers abroad and capital
inflow restrictions have been limited in the past and may limit the
availability of international credit.
Until December
2015, many foreign exchange restrictions and controls imposed by
the Argentine government had limited the ability of companies and
individuals to access the Exchange Market. On December 16, 2015,
the new authorities issued Communication “A” 5850 of
the Central Bank, lifting most of the restrictions then in place.
Among these measures, free access to the Exchange Market was
granted for the purchase of foreign currency intended for general
purposes, without the need for the Central Bank’s or
AFIP’s previous consent, and the requirement to deposit 30%
of certain capital inflows into Argentina was eliminated,
subsequently extended by Communication “A” 5963 and
5964. Also, on August 8, 2016, the Central Bank issued
Communication “A” 6037, in which the exchange
regulations, including the obligation was removed substantially
redefined to justify with documentation each change operation, the
daily and monthly to operate caps were removed to internet banking
and exchange freely chosen schedule to operate and Communication a
“4805” limiting repealed was allowed conducting
derivative transactions with foreign countries, risks denying
coverage to many companies, especially small- and medium-seized
enterprises.
9
Although these
recent changes in the foreign exchange policies tend to allow free
access by companies and individuals to the Exchange Market, certain
limitations remain in effect including the following:
·
The proceeds of
foreign currency sales in the Exchange Market exceeding the peso
equivalent of US$2,500 per month must be credited in pesos in a
checking or savings account with a local financial
institution;
·
It is no longer
necessary that the proceeds of external indebtedness be entered or
settled in the local foreign exchange market;
·
Any external
indebtedness incurred or renewed after December 17, 2015 must
remain in Argentina for a period of at least 120 calendar days from
the date the proceeds were transferred into Argentina;
and
·
Capital inflows
into the local foreign exchange market must be credited in an
account opened with a local financial
institution.
Notwithstanding the
measures adopted by the Macri administration, which lifted certain
exchange and capital controls, in the future the Argentine
government could impose further exchange controls or restrictions
on the movement of capital and/or take other measures in response
to capital flight or a significant depreciation of the peso, which
could limit our ability to access the international capital
markets. Such measures could lead to political and social tensions
and undermine the Argentine government’s public finances, as
has occurred in the past, which could adversely affect
Argentina’s economy and prospects for economic growth. For
more information, see “Local Exchange Market and Exchange
Rates.”
The Argentine economy could be adversely affected by political and
economic developments in other global markets.
Argentina’s
economy is vulnerable to external shocks that could be caused by
adverse developments affecting its principal trading partners. A
significant decline in the economic growth of any of
Argentina’s major trading partners (including Brazil, the
European Union, China and the United States) could have a material
adverse impact on Argentina’s balance of trade and adversely
affect Argentina’s economic growth. In 2015, there were
declines in exports of 14% with Chile, 26% with MERCOSUR (Brazil)
and 16% with NAFTA (the United States, Mexico and Canada), each as
compared to 2014. Declining demand for Argentine exports could have
a material adverse effect on Argentina’s economic growth. For
example, the recent significant depreciation of the Brazilian and
Chinese currencies and the current slowdown of their respective
economies may negatively affect the Argentine economy. Moreover,
the political and social instability in Brazil, which includes the
recent removal of the President Dilma Rousseff from office
following an impeachment vote in the Senate, may have an adversely
impact on Argentine’s economy.
In addition,
financial and securities markets in Argentina have been influenced
by economic and market conditions in other markets worldwide. Such
was the case in 2008, when the global economic crisis led to a
sudden economic decline in Argentina in 2009, accompanied by
inflationary pressures, depreciation of the peso and a drop in
consumer and investor confidence. Although economic conditions vary
from country to country, investors’ perception of the events
occurring in one country may substantially affect capital flows
into other countries. International investors’ reactions to
events occurring in one market sometimes demonstrate a
“contagion” effect in which an entire region or class
of investment is disfavored by international investors. Argentina
could be adversely affected by negative economic or financial
developments in other countries, which in turn may have an adverse
effect on our financial condition and results of operations. Lower
capital inflows and declining securities prices negatively affect
the real economy of a country through higher interest rates or
currency volatility. Moreover, Argentina may also be affected by
other countries that have influence over world economic
cycles.
The international
economy is showing contradictory signals of global growth, leading
to significant financial uncertainty. There is growing concern
about the deceleration of growth in China in particular as well as
the significant decline in global commodity prices, particularly
oil and gas. In addition, emerging market economies have been
affected by the recent change in the U.S. monetary policy,
resulting in the unwinding of investments and increased volatility
in the value of their currencies. If interest rates rise
significantly in developed economies, including the United States,
emerging market economies, including Argentina, could find it more
difficult and expensive to borrow capital and refinance existing
debt, which would negatively affect their economic growth. There is
also global uncertainty about the degree of economic recovery in
the United States, with no substantial positive signals from other
developed countries. Moreover, the recent challenges faced by the
European Union to stabilize certain of its member economies, such
as Greece, have had and may continue to have international
implications affecting the stability of global financial markets,
which has hindered economies worldwide.
The effects of the United Kingdom’s vote to exit from the
European Union and its impact on economic conditions in Latin
America and Argentina and, particularly, on
our business, financial condition, results of
operations, prospects and trading of our notes are
uncertain.
On June 23, 2016,
the United Kingdom voted in favor of the United Kingdom exiting the
European Union. As of the date of this annual report,
the actions that the United Kingdom will take to effectively exit
from the European Union or the length of such process are
uncertain. The results of the United Kingdom’s
referendum have caused, and are anticipated to continue causing,
volatility in the financial markets, which may in turn have a
material adverse effect on our business, financial condition and
results of operations.
A decline in the international prices for Argentina’s main
commodity exports could have an adverse effect on Argentina’s
economic growth and on our business.
High commodity
prices have contributed significantly to the increase in Argentine
exports since the third quarter of 2002 as well as in governmental
revenues from export taxes (withholdings). However, this reliance
on the export of certain commodities, such as soy, has made the
Argentine economy more vulnerable to fluctuations in their prices.
In December 2015, the new Argentine administration announced a plan
to gradually reduce the exports tax payable by soy growers from
January 2018 to December 2019 and eliminated export taxes on wheat,
corn, sorghum and sunflower, in an attempt to encourage
exports.
If international
commodity prices decline, the Argentine government’s revenues
would decrease significantly affecting Argentina’s economic
activity. Accordingly, a decline in international commodity prices
could adversely affect Argentina’s economy, which in turn
would produce a negative impact on our financial condition and
results of operations.
In addition,
adverse weather conditions can affect the production of commodities
by the agricultural sector, which account for a significant portion
of Argentina’s export revenues. These circumstances would
have a negative impact on the levels of government revenues,
availability of foreign exchange and the government’s ability
to service its sovereign debt, and could either generate
recessionary or inflationary pressures, depending on the
government’s reaction. Either of these results would
adversely impact Argentina’s economy growth and, therefore,
our business, financial condition and results of
operations.
10
Restrictions on the supply of energy could negatively affect
Argentina’s economy.
As a result of
prolonged recession, and the forced conversion into Pesos and
subsequent freeze of natural gas and electricity tariffs in
Argentina, there has been a lack of investment in natural gas and
electricity supply and transport capacity in Argentina in recent
years. At the same time, domestic demand for natural gas and
electricity has increased substantially, driven by a recovery in
economic conditions and the implementation of price constraints,
which has prompted the government to adopt a series of measures
that have resulted in industry shortages and/or costs increase. In
particular, Argentina has been importing natural gas in order to
compensate for shortages in local production. In order to pay for
natural gas imports, the Argentine government has frequently used
the Central Bank reserves due to the absence of incoming currencies
from investment. If the government is unable to pay for the natural
gas imported in order to produce electricity, business and
industries may be adversely affected.
The Argentine
government has been taking a number of measures to alleviate the
short-term impact of energy shortages on residential and industrial
users. If these measures prove to be insufficient, or if the
investment that is required to increase natural gas production,
transportation capacity and energy generation over the medium-and
long-term fails to materialize on a timely basis, economic activity
in Argentina could be curtailed which may have a significant
adverse effect on our business.
As a first step of
these measures, subsidies on energy tariffs were withdrawn from
industries and high income consumers. Additionally, since 2011, a
series of rate increases and the reduction of subsidies mainly
among industries and high-income consumers were implemented. In
February 2016, the Argentine government revised the tariff schedule
for electricity and gas rates and eliminated the subsidies for
these utilities, (except for tariffs for certain economically
vulnerable sectors). As a result, energy costs are expected to
increase by 500% or more. By correcting tariffs, modifying the
regulatory framework and reducing the federal government’s
role as an active market participant, the new administration aims
to correct distortions in the energy sector and stimulate
investment. In July 2016, a federal court in the city of La Plata
suspended the increase in gas tariffs across the Province of Buenos
Aires. In addition, on August 3, 2016, a federal court in San
Martin suspended the increase in gas tariffs across the country
until a public hearing to discuss the electricity tariffs increase
is set. The case was brought before the Supreme Court of Argentina,
and on August 18, 2016, the Supreme Court of Argentina upheld the
suspension of gas tariffs increase to residential customers,
arguing that a tariffs increase could not be established without
public hearings. A public hearing on the increase was held on
September 16, 2016 and as result, the increase in gas tariffs will
be increased by approximately 203% in October 2016, with
semi-annual increases until 2019. In relation to other services
(water, transport and electricity), the government announced that
other public meetings will be held in mid-October.
High public expenditure could result in long-lasting adverse
consequences for the Argentine economy.
Over the last
several years, the Argentine government has substantially increased
public expenditures. In 2014, public sector expenditures increased
by 43% year-over-year and the government reported a primary fiscal
deficit of 0.9%. During recent years, the Argentine government has
resorted to the Central Bank and to the Administración
Nacional de la Seguridad Social (Federal Social Security Agency, or
“ANSES”, as per its acronym in Spanish) to source part
of its funding requirements. In 2015, this trend continued as the
primary fiscal balance showed a deficit of 5.4% as of December 31,
2015.
Recently, the
Argentine government has begun adjusting its subsidy policies,
particularly those related to energy, electricity and gas, water
and public transportation. Changes in these policies could
materially and adversely impact consumer purchase capacity and
economic activity and may lead to an increase in
prices.
Moreover, the
primary fiscal balance could be negatively affected in the future
if public expenditures continue to increase at a rate higher than
revenues as a result of subsidies to lower-income sectors, social
security benefits, financial assistance to provinces with financial
problems, increased spending on public works and subsidies to the
energy and transportation sectors. A further deterioration in
fiscal accounts could negatively affect the government’s
ability to access the long-term financial markets and could in turn
result in more limited access to such markets by Argentine
companies.
Risks Relating to Brazil
The Brazilian government has exercised and continues to exercise
significant influence over the Brazilian economy, which combined
with Brazil’s political and economic conditions may adversely
affect us.
Our business is
dependent to a large extent on the economic conditions in Brazil.
From June 30, 2011 we consolidate our financial statements with our
subsidiary Brasilagro-Companhia Brasileira de Propiedades Agricolas
(“Brasilagro”).
We may be adversely
affected by the following factors, as well as the Brazilian federal
government’s response to these factors:
·
economic and social
instability;
·
increase in
interest rates;
·
exchange controls
and restrictions on remittances abroad;
·
restrictions and
taxes on agricultural exports;
·
exchange rate
fluctuations;
·
inflation;
·
volatility and
liquidity in domestic capital and credit
markets;
·
expansion or
contraction of the Brazilian economy, as measured by GDP growth
rates;
·
allegations of
corruption against political parties, elected officials or other
public officials, including allegations made in relation to the
Lava Jato investigation;
·
government policies
related to our sector;
·
fiscal or monetary
policy and amendments to tax legislation; and
·
other political,
diplomatic, social or economic developments in or affecting
Brazil.
Historically, the
Brazilian government has frequently intervened in the Brazilian
economy and has occasionally made significant changes in economic
policies and regulations, including, among others, the imposition
of a tax on foreign capital entering Brazil (IOF tax), changes in
monetary, fiscal and tax policies, currency devaluations, capital
controls and limits on imports.We cannot predict which policies
will be adopted by the Brazilian government and whether these
policies will negatively affect the economy or our business or
financial performance.
11
The Brazilian
economy has been experiencing a slowdown – GDP growth rates
were 3.9%, 1.8%, 2.7%, 0.1%, in 2011, 2012, 2013, 2014,
respectively, and decrease 3.8% in 2015, and 4.6% in the first six
months of 2016. In addition, inflation, unemployment and interest
rates have increased more recently. Our results of operations and
financial condition may be adversely affected by the economic
conditions in Brazil.
In addition to the
recent economic crisis, protests, strikes and corruption scandals,
including the “Lava Jato” investigation, has led to a
fall in confidence and a political crisis. As a result of the Lava
Jato, a number of senior politicians, including congressmen, and
executive officers of some of the major state-owned companies in
Brazil have resigned or been arrested while others are being
investigated for allegations of unethical and illegal conduct. The
matters that have come, and may continue to come, to light as a
result of, or in connection with, the Lava Jato operation and other
similar operations have adversely affected, and we expect that they
will continue to adversely affect, the Brazilian economy, markets
and trading prices of securities issued by Brazilian issuers in the
near future.
On August 31, 2016,
the Senate approved the impeachment of Dilma Rousseff, and the
Vice-President Michel Temer took office. On September 12, 2016, the
former Speaker of the House of Representatives, Eduardo Cunha, had
his mandate revoked the House and lost his political rights for
eight years. The new President intends to implement some reforms,
including in the labor laws and social security systems, and some
other measures to achieve higher rates of economic growth and
employment. We cannot predict which policies will be adopted by the
Brazilian government and whether these policies will negatively
affect the economy or Brasilagro’s business or results of its
operations. In addition, we cannot predict whether the new
government may become involved in corruption scandals or may face
an increasing lack of support from Brazilian citizens, both of
which may make it more difficult to implement new policies and
increase the political and economic instability in Brazil. Such
increase in instability or the new policies to be implemented by
the new government (or the failure to implement them) may have an
adverse effect in the Brazilian economy and in our financial
performance.
The economic and
political crisis have resulted in the downgrading of the
country’s long-term credit rating from Standard & Poor's
rating agency from BBB + to BBB-, placing Brazil back to
speculative investment grade level ("junk"). Moody's downgraded
Brazil from "Baa2" to "Baa3" and changed the negative perspective
to stable, while Fitch Ratings downgraded Brazil from BBB to BBB-
and changed the perspective from stable to negative. Both
Moody’s and Fitch still consider Brazil investment grade.
Further downgrading of Brazil’s ratings by any of these
agencies may adversely affect us and the stock price of our
securities.
Inflation, coupled with the Brazilian government’s measures
to fight inflation, may hinder Brazilian economic growth and
increase interest rates, which could have a material adverse effect
on us.
Brazil has in the
past experienced significantly high rates of inflation. As a
result, the Brazilian government adopted monetary policies that
resulted in Brazilian interest rates being among the highest in the
world. The Brazilian Central Bank’s Monetary Policy Committee
(
Comitê de Política
Monetária do Banco Central
, or “COPOM”, as
per its acronym in Portuguese), establishes an official interest
rate target for the Brazilian financial system based on the level
of economic growth, inflation rate and other economic indicators in
Brazil. Between 2004 and 2010, the official Brazilian interest rate
varied from 19.75% to 8.75% per year. In response to an
increase in inflation in 2010, the Brazilian government increased
the official Brazilian interest rate, the SELIC rate, which was
10.75% per year on December 31, 2010. The SELIC rate has
increased since then and, as of June 30, 2016, it was
14.15% per year. The inflation rates, as measured by the
General Market Price Index (
Índice Geral de
Preços-Mercado
or “IGP-M”, as per its
acronym in Portuguese), and calculated by Fundação
Getúlio Vargas, or “FGV”, were 7.8% in 2012, 5.5%
in 2013, 3.67% in 2014 and 10,54% in 2015.
Cumulative
inflation in the first six months of 2016, calculated by the same
index, was 5.91%.
Inflation and the
government measures to fight inflation have had and may continue to
have significant effects on the Brazilian economy and our business.
In addition, the Brazilian government’s measures to control
inflation have often included maintaining a tight monetary policy
with high interest rates, thereby restricting the availability of
credit and slowing economic growth. On the other hand, an easing of
monetary policies of the Brazilian government may trigger increases
in inflation. In the event of an increase in inflation, we may not
be able to adjust our daily rates to offset the effects of
inflation on our cost structure, which may materially and adversely
affect us.
An increase in
interest rates may have a significant adverse effect on us. In
addition, as of June 30, 2016, certain of our loans were
subject to interest rate fluctuations such as the Brazilian
long-term interest rate (
Taxa de
Juros de Longo Prazo
or “TJLP”, as per its
acronym in Portuguese), and the interbank deposit rate
(
Certificados de Depósitos
Interbancários
or “CDI”, as per its acronym
in Portuguese). In the event of an abrupt increase in interest
rates, our ability to comply with our financial obligations may be
materially and adversely affected.
The Brazilian Real is subject to depreciation and exchange rate
volatility which could adversely affect Brasilagro’s and our
financial condition and results of operations.
Brazil’s rate
of inflation and the government’s actions to combat inflation
have also affected the exchange rate between the Real and the U.S.
Dollar. As a result of inflationary pressures, the Brazilian
currency has been devalued periodically during the last four
decades. Throughout this period, the Brazilian federal government
has implemented various economic plans and utilized a number of
exchange rate policies, including sudden devaluations, periodic
devaluations (during which the frequency of adjustments has ranged
from daily to monthly), floating exchange rate systems, exchange
controls and dual exchange rate markets. During 2009 and 2010 the
Real appreciated 24.9% and 4.6%, respectively, against the U.S.
Dollar. As a contrast, during 2012 and 2013 the Real depreciated
13.3%, 9.6% and 15.5%, respectively, against the U.S. Dollar. In
February, 2014, Brazilian Government started to devaluate its
currency, causing the Real to suffer the steepest depreciation in
over a decade in its attempt to increase exports. Between January
2016 and August 2016 the Real appreciated 19.8%%.There
can be no assurance that the rate of exchange between the Real and
the U.S. Dollar will not fluctuate significantly in the future. In
the event of a devaluation of the Real, the financial condition and
results of operations of our Brazilian subsidiary could be
adversely affected. In addition, during September 2015, Standard
& Poor’s downgraded Brazil’s credit rating to
BB-plus and during October 2015, Fitch Ratings downgraded
Brazil’s credit rating to BBB-, which triggers funds that
target investment-grade countries to sell its holdings in Brazil.
As of August 2016, the Bovespa has increased 71,25% in U.S. Dollars
terms during the year.
Depreciation of the
Real relative to the U.S. Dollar may increase the cost of servicing
foreign currency-denominated debt that our subsidiary may incur in
the future, which could adversely affect our financial condition
and results of operations. In addition, depreciation of the Real
creates additional inflationary pressures in Brazil that may
adversely affect our results of operations. Depreciation generally
curtails access to international capital markets and may prompt
government intervention. It also reduces the U.S. Dollar value of
Brasilagro’s revenues, distributions and dividends, and the
U.S. Dollar equivalent of the market price of our common shares. On
the other hand, the appreciation of the Real against the U.S.
Dollar may lead to the deterioration of Brazil’s public
accounts and balance of payments, as well as to lower economic
growth from exports, which could impact the results of our
subsidiary Brasilagro.
12
A deterioration in general economic and market conditions or in
perceptions of risk in other countries, principally in emerging
countries or the United States, may have a negative impact on the
Brazilian economy and us.
Economic and market
conditions in other countries, including United States, Latin
American and other emerging market countries, may affect the
Brazilian economy and the market for securities issued by Brazilian
companies. Although economic conditions in these countries may
differ significantly from those in Brazil, investors’
reactions to developments in these other countries may have an
adverse effect on the market value of securities of Brazilian
issuers. Crises in other emerging market countries could dampen
investor enthusiasm for securities of Brazilian issuers, including
ours, which could adversely affect the market price of our common
shares. In the past, the adverse development of economic conditions
in emerging markets resulted in a significant flow of funds out of
the country and a decrease in the quantity of foreign capital
invested in Brazil. Changes in the prices of securities of public
companies, lack of available credit, reductions in spending,
general slowdown of the global economy, exchange rate instability
and inflationary pressure may adversely affect, directly or
indirectly, the Brazilian economy and securities market. The recent
global economic downturn and related instability in the
international financial system have had, and may continue to have,
a negative effect on economic growth in Brazil. The ongoing global
economic downturn has reduced the availability of liquidity and
credit to fund the continuation and expansion of business
operations worldwide. The recent substantial losses in worldwide
equity markets, including in Brazil, could lead to an extended
worldwide economic recession or depression.
In addition, the
Brazilian economy is affected by international economic and market
conditions generally, especially economic conditions in the United
States. Share prices on BM&FBOVESPA, for example, have
historically been sensitive to fluctuations in U.S. interest rates
and the behavior of the major U.S. stock indexes. An increase in
the interest rates in other countries, especially the United
States, may reduce global liquidity and investors’ interest
in the Brazilian capital markets, adversely affecting the price of
our common shares.
The Brazilian government imposes certain restrictions on currency
conversions and remittances abroad which could affect the timing
and amount of any dividend or other payment we
receive.
Brazilian law
guarantees foreign shareholders of Brazilian companies the right to
repatriate their invested capital and to receive all dividends in
foreign currency provided that their investment is registered with
the
Banco Central do
Brazil
. We registered our investment in Brasilagro with the
Brazilian Central Bank on April 28, 2006. Although dividend
payments related to profits obtained subsequent to January 1, 1996
are not subject to income tax, if the sum of repatriated capital
and invested capital exceeds the investment amount registered with
the Brazilian Central Bank, repatriated capital is subject to a
capital gains tax of 15%. There can be no assurance that the
Brazilian government will not impose additional restrictions or
modify existing regulations that would have an adverse effect on an
investor’s ability to repatriate funds from Brazil nor can
there be any assurance of the timing or duration of such
restrictions, if imposed in the future.
Widespread uncertainties, corruption and fraud relating to
ownership of real estate may adversely affect our
business.
There are
widespread uncertainties, corruption and fraud relating to title
ownership of real estate assets in Brazil. In Brazil, ownership of
real property is conveyed through filing of deeds before the
relevant land registry. In certain cases, land registry recording
errors, including duplicate and/or fraudulent entries, and deed
challenges frequently occur, leading to judicial actions. Disputes
over title ownership of real estate assets are frequent, and, as a
result, there is a risk that errors, fraud or challenges could
adversely affect us, causing the loss of all or substantially all
of our properties.
In addition, our
land may be subject to expropriation by the Brazilian government.
An expropriation could materially impair the normal use of our
lands or have a material adverse effect on our results of
operations. In addition, social movements, such as
Movimento dos Trabalhadores Rurais Sem Terra
and Comissão Pastoral da Terra
and the Argentinean
Rural Land Law, among others
,
are active in Brazil. Such movements
advocate land reform and mandatory property redistribution by the
government. Land invasions and occupations of rural areas by a
large number of individuals is common practice for these movements,
and, in certain areas, including some of those in which we are
likely to invest, police protection and effective eviction
proceedings are not available to land owners. As a result, we
cannot give you any assurance that Brasilagro properties will not
be subject to invasion or occupation by these groups. A land
invasion or occupation could materially impair the normal use of
Brasilagro lands or have a material adverse effect on us or the
value of our common shares or ADSs.
The lack of efficient transportation, and adequate storage or
handling facilities in certain of the regions in which Brasilagro
operates may have a material adverse effect on our
business.
One of the
principal disadvantages of the agriculture industry in some of the
regions where Brasilagro operates is that they are located far from
major ports (in some cases, up to 1,500 kilometers). Efficient
access to transportation infrastructure and ports is critical to
profitability in the agricultural industry. However, as part of our
business strategy, we intend to acquire and develop land in
specific areas where existing transportation is poor. A substantial
portion of agricultural production in certain of the regions where
we operate is currently transported by truck, a means of
transportation significantly more expensive than the rail
transportation available to the U.S. and other foreign countries.
As a result, we may be unable to provide cost-efficient production
to our potential most important markets, and this could have an
adverse effect on our business and results of our
operations.
Risks Relating to Our Region
Our business is dependent on economic conditions in the countries
where we operate or intend to operate.
We have made
investments in farmland in Argentina, Brazil, Paraguay and Bolivia
and we may possibly make investments in other countries in and
outside Latin America. Owing that demand for livestock and
agricultural products is usually correlated to economic conditions
prevailing in the local market, which in turn is dependent on the
macroeconomic condition of the country in which the market is
located, our financial condition and results of operations are, to
a considerable extent, dependent upon political and economic
conditions prevailing from time to time in the countries where we
operate. Latin American countries have historically experienced
uneven periods of economic growth, as well as recession, periods of
high inflation and economic instability. Certain countries have
experienced severe economic crises, which may still have future
effects. As a result, governments may not have the necessary
financial resources to implement reforms and foster growth. Any of
these adverse economic conditions could have a material adverse
effect on our business.
We face the risk of political and economic crises, instability,
terrorism, civil strife, expropriation and other risks of doing
business in emerging markets.
In addition to
Argentina and Brazil, we conduct or intend to conduct our
operations in other Latin-American countries such as, Paraguay and
Bolivia, among others. Economic and political developments in the
countries in which we operate, including future economic changes or
crisis (such as inflation or recession), government deadlock,
political instability, terrorism, civil strife, changes in laws and
regulations, expropriation or nationalization of property, and
exchange controls could adversely affect our business, financial
condition and results of operations.
Although economic
conditions in one country may differ significantly from another
country, we cannot assure that events in one only country will not
adversely affect our business or the market value of, or market
for, our common shares and/or ADSs.
13
Governments in the countries where we operate or intend to operate
exercise significant influence over their economies.
Emerging market
governments, including governments in the countries where we
operate, frequently intervene in the economies of their respective
countries and occasionally make significant changes in policy and
regulations. Governmental actions to control inflation and other
policies and regulations have often involved, among other measures,
price controls, currency devaluations, capital controls and limits
on imports. Our business, financial condition, results of
operations and prospects may be adversely affected by changes in
government policies or regulations, including factors, such
as:
|
•
|
exchange rates and
exchange control policies;
|
|
•
|
inflation
rates;
|
|
•
|
interest
rates;
|
|
•
|
tariff and
inflation control policies;
|
|
•
|
import duties on
information technology equipment;
|
|
•
|
liquidity of
domestic capital and lending markets;
|
|
•
|
electricity
rationing;
|
|
•
|
tax policies;
and
|
|
•
|
other political,
diplomatic, social and economic developments in or affecting the
countries where we intend to operate.
|
An eventual
reduction of foreign investment in any of the countries where we
operate may have a negative impact on such country’s economy,
affecting interest rates and the ability of companies to access
financial markets.
Local currencies used in the conduct of our business are subject to
exchange rate volatility and exchange controls.
The currencies of
many Latin American countries have experienced substantial
volatility in recent years. Currency movements, as well as higher
interest rates, have materially and adversely affected the
economies of many Latin American countries, including countries in
which account for or are expected to account for a significant
portion of our revenues. The depreciation of local currencies
creates inflationary pressures that may have an adverse effect on
us generally, and may restrict access to international capital
markets. On the other hand, the appreciation of local currencies
against the U.S. Dollar may lead to deterioration in the balance of
payments of the countries where we operate, as well as to a lower
economic growth.
In addition, we may
be subject to exchange control regulations in these Latin American
countries which might restrict our ability to convert local
currencies into U.S. Dollars.
Inflation and certain government measures to curb inflation may
have adverse effects on the economies of the countries where we
operate or intend to operate our business and our
operations.
Most countries
where we operate or intend to operate, historically, experienced
high inflation rates. Inflation and some measures implemented to
curb inflation have had significant negative effects on the
economies of latin american countries. Governmental actions taken
in an effort to curb inflation, coupled with speculation about
possible future actions, have contributed to economic uncertainty
at times in most latin american countries. The countries where we
operate or intend to operate may experience high levels of
inflation in the future that could lead to further government
intervention in the economy, including the introduction of
government policies that could adversely affect our results of
operations. In addition, if any of these countries experience high
rates of inflation, we may not be able to adjust the price of our
services sufficiently to offset the effects of inflation on our
cost structures. A high inflation environment would also have
negative effects on the level of economic activity and employment
and adversely affect our business and results of
operations.
Developments in other markets may affect the Latin American
countries where we operate or intend to operate, and as a result
our financial condition and results of operations may be adversely
affected.
The market value of
securities of companies such as us may be, to varying degrees,
affected by economic and market conditions in other global markets.
Although economic conditions vary from country to country,
investors’ perception of the events occurring in one country
may substantially affect capital flows into and securities from
issuers in other countries, including latin american countries.
Various Latin American economies have been adversely impacted by
the political and economic events that occurred in several emerging
economies in recent times. Furthermore, Latin American economies
may be affected by events in developed economies which are trading
partners or that impact the global economy and adversely affect our
activities and the results of our operations.
Land in Latin American countries may be subject to expropriation or
occupation.
Our land may be
subject to expropriation by the governments of the countries where
we operate and intend to operate. An expropriation could materially
impair the normal use of our lands or have a material adverse
effect on our results of operations. In addition, social movements,
such as
Movimento dos
Trabalhadores Rurais Sem Terra and Comissão Pastoral da Terra
in Brazil
, are active in certain countries where we operate
or intend to operate. Such movements advocate land reform and
mandatory property redistribution by governments. Invasions and
occupations of rural areas by a large number of individuals is
common practice for these movements, and, in certain areas,
including some of those in which we are likely to invest, police
protection and effective eviction proceedings are not available to
land owners. As a result, we cannot assure you that our properties
will not be subject to invasion or occupation. A land invasion or
occupation could materially affect the normal use of our properties
or have a material adverse effect on us or the value of our common
shares and our ADSs.
We may invest in countries other than Argentina and Brazil and
cannot give you any assurance as to the countries in which we will
ultimately invest, and we could fail to list all risk factors for
each possible country.
We have a broad and
opportunistic business strategy therefore we may invest in
countries other than Argentina and Brazil including countries in
other emerging markets outside latin america (e.g., Africa). As a
result, it is not possible at this time to identify all risk
factors that may affect our future operations and the value of our
common shares and ADSs.
14
Risks Relating to Our Business
Fluctuation in market prices for our agriculture products could
adversely affect our financial condition and results of
operations.
Prices for cereals,
oilseeds and by-products, like those of other commodities, can be
expected to fluctuate significantly. The prices that we are able to
obtain for our agriculture products depend on many factors beyond
our control, including:
|
•
|
prevailing world
prices, which historically have been subject to significant
fluctuations over relatively short periods of time, depending on
worldwide demand and supply;
|
|
•
|
changes in the
agricultural subsidy levels in certain important countries (mainly
the United States and countries in the European Union) and the
adoption of other government policies affecting industry market
conditions and prices; and
|
|
•
|
demand for and
supply of competing commodities and substitutes.
|
Our financial
condition and results of operations could be materially and
adversely affected if the prices of our agricultural products
decline.
Unpredictable weather conditions may have an adverse impact on our
crop yields and cattle production.
The occurrence of
severe adverse weather conditions, especially droughts, hail, or
floods, is unpredictable and may have a potentially devastating
impact upon our crop production and, to a lesser extent, our cattle
and wool production. The occurrence of severe adverse weather
conditions may reduce yields on our farmlands or require us to
increase our level of investment to maintain yields.
According to the
United States Department of Agriculture (“USDA”)
estimates, Argentina’s crops output (wheat, corn and soybean)
for the 2016/2017 season is expected to increse by 12.3%, reaching
a production of 108 million tons, as compared to the previous
cycle. The forecast shows mainly an increase in the planted area,
with a focus on wheat and corn, which is additionally enhanced by a
slightly better expected yield in comparison with the 2015/2016
campaign. The estimated production of soybean is supposed to reach
57 million tons, the wheat production 14.4 million tons and the
corn production 36.5 million tons.
We cannot assure
you that the current and future severe adverse weather conditions
will not adversely affect our operating results and financial
condition.
Diseases may strike our crops without warning potentially
destroying some or all of our yields.
The occurrence and
effect of crop disease and pestilence can be unpredictable and
devastating to crops, potentially destroying all or a substantial
portion of the affected harvests. Even when only a portion of the
crop is damaged, our results of operations could be adversely
affected because all or a substantial portion of the production
costs for the entire crop have been duly incurred. Although some
crop diseases are treatable, the cost of treatment is high, and we
cannot assure that such events in the future will not adversely
affect our operating results and financial condition.
Our cattle are subject to diseases.
Diseases among our
cattle herds, such as tuberculosis, brucellosis and foot-and-mouth
disease, can have an adverse effect on milk production and
fattening, rendering cows unable to produce milk or meat for human
consumption. Outbreaks of cattle diseases may also result in the
closure of certain important markets, such as the United States, to
our cattle products. Although we abide by national veterinary
health guidelines, which include laboratory analyses and
vaccination, to control diseases among the herds, especially
foot-and-mouth disease, we cannot assure that future outbreaks of
cattle diseases will not occur. A future outbreak of diseases among
our cattle herds may adversely affect our cattle and milk sales
which could adversely affect our operating results and financial
condition.
We may be exposed to material losses due to volatile crop prices
since a significant portion of our production is not hedged, and
exposed to crop price risk.
Due to the fact
that we do not have all of our crops hedged, we are unable to have
minimum price guarantees for all of our production and are
therefore exposed to significant risks associated with the level
and volatility of crop prices. We are subject to fluctuations in
crop prices which could result in receiving a lower price for our
crops than our production cost. We are also subject to exchange
rate risks related to our crops that are hedged, because our
futures and options positions are valued in U.S. Dollars, and thus
are subject to exchange rate risk.
In addition, if
severe weather or any other disaster generates a lower crop
production than the position already sold in the market, we may
suffer material losses in the repurchase of the sold
contracts.
The creation of new export taxes may have an adverse impact on our
sales and results of operations.
In order to prevent
inflation and variations in the exchange rate from adversely
affecting prices of primary and manufactured products (including
agricultural products), and to increase tax collections and reduce
Argentina’s fiscal deficit, the Argentine government has
imposed new taxes on exports. Pursuant to Resolution No. 11/02 of
the Ministry of Economy and Production, as amended by Resolution
No. 35/02, No. 160/2002, No. 307/2002 and No. 530/2002, effective
as of March 5, 2002, the Argentine government imposed a 20%, 10%
and 5% export tax on primary and manufactured products. On November
12, 2005, pursuant to Resolution No. 653/2005, the Ministry of
Economy and Production increased the tax on cattle exports from 5%
to 10%, and on January 2007 increased the tax on soybean exports
from 23.5% to 27.5%. Pursuant to Resolutions No. 368/07 and No.
369/07 both dated November 12, 2007, the Ministry of Economy and
Production further increased the tax on soybean exports from 27.5%
to 35.0% and also the tax on wheat and corn exports from 20.0% to
28.0% and from 20.0% to 25.0%, respectively. In early March 2008,
the Argentine government introduced a regime of sliding
–scale export tariffs for oilseed, grains and by-products,
where the withholding rate (in percentage) would increase to the
same extent as the crops’ price. Therefore, it imposed an
average tax for soybean exports of 46%, compared to the previous
fixed rate of 35%. In addition, the tax on exports of wheat was
increased, from a fixed rate of 28% to an average variable rate of
38%, and the tax on exports of corn changed from a fixed rate of
25% to an average variable rate of 36%. This tariff regime, which
according to farmers effectively sets a maximum price for their
crops, sparked widespread strikes and protests by farmers whose
exports have been one of the principal driving forces behind
Argentina’s recent growth. In April 2008, as a result of the
export tariff regime, farmers staged a 21-day strike in which,
among other things, roadblocks were set up throughout the country,
triggering Argentina’s most significant political crisis in
five years. These protests disrupted transport and economic
activity, which led to food shortages, a surge in inflation and a
drop in export registrations. Finally, the federal executive branch
decided to send the new regime of sliding-scale export tariffs to
the federal congress for its approval. The project was approved in
the lower chamber of the national congress but rejected by the
Senate. Subsequently, the federal government abrogated the regime
of sliding-scale export tariffs and reinstated the previous scheme
of fixed withholdings.
In December 2015,
the government of Mauricio Macri announced the reduction of 35 to
30% of export duties on soybean and the removing of all of the
export duties for the rest of the products. To the date, the
Argentine government is analyzing the possibility of reducing again
the tax for soybean exports.
Export taxes may
have a material adverse effect on our sales and results of
operations. We produce exportable goods and, therefore, an increase
in export taxes is likely to result in a decrease in our
products’ price, and, therefore, may result in a decrease of
our sales. We cannot guarantee the impact of those or any other
future measures that might be adopted by the Argentine government
on our financial condition and result of operations.
15
An international credit crisis could have a negative impact on our
major customers which in turn could materially adversely affect our
results of operations and liquidity.
The most recent
international credit crisis that started in 2008 had a significant
negative impact on businesses around the world. Although we believe
that available borrowing capacity under the current conditions and
proceeds resulting from potential farmland sales will provide us
with sufficient liquidity through the current economic environment,
the impact of the crisis on our major customers cannot be predicted
and may be quite severe. A disruption in the ability of our
significant customers to access liquidity could cause serious
disruptions or an overall deterioration of their businesses which
could lead to a reduction in their future orders of our products
and the inability or failure on their part to meet their payment
obligations to us, any of which could have a material adverse
effect on our results of operations and liquidity.
Government intervention in the markets may have a direct impact on
our prices.
The Argentine
government has set certain industry market conditions and prices in
the past. In order to prevent a substantial increase in the price
of basic products as a result of inflation, the Argentine
government is adopting an interventionist policy. In March 2002,
the Argentine government fixed the price for milk after a conflict
among producers and the government. Since 2005, the Argentine
government, in order to increase the domestic availability of beef
and reduce domestic prices, adopted several measures: it increased
turnover tax and established a minimum average number of animals to
be slaughtered. In March 2006, the registries for beef exports were
temporarily suspended. This last measure was softened once prices
decreased. There can be no assurance that the Argentine government
will not interfere in other areas by setting prices or regulating
other market conditions. Accordingly, we cannot assure you that we
will be able to freely negotiate all our products’ prices in
the future or that the prices or other market conditions that the
Argentine government could impose will allow us to freely negotiate
the price of our products.
We do not maintain insurance over all our crop storage facilities;
therefore, if a fire or other disaster damages some or all of our
harvest, we will not be completely covered.
We store a
significant portion of our grain production during harvest due to
the seasonal drop in prices that normally occurs at that time.
Currently, we store a significant portion of our grain production
in plastic silos. We do not maintain insurance on our plastic
silos. Although our plastic silos are placed in several different
locations, and it is unlikely that a natural disaster affects all
of them simultaneously, a fire or other natural disaster which
damages the stored grain, particularly if such event occurs shortly
after harvesting, could have an adverse effect on our operating
results and financial condition.
Worldwide competition in the markets for our products could
adversely affect our business and results of
operations.
We experience
substantial worldwide competition in each of our markets in which
we operate, and in many of our product lines. The market for
cereals, oil seeds and by-products is highly competitive and also
sensitive to changes in industry capacity, producer inventories and
cyclical changes in the world’s economies, any of which may
significantly affect the selling prices of our products and thereby
our profitability. Argentina is more competitive in the oilseed
market than in the market for cereals. Due to the fact that many of
our products are agricultural commodities, they compete in the
international markets almost exclusively on the basis of price.
Many other producers of these products are larger than us, and have
greater financial and other resources. Moreover, many other
producers receive subsidies from their respective countries while
we do not receive any such subsidies from the Argentine government.
These subsidies may allow producers from other countries to produce
at lower costs than us and/or endure periods of low prices and
operating losses for longer periods than we can. Any increased
competitive pressure with respect to our products could materially
and adversely affect our financial condition and results of
operations.
Social movements may affect the use of our agricultural properties
or cause damage to them.
Social movements
such as the Landless Rural Workers’ Movement (
Movimento dos Trabalhadores Rurais Sem
Terra
) and the Pastoral Land Commission (
Comissão Pastoral da Terra
) are
active in Brazil and advocate land reform and property
redistribution by the Brazilian government. Invasion and occupation
of agricultural land by large numbers of people is a common
practice among the members of such movements and, in certain
regions, including those where we currently invest, remedies such
as police protection or eviction procedures are inadequate or
non-existent. As a result, we cannot assure you that our
agricultural properties will not be subject to invasion or
occupation by any social movement. Any invasion or occupation may
materially impair the use of our lands and adversely affect our
business, financial condition, and results of
operations.
If we are unable to maintain our relationships with our customers,
particularly with the single customer who purchases our entire raw
milk production each month, our business may be adversely
affected.
Our cattle sales
are diversified, notwithstanding the aforementioned, we are and
will continue to be significantly dependent on a number of third
party relationships, mainly with our customers for crop and milk
sales. During the fiscal year 2016, we sold our products to
approximately 850 customers. Sales of agricultural products to our
ten largest customers represented approximately 72% of our net
sales for the fiscal year ended June 30, 2016. During fiscal year
2016, our biggest three customers were Bunge Argentina S. A.,
Cargill S.A.C.I. and Vicentin S.A.I.C. which represented, in the
aggregate, approximately 31% of our net sales in agricultural
products, while the remaining seven customers in the aggregate
represented approximately 41% of our net sales in the fiscal year
2016.
We sell our crop
production mainly to exporters and manufacturers that process the
raw materials to produce meal and oil, products that are sent to
the export markets. The Argentine crop market is characterized by a
few purchasers and a great number of sellers. Although most of the
purchasers are international companies with strong financial
conditions, we cannot assure you that this situation will remain
the same in the future or this market will not get more
concentrated in the future.
We may not be able
to maintain or form new relationships with customers or others who
provide products and services that are important to our business.
Accordingly, we cannot assure you that our existing or prospective
relationships will result in sustained business or the generation
of significant revenues.
Our business is seasonal, and our revenues may fluctuate
significantly depending on the growing cycle.
Our agricultural
business is highly seasonal due to its nature and cycle. The
harvest and sale of crops (corn, soybean and sunflower) generally
occurs from February to June. Wheat is harvested from December to
January. Our operations and sales are affected by the growing cycle
of the crops we process and by decreases during the summer in the
price of the cattle we fatten. As a result, our results of
operations have varied significantly from period to period, and are
likely to continue to vary, due to seasonal factors.
16
The restrictions imposed on our subsidiaries’ dividend
payments may adversely affect us.
We have
subsidiaries, and therefore, dividends in cash and other permitted
payments of our subsidiaries constitute a major source of our
income. The debt agreements of our subsidiaries contain covenants
that may restrict their ability to pay dividends or proceed with
other types of distributions. If our subsidiaries are prevented
from making payments to us or if they are only allowed to pay
limited amounts, we may be unable to pay dividends or to repay our
indebtedness.
Our principal shareholder has the ability to direct our business
and affairs, and its interests could conflict with
ours.
As of June 30,
2016, Mr. Eduardo S. Elsztain, is the beneficial owner of 30.88%
(on a fully diluted basis) of our common shares. As a result of his
significant influence over us, Mr. Elsztain, by virtue of his
position in IFISA, has been able to elect a majority of the members
of our board of directors, direct our management and determine the
result of substantially all resolutions that require
shareholders’ approval, including fundamental corporate
transactions and our payment of dividends by us.
The interests of
our principal shareholder and management may differ from, and could
conflict with, those of our other shareholders. Pursuant to a
consulting agreement we pay a management fee equal to 10% of our
annual net income to Consultores Asset Management S.A., formerly
known as Dolphin Fund Management S.A. (“Consultores Asset
Management”), a company whose capital stock is 85% owned by
Mr. Eduardo S. Elsztain and the remaining by Saúl Zang, our
vice-chairman. This performance based fee could be viewed as an
incentive for Consultores Asset Management to favor riskier or more
speculative investments than would otherwise be the case. In
addition, as of June 30, 2016 Mr. Elsztain was the beneficial
owner, due to his indirect shareholding through us of 63.38% of
IRSA (without considering treasury shares), an Argentine company
that currently owns approximately 94.61% of the common shares of
its subsidiary IRSA Commercial Properties whose chief executive
officer is Mr. Alejandro G. Elsztain, Mr. Eduardo S.
Elsztain’s brother. We cannot assure you that our principal
shareholders will not cause us to forego business opportunities
that their affiliates may pursue or to pursue other opportunities
that may not be in our interest, all of which may adversely affect
our business, results of operations and financial condition and the
value of our common shares and the ADSs.
We could be materially and adversely affected by our investment in
Brasilagro.
We consolidated our
financial statements with our subsidiary Brasilagro. Brasilagro was
formed on September 23, 2005 to exploit opportunities in the
Brazilian agricultural sector. Brasilagro seeks to acquire and
develop future properties to produce a diversified range of
agricultural products (which may include sugarcane, grains, cotton,
forestry products and livestock). Brasilagro is a startup company
that has been operating since 2006. As a result, it has a
developing business strategy and limited track record.
Brasilagro’s business strategy may not be successful, and if
not successful, Brasilagro may be unable to successfully modify its
strategy. Brasilagro’s ability to implement its proposed
business strategy may be materially and adversely affected by many
known and unknown factors. If we were to write-off our investments
in Brasilagro, this would likely materially and adversely affect
our business. As of June 30, 2016, we owned 39.76% of the
outstanding common shares of Brasilagro.
We are subject to extensive environmental regulation.
Our activities are
subject to a wide set of federal, state and local laws and
regulations relating to the protection of the environment, which
impose various environmental obligations. Obligations include
compulsory maintenance of certain preserved areas in our
properties, management of pesticides and associated hazardous waste
and the acquisition of permits for water use. Our proposed business
is likely to involve the handling and use of hazardous materials
that may cause the emission of certain regulated substances. In
addition, the storage and processing of our products may create
hazardous conditions. We could be exposed to criminal and
administrative penalties, in addition to the obligation to remedy
the adverse effects of our operations on the environment and to
indemnify third parties for damages, including the payment of
penalties for non-compliance with these laws and regulations. Since
environmental laws and their enforcement are becoming more
stringent in Argentina, our capital expenditures and expenses for
environmental compliance may substantially increase in the future.
In addition, due to the possibility of future regulatory or other
developments, the amount and timing of environmental-related
capital expenditures and expenses may vary substantially from those
currently anticipated. The cost of compliance with environmental
regulation may result in reductions of other strategic investments
which may consequently decrease our profits. Any material
unforeseen environmental costs may have a material adverse effect
on our business, results of operations, financial condition or
prospects.
As of June 30,
2016, we owned land reserves extending over more than 365,306
hectares that were purchased at very attractive prices. In
addition, we have a concession over 107,984 hectares reserved for
future development. We believe that there are technological tools
available to improve productivity in these farmlands and,
therefore, achieve appreciation in the long term. However, current
or future environmental regulations could prevent us from fully
developing our land reserves by requiring that we maintain part of
this land as natural woodlands not to be used for production
purposes.
Increased energy prices and fuel shortages could adversely affect
our operations.
We require
substantial amounts of fuel oil and other resources for our harvest
activities and transport of our agricultural products. We rely upon
third parties for our supply of the energy resources consumed in
our operations. The prices for and availability of energy resources
may be subject to change or curtailment, respectively, due to,
among other things, new laws or regulations, imposition of new
taxes or tariffs, interruptions in production by suppliers,
worldwide price levels and market conditions. The prices of various
sources of energy may increase significantly from current levels.
An increase in energy prices could materially adversely affect our
results of operations and financial condition.
We depend on our chairman and senior management.
Our success
depends, to a significant extent, on the continued employment of
Mr. Eduardo S. Elsztain, our chairman, and Alejandro G. Elsztain,
our chief executive officer, and second vice-chairman. The loss of
their services for any reason could have a material adverse effect
on our business. If our current principal shareholders were to lose
their influence on the management of our business, our principal
executive officers could resign or be removed from
office.
Our future success
also depends in part upon our ability to attract and retain other
highly qualified personnel. We cannot assure you that we will be
successful in hiring or retaining qualified personnel, or that any
of our personnel will remain employed by us.
The Investment Company Act may limit our future
activities.
Under Section
3(a)(3) of the Investment Company Act of 1940, as amended, an
investment company is defined in relevant part to include any
company that owns or proposes to acquire investment securities that
have a value exceeding 40% of such company’s unconsolidated
total assets (exclusive of U.S. government securities and cash
items). Investments in minority interests of related entities as
well as majority interests in consolidated subsidiaries which
themselves are investment companies are included within the
definition of “investment securities” for purposes of
the 40% limit under the Investment Company Act.
17
Companies that are
investment companies within the meaning of the Investment Company
Act, and that do not qualify for an exemption from the provisions,
are required to register with the Securities and Exchange
Commission and are subject to substantial regulations with respect
to capital structure, operations, transactions with affiliates and
other matters. In the event such companies do not register under
the Investment Company Act, they may not, among other things,
conduct public offerings of their securities in the United States
or engage in interstate commerce in the United States. Moreover,
even if we desired to register with the Securities and Exchange
Commission as an investment company, we could not do so without an
order of the Commission because we are a non-U.S. corporation, and
it is unlikely that the Securities and Exchange Commission would
issue such an order.
In recent years we
made a significant investment in the capital stock of IRSA. As of
June 30, 2016, we owned approximately 63.38% of IRSA’s
outstanding shares. Although we believe we are not an
“investment company” for purposes of the Investment
Company Act, our belief is subject to substantial uncertainty, and
we cannot give you any assurance that we would not be determined to
be an “investment company” under the Investment Company
Act. As a result, the uncertainty regarding our status under the
Investment Company Act may adversely affect our ability to offer
and sell securities in the United States or to U.S. persons. The
U.S. capital markets have historically been an important source of
funding for us, and our ability to obtain financing in the future
may be adversely affected by a lack of access to the U.S. markets.
If an exemption under the Investment Company Act is unavailable to
us in the future and we desire to access the U.S. capital markets,
our only recourse would be to file an application to the SEC for an
exemption from the provisions of the Investment Company Act which
is a lengthy and highly uncertain process.
Moreover, if we
offer and sell securities in the United States or to U.S. persons
and we were deemed to be an investment company under the investment
company act and not exempted from the application of the Investment
Company Act, contracts we enter into in violation of, or whose
performance entails a violation of, the Investment Company Act,
including any such securities, may not be enforceable against
us.
We hold Argentine securities which might be more volatile than U.S.
securities and carry a greater risk of default.
We currently have
and in the past have had certain investments in Argentine
government debt securities, corporate debt securities, and equity
securities. In particular, we hold a significant interest in IRSA,
an Argentine company that has suffered material losses,
particularly during the fiscal years 2001 and 2002. Although our
holding of these investments, excluding IRSA, tends to be short
term, investments in such securities involve certain risks,
including:
·
market volatility,
higher than those typically associated with U.S. government and
corporate securities; and
·
loss of
principal.
Some of the issuers
in which we have invested and may invest, including the Argentine
government, have in the past experienced substantial difficulties
in servicing their debt obligations, which have led to the
restructuring of certain indebtedness. We cannot assure that the
issuers in which we have invested or may invest will not be subject
to similar or other difficulties in the future which may adversely
affect the value of our investments in such issuers. In addition,
such issuers and, therefore, such investments, are generally
subject to many of the risks that are described in this section
with respect to us, and, thus, could have little or no
value.
Risks relating to our investment in IRSA.
We could be adversely affected by our investment in IRSA if its
value declines.
Our investment in
IRSA is exposed to the common risks generally inherent in
investments in the real estate industry, many of which are outside
IRSA’s control. Any of these risks could adversely and
materially affect IRSA’s businesses, financial position
and/or results of operations. Any available returns on capital
expenditures associated with real estate are dependent upon sales
volumes and/or revenues from leases and the expenses incurred. In
addition, there are other factors that may adversely affect the
performance and the value of a property, including the local
economic conditions prevailing in the area where the property is
located, macroeconomic conditions in Argentina and in the rest of
the world, competition from other companies engaged in real estate
development, IRSA’s ability to find lessees, non-performance
by lessees and/or lease terminations, changes in legislation and in
governmental regulations (including those governing the use of the
properties, urban planning and real estate taxes), variations in
interest rates (including the risk of an increase in interest rates
causing a reduction in the sales of lots in properties intended for
residential development) and the availability of funding. In
addition, and given the relative illiquidity of the real estate
market, IRSA could be unable to effectively respond to adverse
market conditions and/or be compelled to undersell one or more of
its properties. Broadly speaking, some significant expenses, such
as debt services, real estate taxes and operating and maintenance
costs do not fall when there are circumstances that reduce the
revenues from an investment.
These factors
and/or events could impair IRSA’s ability to respond to
adverse changes in the returns on its investments thus causing a
significant reduction in its financial position and/or the results
of its operations, which could have an adverse effect on our
financial position and the results of our operations.
IRSA is subject to risks inherent to the operation of shopping
centers that may affect its profitability.
IRSA’s
shopping centers are subject to various factors that affect their
development, administration and profitability,
including:
·
decline in its
lease prices or increases in levels of default by IRSA’s
tenants due to economic conditions, increases in interest rates and
other factors that IRSA cannot control;
·
the accessibility
and the attractiveness of the area where the shopping center is
located;
·
the intrinsic
attractiveness of the shopping center;
·
the flow of people
and the level of sales of each shopping center rental
unit;
·
increasing
competition from internet sales;
·
the amount of rent
collected from each shopping center rental
unit;
·
changes in consumer
demand and availability of consumer credit (considering the limits
impose by the Central Bank to interest rates charged by financial
institutions), both of which are highly sensitive to general
macroeconomic conditions; and
·
fluctuations in
occupancy levels in IRSA’s shopping
centers.
An increase in
IRSA’s operating costs, caused by inflation or by other
factors, could have a material adverse effect on IRSA if its
tenants are unable to pay higher rent due to the increase in
expenses. Moreover, the shopping center business is closely related
to consumer spending and by prevailing economic conditions that
affect potential customers. All of IRSA’s shopping centers
and commercial properties, under Operations Center in Argentina,
are located in Argentina, and, as a consequence, their business
could be seriously affected by a recession in Argentina. For
example, during the economic crisis in Argentina, spending
decreased significantly, unemployment, political instability and
inflation significantly reduced consumer spending in Argentina,
lowering tenants’ sales and forcing some tenants to leave
IRSA’s shopping centers. Persistently poor economic
conditions in Argentina will likely have a material adverse effect
on the revenues from shopping center activity and thus on
IRSA’s business.
18
Our assets are highly concentrated in certain geographic areas and
an economic downturn in such areas could have a material adverse
effect on our results of operations and financial
condition.
For the fiscal year
ended June 30, 2016, 78% of IRSA’s sales from leases and
services, for the Operations Center in Argentina, were derived from
shopping centers located in the City of Buenos Aires and the
Greater Buenos Aires metropolitan area. In addition, all of
IRSA’s office buildings are located in the City of Buenos
Aires and a substantial portion of IRSA’s revenues in
Argentina are derived from such properties. Although IRSA owns
properties and may acquire or develop additional properties outside
of the City of Buenos Aires and the Greater Buenos Aires, IRSA
expects to continue to depend to a large extent on economic
conditions affecting those areas and therefore, an economic
downturn in those areas could have a material adverse effect on
IRSA’s financial condition and results of operations by
reducing our rental income may adversely affect its ability to meet
their debt obligations.
IRSA’s performance is subject to risks associated with its
properties and with the real estate industry.
IRSA’s
economic performance and the value of its real estate assets are
subject to the risk that their properties may not be able to
generate sufficient revenues to meet the operating expenses,
including debt service and capital expenditures, IRSA’s cash
flow and ability to service its debt and to cover other expenses
may be adversely affected.
Events or
conditions beyond IRSA’s control that may adversely affect
its operations or the value of its properties include:
·
downturns in the
national, regional and local economic climate;
·
volatility and
decline in discretionary spending;
·
competition from
other shopping centers and office, and commercial
buildings;
·
local real estate
market conditions, such as oversupply or reduction in demand for
retail, office, or other commercial space;
·
decreases in
consumption levels;
·
changes in interest
rates and availability of financing;
·
the exercise by our
tenants of their legal right to early termination of their
leases;
·
vacancies, changes
in market rental rates and the need to periodically repair,
renovate and re-lease space;
·
increased operating
costs, including insurance expense, salary increases, utilities,
real estate taxes, state and local taxes and heightened security
costs;
·
civil disturbances,
earthquakes and other natural disasters, or terrorist acts or acts
of war which may result in uninsured or underinsured
losses;
·
significant
expenditures associated with each investment, such as debt service
payments, real estate taxes, insurance and maintenance
costs;
·
declines in the
financial condition of our tenants and our ability to collect rents
from our tenants;
·
changes in our
ability or our tenants’ ability to provide for adequate
maintenance and insurance, possibly decreasing the useful life of
and revenue from property;
·
changes in law or
governmental regulations (such as those governing usage, zoning and
real property taxes) or government action such as expropriation,
confiscation or revocation of concessions; and
·
judicial
interpretation of the New Civil and Commercial Code (in force from
August 1, 2015), which may be adverse to our
interests.
If any one or more
of the foregoing conditions were to affect IRSA’s business,
it could have a material adverse effect on our financial condition
and results of operations.
An adverse economic environment for real estate companies such as a
credit crisis may adversely impact our results of operations and
business prospects significantly.
The success of
IRSA’s business and profitability of its operations depend on
continued investment in the real estate sector and access to
capital and debt financing. A long term crisis of confidence in
real estate investments and lack of credit for acquisitions may
tend to constrain our growth. As part of our business goals, IRSA
intends to increase its properties portfolio though strategic
acquisitions of core properties at advantageous prices, where IRSA
believes it can bring the necessary expertise to enhance property
values.
In order to pursue
acquisitions, IRSA may need access to equity capital and/or debt
financing. Any disruptions in the financial markets, including the
bankruptcy and restructuring of major financial institutions, may
adversely impact IRSA’s ability to refinance existing debt
and the availability and cost of credit in the near future. Any
consideration of sales of existing properties or portfolio
interests may be tempered by decreasing property values.
IRSA’s ability to make scheduled payments or to refinance its
obligations with respect to indebtedness depends on its operating
and financial performance, which in turn is subject to prevailing
economic conditions. If a recurrence of the disruptions in
financial markets remains or arises in the future, there can be no
assurances that government responses to such disruptions will
restore investor confidence, stabilize the markets or increase
liquidity and the availability of credit.
19
IRSA may face risks associated with property
acquisitions.
IRSA has in the
past acquired, and intends to acquire in the future, properties,
including large properties that would increase its size and
potentially alter its capital structure. Although, IRSA believes
that the acquisitions that it has completed in the past and that it
expect to undertake in the future have, and will, enhance its
future financial performance, the success of such transactions is
subject to a number of uncertainties, including the risk
that:
·
IRSA may not be
able to obtain financing for acquisitions on favorable
terms;
·
acquired properties
may fail to perform as expected;
·
the actual costs of
repositioning or redeveloping acquired properties may be higher
than our estimates; and
·
acquired properties
may be located in new markets where we may have limited knowledge
and understanding of the local economy, absence of business
relationships in the area or unfamiliarity with local governmental
and permitting procedures.
If IRSA acquires
new properties, it may not be able to efficiently integrate
acquired properties, particularly portfolios of properties, into
IRSA’s organization and to manage new properties in a way
that allows it to realize cost savings and synergies, which could
impair the results of operations.
IRSA’s future acquisitions may be unprofitable.
IRSA intends to
acquire additional properties to the extent that they manage to
acquire them on advantageous terms and conditions and they meet our
investment criteria. Acquisitions of commercial properties entail
general investment risks associated with any real estate
investment, including:
·
IRSA’s
estimates of the cost of improvements needed to bring the property
up to established standards for the market may prove to be
inaccurate;
·
properties IRSA
acquires may fail to achieve, within the time frames it projects,
the occupancy or rental rates it expects to achieve at the time it
makes the decision to acquire, which may result in the
properties’ failure to achieve the returns that IRSA
projected;
·
IRSA
pre-acquisition evaluation of the physical condition of each new
investment may not detect certain defects or identify necessary
repairs, which could significantly increase the total acquisition
costs; and
·
IRSA investigation
of a property or building prior to its acquisition, and any
representations IRSA may receive from the seller of such building
or property, may fail to reveal various liabilities, which could
reduce the cash flow from the property or increase our acquisition
cost.
If IRSA acquires a
business, it will be required to merge and integrate the
operations, personnel, accounting and information systems of such
acquired business. In addition, acquisitions of or investments in
companies may cause disruptions in IRSA’s operations and
divert management’s attention away from day-to-day
operations, which could impair IRSA’s relationships with its
current tenants and employees.
Acquired properties may subject IRSA to unknown
liabilities.
Properties that
IRSA acquires may be subject to unknown liabilities and IRSA would
have no recourse, or only limited recourse, to the former owners of
the properties. Thus, if a liability were asserted against it based
upon ownership of an acquired property, IRSA might be required to
pay significant sums to settle it, which could adversely affect its
financial results and cash flow. Unknown liabilities relating to
acquired properties could include:
·
liabilities for
clean-up of undisclosed environmental
contamination;
·
law reforms and
governmental regulations (such as those governing usage, zoning and
real property taxes); and
·
liabilities
incurred in the ordinary course of business.
IRSA’s dependence on rental income may adversely affect its
ability to meet its debt obligations.
A substantial part
of IRSA's income is derived from rental income from real property.
As a result, IRSA's performance depends on its ability to collect
rent from its tenants. IRSA's income and funds for distribution
would be negatively affected is a significant number of its
tenants:
·
delay lease
commencements;
·
decline to extend
or renew leases upon expiration;
·
fail to make rental
payments when due; or
·
close stores or
declare bankruptcy.
Any of these
actions could result in the termination of leases and the loss of
rental income attributable to the terminated leases. In addition,
IRSA cannot adssure you that any whose lease expires will renew
that lease or that we will be able to re-lease space on
economically advantageous terms or at all. The loss of rental
revenues froma number of our tenants and our inability to replace
such tenants may adversely affect our profitability and our ability
to meet debt and other financial obligations.
It may be difficult to buy and sell real estate quickly and
transfer restrictions may apply to part of IRSA’s portfolio
of properties.
Real estate
investments are relatively illiquid and this tends to limit its
ability to vary its portfolio in response to changes in the economy
or other conditions. In addition, significant expenditures
associated with each investment, such as mortgage payments, real
estate taxes and maintenance costs, are generally not reduced when
circumstances cause a decrease in income from an investment. If
income from a property declines while the related expenses do not
decline, IRSA’s business would be adversely affected.
Further, if it becomes necessary or desirable for it to dispose of
one or more of the mortgaged properties, IRSA may not be able to
obtain a release of the lien on the mortgaged property without
payment of the associated debt. The foreclosure of a mortgage on a
property or inability to sell a property could adversely affect its
business.
Some of the land IRSA has purchased is not zoned for development
purposes, and it may be unable to obtain, or may face delays in
obtaining the necessary zoning permits and other
authorizations.
IRSA owns several
plots of land which are not zoned for the type of projects it
intends to develop. In addition, IRSA does not yet have the
required land-use, building, occupancy and other required
governmental permits and authorizations for these properties. IRSA
cannot assure you that it will continue to be successful in its
attempts to rezone land and to obtain all necessary permits and
authorizations, or that rezoning efforts and permit requests will
not be unreasonably delayed or rejected. Moreover, IRSA may be
affected by building moratorium and anti-growth legislation. If it
is unable to obtain all of the governmental permits and
authorizations it needs to develop its present and future projects
as planned, IRSA may be forced to make unwanted modifications to
such projects or abandon them altogether.
20
IRSA’s ability to grow will be limited if IRSA cannot obtain
additional financing.
IRSA must maintain
liquidity to fund its working capital, service its outstanding
indebtedness and finance investment opportunities. Without
sufficient liquidity, IRSA could be forced to curtail its
operations or may not be able to pursue new business
opportunities.
IRSA´s growth
strategy is focused on the development and redevelopment of
properties IRSA already owns and the acquisition and development of
additional properties. As a result, IRSA is likely to depend to an
important degree on the availability of debt or equity capital,
which may or may not be available on favorable terms or at all.
IRSA cannot guarantee that additional financing, refinancing or
other capital will be available in the amounts IRSA desires or on
favorable terms. IRSA´s access to debt or equity capital
markets depends on a number of factors, including the
market’s perception of IRSA´s growth potential,
IRSA´s ability to pay dividends, its financial condition, its
credit rating and its current and potential future earnings.
Depending on these factors, IRSA could experience delays or
difficulties in implementing its growth strategy on satisfactory
terms or at all.
The capital and
credit markets have been experiencing extreme volatility and
disruption since the last credit crisis. If IRSA’s current
resources do not satisfy its liquidity requirements, it may have to
seek additional financing. The availability of financing will
depend on a variety of factors, such as economic and market
conditions, the availability of credit and its credit ratings, as
well as the possibility that lenders could develop a negative
perception of the prospects of IRSA or the industry generally. IRSA
may not be able to successfully obtain any necessary additional
financing on favorable terms, or at all.
Serious illnesses and pandemics, such as the 2009 outbreak of
Influenza A H1N1 virus (the “Swine Flu”) and the
current Zika virus, have in the past adversely affected consumer
and tourist activity, may do so in the future and may adversely
affect our results of operations.
As a result of the
outbreak of Swine Flu during the winter of 2009, consumers and
tourists dramatically changed their spending and travel habits to
avoid contact with crowds. Furthermore, several governments enacted
regulations limiting the operation of schools, cinemas and shopping
centers. Even though the Argentine government only issued public
service recommendations to the population regarding the risks
involved in visiting crowded places, such as shopping centers, and
did not issue specific regulations limiting access to public
places, a significant number of consumers nonetheless changed their
habits vis-a-vis shopping centers and malls. Similarly, the current
zika virus pandemic may result in similar courses and outcomes. We
cannot assure you that a new disease outbreak or health hazard
(such as the Ebola outbreak in recent years) will not occur in the
future, or that such an outbreak or health hazard would not
significantly affect consumer and/or tourist activity, and that
such scenario would not adversely affect our
businesses.
Adverse incidents that occur in IRSA’s shopping centers may
result in damage to IRSA’s image and a decrease in the number
of IRSA’s customers.
Given that shopping
centers are open to the public, with ample circulation of people,
accidents, theft, robbery and other incidents may occur in
IRSA´s facilities, regardless of the preventative measures it
adopts. In the event such an incident or series of incidents
occurs, shopping center customers and visitors may choose to visit
other shopping venues that they believe are safer and less violent,
which may cause a reduction in the sales volume and operating
income of IRSA´s shopping centers.
Argentine Law governing leases imposes restrictions that limit
IRSA´s flexibility.
Argentine laws
governing leases impose certain restrictions, including the
following:
·
a prohibition on
including automatic price adjustment clauses based on inflation
increases in lease agreements; and
·
the imposition of a
two-year minimum lease term for all purposes, except in particular
cases such as embassy, consulate or international organization
venues, room with furniture for touristic purposes for less than
three months, custody and bailment of goods, exhibition or offering
of goods in fairs or in cases where due to the circumstances, the
subject matter of the lease agreement requires a shorter
term.
As a result of the
foregoing, IRSA is exposed to the risk of increases of inflation
under our leases, and the exercise of rescission rights by our
tenants could materially and adversely affect its business. IRSA
cannot assure you that its tenants will not exercise such right,
especially if rent values stabilize or decline in the future or if
economic conditions deteriorate.
In addition, on
October 1, 2014, the Argentine Congress adopted a new Civil and
Commercial Code (the “Civil and Commercial Code”) which
became effective on June 30, 2015, and is in force since August 1,
2015, and requires that lease agreements provide for a minimum term
of two years, and a maximum term of twenty years for residential
leases and of fifty years for other leases. Furthermore, the Civil
and Commercial Code modifies the regime applicable to contractual
provisions relating to foreign currency payment obligations by
establishing that foreign currency payment obligations may be
discharged in Pesos. This amends the legal framework currently in
force, pursuant to which debtors may only discharge their foreign
currency payment obligations by making payment in the specific
foreign currency agreed upon in their agreements; although the
option to discharge in Pesos a foreign currency obligation may be
waived by the debtor is still under discussion. Although certain
judicial decisions have held that this regulation regarding foreign
currency can be set aside by the parties to an agreement, it is
still too early to determine whether or not this legal provision
can be set aside in an agreement as a general rule. Moreover, and
regarding the new provisions for leases, there are no judicial
decisions on the scope of this amendment and, in particular, in
connection with the ability of the parties to any contract to set
aside the new provision and enforce such agreements before an
Argentine court.
IRSA may be liable for some defects in its
buildings.
According to the
Argentine Civil Code as previously in effect, the builder of a real
estate development was liable in case of property damage –
meaning the damages compromises the structure and/or the defects
render the building no longer useful – for a period of 10
years since the possession of the property; on the other hand, the
builder was liable for latent defects, even when those defects did
not imply significant property damage. In addition, the Argentine
Civil Code as previously in effect, provided that such liability
was extended to the technical project manager and the designer of
any given project. Furthermore, in certain cases, such as when
consumer law was involved, the liability could be extended to the
developer. The Civil and Commercial Code, which became effective on
August 1, 2015, has similar provisions and expressly extends the
liability for such damage to real estate developers (
i.e.
, any person who sells real estate
built by either themselves or by a third party contractor), and any
other person involved in the project, in addition to the liability
of the builder, the technical project manager and the designer of
the project. According to the Civil and Commercial Code, the
warranty period for latent defects expires after three years after
the client takes possession of the real estate, and both the
builder and the seller are liable for such defects.
In IRSA’s
real estate developments it usually act as developer and seller and
build through third-party contractors. Absent a specific claim,
IRSA cannot quantify the potential cost of any obligation that may
arise as a result of a future claim, and it has not recorded
provisions associated with them in its financial statements. If
IRSA were required to remedy any defects on completed works, its
financial condition and results of operations could be adversely
affected.
21
Eviction proceedings in Argentina are difficult and time
consuming.
Although Argentine
law permits a summary proceeding to collect unpaid rent and a
special proceeding to evict tenants, eviction proceedings in
Argentina are difficult and time-consuming. Historically, the heavy
workloads of the courts and the numerous procedural steps required
have generally delayed landlords’ efforts to evict tenants.
Eviction proceedings generally take between six months and two
years from the date of filing of the suit to the time of actual
eviction.
Historically, IRSA
has sought to negotiate the termination of lease agreements with
defaulting tenants after the first few months of non-payment in
order to avoid legal proceedings. Delinquency may increase
significantly in the future, and such negotiations with tenants may
not be as successful as they have been in the past. Moreover, new
Argentine laws and regulations may forbid or restrict eviction, and
in each such case, they would likely have a material and adverse
effect on IRSA´s financial condition and results of
operation.
IRSA is subject to risks inherent to the operation of office
buildings that may affect its profitability.
Office buildings
are subject to various factors that affect their development,
administration and profitability, including:
·
a decrease in
demand for office space;
·
a deterioration in
the financial condition of our tenants may result in defaults under
leases due to bankruptcy, lack of liquidity or for other
reasons;
·
difficulties or
delays renewing leases or re-leasing space;
·
decreases in rents
as a result of oversupply, particularly of newer
buildings;
·
competition from
developers, owners and operators of office properties and other
commercial real estate, including sublease space available from our
tenants; and
·
maintenance, repair
and renovation costs incurred to maintain the competitiveness of
IRSA’s office buildings.
If IRSA is unable
to adequately address these factors, any one of them could
adversely impact our business, which would have an adverse effect
on our financial condition and results of operations.
IRSA’s investment in property development and management
activities may be less profitable than we anticipate.
IRSA is a company
engaged in the development and management of shopping centers,
office buildings and other rental properties, frequently through
third-party contractors. Risks associated with IRSA’s
development and management activities include the following, among
others:
·
abandonment of
development opportunities and renovation
proposals;
·
construction costs
of a project may exceed IRSA’s original estimates for reasons
including raises in interest rates or increases in the costs of
materials and labor, making a project
unprofitable;
·
occupancy rates and
rents at newly completed properties may fluctuate depending on a
number of factors, including market and economic conditions,
resulting in lower than projected rental rates and a corresponding
lower return on our investment;
·
pre-construction
buyers may default on its purchase contracts or units in new
buildings may remain unsold upon completion of
construction;
·
the unavailability
of favorable financing alternatives in the private and public debt
markets;
·
aggregate sale
prices of residential units may be insufficient to cover
development costs;
·
construction and
lease-up may not be completed on schedule, resulting in increased
debt service expense and construction costs;
·
failure or delays
in obtaining, necessary zoning, land-use, building, occupancy and
other required governmental permits and authorizations, or building
moratoria and anti-growth legislation;
·
significant time
lags between the commencement and completion of projects subjects
IRSA to greater risks due to fluctuation in the general
economy;
·
construction may
not be completed on schedule because of a number of factors,
including weather, labor disruptions, construction delays or delays
in receipt of zoning or other regulatory approvals, or man-made or
natural disasters (such as fires, hurricanes, earthquakes or
floods), resulting in increased debt service expense and
construction costs;
·
general changes in
IRSA’s tenants’ demand for rental properties;
and
·
IRSA may incur
capital expenditures that could result in considerable time
consuming efforts and which may never be completed due to
government restrictions.
In addition, IRSA
may face contractors’ claims for the enforcement of labor
laws in Argentina (sections 30, 31 and 32 under Law No. 20,744),
which provide for joint and several liability. Many companies in
Argentina hire personnel from third-party companies that provide
outsourced services, and sign indemnity agreements in the event of
labor claims from employees of such third company that may affect
the liability of such hiring company. However, in recent years,
several courts have denied the existence of independence in those
labor relationships and declared joint and several liabilities for
both companies.
While IRSA’s
policies with respect to expansion, renovation and development
activities are intended to limit some of the risks otherwise
associated with such activities, nevertheless IRSA is subject to
risks associated with the construction of properties, such as cost
overruns, design changes and timing delays arising from a lack of
availability of materials and labor, weather conditions and other
factors outside of its control, as well as financing costs, may
exceed original estimates, possibly making the associated
investment unprofitable. Any substantial unanticipated delays or
expenses could adversely affect the investment returns from these
redevelopment projects and harm its operating results.
IRSA is subject to great competitive pressure.
IRSA’s real
estate activities are highly concentrated in the Buenos Aires
metropolitan area, where the real estate market is highly
competitive due to a scarcity of properties in sought-after
locations and the increasing number of local and international
competitors.
Furthermore, the
Argentine real estate industry is generally highly competitive and
fragmented and does not have high barriers to entry restricting new
competitors from entering the market. The main competitive factors
in the real estate development business include availability and
location of land, price, funding, design, quality, reputation and
partnerships with developers. A number of residential and
commercial developers and real estate services companies compete
with it in seeking land for acquisition, financial resources for
development and prospective purchasers and tenants. Other
companies, including joint ventures of foreign and local companies,
have become increasingly active in the real estate business and
shopping center business in Argentina, further increasing this
competition. To the extent that one or more of IRSA’s
competitors are able to acquire and develop desirable properties,
as a result of greater financial resources or otherwise, its
business could be materially and adversely affected. If IRSA is not
able to respond to such pressures as promptly as its competitors,
or the level of competition increases, its financial condition and
results of its operations could be adversely affected.
22
There are other
shopping centers and numerous smaller retail stores and residential
properties within the market area of each of our properties. The
number of competing properties in a particular area could have a
material adverse effect on its ability to lease retail space in its
shopping centers or sell units in its residential complexes and on
the amount of rent or the sale price that IRSA is able to charge.
IRSA cannot assure you that other shopping center operators,
including international shopping center operators, will not invest
in Argentina in the near future. If additional companies become
active in the Argentine shopping center market in the future, such
competition could have a material adverse effect on IRSA’s
results of operations.
Substantially all
of IRSA’s offices and other non-shopping center rental
properties are located in developed urban areas. There are many
office buildings, shopping malls, retail and residential premises
in the areas where the properties are located. This is a highly
fragmented market, and the abundance of comparable properties in
the vicinity may adversely affect the ability to rent or sell
office space and other real estate and may affect the sale and
lease price of their premises. In the future, both national and
foreign companies may participate in Argentina’s real estate
development market, competing with IRSA for business
opportunities.
Some potential losses are not covered by insurance, and certain
kinds of insurance coverage may become prohibitively
expensive.
IRSA currently
carries insurance policies that cover potential risks such as civil
liability, fire, loss profit, floods, including extended coverage
and losses from leases on all of its properties. Although IRSA
believes the policy specifications and insured limits of these
policies are generally customary, there are certain types of
losses, such as lease and other contract claims, terrorism and acts
of war that generally are not insured under the insurance policies
offered in the national market. Should an insured loss or a loss in
excess of insured limits occur, IRSA could lose all or a portion of
the capital it has invested in a property, as well as the
anticipated future revenue from the property. In such an event,
IRSA might nevertheless remain obligated for any mortgage debt or
other financial obligations related to the property. IRSA cannot
assure you that material losses in excess of insurance proceeds
will not occur in the future. If any of our properties were to
experience a catastrophic loss, it could seriously disrupt its
operations, delay revenue and result in large expenses to repair or
rebuild the property. If any of its key employees were to die or
become incapacitated, it could experience losses caused by a
disruption in its operations which will not be covered by
insurance, and this could have a material adverse effect on its
financial condition and results of operations.
In addition, IRSA
cannot assure you that it will be able to renew its insurance
coverage in an adequate amount or at reasonable prices. Insurance
companies may no longer offer coverage against certain types of
losses, such as losses due to terrorist acts and mold, or, if
offered, these types of insurance may be prohibitively
expensive.
An uninsured loss or a loss that exceeds the policies on
IRSA’s properties could subject to lost capital or revenue on
those properties.
Under the terms and
conditions of the leases currently in force on IRSA’s
properties, tenants are required to indemnify and hold harmless
from liabilities resulting from injury to persons, or property, on
or off the premises, due to activities conducted on the properties,
except for claims arising from our negligence or intentional
misconduct or that of its agents.
Tenants are
generally required, at the tenant’s expense, to obtain and
keep in full force during the term of the lease, liability and
property damage insurance policies. In addition, IRSA cannot assure
the holders that the tenants will properly maintain their insurance
policies or have the ability to pay the deductibles.
Should a loss occur
that is uninsured or in an amount exceeding the combined aggregate
limits for the policies noted above, or in the event of a loss that
is subject to a substantial deductible under an insurance policy,
IRSA could lose all or part of its invested capital, and
anticipated revenue from, one or more of the properties, which
could have a material adverse effect on our operating results and
financial condition.
Demand for IRSA’s premium properties may not be
sufficient.
IRSA has focused on
developing residential projects that cater to affluent individuals
and has entered into property barter agreements pursuant to which
IRSA contributes its undeveloped properties to ventures with
developers who will deliver to its units at premium locations. At
the time the developers return these properties to it, demand for
premium residential units could be significantly lower. In such
case, IRSA would be unable to sell these residential units at the
estimated prices or time frame, which could have an adverse effect
on its financial condition and results of operations.
IRSA’s level of debt may adversely affect its operations and
its ability to pay its debt as it becomes due.
IRSA had, and
expects to have, substantial liquidity and capital resource
requirements to finance its business. As of June 30, 2016,
IRSA’s consolidated financial debt amounted to Ps.112,932
million (Including IDBD’s debt outstanding as of that date
plus accrued and unpaid interest on such indebtedness and deferred
financing costs). IRSA cannot assure you that it will have
sufficient cash flows and adequate financial capacity in the
future. While, the commitments and other covenants applicable to
IDBD’s debt obligations do not have apply IRSA since such it
is not recourse to IRSA and it is not guaranteed by IRSA’s
assets, these covenants and restrictions may impair or restrict
IRSA’s ability to operate IDBD and implement its business
strategy.
The fact that IRSA
is highly leveraged may affect its ability to refinance existing
debt or borrow additional funds to finance working capital
requirements, acquisitions and capital expenditures. In addition,
the recent disruptions in the global financial markets, including
the bankruptcy and restructuring of major financial institutions,
may adversely impact IRSA’s ability to refinance existing
debt and the availability and cost of credit in the future. In such
conditions, access to equity and debt financing options may be
restricted and it may be uncertain how long these economic
circumstances may last.
This would require
IRSA to allocate a substantial portion of cash flow to repay
principal and interest, thereby reducing the amount of money
available to invest in operations, including acquisitions and
capital expenditures. Its leverage could also affect its
competitiveness and limit its ability to changes in market
conditions, changes in the real estate industry and economic
downturns.
IRSA may not be
able to generate sufficient cash flows from operations to satisfy
its debt service requirements or to obtain future financing. If
IRSA cannot satisfy its debt service requirements or if IRSA
default on any financial or other covenants in its debt
arrangements, the lenders and/or holders of its debt will be able
to accelerate the maturity of such debt or cause defaults under the
other debt arrangements. IRSA’s ability to service debt
obligations or to refinance them will depend upon its future
financial and operating performance, which will, in part, be
subject to factors beyond its control such as macroeconomic
conditions and regulatory changes in Argentina. If it cannot obtain
future financing, it may have to delay or abandon some or all of
its planned capital expenditures, which could adversely affect its
ability to generate cash flows and repay its obligations as they
become due.
23
The recurrence of a credit crisis could have a negative impact on
its major customers, which in turn could materially adversely
affect its results of operations and liquidity.
The global credit
crisis that began in 2008 had a significant negative impact on
businesses around the world. The impact of a crisis on our major
tenants cannot be predicted and may be quite severe. A disruption
in the ability of our significant tenants to access liquidity could
cause serious disruptions or an overall deterioration of their
businesses which could lead to a significant reduction in their
future orders of their products and the inability or failure on
their part to meet their payment obligations to us, any of which
could have a material adverse effect on our results of operations
and liquidity.
IRSA is subject to risks affecting the hotel industry.
The full-service
segment of the lodging industry in which our hotels operate is
highly competitive. The operational success of our hotels is highly
dependent on our ability to compete in areas such as access,
location, quality of accommodations, rates, quality food and
beverage facilities and other services and amenities. Our hotels
may face additional competition if other companies decide to build
new hotels or improve their existing hotels to increase their
attractiveness.
In addition, the
profitability of our hotels depends on:
·
IRSA’s
ability to form successful relationships with international and
local operators to run our hotels;
·
changes in tourism
and travel trends, including seasonal changes and changes due to
pandemic outbreaks, such as the A H1N1 virus or a potential ebola
outbreak, among others, or weather phenomena’s or other
natural events, such as the eruption of the Puyehué and the
Calbuco volcano in June 2011 and April 2015,
respectively;
·
affluence of
tourists, which can be affected by a slowdown in global economy;
and
·
taxes and
governmental regulations affecting wages, prices, interest rates,
construction procedures and costs.
The shift of consumers to purchasing goods over the Internet, where
barriers to entry are low, may negatively affect sales at
IRSA’s shopping centers.
In recent years,
internet retail sales have grown significantly in Argentina, even
although the market share of such sales is still insignificant. The
Internet enables manufacturers and retailers to sell directly to
consumers, diminishing the importance of traditional distribution
channels such as retail stores and shopping centers. IRSA believes
that its target consumers are increasingly using the Internet, from
home, work or elsewhere, to shop electronically for retail goods,
and this trend is likely to continue. If e-commerce and retail
sales through the Internet continue to grow, consumers’
reliance on traditional distribution channels such as IRSA´s
shopping centers could be materially diminished, having a material
adverse effect on our financial condition, results of operations
and business prospects.
IRSA’s business is subject to extensive regulation and
additional regulations may be imposed in the future.
IRSA’s
activities are subject to Argentine federal, state and municipal
laws, and to regulations, authorizations and licenses required with
respect to construction, zoning, use of the soil, environmental
protection and historical patrimony, consumer protection, antitrust
and other requirements, all of which affect its ability to acquire
land, buildings and shopping centers, develop and build projects
and negotiate with customers. In addition, companies in this
industry are subject to increasing tax rates, the creation of new
taxes and changes in the taxation regime. IRSA is required to
obtain licenses and authorizations with different governmental
authorities in order to carry out IRSA´s projects. Maintaining
IRSA´s licenses and authorizations can be a costly provision.
In the case of non-compliance with such laws, regulations, licenses
and authorizations, IRSA may face fines, project shutdowns, and
cancellation of licenses and revocation of
authorizations.
In addition, public
authorities may issue new and stricter standards, or enforce or
construe existing laws and regulations in a more restrictive
manner, which may force IRSA to make expenditures to comply with
such new rules. Development activities are also subject to risks
relating to potential delays in obtaining or an inability to obtain
all necessary zoning, environmental, land-use, development,
building, occupancy and other required governmental permits and
authorizations. Any such delays or failures to obtain such
government approvals may have an adverse effect on IRSA´s
business.
In the past, the
Argentine government imposed strict and burdensome regulations
regarding leases in response to housing shortages, high rates of
inflation and difficulties in accessing credit. Such regulations
limited or prohibited increases on rental prices and prohibited
eviction of tenants, even for failure to pay rent. Most of
IRSA´s leases provide that the tenants pay all costs and taxes
related to their respective leased areas. In the event of a
significant increase in the amount of such costs and taxes, the
Argentine government may respond to political pressure to intervene
by regulating this practice, thereby negatively affecting
IRSA´s rental income. IRSA cannot assure you that the
Argentine government will not impose similar or other regulations
in the future. Changes in existing laws or the enactment of new
laws governing the ownership, operation or leasing of properties in
Argentina could negatively affect the Argentine real estate market
and the rental market and materially and adversely affect
IRSA´s operations and profitability.
IRSA faces risks associated with its expansion in the United
States.
On July 2, 2008, we
acquired 30% interest in Metropolitan 885 LLC
(“Metropolitan”), a limited liability company organized
under the laws of Delaware, United States of America. During fiscal
year 2011, an agreement was reached to restructure
Metropolitan’s debt; after the consummation of the
aforementioned restructuring, we indirectly hold 49% of New
Lipstick LLC (“New Lipstick”), a holding company which
is the owner of Metropolitan. Metropolitan’s main asset is
the Lipstick Building, a 34-story building located at 885, Third
Avenue between 53 and 54 streets in Manhattan, New York.
Metropolitan has incurred in a secured loan in connection with the
Lipstick Building. For more information, please see “Item 5.
Operating and Financial Review and Prospects”.
In March 2012,
through our subsidiary Real Estate Strategies, L.P.
(“RES”), we acquired 3,000,000 Series C convertible
preferred shares issued by Condor in an aggregate amount of US$ 30
million, a REIT focused in middle-class and long-stay hotels in 20
states in the United States of America.
During 2008 and
2009, the U.S. markets experienced extreme dislocations and a
severe contraction in available liquidity globally as important
segments of the credit markets were frozen. Global financial
markets have been disrupted by, among other things, volatility in
securities prices, rating downgrades and declining valuations. This
disruption lead to a decline in business and consumer confidence
and increased unemployment and precipitated an economic recession
throughout the globe. As a consequence, owners and operators of
commercial real estate, including hotels and resorts, and
commercial real estate properties such as offices, experienced
dramatic declines in property values. We are unable to predict if
disruptions in the global financial markets will occur in the
future and the impact that may have on IRSA’s business,
financial condition and results of operations.
24
If the bankruptcy of Inversora Dársena Norte S.A. is extended
to IRSA´s subsidiary Puerto Retiro, IRSA will likely lose a
significant investment in a unique waterfront land reserve in the
City of Buenos Aires.
On April 18, 2000,
Puerto Retiro S.A. (“Puerto Retiro”) was served notice
of a filing made by the Argentine Government, through the Ministry
of Defense, seeking to extend bankruptcy of Inversora Dársena
Norte S.A. (“Indarsa”) to the Company. Upon filing of
the complaint, the bankruptcy court issued an order, restraining
the ability of Puerto Retiro to dispose of, in any manner, the real
property purchased in 1993 from Tandanor.
Indarsa had
acquired 90% of the capital stock in Tandanor from the Argentine
Government in 1991. Tandanor’s main business involved ship
repairs performed in a 19-hectare property located in the vicinity
of La Boca neighborhood and where the Syncrolift is
installed.
As Indarsa failed
to comply with its payment obligation for acquisition of the shares
of stock in Tandanor, the Ministry of Defense filed a bankruptcy
petition against Indarsa, seeking to extend it to the
Company.
The evidentiary
stage of the legal proceedings has concluded. The Company lodged an
appeal from the injunction order, and such order was confirmed by
the Court of Appeals on December 14, 2000. The parties filed the
arguments in due time and proper manner. After the case was set for
judgment, the judge ordered the suspension of the judicial order
requesting the case records for issuance of a decision based on the
alleged existence of pre-judgmental status in relation to the
criminal case against former officials of the Ministry of Defense
and the Company’s former executive officers, for which reason
the case will not be adjudicated until a final judgment is entered
in respect of the criminal case.
It has been made
known to the commercial court that the expiration of the statute of
limitations has been declared in the criminal action and the
criminal defendants have been acquitted. However, this decision was
reversed by the Criminal Court (
Cámara de Casación Penal
). An
extraordinary appeal was filed and rejected, therefore an appeal
was directly lodged with the Argentine Supreme Court for improper
refusal to permit the appeal, and a decision is still
pending.
The Management and
external legal counsel to the Company believe that there are
sufficient legal and technical arguments to consider that the
petition for an extension of the bankruptcy will be dismissed by
the court. However, in view of the particular features and progress
of the case, this position cannot be held to be
conclusive.
In turn, Tandanor
filed a civil action against Puerto Retiro and the other defendants
in the criminal case for violation of Section 174 (5) based on
Section 173 (7) of the Criminal Code. Such action seeks -on the
basis of the nullity of the decree that approved the bidding
process involving the Dársena Norte property- a reimbursement
in favor of Tandanor for all such amounts it has allegedly lost as
a result of a suspected fraudulent transaction involving the sale
of the property disputed in the case.
In July 2013, the
answer to the civil action was filed, which contained a number of
defenses. Tandanor requested the intervention of the Argentine
Government as third party co-litigant in this case, which petition
was granted by the Court. In March 2015, both the Argentine
Government and the criminal complainant answered the asserted
defenses. On July 12, 2016, Puerto Retiro was legally notified of
the decision adopted by the Tribunal Oral Federal N° 5 related
to the preliminary objections above mentioned. Two of them were
rejected –lack of information and lack of legitimacy
(passive). We filed an appeal with regard to the rejection of these
two objections. But, on the other hand, the other two objections
will be considered at sentencing by the court, which is an
important step in order to obtain a favorable decision. As of the
date hereof, no resolution has been issued in such regard. We can
not assure you we will be successful in getting this case
dismissed.
Property ownership through joint ventures or minority participation
may limit IRSA´s ability to act exclusively in its
interest.
In some cases, IRSA
develops and acquires properties through joint ventures with other
persons or entities when IRSA believes circumstances warrant the
use of such structures. For example, IRSA currently owns 80% of
Panamerican Mall S.A. (“PAMSA”), while another 20% is
owned by Centro Comercial Panamericano S.A., and 50% of Quality
Invest S.A. (“Quality Invest”).
IRSA could engage
in a dispute with one or more of its joint venture partners that
might affect its ability to operate a jointly owned property.
Moreover, its joint venture partners may at any time, have
business, economic or other objectives that are inconsistent with
its objectives, including objectives that relate to the timing and
terms of any sale or refinancing of a property. For example, the
approval of certain of the other investors is required with respect
to operating budgets and refinancing, encumbering, expanding or
selling any of these properties. In some instances, its joint
venture partners may have competing interests in its markets that
could create conflicts of interest. If the objectives of its joint
venture partners are inconsistent with its own objectives, IRSA
will not be able to act exclusively in its interests.
If one or more of
the investors in any of its jointly owned properties were to
experience financial difficulties, including bankruptcy, insolvency
or a general downturn of business, there could be an adverse effect
on the relevant property or properties and in turn, on its
financial performance. Should a joint venture partner declare
bankruptcy, IRSA could be liable for its partner’s common
share of joint venture liabilities.
Dividend restrictions in IRSA’s subsidiaries’ debt
agreements may adversely affect it.
Dividends paid by
IRSA’s subsidiaries are an important source of funds for IRSA
as are other permitted payments from subsidiaries. The debt
agreements of its subsidiaries contain covenants restricting their
ability to pay dividends or make other distributions. If
IRSA’s subsidiaries are unable to make payments to it, or are
able to pay only limited amounts, IRSA may be unable to make
payments on its indebtedness.
IRSA is dependent on its Board of Directors.
IRSA´s
success, to a significant extent, depends on the continued
employment of Mr. Eduardo S. Elsztain, and certain other members of
its board of directors and senior management, who have significant
expertise and knowledge of its business and industry. The loss or
interruption of their services for any reason could have a material
adverse effect on its business and results of operations.
IRSA´s future success also depends in part upon its ability to
attract and retain other highly qualified personnel. IRSA cannot
assure you that they will be successful in hiring or retaining
qualified personnel or that any of its personnel will remain
employed by them.
IRSA may face potential conflicts of interest relating to its
principal shareholders.
IRSA’s
largest beneficial owner is Mr. Eduardo S. Elsztain, through us. As
of June 30, 2016, such beneficial ownership consisted of: (i)
366,788,251 common shares held by us, and (ii) 900 common shares
held directly by Mr. Elsztain.
See Item 7 –
Major Shareholders and Related Party Transactions. Conflicts of
interest between IRSA’s management, us and its affiliates may
arise in the performance of IRSA’s business activities. As of
June 30, 2016, Mr. Elsztain also beneficially owned (i)
approximately 30.9% of ours’ common shares and (ii)
approximately 94.6% of the common shares of our subsidiary IRSA
Commercial Properties. IRSA cannot assure you that its’
principal shareholders and their affiliates will not limit or cause
IRSA to forego business opportunities that its affiliates may
pursue or that the pursuit of other opportunities will be in
IRSA’s interest.
25
Due to the currency mismatches between assets and liabilities, IRSA
may have currency exposure.
As of June 30,
2016, the majority of IRSA’s liabilities, From the Operation
Center in Argentina, such as the Series II Notes are denominated in
U.S. dollars while IRSA’s revenues are mainly
denominated in Pesos This currency gap exposes IRSA to a risk of
volatility in the rate of exchange between the Peso and the U.S.
dollar, and its financial results are adversely affected when the
U.S. dollar appreciates against the Peso. Any
depreciation of the Peso against the U.S. dollar will
correspondingly increase the nominal amount of its debt in Pesos,
with further adversely effects on its results of operation and
financial condition and may increase the collection risk of its
leases and other receivables from its tenants, most of which
generate Peso-denominated revenues. Because IRSA records the value
of its investment properties in Argentina at acquisition cost plus
capital expediture, less amortization, any depreciation or
devaluation of the Peso will have an adverse effect on its
financial statements.
IRSA’s Investment in Banco Hipotecario.
As of June 30,
2016, IRSA owned approximately 29.91% of the outstanding capital
stock of Banco Hipotecario S.A. (“Banco Hipotecario”),
which represented 11% of IRSA’s consolidated assets from its
operations center in Argentina as of such date.
All of Banco
Hipotecario’s operations, properties and customers are
located in Argentina. Accordingly, the quality of Banco
Hipotecario’s loan portfolio, financial condition and results
of operations depend on economic, regulatory and political
conditions prevailing in Argentina.
These conditions
include growth rates, inflation rates, exchange rates, changes to
interest rates, changes to government policies, social instability
and other political, economic or international developments either
taking place in, or otherwise affecting, Argentina.
Risks Relating to the Argentine Financial System and Banco
Hipotecario
The short-term structure of the deposit base of the Argentine
financial system, including Banco Hipotecario, could lead to a
reduction in liquidity levels and limit the long-term expansion of
financial intermediation.
Given the
short-term structure of the deposit base of the Argentine financial
system, credit lines are also predominantly short-term, with the
exception of mortgages, which represent a low proportion of the
existing credit base.
Although liquidity
levels are currently reasonable, no assurance can be given that
these levels will not be reduced due to a future negative economic
scenario. Therefore, there is still a risk of low liquidity levels
that could increase funding cost in the event of a withdrawal of a
significant amount of the deposit base of the financial system, and
limit the long-term expansion of financial intermediation including
Banco Hipotecario.
The stability of the financial system depends upon the ability of
financial institutions, including ours, to maintain and increase
the confidence of depositors.
The measures
implemented by the Argentine government in late 2001 and early
2002, in particular the restrictions imposed on depositors to
withdraw money freely from banks and the “pesification”
and restructuring of their deposits, were strongly opposed by
depositors due to the losses on their savings and undermined their
confidence in the Argentine financial system and in all financial
institutions operating in Argentina.
If depositors once
again withdraw their money from banks in the future, there may be a
substantial negative impact on the manner in which financial
institutions, including ours, conduct their business, and on their
ability to operate as financial intermediaries. Loss of confidence
in the international financial markets may also adversely affect
the confidence of Argentine depositors in local banks.
In the future, an
adverse economic situation, even if it is not related to the
financial system, could trigger a massive withdrawal of capital
from local banks by depositors, as an alternative to protect their
assets from potential crises. Any massive withdrawal of deposits
could cause liquidity issues in the financial sector and,
consequently, a contraction in credit supply.
The occurrence of
any of the above could have a material and adverse effect on Banco
Hipotecario’s expenses and business, results of operations
and financial condition.
The asset quality of financial institutions is exposed to the
non-financial public sector’s and Central Bank’s
indebtedness.
Financial
institutions carry significant portfolios of bonds issued by the
Argentine government and by provincial governments as well as loans
granted to these governments. The exposure of the financial system
to the non-financial public sector’s indebtedness had been
shrinking steadily, from 48.9% of total assets in 2002 to 10.3% in
2015 and 9.2% for the period of six months ended as June 30, 2016.
To an extent, the value of the assets held by Argentine banks, as
well as their capacity to generate income, is dependent on the
creditworthiness of the non-financial public sector, which is in
turn tied to the government’s ability to foster sustainable
long-term growth, generate fiscal revenues and reduce public
expenditure.
In addition,
financial institutions currently carry securities issued by the
Central Bank in their portfolios, which generally are short-term;
as of June 30, 2016 such securities issued by the Central Bank
represented approximately 23.6% of the total assets of the
Argentine financial system. As of June 30, 2016, Banco
Hipotecario’s total exposure to the public sector was
Ps.7,517.5 million, which represented 20.3% of its assets as of
that date, and the total exposure to securities issued by the
Central Bank was Ps. 1,499.8 million, which represented 4.1% of its
total assets as of June 30, 2016.
The Consumer Protection Law may limit some of the rights afforded
to Banco Hipotecario.
Argentine Law No.
24,240 (the “Consumer Protection Law”) sets forth a
series of rules and principles designed to protect consumers, which
include Banco Hipotecario’s customers. The Consumer
Protection Law was amended by Law No. 26,361 on March 12, 2008 to
expand its applicability and the penalties associated with
violations thereof. Additionally, Law No. 25,065 (as amended by Law
No. 26,010 and Law No. 26,361, the “Credit Card Law”)
also sets forth public policy regulations designed to protect
credit card holders. Recent Central Bank regulations, such as
Communication “A” 5388, also protect consumers of
financial services.
In addition, the
Civil and Commercial Code has a chapter on consumer protection,
stressing that the rules governing consumer relations should be
applied and interpreted in accordance with the principle of
consumer protection and that a consumer contract should be
interpreted in the sense most favorable to it.
The application of
both the Consumer Protection Law and the Credit Card Law by
administrative authorities and courts at the federal, provincial
and municipal levels has increased. This trend has increased
general consumer protection levels. If Banco Hipotecario is found
to be liable for violations of any of the provisions of the
Consumer Protection Law or the Credit Card Law, the potential
penalties could limit some of Banco Hipotecario’s rights, for
example, with respect to its ability to collect payments due from
services and financing provided by us, and adversely affect Banco
Hipotecario’s financial results of operations. We cannot
assure you that court and administrative rulings based on the
newly-enacted regulation or measures adopted by the enforcement
authorities will not increase the degree of protection given to
Banco Hipotecario’s debtors and other customers in the
future, or that they will not favor the claims brought by consumer
groups or associations. This may prevent or hinder the collection
of payments resulting from services rendered and financing granted
by us, which may have an adverse effect on Banco
Hipotecario’s business and results of
operations.
26
Class actions against financial institutions for unliquidated
amounts may adversely affect the financial system’s
profitability.
Certain public and
private organizations have initiated class actions against
financial institutions in Argentina. The National Constitution and
the Consumer Protection Law contain certain provisions regarding
class actions. However, their guidance with respect to procedural
rules for instituting and trying class action cases is limited.
Nonetheless, through an
ad
hoc
doctrine, Argentine courts have admitted class actions
in some cases, including various lawsuits against financial
entities related to “collective interests” such as
alleged overcharging on products, interest rates and advice in the
sale of public securities, etc. If class action plaintiffs were to
prevail against financial institutions, their success could have an
adverse effect on the financial industry in general and indirectly
on Banco Hipotecario’s business.
Banco Hipotecario operates in a highly regulated environment, and
its operations are subject to regulations adopted, and measures
taken, by several regulatory agencies.
Financial
institutions are subject to a major number of regulations
concerning functions historically determined by the Central Bank
and other regulatory authorities. The Central Bank may penalize
Banco Hipotecario and its directors, members of the Executive
Committee, and members of its Supervisory Committee, in the event
of any breach of the applicable regulation. Potential sanctions,
for any breach on the applicable regulations may vary from
administrative and/or disciplinary penalties to criminal sanctions.
Similarly, the CNV, which authorizes securities offerings and
regulates the capital markets in Argentina, has the authority to
impose sanctions on us and Banco Hipotecario’s Board of
Directors for breaches of corporate governance established in the
capital markets laws and CNV Rules. The Financial Information Unit
(Unidad de Información Financiera or “UIF” as per
its acronym in spanish) regulates matters relating to the
prevention of asset laundering and has the ability to monitor
compliance with any such regulations by financial institutions and,
eventually, impose sanctions.
We cannot assure
you whether such regulatory authorities will commence proceedings
against Banco Hipotecario, its shareholders or directors, or its
Supervisory Committee, or penalize Banco Hipotecario. This
notwithstanding, and in addition to “Know Your
Customer” compliance, Banco Hipotecario has implemented other
policies and procedures to comply with its duties under currently
applicable rules and regulations.
In addition to
regulations specific to the banking industry, Banco Hipotecario is
subject to a wide range of federal, provincial and municipal
regulations and supervision generally applicable to businesses
operating in Argentina, including laws and regulations pertaining
to labor, social security, public health, consumer protection, the
environment, competition and price controls. We cannot assure that
existing or future legislation and regulation will not require
material expenditures by Banco Hipotecario or otherwise have a
material adverse effect on Banco Hipotecario’s consolidated
operations.
Increased competition and M&A activities in the banking
industry may adversely affect Banco Hipotecario.
Banco Hipotecario
foresees increased competition in the banking sector. If the trend
towards decreasing spreads is not offset by an increase in lending
volumes, the ensuing losses could lead to mergers in the industry.
These mergers could lead to the establishment of larger, stronger
banks with more resources than us. Therefore, although the demand
for financial products and services in the market continues to
grow, competition may adversely affect Banco Hipotecario’s
results of operations, resulting in shrinking spreads and
commissions.
Future governmental measures may adversely affect the economy and
the operations of financial institutions.
The Argentine
government has historically exercised significant influence over
the economy, and financial institutions, in particular, have
operated in a highly regulated environment. We cannot assure you
that the laws and regulations currently governing the economy or
the banking sector will remain unaltered in the future or that any
such changes will not adversely affect Banco Hipotecario’ s
business, financial condition or results of operations and Banco
Hipotecario’ s ability to honor its debt obligations in
foreign currency.
Several legislative
bills to amend the Financial Institutions Law have been sent to the
Argentine Congress. If the law currently in force were to be
comprehensively modified, the financial system as a whole could be
substantially and adversely affected. If any of these legislative
bills were to be enacted or if the Financial Institutions Law were
amended in any other way, the impact of the subsequent amendments
to the regulations on the financial institutions in general, Banco
Hipotecario’ s business, its financial condition and the
results of operations is uncertain.
Law N° 26,739
was enacted to amend the Central Bank’s charter, the
principal aspects of which are: (i) to broaden the scope of the
Central Bank’s mission (by establishing that such institution
shall be responsible for financial stability and economic
development while pursuing social equity); (ii) to change the
obligation to maintain an equivalent ratio between the monetary
base and the amount of international reserves; (iii) to establish
that the board of directors of the institution will be the
authority responsible for determining the level of reserves
required to guarantee normal operation of the foreign exchange
market based on changes in external accounts; and (iv) to empower
the monetary authority to regulate and provide guidance on credit
through the financial system institutions, so as to “promote
long-term production investment”.
In addition, the
Civil and Commercial Code, among other things, modifies the
applicable regime for contractual provisions relating to foreign
currency payment obligations by establishing that foreign currency
payment obligations may be discharged in Pesos. This amends the
legal framework, pursuant to which debtors may only discharge their
foreign currency payment obligations by making payment in the
specific foreign currency agreed upon in their agreements; provided
however that the option to discharge in Pesos a foreign currency
obligation may be waived by the debtor is still under
discussion.
We are not able to
ensure that any current or future laws and regulations (including,
in particular, the amendment to the Financial Institutions Law and
the amendment to the Central Bank’s charter) will not result
in significant costs to us, or will otherwise have an adverse
effect on Banco Hipotecario’ s operations.
Risks Relating to Banco Hipotecario’s Business
The quality of Banco Hipotecario’s loan portfolio could be
impaired if the Argentine private sector continues to be affected
in the event of a decrease in the level of activity.
Banco
Hipotecario’s loan portfolio is concentrated on
recession-sensitive segments and it is to a large extent dependent
upon local and international economic conditions. This in turn
might affect the creditworthiness of Banco Hipotecario’s loan
portfolio and its results of operations.
27
Reduced spreads without corresponding increases in lending volumes
could adversely affect Banco Hipotecario’s
profitability.
The spread for
Argentina’s financial system between the interest rates on
loans and deposits could be affected as a result of increased
competition in the banking sector and the Argentine
government’s tightening of monetary policy in response to
inflation concerns.
Since 2009, the
interest rate spreads throughout the Argentine financial system
have generally increased. This increase was sustained by a steady
demand for consumer loans in recent years. In 2013 and 2014,
borrowing and lending rates increased significantly. However, the
net interest margin of the financial system remained stable due to
a substantial growth both in the loan and deposit
portfolios.
In June 2014, the
Central Bank established a system of maximum active benchmark rates
for consumer loans and secured loans and additionally, in October
2014, established a new mechanism of regulation by setting a
minimum deposit rate for certain deposits of natural
persons.
We cannot guarantee
that interest rate spreads will remain stable unless increases in
lending or additional cost-cutting occurs. A reversal of this
trend, or a new regulation imposing maximum active benchmark rates,
could adversely affect Banco Hipotecario’s
profitability.
Banco Hipotecario’s obligations as trustee of the Programa de
Crédito Argentino del Bicentenario para la Vivienda Única
Familiar (“PROCREAR”) trust are limited.
Banco Hipotecario
currently acts as trustee of the PROCREAR Trust, which aims to
facilitate access to housing solutions by providing mortgage loans
for construction and developing housing complexes across Argentina.
Under the terms and conditions of the PROCREAR Trust, all the
duties and obligations under the trust have to be settled with the
trust estate. Notwithstanding, if the aforementioned is not met,
Banco Hipotecario could have its reputation affected. In addition,
if the Argentine government decides to terminate the PROCREAR Trust
and/or terminate Banco Hipotecario’ s role as trustee of the
PROCREAR Trust, this may adversely affect Banco Hipotecario’
s results of operations.
The Argentine Government might prevail at Banco Hipotecario’
s General Shareholders’ Meetings.
By virtue of Law
N° 23,696 (the “Privatization Law”) there are no
restrictions on the Argentine Government’s ability to dispose
of its Class A shares and all those shares minus one could be sold
to third parties through public offering. Banco Hipotecario’
s By-laws set forth that if at any time Class A shares were to
represent less than 42% of Banco Hipotecario’ s shares with
right to vote, Class D shares automatically lose their triple vote
right, which could result in the principal shareholders losing
control of Banco Hipotecario. Should any such situation materialize
and should the Argentine Government retain a sufficient number of
Class A shares, the Argentine Government could prevail in
Shareholders’ Meetings (except for some decisions that call
for qualified majorities) and could thus exert actual control on
the decisions that must be submitted to consideration by the
Shareholders’ Meeting.
Cybersecurity events could negatively affect Banco
Hipotecario’s reputation, its financial condition and results
of operations.
Banco Hipotecario
has access to large amounts of confidential financial information
and control substantial financial assets belonging to the customers
as well as to Banco Hipotecario. In addition, Banco Hipotecario
provides its customers with continuous remote access to their
accounts and the possibility of transferring substantial financial
assets by electronic means. Accordingly, cybersecurity is a
material risk for Banco Hipotecario. Cybersecurity incidents, such
as computer break-ins, phishing, identity theft and other
disruptions could negatively affect the security of information
stored in and transmitted through Banco Hipotecario ‘s
computer systems and network infrastructure and may cause existing
and potential customers to refrain from doing business with Banco
Hipotecario.
In addition,
contingency plans in place may not be sufficient to cover
liabilities associated with any such events and, therefore,
applicable insurance coverage may be deemed inadequate, preventing
Banco Hipotecario from receiving full compensation for the losses
sustained because of such a disruption.
Although Banco
Hipotecario intends to continue to implement security technology
devices and establish operational procedures to prevent such
damage, we cannot assure you that all of Banco Hipotecario‘s
systems are entirely free from vulnerability and these security
measures will be successful. If any of these events occur, it could
damage Banco Hipotecario’s reputation, entail serious costs
and affect Banco Hipotecario‘s transactions, as well as its
results of operations and financial condition.
A disruption or failure in any of Banco Hipotecario’s
information technology systems could adversely affect its
business.
Banco Hipotecario
depends on the efficient and uninterrupted operation of
internet-based data processing, communication and information
exchange platforms and networks, including those systems related to
the operation of Banco Hipotecario’s ATM network. Banco
Hipotecario’s operations depend on its ability to manage its
information technology systems and communications efficiently and
without interruption. Banco Hipotecario’s communications,
systems or transactions could be harmed or disrupted by fire,
floods, power failures, defective telecommunications, computer
viruses, electronic or physical theft and similar events or
disruptions. In addition, Banco Hipotecario’s information
technology systems and operations may suffer if its suppliers do
not meet the delivery of products in a timely manner or decide to
end the relationship with Banco Hipotecario.
Any of the
foregoing events may cause disruptions in Banco Hipotecario’s
information technology systems, delays and the loss of critical
data, and could prevent Banco Hipotecario from operating at optimal
levels. In addition, the contingency plans in place may not be
sufficient to cover all those events and, therefore, this may mean
that the applicable insurance coverage is limited or inadequate,
preventing Banco Hipotecario from receiving full compensation for
the losses sustained because of such a disruption. Also, Banco
Hipotecario’s recovery of losses plan may not be enough to
prevent damage resulting from all the cases and Banco
Hipotecario’s insurance coverage could be inadequate to cover
losses from interruptions. If any of these assumptions occur Banco
Hipotecario’s reputation, business, results of operations and
financial condition could be adversely affected.
Differences in the accounting standards between Argentina and
certain countries with developed capital markets, such as the
United States, may make it difficult to compare Banco
Hipotecario’s financial statements and those prepared by
companies from these other countries.
Publicly available
information about Banco Hipotecario in Argentina is presented
differently from the information available for registered public
companies in certain countries with highly developed capital
markets, such as the United States. Except as otherwise described
herein, Banco Hipotecario prepares its financial statements in
accordance with Central Bank GAAP, which differ in certain
significant respects from Argentine GAAP and from U.S.
GAAP.
28
Operations Center in
Israel
Risks
related to Israel
Conditions in Israel could adversely affect our subsidiary
IDBD.
Our subsidiary IDB
Development Corporation is incorporated and operates in Israel.
Accordingly, political, economic and military conditions in Israel
directly affect IDBD’s business. Since the State of Israel
was established in 1948, a number of armed conflicts have occurred
between Israel, the Palestinian Authority and Israel’s Arab
neighbors. Although Israel has entered into various agreements with
Egypt, Jordan and the Palestinian Authority, there has been an
increase in unrest and terrorist activity, which began in September
2000 and has continued with varying levels of severity. Starting in
December 2008, for approximately three weeks, Israel engaged in an
armed conflict with Hamas in the Gaza Strip, which involved missile
strikes against civilian targets in various parts of Israel and
negatively affected business conditions in Israel. In November
2012, for approximately one week, Israel experienced a similar
armed conflict, resulting in hundreds of rockets being fired from
the Gaza Strip and disrupting most day-to-day civilian activity in
southern Israel. Due to these conflicts, political, economic and
military conditions in Israel may directly affect IDBD and could
result in physical damage to its related facilities or the
interruption or curtailment of trade between Israel and its present
trading partners. If IDBD’s assets are damaged as a result of
hostile action or hostilities otherwise disrupt its ongoing
operations, IDBD’s business could be materially adversely
affected. We do not believe that the political and security
situation has had any material impact on IDBD to date; however, we
can give no assurance that security and political conditions will
not have such effect in the future. Any armed conflict, political
instability or continued violence in the region, or the
interruption or curtailment of trade between Israel and its present
trading partners may have a negative effect on the Israeli economy
and IDBD and adversely affect the results of operations business,
and financial condition, thereby negatively impacting its ability
to generate revenue.
Israel’s economy may become unstable.
Over the years, the
Israeli economy has been subject to periods of inflation, low
foreign exchange reserves, fluctuations in world commodity prices,
military conflicts and civil unrest. For these and other reasons,
the government of Israel has, from time to time, intervened in the
economy employing fiscal and monetary policies. The Israeli
government has periodically changed its policies in these areas.
Reoccurrence of previous destabilizing factors could make it more
difficult for IDBD to operate its business and could adversely
affect its financial results.
In the years in
which there is strong economic activity and positive growth in the
Israeli economy, there is an increase in demand. Conversely, in
times of financial crisis, demand decreases, which would adversely
affect the results of IDBD and, in turn, adversely affect our
consolidated results.
The compliance of the new provisions of the Reduced Centralization
Act may have an adverse material impact in IDBD’s results of
operations.
In December 2013,
the official “Reshumot” published in Israel the
Promotion of Competition and Reduction of Centralization Law,
5774-2013 (the “Reduced Centralization Act”), which
imposes certain limits in the ownership and control of reporting
companies.
One provision
limits the pyramidal structure (or multiholding companies) of
control in reporting companies (in special entities whose
securities are held by public shareholders) to two layers of
entities (with the holding company in the first layer not including
a reporting entity that has no controlling shareholder). In case
Discount Investment is considered a second-tier company, it would
be prohibited to control publicly held companies. IDBD may be
required to merge Discount Investments in order to enable continued
control of IDBD and/or Discount Investments in other
companies.
In connection with
evaluating the application of the Law, in August 2014, IDBD’s
Board of Directors appointed an advisory committee to examine
various alternatives to address the implications of the Law to
comply with the provisions that apply to control in a pyramid o
multiholding company structure in order to enable continued control
of IDBD and/or Discount Investments in “other tier
companies” (currently held directly by Discount Investments)
as of December 2019. The advisory committee has recommended the
following alternatives:
(a)
Taking either IDBD
or Discount Investments private thereby removing the requirement
that they be reporting entities (and as a result not a “tier
company”); and
(b)
Merge IDBD and
Discount Investments.
The Board of
Directors of Discount Investments has appointed an advisory
committee with a similar function. As of the date of this Annual
Report, no specific alternatives have been identified. The
implementation of an alternative that would be adopted is likely to
take several years.
Based on these
analyses, IDBD considers it more likely that the completion of one
of the specified alternatives will be adopted to comply with the
restrictions of the Law regarding pyramidal holdings, while
allowing IDBD to continue to control Discount Investments, and
Discount Investments to continue to control Cellcom after December
2019. PBC, which currently is a third-tier company that controls
each of Gav-Yam, Ispro and Mehadrin, has preliminarily evaluated
application of the Law on its holding structure and determined that
it will be able to maintain said control, as it has concluded that
the Law has no effect over its financial statements.
Another new
provision determines the separation of significant affiliates and
significant financial institutions. In May 2015, companies of Clal
Holdings Insurance Enterprises (except Clal Holdings Insurance
Enterprises), including Clal Insurance and Epsilon Investment House
Ltd. (held by Discount Investments) were included in the list of
the significant financial institutions published in the website
Ministry of Finance and the official gazette in connection with the
Reduced Centralization Act. Clal Holdings Insurance Enterprises was
included in the list as a significant corporation. The
classification of Clal Holdings Insurance Enterprises as a
significant corporation directly impacts its control over Clal
Insurance.
In December 2014,
Israel’s concentration committee issued directives for the
appointment of a trustee in Clal Holdings Insurance Enterprises to
hold the control currently held by IDBD. In addition, in December
30, 2014, the committee delivered a notification requesting IDBD to
sell its interest in Clal Holdings Insurance Enterprises. The sale
arrangement outlined in the letter involves IDBD’s and the
Trustee’s interests in the sale process under different
options and timeframes. As of June 30, 2016, the current sale
arrangement involved the sale of the interest in the stock exchange
or by over-the-counter trades, as per the following detail and by
the following dates:
a. IDBD would
have to sell at least 5% of its equity interest in Clal from May 7,
2016.
b. During
each of the subsequent four-month periods, IDBD would have to sell
at least an additional 5% of its equity interest in
Clal.
c. If IDBD
sells more than 5% of its equity interest in Clal in any given
four-month period, the percentage in excess of the required 5%
would be offset against the percentage required in the following
period.
As a result we
record our investment in CLAL as a financial asset at market value
through profit or loss. The request to sell the shares of CLAL in
5% tranches could cause a negative impact on the market price. A
decrease in the market price of Clal’s shares would cause an
immediate effect in our income statements and financial
results.
Clal Holdings
Insurance Enterprises appealed to the committee, requesting a
reclassification of its status of significant corporation. Dolphin
filed an appeal before the Supreme Court of Justice of Israel on
the Tel Aviv-Jaffo Court’s Decision. We cannot assure
that we will be successful in our appealing with the concentration
committee.
The compliance of
the Reduced Centralization Act, in particular the provisions
related to reporting companies in pyramid structure (or
multiholding companies) and separation of significant corporations
and significant financial corporations, may have a material adverse
impact on IDBD’s business and results of operations and, as a
consequence, a negative effect on the value of our investment in
IDBD. For more information about the Reduced Centralization Act and
potential implications of its provisions on IDBD and its
subsidiaries, see “Item 4 – Information on the
Company”.
IDBD’s operations may be disrupted by the obligations of
personnel to perform military service.
IDBD’s
Israeli employees may be called upon to perform up to 36 days (and
in some cases more) of annual military reserve duty until they
reach the age of 40 (and in some cases, up to the age of 45 or
older) and, in emergency circumstances, could be called to
permanent active duty. In response to increased tension and
hostilities, there have been occasional call-ups of military
reservists, including in connection with the mid-2006 war in
Lebanon and the December 2008 and November 2012 conflicts with
Hamas in the Gaza Strip. It is possible that there will be
additional call-ups in the future. IDBD could be disrupted by the
absence of a significant number of employees or the absence of one
or more key employees for extended periods of times due to military
service. Such disruption could materially adversely affect
IDB’s business and its results of operations. Additionally,
the absence of a significant number of the employees of IDB’s
Israeli suppliers and contractors or the absence of one or more key
employees for extended periods of time due to military service may
disrupt their operations and thereby materially adversely affect
IDBD’s ability to generate revenue and, in turn, adversely
affect our consolidated results.
29
Political relations could limit IDBD’s ability to do business
internationally.
Several countries,
principally in the Middle East, restrict doing business with Israel
and Israeli companies, and additional countries may impose
restrictions on doing business with Israel and Israeli companies if
hostilities in Israel or political instability in the region
continues or increases. These restrictions may materially limit
IDBD’s ability to export or import certain services, or
reduce the domestic demand for its products and services as a
result of the interruption or curtailment of trade between Israel
and its present trading partners, which could adversely affect
IDBD’s ability to generate revenue and, in turn, adversely
affect our consolidated results.
IDBD may face difficulties in exporting offshore.
Israel’s
export policy currently sets forth certain restrictions that may be
unfavorable to IDBD’s activities. Changes in customs tariffs
for goods and in policy on protecting local production may impact
the results of some IDBD’s subsidiaries and/or associates. In
addition, the possibility of exportation and sales in Israel
depends on several factors, such as establishment of export and
transportation facilities, obtaining regulatory approvals, the
economic viability of exports, geopolitical challenges,
identification of potential customers in the international market,
and financing investments in development and establishment of the
export projects. In view of the complexity and potential limited
ability to export, IDBD may be unable to export surplus supply and
this may materially adversely affect the its financial
results.
IDBD’s business is subject to substantial regulation and
permit requirements in Israel and may be materially adversely
affected if it is unable to comply with existing regulations or
requirements, or changes in applicable regulations or
requirements.
Our subsidiary IDBD
is subject to a number of laws and regulations affecting many
aspects of its present and future operations, as well as permits
from Israeli government authorities. Such laws and regulations
generally require that IDBD obtain and comply with a wide variety
of licenses, permits and other approvals.
In recent years
there is a trend of increased legislation, standards and
regulations in various sectors of Israel’s economy.
Legislative changes in various areas in Israel, such as reducing
economic concentration, promoting competition and laws concerning
anti-trust, taxation, mandatory tender offers, regulation of the
communications market, supervision of insurance business, corporate
law and securities law, laws concerning supervision of prices of
goods and services, consumer protection laws, environmental
protection laws, planning and construction laws. This trend may
impact the business and financial results of IDBD and its
subsidiaries, their financial results and trading price of their
securities. Furthermore, changes in policy applied by various
Israeli authorities pursuant to these laws may also have similar
impact.
Under these and
other laws and regulations, IDBD could be subject to business
restructurings, changes in its corporate structure, business
strategy and other corporate adaptations. Failure to comply with
these laws and regulations may also result in the suspension or
termination of IDBD’s operations and subject them to
administrative, civil and criminal penalties. Moreover, these laws
and regulations could change in ways that could substantially
increase its costs. Any such liabilities, penalties, suspensions,
terminations or regulatory changes could have a material adverse
effect on IDBD’s financial condition and results of
operations. Stricter regulation applicable to IDBD’s
business, restrictive trade practices, control of prices and
similar factors, may materially adversely affect IDBD’s
businesses.
IDBD’s
activities are subject to approvals, permits and licenses awarded
to them by law by various authorities (such as: the Commissioner of
Capital Market, Ministry of Communications, Ministry of
Environmental Protection, Petroleum Supervisor at the Ministry of
Energy and Water). Failure to comply with terms and conditions of
such approvals, permits or licenses may result in sanctions being
imposed (including criminal sanctions) on the companies in breach,
including fines and/or termination of the relevant approvals,
permits or licenses. Some of the aforementioned licenses are for a
limited term and may be renewed from time to time, all subject to
terms and conditions thereof and to statutory provisions. As of the
date hereof, we cannot predict what changes (if any) will be made
with respect to future licensing and other regulatory matters.
Furthermore, there is no certainty that IDBD’s existing
licenses will be renewed at the end of their terms or that there
will not be a change in the licenses’
conditions.
We cannot assure
that the existing laws and regulations will not be revised or
reinterpreted, that new laws and regulations will not be adopted or
become applicable to IDBD, or that future changes in laws and
regulations will not have a detrimental effect on its business.
Although not currently required, additional regulatory approvals
may be required in the future due to a change in laws and
regulations or for other reasons. We cannot assure that IDBD will
be able to obtain all required regulatory approvals that may be
required in the future, or any necessary modifications to existing
regulatory approvals, or maintain all required regulatory
approvals.
Changes in
regulations, licensing or any other regulatory matters could
adversely affect IDBD’s ability to generate revenues. This,
in turn, could represent a negative effect in our consolidated
results.
IDBD may be adversely affected by class actions on consumer-related
matters and environmental protection-related matters
The nature of the
business developed by certain IDBD’s subsidiaries, namely
Cellcom and Shufersal, the investment in Clal and the associate
Adama, exposes these companies to class actions with regard to
consumer issues and issues related to environmental protection,
such as ionizing radiation from cellular devices, emissions, water,
noise and smell pollution. Moreover, in most cases, our patients
may benefit from Israeli consumer protection laws, which provide
special procedural rules, such as the shifting of the burden of
proof, strict liability and joint and several liability for damage
caused by companies outsourced by us to provide specific services.
The amount involved in this type of class action can be sumptuous,
in special in issues related to environmental protection, and might
even exceed IDBD’s shareholders equity, and must defend
against such lawsuits at significant cost, even if such lawsuits
are unfounded. If the decisions in any such actions are unfavorable
to IDBD, it might be required to pay heavy fines to cover damages.
Any proceeding involving consumer complaints may also adversely
affect IDBD’s reputation and, consequently, its client base.
Class actions may adversely affect IDBD’s financial condition
and materially adversely affect its reputation. As a result,
IDBD’s is subject to a potential decrease in the number of
clients and in its gross operating revenue. Consequently,
IDBD’s business, results of operations, financial condition
and the market price of its securities may be adversely
affected.
30
Risks
related to IDBD and IDBD’s subsidiaries and/ or
associates.
Most of IRSA’s revenues are generated by IDBD, an
entity incorporated and operating in Israel.
IDBD is
incorporated in Israel, where it operates the totality of its
business. As of June 30, 2016, IDBD’s revenues corresponded
to approximately 86.4% of IRSA’s total revenues for our
fiscal year then ended.
IDBD’s
activities are subject to Israel’s political, economic and
military conditions and also to extensive Israeli regulation
related to, among other matters, licensing, competition, rates and
environmental practices. There can be no assurance that
governmental policies in Israel or the current regulations will not
change in the future and adversely affect IDBD’s business. We
are unable to predict whether IDBD’s success will continue to
prosper in Israeli markets. For more information, please refer to
the risk factors under “Risks Related to
Israel”.
IDBD may not be able to comply with financial
commitments with its creditors and to fully comply with Israeli
laws, which would have a material adverse effect on its financial
condition and on its ability to continue as a going
concern.
On October 11,
2015, we gained effective control over IDBD and we started
consolidating IDBD’s results of operations.
IDBD’s
activities were materially affected with the promulgation of the
Promotion of Competition and Reduction of Centralization Law
Nº 5.774-13 (the “Reduced Centralization Act”)
published in December 2013. In order to fully comply with this law,
IDBD could be forced to adopt some adverse measures, such as
dispose its controlling interest in Clal or to merge with DIC. For
more information about the Reduced Centralization Act and potential
implications of its provisions on IDBD and its subsidiaries, see
“Item 4 – Information on the
Company”.
IDBD is also
subject to compliance with certain covenants under its debt
arrangements. Although IDBD has successfully negotiated waivers to
these covenants with its creditors valid until December 2016, we
cannot assure that it will be successful in renegotiating an
extension or other new terms. If IDBD is unable to renegotiate or,
as an alternative, to raise additional capital, the original
covenants of such arrangements will become effective again and
creditors could require immediate repayment of the
debt.
All factors
mentioned above raise significant uncertainties as to IDBD’s
capacity to continue as a going-concern. IDBD’s ability to
continue as a going concern will depend on its ability in
renegotiating the terms of its arrangements, in raising additional
funds and also its ability to fully comply with Israel
authority’s demands.
IDBD is currently
exploring alternative measures to meet its future liquidity
requirements and is making payments to significant creditors as
cash flow permits. IDBD is in ongoing contact with its creditors
regarding future payments, and is attempting to resolve issues
regarding its late payments or non-payments. Based on its future
cash flow projections, IDBD expects to have the required liquidity
to meet its commitments by issuing new debt in Israel, selling
financial assets such as Clal and dividend payouts by Clal. IDBD
could also secure additional financing through the private issuance
of equity securities. However, there can be no assurance that IDBD
will be able to resolve these matters satisfactorily, and if it is
unable to do so, it may be unable to pay out debts as they become
due and could be subject to litigation regarding non-payment that
could have a material adverse effect on its business, financial
condition, and results of operations.
Our independent
registered public accounting firm has included an explanatory
paragraph in their opinion to makes references to Note 1 of the
consolidated financial statements as of and for the year ended June
30, 2016, which discloses the existence of risks and uncertainties
in relation to IDBD and indicating that our financial statements do
not include any adjustments related to the valuation of
IDBD’s assets and liabilities that would be required if IDBD
were not able to continue as a going-concern.
The outcome of the arbitration proceedings between Dolphin and ETH
is uncertain and may have an adverse effect on our
business.
The arbitration
process between Dolphin an ETH (a non-related company established
under the laws of the State of Israel, which was presented to
Dolphin as a company controlled by Mordechay Ben Moshé)
regarding certain matters related to the acquisition and obtainment
of control of IDBD, though partially resolved, is still
pending.
On September 24,
2015, the competent arbitrator resolved that: (i) Dolphin and IFISA
were entitled to act as buyers in the BMBY process, and ETH had to
sell all of the IDBD shares held by it at a price of NIS 1.64 per
share; (ii) The buyer had to fulfill all of the commitments
included in the Arrangement, including the commitment to carry out
Tender Offers; (iii) The buyer had to pledge in favor of the
Arrangement Trustees the shares that were previously pledged in
favor of the Arrangement Trustees by the seller.
However, Dolphin
and ETH still have counterclaims of different kinds which are
subject to such arbitration proceeding, which, as of the filing
date of this Annual Report, is still being heard. There can be no
assurances of the final outcome of this process. Should the
arbitrator rule in favor of ETH, the value of our investment in
IDBD could be severely affected and therefore would likely have a
significant adverse effect on our business, financial condition and
results of operations.
IDBD’s subsidiaries do business abroad and might be subject
to foreign regulation and, therefore, are subject to substantial
foreign regulations and permit requirements and may be materially
adversely affected if it is unable to comply with existing
regulations or requirements, or changes in applicable regulations
or requirements.
Some of IDBD
subsidiaries do business overseas or their securities are traded on
foreign stock exchanges. Changes in legislation and regulatory
policy in foreign countries as well as characteristics of the
business environment in the operating country may impact the
financial results and business standing of those
companies.
Changes in
international financial reporting standards or in accounting
principles applicable to IDBD and its subsidiaries may impact
various data (including equity attributable to equity holders and
earnings) reported on the financial statements of IDBD and its
subsidiaries, their compliance with financial covenants, if any,
their compliance with terms and conditions of permits and licenses
awarded to them and their capacity to distribute dividends. We
cannot assure that the existing laws and regulations in the
countries where IDBD’s subsidiaries and/ or associates have
operations will not be revised or reinterpreted, that new laws and
regulations will not be adopted or become applicable to
IDBD’s subsidiaries and/ or associates, or that future
changes in laws and regulations will not have a detrimental effect
on its business. Although not currently required, additional
regulatory approvals may be required in the future due to a change
in laws and regulations or for other reasons. We cannot assure that
IDBD’s subsidiaries and/ or associates will be able to obtain
all required regulatory approvals that may be required in the
future, or any necessary modifications to existing regulatory
approvals, or maintain all required regulatory approvals in the
countries in which they operate.
Changes in
regulations, licensing or any other regulatory matters in the
countries where IDBD’s subsidiaries and/ or associates
operate could adversely affect their ability to generate revenues.
This, in turn, could represent a negative effect in IDBD’s
and, as consequence, in our consolidated results.
31
IDBD’s subsidiary Property and Building (“PBC”)
operates in real estate industry, and is exposed to the risks
inherent to that industry.
As part of the real
estate industry, PBC face similar risks as described above,
regarding our Operation Center in Argentina, such as:
·
“Our performance is subject to risks associated with our
properties and with the real estate
industry.”
·
“An adverse economic environment for real estate companies
such as a credit crisis may adversely impact our results of
operations and business prospects
significantly”
·
“We may face risks associated with property
acquisitions.”
·
“Our future acquisitions may be
unprofitable.”
·
“Properties we acquire may subject us to unknown
liabilities.”
·
“Our dependence on rental income may adversely affect our
ability to meet our debt obligations.”
·
“It may be difficult to buy and sell real estate quickly and
transfer restrictions may apply to part of our portfolio of
properties.”
·
“We are subject to risks inherent to the operation of office
buildings that may affect our
profitability.”
·
“The recurrence of a credit crisis could have a negative
impact on our major customers, which in turn could materially
adversely affect our results of operations and
liquidity.”
IDBD’s subsidiary Shufersal operates in the retail industry,
which is a highly regulated industry in Israel.
Israeli legislation
with respect to sanitation licensing, as well as new consumer
legislation which confers extensive authority upon the Israel
Consumer Protection and Fair Trade Authority, consumer legislation
and the increased enforcement thereof, and increased oversight of
prices or increases in the minimum wage, may adversely affect the
business affairs of Shufersal, its financial position and its
results of operations. An increase in the minimum wage may
adversely affect the financial results of Shufersal, including its
profitability. Additionally, the regulator’s determinations
regarding the rules for conduct between the large marketing chains,
of which Shufersal is one, and dominant suppliers in the food
supply segment, including by virtue of the provisions of the Food
Law, and regarding the merger of Shufersal with Clubmarket, which
is one of the largest retail chains in Israel, may adversely affect
Shufersal’s business, financial condition and results of
operations.
Shufersal faces intense competition in all aspects of its
business.
Shufersal closely
monitors the developments in the retail sector, and adjusts its
operations, if and insofar as is required, in accordance with those
developments. Shufersal faces intense competition, especially as it
proceeds with full implementation of its business plan. Competitive
pressures, including the responses of competitors to
Shufersal’s strategy and the manner of its implementation,
may adversely affect Shufersal’s ability to deal with
competition, and may lead to lower pricing and the loss of market
share in a manner which may have an adverse effect on
Shufersal’s business, financial condition and results of
operations. The entry of new competitors into markets in which
Shufersal is engaged, or the entry of existing competitors into
segments in which they were not previously active, could adversely
affect Shufersal’s business.
An ineffective
wholesale market for retail, the offering of services not in
accordance with the criteria of the wholesale market, or the
pricing thereof by competitors in order to expand market share
could harm Shufersal’s ability to offer competitive services
and its competitive position. If Shufersal is unable to manage its
competition in an effective manner, its future results might be
adversely affected.
The sale of Adama is subject to Chinese regulatory and antitrust
approvals and the sale transaction may not be
completed.
On July 17, 2016,
our indirect subsidiary DIC, agreed to sell its remaining 40% in
Adama to ChemChina for cash consideration of US$ 230 million and
cancellation of a loan due to a Chinese bank. It is expected that
the sale transaction be consummated by the first week of November
2016, subject to the fulfillment of certain conditions, including
the receipt of Chinese regulatory and antitrust approvals. Upon
completion of the transaction, each party will waive all claims and
demands against each other. If the sale transaction is not
completed for any reason, the value of our investment in IDBD could
be materially adversely affected and therefore would likely have a
significant adverse effect on our business, financial condition and
results of operations.
IDBD’s subsidiary Cellcom operates in telecommunications
industry, which is a highly regulated industry in Israel. In recent
years, regulation in Israel has materially adversely affected
Cellcom’s results.
A substantial part
of Cellcom’s operations is subject to the Israeli
Communications Law, No 1982, the Israeli Wireless Telegraph
Ordinance (New Version), No 1972, the regulations promulgated
thereunder and the licenses for the provision of different
telecommunications services that Cellcom received from the Ministry
of Communications in accordance with the Communications Law. The
interpretation and implementation of the Communications Law,
Wireless Telegraph Ordinance and regulations and the provisions of
its general licenses, as well as its other licenses, are not
certain and subject to change, and disagreements have arisen and
may arise in the future between the Ministry of Communications and
us. The Communications Law and regulations thereunder grant the
Ministry of Communications extensive regulatory and supervisory
authority with regard to its activities, as well as the authority
to impose substantial sanctions in the event of a breach of its
licenses or the applicable laws and regulations. Further, in the
event that Cellcom materially violate the terms of its licenses,
the Ministry of Communications has the authority to revoke them.
Cellcom’s operations are also subject to the regulatory and
supervisory authority of other Israeli regulators which have the
authority to impose criminal and administrative sanctions against
us.
32
Cellcom’s
general cellular license is valid until February 2022. It may be
extended for additional six-year periods upon request to the
Ministry of Communications and confirmation from the Ministry of
Communications that Cellcom has complied with the provisions of its
license and applicable law, has invested in the improvement of its
service and network and has demonstrated the ability to do so in
the future. Netvision’s unified licenses (granted in July
2015 and amended in February 2016) under which Netvision is
providing landline telephony services, internet connectivity
services, or ISP, and international long distance services, or ILD,
are valid until March 2026 and February 2022, respectively, and may
be extended for additional ten year periods, on terms similar to
those provided in its cellular license. Cellcom’s other
licenses are also limited in time. Cellcom’s licenses may not
be extended when requested, or, if extended, the extensions may be
granted on terms that are less favorable to Cellcom. In addition,
the Ministry of Communications has interpreted and may interpret
its licenses and has modified and may modify its licenses without
Cellcom’s consent and in a manner that could limit its
ability to conduct its business and harm its results of operations.
Possible changes to its licenses and legislation which would
require us to change its pricing plans and information systems
frequently or on a timetable Cellcom cannot meet, can increase the
risk of noncompliance with its licenses or violation of such
legislation and its exposure to lawsuits and regulatory
sanctions.
IDBD’s subsidiary Cellcom faces intense competition in all
aspects of its business.
The Israeli
telecommunications market is highly competitive in many of its
elements, including the cellular and landline service markets. The
competition level has increased substantially in recent years,
following the entry of additional competitors and regulatory
changes alleviating entry barriers and transfer barriers. Also,
there is a continued increase of competition in the end user
equipment market. In the last year, Cellcom entered both the TV
market through its OTT TV service and the landline infrastructure
market, through the landline wholesale market (VDSL). In the other
markets Cellcom operates in and specifically in the cellular
market, the intensified competition led to price competition, the
adverse effects of which include a high churn rate and high
subscriber acquisition costs, in addition to continued price
erosion, all of which have ultimately led to a material decrease in
revenues and profitability for us and other MNOs. The current level
of competition in all the markets in which Cellcom operates and
aggressive price plan offerings by its competitors are expected to
continue. The entry of new competitors into markets in which
Cellcom is engaged, or the entry of existing competitors into
segments in which they were not previously active, or were
partially active, as a result of regulatory changes, would allow
other operators to provide services currently provided only by
Cellcom to its subscribers.
An ineffective
wholesale market for landline communication, including due to the
exclusion of telephony services from the wholesale market, the
offering of services not in accordance with the criteria of the
wholesale market, or the pricing thereof in a manner which could
harm Cellcom’s ability to offer competitive services
packages, and competition on the part of Bezeq and Hot (due to
their dominant status in the landline communication market),
particularly if the cancellation or easement of the structural
separation which applies to the Bezeq and Hot groups is implemented
before the creation of an effective wholesale market in the
landline communication market. We are unable to foresee if the
current high level of competition and trends will continue in the
future or if it will continue to affect Cellcom results of
operations. In case Cellcom is unable to manage its competition in
an effective manner, its future results might be adversely
affected.
Cellcom may be adversely affected by the significant technological
and other changes in the cellular communications
industry.
The
telecommunications market is known for rapid and significant
technological changes and requires ongoing investments in advanced
technologies in order to remain competitive. In recent years
Cellcom has witnessed a growing demand for Internet, content and
data through advanced third and fourth generation cellular phones,
smartphones, modems, tablets and other devices using cellular data
that resulted in a rapid and immense growth of data traffic on
cellular networks and required cellular operators to upgrade their
networks to accord such demand. Transfer of subscribers to
unlimited packages of services and national roaming on its network,
have contributed to the substantially growing demand for data
traffic on its network, as well as to voice and text
messages.
We estimate that
data traffic will continue to rapidly grow in the future. To meet
the growing demand for cellular data traffic, Cellcom is required,
among others, to continue its investment in its 4G network and
upgrading its transmission network, to allow larger capacity and
higher data speed rates. In addition, as in order to provide
optimal performance, its LTE network requires additional
frequencies to those allocated to us under the LTE frequencies
tender (as the Ministry of Communications expects us to evacuate 12
1800MHz which were allocated to us for its 2G network, to be used
by its LTE network), Cellcom is in the process of allocating
additional 1800MHz to its LTE network, in areas where lower usage
of its 2G network, together with advanced and modern equipment and
software features, allows such allocation, with negligible adverse
effect to its 2G network performance. Nonetheless, such limited
quantity of frequencies may adversely affect its network
performance, specifically if Cellcom cannot use additional
frequencies under network sharing agreements, as its 4G network
will have 15MHz at most (similar to Pelephone’s network,
unless Pelephone enters a network sharing agreement), whereas
Partner and Hot’s 4G combined network enjoys
20MHz.
If Cellcom fails to obtain or maintain favorable arrangements with
foreign telecommunications operators, its services may be less
attractive or less profitable.
Cellcom relies on
agreements with cellular providers outside Israel to provide
roaming capabilities to its cellular subscribers in many areas
outside Israel. Cellcom cannot control or compel the improvement of
the quality of the service that they provide and it may be inferior
or less advanced than the service that it provides. Some of
Cellcom’s competitors may be able to obtain lower roaming
rates than it does because they may have larger call volumes or can
use more favorable agreements of their overseas affiliates. If
Cellcom’s competitors’ providers can deliver a higher
quality, more advanced or a more cost effective roaming service,
then subscribers may migrate to those competitors and its results
of operation could be adversely affected, more so if the proposed
amendment to its license, allowing other operators to provide
roaming services to its subscribers, will be adopted.
In recent years,
roaming tariffs for Cellcom’s subscribers have decreased. If
roaming tariffs continue to decrease including as a result of the
increasing competition or the changing regulation, this could
adversely affect its profitability and results of operations.
Inbound roaming to its network is also influenced by its ability to
maintain favorable roaming arrangements. The entry of additional
UMTS providers has not only increased competition regarding
outgoing roaming services but also increased competition on inbound
roaming services. Additional operators or the abovementioned
proposed amendment to its license, may increase such competition
further. Cellcom also relies on agreements with foreign carriers to
provide ILD services by Netvision as well as its international
voice hubbing (providing ILD services to foreign operators)
services. The risks detailed above in relation to roaming services
and possible effects of such risks, apply to Netvion’s ILD
and hubbing services as well.
Cellcom’s
substantial debt increases its exposure to market risks, may limit
its ability to incur additional debt that may be necessary to fund
its operations and could adversely affect its financial stability;
regulatory change, market terms and its financial results may
affect its possibilities to raise debt.
IDBD’s investment Clal operates in the insurance industry,
which is a highly regulated industry in Israel. Therefore, Clal is
subject to substantial regulations and permit requirements in the
insurance area and may be materially adversely affected if it is
unable to comply with existing regulations or requirements, or
changes in applicable regulations or requirements.
Clal is exposed to
changes in legislation and regulation which pertain to its
operating segments. In particular, some of the regulatory changes
which were recently implemented and proposed, may adversely affect
components of the business model in the sector. Additionally,
changes in legislation and regulation, including circulars,
determinations in principle, position papers and provisions which
the Commissioner of Capital Markets is authorized to impose in
connection with changes to policy terms, including policy premiums
which may affect Clal, including with reference to products which
were sold in the past, both by way of retroactive application and
due to their effect on the interpretation of agreements which were
signed in the past.
Significant
operations in Clal are subject to detailed and complex regulation.
In particular, the insurance and long-term savings activities are
subject to regulatory directives which change from time to time,
with respect to products which were sold over many years, and which
have long insurance coverage periods and/or savings periods.
Non-compliance with the regulatory requirements, including by
mistake, may lead to sanctions, including the revocation of
licenses and permits and monetary fines, against Clal, also as part
of audits on behalf of oversight entities, and may serve as a basis
for claims against it.
Risks Related to the ADSs and the Common Shares.
Shares eligible for sale could adversely affect the price of our
common shares and American Depositary Shares.
The market prices
of our common shares and ADS could decline as a result of sales by
our existing shareholders of common shares or ADSs in the market,
or the perception that these sales could occur. These sales also
might make it difficult for us to sell equity securities in the
future at a time and at a price that we deem
appropriate.
The ADSs are freely
transferable under U.S. securities laws, including common shares
sold to our affiliates. IFISA, which as of June 30, 2016, owned
approximately 30.88% of our common shares (or approximately
154,898,780 common shares which may be exchanged for an aggregate
of 15,489,878 ADSs), is free to dispose of any or all of its common
shares or ADSs at any time in its discretion. Sales of a large
number of our common shares and/or ADSs would likely have an
adverse effect on the market price of our common shares and the
ADSs.
33
If we issue additional equity securities in the future, you may
suffer dilution, and trading prices for our equity securities may
decline.
We may issue
additional shares of our common stock for financing future
acquisitions or new projects or for other general corporate
purposes, although there is no present intention to do so. Any such
issuance could result in a dilution of your ownership stake and/or
the perception of any such issuances could have an adverse impact
on the market price of the ADSs.
We are subject to certain different corporate disclosure
requirements and accounting standards than domestic issuers of
listed securities in the United States.
There may be less
publicly available information about the issuers of securities
listed on the Buenos Aires Stock Market (“
Mercado de Valores de Buenos
Aires
” or “MERVAL” as per its acronym in
spanish) than is regularly published by or about domestic issuers
of listed securities in the United States and certain other
countries.
We are exempt from
the rules under the Securities Exchange Act of 1934, as amended
(the “Exchange Act”) prescribing the furnishing and
content of proxy statements, and our officers, directors and
principal shareholders are exempt from the reporting and
short-swing profit recovery provisions contained in Section 16 of
the Exchange Act.
The identification of a material weakness in our internal controls
over financial reporting could negative affect the trading price of
our shares or ADSs
Our management is
responsible for establishing and maintaining adequate Internal
Control over Financial Reporting (as defined in Rules 13a-15(f) and
15d-15(f) under the Exchange Act). Our Internal Control over
Financial Reporting includes a series of procedures designed to
provide reasonable assurance regarding the reliability of financial
reporting and the preparation of consolidated financial statements
for external purposes, in accordance with IFRS and includes those
policies and procedures that (1) pertain to the maintenance of
records that, in reasonable detail, accurately and fairly reflect
the transactions and dispositions of our assets, (2) provide
reasonable assurance that transactions are recorded as necessary to
permit preparation of consolidated financial statements in
accordance with IFRS and that the relevant entity’s or
division’s receipts and expenditures are being made only in
accordance with authorizations of our management and directors, and
(3) provide reasonable assurance regarding prevention or timely
detection of unauthorized acquisition, use, or disposition of our
assets that could have a material effect on our consolidated
financial statements.
Our management
concluded that our disclosure controls and procedures as of the end
of fiscal year 2014 were not effective given to a material weakness
in our internal control over financial reporting. This material
weakness was related to the accounting for derivative financial
instruments derived from non-routine complex contractual provisions
in the context of the acquisition of an associate and was already
remediated. Under this concept, a material weakness is a
deficiency, or combination of deficiencies, in the internal control
over financial reporting that may reasonably cause that a material
misstatement of our annual or interim financial statements will not
be prevented or detected on a timely basis. See “Controls and
Procedures - A. Disclosure Controls and
Procedures”.
Any failure to
implement and/ or maintain improvements in the controls over our
financial reporting, or any difficulties encountered in the
implementation of such improvements, could result in a material
misstatement in our annual or interim financial statements that:
(i) may not be prevented or detected; and/or, (ii) may cause us to
fail to meet our reporting obligations under the applicable
securities laws. This situation may also cause investors to lose
confidence in our reported financial information, and this could
have an adverse impact on the trading price of our shares or
ADSs.
Investors may not be able to effect service of process within the
U.S., limiting their recovery of any foreign judgment.
We are a publicly
held stock corporation (sociedad anónima) organized under the
laws of Argentina. Most of our directors and our senior managers
are located in Argentina. As a result, it may not be possible for
investors to effect service of process within the United States
upon us or such persons or to enforce against us or them in United
States court judgments obtained in such courts predicated upon the
civil liability provisions of the United States federal securities
laws. There is doubt whether the Argentine courts will enforce, to
the same extent and in as timely a manner as a U.S. or foreign
court, an action predicated solely upon the civil liability
provisions of the United States federal securities laws or other
foreign regulations brought against such persons or against
us.
If we are considered to be a passive foreign investment company for
United States federal income tax purposes, U.S. Holders of our
common shares or ADSs would suffer negative
consequences.
Based on the
current and projected composition of our income and valuation of
our assets, including goodwill, we do not believe we were a passive
foreign investment company (“PFIC”) for United States
federal income tax purposes for the taxable year ending June 30,
2016, and we do not currently expect to become a PFIC, although
there can be no assurance in this regard. The determination of
whether we are a PFIC is made annually. Accordingly, it is possible
that we may be a PFIC in the current or any future taxable year due
to changes in our asset or income composition or if our projections
are not accurate. The volatility and instability of
Argentina’s economic and financial system may substantially
affect the composition of our income and assets and the accuracy of
our projections. In addition, this determination is based on the
interpretation of certain U.S. Treasury regulations relating to
rental income, which regulations are potentially subject to
differing interpretation. If we become a PFIC, U.S. Holders (as
defined in “Taxation—United States Taxation”) of
our common shares or ADSs will be subject to certain United States
federal income tax rules that have negative consequences for U.S.
Holders such as additional tax and an interest charge upon certain
distributions by us or upon a sale or other disposition of our
common shares or ADSs at a gain, as well as reporting requirements.
Please see ‘‘Taxation—United States
Taxation—Passive Foreign Investment Company’’ for
a more detailed discussion of the consequences if we are deemed a
PFIC. You should consult your own tax advisors regarding the
application of the PFIC rules to your particular
circumstances.
Changes in Argentine tax laws may adversely affect the tax
treatment of our common shares or ADSs.
On September 23,
2013, the Argentine income tax law was amended by the passage of
Law N° 26,893. Under the amended law, the distribution of
dividends is subject to income tax at a rate of 10%, unless the
dividends are distributed to Argentine corporate entities. In
addition, the amended law establishes that the sale, exchange or
other transfer of shares and other securities is subject to a
capital gain tax at a rate of 15% for Argentine resident
individuals and foreign beneficiaries. There is an exemption for
Argentine resident individuals if certain requirements are met;
however, there is no such exemption for non-Argentine residents.
See “Item 10.E - Taxation —Argentine Taxation”.
However, as of the date hereof many aspects of the amended tax law
remain unclear and, pursuant to certain announcements made by
Argentine tax authorities, they are subject to further rulemaking
and interpretation, which may adversely affect the tax treatment of
our common shares and/or ADSs.
The income tax
treatment of income derived from the sale of ADSs, dividends or
exchanges of shares from the ADS facility may not be uniform under
the revised Argentine income tax law. The possibly varying
treatment of source income could impact both Argentine resident
holders as well as non-Argentine resident holders. In addition,
should a sale of ADSs be deemed to give rise to Argentine source
income, as of the date of this annual report no regulations have
been issued regarding the mechanism for paying the Argentine
capital gains tax when the sale exclusively involves non-Argentine
parties. However, as of the date of this annual report, no
administrative or judicial rulings have clarified the ambiguity in
the law.
Therefore, holders
of our common shares, including in the form of ADSs, are encouraged
to consult their tax advisors as to the particular Argentine income
tax consequences under their specific facts.
34
Holders of our ADSs may be unable to exercise voting rights with
respect to the common shares underlying the ADSs at our
shareholders’ meetings.
We will not treat
the holders of our ADSs as one of our shareholders and the holders
of our ADSs will not have shareholder rights. The ADS depositary
will be the holder of the common shares underlying your ADSs and
ADS holders may exercise voting rights with respect to the common
shares represented by the ADSs only in accordance with the deposit
agreement relating to the ADSs. There are no provisions under
Argentine law or under our by-laws that limit the exercise by ADS
holders of their voting rights through the ADS depositary with
respect to the underlying common shares. However, there are
practical limitations on the ability of ADS holders to exercise
their voting rights due to the additional procedural steps involved
in communicating with these holders. For example, holders of our
common shares will receive notice of shareholders’ meetings
through publication of a notice in an Official Gazette in
Argentina, an Argentine newspaper of general circulation and the
bulletin of the Buenos Aires Stock Exchange (“BCBA”),
and will be able to exercise their voting rights by either
attending the meeting in person or voting by proxy. ADS holders, by
comparison, will not receive notice directly from us. Instead, in
accordance with the deposit agreement, we will provide the notice
to the ADS depositary. If requested by us, the ADS depositary will
mail to holders of ADSs the notice of the meeting and a statement
as to the manner in which instructions may be given by holders. To
exercise their voting rights, ADS holders must then instruct the
ADS depositary as to voting the common shares represented by their
ADSs. Due to these procedural steps involving the ADS depositary,
the process for exercising voting rights may take longer for ADS
holders than for holders of common shares and common shares
represented by ADSs may not be voted as ADS holders
desire.
Under Argentine law, shareholder rights may be more limited or less
well defined than in other jurisdictions.
Our corporate
affairs are governed by our by-laws and by Argentine corporate law,
which differ from the legal principles that would apply if we were
incorporated in a jurisdiction in the United States, such as the
States of Delaware or New York, or in other jurisdictions outside
Argentina. In addition, your rights or the rights of holders of our
common shares to protect your or their interests in connection with
actions by our board of directors may be fewer and less well
defined under Argentine corporate law than under the laws of those
other jurisdictions. Although insider trading and price
manipulation are illegal under Argentine law, the Argentine
securities markets are not as highly regulated or supervised as the
U.S. securities markets or markets in some other jurisdictions. In
addition, rules and policies against self−dealing and
regarding the preservation of shareholder interests may be less
well defined and enforced in Argentina than in the United States,
putting holders of our common shares and ADSs at a potential
disadvantage.
The protections afforded to minority shareholders in Argentina are
different from and more limited than those in the United States and
may be more difficult to enforce.
Under Argentine
law, the protections afforded to minority shareholders are
different from, and much more limited than, those in the United
States and some other Latin American countries. For example, the
legal framework with respect to shareholder disputes, such as
derivative lawsuits and class actions, is less developed under
Argentine law than under U.S. law as a result of Argentina’s
short history with these types of claims and few successful cases.
In addition, there are different procedural requirements for
bringing these types of shareholder lawsuits. As a result, it may
be more difficult for our minority shareholders to enforce their
rights against our directors or us or controlling shareholder than
it would be for shareholders of a U.S. company.
The majority of our shareholders may determine to not pay any
dividends.
In accordance with
Argentine corporate law we may pay dividends to shareholders out of
net and realized profits, if any, as set forth in our Audited
Financial Statements prepared in accordance with IFRS. The
approval, amount and payment of dividends are subject to the
approval by our shareholders at our annual ordinary shareholders
meeting. The approval of dividends requires the affirmative vote of
a majority of the shareholders entitled to vote at the meeting. As
a result, we cannot assure you that we will be able to generate
enough net and realized profits so as to pay dividends or that our
shareholders will decide that dividends will be paid.
Our ability to pay dividends is limited by law and economic
conditions.
In accordance with
Argentine corporate law, we may pay dividends in Pesos out of
retained earnings, if any, to the extent set forth in our Audited
Financial Statements. Our ability to generate retained earnings is
subject to the results of our operations.. The uncertainty
surrounding future rates of inflation may affect our results of
operations and consequently our ability to pay dividends. If the
Peso continues to devaluate significantly, all of the negative
effects on the Argentine economy related to such devaluation could
recur, with adverse consequences on our business and as a result on
the results of our operations and our ability to pay
dividends.
The ability of holders of the ADS to receive cash dividends may be
limited.
The ability of the
ADS holders to receive cash dividends may be limited by the ability
of the depositary to convert cash dividends paid in Pesos into U.S.
Dollars. Under the terms of our deposit agreement with the
depositary for the ADSs, to the extent that the ADS depositary can
in its judgment, and in accordance with local exchange regulations,
convert Pesos (or any other foreign currency) into U.S. Dollars on
a reasonable basis and transfer the resulting U.S. Dollars abroad,
the ADS depositary will promptly as practicable convert or cause to
be converted all cash dividends received by it in Pesos on the
deposited securities common shares into U.S. Dollars. If, in the
judgment of the depositary, this conversion is not possible on a
reasonable basis (or is not permitted by applicable Argentine laws,
regulations and approval requirements), the ADS depositary may
distribute the foreign currency received by it in Pesos in
Argentina or in its discretion hold such currency uninvested for
the respective accounts of the owners entitled to receive the same.
As a result, if the exchange rate fluctuates significantly during a
time when the depositary cannot or does not convert the foreign
currency, you may lose some or all of the value of the dividend
distribution. For further information see “Risks Relating to
Argentina—Restrictions on transfers of foreign currency and
the repatriation of capital from Argentina may impair our ability
to pay dividends and distributions.”
Our ability to pay dividends is limited by law and our
by-laws.
In accordance with
Argentine corporate law, we may pay dividends in Pesos out of
retained earnings, if any, to the extent set forth in our audited
financial statements. Our ability to generate retained earnings is
subject to the results of our operations. During 2014 inflation
accelerated mainly due to the devaluation process carried out by
the Central Bank. The uncertainty surrounding future inflation may
affect our results and as a result our ability to pay dividends. If
the Peso continues to devaluate significantly, all of the negative
effects on the Argentine economy related to such devaluation could
recur, with adverse consequences on our business and as a result on
the results of our operations and our ability to pay
dividends.
35
A.
HISTORY AND DEVELOPMENT OF THE COMPANY
General Information
Our legal name is
Cresud Sociedad Anónima Comercial, Inmobiliaria, Financiera y
Agropecuaria, and our commercial name is “Cresud”. We
were incorporated and organized on December 31, 1936 under
Argentine law as a stock corporation (
sociedad anónima
) and were
registered with the Public Registry of Commerce of the City of
Buenos Aires (
Inspección
General de Justicia
), on February 19, 1937 under number 26,
on page 2, book 45 of National By-laws Volume. Pursuant to our
bylaws, our term of duration expires on July 6, 2082. Our
headquarters are located at Moreno 877, 23rd Floor (C1091AAQ),
Ciudad Autónoma de Buenos Aires, Argentina. Our telephone is
+54 (11) 4814-7800, and our website is
www.cresud.com.ar.
Information
contained in or accessible through our website is not a part of
this annual report on Form 20-F. All references in this annual
report on Form 20-F to this or other internet sites are inactive
textual references to these URLs, or “uniform resource
locators” and are for information purposes only. We assume no
responsibility for the information contained on these
sites.
History
We were
incorporated in 1936 as a subsidiary of Credit Foncier, a Belgian
company engaged in the business of providing rural and urban loans
in Argentina. We were incorporated to administer real estate
holdings foreclosed by Credit Foncier. Credit Foncier was
liquidated in 1959, and as part of such liquidation, our shares
were distributed to Credit Foncier’s shareholders and in 1960
were listed on the Buenos Aires Stock Exchange
(“BASE”). During the 1960s and 1970s, our business
shifted to exclusively agricultural activities.
In 1993 and 1994,
Consultores Asset Management acquired, on behalf of certain
investors, approximately 22% of our shares on the BASE. In late
1994, an investor group led by Consultores Asset Management
(including Dolphin Fund plc.) acquired additional shares increasing
their aggregate shareholding to approximately 51.4% of our
outstanding shares. In 1995, we increased our capital through a
rights offering and global public offering of ADRs representing our
common shares and listed such ADRs on the NASDAQ. We started our
agricultural activities with 7 farmlands and 20,000 hectares under
management.
As of June 30,
2016, we had a 63.77% equity interest in IRSA (without considering
treasury shares). IRSA is one of Argentina’s largest real
estate companies and is engaged in a range of diversified real
estate activities including residential properties, office
buildings, shopping centers and luxury hotels in Argentina. A
majority of our directors are also directors of IRSA.
In line with our
international expansion strategy, on September of 2005 we
participated in the creation of Brasilagro with the purpose of
replicating our business model in Brazil. We created BrasilAgro
together with our partners, Cape Town Llc, Tarpon Investimentos
S.A., Tarpon Agro LLC, Agro Investments S.A. and Agro Managers
S.A.
On May 2, 2006,
BrasilAgro’s shares were listed on the Novo Mercado of the
Brazilian Stock Exchange (“BOVESPA”) with the symbol
AGRO3. BrasilAgro’s shares were placed jointly with Banco de
Investimentos Credit Suisse (Brazil) S.A. in the Brazilian market
through investment mechanisms regulated by controlling authorities
and with sales efforts pursuant to an exception from registration
under the US Securities Act of 1933. The amount originally offered
was R$ 532 million, equivalent to 532,000 common shares at a
price of R$ 1,000 per share of BrasilAgro.
In addition, we
purchased shares in the offering for R$ 42.4 million
(approximately US$ 20.6 million). Following such contribution
we held a total amount of 42,705 shares, equivalent to 7.4% of
BrasilAgro’s capital stock. On October 31, 2007, BrasilAgro
carried out a 1-for-100 share split approved at the special
shareholders' meeting held on March 15, 2007 and ratified at the
annual shareholders' meeting held on October 29, 2007. Following
this split, BrasilAgro's capital stock was composed of 58,422,400
common shares.
On October 20, 2010
and on December 23, 2010, along with Tarpon we executed two
amendments to the share purchase agreement dated as of April 28,
2010, under which we acquired 9,581,750 shares of common stock of
BrasilAgro, representing 16.40% of the outstanding stock.
Consequently, on October 20, 2010 we paid R$25.2 million and on
December 23, 2010 we paid R$50.8 million, and the price reminder of
R$52.6 million was paid on April 27, 2011.
Consequently, as of
the date of this annual report, we hold 23,150,050 shares or 39.76%
of BrasilAgro’s outstanding capital stock. It should be noted
that such acquisition of shares does not imply any change of
control within the shareholders’ group of BrasilAgro
according to the legal regime in Brazil. Additionally, we own
177,004 BrasilAgro’s first issuance warrants and 177,004
BrasilAgro’s second issuance warrants.
In addition, during
the last quarter of calendar year 2010, we entered into an
agreement by means of which we assigned all equity and political
rights related to 2,276,534 shares of BrasilAgro for two years. The
agreement also provides a promise to sell, under which the assignee
may at any time request the sale of BOVESPA’s shares or the
transfer of shares on its behalf. In consideration for the
assignment, we paid a fixed value of US$0.8 million and
additionally, in the event the assignee requested the sale or
transfer of share, it should paid US$7.15 per share sold or
transferred. On June 27, 2012, we agreed together with Mr. Elie
Horn and Cape Town Llc. to terminate the shareholder’s
ageerrment. From fiscal year 2011, we present our financial
statements in consolidated form with Brasilagro’s. In
November past, Brasilagro’s shares became listed as Level II
ADRs on the NYSE, under the ticker symbol LND.
In the context of
operations that represent a new expansion of our agricultural
business in south america, on September 2008, we entered into
several agreements to carry out real estate and agricultural,
livestock and forestry activities in the Republic of Paraguay.
Under these agreements, a new corporation was organized together
with Carlos Casado S.A. (“Carlos Casado”) under the
name Cresca, in which we hold a 50% equity interest. Additionally,
we provide consulting services for the agricultural, livestock and
forestry development of a rural property of 41,931
hectares.
In March 2008 we
concluded a capital increase of 180 million shares. As a result,
180 million shares offered at the subscription price of US$ 1.60 or
Ps. 5.0528 per share were fully subscribed, in the local and
international markets. In addition, each shareholder received,
without additional cost, one warrant for each share subscribed. See
Item 9 “The Offer and Listing – A. Offer and Listing
Details - Stock Exchanges in which our securities are
listed”. This capital increase allows us to expand our
international operations to Paraguay and Bolivia.
We entered into an
agreement to purchase a 50% interest in a rural property located in
Mariscal José Felix Estigarribia, Department of Boquerón,
Chaco Paraguayo, Republic of Paraguay, owned by Carlos Casado, for
a price of US$5.2 million, in order to contribute them to the new
company organized. The contribution was made on January 26, 2009,
and the title deed to the property was executed on February 3,
2009. Therefore, jointly with the contribution made by Carlos
Casado, the total value of the contributions in Cresca is US$10.5
million. In addition, Cresca has an option granted by Carlos Casado
for the purchase of 100,000 additional hectares located in
Paraguay.
On March 19, 2010
the option granted under the agreement dated September 3, 2008 was
partially exercised, whereby 3,614 hectares, valued at US$350 each,
were transferred to Cresca. Finally, on June 29, 2010, the title
deed was executed, involving the conveyance of 3,646
hectares.
In December 2013,
we sold our entire interest in Cresca, in which we held 50% of its
capital stock, and the option granted by Carlos Casado for the
purchase of 100,000 additional hectares located in Paraguay, to our
subsidiary Brasilagro for US$ 18.5 million, thus adding
145,000 hectares in the Paraguayan Chaco to its land portfolio
intended for development. On April 3, 2014, Cresca signed a bill of
sale whereby it sells an area of 24,624 hectares located in Chaco
Paraguayo.
During fiscal year
2015 the option granted under the agreement dated September 3, 2008
was exercised, whereby 60,531 hectares, valued at US$350 each, were
transferred to Cresca.
36
In the framework of
a series of transactions that represent a new expansion of our
agribusiness operations in South America, in line with our business
plan, we have incorporated companies that own land in the Republic
of Bolivia during 2008.
For such purposes,
the following companies were incorporated: Agropecuaria Acres del
Sud S.A (“Acres del Sud”), Ombú Agropecuaria
S.A.(“Ombú”), Yatay Agropecuaria S.A.
(“Yatay”) and Yuchan Agropecuaria S.A.
(“Yuchan”). The preceding Bolivia-based companies
acquired land for agricultural operations. We maintain a 100%
ownership interest in the capital stock of those companies, all
engaged in agricultural operations.
In addition, during
October 2008, we acquired, a company named Helmir S.A.
(“Helmir”), domiciled in the Republic of Uruguay and
incorporated with a broad-ranging corporate purpose.
In line with our
international expansion strategy, we have entered into a number of
agreements to formalize our position in various South American
countries. In July 2008, we, executed several promise to purchase
agreements for an aggregate of 12,166 hectares in the Republic of
Bolivia for a total price of US$28.9 million.
In connection with
these lands, on November 20, 2008, two purchase instruments
including delivery of possession were executed, as part of the
process of casting into public deed and filing of deeds with the
relevant registries, involving the purchase of 883, 2,969 and 3,748
hectares in “San Cayetano,” “San Rafael”
and “La Fon Fon” farmlands, respectively, located in
Santa Cruz, Bolivia.
On January 22,
2009, we executed a deed of purchase for 4,566 hectares in Las
Londras farmlands, located in the Province of Guarayos, Republic of
Bolivia. On that date, the sum of US$3.8 million was paid,
representing 42.9% of the total agreed price. The remaining balance
is payable in two annual installments: the first one was paid
during the 2010 fiscal period, and the second one was paid in
fiscal year 2011.
During fiscal year
2010, 10,800 hectares of the farmlands located in Bolivia were
sown. This region has traditionally achieved double harvesting of
soybean, which means that better results can be obtained per
hectare during a single season; yet, the weather conditions that
prevailed during the last year have not allowed double
harvesting.
In June 2011, we
entered into a purchase agreement for two agricultural parcels
located at Santa Cruz, Republic of Bolivia, with a total surface of
5,000 hectares, which are used for agricultural exploitation: (i)
The first parcel has a surface of approximately 2,660 hectares for
sugar cane exploitation purposes. The purchase price was US$8.4
million which was fully paid, and (ii) the second parcel has a
surface of approximately 2,340 hectares for soybeans exploitation
purposes. The purchase price was US$4.9 million which was fully
paid.
Additionally, we
have agreed to sell a parcel of La Fon Fon with a surface of 910
hectares for US$3.64 million and 1,643 hectares of "La Fon Fon II"
for an overall amount of US$ 7.21 million.
In December 2013,
we sold to our subsidiary Brasilagro the entire interest in CRESCA,
representing 50% of its stock capital.
On May 27, 2014
Ombú executed a purchase and sale agreement involving a sale
subject to retention of title covering 883 hectares of “San
Cayetano I” for an aggregate amount of US$ 4.2
million.
On July 6, 2016, we
sold to the "El Invierno" and "La Esperanza" farmlands. The
total amount of the transaction was set at US$ 6 million, which of
US$ 5 million have been paid and the balance of US$ 1 million,
secured by a mortgage on the property, in five equal, consecutive
and annual installments ending in August 2021. For more information
see “Cresud’s Recent Developments.”
In October 11,
2015, continuing with IRSA
’s
strategy of
expansion and diversification in the international markets, we
gained control of the Israeli conglomerate IDBD. IDBD is one of the
largest and most diversified conglomerates in Israel which
participates through its subsidiaries in numerous markets and
industry sectors, such as: real estate (Property & Building
Corporation), supermarkets (Shufersal), agrochemicals (Adama),
insurance (Clal Holdings Insurance Enterprises), and
telecommunications (Cellcom), among others. IDBD’s shares
ceased to be listed on the Stock Exchange of Tel Aviv
(“TASE”). For more information about the control
obtainment of IDBD please see “Significant acquisitions,
dispositions and development of business - Acquisition of control
of IDBD”.
Significant acquisitions, dispositions and development of
business
Acquisitions
a)
Acquisition
of control of IDBD.
On May 7, 2014, the
Company, acting indirectly through Dolphin, acquired jointly with
ETH, an aggregate of 106.6 million common shares in IDBD,
representing 53.30% of IDBD’s stock capital, in the context
of a restructuring Arrangement of IDBH, IDBD’s parent
company. Under the terms of the agreement, Dolphin and ETH (the
“Shareholders’ Agreement”)1, Dolphin acquired 50%
interest in this investment, and ETH acquired a 50% equity stake in
IDBH. The initial investment amount was NIS 950 million, equivalent
to approximately US$272 million at the exchange rate prevailing on
that date.
On May 28, 2015, in
accordance to the requirements under existing shareholder
arrangements, ETH launched a tender offer to acquire all the shares
of IDBD held by minority shareholders, at a fixed
price. The obligation to consummate this acquisition was
assumed by the buyers. On June 10 and 11, 2015, Dolphin
gave notice to ETH of its intention to buy all the shares of IDBD
held by ETH.
After certain
aspects of the offer were resolved in arbitration brought by
Dolphin and ETH, on September 24, 2015, the arbitration panel
resolved that: (i) Dolphin and IFISA were entitled to act as buyers
in the tender offer and ETH had to sell all IDBD shares held by it
(92,665,925 shares) at a price of NIS 1.64 per share; (ii) the
buyer was obligated to fulfill the commitments assumed by ETH,
including the commitment to carry out the tender offers; and
(iii) the buyer was obligated to pledge the shares of acquired
from ERT to the Agreement Trustees.
On October 11,
2015, the BMBY process concluded, and IFISA acquired all
IDBD’s shares from ETH. Consequently, the Shareholders’
Agreement was terminated and members of IDBD’s board of
directors appointed by ETH tendered their resignations, leaving
Dolphin with the authority to appoint new members to the Board.
Additionally, Dolphin pledged additional shares as collateral to
secure compliance with the IDBD stock purchase agreement, thereby
increasing the number of pledged shares to 64,067,710. As a
consequence, IRSA acquired control of IDBD and started to
consolidate financial statements as from that date.
In addition to the
arbitration decision issued on September 24, 2016, ETH and Dolphin
have counterclaims that remain unresolved in such arbitration
proceeding. As of the date of this Annual Report, the proceeding is
still pending.
Subsequently
following the exercise of BMBY, Dolphin has entered into an option
agreement with IFISA that grants Dolphin the right for a period fo
two years to acquire the 92,665,925 shares in IDBD owned by IFISA
at a price per share of NIS 1.64 plus an annual interest rate of
8.5%. The exercise date for the option extends for two
years. Dolphin also has a first refusal if IFISA agrees
to sell these shares to a third party. The value of the option
agreement as of June 30, 2016 is zero.
37
b)
Acquisition
of non-controlling interest
Dolphin was
required to carry out the first tranche of tender offers in
December 2015. Before expiration of such first tranche, Dolphin and
the arrangement trustees (the “Trustees”) entered into
an extension agreement (the “Extension Agreement”),
which was replaced by the final agreement approved by approximately
95% of the non-controlling shareholders of IDBD (excluding IFISA)
and by warrants holders of IDBD on March 2, 2016 and by the
competent court on March 10, 2016. The major amendments to the
Arrangement were:
(i)
Replacement of the
obligation to conduct tender offers as previously established under
the Arrangement whereby Dolphin would purchase all the shares
outstanding on March 29, 2016 from non-controlling shareholders of
IDBD (except for those held by IFISA) on March 31, 2016. On March
29, 2016, all IDBD shares would be delisted from the TASE. On that
date, all IDBD warrants held by non-controlling shareholders would
expire and Dolphin would make capital contributions to IDBD or
grant subordinate loans, as described hereafter.
(ii)
The price to be
paid for each IDBD share held by non-controlling shareholders on
March 29, 2016 would be NIS 1.25 payable in cash, plus NIS 1.20
adjusted nominal value in bonds of the IDBD Series 9 (the
“IDBD Bonds”), which IDBD will issue directly to
non-controlling shareholders and holders of warrants, and Dolphin
will inject funds into IDBD equal to the adjusted nominal value of
IDBD Bonds. Additionally, Dolphin would undertake to pay NIS 1.05
per share (subject to adjustments) in cash if Dolphin, either
directly or indirectly, gains control of Clal, or if IDBD sells a
controlling stake in Clal under certain parameters (the “Clal
payment”), which refers mainly to Clal’s sale price (at
a price which exceeds 75% of its book value upon execution of the
sale agreement, subject to adjustments) and, under certain
circumstances, the proportion of ownership of Clal shares sold by
IDBD.
(iii)
The warrants held
by non-controlling shareholders that have not been exercised until
March 28, 2016 expired on March 31, 2016. Each warrant holder was
entitled to elect whether: (a) to receive IDBD bonds (based on the
adjusted nominal value) in an amount equal to the difference
between NIS 2.45 and the exercise price of the warrants and be
entitled to the Clal payment; or (b) to receive a payment
determined by an independent appraiser and approved by Court.
Regarding
warrant holders choosing this second alternative of payment, the
District Court has rejected the experts opinion with respect to the
evaluation of the Clal payment and one of the warrants holders has
decided to file an appeal before the Supreme Court. As of the date
of this filing, the process has not been ended and the Supreme
Court has not rendered a decision yet.
(iv)
Dolphin committed
to providing IDBD a total amount of NIS 515 million (the
“Contribution to IDBD”), out of which Dolphin
contributed NIS 15 million in February 2016 and NIS 85 million in
March 2016. The amount injected to IDBD would be reduced by any
capital contribution resulting from the exercise of warrants held
by non-controlling shareholders (maximum amount of approximately
NIS 37.5 million). The contribution to IDBD would further cover the
IDBD Bonds necessary to comply with the transactions described
above (between NIS 166.5 million and NIS 178 million), and the
balance would be contributed until completing the amount committed
by Dolphin either as a capital contribution or as a subordinated
loan which amounted to NIS 248.45 million.
(v)
Dolphin had to
pledge 28% of its IDBD shares, as well as all rights held by
Dolphin in relation to the subordinated loan granted in the amount
of NIS 210 million in December 2015, until the payment obligation
for Clal has been completed or has expired, after which the pledge
will be discharged. Should new shares be issued by IDBD, Dolphin
will be required to pledge additional shares until
completing the 28% of all IDBD share capital. This pledge
supersedes the existing pledge on approximately 64 million shares
of IDBD and all Dolphin’s rights in relation to the
Subordinated Loan.
(vi)
Additionally,
Dolphin agreed not to exercise its right to convert the
subordinated loans into shares of IDBD until the pledge described
above has been released. Should the pledge on subordinated loans be
exercised by the Trustees, then those trustees may convert the
subordinated loans into shares; however, in such case, the maximum
percentage of the IDBD capital that may be pledged is 35%, and any
shares in excess of such amount will be released from the
pledge.
On March 31, 2016:
(i) Dolphin acquired all shares from IDBD’ minority
shareholders (except for IFISA), (ii) all warrants held by IDBDs
minority shareholders expired, and (iii) Dolphin made additional
contributions to IDBD via subordinated loans pursuant. All
commitments to invest in IDBD by Dolphin have been satisfied; only
obligation to make a payment to Clal is outstanding, provided
certain conditions are met. Additionally, Dolphin is obligated ound
to exercise its warrants if both of the following conditions
occur:
(i)
An agreement is
reached to renegotiate the debt covenants applicable to IDBD and
its subsidiaries; and
(ii)
Control over Clal
is obtained.
The obligation
would amount to NIS 391 million. The warrants mature on February
10, 2018. As of June 30, 2016, IRSA’s indirect
interest in IDBD was 68.28% without considering
dilution.
The transaction
described above represented the acquisition of an additional
interest of 19.28% in IDBD for a total amount of Ps.1,249 million.
As a result of this transaction, the non-controlling interest was
increased by Ps.346 million and the interest attributable to the
shareholders’ of the controlling parents was increased by
Ps.234 million.
Acquisition
and disposal of investment properties
During the fiscal
year ended June 30, 2016, IRSA sold certain floors corresponding to
Maipú 1300 Building, Intercontinental Plaza and all the floors
corresponding to Dique IV and Isla Sirgadero, among others. All
sales of the year led to a combined profit for the us of Ps. 1,101
million, disclosed within the line “Gain from disposal of
investment properties” in the Statement of
Income.
During the fiscal
year ended June 30, 2015, IRSA acquired five plots of farmlands in
Luján in the amount of Ps. 210 million and, through IRSA CP, a
plot of land in Córdoba in the amount of Ps. 3.1 million, and
has sold floors corresponding to Maipú 1300 building,
Intercontinental Plaza, Bouchard 551, the entire Madison 183
building and parking spaces in Bouchard 551, Libertador 498 and
Maipú 1300. All sales of the year led to a combined
profit for us of Ps. 1,150.2 million, disclosed within the line
“Gain from disposal of investment properties” in the
Statement of Income.
During the fiscal
year ended June 30, 2014, IRSA acquired, through IRSA CP, a
building next to Alto Palermo Shopping for US$ 3.8 million and has
sold floors corresponding to Maipú 1300 building, Bouchard 551
and the entire buildings Mayo 589, Rivadavia 565, Costeros Dique IV
Constitución 1159 and parking spaces in Maipú 1300,
Bouchard 551 and Libertador 498 buildings. All sales of the year
led to a combined profit for us of Ps. 230.9 million, disclosed
within the line “Gain from disposal of investment
properties” in the Statement of Income.
Changes
in non-controlling interest
IRSA
During the fiscal
year ended June 30, 2016, we sold a 0.93% interest in IRSA for a
total amount of Ps. 86.4 million. This resulted in an increase in
non-controlling interests of Ps. 20.6 million and a increase in
equity attributable to holders of the parent of Ps. 40.3 million,
net of tax effect.
During the fiscal
year ended June 30, 2015, we sold a 1.81% interest in IRSA for a
total amount of Ps. 181.8 million. This resulted in an increase in
non-controlling interests of Ps. 33.7 million and a increase in
equity attributable to owners of the parent of Ps. 97.7 million,
net of tax effect.
38
The effects of
disposals of the ownership interest of IRSA on the equity
attributable to owners of us is summarized as follows:
|
|
June
30, 2016
Ps.
Million
|
|
June
30, 2015
Ps.
Million
|
|
Carrying amount of
the non-controlling interests sold by us
|
(20.6)
|
|
(33.7)
|
|
Consideration
collected
|
86.4
|
|
181.8
|
|
Tax effect
|
(25.5)
|
|
(50.4)
|
|
Reserve recorded in
equity
|
40.3
|
|
97.7
|
During the fiscal
year ended June 30, 2015, we acquired a 0.65% interest in IRSA for
a total amount of Ps. 50.7 million. This resulted in a decrease in
non-controlling interests of Ps. 12.7 million and an decrease in
equity attributable to holders of the parent of Ps. 38 million, net
of tax effect.
The effect of
acquisition of the ownership interest of IRSA on the equity
attributable to owners of us is summarized as follows:
|
|
June
30, 2015
Ps.
Million
|
|
Carrying amount of
our interest acquired of
|
12.7
|
|
Consideration paid
for non-controlling interests
|
(50.7)
|
|
Reserve recorded in
equity
|
(38.0)
|
On June 10, 2014,
the Board of Directors of IRSA resolved to finish the stock
repurchase plan that was approved by resolution of the Board on
July 25, 2013, and modified by resolutions adopted on September 18,
2013, October 15, 2013 and October 22, 2013. During the term of the
Stock Repurchase Plan, IRSA has repurchased 4,904,697 shares for an
aggregate amount of Ps. 37,905,631.
Dolphin
During year 2015,
we through our subsidiaries, contributed an amount of US$ 146
million in Dolphin. Such amount was also allocated to increase
Dolphin’s investment in IDBD. This resulted in a decrease in
non-controlling interests of Ps. 21 million and an increase in
equity attributable to the holders of the parent.
Sale
of Farmlands
Cresca
On April 3, 2014,
Cresca S.A. signed a bill of sale whereby it sells an area of
24,624 hectares located in Chaco Paraguayo. The total price was US$
14.7 million (equivalent to Ps. 116.9 million), which amount shall
be collectable as follows: US$ 1.8 million (equivalent to Ps. 14.3
million) were collected upon the execution of the bill of sale, US$
4.3 million (equivalent to Ps. 34.2 million) upon execution of the
conveyance deed; US$ 3.7 million (equivalent to Ps. 33.1 million)
interest-free between April and July, 2015; and US$ 4.9 million
(equivalent to Ps. 73.1 million) interest-free were collected in
July 2016, thus being cancelled all the mortgage that had been
granted in guarantee price balance. Possession was delivered upon
execution of the conveyance deed. We have recognized gains of Ps.
19.1 million as result of this transaction.
Cremaq
On June 10, 2015,
Brasilagro sold the remaining area of 27,745 hectares of Cremaq
field, an establishment, located in the municipality of Baixa
Grande do Ribeiro (Piaui). The transaction price was fixed at Rs.
270 million (equal to Ps. 694 million), which have already been
fully collected, and Rs. 49.7 million (equivalent to Ps. 127.7
million) of which remain under “Restricted Assets” on
condition that the public deed for 6,020 be registered and that an
agreement for the termination of possessory actions related to a
disputed fraction be notarized. We have recognized gains of Ps.
525.9 million as result of this transaction.
La Fon Fon
II
On October 17,
2013, Yuchán signed a purchase-sale agreement involving a sale
subject to retention of title involving 1,643 hectares of "La Fon
Fon II" for an overall amount of US$ 7.21 million (equivalents to
Ps. 59 million). As of the balance sheet date, the amount of US$
7.1 million (equivalent to Ps. 58.1 million) has been collected,
and the remaining balance amounts to US$ 0.12 million (equivalent
to Ps. 0.9 million) that will be cancelled in 2 installments,
starting in December this year, and concluding in December 2017.
Under the contract, the conveyance will be recorded with the
Registry once the price has been fully paid off. On June 24, 2015,
possession was granted by Yuchán. During the year 2015 we
recognized a profit before tax of US$ 2.7 million (equivalents to
Ps. 24.6 million) as result of this transaction.
Araucária
On June 27, 2014,
Brasilagro sold a total area of 1,164 hectares of Araucaria
farmland.
The sale was priced
at Rs. 32.5 million (Ps. 117.5 million). We recorded a profit
before tax on the sale of the Araucaria farmland for an amount of
Rs. 21.0 million (or Ps. 75.8 million).
San
Cayetano
On May 27, 2014,
Ombú signed a purchase-sale agreement involving a sale subject
to retention of title for 883 hectares of "San Cayetano I"
establishment for an overall amount of US$ 4.2 million (equivalents
to Ps. 31 million).
On June 20, 2016,
an Agreement was signed to modify a Purchase-Sale Private Deed with
Reserve of Property Rights where the precise area of the property
has been determined to cover 855,3213; the parties have agreed to
adjust the sale price of the property by deduction US$ 0.1 million
(equivalent to Ps. 1.4 million) from the total price.
The amount of US$
3.2 million (equivalent to Ps. 23.6 million) of the price has
already been paid, and the balance will be paid in three
installments, with the last installment being due upon execution of
the title conveyance deed.
Under the contract,
the conveyance shall be recorded once the price has been fully
collected off. Possession was granted upon execution of the
contract. We recorded a gain of US$ 1.8 million (Ps.15.6 million)
on the sale.
39
Acquisition
of additional interest in BHSA
During the year
ended June 30, 2015, IRSA acquired 3,289,029 additional shares of
for Ps.14.2 million, thereby increasing its equity stake from
29.77% to 29.99%. During the year ended June 30, 2016 IRSA sold
1,115,165 shares of BHSA in a total amount of Ps.7.7 million,
thereby decreasing its interest to 29.91%.
Disposal
of financial assets
During August 2014,
IRSA has sold through its subsidiary, Real Estate Investment Group
IV, the balance of one million shares in Hersha Hospitality Trust,
at an average price of US$ 6.74 per share.
Disposal
of Associates
On February 5,
2014, IRSA, through Ritelco, sold its interest in Bitania,
representing 49% of its capital stock, for an amount of US$ 4.2
million. Such transaction generated a net gain of approximately Ps.
13.3 million which are shown in the line "Other operating results,
net" in the statement of income.
Acquisition
of BACS
IRSA through Tyrus,
subscribed a purchase-sale agreement of shares of BACS,
representing an interest of 6.125%, for US$ 1.35 million. This
operation is yet to be approved by the BCRA as of June 30, 2016,
according to regulations in force. The advance payment
related to this transaction is disclosed in “Trade and other
receivables”. On August 24, 2016 the operation was approved
by the BCRA.
On June 17, 2015,
we through IRSA, subscribed Convertible Notes, issued by BACS with
a nominal value of Ps. 100,000,000, which are convertible into
common stock.
On June 21, 2016 we
notified BACS on our right to convert all of the convertible
subordinated corporate notes into common shares.
As a consequence,
BACS initiated the relevant diligence before the Argentine Central
Bank in order to secure the authorization to issue the shares in
our favor.
Capital
reduction of Rigby
On October 17,
2014, Rigby reduced its capital stock by distributing among
existing shareholders, proportionally to their shareholdings, the
gain made from the sale of the Madison building. The total amount
distributed is US$ 103.8 million, of which IRSA received US$ 77.4
million (US$ 26.5 million through IRSA International and US$ 50.9
million through IMadison LLC) and US$ 26.4 million were distributed
to other shareholders. As a result of such reduction, IRSA has
decided to reverse the corresponding accumulated conversion
difference on a pro rata basis, which amounted to Ps. 188.3
million. This reversal has been recognized in the line “Other
operating results, net" in the statement of income.
Capital Expenditures
Our capital
expenditures totaled Ps. 2,458
2
million, Ps. 488
3
million and Ps. 436
4
million for the fiscal years ended on
June 30, 2016, 2015 and 2014, including other property and
equipment acquired in business combinations. Our capital
expenditures consisted in the purchase of real estate and farms,
acquisition and improvement of productive agricultural assets,
completion of building a shopping center, construction of real
estate and acquisition of land reserves.
Our capital
expenditures for the new fiscal year will depend on the prices of
real estate, land for agriculture and cattle as well as the
evolution of commodity prices.
Fiscal
Year Ended June 30, 2016
Fiscal Year 2016.
During the fiscal year ended June 30, 2016, we invested Ps. 2,369
million, mainly related to: (a) acquisitions and improvements in
Property, plant and equipment for Ps. 1,172 million, primarily i)
Ps. 378 million in buildings and facilities, mainly in our
operation center in Israel’s supermarkets, ii) Ps. 310
million in communication networks, and iii) Ps. 291 million in
machinery and equipment; (b) improvements in our rental properties
for Ps. 260 million, primarily in our operation center in
Argentina’s shopping centers; and (c) the development of
properties for Ps. 919 million, mainly in our operation center in
Israel.
In addition, our
main investments in the agriculture business during the fiscal year
2015 were Ps. 89 million, mainly due (a) acquisition and
development of owner occupied farmland for Ps. 65 million
(including Ps. 36 million of subsidiary Brasilagro), (b) Ps. 7
million in machinery and equipment, (c) Ps. 3 million in vehicles,
and (d) Ps. 14 million in other building and
facilities.
Fiscal
Year Ended June 30, 2015
Fiscal Year 2015.
During the fiscal year ended June 30, 2015 we invested Ps. 307
million in the urban properties and investment business, mainly due
to (a) improvements in our hotels Sheraton Libertador,
Intercontinental and Llao Llao for Ps. 1 million, Ps. 9 million and
Ps. 5 million, respectively, (b) acquisition of furniture and
fixtures, machinery and equipment, vehicles and other buildings and
facilities for Ps. 35 million, (c) improvements made to our
shopping centers for Ps. 60 million, (d) development of properties
for Ps. 175 million, corresponding Ps. 1 million to "Distrito
Arcos" project and Ps. 174 million to Shopping Neuquén
project, (e) supliers advances for investment
acquisitions for Ps. 14 million, (f) Ps. 6 million
improvements in our Office buildings and other rental properties
and (g) Ps. 2 million were related to the acquisition of plots of
lands.
In addition, our
main investments in the agriculture business during the fiscal year
2015 were Ps. 181 million, mainly due (a) acquisition and
development of owner occupied farmland for Ps. 153 million
(including Ps. 93 million of subsidiary Brasilagro),
(b) Ps. 8 million in investment properties, (c) Ps. 6
million in machinery and equipment, (d) Ps. 5 million in vehicles,
(e) Ps. 8 million in other building and facilities and (f) Ps. 1
million in furniture and fixtures.
40
Fiscal
Year Ended June 30, 2014
Fiscal Year 2014.
During the fiscal year ended June 30, 2014 we invested Ps. 318
million in the urban properties and investment business, mainly due
to (a) improvements in our hotels Sheraton Libertador,
Intercontinental and Llao Llao for Ps. 6 million, Ps. 2 million and
Ps. 3 million, respectively, (b) acquisition of furniture and
fixtures, machinery and equipment, and other buildings and
facilities for Ps. 10 million, (c) improvements made to our
shopping centers for Ps. 61 million, (d) development of properties
for Ps. 180 million, corresponding Ps. 100 million to "Arcos"
project and Ps. 80 million to Shopping Neuquén project,
(e) supliers advances for investment acquisitions for
Ps. 30 million, (f) Ps. 25 million improvements in our
Office buildings and other rental properties and (g) Ps. 1 million
were related to the acquisition of plots of lands.
In addition, our
main investments in the agriculture business during the fiscal year
2014 were Ps. 118 million, mainly due (a) acquisition and
development of owner occupied farmland for Ps. 97 million
(including Ps. 58 million of subsidiary Brasilagro),
(b) Ps. 7 million in investment properties, (c) Ps. 6
million in machinery and equipment, (d) Ps. 3 million in vehicles,
(e) Ps. 3 million in other building and facilities and (f) Ps. 1
million in furniture and fixtures.
Recent
Developments
Cresud’s Recent Developments
Credit Line with
IFISA.
On July 1º,
2016, we renewed the credit line with IFISA for up to 3,500,000
ADRs (previously 4,053,942) of our subsidiary IRSA, in which we are
the lender and IFISA is the borrower. The term of the transaction
was set at 30 days, renewable up to a maximum of 365 calendar days
with an annual interest rate of 6%.
Selling of "El
Invierno" and "La Esperanza" farmlands, city of Rancul, province of
La Pampa.
On July 6, 2016, we
sold to an unrelated party the "El Invierno" and "La Esperanza"
farmlands. The transaction included 2,615 hectares suitable for
agricultural activities which are located in "Rancul" province of
La Pampa. The total amount of the transaction was set at US$ 6
million (US$ / ha 2,294). US$ 5 million have been paid to date and
the remaining balance of US$ 1 million, secured by a mortgage on
the property, in 5 equal, consecutive and annual installments
ending in August 2021.
Director
renouncement
On September 6,
2016, David Alberto Perednik resigned, being its mandate up to June
30, 2016. Its replacement will be appointed in the next shareholder
meeting.
Subscription of the Prior
Commitment of Merger between Cresud and AGRO MANAGERS
S.A.
In July 2016,
Cresud made a shares purchase offer to the other shareholders of
Ps. 5.5 million to acquire their total ownership interest, this
offer was accepted. Thus, our direct interest increased to
100%.
On September 16,
2016, a pre-merger agreement was executed, by which all assets,
rights and obligations of Agromanagers S.A. are transferred to
us.
Annual Shareholders’
Meeting
Our annual
shareholders’ meeting will be held on October 31, 2016, in
order to consider and approve, among others, the following matters:
(i) consideration of documents contemplated in section 234,
paragraph 1, of the Argentine Companies Law No. 19,550 for the
fiscal year ended June 30, 2016; (ii) Consideration of the result
of the fiscal year ended June 30, 2016 which resulted in a loss for
the amount of Ps.1,401,856,585; (iii) consideration of Board of
Directors’ performance; (iv) consideration of Supervisory
Committee’s performance; (v) consideration of compensation
payable to the Board of Directors for Ps.18,985,218 (total
compensation) for the fiscal year ended June 30, 2016; (vi)
consideration of compensation payable to the Supervisory Committee
for the fiscal year ended June 30, 2016; (vii) consideration of the
appointment of Regular Directors and Alternate Directors, as
applicable; (viii) appointment of Regular and Alternate Members of
the Supervisory Committee; (ix) appointment of Certifying
Accountant for the next fiscal year and determination of its
compensation. Delegation of powers; (x) updating of report on
Shared Services Agreement; (xi) treatment of amounts paid as
personal assets tax levied on the shareholders; (xii) consideration
of the renewal of the delegation to the Board of Directors of the
broadest powers to establish the time and currency of issuance, and
other terms and conditions of the issuance of notes under the
global note program, for up to US$ 300.000.000 currently in force
in accordance with approval of the shareholders' meeting dated
October 31, 2012, and November 14, 2014 and its extension for an
additional amount of US$ 200.000.000 in accordance with the
approval of the shareholders' meeting dated October 30, 2015;
(xiii) consideration of granting indemnities to Messrs. Directors,
Syndics and Managers who work or have worked in the Company in a
manner subsidiary to D&O policies; (xiv) consideration of
special financial merger statement of AGRO MANAGERS S.A.; special
separate financial merger statements of Cresud and consolidated
financial merger statements of Cresud with AGRO MANAGERS S.A. as of
June 30, 2016 as well as the reports of the supervisory committee
and the auditor. Consideration of the preliminary merger by
absorption with AGRO MANAGERS S.A. and other related documentation.
Authorizations and delegations. Appointment of proxy to grant
definitive agreements and other formalities; (xv) consideration of
the distribution of treasury shares.
Repurchased of
notes
Since the end of
fiscal year 2016 until October 7, 2016, we have repurchased Notes
(Class XIV, XVI and XVIII) by operations in the local market with
unrelated parties for a total amount of Ps.149,821,406, equivalent
to the amount of NV 11,022,123.
41
IRSA’s Recent Developments
Operations Center in
Argentina
Dolphin Netherlands shares subscription.
On August 10, 2016,
through a subsidiary, IRSA subscribed additional shares of Dolphin
Netherlands B.V. for a subscription price of US$ 3.2 million. As of
June 30, 2016 IRSA owned 98.6% of Dolphin Netherlands
B.V.
Issuance of Series VII and Series VIII Notes.
On September 8, 2016, IRSA issued the
Series VII Notes, for Ps. 384,233,262, bearing an adjustable
interest rate of BADLAR + 2.99% and the Series VIII Notes, for US$
184,507,138, bearing interest at a fixed rate of 7% per year. Both
Series mature on September 9, 2019. The use of proceeds was mainly
to repay debt.
Redemption of Series I Notes.
On September 9, 2016, IRSA announced
its intention to redeem all outstanding Series I Notes for a total
amount of US$ 74.55 million. The redemption took place on October
11, 2016, and the redemption price was equal to 100% of the
aggregate principal amount of the outstanding Notes plus accrued
interest, as a result of the redemption, the outstanding amount of
the Notes was cancelled in full.
Operations Center in
Israel
ChemChina’s offer for Adama Agricultural Solutions
Ltd.
On July 17, 2016, IRSA
’s
indirect subsidiary DIC,
agreed to sell its remaining 40% in Adama to ChemChina for cash
consideration of US$ 230 million and cancellation of a loan due to
a Chinese bank. It is expected that the sale transaction be
consummated by the first week of November 2016, subject to the
fulfillment of certain conditions, including the receipt of Chinese
regulatory and antitrust approvals.
Dismissal of liquidation request of IDBD.
On July 18, 2016, the Tel Aviv District
Court dismissed the request for liquidation of IDBD and appointment
of interim liquidator put forward by Hermetic Trust (1975) Ltd. on
behalf of IDBD’s Series 9 bondholders.
Issuance of Notes by IDBD and DIC.
On August 2, 2016 IDBD issued a new
Series of Debentures in the Israeli market for an amount of NIS 325
million due November 2019 at an annual interest rate adjustable by
CPI plus 4.25%. The notes are pledged by shares of Clal Insurance
Enterprise Holdings Ltd (“Clal”), subject to the
approval of the Commissioner of Capital Markets, Insurance and
Savings. IDBD is working to get the authorization to constitute the
guarantee through the filing of an application to the Supreme Court
asking for such approval. In case IDBD does not get the required
approval, funds must be repaid with interest plus a penalty. on
September 15, 2016, the High Court of Justice gave a partial
judgment and decision, according to which it was decided, to reject
the petition for the most part and to grant an order which
instructs the Commissioner to appear and show a reason for her
opposition to the request of the company to pledge up to 5% of the
shares of Clal Holdings, subject to an outline agreed to at the
time by the company. Furthermore, the company maintains the right
to accede to a proposal for compromise which was raised in the
context of the discussion. A hearing date was set for January
2017.
Furthermore, DIC re-opened its issuance
of Notes due 2025 for an additional principal amount of NIS 360
million.
Notes in IDBD and subsidiaries
In July 2016,
Shufersal acquired Notes Series B shares with a Nominal Value of
NIS 511 million by way of an additional issue of Notes Series F
shares at a ratio of 1.175 for each NIS 1 nominal value of the
Series B shares outstanding. The Notes Series B shares acquired by
Shufersal were cancelled and delisted.
Acqusition of DIC shares from IDBD
On September 23,
2016, we acquired from IDBD 8,888,888 shares of Discount Investment
Corporation (“DIC”) (DISI:TASE) for NIS 100 million
(approximately US$ 26.7 million), equivalent to the 8.8% of
DIC’s shares outstanding.
General
We are a leading
Latin American agricultural company engaged in the production of
basic agricultural commodities with a growing presence in the
agricultural sector of Brazil, through our investment in
Brasilagro, as well as in other Latin American countries. We are
currently involved in several farming activities including grains
and sugarcane production, cattle raising and milk production. Our
business model focuses on the acquisition, development and
exploitation of agricultural properties having attractive prospects
for agricultural production and/or value appreciation and the
selective sale of such properties where appreciation has been
realized. In addition, we lease land to third parties and perform
agency and agro-industrial services, including a meat packing
plant. Our shares are listed on Mercado de Valores de Buenos Aires
(“MVBA”) and the NASDAQ.
We are also
directly and indirectly engaged in the real estate business through
our subsidiary IRSA and its subsidiaries and joint ventures, one of
Argentina’s leading real estate companies. IRSA is engaged in
the development, acquisition and operation of shopping centers,
premium offices, and luxury hotels in Argentina, as well as the
sales and development properties. Also, IRSA has international
investments, that mainly operate in the United States in relation
to the lease of office buildings and hotels in that country, and
the investment in IDBD, one of the largest and most diversified
investment groups of Israel, which, through its subsidiaries,
participates in numerous markets and industry sectors, including
real estate, retail, agroindustry, insurance, telecommunications,
among others. IRSA’s shares are listed on the MVBA and the
NYSE. We own 63.38% of the outstanding common shares of IRSA and a
majority of our directors are also directors of IRSA.
42
During fiscal years
ended June 30, 2016, 2015 and 2014, we had consolidated revenues of
Ps. 35,384 million, Ps. 5,652 and Ps. 4,604 million, and
consolidated net income/(loss) of Ps. 4,166 million, Ps. 1,767
million and Ps. 1,186 million, respectively. During the fiscal
years ended June 30, 2015 and June 30, 2016, our total consolidated
assets increased 986.7% from Ps. 15,276 million to
Ps. 166,001 million, and our consolidated shareholders’
equity decreased 290.3% from Ps. 3,903 million to Ps. 15,232
million.
We
operate in two businesses areas, namely, “Agricultural”
and “Investment and Development Properties” businesses,
as further described below.
In
fiscal year ended June 30, 2016, the Company has changed the
presentation of the agricultural business segments which are
reviewed by the CODM for a better alignment with the current
business vision and the metrics used to such end. Our Agricultural
business is further comprised of three reportable
segments:
●
The "Agricultural
production" segment consists of planting, harvesting and sale of
crops as wheat, corn, soybeans, cotton and sunflowers; breeding,
purchasing and/or fattening of free-range cattle for sale to
slaughterhouses and local livestock auction markets; breeding
and/or purchasing dairy cows for the production of raw milk for
sale to local milk and milk-related products producers; and
planting, harvesting and sale of sugarcane.
The new segment “agricultural
production” aggregate the old segments crops, cattle, dairy
and sugarcane:
■
Our
“Crops”
segment
consists
of planting, harvesting and
sale of crops as wheat, corn, soybeans, cotton, and sunflowers. The
Company is focused on the long-term performance of the land and
seeks to maximize the use of the land through crop rotation; the
use of technology and techniques. In this way, the type and
quantity of harvested crops change in each agricultural
campaign.
Our Crops
Segment
had assets of Ps. 2,775 million and Ps. 1,913
million as of June 30, 2016 and 2015, respectively, representing
60% and 58% of our agricultural business assets at such dates,
respectively. Our
Crops
segment
generated operating income of
Ps.
154 million, operating loss
of Ps. 277 million and Ps. 140 million for fiscal years ended June
30, 2016, 2015 and 2014, respectively, representing 53%, (90%) and
368%, of our consolidated operating income/loss from Agricultural
Business for such years, respectively.
■
Our
“Cattle”
segment
consists of breeding, purchasing and/or fattening of free-range
cattle for sale to meat processors and local livestock auction
markets.
Our Cattle segment
had
assets of Ps. 815 million and Ps. 606 million as of June 30, 2016
and 2015, respectively, representing 18% and 18% of our
agricultural business assets at such dates, respectively. Our
Cattle
segment
generated operating income of Ps.
103 million, Ps. 36 million and Ps. 31
million for fiscal years ended June 30, 2016, 2015 and 2014
respectively, representing 35%, 12% and (82%), of our consolidated
operating income from Agricultural Business for such years,
respectively.
■
Our
“Dairy”
segment
consists of breeding and/or purchasing dairy cows for the
production of raw milk for sale to local milk and milk-related
products producers.
Our Dairy
segment
had assets of Ps. 77 million and Ps. 65 million as
of June 30, 2016 and 2015, respectively, representing 2% and 2% of
our agricultural business assets at such dates, respectively. Our
Dairy
segment
generated operating loss of Ps. 8 million for
fiscal year ended June 30, 2016, representing (3%), of our
consolidated operating income from Agricultural Business for such
years, respectively and operating income of Ps. 4 million and Ps. 5
million for fiscal year ended June 30, 2015 and 2014, representing
1% and (13%), of our consolidated operating income from
Agricultural Business for such year.
■
Our
“Sugarcane”
segment
consists of planting, harvesting and sale of sugarcane.
Our Sugarcane segment
had
assets of Ps. 713 million and Ps. 410 million as of June 30, 2016
and 2015, respectively, representing 13% and 12% of our
agricultural business assets at such dates, respectively. Our
Sugarcane
segment
generated operating income of Ps.
63 million for the fiscal year ended
June 30, 2016, representing 22% of our consolidated operating
income from Agricultural Business for such year and operating loss
of Ps. 13 million and Ps. 23 million for fiscal years ended June
30, 2015 and 2014, respectively, representing (4%) and 61%, of our
consolidated operating income from Agricultural Business for such
years.
●
Our “Land
Transformation and Sales” segment
comprises gains from the disposal and development
of farmlands activities.
Our
Land Transformation and Sales segment
had assets of Ps. 13
million and Ps. 13 million as of June 30, 2016 and 2015,
respectively, representing 0% and 0% of our agricultural business
assets at such dates, respectively. Our
Land Transformation and Sales
segment
generated operating loss of Ps. 12
million for fiscal year ended June 30, 2016, representing (4%) of
our consolidated operating income from Agricultural Business for
such year, respectively, and operating income of Ps. 552 million
and Ps. 78 million for fiscal years ended June 30, 2015 and 2014,
representing 180% and (205%), of our consolidated operating income
from Agricultural Business for such years,
respectively.
●
The "Other
segments" segment includes, principally, agricultural services (for
example, irrigation); leasing of the Company's farms to third
parties; feedlot farming, slaughtering and processing in the meat
refrigeration plant; and brokerage activities, among others.
The new segment “
Other
segments
” aggregate the old
segments
Agricultural Rentals and Services, Agro-industrial
and Others:
■
Our
“Agricultural Rentals and Services”
segment
consists of services (for example:
irrigation) and leasing of the Company’s farms to third
parties. Our Agricultural Rentals and Services Segment had assets
of Ps. 22 million and Ps. 118 million as of June 30, 2016 and 2015,
respectively, representing 0% and 4% of our agricultural business
assets at such dates, respectively. Our Agricultural Rentals and
Services segment generated operating income of Ps. 53 million, Ps.
37 million and Ps. 7 million for fiscal years ended June 30, 2016,
2015 and 2014, respectively, representing 18%, 12% and (18%) of our
consolidated operating income from Agricultural Business for such
years.
■
Our
“Agro-industrial”
segment
consists of feedlot farming and the
slaughtering and processing in the meat refrigerating plant.
Feedlot farming is distinctive and requires specific care and diets
which differ from those provided to free-range cattle. This
activity represents a separate operating segment due to the
distinctive characteristics of the cattle feedlot system and the
industrialized meat processing in the packing plant. Our
Agro-industrial segment had assets of Ps. 71 million and Ps. 42
million as of June 30, 2016 and 2015, respectively, representing 2%
and 1% of our agricultural business assets at such dates,
respectively. Our Agro-Industrial segment generated operating
income of Ps. 1 million for the fiscal year ended June 30, 2014,
representing (3%) of our consolidated operating income from
Agricultural Business for such year, and operating loss of Ps. 63
million and Ps. 35 million for the fiscal years ended June 30, 2016
and 2015, respectively, representing (22%) and (11%), of our
consolidated operating income from Agricultural Business for such
years, respectively.
■
Our
“Others”
segment
consists of the aggregation of the remaining operating segments,
which do not meet the quantitative thresholds for disclosure. This
segment includes the brokerage and sale of inputs activities. Our
Others segment had assets of Ps. 129 million and Ps.114 million as
of June 30, 2016 and 2015, respectively, representing 3% and 3% of
our agricultural business assets at such dates, respectively. Our
Others segment generated operating income of Ps. 2 million, Ps. 3
million and Ps. 3 million for fiscal years ended June 30, 2016,
2015 and 2014, representing 1%, 1% and (8%) of our consolidated
operating income for such years, respectively.
Our Agricultural
business is further comprised of eight reportable
segments:
·
Our
“Agricultural production” segment consists of planting,
harvesting and sale of crops as wheat, corn, soybeans, cotton and
sunflowers; breeding, purchasing and/or fattening of free-range
cattle for sale to slaughterhouses and local livestock auction
markets; breeding and/or purchasing dairy cows for the production
of raw milk for sale to local milk and milk-related products
producers; and planting, harvesting and sale of sugarcane. Our
Agricultural production segment had assets of Ps. 4,380 million and
Ps. 2,994 million as of June 30, 2016 and 2015, respectively,
representing 95% and 91% of our agricultural business assets at
such dates, respectively. Our Agricultural production segment
generated operating income of Ps. 312 million, operating loss of
Ps. 250 million and operating loss Ps. 127 million for fiscal years
ended June 30, 2016, 2015 and 2014, respectively, representing
107%, (4%) and (3%), of our consolidated operating income/loss from
Agricultural Business for such years,
respectively.
·
Our “Land
Transformation and Sales” segment comprises gains from the
disposal and development of farmlands activities. Our Land
Transformation and Sales segment had assets of Ps. 13 million and
Ps. 13 million as of June 30, 2016 and 2015, respectively,
representing 0% and 0% of our agricultural business assets at such
dates, respectively. Our Land Transformation and Sales segment
generated operating loss of Ps. 12 million for fiscal year ended
June 30, 2016, representing (4%) of our consolidated operating
income from Agricultural Business for such year, respectively, and
operating income of Ps. 552 million and Ps. 78 million for fiscal
years ended June 30, 2015 and 2014, representing 180% and (205%),
of our consolidated operating income from Agricultural Business for
such years, respectively.
·
Our
“Others” segment consists of the aggregation of the
remaining operating segments, which do not meet the quantitative
thresholds for disclosure. This segment includes the brokerage and
sale of inputs activities. Our Others segment had assets of Ps. 222
million and Ps.274 million as of June 30, 2016 and 2015,
respectively, representing 5% and 8% of our agricultural business
assets at such dates, respectively. Our Others segment generated
operating loss of Ps. 8 million, operating income Ps. 5 million and
operating income Ps. 11 million for fiscal years ended June 30,
2016, 2015 and 2014, representing (3%), 2% and (29%) of our
consolidated operating income from Agricultural Business for such
years, respectively.
We have decided to
break down reporting of our Urban properties and investment
business into an Operation Center in Argentina and an Operation
Center in Israel. From the Operation Center in Argentina, the
Company, through IRSA and its subsidiaries, manages the businesses
in Argentina and the international investments in the Lipstick
Building in New York and the Condor hotel REIT. From the Operation
Center in Israel, the Company manages IDBD.
Operations Center in
Argentina
We operate our
business in Argentina through six reportable segments, namely
“Shopping Centers”, “Offices and Others”,
“Sales and Developments”, “Hotels”,
“International” and “Financial Operations and
Others” as further described below:
·
Our “Shopping
Centers” segment includes the operating results from our
portfolio of shopping centers principally comprised of lease and
service revenue from tenants. Our Shopping Centers segment had
assets of Ps. 2,365 million and Ps. 2,400 million as of June 30,
2016 and 2015, respectively, representing 47.8% and 37.5% of our
investment and development properties business assets for the
Operations Center in Argentina at such dates, respectively. Our
Shopping Centers segment generated operating income of Ps. 1,637
million, Ps. 1,190 million and Ps. 864 million, for fiscal years
ended June 30, 2016, 2015 and 2014, respectively, representing
60.3%, 47.2% and 69.7%, of our consolidated operating income for
the Operations Center in Argentina for such years,
respectively.
·
Our “Offices
and Others” segment includes the operating results of our
lease and service revenues of office space and other non-retail
building properties principally comprised of lease and service
revenue from tenants. Our Offices and Others segment had assets of
Ps. 941 million and Ps. 1,036 million as of June 30, 2016 and 2015,
respectively, representing 19.0% and 16.2% of our investment and
development properties business assets for the Operations Center in
Argentina at such dates, respectively. Our Offices and Others
segment generated operating income of Ps. 219 million, Ps. 99
million and Ps. 160 million, for fiscal years ended June 30, 2016,
2015 and 2014, respectively, representing 8.1%, 3.9% and 12.9%, of
our consolidated operating income for the Operations Center in
Argentina for such years, respectively.
·
Our “Sales
and Developments” segment includes the operating results of
our acquisition and/or construction of housing and other properties
for sale in the ordinary course of business. Our Sales and
Developments segment had assets of Ps. 585 million and Ps. 466
million as of June 30, 2016 and 2015, respectively, representing
11.8% and 7.3% of our investment and development properties
business assets for the Operations Center in Argentina at such
dates, respectively. Our Sales and Developments segment generated
operating income of Ps. 864 million, Ps. 1,099 million and Ps. 239
million, for fiscal years ended June 30, 2016, 2015 and 2014,
respectively, representing 31.8%, 43.6% and 19.3%, of our
consolidated operating income for the Operations Center in
Argentina for such years, respectively.
·
Our
“Hotels” segment includes the operating results of our
hotels mainly comprised of room, catering and restaurant revenues.
Our Hotels segment had assets of Ps. 174 million and Ps. 182
million as of June 30, 2016 and 2015, respectively, representing
3.5% and 2.8% of our investment and development properties business
assets for the Operations Center in Argentina at such dates,
respectively. Our Hotels segment generated, operating losses of Ps.
2 million and Ps. 13 million, and operating income of Ps. 10
million, for fiscal years ended June 30, 2016, 2015 and 2014,
respectively, representing (0.1%), (0.5%) and 0.8%, of our
consolidated operating income for the Operations Center in
Argentina for such years.
·
Our
“International” segment includes investments that
mainly operate in the United States in relation to the lease of
office buildings and hotels in that country, and the results
arising from investment in IDBD at fair value. We intend to
continue evaluating investment opportunities outside Argentina as
long as they offer attractive investment and development options.
Our International segment generated operating losses of Ps. 2
million and operating income of Ps. 148 million, and operating
losses of Ps. 30 million, for fiscal years ended June 30, 2016,
2015 and 2014, respectively, representing (0.1%), 5.9% and (2.4%),
of our consolidated operating income for the Operations Center in
Argentina for such years, respectively.
·
Our
“Financial Operations and Others” segment includes
principally the income or loss generated by our associates Banco
Hipotecario, BACS and Tarshop, and the residual financial
operations of Metroshop carried on through Apsamedia. During fiscal
year 2015, we decreased equity interest in Banco Hipotecario from
29.99% to 29.91%, held in the form of Class D shares, which are
currently entitled to three votes per share. As of June 30, 2016,
our investment in Banco Hipotecario generated income for Ps. 257
million. Tarshop’s operations consist primarily of lending
and servicing activities related to the credit card offered to
consumers at retail venues. Our Financial Operations and Others
segment had assets of Ps. 1,709 million and Ps. 1,411 million as of
June 30, 2016 and 2015, respectively, representing 34.6% and 22.0%
of our investment and development properties business assets for
the Operations Center in Argentina at such dates, respectively. Our
Financial Operations and Others segment generated operating losses
for Ps. 1 million, Ps. 3 million and Ps. 3 million, for fiscal
years ended June 30, 2016, 2015 and 2014, respectively,
representing 0.0%, (0.1%) and (0.2%) of our consolidated operating
income for the Operations Center in Argentina for such
years.
43
Operations Center in
Israel
We operate our
business in Israel through six reportable segments, namely
“Real Estate”, “Supermarkets”,
“Agrochemicals”, “Telecommunications”,
“Insurances” and “Others” as further
described below:
·
Our “Real
Estate” segment includes mainly assets and operating income
derived from business related to the subsidiary PBC. Through PBC,
the Company operates rental properties and residential properties
in Israel, United States and other parts of the world and carries
out commercial projects in Las Vegas. Our Real Estate segment had
net assets of Ps. 10,745 million as of June 30, 2016, representing
76.1% of our operating assets for the Operations Center in Israel
at such date. Our Real Estate segment generated operating income of
Ps. 617 million for fiscal year ended June 30, 2016, representing
85.7%, of our consolidated operating income for the Operations
Center in Israel for such year.
·
Our
“Supermarkets” segment includes assets and operating
income derived from the business related to the subsidiary
Shufersal. Through Shufersal, the Company mainly operates a
supermarket chain in Israel. Our Supermarkets segment had net
assets of Ps. 5,826 million as of June 30, 2016, representing 41.2%
of our operating assets for the Operations Center in Israel at such
date. Our Supermarkets segment generated operating income of Ps.
424 million for fiscal year ended June 30, 2016, representing
58.9%, of our consolidated operating income for the Operations
Center in Israel for such year.
·
Our
“Agrochemicals” segment includes income derived from
the associate Adama. Adama is a company specialized in
agrochemicals, particularly for the production of crops.. Our
Agrochemicals segment generated operating income of Ps. 0 million
for fiscal year ended June 30, 2016, for the Operations Center in
Israel.
·
Our
“Telecommunications” segment includes assets and
operating income derived from the business related to the
subsidiary Cellcom. Cellcom is a provider of telecommunication
services and its main activities include the provision of mobile
phone services, fixed line phone services, data and Internet, among
others. Our Telecommunications segment had net assets of Ps. 5,688
million as of June 30, 2016, representing 40.3% of our operating
assets for the Operations Center in Israel at such date. Our
Telecommunications segment generated operating losses of Ps. 71
million for fiscal year ended June 30, 2016, representing (9.9%),
of our consolidated operating income for the Operations Center in
Israel for such year.
·
Our
“Insurance” segment includes the investment in Clal.
This company is one of the most important insurance groups in
Israel, and is mainly engaged in pension and social security
insurance, among others. As indicated in Note 16 of the Financial
Statements, 51% of the controlling shares of Clal are held in a
trust following the instructions of the Israel Securities
Commission in order to comply with the sale of the controlling
shares of Clal; as a result, Clal is not fully consolidated on a
line-by-line basis but rather in a single line as a financial
instrument at fair value, as required by the IFRS under the current
circumstances where no control is exercised. Our Insurance segment
had assets of Ps. 4,602 million as of June 30, 2016, representing
32.6% of our operating assets for the Operations Center in Israel
at such date. Our Insurance segment generated operating income of
Ps. 0 million for fiscal year ended June 30, 2016, for the
Operations Center in Israel.
·
Our
“Others” segment includes the assets and income derived
from other diverse business activities, such as technological
developments, tourism, oil and gas assets, electronics, and others.
Our Others segment had negative net assets of Ps. 12,737 million as
of June 30, 2016, representing (90.2%) of our operating assets for
the Operations Center in Israel at such date. Our Others segment
generated operating losses of Ps. 250 million for fiscal year ended
June 30, 2016, representing (34.7%), of our consolidated operating
income for the Operations Center in Israel for such
year.
Agricultural Business
As of June 30,
2016, we owned 27 farms with approximately 622,217 hectares
distributed in Argentina, Brazil, Bolivia and Paraguay.
Approximately 96,710 hectares of the land we own are used for crop
production, approximately 71,937 hectares are for Cattle
production, 85,000 hectares are for sheep production, 2,231
hectares are for milk production and approximately 2,435 hectares
are leased to third parties for crop and cattle beef production.
The remaining 363,904 hectares of land reserves are primarily
natural woodlands. In addition, we have the rights to hold
approximately 132,000 hectares of land under concession for a
35-year period that can be extended for another 29 years. Out of
this total, we have developed 23,196 hectares for crop production.
Also, during fiscal year 2016 ended on June 30, 2016, we leased
41,966 hectares to third parties for crop production and 13,455
hectares for Cattle production
The following table
sets forth, at the dates indicated, the amount of land used for
each production activity (including owned and leased land, and land
under concession):
|
|
2016
(1)
|
2015
(1)(6)
|
2014
(1)(6)
|
2013
(1)(6)
|
2012
(1)(6)
|
|
Crops
(2)
|
178,617
|
187,438
|
201,648
|
182,513
|
181,079
|
|
Cattle
(3)
|
85,392
|
88,643
|
95,160
|
91,053
|
95,995
|
|
Milk/Dairy
|
2,231
|
2,864
|
2,864
|
2,780
|
3,022
|
|
Sheep
|
85,000
|
85,000
|
85,000
|
85,000
|
85,000
|
|
Land Reserves
(4)
|
473,290
|
467,568
|
467,532
|
461,729
|
459,979
|
|
Own farmlands
leased to third parties
|
2,435
|
10,026
|
13,111
|
31,593
|
25,538
|
|
Total
(5)
|
826,965
|
841,539
|
865,315
|
854,668
|
850,613
|
(1)
Includes 35.72% of
approximately 8,299 hectares owned by Agro-Uranga S.A., an
affiliated Argentine company in which we own a non-controlling
35.72% interest.
(2)
Includes wheat,
corn, sunflower, soybean, sorghum and others, including double crop
production.
(3)
Breeding and
fattening.
(4)
We use part of our
land reserves to produce charcoal, rods and fence
posts.
(5)
It includes
Brasilagro and our interest in CRESCA at 50%.
(6)
Includes farms
owned by Brasilagro and CRESUD sold in 2014 and
2015.
44
Strategy
We seek to maximize
our return on assets and overall profitability by (i) identifying,
acquiring and operating agricultural properties having attractive
prospects for increased agricultural production and/or medium or
long-term value appreciation and selectively disposing of
properties as appreciation is realized, (ii) optimizing the yields
and productivity of our agricultural properties through the
implementation of state-of-the-art technologies and agricultural
techniques and (iii) preserving the value of our significant
long-term investment in the urban real estate sector through our
subsidiary IRSA.
To such end, we
seek to:
Focus
on maximizing the value of our agricultural real estate
assets
We conduct our
agricultural activities with a focus on maximizing the value of our
agricultural real estate assets. We rotate our portfolio of
properties from time to time by purchasing properties which we
believe have a high potential for appreciation and selling them
selectively as opportunities arise to realize attractive capital
gains. We achieve this by relying on the following
principles:
|
•
|
Acquiring under-utilized properties and
enhancing their land use:
We seek to purchase under-utilized
properties at attractive prices and develop them to achieve more
productive uses. We seek to do so by (i) transforming
non-productive land into cattle feeding land,
(ii) transforming cattle feeding land into land suitable for
more productive agricultural uses, (iii) enhancing the value
of agricultural lands by changing their use to more profitable
agricultural activities; and (iv) reaching the final stage of
the real estate development cycle by transforming rural properties
into urban areas as the boundaries of urban development continue to
extend into rural areas. To do so, we generally focus on
acquisitions of properties outside of highly developed agricultural
regions and/or properties whose value we believe is likely to be
enhanced by proximity to existing or expected
infrastructure.
|
|
•
|
Applying modern technologies to enhance
operating yields and property values
. We believe that an
opportunity exists to improve the productivity and long-term value
of inexpensive and/or underdeveloped land by investing in modern
technologies such as genetically modified and high yield seeds,
direct sowing techniques, and machinery. We optimize crop yield
through land rotation, irrigation and the use of fertilizers and
agrochemicals. To enhance our cattle production, we use genetic
technology and have a strict animal health plan controlled
periodically through traceability systems. In addition, we have
introduced state-of-the-art milking technologies in our dairy
business.
|
|
•
|
Anticipating market trends.
We seek to
anticipate market trends in the agribusiness sector by
(i) identifying opportunities generated by economic
development at local, regional and worldwide levels,
(ii) detecting medium- and long-term increases or decreases in
supply and demand caused by changes in the world’s food
consumption patterns and (iii) using land for the production
of food and energy.
|
|
•
|
International expansion.
We believe that an attractive
opportunity exists to acquire and develop agricultural properties
outside Argentina, and our objective is to replicate our business
model in other countries. Although most of our properties are
located in different areas of Argentina, we have begun a process of
expansion into other Latin American countries, including Brazil,
Bolivia, and Paraguay.
|
Increase
and optimize production yields
We seek to increase
and improve our production yields through the following
initiatives:
Implementation of
technology
.
|
•
|
To improve crop
production, we use state-of-the-art technology. We invest in
machinery and the implementation of agricultural techniques such as
direct sowing. In addition, we use high-potential seeds (GMOs) and
fertilizers and we apply advanced land rotation techniques. In
addition, we consider installing irrigation equipment in some of
our farms.
|
|
•
|
To increase cattle
production we use advanced breeding techniques and technologies
related to animal health. Moreover, we optimize the use of pastures
and we make investments in infrastructure, including installation
of watering troughs and electrical fencing. In addition, we have
one of the few vertically integrated cattle processing operations
in Argentina through Sociedad Anónima Carnes Pampeanas
S.A.
|
|
•
|
In our milking
facility, we have implemented an individual animal identification
system, using plastic tags for our cattle and “RFID”
tags. We use software from Westfalia Co. which enables us to store
individual information about each of our dairy cows.
|
Increased production
.
Our goal is to
increase our crop, cattle and milk production in order to achieve
economies of scale by:
|
•
|
Increasing our
owned land in various regions by taking advantage of attractive
land purchase opportunities. In addition, we expand our production
areas by developing lands in regions where agricultural and
livestock production is not developed to its full potential. We
believe in the use of technological tools for improving the
productivity of our land reserves and enhancing their long-term
value. However, current or future environmental regulations could
prevent us from fully developing our lands by demanding us to
maintain part of them as natural woodlands not allocated to
production.
|
|
•
|
Diversifying our
production and the weather risk by leasing farms, thus expanding
our product portfolio and optimizing our geographic focus, in
particular in areas that are not appealing in terms of land value
appreciation but with attractive productivity levels. We believe
that this diversification mix mitigates our exposure to
seasonality, commodity price fluctuations, weather conditions and
other factors affecting the agricultural and livestock
sector.
|
|
•
|
Moreover, we
believe that continuing to expand our agricultural operations
outside of Argentina will help us improve even more our ability to
produce new agricultural products, further diversifying our mix of
products, and mitigating our exposure to regional weather
conditions and country-specific risks.
|
45
Focus
on preserving long-term value of our investment in our real estate
subsidiary IRSA
As a leading
company engaged in acquiring, developing and managing real estate,
IRSA seeks to (i) generate stable cash flows through the operation
of its real estate rental assets (shopping centers, office
buildings, hotels), (ii) achieve long-term appreciation of its
asset portfolio by taking advantage of development opportunities,
(iii) increase the productivity of its land reserves and enhance
the margins of its development and sale of properties segment
through partnerships with other developers, and (iv) look for
opportunities abroad offering capital gain potential.
Operations Center in Argentina
|
•
•
|
Shopping Center.
Our main purpose is to
maximize our shareholders’ profitability. By using our
know-how in the shopping center industry in Argentina as well as
our leading position, we seek to generate a sustainable growth of
cash flow and to increase the long-term value of our real estate
assets. We attempt to take advantage of the unsatisfied supply in
different urban areas of the region, as well as of our
customers’ purchase experience. Therefore, we seek to develop
new shopping centers in urban areas with attractive prospects for
growth, including Buenos Aires’ Metropolitan area, some
cities in the provinces of Argentina and possibly, other places
abroad. To achieve this strategy, the close business relationship
we have had for years with more than 1,000 retail companies and
trademarks composing our selected group of tenants is of utmost
importance, as it allows us to offer an adequate mix of tenants for
each particular case.
Offices and Others.
We seek to purchase
and develop premium office buildings in strategically-located
business districts in the City of Buenos Aires and other strategic
locations that we believe offer return and potential for long-term
capital gain. We expect to continue our focus on attracting premium
corporate tenants to our office buildings. Furthermore, we intend
to consider new opportunities on a selective basis to acquire or
construct new rental office buildings.
|
|
•
|
Sales and Developments
. We seek to
purchase undeveloped properties in densely-populated areas and
build apartment complexes offering green space for recreational
activities. We also seek to develop residential communities by
acquiring undeveloped properties with convenient access to the City
of Buenos Aires, developing roads and other basic infrastructure
such as electric power and water, and then selling lots for the
construction of residential units. The scarcity of mortgage
financing restricted the growth in low class home purchases and, as
a result, we mainly focused on the development of residential
communities for middle and high-income individuals, who do not need
to finance their home purchases. We seek to continue to acquire
undeveloped land at locations we consider attractive within and
outside Buenos Aires. In each case, our intention is to purchase
land with significant development or appreciation potential to
resell. We believe that holding a portfolio of desirable
undeveloped plots of land enhances our ability to make strategic
long-term investments and affords us a valuable pipeline of new
development projects for upcoming years.
|
|
•
|
Hotels.
We believe our portfolio of
three luxury hotels is positioned to take advantage of the future
growth in tourism and business travel in Argentina. We seek to
continue with our strategy to invest in high-quality properties
that are operated by leading international hotel companies to
capitalize on their operating experience and international
reputation. We also seek to continue to invest in improvements for
our hotels.
|
|
•
|
International
. In this segment, we seek
investments that represent an opportunity of capital appreciation
potential in the long term. After the international financial
crisis in 2008, we took advantage of the price opportunity in the
real estate sector in the United States and invested in two office
buildings in Manhattan, New York. In 2015, we sold the Madison
building and we hold a 49.9% interest in a US company, whose main
asset is the so-called “Lipstick” office building
located in the City of New York. In addition, jointly with
subsidiaries, we hold 49.0% of the voting securities of Condor
Hospitality Trust REIT (NASDAQ: CDOR). We intend to continue
evaluating -on a selective basis- investment opportunities outside
Argentina as long as they offer attractive investment and
development options.
|
|
|
Financial Operations and Other.
Through
our investment in Banco Hipotecario, the main mortgage-lending bank
in Argentina, we believe that we are able to achieve good synergies
in the long term with a developed mortgage market.
|
Operations Center in Israel
We hold, through
Dolphin, 68.3% of IDBD, which is one of the largest and most
diversified investment groups in Israel, which participates,
through its subsidiaries, associates and joint ventures, in
numerous markets and industry sectors, including real estate,
retail, agricultural industry, insurance, telecommunications, among
others. We seek to continue to reduce IDBD’s indebtedness
level, simplifying its capital structure and nurturing a strategy
in each business unit aimed at improving operating margins and the
results of our investment.
·
Real Estate
. PBC has partnered with IDBD
in two projects based in Las Vegas, through IDBG Ltd., including
commercial and office building project (Tivoli). The first stage of
this project has been fully completed. The second stage of the
project is undergoing the building and marketing stages, and will
include commercial areas with a surface area of approximately
16,000 square meters and office areas with a surface area of
approximately 12,000 square meters. We have already entered into
lease agreements with an anchor tenant and other tenants covering
approximately 66% of the commercial area included in the second
stage of the project and around 8% of the office areas. We also
expect to develop an additional project encompassing two
residential buildings and, during the year under review, have sold
all the remaining residential units of these
buildings.
·
Supermarkets.
Shufersal continued
developing its business plan, with a focus on building a commercial
and operating infrastructure to enable growth in the coming years;
strengthening its competitive edge; offering more value to
customers; and improving its service. Under its business plan,
Shufersal continues expanding and strengthening its brand; boosting
the development of its digital platforms, with “Shufersal
Online” at the core; fostering new and supplementary
operations in the sectors in which it currently operates; and
streamlining its real property, including the closure and
downsizing of existing branches and the opening of new
ones.
·
Agrochemicals
. As a part of
Adama’s long-term strategy, in December 2015, Adama entered
into a commercial cooperation agreement, according to which Adama
will gradually become the sole distributor of formulated
agrochemical products in China of several agrochemical companies
controlled by China National Chemical Corporation
(“ChemChina”). This cooperation is expected to support
the strengthening of Adama’s status in the Chinese market, by
combining sales of Adama’s products with products of
ChemChina’s companies and setting up a significant
distribution platform in China, starting at the beginning of 2016.
On July 17, 2016, DIC, reported that it had accepted
ChemChina’s offer for 40% of Adama Agricultural Solutions
Ltd.’s shares, indirectly controlled by IDBD through DIC. For
more information see “Recent
Developments”.
·
Telecommunications
. Cellcom operates in
a highly competitive environment. The main elements of
Cellcom’s business strategy are: offering comprehensive
solutions to expand landline and mobile communication services,
optimization of costs and expenses, including by means of carrying
out streamlining measures.
·
Insurance
. The investment managers make
use of an advanced research department and an effective trading
execution, to ensure a competitive advantage in order to achieve a
fair long-term yield for policy holders, maximizing income from
investments in accordance with the company’s risk appetite
and the structure of liabilities in the
portfolios.
·
Others.
Includes the assets and income
from other miscellaneous businesses, such as technological
developments, tourism, oil and gas assets, electronics, and other
sundry activities.
46
Our
Principal Business Activities
During fiscal year
ended June 30, 2016, we conducted our operations on 30 owned farms
and 35 leased farms. Some of the farms we own are engaged in more
than one productive activity at the same time.

The following chart
shows, for fiscal year 2016, the surface area in operation for each
line of business:
The following chart
illustrates, for the fiscal year ended on June 30, 2016, the
surface area in operation and the hectares held as land reserves,
classified into own, under lease or under concession:

Agricultural Business
Land
Transformation and Sales
Land
Acquisitions
We intend to
increase our farmland portfolio by acquiring large extensions of
land with high appreciation potential. We also intend to transform
the land acquired from non-productive to cattle breeding, from
cattle breeding to farming, applying state-of-the-art technology to
improve farming yields so as to generate higher land
appreciation.
In our view, the
sector’s potential lies in developing marginal areas and/or
under-utilized areas. Thanks to the current technology, we may
achieve similar yields with higher profitability than core areas,
resulting in the appreciation of land values.
Over the past 15
years, prices of farmlands intended for agricultural production
have increased in the southern hemisphere (mainly South America)
but continue to be relatively low compared to the northern
hemisphere (U.S. and Europe). Our financial strength relative to
other Argentine producers gives us the chance to increase our land
holdings at attractive prices, improve our production scale and
create potential for capital appreciation.
Several important
intermediaries, with whom we usually work, bring farmlands
available for sale to our attention. The decision to acquire
farmlands is based on the assessment of a large number of factors.
In addition to the land’s location, we normally carry out an
analysis of soil and water, including the quality of the soil and
its suitability for our intended use (crops, cattle, or milk
production), classify the various sectors of the lot and the prior
use of the farmland; analyze the improvements in the property, any
easements, rights of way or other variables in relation to the
property title; examine satellite photographs of the property
(useful in the survey of soil drainage characteristics during the
different rain cycles) and detailed comparative data regarding
neighboring farms (generally covering a 50-km area). Based on the
foregoing factors, we assess the farmland in terms of the sales
price compared against the production potential of the land and
capital appreciation potential. We consider that competition for
the acquisition of farmlands is, in general, limited to small
farmers for the acquisition of smaller lots, and that there is
scarce competition for the acquisition of bigger lots.
In addition, we may
consider the acquisition of farmlands in marginal zones and their
improvement by irrigation in non-productive areas as well as the
installation of irrigation devices in order to obtain attractive
production yields and create potential for capital
appreciation.
47
The following chart
shows certain information concerning our land acquisitions for each
of the last 10 fiscal years ended on June 30:
|
Fiscal
Year
|
Number
of Farmlands
|
Amount
of Acquisitions
(Ps. million)
|
|
2006
(1)
|
1
|
45.9
|
|
2007
(2)
|
1
|
7.3
|
|
2008
(3)
|
2
|
4.5
|
|
2009
(4)
|
7
|
133.2
|
|
2010
(5)
|
1
|
5.0
|
|
2011
(6)
|
3
|
61.5
|
|
2012
|
-
|
-
|
|
2013
|
-
|
-
|
|
2014
|
-
|
-
|
|
2015
|
-
|
-
|
|
2016
|
-
|
-
|
|
|
|
|
(1)
Includes the
acquisition of “San Pedro” farmland of 6,022
hectares.
(2)
Includes the
acquisition of “8 de Julio” farmland of 90,000
hectares.
(3)
Includes the
acquisition of the remaining 25% of “La Adela” farmland
of 18 hectares and 80% of “La Esperanza” farmland of
980 hectares.
(4)
Includes the
acquisition of "Estancia Carmen", "Puertas de Luján", "Las
Londras", "San Cayetano", "San Rafael", and "La Fon Fon" farmlands
and 50% of "Jerovia" farmland, of 10,911, 115, 4,566, 883, 2,969,
3,748 and 20,966 hectares, respectively.
(5)
Includes exercise
of the option over 50% of the “Jerovía” farmland
of 3,646 hectares.
(6)
Includes the
acquisition of “La Primavera” and “4
Vientos” farmlands of 2,341 hectares and 2,659 hectares,
respectively. In addition, it includes the acquisition of 943
hectares of the Mendoza farmland.
Land
Sales
We periodically
sell properties that have reached a considerable appraisal to
reinvest in new farms with higher appreciation potential. We
analyze the possibility of selling based on a number of factors,
including the expected future yield of the farmland for continued
agricultural and livestock exploitation, the availability of other
investment opportunities and cyclical factors that have a bearing
on the global values of farmlands.
The following chart
shows certain information concerning our land sales for each of the
last 10 fiscal years ended on June 30:
|
Fiscal
Year
|
Number
of Farmlands
|
Gross
Proceeds from Sales
(Ps. million)
|
Profit
(1)
(Ps. million
)
|
|
2006
(2)
|
1
|
16.1
|
9.9
|
|
2007
(3)
|
3
|
29.9
|
22.3
|
|
2008
(4)
|
2
|
23.0
|
20.0
|
|
2009
(5)
|
2
|
2.0
|
1.9
|
|
2010
(6)
|
1
|
18.6
|
13.7
|
|
2011
(7)
|
2
|
84.5
|
54.6
|
|
2012
(8)
|
3
|
118.3
|
63.2
|
|
2013
(9)
|
4
|
332.6
|
149.6
|
|
2014
(10)
|
2
|
148.5
|
91.4
|
|
2015
(11)(12)
|
4
|
814.3
|
569.6
|
|
2016
|
-
|
-
|
-
|
(1)
Includes the
difference between the gross proceeds from sales (net of all taxes
and commissions) and the book value of the assets
sold.
(2)
Includes the sale
of “El Gualicho” farmland of 5,727
hectares.
(3)
Includes the sale
of 20,833 hectares of “Tapenagá” farmland and the
partial sale of 14,516 hectares of “Los Pozos” farmland
and 50 hectares of “El Recreo”
farmland.
(4)
Includes the
partial sale of 4,974 hectares of “Los Pozos” farmland
and the partial sale of 2,430 hectares of “La
Esmeralda” farmland.
(5)
Includes the
partial sale of 1,658 hectares of “Los Pozos” farmland
and the partial sale of 1,829 hectares of “El Recreo”
farmland.
(6)
Includes the sale
of 12,071 hectares of “Tali Sumaj.”
(7)
Includes the sale
of “La Juanita” farmland, of 4,302 hectares, and the
partial sale of 910 hectares of “La Fon
Fon.”
(8)
Includes the sale
of 2,447 hectares of “San Pedro” farmland, the partial
sale of 1,194 hectares of “La Fon Fon” farmland, and
the partial sale of 115 hectares of “Puerta de Lujan”
farmland.
(9)
Includes the sale
of 14,359 hectares of “Horizontina” farmland, the
partial sale of 394 hectares of “Araucaria” farmland,
the partial sale of “Cremaq” farmland of 4,985
hectares, and the partial sale of 5,613 hectares of La
“Suiza” farmland.
(10)
Includes the sale
of 883 hectares of “San Cayetano” farmland and the
partial sale of 1,164 hectares of “Araucaria”
farmland.
(11)
Includes the sale
of 1,058 hectares of “La Adela” farmland, 24,624
hectares of “Chaco Paraguayo” farmland, 1,643 hectares
of “Fon Fon” farmland and the remainder sale of 27,745
hectares of “Cremaq” farmland.
(12)
The sale of
“La Adela” to our subsidiary IRSA was a transaction
between related parties and generated therefore no results under
the IFRS and it was not included in the gain from disposition of
farms for Ps. 569.5 million.
After recording
farm sales for Ps. 814 million in 2015, we did not close any
transactions during fiscal year 2016. Specifically in Argentina,
the farmland sale market was affected during the last years by the
controls on capitals that prevailed until December 2015 and the
profitability conditions of the business. With the new
administration and new government policies for the farming industry
we have seen a positive change in this market’s prospects. In
this regard, after year-end we sold the “El Invierno”
and “La Esperanza” farms, comprising 2,615 hectares
used for agriculture and located in the district of
“Rancul”, province of La Pampa, for US$ 6 million
(US$ 2,294 per hectare). These farms’ book value was
approximately Ps. 13.5 million; therefore, the transaction
will result in a gain of Ps. 72 million, which will be
recorded in the first quarter of fiscal year 2017.
48
Farmland
Development
We consider that
there is great potential in farmland development where, through the
use of current technology, we may achieve similar yields with
higher profitability than in core areas.
As of June 30,
2016, we owned land reserves in the region extending over more than
365,306 hectares of own farmlands that were purchased at very
attractive prices. In addition, we have a concession 107,984
hectares reserved for future development. We believe that there are
technological tools available to improve productivity in these
farms and, therefore, achieve appreciation in the long term.
However, current or future environmental regulations could prevent
us from fully developing our land reserves by requiring that we
maintain part of this land as natural woodlands not to be used for
production purposes.
During fiscal year
2016, we conducted our land development business in Argentina
mainly in Los Pozos, where we developed 2,486 hectares in La Paz
and Don Mario modules. Moreover, we developed 548 hectares in La
Suiza intended for agricultural production.
Our developments in
Brazil, through our subsidiary Brasilagro, consisted of 4,416
hectares of developed land intended for agriculture.
In connection with
our business in Paraguay, we developed, through CRESCA, 1,400
hectares for agricultural production.
Results
The following table
shows this segment’s results for fiscal year 2016, compared
to the two preceding fiscal years:
|
In
millions of Ps.
|
Fiscal
Year 2016
|
Fiscal
Year 2015
|
Fiscal
Year 2014
|
YoY
var
2016
vs. 2015
|
|
Revenues
|
-
|
-
|
-
|
-
|
|
Costs
|
(9)
|
(9)
|
(8)
|
0.0%
|
|
Gross
Loss
|
(9)
|
(9)
|
(8)
|
0.0%
|
|
(Loss)/Gain from
disposition of farmlands
|
(2)
|
570
|
91
|
-
|
|
Profit/(Loss)
from operations
|
(12)
|
552
|
78
|
-
|
|
Segment
Profit/(Loss)
|
(12)
|
552
|
78
|
-
|
|
Area
under Development (hectares)
|
Developed
2014/2015
|
Developed
2015/2016
|
|
Argentina
|
1,703
|
3,034
|
|
Brazil
|
7,475
|
4,416
|
|
Paraguay
(1)
|
2,367
|
1,400
|
|
Total
|
11,545
|
8,850
|
(1) Includes the
farms of Cresca S.A. at 100%.
Agricultural Production
Crops
and Sugarcane
Our crop production
is mainly based on grains, oilseeds and sugarcane. Our main crops
include soybean, wheat, corn, and sunflower. Other crops, such as
sorghum and peanut, are sown occasionally and represent only a
small percentage of total sown land.
Production
The following table
shows, for the fiscal years indicated, our crop production volumes
measured in tons:
|
Production
Volume
(1)
|
FY
2016
|
FY2015
|
FY2014
|
FY2013
|
FY2012
|
|
Corn
|
229,893
|
310,874
|
155,759
|
194,870
|
247,839
|
|
Soybean
|
168,916
|
279,608
|
242,349
|
220,540
|
196,515
|
|
Wheat
|
16,186
|
15,990
|
12,373
|
4,392
|
18,625
|
|
Sorghum
|
1,127
|
1,740
|
4,502
|
6,709
|
7,791
|
|
Sunflower
|
3,053
|
11,992
|
5,803
|
12,437
|
14,503
|
|
Other
|
6,432
|
6,999
|
2,476
|
5,002
|
6,774
|
|
Total
Crops (tons)
|
425,607
|
627,203
|
423,262
|
443,950
|
492,047
|
|
Sugarcane (tons)
|
1,228,830
|
928,273
|
657,547
|
1,156,848
|
576,048
|
|
Cattle
herd
|
7,714
|
7,812
|
6,970
|
7,723
|
8,936
|
|
Milking
cows
|
491
|
524
|
489
|
470
|
445
|
|
Cattle
(tons)
|
8,205
|
8,336
|
7,459
|
8,193
|
9,381
|
|
Milk
(thousand of liters)
|
16,723
|
17,526
|
19,320
|
18,459
|
16,563
|
(1)
Includes CRESCA at
50%. Does not include Agro-Uranga S.A.
Below is the
geographical distribution of our agricultural production for the
last five seasons (in tons):
|
2016
Season
|
Argentina
|
Brazil
|
Bolivia
|
Paraguay
|
Total
|
|
Corn
|
189,708
|
19,982
|
13,233
|
6,969
|
229,893
|
|
Soybean
|
117,744
|
26,252
|
15,416
|
9,505
|
168,916
|
|
Wheat
|
15,525
|
-
|
661
|
-
|
16,186
|
|
Sorghum
|
56
|
-
|
773
|
298
|
1,127
|
|
Sunflower
|
3,053
|
-
|
-
|
-
|
3,053
|
|
Other
|
5,367
|
1,065
|
-
|
-
|
6,432
|
|
Total
Grains and Other
|
331,453
|
47,299
|
30,083
|
16,772
|
425,607
|
|
Sugarcane
|
-
|
1,075,183
|
153,648
|
-
|
1,228,830
|
49
|
2015
Season
|
Argentina
|
Brazil
|
Bolivia
|
Paraguay
|
Total
|
|
Corn
|
253,929
|
40,102
|
10,199
|
6,644
|
310,874
|
|
Soybean
|
132,101
|
111,751
|
30,471
|
5,285
|
279,608
|
|
Wheat
|
15,990
|
-
|
-
|
-
|
15,990
|
|
Sorghum
|
538
|
-
|
406
|
796
|
1,740
|
|
Sunflower
|
11,992
|
-
|
-
|
-
|
11,992
|
|
Other
|
6,917
|
-
|
-
|
82
|
6,999
|
|
Total
Grains and Other
|
421,467
|
151,853
|
41,076
|
12,807
|
627,203
|
|
Sugarcane
|
-
|
830,204
|
98,069
|
-
|
928,273
|
|
2014
Season
|
Argentina
|
Brazil
|
Bolivia
|
Paraguay
|
Total
|
|
Corn
|
93,388
|
50,102
|
11,445
|
826
|
155,761
|
|
Soybean
|
108,088
|
108,107
|
20,821
|
5,334
|
242,350
|
|
Wheat
|
12,373
|
-
|
-
|
-
|
12,373
|
|
Sorghum
|
1,367
|
-
|
2,487
|
648
|
4,502
|
|
Sunflower
|
5,756
|
-
|
47
|
-
|
5,803
|
|
Other
|
1,926
|
534
|
-
|
16
|
2,476
|
|
Total
Grains and Other
|
222,898
|
158,743
|
34,800
|
6,824
|
423,265
|
|
Sugarcane
|
-
|
570,820
|
86,727
|
-
|
657,547
|
|
2013
Season
|
Argentina
|
Brazil
|
Bolivia
|
Paraguay
|
Total
|
|
Corn
|
145,949
|
34,630
|
14,291
|
-
|
194,870
|
|
Soybean
|
82,476
|
106,276
|
31,601
|
187
|
220,540
|
|
Wheat
|
3,111
|
-
|
1,281
|
-
|
4,392
|
|
Sorghum
|
3,766
|
-
|
2,638
|
305
|
6,709
|
|
Sunflower
|
12,090
|
-
|
347
|
-
|
12,437
|
|
Other
|
2,644
|
2,358
|
-
|
-
|
5,002
|
|
Total
Grains and Other
|
250,036
|
143,264
|
50,158
|
492
|
443,950
|
|
Sugarcane
|
-
|
1,014,234
|
142,614
|
-
|
1,156,848
|
|
2012
Season
|
Argentina
|
Brazil
|
Bolivia
|
Paraguay
|
Total
|
|
Corn
|
153,889
|
72,387
|
21,563
|
-
|
247,839
|
|
Soybean
|
83,221
|
83,319
|
29,976
|
-
|
196,516
|
|
Wheat
|
17,637
|
-
|
988
|
-
|
18,625
|
|
Sorghum
|
3,360
|
-
|
4,431
|
-
|
7,791
|
|
Sunflower
|
13,210
|
-
|
1,293
|
-
|
14,503
|
|
Other
|
5,494
|
1,280
|
-
|
-
|
6,774
|
|
Total
Grains and Other
|
276,811
|
156,986
|
58,251
|
-
|
492,048
|
|
Sugarcane
|
-
|
576,030
|
18
|
-
|
576,048
|
Sales
Below is the total
volume of grains and sugarcane sold broken down into geographical
areas, measured in millions of tons:
|
Volume
of Sales
(3)
|
FY2016
|
FY2015
|
FY2014
|
FY2013
|
FY2012
|
||||||||||
|
D.M.
(1)
|
F.M.
(2)
|
Total
|
D.M.
(1)
|
F.M.
(2)
|
Total
|
D.M.
(1)
|
F.M.
(2)
|
Total
|
D.M.
(1)
|
F.M.
(2)
|
Total
|
D.M.
(1)
|
F.M.
(2)
|
Total
|
|
|
Corn
|
217.3
|
37.9
|
255.2
|
269.7
|
0.0
|
269.7
|
179.9
|
0.0
|
179.9
|
233.3
|
37.8
|
271.1
|
202.3
|
21.8
|
224.1
|
|
Soybean
|
182.5
|
15.8
|
198.3
|
172.9
|
77.2
|
250.1
|
188.9
|
33.2
|
222.1
|
153.4
|
55.4
|
208.8
|
228.6
|
23.0
|
251.6
|
|
Wheat
|
17.3
|
29.3
|
46.6
|
7.0
|
0.1
|
7.1
|
11.4
|
0.0
|
11.4
|
10.7
|
0.0
|
10.7
|
15.2
|
5.5
|
20.7
|
|
Sorghum
|
1.0
|
0.0
|
1.0
|
1.6
|
0.0
|
1.6
|
3.8
|
0.0
|
3.8
|
5.8
|
0.0
|
5.8
|
8.5
|
0.0
|
8.5
|
|
Sunflower
|
10.4
|
0.0
|
10.4
|
5.2
|
0.0
|
5.2
|
9.7
|
0.0
|
9.7
|
10.6
|
0.0
|
10.6
|
18.1
|
0.0
|
18.0
|
|
Other
|
5.9
|
0.0
|
5.9
|
1.9
|
0.0
|
1.9
|
6.2
|
0.3
|
6.5
|
14.0
|
0.1
|
14.1
|
12.0
|
0.0
|
12.0
|
|
Total
Grains
(tons)
|
434.4
|
83.0
|
517.4
|
458.3
|
77.3
|
535.6
|
399.9
|
33.5
|
433.4
|
427.8
|
93.3
|
521.1
|
484.2
|
503
|
534.5
|
|
Sugarcane
(tons)
|
1,219.7
|
0.0
|
1,219.7
|
924.5
|
-
|
924.5
|
675.7
|
-
|
675.7
|
1,179.9
|
-
|
1,179.9
|
636.3
|
-
|
636.3
|
|
Cattle
herd
|
8.3
|
0.0
|
8.3
|
8.9
|
0.0
|
8.9
|
8.8
|
0.0
|
8.8
|
9.6
|
0.0
|
9.6
|
15.0
|
-
|
15.0
|
|
Milking
cows
|
0.7
|
0.0
|
0.7
|
0.9
|
0.0
|
0.9
|
0.5
|
0.0
|
0.5
|
0.5
|
0.0
|
0.5
|
0.5
|
-
|
0.5
|
|
Beef-Cattle
(tons)
|
9.0
|
0.0
|
9.0
|
9.8
|
-
|
9.8
|
9.3
|
-
|
9.3
|
10.1
|
-
|
10.1
|
15.5
|
-
|
15.5
|
|
Milk
(in millions of liters)
|
15.5
|
0.0
|
15.5
|
16.9
|
-
|
16.9
|
18.8
|
-
|
18.8
|
17.9
|
-
|
17.9
|
16.3
|
-
|
16.3
|
(1) Domestic
Market.
(2) Foreign
Market.
(3) Includes
Brasilagro and CRESCA at 50%, Acres del Sud, Ombú, Yatay and
Yuchán. Does not include Agro-Uranga.
The following table
shows the sown surface area assigned to crop production, classified
into owned, under lease, under concession and leased to third
parties for the fiscal years indicated below, measured in
hectares:
|
|
2016
(1)(2)
|
2015
(1)(2)
|
2014
(1)(2)
|
2013
(1)(2)
|
2012
(1)(2)
|
|
Own
|
112,112
|
128,795
|
122,632
|
127,952
|
127,793
|
|
Under
lease
|
43,309
|
58,167
|
58,030
|
45,624
|
44,508
|
|
Under
concession
|
23,196
|
21,547
|
20,986
|
8,937
|
8,778
|
|
Leased to third
parties
|
2,365
|
3,267
|
7,616
|
18,223
|
23,595
|
|
Total
|
180,982
|
211,776
|
209,264
|
200,736
|
204,674
|
(1)
Sown land may
differ from that indicated under “Uses of Land”, since
some hectares are sown twice in the same season and therefore are
counted twice.
(2)
Includes CRESCA at
50%. Does not include Agro-Uranga.
|
Stock
|
2016
Season
|
2015
Season
|
2014
Season
|
YoY
var 2016/2015
|
YoY
var 2015/2014
|
|
Corn
|
21,233
|
61,157
|
17,604
|
(65.3%)
|
247.4%
|
|
Soybean
|
69,665
|
99,972
|
75,885
|
(30.3%)
|
31.74%
|
|
Sunflower
|
913
|
8,594
|
1,825
|
(89.4%)
|
370.9%
|
|
Sorghum
|
369
|
198
|
522
|
86.4%
|
(62.1%)
|
|
Wheat
|
4,964
|
9,377
|
681
|
(47.1%)
|
1,276.9%
|
|
Cotton
|
-
|
-
|
-
|
0.0%
|
0.0%
|
|
Sugarcane
|
-
|
-
|
-
|
0.0%
|
0.0%
|
|
Other
|
2,975
|
4,500
|
32,608
|
(33.9%)
|
(86.2%)
|
|
Total
|
100,119
|
183,798
|
129,125
|
(45.5%)
|
42.3%
|
50
We seek to
diversify our mix of products and the geographic location of our
farmlands to achieve an adequate balance between the two principal
risks associated with our activities: weather conditions and the
fluctuations in the prices of commodities. In order to reduce such
risks, we own and lease land in several areas of Argentina with
different climate conditions that allow us to sow a diversified
range of products. Our leased land for crops is mostly located in
the Pampas region, a favorable area for crop production. The leased
farms are previously studied by technicians who analyze future
production expectations based on the historic use of the land. The
initial duration of lease agreements is typically one or three
seasons. Leases of farms for production of crops generally consist
of lease agreements with payments based on a fixed amount of Pesos
per hectare or sharecropping agreements with payments in kind based
on a percentage of the crops obtained or a fixed amount of tons of
grains obtained or their equivalent value in Pesos. The principal
advantage of leasing farms is that leases do not require us to
commit large amounts of capital to the acquisition of lands but
allow us to increase our scale in the short term and reduce the
risk of inclement weather. The disadvantage of this strategy is
that the cost of leasing can increase over time, in part, because
increased demand for leased land increases the price of leased
land.
In order to
increase our production yields, we use, besides state-of-the-art
technology, labor control methods which imply the supervision of
the seeding’s quality (density, fertilization, distribution,
and depth), crop monitoring (determination of natural losses and
losses caused by harvester) and verification of bagged crop
quality. In this way, we work jointly with our suppliers to achieve
the best management of inputs, water and soil.
Wheat seeding takes
place from June to August, and harvesting takes place from December
to January. Corn, soybean and sunflower are sown from September to
December and are harvested from February to August. Grains are
available to be sold as commodities after the harvest from December
to June and we usually store part of our production until prices
recover after the drop that normally takes place during the
harvesting season. A major part of production, especially soybean,
wheat, corn and sorghum, is sold and delivered to buyers pursuant
to agreements in which price conditions are fixed by reference to
the market price at a specific time in the future that we
determine. The rest of the production is either sold at current
market prices or delivered to cover any futures contract that we
may have entered into.
Agro-Uranga
S.A.
We have a 35.72%
interest in Agro-Uranga S.A. (“Agro-Uranga”). This
company optimizes production processes and attains excellent
results, with special emphasis in soil conservation, the
application of rational techniques and care of the
environment.
At present, with
the assistance of its foreign trade team it is seeking to develop
new products so as to significantly increase export volumes,
encouraged by the world’s growing demand.
Lease
of Farmlands
We conduct our
business on owned and leased land. Rental payments increase our
production costs, as the amounts paid as rent are accounted for as
operating expenses. As a result, production costs per hectare of
leased land are higher than for the land owned by us.
Our land leasing
policy is designed to supplement our expansion strategy, using our
liquidity to make production investments in our principal
agricultural activities. On the other hand, our leasing strategy
provides us with an added level of flexibility in the share of each
of our products in total production, providing for greater
diversification.
The initial
duration of lease agreements is typically one crop season. Leases
of farms for production of crops consist in lease agreements with
payments based on a fixed amount of Pesos per hectare or
sharecropping agreements with payments in kind based on a
percentage of the crops obtained or a fixed amount of tons of
grains obtained or their equivalent value in Pesos. Leases of
farmlands for cattle breeding consist in lease agreements with
fixed payments based on a fixed amount of Pesos per hectare or
steer kilograms or capitalization agreements with payments in kind
or in cash based on the weight gain in kilograms.
During fiscal year
2016, we leased to third parties a total of 35 farmlands, covering
56,003 hectares, including 11,718 hectares in Brazil. Out of the
total leased area, 43,309 hectares were assigned to agricultural
production, including double crops, and 12,635 hectares to cattle
raising. The properties for agricultural production were leased,
primarily, for a fixed price prior to harvest and only a small
percentage consisted of sharecropping agreements.
The following table
shows a breakdown of the number of hectares of leased land used for
each of our principal production activities:
|
|
2016
|
2015
|
2014
|
2013
|
2012
|
|
Crops
(1)
|
43,309
|
58,167
|
58,030
|
45,624
|
44,508
|
|
Cattle
|
12,635
|
13,501
|
18,549
|
12,635
|
12,635
|
(1)
Includes
Brasilagro.
Due to the rise in
the price of land, we adopted a policy of not validating excessive
prices and applying strict criteria upon adopting the decision to
lease, selecting those lands with values that would ensure
appropriate margins.
51
Results
The following table
shows the Company’s results for fiscal year 2016, compared to
the two preceding fiscal years:
Crops
|
In
millions of Ps.
|
Fiscal
Year 2016
|
Fiscal
Year 2015
|
Fiscal
Year 2014
|
YoY
var
2016
vs. 2015
|
YoY
var
2015
vs. 2014
|
|
Revenues
|
1,152
|
987
|
837
|
16.8%
|
17.9%
|
|
Costs
|
(1,813)
|
(1,819)
|
(1,539)
|
(0.3%)
|
18.1%
|
|
Initial recognition
and changes in the fair value of biological assets and agricultural
products at the point of harvest
|
1,071
|
918
|
868
|
16.6%
|
5.8%
|
|
Changes in the net
realizable value of agricultural products after
harvest
|
208
|
(34)
|
(17)
|
-
|
100%
|
|
Gross
profit
|
618
|
52
|
149
|
1088.5%
|
(65.1%)
|
|
General and
administrative expenses
|
(174)
|
(159)
|
(147)
|
9.4%
|
8.2%
|
|
Selling
expenses
|
(216)
|
(161)
|
(115)
|
34.2%
|
40.0%
|
|
Other operating
results, net
|
(74)
|
(9)
|
(27)
|
722.2%
|
(66.6%)
|
|
Profit/(Loss)
from operations
|
154
|
(277)
|
(140)
|
-
|
-
|
|
Share of
profit/(loss) of associates and joint ventures
|
26
|
1
|
11
|
(2500.0%)
|
(90.9%)
|
|
Segment
Profit/(Loss)
|
180
|
(276)
|
(129)
|
-
|
-
|
Sugarcane
|
In
millions of Ps.
|
Fiscal
Year 2016
|
Fiscal
Year 2015
|
Fiscal
Year 2014
|
YoY
var
2016
vs. 2015
|
YoY
var
2015
vs. 2014
|
|
Revenues
|
294
|
198
|
124
|
48.5%
|
59.7%
|
|
Costs
|
(511)
|
(368)
|
(207)
|
38.8%
|
77.8%
|
|
Initial recognition
and changes in the fair value of biological assets and agricultural
products at the point of harvest
|
318
|
187
|
96
|
70.5%
|
94.8%
|
|
Gross
profit
|
101
|
17
|
13
|
494.1%
|
30.8%
|
|
General and
administrative expenses
|
(34)
|
(20)
|
(28)
|
70.0%
|
(28.6%)
|
|
Selling
expenses
|
(8)
|
(8)
|
(8)
|
-
|
-
|
|
Other operating
results, net
|
4
|
(2)
|
-
|
-
|
-
|
|
(Loss)/Profit
from operations
|
63
|
(13)
|
(23)
|
-
|
-
|
|
Segment
(Loss)/Profit
|
63
|
(13)
|
(23)
|
-
|
-
|
Cattle
Our cattle
production involves the breeding and fattening of our own animals.
In some cases, if market conditions are favorable, we also purchase
and fatten cattle which we sell to slaughterhouses and
supermarkets. As of June 2016, our cattle aggregated
69,873 heads, and we had a total surface area of 85,392 hectares of
own and leased lands devoted to this business
activity. In addition, we have leased to third parties
70 hectares assigned to these activities.
During the fiscal
year ended June 30, 2016, our production was 7,714 tons, a 1.2%
year-on-year decrease.
The following table
sets forth, for the fiscal years indicated below, the cattle
production volumes measured in tons:
|
|
2016
(1)
|
2015
(1)
|
2014
(1)
|
2013
(1)
|
2012
(1)
|
|
Cattle
production
|
7,714
|
7,812
|
6,970
|
7,723
|
8,936
|
(1)
Production measured
in tons of live weight. Production is the sum of the net
increases (or decreases) during a given period in live weight of
each head of cattle owned by us.
Our cattle breeding
activities are carried out with breeding cows and bulls and our
fattening activities apply to steer, heifers and calves. Breeding
cows calve approximately once a year and their productive lifespan
is from six to seven years. Six months after birth, calves are
weaned and transferred to fattening pastures. Acquired cattle are
directly submitted to the fattening process. Upon starting this
process, cattle have been grazing for approximately one year to one
and a half year in order to be fattened for sale. Steer and heifers
are sold when they have achieved a weight of 380–430 kg and
280–295 kg, respectively, depending on the
breed.
Pregnancy levels,
which have been improving over the years, showed satisfactory
levels of efficiency notwithstanding the adverse weather
conditions. Genetics and herd management are expected to further
improve pregnancy levels in the coming years. Reproductive
indicators improved thanks to the implementation of technologies,
which have included handling techniques and females artificial
insemination with cattle genetics especially selected for the stock
which is purchased from specialized companies in quality semen
elaboration for meat production. We use veterinarian products
manufactured by leading national and international laboratories. It
is important to emphasize the work of a veterinarian advising
committee, who are external to us and visit each establishment
monthly to control and agree tasks.
Currently, the
cattle raising farms are officially registered as export farmlands
pursuant to the identification and traceability rules in force in
Argentina. Animals are individually identified, thus allowing for
the development of special businesses in this area.
Our cattle stock is
organized into breeding and fattening activities. The following
table shows, for the fiscal years indicated, the number of head of
cattle for each activity:
|
|
2016
|
2015
|
2014
|
|
Breeding
stock
|
58,747
|
52,052
|
54,808
|
|
Winter grazing
stock
|
11,126
|
12,102
|
10,932
|
|
Total
Stock (heads)
|
69,873
|
64,154
|
65,740
|
We seek to improve
cattle production and quality in order to obtain a higher price
through advanced breeding techniques. We cross breed our stock of
Indicus, British (Angus and Hereford) and Continental breeds to
obtain herds with characteristics better suited to the pastures in
which they graze. To enhance the quality of our herds even further,
we plan to continue improving our pastures through permanent
investment in seeds and fertilizers, an increase in the watering
troughs available in pastures, and the acquisition of round bailers
to cut and roll grass for storage purposes.
Our emphasis on
improving the quality of our herd also includes the use of animal
health-related technologies. We comply with national animal health
standards that include laboratory analyses and vaccination aimed at
controlling and preventing disease in our herd, particularly
FMD.
Direct costs of
beef production consist primarily of crops for feeding and dietary
supplementation purposes, animal health and payroll costs, among
others.
52
Results
The following table
shows this segment’s results for fiscal year 2016, compared
to the two preceding fiscal years:
|
In
millions of Ps.
|
Fiscal
Year 2016
|
Fiscal
Year 2015
|
Fiscal
Year 2014
|
YoY
var
2016
vs. 2015
|
YoY
var
2015
vs. 2014
|
|
Revenues
|
178
|
143
|
90
|
24.5%
|
58.9%
|
|
Costs
|
(268)
|
(225)
|
(161)
|
19.1%
|
39.8%
|
|
Initial recognition
and changes in the fair value of biological assets and agricultural
products at the point of harvest
|
254
|
167
|
145
|
52.1%
|
15.2%
|
|
Changes in the net
realizable value of agricultural products after
harvest
|
-
|
-
|
-
|
-
|
-
|
|
Gross
Profit
|
164
|
85
|
74
|
92.9%
|
14.9%
|
|
General and
administrative expenses
|
(40)
|
(26)
|
(27)
|
53.8%
|
(3.7%)
|
|
Selling
expenses
|
(19)
|
(20)
|
(14)
|
(5.0%)
|
42.9%
|
|
Other operating
results, net
|
(2)
|
(3)
|
(2)
|
(33.3%)
|
50.0%
|
|
Profit/
(Loss) from operations
|
103
|
36
|
31
|
186.1%
|
16.1%
|
|
Segment
Profit / (Loss)
|
103
|
36
|
31
|
186.1%
|
16.1%
|
Dairy
As of June 30,
2016, we conducted our milk business in the dairy facility located
in “El Tigre” farm in the Province of La Pampa,
Argentina. We have a milking capacity of 1,788 cows per day and
seek to increase total productivity through the application of new
technologies including improved genetic management for milk
production, strategic feeding plans, based on cattle specific
requirements and the use of individual traceability to know the
productivity history of each animal. We also use computer science
applied to the milk business to make more efficient the manual
labor by surveying the information supplied by the
farm.
Within the process
of de-commoditization and technological innovation, we implemented
an identification and tracking system in compliance with European
and SENASA standards. We also obtained Global Gap and HCCP
certification. Our goal in this respect is to distinguish our
production and obtain higher prices in production
sales.
Our milk production
is based on a herd of Holando Argentina dairy cows, genetically
selected through the use of imported frozen semen of North American
Holando bulls. Male calves are sold, at calving, for a given amount
per head, whereas female calves are weaned after 24 hours, spend
approximately 60 days in raising and approximately 100 days being
fed on the basis of grass, grains and supplements. Young heifers
then graze for an additional 12 to 15 month period, prior to
artificial insemination at the age of 18 to 20 months and they
calve nine months later. Heifers are subsequently milked for an
average of 300 days. Milking dairy cows are once again inseminated
during the 60 to 90 day subsequent period. This process is repeated
once a year during six or seven years. The pregnancy rate for our
dairy cows is 80-90%.
Our dairy herd is
milked mechanically twice a day. The milk obtained is cooled to
less than five degrees centigrade to preserve quality and is then
stored in a tank for delivery once a day to trucks sent by buyers.
Dairy cows are fed mainly with grass, supplemented as needed with
grains, hay and silage. We have invested in certain technologies
that focus on genetic improvement, animal health and feeding in
order to improve our milk production. These investments include
imports of top quality frozen semen from genetically improved North
American Holstein bulls, agricultural machinery and devices such as
feed-mixer trucks, use of dietary supplements and the installation
of modern equipment to control milk cooling. We are currently
acquiring dietary supplements for our dairy cows and have made
investments with the aim of increasing the quantity and quality of
forage (pasture, alfalfa and corn silage) in order to reduce
feeding costs.
The following table
sets forth, for the periods indicated, the average number of our
dairy cows and average daily production per cow:
|
|
2016
|
2015
|
2014
|
|
Average dairy cows
per day (heads)
|
1,788
|
2,189
|
2,439
|
|
Milk
Production/Dairy Cow/Day (liters)
|
23.81
|
21.48
|
19.69
|
At the closing of
fiscal year 2016, we had 5,047 heads of cattle on 2,231 hectares
involved in the production of milk; whereas as of June 30, 2015, we
had 5,658 heads of cattle on 2,864 hectares.
Results
The following table
shows this segment’s results for fiscal year 2016, compared
to the two preceding fiscal years:
|
In
millions of Ps.
|
Fiscal
Year 2016
|
Fiscal
Year 2015
|
Fiscal
Year 2014
|
YoY
var
2016
vs. 2015
|
YoY
var
2015
vs. 2014
|
|
Revenues
|
65
|
72
|
54
|
(9.7%)
|
33.3%
|
|
Costs
|
(135)
|
(133)
|
(104)
|
1.5%
|
27.9%
|
|
Initial recognition
and changes in the fair value of biological assets and agricultural
products at the point of harvest
|
74
|
75
|
63
|
(1.3%)
|
19.0%
|
|
Gross
Profit
|
4
|
14
|
13
|
(71.4%)
|
7.7%
|
|
General and
administrative expenses
|
(8)
|
(5)
|
(6)
|
60.0%
|
(16.7%)
|
|
Selling
expenses
|
(4)
|
(4)
|
(2)
|
-
|
-
|
|
Other operating
results, net
|
-
|
(1)
|
-
|
-
|
-
|
|
Profit
/ (Loss) from operations
|
(8)
|
4
|
5
|
-
|
-
|
|
Segment
Profit / (Loss)
|
(8)
|
4
|
5
|
-
|
-
|
Agro-industrial
Activities
This segment
consists in the slaughtering and processing of beef in meat packing
plants.
Through our
subsidiary Sociedad Anónima Carnes Pampeanas S.A.
(“Carnes Pampeanas”) we own a meat packing plant in
Santa Rosa, Province of La Pampa, with capacity to slaughter and
process approximately 9,600 cattle heads per month.
During the last
years, the smaller supply of cattle has adversely affected the
value chain by reducing cold-storage plant utilization. This has
left several plants struggling to remain operational in view of the
poor returns and shortage of raw materials. Our investment in
Carnes Pampeanas has not escaped unscathed of this
situation.
During fiscal year
2016, this segment recorded a net loss of Ps. 63.0 million
compared to a net loss of Ps. 35.0 million in the previous
fiscal year. Although the business was favored by the new
government policies consisting in raising the exchange rate and
lowering withholding taxes on beef exports, the positive impact of
these measures was offset by a deterioration in the input/product
ratios, explained by the fact that livestock prices and labor costs
significantly outpaced the rise in beef prices for domestic
consumption and in the international markets, as well as the prices
of leather, this business’ main by-product.
53
Results
The following table
shows this segment’s results for fiscal year 2016, compared
to the two preceding fiscal years:
|
In
millions of Ps.
|
Fiscal
Year 2016
|
Fiscal
Year 2015
|
Fiscal
Year 2014
|
YoY
var
2016
vs. 2015
|
YoY
var
2015
vs. 2014
|
|
Revenues
|
966
|
806
|
554
|
19.8%
|
45.4%
|
|
Costs
|
(925)
|
(739)
|
(480)
|
25.2%
|
54.0%
|
|
Gross
profit
|
41
|
67
|
74
|
(38.8%)
|
(9.5%)
|
|
General and
administrative expenses
|
(38)
|
(25)
|
(17)
|
52.0%
|
47.1%
|
|
Selling
expenses
|
(67)
|
(77)
|
(55)
|
(13.0%)
|
40.0%
|
|
Other operating
results, net
|
1
|
-
|
(1)
|
-
|
100.0%
|
|
(Loss)/Profit
from operations
|
(63)
|
(35)
|
1
|
80.0%
|
3,600%
|
|
Segment
(Loss)/Profit
|
(63)
|
(35)
|
1
|
80.0%
|
3,600%
|
Leases
andAgricultural Services
We lease own farms
to third parties for agriculture, cattle breeding and seed
production, mainly in two types of farms. On the one hand, we lease
our farms under irrigation in San Luis (Santa Bárbara and La
Gramilla) to seed producers. These farms are ideal for obtaining
steady production levels, given the quality of their soil and the
weather conditions of the area, along with the even humidity
provided by irrigation.
On the other hand,
we lease farms recently put into production after agricultural
development. In this way we manage to reduce our production risk,
ensuring fixed rental income until the new farms reach stable
productivity levels.
In addition, in
this segment we include the irrigation service we provide to our
own farms leased to third parties.
Results
The following table
shows this segment’s results for fiscal year 2016, compared
to the two preceding fiscal years:
|
In
millions of Ps.
|
Fiscal
Year 2016
|
Fiscal
Year 2015
|
Fiscal
Year 2014
|
YoY
var
2016
vs. 2015
|
YoY
var
2015
vs. 2014
|
|
Revenues
|
78
|
61
|
29
|
27.9%
|
110.3%
|
|
Costs
|
(20)
|
(21)
|
(17)
|
4.8%
|
23.5%
|
|
Gross
Profit
|
58
|
40
|
12
|
45.0%
|
233.4%
|
|
General and
administrative expenses
|
(4)
|
(2)
|
(4)
|
100%
|
(100.0%)
|
|
Selling
expenses
|
(1)
|
(1)
|
(1)
|
-
|
-
|
|
Other operating
results, net
|
-
|
-
|
-
|
-
|
-
|
|
Profit
from operations
|
53
|
37
|
7
|
43.2%
|
428.6%
|
|
Segment
Profit
|
53
|
37
|
7
|
43.2%
|
428.6%
|
Other
This segment
includes part of our business through Futuros y Opciones (FyO), as
grain trading is reflected in the Grains segment.
Futuros
y Opciones.Com S.A. (FyO)
Futuros y
Opciones.com’s main business is grain trading (grain
brokerage, storage, futures and options, consulting and logistics
services) and sale and distribution of own inputs and third-party
products.
During this fiscal
year FyO sold its website to Agrofy S.A., a company in which Cresud
holds an equity interest.
As concerns the
Grains business, revenues grew thanks to the increase in traded
volumes as compared to the previous fiscal year, the effect of the
devaluation and strong growth in trading revenues. The inputs
business started to recover, and invoicing increased 6% as compared
to the previous fiscal year.
During this fiscal
year, financial income increased as compared to the previous year
as a result of the investments made in mutual investment funds,
LEBACS and government securities.
FyO continues to
invest in systems for the inputs and grains
businesses.
Concerning the
goals for next year, the Grains business is expected to keep
growing at the same pace as in the past years, aspiring to lead the
grain trading business and to consolidate storage operations. As
concerns inputs, FyO’s goals include consolidating its suite
of products, increasing sales and improving margins. Other
objectives include becoming a leading company in the knowledge of
the grains markets, offering all businesses and services related to
grain trading, and being digital innovators.
Results
The following table
shows this segment’s results for fiscal year 2016, compared
to the two preceding fiscal years:
|
In
millions of Ps.
|
Fiscal
Year 2016
|
Fiscal
Year 2015
|
Fiscal
Year 2014
|
YoY
var
2016
vs. 2015
|
YoY
var
2015
vs. 2014
|
|
Revenues
|
179
|
128
|
125
|
39.8%
|
2.4%
|
|
Costs
|
(140)
|
(105)
|
(101)
|
33.3%
|
3.9%
|
|
Initial recognition
and changes in the fair value of biological assets and agricultural
products at the point of harvest
|
-
|
-
|
-
|
-
|
-
|
|
Gross
Profit
|
39
|
23
|
24
|
69.6%
|
(4.2%)
|
|
General and
administrative expenses
|
(15)
|
(8)
|
(11)
|
87.5%
|
(27.3%)
|
|
Selling
expenses
|
(23)
|
(13)
|
(11)
|
76.9%
|
18.2%
|
|
Other operating
results, net
|
1
|
1
|
1
|
-
|
-
|
|
Profit
from operations
|
2
|
3
|
3
|
33.3%
|
-
|
|
Share of
Profit/(loss) of associates and joint ventures
|
(3)
|
-
|
-
|
-
|
-
|
|
Segment
Profit
|
(1)
|
3
|
3
|
-
|
-
|
54
1
Note that the
shareholders’ agreement was originally signed between Dolphin
and ETH MBA Extra Holdings. On April 2014, Dolphin and CAA Extra
Holding received the rights to become holders of the
shares.
2
Includes the
acquisition of investment properties, the acquisition of property,
plant and equipment and suppliers advances for acquisition of
property, plant and equipment for Ps. 2,040 million according to
the Statement of cash flows, and non-cash transactions for Ps. 418
million as described in Note 20 - Cash flow information, of the
Consolidated Financial Statements as of June 30, 2016.
3
Includes the
acquisition of investment properties, the acquisition of property,
plant and equipment and suppliers advances for acquisition of
property, plant and equipment for Ps. 486 million according to the
Statement of cash flows, and non-cash transactions for Ps. 2
million as described in Note 21 - Cash flow information, of the
Consolidated Financial Statements as of June 30, 2015.
4
Includes the
acquisition of investment properties, the acquisition of property,
plant and equipment and suppliers advances for acquisition of
property, plant and equipment for Ps. 435 million according to the
Statement of cash flows, non-cash transactions for Ps. 1 million as
described in Note 21 - Cash flow information of the Consolidated
Financial Statements as of June 30, 2014.
55
Farmland
Portfolio
As of June 30,
2016, we owned, together with our subsidiaries, 27 farms, with a
total surface area of 622,217 hectares.
The following table
sets forth our farm portfolio as of June 30, 2016:
|
Use
of Farmlands Owned and under Concession as of June 30,
2016
|
||||||||||
|
|
Locality
|
Province
|
Date
of
|
Surface
Area
|
Main
Business
|
Cattle
|
Sheep
|
Dairy
|
Agriculture
|
Cattle
|
|
|
|
|
Acquisition
|
(has)
|
|
(has)
|
(has)
|
(has)
|
(has)
|
(head)
|
|
El
Recreo
|
Recreo
|
Catamarca
|
May 95
|
12,395
|
Natural
woodlands
|
|
|
|
|
|
|
Los
Pozos
|
JV
González
|
Salta
|
May
’95
|
239,639
|
Cattle/
Agriculture/ Natural woodlands
|
44,010
|
|
|
13,938
|
44,914
|
|
San Nicolás
(1)
|
Rosario
|
Santa
Fe
|
May
‘97
|
1,431
|
Agriculture
|
|
|
|
1,409
|
|
|
Las Playas
(1)
|
Idiazabal
|
Córdoba
|
May
‘97
|
1,534
|
Agriculture/
Dairy
|
|
|
|
1,534
|
|
|
La Gramilla/ Santa
Bárbara
|
Merlo
|
San
Luis
|
Nov
‘97
|
7,072
|
Agriculture Under
irrigation
|
|
|
|
4,294
|
|
|
La
Suiza
|
Villa
Angela
|
Chaco
|
Jun
‘98
|
36,380
|
Agriculture/
Cattle
|
26,700
|
|
|
3,414
|
15,300
|
|
La
Esmeralda
|
Ceres
|
Santa
Fe
|
Jun
‘98
|
9,370
|
Agriculture/
Cattle
|
|
|
|
7,885
|
|
|
El
Tigre
|
Trenel
|
La
Pampa
|
Apr
‘03
|
8,360
|
Agriculture/
Dairy
|
|
|
2,231
|
5,239
|
5,047
|
|
El
Invierno
(4)
|
Rancul
|
La
Pampa
|
Jun
‘05
|
1,946
|
Agriculture
|
|
|
|
1,839
|
|
|
San
Pedro
|
Concepción de
Uruguay
|
Entre
Rios
|
Sep
‘05
|
6,022
|
Agriculture
|
|
|
|
4,083
|
|
|
8 De Julio/
Estancia Carmen
|
Puerto
Deseado
|
Santa
Cruz
|
May ‘07/ Sep
‘08
|
100,911
|
Sheep
|
|
85,000
|
|
|
|
|
Cactus
Argentina
|
Villa
Mercedes
|
San
Luis
|
Dec
‘97
|
171
|
Natural
woodlands
|
171
|
|
|
|
|
|
Las
Vertientes
|
Las
Vertientes
|
Cordoba
|
-
|
4
|
Silo
|
|
|
|
|
|
|
La
Esperanza
(4)
|
Rancul
|
La
Pampa
|
Mar
‘08
|
980
|
Agriculture
|
|
|
|
402
|
|
|
Las
Londras
|
Santa
Cruz
|
Bolivia
|
Nov
‘08
|
4,566
|
Agriculture
|
|
|
|
3,736
|
|
|
San
Rafael
|
Santa
Cruz
|
Bolivia
|
Nov
‘08
|
2,969
|
Agriculture
|
|
|
|
2,269
|
|
|
La
Primavera
|
Santa
Cruz
|
Bolivia
|
Jun
‘11
|
2,340
|
Agriculture
|
|
|
|
636
|
|
|
Cuatro
Vientos
|
Santa
Cruz
|
Bolivia
|
Jun
‘11
|
2,658
|
Agriculture
|
|
|
|
1,844
|
|
|
Jeroviá/Marangatú/Udra
(2)
|
Mariscal
Estigarribia
|
Paraguay
|
Feb
‘09
|
58,754
|
Agriculture/
Natural woodlands
|
1,126
|
|
|
5,870
|
|
|
Finca
Mendoza
|
Lujan de
Cuyo
|
Mendoza
|
Mar
‘11
|
389
|
Natural
woodlands
|
|
|
|
|
|
|
Establecimiento
Mendoza
|
Finca
Lavalle
|
Mendoza
|
Nov’03
|
9
|
Natural
woodlands
|
|
|
|
|
|
|
Jatoba
|
Jaborandi/BA
|
Brazil
|
Oct
‘06
|
31,606
|
Agriculture
|
|
|
|
12,510
|
|
|
Alto
Taquari
|
Alto
Taquari/MT
|
Brazil
|
Aug
‘07
|
5,395
|
Agriculture
|
|
|
|
3,190
|
|
|
Araucaria
|
Mineiros/GO
|
Brazil
|
Mar
‘07
|
8,124
|
Agriculture
|
|
|
|
4,020
|
|
|
Chaparral
|
Correntina/BA
|
Brazil
|
Nov
‘07
|
37,182
|
Agriculture
|
|
|
|
14,398
|
|
|
Nova
Buruti
|
Januária/MG
|
Brazil
|
Dec
‘07
|
24,211
|
Forestry
|
|
|
|
|
|
|
Preferencia
|
Barreiras/BA
|
Brazil
|
Sep
‘08
|
17,799
|
Cattle
|
|
|
|
6,566
|
|
|
Subtotal
Own Farms
|
|
|
|
622,217
|
|
72,007
|
85,000
|
2,231
|
99,076
|
65,261
|
|
Agropecuaria Anta
SA
(3)
|
Las
Lajitas
|
Salta
|
|
132,000
|
|
820
|
|
|
23,547
|
2,460
|
|
Subtotal
Farms under Concession
|
|
|
|
132,000
|
|
820
|
|
|
23,547
|
2,460
|
|
Total
|
|
|
|
754,217
|
|
72,827
|
85,000
|
2,231
|
122,623
|
67,721
|
|
|
|
|
|
|
|
|
|
|
|
|
(1) Hectares
in proportion to our 35.72% interest in Agro-Uranga
S.A.
(2)
Hectares in
proportion to our 50.0% interest in CRESCA through
Brasilagro.
(3) Hectares
in concession. They include 2,000 hectares operated by third
parties.
(4) On
July 2016, we sold these farmlands.
56
Additional information about our Farmlands
Argentina
El Recreo
“El
Recreo” farm, located 970 kilometers northwest of Buenos
Aires, in the Province of Catamarca, was acquired in May 1995. It
has semi-arid climate and annual rainfall not in excess of 400 mm.
This farm is maintained as a productive reserve.
Los Pozos
The “Los
Pozos” farm, located 1,600 kilometers northwest of Buenos
Aires, in the Province of Salta, was acquired in May 1995. This
property is located in a semi-arid area with average annual
rainfall of 500 mm. The area is naturally suited to cattle raising
and forestry activities (poles and fence posts), and it has
agricultural potential for summer crops such as sorghum and corn,
among others. For the fiscal year ended June 30, 2016, we used
13,938 hectares in agricultural production. As of June 30, 2016,
there were 41,914 heads of cattle in this farm.
San Nicolás
“San
Nicolás” is a 4,005 hectares farm owned by Agro-Uranga
S.A., and is located in the Province of Santa Fe, approximately 45
kilometers from the Port of Rosario. As of June 30, 2016, 5,918
hectares were planted for agricultural production, including double
crops. The farm has two plants of silos with a storage capacity of
14,950 tons.
Las Playas
The “Las
Playas” farm has a surface area of 4,294 hectares and is
owned by Agro-Uranga S.A. It is located in the Province of
Córdoba, and it is used for agricultural purposes. As of June
30, 2016, the farm had a sown surface area, including double crops,
of 7,079 hectares for grain production.
La Gramilla and Santa Bárbara
These farms have a
surface area of 7,072 hectares in Valle de Conlara, in the Province
of San Luis. Unlike other areas in the Province of San Luis, this
valley has a high quality underground aquifer which makes these
farms well suited for agricultural production after investments
were made in the development of lands, wells and irrigation
equipment. In the course of the 2015/2016 farm season, a total of
4,294 hectares were sown, 513 hectares of which were sown under
contractual arrangements with seed producers. We leased, in turn,
1,259 hectares to third parties. The remaining hectares are kept as
land reserves.
La Suiza
The “La
Suiza” farm has a surface area of 36,380 hectares and is
located in Villa Ángela in the Province of Chaco. It is used
for raising cattle. As of June 30, 2016, “La Suiza” had
a stock of approximately 15,300 heads of cattle. During the 2015/16
season, we used 3,414 hectares for agricultural production and 200
hectares for timber production.
La Esmeralda
The “La
Esmeralda” farm has a surface area of 9,370 hectares and is
located in Ceres in the Province of Santa Fe. This farm was
acquired in June 1998. During the 2015/16 farm season, we used
7,885 hectares for production of corn, soybean, wheat, sunflower
and sorghum.
El Tigre
The “El
Tigre” farm was acquired on April 30, 2003 and has a surface
area of 8,360 hectares. This farm has a high-tech dairy facility
where we develop our milk production business in compliance with
the highest quality standards. It is located in Trenel in the
Province of La Pampa. As of June 30, 2016, 5,239 hectares were
assigned to crop production, including double crops, and 2,231
hectares were assigned to milk production. This farm produced 16.2
million liters of milk in the fiscal year ended June 30, 2016, with
an average of 1,838 cows being milked and an average daily
production of 24.16 liters per cow.
El Invierno
The “El
Invierno” farm was acquired on June 24, 2005 and has a
surface area of 1,946 hectares. It is located in Rancul
in the Province of La Pampa, 621 kilometers to the west of Buenos
Aires. During the fiscal year ended June 30, 2016, we used the land
exclusively for crop production and planted 1,839 hectares. On July
5, 2016, we sold the farmlands “El Invierno” and
“La Esperanza”. The total amount of the transaction was
fixed at US$ 6.0 million (equivalent to Ps. 90.1 million). This
transaction included 2,615 hectares of land suitable for
agricultural production.
San Pedro
The
“San Pedro” farm was purchased on September 1, 2005. It
has a surface area of 6,022 hectares and is located in
Concepción del Uruguay, Province of Entre Ríos, which is
305 kilometers north of Buenos Aires. In the course of the
2015/2016 farm season, 4,083 hectares were used for agricultural
production, including double crops.
8 de Julio and Estancia Carmen
The “8 de
Julio” farm was acquired on May 15, 2007 and has a surface
area of 90,000 hectares. It is located in the department of Deseado
in the Province of Santa Cruz. Due to its large surface area, this
farm offers excellent potential for sheep production. In addition,
we believe the land has potential for future tourism and
recreational activities, as the southeast border of the farm
stretches over 20 kilometers of coast. "Estancia Carmen" was
acquired on September 5, 2008 and has a surface area of 10,911
hectares. It is located in the Province of Santa Cruz, next to our
"8 de Julio" farm.
57
Cactus
The feedlot has a
surface area of 171 hectares. It is located in Villa Mercedes,
Province of San Luis. Given its degree of urban development and
closeness to the city, we decided to discontinue fattening
activities in this facility.
Las Vertientes
The “Las
Vertientes” storage facility has a surface area of 4 hectares
and 10,000 tons capacity, and is located in Las Vertientes,
Río Cuarto, in the Province of Córdoba.
La Esperanza
In 2008 we acquired
“La Esperanza” farm located in the Province of La Pampa
with a surface area of 980 hectares. The transaction was agreed for
a price of US$ 1.3 million that has been paid in full. During
the year ended June 30, 2015, we used this farm solely for crop
production. On July 5, 2016, we sold the farmlands “El
Invierno” and “La Esperanza”. The total amount of
the transaction was fixed at US$ 6.0 million (equivalent to Ps.
90.1 million). This transaction included 2,615 hectares of land
suitable for agricultural production.
Finca Mendoza
On March 2, 2011,
the Company purchased, jointly with Zander Express S.A., a rural
property composed of thirteen plots of land located in the District
of Perdriel, Luján de Cuyo Department, in the Province of
Mendoza. As a result of this acquisition, CRESUD has become owner
of a 40% undivided estate in all and each of the properties, while
Zander Express S.A. holds the remaining 60%. The total agreed price
for this transaction was US$ 4.0 million; therefore, the
amount of US$ 1.6 million was payable by CRESUD.
Bolivia
Las Londras
On January 22,
2009, the bill of purchase for "Las Londras" farm was cast into
public deed; it has a surface area of 4,566 hectares, and is
located in the Province of Guarayos, Republic of Bolivia. During
the 2015/2016 farm season it was used for crop
production.
San Rafael
On November 19,
2008, the bill of purchase for "San Rafael" farm was cast into
public deed. This farm is located in the Province of Guarayos,
Republic of Bolivia, and has a surface area of 2,969 hectares,
which were used for crop production during the 2015/2016 farm
season.
Cuatro Vientos
On June 3, 2011, we
executed the purchase agreement for the “Cuatro
Vientos” farm, with a surface area of approximately 2,658
hectares, allocated to sugarcane production. Its purchase price was
US$ 8.4 million.
La Primavera
On June 7, 2011 we
acquired “La Primavera” farm, with a surface area of
approximately 2,340 hectares. During the 2015/2016 season, this
farm was used for crop production.
Brazil
(through our subsidiary Brasilagro)
Jatobá
Jatobá is a
farm in the northeastern region of Brazil, with a total surface
area of 31,606 hectares, 12,510 of which are intended for
agriculture. Jatobá was acquired in March 2007 for BRL 33
million. We consider that this farm is in a very advantageous
location for the movement of crops, as it is close to the Candeias
Port, in the State of Bahia.
Araucária
Araucária is a
farm located in the municipal district of Mineiros, in the State of
Goiás, and it has a total surface area of 8,124 hectares,
4,020 of which are used for agriculture. Araucaria was acquired in
2007 for BRL 70.4 million. Before we purchased it,
Araucária had been used for grain planting. The farm was
transformed, and at present it is planted with
sugarcane.
Alto Taquarí
Alto Taquarí
is located in the municipal district of Alto Taquarí, State of
Mato Grosso, and it has a total surface area of 5,395 hectares,
3,190 of which are used for agriculture. The farm was acquired in
August 2007 for BRL 33.2 million. Before we purchased it, the farm
had been used for agriculture and Cattle raising. Following its
transformation, it is being used for sugarcane
production.
Chaparral
Chaparral is a
37,182hectare farm, with 14,398 hectares used for agriculture. It
is located in the municipal district of Correntina, State of Bahia.
The farm was acquired in November 2007 for BRL 47.9
million.
Nova Buriti
Located in the
municipal district of Januária, State of Minas Gerais, Nova
Buriti has a surface area of 24,211 hectares. Nova Buriti was
acquired in December 2007 for BRL 21.6 million. It is located
in the southeastern region of Brazil and it is close to the large
iron industries. At present, it is undergoing proceedings for
obtaining the environmental licenses required for starting
operations.
58
Preferencia
Preferencia is
located in the municipal district of Barreiras, in the State of
Bahia. It has a total surface area of 17,799 hectares, 6,566 of
which are used for cattle activities. It was acquired for R$ 9.6
million in September 2008. The farm is being transformed into a
pasturing area and will be later developed for agricultural
purposes.
Paraguay
(through our subsidiary Brasilagro)
Jeroviá / Marangatú /Udra
Cresud, through
Brasilagro, who is in turn shareholder of CRESCA, holds a 50%
undivided interest in the “Jeroviá”,
“Marangatú” and “UDRA” farms and
related undeveloped plots of land, all of them located in Mariscal
José Félix Estigarribia, Department of Boquerón,
Paraguayan Chaco, Republic of Paraguay, totaling 117,508
hectares.
Silos
As of June 30,
2016, we had a storage capacity of approximately 25,620 tons
(including 35.723% of the storage capacity of over 14,950 tons
available at Agro-Uranga S.A.).
The following table
shows, for the fiscal years presented, our storage
facilities:
|
|
As
of year ended June 30,
|
||||
|
|
2016
(2)
|
2015
(2)
|
2014
(2)
|
2013
(2)
|
2012
(2)
|
|
Las Vertientes
(1)
|
10,000
|
10,000
|
10,000
|
10,000
|
10,000
|
|
San Nicolás
(1)
|
5,341
|
5,341
|
5,341
|
5,341
|
5,341
|
|
Brasilagro
|
10,279
|
10,279
|
90,200
|
90,200
|
90,200
|
|
Total
|
25,620
|
25,620
|
105,541
|
105,541
|
105,541
|
(1)
Owned by us through
Agro-Uranga (which represents 35.723% of the total
capacity).
(2)
Includes
Brasilagro.
Land
Management
In contrast to
traditional Argentine farms, run by families, we centralize policy
making in an Executive Committee that meets on a weekly basis in
Buenos Aires. Individual farm management is delegated to farm
managers who are responsible for farm operations. The Executive
Committee lays down commercial and production rules based on sales,
market expectations and risk allocation.
We rotate the use
of our pasture lands between agricultural production and cattle
feeding and the frequency depends on the location and
characteristics of the farmland. The use of preservation techniques
(including exploitation by no till sowing) frequently allows us to
improve farm performance.
Subsequent to the
acquisition of the properties, we make investments in technology in
order to improve productivity and increase the value of the
property. It may be the case that upon acquisition, a given
extension of the property is under-utilized or the infrastructure
may be in need of improvement. We have invested in traditional
fencing and in electrical fencing, watering troughs for cattle
herds, irrigation equipment and machinery, among other
things.
Principal
Markets
Crops
Our crop production
is mostly sold in the domestic market. The prices of our grains are
based on the market prices quoted in Argentine grains exchanges
such as the Buenos Aires Grains Exchange (Bolsa de Cereales de
Buenos Aires) and the cereal exchanges in each country, that take
as reference the prices in international grains markets. The
largest part of this production is sold to exporters who offer and
ship this production to the international market. Prices are quoted
in relation to the month of delivery and the port in which the
product is to be delivered. Different conditions in price, such as
terms of storage and shipment, are negotiated between the end buyer
and ourselves.
Cattle
Our beef cattle
production is sold in the local market. The main buyers are
slaughterhouses and supermarkets.
Prices in the beef
cattle market in Argentina are basically fixed by local supply and
demand. The Liniers Market (on the outskirts of the City of Buenos
Aires) provides a standard in price formation for the rest of the
domestic market. In this market live animals are sold by auction on
a daily basis. At Liniers Market, prices are negotiated by kilogram
of live weight and are mainly determined by local supply and
demand. Prices tend to be lower than in industrialized countries.
Some supermarkets and meat packers establish their prices by
kilogram of processed meat; in these cases, the final price is
influenced by processing yields.
Dairy
During fiscal year
2016 we sold our entire milk production to the largest Argentine
dairy company, Mastellone S.A., which in turn manufactures a range
of mass consumption dairy products sold in Argentina and abroad.
The price of the milk we sell is mainly based on the percentage of
fat and protein that it contains and the temperature at which it is
cooled. The price we obtain from our milk also rises or drops based
on the content of bacteria and somatic cells.
59
Customers
For the fiscal year
2016 our sales from the agribusiness segment (excluding sales of
farms) were made to approximately 850 customers. Sales to our ten
largest customers represented approximately 70% to 75% of our net
sales. Of these customers, our biggest three customers were Bunge
Argentina S. A., Cargill S.A.C.I. and Vicentin S.A.I.C. We have
signed non-binding letters of intent with some of our largest
customers that allow us to estimate the volume of the demand for
certain products and to plan production accordingly. We generally
enter into short-term agreements with a term of less than a
year.
Marketing
Channels and Sales Methods
Crops
We normally work
with grains brokers and other intermediaries to trade in the
exchanges. We sell part of our production in advance through
futures contracts and buy and sell options to hedge against a drop
in prices. Approximately 87% of the futures and options contracts
are closed through the Buenos Aires Grains Exchange and 13% in the
Chicago Board of Trade for hedging purposes.
Our storage
capabilities allow us to condition and store grains with no
third-party involvement and thus to capitalize the fluctuations in
the price of commodities. Our largest storage facilities in
Argentina, with capacity for 10,000 tons, are located in “Las
Vertientes”, close to Río Cuarto, Province of
Córdoba. In addition, we store grains in silo
bags.
Cattle
We have several
marketing channels. We sell directly to local meat processors and
supermarkets, as well as in markets and auctions. Our customers
include Arre Beef S.A., Frigorífico Bermejo, Quickfood S.A.,
Frigorífico Forres Beltrán S.A., Madelán S.A.,
Colombo y Colombo S.A., Iván O’Farrell S.R.L. and
Colombo y Magliano S.A., for prices based on the price at Liniers
Market.
We usually are
responsible for the costs of the freight to the market and, in
general, we pay commissions on our transactions.
Inputs
The current direct
cost of our production of grains varies in relation to each crop
and normally includes the following costs: tillage, seeds,
agrochemicals and fertilizers. We buy in bulk and store seeds,
agrochemicals and fertilizers to benefit from discounts offered
during off-season sales.
Competition
The agricultural
and livestock sector is highly competitive, with a huge number of
producers. We are one of the leading producers in Argentina and the
region. However, if we compare the percentage of our production to
the country’s total figures, our production would appear as
extremely low, since the agricultural market is highly atomized.
Our leading position improves our bargaining power with suppliers
and customers. In general, we obtain discounts in the region in the
acquisition of raw materials and an excess price in our
sales.
Historically, there
have been few companies competing for the acquisition and leases of
farmlands for the purpose of benefiting from land appreciation and
optimization of yields in the different commercial activities.
However, we anticipate the possibility that new companies, some of
them international, may become active players in the acquisition of
farmlands and the leases of sown land, which would add players to
the market in coming years.
Seasonality
As is the case with
any company in the agro-industrial sector, our business activities
are inherently seasonal. Harvest and sales of corn and soybean in
general take place from March to September. Sunflower is harvested
from December to May. Wheat is harvested from October to January.
Peanut is harvested from April to July. With respect to our
international market, in Bolivia climate conditions allow a double
season of soybean, corn and sorghum production and, accordingly,
these crops are harvested in March and October, while wheat and
sunflower are harvested between August and September. In Brasil,
our crops are harvested from March to May and our sugarcane is
harvested from April to November. Other segments of our activities,
such as our sales of cattle and milk and our forestry activities
tend to be more of a successive character than of a seasonal
character. However, the production of beef and milk is generally
higher during the second quarter, when pasture conditions are more
favorable. In consequence, there may be significant variations in
results from one quarter to the other.
Regulation
and Governmental Supervision of our Agricultural
Business
Farming and Animal Husbandry Agreements
Agreements relating
to farming and animal husbandry activities are regulated by
Argentine law, the Argentine Civil and Commercial Code and local
customs.
According to Law
No. 13,246, as amended by Law No. 22,298, all lease agreements
related to rural properties and land are required to have a minimum
duration of 3 years. Upon death of the tenant farmer, the agreement
may continue with his successors. Upon misuse of the land by the
tenant farmer or default on payment of the rent, the land owner may
initiate an eviction proceeding.
Law No. 13,246,
amended by Law No. 22,298, also regulates agreements for crop
sharing pursuant to which one of the parties furnishes the other
with farmland animals or land with the purpose to share benefits
between tenant farmer and land owner. These agreements are required
to have a minimum term of duration of 3 years. The tenant farmer
must perform the obligations under the agreement himself and may
not, assign it under any circumstances. Upon death, incapacity of
the tenant farmer or other impossibility, the agreement may be
terminated.
60
Quality control of Crops and Cattle
The quality of the
crops and the health measures applied on the cattle are regulated
and controlled by the
Servicio
Nacional de Sanidad y Calidad Agroalimentaria
(“SENASA”)
, which is an entity within the
Ministry of Economy and Public Finance that over sees the farming
and animal sanitary activities.
Argentine law
establishes that the brands should be registered with each
provincial registry and that there cannot be brands alike within
the same province.
Sale and Transportation of Cattle
Even though the
sale of cattle is not specifically regulated, general contract
provisions are applicable. Further, every province has its own
rural code regulating the sale of cattle.
Argentine law
establishes that the transportation of cattle is lawful only when
it is done with the respective certificate that specifies the
relevant information about the cattle. The required information for
the certificate is established by the different provincial
regulations, the inter-provinces treaties and the regulations
issued by the
SENASA
.
Export Restriction of Beef
In addition, the
Secretary of Agriculture, Livestock, Fishing and Food Products,
within the orbit of the Ministry of Economy and Public Finance,
oversees the farming and animal sanitary activities.
The Secretary of
Agriculture, Livestock, Fishing and Food Products is in charge of
distributing the annual regular quota of top quality chilled beef
without bones, the “
Cuota
Hilton
.” The destination of the
Cuota Hilton
is the European
Union.
The Secretary of
Agriculture, Livestock, Fishing and Food Products granted to our
subsidiary Sociedad Anónima Carnes Pampeanas up to 1,400 tons
to export beef under the
Cuota
Hilton
for the July 2015-June 2016 period.
Environment
The development of
our agribusiness activities depends on a number of federal,
provincial and municipal laws and regulations related to
environmental protection.
We may be subject
to criminal and administrative penalties, including taking action
to reverse the adverse impact of our activities on the environment
and to reimburse third parties for damages resulting from
contraventions of environmental laws and regulations. Under the
Argentine
Criminal
Code, persons (including directors, officers and managers of
corporations) who commit crimes against public health, such as
poisoning or dangerously altering water, food or medicine used for
public consumption and selling products that are dangerous to
health, without the necessary warnings, may be subject to fines,
imprisonment or both. Some courts have enforced these provisions in
the Argentine Criminal Code to sanction the discharge of substances
which are hazardous to human health. At the administrative level,
the penalties vary from warnings and fines to the full or partial
suspension of the activities, which may include the revocation or
annulment of tax benefits, cancellation or interruption of credit
lines granted by state banks and a prohibition against entering
into contracts with public entities.
The Forestry
Legislation of Argentina prohibits the devastation of forests and
forested lands, as well as the irrational use of forest products.
Landowners, tenants and holders of natural forests require an
authorization from the Forestry Competent Authority for the
cultivation of forest land. The legislation also promotes the
formation and conservation of natural forests in properties used
for agriculture and farming purposes.
As of June 30,
2016, we owned land reserves extending over 365.306 hectares, which
are located in under-utilized areas where agricultural production
is not yet fully developed. We also have 107,984 hectares under
concession as reserves for future developments. We believe that
technological tools are available to improve the productivity of
such land and enhance its long-term value. However, existing or
future environmental regulations may prevent us from developing our
land reserves, requiring us to maintain a portion of such land as
unproductive land reserves.
In accordance with
legislative requirements, we have applied for approval to develop
certain parts of our land reserves and were authorized to develop
them partially and to maintain other areas as land reserves. We
cannot assure you that current or future development applications
will be approved, and if so, to what extent we will be allowed to
develop our land reserves. We intend to use genetically modified
organisms in our agricultural activities. In Argentina, the
development of genetically modified organisms is subject to special
laws and regulations and special permits.
On November 28,
2007, Argentine Congress passed a law known as the Forest Law which
sets minimum standards for the conservation of native forests and
incorporates minimum provincial expenditures to promote the
protection, restoration, conservation and sustainable use of native
forests. The Forest Law prevents landowners, including owners of
native forests, from deforesting or converting forested areas into
non-forested land for other commercial uses without prior
permission from each local government that gives the permit and
requires the preparation, assessment and approval of an
environmental impact report. The Forest Law also provides that each
province should adopt its own legislation and regional regulation
map within a term of one year. Until such provincial implementation
is carried into effect, no new areas may be deforested. In
addition, the Forest Law also establishes a national policy for
sustainable use of native forests and includes the recognition of
native communities and aims to provide preferential use rights to
indigenous communities living and farming near the forest. In case
a project affects such communities, the relevant provincial
authority may not issue permits without formal public hearings and
written consent of the communities.
In addition, the
Rules issued by the CNV provide that publicly traded companies
whose corporate purpose includes environmentally hazardous
activities should report to their shareholders, investors and the
general public their compliance with the applicable environmental
laws and risks inherent to such activities, so as to be able to
reasonably assess such hazards.
61
Our activities are
subject to a number of national, provincial and municipal
environmental regulations. Section 41 of the Argentine
Constitution, as amended in 1994, provides that all Argentine
inhabitants have the right to a healthy and balanced environment
fit for human development and have the duty to preserve it.
Environmental damage shall bring about primarily the obligation to
redress it as provided by applicable law. The authorities shall
protect this right, the rational use of natural resources, the
preservation of the natural and cultural heritage and of
biodiversity, and shall also provide for environmental information
and education. The National Government shall establish minimum
standards for environmental protection and Provincial and Municipal
Governments shall determine specific standards and issue the
applicable regulations.
On November 6,
2009, the Argentine Congress passed Law No. 25,675. This law
regulates the minimum standards for the achievement of a
sustainable environment and the preservation and protection of
biodiversity and sets environmental policy goals. Moreover, Law No.
25,675 establishes the activities that will be subject to an
environmental impact assessment procedure and certain requirements
applicable thereto. In addition, the Law sets forth the duties and
obligations that will be triggered by any damage to the environment
and imposes the obligation to restore it to its former condition
or, if that is not technically feasible, to pay a compensation in
lieu thereof. The Law also fosters environmental education and
provides for certain minimum obligations to be fulfilled by natural
and artificial persons.
The new Argentine
Civil and Commercial Code has introduced as a novel feature the
acknowledgement of collective rights, including the right to a
healthy and balanced environment. Accordingly, the Argentine Civil
and Commercial Code expressly sets forth that the law does not
protect an abusive exercise of individual rights if such exercise
could have an adverse impact on the environment and the rights with
a collective impact in general.
Other
Regulations
Consumer Relationship. Consumer or End User
Protection.
The Argentine Constitution expressly establishes
in Article 42 that consumers and users of goods and services have a
right to protection of health, safety and economic interests in a
consumer relationship. Consumer Protection Law No. 24,240, as
amended, regulates several issues concerning the protection of
consumers and end users in a consumer relationship, in the
arrangement and execution of contracts.
The Consumer
Protection Law, and the applicable sections of the Argentine Civil
and Commercial Code are intended to regulate the constitutional
right conferred under the Constitution on the weakest party of the
consumer relationship and prevent potential abuses deriving from
the stronger bargaining position of vendors of goods and services
in a mass-market economy where standard form contracts are
widespread.
As a result, the
Consumer Protection Law and the Argentine Civil and Commercial Code
deem void and unenforceable certain contractual provisions included
in consumer contracts entered into with consumers or end users,
including those which:
·
deprive obligations
of their nature or limit liability for damages;
·
imply a waiver or
restriction of consumer rights and an extension of seller rights;
and
·
impose the shifting
of the burden of proof against consumers.
In addition, the
Consumer Protection Law imposes penalties ranging from warnings to
the forfeiture of concession rights, privileges, tax regimes or
special credits to which the sanctioned party was entitled,
including closing down of establishments for a term of up to 30
days.
The Consumer
Protection Law and the Argentine Civil and Commercial Code define
consumers or end users as the individuals or legal entities that
acquire or use goods or services free of charge or for a price for
their own final use or benefit or that of their family or social
group. In addition, both laws provide that those who though not
being parties to a consumer relationship as a result thereof
acquire or use goods or services, for consideration or for
non-consideration, for their own final use or that of their family
or social group are entitled to such protection rights in a manner
comparable to those engaged in a consumer
relationship.
In addition, the
Consumer Protection Law defines the suppliers of goods and services
as the individuals or legal entities, either public or private,
that in a professional way, even occasionally, produce, import,
distribute or commercialize goods or supply services to consumers
or users.
The Argentine Civil
and Commercial Code defines a consumer agreement as such agreement
that is entered into between a consumer or end user and an
individual or legal entity that acts professionally or occasionally
or a private or public company that manufactures goods or provides
services, for the purpose of acquisition, use or enjoyment of goods
or services by consumers or users for private, family or social
use.
It is important to
point out that the protection under the laws afforded to consumers
and end users encompasses the entire consumer relationship process
(from the offering of the product or service) and it is not only
based on a contract, including the consequences
thereof.
In addition, the
Consumer Protection Law establishes a joint and several liability
system under which for any damages caused to consumers, if
resulting from a defect or risk inherent in the thing or the
provision of a service, the producer, manufacturer, importer,
distributor, supplier, seller and anyone who has placed its
trademark on the thing or service shall be liable.
The Consumer
Protection Law excludes the services supplied by professionals that
require a college degree and registration in officially recognized
professional organizations or by a governmental authority. However,
this law regulates the advertisements that promote the services of
such professionals.
The Consumer
Protection Law determines that the information contained in the
offer addressed to undetermined prospective consumers, binds the
offeror during the period in which the offer takes place and until
its public revocation. Further, it determines that specifications
included in advertisements, announcements, prospectuses, circulars
or other media bind the offeror and are considered part of the
contract entered into by the consumer.
62
Pursuant to
Resolution No. 104/05 issued by the Secretariat of Technical
Coordination reporting to the Argentine Ministry of Economy, the
Consumer Protection Law adopted Resolution No. 21/2004 issued by
the Mercorsur's Common Market Group which requires that those who
engage in commerce over the Internet (E-Business) shall disclose in
a precise and clear manner the characteristics of the products
and/or services offered and the sale terms. Failure to comply with
the terms of the offer is deemed an unjustified denial to sell and
gives rise to sanctions.
On September 17,
2014, the Consumer Protection Law was modified by the enactment of
Law Nº 26,993, which is called “System for Conflict
Resolution in Consumer Relationships” as it provides for the
creation of new administrative and judicial procedures for this
field of Law. It has created a two-instance administrative system:
the Preliminary Conciliation Service for Consumer Relationships
(
Servicio de Conciliación
Previa en las Relaciones de Consumo,
COPREC) and the
Consumer Relationship Audit, and a number of courts assigned to
resolution of conflicts between consumers and producers of goods
and services (
Fuero Judicial
Nacional de Consumo
). In order to file a claim, the amount
so claimed should not exceed a fixed amount equivalent to 55
adjustable minimum living wages, which are determined by the
Ministry of Labor, Employment and Social Security. The claim is
required to be filed with the administrative agency. If an
agreement is not reached between the parties, the claimant may file
the claim in court. The administrative system known as Preliminary
Conciliation Service for Consumer Relationships (COPREC) is
currently in full force and effect. However, the court system
(
fuero judicial nacional de
consumo
) is not in force yet, therefore, any court claims
should be currently filed with the existing applicable courts. A
considerable volume of claims filed against us are expected to be
settled pursuant to the system referred to above, without
disregarding the full force and effect of different instances for
administrative claims existing in the provincial sphere and the
City of Buenos Aires, which remain in full force and effect, where
potential claims related to this matter could also be
filed.
Antitrust
Law
Law No. 25,156, as
amended, prevents trust practices and requires administrative
authorization for transactions that according to the Antitrust Law
constitute an economic concentration. According to this law,
mergers, transfers of goodwill, acquisitions of property or rights
over shares, capital or other convertible securities, or similar
operations by which the acquirer controls or substantially
influences a company, are considered as an economic concentration.
Whenever an economic concentration involves a company or companies
and the aggregate volume of business of the companies concerned
exceeds in Argentina the amount of Ps. 200.0 million, in such case
the respective concentration should be submitted for approval to
the CNDC. The request for approval may be filed, either prior to
the transaction or within a week after its completion.
When a request for
approval is filed, the CNDC may (i) authorize the transaction, (ii)
subordinate the transaction to the accomplishment of certain
conditions, or (iii) reject the
authorization.
The Antitrust Law
provides that economic concentrations in which the transaction
amount and the value of the assets absorbed, acquired, transferred
or controlled in Argentina, do not exceed Ps. 20.0 million
each are exempted from the administrative authorization.
Notwithstanding the foregoing, when the transactions effected by
the companies concerned during the prior 12-month period exceed in
the aggregate Ps. 20.0 million or Ps. 60.0 million in the
last 36 months, these transactions must be notified to the
CNDC.
As our consolidated
annual sales volume and our parent’s consolidated annual
sales volume exceed Ps. 200.0 million, we should give notice
to the CNDC of any concentration provided for by the Antitrust
Law.
Taxes on the Transfer of Property and Sale of Meat and
Grains
Value Added Tax.
This tax is applicable
to the sale of personal property, the hiring of works, the
rendering of services and the import of goods and services operated
in Argentina. The general tax rate is 21%.
The value added tax
law imposes a reduced rate, equal to 10.5% on the sale price of
live animals (including cattle, sheep, camels and goats) as well as
their meat and edible remains, fruits and vegetables, all of which
whether fresh, chilled, or frozen, which have not undergone any
cooking or manufacturing process turning them into a manufactured
product. This 10.5% reduced rate is also applicable to the sale of
grains (cereals and oilseeds, excluding rice), and dry pulses
(beans, peas, and lentils). In the case of milk, the sale is
subject to a 21% rate (except for sales to final consumers, the
federal government, the provinces, municipalities or the City of
Buenos Aires or any subordinate agencies, school or university
kitchens, health funds or entities under the scope of paragraphs
e), f), g) and m) of Section 20 of the Income Tax Law, which are
exempt).
The sale of land
and immovable property is not subject to this tax.
Gross Sales Tax
. This is a local tax
(collected by the provinces and the City of Buenos Aires) that
levies gross revenues derived from the ordinary development of a
given business for profit. When the same business is developed in
more than one jurisdiction, the tax is applicable pursuant to the
regulations set forth in the Multilateral Agreement, which
establishes the proportions allocable to each of the jurisdictions
involved, so as to prevent double or multiple taxation. In the City
of Buenos Aires, gross revenues derived from livestock raising and
milk production are subject to this tax at a general rate of 1%. In
certain provinces, the sale or primary goods is not
taxable.
Stamp Tax
. This is a local tax that 23
provinces and the City of Buenos Aires collect based on similar
rules regarding subject matter, tax base and rates. In general,
this tax is levied on instrumented acts,
i.e.
executed and delivered by means of
documents (e.g. acts related to the constitution, transmission, or
expiration of rights, contracts, contracts for sales of stock and
company shares, public deeds relating to real property,
etc.).
Both in the
Province and the City of Buenos Aires (federal district) the stamp
tax rate applicable to the transfer by public deed of real property
is 3.6%. The purchase and sale of real estate through public deed,
however, is not taxable –up to a certain value of the
property- if the real estate is used for permanent dwelling
purposes, and provided that it is the only property owned by the
purchaser.
Urban Properties and Investments Business (through our subsidiary
IRSA)
We decided to break
down the operations of our subsidiary IRSA Inversiones y
Representaciones S.A. into an Operation Center in Argentina and an
Operation Center in Israel. From the Operation Center in Argentina,
we, through IRSA and its subsidiaries, manage the businesses in
Argentina and the international investments in the Lipstick
Building in New York and the Condor Hospitality Trust hotel REIT.
From the Operation Center in Israel, we manage IDBD.
63
As of June 30,
2016, our investment in IRSA’s common shares amounts to
63.38%.
The following
information corresponds to data of the segments extracted from our
subsidiary IRSA Inversiones y Representaciones S.A.’s Annual
Report and Financial Statements as of June 30, 2016.
The revenue figures
for fiscal year 2016 described in the different tables correspond
to the twelve-month period reported in IRSA’s Financial
Statements.
Description
of main operations
Operation Center in Argentina.
Shopping
Centers
We are engaged in
purchasing, developing and managing shopping centers through our
subsidiary, IRSA Commercial Properties. As of June 30, 2016, IRSA
Commercial Properties operated and owned a majority interest in
sixteen shopping centers in Argentina, seven of which are located
in the City of Buenos Aires (Abasto, Alcorta Shopping, Alto
Palermo, Patio Bullrich, Buenos Aires Design, Dot Baires Shopping
and Distrito Arcos), two of which are located in the greater Buenos
Aires metropolitan area (Alto Avellaneda and Soleil Premium Outlet)
and the other ones located in different Argentine provinces: Alto
NOA in the City of Salta, Alto Rosario in the City of Rosario,
Mendoza Plaza in the City of Mendoza, Córdoba Shopping Villa
Cabrera and Patio Olmos in the City of Córdoba, La Ribera
Shopping in the City of Santa Fe, and Alto Comahue in the City of
Neuquén.
As of June 30,
2016, we owned, through IRSA, 94.61% of IRSA Commercial Properties.
The remaining shares are held by the public investor and traded on
the
Bolsa de Comercio de Buenos
Aires
and the related ADRs are listed and traded on the
NASDAQ (USA) under the ticker “IRCP.”
As of June 30,
2016, IRSA Commercial Properties’s shopping centers comprised
a total of 333,155 square meters of gross leasable area
(“GLA”) (excluding certain space occupied by
hypermarkets which are not our tenants). For fiscal year 2016, the
occupancy rate of IRSA Commercial Properties’s shopping
center portfolio was approximately 98.4%.
We centralized
management of our shopping centers in IRSA Commercial Properties,
which is responsible for providing common area electrical power, a
main telephone switchboard, central air conditioning and other
basic common area services.
The following table
shows certain information concerning our shopping center as of June
30, 2016:
|
Shopping
Centers
|
Date
of Acquisition
|
Location
|
Gross
Leasable Area
sqm
(1)
|
Stores
|
Occupancy
Rate
(2)
|
IRSA Commercial Properties’ Interest
(3)
|
Book
Value
(in
millions of Ps.)
(4)
|
|
|
|
Abasto
(5)
|
Jul-94
|
City of Buenos
Aires, Argentina
|
36,738
|
170
|
99.8%
|
100.0%
|
259
|
|
|
|
Alto
Palermo
|
Nov-97
|
City of Buenos
Aires, Argentina
|
18,966
|
142
|
99.6%
|
100.0%
|
209
|
|
|
|
Alto
Avellaneda
|
Dec-97
|
Province of Buenos
Aires, Argentina
|
35,887
|
134
|
100.0%
|
100.0%
|
128
|
|
|
|
Alcorta
Shopping
|
Jun-97
|
City of Buenos
Aires, Argentina
|
15,877
|
112
|
89.1%
|
100.0%
|
123
|
|
|
|
Patio
Bullrich
|
Oct-98
|
City of Buenos
Aires, Argentina
|
11,783
|
88
|
99.1%
|
100.0%
|
103
|
|
|
|
Alto
Noa
|
Mar-95
|
Salta,
Argentina
|
19,040
|
89
|
100.0%
|
100.0%
|
33
|
|
|
|
Buenos Aires
Design
|
Nov-97
|
City of Buenos
Aires, Argentina
|
13,903
|
62
|
95.7%
|
53.7%
|
6
|
|
|
|
Mendoza
Plaza
|
Dec-94
|
Mendoza,
Argentina
|
42,043
|
139
|
95.2%
|
100.0%
|
93
|
|
|
|
Alto Rosario
(5)
|
Nov-04
|
Santa Fe,
Argentina
|
28,796
|
143
|
100.0%
|
100.0%
|
129
|
|
|
|
Córdoba
Shopping
|
Dec-06
|
Córdoba,
Argentina
|
15,582
|
110
|
99.2%
|
100.0%
|
49
|
|
|
|
Dot Baires
Shopping
|
May-09
|
City of Buenos
Aires, Argentina
|
49,641
|
150
|
100.0%
|
80.0%
|
374
|
|
|
|
Soleil Premium
Outlet
|
Jul-10
|
Province of Buenos
Aires, Argentina
|
13,991
|
78
|
100.0%
|
100.0%
|
80
|
|
|
|
La Ribera
Shopping
|
Aug-11
|
Santa Fe,
Argentina
|
9,851
|
63
|
99.3%
|
50.0%
|
24
|
|
|
|
Distrito Arcos
(6)
|
Dec-14
|
City of Buenos
Aires, Argentina
|
11,170
|
60
|
97.0%
|
90.0%
|
279
|
|
|
|
Alto Comahue
(7)
|
Mar-15
|
Neuquén,
Argentina
|
9,890
|
102
|
96.6%
|
99.1%
|
319
|
|
|
|
Patio Olmos
(8)
|
Sep-07
|
Córdoba,
Argentina
|
-
|
-
|
-
|
100%
|
26
|
|
|
|
TOTAL
GENERAL
|
|
|
333,158
|
1,642
|
98.4%
|
|
2,210
|
|
|
|
|
(1) Corresponds to
the total leaseable surface area of each property. Excludes common
areas and parking spaces.
|
||||||||
|
|
(2) Calculated by
dividing square meters leased under leases in effect by gross
leaseable area as of fiscal year end.
|
||||||||
|
|
(3) Our effective
interest in each of its business units.
|
||||||||
|
|
(4) Cost of
acquisition, plus improvements, less accumulated depreciation.
Values expressed in million of pesos (Ps.).
|
||||||||
|
|
(5) Excludes Museo
de los Niños (3,732 sqm in Abasto and 1,261 sqm in Alto
Rosario).
(6) Opening
December 18, 2014.
(7) Opening March
17, 2015.
(8) IRSA CP owns
the historic building of the Patio Olmos shopping center in the
province of Cordoba, operated by a third party.
|
||||||||
64
Accumulated
Rental Income as of June 30, 2016, 2015 and 2014
The following table
shows certain information concerning Accumulated Rental Income as
of June 30, 2016, 2015 and 2014 of our IRSA Commercial Properties
subsidiary’s shopping centers:
|
As
of June 30,
|
|
|||
|
|
2016
|
2015
|
2014
|
|
|
|
(In
million of Ps.)
|
|||
|
Abasto
|
384
|
302
|
238
|
|
|
Alto
Palermo
|
392
|
295
|
244
|
|
|
Alto
Avellaneda
|
265
|
200
|
161
|
|
|
Alcorta
Shopping
|
187
|
141
|
106
|
|
|
Patio
Bullrich
|
118
|
98
|
79
|
|
|
Alto
Noa
|
73
|
51
|
39
|
|
|
Buenos Aires
Design
|
45
|
35
|
27
|
|
|
Mendoza
Plaza
|
119
|
92
|
74
|
|
|
Alto
Rosario
|
182
|
138
|
100
|
|
|
Córdoba
Shopping- Villa Cabrera
|
68
|
54
|
40
|
|
|
Dot Baires
Shopping
|
261
|
199
|
158
|
|
|
Soleil Premium
Outlet
|
80
|
59
|
44
|
|
|
La Ribera
Shopping
|
21
|
13
|
9
|
|
|
Distrito Arcos
(1)
|
78
|
23
|
-
|
|
|
Alto Comahue
(2)
|
48
|
12
|
-
|
|
|
Total
income
(3)
|
2,321
|
1,712
|
1,319
|
|
(1) Opening was on
December 18, 2014.
(2) Opening was on
March 17, 2015.
(3) Does not
include income neither from Fibesa or from Patio
Olmos.
Tenant
Retail Sales
(1)(2)
The following table
contains a breakdown of approximate total tenant retail sales in
millions of Pesos at the shopping centers in which we had an
interest for the fiscal years shown:
|
As
of June 30,
|
|
|||
|
|
2016
|
2015
|
2014
|
|
|
|
(In
million of Ps.)
|
|||
|
Abasto
|
4,043
|
3,150
|
2,447
|
|
|
Alto
Palermo
|
3,499
|
2,662
|
2,111
|
|
|
Alto
Avellaneda
|
3,781
|
2,913
|
2,334
|
|
|
Alcorta
Shopping
|
1,900
|
1,475
|
1,120
|
|
|
Patio
Bullrich
|
1,061
|
889
|
689
|
|
|
Alto
Noa
|
1,369
|
1,069
|
766
|
|
|
Buenos Aires
Design
|
414
|
326
|
272
|
|
|
Mendoza
Plaza
|
2,369
|
1,907
|
1,515
|
|
|
Alto
Rosario
|
2,628
|
1,952
|
1,378
|
|
|
Córdoba
Shopping- Villa Cabrera
|
991
|
756
|
547
|
|
|
Dot Baires
Shopping
|
3,254
|
2,571
|
2,008
|
|
|
Soleil Premium
Outlet
|
1,282
|
938
|
664
|
|
|
La Ribera
Shopping
|
634
|
398
|
281
|
|
|
Distrito Arcos
(2)
|
962
|
340
|
-
|
|
|
Alto Comahue
(3)
|
717
|
182
|
-
|
|
|
Total
sales
|
28,904
|
21,527
|
16,132
|
|
(1)
Retail sales based
upon information provided to us by retailers and prior owners. The
amounts shown reflect 100% of the retail sales of each shopping
center, although in certain cases we own less than 100% of such
Shopping Center. Excludes sales from stands and spaces used for
special exhibitions.
(2)
Opening was on
December 18, 2014.
(3)
Opening was on
March 17, 2015.
65
Accumulated
Sales per type of Business
|
|
As
of June 30,
|
||
|
|
2016
|
2015
|
2014
|
|
|
(In millions of
Ps.)
|
||
|
Anchor
Store
|
1,591
|
1,299
|
1,098
|
|
Clothes and
footwear
|
15,201
|
11,125
|
7,940
|
|
Entertainment
|
1,026
|
741
|
547
|
|
Home
|
784
|
617
|
486
|
|
Home
Appliances
|
3,862
|
2,994
|
2,527
|
|
Restaurant
|
2,722
|
1,938
|
1,477
|
|
Miscellaneous
|
3,368
|
2,589
|
1,922
|
|
Services
|
352
|
223
|
136
|
|
Total
|
28,906
|
21,526
|
16,133
|
Occupancy
Rate
The following table
showssets forth the occupancy rate expressed as a percentage of the
gross leasable area as of the closing dates stated at the end of
the following fiscal years set forth below:
|
|
As
of June 30,
|
||
|
|
2016
|
2015
|
2014
|
|
Abasto
|
99.8%
|
100.0%
|
99.4%
|
|
Alto
Palermo
|
99.6%
|
99.7%
|
98.9%
|
|
Alto
Avellaneda
|
100.0%
|
99.9%
|
99.5%
|
|
Alcorta
Shopping
|
89.1%
|
100.0%
|
99.8%
|
|
Patio
Bullrich
|
99.1%
|
100.0%
|
99.6%
|
|
Alto
Noa
|
100.0%
|
100.0%
|
99.7%
|
|
Buenos Aires
Design
|
95.7%
|
94.6%
|
92.3%
|
|
Mendoza
Plaza
|
95.2%
|
96.1%
|
95.0%
|
|
Alto
Rosario
|
100.0%
|
97.9%
|
97.0%
|
|
Córdoba
Shopping Villa Cabrera
|
99.2%
|
99.8%
|
99.8%
|
|
Dot Baires
Shopping
|
100.0%
|
99.7%
|
99.7%
|
|
Soleil Premium
Outlet
|
100.0%
|
99.4%
|
100.0%
|
|
La Ribera
Shopping
|
99.3%
|
99.3%
|
99.6%
|
|
Distrito
Arcos
|
97.0%
|
97.3%
|
-
|
|
Alto
Comahue
|
96.6%
|
94.2%
|
-
|
|
Total
Percentage
|
98.4%
|
98.7%
|
98.4%
|
66
Rental
Price
The following table
shows the annual average accumulated rental price per square meter
for the fiscal years ended June 30, 2016, 2015 and
2014:
(1)
|
|
As
of June 30,
|
||
|
|
2016
|
2015
|
2014
|
|
|
(in
Ps.)
|
||
|
Abasto
|
10,456.4
|
8,227.2
|
6,254.6
|
|
Alto
Palermo
|
20,663.9
|
15,107.9
|
12,618.5
|
|
Alto
Avellaneda
|
7,389.7
|
5,443.2
|
4,400.3
|
|
Alcorta
Shopping
|
11,759.4
|
9,106.1
|
7,000.2
|
|
Patio
Bullrich
|
10,056.9
|
8,452.8
|
6,762.3
|
|
Alto
Noa
|
3,814.7
|
2,656.6
|
2,022.5
|
|
Buenos Aires
Design
|
3,264.2
|
2,543.2
|
1,874.9
|
|
Mendoza
Plaza
|
2,831.3
|
2,181.1
|
1,802.8
|
|
Alto
Rosario
|
6,303.1
|
4,847.2
|
3,390.4
|
|
Córdoba
Shopping Villa Cabrera
|
4,367.3
|
3,552.0
|
2,503.8
|
|
Dot Baires
Shopping
|
5,265.1
|
4,001.7
|
3,389.3
|
|
Soleil Premium
Outlet
|
5,726.0
|
4,242.5
|
2,908.4
|
|
La Ribera
Shopping
|
2,109.4
|
1,340.3
|
1,129.7
|
|
Distrito Arcos
(2)
|
6,993.8
|
1,891.1
|
-
|
|
Alto Comahue
(3)
|
4,832.1
|
1,236.1
|
-
|
(1)
Correspond to
consolidated annual accumulated rental prices according to the IFRS
divided by gross leaseable square meters. Does not include income
from Fibesa or Patio Olmos.
(2)
Opening was on
December 18, 2014.
(3)
Opening was on
March 17, 2015.
Lease
Expirations
The following table
sets forth the schedule of estimated lease expirations for our
shopping centers for leases in effect as of June 30, 2016, assuming
that none of the tenants exercise renewal options or terminate
their leases earlier:
|
Year
of expiration
|
Number
of Agreements
(1)
|
Square meters
to expire
|
Percentage
to expire
|
Amount (In
million of Ps.)
(3)
|
Percentage
of Agreements
|
|
2016
|
171
|
33,155.2
|
10%
(1)
|
96.29
|
8%
|
|
2017
|
487
|
83,781.3
|
25%
|
356.83
|
30%
|
|
2018
|
403
|
69,906.2
|
21%
|
308.86
|
26%
|
|
2019 and subsequent
years
|
581
|
146,312.7
|
44%
|
409.13
|
35%
|
|
Total
(2)
|
1,642
|
333,155.4
|
100%
|
1,171.11
|
100%
|
(1) Including
vacant stores relating to leases expired as of June 30,
2016. A lease may be associated to one or more stores.
(2) Does not
reflect our ownership interest in each property.
(3) Annual base
rent of each agreement as in effect as of June 30,
2016.
New
Agreements and Renewals
The following table
shows certain information about lease agreements as of June 30,
2016:
|
Type
of Business
|
Number
of Agreements
|
Annual
Base Rent Amount (million
Ps.)
|
Annual
Admission Rights Amount (million Ps.)
|
Average
Annual Base Rent per sqm (Ps.)
|
Number
of non-renewed agreements
(1)
|
Non-renewed
agreements
(1)
Annual Base Rent
Amount (million Ps.)
|
|
|
New
and renewed
|
Former
agreements
|
||||||
|
Clothing and
footwear
|
456
|
345.3
|
95.9
|
6,394.0
|
4,029.7
|
515
|
366.1
|
|
Miscellaneous
(2)
|
103
|
76.1
|
25.0
|
3,622.4
|
2,904.1
|
118
|
91.6
|
|
Restaurant
|
86
|
45.0
|
8.3
|
3,990.2
|
3,381.3
|
130
|
74.5
|
|
Home &
décor
|
43
|
19.5
|
5.4
|
3,735.3
|
2,480.8
|
48
|
26.4
|
|
Houseware
|
26
|
39.5
|
4.0
|
4,997.9
|
3,216.9
|
25
|
29.2
|
|
Entertainment
|
9
|
13.5
|
1.1
|
673.3
|
322.9
|
23
|
17.2
|
|
Services
|
12
|
6.4
|
0.5
|
1,867.2
|
1,702.2
|
48
|
20.7
|
|
Total
|
735
|
545.2
|
140.3
|
4,435.8
|
2,550.3
|
907
|
625.9
|
(1)
Includes vacant
stores as of June 30, 2016. Leasable Area with respect to such
vacant stores is included under the type of business of the last
tenant to occupy such stores.
(2)
Miscellaneous
includes Anchor Store.
67
Depreciation.
Depreciation, based
on a component approach, is calculated using the straight-line
method to allocate the cost over the assets’ estimated useful
lives.
Principal
Terms of the Leases.
Under the Civil and
Commercial Code, lease terms may not exceed fifty years, except for
leases regulated by Law No.25,248. See Item. Key Information.
“Risk Factors—Risks Relating to IRSA.” Generally,
our lease agreements provide terms of three to ten
years.
Leasable space in
the Company’s shopping centers is marketed through an
exclusive arrangement with its wholly owned subsidiary and real
estate brokers Fibesa. The Company has a standard lease agreement,
the terms and conditions of which are described below, which it
uses for most tenants. However, the Company’s largest tenants
generally negotiate better terms for their respective leases. No
assurance can be given that lease terms will be as set forth in the
standard lease agreement.
The rent which
consists of the higher of (i) a monthly base rent (the “Base
Rent”) and (ii) a specified percentage of the tenant’s
monthly gross sales in the store (the “Percentage
Rent”), which generally ranges between 4% and 12% of
tenant’s gross sales. Furthermore, pursuant to the rent
escalation clause in most leases, a tenant’s Base Rent
generally increases between 18% and 27% on an annual and cumulative
basis from the thirteenth (13
th
) month of
effectiveness of the lease. Although many of our lease agreements
contain readjustment clauses, these are not based on an official
index nor do they reflect the inflation index. In the event of
litigation, there can be no assurance that we may be able to
enforce such clauses contained in our lease
agreements.
In addition to
rent, IRSA charges most of its tenants an admission right, which is
required to be paid upon entering into a lease agreement and upon a
lease agreement renewal. The admission right is normally paid in
one lump sum or in a small number of monthly installments, which
range between three and six. If the tenant pays this fee in
installments, it is the tenant’s responsibility to pay for
the balance of any such amount unpaid in the event the tenant
terminates its lease prior to its expiration. In the event of
unilateral termination and/or resolution for breach of duties by
the tenant, a tenant will not be refunded its admission right
without IRSAs consent.
IRSA is responsible
for supplying each shopping center with electricity, a main
telephone switchboard, central air conditioning and a connection to
a general fire detection system. Each rental unit at our properties
is connected to these systems. The Company also provides food court
tenants with sanitation and with gas connections. Each tenant is
responsible for completing all the necessary installations within
its own rental unit, in addition to the direct expenses generated
by these items within each rental unit. These direct expenses
generally include: electricity, water, gas, telephone and air
conditioning. Tenants must also pay for a percentage of total
charges and general taxes related to the maintenance of the common
areas. IRSA determines this percentage based on different factors.
The common area expenses include, among others, administration,
security, operations, maintenance, cleaning and taxes.
IRSA carries out
promotional and marketing activities to increase consumer traffic
at the shopping centers. These activities are paid for with the
tenants’ contributions to the Common Promotional Fund
(“CPF”), which is administered by IRSA. Every month,
tenants contribute to the CPF an amount equal to approximately 15%
of their total rent (Base Rent plus Percentage Rent), in addition
to rent and expense payments. IRSA may increase the percentage that
tenants must contribute to the CPF, but the increase cannot exceed
25% of the original amount set in the corresponding lease for the
contributions to the CPF. IRSA may also require tenants to make
extraordinary contributions to the CPF to fund special promotional
and marketing campaigns or to cover the costs of special
promotional events that benefit all tenants. IRSA may require
tenants to make these extraordinary contributions up to four times
a year provided that each such extraordinary contribution may not
exceed 25% of the preceding monthly rental payment of the
tenant.
Each tenant leases
its rental unit as a shell without any fixtures. Each tenant is
responsible for the interior design of its rental unit. Any
modifications and additions to the rental units must be
pre-approved by IRSA. IRSA has the option to decide tenants’
responsibility for all costs incurred in remodeling the rental
units and for removing any additions made to the rental unit when
the lease expires. Furthermore, tenants are responsible for
obtaining adequate insurance for their rental units, which must
include, among other things, coverage for fire, glass breakage,
theft, flood, civil liability and workers’
compensation.
Sources
of Shopping Center Sales
Set forth below is
a breakdown of the sources of sales by tenants of the shopping
centers stated in millions of Pesos for fiscal years ended June 30,
2016, 2015 and 2014:
|
|
|
As
of June 30,
|
|
|
|
2016
|
2015
|
2014
|
|
Anchor
Store
|
1,590.5
|
1,299.3
|
1,098.4
|
|
Clothing and
footwear
|
15,201.4
|
11,124.8
|
7,940.1
|
|
Entertainment
|
1,025.7
|
740.6
|
546.5
|
|
Home
|
783.9
|
617.1
|
486.4
|
|
Home
Appliances
|
3,861.5
|
2,994.2
|
2,526.5
|
|
Restaurants
|
2,722.2
|
1,938.4
|
1,476.8
|
|
Miscellaneous
|
3,368.2
|
2,589.4
|
1,922.3
|
|
Services
|
351.5
|
223.1
|
135.8
|
|
Total
|
28,904.9
|
21,526.9
|
16,132.8
|
Competition
Given that most of
our shopping centers are located in densely populated areas, there
are competing shopping centers within, or in close proximity to,
our targeted areas. The number of shopping centers in a particular
area could have a material effect on our ability to lease space in
our shopping centers and on the amount of rent that we are able to
charge. We believe that due to the limited availability of large
plots of land and zoning restrictions in the City of Buenos Aires,
it will be difficult for other companies to compete with us in
areas through the development of new shopping.centers. Our
principal competitor is Cencosud S.A. which owns and operates
Unicenter Shopping and the Jumbo hypermarket chain, among
others.
68
The following table
sets forth certain information relating toconcerning the most
importantsignificant owners and operators of shopping centers in
Argentina:.
|
Company
|
Shopping
Center
|
Location
(1)
|
Gross
Leasable Area
(2)
(sq.m.)
|
Stores
|
National
GLA Percentage
(2)
|
Stores
Percentage
(2)
|
|
IRSA Commercial
Properties
|
|
|
|
|
|
|
|
|
Dot Baires
Shopping
|
CABA
|
49,641
|
150
|
2.14%
|
2.16%
|
|
|
Mendoza Plaza
Shopping
|
Mendoza
|
42,043
|
139
|
1.81%
|
2.00%
|
|
|
Abasto de Buenos
Aires
|
CABA
|
40,470
|
170
|
1.74%
|
2.45%
|
|
|
Alto
Avellaneda
|
GBA
|
35,887
|
134
|
1.54%
|
1.93%
|
|
|
Alto
Rosario
|
Rosario
|
30,057
|
143
|
1.29%
|
2.06%
|
|
|
Alto Palermo
Shopping
|
CABA
|
18,966
|
142
|
0.82%
|
2.05%
|
|
|
Alto
Noa
|
Salta
|
19,040
|
89
|
0.82%
|
1.28%
|
|
|
Alcorta
Shopping
|
CABA
|
15,877
|
112
|
0.68%
|
1.62%
|
|
|
Córdoba
Shopping
|
Córdoba
|
15,582
|
110
|
0.67%
|
1.59%
|
|
|
Soleil Premium
Outlet
|
GBA
|
13,991
|
78
|
0.60%
|
1.12%
|
|
|
Buenos Aires
Design
|
CABA
|
13,903
|
62
|
0.62%
|
0.89%
|
|
|
Distrito
Arcos
|
CABA
|
11,170
|
60
|
0.48%
|
0.87%
|
|
|
Patio
Bullrich
|
CABA
|
11,738
|
88
|
0.51%
|
1.27%
|
|
|
La Ribera
Shopping
|
Santa
Fe
|
9,851
|
63
|
0.42%
|
0.91%
|
|
|
Alto
Comahue
|
Neuquen
|
9,890
|
102
|
0.43%
|
1.47%
|
|
|
Subtotal
|
|
338,198
|
1,642
|
14.55%
|
23.67%
|
|
Cencosud
S.A.
|
|
|
|
|
|
|
|
|
Subtotal
|
|
650,256
|
1,456
|
28.01%
|
21.02%
|
|
Other
|
|
|
|
|
|
|
|
Operators
|
|
|
|
|
|
|
|
|
Subtotal
|
|
1,334,846
|
3,836
|
57.44%
|
55.32%
|
|
|
Total
|
|
2,323,278
|
6,934
|
100%
|
100%
|
(1)
“GBA”
means Greater Buenos Aires, the Buenos Aires metropolitan area, and
“CABA” means the City of Buenos
Aires.
(2)
Percentage over
total shopping centers in Argentina that are members of the
Argentine Chamber of Shopping Centers (Cámara Argentina de
Shopping Centers, CASC). Figures may not sum due to
rounding.
Source:
Argentine Chamber of Shopping Centers.
Seasonality.
Our business is
affected by seasonality, influencing the level of our
tenants’ sales. During summer holidays (January and February)
our tenants’ sales typically reach their minimum level,
whereas during winter holidays (July) and in December (Christmas)
they reach their maximum level. Clothing retailers generally change
their collections in spring and autumn, positively affecting our
shopping centers’ sales. Sales at discount prices at the end
of each season are also one of the main seasonal factors affecting
our business.
Offices
and Others
According to
Colliers International, as of June 30, 2016, the A+ and A office
inventory remained stable since end of 2015 at 1,655,954 sqm. In
terms of rental availability, there was a 1% decrease in the
vacancy rate to 6.4% during the second quarter of 2016 compared to
the same period the previous year. Thus, the vacancy rate has
remained stable between 6% and 8% since 2010. These values indicate
that the market is healthy in terms of its operations, allowing an
optimum level of supply with balanced values. According to the
market segments, class A properties show a vacancy rate of 7% for
the entire stock, while A+ properties buildings show a vacancy rate
of 5%.
During the second
quarter of 2016, net absorption was negative at 400 sqm, i.e., more
meters have become vacants than the ones which have been occupied,
a situation that had not be seen since 2012. This behavior of
demand is mainly explained by the sub-market Zona Norte GBA, which
concentrates most of the spaces that have become vacant. On the
other hand, that area has experienced vacancies in A+ properties
(-2,908 sqm) which mainly migrated to class A properties (as it
increased by 2,474 sqm).
During the second
quarter of 2016, rental prices remained steady as compared to the
general average prices seen over the past ten years (US$24.80 per
square meter). Compared to the previous quarter, a 2.5% increase
was recorded (from US$24.10 per square meter to US$24.70 per square
meter). This slight increase shows a 1.4% increase in rental prices
for A+ properties (US$27.20 per square meter in the second quarter
against US$26.80 per square meter in the first quarter) and a 2.4%
increase in rental prices for A properties (US$23.40 per square
meter in the second quarter against US$22.90 per square meter in
the first quarter). The spread between both categories is US$3.80
and reached US$12 in low vacancy periods.
In turn, the
sub-market Catalinas currently features the lowest prices in the
market. The average value of the properties in such area is
US$27.90 per square meter. This value is expected to increase over
the next few months due to the addition of new towers with prices
already over US$35 per square meter in the inventory.
At June 30, 2016,
the sub-market Zona Norte GBA shows average rental prices of
US$23.30, comparable to values reported in June 2015. Moreover,
during the same month, the vacancy rate was 8.9%, compared to 9.5%
in June 2015.
69
We are engaged in
the acquisition and management of office buildings and other rental
properties in Argentina. As of June 30, 2016, we directly and
indirectly owned interests in office and other rental properties,
which comprised 333,962 square meters of gross leaseable area. Out
of these properties, eight were office properties, which comprised
81,020 square meters of gross leaseable area. For fiscal year 2016,
we had revenues from Offices and other non-shopping center rental
properties of Ps. 340 million.
All our office
rental properties in Argentina are located in the City of Buenos
Aires. For the year ended June 30, 2016, the average occupancy rate
for all our properties in the Offices and Others segment was
approximately 84.7%.
Management
We generally act as
the managing agent of the office properties in which we own an
interest. These interests consist primarily of the ownership of
entire buildings or a substantial number of floors in a building.
The buildings in which we own floors are generally managed pursuant
to the terms of a condominium agreement that typically provides for
control by a simple majority of the interests (based on the area
owned) in the building. As the managing agent of operations, we are
responsible for handling services, such as security, maintenance
and housekeeping. These services are generally outsourced. The cost
of the services is passed-through and paid for by the tenants,
except in the case of our units not rented, in which case we absorb
the cost. Our leaseable space is marketed through commissioned
brokers, the media and directly by us.
Leases
We usually lease
our offices and other rental properties by using contracts with an
average term of three years, with the exception of a few contracts
with terms of five years. These contracts are renewable for two or
three years at the tenant’s option. Contracts for the rental
of office buildings and other commercial properties are generally
stated in U.S. dollars, and in accordance with Argentine law they
are not subject to inflation adjustment. Rental rates for renewed
periods are negotiated at market value.
Properties.
The following table
sets forth certain information regarding our direct and indirect
ownership interest in offices and other non-shopping center rental
properties:
|
|
Date
of Acquisition
|
Gross
Leasable Area (sqm)
(1)
|
Occupancy
Rate
(2)
|
IRSA’s
Effective Interest
|
Monthly
Rental Income (in thousands of Ps.)
(3)
|
Annual
accumulated rental income as of June 30, (in millions of
Ps.)
(4)
|
Book
Value
(in
millions of Ps.)
|
||
|
2016
|
2015
|
2014
|
|||||||
|
Offices
|
|
|
|
|
|
|
|
|
|
|
Edificio
República
(5)
|
04/28/08
|
19,885
|
100.0%
|
100.0%
|
7,637
|
72
|
62
|
46
|
191
|
|
Torre
BankBoston
(5)
|
08/27/07
|
14,873
|
100.0%
|
100.0%
|
5,098
|
56
|
42
|
35
|
130
|
|
Bouchard
551
|
03/15/07
|
-
|
-
|
100.0%
|
-
|
3
|
10
|
24
|
9
|
|
Intercontinental
Plaza
(5)
|
11/18/97
|
6,569
|
100.0%
|
100.0%
|
2,036
|
28
|
56
|
40
|
12
|
|
Bouchard
710
(5)(6)
|
06/01/05
|
15,014
|
100.0%
|
100.0%
|
7,020
|
68
|
48
|
34
|
79
|
|
Dique
IV
(9)
|
12/02/97
|
-
|
-
|
-
|
-
|
15
|
32
|
25
|
-
|
|
Maipú
1300
|
09/28/95
|
1,353
|
100.0%
|
100.0%
|
486
|
6
|
16
|
15
|
6
|
|
Libertador
498
|
12/20/95
|
620
|
100.0%
|
100.0%
|
611
|
6
|
2
|
3
|
4
|
|
Suipacha
652/64
(5)
|
11/22/91
|
11,465
|
90.7%
|
100.0%
|
2,085
|
22
|
16
|
13
|
12
|
|
Dot Building
(5)
|
11/28/06
|
11,242
|
100.0%
|
80.0%
|
3,521
|
31
|
27
|
19
|
121
|
|
Subtotal
Offices
|
|
81,021
|
98.7%
|
N/A
|
28,494
|
307
|
311
|
254
|
564
|
|
|
|
|
|
|
|
|
|
|
|
|
Other
Properties
|
|
|
|
|
|
|
|
|
|
|
Santa María
del Plata
|
10/17/97
|
106,610
|
100.0%
|
100.0%
|
676
|
12
|
|
|
13
|
|
Nobleza Picardo
(7)
|
05/31/11
|
109,610
|
74.8%
|
50.0%
|
185
|
2
|
8
|
8
|
7
|
|
Other Properties
(8)
|
N/A
|
38,646
|
42.8%
|
N/A
|
1,714
|
11
|
7
|
3
|
44
|
|
Subtotal
Other Properties
|
|
154,942
|
80.3%
|
N/A
|
2,575
|
25
|
15
|
11
|
64
|
|
|
|
|
|
|
|
|
|
|
|
|
Total
Offices and others
(7)
|
|
335,887
|
84.7%
|
N/A
|
31,069
|
332
|
326
|
265
|
628
|
|
|
|||||||||
|
(1) Corresponds to
the total leaseable surface area of each property as of June 30,
2016. Excludes common areas and parking spaces.
(2) Calculated by
dividing occupied square meters by leaseable area as of June 30,
2016.
(3) The lease
agreements in effect as of June 30, 2016 were computed for each
property.
(4) Corresponds to
total consolidated lease agreements.
(5) Through IRSA
CP.
(6) On July 29,
2016, we executed a bill of sale for 1,702 square meters
corresponding to two office floors and 16 parking units to an
unrelated party, for a total amount of US$6.01 million, US$1.60
million which has already been paid, while the remaining balance
will be paid upon execution of the deed of conveyance and delivery
of possession.
(7) Through Quality
Invest S.A.
(8) Includes the
following properties: Ferro, Dot Adjoining Plot, Anchorena 665,
Anchorena 545 (Chanta IV) and La Adela, among others.
(9) On December 10,
2015, we sold the “Juana Manso 295” office building
located in the “Puerto Madero” area of the City of
Buenos Aires, composed of 8 office floors and 116 parking
spaces.The transaction amount was Ps.649 million, which has been
fully paid and the gross profit from the transaction amounts to
approximately Ps.586.8 million.
|
|||||||||
|
|
|||||||||
70
The following table
shows a schedule of the lease expirations of our office and other
properties for leases outstanding as of June 30, 2016, assuming
that none of the tenants exercise renewal options or terminate
their lease early. Most tenants have renewal clauses in their
leases.
|
As
of June 30, 2016
|
|||||
|
Year
of
expiration
|
Number
of
Leases
|
Surface
area subject
to
expiration (sqm)
|
Percentage
subject
to
expiration
|
Amount
(Ps.)
|
Percentage
of
Leases
|
|
2016
|
29
|
34,947
|
12%
|
34,508,797
|
10%
|
|
2017
|
20
|
23,455
|
8%
|
74,530,611
|
22%
|
|
2018
|
40
|
43,627
|
15%
|
148,854,011
|
43%
|
|
2019+
|
29
|
185,540
|
65%
|
85,548,601
|
25%
|
|
Total
|
118
|
287,569
|
100%
|
343,442,020
|
100%
|
Includes Offices,
whose lease agreement has not yet been renewed as of June 30,
2016.
Does not include
vacant leased square meters.
Does not include
square meters or revenues from parking spaces.
The following table
shows our offices occupancy percentage as of the end of fiscal
years of June 30, 2016, 2015 and 2014:
|
|
Occupancy
Rate
(1)
|
||
|
|
2016
|
2015
|
2014
|
|
Offices
|
|
|
|
|
Edificio
República
|
100.0%
|
93.6%
|
94.0%
|
|
Torre
BankBoston
|
100.0%
|
100.0%
|
100.0%
|
|
Intercontinental
Plaza
|
100.0%
|
100.0%
|
100.0%
|
|
Bouchard
710
|
100.0%
|
100.0%
|
99.8%
|
|
Suipacha
652/64
|
90.7%
|
96.7%
|
100.0%
|
|
DOT
Building
|
100.0%
|
100.0%
|
100.0%
|
|
Maipú
1300
|
100.0%
|
90.9%
|
87.3%
|
|
Libertador
498
|
100.0%
|
100.0%
|
100.0%
|
|
Juana Manso 295
(Dique IV)
|
-
|
99.5%
|
94.4%
|
|
Total
Offices
|
98.7%
|
98.1%
|
97.7%
|
|
(1) Leased surface
area in accordance with agreements in effect as of June 30, 2016
and 2015 considering the total leaseable office area for the same
periods.
|
The following table
sets forth the annual average income per square meter for our
offices during fiscal years ended June 30, 2016, 2015 and
2014.
Annual average
income per surface area as of June 30, 2016, 2015 and
2014.
|
|
Annual
average income per square meter
(1)
|
||
|
|
2016
|
2015
|
2014
|
|
Offices
|
|
|
|
|
Edificio
República
|
3,615
|
3,115
|
3,075
|
|
Torre
BankBoston
|
3,778
|
2,819
|
2,467
|
|
Bouchard
551
|
-
|
-
|
3,565
|
|
Intercontinental
Plaza
|
4,291
|
2,484
|
2,402
|
|
Bouchard
710
|
4,539
|
3,219
|
2,844
|
|
Juana Manso 295
(Dique IV)
|
-
|
2,847
|
2,722
|
|
Maipú
1300
|
4,790
|
3,330
|
3,000
|
|
Libertador
498
|
10,464
|
3,149
|
5,227
|
|
Suipacha
652/64
|
1,961
|
1,399
|
1,512
|
|
DOT
Building
|
2,778
|
2,439
|
2,410
|
(1)
Calculated by
dividing annual rental income by the gross leaseable area of
offices based on our interest in each building as of June 30 for
each fiscal year.
71
New
agreements and renewals
The following table
sets forth certain information on lease agreements as of June 30,
2016:
|
Property
|
Number of Agreements
(1)(5)
|
Annual Rental income
(in millions of Ps.)
(2)
|
Rental income per sqm New and Renewed
(3)
|
Previous rental income per sqm
(3)
|
N° of non-renewed agreements
|
Non-renewed agreements Annual rental income
(4)
(in
million Ps.)
|
|
Maipú
1300
|
3
|
3.4
|
269.8
|
385.0
|
1
|
1
|
|
Libertador
498
|
1
|
3.2
|
427.8
|
413.6
|
-
|
-
|
|
Intercontinental
Plaza
|
1
|
2.5
|
232.5
|
232.5
|
-
|
-
|
|
Bouchard
710
|
3
|
12.9
|
399.2
|
331.8
|
-
|
-
|
|
Torre
BankBoston
|
3
|
11.2
|
375.5
|
283.5
|
1
|
32
|
|
Edificio
República
|
4
|
18.5
|
399.8
|
477.4
|
-
|
-
|
|
Dot
Building
|
1
|
3.7
|
374.1
|
327.3
|
2
|
6
|
|
Suipacha
664
|
3
|
6.5
|
151.0
|
143.3
|
3
|
14
|
|
Total Offices
|
19
|
61.9
|
312.9
|
299.5
|
7
|
53
|
(1)
Includes new and
renewed agreements executed in fiscal year
2016.
(2)
Agreements stated
in US dollars converted into Pesos at the exchange rate prevailing
in the initial month of the agreement multiplied by 12
months.
(3)
Monthly
value.
(4)
Agreements stated
in US dollars converted into Pesos at the exchange rate prevailing
in the last month of the agreement, multiplied by 12
months.
(5)
Does not include
agreements of parking spaces, antennas or terrace
space.
Sales
and Development of Properties and Land Reserves
Residential Development Properties
The acquisition and
development of residential apartment complexes and residential
communities for sale is one of our core activities. Our development
of residential apartment complexes consists of the new construction
of high-rise towers or the conversion and renovation of existing
structures such as factories or warehouses. In connection with our
development of residential communities, we frequently acquire
vacant land, develop infrastructure such as roads, utilities and
common areas, and sell plots of land for construction of
single-family homes. We may also develop or sell portions of land
for others to develop complementary facilities such as shopping
areas within residential developments.
During the fiscal
year ended June 30, 2016, revenues from the development and sale of
properties segment amounted to Ps. 8 million, compared to
Ps. 15 million in the fiscal year ended June 30,
2015.
Construction and
renovation works on our residential development properties are
currently performed, under our supervision, by independent
Argentine construction companies that are selected through a
bidding process. We enter into turnkey contracts with the selected
company for the construction of residential development properties
pursuant to which the selected company agrees to build and deliver
the development for a fixed price and at a fixed date. We are
generally not responsible for any additional costs based upon the
turnkey contract. All other aspects of the construction, including
architectural design, are performed by third parties.
Another modality
for the development of residential undertakings is the exchange of
land for constructed square meters. In this way, we deliver
undeveloped pieces of land and another firm is in charge of
building the project. In this case, we receive finished square
meters for commercialization, without taking part in the
construction works.
The following table
shows certain information and gives an overview regarding our sales
and development properties as of June 30, 2016, 2015 and
2014:
|
|
|
As
of June 30,
|
|
|
Development
|
2016
|
2015
|
2014
|
|
Residential
apartments
|
|
|
|
|
Caballito
Nuevo
|
-
|
2
|
1
|
|
Condominios I y II
(1)
|
-
|
7
|
52
|
|
Horizons
(2)
|
5
|
5
|
23
|
|
Other residential
apartments
(3)
|
2
|
-
|
-
|
|
Subtotal
residential apartments
|
7
|
14
|
76
|
|
Residential
Communities
|
|
|
|
|
Abril
(4)
|
-
|
1
|
2
|
|
El
Encuentro
|
-
|
-
|
8
|
|
Subtotal
Residential Communities
|
-
|
1
|
10
|
|
Land
Reserve
|
|
|
|
|
Neuquén
|
-
|
-
|
13
|
|
Subtotal
Land Reserve
|
-
|
-
|
13
|
|
Total
|
7
|
15
|
99
|
(1)
Through IRSA
Commercial Properties.
(2)
Belongs to CYRSA
S.A.
(3)
Refers to Entre
Ríos 465 and Caballito Plot.
(4)
Includes sales of
shares in April.
72
Sale
of Investment Properties in Fiscal Year 2016 (in millions of
Ps.)
|
|
FY
2016
|
FY
2015
|
FY
2014
|
|
Revenues
|
1,175
|
2,517
|
402
|
|
Costs
|
(107)
|
(1,354)
|
(166)
|
|
Profit
|
1,068
|
1,163
|
236
|
Partial sales of “Maipú 1300”
building
In July and August
2015, 1,761 sqm were sold in the Maipú 1300 building,
consisting of four floors, at a gain of Ps.57.1 million. In
November and December 2015, 1,690 additional sqm were sold in this
building, consisting of four additional floors, generating a profit
of Ps.52.9 million.
Sale of Isla Sirgadero Land Reserve (Santa Fe)
On September 3,
2015, this 8,262,600 sqm parcel of land was sold for a total amount
of US$ 4 million, at a gain of Ps.32.3 million.
Partial Sale of Intercontinental Plaza (through IRSA Propiedades
Comerciales)
On September 10,
2015, our subsidiary IRSA CP sold 5,963 sqm consisting of seven
office floors, 56 parking spaces and 3 storage units, for a total
amount of Ps. 324.5 million, at a gain of Ps.300 million.
Moreover, on February 4, 2016, our subsidiary IRSA CP sold 851 sqm
consisting of one office floor and 8 parking spaces, at a gain of
Ps. 39.2 million.
Sale of “Dique IV” building
On December 10,
2015, IRSA sold to a non-related party the “Juana Manso
295” office building located in the “Puerto
Madero” area of the City of Buenos Aires, consisting of 8
office floors and 116 parking spaces for Ps. 649 million,
which has been fully paid as of the date of this annual report. The
gross profit from this sale was approximately Ps. 586.8
million.
Partial sale of the building to be developed in Catalinas (no
impact on results for this fiscal year)
On December 4,
2015, the company sold to Globant S.A. 4,896 sqm corresponding to
four office floors of a building to be developed in the
“Catalinas” area in the City of Buenos Aires and 44
parking spaces located in the same building. Surrender of
possession is expected within 48 months and the execution of the
title deed within 60 months, in both cases counted as from even
date.
The transaction
amount was Ps. 180.3 million and US$ 12.3 million payable
as follows: (i) Ps. 180.3 million paid on even date, (ii)
US$ 8.6 million payable in 12 quarterly installments during a
period of 3 years beginning in June 2016; and (iii) the remaining
US$ 3.7 million upon execution of the title deed.
Partial sale of the building to be developed in
“Catalinas” (no impact on results for this fiscal
year)
On April 7, 2016,
IRSA sold to its subsidiary IRSA Propiedades Comerciales S.A.
(“IRSA CP”), controlled by a 94.61% interest, 16,012
square meters, consisting of 14 floors (from 13 to 16 and from 21
to 30) intended for long term lease and 142 parking spaces of the
building to be built in the “Catalinas” area, City of
Buenos Aires. The building to be built will have a gross leaseable
area of 35,468 square meters distributed over 30 office floors and
316 parking spaces in 4 underground levels. Surrender of possession
is expected to take place in December 2019, and the deed of
conveyance is planned to be executed in December 2020.
The transaction
price was set considering two components: a “Fixed”
portion, relating to the incidence of the land over the square
meters purchased by IRSA CP, for a total amount of Ps. 455.7
million (approximately US$ 1,600 + VAT per square meter),
which was paid on that date, and a “Determinable”
portion, as to which IRSA will pass through to IRSA CP only the
actual cost of the works per square meter.
The remaining
14,820 sqm of gross leaseable area corresponding to the first 12
floors of the building are held the company since no decision has
been made between development intended for rent and/or
sale.
73
Estimated
Capital Expenditures
|
|
Developments
|
||
|
|
Greenfields
|
Expansions
|
|
|
|
Polo Dot (First
Stage)
|
Catalinas
(1)
|
Alto
Palermo
|
|
Beginning of
Works
|
FY
2017
|
FY
2017
|
FY
2017
|
|
Estimated opening
date
|
FY
2019
|
FY
2020
|
FY
2018
|
|
Total GLA
(sqm)
|
31,635
|
35,468
|
3,884
|
|
Investment amount
at 100% (million US$)
(2)
|
54
|
101
|
28.5
|
|
Investment amount
at 100% (million Ps.)
(3)
|
812.16
|
1,
519.04
|
428.64
|
|
Work progress
(%)
|
0%
|
0%
|
0%
|
________________
(1) 45% of the
development corresponds to our subsidiary IRSA Propiedades
Comerciales S.A.
(2)
The amount
corresponds to the expected total amount of the project, not only
for the Fiscal Year 17.
(3)
We have translated
U.S. dollars into Pesos at the offer exchange rate quoted by Banco
de la Nación Argentina for June 30, 2016, which was Ps.
15.04=U.S.$1.00.
Alto Palermo
Expansion
The expansion
project for the Alto Palermo shopping center adds approximately
4,000 square meters of GLA to the shopping center, which has the
highest sales per square meter and consists of moving the food
court to a third level using the area of an adjacent building
acquired in 2015. Construction works are estimated to be completed
in between 18 and 24 months.
First stage of Polo Dot
The project called
“Polo Dot”, located in the commercial complex adjacent
to our Dot Baires shopping center, has experienced significant
growth since our first investments in the area. The total project
will consist of three new office buildings (one of them could
include a hotel) in land reserves owned by IRSA CP and the
expansion of the shopping center by approximately 15,000 square
meters of gross leaseable area. In the first phase of the project,
we will develop an 11-floor office building with an area of
approximately 30,000 square meters on an existing building, in
respect of which we have already executed a lease agreement for
approximately half the available square footage, before starting
the works. Construction will begin during the next fiscal period
and is estimated to last between 18 and 24 months before the
building is operational. The second phase of the project will
include two office/hotel buildings that will add 38,400 square
meters of gross leaseable area to the complex. We have seen a
significant demand for Premium office space in our new commercial
complex and we believe that we will be able to open these buildings
with attractive rent levels and full occupancy. As of June 30,
2016, 75% of the building has already leased.
Catalinas Building
The
“Catalinas” project is located in one of the most
sought-after spots for office development in Argentina. The
building to be constructed will have 35,468 square meters of gross
leaseable area in 30 office floors and 316 parking spaces.
Construction is scheduled to begin towards the end of the current
calendar year and will take approximately three years to be
completed.
74
|
Development
|
Company
|
Interest
|
Date
of Acquisition
|
Surface
area sqm
|
Area
intended for sale sqm (1)
|
Area
intended for construction
|
Sold
(2)
|
Location
|
Accumulated
Income as of June 2016
|
Accumulated
Income as of June 2015
|
Book
Value (ARS MM)
|
|
Residential
properties
|
|
|
|
|
|
|
|
|
|
|
|
|
Available
for sale
|
|
|
|
|
|
|
|
|
|
|
|
|
Condominios del
Alto I
|
IRSA
CP
|
100%
|
04/30/1999
|
-
|
2,082
|
-
|
100%
|
Santa
Fe
|
-
|
7
|
1
|
|
Condominios del
Alto II
|
IRSA
CP
|
100%
|
04/30/1999
|
-
|
4,082
|
-
|
100%
|
Santa
Fe
|
-
|
-
|
-
|
|
Caballito
Nuevo
|
IRSA
|
100%
|
11/03/1997
|
-
|
7,323
|
-
|
100%
|
CABA
|
-
|
2
|
-
|
|
Barrio
Chico
|
IRSA
|
100%
|
03/01/2003
|
-
|
2,872
|
-
|
100%
|
CABA
|
-
|
-
|
-
|
|
El
Encuentro
|
IRSA
|
100%
|
11/18/1997
|
-
|
127,748
|
-
|
100%
|
Buenos
Aires
|
-
|
-
|
-
|
|
Abril Club de Campo
– Plots
|
IRSA
|
100%
|
01/03/1995
|
-
|
5,135
|
-
|
100%
|
Buenos
Aires
|
-
|
1
|
-
|
|
Abril Club de Campo
– Manor House
(3)
|
IRSA
|
100%
|
01/03/1995
|
31,224
|
34,605
|
-
|
100%
|
Buenos
Aires
|
-
|
-
|
2
|
|
Torres
Jardín
|
IRSA
|
100%
|
07/18/1996
|
-
|
-
|
|
-
|
CABA
|
-
|
-
|
-
|
|
Departamento Entre
Ríos 465/9
|
IRSA
CP
|
100%
|
-
|
-
|
-
|
|
100%
|
Buenos
Aires
|
1
|
-
|
-
|
|
Horizons
|
IRSA
|
50%
|
01/16/2007
|
-
|
60,232
|
-
|
100%
|
Buenos
Aires
|
5
|
5
|
1
|
|
Intangible – Receivable units
|
|
|
|
-
|
|
|
|
-
|
-
|
-
|
|
|
Beruti (Astor
Palermo)
(4)
|
IRSA
CP
|
100%
|
06/24/2008
|
-
|
2,170
|
-
|
-
|
CABA
|
-
|
-
|
33
|
|
Caballito Manzana
35
|
IRSA
|
100%
|
10/22/1998
|
-
|
6,952
|
-
|
-
|
CABA
|
-
|
-
|
52
|
|
CONIL - Güemes
836 – Mz. 99 and Güemes 902 – Mz.
95
and Retail
Stores
|
IRSA
CP
|
100%
|
07/19/1996
|
1,389
|
-
|
5,994
|
-
|
Buenos
Aires
|
-
|
-
|
5
|
|
Canteras Natal
Crespo (2 commercial parcels)
|
IRSA
|
-
|
-
|
40,333
|
-
|
-
|
-
|
Buenos
Aires
|
-
|
-
|
-
|
|
Isla
Sirgadero
(10)
|
IRSA
|
100%
|
02/16/2007
|
826,276
|
-
|
-
|
-
|
Santa
Fe
|
-
|
-
|
-
|
|
Pereiraola
(Greenville)
|
IRSA
|
100%
|
04/21/2010
|
-
|
39,634
|
-
|
-
|
Buenos
Aires
|
-
|
-
|
8
|
|
|
|
|
|
|
|
|
|
|
-
|
|
|
|
Subtotal
Residential properties
|
|
|
|
899,222
|
292,835
|
5,994
|
|
|
6
|
15
|
102
|
|
Land
Reserves
|
|
|
|
|
|
|
|
|
|
|
|
|
Pilar R8 Km
53
|
IRSA
|
100%
|
05/29/1997
|
74,828
|
-
|
-
|
-
|
Buenos
Aires
|
-
|
-
|
3
|
|
Pontevedra
|
IRSA
|
100%
|
02/28/1998
|
730,994
|
-
|
-
|
-
|
Buenos
Aires
|
-
|
-
|
2
|
|
Mariano
Acosta
|
IRSA
|
100%
|
02/28/1998
|
967,290
|
-
|
-
|
-
|
Buenos
Aires
|
-
|
-
|
1
|
|
Merlo
|
IRSA
|
100%
|
02/28/1998
|
1,004,987
|
-
|
-
|
-
|
Buenos
Aires
|
-
|
-
|
1
|
|
San Luis
Plot
|
IRSA
|
50%
|
03/31/2008
|
3,250,523
|
-
|
-
|
-
|
San
Luis
|
-
|
-
|
1
|
|
Subtotal
Land reserves
|
|
|
|
6,028,622
|
-
|
-
|
|
|
-
|
-
|
8
|
75
|
Future
Developments
|
|
|
|
|
|
|
|
|
|
|
|
|
Mixed
Uses
|
|
|
|
|
|
|
|
|
|
|
|
|
UOM Luján
(5)
|
IRSA
CP
|
100%
|
05/31/2008
|
1,160,000
|
-
|
-
|
N/A
|
Buenos
Aires
|
|
-
|
42
|
|
La
Adela
|
IRSA
|
100%
|
08/01/2014
|
10,580,000
|
-
|
-
|
N/A
|
Buenos
Aires
|
-
|
-
|
216
|
|
Predio San Martin
(Ex Nobleza Piccardo)
(6)
|
IRSA
CP
|
50%
|
05/31/2011
|
159,995
|
-
|
127,996
|
N/A
|
Buenos
Aires
|
-
|
-
|
60
|
|
Puerto
Retiro
|
IRSA
|
50%
|
05/18/1997
|
82,051
|
-
|
-
|
N/A
|
CABA
|
-
|
-
|
34
|
|
Santa María
del Plata
(7)
|
IRSA
|
100%
|
07/10/1997
|
716,058
|
-
|
-
|
N/A
|
CABA
|
-
|
-
|
223
|
|
Residential
|
|
|
|
|
|
-
|
|
-
|
-
|
-
|
|
|
Coto Abasto Air
Space
|
IRSA
CP
|
100%
|
09/24/1997
|
-
|
-
|
21,536
|
N/A
|
CABA
|
-
|
-
|
10
|
|
Neuquén
– Residential parcel
|
IRSA
CP
|
100%
|
07/06/1999
|
13,000
|
-
|
18,000
|
N/A
|
Neuquén
|
-
|
-
|
1
|
|
Uruguay
Zetol
|
IRSA
|
90%
|
06/01/2009
|
152,977
|
62,756
|
-
|
N/A
|
Uruguay
|
-
|
-
|
92
|
|
Uruguay Vista al
Muelle
|
IRSA
|
90%
|
06/01/2009
|
102,216
|
62,737
|
-
|
N/A
|
Uruguay
|
-
|
-
|
64
|
|
|
|
|
|
|
|
|
|
|
-
|
|
|
|
Retail
|
|
|
|
|
|
|
|
|
|
|
|
|
Caballito Shopping
plot
(8)
|
IRSA
CP
|
100%
|
-
|
23,791
|
-
|
-
|
N/A
|
CABA
|
1
|
-
|
4
|
|
Dot potential
expansion
|
IRSA
CP
|
80%
|
-
|
15,881
|
-
|
47,643
|
N/A
|
CABA
|
-
|
-
|
-
|
|
Offices
|
|
|
|
|
|
|
|
|
|
|
|
|
Philips Adjoining
plots - Offices 1 and 2
|
IRSA
CP
|
80%
|
11/28/2006
|
12,800
|
-
|
38,400
|
N/A
|
CABA
|
-
|
-
|
25
|
|
Baicom
|
IRSA
|
50%
|
12/23/2009
|
6,905
|
-
|
34,500
|
N/A
|
CABA
|
-
|
-
|
4
|
|
Intercontinental
Plaza II
(9)
|
IRSA
CP
|
100%
|
02/28/1998
|
6,135
|
-
|
19,598
|
N/A
|
CABA
|
-
|
-
|
3
|
|
Catalinas Norte
Plot
|
IRSA
|
100%
|
12/17/2009
|
3,649
|
-
|
35,468
|
13%
|
CABA
|
-
|
-
|
112
|
|
Subtotal
Future Developments
|
|
|
|
13,035,458
|
125,493
|
343,141
|
|
|
|
-
|
890
|
|
Total
Land Reserves
|
|
|
19,963,302
|
418,328
|
349,135
|
|
|
7
|
15
|
1,000
|
|
(1)
Saleable Area means
the housing square meters proper, excluding parking and storage
spaces. It is recorded at 100%, before making any
sales.
(2)
% Sold includes
those sale transactions for which there is a Preliminary Sales
Agreement, Possession or a Title Deed executed. Includes housing
square meters only, excludes parking and storage
spaces.
(3)
Saleable Area
includes 31,224 sqm of the plot and 4,712.81 total sqm of the Manor
House (not including 1,331.76 sqm of Ground
Floor).
(4)
Saleable Area
excludes 171 commercial parking spaces to be received and the units
as compensation.
(5)
Mixed Used
Feasibility requested, pending provincial
approval.
(6)
127,996 sqm arise
from current laws, a draft project is being made for 479,415
buildable square meters (pending approval).
(7)
Feasibility
requested for 716,058 buildable square meters, pending approval
from the Legislative body of the City of Buenos
Aires.
(8)
Draft project of
71,374 buildable square meters, pending approval of zoning
parameters.
(9)
6,135 sqm of
surface area correspond to the parcel, which includes
Intercontinental I and II.
(10)
On September 3,
2015, the entire property was sold for US$ 3.9 million, payable in
16 quarterly installments, plus an installment in kind, land
resulting from the final blueprint, equivalent to 10% of the
surface area.
76
Residential
Apartments and Lofts
In the residential
market, we acquire undeveloped properties strategically located in
densely populated areas mainly in the City of Buenos Aires,
particularly properties located near shopping centers and
hypermarkets or those to be developed. We then develop
multi-building high-rise complexes targeting the middle- and high-
income market. These are equipped with modern comforts and
services, such as open “green areas,” swimming pools,
sports and recreation facilities and 24-hour security. In the loft
buildings market, our strategy is to acquire old buildings no
longer in use located in areas with a significant middle and
upper-income population. The properties are then renovated into
unfinished lofts allowing buyers the opportunity to design and
decorate them according to their preferences.
Residential
Properties (available for Sale)
Condominios del Alto II –City of Rosario, Province of Santa
Fe (IRSA
CP
)
As of June 30,
2016, works in parcel H have been completed; and all the units
subject to the barter agreement have been received, with 13 parking
spaces available for sale.
Barrio Chico – City of Buenos Aires
This is a unique
Project located in Barrio Parque, an exclusive residential area in
the City of Buenos Aires. During May 2006, the commercialization of
the project was launched with successful results. The image of the
product was originally developed under the name “Barrio
Chico” through advertisements in the most important media. As
of June 30, 2016, the project is completed and there are 2 parking
spaces yet to be sold.
Abril – Hudson – Province of Buenos Aires
Abril is a
312-hectare private residential community located near Hudson City,
approximately 34 kilometers south of the City of Buenos Aires. We
have developed this property into a private residential community
for the construction of single-family homes targeting the
upper-middle income market. The project includes 20 neighborhoods
subdivided into 1,273 lots of approximately 1,107 square meters
each. Abril also includes an 18-hole golf course, 130 hectares of
woodlands, a 4,000-square meter mansion and entertainment and
recreational facilities. A bilingual school, horse stables and
sports centers and the construction of the shopping center were
concluded in 1999. The project is highly consolidated, and as of
June 30, 2016 there are no lots pending execution of the relevant
title deed.
“La Casona
Abril” is located in the heart of the project. It is the
antique manor of “Estancia Pereyra Iraola,” which was
built in the 1930s by architect José Mille. This French-style
palace of the XIX century has 4,700 sqm distributed over four
floors and a manicured garden of approximately 30,000
sqm.
Horizons, Vicente López, Olivos, Province of Buenos
Aires
The IRSA-CYRELA
Project, developed over two adjacent blocks, was launched in March
2008 under the name Horizons. Horizons is one of the most
significant developments in Greater Buenos Aires, featuring a new
concept in residential complexes given its emphasis on the use of
common spaces. This project includes two complexes with a total of
six buildings: one complex faces the river and consists of three
14-floor buildings, the “Río” complex, and the
other one, facing Libertador Avenue, consists of three 17-floor
buildings, the “Parque” complex, encompassing 59,000
square meters of saleable area distributed over 467 units
(excluding the units to be delivered as consideration for the
purchase of the lands). Horizons is a unique and style-innovating
residential complex offering 32 amenities, including a meeting
room, work zone, heated swimming pools, community center with spa,
sauna, gym, childrens’ room, teen room, thematically
landscaped areas, and aerobic trail. The showroom was opened to the
public in March 2008 with great success. As of June 30, 2016, the
project was fully built and two apartments and two parking spaces
are pending execution of the title deed. The stock available for
sale consists of two parking spaces and 40 storage
spaces.
Intangibles
- Units to be received under barter agreements
Beruti Plot – City of Buenos Aires (IRSA CP)
On October 13,
2010, through our subsidiary IRSA CP, and TGLT S.A.
(“TGLT”), entered into an exchange agreement in
connection with a plot of land located at Beruti 3351/59 in the
City of Buenos Aires for cash and 2,170 square meters in future
residential apartments to be constructed by TGLT on the plot. In
addition, TGLT will deliver 32 residential parking spaces and 171
commercial parking spaces to IRCP.
Caballito Plot – City of Buenos Aires (IRSA)
On June 29, 2011,
we and TGLT, a residential developer, entered into a barter
agreement for a plot of land located on Mendez de Andes street in
the neighborhood of Caballito in the City of Buenos Aires for cash
and future residential apartments to be constructed by TGLT. The
transaction was agreed upon at US$ 12.8 million. TGLT plans to
construct an apartment building with parking spaces. As
consideration, TGLT paid US$ 159,375 in cash and will transfer
to IRSA: (i) a number of apartments to be determined representing
23.10% of total square meters of residential space developed; (ii)
a number of parking spaces to be determined representing 21.10% of
total square meters of parking spaces; and (iii) if TGLT builds
complementary storage rooms, such number of storage rooms
representing 21.10% of square meters of storage spaces developed.
TGLT is committed to build, finish and obtain authorization for the
three buildings making up the project within 36 to 48 months. TGLT
mortgaged the land in favor of IRSA as guarantee.
A neighborhood
association named Asociación Civil y Vecinal SOS Caballito
secured a preliminary injunction which suspended the works to be
developed by TGLT in the abovementioned property. Once said
preliminary injunction was deemed final, the Government of the City
of Buenos Aires and TGLT were served notice of the complaint. Both
first and second instance, ruled against TGLT´s arguments. In
consequence, the permission granted to TGLT in order to build in
the area was declared null and void. TGLT and the Government of the
City of Buenos Aires filed a federal appeal on The Supreme Court of
Buenos Aires. Up to the date, the Court has not reached a decision
yet.
CONIL – Avellaneda, Province of Buenos Aires (IRSA
CP)
These plots face
Alto Avellaneda shopping center, totaling 2,398 sqm distributed in
two opposite corners and according to urban planning standards,
approximately 6,000 sqm may be built. Its intended use, either
through an owned development or sale to a third party, is
residential with the possibility of a retail space as well. In
November 2014, a Barter Deed was executed to carry out a
residential project and as consideration the Company will receive
1,365 sqm of retail stores located on the ground floors of blocks
99 and 95, at Güemes 836 and Güemes 902, respectively.
Delivery of the consideration for block 95 is expected to take
place in January 2018, and consideration corresponding to block 99
is scheduled for September 2018. The barter was value at
US$ 0.7 million.
77
Pereiraola (Greenville), Hudson – Province of Buenos
Aires
In April 2010, we
sold Pereiraola S.A., which owns certain lands adjacent to the
Abril Club de Campo that comprises 130 hectares, for US$ 11.7
million. The purchaser would develop a project that would include
the fractioning into lots, a condo-hotel, two polo fields, and
apartment buildings. The delivery to the Company of 39,634 square
meters of lots with a value of approximately US$ 3 million was
included in the sale price. At present the project is at an
advanced stage, and the 52 lots are expected to be received by the
end of 2016.
Canteras Natal Crespo, La Calera – Province of
Córdoba
On June 26, 2013,
we sold 100% of our interest in Canteras Natal Crespo S.A.
representing 50% of its capital stock, to Euromayor S.A. de
Inversiones for US$ 4,215,000 according to the following
payment schedule: US$ 3,815,000 in cash and US$ 400,000
through the transfer of approximately 40,000 sqm for business
purposes within the project to be developed on the site known as
Laguna Azul. Delivery of the non-monetary consideration is expected
in March 2017.
Land
Reserves and development properties
Other Land Reserves –Pilar, Pontevedra, Mariano Acosta, Merlo
and San Luis Plot
We grouped plots of
land with a significant surface area, the development of which is
not feasible in the short term either due to their current urban
and zoning parameters, their legal status or the lack of
consolidation of their immediate environment. This group totals
approximately 14 million sqm.
Isla Sirgadero
On September 3,
2015, this property was sold to several companies for US$ 3.9
million, payable in 16 quarterly installments, plus an installment
in kind, consisting of land resulting from the final blueprint,
equivalent to 10% of the surface area of the property.
Future
Developments
Mixed
Uses
Ex UOM – Luján, Province of Buenos Aires (IRSA
CP)
This 116-hectare
plot is located at kilometer 62 of the West Highway, at the
intersection with Route 5 and was originally purchased by us on May
31, 2008. In May 2012, IRSA CP acquired the property through a
purchase and sale agreement entered with a related party. The
current intention is to carry out a mixed-use project, taking
advantage of the environment consolidation and the strategic
location of the plot. At present, negotiations are underway to
change the zoning parameters, which would potentially make the
project feasible.
Ex Nobleza Piccardo Plant – San Martín, Province of
Buenos Aires (IRSA CP)
On March 31, 2011,
Quality Invest S.A. and Nobleza Piccardo S.A.I.C. y F. (Nobleza)
executed the title deed for the purchase of a plot of land
extending over 160,000 square meters located in the District of San
Martín, Province of Buenos Aires, currently intended for
industrial purposes and suitable in terms of characteristics and
scales for mixed-use developments. The price for the property was
US$ 33 million, 30% of which was paid at signing. A promissory note
and a first-priority mortgage was issued for the balance of the
purchase price of the property, in favor of Nobleza. The balance
plus interest at a nominal annual rate of 7.5% on the outstanding
balance was paid in full –principal plus interest- in March
2013.
Simultaneously with
execution of the title deed, the parties entered into a lease
agreement whereby Nobleza leased the whole property for a term of
up to 36 months as from May 2011. This lease agreement contained a
clause providing for partial return of the property from month
eight to month fourteen after the date of execution thereof. Prior
to expiration, an extension was executed for two to six months
which expired in December 2012, and Quality Invest S.A. obtained
usufructuary rights over half the plot. The return of the remaining
area set forth in the lease agreement, set forth in May 2014 was
once again extended until December 31, 2014. On March 2, 2015, a
Certificate was executed by Nobleza and Quality Invest S.A. for
full return of the property, and the contract relationship between
the parties was terminated.
On May 16, 2012,
the Municipality of San Martín granted a pre-feasibility
permit for commercial use, entertainment, events, offices, etc.,
which would enable performance of a mixed-use development
thereon.
Pursuant to an
Ordinance enacted on December 30, 2014, a process was initiated to
obtain a rezoning permit for the plot of land to be used mainly for
commercial purposes, which considerably expands the uses and
potential buildable square meters through new urban indicators. On
January 5, 2016, a Provincial Decree was published in the Official
Gazette, through which zoning parameters and the rezoning permit
previously obtained became effective.
As approved in the
Ordinance, on January 20, 2015, Quality Invest S.A. entered into a
Zoning Agreement with the Municipality of San Martín which
governs various issues related to applicable regulations and
provides for a mandatory assignment of square meters in exchange
for monetary contributions subject to fulfillment of certain
administrative milestones of the rezoning process. The first
monetary contribution (which amounted to Ps. 20,000,000) was paid
to the Municipality ten days after execution of the above mentioned
agreement.
Moreover, on June
27, 2016, the subdivision of the property was submitted to the
Municipality, in compliance with another relevant aspect of the
Zoning Agreement.
Solares de Santa María – City of Buenos
Aires
Solares de Santa
María is a 70-hectare property facing the Río de la Plata
in the south of Puerto Madero, 10 minutes from downtown Buenos
Aires. We are owners of this property in which we intend to develop
an entrepreneurship for mixed purposes, i.e. our development
project involves residential complexes as well as offices, stores,
hotels, sports and sailing clubs, services areas with schools,
supermarkets and parking lots.
In 2000, we
submitted a master plan for the Santa María del Plata site,
which was assessed by the Environmental Urban Plan Council (Consejo
del Plan Urbano Ambiental, “COPUA”) and submitted to
the Town Treasurer’s Office for consideration. In 2002, the
Government of the City of Buenos Aires issued a notice of public
hearing and in July 2006, the COPUA made recommendations. In
response to these recommendations, on December 13, 2006, we filed
an amendment to satisfy these recommendations, making material
amendments to our development plan, which amendments included the
donation of 50% of the site to the City of Buenos Aires for public
use and a perimetrical pedestrian walkway along the entire site on
the banks of the river.
78
In March 2007, a
committee of the Government of the City of Buenos Aires, composed
of representatives from the Legislative and Executive Branches
issued a report stating that such Committee had no objections to
our development plan and requested that the General Treasury render
a decision concerning the scope of the development plan submitted
for the project. In November 2007, 15 years after the Legislative
Branch of the City of Buenos Aires granted the general zoning
standards for the site, the authorities of the City of Buenos Aires
executed
Decree No. 1584/07,
which passed the specific ruling, set forth certain rules for the
urban development of the project, including types of permitted
constructions and the obligation to assign certain spaces for
public use and convenience.
Notwithstanding the
approval of Decree No. 1584/07 in 2007, several municipal approvals
are still pending and in December 2007, a municipal court rendered
a decision restricting the implementation of our proposed
development plan, as a result of objections lodged by a legislator
of the City of Buenos Aires, alleging the suspension of Decree No.
1584/07, and each construction project and/or the municipal permits
granted for business purposes. Notwithstanding the legality and
validity of Decree No. 1584/07, we entered into an agreement with
the Government of the City of Buenos Aires, which was sent with a
legislative bill to the Legislature of the City of Buenos Aires
under number 976-J-2010, for approval.
On October 30, 2012
a new agreement was executed with the Government of the City of
Buenos Aires, replacing all prior arrangements, whereby new
obligations were agreed. To that end, such Agreement – as
well as the previous ones – shall be countersigned and
approved by the Legislative Branch of the City of Buenos Aires. The
docket containing the Bill of Law was reserved and is pending such
legislative treatment. The Agreement provided that if by February
28, 2014 the Bill of Law was not enacted, it would become
invalidated -current status to date. In order to secure the desired
rules a new Agreement must be executed with the Government of the
City of Buenos Aires, to be subsequently confirmed by the
Legislature. Currently we have resumed conversations with the
Executive Branch through the Transportation and Urban Development
Ministry in order to discuss the subscription of a new Agreement
(which will also append the Bill of Law).
Puerto Retiro – City of Buenos Aires
Puerto Retiro is an
8.2 hectare undeveloped riverside property bounded by the Catalinas
and Puerto Madero office zones to the west, the Retiro railway
station to the north and the Río de la Plata to the south and
east. One of the only two significant privately owned waterfront
properties in the City of Buenos Aires, Puerto Retiro may currently
be utilized only for port activities. Consequently, we have
initiated negotiations with municipal authorities in order to
rezone the area. We own a 50% interest in Puerto Retiro
S.A.
On April 18, 2000,
Puerto Retiro S.A. was served with notice of a filing made by the
National Government, through the Ministry of Defense, to extend the
petition in bankruptcy of Inversora Dársena Norte S.A.
(Indarsa) to the Company. Upon request of petitioner, the court
hearing the bankruptcy case issued an injunction preventing the
Company from selling or otherwise disposing of the Puerto Retiro
land.
Indarsa had
acquired 90% of the capital stock in Tandanor from the National
Government in 1991. Tandanor’s main business involved ship
repairs performed in a 19-hectare property located in the vicinity
of La Boca neighborhood and where the Syncrolift is
installed.
As Indarsa failed
to comply with its payment obligation for acquisition of the shares
of stock in Tandanor, the Ministry of Defense filed a bankruptcy
petition against Indarsa, seeking to extend it to the
Company.
The evidentiary
stage of the legal proceedings has concluded. The Company lodged an
appeal from the injunction order, and such order was confirmed by
the Court of Appeals on December 14, 2000. The parties filed the
arguments in due time and proper manner. After the case was set for
judgment, the judge ordered the suspension of the judicial order
requesting the case records for issuance of a decision based on the
alleged existence of pre-judgmental status in relation to the
criminal case against former officials of the Ministry of Defense
and former executive officers of the Company, for which reason the
case will not be adjudicated until a final judgment is entered in
respect of the criminal case.
It has been made
known to the commercial court that the expiration of the statute of
limitations has been declared in the criminal action and the
criminal defendants have been acquitted. However, this decision was
reversed by the Criminal Court (Cámara de Casación
Penal). An extraordinary appeal was filed and rejected, therefore
an appeal was directly lodged with the Argentine Supreme Court for
improper refusal to permit the appeal, and a decision is still
pending.
The Management and
external legal counsel to Puerto Retiro believe that there are
sufficient legal and technical arguments to consider that the
petition for an extension of the bankruptcy will be dismissed by
the court. However, in view of the current status of the case, its
result cannot be predicted.
Under the records
of the proceedings for the extension of bankruptcy, Puerto Retiro
S.A. requested authorization to execute both leases with the
companies Los Cipreses S.A. and Flight Express S.A. for certain
areas of the property acquired for a term of five years each. While
authorization was granted by the lower court, the Court of Appeals
in Commercial Matters reversed such decision upon request of the
National Government and the receiver of INDARSA. Puerto Retiro S.A.
filed an extraordinary appeal that was denied.
In turn, Tandanor
filed a civil action against Puerto Retiro S.A. and the other
defendants in the criminal case for violation of Section 174 (5)
based on Section 173 (7) of the Criminal Code. Such action seeks
-on the basis of the nullity of the decree that approved the
bidding process involving the Dársena Norte property- a
reimbursement in favor of Tandanor for all such amounts it has
allegedly lost as a result of a suspected fraudulent transaction
involving the sale of the property disputed in the
case.
The answer to the
civil action was filed in due time, which contained a number of
defenses. Tandanor requested the intervention of the National
Government as third party co-litigant in this case, which petition
was granted by the Court. In March 2015 both the National
Government and the criminal complainant answered the asserted
defenses.
On July 12, 2016,
Puerto Retiro S.A. was served with notice of the decision issued by
the Federal Court (Tribunal Oral Federal) No. 5 on the defenses
asserted by all codefendants in the civil action. As regards the
defenses asserted by Puerto Retiro S.A., the court rejected the
defenses of legal defect and lack of legal standing to be sued,
while with regard to the defenses of lack of legal standing to sue
and the expiration of the statute of limitations, it decided to
postpone discussion thereof to the time of entering judgment on the
merits of the case. It should be pointed out that the defense of
legal defect so dismissed is a dilatory defense, i.e. it does not
determine a substantive matter but refers to procedural issues and
may be cured. On the contrary, the defense of lack of legal
standing to be sued, if accepted, determines the outcome of the
dispute, because such admission would establish that Puerto Retiro
S.A. should not be a party to these proceedings. Puerto Retiro S.A.
has filed an appeal (recurso de reposición) from such decision
–reserving the right to file a new appeal (recurso de
casación) against dismissal of both defenses. As regards the
defenses of lack of legal standing to sue and the statute of
limitations, they are central to the defense strategy, and because
they were not dismissed by the court, a possible consideration
thereof at final consideration of the merits of the case in our
favor could be determinative.
79
Residential
Coto Residential Project (IRSA CP)
The Company owns
approximately 23,000 sqm of air space above the Coto hypermarket
that is close to the Abasto Shopping Center in the heart of the
City of Buenos Aires. The Company and Coto Centro Integral de
Comercialización S.A. (Coto) executed and delivered a deed
dated September 24, 1997, whereby the Company acquired the rights
to receive parking units and the rights to build above of the
premises located in the block formed by Agüero, Lavalle,
Guardia Vieja and Gallo streets, in the Abasto
neighborhood.
In June 2016, a
preliminary barter agreement was signed, subject to certain
conditions, for a term of one year, at the end of which the deed
will be executed. The project will be a residential development
and, as consideration, the Company will expect to receive 3,621
square meters in apartments plus a cash payment of US$ 1 million.
The consideration for Torre I will be delivered by June 2021, while
the consideration for Torre II will be delivered by September 2022.
The value of the barter was set at US$ 7.5 million.
Córdoba Shopping Center Project (IRSA CP)
The Company owns a
few plots adjacent to the Córdoba Shopping Center with a
construction capacity of approximately 17,300 square meters in the
center of the City of Córdoba.
In May 2016, a
preliminary barter agreement was signed for 13,500 square meters of
the total construction capacity, subject to certain conditions, for
a term of one year, at the end of which the deed will be executed.
It will be a mixed residential and office project and, as part of
the consideration, the Company will receive 2,160 square meters in
apartments, parking spaces, plus the management of permits,
unifications and subdivisions in three plots. The consideration
will be delivered by May 2021 for Torre I and by July 2023 for
Torre II. The value of the barter was US$ 4 million.
Neuquén Residential parcels – Neuquén, Province of
Neuquén (IRSA CP)
Through Shopping
Neuquén S.A., we own a 13,000 sqm plot with construction
capacity per FOT of 18,000 sqm of residential properties in an area
with significant growth potential. This area is located proximate
to the recently inaugurated shopping center, a recently opened
hypermarket and a hotel to be completed in approximately
months.
Zetol S.A. and Vista al Muelle S.A. – District of Canelones
– Uruguay
In the course of
fiscal year 2009, we acquired 100% of the equity of Liveck S.A., a
company organized under the laws of Uruguay. In June 2009, Liveck
had acquired a 90% stake of the capital stock of Vista al Muelle
S.A. and Zetol S.A., two companies incorporated under the laws of
Uruguay, for US$ 7.8 million. The remaining 10% interest in
both companies is owned by Banzey S.A. These companies have
undeveloped lands in Canelones, Uruguay, close to the capital city
of Uruguay, Montevideo.
We intend to carry
out an urban project consisting of the development and
commercialization of 13 apartment buildings. This project has the
“urban feasibility” status for the construction of
approximately 200,000 sqm for a term of 10 years, which was granted
by the Mayor’s Office of the Canelones department and by its
Local Legislature. Zetol S.A. and Vista al Muelle S.A. agreed to
carry out the infrastructure works for US$ 8 million as well
as delivery of a minimum amount of sqm of properties. The
satisfaction of this commitment under the terms and conditions
agreed upon will grant an additional 10-year effective term to the
urban feasibility status.
The total purchase
price for Zetol S.A. was US$ 7 million; of which US$ 2
million have been paid. Sellers may opt to receive the balance in
cash or through the delivery of units in the buildings to be
constructed in the land owned by Zetol S.A. equivalent to 12% of
the total marketable meters to be constructed.
In addition, Vista
al Muelle S.A. owned since September 2008 a plot of land purchased
for US$ 0.83 million. In February 2010, other plots were
acquired for US$ 1 million, the balance of which was
US$ 0.28 million plus interest and will be repaid in December
2014. In December 2010, Vista al Muelle S.A. executed the title
deed of other plots for a total amount of US$ 2.66 million, of
which US$ 0.3 million were paid. The balance will be repaid by
delivering 2,334 sqm of units and/or retail stores to be
constructed or in cash.
On June 30, 2009,
the Company sold a 50% stake in Liveck S.A. to Cyrela Brazil Realty
S.A. for US$ 1.3 million. On December 17, 2010, together with
Cyrela Brazil Realty S.A. we executed a stock purchase agreement
pursuant to which we repurchased from Cyrela Brazil Realty S.A. a
50% shareholding in Liveck S.A. for US$ 2.7 million.
Accordingly, as of June 30, 2016, our stake, through Tyrus, in
Liveck is 100%.
As a result of the
plot barter agreements executed in due time between the IMC, Zetol
S.A. and Vista al Muelle S.A. in March 2014, the parcel
redistribution dealing was concluded. This milestone, as set forth
in the amendment to the Master Agreement executed in 2013,
initiates the 10-year term for the investment in infrastructure and
construction of the buildings mentioned above. At present, the
urban project and the design of the first tower are being
developed.
Retail
Caballito Plot – City of Buenos Aires (IRSA CP)
This is a property
of approximately 23,791 sqm in the City of Buenos Aires,
neighborhood of Caballito, one of the most densely populated of the
city, which we purchased in November 1997. This plot would allow to
develop up to 71,000 sqm distributed in several uses including a
shopping center , a hypermarket, a cinema complex, and several
recreation and entertainment activity areas. At present, the
Legislature of the City of Buenos Aires has received from the
Executive Branch a legislative bill project to approve the zoning
parameters corresponding to this property, currently the project is
being reviewed by several committees within the Legislature in
order to be submitted to approval through voting.
Dot Adjoining Plot – City of Buenos Aires (IRSA
CP)
On May 3, 2012, the
Government of the City of Buenos Aires, through the General Office
of Zoning Interpretation (Dirección General de
Interpretación Urbanística) approved, through a
pre-feasibility study, the parcel subdivision of the Ex-Philips
plot contingent upon the observance of the applicable building
regulations in each of the resulting parcels. In addition, all the
uses and parameters established under the municipal ordinance
previously issued by the above mentioned authority are being
observed.
On June 3, 2013, we
were given notice that the Government of the City of Buenos Aires
had approved the requested parcel subdivision of the ex-Philips
plot. As a result, the property was divided into three parcels: two
parcels of approximately 6,400 sqm each and a parcel adjoining DOT
Shopping of 15,900 sqm intended for the future extension of the
shopping center in 47,000 sqm.
80
Offices
Philips Adjoining Plots 1 and 2 – City of Buenos Aires (IRSA
CP)
These two parcels
of 6,400 sqm with construction capacity of 19,200 sqm each, are at
present a significant land reserve jointly with a plot where the
extension of Dot Baires Shopping is planned. As a result of major
developments, the intersection of Av. General Paz and the
Panamerican Highway has experienced a significant growth in recent
years. The project of theses parcels will conclude the
consolidation of this area.
Baicom Plot - City of Buenos Aires
On December 23,
2009, we acquired 50% of a parcel located in the surroundings of
the Buenos Aires Port, for a purchase price of Ps. 4.5 million. The
property’s total surface area is 6,905 square meters and
there is a construction permit associated for 34,500 square meters
in accordance with the City of Buenos Aires urban construction
rules and regulations.
On December 21,
2015, a purchase option was executed in favor of Argencons
amounting to US$ 0.5 million, plus maintenance expenses, for a
term of 12 months. The real property price at the time of execution
amounted to US$ 14 million.
Intercontinental Plaza II Plot - City of Buenos Aires (IRSA
CP)
The
Intercontinental Plaza complex is located in the heart of the
Monserrat district, situated a few meters away from the most
important avenue in the city and the financial district. It
consists of an office tower and the exclusive Intercontinental
Hotel. In the 6,135 square meter plot, it would be feasible to
develop a second office tower, including 19,600 square meters and
25 stories, that would supplement the one already erected in the
intersection of Moreno and Tacuarí streets.
Hotels
According to the
Hotel Vacancy Survey (EOH) prepared by INDEC, at June 2016, stays
at hotel and parahotel establishments were estimated at 2.7
million, 6.8% lower than the same month the previous year. Stays by
resident and nonresident travelers decreased by 11.2% and 8.0%,
respectively. Total travelers who stayed at hotels during June were
1.2 million. The number of resident and nonresident travelers
increased by 1.1% and deceased by 4.6%, respectively. Out of the
total number of travelers who stayed at hotels, 81.4% were
residents, reaching 1.0 million. The Room Occupancy Rate in June
was 34.5%, showing a slight decline compared to the same month the
previous year, and, as shown in the following chart, our
Hotel’s occupancy was over this rate. Moreover,
the Bed Occupancy Rate for the same period was 24.8%, which
represents a slight decrease compared to June 2015.
During fiscal year
2016, IRSA kept 76.34% interest in Intercontinental
hotel, 80.00% interest in Sheraton Libertador hotel and 50.00%
interest in Llao Llao. We observed a decrease in the occupancy of
our hotels due to a lower inflow of foreign and corporate
tourists.
The following chart
shows certain information regarding our luxury hotels:
|
Hotels
|
Date
of Acquisition
|
IRSA’s
Interest
|
Number
of rooms
|
Occupancy
(1)
|
Average
Price per Room Ps.
(2)
|
Fiscal
Year Sales as of June 30,
|
Book
Value
|
|||
|
2016
|
2015
|
2014
|
||||||||
|
Intercontinental
(3)
|
11/01/1997
|
76.34%
|
309
|
70.58%
|
1,694
|
195
|
143
|
124
|
58
|
|
|
Sheraton Libertador
(4)
|
03/01//1998
|
80.00%
|
200
|
73.42%
|
1,506
|
119
|
94
|
74
|
29
|
|
|
Llao Llao
(5)
|
06/01/1997
|
50.00%
|
205
|
51.15%
|
3,784
|
220
|
159
|
134
|
75
|
|
|
Total
|
-
|
-
|
714
|
65.79%
|
2,102
|
534
|
396
|
332
|
162
|
|
|
|
|
|||||||||
|
(1)
Accumulated average
in the twelve-month period.
|
|
|||||||||
|
(2)
Accumulated average
in the twelve-month period.
|
|
|||||||||
|
(3)
Through Nuevas
Fronteras S.A. (Subsidiary of IRSA).
|
|
|||||||||
|
(4)
Through Hoteles
Argentinos S.A.
|
|
|||||||||
|
(5)
Through Llao Llao
Resorts S.A.
|
|
|||||||||
Additional information about our Hotels
Hotel Llao Llao, San Carlos de Bariloche, Province of Rio
Negro
In June 1997 we
acquired the Hotel Llao Llao from Llao Llao Holding S.A. Fifty
percent is currently owned by the Sutton Group. The Hotel Llao Llao
is located on the Llao Llao peninsula, 25 kilometers from San
Carlos de Bariloche, it is one of the most important tourist hotels
in Argentina. Surrounded by mountains and lakes, this hotel was
designed and built by the famous architect Bustillo in a
traditional alpine style and first opened in 1938. The hotel was
renovated between 1990 and 1993 and has a total constructed surface
area of 15,000 sqm and 158 original rooms. The hotel-resort also
includes an 18-hole golf course, tennis courts, fitness facility,
spa, game room and swimming pool. The hotel is a member of The
Leading Hotels of the World, Ltd., a prestigious luxury hospitality
organization representing 430 of the world’s finest hotels,
resorts and spas. The Hotel Llao Llao is currently being managed by
Compañía de Servicios Hoteleros S.A., operator, among
others, of the Alvear Palace Hotel, a luxury hotel located in the
Recoleta neighborhood of Buenos Aires. During 2007, the hotel was
subject to an expansion and the number of suites in the hotel rose
to 201 rooms.
Bariloche Plot, “El Rancho,” San Carlos de Bariloche,
Province of Río Negro
On December 14,
2006, through our hotel operator subsidiary, Llao Llao Resorts
S.A., we acquired a land covering 129,533 sqm of surface area in
the City of San Carlos de Bariloche in the Province of Río
Negro. The total price of the transaction was US$7 million, of
which US$4.2 million were paid in cash and the balance of US$2.8
million was financed by means of a mortgage to be paid in 36
monthly, equal and consecutive installments of US$0.086 million
each. The land is in the border of the Lago Gutiérrez, close
to the Llao Llao Hotel in an outstanding natural environment and it
has a large cottage covering 1,000 sqm of surface area designed by
the architect Ezequiel Bustillo.
Hotel Intercontinental, City of Buenos Aires
In November 1997,
we acquired 51% of the Hotel Intercontinental from Pérez
Companc S.A. The Hotel Intercontinental is located in the downtown
City of Buenos Aires neighborhood of Montserrat, near the
Intercontinental Plaza office building. Intercontinental Hotels
Corporation, a United States corporation, currently owns 24% of the
Hotel Intercontinental. The hotel’s meeting facilities
include eight meeting rooms, a convention center and a divisible
588 sqm ballroom. Other amenities include a restaurant, a business
center, a sauna and a fitness facility with swimming pool. The
hotel was completed in December 1994 and has 309
rooms.
81
Hotel Sheraton Libertador, City of Buenos Aires
In March 1998, we
acquired 100% of the Hotel Sheraton Libertador from Citicorp Equity
Investment for an aggregate purchase price of US$ 23 million.
This hotel is located in downtown Buenos Aires. The hotel contains
193 rooms and 7 suites, eight meeting rooms, a restaurant, a
business center, a spa and fitness facilities with a swimming pool.
In March 1999, we sold 20% of our interest in the Sheraton
Libertador Hotel for US$ 4.7 million to Hoteles Sheraton de
Argentina. The hotel is currently managed by Sheraton Overseas
Management Corporation, a United States corporation.
International
Segment
Lipstick Building, New York, United States
The Lipstick
Building is a landmark building in the City of New York, located on
Third Avenue and 53rd Street, in Midtown Manhattan, New York. It
was designed by architects John Burgee and Philip Johnson (Glass
House and Seagram Buildings among other remarkable works) and it
has been named for its original elliptic form and the reddish color
of its façade. Its gross leaseable area is approximately
57,500 sqm distributed over 34 stories.
As of June 30,
2016, this building had an occupancy rate of 97.33% generating
average revenues of US$ 66.67 per sqm.
|
Lipstick
Building
|
June
30, 2016
|
June
30, 2015
|
YoY
Var
|
|
Gross Leasable Area
(sqm)
|
58,094
|
58,094
|
-
|
|
Occupancy
|
97.33%
|
91.86%
|
5.47pp
|
|
Rent
(US$./sqm)
|
66.67
|
64.74
|
2.98%
|
In March 2016, two
lease agreements were executed: one for the lease of the entire
Floor 28 and another for a portion of the basement floor, at an
average rental price of US$ 85 per square meter. This caused
occupancy to rise to over 97% of the total surface
area.
Moreover, we
successfully completed the building’s certification process
and obtained the LEED EB: O&M Gold certification. The
implementation of this project started in July 2015, and it
successfully achieved a certification that certifies compliance
with the best environmental practices, transforming the
building’s operational standards.
Finally, in the
southern wing of the lobby there is an exhibition since September
2014 showcasing part of the work and life of the celebrated
Argentine architect César Pelli. The exhibition has been
conceived, designed and executed in close cooperation with
César Pelli’s architectural firm.
Investment in Condor HospitalityTrust
We hold our
investment in the Condor Hospitality Trust hotel REIT (NASDAQ:CDOR)
through our subsidiary Real Estate Strategies, L.P.
(“RES”), in which we hold a 66.3% interest. Condor is a
REIT listed on Nasdaq and is focused on middle-class and long-stay
hotels, in various states throughout the United States, which are
operated by various operators and franchises such as Comfort Inn,
Days Inn, Hampton Inn, Holiday Inn, Sleep Inn and Super 8, among
others.
During recent
months, Condor’s results have shown an improvement in
operating levels and it has continued to deploy its strategy of
selectively disposing of lower-class hotels at very attractive
prices and replacing them with higher-class hotels.
In March 2016,
Condor exchanged its Class C preferred shares for newly issued
Class D preferred shares. In this new issue, “Stepstone Real
Estate” joined as new partner to the investment by
contributing US$ 30 million, which were used to retire the
Class A and B Preferred shares and to acquire new
hotels.
The new Class D
preferred shares accrue interest at an annual rate of 6.25% and
will be convertible into common shares at a price of US$ 1.60
per share at any time upon the occurrence of an event of
capitalization with respect to Condor.
Condor’s
board of directors will be composed of four directors nominated by
the Company, three by Stepstone and two independent directors.
Moreover, the Company’s voting rights in Condor represent 49%
of its total voting rights as of the date of this annual
report.
Financial
Operation and Others Segment
Our interest in Banco Hipotecario
As of June 30,
2016, we held a 29.91% interest in Banco Hipotecario. Established
in 1886 by the argentine government and privatized in 1999, Banco
Hipotecario has historically been Argentina’s leading
mortgage lender, provider of mortgage-related insurance and
mortgage loan services. All of its operations are located in
Argentina where it operates a nationwide network of 62 branches in
the 23 Argentine provinces and the City of Buenos Aires, and 15
additional sales offices. Additionally, its subsidiary Tarshop S.A.
has 24 sales offices.
Banco Hipotecario
is an inclusive commercial bank that provides universal banking
services, offering a wide variety of banking products and
activities, including a wide range of individual and corporate
loans, deposits, credit and debit cards and related financial
services to individuals, small-and medium-sized companies and large
corporations. As of June 30, 2016, Banco Hipotecario ranked
fifteenth in the Argentine financial system in terms of
shareholders’ equity and in terms of total assets.
As of June 30, 2016, Banco Hipotecario’s shareholders’
equity was Ps. 5,816.2 million, its consolidated assets were
Ps. 40,527.3 million, and its net income for the twelve-month
period ended June 30, 2016 was Ps. 1,115.3 million. Since
1999, Banco Hipotecario’s shares have been listed on the
Buenos Aires Stock Exchange in Argentina, and since 2006 it has had
a Level I ADR program.
Banco Hipotecario
continues to deploy its business strategy of diversifying its loan
portfolio. As a result, non-mortgage loans increased from
Ps. 10,708 million as of December 31, 2013 to
Ps. 14,845.9 million as of December 31, 2014,
Ps. 17,944.7 million as of December 31, 2015 and
Ps. 19,339.6 million as of June 30, 2016, increasing the
composition of its aggregate loan portfolio to the non-financial
private sector from 82.8% as of December 31, 2013 to 88.7% as of
June 30, 2016. Non-performing loans represented 2.1% of its total
portfolio as of June 30, 2016.
Furthermore, Banco
Hipotecario has diversified its funding sources, by developing its
presence in the local and international capital markets and
increasing its deposit base. Its financial debt represented 35.2%
of the total financing as of June 30, 2016.
Its subsidiaries
include BACS Banco de Crédito y Securitización S.A., a
bank specialized in investment banking, securitization and asset
management, BHN Vida S.A., a life insurance company, BHN Seguros
Generales S.A., a fire insurance company for home owners and
Tarshop S.A., a company specialized in the sale of consumer
financing products and cash advances to non-banking
customers.
82
Operation Center in Israel.
Investment
in IDB Development Corporation
Acquisition of Control of IDBD
On May 7, 2014, the
Company, acting indirectly through Dolphin, acquired, jointly with
E.T.H.M.B.M. Extra Holdings Ltd. (“ETH”, company
incorporated under the laws of the State of Israel) controlled by
Mordechay Ben Moshé, entered into a transaction to acquire an
aggregate of 106.6 million common shares in IDBD representing
53.30% of its stock capital, in the context of a debt restructuring
transaction related to IDBD’s holding company, IDBH..Under
the terms of the agreement, Dolphin and ETH executed a
Shareholders’ Agreement and Dolphin and ETH each acquired a
50% interest in IDBD. The initial amount invested by each Company
was NIS 950 million, equivalent to approximately US$272 million at
the exchange rate prevailing on that date. On October 11, 2015,
IFISA (a company indirectly controlled by Eduardo S. Elsztain)
acquired ETH, and the directors appointed by ETH in IDBD tendered
their irrevocable resignation from the Board of Directors and
Dolphin became entitled to appoint new board members. Since that
date, we started to consolidate IDBD into our results of
operations. As of the date of this annual report, the investment
made from IRSA in IDBD is US$ 515 million, and IRSA’s
indirect equity interest reached 68.3% of IDBD’s undiluted
stock capital.
Tender Offers
On March 31, 2016,
Dolphin satisfied its commitments under the amendment to the debt
restructuring agreement of IDBD’s controlling company, IDBH,
with its creditors (the “Arrangement”). Such amendment
was approved by 95% of IDBD’s minority shareholders on March
2, 2016 and by the competent court on March 10, 2016. As a result,
as of March 3, 2016: (i) Dolphin purchased all the shares held by
IDBD’s minority shareholders; (ii) all the warrants held by
IDBD’s minority shareholders expired; and (iii) Dolphin made
additional contributions to IDBD in the form of a subordinated
loan, as described below.
The price paid for
each IDBD share to holders of record as of March 29, 2016 was: (i)
NIS 1.25 million in cash, resulting in a total payment of NIS 159.6
million (US$42.2 million); (ii) NIS 1.20 per share through the
subscription and delivery of IDBD’s Series 9 bonds
(“IDBD Bonds”) that was paid by Dolphin at par;
therefore, it subscribed bonds for NIS 166.5 million, including the
payments due to warrant holders (as detailed below); and (iii) the
commitment to pay NIS 1.05 million (subject to adjustment) in cash
if Dolphin receives authorization to assume control of Clal
Insurance Company Ltd. and Clal Insurance Business Holdings Ltd. or
IDBD sells its interest in Clal for a sale price per Clal share in
excess of 75% of its book value Dolphin being would be required to
pay approximately NIS 155.8 million (approximately US$40.8 million)
in aggregate.
Any warrants held
by minority shareholders that were not exercised as of March 28,
2016, would be convertible at a price equal to the difference (if
positive) between NIS 2.45 and the warrant exercise price, and
payable in IDBD Bonds.
In addition,
Dolphin made a capital contribution of NIS 348.4 million into IDBD,
in exchange for a subordinated loan, convertible into
shares.
As security for
payment of each cash due to Clal shareholders, on March 31, 2016,
Dolphin gave a pledge over 28% of the stock capital in IDBD it owns
and its rights under a NIS 210 million subordinated loan made on
December 1, 2015 due from IDBD. If IDBD issues new shares,
additional shares shall be pledged until reaching 28% of
IDBD’s total stock capital.
Dolphin has
committed to abstain from exercising its right to convert the
subordinated loan into IDBD shares until the above mentioned pledge
is released. However, if the pledge is enforced, the
representatives of IDBH’s creditors will be entitled to
convert the subordinated debt into IDBD shares, up to a maximum of
35% of all IDBD shares outstanding.
On April 3, 2016,
IDBD’s shares were delisted from the TASE and all the
minority warrants were cancelled. IDBD continues to be listed on
TASE as a “Debentures Company” pursuant to Israeli law,
as it has bonds listed on such exchange.
Within the
Operations Center in Israel, the Company operates in the following
segments.
Real Estate
Includes the assets
and operating income generated by PBC and its subsidiaries. PBC is
mainly engaged in the operation of income producing properties and
in residential construction primarily in Israel and other parts of
the world. In rental properties, PBC is the exclusive owner of the
HSBC building located on Fifth Avenue in Manhattan. The building
has an area of approximately 80,000 square meters. At present, the
building is fully occupied by renowned tenants who have lease
agreements in place for periods ranging from 10 to 15 years. In
addition, PBC has partnered with IDBD in two projects based in Las
Vegas (through IDBG Ltd.), including a commercial and office
project known as Tivoli.
The PBC group is
one of the largest and most experienced real estate developers in
Israel. Most of its activities involve income generating assets and
residential entrepreneurship in Israel and overseas, with
additional activity in the agriculture sector, through its
subsidiary Mehadrin. In this regard, PBC engages in: (i) income
producing properties, consisting of development, construction,
rental and management of hi-tech parks, business and industrial
parks, office buildings, commercial centers and industrial
buildings, storage facilities and parking lots in high demand areas
throughout Israel; and (ii) residential entrepreneurship,
consisting of the development, planning, construction and sale of
quality residential projects and neighborhoods in high demand areas
throughout Israel. PBC also has reserves of land for construction.
Our Real Estate segment generated operating income of Ps.617
million for the fiscal year ended June 30, 2016, representing 86%
of our consolidated operating income for the Operations Center in
Israel for such year.
PBC owns
approximately 1.13 million square meters of
income-producing properties in Israel, with an occupancy rate of
97%, with most tenants being quality tenants with long-term leases
that provide a strong and steady cash flow. In addition, PBC owns
land reserves of approximately 700,000 square meters with building
rights for the construction of income-producing properties in
Israel. In the Residential Construction Segment in Israel, PBC
operates, as of June 30, 2016 (in some of the projects together
with partners) in 9 sites around the country, on which 1,320
residential units are in various stages of marketing and
construction and 820 have been sold.
PBC owns several
subsidiaries, the largest of which are: Gav-Yam, Nave-Gad, Ispro
and the joint venture Mehadrin.
·
Gav-Yam
(approximately 69% ownership stake) is one of Israel’s
largest and longest-standing real estate companies. Gav-Yam, itself
and through its subsidiaries, deals in income-producing property,
initiating, planning, developing, building, marketing, leasing,
maintaining and managing hi-tech parks, commercial and industrial
parks, office buildings, retail areas, storage buildings, and
parking lots in high-demand locations throughout
Israel.
·
Nave-Gad
(wholly-owned) is engaged in the planning, development and
construction of quality residential neighborhoods. All
neighborhoods are developed as unique all-inclusive
“residential parks” that include various components of
full environmental development and associated community services
(public parks, trails, pavements and parking
lots).
·
Ispro
(wholly-owned) is engaged in the management, maintenance and
development of commercial centers and malls, primarily power
centers in areas of high demand. Ispro initiates various commercial
projects on land it owns.
·
Mehadrin
(approximately 45% ownership stake) is Israel’s largest
exporter of citrus fruit. In addition, Mehadrin is engaged in a
wide range of agriculture-related activities including planting,
cultivating, packing and processing fruits and vegetables,
refrigeration services, storage and marketing.
83
PBC’s foreign
operations consist of income generating assets and residential
properties in the United States, India and England. In India, it
develops and markets residential neighborhoods, together with
partners, in the Indian city of Chennai. In addition, PBC is a
partner in three Hilton hotels in the cities of London, Birmingham
and Cardiff, England, together totaling 2,050 hotel rooms and
conference facilities. All foreign operations are executed in
cooperation with local partners in such a manner that allows
efficient utilization of PBC’s extensive experience and
capabilities, combined with the familiarity with relevant markets
and advantages of the local partners.
As at June 30,
2016, PBC engages in marketing, construction and planning income
producing properties in Israel of which the main projects are the
following:
·
MATAM-Yam.
MATAM, a subsidiary of Gav
Yam, is developing a new project with an above-ground space of
10,000 sqm, on a lot acquired in 2015, at the south-western edge of
the MATAM Haifa Park. In addition, MATAM is expanding the
above-ground parking lot. This expansion, which will add 22,000
square meters of space, will accommodate 815 parking spaces. After
completion of this phase, the above-ground parking structure in
MATAM Park will accommodate 2,100 parking spaces, with a total area
of 56,000 sqm.
·
Gav Yam Park, Rehovot.
Gav Yam and the
Weizmann Institute are the joint owners Gav Yam Park in Rehovot
(PBC 72% and the Weizmann Institute 28%). In light of the existing
demand in the park, in the first quarter of 2016 Gav Yam started
marketing and construction of an additional building in the park
(the fourth building), with an above ground area of 15,000 sqm and
13,000 sqm of underground parking area.
·
Ispro Planet.
This is an entertainment
and retail project in Beer-Sheva being built in two phases. The
first phase includes a Cinema Multiplex and a large entertainment
facility, restaurants and retail shops and the second phase
consists of a Power Center. During the first half of 2016, the
leasing and the construction of Stage A of the project
continued. This stage consists of 18 cinema halls for
the Yes Planet chain, with 3,400 seats and an IMAX screen, as well
as commercial areas and Big Boxes, with total GLA of approximately
28,000 sqm of which approximately 86% have been leased up and was
opened to the public at the end of June 2016.
·
Modi’in – logistics
building.
In July 2016, Gav-Yam completed the construction
of a logistics building with an area of approximately 7,000 sqm
above ground, which is fully rented.
·
Totzeret Ha’Aretz –
Tel-Aviv.
Gav Yam and Amot Investments Ltd.
(“Amot”), jointly own the rights (in equal shares) in
adjacent plots of land with an overall area of approximately 17
dunams on Totzeret Ha’Aretz, Yigal Alon and Derech Shalom
Streets in Tel-Aviv, which include existing rights for the
construction of a project with approximately 53,000 sqm of
constructed floor space. During the second quarter of 2016,
construction and marketing of the Phase A building with an above
ground area of 53,000 sqm. started and the construction of the
underground parking area, with an overall area of approximately
31,600 sqm, providing approximately 950 parking places, continued.
At the same time, and according to an agreement that was signed
with the Tel Aviv Municipality, Gav-Yam and Amot filed a building
plan under district committee jurisdiction for the addition of
rights for 130,000 square meters (gross) above-ground on 70 floors,
the addition of 2,000 parking spaces and approval of the
designation of offices, commercial space and hotel
areass.
·
Gav-Yam Negev Park – The third
building.
Gav-Yam is developing the third building in the
park with an above ground area of 15,000 sqm. The two first
buildings in the park, with an area of 33,000 sqm are completed and
rented.
Second office tower at the Kiryat Ono
Mall.
In the first half of 2016, PBC and Amot (in joint
venture) continued the construction of a second office tower above
the Kiryat Ono Mall, with an area of approximately 7,400 sqm of
office space and 1,500 sqm of commercial space. The construction is
expected to be completed during the third quarter of
2016.
The following are
the main overseas activities in which PBC is involved:
HSBC Tower in New York.
The HSBC tower,
with an area of 80,000 square meters, is located on Fifth Avenue in
Manhattan, New York. The tower is leased to quality tenants, such
as HSBC, the law firm Baker Mckenzie and various financial
entities, for long periods. The tower is 100%
leased. HSBC Bank is considering alternative leasing
possibilities, including extending its lease in the
Tower. At the end of 2015, we presented a proposal for
the extension of HSBC Bank’s lease agreement, which is being
reviewed by the parties.
GW project (“Tivoli”) in Las
Vegas.
A commercial and office project (we own a 50%
interest through IDBG) that is divided into three stages –
the first stage (Triad A) of the Tivoli project includes about
19,000 square meters of commercial areas and about 15,000 square
meters of offices. As at June 30, 2016, the occupation rate was
84%. The second part of the project (Triad B) is under construction
and marketing and it is planned to include 14,000 square meters of
commercial areas and 14,000 square meters of offices. To date,
lease agreements have been signed in Triad B with an anchor lessee
and other lessees with respect to 11,000 square meters of available
area. The opening of triad B is expected in November 2016. The
construction of Triad B is currently financed by US$50 million
credit facility granted at December 2015 by the company to IDBG,
based on the approval in September 2015 at the General Meeting of
the Shareholders of the Company. As of the date of their
annual report, US$38 million of the said facility has been
disbursed.
India.
PBC’s activity in India is
conducted together with partners (PBC’s share is 45%). The
activity presently focuses on a residential project in Chennai,
being built in stages. As of the date of their annual
report, three buildings were offered for sale – two buildings
including 390 units, of which 340 units were sold, are to be
delivered in the second half of 2017 and the third building, which
includes 160 units, of which 40 units were sold, is expected to be
delivered during 2018. In the first half of 2016, 65 units had been
sold in the project in Chennai compared with 50 units in the
corresponding period in 2015. In January 2016, the remaining rights
in the Hyderabad project were sold for a consideration of US$34
million.
84
The following are
the main Investment Properties of PBC as of June 30,
2016:
|
|
|
Initial
costs
|
Subsequent
costs
|
|
Costs
at end of the year
|
|
|
|
|
|
|
|
|
|
|
|
||||||||||||||
|
Name
|
Encum-brances
|
Plot
of land
|
|
Buildings,
facilities and improvement
|
Improve-ments
/ Additions
|
|
Plot
of land
|
|
Buildings,
facilities and improvements
|
|
Total
|
|
Accumu-lated
depreciation
|
|
Net
book amount
|
|
Date
of construction
|
|
Date
of acquisition
|
|
Useful
life as of 06.30.16
|
|||||||||
|
|
|
|
|
|
|
|
|
|
|
|
|
|
|
|
|
|
|
|
|
|
|
|||||||||
|
Tivoli
|
Mortgage
|
171
|
|
1,241
|
-
|
|
124
|
|
1,969
|
|
2,093
|
|
(46)
|
|
2,047
|
|
apr-2011
|
|
oct-2015
|
|
35
|
|||||||||
|
Kiryat Ono
Mall
|
Mortgage
|
316
|
|
696
|
8
|
|
502
|
|
1,115
|
|
1,617
|
|
(19)
|
|
1,598
|
|
nov-2007
|
|
oct-2015
|
|
72
|
|||||||||
|
Shopping Center
Modi’in A
|
Mortgage
|
223
|
|
289
|
-
|
|
354
|
|
459
|
|
813
|
|
(8)
|
|
805
|
|
aug-2005
|
|
oct-2015
|
|
81
|
|||||||||
|
HSBC
|
Mortgage
|
5,471
|
|
1,778
|
-
|
|
8,337
|
|
2,962
|
|
11,299
|
|
(74)
|
|
11,225
|
|
1927-1984
|
|
oct-2015
|
|
35
|
|||||||||
|
Matam park -
Haifa
|
Mortgage
|
544
|
|
2,685
|
480
|
|
910
|
|
4,842
|
|
5,752
|
|
(90)
|
|
5,662
|
|
1979-2015
|
|
oct-2015
|
|
63
|
|||||||||
|
Caesarea -
Maichaley Carmel
|
-
|
142
|
|
230
|
-
|
|
226
|
|
365
|
|
591
|
|
(8)
|
|
583
|
|
jun-1905
|
|
oct-2015
|
|
76
|
|||||||||
|
Herzeliya
North
|
-
|
777
|
|
1,025
|
856
|
|
1,498
|
|
2,662
|
|
4,160
|
|
(35)
|
|
4,125
|
|
1996-2015
|
|
oct-2015
|
|
89
|
|||||||||
|
Gav-Yam Center -
Herzeliya
|
Mortgage
|
748
|
|
817
|
-
|
|
1,187
|
|
1,297
|
|
2,484
|
|
(35)
|
|
2,449
|
|
1997-2006
|
|
oct-2015
|
|
64
|
|||||||||
|
Neyar Hadera
Modi’in
|
-
|
186
|
|
248
|
-
|
|
295
|
|
393
|
|
688
|
|
(8)
|
|
680
|
|
jun-1905
|
|
oct-2015
|
|
84
|
|||||||||
|
Gav yam park - Beer
Sheva
|
Mortgage
|
34
|
|
402
|
16
|
|
54
|
|
658
|
|
712
|
|
(12)
|
|
700
|
|
jul-1905
|
|
oct-2015
|
|
97
|
|||||||||
|
Hazomet Kfar
Saba
|
-
|
-
|
|
74
|
-
|
|
-
|
|
117
|
|
117
|
|
-
|
|
117
|
|
jun-1905
|
|
oct-2015
|
|
50
|
|||||||||
|
Bilu
|
-
|
-
|
|
54
|
-
|
|
-
|
|
86
|
|
86
|
|
-
|
|
86
|
|
jun-1905
|
|
oct-2015
|
|
35
|
|||||||||
|
Mazkeret
Batia
|
-
|
-
|
|
69
|
-
|
|
-
|
|
109
|
|
109
|
|
-
|
|
109
|
|
jul-1905
|
|
oct-2015
|
|
50
|
|||||||||
|
Netania
|
-
|
-
|
|
525
|
23
|
|
-
|
|
861
|
|
861
|
|
(12)
|
|
849
|
|
jun-1905
|
|
oct-2015
|
|
31
|
|||||||||
|
Rishon Le
Zion
|
-
|
-
|
|
44
|
-
|
|
-
|
|
70
|
|
70
|
|
-
|
|
70
|
|
may-1905
|
|
oct-2015
|
|
35
|
|||||||||
|
Rehovot
|
-
|
-
|
|
69
|
13
|
|
-
|
|
125
|
|
125
|
|
-
|
|
125
|
|
jun-1905
|
|
oct-2015
|
|
35
|
|||||||||
|
Mizpe
Sapir
|
-
|
-
|
|
78
|
-
|
|
-
|
|
128
|
|
128
|
|
(4)
|
|
124
|
|
jun-1905
|
|
oct-2015
|
|
35
|
|||||||||
|
Holon
|
-
|
191
|
|
15
|
-
|
|
303
|
|
24
|
|
327
|
|
-
|
|
327
|
|
jan-1969
|
|
oct-2015
|
|
25
|
|||||||||
|
Haifa
|
-
|
15
|
|
-
|
-
|
|
24
|
|
-
|
|
24
|
|
-
|
|
24
|
|
jan-1970
|
|
oct-2015
|
|
25
|
|||||||||
|
Others
|
-
|
1,781
|
|
3,938
|
195
|
|
3,018
|
|
5,830
|
|
8,848
|
|
(89)
|
|
8,759
|
|
N/A
|
|
oct-2015
|
|
N/A
|
|||||||||
|
Total
Rental properties
|
|
10,599
|
|
14,277
|
1,591
|
|
16,832
|
|
24,072
|
|
40,904
|
|
(440)
|
|
40,464
|
|
|
|
|
|
|
|||||||||
|
Undeveloped
parcels of land
|
|
|
|
|
|
|
|
|
|
|
|
|
|
|
|
|
|
|
|
|
|
|||||||||
|
Tivoli
|
-
|
15
|
|
-
|
-
|
|
24
|
|
-
|
|
24
|
|
-
|
|
24
|
|
apr-2011
|
|
oct-2015
|
|
-
|
|||||||||
|
Queensridge
Towers
|
-
|
223
|
|
-
|
-
|
|
266
|
|
-
|
|
266
|
|
-
|
|
266
|
|
apr-2011
|
|
oct-2015
|
|
-
|
|||||||||
|
Zarchini
Raanana
|
-
|
-
|
|
49
|
-
|
|
-
|
|
78
|
|
78
|
|
-
|
|
78
|
|
-
|
|
oct-2015
|
|
-
|
|||||||||
|
Kurdani
|
-
|
-
|
|
-
|
-
|
|
-
|
|
-
|
|
-
|
|
-
|
|
-
|
|
-
|
|
oct-2015
|
|
-
|
|||||||||
|
Others
|
-
|
1,056
|
|
5
|
-
|
|
1,785
|
|
-
|
|
1,785
|
|
(8)
|
|
1,777
|
|
N/A
|
|
oct-2015
|
|
N/A
|
|||||||||
|
Total
undeveloped parcels of land
|
|
1,294
|
|
54
|
|
|
2,075
|
|
78
|
|
2,153
|
|
(8)
|
|
2,145
|
|
|
|
|
|
|
|||||||||
|
Tivoli
|
-
|
-
|
|
1,170
|
103
|
|
-
|
|
1,981
|
|
1,981
|
|
-
|
|
1,981
|
|
in
progress
|
|
oct-2015
|
|
-
|
|||||||||
|
Ispro Planet
– Beer Sheva – Phase 1
|
-
|
154
|
|
294
|
296
|
|
245
|
|
817
|
|
1,062
|
|
-
|
|
1,062
|
|
in
progress
|
|
oct-2015
|
|
-
|
|||||||||
|
Others
|
-
|
149
|
|
245
|
-
|
|
191
|
|
689
|
|
880
|
|
-
|
|
880
|
|
in
progress
|
|
oct-2015
|
|
N/A
|
|||||||||
|
Total
properties under development
|
|
303
|
|
1,709
|
399
|
|
436
|
|
3,487
|
|
3,923
|
|
|
|
3,923
|
|
|
|
|
|
|
|||||||||
Supermarkets
This division
includes the assets and operating income of Shufersal. Shufersal,
established in 1958, is Israel’s largest retail chain and the
owner of the largest supermarket chain in Israel in terms of sales
volume, operating 270 supermarkets nationwide, within an
approximate aggregate area of 503,000 square
meters. Shufersal employs approximately 12,300
employees. In recent years, Shufersal has introduced and continues
developing strategic processes and structural changes seeking to
optimize profitability, strengthen its market leading position, and
address the challenges of the business and regulatory environment
where it operates. Shufersal separated its real estate business
from its retail business, and formed Shufersal Real Estate Ltd., a
wholly-owned subsidiary whose assets include branches that are
leased to Shufersal and real estate property leased to third
parties.
Among its other
branches, Shufersal owns the Mega chain, the largest supermarket
chain in Israel. Our Supermarkets segment generated operating
income of Ps. 424 million for the fiscal year ended June 30, 2016,
representing 59% of our consolidated operating income for the
Operations Center in Israel for such year.
Shufersal operates
five different retail formats throughout Israel:
(i)
Shufersal Sheli: a
chain of 107 neighborhood stores providing customer shopping needs,
while vigilantly maintaining convenience, availability, freshness
and service;
(ii)
Shufersal Deal: a
chain of 74 discount stores that offers low-priced products
throughout the year;
(iii)
Yesh: a chain of 54
competitive discount stores addressing different populations by
matching products to customers, and by offering special
kashruth;
(iv)
Shufersal Express:
a chain of 13 convenience stores; and
(v)
Shufersal Online
(former Shufersal Yashir): a service that markets products directly
to the customer’s home or office, with orders taken via the
internet, phone or fax.
Shufersal puts
great effort into producing its private label to provide customers
with a brand that meets high quality standards, is competitively
priced and is adapted to Israeli consumer tastes. The brand
currently includes about 1,400 products. Shufersal’s Loyalty
Club is the leading loyalty club in Israel with 1.4 million
members. Club members enjoy cash coupons, accumulated bonuses,
discounts and special offers.
As part of its
strategic plan, Shufersal, together with Leumi card and Paz,
launched the Shufersal credit card in October 2006. The card
provides customers with a non-banking credit framework, as well as
special offers and benefits. “Yesch” Credit Card for
“Yesch” customers was launched in August 2009 and
offers the same benefits.
Shufersal also owns
a sophisticated 40,000 m2 logistics center in Rishon Lezion in
addition to distribution centers in Kfar Vitkin, Ramle, and
Kadima.
85
Shufersal engages
in income-generating real estate, leasing commercial centers and
other properties through several subsidiaries: Shufersal Bailsol
Investments Ltd. (50% owned); Merkaz Hakirya (Ashdod 1995) Ltd.
(50%); and Lev Hamifratz Ltd. (37%).
Although
Shufersal’s main operations is retail, it also operates in
two other sectors: real estate and credit card customer’s
club management. In income-generating real estate activity,
Shufersal engages in leasing commercial centers and other
properties. As part of its strategic plan, Shufersal is also active
in managing a customer credit club through which it offers credit
cards to the public that provide a non-bank credit framework, as
well as special offers and benefits to customers.
During 2016,
Shufersal continued to carry out its business plan, which is
intended to create a growth-oriented commercial and operational
infrastructure for the years to come, to reinforce its
competitiveness, to improve value offered to customers, and to
improve service. As its main distribution center, Shufersal owns a
sophisticated 40,000 m2 logistics center in Rishon Lezion in
addition to distribution centers in Kfar Vitkin, Ramle, and
Kadima.
In recent years,
Shufersal has performed, and continues performing, strategic
processes and structural changes, with the aim of optimizing its
operations, strengthening its market leadership, and dealing with
challenges it faces in its business and regulatory environment. As
part of its strategies, Shufersal is focused in the development of
its digital market platforms, of which the main one is Shufersal
Online. During 2016, there was a significant increase in
Shufersal’s sales through Shufersal Online.
During 2015,
Shufersal continued to implement its business plan, as approved by
its Board of Directors in July 2014, as follows:
·
The developments in
the Mega chain led, in addition to the sale of Mega stores that
operated in the discount format to various third parties, the
closing of its online platform and a one-off closing of all of its
branches by Mega’s employees, led to the loss of consumers.
Shufersal adapted its operations to these changes at the Mega
chain, and the impact of the competitive landscape. Shufersal
continues to monitor the effects on Mega’s results, and is
preparing to address multiple scenarios, including increased
competition in the discount market and a potential purchase of
Mega’s stores in city centers by chains that operate in the
discount market, which may lead to greater competition. In the
first half of 2016, Shufersal continued to monitor and prepare
various scenarios regarding the change in ownership of Mega city
center stores.
·
The continued
expansion and strengthening of Shufersal’s private label
brand as a part of its strategy, including the launch of new
products in leading categories, such as the milk and meat. Sales of
Shufersal’s own branded products in 2015 were approximately
15% of all retail sales, an increase of 11.5% compared with sales
in 2014.
·
The continued
development of Shufersal’s digital platforms, of which the
main one is “Shufersal Online” and the cellular
application, and the streamlining of the operating processes with
regard to the distribution system of “Shufersal
Online.” There has been a significant increase in
Shufersal’s sales through Shufersal Online, and they
constituted approximately 6% of total sales in 2015 (compared with
approximately 4% in 2014). During the first half of 2016, Shufersal
continued to accelerate the development of its digital platform and
to open special warehouses to support those sales. In the first
half of 2016, Shufersal Online sales accounted for approximately
8.6% of Shufersal’s total sales.
·
The continued
streamlining of real estate in accordance with the business plan,
which includes the closing and downsizing of retail
stores.
·
In 2015, Shufersal
continued its efforts to complete the change in the supply chain
system, and during the first quarter of 2016 it began the gradual
operation of its new logistics center in Shoham, that began
operating on February 2016.
·
Various regulatory
developments, such as an increase in the minimum wage, the first
installment of which came into effect in April
2015.
·
Shufersal performed
a renewed evaluation of branches with operational and cash flow
losses, and concluded that 15 stores out of all evaluated branches
(which are mainly leased through operational leases) no longer
contribute or make a viable contribution, either in operational
and/or strategic terms, to the geographical region (the cash
generating unit) with which they are
associated. Shufersal decided to close 14 stores, and to
reduce the size of the store network it owns.
·
For the purpose of
the impairment test, Shufersal branches are combined into
geographical regions which constitute separate cash generating
units. Based on Shufersal’s strategy, the closure of stores
may result in a reduction in profitability of other stores located
in the same geographical area. In light of the foregoing, the
impairment test for retail activity is performed on a regional
level, and the recoverable amount is calculated for the cash
generating unit.
Agrochemicals
Includes income
from the associate of IDBD, Adama. Adama is a worldwide leader in
active ingredients used in agricultural production. Adama became a
private company owned by ChemChina (60%) and Koor
(40%).
Adama is one of the
leading generic brand crop protection companies in the world. Adama
has a heritage dating back 70 years and strives to develop products
to simplify and optimize agricultural production, offering farmers
products and services that optimize crop yields. Adama has a
comprehensive range of high-quality, innovative and effective crop
protection products, including herbicides, insecticides,
fungicides, plant growth regulators and seed treatments, designed
to improve the quality and quantity of crop yields by preventing or
controlling harmful, insects and disease. Adamas’
comprehensive product portfolio includes more than 270 active
ingredients and more than 1,000 end-use products. Our Agrochemicals
segment generated an income of Ps. 334 million from the investment
in Adama for the fiscal year ended June 30, 2016.
Adama’s 4,900
employees reach farmers in more than 120 countries with its main
customers in Europe, North America, Latin America, Asia-Pacific,
India, the Middle East and Africa. As of the date of this annual
report, Adama is ranked as the leading company in the world
focusing on non-patent protected active materials used crop
protection products. Adama has 19 production facilities for
synthesis and formulation of its product and seven global products
development centers.
Adamas’ range
of products include crop protection solutions and other related
products that leverage its core expertise, including dietary
supplements and food additives, aromatic products and industrial
products. Accordingly, Adama organizes and manages its business in
two segments: crop protection and other operations. The crop
protection business focuses on the research, development,
production and marketing of products that enhance crop yields by
protecting against the damaging and destructive effects of a
variety of weeds, pests and disease. Adama markets (mostly directly
and through third parties) the products it develops and produces,
as well as other crop protection products it sources from third
parties. Crop protection products in the global market are divided
into (i) patent-protected and legacy, branded off-patent
products, most of which were originally developed by leading
companies in the field; and (ii) newly introduced, branded
off-patent products, such as our products, which are similar to
patent-expired products (in terms of composition) and are produced
by off-patent focused companies.
Adama manufactures
and sells a broad range of crop protection products that are
divided into three main categories based on their uses:
(i) herbicides, (ii) insecticides and
(iii) fungicides. These solutions offer protection for all
sorts of crops including corn, cotton, oil seed rape, soybean and
cereal, and are developed and adapted for use in seed treatment as
well as for non-crop uses such as protection against weeds, pests
and disease in roadsides, forests, lawns, parks, institutions, the
wood and paint industry, animal health and private facilities,
homes and gardens. Adama has a unique positioning and access to the
Chinese markets, principally through ChemChina.
86
On July 17, 2016,
DIC reported that it had accepted ChemChina’s offer to
acquire 40% of Adama Agricultural Solutions Ltd.’s shares,
indirectly controlled by IDBD through DIC. For more information see
“Recent Developments”.
Telecommunications
This division
includes the assets and operating income derived from Cellcom.
Cellcom is Israel’s leading mobile communications operator.
Cellcom has more than 2.8 million subscribers, with an estimated
market share of 27%. Through its independent transmission network,
Cellcom provides services to its customers with a broad range of
value added services including cellular and landline telephony,
roaming services for tourists in Israel and for its customers
abroad, and additional services including music, video, mobile
office etc. With a technologically advanced infrastructure, Cellcom
provides internet connectivity services and international calling
services, as well as landline telephone communication, cloud,
hosting services and information security in Israel, in addition to
data communication services. Our Telecommunications segment
generated operating losses of Ps. 71 million for the fiscal year
ended June 30, 2016, representing 10% of our consolidated operating
income for the Operations Center in Israel for such
year.
Cellcom has
launched television services over the internet
(“over-the-top” TV or OTT TV) which currently has
87,000 subscribers representing a 5.7% market share. IDBD believes
that there is an opportunity for further penetration in television
services over the internet and thus it plans to expand its
activities in this business, as part of its strategies. Cellcom
provides a “triple play package”, which combines
television services, internet infrastructure and supplier services
and home telephone services. Cellcom operates powerful generation
networks (LTE 4 and HSPA 3.5) enabling advanced high speed
broadband multimedia services, in addition to the regular networks
(GSM/GPRS/EDGE).
On November 2015,
Cellcom entered into an agreement with Golan Telecom Ltd.
(“Golan”) to purchase all of the shares of Golan, one
of the four cell phone carriers in Israel, in addition to Cellcom,
for a consideration of NIS 1,170 million. If Golan’s
acquisition is approved, Cellcom’s market share and revenues
will increase and Cellcom will be able to offer additional bundled
and separate services and products which will result in
opportunities for leveraging cost-synergies.
The following table
presents our number of cellular subscribers and revenues for each
of the last five years:
|
|
|
Year
Ended December 31,
(in thousands)
|
||||||||||||||||||
|
|
|
2011
|
|
2012
|
|
2013
|
|
2014
|
|
2015
|
||||||||||
|
Cellular
subscribers (end of period)
(1)
(in
thousands)
|
|
|
3,349
|
|
|
|
3,199
|
|
|
|
3,092
|
|
|
|
2,967
|
|
|
|
2,835
|
|
(1)
Subscriber data
refers to active cellular subscribers. Cellcom uses a six-month
method to calculate cellular subscriber base, which means that
Cellcom deducts subscribers from its cellular subscriber base after
six months of no revenue generation and activity on its network by
or in relation to the post-paid subscriber, no revenue generating
calls or SMS for pre-paid subscriber and no data usage or less than
NIS 1 of accumulated revenues for M2M (machine to machine)
subscribers. The six-month method is, to the best of our knowledge,
consistent with the methodology used by other cellular providers in
Israel. During the fourth quarter of 2011, Cellcom removed
approximately 52,000 subscribers from our subscribers base, which
included its subscribers using its TDMA network who had not
requested a transfer to its other networks following the shutdown
of its TDMA network as of December 31, 2011, and subscribers who
ceased using services following a change to Cellcom’s policy
which previously allowed subscribers to change from post to prepaid
subscription as a result of the reduction of Early Termination Fees
in the cellular market in early 2011. These changes affected other
key performance indicators. In the fourth quarter of 2012, Cellcom
removed approximately 138,000 M2M subscribers from its subscriber
base, following the addition of the above revenue generation
criterion for M2M subscribers. This change had an immaterial effect
on Cellcom’s ARPU for 2012. In the fourth quarter of 2013 we
removed approximately 64,000 subscribers from our subscribers base,
following a change to our prepaid subscribers counting mechanism.
As a result of such change, we add a prepaid subscriber to our
subscribers base only upon charging a prepaid card and remove them
from our subscribers base after six months of no revenue generating
calls or SMS. Following each of these changes, we have not restated
prior subscriber data to conform to such
changes.
We present bellow a
detailed desciption about each of the segments in
telecommunications operated by IDBD’s subsidiary
Cellcom:
Television Market
Our offer to the
Israeli Market includes:
·
Linear channels
including the Israeli Digital terrestrial
broadcasting
·
Video on Demand
library
·
Live and catch up
sports channels
·
Access to internet
video content from selected internet sites
·
Music streaming
service
·
An improved and
advanced user experience
·
Highly competitive
pricing
Cellular Services and
Products
Cellcom offers its
cellular subscribers a variety of usage and sector pricing plans
and bundles combining cellular services with other communications
services that the group offers, such as Internet infrastructure and
ISP, landline, ILD and OTT TV services for home and IP switchboard,
Internet infrastructure and ISP landline and ILD services for the
office. Cellcom offers two methods of payment: pre-paid and
post-paid. Pre-paid services are offered to subscribers who pay for
its services prior to obtaining them, usually by purchasing their
“Talkman” pre-paid cards or “virtual”
Talkman cards. Post-paid services are offered to subscribers
willing to pay for their services through banking and credit
arrangements, such as credit cards and direct debits. Price erosion
and the marketing of unlimited packages, have resulted to a decline
in our pre-paid subscriber base. In line with regulation, our
pricing plans do not include a commitment to purchase their
services for a predefined period, other than in large business
agreements.
Basic cellular
services
Its principal
cellular service is basic cellular telephony and data transfer,
upload and download (in supporting handsets). Both are included in
the “unlimited packages”. In addition, Cellcom offers
many other services with enhancements and additional features to
their basic cellular telephony service, including voice mail,
cellular fax, call waiting, call forwarding, caller identification
and conference calling. Data services can be used with handsets (in
supporting models), cellular modems, laptops and tablets. Cellcom
provides their customers with a variety of “internet surfing
packages” for that purpose. Cellcom also offers both an
outbound roaming service to subscribers traveling outside of Israel
and an inbound roaming service to visitors to Israel who can
“roam” into their network.
Value-added
services
In addition to
basic cellular telephony and data services, Cellcom offers many
value-added services, such as SMS and MMS, cloud backup content
services such as music downloads and “Cellcom TV”
application. SMS is included in the “unlimited
packages”. Cellcom offers services that are likely to be
popular with subscribers and complement Cellcom’s business.
Some of these value-added services are available only to
subscribers who have supporting handset models and some are offered
only to business subscribers.
87
Business
subscribers, also may receive multi SMS, M2M, “Double
Net” services allowing combined usage of cellular and
landline networks in order to ensure uninterrupted service, work
force management and vehicles management applications.
Handsets
Cellcom sells a
wide selection of handsets (which for purposes of this report may
include other types of communications end-user equipment, such as
tablets) designed to meet individual preferences. Prices of
handsets vary based on handset features and special promotions.
Cellcom offers a variety of installment plans for handsets and
discounts for short term installment plans. In most
cases, handsets are to be paid in 36 monthly installments. Cellcom
offers a variety of handsets from world-leading brands such as
Apple, LG, Nokia, Samsung, Sony, HTC, ZTE and Alcatel. The vast
majority of handset sales in 2015 have been of Apple and Samsung
models. The handset models Cellcom sells offer Hebrew language
displays in addition to English, Arabic and Russian (in most of the
models). Cellcom is also required to provide cellular services to
subscribers who did not purchase their handsets from us, provided
that the handset model complies with the standards set by the
Ministry of Communications. Cellcom offers subscribers repair
services for most handsets, in approximately 28 locations,
including through their wholly owned dealer, as well as by dispatch
service. See also “Customer Care” below.
Cellcom also sells
modems, tablets and smart watches to promote data services. In
addition, it sells added value products to its
customers, such as smart watches. Samsung International Co. Ltd.
provides us Samsung products and spare parts for such products,
under terms, including price of products, agreed between us and
Samsung from time to time.
In 2013, Cellcom
entered into an agreement with Apple Sales International for the
purchase and distribution of iPhone products in Israel. Under the
terms of the agreement, Cellcom has committed to purchase a minimum
quantity of iPhone products over a period of three
years, which have represented a significant portion of total
cellular handset sales over that period.
Landline services
In addition to
cellular services, Cellcom provides landline telephony,
transmission and data services, using approximately 1,780
kilometers of inland fiber-optic infrastructure and complementary
microwave links. Cellcom has offered transmission and data services
since 2001, landline telephone service since July 2006, and
advanced, voice and data landline services since 2008, both to
selected business customers. Since May 2015 Cellcom (and Netvision)
have offered internet infrastructure services through the landline
wholesale market, using Bezeq’s VDSL infrastructure.
Netvision also offers landline services to both private and
business customers, focusing on the private sector.
As of December
2014, Cellcom offers OTT-TV services, branded “Cellcom
tv” to private customers using Netvision’s systems.
Cellcom tv is a hybrid OTT-DTT TV service provided to the Israeli
market. The service includes a set-top box that enables linear
channels, including channels based on the Israeli Digital
terrestrial television (DTT) broadcasting, Video on Demand library
subscription (SVoD) that can be accessed from smartphones and
tablets (TV anywhere), access to internet video content from
selected internet sites, music streaming service and additional
advanced features such as personal video recorder, VoD playlist
channels and connection to social networks, at highly competitive
prices. Cellcom’s VoD catalogue and linear channels offer
international and local content from top content
suppliers.
Network and
Technology
Cellcom’s
cellular network has developed over the years since it commenced
operations in 1994, and we now have dual cellular and wireline
capabilities.
The “fourth
generation” LTE, or Long Term Evolution technology, was
launched in August 2014 and offers data throughput of up to 112
Mbps on the downlink path and up to 37 Mbps on the uplink path
(voice services are provided through our 3G network). The LTE
network covers most of the population of Israel and in 2016 it
continued to deploy this network and allocate additional spectrum
in the 1800 band (where possible) in order to enable higher data
throughput rate.
The “third
generation” UMTS/HSPA+, or high-speed packet data access,
technology, offers full interactive multimedia capabilities with
current data rates of up to 42 Mbps on the downlink path and up to
5 Mbps on the uplink path. In 2016, Cellcom intends to continue to
support the increasing demand for data traffic, while maintaining
its quality of services. This network, considered to be a
“3.9” technology, uses the same core as Cellcom’s
GSM/GPRS/EDGE network and covers substantially all of the populated
territory in Israel. Moreover, Cellcom’s UMTS/HSPA+ network
supports types of services that require higher throughput and lower
delay, such as video conferencing and provides an adequate fallback
for our LTE network by means of smart features and network load
sharing.
Cellcom’s
“second generation” GSM/GPRS/EDGE 1800MHz network
allows for voice calls, data transmission and multimedia services,
although at slower speeds than the LTE and UMTS/HSPA+ networks.
Cellcom’s GSM/GPRS/EDGE technology is an advanced
second-generation technology considered to be a “2.75G”
technology. It enables Cellcom to deliver multimedia and services
at speeds that are higher than the rates offered through regular
“second generation” digital cellular technology. Packet
data rates vary from 50 Kbps to 200 Kbps, depending mainly on
handset capabilities. In addition, in the case of coverage gaps and
for voice services supported by their GSM/GPRS/EDGE technology, the
network provides an adequate voice fallback for their LTE and UMTS
networks. Most of Cellcom’s traffic uses the UMTS/HSPA+
network with a continuous growth of data using Cellcom’s LTE
network.
Cellcom’s
transmission network is comprised of approximately 1,780 kilometers
of inland advanced fiber-optic cables that, together with
Cellcom’s microwave infrastructure, enable them to provide
their customers with telephony and high speed and high quality
transmission and data services. Cellcom’s transmission
network is strategically deployed in order to cover the major
portion of Israel’s business parks and permits them to
provide their own backhaul services while reducing their need to
lease capacity from Bezeq, the incumbent landline operator in
Israel.
Cellcom’s
system for the provision of advanced centrex services based on
cloud solutions to our business landline customers, is by Broadsoft
Ltd.
Netvision’s
platform by LM Ericsson, allows the provision of our OTT TV
services, together with the Israeli DTT
infrastructure.
Infrastructure
Cellcom has built
an extensive, durable and advanced cellular network system,
enabling them to offer high-quality services to substantially the
entire Israeli populated territory. They seek to satisfy quality
standards that are important to their subscribers, such as high
voice quality, high data rate packet sessions, low “blocked
call” rate (average rate of call attempts that fail due to
insufficient network resources), low “dropped call”
rate (average rate of calls that are terminated not in the ordinary
course) and deep indoor coverage. Therefore, they have made
substantial capital expenditures and expect to continue to make
substantial capital expenditures on their network
system.
Cellcom’s LTE
network is covering most of the population of Israel and they cover
substantially all of the populated areas of Israel with both our
UMTS/HSPA+ network and our GSM/GPRS/EDGE network. Our LTE and
UMTS/HSPA+ networks are mostly co-located with our GSM/GPRS/EDGE
network.
Cellular Network
design
Cellcom has
designed the GSM/GPRS/EDGE, UMTS/HSPA+ and LTE networks in order to
provide high quality and reliability in-line with the requirements
set forth in their license while using a cost-effective design,
utilizing shared components for the networks, where
applicable.
Cellcom has a DRP
for its engineering systems, aimed at increasing its
network’s survivability in case of damage to any of its
component systems. The DRP also provides the network with
additional advantages, including increased capacity and advanced
qualities in line with our license requirements.
Cellcom’s
primary goal is to continue deploying its LTE network while
allocating a smaller amount of our 1800MGz frequencies to our 2G
network, where possible, through advanced and modern equipment and
software features, and to continue to support the increasing demand
for data traffic of their high speed UMTS/HSPA+ network. At the
same time they intend to continue to perform extensive optimization
work to provide their subscribers with maximum capability to
support video and other broad-bandwidth content.
88
Cellular Network
performance
Cellcom continually
seeks to optimize its entire network in order to meet the key
performance indicators for its services, including dropped calls,
voice quality, accessibility, availability and packet success rate.
Cellcom uses advanced planning, monitoring and analyzing tools and
introduced advanced and modern equipment and software features in
order to achieve performance goals efficiently and with minimal
faults.
The main indicators
use to measure network performance for voice and packet data are
the “blocked call” rate, the “dropped call”
rate and average throughput. The average rates of blocked and
dropped calls meet those required by Cellcom’s operating
license. The average throughput indicator is not a license
requirement.
Spectrum
allocation
Spectrum
availability in Israel is limited and is allocated by the Ministry
of Communications through a licensing process. Cellcom has been
allocated 2x10 MHz in the 850 MHz frequency band previously used by
their TDMA network and currently by their UMTS/HSPA base stations,
2x20 MHz in the 1800 MHz frequency band, 5 - 15 MHz (varying
dependent on usage required in different areas) of which are used
by our LTE network and the remaining is used by their GSM/GPRS/EDGE
network (again varying dependent on usage required in different
areas) and 2 x 10 MHz 2100 MHz frequency band used by their
UMTS/HSPA network. Cellcom believes that its available spectrum is
sufficient for its current needs.
Of the 20 1800 MHz
spectra, three were allocated to Cellcom in August 2015 by the
Israeli Ministry of Communications, for 4G technologies (such as
LTE, LTE Advanced) . Unlike Cellcom’s other frequencies,
these frequencies were awarded for a period of just ten
years.
Cell site construction and
licensing
Cellcom develops
cell sites based on a strategy to expand the geographical coverage
and improve the quality of its network and as necessary to replace
cell sites as needed. Cellcom’s acquisition teams survey the
area in order to identify optimal locations for a cell site. In
urban areas, this would normally be building rooftops. In rural
areas, masts are usually constructed. The transmission teams also
identify the best means of connecting the base station to our
network, based on Cellcom’s independent transmission network,
either by physical optical fiber, microwave link or Bezeq
landlines. Once a preferred site has been identified and the exact
equipment configuration for that site decided, Cellcom begins the
process of obtaining all necessary consents and permits. The
construction of cell sites requires building permits from local or
regional authorities, or an applicable exemption, as well as a
number of additional permits from governmental and regulatory
authorities, such as construction and operating permits from the
Ministry of Environmental Protection in all cases, permits from the
Civil Aviation Authority in most cases and permits from the Israeli
Defense Forces in some cases. In special circumstances, additional
licenses are required.
Transmission
network
Cellcom’s
transmission network provides them with wireline connectivity for
their cellular and landline network in substantially all of the
populated territory of Israel. It is based on their fiber-optic
network and complementary microwave infrastructure. Cellcom’s
transmission network includes links to their internal cellular
network and to their landline and transmission
subscribers.
Cellcom’s
optical transmission network is deployed from Nahariya in the north
to Beer Sheva in the south and Afula and Jerusalem in the east,
consisting of approximately 1,780 kilometers. The fiber-optic
network reaches most of the business parks in the country and is
monitored by a fault-management system that performs real-time
monitoring in order to enable them to provide our subscribers with
high quality service. In order to efficiently complete their
transmission network’s coverage to substantially the entire
country, they use a microwave network as a complementary solution
in those areas that are not served by their fiber-optic
network.
Information
technology
Cellcom maintains a
variety of information systems that enable it to deliver superior
customer service while enhancing our internal
processes.
Sales
As part of
Cellcom’s strategy to fully penetrate every part of the
Israeli market, it seeks to make the purchase of its services and
products as easy and accessible as possible, while seeks to
optimize costs. These efforts to adapt sales operations to market
conditions include optimizing points of sale and transferring
operations more cost effective channels. Cellcom offer pricing
plans, value-added services, handsets, accessories and related
services through a broad network of direct and indirect sales
personnel. Cellcom designs pricing plans and promotional campaigns
aimed at attracting new subscribers and enhancing customer
retention strategies. Cellcom pays independent dealers commissions
on sales, while employee sales personnel receive base salaries plus
performance-based incentives. All sales and other customer-facing
staff go through extensive training prior to commencing their work.
Cellcom’s distribution and sales efforts for subscribers are
conducted primarily through four channels:
Points of sale.
Cellcom distribute
products and services through a broad network of physical points of
sale providing them with nationwide coverage of their existing and
potential subscriber base. Cellcom operate directly approximately
28 physical points of sale and service located in central and other
frequently visited locations. In 2015, Cellcom reduced the space of
several additional points of sale, in line with its operating
strategy, which continued in 2016 on a selective
basis.
Cellcom also
distributes products and services indirectly through a chain of
dozens of dealers (including its wholly-owned dealer, Dynamica)
which operates at approximately 150 points of sale throughout
Israel. These dealers are compensated for each sale based on
qualitative and quantitative measures. Cellcom closely monitors the
quality of service provided to their subscribers by Cellcom’s
dealers. In Cellcom’s efforts to penetrate certain sectors of
their potential subscriber base, Cellcom selects dealers with
proven expertise in marketing to such sectors.
Telephonic sales.
Telephonic sales
efforts target existing and potential subscribers who are
interested in buying or upgrading handsets and services.
Cellcom’s sales representatives (both in-house and
outsourced) offer customers a variety of products and services,
tailored to their needs.
Account managers.
Cellcom’s direct
sales force for business customers maintains regular contact with
mid-sized and large accounts, focusing on sales of cellular and
wireline services, customer retention and tailor-made solutions for
the specific needs of such customers. Cellcom provides small- and
mid-sized business customers one point for both sales and services
by phone. Cellcom’s account managers are aided by various
back office experts in determining customers’ needs and
making suitable offers. Sales to larger business customers or
governmental and local authorities sometimes involves participation
in requests for proposals.
Online sales.
Cellcom offers customers
the ability to purchase products and services through
Cellcom’s internet site and Cellcom’s smartphone
application and invest efforts in directing customers toward
self-service channels. Cellcom has established a dedicated internet
site for the marketing and sales their OTT TV service.
89
Cellcom Fixed Line
Opportunities
Key advantages of
Cellcom which are expected to facilitate expansion in the landline
business:
·
Triple play package
– the first of its kind in Israel providing Cellcom
television, Internet access and infrastructure and telephony at a
highly competitive pricing
·
Large subscriber
base: approximately. 2.8 million cellular subscribers, representing
a 27% market share in the ISP market and approximately 138,000 VOB
subscribers
·
Leveraging the
fiber network infrastructure (approximately 1,780 KM of fiber optic
infrastructure) together with the wholesale market aiming to
increase market share in the business sector
Insurance
This division
includes the assets from Clal Insurance Business Holdings. Clal is
one of the largest insurance groups in Israel, whose businesses
mainly comprise pension and social security insurance and other
insurance lines. Clal, through its subsidiaries, primarily issues
insurance policies, provides pension fund management services,
including provident funds, and holds assets and other businesses
(including holdings in insurance agencies). In 2015, Clal was one
of the largest insurance groups operating in Israel. Clal Insurance
Enterprises’ offers (1) long-term savings plans; (2) non-life
insurance products; and (3) health insurance. Clal Insurance
Enterprises’ other operations are carried out principally
through holdings of its Clal Insurance Company Ltd. subsidiary
(“Clal Insurance”). We refer to Clal Credit Insurance
Ltd. (“Clal Credit Insurance”) and the management
companies that manage the pension funds and insurance agencies
(Clal Insurance Business Holdings Ltd., and the companies held by
it), as “Clal Insurance Business Holdings Group”). 51%
of Clal’s controlling shares are held in trust be managed by
a trustee in compliance with the order issued by the Capital
Markets Commission of Israel requiring that Clal’s
controlling stake; therefore, Clal’s results are not fully
consolidated on a line-by-line basis in IDBD’s financial
statements, but under a single line as a financial instrument at
fair value, as required under IFRS when no control is
exercised.
Diagram of
holdings
Presented below is
a diagram illustrating the structure of the company’s primary
holdings, as of March 6, 2016:
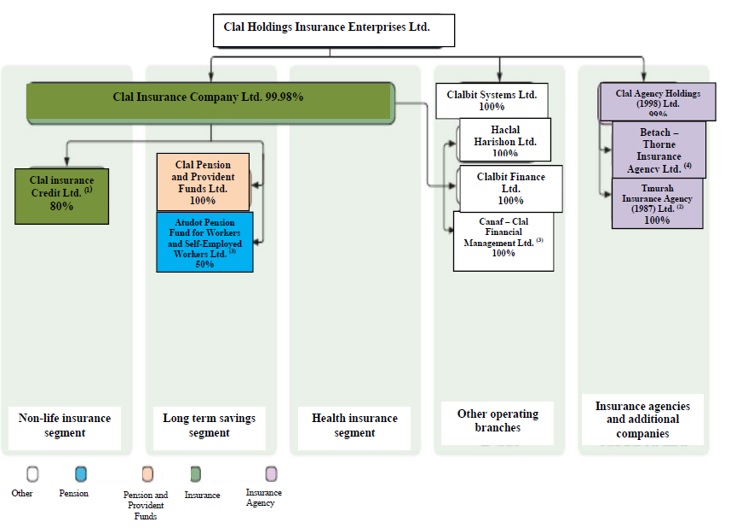
Clal Holdings
Insurance Enterprises is one of the leading insurance and pension
companies in Israel. As of June 30, 2016, Clal held a 20% market
share in the insurance market and managed over US$43 billion in
assets. Clal offers a wide range of services and products to
private and corporate customers, such as non-life insurance, health
insurance, travel insurance, education funds, provident funds,
pension funds, among others. Clal employs over 4,000 people and
markets its products through 2,000 insurance agents, to provide
service and professional support to their customers. Our Ins urance
segment had assets of Ps. 4,602 million as of June 30, 2016,
representing 3% of our operating assets for the Operations Center
in Israel at such date.
Clal’s
operations consist of three main insurance divisions:
(i)
non-life insurance
: the general
insurance domain in Clal is among the largest in Israel. The
division holds a 15% market share in this segment and offers
coverage to private and corporate customers. The non-life insurance
division offers a wide range of insurance plans: automotive,
property, liability, marine insurance, personal accidents,
guarantees and additional services. The division’s strategy
is to grow their private customer base - automotive, private
residences and small businesses, while professionally understanding
the unique needs of its diverse customers. Its vision is to provide
professional and high-level service to company’s agents and
customers, through constant improvements and new product
development;
(ii)
life insurance and long-term
savings
: this division holds a 15% market share of the
long-term savings market, as defined by the Commissioner of
Insurance. The division manages long-term assets, including life
insurance, pension and provident funds. The division also provides
comprehensive solutions to private and corporate customers in all
sectors of the Israeli economy. Among the division’s
customers are large corporations and many residents of the State of
Israel. Its objectives are to support the company’s
distribution channels and become a professional benchmark, helping
to improve company business results, profitability and value, while
emphasizing quality of service. The division offers a
variety of savings options, enabling its customers to maintain a
strong, solid economic foundation in the event of death, accident
or loss of earning capacity. It also offers a variety of pension
funds designed to guarantee a monthly income for life in the event
of retirement, disability, or death, enabling economic stability
for the future even in difficult times. Clal takes full
responsibility for managing its member’s. Members enjoy high
returns, among the highest in the Israeli market, as well as peace
of mind, knowing a large, professional, industry-leading
corporation manages their money; and
(iii)
health insurance
: The health
insurance division offers a wide range of products for individuals,
families and groups, specializing in comprehensive solutions for
specific market segments such as women and children. Clal holds a
21% market share of the health insurance market in Israel and
offers health insurance products such as surgeries in Israel and
overseas, transplants, medications, critical illness, long-term
care, personal accidents, travel and more. Health insurance
division vision is to establish Clal as a leading, innovative and
professional company in the field of health and nursing care
insurance, while providing a professional and timely service to its
agents and customers. The division focuses on technological
innovation as well as on developing a range of innovative health
insurance products, enabling flexibility in creating health
insurance packages tailored for each client, based on his needs and
financial status. Each package is either derived from existing
packages, or custom-built for each customer. The division is
constantly growing, and is proud to provide quality service to
400,000 members insured under private insurance plans as well as an
additional 2,000,000 members insured under group insurance
plans.
90
In addition, Clal
operates in the investments business through its wholly owned
subsidiary Canaf, which manages assets worth more than US$ 44,256
million, including members’ pension funds, provident funds,
insurance executives and also Clal’s balance sheet assets and
insurance reserves. The size of assets managed by Canaf provides a
significant competitive advantage. This is reflected in its
accessibility to companies and their executives, information on
special transactions, cooperation with relevant independent bodies
inside and outside of Israel and the development of mutual
strategic relationships with international bodies that specialize
in long-term financial management. Canaf has a staff of
approximately 80 employees, of whom about 30 are professional
investment managers specializing in various aspects of asset and
investment management.
The following is a
description of the Products and Services offered by
Clal:
Description of the Areas of Activity
and Insurance Coverages
Products in this
sector mainly consist of retirement solutions for salaried and
self-employed individuals, private investment solutions and life
insurance, and disability insurance.
·
Life insurance products.
Consist of
contractual obligations between insurer and policyholder, and
include insurance plans that allow accumulation of savings and
insurance plans and/or combinations in insurance plans that include
coverage for death, work disability and disability. A policyholder
who reaches the end of the insurance period is entitled to
insurance benefits (the amounts accrued in the savings component of
the policy) in accordance with the policy terms. The policyholder
may receive these amounts as a one-time amount (“Capital
Payment”), in lifetime installments (“Annuity”)
or a combination of the two, according to the terms of the policy;
in some of the annuity products the policyholder benefits from an
annuity coefficient protected against extended life expectancy,
which is established on the purchasing date of the policy or on the
commencement date of the annuity payment to the policyholder, or
which can be purchased once the policyholder reaches the age of at
least 60.
·
Pension funds.
Constitute mutual
insurance funds, and operate according to regulations which may
change from time to time. From the date of retirement, a pension
fund member is entitled to receive lifetime annuity payments based
on annuity coefficients that do not guarantee life expectancy, and
the annuity is likely to change from time to time according to the
actuarial balance of the fund.
·
Comprehensive pension funds.
Allow
pension savings for an annuity and death and disability insurance
coverage; benefit from designated bonds; and deposits can be made
into them up to the maximum set out in law; general (supplementary)
pension funds do not benefit from designated bonds, but allow
pension savings for an annuity, and deposits may be made into them
beyond the maximum stipulated by law. In some general funds, there
is no insurance coverage beyond an old age annuity; provident funds
provide savings solutions for the long term (such as provident
funds for severance pay and compensation to salaried employees) and
medium term (study funds), without insurance coverage. A provident
fund member is entitled to withdraw the amounts accumulated in his
favor in the capital based provident funds, with respect to
deposits made until December 31, 2007, in a one-time amount,
whereas the amounts accumulated in his favor which were deposited
as from January 1, 2008 may be withdrawn by means of an annuity or
annuity capitalization. Until the Control of Financial Services
(Provident Funds) (Amendment No. 13) Law, 2015 (“Amendment 13
to the Provident Fund Law”) entered into effect, withdrawal
by means of an annuity could have been made from an annuity paying
provident fund only (currently known as “a provident fund for
annuities”), subject to determined exceptions. In this
amendment, the option is given to withdraw directly from a
provident fund for savings (that was a non-annuity paying provident
fund).
How Savings Funds are Invested.
Pension
savings products differ from each other in the way in which the
savings funds are invested. Some of the savings funds are invested
in market securities, while others are backed by designated bonds,
according to legislation, as set out below:
(a)
Life insurance
: Life policies
issued through the end of 1990 offered policyholders a guaranteed
savings component (“Guaranteed Return Policies”). The
rate varied according to the type of policy and date of issue. The
obligation to pay the guaranteed return was generally backed by
designated bonds, whereas the balance of assets was invested
according to the restrictions imposed by the Control of Financial
Services Regulations (Provident Funds) (Investment Regulations
Applicable for Management Companies and Insurers), 2012 (the
“Investment Regulations”). As of December 31, 2015, the
holding of designated bonds by Clal Insurance constituted 76% of
the total assets held against liabilities for Guaranteed Return
Policies. Over the years, Clal Insurance Enterprises Holdings Group
has redeemed designated bonds, upon approval of the Ministry of
Finance, as a means of achieving excess returns. The proceeds were
invested in other investments. Clal Insurance Enterprises Holdings
Group could not buy back designated bonds for some of the reserves
that it redeemed and as a result its exposure to free investments
increased. According to the accounting mechanism established with
the Ministry of Finance, the designated bonds held will be reduced
gradually to a rate of 50% of total revenue held against
liabilities for guaranteed return policies.
Policies issued
since the early 1990s include mainly investment-linked policies in
which savings are invested by the insurance companies in free
investments, mainly in capital market instruments, while the return
less applicable expenses are applied for the benefit of the
policyholder based on the returns achieved by the investment
portfolio, less management fees;
(b)
pension funds
: As of the date
of this Annual Report, legacy and new comprehensive pension funds
benefit from guaranteed returns on the fund’s assets that are
backed by designated bonds, up to a maximum rate of 30% of total
assets. However, the rate of designated bonds relative to members
in the new comprehensive pension funds who, prior to January 1,
2004 were eligible to receive a pension, must represent 70% of the
total assets. Also, the government provides
“compensation” to the old balanced pension funds in
order to reduce the issuance of designated bonds, which was carried
out over the years;
(c)
provident funds
: Since the
mid-1980s, designated bonds have not been issued for provident
funds (other than a small number of guaranteed return provident
funds) and the assets were invested in accordance with the
restrictions set out in the Investment Regulations;
(d)
Task force to increase certainty in
pension savings
: In December 2015, the task force to
increase certainty in pension savings published a report that,
among other things, recommended an increase in the allocation of
designated bonds to pensioners and to senior savers approaching
retirement age. At the same time, it proposes gradually decreasing
the allocation of designated bonds intended for young savers, due
to their longer investment horizon. The recommendations of the task
force did include an increase in the proportion of designated bonds
to total funds under management.
Regulation - the
provisions of the Insurance Law, the Supervision of Financial
Services (Provident Funds) Law, 5765-2005 (the “Provident
Fund Law”), the Income Tax Regulations (Rules for the
Approval and Management of Provident Funds), 5724-1964 (the
“Provident Fund Regulations”), the Supervision of
Financial Services Law (Financial, Consultation, Marketing and
Clearing Systems), 5765-2005 (“The Financial Consultation
Law”) and the pronouncements and interpretations issued by
the Commissioner from time to time, apply to pension fund
activities. The Insurance Law and the Provident Fund Law require
appropriate licensing for any insurer or pension fund and provident
fund management company, including those in the Clal Holdings
Group, and each is supervised by the Capital Markets
Department.
In January 2016,
rules were issued setting for the protocol for the issuance of an
additional control permit to a company that manages pension funds
or provident funds (“Managing Company”) for any entity
that controls other pension or provident funds. In accordance with
applicable regulation, an entity may control multiple Managing
Companies without needing to merge the two companies, where one of
the Managing Companies. Accordingly, Clal Insurance is not required
to merge the managing companies which it currently
controls.
91
Others
Includes the assets
and income from other miscellaneous businesses, such as
technological developments, tourism, oil and gas assets,
electronics, and other sundry activities. Our Others segment had
operating assets of Ps. 25,405 million as of June 30, 2016,
representing 17% of our operating assets for the Operations Center
in Israel at such date. Our Others segment generated operating
losses of Ps. 250 million for the fiscal year ended June 30, 2016,
representing 35%, of our consolidated operating income for the
Operations Center in Israel for such year.
Seasonality
In Israel retail
segment business results are subject to seasonal fluctuations as a
result of the consumption behavior of the population proximate to
the Pesach holidays (March and/or April) and Rosh Hashanah and
Sukkoth holidays (September and/or October). This also affects the
balance sheet values of inventory, customers and suppliers. Our
revenues from cellular services are usually affected by seasonality
with the third quarter of the year characterized by higher roaming
revenues due to increased incoming and outgoing
tourism.
In 2016, the
Passover holiday fell at the end of April, compared to 2015 when it
was at the beginning of April. The timing of the holiday affects
Shufersal’s sales and special offers in the second quarter of
2016, compared to last year.
The Passover
holiday in the second quarter of 2016 had a greater effect on
Shufersal’s results than in the corresponding quarter in
2015, therefore analysis of the results for the first half of the
year compared to the corresponding period in 2015 better represents
the changes between the periods.
Legal
Framework
Operations Center in
Argentina
Regulation and Governmental Supervision
The laws and
regulations governing the acquisition and transfer of real estate,
as well as municipal zoning ordinances are applicable to the
development and operation of our properties. Currently, Argentine
law does not specifically regulate shopping center lease
agreements. Since our shopping center leases generally differ from
ordinary commercial leases, we have created provisions which govern
the relationship with our shopping center tenants.
Leases
Argentine law
imposes certain restrictions on property owners,
including:
·
a prohibition to
include automatic price adjustment clauses based on inflation
increases in lease agreements; and
·
the imposition of a
two-year minimum lease term for all purposes, except in particular
cases such as embassy, consulate or international organization
venues, room with furniture for touristic purposes for less than
three months, custody and bailment of goods, exhibition or offering
of goods in fairs or in cases where the subject matter of the lease
agreement is the fulfillment of a purpose specified in the
agreement and which requires a shorter term.
Rent Increases
In addition, there
are contradictory court rulings regarding whether rent may be
increased during the term of the lease agreement. For example,
Section 10 of the Public Emergency Law prohibits the adjustment of
rent under leases subject to official inflation rates, such as the
consumer price index or the wholesale price index. Most of our
leases provide for incremental rent increases that are not based on
any official index. As of the date of this annual report no tenant
has filed any legal action against us challenging incremental rent
increases, but we cannot ensure that such actions will not be filed
in the future and, if any such actions were successful, that they
will not have an adverse effect on us.
Lease Terms Limits
Under the Argentine
Civil and Commercial Code lease terms may not exceed fifty years.
Generally, our leases are for terms of three to ten
years.
Rescission Rights
The Argentine Civil
and Commercial Code provides that tenants may terminate leases
earlier after the first six months of the effective date. Such
termination is subject to penalties which range from one to one and
a half months of rent payable. If the tenant terminates the lease
during the first year of the lease the penalty is one and a half
month’s rent and if termination occurs after the first year
of lease the penalty is one month’s rent.
Other
The Argentine Civil
and Commercial Code requires a tenant to give at least 60
days’ prior notice of termination. There are no court rulings
related to: (i) the tenants’ unilateral right to terminate;
or (ii) the possibility of establishing a penalty different from
that prescribed by law.
While current
Argentine government discourages government regulation of leases,
there can be no assurance that additional regulations will not be
imposed in the future, including regulations similar to those
previously in place. Furthermore, most of our leases provide that
the tenants pay all costs and taxes related to the property in
proportion to their respective leaseable areas. If a significant
increase in the amount of such costs and taxes occurs, the
Argentine government may respond to political pressure to intervene
by regulating this practice, thereby increasing our
costs.
Argentine law
enables lessors to pursue an “executory proceeding” if
lessees’ fail to pay rent when due. In executory proceedings,
debtors have fewer defenses available to prevent foreclosure,
making these proceedings substantially shorter than in normal
proceedings. In executory proceedings the origin of the debt is not
under discussion; the trial focuses on the formalities of debt
instrument itself. The code also permits special eviction
proceedings, which are carried out in the same way as ordinary
proceedings. The Argentine Civil and Commercial Code requires that
notice be given to a tenant demanding payment of amounts due in the
event of breach prior to eviction, of no less than ten days for
residential leases, and establishes no limitation or minimum notice
for other leases. However, historically, backlogs in court dockets
and numerous procedural hurdles have resulted in significant delays
to eviction proceedings, which generally last from six months to
two years from the date of filing of the suit.
Development and Use of the Land
Buenos Aires Urban Planning Code.
Our
real estate activities are subject to several municipal zoning,
building, occupation and environmental regulations. In the city of
Buenos Aires, where the vast majority of our real estate properties
are located, the Buenos Aires Urban Planning Code (
Código de Planeamiento Urbano de la
Ciudad de Buenos Aires
) generally restricts the density and
use of property and controls physical features of improvements on
property, such as height, design, set-back and overhang, consistent
with the city’s urban landscape policy. The administrative
agency in charge of the Urban Planning Code is the Secretary of
Urban Planning of the City of Buenos Aires.
Buenos Aires Building Code.
The Buenos
Aires Building Code (
Código
de Edificación de la Ciudad de Buenos Aires
)
complements the Buenos Aires Urban Planning Code and regulates the
structural use and development of property in the city of Buenos
Aires. The Buenos Aires Building Code requires builders and
developers to file applications for building permits, including the
submission to the Secretary of Work and Public Services
(
Secretaría de Obras y
Servicios Públicos
) of architectural plans for review,
to assure compliance therewith.
92
We believe that all
of our real estate properties are in material compliance with all
relevant laws, ordinances and regulations.
Sales and Ownership
Buildings Law.
Buildings Law No. 19,724
(
Ley de Pre horizontalidad
)
was superceded by the Argentine Civil and Commercial Code which
became effective on August 1, 2015. The new regulations provide
that for purposes of execution of agreements with respect to build
units or condo units under construction, the owner or developer
must purchase insurance in favor of prospective purchasers against
the risk of frustration of the contract. A breach of this
obligation prevents the owner from exercising any right against the
purchaser–such as demanding payment of any outstanding
installments due – unless the owner fully complies with its
obligations, but does not prevent the purchaser from exercising its
rights against seller.
Protection for the Disabled Law.
The
Protection for the Disabled Law No. 22,431, enacted on March 20,
1981, as amended, provides that in connection with the construction
and renovation of buildings, obstructions to access must be
eliminated in order to enable access by handicapped individuals. In
the construction of public buildings, entrances, transit pathways
and adequate facilities for mobility impaired individuals must be
provided for. Buildings developed before the Law came into effect
must be retrofitted to provide access, transit pathways and
adequate facilities for mobility-impaired individuals. Those
pre-existing buildings, which due to their architectural design may
not be so retrofitted, are exempted from compliance. The Protection
for the Disabled Law provides that residential buildings must
ensure access by mobility impaired individuals to elevators and
aisles. Architectural requirements refer to pathways, stairs, ramps
and parking.
Real Estate Installment Sales Law.
The
Real Estate Installment Sales Law No. 14,005, as amended by Law No.
23,266 and Decree No. 2015/85, imposes a series of requirements on
contracts for the sale of subdivided real estate property
regarding, for example, the sale price which is paid in
installments and the deed, which is not conveyed until final
payment of such price. The provisions of this law require, among
other things:
·
The registration of
the intention to sell the property in subdivided plots with the
Real Estate Registry (
Registro de
la Propiedad Inmueble
) corresponding to the jurisdiction of
the property. Registration will only be possible with regard to
unencumbered property. Mortgaged property may only be registered
where creditors agree to divide the debt in accordance with the
subdivided plots. However, creditors may be judicially compelled to
agree to the division.
·
Preliminary
registration with the Real Estate Registry of the deed of transfer
within 30 days of execution of the sales
contract.
Once the property
is registered, the installment sale must be consistent with the
requirements of the Real Estate Installment Sales Act, unless
seller affirms that it will not provide for the sale in
installments. If a title dispute arises, the installment purchaser
who has duly registered the purchase instrument with the Real
Estate Registry will be entitled to the deed. Further, the
purchaser can demand conveyance of title after at least 25% of the
purchase price has been paid, although the seller may demand a
mortgage to secure payment of the balance of the purchase
price.
After payment of
25% of the purchase price or the construction of improvements on
the property equal to at least 50% of the value of the property,
the Real Estate Installment Sales Act prohibits termination of the
sales contract for failure by the purchaser to pay the balance of
the purchase price. However, in such event the seller may take
action under any mortgage on the property.
Other Regulations
Consumer Relationship.
Consumer or End User Protection.
The
Argentine Constitution expressly establishes in Article 42 that
consumers and users of goods and services have a right to
protection of health, safety and economic interests in a consumer
relationship. Consumer Protection Law No. 24,240, as amended,
provides protection of consumers and end users in a consumer
relationship, in the arrangement and execution of
contracts.
The Consumer
Protection Law, and the applicable provisions of the Argentine
Civil and Commercial Code regulate the rights conferred under the
Constitution focused on the weakest party in the consumer
relationship as a means to prevent potential abuses by vendors of
goods and services in a mass-market economy where standard
contracts are the norm.
As a result,
contractual provisions included in consumer contracts are voided
and unenforceable if they:
·
Are inconsistent
with the essence of the service to be provided or limit liability
for damages;
·
imply a waiver or
restriction of consumer rights and an extension of seller rights;
or
·
shift the burden of
proof to consumers.
In addition, the
Consumer Protection Law imposes penalties ranging from warnings to
the forfeiture of concession rights, privileges, tax regimes or
special credits to which the sanctioned party may be entitled,
including closing down of establishments for a term of up to 30
days.
The Argentine Civil
and Commercial Code defines a consumer agreement as are entered
into between a consumer or end user and an individual or legal
entity that provides professional services or a private or public
company that manufactures goods or offers services to consumers in
the stream of commerce.
In addition, the
Consumer Protection Law establishes a joint and several liability
system under which for any damages caused to consumers, if
resulting from a defect or risk inherent in the thing or the
provision of a service, the producer, manufacturer, importer,
distributor, supplier, seller and anyone who has placed its
trademark on the good or service is liable. The Consumer Protection
Law excludes professional services that require a college degree
and that are provided by members of professional organizations or
those provided by a governmental authority. However, this law
regulates professional advertisements.
The Consumer
Protection Law determines that the information contained in the
offer addressed to undetermined prospective consumers, binds the
offeror during the period in which the offer takes place and until
its public revocation. Further, it determines that specifications
included in advertisements, announcements, prospectuses, circulars
or other media bind the offeror and are considered part of the
contract entered into by the consumer.
Pursuant to
Resolution No. 104/05 issued by the Secretariat of Technical
Coordination reporting to the Argentine Ministry of Economy, the
Consumer Protection Law adopted Resolution No. 21/2004 issued by
the Mercorsur’s Common Market Group which requires that those
who engage in commerce over the Internet (E-Business) shall
disclose in a precise and clear manner the characteristics of the
products and/or services offered and the sale terms. Failure to
comply with the terms of the offer is deemed an unjustified denial
to sell and gives rise to sanctions.
On September 17,
2014, a new Consumer Protection Law was enacted by the Argentine
Congress –Law No. 26,993. This law, known as “System
for Conflict Resolution in Consumer Relationships,” provided
for the creation of new administrative and judicial procedures. It
created a two-tiered administrative system: the Preliminary
Reconciliation Agency for Consumer Relationships (
Servicio de Conciliación Previa en las
Relaciones de Consumo, COPREC
) and the Consumer Relationship
Audit, and a number of courts assigned to conflicts between
consumers and producers (
Fuero
Judicial Nacional de Consumo
). A claim may not exceed a
fixed amount equivalent to 55 adjustable minimum living wages, as
determined by the Ministry of Labor, Employment and Social
Security. The claim must be filed with the administrative agency.
If an agreement is not reached between the parties, the claimant
may file the claim in court. The COPREC is currently in full force
and effect. However, the court system is not in force yet,
therefore, any court claims currently must filed with existing
courts. A considerable volume of claims filed against us are
expected to be settled pursuant to the system.
Antitrust Law.
Law No. 25,156, as
amended, prevents monopolistic practices and requires
administrative authorization for transactions that according to the
Antitrust Law constitute an economic concentration. According to
this law, mergers, transfers of goodwill, acquisitions of property
or rights over shares, capital or other convertible securities, or
similar operations by which the acquirer controls or substantially
influences a company, are considered as an economic concentration.
Whenever an economic concentration involves a company or companies
and the aggregate volume of business of the companies concerned
exceeds in Argentina the amount of Ps. 200 million, in such case
the respective concentration should be submitted for approval to
the Argentine Antitrust Authority (
Comisión Nacional de Defensa de la
Competencia, “
CNDC
”
). The request for approval may
be filed either prior to the transaction or within a week after its
completion.
93
When a request for
approval is filed, the CNDC may (i) authorize the transaction, (ii)
condition the transaction to satisfaction of certain conditions, or
(iii) reject the application.
The Antitrust Law
provides that economic concentrations in which the transaction
amount and the value of the assets absorbed, acquired, transferred
or controlled in Argentina, do not exceed Ps. 20 million are
exempted from the law. Notwithstanding the foregoing, when the
transactions consummated by the companies involved in the prior
12-month period exceed in the aggregate Ps. 20 million or Ps. 60
million in the last 36 months, these transactions must be notified
to the CNDC.
As our consolidated
annual sales volume and our parent’s consolidated annual
sales volume exceed Ps. 200 million, we should give notice to the
CNDC of any concentration provided for by the Antitrust
Law.
Credit Card Law.
Law No. 25,065, as
amended by Law No. 26,010 and Law No. 26,361, governs certain
aspects of the business activity known as “credit card
system.” Regulations impose minimum contract contents and
approval thereof by the Argentine Ministry of Industry, as well as
limitations on chargeable interest by users and commissions charged
by the retail stores that adhere to the system. The Credit Card Law
applies both to banking and non-banking cards, such as
“Tarjeta Shopping,” issued by Tarshop S.A. Pursuant to
Communication “A” 5477 issued by the Argentine Central
Bank, loans granted under credit cards by non-financial entities
cannot exceed 25% of the monthly interest rate published by the
Argentine Central Bank for loans to individuals without security
interests.
Environmental Law.
Our activities are
subject to a number of national, provincial and municipal
environmental provisions.
Article 41 of the
Argentine Constitution, as amended in 1994, provides that all
Argentine inhabitants have the right to a healthy and balanced
environment fit for human development and have the duty to preserve
it. Environmental damage shall bring about primarily the obligation
to restore it as provided by applicable law. The authorities shall
control the protection of this right, the rational use of natural
resources, the preservation of the natural and cultural heritage
and of biodiversity, and shall also provide for environmental
information and education. The National Government shall establish
minimum standards for environmental protection whereas Provincial
and Municipal Governments shall fix specific standards and
regulatory provisions.
On November 6,
2009, the Argentine Congress passed Law No. 25,675. Such law
regulates the minimum standards for the achievement of a
sustainable environment and the preservation and protection of
biodiversity and fixes environmental policy goals.
Law No. 25,675
establishes the activities that will be subject to an environmental
impact assessment procedure and certain requirements applicable
thereto. In addition, such Law sets forth the duties and
obligations that will be triggered by any damage to the environment
and mainly provides for restoration of the environment to its
former condition or, if that is not technically feasible, for
payment of compensation in lieu thereof. Such Law also fosters
environmental education and provides for certain minimum reporting
obligations to be fulfilled by natural and legal
entities.
In addition, the
CNV Rules require the obligation to report to the Commission any
events of any nature and fortuitous acts that seriously hinder or
could potentially hinder performance of our activities, including
any events that generate or may generate significant impacts on the
environment, providing details on the consequences
thereof.
The Argentine Civil
and Commercial Code introduced as a novel feature the
acknowledgement of collective rights, including the right to a
healthy and balanced environment expressly sets forth that the law
does not protect an abusive exercise of individual rights if such
exercise could have an adverse impact on the environment and
collective rights in general. For additional information see
“Item 3 (d). Risk Factors - Risk relating to our Business -
Our business is subject to extensive regulation and additional
regulations may be imposed in the future.”
Control Systems
IRSA Commercial
Properties owns computer systems to monitor tenants’ sales
(except stands) in all of its shopping centers. IRSA CP also
conducts regular manual audits of its tenants accounting sales
records in all of its shopping centers. Almost every store in those
shopping centers has a point of sale that is linked to a main
computer server in the administrative office of such shopping
center. IRSA CP uses the information generated from the
computer monitoring system for statistics regarding total sales,
average sales, peak sale hours, etc., for marketing purposes and as
a reference for the processes of internal audit. The lease
contracts for tenants in Alto Avellaneda, Alto Palermo, Alcorta
Shopping, Patio Bullrich, Buenos Aires Design, Abasto, Alto
Rosario, Alto NOA, Dot Baires Shopping, Córdoba Shopping,
Soleil Premium Outlet, La Ribera Shopping, Mendoza Plaza, Distrito
Arcos and Alto Comahue contain a clause requiring tenants to be
linked to the computer monitoring system, there being certain
exceptions to this requirement.
Insurance
We carry all-risk
insurance for the shopping centers and other buildings covering
property damage caused by fire, explosion, gas leak, hail, storms
and wind, earthquakes, vandalism, theft and business interruption.
In addition, we carry liability insurance covering any potential
damage to third parties or property caused by the conduct of our
business throughout Argentina. We are in compliance with all legal
requirements related to mandatory insurance, including insurance
required by the Occupational Risk Law (
Ley de Riesgos del Trabajo
), life
insurance required under collective bargaining agreements and other
insurance required by laws and executive orders. Our history of
damages is limited to one single claim resulting from a fire in
Alto Avellaneda Shopping in March 2006, a loss which was
substantially recovered from our insurers. These insurance policies
contain specifications, limits and deductibles which we believe are
adequate to the risks to which we are exposed in our daily
operations. We further maintain liability insurance covering our
directors’ and corporate officers’
liability.
Operations Center in
Israel
IDBD is a holding
company that invests, either directly or through its subsidiaries,
associates and joint ventures in companies that operate in various
sectors of the economy in Israel. IDBD is directly affected by the
political, economic, military and regulatory conditions of Israel.
The main regulations applicable to IDBD’s business are
described below. For more information, see “Risk
Factors– Risks related to IDBD and IDBD’s
subsidiaries.”
General
regulations applicable to our business in Israel
Proper Conduct of Banking Business
IDBD and certain of
its affiliates are subject to supervision by the Israeli Supervisor
of Banks relating to “Proper Conduct of Banking
Business” which impose, among others limits on the aggregate
principal amount of loans a financial institution can have
outstanding to a single borrower, a group of related borrowers, and
to the largest borrowers and groups of related borrowers of a
banking entity (as these terms are defined in the aforesaid
directives). IDBD, its controlling shareholders and its affiliates
are considered a single group of borrowers for purposes of this
regulation. These restrictions limit the ability of IDBD and its
affiliates to borrow from a single bank in Israel, their ability to
make investments where they require bank lines of credit, to invest
in companies that have loans outstanding from banks in Israel, and
to make business transactions together with groups that have such
credit outstanding. In the period from 2013 and until the date of
publication of the report, the concentration of credit risk of IDBD
and its affiliates decreased as a result of a reduction in the
amount of utilized credit for the group that includes IDBD,
including as a result of a change of control that resulted in a
re-characterization of the group for purposes of applicable
regulation.
94
Reduced Centralization Act
In December 2013,
the official “Reshumot” published in Israel the
Promotion of Competition and Reduction of Centralization Law,
N° 5774-2013 (the “Reduced Centralization Act ”)
pursuant to which a pyramidal structure (or multiholding companies)
of control in “reporting entities” (principally
entities whose securities are held by public shareholders) is
limited to two layers of reporting entities (with the holding
company in the first layer not including a reporting entity that
has no controlling shareholder). For this purpose, on the date of
publication of the law in Reshumot, IDBD was considered a
second-tier company and Discount Investments was considered a
third-tier company, and as such, Discount Investments would
not have been permitted to continue to control the operating
companies after December 2019. As a result of the change in
control of IDBD, IDBD and Discount Investments are no longer
considered as second and third-tier companies, respectively, for
the purpose of the Law. If Discount Investments is considered a
second-tier company, it would be required by December 2019 at the
latest, to cease controlling entities with publicly held
securities.
In connection with
evaluating the application of the Law, in August 2014, IDBD’s
Board of Directors appointed an advisory committee to examine
various alternatives to address the implications of the Law to
comply with the provisions that apply to control in a pyramid
structure (or multiholding companies) in order to enable continued
control of IDBD and/or Discount Investments in “other tier
companies” (currently held directly by Discount Investments)
as of December 2019. The advisory committee has recommended the
following alternatives:
(a)
Taking either IDBD
or Discount Investments private thereby removing the requirement
that they be reporting entities (and as a result not a “tier
company”); and
(b)
Merge IDBD and
Discount Investments.
The Board of
Directors of Discount Investments has appointed an advisory
committee with a similar function. As of the date of this Annual
Report, no specific alternatives have been identified. The
implementation of an alternative that would be adopted is likely to
take several years.
Based on these
analyses, IDBD considers it more likely that the completion of one
of the specified alternatives will be adopted to comply with the
restrictions of the Law regarding pyramidal holdings, while
allowing IDBD to continue to control Discount Investments, and
Discount Investments to continue to control Cellcom after December
2019. PBC, which currently is a third-tier company that controls
each of Gav-Yam, Ispro and Mehadrin, has preliminarily evaluated
application of the Law on its holding structure and determined that
it will be able to maintain said control, as it has concluded that
the Law has no effect over its financial statements.
IDBD, as a
first-tier company, and Discount Investments, as a second-tier
company, are not required to designate independent directors to
their respective boards of directors or to appoint outside
directors as required by the Law.
Pursuant to the
provisions of the Law, the boards of directors of Cellcom, PBC,
Elron, Gav-Yam, Ispro and Mehadrin, include a majority of
independent outside directors. In June 2014, the Promotion of
Competition and Reduction of Centralization (Classification of a
Company as a Tier Company) Regulations, N° 5774-2014, came
into effect, as part of which exemptions were provided for certain
“third-tier” entities from changing the composition of
their boards of directors to comply with the Reduced Centralization
Act. Pursuant to this law and the Promotion of Competition and
Reduction of Centralization (Concessions Regarding the Number of
Outside directors) Regulations, N° 5774-2014, and in view of
the number of directors who may be appointed with the consent of
the Bronfman-Fisher Group (per the terms of the shareholders’
agreement between it and Discount Investments), the Board of
Directors of Shufersal includes a majority of independent outside
directors. In this context, in August 2014, Discount Investments
entered into an agreement with an affiliate of the Bronfman-Fisher
(which at the time held approximately 19% of the share capital of
Shufersal), pursuant to which Discount Investments will vote in
favor of the four directors designated by Bronfman-Fisher at the
meeting of shareholders of Shufersal (out of a board of fifteen
members), for so long as it holds the minimum defined percentage of
the share capital of Shufersal, although Discount Investments
reserves the right to object to any candidate on reasonable
grounds.
These arrangements
will be in effect so long as the restrictions of section 25(d) to
the Reduced Centralization Act apply to Shufersal. Accordingly,
Discount Investments, which as of December 31, 2015, owned
approximately 53% of Shufersal’s share capital, is
effectively able to appoint the majority of the members of
Shufersal’s Board of Directors.
The Reduced
Centralization Act includes provisions relating to a separation
between significant affiliates and significant financial
institutions. Consequently, so long as IDBD will be a significant
operating entity, after December 11, 2019, IDBD will not be able to
control Clal Insurance and additional financial affiliates within
the Clal Holdings Insurance Enterprise Group or to hold more than
10% of the equity of any such entity (or more than a 5% stake in
such an entity if it is regarded as an insurer without a
controlling shareholder).
In May 2015,
updated lists were published on the website of the Ministry of
Finance and the official gazette in connection with the Reduced
Centralization Act, which includes a list of the centralization
factors, the list of the significant corporations and a list of the
significant financial institutions. In accordance with the
provisions of the Reduced Centralization Act, a substantial
financial institution or a significant real corporation will be
deemed as a centralization factor that subjects these entities to
the provisions of the Reduced Centralization Act, as well as any
entity that is part of a business group that includes a significant
financial entity or a significant real corporation. IDBD and its
controlling shareholders (Eduardo Elsztain and entities through
which he holds his interest in IDBD) and the companies of IDBD
(including Discount Investments, Cellcom, PBC, Shufersal, Adama,
Clal Holdings Insurance Enterprises, IDB Tourism, Noya Oil and Gas
Explorations Ltd. and companies under the control of these
companies) were included in the list of centralization factors, and
these entities, except for Adama (excluding Eduardo Elsztain
himself), were also included in the list of significant
corporations. In addition, companies of Clal Holdings Insurance
Enterprises, including Clal Insurance (except Clal Holdings
Insurance Enterprises) and Epsilon Investment House Ltd. (held by
Discount Investments) were also included in the list of the
significant financial institutions.
Insofar as Clal
Holdings Insurance Enterprises will continue to be considered a
significant real entity, this may affect its ability to retain
control of Clal Insurance, directly or indirectly after December
2019, which may adversely affect its ability to appoint joint
directors in both of the companies (Clal Holdings Insurance
Enterprises and Clal Insurance).
In light of the
directives issued by the Commissioner in connection with the
appointment of a trustee for holding control in Clal Holdings
Insurance Enterprises, which currently are held by IDBD and
considering the letter issued by the Commissioner on December 30,
2014 pursuant to which IDBD is required to sell its control shares
in Clal Holdings Insurance Enterprises, Clal Holdings Insurance
Enterprises has appealed to the Concentration Committee in
connection with its classification as a significant real
entity.
In November 2014,
IDBD’s Board of Directors resolved, subject to requisite
corporate approvals, to promote a consolidation of management
functions at IDBD and Discount Investments, in order to achieving
costs savings. In this regard, on March 29, 2016, IDBD’s
Board of Directors approved the terms of office and of employment
of Mr. Shalom Lapidot to be chief executive officer of both IDBD
and Discount Investments, which was subsequently approved by the
compensation committee of Discount Investments. The term of office
of Mr. Lapidot is subject to approval of a general meeting of
shareholders of Discount Investments.
Regulations
applicable to each of the businesses in Israel
Real Estate
In recent years,
there has been continued shortage in manpower in the construction
and agricultural industries which typically are labor intensive and
depend on foreign workers, including in the areas of Judea and
Samaria. The security situation in Israel, as well as the shutdown
of Judea and Samaria during certain periods of the year, have
resulted in continued shortage in the workforce, driven by lower
numbers of foreign workers from Judea and Samaria. In July 2015,
the Minister of Finance increased the quota of foreign work permits
to approximately 20,000 through the end of 2016, as a means to
achieving the goal of increasing new construction projects by
70,000 during the year and to promote new housing starts to
alleviate the housing crisis. Given the shortage of skilled
workers, wages increased in general and in particular those of
foreign construction workers. The shortage and unavailability of a
skilled workforce, increased construction costs and resulted in
longer timetables for the execution of new projects.
95
Supermarkets
Labor Law
The retail sector
activities of Shufersal are subject to labor laws including the
Employment of Workers by Human Resources Subcontractors Law,
5756-1996, the Extension Order in the Matter of Contract Workers in
the Cleaning Branch in the Private Sector, the Minimum Wage Law,
5747-1987 and the Increased Enforcement of Labor Laws Law,
5772-2011. As of December 31, 2015, Shufersal employed
approximately 1,000 workers, all of which are subject to minimum
wage requirements. The majority of Shufersal’s employees are
parties to a collective bargaining agreement.
The provisions of
the Minimum Wage Law (Increase of Minimum Wage - Emergency
Provision), 5772 - 2015 and the amendment of the Minimum Wage Law,
5747 – 1987, resulted in an increase in the minimum wage
effective as of April 2015 and led to an increase of NIS 43 million
in Shufersal’s wage expense in 2015 (compared with 2014). In
Shufersal’s evaluation the increase of the minimum wage in
Israel, changes to labor laws in Israel and the increased
possibility of organized workers may detrimentally affect the
business results of Shufersal and result in higher wage expenses of
Shufersal.
Retail and Production
The activities of
Shufersal are also subject to consumer protection laws, including
the Food Law, the Defective Products Liability Law, 5740-1980, the
Consumer Protection Law, 5741-1981, and the Consumer Product and
Service Price Supervision Law, 5756-1996 that allows a consumer to
institute a class action suit for damages caused to consumers as a
whole based on the causes of action set out in that
law.
The Public Health
Protection (Food) Law, 5776-2015, sets forth quality standards and
food safety measures and provides the relevant regulator
supervisory and criminal and administrative enforcement powers. The
provisions of the Food Protection Law affect production activities
of Shufersal, including importation and food marketing activities.
Shufersal is continuing the process of implementing procedures to
comply with the provisions of the Food Protection Law that apply to
its activities. Shufersal also operates pharmacies in certain of
its stores, and is therefore subject to the provisions of the
Pharmacists Ordinance (New Version), 5741-1981.
Shufersal is
involved in manufacturing activities at three owned facilities
where it produces principally private-branded baked goods which are
subject to compliance with applicable production and quality
assurance standards. Shufersal is continuously evaluating
compliance of these facilities with the provisions of the Food
Protection Law and as of the date of this Annual Report, Shufersal
believes its operations comply in all material respects with the
applicable provisions of this law.
The retail
activities of each Shufersal store requires compliance with the
Business License Order (Businesses Requiring a License), 5773-2013,
principally providing that they obtain a business operating license
for each unit. As of the date of this Annual Report, there are two
units that are subject to legal proceedings regarding business
licenses that are pending against Shufersal and its directors.
Shufersal’s operating units are also subject to land
development approvals and licensing, substantially all of which are
in compliance.
The Food Law and the Anti Trusts Law
The Antitrust Law
affects the activities of Shufersal, especially with respect of the
possibility of carrying out future acquisitions for which approval
is required from the Antitrust Commissioner (the
“Commissioner”) and the influence on the trade
arrangements of Shufersal with its suppliers. The Food Law
regulates Shufersal’s trade arrangements with its suppliers
which are regulated in detail which are designed to promote
competition in the food supply industry. As of the date of this
Annual Report, Shufersal believes that growth through acquisitions
of a significant entity in the retail market would be limited.
Moreover, provisions of the Food Law relating to geographical
competition of retailers may influence the ability of Shufersal to
expand organically through opening new stores in certain areas and
under certain circumstances Shufersal may be required to close
active branches under certain circumstances.
The Food Law
includes the following three systems:
(a) with respect to
activities of suppliers and retail trade, the Food Law
prohibits:
i. a supplier
interfering with the retail price of the products of another
supplier;
ii. a retailer
interfering with a supplier in the matter of the consumer price
imposed by another retailer;
iii. a large
supplier imposing its market position to influence the ordering or
presentation of retail products within stores of a large retailer
(Shufersal is included in the list of large
retailers);
iv. a large
supplier interfering with the price a retailer charges consumers
for the products of that supplier, in the allocation of sales areas
at any rate for the products of the supplier, for the acquisition
of a product from the supplier in any scope from the total retail
purchases of the product and of competing products, and for the
purchase or sale of products which another supplier supplies to the
retailer, including purchase quantities and goals, the sale area
allocated to them in a store and any other commercial condition
sought to be imposed;
v. a large retailer
and a large supplier agreeing to set the pricing of a basket of
products at a price that is lower than the marginal cost of
production of the related product or that would require a consumer
to purchase a minimum amount of the related product to achieve the
reduces price;
vi. a large
supplier conditioning the sale of its product to a retailer on the
purchase of another product of that large supplier;
and
vii. a
supplier forwarding payments to the large retailer, unless by way
of a price reduction of the product units.
(b) Restrictions on
geographical competition of retailers have adversely affected
Shufersal’s expansion through organic growth and
acquisitions. On September 28, 2014 Shufersal received a
notification from the Antitrust Authority regarding demand areas of
Shufersal’s large stores (“Notice of Demand
Areas”). The stores that were the subject of the
Commissioner’s request under the Law are 14 stores located in
Haifa, 3 stores in Carmiel, 4 stores in Hadera, and 3 stores in
Safed. As of the date of this Annual Report, Shufersal has not been
required to close or dispose of any of its stores.
(c) Provisions
designed to increase transparency of consumer prices,
inter alia,
by requiring a large
retailer to publish on the internet and without cost to consumers,
various data on prices of consumer goods it sells in its stores to
allow consumers to compare prices with those of other
retailers.
(
d) Provisions regarding the
contemporaneous application of the Food Law and the Antitrust law -
In December 2015, the Commissioner published a statement on the
parallel application of the Antitrust Law and the Food Law listing
cases in which only the provisions of the Food Law will apply and
no additional regulation will be required under the Antitrust Law.
As of the date of the notice Shufersal’s operations comply
with the Food Law. As of December 31, 2015 the implementation of
the Food Law has had no significant impact on Shufersal’s
business.
Shufersal’s
acquisition of Clubmarket was approved by the Commissioner in 2005,
and within this framework the Commissioner imposed a number of
limitations on Shufersal’s activities including: prohibiting
Shufersal from pricing products that result in a loss that is not
proportionate to its business activities and are aimed to affect
the operations of competitors from the market; prohibiting
Shufersal from entering into agreements with suppliers that impose
restrictions on those suppliers from doing business with
competitors of Shufersal; and prohibiting Shufersal from attempting
to influence commercial conditions between its suppliers and
competitors.
Shufersal obtained
an exemption from the Commissioner, available until October 14,
2018, regarding the operation of the Fourth Chain, which is a label
company owned by a number of supermarket chains that was
established to develop consumer goods. The Commissioner’s
decision took into account the fact that Fourth Chain contracted
with a third party that develops products for it under a private
brand and the stipulated exemption exclusively permits these joint
activities for the development of the private brand. Shufersal
believes the Fourth Chain private label increases competition by
establishing a cost-effective alternative to dominant branded
consumer products.
The findings of the
Commissioner in the matter of the rules of conduct among the
largest store chains and the dominant suppliers in the food supply
market, including under the provisions of the Food Law, and in the
matter of the merger of Shufersal with Clubmarket, may have a
detrimental effect on Shufersal’s business, its financial
condition and operating results.
96
Agriculture
a.
Operations Development and Licensing.
ADAMA manufactures generic crop protection products which require
production processes and licensing of existing molecules or
processes. The primary development and licensing operation focuses
on chemical-engineering development of production processes for new
active ingredients and generic products, biological and
agricultural testing intended for obtaining licenses, development
of licensing information for the active ingredients and solutions
that form licensing portfolios for the various regions, development
of compounds, streamlining of production processes and development
of new and specialized formulations of existing products. Moreover,
ADAMA also engages in scientific-technological backup of existing
production processes with emphasis on improving quality,
efficiency, safety, environmental protection and reducing
production costs. Furthermore, ADAMA develops several innovative
substances, based on molecules acquired after a screening process,
in which their effectiveness is proven. As of the date of this
annual report, ADAMA operates research and development (R&D)
facilities in Israel, India and Brazil and has started operating on
R&D facility in China. In addition to chemical development,
ADAMA develops licensed products through third party producers. At
times, such development incorporates proprietary know-how and
processes owned by ADAMA, as well as those developed jointly with
subcontractors, in addition to processes and know-how of
Adama’s suppliers.
Licensing
-
at various stages of manufacture and marketing, the substances and
products marketed by ADAMA require licensing in each country in
which it operates (ADAMA products that are manufactured and sold in
Israel require licensing under the Crop Protection Law, 956). ADAMA
has seven development and licensing centers in Europe, Israel,
Latin America (Brazil), the United States and Asia, and licensing
expertise in more than 100 countries. For its foregoing operations,
ADAMA employs 170 employees around the world and also works with
external contractors. Crop protection products are sold under the
control of government authorities in each country (usually
ministries of agriculture, health and the environment). The
licensing requirements vary from time to time and in general have
become more stringent over the years throughout the world,
resulting in increased licensing costs and time commitments. The
most demanding licensing standards are in the United States,
Brazil, Japan and the EU. The rest of the world generally is
adapting their requirements to the standards of the more advanced
countries. In some countries, the license is not limited in time,
but further development of licensing information is required every
few years. Some of the countries grant licenses for 7-15 years and
renew them at the end of that period subject additional testing
Licensing costs and procedures differ from one state to another and
may take several years. ADAMA is also required to make
modifications to fully adapt any product in a certain country to
the specific licensing requirements of that country. ADAMA
regularly reviews the compliance of its products with the licensing
requirements in the various countries in which they are sold, and
adjusts them as needed. Licensing costs usually amount to hundreds
of thousands of dollars per product and in some countries, such as
the United States, the European Union and Japan, the costs can
reach millions of dollars per product. In 2015, ADAMA received 276
new licenses for marketing its products (excluding expansion of
labels of permitted products for new crops).
In 2015,
ADAMA’s licensing expenses amounted to US$93.1 million, with
the addition of depreciation the gross amount constitutes 3% of
ADAMA’s revenue for 2015.
b.
Labor Laws. Labor Relations in Israel.
Labor relations of most of the employees of ADAMA’s
subsidiaries are regulated under special collective agreements for
limited periods. In addition, some of the employees of
ADAMA’s subsidiaries in Israel are employed under personal
agreements. As part of an agreement executed in 2011 between ADAMA
and the Histadrut regarding employees in Israel, ADAMA undertook to
carry on production, at the scope and on certain production lines,
at the plants of the subsidiaries in Israel through June 1, 2017.
In 2015, in addition to the provisions set aside by ADAMA in
preceding years with regard to these understandings, ADAMA set
aside a provision of US$12 million which is recorded in its
financial statements under other expenses.
Labor Relations in Brazil.
At two of
ADAMA’s plants in Brazil, labor relations are subject to a
collective bargaining agreement that is renewed every two years,
and to the best of ADAMA’s knowledge, there has been no major
labor unrest in recent years.
As of the date of
this annual report, ADAMA believes that it is not dependent upon
any of its employees.
c.
Environmental
Risks and Environmental Regulation
General
. ADAMA is exposed to various
environmental risks and its operations are subject to extensive
environmental regulation, that varies by country where ADAMA
operates. In recent years environmental legislation (or in stages
of legislation) applicable to ADAMA’s operations have become
much stricter as supervision and enforcement of these environmental
requirements has tightened. ADAMA believes that this trend is
expected to continue in the future.
ADAMA holds, as
required by law, various permits and licenses such as business
licenses, toxins permits and permits for pumping effluents into the
sea. To the best of ADAMA’s knowledge, of the date of this
annual report the permits and licenses applicable to ADAMA with
regard to environmental issues are valid.
ADAMA’s environmental risk management
policy
: ADAMA attaches great importance to protecting the
environment by accepting social and environmental responsibility
and takes necessary measures to comply with the requirements of the
law, and seeks to exceed compliance, through continuous dialogue
with affected parties, including the authorities and the
community.
Environmental Regulation
. The key
environmental law applicable to ADAMA’s operations are, inter
alia, the Law for the Prevention of Nuisances, 1961; the Job Safety
Ordinance (New Version), 1970; Business Licensing Law, 1968; Water
Law, 1959; Law for the Prevention of Sea Pollution from Land-Based
Sources, 1988 “Prevention of Sea Pollution”); Hazardous
Materials Law, 1993 “Hazardous Materials Law”); Israel
Clean Air Law, 2008 (“Clean Air Law”) and their
regulations.
ADAMA continuously
reviews the impact of environmental regulation on its business,
acts to prevent or minimize environmental risks and to reduce
environmental impacts that could be caused by its operations and
invests considerable resources in ensuring compliance with the
provisions of the environmental laws and those that may apply to
it.
In September 2015,
the Ministry of Environmental Protection issued for public comment
a memorandum of the Integrated Environmental Licensing Law, 2015.
The Memorandum of Law sets out one licensing procedure for
businesses that have a substantial impact on the environment, at
the end of which the business is granted an integrated
environmental license in substitution of various environmental
permits and licenses. The Memorandum of Law seeks to update and
strengthen legal requirements applicable to, among other things,
the use of hazardous substances, treatment of waste, compliance
with building and construction laws, sanctions for license
violation, etc. In view of the early stage of this legislation,
ADAMA is unable to assess whether these obligations will apply to
it or as to the scope thereof.
Air Quality.
ADAMA’s plants are
subject to regulation relating to air emissions under the Clean Air
Law. ADAMA’s plants have duly filed applications for emission
permits and some plants have already received valid emission
permits or draft emission permits.
97
In May 2012, ADAMA
signed an arbitration agreement with a group of Nir-Galim residents
pursuant to which ADAMA agreed to comply with the recommendations
of a certified expert to prevent future potential air and odor
nuisances and to invest in facilities such as those mentioned
above. In September 2015, the expert appointed pursuant to the
mediation agreement announced that the mediation outline will be
implemented in full by ADAMA and thereby the mediation proceedings
came to an end. ADAMA makes substantial investments to minimize and
prevent environmental consequences of its operations on air
quality.
Effluents and Pumping into the Sea.
The
Prevention of Sea Pollution Law requires that the Ministry of
Environmental Protection issue a permit for pumping wastewater or
effluents into the sea. The ADAMA plant in Ashdod has such permit
the terms of which have been made more stringent throughout the
permit period as part of the general trend adopted by the
Ministry.
Land
.
There are hazardous materials that
are stored and located at Adama’s plant, as well as
infrastructure and facilities, which contain fuels and hazardous
materials. ADAMA is dedicated to preventing and treating the
pollution of land and water by these materials.
ADAMA’s plant
in Ashdod has been requested to conduct various land and well
surveys for groundwater by the Ministry of the Environment and by
the Water Authority. When the surveys were presented, the plant was
required to present a program to mitigate environmental risks in
accordance with methodology set by the Ministry of the Environment.
The plant presented a detailed program to the Water Authority for
the treatment of the ground water, which has been accepted in
principle by the Water Authority.
The ADAMA plant in
Be’er Sheva has been requested by the Ministry of the
Environment to conduct an historical land survey and sample tests
on ground gases. Sample tests of the ground gases have been
conducted in coordination the Ministry of the Environment, and as
of the date hereof, the plant has not been required to take any
further action in this connection.
Within the context
of the integrated environmental regulation process, ADAMA’s
plant at Neot Hovav has been required to present a historical land
survey. The survey was presented to the Ministry of the Environment
at the beginning of 2015. At this stage, ADAMA is unable to
evaluate whether additional requirements will be placed upon it in
relation to surveys or the treatment of land or ground water at its
plant, what their substance might be and whether they would have
any significant impact on it.
Pollution of the
groundwater was discovered in the Neot Hovav Council in the past,
following which the Council took various steps to halt the
spreading pollution and to extract it, including the treatment and
monitoring of the underground water. As the date hereof, ADAMA is
not required to incur expenditures in the treatment of the
pollution. The possibility exists that the Neot Hovav Council will
require ADAMA to contribute to the costs of remediation in the
future. However, ADAMA is unable at present
to evaluate whether such a demand will be made and what the size of
such a demand may be.
Adama’s Investments in the
Environment
. ADAMA’s investments in environmental
compliance in 2015, amounted to approximately US$21 million
(facilities) and approximately US$41 million (routine costs
exclusive of depreciation). ADAMA intends to continue to make
investments, insofar as may be required and deemed appropriate to
exceed these standards on environmental issues, in order to realize
its policy of optimizing compliance. In Adama’s assessment,
in each of the years 2016 – 2018 the total environmental
costs are expected to amount to approximately US$60
million.
Adama’s plan in Brazil
–ADAMA’s Brazilian subsidiary has two main plants,
located in the South of Brazil. To the best of ADAMA’s
knowledge, as at the time of this annual report, all of the permits
and the licenses are in full force and effect. The Brazilian
subsidiary invests in safety and ecological facilities in its
plants, including in the performance of independent environmental
testing to ensure compliance with the terms of its licenses,
control over water sources located near the plant and the
monitoring of emissions into the atmosphere, based on advanced
technology. Periodic tests on the volume of the emissions into the
atmosphere and the water sources show that the Brazilian plants
comply with the requirements of the State’s Ministry of the
Environment. As part of that company’s policy for improving
ecological processes, it invests in the correction of deficiencies
that have been found, changes in production processes, the building
of facilities for purifying wastewater, the storage of by-products
and recycling.
d.
Legislation,
standards, regulation and exposure in the environmental field, in
health and in safety.
Adama may bear
significant civil (including through class actions) or criminal
liability (including high fines and/or payments of high amounts of
compensation and/or environmental monitoring and rehabilitation
costs) in respect of a breach of environmental regulation and
failure to comply with health and safety standards including on the
basis of strict liability. Even though Adama makes substantial
investments in its facilities and in building special facilities in
accordance with environmental requirements, it is unable to verify
that those investments will be sufficient to satisfy evolving
requirements. In addition, Adama is subject lawsuits alleging
physical or property damage as a result of exposures to hazardous
materials, which are covered for the most part by Adama’s
insurance policies.
Telecomunnications
Communications Regulations
Cellcom’s
operations are subject to general legal provisions regulating the
relationships and method of contracting with its customers. These
provisions include the Consumer Protection Law, 5721-1981 and
regulations promulgated thereunder and other laws detailed below. A
substantial part of Cellcom’s operations are subject to the
Communications Law, regulations enacted by the Ministry of
Communications, and the provisions of the licenses granted to
Cellcom by the Minister of Communications. Cellcom’s activies
which include providing cellular service, landline, international
telephone services and internet access, and infrastructure services
are subject to licensing.
Supervision of
Rates. The Communications Regulations (Telecommunications and
Broadcasts) (Payments for Interconnect), 5760 - 2000 requires
cellular operators to phase in gradual reduction of communications
rates (i.e. payments that will be made by an in-country operator,
another cellular operator or international operator to complete one
minute of call time in the network of a cellular operator or for
the sending of an SMS between cellular operators). This reduction
has led to a considerable reduction in Cellcom’s
revenues.
Moreover, in August
2013 the Communications Law was amended to authorize the Minister
of Communications to set interconnection prices and regulate the
use of networks owned by another operator based not only on the
cost incurred to establish the network (according to the
calculation method to be determined by the Minister of
Communication) plus a reasonable profit, but also on one of the
following: (1) flat payment for a service provided by the license
holder; (2) reference to tariffs charged for a comparable service;
or (3) reference to the cost of these services or with the
interconnection costs charged in other countries. The Minister of
Communications was also empowered to give instructions on
structural separation for the providing various services, including
segregating services provided by a license holder from services
provided to a subscriber.
In the last few
years, contract termination charges for cellular plans have been
banned in the cellular and other communications markets, other than
for customers who have more than a certain number of cellular lines
or whose monthly payments exceed a certain amount for bundled
service. The elimination of these charges led to a considerable
increase in plan cancellations, increased the costs of retaining
and acquiring customers, and accelerated erosion of
rates.
Virtual Operators
(MVNO). The Communications Law and related pronouncements regulate
the activities of virtual operators. Notwithstanding that the MVNO
regulations apply only to the activities of a virtual operator
which has an operating agreement with a cellular operator, the
regulations empower the Ministry of Communications together with
the Economic Ministry to impose terms of an agreement including
fixing the price to be charged for the services
provided.
Other Third
Generation Operators (UMTS). In 2012, Golan and Hot Mobile began to
offer UMTS services. The conditions of the tender according to
which Golan and Hot Mobile were granted those licenses included a
number of benefits and concessions, including minimally low license
fees and a mechanism to reduce the royalties they undertook to pay
for the frequencies based on the operator’s market share in
the private sector and setting long timetables to meet the
geographical coverage requirements of the network and the right to
use in-country migration services via other cellular
operators’ networks. The Communications Law obliges the other
cellular operators to provide in-country migration services to
Golan and Hot Mobile for a period ranging from seven to ten years
subject to certain conditions. In 2011, Cellcom entered into a
contract with Golan to provide in-country migration services. Hot
Mobile entered into a similar in-country migration agreement with
Pelephone and later with Partner (which was subsequently replaced
by a joint networks agreement with Partner) without intervention
from the Ministry of Communications.
98
Regulation of Multi-Channel Television Services
As at the date of
this Annual Report, television program streaming via the Internet
is not subject to regulation in Israel. Should the recommendations
of the committee for the examination of the arrangement of
commercial broadcasts be adopted and the committee requires Cellcom
to make additional investments or regulation is imposed that is not
beneficial for Cellcom’s streamign services or for its
ability to use the DTT infrastructures, the results of
Cellcom’s streaming services may be adversely
affected.
Cellcom’s Communications Licenses
Cellcom holds a
general license for providing cellular services, valid until
January 31, 2022, setting out conditions (including duties and
restrictions) applicable to its activities, officers and
shareholders holding certain percentages of Cellcom’s shares.
The license may be extended by the Ministry of Communications for
consecutive periods of six years, if Cellcom is in compliance with
the provisions of the license and law, and makes requisite
investments to its service and network. The Ministry of
Communications has amended the license conditions in the past, and
may amend them in the future, without Cellcom’s consent and
in a manner that may limit its ability to conduct business. The
license provides that Cellcom does not have exclusivity for
providing services.
The cellular
license can be revoked, suspended or limited in the following
cases: total holdings of the founding shareholders or their
successors (as defined in the license) is less than 26% of the
control shares of Cellcom; total holdings of Israeli parties (as
defined in the license), who are among the founding shareholders or
their successors, is less than 20% of the total issued share
capital and control shares of Cellcom; a majority of directors are
not Israeli citizens or residents of Israel; fewer than 20% of the
directors of Cellcom were appointed by Israeli parties; any an act
or omission of Cellcom that adversely affects or restricts
competition in the cellular sector; the aggregate equity of
Cellcom, together with the aggregate equity of shareholders each
holding 10% or more of the share capital, is less than US$200
million.
In light of the
2015 change in the control structure of IDBD, the Cellcom control
structure has also changed, and requires the approval of the
Ministry of Communications, including with regard to Israeli
holding requirements included in the licenses of Cellcom, as Mr.
Eduardo Elsztain is not a citizen of Israel. IDBD and Cellcom
formally applied to the Ministry of Communications to approve these
changes and amend the telecommunications licenses of Cellcom
accordingly. If the request is not approved and another arrangement
is not offered by the Ministry of Communications, Cellcom may face
sanctions, which under the terms of its license, can include
suspension or cancellation of its licenses.
According to
Telecommunications Law, the Ministry of Communications may impose
on telecommunication companies, including Cellcom, financial
sanctions for breach of license and law. The amount of the sanction
is calculated as a percentage of the revenue of the operator, and
according to the degree of severity and extent of the breach, said
may be significant.
In July 2015,
Cellcom received (through a wholly owned entity) a uniform and
general license for the provision of landline telephony services
(which replaced the previous license for providing this service),
for the period ending April 2026. A uniform and general license was
also awarded to Netvision and replaced its general license for
providing internet access services, international carriers, and a
network access point for the period ending February 2022. In
addition, an entity, fully controlled by Cellcom received a uniform
and general license which replaced the landline telephony service
license, for the period ending March 2026. These licenses can be
extended for an additional period of 10 years, under terms similar
to the terms of extension of the general cellular
license.
The Ministry of
Communications has issued rules providing for unification of all
uniform licenses. The uniform license allows providers to also
offer virtual operator services. The process of unifying the
uniform licenses and the timetable have not yet been determined and
it is possible that this process will have a legal, financial, tax
and accounting effect on Cellcom’s and Netvision’s
businesses. The provision of a number of services by one entity
will require limitations also on discrimination between
operators.
Cellcom holds other
communications licenses: a special license for the provision of
data transmission and communication services in Israel, a license
to provide internet services, and licenses to provide cellular
services, landline telecommunication services and internet services
in the West Bank, for periods ending 2016-2018. These licenses
include conditions similar to those of the general license for the
provision of cellular services, as noted above.
According to
regulations that apply to the uniform license, there are certain
limitations on cross ownership among license holders.
2.
Further
Regulation Applicable to Communications Services
In July 2014, the
Ministry of Communications announced a public hearing on the
coverage and quality requirements for second-generation and third
generation networks. The proposed requirements are stricter than
those currently existing and if adopted, could have an adverse
effect on the results of Cellcom. Cellcom is unable to assess
whether the proposed changes will be adopted, and what the impact
of these changes will have in practice on Cellcom’s operating
results.
In addition, in
August 2014, the Ministry of Communications announced a public
hearing to consider call centers owned by communications operators.
In addition, the Ministry of Communications proposed to amend the
Communications Law (Telecommunications and Broadcasting), 1982,
providing that a customer may claim pre-set financial compensation
if the telephone call center does not reply within an average
response time or if there is an overcharge error. Cellcom believes
that adoption of these proposed changes could have a material
adverse effect on Cellcom’s business.
3.
Permits
for Setting Up Base Sites
a.
Cellcom’s
cellular services genearlly are provided through base sites across
Israel, their construction and licensing are included in TAMA 36
(District Zoning Plan) – Part A - National Master Plan for
Communications - Small and Micro Broadcasting Facilities
(“TAMA 36”), and Radiation Law. Regulating the
deployment of wireless access devices, which are base sites with
smaller dimensions, are, for the most part, regulated by
Communications Law and Radiation Law. The construction of base
sites requires a permit as per Planning and Building Law, 1965
(“Planning and Building Law”), and is subject to other
approvals from multiple regulators.
Legal proceedings
(civil, criminal and administrative) are pending against Cellcom,
under which a number of arguments were raised concerning the legal
compliance of some of Cellcom’s sites, alleging failure to
obtain permits under Planning and Building Law, or based on
development of sites in contravention of a permit.
Cellcom did not
apply for a building permit for approximately 33% of its base sites
on the basis of the exemptions for wireless access facilities
provided by law. In 2010, the Supreme Court issued a Temporary
Order at the request of the Government’s Attorney General,
enjoining Cellcom, Partner, and Pelephone from proceeding with
construction of these facilities on the basis of the exemption. A
final determination of the regulatory authorities regarding
applications for exemptions is pending as of the date of this
Annual Report.
In addition,
Cellcom provides in-building repeaters and micro-sites
(“
femtocells
”)
for its subscribers seeking a solution to poor indoor reception.
Based on an opinion Cellcom received from legal counsel, Cellcom
did not request building permits for the repeaters that were
installed on roof tops, which are a small fraction of all repeaters
installed. It is not clear whether the installation of a different
type of in-building repeaters and micro-sites requires a building
permit. Some require a specific permit while others require a
permit from the Ministry of Environmental Protection, depending on
their radiation levels. Cellcom also builds and operates microwave
facilities as part of its transmission network. The different types
of microwave facilities receive permits from the Ministry of
Environmental Protection regarding their radiation levels. Based on
an opinion of legal counsel, Cellcom believes that building permits
are not required for the installation of microwave facilities on
rooftops.
b.
Indemnification
obligation
- under Planning and Construction Law, local
planning and building committees may demand and receive, as a
condition for granting a building permit for a site, a letter of
indemnity for claims under Section 197 of Planning and Construction
Law. By December 31, 2015, Cellcom had executed approximately 400
letters of indemnity as a condition for receiving permits. In some
cases, Cellcom has not yet been built any sites. As at December 31,
2015, two requests for indemnification were received from one local
committee on the basis of a letter of indemnity as noted, in an
immaterial amount.
99
As a result of the
requirement to deposit letters of indemnity, Cellcom may decide to
dismantle or move some sites to less advantageous locations, or
build certain sites, if it concludes that the risk of granting
letters of indemnity exceeds the benefit derived from those sites,
which may result in a deterioration of cellular services and damage
network coverage.
c.
Radiation Law, Regulations and
Permits Thereunder
- Radiation Law, Regulations and
Principles thereunder included provisions relating to all aspects
related to regulating the issue of non-ionizing radiation,
including,
inter alia
,
levels of exposure that are permissible.
In May 2012, the
Ministries of Communications, Health and Environmental Protection,
based on their assessment of the potential health consequences of
fourth-generation telecommunications services in Israel, including
increased exposure to non-ionizing radiation, issued a memorandum
advising that deployment of the fourth-generation network should be
based on existing base stations, other smaller base sites both
internal and external, and if possible, using the wired
infrastructure so that data traffic will be carried mainly through
fixed communication lines and not through any cellular
infrastructure. In August 2014, the Ministry of Communications
allowed the use of fourth-generation infrastructures, and in
January 2015 fourth-generation frequencies were awarded to cellular
operators. The recommendations of May 2012, as noted, were not
included in the tender documents or in said approval.
4.
The Reduced Centralization Act
Given the holding
structure of the I.D.B. Group, Cellcom is considered in the
“third layer”. Cellcom is included in the list of
centralized parties, and in the list of significant non-financial
corporations under said Law. According to said Law, DIC and IDBD
must take steps to have Cellcom cease to be a “third
layer” by December 2019. DIC and IDBD have announced that
they are considering steps to achieve this goal without giving up
control of Cellcom, by taking DIC or IDBD private or implementing a
merger of DIC and IDBD. As of the date of this Annual Report, there
is no certainty regarding the implementation of these strategies.
The provisions of the Reduced Centralization Act regarding the
allocation of rights over public assets could adversely affect the
ability of Cellcom to renew its cellular licenses and to receive
new frequencies, which may adversely affect Cellcom’s ability
to issue debt or adversely affect its business.
a.
Changes in legislation and high regulatory
intervention
- legislative changes and active regulatory
enforcement may have an adverse influence especially if material
financial sanctions are imposed on Cellcom, on the ability of
Cellcom to plan its management and on its operating results, if any
of the following occurs: the cancelation or relief for the
obligation for structural separation applicable to Bezeq and Hot,
especially if the said cancelation or easing is given prior to the
establishment of the effective wholesale market in landline
communications, if tariffs do not encourage competition or if other
regulation is set out in the wholesale landline market which
adversely affects Cellcom’s operations; the granting of
relief and benefits to competitors compared with Cellcom; the
authorization of other operators to provide services to Cellcom
subscribers which were previously provided only by Cellcom; the
non-renewal of licenses and/or frequencies available to Cellcom or
the increased use thereof, and the non-location of additional
frequencies, where required; the imposition of additional
requirements in respect of public safety or health, including with
respect to base sites; imposition of additional restrictions or
requirements for providing services and products and/or intervening
in market conditions; imposition of a higher standard of service;
imposition of stricter privacy policies; the imposition of
regulation on streaming services, the imposition of conditions
which are not beneficial for the users of DTT broadcasts, or the
imposition of conditions that impact Cellcom and do not apply to
other operators of streaming services over the
internet.
b.
Labor Law.
In February 2015, a
collective bargaining agreement was signed with the workers
representative body and with the Histadrut for a period of three
years (form 2015 to 2017) which applies to all employees of Cellcom
and Netvision, except members of senior management. This agreements
limits the right of Cellcom to make organizational and personal
changes and makes such changes more expensive as reflected in the
voluntary retirement plans executed in 2014 and 2015 and may also
require greater management attention to administer.
Insurance
Areas of Activity of Clal Insurance Business Holdings
Clal Holdings
offers general insurance such as car insurance, homeowners’
insurance, and credit and foreign trade risk insurance, among
others, as well as health insurance. The activities of Clal
Holdings and its subsidiaries are subject to the provisions of laws
applicable insurance companies and to regulatory supervision. Clal
Holdings’ subsidiaries are supervised by the Capital Markets,
Insurance and Savings Commissioner (the “Insurance
Commissioner”). Clal Insurance and its subsidiary, Clalbit
Financing, are supervised by the Israel Securities Authority.
Subsidiaries of the Clal Holdings Insurance Group have been subject
to administrative enforcement proceedings and the imposition of
fines. Clal Insurance is not in breach of any material regulatory
provision applicable to its operations.
Capital Requirements of Insurance Companies
Minimum Capital
– The
Supervision of Financial Services (Insurance) (Minimum Equity
Required of an Insurer), Regulations, 1998 (“Capital
Regulations”) law prescribes minimum capital requirements for
insurance companies. The capital required for insurance activities
consists of a first layer of capital, based the greater of the
initial capital and capital derived from the volume of activity in
general insurance, the higher of the calculation based on premiums
and the calculation based on outstanding claims, as well as other
capital requirements. Failure to comply with the Capital
Regulations will require the insurer to increase its equity up to
the amount stated in the Capital Regulations or reduce the scope of
its business accordingly, no later than the date of publication of
the report, except in exceptional circumstances as approved by the
Insurance Commissioner, that will then determine any supplementary
capital requirements.
Breakdown of an Insurer’s
Capital
– The Insurance Commissioner issued a circular
in August 2011 (“Circular”) that provides a framework
for determining the composition of an insurer’s equity, in
conjunction with the adoption in Israel of the Solvency II
Directive (“Directive” or “Solvency II”),
as amended and updated.
·
Initial (core)
capital (basic tier 1), equals the components included in capital
attributable to shareholders of Clal Insurance. The overall capital
ratio must be at least 60% of the total equity of the
insurer.
·
Secondary (tier 2)
capital includes complex secondary capital instruments (excluding
periodic accrued interest payments), subordinate secondary capital
instruments (as defined by the Circular) and any other component or
instrument approved by the Insurance Commissioner. A complex
secondary capital instruments is one that is subordinated to any
other instrument, except for initial capital, including financial
instruments available to absorb losses by postponing payment of
principal and interest. The first repayment date of secondary
capital instruments will be after the end of the period that
reflects the weighted average maturity of insurance liabilities,
plus two years, or after 20 years, whichever is first, but no
earlier than eight years from the date an instrument is issued. If
the complex secondary capital instrument includes an incentive for
early redemption, the first incentive payment date may not be
earlier than five years from the date of issue of the
instrument.
100
·
Tertiary (tier 3)
capital includes complex tertiary capital instruments (excluding
periodic accrued interest payments) and any other component or
instrument approved by the Insurance Commissioner. A tertiary
capital instrument is subordinate to any other instrument, except
for primary and secondary capital, and includes financial
instruments available to absorb the insurer’s losses by
postponing the payment of principal. Tertiary capital will must be
junior to secondary capital and equal in the order of credit
repayments. The first repayment date on tertiary capital
instruments may not be earlier than five years from the date of
issuance. If the complex tertiary capital instrument includes an
incentive for early redemption, the first indentive payment date
may not be earlier than five years from the date of issue of the
instrument. Tertiary capital may not exceed 15% of the total
capital of the insurer.
Insurance
liabilities include liabilities that are not yield dependent but
excludes any liability fully backed by lifetime indexed bonds and
net of any reinsurance costs. Approval of the Insurance
Commissioner is required for inclusion of hybrid capital
instruments (primary, secondary or tertiary) in equity. The
Circular includes a Temporary Order regarding the breakdown of an
insurer’s equity (“Temporary Order”), which will
apply until full implementation of the Directive in Israel, when
announced by the Insurance Commissioner. The Temporary Order
defines the secondary capital issued according to Capital
Regulations, before amendment, as subordinate secondary capital and
imposes a limit equal to 50% of basic capital.
Distribution of dividends
– In accordance with rules promulgated by the Insurance
Commissioner, a dividend distribution may not be approved, unless,
after giving pro forma effect to the proposed distribution, the
insurer has a ratio of recognized equity to required equity of at
least 105%, as confirmed in filings with the Insurance
Commissioner. Prior approval of the Insurance Commissioner is not
required for any distribution of dividends if the total equity of
the insurance company, as defined by Supervision of Financial
Services (Insurance) (Minimum Equity Required of an Insurer),
Regulations, 1998 (“Minimum Capital Regulations”),
after giving effect to the distribution of the proposed dividend,
exceeds 115% of the required equity.
In November 2014,
the Insurance Commissioner outlined solvency rules
(“rules” or “regime”, as applicable) based
on Solvency II, in Israel, in a letter addressed to managers of the
insurance companies (“Letter”). In the Letter, the
Insurance Commissioner outlined a plan to adopt the 2016 European
model for calculating capital and capital requirements for the
local market, effective as of the annual reports for 2016
(“First Adoption Date”). During a period to be
determined by the Insurance Commissioner and as conditions require,
insurance companies will also be required to comply with capital
requirements under existing regulations. The Letter stated that
until final adoption, insurance companies must prepare additional
quantitative assessment exercises (IQIS) for the 2014 -2015 period.
These requirements are intended to assess the quantitative effects
of adopting the model, as well as providing data for calibrating
and adjusting the model. In addition, the Letter addressed an
initiative to develop a framework for quarterly reporting of
insurance companies’ solvency ratio. The Letter also referred
to the Commissioner’s intention to publish provisions for
managing capital and targets for internal capital, to address a gap
survey that insurers will undertake with respect to their risk
management systems, controls and corporate governance and a
consultation paper to promote the process of self-assessment of
risks and solvency (ORSA).
In April 2015, the
Insurance Commissioner published a second letter titled “Plan
for the Adoption of Rules for Solvency, based on Solvency II”
and provisions for the IQIS4 exercises to be undertaken regarding
the 2014 historical financial statements. The letter emphasized
that the exercise reflects the decision of the Insurance
Commissioner to impose adjustments required for the Israeli
insurance market. The Letter further stated in connection with the
proposed adoption of IQIS5 that the Insurance Commissioner would
continue to monitor developments in the European markets and would
consider adjustments relevant for Israel.
In July 2015, the
Insurance Commissioner issued a letter concerning
“transitional provisions regarding the application of
solvency rules, based on Solvency II” (the “Letter on
Transitional Provisions”). The transitional provisions were
provided by reference to certain solvency rules set forth in the
European Directive relating to, inter alia, a gradual adoption of
capital requirements in respect of holdings of equity shares which
may a component to be included in the calculation of core capital.
In addition, the letter included transitional provisions regarding
submission of a plan to improve the capital ratios of insurance
companies whose ratios are negatively affected following adoption
of the new solvency rules beginning with the financial statements
for 2018. Adoption of the solvency rules are expected to change
both the recognized regulatory and required regulatory capital and
according to indications existing today, is expected to result in a
significant decline in the ratio between recognized capital and
required capital of Clal Insurance compared to capital ratios
calculated according to capital ratio requirements currently in
effect, and is expected to adversely affect the ability of Clal
Insurance and Clal Insurance Enterprises to distribute dividends
upon such adoption. However, as a rule, the capital requirements
under the solvency rule are intended to serve as a capital cushion
against more serious events, with a lower loss probability than the
capital requirements under current rules.
In May 2015, the
Board of Directors of Clal Insurance Enterprises and the Board of
Directors of Clal Insurance directed its management team and the
Risk Management Committee, which also functions as the Solvency
Committee (“Committee”), to examine measures Clal
Insurance may be able to employ to improve its capital ratio, in
accordance with the new solvency rules and to recommend a course of
action to the Board, including in relation to business adjustments
and/or financial transactions related to Clal Insurance’s
capital, its breakdown, and/or its responsibilities. The Committee
and Management have begun this examination, and during the first
stage, recommended that the Board issue secondary capital
instruments. The Committee will continue to examine other measures
in an effort to prepare the company for possible adoption of these
proposed capital requirements, and related measures.
Clal Insurance has
calculated its capital ratio using results as of December 31, 2014
(“Calculation Date”) and based on the IQIS4 rules and
has determined that it would be in compliance, as of the
Calculation Date, with the proposed capital requirements, in the
context of the transitional provisions, even before taking pro
forma account of the positive impact on the capital ratio provided
by the subsequent issuance of subordinated notes. The related
calculations were submitted to the Insurance Commissioner on August
31, 2015. The Insurance Commissioner has not yet published binding
provisions for adoption, and there is uncertainty regarding the
details of the final provisions. Clal Insurance will continue to
monitor the quantitative aspects of the proposed solvency rules
towards final adoption, in an effort to anticipate requisite
controls and capital requirements.
On March 14, 2016,
“IQIS Provisions for 2015” (“Draft”) was
published in preparation for the adoption of Solvency II. Insurance
companies are required to submit an additional quantitative
evaluation survey on the basis of December 2015 results
(“IQIS5”), by June 30, 2016. The Draft was issued by
reference to the European legislation adapted for requirements of
the local market and that goes beyond provisions for quantitative
evaluation surveys previously issued. The main changes relate to
establishing risk-free interest curves, through extrapolation to
the ultimate forward rate point, the components of recognized
capital, capital requirements less investments in infrastructure
(capital and debt), adjusting capital requirements for management
companies, and updating the formula for calculating capital
requirements for risk premiums and reserves for general insurance.
Clal Insurance is unable to assess the overall impact of the
changes based on the provisions in the Draft to carry out a further
quantitative evaluation survey, and will carry out an assessment of
the current capital status, when the binding provisions will be
finalized. According to the Draft, the IQIS5 calculation will be a
factor in assessing preparedness of insurance companies and to the
implementation and scope of the final provisions to be
adopted.
Capital
requirements under the Capital Regulations are based on the
separate individual financial statements of an insurance company.
For purposes of calculating recognized capital, an investment by an
insurance company in an insurance company or a controlled
management company, and in other investee companies will be
calculated on the equity basis, according to a holding rate, which
includes indirect holdings.
The minimum capital
required of Clal Insurance has been reduced, with approval of the
Insurance Commissioner, by 35% of the original difference
attributed to the managing companies and provident funds under its
control. However, when calculating the amount of dividends
permitted for distribution, this difference will be added at level
of the capital structure, as detailed in Paragraph 13.7.3 (C). In
September 2013, the Insurance Commissioner notified Clal Insurance
that the deducted amount to be added back to the minimum capital
required, will be after a deduction for a tax reserve accrued by
Clal Insurance following the acquisition of provident fund
operations. The approval of the Insurance Commissioner, as noted
above, will be canceled with adoption of capital requirements under
the Directive (see Paragraph 13.7.3 (C)) that will replace the
Capital Regulations.
In March 2013, Clal
Insurance received a letter from the Insurance Commissioner
regarding the determination of credit ratings according to an
internal model used by Clal Insurance (“internal
model”), to be applied as a risk rating methodology for a
subject insured, according to conditions of the relevant sector.
The Insurance Commissioner authorized Clal Insurance to allocate
capital for adjusted loans, ranked according to its internal model
and with reference to the rates specified in the Capital
Regulations. If there is an external rating available, the capital
allocation will be made using the lower of the available ratings.
The letter also requires Clal Insurance to submit immediate and
periodic reports as specified regarding these activities that make
the specified transactions subject to review by the Commissioner of
Insurance. As a result of its compliance with the provisions of the
letter, Clal Insurance’s capital requirements were reduced by
NIS 69 million, as at the end of the reporting period.
101
Permit Issued by the Insurance Commissioner to the Former
Controlling Shareholders of IDB Holdings to Retain Control of Clal
Insurance Enterprises and Consolidated Institutional
Entities
On May 8, 2014,
legal counsel for the former controlling shareholders of IDB
Development (Ganden, Manor, and Livnat Groups) was notified by the
Commissioner that in the context of arrangements among the
creditors of IDB Holdings (“IDBH”), and given that they
no longer controlled the Clal Insurance Enterprises Group, the
authorization previously issued by the Insurance Commissioner for
control of these entities was terminated, including, with respect
to Clal Insurance, Clal Credit Insurance and Clal Pension and
Provident Funds. IDB Holdings undertook to supplement (or to cause
its controlled affiliates to supplement) the required equity of the
insurers in compliance with the Capital Regulations, subject to the
a cap of 50% of the required capital of an insurer, and that the
obligation will take effect only if the insurer’s equity is
determined to be negative, and such funding amount will then be
equal to the amount of negative capital, up to the 50%
cap.
In addition, IDB
Holdings undertook to contribute to the equity of Clal Pension and
Provident Funds up to the amount prescribed by the Provident Fund
Regulations, for as long as IDB Holdings is the controlling
shareholder of the institutional entities. The authorization
specifies conditions and imposes restrictions on the ability of a
holding entity to impose liens on the equity of IDBD’s
institutional entities it holds. The former controlling
shareholders were also required, as long as any liens existed on
their equity interest of IDB Holdings, to ensure that Clal
Insurance Enterprises complied with applicable capital
requirements, such that the equity of Clal Insurance Enterprises at
no time was less than the product of the holding rate of Clal
Insurance Enterprises in Clal Insurance and 140% of the required
minimum equity of Clal Insurance, calculated according to the
Capital Regulations on September 30, 2005 (as the holding rate was
linked to the CPI of September 2005).
At the end of the
reporting period, the required minimum capital of Clal Insurance
Enterprises was NIS 2.9 billion, greater that the amount required
based on the foregoing calculation. The capital requirement is
calculated on the basis of the financial statements of Clal
Insurance Enterprises. Following termination of the control
authorization, the former controlling shareholders have questioned
whether the capital requirements applicable to Clal Insurance
Enterprises thereunder continue to apply.
Clal Insurance is
committed to finding a strategy to supplement its required equity
in compliance with the Capital Regulations if the equity of Clal
Credit Insurance becomes negative, and as long as Clal Insurance is
the controlling shareholder of Clal Credit Insurance. Clal
Insurance is committed to supplement the equity of Clal Pension and
Provident Funds as necessary to ensure it complies with the minimum
amount required by Income Tax Regulations (Rules for Approval and
Management of Provident Funds), 1964 (“Income Tax
Regulations”). This commitment is valid as long as Clal
Insurance controls, directly or indirectly, Clal Pension and
Provident Funds.
In February 2012,
Supervision of Financial Services Regulations (Provident Funds)
(Minimum Capital Required of a Management Company of a Provident
Fund or Pension Fund), 2012, was published along with Income Tax
Regulations (Rules for Approval and Management of Provident Funds)
(Amendment 2), 2012 (“new regulations”).
Pursuant to the new
regulations, the capital requirements for management companies were
expanded to include capital requirements based on the volume of
assets under management and applicable annual expenses, but not
less than the initial capital of NIS 10 million. In addition,
liquidity requirements were also prescribed. A fund management
company may distribute dividends only to the extent of any excess
above the minimum amount of equity required by said regulations. In
addition, a fund management company must provide additional capital
in respect of controlled management companies. As at the end of the
reporting period, the management companies controlled by Clal
Insurance have capital balances in excess of the minimum capital
required by the capital regulations for management companies. In
light of capital regulations for management companies and in order
to finance the expansion of operating and investing activities of
Clal Pension and Provident Funds, the Boards of Directors of Clal
Insurance and Clal Pension and Provident Funds in 2015 and 2014
approved an subscribed shares of Clal Pension and Provident Funds
in consideration for NIS 100 million and NIS 80 million,
respectively.
Anti-Money Laundering
. In
September 2015, a draft Anti-Money Laundering Order was proposed
which seeks to expand its application to certain provident funds,
and reduced the amounts of accumulations, deposits and withdrawals
subject to reporting. Furthermore, the draft order specifies a
‘know your customer’ process that must be undertaken
before issuing a life insurance policy or opening a provident fund.
In October 2015, a draft addendum to the Anti-Money Laundering Law,
5776-2015 was published to provide for changes to existing law that
set forth stricter criminal penalties under the Anti-Money
Laundering Law and set forth provisions for sharing of information
between the Anti-Money Laundering Authority and the insurance
commissioner. In the evaluation of Clal Insurance, the draft order
and draft bill may adversely affect the sale of its
products.
102
C.
ORGANIZATIONAL STRUCTURE
Subsidiaries
and associated companies
The following table
includes a description of our subsidiaries and associated companies
as of June 30, 2016:
|
Subsidiaries
|
Effective
Ownership and Voting Power Percentage
|
Property/Activity
|
|
|
|
|
|
Agro Managers
S.A
|
46.84%
|
Agro Managers S.A.
is engaged in doing by itself or on behalf of third parties
investments in the country or overseas through long and short term
loans with or without warranties, derivatives, stocks and
commodities as well as any kind of debentures or credit
notes.
|
|
Agro-Uranga
S.A
|
35.72%
|
Agro-Uranga S.A. is
an agricultural company which owns 2 farmlands (Las Playas and San
Nicolás) that have 8.299 hectares on the state of Santa Fe and
Córdoba.
|
|
|
|
|
|
|
|
|
|
Brasilagro
Companhia Brasileira de Propiedades Agrícolas
|
39.76%
(1)
|
Brasilagro is
mainly involved in four productive activities: sugarcane, crops and
cotton, forestry activities, and livestock.
|
|
|
|
|
|
|
|
|
|
|
|
|
|
Doneldon
|
100%
|
Doneldon S.A. is
involved in investments in entities organized in Uruguay or abroad
through the purchase and sale of bonds, shares, debentures and any
kind of securities and commercial paper under any of the systems or
forms created or to be created, and in the management and
administration of the capital stock it owns on companies controlled
by it.
|
|
Futuros y
Opciones.Com S.A.
|
59.59%
|
A leading
agricultural web site which provides information about markets and
services of economic and financial consulting through the Internet.
The company has begun to expand the range of commercial services
offered to the agricultural sector by developing direct sales of
supplies, crops brokerage services and cattle
operations.
|
|
Agrofy
S.A.
|
45.23%
|
Agrofy S.A. is
involved in the creation, operation, development, management,
buying and selling of websites and domain names on the
Internet.
|
|
Amauta Agro
S.A.
|
59,63%
|
Amauta Agro
S.A.’s purpose is to engage, in its own name or on behalf of
or associated with third parties, in activities related to the
production of agricultural products and raw materials, export and
import of agricultural products and national and international
purchases and sales of agricultural products and raw
materials.
|
|
Granos Olavarria
S.A.
|
59,63%
(2)
|
Granos
Olavarría S.A. is principally engaged to the warehousing of
cereals and brokering of grains.
|
|
|
|
|
|
Helmir
S.A.
|
100%
|
Helmir S.A. is
involved in investments in entities organized in Uruguay or abroad
through the purchase and sale of bonds, shares, debentures and any
kind of securities and commercial paper under any of the systems or
forms created or to be created, and to the management and
administration of the capital stock it owns on companies controlled
by it.
|
|
IRSA Inversiones y
Representaciones Sociedad Anónima
|
63.77%
(1)
|
IRSA is a leading
Argentine company devoted to the development
and management of real estate.
|
|
|
|
|
|
|
|
|
|
Sociedad
Anónima Carnes Pampeanas S.A. (formerly known as
Exportaciones Agroindustriales Argentinas S.A.)
|
100%
(3)
|
Sociedad
Anónima Carnes Pampeanas, a company that owns a cold storage
plant in Santa Rosa, Province of La Pampa, with capacity to
slaughter and process approximately 9,500 cattle head per
month.
|
|
|
||
|
|
|
|
|
|
|
|
(1) Excludes effect
of treasury stock.
(2) Includes
Futuros y Opciones.Com S.A.’s interest.
(3) Includes
Helmir’s interest.
103
Overview
of Agricultural Properties
As of June 30,
2016, we owned, together with our subsidiaries, 31 farmlands, which
have a total surface area of 622,220 hectares.
The following table
sets forth our properties’ size (in hectares), primary
current use and book value. The market value of farmland is
generally higher the closer a farmland is located to Buenos
Aires:
|
Owned Farmlands as of June 30,
2016
|
|
|||||||
|
|
Facility
|
Province
|
Country
|
Gross
Size
|
Date
of Acquisition
|
Primary
Current Use
|
Net
Book Value
|
|
|
|
|
|
|
(in
hectares)
|
|
|
(Ps.
Millions)
(1)
|
|
|
|
|
|
|
|
|
|
|
|
|
1
|
El
Recreo
|
Catamarca
|
Argentina
|
12,395
|
May 95
|
Natural
woodlands
|
1.3
|
|
|
2
|
Los
Pozos
|
Salta
|
Argentina
|
239,639
|
May
’95
|
Cattle/
Agriculture/ Natural woodlands
|
152.6
|
|
|
3/4
|
San
Nicolás/Las Playas
(2)
|
Santa
Fe/Córdoba
|
Argentina
|
2,966
|
May
‘97
|
Agriculture/
Dairy
|
19.4
|
|
|
5/6
|
La Gramilla/ Santa
Bárbara
|
San
Luis
|
Argentina
|
7,072
|
Nov
‘97
|
Agriculture Under
irrigation
|
44.9
|
|
|
7
|
La
Suiza
|
Chaco
|
Argentina
|
36,380
|
Jun
‘98
|
Agriculture/
Cattle
|
43.7
|
|
|
8
|
La
Esmeralda
|
Santa
Fe
|
Argentina
|
9,370
|
Jun
‘98
|
Agriculture/
Cattle
|
16.3
|
|
|
9
|
El
Tigre
|
La
Pampa
|
Argentina
|
8,360
|
Apr
‘03
|
Agriculture/
Dairy
|
34.2
|
|
|
10
|
El
Invierno
|
La
Pampa
|
Argentina
|
1,946
|
Jun
‘05
|
Agriculture
|
9.2
|
|
|
11
|
San
Pedro
|
Entre
Rios
|
Argentina
|
6,022
|
Sep
‘05
|
Agriculture
|
49.0
|
|
|
12/13
|
8 De Julio/
Estancia Carmen
|
Santa
Cruz
|
Argentina
|
100,911
|
May ‘07/ Sep
‘08
|
Sheep
|
11.0
|
|
|
14
|
Administración
Cactus
|
San
Luis
|
Argentina
|
171
|
Dec
‘97
|
Natural
woodlands
|
1.5
|
|
|
15
|
Las
Vertientes
|
Cordoba
|
Argentina
|
4
|
-
|
Silo
|
0.7
|
|
|
16
|
La
Esperanza
|
La
Pampa
|
Argentina
|
980
|
Mar
‘08
|
Agriculture
|
4.3
|
|
|
17
|
Finca
Mendoza
|
Mendoza
|
Argentina
|
389
(5)
|
Mar
‘11
|
Natural
woodlands
|
0.1
|
|
|
18
|
Establecimiento
Mendoza
|
Mendoza
|
Argentina
|
9
|
Nov’03
|
Natural
woodlands
|
6.8
|
|
|
19/20/21/22
|
Las Londras/San
Rafael/ Cuatro Vientos/ La Primavera
|
Santa
Cruz
|
Bolivia
|
12,533
|
Nov-08/Jan-11
|
Agriculture
|
470.3
|
|
|
23/24/25
|
Jeroviá/Marangatú/Udra
(3)
|
Mariscal Estigarribia
|
Paraguay
|
58,754
|
Feb-09
|
Agriculture
/Natural Woodlands
|
244.0
|
|
|
26/31
|
Brasilagro
(4)
|
|
Brazil
|
124,319
|
|
Agriculture/
Forestry/Cattle
|
1,185.1
|
|
|
|
Subtotal
|
|
|
622,220
|
|
|
2,294.6
|
|
|
(1)
|
Acquisition costs
plus improvements and furniture necessary for the production, less
depreciation.
|
|
(2)
|
Hectares and
carrying amount in proportion to our 35.72% interest in Agro-Uranga
S.A.
|
|
(3)
|
Hectares and
carrying amount in proportion to our 50.00% interest in Cresca
through Brasilagro.
|
|
(4)
|
See the section
“Overview of Brasilagro’s
Properties”.
|
|
(5)
|
Corresponds to our
40% ownership of Establecimiento Mendoza.
|
Overview of Brasilagro’s Properties
As of June 30,
2016, we owned, together with our subsidiaries, 6 farmlands, which
have a total surface area of 124,319 hectares, acquired at a highly
convenient value compared to the average of the region, all of them
with a great appreciation potential.
|
Properties
|
Place
|
Total
Area
|
Use
|
Net
Book Value
|
|
(ha)
|
(Ps.
Millions)
|
|||
|
Jatobá
Farmland
|
Jaborandi/BA
|
31,606
|
Agriculture
|
263.1
|
|
Alto Taquari
Farmland
|
Alto
Taquari/MT
|
5,395
|
Agriculture
|
144.6
|
|
Araucária
Farmland
|
Mineiros/GO
|
8,124
|
Agriculture
|
237.4
|
|
Chaparral
Farmland
|
Correntina/BA
|
37,183
|
Agriculture
|
322.9
|
|
Nova Buriti
Farmland
|
Januária/MG
|
24,212
|
Forestry
|
89.6
|
|
Preferência
Farmland
|
Barreiras/BA
|
17,799
|
Cattle
|
127.5
|
|
|
Subtotal
Brazil
|
124,319
|
|
1,185.1
|
|
|
|
|
|
|
|
Jeroviá/Marangatú/Udra
|
Mariscal
Estigarribia, Paraguay
|
58,754
|
Agriculture
/Natural Woodlands
|
244.0
|
|
|
|
|
|
|
|
|
|
|
|
|
|
|
Total
|
183,073
|
|
1,129.1
|
In the ordinary
course of business, the leases property or spaces for
administrative or commercial use both in Argentina and Israel under
operating lease arrangements. The agreements entered into include
several clauses, including but not limited, to fixed, variable or
adjustable payments.
Overview
of Urban properties and investment business
As of June 30,
2016, most of our property was located in Argentina. We lease our
headquarters, located at Bolívar 108, (C1066AAB) Ciudad
Autónoma de Buenos Aires. We do not currently lease any
material properties other than our headquarters.
104
The following table
sets forth certain information about our properties in Argentina as
of June 30, 2016:
|
Property
(6)
|
|
Date
of Acquisition
|
|
|
Leasable/
Sale
m2
(1)
|
|
Location
|
|
Net
Book
Value
Ps.
(2)
|
|
|
Encumbrance
|
|
|
Outstanding
principal amount Ps./000
|
|
|
Maturity
Date
|
|
|
Balance
due at maturity
Ps./000
|
|
|
Rate
|
|
Use
|
|
Occupancy
rate
(7)
|
|
||||||||
|
Edificio
República
|
|
Apr-08
|
|
|
|
19,885
|
|
City of Buenos
Aires
|
|
|
189
|
|
|
|
-
|
|
|
|
-
|
|
|
|
-
|
|
|
|
-
|
|
|
|
-
|
|
Office
Rental
|
|
|
100.0%
|
|
|
Torre
Bankboston
|
|
Aug-07
|
|
|
|
14,873
|
|
City of Buenos
Aires
|
|
|
134
|
|
|
|
-
|
|
|
|
-
|
|
|
|
-
|
|
|
|
-
|
|
|
|
-
|
|
Office
Rental
|
|
|
100.0%
|
|
|
Bouchard
551
|
|
Mar-07
|
|
|
|
-
|
|
City of Buenos
Aires
|
|
|
8
|
|
|
|
-
|
|
|
|
-
|
|
|
|
-
|
|
|
|
-
|
|
|
|
-
|
|
Office
Rental
|
|
|
-
|
|
|
Intercontinental
Plaza
|
|
Nov-97
|
|
|
|
6,569
|
|
City of Buenos
Aires
|
|
|
10
|
|
|
|
-
|
|
|
|
-
|
|
|
|
-
|
|
|
|
-
|
|
|
|
-
|
|
Office
Rental
|
|
|
100.0%
|
|
|
Bouchard
710
|
|
Jun-05
|
|
|
|
15,014
|
|
City of Buenos
Aires
|
|
|
60
|
|
|
|
-
|
|
|
|
-
|
|
|
|
-
|
|
|
|
-
|
|
|
|
-
|
|
Office
Rental
|
|
|
100.0%
|
|
|
Dique
IV
|
|
Dec-97
|
|
|
|
-
|
|
City of Buenos
Aires
|
|
|
-
|
|
|
|
-
|
|
|
|
-
|
|
|
|
-
|
|
|
|
-
|
|
|
|
-
|
|
Office
Rental
|
|
|
-
|
|
|
Maipú
1300
|
|
Sep-95
|
|
|
|
1,353
|
|
City of Buenos
Aires
|
|
|
5
|
|
|
|
-
|
|
|
|
-
|
|
|
|
-
|
|
|
|
-
|
|
|
|
-
|
|
Office
Rental
|
|
|
100.0%
|
|
|
Libertador
498
|
|
Dec-95
|
|
|
|
620
|
|
City of Buenos
Aires
|
|
|
3
|
|
|
|
-
|
|
|
|
-
|
|
|
|
-
|
|
|
|
-
|
|
|
|
-
|
|
Office
Rental
|
|
|
100.0%
|
|
|
Suipacha
652/64
|
|
Nov-91
|
|
|
|
11,465
|
|
City of Buenos
Aires
|
|
|
8
|
|
|
|
-
|
|
|
|
-
|
|
|
|
-
|
|
|
|
-
|
|
|
|
-
|
|
Office
Rental
|
|
|
90.7%
|
|
|
Dot
Building
|
|
Nov-06
|
|
|
|
11,242
|
|
City of Buenos
Aires
|
|
|
122
|
|
|
|
-
|
|
|
|
-
|
|
|
|
-
|
|
|
|
-
|
|
|
|
-
|
|
Office
Rental
|
|
|
100.0%
|
|
|
Santa María
del Plata
|
|
Oct-97
|
|
|
|
106,610
|
|
City of Buenos
Aires
|
|
|
13
|
|
|
|
-
|
|
|
|
-
|
|
|
|
-
|
|
|
|
-
|
|
|
|
-
|
|
Other
Rentals
|
|
|
100.0%
|
|
|
Nobleza
Picardo
|
|
May-11
|
|
|
|
109,610
|
|
City of Buenos
Aires
|
|
|
7
|
|
|
|
-
|
|
|
|
-
|
|
|
|
-
|
|
|
|
-
|
|
|
|
-
|
|
Office
Rental
|
|
|
74.8%
|
|
|
Other
Properties
(5)
|
|
N/A
|
|
|
|
38,646
|
|
N/A
|
|
|
266
|
|
|
|
-
|
|
|
|
-
|
|
|
|
-
|
|
|
|
-
|
|
|
|
-
|
|
Other
Rentals
|
|
|
42.8%
|
|
|
Abasto
(3)
|
|
Jul-94
|
|
|
|
36,737.6
|
|
City of Buenos
Aires, Argentina
|
|
|
245
|
|
|
|
-
|
|
|
|
-
|
|
|
|
-
|
|
|
|
-
|
|
|
|
-
|
|
Shopping
Center
|
|
|
99.8%
|
|
|
Alto
Palermo
(3)
|
|
Nov-97
|
|
|
|
18,966.0
|
|
City of Buenos
Aires, Argentina
|
|
|
208
|
|
|
|
-
|
|
|
|
-
|
|
|
|
-
|
|
|
|
-
|
|
|
|
-
|
|
Shopping
Center
|
|
|
99.6%
|
|
|
Alto
Avellaneda
(3)
|
|
Dec-97
|
|
|
|
35,887.0
|
|
Province of Buenos
Aires, Argentina
|
|
|
127
|
|
|
|
-
|
|
|
|
-
|
|
|
|
-
|
|
|
|
-
|
|
|
|
-
|
|
Shopping
Center
|
|
|
100.0%
|
|
|
Alcorta
Shopping
(3)
|
|
Jun-97
|
|
|
|
15,876.7
|
|
City of Buenos
Aires, Argentina
|
|
|
116
|
|
|
|
-
|
|
|
|
-
|
|
|
|
-
|
|
|
|
-
|
|
|
|
-
|
|
Shopping
Center
|
|
|
89.1%
|
|
|
Patio
Bullrich
(3)
|
|
Oct-98
|
|
|
|
11,782.7
|
|
City of Buenos
Aires, Argentina
|
|
|
109
|
|
|
|
-
|
|
|
|
-
|
|
|
|
-
|
|
|
|
-
|
|
|
|
-
|
|
Shopping
Center
|
|
|
99.1%
|
|
|
Alto
Noa
(3)
|
|
Mar-95
|
|
|
|
19,039.9
|
|
City of Salta,
Argentina
|
|
|
32
|
|
|
|
-
|
|
|
|
-
|
|
|
|
-
|
|
|
|
-
|
|
|
|
-
|
|
Shopping
Center
|
|
|
100.0%
|
|
|
Buenos Aires
Design
(3)
|
|
Nov-97
|
|
|
|
13,903.1
|
|
City of Buenos
Aires, Argentina
|
|
|
7
|
|
|
|
-
|
|
|
|
-
|
|
|
|
-
|
|
|
|
-
|
|
|
|
-
|
|
Shopping
Center
|
|
|
95.7%
|
|
|
Mendoza
Plaza
(3)
|
|
Dec-94
|
|
|
|
42,043.0
|
|
Mendoza,
Argentina
|
|
|
92
|
|
|
|
-
|
|
|
|
-
|
|
|
|
-
|
|
|
|
-
|
|
|
|
-
|
|
Shopping
Center
|
|
|
95.2%
|
|
|
Alto Rosario
(3)
|
|
Nov-04
|
|
|
|
28,795.5
|
|
Santa Fe,
Argentina
|
|
|
127
|
|
|
|
-
|
|
|
|
-
|
|
|
|
-
|
|
|
|
-
|
|
|
|
-
|
|
Shopping
Center
|
|
|
100.0%
|
|
|
Córdoba
Shopping –Villa Cabrera
(3)
|
|
Dec-06
|
|
|
|
15,581.7
|
|
Córdoba,
Argentina
|
|
|
53
|
|
|
Anticresis
|
|
|
|
3,2
|
|
|
Jan-17
|
|
|
|
17,7
|
|
|
Libor+1,5%+CER
|
|
Shopping
Center
|
|
|
99.2%
|
|
|||
105
|
Dot Baires
Shopping
(3)
|
|
May-09
|
|
|
|
49,640.7
|
|
City of Buenos
Aires, Argentina
|
|
|
368
|
|
|
|
-
|
|
|
|
-
|
|
|
|
-
|
|
|
|
|
|
|
|
-
|
|
Shopping
Center
|
|
|
100.0%
|
|
|
Soleil Premium
Outlet
(3)
|
|
Jul-10
|
|
|
|
13,991.1
|
|
Province of Buenos
Aires, Argentina
|
|
|
80
|
|
|
|
-
|
|
|
|
-
|
|
|
|
-
|
|
|
|
-
|
|
|
|
-
|
|
Shopping
Center
|
|
|
100.0%
|
|
|
La Ribera
Shopping
(3)
|
|
Aug-11
|
|
|
|
9,850.6
|
|
Santa Fe,
Argentina
|
|
|
24
|
|
|
|
-
|
|
|
|
-
|
|
|
|
-
|
|
|
|
-
|
|
|
|
-
|
|
Shopping
Center
|
|
|
99.3%
|
|
|
Distrito Arcos
(3)
|
|
Dec-14
|
|
|
|
11,170.1
|
|
City of Buenos
Aires, Argentina
|
|
|
280
|
|
|
|
-
|
|
|
|
-
|
|
|
|
-
|
|
|
|
-
|
|
|
|
-
|
|
Shopping
Center
|
|
|
97.0%
|
|
|
Alto
Comahue
(3)
|
|
Mar-15
|
|
|
|
9,889.6
|
|
Neuquén,
Argentina
|
|
|
318
|
|
|
|
-
|
|
|
|
-
|
|
|
|
-
|
|
|
|
-
|
|
|
|
-
|
|
Shopping
Center
|
|
|
96.6%
|
|
|
Patio
Olmos
(3)
|
|
-
|
|
|
|
-
|
|
-
|
|
|
26
|
|
|
|
-
|
|
|
|
-
|
|
|
|
-
|
|
|
|
-
|
|
|
|
-
|
|
Shopping
Center
|
|
|
-
|
|
|
Caballito Plot of
Land
|
|
Nov-97
|
|
|
|
23,791
|
|
City of Buenos
Aires
|
|
|
45,812
|
|
|
|
-
|
|
|
|
-
|
|
|
|
-
|
|
|
|
-
|
|
|
|
-
|
|
Land
Reserve
|
|
|
N/A
|
|
|
Other Land Reserves
(4)
|
|
N/A
|
|
|
|
6,126,022
|
|
City and Province
of Buenos Aires.
|
|
|
5,508
|
|
|
|
-
|
|
|
|
-
|
|
|
|
-
|
|
|
|
-
|
|
|
|
-
|
|
Land
Reserve
|
|
|
N/A
|
|
|
Luján
(3)
|
|
May-12
|
|
|
|
1,160,000
|
|
Province of Buenos
Aires.
|
|
|
41,861
|
|
|
|
-
|
|
|
|
-
|
|
|
|
-
|
|
|
|
-
|
|
|
|
-
|
|
Land
Reserve
|
|
|
N/A
|
|
|
Intercontinental
|
|
Nov-97
|
|
|
|
24,000
|
|
City of Buenos
Aires
|
|
|
51
|
|
|
|
-
|
|
|
|
-
|
|
|
|
-
|
|
|
|
-
|
|
|
|
-
|
|
Hotel
|
|
|
70.58%
|
|
|
Sheraton
Libertador
|
|
Mar-98
|
|
|
|
37,600
|
|
City of Buenos
Aires
|
|
|
28
|
|
|
|
-
|
|
|
|
-
|
|
|
|
-
|
|
|
|
-
|
|
|
|
-
|
|
Hotel
|
|
|
73.42%
|
|
|
Llao
Llao
(9)
|
|
Jun-97
|
|
|
|
17,463
|
|
City of
Bariloche
|
|
|
77
|
|
|
|
-
|
|
|
|
-
|
|
|
|
-
|
|
|
|
-
|
|
|
|
-
|
|
Hotel
|
|
|
51.15%
|
|
(1) Total leasable
area for each property. Excludes common areas and parking
spaces.
(2) Cost of
acquisition or development plus improvements, less accumulated
depreciation, less allowances.
(3) Through IRSA
Commercial Properties.
(4) Includes the
following land reserves: Pontevedra plot; Mariano Acosta, San Luis
and Merlo (through IRSA) and Intercontinental Plot (through IRSA
Commercial Properties) .
(5) Includes the
following properties: Anchorena 665, Zelaya 3102, 3103 y 3105,
Rivadavia 2768, Constitución 1111, Santa Maria del Plata,
Puerto Retiro Plots 50%, Rio Parcel 50%, Libertador Parcel
50%.
(6) All assets are
owned by us or through any our subsidiary.
(7) Percentage of
occupation of each property. The land reserves are assets that the
company remains in the portfolio for future
development.
(8) Intern
information of the Company.
(9) Includes Ps.
21,900 thousand of Book Value that corresponds to “Terreno
Bariloche.”
The following table sets
forth certain information about our properties for the Operation
Center in Israel as of June 30, 2016:
|
Property
|
Date
of acquisition
|
Location
|
Net
book amount
|
Use
|
|
|
|
|
|
|
|
Tivoli
|
Oct-2015
|
United
States
|
2,047
|
Rental
properties
|
|
Kiryat Ono
Mall
|
Oct-2015
|
Israel
|
1,598
|
Rental
properties
|
|
Shopping Center
Modi’in A
|
Oct-2015
|
Israel
|
805
|
Rental
properties
|
|
HSBC
|
Oct-2015
|
United
States
|
11,225
|
Rental
properties
|
|
Matam park -
Haifa
|
Oct-2015
|
Israel
|
5,662
|
Rental
properties
|
|
Caesarea -
Maichaley Carmel
|
Oct-2015
|
Israel
|
583
|
Rental
properties
|
|
Herzeliya
North
|
Oct-2015
|
Israel
|
4,125
|
Rental
properties
|
|
Gav-Yam Center -
Herzeliya
|
Oct-2015
|
Israel
|
2,449
|
Rental
properties
|
|
Neyar Hadera
Modi’in
|
Oct-2015
|
Israel
|
680
|
Rental
properties
|
|
Gav yam park - Beer
Sheva
|
Oct-2015
|
Israel
|
700
|
Rental
properties
|
|
Hazomet Kfar
Saba
|
Oct-2015
|
Israel
|
117
|
Rental
properties
|
|
Bilu
|
Oct-2015
|
Israel
|
86
|
Rental
properties
|
|
Mazkeret
Batia
|
Oct-2015
|
Israel
|
109
|
Rental
properties
|
|
Netania
|
Oct-2015
|
Israel
|
849
|
Rental
properties
|
|
Rishon Le
Zion
|
Oct-2015
|
Israel
|
70
|
Rental
properties
|
|
Rehovot
|
Oct-2015
|
Israel
|
125
|
Rental
properties
|
|
Mizpe
Sapir
|
Oct-2015
|
Israel
|
124
|
Rental
properties
|
|
Holon
|
Oct-2015
|
Israel
|
327
|
Rental
properties
|
|
Haifa
|
Oct-2015
|
Israel
|
24
|
Rental
properties
|
|
Others
|
Oct-2015
|
Israel
|
8,759
|
Rental
properties
|
|
Tivoli
|
Oct-2015
|
United
States
|
24
|
Undeveloped parcels
of land
|
|
Queensridge
Towers
|
Oct-2015
|
Israel
|
266
|
Undeveloped parcels
of land
|
|
Zarchini
Raanana
|
Oct-2015
|
Israel
|
78
|
Undeveloped parcels
of land
|
|
Kurdani
|
Oct-2015
|
Israel
|
-
|
Undeveloped parcels
of land
|
|
Others
|
Oct-2015
|
Israel
|
1,777
|
Undeveloped parcels
of land
|
|
Tivoli
|
Oct-2015
|
United
States
|
1,981
|
Properties under
development
|
|
Ispro Planet
– Beer Sheva – Phase 1
|
Oct-2015
|
Israel
|
1,062
|
Properties under
development
|
|
Others
|
Oct-2015
|
Israel
|
880
|
Properties under
development
|
|
Shufersal´s
Stores
|
Oct-2015
|
Israel
|
10,478
|
Supermarkets
|
|
Total
|
|
|
57,010
|
|
106
Insurance
Agricultural Business
We carry insurance
policies with insurance companies that we consider to be
financially sound. We employ multi-risk insurance for our farming
facilities and industrial properties, which covers property damage,
negligence liability, fire, falls, collapse, lightning and gas
explosion, electrical and water damages, theft, and business
interruption. Such insurance policies have specifications, limits
and deductibles which we believe are customary. Nevertheless, they
do not cover damages to our crops. We carry directors and
officer’s insurance covering management’s civil
liability, as well as legally mandated insurance, including
employee personal injury. We also provide life or disability
insurance for our employees as benefits.
We believe our
insurance policies are adequate to protect us against the risks for
which we are covered. Nevertheless, some potential losses are not
covered by insurance and certain kinds of insurance coverage may
become prohibitively expensive.
The types of
insurance used by us are the following:
|
Insured
Property
|
Risk
Covered
|
Amount
Insured
(in
Millions of Ps.)
|
Book
Value
(in
Millions of Ps.)
|
|
Buildings,
machinery, silos, installation and furniture and
equipment
|
Theft, fire and
technical insurance
|
517
|
490
|
|
Vehicles
|
Theft, fire and
civil and third parties liability
|
17
|
7
|
Urban properties and investment business
IRSA carries
all-risk insurance for its shopping centers and other buildings
covering damages to the property caused by fire, explosion, gas
leak, hail, storm and winds, earthquakes, vandalism, theft and
business interruption. IRSA also has civil liability insurance
covering all potential damages to third parties or goods arising
from the development of its businesses throughout the whole
Argentine territory. IRSA is in compliance with all the legal
requirements relating to mandatory insurance, including statutory
coverage under the Occupational Risk Law, life insurance required
under collective bargaining agreements and other insurance required
by the laws and decrees. Its history of damages is limited to only
one claim made as a result a fire in Alto Avellaneda Shopping in
March 2006, in which the loss was substantially recovered from its
insurers. These insurance policies have all the specifications,
limits and deductibles that are customary in the market and which
IRSA believes are adequate for the risks to which it is exposed in
its daily operations. IRSA also has purchased civil liability
insurance to cover its directors’ and officers’
liability.
Control
Systems
IRSA Commercial
Properties has a computer systems to monitor tenants’ sales
in all of our shopping centers (except stands). IRSA Commercial
Properties also conduct regular manual audits of its tenants
accounting sales records in all of our shopping centers. Almost
every store in those shopping centers has a point of sale that is
linked to a main computer server in the administrative office of
such shopping center. Likewise, it uses the information generated
from the computer monitoring system for statistics regarding total
sales, average sales, peak sale hours, etc., for marketing purposes
and as a reference for the processes of internal audit. The lease
contracts for tenants in Alto Avellaneda, Alto Palermo, Alcorta
Shopping, Patio Bullrich, Buenos Aires Design, Abasto, Alto
Rosario, Alto NOA, Dot Baires Shopping, Córdoba Shopping,
Soleil Premium Outlet, La Ribera Shopping, Mendoza Plaza Shopping,
Distrito Arcos and Alto Comahue contain a clause requiring tenants
to be linked to the computer monitoring system, there being certain
exceptions to this requirement.
None.
A.
CONSOLIDATED OPERATING RESULTS
The following
management’s discussion and analysis of our financial
condition and results of operations should be read together with
“Selected Consolidated Financial Data” and our Audited
Consolidated Financial Statements and related notes appearing
elsewhere in this annual report. This discussion and analysis of
our financial condition and results of operations contains
forward-looking statements that involve risks, uncertainties and
assumptions. These forward-looking statements include such words
as, “expects”, “anticipates”,
“intends”, “believes” and similar language.
Our actual results may differ materially and adversely from those
anticipated in these forward-looking statements as a result of many
factors, including without limitation those set forth elsewhere in
this annual report. See
Item 3
“Key Information – D. Risk Factors”
for a
more complete discussion of the economic and industry-wide factors
relevant to us.
For purposes of the
following discussion and analysis, unless otherwise specified,
references to fiscal years 2016, 2015 and 2014 relate to the fiscal
years ended June 30, 2016, 2015, and 2014
respectively.
Revenue
Recognition
Our revenue is
measured at the fair value of the consideration received or
receivable.
Revenue derived
from the sale of goods is recognized when: (a) material risks and
benefits derived from title to property have been transferred; (b)
the company does not retain any management function on the assets
sold nor does it have any control whatsoever on such assets; (c)
the amount of revenues and costs associated to the transaction may
be measured on a reliable basis; and (d) the company is expected to
accrue the economic benefits associated to the
transaction.
Revenue derived
from the provision of services is recognized when (a) the amount of
revenue and costs associated to the services may be measured on a
reliable basis; (b) the company is expected to accrue the economic
benefits associated to the transaction, and (c) the level of
completion of services may be measured on a reliable
basis.
107
Agricultural
and agricultural-related activities:
Revenue from our
agricultural activities comes primarily from sales of agricultural
produce and biological assets, from provision of services related
to the activity and from leases from farmlands.
We recognize
revenue on product sales when the agricultural produce or
biological assets are delivered and the customers take ownership
and assume risk of loss, which is when the products are received by
the customer at its or a designated location or collected directly
by the customer from the cultivation bases, collection of the
relevant receivable is probable and the selling price is fixed or
determinable. Net sales of products represent the invoiced value of
goods, net of trade discounts and allowances, if any.
We also provide
agricultural-related (including but not limited to watering and
feedlot services) and brokerage services to third parties. Revenue
from services is recognized as services are rendered.
We also lease land
to third parties under operating lease agreements. Lease income is
recognized on a straight-line basis over the period of the
lease.
Investment
property activities:
·
Rental
and services - Shopping centers portfolio
Revenues derived
from business activities developed in our shopping centers mainly
include rental income under operating leases, admission rights,
commissions and revenue from several services provided to our
lessees.
Rental income from
shopping center leased out under operating leases, admission rights
and fees related to their real estate agent business are recognized
in the income statements on a straight-line basis over the term of
the leases. When lease incentives are granted, they are recognized
as an integral part of the net consideration for the use of the
property and are therefore recognized on the same straight-line
basis.
Contingent rents,
being lease payments that are not fixed at the inception of a
lease, are recorded as income in the years in which they are
earned. Rent reviews are recognized when such reviews have been
agreed with tenants.
Lease contracts
also provide that common area maintenance charges and collective
promotion funds of our shopping centers are borne by the
corresponding lessees, generally on a proportionally basis. These
common area maintenance charges include all such expenses
convenient and necessary for various purposes including, but not
limited to, the operation, maintenance, management, safety,
preservation, repair, supervision, insurance and enhancement of the
shopping centers. The lessor is responsible for determining the
need and suitability of incurring a common area expense. We makes
the original payment for such expenses, which are then reimbursed
by the lessees. We have assessed the substance of the transactions
and conclude that we are acting as a principal since it has
exposure to the significant risks and rewards associated with the
rendering of services. Service charge income is presented within
rental income and services, separately from property operating
expenses. Property operating expenses are expensed as
incurred.
·
Rental
and services - Offices and other rental properties
Rental income from
offices and other rental properties include rental income from
office leased out under operating leases, income for services and
expenses recovery paid from tenants.
Rental income from
offices and other rental properties leased out under operating
leases is recognized in the income statements on a straight-line
basis over the term of the leases. When lease incentives are
granted, they are recognized as an integral part of the net
consideration for the use of the property and are therefore
recognized on the same straight-line basis.
Lease contracts
also provide that common area maintenance expenses of our offices
and other rental properties are borne by the corresponding lessees,
generally on a proportionally basis. These common area maintenance
expenses include all such expenses convenient and necessary for
various purposes including, but not limited to, the operation,
maintenance, management, safety, preservation, repair, supervision,
insurance and enhancement of the offices and other rental
properties. We make the original payment for such expenses, which
are then reimbursed by the lessees. We considered that we act as a
principal in these cases. Th accrues reimbursements from tenants
for recoverable portions of all these expenses as service charge
revenue in the period the applicable expenditures are incurred and
is presented separately from property operating expenses. Property
operating expenses are recognized as incurred.
·
Revenues
from supermarkets
Revenue from the
sale of goods in the ordinary course of business are recognized at
the fair value of the consideration collected or receivable, net of
returns and discounts. Where the credit term is short and financing
is that typical in the industry, consideration is not discounted.
Where the credit term is longer than the industry’s average,
in accounting for the consideration, theCompany discounts it to its
net present value by using the client’s risk premium or the
market rate. The difference between the fair value and the nominal
amount is accounted for under financial income. If discounts are
granted and their amount can be measured reliably, the discount is
recognized as a reduction of revenue.
Generally, the
Company recognizes revenue upon delivery of goods to the client. In
international sales, revenue is recognized upon loading goods with
the forwarder. Where two or more products are sold under one single
contract, the Company separates each component and gives them a
separate accounting treatment. The attribution of value to each
component is based on the relative fair value of each unit. Should
the fair value not be measurable on a reliable basis, then revenue
is attributed based on the difference arising between the total
amount of the executed contract and the fair value of the goods
delivered.
As regards client
loyalty programs, the fair value of the consideration received or
receivable in relation to the initial sale is allocated across the
rewards credits and the other components of the sale. The amount
allocated to rewards credits is estimated based on the market value
of the goods to be delivered. The fair value of the right to
purchase products at a discount is calculated considering the
expected exchange ratio and the expected terms. Such amount is
deferred and revenue is recognized only where rewards credits are
exchanged and the Company has complied with its obligation to
provide the products at a discount, or else when such reward
credits have expired. The amount of revenue recognized under such
circumstances is based on the number of reward credits that have
been exchanged for products with discounts, in relation to the
total number of reward credits expected to be exchanged. Deferred
revenue is then reversed when reward credits are no longer likely
to be exchanged.
In addition, when
the Company acts as agent and not as main supplier in a
transaction, revenue is recognized at the net amount of
commissions. Revenue from commissions is recognized based on
transactions conducted by credit card companies at the rate and on
the date they are credited. Revenue from credit margins of credit
cards is recognized on the date the client is bound to pay and
revenue for subscription fees is recognized on a monthly
basis.
108
·
Revenue
from communication services and sale of communication
equipment
Revenue derived
from the use of communication networks by the Company, including
mobile phones, Internet services, international calls, fixed line
calls, interconnection rates and roaming service rates, are
recognized when the service is provided, proportionally to the
extent the transaction has been realized, and provided all other
criteria have been met for revenue recognition.
Revenue from the
sale of mobile phone cards are initially recognized as deferred
revenue and then recognized as revenue as they are used or upon
expiration, whichever takes place earlier.
A transaction
involving the sale of equipment to a final user normally also
involves a service sale transaction. In general, this type of sale
is performed without a contractual obligation by the client to
consume telephone services for a minimum amount over a
predetermined period. As a result, the Company records the sale of
equipment separately and recognizes revenue pursuant to the
transaction value upon delivery of the equipment to the client.
Revenue from telephone services are recognized and accounted for as
they are provided. When the client is bound to make a minimum
consumption of services during a predefined period, the contract
formalizes a transaction of several elements and, therefore,
revenue from the sale of equipment is recorded at an amount that
should not exceed its fair value, and is recognized upon delivery
of the equipment to the client and provided the criteria for
recognition are met. The Company ascertains the fair value of
individual elements, based on the price at which it is normally
sold, after taking into account the relevant
discounts.
Revenue derived
from long-term contracts is recognized at the present value of
future cash flows, discounted at market rates prevailing on the
transaction date. Any difference between the original credit and
its net present value is accounted for as interest income over the
credit term.
·
Revenue from tourism services
Revenue from the
provision of tourist services is recognized when the following
conditions are met:
-
the revenue amount
may be reliably measured;
-
the economic
benefits associated to the transaction are expected to have an
impact on the Company;
-
the degree of
completion of the transaction may be measured on a reliable basis;
and
-
expenses incurred
in relation to the transaction as well as all necessary costs to
finalize the transaction may be reliably
measured.
Effects
of the Global Macroeconomic Environment
Most of our assets
are located in Argentina, where we conduct our operations, and in
Israel. Therefore, our financial condition and the results of our
operations are significantly dependent upon the economic conditions
prevailing in both countries.
The table below
shows Argentina’s GDP growth, inflation, Dollar exchange
rates and the appreciation (depreciation) of the Peso against the
U.S. Dollar for the indicated periods.
|
|
|
Fiscal
year ended June 30,
|
||||
|
|
|
2016
|
|
2015
|
|
2014
|
|
GDP
growth
|
|
(3.4%)
|
|
1.2%
|
|
0.0%
|
|
Inflation
(IPIM)
(1)
|
|
26.7%
|
|
13.6%
|
|
27.7%
|
|
Inflation
(CPI)
(2)
|
|
47.1%
|
|
14.0%
|
|
15.0%
(2)
|
|
Appreciation
(depreciation) of the Peso against the U.S. Dollar
(3)
|
|
(65.9%)
|
|
(11.8%)
|
|
(50.6%)
|
|
Average exchange
rate per US$1.00
(4)
|
|
Ps.14.9900
|
|
Ps.9.034
|
|
Ps.8.083
|
|
Appreciation
(depreciation) of the NIS against the U.S. Dollar
|
|
(1.1%)
|
|
(10.0%)
|
|
5.6%
|
(1)
IPIM is the
wholesale price index as measured by the Argentine Ministry of
Economy and Production. Given the modifications to the system that
INDEC uses to measure IPIM, there is no data for any price
variations from July 1, 2015 to June 30, 2016. For that reason, we
show accumulated prices from January 1, 2016 to June 30, 2016,
published by INDEC.
(2)
CPI is the consumer
price index as measured by the Argentine Ministry of Economy and
Production. Since January 2014, the Argentine government
established IPCNu, which more broadly reflects consumer prices by
considering price information from the 23 Argentine provinces and
the City of Buenos Aires. Therefore, the consumer price index for
our fiscal 2014 only takes into account the six-month period after
the new consumer price index was introduced. Given the
modifications to the system that INDEC uses to measure CPI, there
is no data for any price variations for the fiscal year ended at
June 30, 2016, yet. For that reason, we show the interanual
inflation published by “Dirección General de
Estadísticas y Censos de la Ciudad de Buenos Aires, Ministerio
de Hacienda”. It differs from inflation reported for 2015 and
2014 because of the change of government and changes in the systems
of measure of the INDEC. See Item 3.(a) Risk Factors —Risks
Relating to Argentina - There are concerns about the accuracy of
Argentina’s official inflation
statistics.
(3)
Depreciation
corresponding to fiscal year 2016 is mostly due to the devaluation
that took place on December 17, 2015. See Risk factor
“Exchange controls and restrictions on transfers abroad and
capital inflow restrictions have been limited in the past, and may
limit the availability of international
credit.”
(4)
Represents average
of the selling and buying exchange rate.
Sources: INDEC,
Argentine Ministry of Economy and Production, City of Buenos Aires
Ministry of Treasury, Banco de la Nación Argentina,
Bloomberg.
According to the
IMF estimates, Argentina’s GDP for 2016 is expected to
contract by 1.8% compared to 2015 due to a slight adjustment
recession during the year, primarily due to the correction of
macroeconomic and microeconomic distortions. However, growth is
expected to strengthen to 2.7% in 2017 on the back of moderating
inflation and more supportive monetary and fiscal policy policies
by the Central Bank. According to the Organisation for Economic
Co-operation and Development (“OECD”) Israel’s
economic growth is projected to remain at 2.5% in 2016, before
rising to 3% in 2017.
Argentine GDP
decreased 3.4% during our fiscal 2016, compared to GDP growth of
1.2% in our fiscal 2015. Consumption was the primary driver of
economic activity, as shopping center sales grew 41.4% as of June
30, 2016, compared to June 30, 2016, driven by the increase in
nominal salaries. As of June 30, 2016, the unemployment rate was at
9.3% of the country’s economically active population,
compared to 6.6% as of June 30, 2015. For the year ended at
December 31, 2015, Israel’s growth reached 2.5% and remained
at the same level for 2016.
Argentina’s
country risk, measured by the Emerging Market Bond Index, decreased
97 basis points for the 12 months ended June 30, 2016, maintaining
a high spread vis-à-vis other countries in the region. The
debt premium paid by Argentina was at 518 points in June 2016,
compared to 352 paid by Brazil, and 213 paid by
Mexico.
109
In regard to the
Argentine economy, changes in short and long-term interest rates,
unemployment and inflation may reduce the availability of consumer
credit and the purchasing power of individuals who frequent
shopping centers. These factors, combined with low GDP growth, may
reduce general consumption rates in our shopping centers. Since
leases agreements in our shopping centers for most of our revenue,
require tenants to pay a percentage of their total sales as rent, a
general reduction in consumption may reduce our revenue. A
reduction in the number of shoppers in our shopping centers and
consequently, in the demand for parking, may also reduce our
revenues from services rendered.
Regarding
Israel’s economy, and based on information published by OECD,
domestic demand is expected to remain the main driver of growth,
while external demand is projected to recover slowly due to the
high exchange rates that hold back exports. In this context,
unemployment is expected to remain low, and inflation is projected
to increase at very low levels.
Effects
of inflation
The following are
annual inflation rates during our fiscal years indicated, based on
information published by the INDEC, which is dependent on the
Argentine Ministry of Economy and Production:
|
Fiscal
Year ended June 30
|
Consumer
Price
Index
(1)
|
Wholesale
Price
Index
|
|
2011
|
9.7%
|
12.5%
|
|
2012
|
9.9%
|
12.8%
|
|
2013
|
10.5%
|
13.5%
|
|
2014 (from January 2014)
|
15.0%
|
27.7%
|
|
2015
|
15.0%
|
13.4%
|
|
2016
|
47.1%
|
26.7%
(2)
|
(1)
In January 2014 the
Argentine government established IPCNu, which more broadly reflects
consumer prices by considering price information from the 23
provinces of Argentina and the City of Buenos Aires. Therefore, the
consumer price index for the fiscal year ended June 30, 2014 only
takes into account the six month period starting on January 1,
2014.
(2)
Given the
modifications to the system that INDEC uses to measure IPIM, there
is no data for any price variations from July 1, 2015 to June 30,
2016. For that reason, we show accumulated prices from January 1,
2016 to June 30, 2016, published by INDEC.
Continuing
inflation will likely have an adverse effect on our operations.
Additionally, minimum lease payments from tenants in our shopping
centers are generally adjusted in accordance with the CER, an
inflation index published by the Central Bank. Although higher
inflation may increase lease payments, given that tenants tend to
pass on increased expenses to consumers, this trend could lead to
higher prices charged on goods sold which could result in lower
sales volumes and therefore reduce the component of rent we receive
based on sales revenue.
Since the INDEC
modified the methodology it uses to calculate the consumer price
index in January 2007, there have been concerns about the accuracy
of Argentina’s official inflation statistics, which led to
the creation of the IPCNu in February 2014 in order to address the
quality of official data.
Regarding rates of
inflation in Israel, the Consumer Price Index, according to OECD
was 0.5% increase in the prices for 2014, and deflation of 0.6% in
2015. Likewise, inflation projected for 2016 and 2017 is (0.2)% and
0.8%, respectively.
Seasonality
Our shopping
centers business is directly affected by seasonality, as if results
in fluctuations in the level of our tenants’
sales. During Argentine summer holidays (January and February) our
tenants’ sales are generally at their lowest level, whereas
during winter holidays (July) and in December (Christmas) they
reach their highest level. Clothing retailers generally change
their collections in spring and autumn, positively affecting our
shopping center sales. Sales at discount prices at the end of each
season are also one of the main sources revenue.
Also, in the
Israeli retail segment business results are subject to seasonal
fluctuations as a result of the consumption behavior of the
population proximate to the Pesach holidays (March and/or April)
and Rosh Hashanah and Sukkoth holidays (September and/or October).
This also affects the balance sheet values of inventory, customers
and suppliers. Our revenues from cellular services are usually
affected by seasonality, with the third calendar quarter of each
year characterized by higher roaming revenues due to increased
incoming and outgoing tourism.
In 2016, the
Passover holiday fell at the end of April, compared to 2015 when it
was at the beginning of April. The timing of the holiday affects
Shufersal’s sales and special offers in the second quarter of
2016, compared to last year. The Passover holiday in the second
quarter of 2016 had a greater effect on Shufersal’s results
than in the corresponding quarter in 2015, therefore analysis of
the results for the first half of the year compared to the
corresponding period in 2015 better represents the changes between
the periods.
Effects
of interest rate fluctuations
Most of our U.S.
Dollar denominated debt accrues interest at a fixed rate. An
increase in interest rates will not necessary result in a
significant increase in our financial costs and may not materially
affect our financial condition or our results of
operations.
Effects
of foreign currency fluctuations
A significant
portion of our financial debt is denominated in U.S. dollars.
Therefore, a depreciation or devaluation of the Argentine Peso
against the U.S. dollar would increase our indebtedness measured in
Pesos and materially affect our results of operations. Foreign
currency exchange rate fluctuations significantly increase the risk
of default on our mortgages and lease receivables. Foreign currency
exchange restrictions that may be imposed by the Argentine
Government could prevent or restrict our access to U.S. dollars,
affecting our ability to service our U.S. dollar denominated
liabilities.
During fiscal year
2016 and 2015, the Peso depreciated against the U.S. dollar and
other curren cies by approximately 66% and 12%, respectively, which
caused an impact on the comparability of our results of operations
for the year ended June 30, 2016 to our results of operations for
the year ended June 30, 2015, primarily in our revenues from office
rentals and our net assets and liabilities denominated in foreign
currency. The devaluation affected assets and liabilities
denominated in foreign currency, and this effect is shown in the
line “financial results, net” of our income
statement.
As a result of the
devaluation of the Peso and the discontinuation of the official
exchange rate by the newly elected Argentine government that took
office in December 2015, the exchange rate was Ps.13.0400 per
US$1.00 on December 31, 2015 and Ps.15.5100 per US$1.00 on
September 30, 2016.
110
During fiscal year
2016 and 2015, Israeli New Shekel depreciated against the U.S.
dollar and other currencies by approximately 2.2% and 10%,
respectively, which caused an impact on the comparability of our
results of IDBD´s operations for the year ended June 30, 2016
to IDBD´s results of operations for the year ended June 30,
2015. As of June 30 2016, the offer exchange rate for June 30, 2016
was NIS 3.8575=U.S.$1.00, and NIS 3.7464 per US$1.00 on September
30, 2016. According to the information published in the Monetary
Policy Report in July 2016 by the Bank of Israel, various models of
the equilibrium exchange rate indicate that the Shekel could be
overvalued. For more information about the exchange rates, see
“Local Exchange Market and Exchange
Rates.”
Critical
Accounting Policies and Estimates.
Our Audited
Consolidated Financial Statements are prepared in accordance with
IFRSs as issued by the IASB, and the accounting policies employed
are set out in our Accounting Policies section in the financial
statements. In applying these policies, we make estimates and
assumptions that affect the reported amounts of assets and
liabilities and disclosure of contingent assets and liabilities.
The actual outcome could differ from those estimates. Some of these
policies require a high level of judgment because the areas are
especially subjective or complex.
The discussion
below should also be read in conjunction with our disclosure of
significant IFRS accounting policies, which is provided in Note 2
to our Audited Consolidated Financial Statements, “Summary of
significant accounting policies”.
Not all of these
significant accounting policies require management to make
subjective or complex judgments or estimates. The following is
intended to provide an understanding of the policies that
management considers critical because of the level of complexity,
judgment or estimations involved in their application and their
impact on the consolidated financial statements. These judgments
involve assumptions or estimates in respect of future events.
Actual results may differ from these estimates.
|
Estimation
|
Main
assumptions
|
Potential
implications
|
|
Business
combination - Allocation of acquisition prices
|
Assumptions
regarding timing, amount of future revenues and expenses, revenue
growth, expected rate of return, economic conditions, discount
rate, among others.
|
Should any of the
assumptions made be inaccurate the recognized combination may not
be correct.
|
|
Recoverable amounts
of cash-generating units (even those including goodwill),
associates and assets.
|
The discount rate
and the expected growth rate before taxes – in connection
with cash-generating units.
The discount rate
and the expected growth rate after taxes – in connection with
associates.
Cash flows are
determined based on past experiences with the asset or with similar
assets and in accordance with the Company’s best factual
assumption relative to the economic conditions expected to
prevail.
Business continuity
and share market public in connection with cash-generating unit
value of the companies.
Appraisals made by
external appraisers and valuators with relation to the
assets’ fair value, net of realization costs (including real
estate assets).
|
Should any of the
assumptions made be inaccurate, this could lead to differences in
the recoverable values of cash-generating units.
|
|
Control, joint
control or significant influence
|
Judgment relative
to the determination that the Company holds an interest in the
shares of investees (considering the existence and influence of
significant potential voting rights), its right to designate
members in the executive management of such companies (usually the
Board of directors) based on the investees’ bylaws; the
composition and the rights of other shareholders of such investees
and their capacity to establish operating and financial policies
for investees or to take part in the establishment
thereof.
|
Accounting
treatment of investments as subsidiaries (consolidation) or
associates (equity method).
|
|
Estimated useful
life of intangible assets, investment properties and property,
plant and equipment
|
Estimated useful
life of assets based on their conditions.
|
Recognition of
accelerated or decelerated depreciation by comparison against final
actual earnings (losses).
|
|
Fair value
valuation of investment properties
|
Fair value
valuation made by external appraisers and valuators.
|
Incorrect exposure
of investment property values.
|
|
Income tax
expense
|
The Company
estimates the income tax amount payable for transactions where the
Treasury’s Claim cannot be clearly determined.
Additionally, the
Company evaluates the recoverability of assets due to deferred
taxes considering whether some or all of the assets will not be
recoverable.
|
Upon the improper
determination of the provision for income tax, the Company will be
bound to pay additional taxes, including fines and compensatory and
punitive interest.
|
|
Allowance for
doubtful accounts
|
A periodic review
is conducted of receivables risks in the Company’s
clients’ portfolios. Bad debts based on the expiration of
account receivables and account receivables’ specific
conditions.
|
Improper
recognition of charges / reimbursements of the allowance for bad
debt.
|
|
Hybrid financial
instrument related to the non-recourse loan from Koor
(Adama)
|
·
The value of
Adama’s shares.
·
Unobserved data
underlying the binomial model applied to the determination of the
embedded derivative instruments’ value.
|
Changes in losses
or profits resulting from the variation in the fair value of the
embedded derivative, and variations in the book amount of the
primary contract recognized as revenues or expenses from
financing.
|
|
Level 2 and 3
financial instruments
|
Main assumptions
used by the Company are:
·
Projected
discounted income as per discount rate
·
Values determined
in accordance with the company’s shares in equity funds on
the basis of its financial statements, based on fair value or
investment assessments.
·
Comparable market
multiple (EV/GMV ratio).
·
Underlying asset
price (market price) and share price volatility (historical) and
market interest rate (Libor curve).
|
Wrong recognition
of a charge to income.
|
|
Probability
estimate of contingent liabilities
|
Whether more
economic resources may be spent in relation to litigation against
the Company; such estimate is based on legal advisors’
opinions.
|
Charge / reversal
of provision in relation to a claim.
|
|
Biological
assets
|
Main assumptions
used in valuation are: yields, operating costs, selling expenses,
future of sales prices, discount rate.
|
Wrong
recognition/valuation of biological assets. See sensitivities
modeled on these parameters in Note 14.
|
111
IFRS 8 requires an
entity to report financial and descriptive information about its
reportable segments, which are operating segments or aggregations
of operating segments that meet specified criteria. Operating
segments are component of an entity about which separate financial
information is available that is evaluated regularly by the CODM.
According to IFRS 8, the CODM represents a function whereby
strategic decisions are made and resources are assigned. The CODM
function is carried out by the President of the Company, Mr.
Eduardo S. Elsztain. In addition, and due to the acquisition of
IDBD, two responsibility levels have been established for resource
allocation and assessment of results of the two operations centers,
through executive committees in Argentina and Israel.
As a result of the
control of IDBD, the Company reports its financial and equity
performance based on the new segment structure. Comparative
information has been modified to reflect the new organization
insofar as possible.
Segment information
is reported from the perspective of products and services: (i)
agricultural business and (ii) urban properties and investment
business. In addition, this last segment is reported divided from
the geographic point of view in two Operations Centers to manage
its global interests: Argentina and Israel. Within each operations
center, the Company considers separately the various activities
being developed, which represent reporting operating segments given
the nature of its products, services, operations and risks.
Management believes the operating segment clustering in each
operations center reflects similar economic characteristics in each
region, as well as similar products and services offered, types of
clients and regulatory environments.
Agricultural
business:
In the third
quarter, we have changed the presentation of the agricultural
business segments which are reviewed by the CODM for a better
alignment with the current business vision and the metrics used to
such end. Four operating segments (crops, cattle, dairy and
sugarcane) have been aggregated into a single operating segment
named “Agricultural production”. Management consider
for the aggregation the nature of the production processes (growing
of biological assets), the methods used to distribute their
products and the nature of the regulatory environment (agricultural
business). Therefore this quarter three segments are
considered:
The
"Agricultural production"
segment
consists of planting, harvesting and sale of crops as wheat, corn,
soybeans, cotton and sunflowers; breeding, purchasing and/or
fattening of free-range cattle for sale to slaughterhouses and
local livestock auction markets; breeding and/or purchasing dairy
cows for the production of raw milk for sale to local milk and
milk-related products producers; and planting, harvesting and sale
of sugarcane.
The
“Land transformation and
sales”
segment comprises gains from the disposal and
development of farmlands activities
The
"Other segments"
column includes,
principally, agricultural services (for example, irrigation);
leasing of our farms to third parties; feedlot farming,
slaughtering and processing in the meat refrigeration plant; and
brokerage activities, among others.
The amounts
corresponding to the fiscal year ended June 30, 2015 and 2014, have
been retroactively adjusted to reflect changes in segment
information.
Urban
properties and investments:
Operations Center in
Argentina
Within this center,
IRSA operates in the following segments:
The
“Shopping centers”
segment
includes assets and results of the activity of shopping centers
portfolio, principally comprised of lease and service revenues
related to rental of commercial space and other spaces in the
shopping centers of the Company.
The
“Office and others”
segment
includes the assets and the operating results of the activity of
lease of office space and other rental properties and service
revenues related to this activity.
The
“Sales and developments”
segment includes assets and the operating results of the sales of
undeveloped parcels of land and/or trading properties, as the
results related with its development and maintenance. Also included
in this segment are the results of the sales of real property
intended for rent, sales of hotels and other properties included in
the International segment.
The
“Hotels”
segment includes
the operating results of the hotels principally comprised of room,
catering and restaurant revenues.
The
“International”
segment
primarily includes assets and operating profit or loss from
business related to associates Condor and Lipstick. Through these
associates, the Company derives revenue from hotels and an office
building in United States, respectively. Until September 30, 2014,
this segment included revenue from a subsidiary that owned the
building located at 183 Madison Ave in New York, United States,
which was sold on September 29, 2014. Additionally, until October
11, 2015, this international segment only included results from the
investment in IDBD carried at fair value.
The
“Financial operations and
others”
segment primarily includes the financial
activities carried out by BHSA and Tarshop and other residual
financial operations.
The CODM
periodically reviews the results and certain asset categories and
assesses performance of the operating segments corresponding to the
agricultural business and urban properties and investment business
of the operations center Argentina based on a measure of profit or
loss of the segment composed by the operating income plus the
equity in earnings of joint ventures and associates. The valuation
criteria used in preparing this information are consistent with
IFRS standards used for the preparation of the Audited Consolidated
Financial Statements, except for the following:
112
Operating results
of joint ventures: Cresca, Cyrsa, NPSF, Puerto Retiro, Baicom and
Quality are evaluated by the CODM applying proportional
consolidation method. Under this method the income/loss generated
and assets, are reported in the income statement line-by-line based
on the percentage held in joint ventures rather than in a single
item as required by IFRS. Management believes that the proportional
consolidation method provides more useful information to understand
the business return. Moreover, operating results of EHSA joint
venture is accounted for under the equity method. Management
believes that, in this case, this method provides more adequate
information for this type of investment, given its low materiality
and considering it is a company without direct trade operations,
where the main asset consists of an indirect interest of 25% of
LRSA.
Operating results
from the shopping centers and offices do not include the amounts
attributable to building arrangement expenses and collective
promotion funds ("FPC", as per its Spanish acronym) as well as
total recovered costs, whether by way of building administration
expenses or other concepts included under financial results (for
example default interest and other concepts). The CODM examines the
net amount from both concepts (total surplus or deficit between
building administration expenses and FPC and recoverable
expenses).
The asset
categories examined by the CODM are: investment properties,
property, plant and equipment, trading properties, inventories,
right to receive future units under barter agreements, investment
in associates and goodwill. The sum of these assets, classified by
business segment, is reported under “assets by
segment”. Assets are allocated to each segment based on the
operations and/or their physical location.
Within the
operations center in Argentina, most revenue from its operating
segments is derived from, and their assets are located in,
Argentina, except for earnings of associates included in the
“International” segment located in United
States.
Revenues for each
reporting segments derive from a large and diverse client base and,
therefore, there is no revenue concentration in any particular
segment.
Operations Center in
Israel
Within this center,
IRSA operates in the following segments:
·
The
“Real Estate”
segment
includes assets and operating income derived from business related
to the subsidiary PBC. Through PBC, we operate rental properties
and residential properties in Israel, United States and other parts
of the world and carries out commercial projects in Las
Vegas.
·
The
“Supermarkets”
segment
includes assets and operating income derived from the business of
Shufersal which operates a supermarket chain in
Israel.
·
The
“Agrochemicals”
segment
includes income derived from the activities of Adama which is
accounted for as an associate using the equity method of accounting
Adama is specialized in agrochemicals, particularly for the
production of crops for consumption.
·
The
“Telecommunications”
segment
includes assets and operating income from the business of Cellcom
which is telecommunication service provider that offers mobile
phone services, fixed line phone services, data and Internet, among
others.
·
The
“Insurance”
segment includes
the operations of Clal which is one of the most important insurance
groups in Israel, and is mainly engaged in pension and social
security insurance, among others. As indicated in Note 16 to our
Audited Consolidated Financial Statements, 51% of the controlling
shares of Clal are held in trust as specified in a judicial order
of the Israel Securities Commission in order to comply with the
requirement that the controlling shares of Clal be offered for sale
to a third party; as a result, the Company is not fully
consolidated on a line-by-line basis but rather in a single line as
a financial instrument at fair value, as required by
IFRS.
·
The
“Others”
segment includes
the assets and income derived from other diverse business
activities, such as technological developments, tourism, oil and
gas assets, electronics, and others.
The CODM
periodically reviews the results and certain asset categories and
assesses performance of this operating segment based on a measure
of profit or loss of the segment composed by the operating income
plus the equity in earnings of joint ventures and associates. The
valuation criteria used in preparing this information are
consistent with IFRS standards used for the preparation of the
Audited Consolidated Financial Statements.
As indicated under
Note 2 of our Audited Consolidated Financial Statements, the
Company decided to consolidate income derived from its operations
center in Israel with a three month lag, as adjusted for the
effects of significant transactions; hence, operating results of
IDBD for the period extending from October 11, 2015 (the date of
acquisition of control) through March 31, 2016 are included in the
Company’s comprehensive income for the fiscal year ended June
30, 2016.
Furthermore,
comparative information has not been modified for as of that date
the Company did not exercise control over IDBD. The assessment of
this investment was part of the international segment of the urban
properties and investment business in the operations center in
Argentina.
Goods and services
exchanged between segments are calculated on the basis of market
prices. Intercompany transactions between segments, if any, are
eliminated.
Business segments
involving the urban properties and investments business from the
operations center in Argentina where the CODM evaluated assets
under the proportional consolidation method, each reported asset
includes the proportional share of the Company in the same class of
assets of the associates and/or joint ventures. Only as an example,
the investment properties amount reported to the CODM includes (i)
the balance investment properties as per the statement of financial
position plus (ii) the Company’s share of the investment
properties of these joint ventures.
Within the
agricultural business, most revenue from its operating segments are
generated from and their assets are located in Argentina and
Brazil, mainly.
Within the
operations center in Israel, most revenue from its operating
segments are derived from, and their assets are located in, Israel,
except for part of earnings from the Real Estate segment, which are
generated from activities outside Israel, mainly in United
States.
Within the
agricultural business and the urban properties and investments
business from the operations center in Argentina, the assets
categories reviewed by the CODM are: investment properties,
property, plant and equipment, trading properties, inventories,
biological assets, right to receive future units under barter
agreements, investment in joint ventures and associates and
goodwill. The aggregate of these assets, classified by business
segment, are disclosed as “segment assets”. Assets are
allocated to each segment based on the operations and/or their
physical location.
113
Below is a
summarized analysis of the lines of business of the Company for the
year ended June 30, 2016:
|
|
Agricultural
business
|
|
Urban
properties and investments business
|
|
Total
|
||||
|
|
|
|
Operations
Center in Argentina
|
|
Operations
Center in
Israel
|
|
Subtotal
|
|
|
|
|
|
|
|
|
(in
million of Ps.)
|
|
|
|
|
|
Revenues
|
2,912
|
|
3,284
|
|
28,229
|
|
31,513
|
|
34,425
|
|
Costs
|
(3,821)
|
|
(839)
|
|
(20,481)
|
|
(21,320)
|
|
(25,141)
|
|
Initial recognition
and changes in the fair value of biological assets and agricultural
produce at the point of harvest
|
1,717
|
|
-
|
|
-
|
|
-
|
|
1,717
|
|
Changes in the net
realizable value of agricultural produce after harvest
|
208
|
|
-
|
|
-
|
|
-
|
|
208
|
|
Gross
profit
|
1,016
|
|
2,445
|
|
7,748
|
|
10,193
|
|
11,209
|
|
Gain from disposal
of investment properties
|
-
|
|
1,056
|
|
45
|
|
1,101
|
|
1,101
|
|
Loss from disposal
of
farmlands
|
(2)
|
|
-
|
|
-
|
|
-
|
|
(2)
|
|
General and
administrative
expenses
|
(314)
|
|
(554)
|
|
(1,387)
|
|
(1,941)
|
|
(2,255)
|
|
Selling
expenses
|
(338)
|
|
(264)
|
|
(5,686)
|
|
(5,950)
|
|
(6,288)
|
|
Other operating
results,
net
|
(70)
|
|
32
|
|
-
|
|
32
|
|
(38)
|
|
Profit
from operations
|
292
|
|
2,715
|
|
720
|
|
3,435
|
|
3,727
|
|
Share of profit /
(loss) of joint ventures and associates
|
23
|
|
96
|
|
338
|
|
434
|
|
457
|
|
Segment
profit
|
315
|
|
2,811
|
|
1,058
|
|
3,869
|
|
4,184
|
|
|
|
|
|
|
|
|
|
|
|
|
Investment
properties
|
11
|
|
3,340
|
|
-
|
|
3,340
|
|
3,351
|
|
Property, plant and
equipment
|
2,736
|
|
244
|
|
-
|
|
244
|
|
2,980
|
|
Trading
properties
|
-
|
|
253
|
|
-
|
|
253
|
|
253
|
|
Goodwill
|
10
|
|
25
|
|
-
|
|
25
|
|
35
|
|
Rights to receive
future units under barter agreements
|
-
|
|
90
|
|
-
|
|
90
|
|
90
|
|
Biological
assets
|
1,144
|
|
-
|
|
-
|
|
-
|
|
1,144
|
|
Inventories
|
660
|
|
28
|
|
-
|
|
28
|
|
688
|
|
Interests in joint
ventures and associates
|
54
|
|
964
|
|
-
|
|
964
|
|
1,018
|
|
Operating assets
from Operations Center in Israel
|
-
|
|
-
|
|
146,989
|
|
146,989
|
|
146,989
|
|
Total
segment assets
|
4,615
|
|
4,944
|
|
146,989
|
|
151,933
|
|
156,548
|
|
|
|
|
|
|
|
|
|
|
|
|
Operating
liabilities from Operations Center in Israel
|
-
|
|
-
|
|
132,865
|
|
132,865
|
|
132,865
|
114
Below is a
summarized analysis of the lines of business of the Company for the
year ended June 30, 2015:
|
|
Agricultural
business
|
|
Urban
properties and investments business
|
|
Total
|
|
|
|
|
Operations
Center in Argentina
|
|
|
|
|
|
|
(in
million of Ps.)
|
|
|
|
Revenues
|
2,395
|
|
2,547
|
|
4,942
|
|
Costs
|
(3,419)
|
|
(633)
|
|
(4,052)
|
|
Initial recognition
and changes in the fair value of biological assets and agricultural
produce at the point of harvest
|
1,347
|
|
-
|
|
1,347
|
|
Changes in the net
realizable value of agricultural produce after harvest
|
(34)
|
|
-
|
|
(34)
|
|
Gross
profit
|
289
|
|
1,914
|
|
2,203
|
|
Gain from disposal
of investment
properties
|
-
|
|
1,150
|
|
1,150
|
|
Gain from disposal
of
farmlands
|
570
|
|
-
|
|
570
|
|
General and
administrative
expenses
|
(247)
|
|
(378)
|
|
(625)
|
|
Selling
expenses
|
(286)
|
|
(195)
|
|
(481)
|
|
Other operating
results,
net
|
(19)
|
|
29
|
|
10
|
|
Profit
from operations
|
307
|
|
2,520
|
|
2,827
|
|
Share of profit /
(loss) of joint ventures and
associates
|
1
|
|
(1,037)
|
|
(1,036)
|
|
Segment
profit
|
308
|
|
1,483
|
|
1,791
|
|
|
|
|
|
|
|
|
Investment
properties
|
77
|
|
3,494
|
|
3,571
|
|
Property, plant and
equipment
|
2,079
|
|
256
|
|
2,335
|
|
Trading
properties
|
-
|
|
136
|
|
136
|
|
Goodwill
|
8
|
|
25
|
|
33
|
|
Rights to receive
future units under barter
agreements
|
-
|
|
90
|
|
90
|
|
Biological
assets
|
588
|
|
-
|
|
588
|
|
Inventories
|
496
|
|
23
|
|
519
|
|
Interests in joint
ventures and
associates
|
33
|
|
2,382
|
|
2,415
|
|
Total
segment
assets
|
3,281
|
|
6,406
|
|
9,687
|
115
Below is a
summarized analysis of the lines of business of the Company for the
year ended June 30, 2014:
|
|
Agricultural
business
|
|
Urban
properties and investments business
|
|
Total
|
|
|
|
|
Operations
Center in Argentina
|
|
|
|
|
|
|
(in
million of Ps.)
|
|
|
|
Revenues
|
1,813
|
|
2,157
|
|
3,970
|
|
Costs
|
(2,617)
|
|
(649)
|
|
(3,266)
|
|
Initial recognition
and changes in the fair value of biological assets and agricultural
produce at the point of harvest
|
1,172
|
|
-
|
|
1,172
|
|
Changes in the net
realizable value of agricultural produce after harvest
|
(17)
|
|
-
|
|
(17)
|
|
Gross
profit
|
351
|
|
1,508
|
|
1,859
|
|
Gain from disposal
of investment
properties
|
-
|
|
231
|
|
231
|
|
Gain from disposal
of
farmlands
|
91
|
|
-
|
|
91
|
|
General and
administrative
expenses
|
(241)
|
|
(300)
|
|
(541)
|
|
Selling
expenses
|
(210)
|
|
(150)
|
|
(360)
|
|
Other operating
results,
net
|
(29)
|
|
(49)
|
|
(78)
|
|
(Loss)
/ Profit from operations
|
(38)
|
|
1,240
|
|
1,202
|
|
Share of profit /
(loss) of joint ventures and
associates
|
11
|
|
(437)
|
|
(426)
|
|
Segment
(loss) / profit
|
(27)
|
|
803
|
|
776
|
|
|
|
|
|
|
|
|
Investment
properties
|
51
|
|
3,539
|
|
3,590
|
|
Property, plant and
equipment
|
2,417
|
|
238
|
|
2,655
|
|
Trading
properties
|
-
|
|
143
|
|
143
|
|
Goodwill
|
11
|
|
26
|
|
37
|
|
Rights to receive
future units under barter
agreements
|
-
|
|
85
|
|
85
|
|
Assets held for
sale
|
-
|
|
1,358
|
|
1,358
|
|
Biological
assets
|
652
|
|
-
|
|
652
|
|
Inventories
|
433
|
|
18
|
|
451
|
|
Interests in joint
ventures and
associates
|
37
|
|
1,966
|
|
2,003
|
|
Total
segment
assets
|
3,601
|
|
7,373
|
|
10,974
|
116
Agriculture line of business:
The following
tables present the reportable segments of the agriculture line of
business:
|
|
June
30, 2016
|
||||||
|
|
Agricultural
production
|
|
Land
transformation
and
sales
|
|
Others
|
|
Total
Agricultural
business
(i)
|
|
|
(in
million of Ps.)
|
||||||
|
Revenues
|
1,689
|
|
-
|
|
1,223
|
|
2,912
|
|
Costs
|
(2,727)
|
|
(9)
|
|
(1,085)
|
|
(3,821)
|
|
Initial recognition
and changes in the fair value of biological assets and agricultural
produce at the point of harvest
|
1,717
|
|
-
|
-
|
-
|
|
1,717
|
|
Changes in the net
realizable value of agricultural produce
after
harvest
|
208
|
|
-
|
-
|
-
|
|
208
|
|
Gross
profit /
(loss)
|
887
|
|
(9)
|
|
138
|
|
1,016
|
|
Loss from disposal
of
farmlands
|
-
|
|
(2)
|
|
-
|
|
(2)
|
|
General and
administrative
expenses
|
(256)
|
|
(1)
|
|
(57)
|
|
(314)
|
|
Selling
expenses
|
(247)
|
|
-
|
|
(91)
|
|
(338)
|
|
Other operating
results,
net
|
(72)
|
|
-
|
|
2
|
|
(70)
|
|
Profit
/ (Loss) from operations
|
312
|
|
(12)
|
|
(8)
|
|
292
|
|
Share of profit /
(loss) of
associates
|
26
|
|
-
|
|
(3)
|
|
23
|
|
Segment
profit / (loss)
|
338
|
|
(12)
|
|
(11)
|
|
315
|
|
|
|
|
|
|
|
|
|
|
Investment
properties
|
-
|
-
|
-
|
|
11
|
|
11
|
|
Property, plant and
equipment
|
2,673
|
|
13
|
|
50
|
|
2,736
|
|
Goodwill
|
10
|
|
-
|
|
-
|
|
10
|
|
Biological
assets
|
1,144
|
|
-
|
|
-
|
|
1,144
|
|
Inventories
|
499
|
|
-
|
|
161
|
|
660
|
|
Investments in
associates
|
54
|
|
-
|
|
-
|
|
54
|
|
Total
segment assets
(ii)
|
4,380
|
|
13
|
|
222
|
|
4,615
|
(i)
From all of the
Company’s revenues corresponding to Agricultural Business,
Ps. 2,212 million are originated in Argentina and Ps. 700 million
in other countries, principally in Brazil for Ps. 503
million.
(ii)
From all of the
Company’s assets included in the segment corresponding to
Agricultural Business, Ps. 2,062 million are located in Argentina
and Ps. 2,556 million in other countries, principally in Brazil for
Ps. 1,470 million.
117
|
|
June
30, 2015
|
||||||
|
|
Agricultural
production
|
|
Land
transformation
and
sales
|
|
Others
|
|
Total
Agricultural
business
(i)
|
|
|
(in
million of Ps.)
|
||||||
|
Revenues
|
1,400
|
|
-
|
|
995
|
|
2,395
|
|
Costs
|
(2,545)
|
|
(9)
|
|
(865)
|
|
(3,419)
|
|
Initial recognition
and changes in the fair value of biological assets and agricultural
produce at the point of harvest
|
1,347
|
|
-
|
|
-
|
|
1,347
|
|
Changes in the net
realizable value of agricultural produce
after
harvest
|
(34)
|
|
-
|
|
-
|
|
(34)
|
|
Gross
profit /
(loss)
|
168
|
|
(9)
|
|
130
|
|
289
|
|
Gain from disposal
of
farmlands
|
-
|
|
570
|
|
-
|
|
570
|
|
General and
administrative
expenses
|
(210)
|
|
(2)
|
|
(35)
|
|
(247)
|
|
Selling
expenses
|
(193)
|
|
(2)
|
|
(91)
|
|
(286)
|
|
Other operating
results,
net
|
(15)
|
|
(5)
|
|
1
|
|
(19)
|
|
(Loss)
/ Profit from operations
|
(250)
|
|
552
|
|
5
|
|
307
|
|
Share of profit of
associates
|
1
|
|
-
|
|
-
|
|
1
|
|
Segment
(loss) / profit
|
(249)
|
|
552
|
|
5
|
|
308
|
|
|
|
|
|
|
|
|
|
|
Investment
properties
|
-
|
|
-
|
|
77
|
|
77
|
|
Property, plant and
equipment
|
1,997
|
|
13
|
|
69
|
|
2,079
|
|
Goodwill
|
7
|
|
-
|
|
1
|
|
8
|
|
Biological
assets
|
587
|
|
-
|
|
1
|
|
588
|
|
Inventories
|
370
|
|
-
|
|
126
|
|
496
|
|
Investments in
associates
|
33
|
|
-
|
|
-
|
|
33
|
|
Total
segment assets
(ii)
|
2,994
|
|
13
|
|
274
|
|
3,281
|
(i)
From all of the
Company’s revenues corresponding to Agricultural Business,
Ps. 1,679 million are originated in Argentina and Ps. 716 million
in other countries, principally in Brazil for Ps. 578
million.
(ii)
From all of the
Company’s assets included in the segment corresponding to
Agricultural Business, Ps. 1,379 million are located in Argentina
and Ps. 1,902 million in other countries, principally in Brazil for
Ps. 1,186 million.
118
|
|
June
30, 2014
|
||||||
|
|
Agricultural
production
|
|
Land
transformation
and
sales
|
|
Others
|
|
Total
Agricultural
business
(i)
|
|
|
(in
million of Ps.)
|
||||||
|
Revenues
|
1,105
|
|
-
|
|
708
|
|
1,813
|
|
Costs
|
(2,011)
|
|
(8)
|
|
(598)
|
|
(2,617)
|
|
Initial recognition
and changes in the fair value of biological assets and agricultural
produce at the point of harvest
|
1,172
|
|
-
|
|
-
|
|
1,172
|
|
Changes in the net
realizable value of agricultural produce
after
harvest
|
(17)
|
|
-
|
|
-
|
|
(17)
|
|
Gross
profit /
(loss)
|
249
|
|
(8)
|
|
110
|
|
351
|
|
Gain from disposal
of
farmlands
|
-
|
|
91
|
|
-
|
|
91
|
|
General and
administrative expenses
|
(208)
|
|
(1)
|
|
(32)
|
|
(241)
|
|
Selling
expenses
|
(139)
|
|
(4)
|
|
(67)
|
|
(210)
|
|
Other operating
results,
net
|
(29)
|
|
-
|
|
-
|
|
(29)
|
|
(Loss)
/ Profit from operations
|
(127)
|
|
78
|
|
11
|
|
(38)
|
|
Share of profit of
associates
|
11
|
|
-
|
|
-
|
|
11
|
|
Segment
(loss) / profit
|
(116)
|
|
78
|
|
11
|
|
(27)
|
|
|
|
|
|
|
|
|
|
|
Investment
properties
|
-
|
|
-
|
|
51
|
|
51
|
|
Property, plant and
equipment
|
2,365
|
|
7
|
|
45
|
|
2,417
|
|
Goodwill
|
10
|
|
-
|
|
1
|
|
11
|
|
Biological
assets
|
647
|
|
-
|
|
5
|
|
652
|
|
Inventories
|
334
|
|
-
|
|
99
|
|
433
|
|
Investments in
associates
|
34
|
|
-
|
|
3
|
|
37
|
|
Total
segment assets
(ii)
|
3,390
|
|
7
|
|
204
|
|
3,601
|
(i)
From all of the
Company’s revenues corresponding to Agricultural Business,
Ps. 1,279 million are originated in Argentina and Ps. 534 million
in other countries, principally in Brazil for Ps. 415
million.
(ii)
From all of the
Company’s assets included in the segment corresponding to
Agricultural Business, Ps. 1,252 million are located in Argentina
and Ps. 2,348 million in other countries, principally in Brazil for
Ps. 1,727 million.
119
Urban properties line of business and investments
The following tables present
the reportable segments from the Operations Center in
Argentina:
|
|
June
30, 2016
|
||||||||||||
|
|
Shopping
Center
|
|
Offices
and others
|
|
Sales
and developments
|
|
Hotels
|
|
International
|
|
Financial
operations
and
others
|
|
Total
|
|
|
(in
million of Ps.)
|
||||||||||||
|
Revenues
(i)
|
2,406
|
|
340
|
|
3
|
|
534
|
|
-
|
|
1
|
|
3,284
|
|
Costs
|
(403)
|
|
(53)
|
|
(20)
|
|
(362)
|
|
-
|
|
(1)
|
|
(839)
|
|
Gross
profit /
(loss)
|
2,003
|
|
287
|
|
(17)
|
|
172
|
|
-
|
|
-
|
|
2,445
|
|
Gain from disposal
of investment properties
|
-
|
|
-
|
|
1,056
|
|
-
|
|
-
|
|
-
|
|
1,056
|
|
General and
administrative
expenses
|
(179)
|
|
(50)
|
|
(131)
|
|
(103)
|
|
(91)
|
|
-
|
|
(554)
|
|
Selling
expenses
|
(145)
|
|
(12)
|
|
(36)
|
|
(69)
|
|
-
|
|
(2)
|
|
(264)
|
|
Other operating
results,
net
|
(42)
|
|
(6)
|
|
(8)
|
|
(2)
|
|
89
|
|
1
|
|
32
|
|
Profit
/ (Loss) from
operations
|
1,637
|
|
219
|
|
864
|
|
(2)
|
|
(2)
|
|
(1)
|
|
2,715
|
|
Share of profit /
(loss) of joint ventures and associates
|
-
|
|
14
|
|
5
|
|
-
|
|
(154)
|
|
231
|
|
96
|
|
Segment
profit /
(loss)
|
1,637
|
|
233
|
|
869
|
|
(2)
|
|
(156)
|
|
230
|
|
2,811
|
|
|
|
|
|
|
|
|
|
|
|
|
|
|
|
|
Investment
properties
|
2,282
|
|
879
|
|
173
|
|
-
|
|
-
|
|
6
|
|
3,340
|
|
Property, plant and
equipment
|
49
|
|
25
|
|
2
|
|
166
|
|
2
|
|
-
|
|
244
|
|
Trading
properties
|
1
|
|
-
|
|
252
|
|
-
|
|
-
|
|
-
|
|
253
|
|
Goodwill
|
14
|
|
6
|
|
5
|
|
-
|
|
-
|
|
-
|
|
25
|
|
Rights to receive
future units under barter agreements
|
-
|
|
-
|
|
90
|
|
-
|
|
-
|
|
-
|
|
90
|
|
Inventories
|
19
|
|
-
|
|
1
|
|
8
|
|
-
|
|
-
|
|
28
|
|
Investment in joint
ventures and associates
|
-
|
|
31
|
|
62
|
|
-
|
|
(832)
|
|
1,703
|
|
964
|
|
Total
segment assets
(ii)
|
2,365
|
|
941
|
|
585
|
|
174
|
|
(830)
|
|
1,709
|
|
4,944
|
(i)
From all our
revenues corresponding to the urban properties and investment
business of the Operations Center in Argentina, Ps. 3,284 million
are originated in Argentina. No external client represents 10% or
more of revenue of any of the reportable
segments.
(ii)
From all our assets
included in the segment corresponding to the urban properties and
investment business of the operations Center in Argentina, Ps.
5,618 million are located in Argentina and Ps. (674) million in
other countries, principally in United States for Ps. (832) million
and Uruguay for Ps. 158 million, respectively.
120
|
|
June
30, 2015
|
||||||||||||
|
|
Shopping
Center
|
|
Offices
and others
|
|
Sales
and developments
|
|
Hotels
|
|
International
|
|
Financial
operations
and
others
|
|
Total
|
|
|
(in
million of Ps.)
|
||||||||||||
|
Revenues
(i)
|
1,778
|
|
333
|
|
14
|
|
396
|
|
26
|
|
-
|
|
2,547
|
|
Costs
|
(291)
|
|
(36)
|
|
(19)
|
|
(279)
|
|
(7)
|
|
(1)
|
|
(633)
|
|
Gross
profit /
(loss)
|
1,487
|
|
297
|
|
(5)
|
|
117
|
|
19
|
|
(1)
|
|
1,914
|
|
Gain from disposal
of investment properties
|
-
|
|
-
|
|
1,150
|
|
-
|
|
-
|
|
-
|
|
1,150
|
|
General and
administrative
expenses
|
(135)
|
|
(59)
|
|
(50)
|
|
(78)
|
|
(56)
|
|
-
|
|
(378)
|
|
Selling
expenses
|
(113)
|
|
(21)
|
|
(9)
|
|
(52)
|
|
-
|
|
-
|
|
(195)
|
|
Other operating
results,
net
|
(49)
|
|
(118)
|
|
13
|
|
-
|
|
185
|
|
(2)
|
|
29
|
|
Profit
/ (Loss) from
operations
|
1,190
|
|
99
|
|
1,099
|
|
(13)
|
|
148
|
|
(3)
|
|
2,520
|
|
Share of (loss) /
profit of joint ventures and associates
|
-
|
|
(3)
|
|
(2)
|
|
1
|
|
(1,191)
|
|
158
|
|
(1,037)
|
|
Segment
profit /
(loss)
|
1,190
|
|
96
|
|
1,097
|
|
(12)
|
|
(1,043)
|
|
155
|
|
1,483
|
|
|
|
|
|
|
|
|
|
|
|
|
|
|
|
|
Investment
properties
|
2,321
|
|
978
|
|
188
|
|
-
|
|
-
|
|
7
|
|
3,494
|
|
Property, plant and
equipment
|
48
|
|
31
|
|
1
|
|
175
|
|
1
|
|
-
|
|
256
|
|
Trading
properties
|
1
|
|
-
|
|
135
|
|
-
|
|
-
|
|
-
|
|
136
|
|
Goodwill
|
14
|
|
6
|
|
5
|
|
-
|
|
-
|
|
-
|
|
25
|
|
Rights to receive
future units under barter agreements
|
-
|
|
-
|
|
90
|
|
-
|
|
-
|
|
-
|
|
90
|
|
Inventories
|
16
|
|
-
|
|
-
|
|
7
|
|
-
|
|
-
|
|
23
|
|
Interests in joint
ventures and associates
|
-
|
|
21
|
|
47
|
|
-
|
|
910
|
|
1,404
|
|
2,382
|
|
Total
segment assets
(ii)
|
2,400
|
|
1,036
|
|
466
|
|
182
|
|
911
|
|
1,411
|
|
6,406
|
(i)
From all our
revenues corresponding to the urban properties and investment
business of the Operations Center in Argentina, Ps. 2,521 million
are originated in Argentina and Ps. 26 million in United States. No
external client represents 10% or more of revenue of any of the
reportable segments.
(ii)
From all our assets
included in the segment corresponding to the urban properties and
investment business of the Operations Center in Argentina, Ps.
4,767 million are located in Argentina and Ps. 1,639 million in
other countries, principally in United States for Ps. 1,533 million
and Uruguay for Ps. 106 million, respectively.
121
|
|
June
30, 2014
|
||||||||||||
|
|
Shopping
Center
|
|
Offices
and others
|
|
Sales
and developments
|
|
Hotels
|
|
International
|
|
Financial
operations
and
others
|
|
Total
|
|
|
(in
million of Ps.)
|
||||||||||||
|
Revenues
(i)
|
1,383
|
|
271
|
|
86
|
|
332
|
|
84
|
|
1
|
|
2,157
|
|
Costs
|
(297)
|
|
(45)
|
|
(35)
|
|
(217)
|
|
(54)
|
|
(1)
|
|
(649)
|
|
Gross
profit
|
1,086
|
|
226
|
|
51
|
|
115
|
|
30
|
|
-
|
|
1,508
|
|
Gain from disposal
of investment properties
|
-
|
|
-
|
|
231
|
|
-
|
|
-
|
|
-
|
|
231
|
|
General and
administrative
expenses
|
(102)
|
|
(42)
|
|
(37)
|
|
(60)
|
|
(59)
|
|
-
|
|
(300)
|
|
Selling
expenses
|
(73)
|
|
(21)
|
|
(14)
|
|
(42)
|
|
-
|
|
-
|
|
(150)
|
|
Other operating
results,
net
|
(47)
|
|
(3)
|
|
8
|
|
(3)
|
|
(1)
|
|
(3)
|
|
(49)
|
|
Profit
/ (Loss) from
operations
|
864
|
|
160
|
|
239
|
|
10
|
|
(30)
|
|
(3)
|
|
1,240
|
|
Share of (loss) /
profit of joint ventures and associates
|
-
|
|
(1)
|
|
6
|
|
1
|
|
(616)
|
|
173
|
|
(437)
|
|
Segment
profit /
(loss)
|
864
|
|
159
|
|
245
|
|
11
|
|
(646)
|
|
170
|
|
803
|
|
|
|
|
|
|
|
|
|
|
|
|
|
|
|
|
Investment
properties
|
2,275
|
|
834
|
|
423
|
|
-
|
|
-
|
|
7
|
|
3,539
|
|
Property, plant and
equipment
|
20
|
|
36
|
|
4
|
|
176
|
|
2
|
|
-
|
|
238
|
|
Trading
properties
|
1
|
|
-
|
|
142
|
|
-
|
|
-
|
|
-
|
|
143
|
|
Goodwill
|
9
|
|
12
|
|
5
|
|
-
|
|
-
|
|
-
|
|
26
|
|
Rights to receive
future units under barter agreements
|
-
|
|
-
|
|
85
|
|
-
|
|
-
|
|
-
|
|
85
|
|
Assets held for
sale
|
-
|
|
-
|
|
-
|
|
-
|
|
1,358
|
|
-
|
|
1,358
|
|
Inventories
|
11
|
|
-
|
|
1
|
|
6
|
|
-
|
|
-
|
|
18
|
|
Interests in joint
ventures and associates
|
-
|
|
23
|
|
38
|
|
22
|
|
629
|
|
1,254
|
|
1,966
|
|
Total
segment assets
(ii)
|
2,316
|
|
905
|
|
698
|
|
204
|
|
1,989
|
|
1,261
|
|
7,373
|
(i)
From all our
revenues corresponding to the urban properties and investment
business of the Operations Center in Argentina, Ps. 2,073 million
are originated mainly in Argentina and Ps. 84 million in United
States. No external client represents 10% or more of revenue of any
of the reportable segments.
(ii)
From all our assets
included in the segment corresponding to the urban properties and
investment business of the Operations Center in Argentina, Ps.
5,274 million are located in Argentina and Ps. 2,099 million in
other countries, principally in United States for Ps. 1,988
million.
122
The following table
presents the reportable segments of the Operations Center in
Israel:
|
|
June
30, 2016
|
||||||||||||
|
|
Real
Estate
|
|
Supermarkets
|
|
Agrochemicals
|
|
Telecommunications
|
|
Insurance
|
|
Others
|
|
Total
|
|
|
(in
million of Ps.)
|
||||||||||||
|
Revenues
(i)
|
1,538
|
|
18,610
|
|
-
|
|
6,655
|
|
-
|
|
1,426
|
|
28,229
|
|
Costs
|
(837)
|
|
(13,925)
|
|
-
|
|
(4,525)
|
|
-
|
|
(1,194)
|
|
(20,481)
|
|
Gross
profit
|
701
|
|
4,685
|
|
-
|
|
2,130
|
|
-
|
|
232
|
|
7,748
|
|
Gain from disposal
of investment properties
|
45
|
|
-
|
|
-
|
|
-
|
|
-
|
|
-
|
|
45
|
|
General and
administrative expenses
|
(100)
|
|
(203)
|
|
-
|
|
(708)
|
|
-
|
|
(376)
|
|
(1,387)
|
|
Selling
expenses
|
(29)
|
|
(4,058)
|
|
-
|
|
(1,493)
|
|
-
|
|
(106)
|
|
(5,686)
|
|
Profit
/ (Loss) from operations
|
617
|
|
424
|
|
-
|
|
(71)
|
|
-
|
|
(250)
|
|
720
|
|
Share of profit /
(loss) of joint ventures and associates
|
97
|
|
-
|
|
334
|
|
-
|
|
-
|
|
(93)
|
|
338
|
|
Segment
profit /
(loss)
|
714
|
|
424
|
|
334
|
|
(71)
|
|
-
|
|
(343)
|
|
1,058
|
|
|
|
|
|
|
|
|
|
|
|
|
|
|
|
|
Operating assets
(ii)
|
60,197
|
|
29,440
|
|
-
|
|
27,345
|
|
4,602
|
|
25,405
|
|
146,989
|
|
Operating
liabilities
|
(49,452)
|
|
(23,614)
|
|
-
|
|
(21,657)
|
|
-
|
|
(38,142)
|
|
(132,865)
|
|
|
10,745
|
|
5,826
|
|
-
|
|
5,688
|
|
4,602
|
|
(12,737)
|
|
14,124
|
(i)
From all our
revenues corresponding to the urban properties and investment
business of the Operations Center in Israel, Ps. 512 million are
originated in United States and Ps. 27,717 million in Israel. No
external client represents 10% or more of revenue of any of the
reportable segments.
(ii)
From all our assets
included in the segment corresponding to the urban properties and
investment business of the Operations Center in Israel, Ps. 14,070
million are located in United States, Ps. 786 million in India and
the remaining in Israel.
123
The following
tables present a reconciliation between the total results of
operations as per the segment information and the profit from
operation as per the statement of income. The adjustments relate to
the presentation of the results of operations of joint ventures
accounted for under the equity method under IFRS and the
non-elimination of the inter-segment transactions.
|
|
June
30, 2016
|
||||||||
|
|
Total
segment
information
|
|
Adjustment
for share of profit / (loss) of joint ventures
|
|
Expenses
and
collective promotion
funds
|
|
Adjustment
to
income
for
elimination
of
inter-segment transactions
|
|
Total
statement
of income
|
|
|
(in
million of Ps.)
|
||||||||
|
Revenues
|
34,425
|
|
(89)
|
|
1,194
|
|
(146)
|
|
35,384
|
|
Costs
|
(25,141)
|
|
111
|
|
(1,207)
|
|
147
|
|
(26,090)
|
|
Initial recognition
and changes in the fair value of biological assets and agricultural
produce at the point of harvest
|
1,717
|
|
(57)
|
|
-
|
|
-
|
|
1,660
|
|
Changes in the net
realizable value of agricultural produce after harvest
|
208
|
|
-
|
|
-
|
|
-
|
|
208
|
|
Gross
profit / (loss)
|
11,209
|
|
(35)
|
|
(13)
|
|
1
|
|
11,162
|
|
Gain from disposal
of investment properties
|
1,101
|
|
-
|
|
-
|
|
-
|
|
1,101
|
|
Loss from disposal
of farmlands
|
(2)
|
|
-
|
|
-
|
|
-
|
|
(2)
|
|
General and
administrative expenses
|
(2,255)
|
|
5
|
|
-
|
|
6
|
|
(2,244)
|
|
Selling
expenses
|
(6,288)
|
|
8
|
|
-
|
|
1
|
|
(6,279)
|
|
Other operating
results, net
|
(38)
|
|
(2)
|
|
-
|
|
(3)
|
|
(43)
|
|
Profit
/ (Loss) from operations before share of
Profit
/ (Loss) of joint ventures and associates
|
3,727
|
|
(24)
|
|
(13)
|
|
5
|
|
3,695
|
|
Share of (loss) /
profit of joint ventures and associates
|
457
|
|
14
|
|
-
|
|
-
|
|
471
|
|
Profit
/ (Loss) from operations before financing and taxation
|
4,184
|
|
(10)
|
|
(13)
|
|
5
|
|
4,166
|
124
|
|
June
30, 2015
|
||||||||
|
|
Total
segment
information
|
|
Adjustment
for share of Profit / (Loss)
of
joint ventures
|
|
Expenses
and
collective promotion funds
|
|
Adjustment
to
income for elimination of
inter-segment
transactions
|
|
Total
statement
of income
|
|
|
(in
million of Ps.)
|
||||||||
|
Revenues
|
4,942
|
|
(53)
|
|
887
|
|
(124)
|
|
5,652
|
|
Costs
|
(4,052)
|
|
61
|
|
(901)
|
|
122
|
|
(4,770)
|
|
Initial recognition
and changes in the fair value of biological assets and agricultural
produce at the point of harvest
|
1,347
|
|
(23)
|
|
-
|
|
-
|
|
1,324
|
|
Changes in the net
realizable value of agricultural produce after harvest
|
(34)
|
|
-
|
|
-
|
|
-
|
|
(34)
|
|
Gross
profit / (loss)
|
2,203
|
|
(15)
|
|
(14)
|
|
(2)
|
|
2,172
|
|
Gain from disposal
of investment properties
|
1,150
|
|
-
|
|
-
|
|
-
|
|
1,150
|
|
Gain / (Loss) from
disposal of farmlands
|
570
|
|
(20)
|
|
-
|
|
-
|
|
550
|
|
General and
administrative expenses
|
(625)
|
|
4
|
|
-
|
|
3
|
|
(618)
|
|
Selling
expenses
|
(481)
|
|
6
|
|
-
|
|
1
|
|
(474)
|
|
Other operating
results, net
|
10
|
|
3
|
|
-
|
|
(1)
|
|
12
|
|
Profit
/ (Loss) from operations before share of Profit / (Loss) of joint
ventures and associates
|
2,827
|
|
(22)
|
|
(14)
|
|
1
|
|
2,792
|
|
Share of (loss) /
profit of joint ventures and associates
|
(1,036)
|
|
11
|
|
-
|
|
-
|
|
(1,025)
|
|
Profit
/ (Loss) from operations before financing and taxation
|
1,791
|
|
(11)
|
|
(14)
|
|
1
|
|
1,767
|
|
|
June
30, 2014
|
||||||||
|
|
Total
segment
information
|
|
Adjustment
for share of Profit / (Loss)
of
joint ventures
|
|
Expenses
and
collective promotion funds
|
|
Adjustment
to
income
for
elimination
of
inter-segment
transactions
|
|
Total
statement
of income
|
|
|
(in
million of Ps.)
|
||||||||
|
Revenues
|
3,970
|
|
(63)
|
|
736
|
|
(39)
|
|
4,604
|
|
Costs
|
(3,266)
|
|
60
|
|
(744)
|
|
37
|
|
(3,913)
|
|
Initial recognition
and changes in the fair value of biological assets and agricultural
produce at the point of harvest
|
1,172
|
|
(20)
|
|
-
|
|
-
|
|
1,152
|
|
Changes in the net
realizable value of agricultural produce after harvest
|
(17)
|
|
-
|
|
-
|
|
-
|
|
(17)
|
|
Gross
profit / (loss)
|
1,859
|
|
(23)
|
|
(8)
|
|
(2)
|
|
1,826
|
|
Gain from disposal
of investment properties
|
231
|
|
-
|
|
-
|
|
-
|
|
231
|
|
Gain from disposal
of farmlands
|
91
|
|
-
|
|
-
|
|
-
|
|
91
|
|
General and
administrative expenses
|
(541)
|
|
5
|
|
-
|
|
3
|
|
(533)
|
|
Selling
expenses
|
(360)
|
|
6
|
|
-
|
|
-
|
|
(354)
|
|
Other operating
results, net
|
(78)
|
|
4
|
|
-
|
|
(1)
|
|
(75)
|
|
Profit
/ (Loss) from operations before share of Profit / (Loss) of joint
ventures and associates
|
1,202
|
|
(8)
|
|
(8)
|
|
-
|
|
1,186
|
|
Share of (loss) /
profit of joint ventures and associates
|
(426)
|
|
16
|
|
-
|
|
-
|
|
(410)
|
|
Profit
/ (Loss) from operations before financing and taxation
|
776
|
|
8
|
|
(8)
|
|
-
|
|
776
|
125
The following
tables present a reconciliation between total segment assets and
liabilities and total assets as per the statement of financial
position. Adjustments are mainly related to the filing of certain
classes of assets in segment information and to the proportional
consolidation of joint ventures mentioned previously.
|
|
June
30, 2016
|
|
June
30, 2015
|
|
June
30, 2014
|
||||||||||||||
|
|
Agricultural
business
|
|
Urban
properties
and
investments business
|
|
Total
|
|
Agricultural
business
|
|
Urban
properties
and
investments business
|
|
Total
|
|
Agricultural
business
|
|
Urban
properties
and
investments business
|
|
Total
|
||
|
|
|
|
Operations
Center in Argentina
|
Operations
Center in
Israel
|
Subtotal
|
|
|
|
|
|
Operations
Center in
Argentina
|
|
|
|
|
|
Operations
Center in
Argentina
|
|
|
|
|
(in
million of Ps.)
|
||||||||||||||||||
|
Total
Assets per segment
|
4,615
|
|
4,944
|
146,989
|
151,933
|
|
156,548
|
|
3,281
|
|
6,406
|
|
9,687
|
|
3,601
|
|
7,373
|
|
10,974
|
|
Less:
|
|
|
|
|
|
|
|
|
|
|
|
|
|
|
|
|
|
|
|
|
Proportionate share
in reportable assets per segment of joint ventures (*)
|
(529)
|
|
(117)
|
-
|
(117)
|
|
(646)
|
|
(382)
|
|
(95)
|
|
(477)
|
|
(294)
|
|
(149)
|
|
(443)
|
|
Measurement
adjustments at fair value
|
|
|
|
|
|
|
|
|
|
|
|
|
|
|
|
|
|
|
|
|
Plus:
|
|
|
|
|
|
|
|
|
|
|
|
|
|
|
|
|
|
|
|
|
Investments in
joint ventures (**)
|
233
|
|
203
|
-
|
203
|
|
436
|
|
177
|
|
181
|
|
358
|
|
64
|
|
308
|
|
372
|
|
Other
non-reportable assets (***)
|
3,102
|
|
6,561
|
-
|
6,561
|
|
9,663
|
|
2,794
|
|
2,914
|
|
5,708
|
|
2,606
|
|
2,275
|
|
4,881
|
|
Total
Consolidated assets as per Statement of financial
position
|
7,421
|
|
11,591
|
146,989
|
158,580
|
|
166,001
|
|
5,870
|
|
9,406
|
|
15,276
|
|
5,977
|
|
9,807
|
|
15,784
|
(***) Includes
deferred income tax assets, income tax credit, restricted assets,
trade and other receivables, financial assets held for sale,
investment in financial assets, derivative financial instruments,
employee benefits, cash and cash equivalents and intangible assets
except for goodwill and right to receive units.
126
(*) Below is a
detail of the proportionate share in assets by segment of joint
ventures included in the information reported by
segment.
|
|
June
30, 2016
|
|
June
30, 2015
|
|
June
30, 2014
|
||||||||||||||
|
|
Agricultural
business
|
|
Urban
properties
and
investments business
|
|
Total
|
|
Agricultural
business
|
|
Urban
properties
and
investments business
|
|
Total
|
|
Agricultural
business
|
|
Urban
properties
and
investments business
|
|
Total
|
||
|
|
|
|
Operations
Center in Argentina
|
Operations
Center in
Israel
|
Subtotal
|
|
|
|
|
|
Operations
Center
in Argentina
|
|
|
|
|
|
Operations
Center
in Argentina
|
|
|
|
|
(in
million of Ps.)
|
||||||||||||||||||
|
Investment
properties
|
2
|
|
115
|
-
|
115
|
|
117
|
|
-
|
|
96
|
|
96
|
|
-
|
|
135
|
|
135
|
|
Property, plant and
equipment
|
509
|
|
(5)
|
-
|
(5)
|
|
504
|
|
366
|
|
(9)
|
|
357
|
|
273
|
|
-
|
|
273
|
|
Trading
properties
|
-
|
|
1
|
-
|
1
|
|
1
|
|
-
|
|
3
|
|
3
|
|
-
|
|
6
|
|
6
|
|
Goodwill
|
-
|
|
5
|
-
|
5
|
|
5
|
|
-
|
|
5
|
|
5
|
|
-
|
|
7
|
|
7
|
|
Biological
assets
|
12
|
|
-
|
-
|
-
|
|
12
|
|
9
|
|
-
|
|
9
|
|
11
|
|
-
|
|
11
|
|
Inventories
|
6
|
|
1
|
-
|
1
|
|
7
|
|
7
|
|
-
|
|
7
|
|
10
|
|
1
|
|
11
|
|
Total
proportionate share in assets per segment of joint
ventures
|
529
|
|
117
|
-
|
117
|
|
646
|
|
382
|
|
95
|
|
477
|
|
294
|
|
149
|
|
443
|
(**)
Represents the
equity-accounted amount of those joint ventures, which were
proportionate-consolidated for segment information
purposes.
|
|
June
30, 2016
|
|
June
30, 2015
|
|
June
30, 2014
|
|
||||||||||||||||
|
|
Agricultural
business
|
|
Urban
properties
and
investments business
|
|
Total
|
|
Agricultural
business
|
|
Urban
properties
and
investments business
|
|
Total
|
|
Agricultural
business
|
|
Urban
properties
and
investments business
|
|
Total
|
|||||
|
|
|
|
Operations
Center in Argentina
|
Operations
Center in
Israel
|
Subtotal
|
|
|
|
|
|
Operations
Center
in
Argentina
|
|
|
|
|
|
Operations
Center
in Argentina
|
|
|
|||
|
|
(in
million of Ps.)
|
|||||||||||||||||||||
|
Total
Liabilities per segment
|
-
|
|
-
|
132,865
|
132,865
|
|
132,865
|
|
-
|
|
-
|
|
-
|
|
-
|
|
-
|
|
-
|
|||
|
Plus:
|
|
|
|
|
|
|
|
|
|
|
|
|
|
|
|
|
|
|
|
|||
|
Liabilities
corresponding to agricultural business and urban properties and
investment business of the operations center in
Argentina
|
5,323
|
|
12,581
|
-
|
12,581
|
|
17,904
|
|
4,209
|
|
7,165
|
|
11,374
|
|
4,213
|
|
7,136
|
|
11,349
|
|||
|
Total
Consolidated liabilities as per Statement of financial
position
|
5,323
|
|
12,581
|
132,865
|
145,446
|
|
150,769
|
|
4,209
|
|
7,165
|
|
11,374
|
|
4,213
|
|
7,136
|
|
11,349
|
|||
127
Fiscal
year ended on June 30, 2016 compared to the fiscal year ended on
June 30, 2015
On October 11,
2015, we obtained control of IDBD (See Note 3 to the Consolidated
Financial Statements as of June 30, 2016 and 2015). Given that we
have consolidated significant figures from various industries
provided by IDBD and its subsidiaries, consolidated results
(Agricultural Business, Israeli Operating Center’s Real
Estate Business and Argentine Operating Center’s Real Estate
Business) exhibit significant variations in Revenues, Costs,
Administrative and Selling expenses, Share of Profit / (Loss) of
Associates, and Financial Results.
Operating
results
REVENUES
Our total revenues
rose by 596.6%, from Ps. 4,942 million in fiscal year 2015 to
Ps. 34,425 million in fiscal year 2016. This was mainly due to
the 21.6% increase in the Agricultural Business, from
Ps. 2,395 million in fiscal year 2015 to Ps. 2,912
million in fiscal year 2016 and to the 1,137.3% increase in the
Urban Properties and Investments Business, attributable to the
Ps. 28,229 in revenues from the Operation Center in Israel for
fiscal year 2016, and to the increase of 28.9% in the Operation
Center in Argentina, from Ps. 2,547 million in fiscal year
2015 to Ps. 3,284 million in fiscal year 2016.
Agricultural
Business
|
|
|
Fiscal
year ended June 30, 2016
|
|||
|
Revenues
|
|
Statement
of Income
|
Interests
in joint ventures
|
Inter-segment
eliminations
|
Segment
reporting
|
|
|
|
(in
million of Ps.)
|
|||
|
Crops
|
|
1,101
|
51
|
-
|
1,152
|
|
Cattle
|
|
80
|
9
|
89
|
178
|
|
Dairy
|
|
65
|
-
|
-
|
65
|
|
Sugarcane
|
|
294
|
-
|
-
|
294
|
|
Agricultural
Production Subtotal
|
|
1,540
|
60
|
89
|
1,689
|
|
Land Transformation
and Sales
|
|
-
|
-
|
-
|
-
|
|
Agro-industrial
|
|
966
|
-
|
-
|
966
|
|
Others
segments
|
|
167
|
-
|
12
|
179
|
|
Agricultural Rental
and Services
|
|
40
|
-
|
38
|
78
|
|
Subtotal
Others
|
|
1,173
|
-
|
50
|
1,223
|
|
Total
Agricultural Business
|
|
2,713
|
60
|
139
|
2,912
|
|
|
|
Fiscal
Year ended June 30, 2015
|
|||
|
Revenues
|
|
Statement
of Income
|
Interests
in joint ventures
|
Inter-segment
eliminations
|
Segment
reporting
|
|
|
|
(in
million of Ps.)
|
|||
|
Crops
|
|
964
|
23
|
-
|
987
|
|
Cattle
|
|
56
|
3
|
84
|
143
|
|
Dairy
|
|
72
|
-
|
-
|
72
|
|
Sugarcane
|
|
198
|
-
|
-
|
198
|
|
Agricultural
Production Subtotal
|
|
1,290
|
26
|
84
|
1,400
|
|
Land Transformation
and Sales
|
|
-
|
-
|
-
|
-
|
|
Agro-industrial
|
|
806
|
-
|
-
|
806
|
|
Others
segments
|
|
118
|
-
|
10
|
128
|
|
Agricultural rental
and Services
|
|
37
|
-
|
24
|
61
|
|
Subtotal
Others
|
|
961
|
-
|
34
|
995
|
|
Total
Agricultural Business
|
|
2,251
|
26
|
118
|
2,395
|
Total revenues rose
by 20.5%, up from Ps. 2,251 million in fiscal year 2015 to
Ps. 2,713 in fiscal year 2016. This was due to the following
increases:
·
Ps. 137
million in the Crops segment,
·
Ps. 24 million
in the Cattle segment,
·
Ps. 96 million
in the Sugarcane segment,
·
Ps. 160
million in the Agro-industrial segment,
·
Ps. 49 million
in Others segments, and
·
Ps. 3 million
in the Agricultural Rental and Services segment; offset by a
Ps. 7 million decrease in the Dairy
segment.
In turn, revenues
from our interests in joint ventures increased by 130.8% from
Ps. 26 million in fiscal year 2015 to Ps. 60 million in
fiscal year 2016, primarily as a consequence of a 121.7% increase
in the Crops sold to Cresca, up from Ps. 23 million in fiscal
year 2015 to Ps. 51 million in fiscal year 2016.
128
Similarly,
inter-segment revenues rose by 17.8%, from Ps. 118 million in
fiscal year 2015 up to Ps. 139 million in fiscal year 2016,
mainly as a result of livestock sales during the year to our
subsidiary Sociedad Anónima Carnes Pampeanas which was
reclassified from the Cattle segment to the Agro-industrial segment
and to the leases of croplands between our subsidiary Brasilagro
and its subsidiaries, which were reclassified from the Crops and
Sugarcane segment to the Agricultural Rental and Services
segment.
Hence, according to
business segment reporting and considering all our joint ventures
and inter-segment eliminations, revenues increased by 21.6%, up
from Ps. 2,395 million in fiscal year 2015 to Ps. 2,912
million in fiscal year 2016.
Crops
Total revenues from
the Crops segment increased by 16.7%, up from Ps. 987 million
in fiscal year 2015 to Ps. 1,152 million in fiscal year 2016,
mainly as a consequence of:
·
a 20.9% increase in
the average price of the Crops sold, up from Ps. 1,842 per ton
in fiscal year 2015 to Ps. 2,226 per ton in fiscal year 2016,
partially due to the reduction of 5% in export duties of soybean
and the elimination of export duties of corn and wheat (20% and
23%, respectively);
·
partially offset by
a reduction of 18,175 tons in the volume of Crops sold during
fiscal year 2016 compared to the previous fiscal year; a 38.8%
decrease in Production volumes, from 405,882 tons in fiscal year
2015 down to 248,435 tons in fiscal year 2016.
The following table
provides a breakdown of the sales of Crops:
|
|
Sales of Crops
(in tons)
|
|
|||
|
|
Fiscal
year ended June 30
|
|
|||
|
|
2016
|
2015
|
Variation
|
|
|
|
Corn
|
255,162
|
269,701
|
(14,539)
|
||
|
Soybean
|
198,296
|
250,125
|
(51,829)
|
||
|
Wheat
|
46,607
|
7,083
|
39,524
|
||
|
Sorghum
|
1,007
|
1,569
|
(562)
|
||
|
Sunflower
|
10,421
|
5,181
|
5,240
|
||
|
Other
|
5,863
|
1,872
|
3,991
|
||
|
Total
Sales
|
517,356
|
535,531
|
(18,175)
|
||
Cattle
Total revenues from
the Cattle segment increased 24.5%, from Ps. 143 million in
fiscal year 2015 to Ps. 178 million in fiscal year 2016,
mainly as a consequence of:
·
a 31.8% increase in
the average price per kilogram sold, from Ps. 16.0 million in
fiscal year 2015 to Ps. 21.2 million in fiscal year
2016;
·
offset by a 6.3%
decrease in the volume of Cattle sold, down from 8,871 tons in
fiscal year 2015 to 8,315 tons in fiscal year
2016.
Dairy
Total revenues from
the Dairy segment dropped by 9.7%, down from Ps. 72 million in
fiscal year 2015 to Ps. 65 million in fiscal year 2016, mainly
as a consequence of:
·
an 8.2% reduction
in the average price of milk, down from Ps. 3.55 per liter in
fiscal year 2015 to Ps. 3.26 per liter in fiscal year
2016;
·
a 48.0% increase in
the average price per kilogram sold of milking cows from
Ps. 13.1 in fiscal year 2015 to Ps. 19.3 in fiscal year
2016;
·
a 17.7% reduction
in the volume of milking cows from 903 tons in fiscal year 2015 to
743 tons in fiscal year 2016;
·
slightly offset by
an 8.2% decrease in the volume of sales of milk, from 17 million
liters in fiscal year 2015 to 16 million liters in fiscal year
2016.
Sugarcane
Total revenues from
the Sugarcane segment increased 48.5%, from Ps. 198 million in
fiscal year 2015 to Ps. 294 million in fiscal year 2016,
mainly as a consequence of:
·
an increase of
295,226 tons (31.9%) in sales of sugarcane in fiscal year 2016
compared to the previous fiscal year, primarily attributable to
Brasilagro; and
·
a 12.7% increase in
the average price of sugarcane sold, from, from Ps. 214.0 per
ton in fiscal year 2015 up to Ps. 241.2 per ton in fiscal year
2016.
Agricultural Rental and Services
Total revenues from
the Agricultural Rental and Services segment increased by 27.9%, up
from Ps. 61 million in fiscal year 2015 to Ps. 78 million
in fiscal year 2016, mainly as a consequence of:
129
·
a 60.2% increase in
leases, due to an increase in leases in Brazil for Ps. 10
million originating primarily in the increase in the price of
soybean and an increase in Income from leases in Argentina for
Ps. 4.9 million, primarily attributable to a new agreement for
1,106 hectares in La Esmeralda (Don Avelino), and an improvement in
the agreement between Agro-Riego and Monsanto;
·
a 36.5% increase in
revenues from the production of seeds mainly due to an increase in
the prices of Crops that took place this fiscal
year;
·
offset by a 16.5%
decrease in revenues from irrigation services and agricultural
management (Ps. 1 million) in the course of the current fiscal
year compared to fiscal year 2015.
Agro-industrial
Total revenues from
the Agro-industrial segment increased 19.9%, from Ps. 806
million in fiscal year 2015 to Ps. 966 million in fiscal year
2016, mainly as a consequence of:
·
a 20.0% increase in
exports and a 32.1% increase in sales to the domestic market.
Domestic consumption prices exhibited an upward trend and were
42.3% higher than in fiscal year 2015. The price of exports rose by
0.7% in US$ in fiscal year 2016 compared to
2015,
·
a 24.4% decrease in
sales of by-products,
·
a small 3.3%
reduction in slaughtering volumes, from 6,632 head per month in
fiscal year 2015 to 6,415 during fiscal year
2016.
Others segments
Total revenues from
Others segments rose by 39.8%, up from Ps. 128 million in
fiscal year 2015 to Ps. 179 million in fiscal year 2016,
mainly as a consequence of:
·
an increase of
Ps. 13 million in sales on consignment,
and
·
an increase of
Ps. 26 million in commodity brokerage
services.
Urban
Properties and Investments Business
|
|
|
Fiscal
year ended June 30, 2016
|
|||||||
|
Revenues
|
|
Statement
of Income
|
Interests
in joint ventures
|
Inter-segment
eliminations
|
Maintenance
Fee and Common Advertising Funds
|
Segment
reporting
|
|||
|
|
|
(in
million of Ps.)
|
|||||||
|
Operations
Center in Argentina
|
|
|
|
|
|
|
|||
|
Shopping
Center
|
|
3,487
|
20
|
-
|
(1,101)
|
2,406
|
|||
|
Offices and
Others
|
|
421
|
4
|
8
|
(93)
|
340
|
|||
|
Sales and
Developments
|
|
(1)
|
4
|
-
|
-
|
3
|
|||
|
Hotels
|
|
534
|
-
|
-
|
-
|
534
|
|||
|
International
|
|
-
|
-
|
-
|
-
|
-
|
|||
|
Financial
Operations and Others
|
|
1
|
-
|
-
|
-
|
1
|
|||
|
Total
Operations Center in Argentina
|
|
4,442
|
28
|
8
|
(1,194)
|
3,284
|
|||
|
|
|
|
|
|
|
|
|||
|
Operations
Center in Israel
|
|
|
|
|
|
|
|||
|
Real
Estate
|
|
1,538
|
-
|
-
|
-
|
1,538
|
|||
|
Supermarkets
|
|
18,610
|
-
|
-
|
-
|
18,610
|
|||
|
Agrochemicals
|
|
-
|
-
|
-
|
-
|
-
|
|||
|
Telecommunications
|
|
6,655
|
-
|
-
|
-
|
6,655
|
|||
|
Insurance
|
|
-
|
-
|
-
|
-
|
-
|
|||
|
Other
|
|
1,426
|
-
|
-
|
-
|
1,426
|
|||
|
Total
Operations Center in Israel
|
|
28,229
|
-
|
-
|
-
|
28,229
|
|||
|
Total
Urban Properties and Investments Business
|
|
32,671
|
28
|
8
|
(1,194)
|
31,513
|
|||
|
|
|
Fiscal
year ended June 30 2015
|
|||||||
|
Revenues
|
|
Statement
of Income
|
Interests
in joint ventures
|
Inter-segment
eliminations
|
Maintenance
Fee and Common Advertising Funds
|
Segment
reporting
|
|||
|
|
|
(in
million of Ps.)
|
|||||||
|
Operations
Center in Argentina
|
|
|
|
|
|
|
|||
|
Shopping
Centers
|
|
2,571
|
13
|
-
|
(806)
|
1,778
|
|||
|
Offices and
Others
|
|
397
|
10
|
5
|
(79)
|
333
|
|||
|
Sales and
Developments
|
|
9
|
5
|
-
|
-
|
14
|
|||
|
Hotels
|
|
396
|
-
|
-
|
-
|
396
|
|||
|
International
|
|
28
|
-
|
-
|
(2)
|
26
|
|||
|
Financial
Operations and Others
|
|
-
|
-
|
-
|
-
|
-
|
|||
|
Total
Urban Properties and Investments Business
|
|
3,401
|
28
|
5
|
(887)
|
2,547
|
|||
|
|
|
|
|
|
|
|
|
||
130
Total revenues from
the Urban Properties and Investments business increased 860.6%,
from Ps. 3,401 million in fiscal year 2015 to Ps. 32,671
million in fiscal year 2016, of which Ps. 28,229 million are
derived from the Israeli Operating Center, and Ps. 4,442 million
are derived from the Operation Center in Argentina. Considering
Operation Center in Argentina variation was due to the a
Ps. 916 million increase in the Shopping Center segment, a
Ps. 24 million increase in the Offices and Others segment, a
Ps. 138 million increase in the Hotels segment, a Ps. 1
million increase in the Financial Operations and Others segments,
offset by a Ps. 28 million decrease in the International
segment and a Ps. 10 million drop in the Sales and
Developments segment.
In turn, revenues
from our interests in joint ventures did not exhibit significant
variations when considering fiscal years 2016 and 2015. Our joint
venture Nuevo Puerto de Santa Fe S.A. posted an increase in
revenues but it was offset by a decrease in revenues posted by our
joint venture Quality S.A.
Inter-segment
revenues rose by 60.0%, up from Ps. 5 million during fiscal
year 2015 to Ps. 8 million during fiscal year 2016, both
attributed to the Offices and Others segment.
In addition,
revenues from Maintenance Fee and Common Advertising Funds rose by
34.6%, from Ps. 887 million during fiscal year 2015 (of this
amount, there are Ps. 806 million attributed to the Shopping
Centers segment) to Ps. 1,194 million during fiscal year 2016
(of this amount, there are Ps. 1,101 million attributed to the
Shopping Centers segment).
Hence, according to
business segment reporting and considering all our joint ventures,
inter-segment eliminations, and maintenance fee and common
advertising funds, revenues increased 1,137.3%, from Ps. 2,547
million in fiscal year 2015 to Ps. 31,513 million in fiscal
year 2016 (of which Ps. 28,229 million are derived from the
Operation Center in Israel and Ps. 3,284 million are derived from
the Operation Center in Argentina). Without considering the
revenues from the Operation Center in Israel, revenues, pursuant to
business segment reporting, grew by 28.9%.
Operation Center in
Argentina
Shopping Center
Revenues from the
Shopping Centers segment increased 35.3%, from Ps. 1,778
million during fiscal year 2015 to Ps. 2,406 million during
fiscal year 2016. Such variation was mostly attributable
to:
·
an increase of
Ps. 465 million in revenues from fixed and variable rentals as
a result of a 34% increase in our tenants’ sales, from
Ps. 21,509 million during fiscal year 2015 to Ps. 28,905
million during fiscal year 2016;
·
a Ps. 52
million increase in revenues from admission
fees;
·
a Ps. 41
million increase in parking revenues, and
·
a Ps. 34
million increase in revenues from commissions and
other.
Offices and Others
Revenues from the
Offices and Others segment increased 2.1%, up from Ps. 333
million in fiscal year 2015 to Ps. 340 million in fiscal year
2016. Such revenues were impacted by the partial sale of investment
properties during fiscal year 2016, which resulted in a reduction
of the segment total leasable area.
Considering
comparable properties in both fiscal years, rental revenues from
properties which did not experience a decrease in their leasable
area increased by 34.0%, up from Ps. 200 million during the
fiscal year ended on June 30, 2015 to Ps. 268 million during
the fiscal year ended on June 30, 2016, mainly due to the
depreciation of the peso while revenues from properties which
leasable area was reduced went down by 49.5%, from Ps. 111
million during fiscal year 2015 to Ps. 56 million during
fiscal year 2016.
As of year-end, the
2016 average occupancy rate of premium offices stood at 97.7% and
the average rent was around US$ 27 per sqm.
Sales and Developments
There are
significant variations in the revenues earned in this segment from
one fiscal year to the other. Without considering our joint
ventures, revenues from the Sales and Developments segment
decreased by 111.1% from Ps. 9 million during fiscal year 2015
to a loss of Ps. 1 million during fiscal year 2016. Such
reduction was mainly attributable to reduced revenues from the sale
of the Condominios I and II (Ps. 7 million). Hence, total
revenues derived from this segment fell by 78.6%, down from
Ps. 14 million during fiscal year 2015 to Ps. 3 million
during fiscal year 2016.
Hotels
Revenues from our
Hotels segment increased by 34.8% from Ps. 396 million during
fiscal year 2015 to Ps. 534 million during fiscal year 2016,
primarily attributable to a 34.4% increase in the average room rate
of our hotels (measured in Argentine Pesos).
International
Revenues from the
International segment decreased by 100% vis-à-vis the
Ps. 26 million posted during fiscal year 2015 because we sold
the Madison 183 building during fiscal year 2015.
Financial Operations and Others
Revenues from the
Financial Operations and Others segments did not exhibit
significant variations for the periods presented.
131
Operations Center in
Israel
Real Estate.
During fiscal year
2016, revenues from the Real Estate segment totaled Ps. 1,538
million.
Supermarkets.
During fiscal year
2016, revenues from the Supermarkets segment totaled Ps. 18,610
million.
Telecommunications.
During fiscal year
2016, revenues from the Telecommunications segment totaled Ps.
6,655 million.
Others.
During fiscal year
2016, revenues from the Others segment totaled Ps. 1,426
million.
COSTS
Our total costs
rose by 520.5%, from Ps. 4,052 million in fiscal year 2015 to
Ps. 25,141 million in fiscal year 2016. This was mainly as a
result of an 11.8% increase in the Agriculture business, from
Ps. 3,419 million in fiscal year 2015 to Ps. 3,821
million in fiscal year 2016, and to the 3,268.1% increase in the
Urban Properties and Investments Business, due to costs for
Ps. 20,481 from the Operation Center in Israel for the fiscal
year 2016; and a 32.5% increase in the Operation Center in
Argentina, from Ps. 633 million in fiscal year 2015 to
Ps. 839 million in fiscal year 2016.
Agricultural
Business
|
|
|
Fiscal
year ended June 30, 2016
|
|||
|
Costs
|
|
Statement
of Income
|
Interests
in joint ventures
|
Inter-segment
eliminations
|
Segment
reporting
|
|
|
|
(in
million of Ps.)
|
|||
|
Crops
|
|
(1,698)
|
(80)
|
(35)
|
(1,813)
|
|
Cattle
|
|
(255)
|
(13)
|
-
|
(268)
|
|
Dairy
|
|
(135)
|
-
|
-
|
(135)
|
|
Sugarcane
|
|
(494)
|
-
|
(17)
|
(511)
|
|
Agricultural
Production subtotal
|
|
(2,582)
|
(93)
|
(52)
|
(2,727)
|
|
Land Transformation
and Sales
|
|
(9)
|
-
|
-
|
(9)
|
|
Agro-industrial
|
|
(836)
|
-
|
(89)
|
(925)
|
|
Others
segments
|
|
(140)
|
-
|
-
|
(140)
|
|
Agricultural rental
and Services
|
|
(20)
|
-
|
-
|
(20)
|
|
Subtotal
Others
|
|
(996)
|
-
|
(89)
|
(1,085)
|
|
Total
Agricultural Business
|
|
(3,587)
|
(93)
|
(141)
|
(3,821)
|
|
|
|
Fiscal
Year ended June 30, 2015
|
|||
|
Costs
|
|
Statement
of Income
|
Interests
in joint ventures
|
Inter-segment
eliminations
|
Segment
reporting
|
|
|
|
(in
million of Ps.)
|
|||
|
Crops
|
|
(1,744)
|
(42)
|
(33)
|
(1,819)
|
|
Cattle
|
|
(220)
|
(5)
|
-
|
(225)
|
|
Dairy
|
|
(133)
|
-
|
-
|
(133)
|
|
Sugarcane
|
|
(368)
|
-
|
-
|
(368)
|
|
Agricultural
Production subtotal
|
|
(2,465)
|
(47)
|
(33)
|
(2,545)
|
|
Land Transformation
and Sales
|
|
(9)
|
-
|
-
|
(9)
|
|
Agro-industrial
|
|
(654)
|
-
|
(85)
|
(739)
|
|
Others
segments
|
|
(105)
|
-
|
-
|
(105)
|
|
Agricultural rental
and Services
|
|
(21)
|
-
|
-
|
(21)
|
|
Subtotal
Others
|
|
(780)
|
-
|
(85)
|
(865)
|
|
Total
Agricultural Business
|
|
(3,254)
|
(47)
|
(118)
|
(3,419)
|
Total costs
increased by 10.2%, from Ps. 3,254 million in fiscal year 2015
to Ps. 3,587 million in fiscal year 2016.This was primarily
attributable to the following increases:
·
Ps. 35 million
in the Cattle segment,
·
Ps. 2 million
in the Dairy segment,
132
·
Ps. 126
million in the Sugarcane segment,
·
Ps. 182
million in the Agro-industrial segment,
·
Ps. 35 million
in the segment Other; offset by a Ps. 46 million reduction in
the Crops segment, and Ps. 1 million in the Agricultural
Rental and Services segment.
In turn, the cost
of our joint ventures experienced a net increase of Ps. 46
million, from 47 million in fiscal year 2015 up to Ps. 93
million in fiscal year 2016, mainly as a result of a Ps. 38
million increase in the costs of Cresca’s Crops, from
Ps. 42 million in fiscal year 2015 to Ps. 80 million in
fiscal year 2016.
Similarly,
inter-segment costs rose by Ps. 23 million, up from
Ps. 118 million in fiscal year 2015 to Ps. 141 million in
fiscal year 2016, primarily attributable to the cost of Cattle
sales during the year to our subsidiary Sociedad Anónima
Carnes Pampeanas which was reclassified from the Cattle segment to
the Agro-industrial segment and to the leases of cropland between
our subsidiary Brasilagro and its subsidiaries, which are
reclassified from the Crops and Sugarcane segments to the
Agricultural Rental and Services segment.
Hence, according to
business segment reporting and considering all our joint ventures,
and the Inter-segment eliminations, costs grew by 11.8%, from
Ps. 3,419 million in fiscal year 2015 to Ps. 3,821
million in fiscal year 2016.
Crops
Total costs from
the Crops segment decreased by 0.4%, from Ps. 1,819 million in
fiscal year 2015 to Ps. 1,813 million in fiscal year 2016. The
costs from the Crops segment have been broken down in the following
table:
|
|
|
|
|
|
Fiscal
year 2016
|
Fiscal
year 2015
|
|
|
In
million Pesos
|
|
|
Cost of
sales
|
952
|
873
|
|
Cost of
production
|
861
|
946
|
|
Total
Costs
|
1,813
|
1,819
|
Costs of sales in
the Crops segment increased by 9.0%, from Ps. 873 million in
fiscal year 2015 to Ps. 952 million in fiscal year 2016,
mainly as a consequence of:
·
a 3.4% decrease in
the volume of tons sold as compared to the previous fiscal year;
and
·
slightly offset by
a 12.8% increase in the average cost per ton of grain sold in
fiscal year 2016, up from Ps. 1,631 in fiscal year 2015 to
Ps. 1,840 in fiscal year 2016, due to a higher market price in
Crops.
The cost of sales
as a percentage of sales was 88.5% in fiscal year 2015 and 82.6% in
fiscal year 2016.
The cost of
production in the Crops segment fell by 9.0% from Ps. 946
million in fiscal year 2015 to Ps. 861 million in fiscal year
2016, mainly as a consequence of:
·
an 11.0% reduction
in direct production costs during this fiscal year compared to the
previous fiscal year, primarily attributable to the smaller
quantity of hectares sown in the 2015-2016 season (a 47.1% decrease
compared to the previous season);
·
a smaller volume of
production in fiscal year 2016 compared to the fiscal year
2015;
·
a larger number of
hectares in operation in own farms in fiscal year 2016 compared to
the fiscal year 2015.
Total direct
production costs per ton increased by 45.4%, from Ps. 1,899
per ton in fiscal year 2015 to Ps. 2,760 per ton in fiscal
year 2016, mainly as a result of decreased yields and higher
production costs in fiscal year 2016 compared to the fiscal year
2015.
Cattle
Total costs in the
Cattle segment rose by 19.1%, from Ps. 225 million in fiscal
year 2015 to Ps. 268 million in fiscal year 2016. The
following table shows the costs in the Cattle segment:
|
|
Fiscal
year 2016
|
Fiscal
year 2015
|
|
|
In
million Pesos
|
|
|
Cost of
sales
|
136
|
122
|
|
Cost of
production
|
132
|
103
|
|
Total
Costs
|
268
|
225
|
Cost of sales
increased 11.5%, from Ps. 122 million in fiscal year 2015 to
Ps. 136 million in fiscal year 2016, mainly as a consequence
of:
·
an increase in the
cost per kilogram sold in fiscal year 2016 (19.5%);
and
·
a 6.2% decrease in
beef sales volumes in fiscal year 2016.
Costs of production
in the Cattle segment rose by 28.2%, from Ps. 103 million in
fiscal year 2015 to Ps. 132 million in fiscal year 2016. The
higher cost of production from the Cattle segment in fiscal year
2016 was mainly attributable to:
·
smaller payroll
expenses;
·
higher feeding
costs (34.6% compared to fiscal year 2015) resulting from a higher
quantity of head in the feedlot, and an 8% increase in the average
cost of feedstuff.
133
Dairy
Total Costs in the
Dairy segment rose by 1.5%, from Ps. 133 million in fiscal
year 2015 to Ps. 135 million in fiscal year 2016. The
following table contains a breakdown of costs in the Dairy
segment:
|
|
Fiscal
year 2016
|
Fiscal
year 2015
|
|
|
In
million Pesos
|
|
|
Cost of
sales
|
61
|
68
|
|
Cost of
production
|
74
|
65
|
|
Total
Costs
|
135
|
133
|
Cost of sales in
the Dairy segment fell by 10.3%, from Ps. 68 million in fiscal
year 2015 to Ps. 61 million in fiscal year 2016, mainly as a
consequence of:
·
a 42.3% increase in
the cost of sales of milking cows, from Ps. 10.9 per kg in
fiscal year 2015 to Ps. 15.5 per kg in fiscal year
2016,
·
offset by an 8.6%
decrease in the cost of Milk, from Ps. 3.5 per liter in fiscal
year 2015 to Ps. 3.2 per liter in fiscal year
2016,
·
a 17.7% reduction
in the sales volume of milking cows;
·
an 8.2% decrease in
milk sales volume.
Costs of production
in the Dairy segment increased by 14.7%, from Ps. 65 million
in fiscal year 2015 to Ps. 74 million in fiscal year 2016.
This increase was primarily attributable to the impact of increased
feeding, health and prairie costs.
Sugarcane
Total Costs in the
Sugarcane segment rose by 38.9%, from Ps. 368 million in
fiscal year 2015 to Ps. 511 million in fiscal year 2016. The
following table contains a breakdown of costs in the Sugarcane
segment:
|
|
Fiscal
year 2016
|
Fiscal
year 2015
|
|
|
In
million Pesos
|
|
|
Cost of
sales
|
263
|
188
|
|
Cost of
production
|
248
|
180
|
|
Total
Costs
|
511
|
368
|
Costs of sales in
the Sugarcane segment rose by 39.9%, de Ps. 188 million in
fiscal year 2015 to Ps. 263 million in fiscal year 2016,
mainly as a consequence of:
·
an increase of
295,226 tons of sugarcane sold in fiscal year 2016 compared to the
previous fiscal year, primarily attributable to our subsidiary
Brasilagro; and
·
an increase in the
average cost per ton of sugarcane sold in fiscal year 2016, from
Ps. 204 per ton in fiscal year 2015 to Ps. 216 per ton in
fiscal year 2016.
Costs of sales as a
percentage of sales was 94.9% in fiscal year 2015 and 89.5% in
fiscal year 2016.
The cost of
production of the Sugarcane segment increased 37.8%, from
Ps. 180 million in fiscal year 2015 to Ps. 248 million in
fiscal year 2016, mainly as a result of a higher production volume
in fiscal year 2016 compared to the fiscal year 2015.
Total production
costs per ton increased by 4.1%, from Ps. 194 per ton in
fiscal year 2015 to Ps. 202 per ton in fiscal year
2016.
Agricultural Rental and Services
Total Costs in the
Agricultural Rental and Services segment shrank by 4.8%, from
Ps. 21 million in fiscal year 2015 to Ps. 20 million in
fiscal year 2016, mainly as a consequence of:
·
a Ps. 2
million (42.3%) reduction in irrigation service costs, compared to
Fiscal year 2015.
·
Partially offset by
an increase of Ps. 1 million in feedlot lease and services
costs, in Brasilagro and Cresud, respectively.
134
Land Transformation and Sales
Total Costs in the
Land Transformation and Sales segment remained stable at Ps. 9
million in both fiscal years.
Agro-industrial
Total Costs in the
Agro-industrial segment rose by 25.2%, from Ps. 739 million in
fiscal year 2015 to Ps. 925 million in fiscal year 2016, due
to an inflationary context that hindered the increase in gross
marginal contribution. The reason for this increase is to be found
in the increase of costs to acquire Cattle and to a lesser extent
in the increase in labor.
Others segments
Total Costs in the
Others segments rose by 33.3%, from Ps. 105 million in fiscal
year 2015 to Ps. 140 million in fiscal year 2016, primarily as
a result of increased costs in the brokerage business related to
commodity trading transactions through FyO, and increased costs for
consignment, by 71.4% and 97.2%, respectively.
Urban
Properties and Investments Business
|
|
|
Fiscal
year ended June 30 2016
|
|||||||
|
Costs
|
|
Statement
of Income
|
Interests
in joint ventures
|
Inter-segment
eliminations
|
Maintenance
Fee and Common Advertising Funds
|
Segment
reporting
|
|||
|
|
|
(in
million of Ps.)
|
|||||||
|
Operations
Center in Argentina
|
|
|
|
|
|
|
|||
|
Shopping
Centers
|
|
(1,505)
|
(5)
|
(6)
|
1,113
|
(403)
|
|||
|
Offices and
Others
|
|
(139)
|
(8)
|
-
|
94
|
(53)
|
|||
|
Sales and
Developments
|
|
(15)
|
(5)
|
-
|
-
|
(20)
|
|||
|
Hotels
|
|
(362)
|
-
|
-
|
-
|
(362)
|
|||
|
International
|
|
-
|
-
|
-
|
-
|
-
|
|||
|
Financial
Operations and Others
|
|
(1)
|
-
|
-
|
-
|
(1)
|
|||
|
Total
Operations Center in Argentina
|
|
(2,022)
|
(18)
|
(6)
|
1,207
|
(839)
|
|||
|
|
|
|
|
|
|
|
|||
|
Operations
Center in Israel
|
|
|
|
|
|
|
|||
|
Real
Estate
|
|
(837)
|
-
|
-
|
-
|
(837)
|
|||
|
Supermarkets
|
|
(13,925)
|
-
|
-
|
-
|
(13,925)
|
|||
|
Agrochemicals
|
|
-
|
-
|
-
|
-
|
-
|
|||
|
Telecommunications
|
|
(4,525)
|
-
|
-
|
-
|
(4,525)
|
|||
|
Insurance
|
|
-
|
-
|
-
|
-
|
-
|
|||
|
Other
|
|
(1,194)
|
-
|
-
|
-
|
(1,194)
|
|||
|
Total
Operations Center in Israel
|
|
(20,481)
|
-
|
-
|
-
|
(20,481)
|
|||
|
Total
Urban Properties and Investments Business
|
|
(22,503)
|
(18)
|
(6)
|
1,207
|
(21,320)
|
|||
|
|
|
Fiscal
year ended June 30 2015
|
|||||||
|
Costs
|
|
Statement
of Income
|
Interests
in joint ventures
|
Inter-segment
eliminations
|
Maintenance
Fee and Common Advertising Funds
|
Segment
reporting
|
|||
|
|
|
(in
million of Ps.)
|
|||||||
|
Operations
Center in Argentina
|
|
|
|
|
|
|
|||
|
Shopping
Centers
|
|
(1,103)
|
(4)
|
(4)
|
820
|
(291)
|
|||
|
Offices and
Others
|
|
(110)
|
(5)
|
-
|
79
|
(36)
|
|||
|
Sales and
Developments
|
|
(14)
|
(5)
|
-
|
-
|
(19)
|
|||
|
Hotels
|
|
(279)
|
-
|
-
|
-
|
(279)
|
|||
|
International
|
|
(9)
|
-
|
-
|
2
|
(7)
|
|||
|
Financial
Operations and Others
|
|
(1)
|
-
|
-
|
-
|
(1)
|
|||
|
Total
Urban Properties and Investments Business
|
|
(1,516)
|
(14)
|
(4)
|
901
|
(633)
|
|||
Costs of sales in
our Urban Properties and Investments Business rose by 1,384.4%,
from Ps. 1,516 million in fiscal year 2015 to Ps. 22,503
million in fiscal year 2016, of which Ps. 20,481 million are
derived from the Operation Center in Israel, and Ps. 2,022 million
are derived from the Operation Center in Argentina. Considering
Operation Center in Argentina variation was due to an increase of
Ps. 402 million in the Shopping Center segment, an increase of
Ps. 29 million in the Offices and Others segment, a Ps. 1
million increase in the Sales and Developments segment, an increase
of Ps. 83 million in the Hotels segment, offset by a
Ps. 9 million decrease in the International segment; whilst
the Financial Operations and Others segments did not experience
significant variations.
135
In turn, the costs
corresponding to maintenance fees and Common Advertising Funds
costs increased 34.0%, from Ps. 901 million in fiscal year
2015 to Ps. 1,207 million in fiscal year 2016 mainly due to
the maintenance fees and Common Advertising Funds expenses afforded
by the Shopping Center, which rose by 35.7%, from Ps. 827
million during fiscal year 2015 to Ps. 1,113 million during
fiscal year 2016, as a consequence of: (i) an increase in
advertising expenses of Ps. 112 million, (ii) an increased
charge for salaries and wages, social security contributions and
other payroll expenses amounting to Ps. 103 million; (iii) an
increase in maintenance, security, cleaning, repair and similar
expenses amounting to Ps. 101 million (mainly stemming from
increases in security and cleaning services and in the rates for
public utilities), (iv) an increase in taxes, rates and
contributions and other expenses amounting to Ps. 25 million
and (v) an increase in other expenses for Ps. 42 million
(primarily due to the absorption of the deficit in Common
Advertising Funds and common maintenance fees). In addition, the
variation was due to: II) an increase in the Common maintenance
fees expenses incurred by the Offices and Others segment, which
rose by Ps. 54 million, up from Ps. 28 million during
fiscal year 2015 to Ps. 82 million during fiscal year 2016,
primarily attributable to the acquisition of new buildings
(maintenance, cleaning and lease expenses and common maintenance
fees and other for Ps. 36 million, expenses associated to
salaries and wages and social security contributions for
Ps. 11 million and taxes, rates and contributions and
utilities for Ps. 9 million).
In addition, costs
from our joint ventures experienced a net decrease of 28.6%, down
from Ps. 14 million during fiscal year 2015 to Ps. 18
million during fiscal year 2016.
Finally, costs from
inter-segment operations rose by 50.0%, up from Ps. 4 million
during fiscal year 2015 to Ps. 6 million during fiscal year
2016.
Hence, according to
the business segment information relayed in the framework of
segment reporting and considering all our joint ventures, and the
Inter-segment eliminations, costs rose by 3268.1%, up from
Ps. 633 million in fiscal year 2015 to Ps. 21,320 million
in fiscal year 2016 (of which Ps. 20,481 million are attributable
to the Operation Center in Israel and Ps. 839 million to the
Operation Center in Argentina). Without considering the costs from
the Operation Center in Israel, costs rose by 32.5%.
Operation Center in
Argentina
Shopping Centers
Costs in the
Shopping Centers segment rose by 38.5%, from Ps. 291 million
during fiscal year 2015 to Ps. 403 million during fiscal year
2016.
The reasons for
this increase are to be found mainly in: (i) an increased charge
for depreciations and amortizations in the amount of Ps. 56
million; (ii) an increased cost corresponding to rentals and common
maintenance fees in the amount of Ps. 30 million; (iii) an
increase in maintenance, security, cleaning, repair and similar
expenses for Ps. 10 million (mainly stemming from increases in
security and cleaning services and in the rates for public
utilities); and (iv) an increase of salaries and wages, social
security contributions and other payroll expenses in the amount of
Ps.10 million, amongst other items.
Costs in the
Shopping Centers segment, measured as a percentage of the revenues
derived from this segment rose from 16.4% during fiscal year 2015
to 16.7% in the fiscal year ended on June 30, 2016.
Offices and Others
Total Costs in the
Offices and Others segment rose by 47.2%, from Ps. 36 million
during fiscal year 2015 to Ps. 53 million during fiscal year
2016. (i) an increase in maintenance, security, cleaning, repair
and similar expenses in the amount of Ps. 7 million; (ii) an
increased cost corresponding to rentals and common maintenance fees
for Ps. 6 million and; (iii) an increased charge for
depreciations and amortizations in the amount of Ps. 5
million. This variation is affected by the partial sales of
investment properties for rental that took place during fiscal year
2016.
Costs attributable
to non-comparable properties rose by 4.0%, from Ps. 9 million
to Ps. 10 million. In turn, the costs that consider comparable
properties in both fiscal years for failure to submit partial sales
rose by 76.8%, from Ps. 24 million to Ps. 42 million,
primarily attributable to increased maintenance costs.
Total Costs in the
Offices and Others segment, measured as a percentage of the
revenues derived from this segment, rose from 10.8% during fiscal
year 2015 to 15.6% during fiscal year 2016.
Sales and Developments
Costs attributable
to this segment often vary significantly period over period, given
that some of the sales consummated by us are non-recurrent. Without
considering our joint ventures, costs associated to our Sales and
Developments segment rose by 7.1%, from Ps. 14 million during
fiscal year 2015 to Ps. 15 million during fiscal year
2016.
Costs in the Sales
and Developments segment, measured as a percentage of the revenues
derived from this segment, rose from 135.7% during fiscal year 2015
to 666.7% during fiscal year 2016.
Hotels
Costs in the Hotels
segment increased by 29.7%, from Ps. 279 million during fiscal
year 2015 to Ps. 362 million during fiscal year 2016, mainly
as a consequence of:
·
an increase of
Ps. 52 million in salaries and wages, social security
contributions and other payroll expenses;
·
an increase of
Ps. 19 million in maintenance and repair expenses
and;
·
increased charges
for Ps. 7 million and Ps. 5 million as fees for services
and as food, beverages and other hotel expenses,
respectively.
Costs in the Hotels
segment, measured as a percentage of the revenues derived from this
segment decreased from 70.5% during fiscal year 2015 to 67.8%
during fiscal year 2016.
International
Costs in the
International segment shrank by 100%, compared to the Ps. 7
million posted during fiscal year 2015 on account of the sale
consummated in the year 2015 of the Madison 183 building which was
previously held as a rental property.
Costs in the
Financial Transaction and Others segments, measured as a percentage
of the revenues derived from this segment do not exhibit
significant percentage figures.
136
Financial Operations and Others
Costs in the
Financial Operations and Others segments remained stable at
Ps. 1 million in both fiscal years.
Costs in the
Financial Operations and Others, measured as a percentage of the
revenues derived from this segment do not exhibit significant
percentage figures.
Operations Center in
Israel
Real Estate.
During fiscal year
2016, costs from the Real Estate segment totaled Ps. 837 million.
Costs, as a percentage of the revenues, amounted to
54.4%.
Supermarkets.
During fiscal year
2016, costs from the Supermarkets segment totaled Ps. 13,925
million. Costs, as a percentage of the revenues, amounted to
74.8%.
Telecommunications.
During fiscal year
2016, costs from the Telecommunications segment totaled Ps. 4,525
million. Costs, as a percentage of the revenues derived from this
segment, amounted to 68.0%.
Others.
During fiscal year
2016, costs from the Others segment totaled Ps. 1,194 million.
Costs, as a percentage of the revenues derived from this segment,
amounted to 83.7%.
Initial
recognition and changes in the fair value of biological assets and
agricultural products at the point of harvest
|
|
|
Fiscal
year ended June 30, 2016
|
|||
|
Initial
recognition and changes in the fair value of biological assets and
agricultural products at the point of harvest
|
|
Statement
of Income
|
Interests
in joint ventures
|
Inter-segment
eliminations
|
Segment
reporting
|
|
|
|
(in
million of Ps.)
|
|||
|
Crops
|
|
1,017
|
54
|
-
|
1,071
|
|
Cattle
|
|
251
|
3
|
-
|
254
|
|
Dairy
|
|
74
|
-
|
-
|
74
|
|
Sugarcane
|
|
318
|
-
|
-
|
318
|
|
Agricultural
Production Subtotal
|
|
1,660
|
57
|
-
|
1,717
|
|
Land Transformation
and Sales
|
|
-
|
-
|
-
|
-
|
|
Agro-industrial
|
|
-
|
-
|
-
|
-
|
|
Others
segments
|
|
-
|
-
|
-
|
-
|
|
Agricultural rental
and Services
|
|
-
|
-
|
-
|
-
|
|
Subtotal
Others
|
|
-
|
-
|
-
|
-
|
|
Total
Agricultural Business
|
|
1,660
|
57
|
-
|
1,717
|
|
|
|
Fiscal
Year ended June 30, 2015
|
|||
|
Initial
recognition and changes in the fair value of biological assets and
agricultural products at the point of harvest
|
|
Statement
of Income
|
Interests
in joint ventures
|
Inter-segment
eliminations
|
Segment
reporting
|
|
|
|
(in
million of Ps.)
|
|||
|
Crops
|
|
897
|
21
|
-
|
918
|
|
Cattle
|
|
165
|
2
|
-
|
167
|
|
Dairy
|
|
75
|
-
|
-
|
75
|
|
Sugarcane
|
|
187
|
-
|
-
|
187
|
|
Agricultural
Production Subtotal
|
|
1,324
|
23
|
-
|
1,347
|
|
Land Transformation
and Sales
|
|
-
|
-
|
-
|
-
|
|
Agro-industrial
|
|
-
|
-
|
-
|
-
|
|
Others
segments
|
|
-
|
-
|
-
|
-
|
|
Agricultural rental
and Services
|
|
-
|
-
|
-
|
-
|
|
Subtotal
Others
|
|
-
|
-
|
-
|
-
|
|
Total
Agricultural Business
|
|
1,324
|
23
|
-
|
1,347
|
137
Our revenues from
Initial recognition and changes in the fair value of biological
assets and agricultural products at the point of harvest increased
25.4%, from Ps. 1,324 million in fiscal year 2015 to
Ps. 1,660 million in fiscal year 2016.
In turn, our
revenues from Initial recognition and changes in the fair value of
biological assets and agricultural products at the point of harvest
derived from our interests in joint ventures increased 147.8% from
Ps. 23 million in fiscal year 2015 to Ps. 57 million in
fiscal year 2016.
In addition, there
were no inter-segment eliminations in connection with revenues from
Initial recognition and changes in the fair value of biological
assets and agricultural products at the point of
harvest.
Hence, according to
business segment reporting and considering all our joint ventures,
revenues from Initial recognition and changes in the fair value of
biological assets and agricultural products at the point of harvest
grew by 27.5%, from Ps. 1,347 million in fiscal year 2015 to
Ps. 1,717 million in fiscal year 2016.
Crops
Income from
production in the Crops segment rose by 16.7%, from Ps. 918
million in fiscal year 2015 to Ps. 1,071 million in fiscal
year 2016, mainly as a consequence of:
·
a 38.8% decrease in
total production, from 405,882 tons in fiscal year 2015 down to
248,435 tons in fiscal year 2016;
·
partially offset by
a 33.8% increase in the average Price for the production of Crops;
and
·
a 654.1% increase
in the expected revenues.
As of June 30,
2016, the harvested area was 97.1% of our total sown area, compared
to 100% as of June 30, 2015.
The following table
shows the number of tons produced and total production income as of
June 30, 2016 and 2015:
Revenues from the production of Crops
(in tons and million Pesos)
|
|
Fiscal
year ended June 30,
|
|||
|
|
2016
|
2015
|
||
|
|
Tons
|
Pesos
|
Tons
|
Pesos
|
|
Corn
|
55,475
|
82
|
92,093
|
84
|
|
Soybean
|
169,592
|
520
|
279,356
|
625
|
|
Wheat
|
16,181
|
11
|
16,211
|
13
|
|
Sorghum
|
829
|
1
|
1,202
|
1
|
|
Sunflower
|
3,056
|
9
|
11,720
|
27
|
|
Other
|
3,302
|
8
|
5,300
|
20
|
|
Total
|
248,435
|
631
|
405,882
|
770
|
Estimated results
from the valuation of our crops in progress at fair value rose by
654.1%, from Ps. 49 million in fiscal year 2015 to
Ps. 369 million in fiscal year 2016, due to the 722.4%
increase in corn crops.
Cattle
Income from
production in the Cattle segment rose by 52.1%, from Ps. 167
million in fiscal year 2015 to Ps. 254 million in fiscal year
2016, mainly as a consequence of:
·
a 19.3% increase in
the average price per kilogram produced, from Ps. 14.8 per
kilogram in fiscal year 2015 to Ps. 17.6 per kilogram in
fiscal year 2016;
·
a slight 1.6%
decrease in beef production, from 7,905 tons in fiscal year 2015 to
7,781 tons in fiscal year 2016;
·
offset by a 137.2%
increase in holding results.
The calving rate
decreased by 12.1%, whereas the death rate decreased by 4.4% during
fiscal year 2016 compared to fiscal year 2015.
The number of
hectares devoted to Cattle production decreased from 88,643
hectares in fiscal year 2015 to 85,392 hectares in fiscal year
2016, due to a smaller number of leased land devoted to Cattle
production.
Dairy
Income from
production in the Dairy segment decreased by 1.3%, from Ps. 75
million in fiscal year 2015 to Ps. 74 million in fiscal year
2016. This decrease was mainly due to:
·
the result from
holding of milking cows, which increased by 46.9%, up from a gain
of Ps. 8.9 million in fiscal year 2015 to a gain of
Ps. 13.1 million in fiscal year 2016, as the inflationary
context led to a significant rise in prices;
138
·
a 7.8% decrease in
the average price of milk, from Ps. 3.42 per liter in fiscal
year 2015 to Ps. 3.15 per liter in fiscal year
2016;
·
a 6.2% decrease in
the production of milking cows offset by a 78.6% increase in
average price,
·
a 7.1% decrease in
the milk production volume, from 17.5 million of liters in fiscal
year 2015 to 16.3 million of liters during this fiscal year. This
reduction in production volume was mainly due to a lower average
number of milking cows per day, from 2,189 milking cows per day in
fiscal year 2015 to 1,788 milking cows per day in fiscal year 2016,
partially offset by a 10.8% increase in the efficiency level of
average daily milk production per cow, from 21.5 liters per cow in
fiscal year 2015 to 23.8 liters per cow in fiscal year
2016.
Sugarcane
Income from
production in the Sugarcane segment rose by 70.1%, from
Ps. 187 million in fiscal year 2015 to Ps. 318 million in
fiscal year 2016, mainly as a consequence of:
·
a 32.4% increase in
total production volume from 928,273 tons in fiscal year 2015 to
1,228,830 tons in fiscal year 2016; and
·
a 19.0% increase in
the average production price of sugarcane.
The 32.4% increase
in the production volume from the Sugarcane segment was
attributable to a 19.0% increase in the average price of
production, which went from Ps. 199.5 per ton up to
Ps. 237.4 per ton in fiscal year 2016.
The following table
shows the actual tons produced and income as of June 30, 2016 and
2015:
Revenues from the production of
Sugarcane
(In tons and million Pesos)
|
|
Fiscal
year ended June 30,
|
|||
|
|
2016
|
2015
|
||
|
|
Tons
|
Pesos
|
Tons
|
Pesos
|
|
Sugarcane
|
1,228,830
|
292
|
928,273
|
185
|
Estimated
results from the valuation of our sugarcane crops in progress at
fair value
Estimated results
from the valuation of our sugarcane crops in progress at fair value
increased significantly from a gain of Ps. 2 million in fiscal
year 2015 to Ps. 27 million in fiscal year 2016 mainly
generated by Brasilagro. This variation originated mainly in
Brazil, and was caused by the following factors:
·
the number of
estimated hectares went up from a year-on-year increase of 33.4% in
fiscal year 2015 to a year-on-year increase of 0.4% in fiscal year
2016;
·
the estimated
yields went up from a year-on-year increase of 2.4% in the fiscal
year 2015 to a year-on-year increase of 3.2% for the fiscal year
2016; and
·
the estimated unit
costs went down from a year-on-year increase of 10.0% in fiscal
year 2015 to a year-on-year increase of 6.4% in fiscal year
2016.
Changes
in the net realizable value of agricultural products after
harvest
|
|
|
Fiscal
year ended June 30, 2016
|
|||
|
Changes
in the net realizable value of agricultural products after
harvest
|
|
Statement
of Income
|
Interests
in joint ventures
|
Inter-segment
eliminations
|
Segment
reporting
|
|
|
|
(in
million of Ps.)
|
|||
|
Crops
|
|
208
|
-
|
-
|
208
|
|
Cattle
|
|
-
|
-
|
-
|
-
|
|
Dairy
|
|
-
|
-
|
-
|
-
|
|
Sugarcane
|
|
-
|
-
|
-
|
-
|
|
Agricultural
Production Subtotal
|
|
208
|
-
|
-
|
208
|
|
Land Transformation
and Sales
|
|
-
|
-
|
-
|
-
|
|
Agro-industrial
|
|
-
|
-
|
-
|
-
|
|
Others
segments
|
|
-
|
-
|
-
|
-
|
|
Agricultural rental
and Services
|
|
-
|
-
|
-
|
-
|
|
Subtotal
Others
|
|
-
|
-
|
-
|
-
|
|
Total
Agricultural Business
|
|
208
|
-
|
-
|
208
|
|
|
|
Fiscal
Year ended June 30 2015
|
|||
|
Changes
in the net realizable value of agricultural products after
harvest
|
|
Statement
of Income
|
Interests
in joint ventures
|
Inter-segment
eliminations
|
Segment
reporting
|
|
|
|
(in
million of Ps.)
|
|||
|
Crops
|
|
(34)
|
-
|
-
|
(34)
|
|
Cattle
|
|
-
|
-
|
-
|
-
|
|
Dairy
|
|
-
|
-
|
-
|
-
|
|
Sugarcane
|
|
-
|
-
|
-
|
-
|
|
Agricultural
Production Subtotal
|
|
(34)
|
-
|
-
|
(34)
|
|
Land Transformation
and Sales
|
|
-
|
-
|
-
|
-
|
|
Agro-industrial
|
|
-
|
-
|
-
|
-
|
|
Others
segments
|
|
-
|
-
|
-
|
-
|
|
Agricultural rental
and Services
|
|
-
|
-
|
-
|
-
|
|
Subtotal
Others
|
|
-
|
-
|
-
|
-
|
|
Total
Agricultural Business
|
|
(34)
|
-
|
-
|
(34)
|
139
Income from Changes
in the net realizable value of agricultural products after harvest
increased significantly, from a loss of Ps. 34 million in
fiscal year 2015 to income for Ps. 208 million in fiscal year
2016. In Argentina, it stems above all from a widespread price
increase in late December caused by the suppression/reduction of
withholdings on the agricultural industry, the major devaluation
determined by the new government and today’s current free
floating exchange rate market.
There were neither
interest in joint ventures nor inter-segment eliminations in income
from changes in the net realizable value of agricultural products
after harvest.
Gross
profit
As a result of the
above mentioned factors, our gross profit increased 408.8%, from
Ps. 2,203 million in fiscal year 2015 to Ps. 11,209
million in fiscal year 2016, which was primarily attributable
to:
·
a 251.6% increase
in the Agricultural Business, from income for Ps. 289 million
in fiscal year 2015 to income for Ps. 1,016 million in fiscal
year 2016;
·
income for
Ps. 7,748 provided by the Operation Center in Israel at the
Urban Properties and Investments Business; and
·
a 27.7% increase in
the Operation Center in Argentina at the Urban Properties and
Investments Business, from Ps. 1,914 million in fiscal year
2015 to Ps. 2,445 million in fiscal year
2016.
Agricultural
Business
As a result of the
above mentioned factors, gross profit increased by 251.6%, from
Ps. 289 million in fiscal year 2015 to Ps. 1,016 million
in fiscal year 2016.
Crops
Gross profit from
this segment increased by 1,088.5%, from Ps. 52 million in
fiscal year 2015 to Ps. 618 million in fiscal year
2016.
Cattle
Gross profit from
this segment increased by 92.9%, from Ps. 85 million in fiscal
year 2015 to Ps. 164 million in fiscal year 2016.
Dairy
Gross profit from
this segment decreased by 71.4%, from Ps. 14 million in fiscal
year 2015 to Ps. 4 million in fiscal year 2016.
Sugarcane
Gross profit from
this segment increased by 494.1%, from Ps. 17 million in
fiscal year 2015 to Ps. 101 million in fiscal year
2016.
Agricultural Rental and Services
Gross profit from
this segment increased by 45.0%, from Ps. 40 million in fiscal
year 2015 to Ps. 58 million in fiscal year 2016.
Land Transformation and Sales
Gross loss from
this segment remained stable at Ps. 9 million in both fiscal
years.
Agro-industrial
Gross profit from
this segment decreased by 38.8% from Ps. 67 million in fiscal
year 2015 to Ps. 41 million in fiscal year 2016.
Other
Gross profit from
this segment increased by 69.6%, from Ps. 23 million in fiscal
year 2015 to Ps. 39 million in fiscal year 2016.
140
Urban
Properties and Investments Business
Gross profit in
Urban Properties and Investments Business rose by 432.5% from
Ps. 1,914 million in fiscal year 2015 to Ps. 10,193
million in fiscal year 2016. This was mainly due to the income
obtained through the Operation Center in Israel for Ps. 7,748
million and a 27.7% increase in the Operation Center in Argentina,
from Ps. 1,914 million in fiscal year 2015 to Ps. 2,445
million in fiscal year 2016.
Operation Center in
Argentina
Shopping Center
Gross profit from
the Shopping Centers segment increased by 34.7% up from
Ps. 1,487 million for the fiscal year 2015 to Ps. 2,003
million during fiscal year 2016 mainly due to an increase in our
tenants’ total sales, resulting in higher lease payments as a
percentage of volume sales. Gross profit from the Shopping Centers
segment as a percentage of this segment’s revenues
experienced a slight decline from 83.6% during fiscal year 2015 to
83.3% during fiscal year 2016.
Offices and Others
Gross profit from
the Offices and Others segment fell by 3.4% from Ps. 297
million for the fiscal year 2015 down to Ps. 287 million in
fiscal year 2016. Gross profit for the Offices and Others segment
as a percentage of this segment’s revenues decreased from
89.2% during fiscal year 2015 to 84.4% during fiscal year
2016.
Sales and Developments
Gross income/(loss)
from the Sales and Developments segment rose by 240.0% from a loss
of Ps. 5 million for fiscal year 2015 to a loss of Ps. 17
million during fiscal year 2016, mainly due to lower sales
accounted for during fiscal year 2016 and an increase in
maintenance and preservation costs in connection with these
properties.
Hotels
Gross profit from
the Hotels segment increased by 47.0% up from Ps. 117 million
for the fiscal year 2015 to Ps. 172 million during fiscal year
2016. Gross profit for the Hotels segment, as a percentage of this
segment’s revenues, rose from 29.5% during fiscal year 2015
to 32.2% during fiscal year 2016.
International
Gross profit from
the International segment decreased by 100%, compared to the
Ps. 19 million posted during fiscal year 2015.
Financial Operations and Others
There were no
significant variations between the Income/(loss) from our Financial
Operations and Others segment between the periods
presented.
Operations Center in
Israel
Real Estate.
During fiscal year
2016, gross profit from the Real Estate segment totaled Ps. 701
million. Gross profit, as a percentage of the segment revenues,
amounted to 45.6%.
Supermarkets.
During fiscal year
2016, gross profit from the Supermarkets segment totaled Ps. 4,685
million. Gross profit, as a percentage of the segment revenues,
amounted to 25.2%.
Shufersal’s
results in the first half of the calendar year 2016 were affected
by the following key factors:
·
Continued increased
efficiency with respect to real estate.
·
Gradual launch of
the new logistical center in Shoham, which began operating in
February 2016.
·
Shufersal is
continuing to prepare strategies for various scenarios in
connection with the change in ownership of the Mega chain in the
city centers.
·
Continued
acceleration of the development of Shufersal’s digital
platform, which primarily included the Shufersal Online, including
the opening of designated warehouses.
·
Continued building
of its private brand.
Telecommunications.
During fiscal year
2016, gross profit from the Telecommunications segment totaled Ps.
2,130 million. Gross profit, as a percentage of the segment
revenues, amounted to 32.0%.
Others.
During fiscal year
2016, gross profit from the Others segment totaled Ps. 232 million.
Gross profit, as a percentage of the segment revenues, amounted to
16.3%.
141
Gain
from disposal of investment properties
Gain from disposal
of investment properties derived from our Sales and Developments
segment experienced a 4.3% decrease from Ps. 1,150 million
during fiscal year 2015 to Ps. 1,101 million during fiscal
year 2016 (of which Ps. 1,056 million are attributable to the
Operation Center in Argentina and Ps. 45 million to Operation
Center in Israel). Without considering the effect of the Operation
Center in Israel, total gain from the disposal of investment
properties fell by 8.2%.
Gain
from disposal of farmlands
Gain from disposal
of farmlands derived from the Land Transformation and Sales segment
decreased by 100.4%, from income for Ps. 570 million in fiscal
year 2015 to a loss of Ps. 2 million in fiscal year 2016,
primarily as a result of the absence of sales in this fiscal year
and the following transactions in the preceding fiscal
year:
During fiscal year
2015
·
On April 3, 2014,
Cresca S.A. executed a deed of sale for an area of 24,624 hectares
located in Chaco Paraguayo. The total price was US$ 14.7
million paid as follows: US$ 1.8 million was cashed upon the
execution of the deed of sale; US$ 4.3 million at the time of
the title conveyance; US$ 3.7 million on July 2015
interest-free; and US$ 4.9 million on July 2016 interest-free.
Possession was surrendered upon the execution of the title deed and
upon the creation of a mortgage as guarantee of the remaining
balance on July 14, 2014. We recorded a gain of Ps. 19.1
million as a result of this transaction.
·
On June 10, 2015,
Brasilagro sold the remaining area of 27,745 hectares of the Cremaq
farm located in the municipal district of Baixa Grande do Ribeiro
(Piaui). The transaction price was Rs. 270 million (equivalent to
Ps. 694 million) which was fully paid. We recorded a gain of
Ps. 525.9 million as a result of this
transaction.
·
On October 17,
2013, Yuchán Agropecuaria executed an agreement providing for
the sale, subject to retention of title, of a 1,643 hectare
property in the “La Fon II” farm for a total price of
US$ 7.21 million (equivalent to Ps. 59.0 million). As of
the date of issuance of these financial statements, the amount of
US$ 7.1 million was cashed, with the remaining balance of
US$ 0.12 million being payable in two installments beginning
in December this year and ending in December 2017. The agreement
provides that title conveyance will be registered once the full
price has been paid. On June 24, 2015, Yuchán Agropecuaria
surrendered the possession of the property. We recorded a gain of
US$ 2.7 million (equivalent to Ps. 24.6 million) as a
result of this transaction in the fiscal year
2015.
General
and Administrative Expenses
Our General and
Administrative Expenses rose by 260.9%, from Ps. 625 million
in fiscal year 2015 to Ps. 2,255 million in fiscal year 2016.
This was mainly due to an increase of Ps. 67 million in the
Agricultural business and an increase of Ps. 1,563 million in
the Urban Properties and Investments Business. Within the Urban
Properties and Investments Business the Variation is attributable
to the Operation Center in Israel for Ps. 1,387 and to the
Operation Center in Argentina for Ps. 176.
Agricultural
Business
|
|
|
Fiscal
year ended June 30, 2016
|
|||
|
General
and Administrative Expenses
|
|
Statement
of Income
|
Interests
in joint ventures
|
Inter-segment
eliminations
|
Segment
reporting
|
|
|
|
(in
million of Ps.)
|
|||
|
Crops
|
|
(171)
|
(3)
|
-
|
(174)
|
|
Cattle
|
|
(40)
|
-
|
-
|
(40)
|
|
Dairy
|
|
(8)
|
-
|
-
|
(8)
|
|
Sugarcane
|
|
(34)
|
-
|
-
|
(34)
|
|
Agricultural
Production Subtotal
|
|
(253)
|
(3)
|
-
|
(256)
|
|
Land Transformation
and Sales
|
|
(1)
|
-
|
-
|
(1)
|
|
Agro-industrial
|
|
(38)
|
-
|
-
|
(38)
|
|
Others
segments
|
|
(15)
|
-
|
-
|
(15)
|
|
Agricultural rental
and Services
|
|
(4)
|
-
|
-
|
(4)
|
|
Subtotal
Others
|
|
(57)
|
-
|
-
|
(57)
|
|
Total
Agricultural Business
|
|
(311)
|
(3)
|
-
|
(314)
|
|
|
|
Fiscal
Year ended June 30, 2015
|
|||
|
General
and Administrative Expenses
|
|
Statement
of Income
|
Interests
in joint ventures
|
Inter-segment
eliminations
|
Segment
reporting
|
|
|
|
(in
million of Ps.)
|
|||
|
Crops
|
|
(156)
|
(3)
|
-
|
(159)
|
|
Cattle
|
|
(26)
|
-
|
-
|
(26)
|
|
Dairy
|
|
(5)
|
-
|
-
|
(5)
|
|
Sugarcane
|
|
(20)
|
-
|
-
|
(20)
|
|
Subtotal
Agricultural production
|
|
(207)
|
(3)
|
-
|
(210)
|
|
Land Transformation
and Sales
|
|
(2)
|
-
|
-
|
(2)
|
|
Agro-industrial
|
|
(25)
|
-
|
-
|
(25)
|
|
Others
segments
|
|
(8)
|
-
|
-
|
(8)
|
|
Agricultural rental
and Services
|
|
(2)
|
-
|
-
|
(2)
|
|
Subtotal
Others
|
|
(35)
|
-
|
-
|
(35)
|
|
Total
Agricultural Business
|
|
(244)
|
(3)
|
-
|
(247)
|
142
General and
Administrative Expenses from the Agricultural business sales rose
by 27.5%, from Ps. 244 million in fiscal year 2015 to
Ps. 311 million in fiscal year 2016. This was due to the
following increases: Ps. 14 million in the Crops segment,
Ps. 15 million in the Cattle segment, Ps. 3 million in
the Dairy segment, Ps. 14 million in the Sugarcane segment,
Ps. 13 million in the Agro-industrial segment, Ps. 2
million in the Agricultural rental and Services segment and
Ps. 7 million corresponding to Others segments.
The causes for the
variation were:
·
The variation in
Cresud’s administrative expenses is mostly due to the
variation in wages, salaries and social security contributions due
to the allowance for bonuses payable for fiscal year 2016. In
addition, the reason for the variation is to be found also in the
increases exhibited by the fees of the accountants associated to
the consolidation of IDBD as well as the increase in legal fees
associated to the Class Action.
·
An increase in the
General and Administrative Expenses of the subsidiary Sociedad
Anónima Carnes Pampeanas primarily attributable to the
increases in the services hired for the project to implement the
SAP system, consultancy fees and SOX standard testing and salary
adjustments due to collective bargaining agreements;
and
·
an increase in
expenses as a result of the inflationary
context.
In turn, general
and administrative expenses from our joint ventures remained stable
at Ps. 3 million during fiscal years 2016 and
2015.
There were no
General and Administrative Expenses incurred by reason of
Inter-segment eliminations.
Hence, according to
business segment reporting and considering all our joint ventures,
General and Administrative Expenses grew by 27.1%, up from
Ps. 247 million in fiscal year 2015 to Ps. 314 million in
fiscal year 2016.
Urban
Properties and Investments Business
|
|
|
Fiscal
year ended June 30, 2016
|
|||||||
|
General
and Administrative Expenses
|
|
Statement
of Income
|
Interests
in joint ventures
|
Inter-segment
eliminations
|
Maintenance
Fee and Common Advertising Funds
|
Segment
reporting
|
|||
|
|
|
(in
million of Ps.)
|
|||||||
|
Operations
Center in Argentina
|
|
|
|
|
|
|
|||
|
Shopping
Centers
|
|
(178)
|
-
|
(1)
|
-
|
(179)
|
|||
|
Offices and
Otherss
|
|
(50)
|
-
|
-
|
-
|
(50)
|
|||
|
Sales and
Developments
|
|
(126)
|
(1)
|
(4)
|
-
|
(131)
|
|||
|
Hotels
|
|
(101)
|
-
|
(2)
|
-
|
(103)
|
|||
|
International
|
|
(91)
|
-
|
-
|
-
|
(91)
|
|||
|
Financial
Operations and Others
|
|
-
|
-
|
-
|
-
|
-
|
|||
|
Total
Operations Center in Argentina
|
|
(546)
|
(1)
|
(7)
|
-
|
(554)
|
|||
|
|
|
|
|
|
|
|
|||
|
Operations
Center in Israel
|
|
|
|
|
|
|
|||
|
Real
Estate
|
|
(100)
|
-
|
-
|
-
|
(100)
|
|||
|
Supermarkets
|
|
(203)
|
-
|
-
|
-
|
(203)
|
|||
|
Agrochemicals
|
|
-
|
-
|
-
|
-
|
-
|
|||
|
Telecommunications
|
|
(708)
|
-
|
-
|
-
|
(708)
|
|||
|
Insurance
|
|
-
|
-
|
-
|
-
|
-
|
|||
|
Other
|
|
(376)
|
-
|
-
|
-
|
(376)
|
|||
|
Total
Operations Center in Israel
|
|
(1,387)
|
-
|
-
|
-
|
(1,387)
|
|||
|
Total
Urban Properties and Investments Business
|
|
(1,933)
|
(1)
|
(7)
|
-
|
(1,941)
|
|||
|
|
|
|
|
|
|
|
|||
|
|
|
Fiscal
year ended June 30, 2015
|
|||||||
|
General
and Administrative Expenses
|
|
Statement
of Income
|
Interests
in joint ventures
|
Inter-segment
eliminations
|
Maintenance
Fee and Common Advertising Funds
|
Segment
reporting
|
|||
|
|
|
(in
million of Ps.)
|
|||||||
|
Operations
Center in Argentina
|
|
|
|
|
|
|
|||
|
Shopping
Centers
|
|
(135)
|
-
|
-
|
-
|
(135)
|
|||
|
Offices and
Others
|
|
(58)
|
-
|
(1)
|
-
|
(59)
|
|||
|
Sales and
Developments
|
|
(48)
|
(1)
|
(1)
|
-
|
(50)
|
|||
|
Hotels
|
|
(77)
|
-
|
(1)
|
-
|
(78)
|
|||
|
International
|
|
(56)
|
-
|
-
|
-
|
(56)
|
|||
|
Financial
Operations and Others
|
|
-
|
-
|
-
|
-
|
-
|
|||
|
Total
Urban Properties and Investments Business
|
|
(374)
|
(1)
|
(3)
|
-
|
(378)
|
|||
143
General and
Administrative Expenses in connection with the sales of the Urban
Properties and Investments Business segment rose by 416.8%, from
Ps. 374 million in fiscal year 2015 to Ps. 1,933 million
in fiscal year 2016, of which Ps. 1,387 million are derived from
the Operation Center in Israel, and Ps. 546 million are derived
from the Operation Center in Argentina. Considering Operation
Center in Argentina variation was due to the Ps. 43 million
increase in the Shopping Center segment, an increase of Ps. 78
million in the Sales and Developments segment, an increase of
Ps. 24 million in the Hotels segment, an increase of
Ps. 35 million in the International segment, all of which was
partially offset by a decrease of Ps. 8 million in the segment
Offices and Others.
In turn, the
administrative expenses of our joint ventures did not exhibit
variations between the fiscal years 2015 and 2016 and remained
stable at Ps. 1 million.
Inter-segment
eliminations increased Ps. 4 million, up from Ps. 3
million in fiscal year 2015 to Ps. 7 million in fiscal year
2016.
Hence, according to
business segment reporting and considering all our joint ventures
and inter-segment eliminations, administrative expenses increased
by 413.5% up from Ps. 378 million in fiscal year 2015 to
Ps. 1,941 million in fiscal year 2016 (of which Ps. 1,387
million are attributable to the Operation Center in Israel and Ps.
554 million to the Operation Center in Argentina). Without
considering the general & administrative expenses from the
Operation Center in Israel, general & administrative expenses
rose by 46.6%. Furthermore, general & administrative expenses
as a percentage of revenues, pursuant to business segment
reporting, declined from 14.8% during fiscal year 2015 to 6.2%
during fiscal year 2016. Without considering the effect of the
Israeli Operation Center in Israel, total general &
administrative expenses as a percentage of revenues experienced
increase from 14.8% during fiscal year 2015 to 16.9% during fiscal
year 2016.
Operations Center in
Argentina
Shopping Centers
Administrative
expenses in the Shopping Centers segment increased by 32.6%, up
from Ps. 135 million during fiscal year 2015 to Ps. 179
million during fiscal year 2016, mainly as a consequence
of:
·
a Ps. 18
million increase in salaries, wages, social security contributions
and other payroll expenses;
·
an increase of
Ps. 13 million in Directors’ fees;
·
an increase of
Ps. 7 million in fees and compensation for services, to name
but a few items.
Administrative
expenses in the Shopping Centers segment as a percentage of
revenues from the same segment decreased slightly from 7.7% during
fiscal year 2015 to 7.4% during fiscal year 2016.
Offices and Others
General and
Administrative Expenses in our Offices and Others segment decreased
by 15.3%, from Ps. 59 million during fiscal year 2015 to
Ps. 50 million during fiscal year 2016, primarily as a
consequence of: (i) a Ps. 12 million decrease in salaries,
wages, social security contributions and other payroll expenses;
partially offset by (ii) an increase in directors’ fees in
the amount of Ps. 6 million, amongst others
items.
When measured as a
percentage of revenues from the same segment, General and
Administrative Expenses decreased by 17.7% during fiscal year 2015
to 14.7% during fiscal year 2016.
Sales and Developments
General and
Administrative Expenses associated to our Sales and Developments
segment rose by 162.0%, from Ps. 50 million during fiscal year
2015 to Ps. 131 million during fiscal year 2016, primarily as
a consequence of: (i) an increase in salaries, wages, social
security contributions and other payroll expenses of Ps. 26
million, (ii) an increase of Ps. 24 million in fees and
compensation for services; (iii) and an increase in
directors’ fees of Ps. 21 million, amongst others
items.
Hotels
The General and
Administrative Expenses associated to our Hotels segment increased
by 32.1% from Ps. 78 million during fiscal year 2015 to
Ps. 103 million during fiscal year 2016, mainly as a
consequence of:
·
(i) an increase of
Ps. 12 million in salaries and wages, social security
contributions and others payroll expenses;
·
(ii) an increase of
Ps. 6 million in the cost of fees from services, amongst other
items.
The General and
Administrative Expenses associated to the Hotels segment measured
as a percentage of the revenues derived from this segment shrank
from 19.6% in fiscal year 2015 to 19.3% in fiscal year
2016.
International
General and
Administrative Expenses associated to our International segment
rose by Ps. 35 million, from Ps. 56 million during fiscal
year 2015 to Ps. 91 million during fiscal year 2016 primarily
attributable to fees for services incurred in connection with the
investment in IDBD.
144
Financial Operations and Others.
General and
Administrative Expenses associated to our Financial Operations and
Others segment did not exhibit variations for the periods
disclosed.
Operations Center in
Israel
Real Estate
During fiscal year
2016, general & administrative expenses associated to the Real
Estate segment totaled Ps. 100 million. General &
administrative expenses as a percentage of the segment revenues
amounted to 6.6%.
Supermarkets
During fiscal year
2016, general & administrative expenses associated to the
Supermarkets segment totaled Ps. 203 million. General &
administrative expenses as a percentage of the segment revenues
amounted to 1.1%.
Telecommunications
During fiscal year
2016, general & administrative expenses associated to the
Telecommunications segment totaled Ps. 708 million. General &
administrative expenses as a percentage of the segment revenues
amounted to 10.6%.
Others
During fiscal year
2016, general & administrative expenses associated to the
Others segment totaled Ps. 376 million. General &
administrative expenses as a percentage of the segment revenues
amounted to 26.4%.
Selling
expenses
Our total selling
expenses grew by 1,207.3%, from Ps. 481 million in fiscal year
2015 to Ps. 6,288 million in fiscal year 2016. This was
primarily attributable to an increase of Ps. 52 million in the
Agricultural business and an increase of Ps. 5,755 million in
the Urban Properties and Investments Business which accounts for
the Ps. 69 million increase in the Operation Center in
Argentina and the Ps. 5,686 million increase in the Operation
Center in Israel.
Agricultural
Business
|
|
|
Fiscal
year ended June 30, 2016
|
|||
|
Selling
expenses
|
|
Statement
of Income
|
Interests
in joint ventures
|
Inter-segment
eliminations
|
Segment
reporting
|
|
|
|
(in
million of Ps.)
|
|||
|
Crops
|
|
(209)
|
(5)
|
(2)
|
(216)
|
|
Cattle
|
|
(19)
|
-
|
-
|
(19)
|
|
Dairy
|
|
(4)
|
-
|
-
|
(4)
|
|
Sugarcane
|
|
(8)
|
-
|
-
|
(8)
|
|
Agricultural
Production Subtotal
|
|
(240)
|
(5)
|
(2)
|
(247)
|
|
Land Transformation
and Sales
|
|
-
|
-
|
-
|
-
|
|
Agro-industrial
|
|
(67)
|
-
|
-
|
(67)
|
|
Others
segments
|
|
(23)
|
-
|
-
|
(23)
|
|
Agricultural Rental
and Services
|
|
(1)
|
-
|
-
|
(1)
|
|
Subtotal
Others
|
|
(91)
|
-
|
-
|
(91)
|
|
Total
Agricultural Business
|
|
(331)
|
(5)
|
(2)
|
(338)
|
|
|
|
Fiscal
Year ended June 30, 2015
|
|||
|
Selling
expenses
|
|
Statement
of Income
|
Interests
in joint ventures
|
Inter-segment
eliminations
|
Segment
reporting
|
|
|
|
(in
million of Ps.)
|
|||
|
Crops
|
|
(157)
|
(3)
|
(1)
|
(161)
|
|
Cattle
|
|
(20)
|
-
|
-
|
(20)
|
|
Dairy
|
|
(4)
|
-
|
-
|
(4)
|
|
Sugarcane
|
|
(8)
|
-
|
-
|
(8)
|
|
Agricultural
Production Subtotal
|
|
(189)
|
(3)
|
(1)
|
(193)
|
|
Land Transformation
and Sales
|
|
(1)
|
(1)
|
-
|
(2)
|
|
Agro-industrial
|
|
(77)
|
-
|
-
|
(77)
|
|
Others
segments
|
|
(13)
|
-
|
-
|
(13)
|
|
Agricultural Rental
and Services
|
|
(1)
|
-
|
-
|
(1)
|
|
Subtotal
Others
|
|
(91)
|
-
|
-
|
(91)
|
|
Total
Agricultural Business
|
|
(281)
|
(4)
|
(1)
|
(286)
|
145
The Selling
expenses associated to the sales of the Agricultural business rose
by 17.8%, from Ps. 281 million in fiscal year 2015 to
Ps. 331 million in fiscal year 2016. This was primarily due to
the Ps. 52 million increase in the Crops segment and the
Ps. 10 million increase in the Others segments, partially
offset by a reduction of Ps. 1 million in the Cattle segment,
and the Ps. 10 million decrease in the Agro-industrial
segment.
In turn, selling
expenses from our interests in joint ventures rose by 25% from
Ps. 4 million in fiscal year 2015 to Ps. 5 million in
fiscal year 2016, in connection with our Cresca joint
venture.
Besides,
Inter-segment eliminations rose Ps. 1 million in the fiscal
year 2016 compared to the figure posted for 2015.
Hence, according to
the business segment details reported by segment and considering
all our joint ventures and the Inter-segment eliminations, Selling
expenses grew by 18.2%, up from Ps. 286 million in fiscal year
2015 to Ps. 338 million in fiscal year 2016.
Urban
Properties and Investments Business
|
|
|
Fiscal
year ended June 30, 2016
|
|
|||||||
|
Selling
expenses
|
|
Statement
of Income
|
Interests
in joint ventures
|
Inter-segment
eliminations
|
Segment
reporting
|
|
||||
|
|
|
(in
million of Ps.)
|
|
|||||||
|
Operations
Center in Argentina
|
|
|
|
|
|
|
||||
|
Shopping
Centers
|
|
(143)
|
(2)
|
-
|
(145)
|
|
||||
|
Offices and
Others
|
|
(12)
|
-
|
-
|
(12)
|
|
||||
|
Sales and
Developments
|
|
(36)
|
-
|
-
|
(36)
|
|
||||
|
Hotels
|
|
(69)
|
-
|
-
|
(69)
|
|
||||
|
International
|
|
-
|
-
|
-
|
-
|
|
||||
|
Financial
Operations and Others
|
|
(2)
|
-
|
-
|
(2)
|
|
||||
|
Total
Operations Center in Argentina
|
|
(262)
|
(2)
|
-
|
(264)
|
|
||||
|
|
|
|
|
|
|
|
||||
|
Operations
Center in Israel
|
|
|
|
|
|
|
||||
|
Real
Estate
|
|
(29)
|
-
|
-
|
(29)
|
|
||||
|
Supermarkets
|
|
(4,058)
|
-
|
-
|
(4,058)
|
|
||||
|
Agrochemicals
|
|
-
|
-
|
-
|
-
|
|
||||
|
Telecommunications
|
|
(1,493)
|
-
|
-
|
(1,493)
|
|
||||
|
Insurance
|
|
-
|
-
|
-
|
-
|
|
||||
|
Other
|
|
(106)
|
-
|
-
|
(106)
|
|
||||
|
Total
Operations Center in Israel
|
|
(5,686)
|
-
|
-
|
(5,686)
|
|
||||
|
Total
Selling expenses
|
|
(5,948)
|
(2)
|
-
|
(5,950)
|
|
||||
|
|
|
Fiscal
year ended June 30, 2015
|
|
|||||||
|
|
|
|
||||||||
|
Selling
expenses
|
|
Statement
of Income
|
Interests
in joint ventures
|
Inter-segment
eliminations
|
Segment
reporting
|
|
||||
|
|
|
(in
million of Ps.)
|
|
|||||||
|
Operations
Center in Argentina
|
|
|
|
|
|
|
||||
|
Shopping
Centers
|
|
(112)
|
(1)
|
-
|
(113)
|
|
||||
|
Offices and
Others
|
|
(21)
|
-
|
-
|
(21)
|
|
||||
|
Sales and
Developments
|
|
(8)
|
(1)
|
-
|
(9)
|
|
||||
|
Hotels
|
|
(52)
|
-
|
-
|
(52)
|
|
||||
|
International
|
|
-
|
-
|
-
|
-
|
|
||||
|
Financial
Operations and Others
|
|
-
|
-
|
-
|
-
|
|
||||
|
Total
Urban Properties and Investments Business
|
|
(193)
|
(2)
|
-
|
(195)
|
|
||||
|
|
|
|
|
|
|
|
||||
The Selling
expenses associated to the sales completed by the Urban Properties
and Investments Business rose by 2,981.9% from Ps. 193 million
in fiscal year 2015 to Ps. 5,948 million in fiscal year 2016
of which Ps. 5,686 million are derived from the Operation Center in
Israel, and Ps. 262 million are derived from the Operation Center
in Argentina. Considering Operation Center in Argentina variation
was due to an increase of Ps. 31 million in the Shopping
Center segment, an increase of Ps. 28 million in the Sales and
Developments segment, an increase of Ps. 17 million in the
Hotels segment and an increase of Ps. 2 million in the
Financial Operations and Others segment, partially offset by a
reduction of Ps. 9 million in the Offices and Others
segment.
In turn, selling
expenses in our joint ventures did not exhibit a decrease in the
fiscal years 2016 and 2015.
Hence, according to
business segment reporting, Selling expenses experienced 2,951.3%
growth from Ps. 195 million during fiscal year 2015 to
Ps. 5,950 million during fiscal year 2016 (of which Ps. 5,686
million are attributable to the Operation Center in Israel and Ps.
264 million to the Operation Center in Argentina). Without
considering the effect of the Operation Center in Israel, selling
expenses rose by 35.4%. Furthermore, selling expenses as a
percentage of revenues, pursuant to business segment reporting,
rose from 7.7% during fiscal year 2015 to 18.9% during fiscal year
2016. Without considering the effect of the Israeli Operating
Center, selling expenses as a percentage of total revenues pursuant
to business segment reporting, experienced a slight increase from
7.7% during fiscal year 2015 to 8.0% during fiscal year
2016.
146
Operations Center in
Argentina
Shopping Centers
Selling expenses in
the Shopping Centers segment increased by 28.3%, up from
Ps. 113 million during fiscal year 2015 to Ps. 145
million during fiscal year 2016, primarily as a consequence of: (i)
an increase in the charge for taxes, rates and contributions of
Ps. 29 million, primarily generated by an increase in charges
for gross income tax, amongst other items.
Selling expenses
measured as a percentage of revenues from the Shopping Centers
segment, went down from 6.3 % during fiscal year 2015 to 6.0%
during fiscal year 2016.
Offices and Others
The Selling
expenses associated to our Offices and Others segment decreased by
42.9% down from Ps. 21 million in fiscal year 2015 to
Ps. 12 million in fiscal year 2016.
The Selling
expenses associated to our Offices and Others segment, measured as
a percentage of the revenues derived from this segment diminished
by 6.3% in fiscal year 2015 to 3.5% in fiscal year
2016.
Sales and Developments
Selling expenses in
the Sales and Developments segment rose by 300.0%, up from
Ps. 9 million during fiscal year 2015 to Ps. 36 million
during fiscal year 2016, primarily as a result of an increased
charge for taxes, rates and contributions that amounts to
Ps. 21 million, primarily generated by an increase in charges
for gross income tax.
Hotels
The selling
expenses associated to our Hotels segment rose by 32.7%, from
Ps. 52 million during fiscal year 2015 to Ps. 69 million
during fiscal year 2016, primarily attributable to:
·
a Ps. 6
million increase in the charge for taxes, rates and contributions
and
·
an increase of
Ps. 5 million in fees for services amongst other
items.
The selling
expenses associated to our Hotels segment measured as a percentage
of the revenues derived from this segment fell slightly down from
13% during fiscal year 2015 to 12.9% during fiscal year
2016.
Financial Operations and Others
Selling expenses in
the Financial Operations and Others segment rose by Ps. 2
million during fiscal year 2016 compared to fiscal year
2015.
Operations Center in
Israel
Real Estate
During fiscal year
2016, selling expenses associated to the Real Estate segment
totaled Ps. 29 million. Selling expenses as a percentage of the
revenues derived from this segment amounted to 1.9%.
Supermarkets
During fiscal year
2016, selling expenses associated to the Supermarkets segment
totaled Ps. 4,058 million. Selling expenses as a percentage of the
revenues derived from this segment amounted to 21.8%.
Telecommunications
During fiscal year
2016, selling expenses associated to the Telecommunications segment
totaled Ps. 1,493 million. Selling expenses as a percentage of the
revenues derived from this segment amounted to 22.4%.
Others
During fiscal year
2016, selling expenses associated to the Others segment totaled Ps.
106 million. Selling expenses as a percentage of the revenues
derived from this segment amounted to 7.4%.
Other
Operating results, net
Our Other operating
results, net decreased by Ps. 48 million, from income for
Ps. 10 million in fiscal year 2015 to a loss for Ps. 38
million in fiscal year 2016. This was mainly due to an
increase of Ps. 3 million in the Urban Properties and
Investments Business in the Argentine Operating Center, offset by a
Ps. 51 million decrease in the Agricultural
business.
147
Agricultural
Business
|
|
|
Fiscal
year ended June 30, 2016
|
|||
|
Other
Operating results, net
|
|
Statement
of Income
|
Interests
in joint ventures
|
Inter-segment
eliminations
|
Segment
reporting
|
|
|
|
(in
million of Ps.)
|
|||
|
Crops
|
|
(72)
|
(1)
|
(1)
|
(74)
|
|
Cattle
|
|
(2)
|
-
|
-
|
(2)
|
|
Dairy
|
|
-
|
-
|
-
|
-
|
|
Land Transformation
and Sales
|
|
-
|
-
|
-
|
-
|
|
Sugarcane
|
|
4
|
-
|
-
|
4
|
|
Agricultural
Production Subtotal
|
|
(70)
|
(1)
|
(1)
|
(72)
|
|
Agro-industrial
|
|
1
|
-
|
-
|
1
|
|
Others
segments
|
|
1
|
-
|
-
|
1
|
|
Agricultural Rental
and Services
|
|
-
|
-
|
-
|
-
|
|
Subtotal
Others
|
|
2
|
-
|
-
|
2
|
|
Total
Agricultural Business
|
|
(68)
|
(1)
|
(1)
|
(70)
|
|
|
|
Fiscal
Year ended June 30, 2015
|
|||
|
Other
Operating results, net
|
|
Statement
of Income
|
Interests
in joint ventures
|
Inter-segment
eliminations
|
Segment
reporting
|
|
|
|
(in
million of Ps.)
|
|||
|
Crops
|
|
(7)
|
(1)
|
(1)
|
(9)
|
|
Cattle
|
|
(2)
|
(1)
|
-
|
(3)
|
|
Dairy
|
|
(1)
|
-
|
-
|
(1)
|
|
Sugarcane
|
|
(2)
|
-
|
-
|
(2)
|
|
Agricultural
Production Subtotal
|
|
(12)
|
(2)
|
(1)
|
(15)
|
|
Land Transformation
and Sales
|
|
(5)
|
-
|
-
|
(5)
|
|
Agro-industrial
|
|
-
|
-
|
-
|
-
|
|
Others
segments
|
|
1
|
-
|
-
|
1
|
|
Agricultural Rental
and Services
|
|
-
|
-
|
-
|
-
|
|
Subtotal
Others
|
|
1
|
-
|
-
|
1
|
|
Total
Agricultural Business
|
|
(16)
|
(2)
|
(1)
|
(19)
|
The Other operating
results, net, associated to sales in the Agricultural business
increased their losses up from Ps. 16 million in fiscal year
2015 to Ps. 68 million in losses for fiscal year 2016. This
was primarily due to an increase of Ps. 65 million in losses
in the Crops segment, partially offset by an increase of Ps. 6
million in the Sugarcane segment, Ps. 5 million in the segment
Land Transformation and Sales, and Ps. 1 million in the Dairy
and Agro-industrial segments.
In turn, Other
operating results, net from our interests in joint ventures
experienced a decrease in loss equivalent to 50% of Ps. 2
million in fiscal year 2015 to Ps. 1 million in fiscal year
2016, associated to our joint venture Cresca.
Besides, there have
not been any variations in the Inter-segment eliminations for other
operating results, net which remain at a loss of Ps. 1 million
for both fiscal years.
Hence, according to
business segment reporting and considering all our joint ventures,
Other operating results, net went from a loss of Ps. 19
million in fiscal year 2015 to a loss of Ps. 70 million in
fiscal year 2016.
Crops
Other operating
results, net, in the Crops segment experienced an increase in
losses for Ps. 65 million, up from Ps. 9 million in
losses for fiscal year 2015 to Ps. 74 million in losses for
fiscal year 2016, primarily as a result of the derivatives of
Brasilagro and Cresud commodities (Ps. 84 million), partially
offset by the results generated by FyO (equivalent to income for
Ps. 12 million).
Sugarcane
Other operating
results, net in the Sugarcane segment rose by Ps. 6 million,
up from a Ps. 2 million loss in fiscal year 2015 to income for
Ps. 4 million in fiscal year 2016.
Land Transformation and Sales
Other operating
results, net in the Land Transformation and Sales segment in fiscal
year 2016 were no associated to expenses whilst losses for these
expenses in fiscal year 2015 had amounted to Ps. 5
million.
The rest of the
segments of the Agriculture business did not exhibit significant
changes.
148
Urban
Properties and Investments Business
|
|
|
Fiscal
year ended June 30, 2016
|
|
|||||||
|
Other
Operating results, net
|
|
Statement
of Income
|
Interests
in joint ventures
|
Inter-segment
eliminations
|
Segment
reporting
|
|
||||
|
|
|
(in
million of Ps.)
|
|
|||||||
|
Operations
Center in Argentina
|
|
|
|
|
|
|
||||
|
Shopping
Centers
|
|
(40)
|
(2)
|
-
|
(42)
|
|
||||
|
Offices and
Others
|
|
(7)
|
-
|
1
|
(6)
|
|
||||
|
Sales and
Developments
|
|
(16)
|
4
|
4
|
(8)
|
|
||||
|
Hotels
|
|
(2)
|
-
|
-
|
(2)
|
|
||||
|
International
|
|
89
|
-
|
-
|
89
|
|
||||
|
Financial
Operations and Others
|
|
1
|
-
|
-
|
1
|
|
||||
|
Total
Operations Center in Argentina
|
|
25
|
2
|
5
|
32
|
|
||||
|
|
|
|
|
|
|
|
||||
|
Operations
Center in Israel
|
|
|
|
|
|
|
||||
|
Real
Estate
|
|
-
|
-
|
-
|
-
|
|
||||
|
Supermarkets
|
|
-
|
-
|
-
|
-
|
|
||||
|
Agrochemicals
|
|
-
|
-
|
-
|
-
|
|
||||
|
Telecommunications
|
|
-
|
-
|
-
|
-
|
|
||||
|
Insurance
|
|
-
|
-
|
-
|
-
|
|
||||
|
Other
|
|
-
|
-
|
-
|
-
|
|
||||
|
Total
Operations Center in Israel
|
|
-
|
-
|
-
|
-
|
|
||||
|
Total
Other operating results, net
|
|
25
|
2
|
5
|
32
|
|
||||
|
|
|
|
|
|
|
|
||||
|
|
|
Fiscal
year ended June 30, 2015
|
||||||||
|
Other
Operating results, net
|
|
Statement
of Income
|
Interests
in joint ventures
|
Inter-segment
eliminations
|
Segment
reporting
|
|
||||
|
|
|
(in
million of Ps.)
|
|
|||||||
|
Operations
Center in Argentina
|
|
|
|
|
|
|
||||
|
Shopping
Centers
|
|
(48)
|
(1)
|
-
|
(49)
|
|
||||
|
Offices and
Others
|
|
(120)
|
1
|
1
|
(118)
|
|
||||
|
Sales and
Developments
|
|
13
|
-
|
-
|
13
|
|
||||
|
Hotels
|
|
-
|
-
|
-
|
-
|
|
||||
|
International
|
|
185
|
-
|
-
|
185
|
|
||||
|
Financial
Operations and Others
|
|
(2)
|
-
|
-
|
(2)
|
|
||||
|
Total
Urban Properties and Investments Business
|
|
28
|
-
|
1
|
29
|
|
||||
The Other operating
results, net in the Urban Properties and Investments Business
segment decreased by Ps. 3 million, up from a gain of
Ps. 28 million in fiscal year 2015 to a gain of Ps. 25
million in fiscal year 2016 (attributable to the Operation Center
in Argentina), primarily attributable to income for Ps. 113
million in the Offices and Others segment, partially offset by a
reduction of Ps. 96 million in the International
segment.
The effect of
consolidation in our joint ventures rose by Ps. 2 million
primarily due to larger operating revenues in the joint ventures
Baicom and Cyrsa, partially offset by operating expenses in the
Puerto Retiro joint venture.
Besides,
Inter-segment eliminations rose by Ps. 4 million, up from
Ps. 1 million in income for the fiscal year 2015 to Ps. 5
million in income for the fiscal year 2016.
In accordance with
the details from the business segment reported by segment and
considering all our joint ventures and the Inter-segment
eliminations, the Other operating results, net went from income for
Ps. 29 million as net income for the fiscal year 2015 to
income for Ps. 32 million in the fiscal year 2016 (allocated
to the Operation Center in Argentina)..
Operation Center in
Argentina
Shopping Centers
The net loss
stemming from Other operating results in the Shopping Centers
segment shrank by 14.3%, down from Ps. 49 million during
fiscal year 2015 to Ps. 42 million during fiscal year 2016,
primarily as a consequence of a smaller charge for lawsuits and
contingencies of Ps. 8 million.
The net loss
stemming from Other operating results, measured as a percentage of
revenues from the Shopping Centers segment, diminished from 2.7%
during fiscal year 2015 to 1.7% during fiscal year
2016.
149
Offices and Others
The net loss
stemming from Other operating results associated to our Offices and
Others segment decreased by Ps. 112 million, down from
Ps. 118 million during fiscal year 2015 to Ps. 6 million
during fiscal year 2016, primarily attributable to the expenses for
conveyances of assets from IRSA to IRSA CP for Ps. 111 million
generated during fiscal year 2015.
Sales and Developments
Our Sales and
Developments segment diminished by Ps. 21 million from income
for Ps. 13 million during fiscal year 2015 to a loss of
Ps. 8 million during fiscal year 2016, primarily as a
consequence of the income posted during fiscal year 2015 for the
sale of our shareholding in Bitania for Ps. 16 million, among
other items.
Hotels
The net loss
stemming from Other operating results associated to our Hotels
segment rose by Ps. 2 million recorded during fiscal year
2016, primarily attributable to an increased charge for provisions
for lawsuits and contingencies.
International
The Other operating
results, net in this segment exhibited a Ps. 96 million
decrease, down from Ps. 185 million during fiscal year 2015 to
Ps. 89 million during fiscal year 2016, primarily attributable
to a reduction in income caused by the partial reversal of
accumulated gains/(losses) from conversion. As of June 30, 2016,
this reflects primarily the reversal of the gains/(losses) for
conversion before the IDBD business combination whilst as of June
30, 2015 this reflects the reversal of the reserve for conversion
generated at Rigby and due to the partial repayment of the
company’s principal.
Financial Operations and Others
Other operating
results, net associated to our Financial Operations and Others
segment rose by Ps. 3 million, up from a loss of Ps. 2
million during fiscal year 2015 to income for Ps. 1 million
during fiscal year 2016.
Profit
from operations
As a consequence of
the factors explained above, our profit from operations rose
Ps. 900 million (31.8%), up from income for Ps. 2,827
million in fiscal year 2015 to income for Ps. 3,727 million in
fiscal year 2016.
Agricultural
Business
Profit from
operations in the Agricultural business decreased Ps. 15
million (4.9%), down from income for 307 million in fiscal year
2015 to income for Ps. 292 million in fiscal year
2016.
Crops
Profit / (loss)
from operations in this segment increased Ps. 431 million
(155.6%) from a loss of Ps. 277 million in fiscal year 2015 to
income for Ps. 154 million in fiscal year 2016.
Cattle
Profit from
operations in this segment rose by Ps. 67 million (186.1%),
from income for Ps. 36 million in fiscal year 2015 to income
for Ps. 103 million in fiscal year 2016.
Dairy
Profit / (loss)
from operations in this segment decreased Ps. 12 million
(300.0%), from income for Ps. 4 million in fiscal year 2015 to
a loss of Ps. 8 million in fiscal year 2016.
Sugarcane
Profit / (loss)
from operations in this segment increased Ps. 76 million
(584.6%), from a loss of Ps. 13 million in fiscal year 2015 to
income for Ps. 63 million in fiscal year 2016.
Agricultural Rental and Services
Profit from
operations in this segment increased Ps. 16 million (43.2%),
from income for Ps. 37 million in fiscal year 2015 to income
for Ps. 53 million in fiscal year 2016.
Land Transformation and Sales
Profit from
operations in this segment decreased by Ps. 564 million
(102.2%), from income for Ps. 552 million in fiscal year 2015
to a loss of Ps. 12 million in fiscal year 2016.
150
Agro-industrial
Loss from
operations in this segment decreased Ps. 28 million (80.0%),
from a loss of Ps. 35 million in fiscal year 2015 to a loss of
Ps. 63 million in fiscal year 2016.
Others
Profit from
operations in this segment decreased Ps. 1 million (33.3%)
from income for Ps. 3 million in fiscal year 2015 to income
for Ps. 2 million in fiscal year 2016.
Urban
Properties and Investments Business
Profit from
operations in this segment rose by Ps. 915 million (36.3%), up
from income for Ps. 2,520 million in fiscal year 2015 to
income for Ps. 3,435 million in fiscal year 2016 of which Ps.
720 million are derived from the Operation Center in Israel, and
Ps. 2,715 million are derived from the Operation Center in
Argentina. Considering Operation Center in Argentina variation was
due to an increase of Ps. 580 million in the segments Shopping
Center, Offices and Others, Hotels and Financial Operations,
partially offset by a Ps. 385 million reduction in the
segments Sales and Developments and International.
Shopping Centers
Profit from
operations in our Shopping Centers segment rose by 37.6%, from a
gain of Ps. 1,190 million during fiscal year 2015 to a gain of
Ps. 1,637 million during fiscal year 2016.
Profit from
operations in our Shopping Centers segment, as a percentage of the
segment revenues, increased from 66.9% in fiscal year 2015 to 68.0%
in fiscal year 2016.
Offices and Others
Profit from
operations in our Offices and Others segment rose by 121.2%, from a
gain of Ps. 99 million during fiscal year 2015 to a gain of
Ps. 219 million during fiscal year 2016.
Profit from
operations in our Offices and Others segment, as a percentage of
the revenues derived from this segment, increased from 29.7% in
fiscal year 2015 to 64.4% in fiscal year 2016.
Sales and Developments
Profit from
operations in our Sales and Developments segment decreased by
21.4%, from a gain of Ps. 1,099 million during fiscal year
2015 to a gain of Ps. 864 million during fiscal year
2016.
Profit from
operations in our Sales and Developments segment, as a percentage
of the revenues derived from this segment, increased from 7,850.0%
in fiscal year 2015 to 28,800.0% in fiscal year 2016.
Hotels
Loss from
operations in our Hotels segment decreased losses by 84.6% down
from Ps. 13 million during fiscal year 2015 to Ps. 2
million during fiscal year 2016.
International
Profit/(loss) from
operations in our International segment decreased Ps. 150
million (101.3%), from a gain of Ps. 148 million during fiscal
year 2015 to a loss of Ps. 2 million during fiscal year
2016.
Financial Operations and Others
Loss from
operations in our Financial Operations and Others segment
experienced a 66.7% decrease in losses, down from Ps. 3
million during fiscal year 2015 to Ps. 1 million during fiscal
year 2016.
Operations Center in
Israel
Real Estate
During fiscal year
2016, operating income associated to the Real Estate segment
totaled Ps. 617 million and, as a percentage of the revenues
derived from this segment, amounted to 40.1%.
Supermarkets
During fiscal year
2016, operating income associated to the Supermarkets segment
totaled Ps. 424 million and, as a percentage of the revenues
derived from this segment, amounted to 2.3%.
151
Telecommunications
During fiscal year
2016, operating loss associated to the Telecommunications segment
totaled Ps. 71 million.
Others
During fiscal year
2016, operating loss associated to the Others segment totaled Ps.
250 million.
Share
of profit / (loss) of associates and joint ventures
Share of profit /
(loss) of associates and joint ventures increased by Ps. 1,499
million, up from a loss of Ps. 1,026 million in
fiscal year 2015 to a gain of Ps. 473 million in fiscal year
2016. This was primarily attributable to:
·
a Ps. 1,136
million increase in our related companies’ interest in the
Urban Properties and Investments business in fiscal year 2016. Such
increase was mainly attributable to the income stemming from the
share in the Profit of associates and joint ventures posted by our
subsidiary IDBD which amounted to Ps. 338 million during
fiscal year 2016, and the profit associated to the investment in
IDBD previous to the consolidation which amounts to Ps. 1,080
million, which adds to the income stemming from our investment in
our related company Banco Hipotecario which exhibited a
Ps. 114 million variation during fiscal year 2016. This has
all been partially offset by an increase in losses of Ps. 55
million in our ownership interest in New Lipstick LLC, partially
offset by increased gains from Condor for Ps. 15
million.
·
a Ps. 22
million increase in the revenues provided by the Agricultural
business, primarily attributable to the revenues earned by the
Agro-Uranga investment (corresponding to the Crops
segment).
In turn, share of
profit of associates and joint ventures from our interests in joint
ventures increased by 30.0% from Ps. 10 million in fiscal year
2015 to Ps. 13 million in fiscal year 2016, mainly as a
consequence of a 298.7% increase in our Cresca joint venture, up
from a loss of Ps. 2 million in fiscal year 2015 to a gain of
Ps. 3 million in fiscal year 2016.
Hence, according to
business segment reporting and considering all our joint ventures,
share of profit / (loss) of associates and joint ventures increased
by 144.4%, up from a loss of Ps. 1,036 million in fiscal year
2015 to a gain of Ps. 460 million in fiscal year
2016.
Financial
results, net
We incurred a
higher financial loss, net of Ps. 4,967 million, up from a
loss of Ps. 1,288 million in fiscal year 2015 to a loss of
Ps. 6,255 million in fiscal year 2016. This was primarily due
to:
·
a higher loss, of
Ps. 2,340 million in foreign exchange, net in fiscal year
2016;
·
a higher loss, of
Ps. 1,160 million in financial interest, net recorded in
fiscal year 2016;
·
a higher loss, of
Ps. 1,428 million, stemming from the fair value measurement of
financial assets and liabilities in fiscal year
2016;
·
a higher loss, of
Ps. 353 million, stemming from the impairment in the
investment properties of our IDBD subsidiary in fiscal year 2016;
and
·
slightly offset by
a gain of Ps. 1,172 million stemming from derivative financial
instruments in fiscal year 2016.
Our financial
losses, net in fiscal year 2016 were primarily attributable to (i)
an increase in the financial losses stemming from the consolidation
of IDBD for Ps. 3,176 million; (ii) a Ps. 3,249 million
loss stemming from foreign exchange primarily as a result of the
depreciation sustained by the foreign exchange rate, whitout
IDBD’s results; (iii) a Ps. 1,246 million loss stemming
from the interest accrued on debt financing, mainly due to
increased indebtedness and higher interest rates, whitout
IDBD’s results; (iv) a gain of Ps. 662 million primarily
attributable to the fair value measurement of financial assets,
whitout IDBD’s results; and (v) a gain of Ps. 1,138 million
attributable to derivative financial instruments (except
commodities), whitout IDBD’s results.
There was a 65.5%
variation in the U.S. Dollar buying rate during fiscal year 2016
(it increased from Ps. 9.088 on June 30, 2015 to
Ps. 15.040 as of June 30, 2016) as compared to the previous
fiscal year, when the U.S. Dollar quotation had experienced a
variation of 11.7% (from Ps. 8.133 as of June 30, 2014 to
Ps. 9.088 as of June 30, 2015).
Income
tax
Our income tax
expense increased Ps. 500 million, from a Ps. 303 million
loss in fiscal year 2015 to a Ps. 197 million gain in fiscal
year 2016. We recognize the income tax expense on the basis of the
deferred tax liability method, thus recognizing temporary
differences between accounting and tax assets and liabilities
measurements. The main temporary differences for the Agriculture
business derive from valuation of cattle stock and sale and
replacement of property, plant and equipment, while those
corresponding to the Urban Properties and Investments business
derive from the sale and replacement of investment
properties.
For purposes of
determining the deferred assets and liabilities, the tax rate
expected to be in force at the time of their reversion or use,
according to the legal provisions enacted as of the date of
issuance of these financial statements, has been applied to the
identified temporary differences and tax losses.
Profit
/ (loss) for the Fiscal Year
Due to the above
mentioned factors, our profit / (loss) for the fiscal year
decreased Ps. 2,066 million (1,180.6%) from Ps. 175
million in net income for fiscal year 2015 to a net loss of
Ps. 1,891 million in fiscal year 2016. Profit / (loss) for
fiscal years 2016 and 2015 is attributable to the controlling
company’s shareholders and non-controlling interest, as per
the following detail:
·
Loss for the fiscal
year attributable to the controlling company’s shareholders
went from a loss of Ps. 250 million in fiscal year 2015 to a
loss of Ps. 1,038 million in fiscal year 2016;
and
·
Profit / (loss)
attributable to the non-controlling interest in controlled
companies went from a gain of Ps. 425 million in fiscal year
2015 to a loss of Ps. 853 million in fiscal year 2016,
primarily due to the consolidation of our subsidiary
IDBD.
152
Fiscal
year ended June 30, 2015 compared to the fiscal year ended June 30,
2014
Operating
Results
REVENUES
Our total revenues
increased 24.5%, from Ps. 3,970 million for fiscal year 2014
to Ps. 4,942 million for fiscal year 2015. This was mainly due
to a 32.1% increase in the Agricultural business, from Ps.1,813
million in fiscal year 2014 to Ps. 2,395 million in fiscal
year 2015 and a 18.1% increase in the Urban Properties and
Investments business, from Ps. 2,157 million in fiscal year
2014 to Ps. 2,547 million in fiscal year 2015.
Agricultural
Business
|
|
|
Fiscal
year ended June 30, 2015
|
|||
|
Revenues
|
|
Statement
of Income
|
Interests
in joint ventures
|
Inter-segment
eliminations
|
Segment
reporting
|
|
|
|
(in
million of Ps.)
|
|||
|
Crops
|
|
964
|
23
|
-
|
987
|
|
Cattle
|
|
56
|
3
|
84
|
143
|
|
Dairy
|
|
72
|
-
|
-
|
72
|
|
Sugarcane
|
|
198
|
-
|
-
|
198
|
|
Subtotal
Agricultural Business
|
|
1,290
|
26
|
84
|
1,400
|
|
Land Transformation
and Sales
|
|
-
|
-
|
-
|
-
|
|
Agro-industrial
|
|
806
|
-
|
-
|
806
|
|
Others
segments
|
|
118
|
-
|
10
|
128
|
|
Agricultural Rental
and Services
|
|
37
|
-
|
24
|
61
|
|
Other
Subtotal
|
|
961
|
-
|
34
|
995
|
|
Total
Agricultural Business
|
|
2,251
|
26
|
118
|
2,395
|
|
|
|
Fiscal
year ended June 30, 2014
|
|||
|
Revenues
|
|
Statement
of Income
|
Interests
in joint ventures
|
Inter-segment
eliminations
|
Segment
reporting
|
|
|
|
(in
million of Ps.)
|
|||
|
Crops
|
|
818
|
19
|
-
|
837
|
|
Cattle
|
|
62
|
2
|
26
|
90
|
|
Dairy
|
|
54
|
-
|
-
|
54
|
|
Sugarcane
|
|
124
|
-
|
-
|
124
|
|
Subtotal
Agricultural Business
|
|
1,058
|
21
|
26
|
1,105
|
|
Land Transformation
and Sales
|
|
-
|
-
|
-
|
-
|
|
Agro-industrial
|
|
549
|
-
|
5
|
554
|
|
Others
segments
|
|
124
|
-
|
1
|
125
|
|
Agricultural Rental
and Services
|
|
28
|
-
|
1
|
29
|
|
Other
Subtotal
|
|
701
|
-
|
7
|
708
|
|
Total
Agricultural Business
|
|
1,759
|
21
|
33
|
1,813
|
Total revenues
increased 28.0%, from Ps. 1,759 million in fiscal year 2014 to
Ps. 2,251 in fiscal year 2015. This was due to an increase
of:
·
Ps. 146 in the
Crops segment;
·
Ps. 18 million
in the Dairy segment;
·
Ps. 74 million
in the Sugarcane segment;
·
Ps. 257
million in the Agroindustrial segment; and
·
Ps. 9 million
in the Agricultural Rental and Services
segment.
These increases
were offset by a reduction of Ps. 6 million in the Cattle and
Others segments, respectively.
In turn, revenues
from our interests in joint ventures increased 23.8% from
Ps. 21 million in fiscal year 2014 to Ps. 26 million in
fiscal year 2015, as a result of a 21.1% increase in crops sold in
Cresca, from Ps. 19 million in fiscal year 2014 to Ps. 23
million in fiscal year 2015.
Similarly,
inter-segment revenues increased 257.6%, from Ps. 33 million
in fiscal year 2014 to Ps. 118 million in fiscal year 2015, as
a result of livestock sales during the year to our subsidiary
Sociedad Anónima Carnes Pampeanas which was reclassified from
the Cattle segment to the Agroindustrial segment, and the leases of
farmlands between our subsidiary Brasilagro and its subsidiaries,
which were reclassified from the Crops segment to the Agricultural
Rental and Services segment.
153
Crops
Revenues from the
Crops segment increased 17.9%, from Ps. 837 million in fiscal
year 2014 to Ps. 987 million in fiscal year 2015, mainly as a
result of:
·
a reduction of 4.6%
in the average price of sold crops, from Ps. 1,931 per ton in
fiscal year 2014 to Ps. 1,842 per ton in fiscal year
2015;
·
offset by an
increase of 102,130 tons in the volume of crops sold
during fiscal year 2015 compared to the previous fiscal year, a
17.9% increase in production volume, from 344,165 tons in fiscal
year 2014 to 405,882 tons in fiscal year 2015.
The following table
shows the sales of crops in detail:
|
|
Sale of Crops
(in
tons)
|
||
|
|
Fiscal
year ended June 30,
|
||
|
|
2015
|
2014
|
Variation
|
|
Corn
|
269,701
|
179,893
|
89,808
|
|
Soybean
|
250,125
|
222,051
|
28,074
|
|
Wheat
|
7,083
|
11,359
|
(4,276)
|
|
Sorghum
|
1,569
|
3,843
|
(2,274)
|
|
Sunflower
|
5,181
|
9,745
|
(4,564)
|
|
Other
|
1,872
|
6,509
|
(4,637)
|
|
Total
Sales
|
535,531
|
433,400
|
(102,131)
|
Cattle
Revenues from the
Cattle segment increased 58.9%, from Ps. 90 million in fiscal
year 2014 to Ps. 143 million in fiscal year 2015, mainly as a
result of:
·
a 57.8% increase in
the average price per kilogram sold, from Ps. 10.2 million in
fiscal year 2014 to Ps. 16.1 million in fiscal year
2015;
·
a slight decrease
of 0.3% in the cattle sales volume, from 8,842 tons in
fiscal year 2014 to 8,871 tons in fiscal year 2015;
and
·
a 12.1% increase in
the cattle production volume, from 6,970 tons in fiscal year 2014
to 7,812 tons in fiscal year 2015.
Dairy
Revenues from the
Dairy segment increased 33.3%, from Ps. 54 million in fiscal
year 2014 to Ps. 72 million in fiscal year 2015, mainly as a
result of:
·
a 31.0% increase in
the average price of milk, from Ps. 2.70 per liter in fiscal
year 2014 to Ps. 3.55 per liter in fiscal year
2015;
·
a 10.3% decrease in
the average amount number of milking cows; and
o
a 9.9% decrease in
the volume of sales, from 18.8 million liters in fiscal year 2014
to 16.9 million liters in fiscal year 2015.
Sugarcane
Revenues from the
Sugarcane segment increased 59.7%, from Ps. 124 million in
fiscal year 2014 to Ps. 198 million in fiscal year 2015,
mainly as a result of:
·
248,808 more tons
of sugarcane sold in fiscal year 2015 as compared to the previous
fiscal year (36.8%), mainly by Brasilagro; and
·
a 16.7% increase in
the average price of sugarcane sold, from Ps. 183.3 per ton in
fiscal year 2014 to Ps. 214.0 per ton in fiscal year
2015.
Agricultural Rental and Services
Revenues from the
Agricultural Rental and Services segment increased by 110.3%, from
Ps. 29 million in fiscal year 2014 to Ps. 61 million in
fiscal year 2015, mainly as a result of:
·
a 232.0% increase
in leases due to higher leases and machinery rentals from
Brasilagro for Ps. 2 and Ps. 35 million in 2015,
respectively, as compared to no transactions in the previous fiscal
year, and new lease agreements in Bolivia in San Rafael (900
hectares), 4 Vientos (169 hectares) and Primavera (92 hectares)
farms from January to May 2015, which generated revenues of
Ps. 1 million;
·
a 18.2% increase in
revenues from irrigation services (Ps. 1 million) originated
in a 57% increase in the price, offset by a 25% reduction in
irrigation volume;
·
partially offset by
a 71.4% reduction in revenues from agricultural management services
(Ps. 1 million) due to the fact that in the previous fiscal
year cotton management services had been rendered to Iazfin in La
Suiza, whereas such agreement was discontinued in this fiscal
year.
154
Agro-industrial Activities
Revenues from
Agro-industrial Activities increased 45.5%, from Ps. 554
million in fiscal year 2014 to Ps. 806 million in fiscal year
2015, mainly as a result of:
·
a 50% increase in
sales to the domestic market and by-products. Domestic market
prices showed an upward trend of 15% for fiscal year 2015 as
compared to fiscal year 2014, while export sales fell 3.2% in
fiscal year 2015 as compared to fiscal year 2014;
and
·
in fiscal year 2015
average slaughtering stood at 6,398 heads per month, compared to
5,472 in fiscal year 2014.
Other segment
Revenues from the
Other segment increased 2.4%, from Ps. 125 million in fiscal
year 2014 to Ps. 128 million in fiscal year 2015, mainly as a
result of:
·
an increase of
Ps. 19 million in revenues from consignment;
and
·
offset by a
reduction of Ps. 6 million and Ps. 9 million in the sale
of inputs and commodity brokerage services,
respectively.
Urban
Properties and Investments Business
|
|
|
Fiscal
year ended June 30, 2015
|
|||||||
|
Revenues
|
|
Statement
of Income
|
Interests
in joint ventures
|
Inter-segment
eliminations
|
Maintenance
Fee and Common Advertising Funds
|
Segment
reporting
|
|||
|
|
|
(in
million of Ps.)
|
|||||||
|
Shopping
Centers
|
|
2,571
|
13
|
-
|
(806)
|
1,778
|
|||
|
Offices and
Others
|
|
397
|
10
|
5
|
(79)
|
333
|
|||
|
Sales and
Developments
|
|
9
|
5
|
-
|
-
|
14
|
|||
|
Hotels
|
|
396
|
-
|
-
|
-
|
396
|
|||
|
International
|
|
28
|
-
|
-
|
(2)
|
26
|
|||
|
Financial
Operations and Others
|
|
-
|
-
|
-
|
-
|
-
|
|||
|
Total
Urban Properties and Investments Business
|
|
3,401
|
28
|
5
|
(887)
|
2,547
|
|||
|
|
|
|
|
|
|
|
|||
|
|
|
Fiscal
year ended June 30, 2014
|
|||||||
|
Revenues
|
|
Statement
of Income
|
Interests
in joint ventures
|
Inter-segment
eliminations
|
Maintenance
Fee and Common Advertising Funds
|
Segment
reporting
|
|||
|
|
|
(in
million of Ps.)
|
|||||||
|
Shopping
Centers
|
|
2,032
|
9
|
2
|
(660)
|
1,383
|
|||
|
Offices and
Others
|
|
327
|
10
|
4
|
(70)
|
271
|
|||
|
Sales and
Developments
|
|
63
|
23
|
-
|
-
|
86
|
|||
|
Hotels
|
|
332
|
-
|
-
|
-
|
332
|
|||
|
International
|
|
90
|
-
|
-
|
(6)
|
84
|
|||
|
Financial
Operations and Others
|
|
1
|
-
|
-
|
-
|
1
|
|||
|
Total
Urban Properties and Investments Business
|
|
2,845
|
42
|
6
|
(736)
|
2,157
|
|||
|
|
|
|
|
|
|
|
|
||
Total revenues from
the Urban Properties and Investments business increased 19.5%, from
Ps. 2,845 million in fiscal year 2014 to Ps. 3,401
million in fiscal year 2015. This was mainly due to an increase of
Ps. 395 million in the Shopping Centers segment, an increase
of Ps. 62 million in the Offices and Others segment, an
increase of Ps. 64 million in the Hotel segment, offset by a
decrease of Ps. 1 million in the Financial Operations and
Others segment, a decrease of Ps. 58 million in the
International segment, and a decrease of Ps. 72 million in the
Sales and Developments segment.
In turn, revenues
from our interests in joint ventures decreased by 33.3%, from
Ps. 42 million in fiscal year 2014 to Ps. 28 million in
fiscal year 2015. Such decrease is mostly attributable to a
reduction in sales revenues derived from the Horizons development,
from our joint venture with CYRSA S.A.
Similarly,
inter-segment revenues decreased 16.7%, from Ps. 6 million in
fiscal year 2014 (out of which Ps. 4 million is attributable
to the Offices and Others segment) to Ps. 5 million in fiscal
year 2015 (attributable to the Offices and Others
segment).
On the other hand,
revenues from Maintenance Fee and Common Advertising Funds
increased by 20.5%, from Ps. 736 million in fiscal year 2014
(out of which Ps. 660 million is attributable to the Shopping
Centers segment) to Ps. 887 million in fiscal year 2015 (out
of which Ps. 806 million is attributable to the Shopping
Centers segment).
Hence, according to
business segment reporting and considering all our joint ventures,
inter-segment eliminations, and maintenance fee and common
advertising funds, revenues increased 18.1%, from Ps. 2,157
million in fiscal year 2014 to Ps. 2,547 million in fiscal
year 2015.
155
Shopping Centers
Revenues from the
Shopping Centers segment increased 28.6%, from Ps. 1,383
million in fiscal year 2014 to Ps. 1,778 million in fiscal
year 2015. Such variation was mostly attributable to:
·
an increase of
Ps. 317 million in revenues from fixed and variable rentals as
a result of a 33.3% rise in our tenants’ sales, from
Ps. 16,133 million in fiscal year 2014 to Ps. 21,509
million in fiscal year 2015;
·
an increase of
Ps. 30 million in revenues from admission
fees;
·
an increase of
Ps. 31 million in parking revenues; and
·
an increase of
Ps. 17 million in revenues from commissions, management fees
and others.
Offices and Others
Revenues from the
Offices and Others segment increased 22.9%, from Ps. 271
million in fiscal year 2014 to Ps. 333 million in fiscal year
2015. Such revenues were impacted by the partial sale of investment
properties in fiscal year 2015, which resulted in a reduction of
the segment total leasable area.
Considering
comparable properties in both fiscal years, rental revenues from
properties which did not experience a decrease in their leasable
area increased by 30.8%, from Ps. 214 million in fiscal year
2014 to Ps. 280 million in fiscal year 2015, mostly as a
result of the currency devaluation and improved occupancy, whereas
rental revenues from properties whose leasable area was reduced
went down by 44.4%, from Ps. 45 million in fiscal year 2014 to
Ps. 25 million in fiscal year 2015.
As of year-end, the
2015 average occupancy rate of premium offices stood at 98.1% and
the average rent was around 26 US$ per sqm.
Sales and Developments
Revenues
attributable to this segment often vary significantly period over
period. Without considering our joint ventures, revenues from the
Sales and Developments segment decreased by 85.7% from Ps. 63
million in fiscal year 2014 to Ps. 9 million in fiscal year
2015. Such reduction was mainly attributable to reduced revenues
from the sale of the Condominios I and II (Ps. 46 million) and
El Encuentro (Ps. 8 million) developments. On the other hand,
revenues from out joint ventures (Horizons) fell by 78.3%,
accounting for a decrease of Ps. 18 million. Hence, total
revenues derived from this segment fell by 83.7%, from Ps. 86
million in fiscal year 2014 to Ps. 14 million in fiscal year
2015.
Hotels
Revenues from our
Hotels segment increased by 19.3% from Ps. 332 million in
fiscal year 2014 to Ps. 396 million in fiscal year 2015,
mainly as a result of a 34.2% increase in the average room rate of
our hotels (in terms of Argentine pesos), partially offset by a
decrease in the average occupancy rate from 67.2% in fiscal year
2014 to 65.7% in fiscal year 2015 (mainly at our Llao Llao
hotel).
International
Revenues from the
International segment decreased by 69.0% from Ps. 84 million
in fiscal year 2014 to Ps. 26 million in fiscal year 2015,
mostly due to the fact that the results of Rigby 183 LLC –
owner of the rental building Madison 183 – were consolidated
for only 3 months in fiscal year 2015 whereas such results were
consolidated for 12 months in fiscal year 2014. This building was
sold in September 2014.
Financial Operations and Others
Revenues from the
Financial Operations and Others segment decreased from Ps. 1
million in fiscal year 2014 to Ps. 0 million in fiscal year
2015, as a result of reduced revenues from our personal financing
residual activity.
COSTS
Our total costs
increased 24.1%, from Ps. 3,266 million in fiscal year 2014 to
Ps. 4,052 million in fiscal year 2015. This was mainly as a
result of a 30.6% increase in the Agricultural business, from
Ps. 2,617 million in fiscal year 2014 to Ps. 3,419
million in fiscal year 2015 and a 2.5% decrease in the Urban
Properties and Investments business from Ps. 649 million in
fiscal year 2014 to Ps. 633 million in fiscal year
2015.
Agricultural
Business
|
|
|
Fiscal
year ended June 30, 2015
|
|||
|
Costs
|
|
Statement
of Income
|
Interests
in joint ventures
|
Inter-segment
eliminations
|
Segment
reporting
|
|
|
|
(in
million of Ps.)
|
|||
|
Crops
|
|
(1,744)
|
(42)
|
(33)
|
(1,819)
|
|
Cattle
|
|
(220)
|
(5)
|
-
|
(225)
|
|
Dairy
|
|
(133)
|
-
|
-
|
(133)
|
|
Sugarcane
|
|
(368)
|
-
|
-
|
(368)
|
|
Subtotal
Agricultural Production
|
|
(2,465)
|
(47)
|
(33)
|
(2,545)
|
|
Land Transformation
and Sales
|
|
(9)
|
-
|
-
|
(9)
|
|
Agro-industrial
|
|
(654)
|
-
|
(85)
|
(739)
|
|
Others
segments
|
|
(105)
|
-
|
-
|
(105)
|
|
Agricultural rental
and Services
|
|
(21)
|
-
|
-
|
(21)
|
|
Subtotal
Others
|
|
(780)
|
-
|
(85)
|
(865)
|
|
Total
Agricultural Business
|
|
(3,254)
|
(47)
|
(118)
|
(3,419)
|
156
|
|
|
Fiscal
year ended June 30, 2014
|
|||
|
Costs
|
|
Statement
of Income
|
Interests
in joint ventures
|
Inter-segment
eliminations
|
Segment
reporting
|
|
|
|
(in
million of Ps.)
|
|||
|
Crops
|
|
(1,506)
|
(32)
|
(1)
|
(1,539)
|
|
Cattle
|
|
(152)
|
(4)
|
(5)
|
(161)
|
|
Dairy
|
|
(104)
|
-
|
-
|
(104)
|
|
Sugarcane
|
|
(207)
|
-
|
-
|
(207)
|
|
Subtotal
Agricultural Production
|
|
(1,969)
|
(36)
|
(6)
|
(2,011)
|
|
Land Transformation
and Sales
|
|
(8)
|
-
|
-
|
(8)
|
|
Agro-industrial
|
|
(454)
|
-
|
(26)
|
(480)
|
|
Others
segments
|
|
(101)
|
-
|
-
|
(101)
|
|
Agricultural rental
and Services
|
|
(17)
|
-
|
-
|
(17)
|
|
Subtotal
Others
|
|
(572)
|
-
|
(26)
|
(598)
|
|
Total
Agricultural Business
|
|
(2,549)
|
(36)
|
(32)
|
(2,617)
|
Total costs
increased by 27.7% from Ps. 2,549 million in fiscal year 2014
to Ps. 3,254 million in fiscal year 2015. This was caused by
an increase of:
·
Ps. 238
million in the Crops segment;
·
Ps. 68 million
in the Cattle segment;
·
Ps. 29 million
in the Dairy segment;
·
Ps. 161
million in the Sugarcane segment;
·
Ps. 4 million
in the Agricultural Rental and Services
segment;
·
Ps. 1 million
in the Land Transformation and Sales segment;
·
Ps. 200
million in the Agro-industrial segment, and
·
Ps. 4 million
in the Other segment.
In turn, the cost
of our joint ventures experienced a net increase of Ps. 11
million, from 36 million in fiscal year 2014 to Ps. 47 million
in fiscal year 2015, mainly as a result of an increase of
Ps. 12 million in the cost of Cresca’s crops, from
Ps. 31 million in fiscal year 2014 to Ps. 43 million in
fiscal year 2015.
Similarly,
inter-segment costs rose by Ps. 86 million from Ps. 32
million in fiscal year 2014 to Ps. 118 million in fiscal year
2015, mainly as a result of the cost of Cattle sales during the
year to our subsidiary Sociedad Anónima Carnes Pampeanas which
was reclassified from the Cattle segment to the Agro-industrial
segment and the leases of farmlands between our subsidiary
Brasilagro and its subsidiaries, reclassified from the Agricultural
Rental and Services segment to the Crops segment.
Hence, according to
business segment reporting and considering all our joint ventures
and inter-segment eliminations, costs increased by 30.6%, from
Ps. 2,617 million in fiscal year 2014 to Ps. 3,419
million in fiscal year 2015.
Crops
Costs from the
Crops segment increased by 18.2%, from Ps. 1,539 million in
fiscal year 2014 to Ps. 1,819 million in fiscal year 2015.
Costs from the Crops segment are detailed in the following
table:
|
|
Fiscal
year 2015
|
Fiscal
year 2014
|
|
|
In
Millions of Ps.
|
|
|
Cost of
sales
|
873
|
787
|
|
Cost of
production
|
946
|
752
|
|
Total
Costs
|
1,819
|
1,539
|
The cost of sales
from the Crops segment increased by 10.9%, from Ps. 787
million in fiscal year 2014 to Ps. 873 million in fiscal
year 2015, mainly as a result of:
157
·
a 23.6% increase in
the volume of tons sold as compared to the previous fiscal
year;
·
partially offset by
a 10.2% decrease in the average cost per ton of grain sold in
fiscal year 2015, from Ps. 1,816 in fiscal year 2014 to
Ps. 1,631 in fiscal year 2015, due to an increase in the
average grain domestic market price.
The cost of sales
as a percentage of sales was 94.1% in fiscal year 2014 and 88.5% in
fiscal year 2015.
The cost of
production from the Crops segment increased by 25.8%, from
Ps. 752 million in fiscal year 2014 to Ps. 946 million in
fiscal year 2015, mainly as a result of:
·
a 17.6% increase in
direct production costs during this fiscal year as compared to the
previous one, mainly affected by the inflationary context that
impacts both on the prices of leases and supplies used
(agrochemicals and seeds);
·
higher production
volumes in fiscal year 2015 as compared to fiscal year
2014;
·
a larger number of
hectares in operation in own farms in fiscal year 2015 as compared
to fiscal year 2014.
Total direct
production costs per ton decreased 0.3%, from Ps. 1,904 per
ton in fiscal year 2014 to Ps. 1,899 per ton in fiscal year
2015, mainly as a result of higher yields and higher costs in
fiscal year 2015 as compared to fiscal year 2014.
Cattle
Costs of the Cattle
segment increased 39.8%, from Ps. 161 million in fiscal year
2014 to Ps. 225 million in fiscal year 2015. Costs from the
Cattle segment are detailed in the following table:
|
|
Fiscal
year 2015
|
Fiscal
year 2014
|
|
|
In
Millions of Ps.
|
|
|
Cost of
sales
|
122
|
77
|
|
Cost of
production
|
103
|
84
|
|
Total
Costs
|
225
|
161
|
The cost of sales
increased by 58.4%, from Ps. 77 million in fiscal year 2014 to
Ps. 122 million in fiscal year 2015, mainly as a result
of:
·
a 57.3% increase in
the cost per kilogram sold in fiscal year 2015;
and
·
a 0.7% increase in
beef sales volumes in fiscal year 2015.
The cost of
production from the Cattle segment rose by 22.6%, from Ps. 84
million in fiscal year 2014 to Ps. 103 million in fiscal year
2015. The higher cost of production from the Cattle segment in
fiscal year 2015 was mainly attributable to:
·
higher payroll
expenses;
·
higher feeding
costs due to the rise in prices and higher feed costs due to the
increase of animals in our own farms fattened in
feedlots.
Dairy
Costs of the Dairy
segment increased 27.9%, from Ps. 104 million in fiscal year
2014 to Ps. 133 million in fiscal year 2015. Costs from the
Dairy segment are detailed in the following table:
|
|
Fiscal
year 2015
|
Fiscal
year 2014
|
|
|
In
Millions of Ps.
|
|
|
Cost of
sales
|
68
|
52
|
|
Cost of
production
|
65
|
52
|
|
Total
Costs
|
133
|
104
|
The cost of sales
from the Dairy segment increased by 30.8%, from Ps. 52 million
in fiscal year 2014 to Ps. 68 million in fiscal
year 2015, mainly as a result of:
·
an increase of 32%
and 119% in milk and milking cows price levels,
respectively;
·
a 94.3% increase in
the sales volume of milking cows, offset by
·
a 9.9% reduction in
milk sales volume.
158
Cost of production
of the Dairy segment increased 25.0%, from Ps. 52 million in
fiscal year 2014 to Ps. 65 million in fiscal year 2015. This
increase was mainly due to the impact of increased feeding, health
and payroll costs.
Sugarcane
Costs of the
Sugarcane segment increased 77.8%, from Ps. 207 million in
fiscal year 2014 to Ps. 368 million in fiscal year 2015. Costs
from the Sugarcane segment are detailed in the following
table:
|
|
Fiscal
year 2015
|
Fiscal
year 2014
|
|
|
In
Millions of Ps.
|
|
|
Cost of
sales
|
188
|
106
|
|
Cost of
production
|
180
|
101
|
|
Total
Costs
|
368
|
207
|
The cost of sales
from the Sugarcane segment increased by 77.4%, from Ps. 106
million in fiscal year 2014 to Ps. 188 million in fiscal
year 2015, mainly as a result of:
·
an increase of
248,808 tons of sugarcane sold in fiscal year 2015 compared to the
previous fiscal year, mainly in our subsidiary Brasilagro;
and
·
an increase in the
average cost per ton of sugarcane sold in fiscal year 2015, from
Ps. 156 per ton in fiscal year 2014 to Ps. 204 per ton in
fiscal year 2015.
The cost of sales
as a percentage of sales was 85.3% in fiscal year 2014 and 94.9% in
fiscal year 2015.
The cost of
production of the Sugarcane segment increased 78.2%, from
Ps. 101 million in fiscal year 2014 to Ps. 180 million in
fiscal year 2015, mainly as a result of a higher production volume
in fiscal year 2015 compared to fiscal year 2014.
The total cost of
production per ton increased 25.9%, from Ps. 154 per ton in
fiscal year 2014 to Ps. 194 per ton in fiscal year
2015.
Agricultural Rental and Services
The cost of sales
from the Agricultural Rental and Services segment increased by
23.5%, from Ps. 17 million in fiscal year 2014 to Ps. 21
million in fiscal year 2015, mainly as a result
of:
·
higher lease costs
in Brasilagro, which rose by 28.8%, due to the amortization of new
soil improvement works and structural expenses in the Preferencia,
Chaparral, Jatobá and Araucaria farms;
·
lower costs from
seed production services by 2.8%; and
·
a 3.9% increase in
irrigation service costs.
Land Transformation and Sales
Cost of sales from
the Land Transformation and Sales segment increased 12.5%, from
Ps. 8 million in fiscal year 2014 to Ps. 9 million in
fiscal year 2015. Such increase is mainly attributable to a
reclassification due to discontinued activities at the feedlot land
and, to a lesser extent, to increases in salary-related items and
fees.
Agro-industrial
Costs of the
Agro-industrial segment increased 54.0%, from Ps. 480 million
in fiscal year 2014 to Ps. 739 million in fiscal year 2015,
due to an inflationary context that hindered the increase in the
gross marginal contribution.
Others segments
The cost of sales
of the Other segment increased 4.0%, from Ps. 101 million in
fiscal year 2014 to Ps. 105 million in fiscal year 2015,
mainly as a result of a 12% increase in the costs from the
brokerage business related to commodity trading transactions
through our subsidiary FyO and higher costs of consignment
transactions (versus no such transactions in fiscal year 2014)
offset by a reduction in the costs of resale of inputs and others
of 12% and 65%, respectively.
159
Urban
Properties and Investments Business
|
|
|
Fiscal
year ended June 30, 2015
|
||||
|
Costs
|
|
Statement
of Income
|
Interests
in joint ventures
|
Inter-segment
eliminations
|
Maintenance
Fee and Common Advertising Funds
|
Segment
reporting
|
|
|
|
(in
million of Ps.)
|
||||
|
Shopping
Centers
|
|
(1,103)
|
(4)
|
(4)
|
820
|
(291)
|
|
Offices and
Others
|
|
(110)
|
(5)
|
-
|
79
|
(36)
|
|
Sales and
Developments
|
|
(14)
|
(5)
|
-
|
-
|
(19)
|
|
Hotels
|
|
(279)
|
-
|
-
|
-
|
(279)
|
|
International
|
|
(9)
|
-
|
-
|
2
|
(7)
|
|
Financial
Operations and Others
|
|
(1)
|
-
|
-
|
-
|
(1)
|
|
Total
Urban Properties and Investments Business
|
|
(1,516)
|
(14)
|
(4)
|
901
|
(633)
|
|
|
|
Fiscal
year ended June 30, 2014
|
||||
|
Costs
|
|
Statement
of Income
|
Interests
in joint ventures
|
Inter-segment
eliminations
|
Maintenance
Fee and Common Advertising Funds
|
Segment
reporting
|
|
|
|
(in
million of Ps.)
|
||||
|
Shopping
Centers
|
|
(955)
|
(4)
|
(5)
|
667
|
(297)
|
|
Offices and
Others
|
|
(111)
|
(4)
|
-
|
70
|
(45)
|
|
Sales and
Developments
|
|
(19)
|
(16)
|
-
|
-
|
(35)
|
|
Hotels
|
|
(217)
|
-
|
-
|
-
|
(217)
|
|
International
|
|
(61)
|
-
|
-
|
7
|
(54)
|
|
Financial
Operations and Others
|
|
(1)
|
-
|
-
|
-
|
(1)
|
|
Total
Urban Properties and Investments Business
|
|
(1,364)
|
(24)
|
(5)
|
744
|
(649)
|
Cost of sales from
our Urban Properties and Investments business increased 11.1%, from
Ps. 1,364 million in fiscal year 2014 to Ps. 1,516
million in fiscal year 2015. This was mainly due to an increase of
Ps. 62 million in the Hotels segment, slightly offset by a
decrease of Ps. 9 million in the Offices and Others segment, a
decrease of 6 million in the Shopping Centers segment, a decrease
of Ps. 16 million in the Sales and Developments segment, and a
decrease of Ps. 47 million in the International
segment.
On the other hand,
maintenance fees and Common Advertising Funds costs increased
21.1%, from Ps. 744 million in fiscal year 2014 to
Ps. 901 million in fiscal year 2015, mainly due to maintenance
fees and Common Advertising Funds expenses from Shopping Centers,
which increased by 22.9%, from Ps. 667 million in fiscal year
2014 to Ps. 820 in fiscal year 2015, as a result of: (i) an
increase of Ps. 60 million in maintenance, security, cleaning,
repair and similar expenses (mainly attributable to increases in
security and cleaning services and utility rates), (ii) an increase
of Ps. 28 million in advertising expenses, (iii) an increase
of Ps. 30 million in salaries and wages, social security
contributions and other payroll expenses; (iv) an increase of
Ps. 21 million in taxes, rates and contributions and other
expenses, and (v) an increase of Ps. 14 million in other items
(mostly as a result of travel and office supplies
expenses).
In addition, costs
from our joint ventures experienced a net decrease of 41.7%, from
Ps. 24 million in fiscal year 2014 to Ps. 14 million in
fiscal year 2015, mainly as a result of lower costs resulting from
reduced sales of the Horizons development.
Finally, costs from
inter-segment operations decreased by 20.0%, from Ps. 5
million in fiscal year 2014 to Ps. 4 million in fiscal year
2015, mainly as a result of a change in the cost allocation of our
Shopping Centers.
Hence, according to
business segment reporting and considering all our joint ventures
and inter-segment eliminations, costs decreased by 2.5%, from
Ps. 649 million in fiscal year 2014 to Ps. 633 million in
fiscal year 2015.
Shopping Centers
Costs from the
Shopping Centers segment decreased by 2.0%, from Ps. 297
million in fiscal year 2014 to Ps. 291 million in fiscal year
2015. This reduction is mainly attributable to:
·
a reduction of
Ps. 36 million in costs from a deficit in maintenance fees
and Common Advertising Funds from our Shopping Centers;
and
·
a decrease of
Ps. 4 million in our depreciation and amortization
expense;
·
partially offset by
increased costs resulting from: an increase of Ps. 13 million
in maintenance, security, cleaning, repair and similar expenses
(mainly attributable to increases in security and cleaning services
and utility rates); an increase of Ps. 10 million in salaries
and wages, social security contributions and other payroll
expenses; an increase of Ps. 9 million in taxes, rates and
contributions and other expenses (mostly attributable to an
increase in provincial property taxes and municipal utility rates,
among other things), and an increase of Ps. 5 million in fees
and compensation from services.
Costs from the
Shopping Centers segment, as a percentage of revenues derived from
this segment, decreased from 21.5% in fiscal year 2014 to 16.4% in
fiscal year 2015.
Offices and Others
Costs from the
Offices and Others segment decreased by 20.0%, from Ps. 45
million in fiscal year 2014 to Ps. 36 million in fiscal year
2015. Such decrease was attributable to the partial sales of
investment property for rental completed in fiscal year
2015.
Costs attributable
to non-comparable properties decreased by 44.3%, from Ps. 5
million to Ps. 3 million, mainly as a result of the above
mentioned sales.
In the absence of
partial sales, costs - considering comparable properties in both
fiscal years - decreased by 19.3%, from Ps. 37 million to
Ps. 30 million, mainly as a result of a lower amortization and
depreciation expense.
160
Costs from the
Offices and Others segment, as a percentage of segment revenues,
decreased from 16.6% in fiscal year 2014 to 10.8% in fiscal year
2015.
Sales and Developments
Costs attributable
to this segment often vary significantly period over period, given
that the several sales completed by us over the time are not
recurring. Without considering our joint ventures, costs from our
Sales and Developments segment decreased by 26.3% from Ps. 19
million in fiscal year 2014 to Ps. 14 million in fiscal year
2015. Such reduction was mainly attributable to lower costs from
the sale of units of Condominios I and II (Ps. 7 million),
partially offset by higher costs from maintenance of land reserves
and real property for sale (Ps. 5 million).
Costs from our
joint ventures (Horizons) went down by 68.8%, accounting for a
decrease of Ps. 11 million. Hence, total costs from this
segment fell by 45.7%, from Ps. 35 million in fiscal year 2014
to Ps. 19 million in fiscal year 2015.
Costs from the
Sales and Developments segment, as a percentage of revenues derived
from this segment, increased by 40.7% in fiscal year 2014 to 135.7%
in fiscal year 2015.
Hotels
Costs from the
Hotels segment increased by 28.6%, from Ps. 217 million in
fiscal year 2014 to Ps. 279 million in fiscal year 2015,
mainly as a result of:
·
an increase of
Ps. 41 million in salaries and wages, social security
contributions and other payroll expenses;
·
an increase of
Ps. 11 million in the cost of food, beverages and other
hotel-related expenses; and
·
an increase of
Ps. 8 million in maintenance and repair expenses, among other
items.
Costs from the
Hotels segment, as a percentage of revenues derived from this
segment, increased from 65.4% in fiscal year 2014 to 70.5% in
fiscal year 2015.
International
Costs from the
International segment decreased by 87.0%, from Ps. 54 million
in fiscal year 2014 to Ps. 7 million in fiscal year 2015
mostly due to the fact that the results of Rigby 183 LLC –
owner of the rental building Madison 183 - were consolidated for
only 3 months in fiscal year 2015 whereas such results were
consolidated for 12 months in fiscal year 2014. This building was
sold in September 2014. In addition, the three-month period in
fiscal year 2015 does not include amortization and depreciation
since the property had been classified as available for sale as of
June 30, 2014.
Costs from the
International segment, as a percentage of revenues derived from
this segment, decreased from 64.3% in fiscal year 2014 to 26.9% in
fiscal year 2015.
Financial Operations and Others
Costs from the
Financial Operations and Other segment remained stable
at Ps. 1 million during fiscal years 2014 and
2015.
Costs from the
Financial Operations and Other segment, as a percentage of revenues
derived from this segment, do not reflect any significant
percentage amounts.
Initial
recognition and changes in the fair value of biological assets and
agricultural products at the point of harvest
|
|
|
Fiscal
year ended June 30, 2015
|
|||
|
Initial
recognition and changes in the fair value of biological assets and
agricultural products at the point of harvest
|
|
Statement
of Income
|
Interests
in joint ventures
|
Inter-segment
eliminations
|
Segment
reporting
|
|
|
|
(in
million of Ps.)
|
|||
|
Crops
|
|
897
|
21
|
-
|
918
|
|
Cattle
|
|
165
|
2
|
-
|
167
|
|
Dairy
|
|
75
|
-
|
-
|
75
|
|
Sugarcane
|
|
187
|
-
|
-
|
187
|
|
Subtotal
Agricultural Production
|
|
1,324
|
23
|
-
|
1,347
|
|
Land Transformation
and Sales
|
|
-
|
-
|
-
|
-
|
|
Agro-industrial
|
|
-
|
-
|
-
|
-
|
|
Others
segments
|
|
-
|
-
|
-
|
-
|
|
Agricultural rental
and Services
|
|
-
|
-
|
-
|
-
|
|
Subtotal
Others
|
|
-
|
-
|
-
|
-
|
|
Total
Agricultural Business
|
|
1,324
|
23
|
-
|
1,347
|
161
|
|
|
Fiscal
year ended June 30, 2014
|
|||
|
Initial
recognition and changes in the fair value of biological assets and
agricultural products at the point of harvest
|
|
Statement
of Income
|
Interests
in joint ventures
|
Inter-segment
eliminations
|
Segment
reporting
|
|
|
|
(in
million of Ps.)
|
|||
|
Crops
|
|
848
|
20
|
-
|
868
|
|
Cattle
|
|
145
|
-
|
-
|
145
|
|
Dairy
|
|
63
|
-
|
-
|
63
|
|
Sugarcane
|
|
96
|
-
|
-
|
96
|
|
Subtotal
Agricultural Production
|
|
1,152
|
20
|
-
|
1,172
|
|
Land Transformation
and Sales
|
|
-
|
-
|
-
|
-
|
|
Agro-industrial
|
|
-
|
-
|
-
|
-
|
|
Others
segments
|
|
-
|
-
|
-
|
-
|
|
Agricultural rental
and Services
|
|
-
|
-
|
-
|
-
|
|
Subtotal
Others
|
|
-
|
-
|
-
|
-
|
|
Total
Agricultural Business
|
|
1,152
|
20
|
-
|
1,172
|
Our revenues from
initial recognition and changes in the fair value of biological
assets and agricultural products at the point of harvest increased
14.9%, from Ps. 1,152 million in fiscal year 2014 to
Ps. 1,324 million in fiscal year 2015.
In turn, our
revenues from initial recognition and changes in the fair value of
biological assets and agricultural products at the point of harvest
derived from our interests in joint ventures increased 15.0%, from
Ps. 20 million in fiscal year 2014 to Ps. 23 million in
fiscal year 2015.
On the other hand,
there were no inter-segment eliminations in connection with
revenues from initial recognition and changes in the fair value of
biological assets and agricultural products at the point of
harvest.
Hence, according to
business segment reporting and considering all our joint ventures,
revenues from initial recognition and changes in the fair value of
biological assets and agricultural products at the point of harvest
increased by 14.9%, from Ps. 1,172 million in fiscal year 2014
to Ps. 1,347 million in fiscal year 2015.
Crops
Production income
from the Crops segment increased by 5.8%, from Ps. 868 million
in fiscal year 2014 to Ps. 918 million in fiscal
year 2015, mainly as a result of:
·
a 17.9% increase in
the total production volume from 344,165 tons in fiscal year 2014
to 405,882 tons in fiscal year 2015;
·
a 3.3% decrease in
grain production average price; and
·
partially offset by
a 71.1% decrease in expected revenues.
As of June 30, 2015
the harvested area was 100% of our total sown area, compared to
98.9% as of June 30, 2014.
The following table
shows the number of tons produced and total production income as of
June 30, 2015 and 2014:
Crops Production Income
(in tons and
millions of Ps.)
|
|
Fiscal
year ended June 30
|
|||
|
|
2015
|
2014
|
||
|
|
Tons
|
Ps.
|
Tons
|
Ps.
|
|
Corn
|
92,093
|
84
|
79,239
|
79
|
|
Soybean
|
279,356
|
625
|
241,205
|
564
|
|
Wheat
|
16,211
|
13
|
12,373
|
12
|
|
Sorghum
|
1,202
|
1
|
4,058
|
1
|
|
Sunflower
|
11,720
|
27
|
5,884
|
16
|
|
Other
|
5,300
|
20
|
1,406
|
3
|
|
Total
|
405,882
|
770
|
344,165
|
675
|
Estimated results
from the valuation of our crops in progress at fair value decreased
71.2%, from Ps. 170 million in fiscal year 2014 to Ps. 49
million in fiscal year 2015, mainly due to a reduction of 68.4% in
corn crops.
162
Cattle
Production income
from the Cattle segment increased by 15.2%, from Ps. 145
million in fiscal year 2014 to Ps. 167 million in fiscal
year 2015, mainly as a result of:
·
a 51.8% increase in
the average price per kilogram produced, from Ps. 9.7 per
kilogram in fiscal year 2014 to Ps. 14.8 per kilogram in
fiscal year 2015;
·
a 13.8% increase in
cattle production volume from 6,948 tons in fiscal year 2014 to
7,905 tons in fiscal year 2015;
·
offset by a 36.5%
reduction in holding gains.
The calving rate
decreased slightly 3.6%, whereas the death rate decreased by 27.2%
during fiscal year 2015 as compared to fiscal year
2014.
The number of
hectares devoted to Cattle production decreased from 95,745
hectares in fiscal year 2014 to 88,643 hectares in fiscal year 2015
due to a smaller number of leased land devoted to Cattle
production.
Dairy
Production income
from the Dairy segment increased by 19.0%, from Ps. 63 million
in fiscal year 2014 to Ps. 75 million in fiscal year 2015,
mainly as a result of:
·
the result from
holding of milking cows, which increased 3.0%, from a gain of
Ps. 8.6 million in fiscal year 2014 to a gain of Ps. 8.9
million in fiscal year 2015, as the inflationary context led to a
significant rise in prices;
·
a 31.9% increase in
the average price of milk, from Ps. 2.59 per liter in fiscal
year 2014 to Ps. 3.42 per liter in fiscal year 2015;
and
·
an increase of 7.1%
in milk production volumes and a 41.6% increase in the average
price, offset by
·
a 9.3% decrease in
the milk production volume, from 19.3 million of liters in fiscal
year 2014 to 17.5 million of liters in fiscal year 2015. This
reduction in production volume was mainly due to a lower average
number of milking cows per day, from 2,439 in fiscal year 2014 to
2,189 in fiscal year 2015, partially offset by a 9.1% increase in
the efficiency level of average daily milk production per cow, from
19.7 liters in fiscal year 2014 to 21.5 liters in fiscal year
2015.
Sugarcane
Production income
from the Sugarcane segment increased by 94.8%, from Ps. 96
million in fiscal year 2014 to Ps. 187 million in fiscal
year 2015, mainly as a result of:
·
a 41.2% increase in
total production volume from 657,547 tons in fiscal year 2014 to
928,273 tons in fiscal year 2015; and
·
a 23.1% increase in
the average production price of sugarcane.
The 41.2% increase
in the production volume from the Sugarcane segment was
attributable to a 12.3% increase in our average yield from 81.2
ton/ha to 91.2 ton/ha.
The following table
shows the actual tons produced and income as of June 30, 2015 and
2014:
Sugarcane Production Income
(in tons and
millions of Ps.)
|
|
Fiscal
year ended June 30
|
|||
|
|
2015
|
2014
|
||
|
|
Tons
|
Ps.
|
Tons
|
Ps.
|
|
Sugarcane
|
928,273
|
185
|
657,547
|
106
|
Estimated
results from the valuation of our sugarcane crops in progress at
fair value
Estimated results
from the valuation of our sugarcane crops in progress at fair value
increased significantly from a loss of 10 million in fiscal year
2014 to a gain of Ps. 2 million in fiscal year 2015 mainly
generated by Brasilagro. This variation originated mainly in
Brazil, and was caused by the following factors:
·
the number of
estimated hectares went up from a year-on-year decrease of 13.0% in
fiscal year 2014 to a year-on-year increase of 33.4% in fiscal year
2015;
·
the estimated
yields went up from a from a year-on-year decrease of 2.0% in
fiscal year 2014 to a year-on-year increase of 2.4% in fiscal year
2015; and
·
the estimated unit
costs went down from a year-on-year increase of 15.0% in fiscal
year 2014 to a year-on-year increase of 10.0% in fiscal year
2015.
163
Changes
in the net realizable value of agricultural products after
harvest
|
|
|
Fiscal
year ended June 30, 2015
|
|||
|
Changes
in the net realizable value of agricultural products after
harvest
|
|
Statement
of Income
|
Interests
in joint ventures
|
Inter-segment
eliminations
|
Segment
reporting
|
|
|
|
(in
million of Ps.)
|
|||
|
Crops
|
|
(34)
|
-
|
-
|
(34)
|
|
Cattle
|
|
-
|
-
|
-
|
-
|
|
Dairy
|
|
-
|
-
|
-
|
-
|
|
Sugarcane
|
|
-
|
-
|
-
|
-
|
|
Subtotal
Agricultural Production
|
|
(34)
|
-
|
-
|
(34)
|
|
Land Transformation
and Sales
|
|
-
|
-
|
-
|
-
|
|
Agro-industrial
|
|
-
|
-
|
-
|
-
|
|
Others
segments
|
|
-
|
-
|
-
|
-
|
|
Agricultural rental
and Services
|
|
-
|
-
|
-
|
-
|
|
Subtotal
Others
|
|
-
|
-
|
-
|
-
|
|
Total
Agricultural Business
|
|
(34)
|
-
|
-
|
(34)
|
|
|
|
Fiscal
year ended June 30, 2014
|
|||
|
Changes
in the net realizable value of agricultural products after
harvest
|
|
Statement
of Income
|
Interests
in joint ventures
|
Inter-segment
eliminations
|
Segment
reporting
|
|
|
|
(in
million of Ps.)
|
|||
|
Crops
|
|
(17)
|
-
|
-
|
(17)
|
|
Cattle
|
|
-
|
-
|
-
|
-
|
|
Dairy
|
|
-
|
-
|
-
|
-
|
|
Sugarcane
|
|
-
|
-
|
-
|
-
|
|
Subtotal
Agricultural Production
|
|
(17)
|
-
|
-
|
(17)
|
|
Land Transformation
and Sales
|
|
-
|
-
|
-
|
-
|
|
Agro-industrial
|
|
-
|
-
|
-
|
-
|
|
Others
segments
|
|
-
|
-
|
-
|
-
|
|
Agricultural rental
and Services
|
|
-
|
-
|
-
|
-
|
|
Subtotal
Others
|
|
-
|
-
|
-
|
-
|
|
Total
Agricultural Business
|
|
(17)
|
-
|
-
|
(17)
|
Income from changes
in the net realizable value of agricultural products after harvest
decreased significantly, from a loss of Ps. 17 million in
fiscal year 2014 to a loss of Ps. 34 million in fiscal year
2015. This was caused mainly by a reduction of
Ps. 17 million in the Crops segment (mainly due to the first
quarter’s 21% reduction in the net realizable value of corn
in Argentina).
No interest in
joint ventures or inter-segment elimination was recorded in income
from changes in the net realizable value of agricultural products
after harvest.
Gross
Profit
As a result of the
above mentioned factors, our gross profit increased 18.5%, from
Ps. 1,859 million in fiscal year 2014 to Ps. 2,203
million in fiscal year 2015. This was caused mainly
by:
·
a 17.7% decrease in
the Agricultural Business, from Ps. 351 million income in
fiscal year 2014 to Ps. 289 million income in fiscal year
2015; and
·
a 26.9% increase in
the Urban Properties and Investments business, from a
Ps. 1,508 million income in fiscal year 2014 to a
Ps. 1,914 million income in fiscal year
2015.
Agricultural
Business
As a result of the
above mentioned factors, gross profit decreased 17.7%, from
Ps. 351 million in fiscal year 2014 to Ps. 289 million in
fiscal year 2015.
Crops
Gross profit from
this segment decreased by 65.1%, from Ps. 149 million in
fiscal year 2014 to Ps. 52 million in fiscal year
2015.
Cattle
Gross profit from
this segment increased by 14.9%, from Ps. 74 million in fiscal
year 2014 to Ps. 85 million in fiscal year 2015.
164
Dairy
Gross profit from
this segment increased by 7.7%, from Ps. 13 million in fiscal
year 2014 to Ps. 14 million in fiscal year 2015.
Sugarcane
Gross profit from
this segment increased by 30.8%, from Ps. 13 million in fiscal
year 2014 to Ps. 17 million in fiscal year 2015.
Agricultural Rental and Services
Gross profit from
this segment increased by 233.3%, from Ps. 12 million in
fiscal year 2014 to Ps. 40 million in fiscal year
2015.
Land Transformation and Sales
Gross loss from
this segment increased by 12.5%, from Ps. 8 million in fiscal
year 2014 to Ps. 9 million in fiscal year 2015.
Agro-industrial
Gross profit from
this segment decreased by 9.5%, from Ps. 74 million in fiscal
year 2014 to Ps. 67 million in fiscal year 2015.
Other
Gross profit from
this segment decreased by 4.2%, from Ps. 24 million in fiscal
year 2014 to Ps. 23 million in fiscal year 2015.
Urban
Properties and Investments Business
Gross profit from
the Urban Properties and Investments business increased 26.9% from
Ps. 1,508 million in fiscal year 2014 to Ps. 1,914
million in fiscal year 2015. This was mainly due to an increase of
Ps. 401 million in the Shopping Centers segment; an increase
of Ps. 71 million in the Offices and Others segment; an
increase of Ps. 2 million in the Hotels segment, partially
offset by a reduction of Ps. 56 million in the Sales and
Developments segment, a reduction of Ps. 11 million in the
International segment and a reduction of Ps. 1 million in the
Financial Operations and Others segment.
Shopping Centers
Gross profit from
the Shopping Centers segment increased by 36.9%, from
Ps. 1,086 million in fiscal year 2014 to Ps. 1,487
million in fiscal year 2015.
Offices and Others
Gross profit from
the Offices and Others segment increased by 31.4%, from
Ps. 226 million in fiscal year 2014 to Ps. 297 million in
fiscal year 2015.
Sales and Developments
Gross profit from
the Sales and Developments segment fell by 109.8% from a gain of
Ps. 51 million in fiscal year 2014 to a loss of Ps. 5
million in fiscal year 2015.
Hotels
Gross profit from
the Hotels segment increased by 1.7%, from Ps. 115 million in
fiscal year 2014 to Ps. 117 million in fiscal year
2015.
International
Gross profit from
the International segment decreased by 36.7%, from Ps. 30
million in fiscal year 2014 to Ps. 19 million in fiscal year
2015.
Financial Operations and Others
Gross loss from the
Financial Operations and Others segment increased by Ps. 1
million in fiscal year 2015.
Gain
from disposal of investment properties
Gain from disposal
of investment properties derived from the Sales and Developments
segment increased 397.8%, from a Ps. 231 million income in
fiscal year 2014 to a Ps. 1,150 million income in fiscal year
2015, as a result of the sale of functional units at Maipu 1300,
Intercontinental Plaza, Bouchard 551 and the sale of the 183
Madison building.
Gain
from disposal of farmlands
Gain from disposal
of farmlands derived from the Land Transformation and Sales segment
increased 526.4%, from Ps. 91 million income in fiscal year
2014 to Ps. 570 million income in fiscal year 2015, mainly as
a result of:
165
During fiscal year 2015
·
On April 3, 2014,
Cresca S.A. executed a deed of sale for an area of 24,624 hectares
located in Chaco Paraguayo. The total price was US$ 14.7
million payable as follows: US$ 1.8 million was cashed upon
the execution of the deed of sale; US$ 4.3 million at the time
of the title conveyance; US$ 3.7 million on July 2015
interest-free; and US$ 4.9 million on July 2016 interest-free.
Possession was surrendered upon the execution of the title deed and
upon the creation of a mortgage as guarantee of the remaining
balance on July 14, 2014. We recorded a gain of Ps. 19.1
million as a result of this transaction.
·
On June 10, 2015,
Brasilagro sold the remaining area of 27,745 hectares of the Cremaq
farm located in the municipal district of Baixa Grande do Ribeiro
(Piaui). The transaction price was Rs. 270 million (equivalent to
Ps. 694.0 million), out of which Rs. 67.5 million was cashed
(equivalent to Ps. 196.8 million), with the balance being
payable in an estimated term of 90 days. We recorded a gain of
Ps. 525.9 million as a result of this
transaction.
·
On October 17,
2013, Yuchán Agropecuaria executed an agreement providing for
the sale, subject to retention of title, of an 1,643 hectare
property in the “La Fon Fon II” farm for a total price
of US$ 7.21 million (equivalent to Ps. 59.0 million). As
of the date of issuance of these financial statements, the amount
of US$ 1.5 million was cashed, with the remaining balance of
US$ 5.71 million being payable in six semi-annual installments
beginning in December this year and ending in June 2018. The
agreement provides that title conveyance will be registered once
the full price has been paid. On June 24, 2015, Yuchán
Agropecuarria surrendered the possession of the property. We
recorded a gain of US$ 2.7 million (equivalent to
Ps. 24.6 million) as a result of this transaction in this
fiscal year.
During fiscal year 2014
·
On June 27, 2014,
Brasilagro sold a fraction of 1,164 hectares in the
“Araucaria” farm located in the municipal district of
Mineiros, State of Goias, Brazil, that had been purchased in 2007.
After the sale, the farm has a total area of 8,178 hectares, out of
which approximately 5,982 hectares are arable land. The sale price
was Rs. 32.5 million (equivalent to Ps. 117.5 million).
In July 2014, the buyer made an initial payment of Rs. 4.5
million, and the remaining balance is payable in five installments,
the first of which, for Rs. 4.5 million, matures in November
2014 and the last one at the time of execution of the title deed,
in August 2018. We recorded a gain of Rs. 21.0 million
(equivalent to Ps. 75.8 million) for the sale of the Araucaria
farm.
·
On May 27, 2014,
Ombú Agropecuaria Argentina S.A. executed an agreement
providing for the sale, subject to retention of title, of an 882.96
hectare property in the “San Cayetano I” farm for a
total price of US$ 4.2 million. Out of this amount, the sum of
US$ 1 million has been already collected and the balance is
payable in 5 consecutive semi-annual installments, the last of
which falls due in November 2016. The agreement provides that title
conveyance will be registered once the full price has been paid.
Possession was surrendered on the date of execution of the
agreement. We recorded a gain of US$ 1.8 million for this
sale.
General
and Administrative Expenses
Our total general
and administrative expenses increased 15.5%, from Ps. 541
million for fiscal year 2014 to Ps. 625 million for fiscal
year 2015. This was mainly due to an increase of Ps. 6 million
in the Agricultural business and an increase of Ps. 78 million
in the Urban Properties and Investments business.
Agricultural
Business
|
|
|
Fiscal
year ended June 30, 2015
|
|||
|
General
and Administrative Expenses
|
|
Statement
of Income
|
Interests
in joint ventures
|
Inter-segment
eliminations
|
Segment
reporting
|
|
|
|
(in
million of Ps.)
|
|||
|
Crops
|
|
(156)
|
(3)
|
-
|
(159)
|
|
Cattle
|
|
(26)
|
-
|
-
|
(26)
|
|
Dairy
|
|
(5)
|
-
|
-
|
(5)
|
|
Sugarcane
|
|
(20)
|
-
|
-
|
(20)
|
|
Subtotal
Agricultural Production
|
|
(207)
|
(3)
|
-
|
(210)
|
|
Land Transformation
and Sales
|
|
(2)
|
-
|
-
|
(2)
|
|
Agro-industrial
|
|
(25)
|
-
|
-
|
(25)
|
|
Others
segments
|
|
(8)
|
-
|
-
|
(8)
|
|
Agricultural rental
and Services
|
|
(2)
|
-
|
-
|
(2)
|
|
Subtotal
Others
|
|
(35)
|
-
|
-
|
(35)
|
|
Total
Agricultural Business
|
|
(244)
|
(3)
|
-
|
(247)
|
|
|
|
Fiscal
year ended June 30, 2014
|
|||
|
General
and Administrative Expenses
|
|
Statement
of Income
|
Interests
in joint ventures
|
Inter-segment
eliminations
|
Segment
reporting
|
|
|
|
(in
million of Ps.)
|
|||
|
Crops
|
|
(146)
|
(1)
|
-
|
(147)
|
|
Cattle
|
|
(26)
|
(1)
|
-
|
(27)
|
|
Dairy
|
|
(6)
|
-
|
-
|
(6)
|
|
Sugarcane
|
|
(28)
|
-
|
-
|
(28)
|
|
Subtotal
Agricultural Production
|
|
(206)
|
(2)
|
-
|
(208)
|
|
Land Transformation
and Sales
|
|
(1)
|
-
|
-
|
(1)
|
|
Agro-industrial
|
|
(17)
|
-
|
-
|
(17)
|
|
Others
segments
|
|
(9)
|
(2)
|
-
|
(11)
|
|
Agricultural rental
and Services
|
|
(4)
|
-
|
-
|
(4)
|
|
Subtotal
Others
|
|
(30)
|
(2)
|
-
|
(32)
|
|
Total
Agricultural Business
|
|
(237)
|
(4)
|
-
|
(241)
|
166
General and
administrative expenses from our Agricultural business increased
1.7%, from Ps. 237 million in fiscal year 2014 to Ps. 244
million in fiscal year 2015. This was mainly due to an increase of
Ps. 10 million in the Crops segment, an increase of Ps. 1
million in the Land Transformation and Sales segment, an increase
of Ps. 8 million in the Agro-industrial segment, slightly
offset by a reduction of Ps. 1 million in the Cattle segment,
a reduction of Ps. 1 million in the Dairy segment, a reduction
of Ps. 8 million in the Sugarcane segment, a reduction of
Ps. 2 million in the Agricultural Rental and Services segment,
and a reduction of Ps. 1 million in the Other segment. The
main causes of this variation were:
·
the changes in
Doneldon’s administrative expenses from Bolivia since a
severance payment was accrued for (HF) and bonus allowances started
to be set up (US); bonuses for fiscal year 2014 were paid for
(which had not been accrued for because of a subsequent change in
the Company’s policy) and bonuses for fiscal year 2015 were
accrued for in fiscal year 2015;
·
an increase in
Carnes Pampeanas S.A.’s headcount to support the increase in
operation volume and overtime; and
·
a 26% rise in
expenses as a result of the inflationary
context.
In turn, general
and administrative expenses from our joint ventures decreased by
Ps. 1 million, from Ps. 4 million in fiscal year 2015 to
Ps. 3 million in fiscal year 2016.
On the other hand,
no general and administrative expenses arose from inter-segment
eliminations.
Hence, according to
business segment reporting and considering all our joint ventures,
general and administrative expenses increased by 3.0%, from
Ps. 241 million in fiscal year 2014 to Ps. 247 million in
fiscal year 2015.
167
Urban
Properties and Investments Business
|
|
|
|
Fiscal
year ended June 30, 2015
|
|||||
|
General
and Administrative Expenses
|
|
Statement
of Income
|
Interests
in joint ventures
|
Inter-segment
eliminations
|
Segment
reporting
|
|||
|
|
|
(in
million of Ps.)
|
||||||
|
Shopping
Centers
|
|
(135)
|
-
|
-
|
(135)
|
|||
|
Offices and
Others
|
|
(58)
|
-
|
(1)
|
(59)
|
|||
|
Sales and
Developments
|
|
(48)
|
(1)
|
(1)
|
(50)
|
|||
|
Hotels
|
|
(77)
|
-
|
(1)
|
(78)
|
|||
|
International
|
|
(56)
|
-
|
-
|
(56)
|
|||
|
Financial
Operations and Others
|
|
-
|
-
|
-
|
-
|
|||
|
Total
Urban Properties and Investments Business
|
|
(374)
|
(1)
|
(3)
|
(378)
|
|||
|
|
|
|
Fiscal
year ended June 30, 2014
|
||||||
|
General
and Administrative Expenses
|
|
Statement
of Income
|
Interests
in joint ventures
|
Inter-segment
eliminations
|
Segment
reporting
|
||||
|
|
|
(in
million of Ps.)
|
|||||||
|
Shopping
Centers
|
|
(101)
|
-
|
(1)
|
(102)
|
||||
|
Offices and
Others
|
|
(42)
|
-
|
-
|
(42)
|
||||
|
Sales and
Developments
|
|
(36)
|
(1)
|
-
|
(37)
|
||||
|
Hotels
|
|
(59)
|
-
|
(1)
|
(60)
|
||||
|
International
|
|
(59)
|
-
|
-
|
(59)
|
||||
|
Financial
Operations and Others
|
|
-
|
-
|
-
|
-
|
||||
|
Total
Urban Properties and Investments Business
|
|
(297)
|
(1)
|
(2)
|
(300)
|
||||
General and
administrative expenses from our Urban Properties and Investments
Business increased 25.9%, from Ps. 297 million in fiscal year
2014 to Ps. 374 million in fiscal year 2015. This was mainly
due to an increase of Ps. 34 million in the Shopping Centers
segment; an increase of Ps. 16 million in the Offices and
Others segment; an increase of Ps. 18 million in the Hotels
segment, an increase of Ps. 12 million in the Sales and
Developments segment, partially offset by a reduction of Ps. 3
million in the International segment.
On the other hand,
administrative expenses from our joint ventures did not change in
fiscal year 2015 compared to fiscal year 2014, remaining stable at
Ps. 1 million.
Hence, according to
business segment reporting and considering all our joint ventures
and inter-segment eliminations, administrative expenses increased
by 26.0%, from Ps. 300 million in fiscal year 2014 to
Ps. 378 million in fiscal year 2015. Based on the reported
business segment reporting and considering our joint ventures and
inter-segment eliminations, administrative expenses as a percentage
of sales increased from 13.9% in fiscal year 2014 to 14.8% in
fiscal year 2015.
Shopping Centers
Administrative
expenses from the Shopping Centers segment increased by 32.4%, from
Ps. 102 million in fiscal year 2014 to Ps. 135 million in
fiscal year 2015, mainly due to:
·
an increase of
Ps. 25 million in Directors’ fees;
·
an increase of
Ps. 3 million in fees and compensation from
services;
·
an increase of
Ps. 2 million in amortization and depreciation,
and
·
an increase of
Ps. 3 million in other miscellaneous items, such as,
maintenance, security, cleaning, repair and similar expenses, and
taxes, rates and contributions.
Administrative
expenses from the Shopping Centers segment as a percentage of
segment revenues increased from 7.3% in fiscal year 2014 to 7.7% in
fiscal year 2015.
Offices and Others
Administrative
expenses from the Offices and Others segment increased by 40.5%,
from Ps. 42 million in fiscal year 2014 to Ps. 59 million
in fiscal year 2015, mainly due to: (i) an increase of Ps. 5
million in fees and compensation from services; (ii) an increase of
Ps. 5 million in salaries and wages, social security
contributions and other payroll expenses; (iii) an increase of
Ps. 2 million in Directors’ fees; (iv) an increase of
Ps. 2 million in travel and office supplies expenses, and (v)
an increase of Ps. 2 million in bank expenses.
As a percentage of
segment revenues, general and administrative expenses increased
from 15.4% in fiscal year 2014 to 17.7% in fiscal year
2015.
Sales and Developments
General and
administrative expenses from the Sale and Developments segment
increased by 35.1%, from Ps. 37 million in fiscal year 2014 to
Ps. 50 million in fiscal year 2015, mainly due to: (i) an
increase of Ps. 4 million in fees and compensation from
services; (ii) an increase of Ps. 2 million in salaries and
wages, social security contributions and other payroll expenses;
(iii) an increase of Ps. 2 million in Directors’ fees;
(iv) an increase of Ps. 2 million in travel and office
supplies expenses, and (v) an increase of Ps. 1 million in
bank expenses. General and administrative expenses from the Sales
and Developments segment, as a percentage of revenues derived from
this segment, increased from 43.9% in fiscal year 2014 to 362.5% in
fiscal year 2015.
Considering the
gain from disposal of investment properties, such percentages
decreased from 4% in fiscal year 2014 to 0.5% in fiscal year
2015.
Hotels
General and
administrative expenses from the Hotels segment increased by 30%,
from Ps. 60 million in fiscal year 2014 to Ps. 78 million
in fiscal year 2015, mainly due to:
·
an increase of
Ps. 10 million in salaries and wages, social security
contributions and other payroll expenses;
·
an increase of
Ps. 3 million in maintenance and repair expenses,
and
·
an increase of
Ps. 2 million in the cost of fees from services and an
increase of Ps. 1 million in the cost of food, beverages and
other hotel-related expenses, among other
items.
General and
administrative expenses from the Hotels segment, as a percentage of
revenues derived from this segment, increased from 18.0% in fiscal
year 2014 to 19.6% in fiscal year 2015.
International
General and
administrative expenses from the International segment decreased by
Ps. 3 million from Ps. 59 million in fiscal year 2014 to
Ps. 56 million in fiscal year 2015, mostly due to the fact
that the results of Rigby 183 LLC – owner of the rental
building Madison 183 which was sold in September 2014- were
consolidated for only three months in fiscal year 2015 whereas such
results were consolidated for 12 months in fiscal year 2014, and to
lower expenses incurred in connection with our interest in
IDBD.
General and
administrative expenses from the International segment, as a
percentage of revenues derived from this segment, increased from
70.9% in fiscal year 2014 to 215.5% in fiscal year
2015.
Selling
expenses
Our total selling
expenses increased 33.6%, from Ps. 360 million for fiscal year
2014 to Ps. 481 million for fiscal year 2015. This was mainly
due to an increase of Ps. 76 million in the Agricultural
business and an increase of Ps. 45 million in the Urban
Properties and Investments business.
Agricultural
Business
|
|
|
|
Fiscal
year ended June 30, 2015
|
||||||||||
|
|
Selling
Expenses
|
|
Statement
of Income
|
Interests
in joint ventures
|
Inter-segment
eliminations
|
Segment
reporting
|
|||||||
|
|
|
|
(in
million of Ps.)
|
||||||||||
|
|
Crops
|
|
(157)
|
(3)
|
(1)
|
(161)
|
|||||||
|
|
Cattle
|
|
(20)
|
-
|
-
|
(20)
|
|||||||
|
|
Dairy
|
|
(4)
|
-
|
-
|
(4)
|
|||||||
|
|
Sugarcane
|
|
(8)
|
-
|
-
|
(8)
|
|||||||
|
|
Subtotal
Agricultural Production
|
|
(189)
|
(3)
|
(1)
|
(193)
|
|||||||
|
|
Land Transformation
and Sales
|
|
(1)
|
(1)
|
-
|
(2)
|
|||||||
|
|
Agro-industrial
|
|
(77)
|
-
|
-
|
(77)
|
|||||||
|
|
Others
segments
|
|
(13)
|
-
|
-
|
(13)
|
|||||||
|
|
Agricultural rental
and Services
|
|
(1)
|
-
|
-
|
(1)
|
|||||||
|
|
Subtotal
Others
|
|
(91)
|
-
|
-
|
(91)
|
|||||||
|
|
Total
Agricultural Business
|
|
(281)
|
(4)
|
(1)
|
(286)
|
|||||||
|
|
|
Fiscal
year ended June 30, 2014
|
|
||||||||||
|
Selling
Expenses
|
|
Statement
of Income
|
Interests
in joint ventures
|
Inter-segment
eliminations
|
Segment
reporting
|
|
|||||||
|
|
|
(in
million of Ps.)
|
|
||||||||||
|
Crops
|
|
(113)
|
(2)
|
-
|
(115)
|
|
|||||||
|
Cattle
|
|
(14)
|
-
|
-
|
(14)
|
|
|||||||
|
Dairy
|
|
(2)
|
-
|
-
|
(2)
|
|
|||||||
|
Sugarcane
|
|
(8)
|
-
|
-
|
(8)
|
|
|||||||
|
Subtotal
Agricultural Production
|
|
(137)
|
(2)
|
-
|
(139)
|
|
|||||||
|
Land Transformation
and Sales
|
|
(4)
|
-
|
-
|
(4)
|
|
|||||||
|
Agro-industrial
|
|
(55)
|
-
|
-
|
(55)
|
|
|||||||
|
Others
segments
|
|
(11)
|
-
|
-
|
(11)
|
|
|||||||
|
Agricultural rental
and Services
|
|
(1)
|
-
|
-
|
(1)
|
|
|||||||
|
Subtotal
Others
|
|
(67)
|
-
|
-
|
(67)
|
|
|||||||
|
Total
Agricultural Business
|
|
(208)
|
(2)
|
-
|
(210)
|
|
|||||||
168
Selling expenses
from our Agricultural business increased 35.1% from Ps. 208
million in fiscal year 2014 to Ps. 281 million in fiscal year
2015. This was caused mainly by an increase of Ps. 44 million
in the Crops segment, an increase of Ps. 6 million in the
Cattle segment, an increase of Ps. 2 million in the Dairy
segment, an increase of Ps. 22 million in the Agro-industrial
segment, and an increase of Ps. 2 million in the Other
segment, partially offset by a reduction of Ps. 3 million in
the Land Transformation and Sales segment.
In turn, selling
expenses from our interests in joint ventures increased by 100%
from Ps. 2 million in fiscal year 2014 to Ps. 4 million
in fiscal year 2015, in connection with our Cresca joint
venture.
On the other hand,
inter-segment eliminations increased by Ps. 1 million in
fiscal year 2015 compared to fiscal year 2014, in which there had
been no inter-segment eliminations from selling
expenses.
Hence, according to
business segment reporting and considering all our joint ventures
and inter-segment eliminations, selling expenses increased by
36.2%, from Ps. 210 million in fiscal year 2014 to
Ps. 286 million in fiscal year 2015.
Urban
Properties and Investments Business
|
|
|
Fiscal
year ended June 30, 2015
|
|||
|
Selling
expenses
|
|
Statement
of Income
|
Interests
in joint ventures
|
Inter-segment
eliminations
|
Segment
reporting
|
|
|
|
(in
million of Ps.)
|
|||
|
Shopping
Centers
|
|
(112)
|
(1)
|
-
|
(113)
|
|
Offices and
Others
|
|
(21)
|
-
|
-
|
(21)
|
|
Sales and
Developments
|
|
(8)
|
(1)
|
-
|
(9)
|
|
Hotels
|
|
(52)
|
-
|
-
|
(52)
|
|
International
|
|
-
|
-
|
-
|
-
|
|
Financial
Operations and Others
|
|
-
|
-
|
-
|
-
|
|
Total
Urban Properties and Investment Business
|
|
(193)
|
(2)
|
-
|
(195)
|
|
|
|
Fiscal
year ended June 30, 2014
|
|||
|
Selling
expenses
|
|
Statement
of Income
|
Interests
in joint ventures
|
Inter-segment
eliminations
|
Segment
reporting
|
|
|
|
(in
million of Ps.)
|
|||
|
Shopping
Centers
|
|
(72)
|
(1)
|
-
|
(73)
|
|
Offices and
Others
|
|
(21)
|
-
|
-
|
(21)
|
|
Sales and
Developments
|
|
(11)
|
(3)
|
-
|
(14)
|
|
Hotels
|
|
(42)
|
-
|
-
|
(42)
|
|
International
|
|
-
|
-
|
-
|
-
|
|
Financial
Operations and Others
|
|
-
|
-
|
-
|
-
|
|
Total
Urban Properties and Investment Business
|
|
(146)
|
(4)
|
-
|
(150)
|
169
Selling expenses
from our Urban Properties and Investments business increased 32.2%,
from Ps. 146 million in fiscal year 2014 to Ps. 193
million in fiscal year 2015. This was mainly due to an increase of
Ps. 40 million in the Shopping Centers segment, an increase of
Ps. 10 million in the Hotels segment, partially offset by a
reduction of Ps. 3 million in the Sales and Developments
segment.
On the other hand,
selling expenses from our joint ventures went down by 50%, from
Ps. 4 million in fiscal year 2014 (out of which Ps. 2
million was allocated to the Sales and Developments segment) to
Ps. 2 million (out of which Ps. 1 million was allocated
to the Sales and Developments segment) in fiscal year 2015. This
reduction is mainly attributable to lower expenses from our Cyrsa
S.A. joint venture as a result of the recognition of fewer sales
from the Horizons development in fiscal year 2015.
Hence, based on the
information by segment, selling expenses increased by 30.0% from
Ps. 150 million in fiscal year 2014 to Ps. 195 million in
fiscal year 2015. Based on the information by segment, selling
expenses as a percentage of revenues experienced a slight increase
from 7.0% in fiscal year 2014 to 7.7% in fiscal year
2015.
Shopping Centers
Selling
expenses from the Shopping Centers segment increased by 54.8%, from
Ps. 73 million in fiscal year 2014 to Ps. 113 million in
fiscal year 2015, mainly due to:
·
an increase of
Ps. 18 million in taxes, rates and contributions, mainly due
to a higher turnover tax liability;
·
an increase of
Ps. 8 million in advertising expenses;
·
an increase of
Ps. 5 million in bad debtors; and
·
an increase of
Ps. 6 million in salaries and wages, social security
contributions and other payroll expenses.
Selling expenses
from the Shopping Centers segment as a percentage of revenues
derived from that segment increased from 5.3 % in fiscal year 2014
to 6.3% in fiscal year 2015.
Offices and Others
Selling expenses
from our Offices and Others segment remained stable during fiscal
years 2015 and 2014, amounting to Ps. 21 million.
Selling expenses
from the Offices and Others segment, as a percentage of revenues
derived from this segment, decreased from 7.6% in fiscal year 2014
to 6.3% in fiscal year 2015.
Sales and Developments
Selling
expenses from the Sales and Developments segment decreased by
35.7%, from Ps. 14 million in fiscal year 2014 to Ps. 9
million in fiscal year 2015, mainly as a result of a reduction in
expenses directly related to the sales volume: taxes, rates and
contributions by Ps. 3 million and sales commissions by
Ps. 1 million.
Selling
expenses from the Sales and Developments segment, as a percentage
of revenues derived from this segment, increased from 16.0% in
fiscal year 2014 to 66.7% in fiscal year 2015.
Hotels
Selling expenses
from our Hotels segment increased by 23.8%, from Ps. 42
million in fiscal year 2014 to Ps. 52 million in fiscal year
2015, mainly due to:
·
an increase of
Ps. 3 million in advertising and other selling
expenses;
·
an increase of
Ps. 3 million in taxes, rates and contributions;
and
·
an increase of
Ps. 3 million in salaries and wages, social security
contributions and other payroll expenses, among other
items.
Selling expenses
from our Hotels segment as a percentage of revenues derived from
this segment stood at around 13% in both fiscal years.
Financial Operations and Others
Selling expenses
from our Financial Operations and Others segment did not suffer
significant changes in fiscal years 2015 and 2014.
Other
operating results, net
Our other operating
results, net increased Ps. 88 million, from a Ps. 78
million loss in fiscal year 2014 to a Ps. 10 million income in
fiscal year 2015. This was mainly due to a Ps. 10
million increase in the Agricultural business and a Ps. 78
million increase in the Urban Properties and Investment
business.
170
Agricultural
Business
|
|
|
Fiscal
year ended June 30, 2015
|
|||
|
Other
operating results, net
|
|
Statement
of Income
|
Interests
in joint ventures
|
Inter-segment
eliminations
|
Segment
reporting
|
|
|
|
(in
million of Ps.)
|
|||
|
Crops
|
|
(7)
|
(1)
|
(1)
|
(9)
|
|
Cattle
|
|
(2)
|
(1)
|
-
|
(3)
|
|
Dairy
|
|
(1)
|
-
|
-
|
(1)
|
|
Sugarcane
|
|
(2)
|
-
|
-
|
(2)
|
|
Subtotal
Agricultural Production
|
|
(12)
|
(2)
|
(1)
|
(15)
|
|
Land Transformation
and Sales
|
|
(5)
|
-
|
-
|
(5)
|
|
Agro-industrial
|
|
-
|
-
|
-
|
-
|
|
Others
segments
|
|
1
|
-
|
-
|
1
|
|
Agricultural rental
and Services
|
|
-
|
-
|
-
|
-
|
|
Subtotal
Others
|
|
1
|
-
|
-
|
1
|
|
Total
Agricultural Business
|
|
(16)
|
(2)
|
(1)
|
(19)
|
|
|
|
Fiscal
year ended June 30, 2014
|
|||
|
Other
operating results, net
|
|
Statement
of Income
|
Interests
in joint ventures
|
Inter-segment
eliminations
|
Segment
reporting
|
|
|
|
(in
million of Ps.)
|
|||
|
Crops
|
|
(27)
|
1
|
(1)
|
(27)
|
|
Cattle
|
|
(2)
|
-
|
-
|
(2)
|
|
Dairy
|
|
-
|
-
|
-
|
-
|
|
Sugarcane
|
|
-
|
-
|
-
|
-
|
|
Subtotal
Agricultural Production
|
|
(29)
|
1
|
(1)
|
(29)
|
|
Land Transformation
and Sales
|
|
-
|
-
|
-
|
-
|
|
Agro-industrial
|
|
(1)
|
-
|
-
|
(1)
|
|
Others
segments
|
|
1
|
-
|
-
|
1
|
|
Agricultural rental
and Services
|
|
-
|
-
|
-
|
-
|
|
Subtotal
Others
|
|
-
|
-
|
-
|
-
|
|
Total
Agricultural Business
|
|
(29)
|
1
|
(1)
|
(29)
|
Other operating
results, net from the Agricultural business increased from a loss
of Ps. 29 million in fiscal year 2014 to a loss of Ps. 16
million in fiscal year 2015, mainly as a result of a Ps. 20
million decrease in the Croops segment, partially offset by a
Ps. 2 million increase in the Sugarcane segment, Ps. 5
million in the Land Transformation and Sales segment.
In turn, other
operating results, net from our interests in joint ventures
increased by 300% from a Ps. 1 million income in fiscal year
2014 to a Ps. 2 million loss in fiscal year 2015, in
connection with our Cresca joint venture.
On the other hand,
no inter-segment eliminations arose from operating results,
net.
Hence, according to
business segment reporting and considering all our joint ventures,
other operating results, net increased from a Ps. 29 million
loss in fiscal year 2014 to a Ps. 19 million loss in fiscal
year 2015.
Crops
Other operating
results, net of the Crops segment decreased Ps. 20 million,
from a Ps. 27 million loss in fiscal year 2014 to a Ps. 7
million loss in fiscal year 2015, mainly as a result of the
commodity derivatives held by Brasilagro and Cresud (Ps. 23
million), partially offset by the charge to income of the reversal
of Brasilagro’s contingency liability in fiscal year
2014.
Sugarcane
Other operating
results, net of the Sugarcane segment increased by Ps. 2
million, from a Ps. 0.1 million gain in fiscal year 2014 to a
Ps. 2 million loss in fiscal year 2015.
The rest of the
segments of the Agricultural business did not record significant
changes.
Urban
Properties and Investments Business
|
|
|
Fiscal
year ended June 30, 2015
|
|
||||||||
|
Other
operating results, net
|
|
Statement
of Income
|
Interests
in joint ventures
|
Inter-segment
eliminations
|
Segment
reporting
|
|
|||||
|
|
|
(in
million of Ps.)
|
|
||||||||
|
Shopping
Centers
|
|
(48)
|
(1)
|
-
|
(49)
|
|
|||||
|
Offices and
Others
|
|
(120)
|
1
|
1
|
(118)
|
|
|||||
|
Sales and
Developments
|
|
13
|
-
|
-
|
13
|
|
|||||
|
Hotels
|
|
-
|
-
|
-
|
-
|
|
|||||
|
International
|
|
185
|
-
|
-
|
185
|
|
|||||
|
Financial
Operations and Others
|
|
(2)
|
-
|
-
|
(2)
|
|
|||||
|
Total
Urban Properties and Investments Business
|
|
28
|
-
|
1
|
29
|
|
|||||
|
|
|
Fiscal
year ended on June 30, 2014
|
|||||||||
|
Other
operating results, net
|
|
Statement
of Income
|
Interests
in joint ventures
|
Inter-segment
eliminations
|
Segment
reporting
|
||||||
|
|
|
(in
million of Ps.)
|
|||||||||
|
Shopping
Centers
|
|
(46)
|
(1)
|
-
|
(47)
|
||||||
|
Offices and
Others
|
|
(1)
|
(3)
|
1
|
(3)
|
||||||
|
Sales and
Developments
|
|
8
|
-
|
-
|
8
|
||||||
|
Hotels
|
|
(3)
|
-
|
-
|
(3)
|
||||||
|
International
|
|
(1)
|
-
|
-
|
(1)
|
||||||
|
Financial
Operations and Others
|
|
(3)
|
-
|
-
|
(3)
|
||||||
|
Total
Urban Properties and Investments Business
|
|
(46)
|
(4)
|
1
|
(49)
|
||||||
171
Other operating
results, net from the Urban Properties and Investments business
increased by Ps. 74 million from a Ps. 46 million loss in
fiscal year 2014 to a Ps. 28 million gain in fiscal year 2015,
mainly as a result of a Ps. 185 million gain derived from the
International segment.
The effect from the
consolidation of our joint ventures is not material on this line.
According to business segment reporting and considering all our
joint ventures and inter-segment eliminations, other operating
results, net improved from a Ps. 49 million loss in fiscal
year 2014 to a Ps. 29 million gain in fiscal year
2015.
Shopping Centers
The net loss from
other operating results of the Shopping Centers segment increased
by 4.3%, from Ps. 46 million in fiscal year 2014 to
Ps. 48 million in fiscal year 2015, mainly as a result of a
Ps. 3 million increase in the donation charge.
The net loss from
other operating results, as a percentage of revenues derived from
the Shopping Centers segment, decreased from 3.3% in fiscal year
2014 to 2.7% in fiscal year 2015.
Offices and Others
The net loss from
other operating results of our Offices and Others segment increased
Ps. 119 million from Ps. 1 million in fiscal year 2014 to
Ps. 120 million in fiscal year 2015, mainly as a result of
expenses incurred in the transfer of assets from IRSA to IRSA CP
for Ps. 111 million.
The net loss from
operating results of our Offices and Others segment, as a
percentage of revenues derived from this segment, increased from
1.1% in fiscal year 2014 to 35.3% in fiscal year 2015.
Sales and Developments
The net gain from
other operating results of our Sales and Developments segment
increased Ps. 5 million from Ps. 8 million in fiscal year
2014 to Ps. 13 million in fiscal year 2015, mainly due
to:
·
the gain recorded
in fiscal year 2015 from the sale of our interest in Bitania for
Ps. 16 million;
·
a reduction of
Ps. 2 million in the provisions for lawsuits and
contingencies; partially offset by
·
the non-recurrence,
during fiscal year 2015, of a fee charged as “fee for
admission to the undertaking” in connection with the sale of
the Neuquén lot for development of a hotel that took place in
fiscal year 2014.
Hotels
The net loss from
operating results of our Hotels segment decreased by Ps. 3
million, from Ps. 3 million in fiscal year 2014 to Ps. 0
million in fiscal year 2015, mainly as a result of a reduction in
the reserve for lawsuits and other contingencies.
The net loss from
operating results of our Hotels segment, as a percentage of
revenues derived from this segment, decreased from 0.8% in fiscal
year 2014 to 0.1% in fiscal year 2015.
International
Other operating
results, net from this segment increased from a net loss of
Ps. 1 million in fiscal year 2014 to a net gain of
Ps. 185 million in fiscal year 2015, mainly as a result of the
gain from the partial reversal of accumulated translation
differences following Rigby 183 LLC’s partial
liquidation.
Financial Operations and Others
Other operating
results, net from our Financial Operations and Others segment
decreased by Ps. 1 million from Ps. 3 million in fiscal
year 2014 to Ps. 2 million in fiscal year 2015, mainly due to
lower taxes deducted by BHSA on lower dividends distributed in
fiscal year 2015 to our subsidiaries Ritelco and
Tyrus.
Profit
/ (loss) from operations
As a result of the
above mentioned factors, our profit / (loss) from operations
increased by Ps. 1,625 million (135.2%), from a gain of
Ps. 1,202 million in fiscal year 2014 to a gain of
Ps. 2,827 million in fiscal year 2015.
172
Agricultural
Business
Profit / (loss)
from operations of the Agricultural business increased by
Ps. 345 million (907.9%), from a Ps. 38 million loss in
fiscal year 2014 to a Ps. 307 million gain in fiscal year
2015.
Crops
Loss from
operations of this segment increased by Ps. 137 million
(97.9%), from a Ps. 140 million loss in fiscal year 2014 to a
Ps. 277 million loss in fiscal year 2015.
Cattle
Profit from
operations of this segment increased by Ps. 5 million (16.1%),
from a Ps. 31 million gain in fiscal year 2014 to a
Ps. 36 million gain in fiscal year 2015.
Dairy
Profit from
operations of this segment decreased by Ps. 1 million (20.0%),
from a Ps. 5 million gain in fiscal year 2014 to a Ps. 4
million gain in fiscal year 2015.
Sugarcane
Loss from
operations of this segment decreased by Ps. 10 million
(43.5%), from a Ps. 23 million loss in fiscal year 2014 to a
Ps. 13 million loss in fiscal year 2015.
Agricultural Rental and Services
Profit from
operations of this segment increased by Ps. 30 million
(428.6%), from a Ps. 7 million gain in fiscal year 2014 to a
Ps. 37 million gain in fiscal year 2015.
Land Transformation and Sales
Profit from
operations of this segment increased by Ps. 474 million, from
a Ps. 78 million gain in fiscal year 2014 to a Ps. 552
million gain in fiscal year 2015.
Agro-industrial
Profit / (loss)
from operations of this segment decreased by Ps. 36 million,
from a Ps. 1 million gain in fiscal year 2014 to a Ps. 35
million loss in fiscal year 2015.
Other
Profit / (loss)
from operations of this segment did no record any changes for
fiscal year 2014 vs. fiscal year 2015.
Urban
Properties and Investments Business
Profit from
operations of this segment increased by Ps. 1,280 million
(103.2%), from a Ps. 1,240 million gain in fiscal year 2014 to
a Ps. 2,520 million gain in fiscal year 2015. This was mainly
due to an increase of Ps. 1,364 million in the Shopping
Centers, Sales and Developments, and International segments,
partially offset by a Ps. 84 million reduction in the Offices
and Others, Hotels, and Financial Operations and Others
segments.
Shopping Centers
Profit from
operations of our Shopping Centers segment increased by 37.5%, from
a gain of Ps. 864 million in fiscal year 2014 to a gain of
Ps. 1,190 million in fiscal year 2015.
Profit from
operations of our Shopping Centers segment, as a percentage of the
revenues derived from this segment, decreased from 62.5% in fiscal
year 2014 to 66.9% in fiscal year 2015.
Offices and Others
Profit from
operations of our Offices and Others segment decreased by 39.6%,
from a gain of Ps. 160 million in fiscal year 2014 to a gain
of Ps. 99 million in fiscal year 2015.
Profit from
operations of our Offices and Others segment, as a percentage of
the revenues derived from this segment, decreased from 59.0% in
fiscal year 2014 to 29.7% in fiscal year 2015.
Sales and Developments
Profit from
operations of our Sales and Developments segment increased by
360.6%, from a gain of Ps. 239 million in fiscal year 2014 to
a gain of Ps. 1,099 million in fiscal year 2015.
Profit from
operations of our Sales and Developments segment, as a percentage
of the revenues derived from this segment, increased from 277.9% in
fiscal year 2014 to 7,850.0% in fiscal year 2015.
173
Hotels
Profit / (loss)
from operations of our Hotels segment decreased from a gain of
Ps. 11 million in fiscal year 2014 to a loss of Ps. 12
million in fiscal year 2015.
International
Profit / (loss)
from operations of our International segment increased from a loss
of Ps. 30 million in fiscal year 2014 to a gain of
Ps. 148 million in fiscal year 2015.
Financial Operations and Others
Loss from
operations of our Financial Operations and Others segment did not
record any significant changes, amounting to a loss of Ps. 3
million during fiscal years 2014 and 2015.
Share
of loss of associates and joint ventures
Share of loss of
associates and joint ventures increased by Ps. 615 million,
from a loss of Ps. 410 million in fiscal year 2014 to a loss
of Ps. 1,025 million in fiscal year 2015. This was
caused mainly by:
·
a Ps. 614
million increase in our related companies’ interest in the
Urban Properties and Investments business in fiscal year 2015. Such
increase was mainly attributable to higher losses of Ps. 25
million from our interest in New Lipstick LLC and Ps. 66
million from our interest in Supertel (International segment), a
Ps. 41 million increase in gains from our investment in BHSA,
offset by negative results from our investment in IDBD for
Ps. 589 million, mainly as a result of the recovery in the
market value of this company’s stock; and
·
lower revenues of
Ps. 3 million from the Agricultural business, mainly as a
result of the revenues incurred in the investment in Agro-Uranga
(Crops segment).
In turn, share of
profit of associates and joint ventures decreased from our
interests in joint ventures increased by 31.25% from Ps. 16
million income in fiscal year 2014 to a Ps. 11 million income
in fiscal year 2015, mainly as a consequence of 83.3% increase in
our Cresca joint venture, up from a loss of Ps. 10 million in
fiscal year 2014 to a loss of Ps. 2 million in fiscal year
2015.
On the other hand,
no inter-segment eliminations arose from share of (loss) / profit
of associates and joint ventures.
Hence, according to
business segment reporting and considering all our joint ventures,
share of loss of associates and joint ventures increased by 143.19%
from a Ps. 426 million loss in fiscal year 2014 to a
Ps. 1,036 million loss in fiscal year 2015.
Financial
results, net
We had a lower net
financial loss of Ps. 1,286 million, from a loss of
Ps. 2,574 million in fiscal year 2014 to a loss of
Ps. 1,288 million in fiscal year 2015. This was primarily due
to:
·
a lower loss of
Ps. 1,337 million in net exchange differences in fiscal year
2015;
·
a higher loss of
Ps. 168 million in net financial interest recorded in fiscal
year 2015;
·
a higher income of
Ps. 32 million in revaluation of receivables from sale of
farms in fiscal year 2015;
·
a lower loss of
Ps. 284 million in derivative financial instruments in fiscal
year 2015; and
·
slightly offset by
a gain of Ps. 2 million generated by the results from
Financial Operations and Others in fiscal year
2015.
Our net financial
loss in fiscal year 2015 was mainly attributable to (i) a
Ps. 686 million loss generated by exchange differences mainly
as a result of a higher liability position in US dollars due to the
issuance of new series of notes; (ii) a loss of Ps. 887
million generated by interest accrued on debt financing, mainly due
to increased indebtedness and higher interest rates; and (iii) a
loss of Ps. 82 million generated mainly by derivative
instruments due to IDBD’s tender offer.
There was a 11.7%
variation in the U.S. Dollar buying rate during fiscal year 2015
(it increased from Ps. 8.133 as of June 30, 2014 to
Ps. 9.088 as of June 30, 2015) as compared to the previous
fiscal year, when the U.S. Dollar quotation had experienced a
larger variation of 50.9% (from Ps. 5.388 as of June 30, 2013
to Ps. 8.133 as of June 30, 2014).
Income
tax
Our income tax
expense increased Ps. 693 million, from a Ps. 389 million
gain in fiscal year 2014 to Ps. 303 million loss in fiscal
year 2015. We recognize the income tax expense on the basis of the
deferred tax liability method, thus recognizing temporary
differences between accounting and tax assets and liabilities
measurements. The main temporary differences for the Agriculture
business derive from valuation of cattle stock and sale and
replacement of property, plant and equipment, while those
corresponding to the Urban Properties and Investments business
derive from the sale and replacement of investment
properties.
For purposes of
determining the deferred assets and liabilities, the tax rate
expected to be in force at the time of their reversion or use,
according to the legal provisions enacted as of the date of
issuance of these financial statements, has been applied to the
identified temporary differences and tax losses.
Profit
/ (loss) for the Fiscal Year
Due to the above
mentioned factors, our profit / (loss) for the fiscal year
increased by Ps. 2,165 million (153.7%) from a Ps. 1,409
million net loss for fiscal year 2014 to a Ps. 176 million net
income in fiscal year 2015. Profit / (loss) for fiscal years 2015
and 2014 is attributable to the controlling company’s
shareholders and non-controlling interest, as per the following
detail:
·
Profit / (loss) for
the fiscal year attributable to the controlling company’s
shareholders increased from a loss of Ps. 1,068 million in
fiscal year 2014 to a loss of Ps. 250 million in fiscal year 2015;
and
·
the non-controlling
interest in controlled companies went from a loss of Ps. 341
million in fiscal year 2014 to a gain of Ps. 426 million in
fiscal year 2015, mainly due to a positive variation of
Ps. 356 million in Brasilagro, a Ps. 162 million
variation in our subsidiary IRSA, and a Ps. 113 million
variation in other companies from the Urban Properties and
Investments business.
174
B.
LIQUIDITY AND CAPITAL RESOURCES
Liquidity
Our main sources of
liquidity have historically been:
·
cash generated by
operations;
cash generated by
our issuance of common shares and non-convertible
notes;
cash proceeds from
borrowings (including cash from bank loans and overdrafts) and
financing arrangements (including cash from the exercise of
warrants); and
cash proceeds from
sale of investment and trading properties and property, plant and
equipment (including cash proceeds from the sale of
farmlands).
Our main cash
requirements or uses (other than in connection with our operating
activities) have historically been:
·
acquisition of
subsidiaries and non-controlling interest in
subsidiaries;
·
acquisition of
interest in associates and joint ventures;
·
capital
contributions to associates and joint ventures;
·
capital
expenditures in property, plant and equipment (including
acquisitions of farmlands) and investment and trading
properties;
·
payments of
short-term and long-term debt and payment of the related interest
expense; and
·
payment of
dividends.
Our liquidity and
capital resources include our cash and cash equivalents, proceeds
from operating activities, sales of investment properties, trading
properties and farms, obtained bank borrowings, long-term debts
incurred and capital funding.
Cash Flows
The table below
shows our cash flow for the fiscal years ended June 30, 2016, 2015
and 2014:
|
|
For the fiscal year
ended June 30,
|
||
|
|
2016
|
2015
|
2014
|
|
|
(in million of
Pesos)
|
||
|
|
|
|
|
|
Net cash generated
from operating activities
|
4,055
|
494
|
883
|
|
Net cash generated
from / (used in) investing activities
|
8,652
|
872
|
(886)
|
|
Net cash used in
financing
activities
|
(4,495)
|
(1,776)
|
(446)
|
|
Net
increase(decrease) in cash and cash
equivalents
|
8,212
|
(410)
|
(449)
|
|
|
|
|
|
|
|
|
|
|
As of June 30,
2016, we had negative working capital of Ps. 478 million
(calculated as current assets less current liabilities as of such
date).
As of June 30,
2016, in our Agricultural business, we had positive working capital
of Ps. 595 million (calculated as current assets less current
liabilities as of such date).
As of June 30,
2016, in our Urban Properties and Investments Business, our
Operation Center in Argentina had negative working capital of Ps.
185 million while our Operations Center in Israel had negative
working capital of Ps.888 million, resulting in a consolidated
negative working capital of Ps. 1073 million (calculated as current
assets less current liabilities as of such
date).
At the same date,
our Operations Center in Argentina had cash and cash equivalents of
Ps.95 million while our Operations Center in Israel had cash and
cash equivalents of Ps.13,771 million, totaling consolidated cash
and cash equivalents for Ps.13,866 million.
IDBD has diverse
debts containing certain covenants which have been successively
negotiated, resulting in several waivers expiring in December 2016.
IDBD estimates that if the original covenants of such loans were to
become effective again, it would not be able to honor them.
Non-compliance could have the effect of creditors requiring
immediate repayment of the debt. As a holding company, IDBD’s
main sources of funds derive from the dividends distributed by its
subsidiaries, which have experienced a reduction in recent years.
Yet, there are restrictions as to the payment of dividends based on
the indebtedness level in some subsidiaries. IDBD has projected
future cash flows and expects to have the required liquidity to
meet its commitments by issuing new debt in Israel, selling
financial assets such as Clal and dividend payouts by Clal. IDBD
could also secure additional financing through the private issuance
of equity securities. All factors mentioned above, mainly (i)
IDBD’s current financial position and need of financing to
honor its financial debt and other commitments, (ii) the
renegotiation underway with financial creditors, and (iii) the term
set by Israel’s governmental authorities to sell the equity
interest in Clal and the potential effects of such sale, in
particular, on its market value, raise significant uncertainties as
to IDBD’s capacity to continue as a
going-concern.
The financial
position of IDBD and its subsidiaries at the operations center in
Israel does not affect the financial position of IRSA and its
subsidiaries at the operations center in Argentina. The operation
center in Argentina is not facing financial constraints and is
compliant with their financial commitments. We believe our working
capital and our cash from operating activities are adequate for our
present and future requirements. If cash generated from our
operations is at any time insufficient to finance our working
capital, we would seek to finance such working capital needs
through debt financing or equity issuances or through the sale of
selective assets.
175
In addition, the
commitments and other covenants resulting from IDBD’s debt do
not have impact on IRSA since such debt has no recourse against
IRSA and it is not granted by IRSA’s assets. We do not have
significant uncertainties as to the capacity as a group to operate
as a going-concern perspective, with such uncertainties being
limited to the operation center in Israel. For more information
about our liquidity see “Item 3(d) Risk Factors” and
“Recent Developments”.
On September 8,
2016, IRSA issued Series VII and VIII Notes in an aggregate
principal amount of Ps.384.2 million and US$184.5 million,
respectively. Series VII and VIII Notes have a maturity of 36
months from its issue date. For more information, please see
“Recent Developments”.
On August 2, 2016,
IDBD issued a new Series of Notes in the Israeli market for NIS 325
million, bearing an adjustable interest rate and maturing in 2019.
Furthermore, DIC expended it issuance of Notes due 2025 for an
additional NIS 360 million. For more information, please see
“Recent Developments”.
Net cash provided by operating activities
Fiscal Year ended June 30, 2016 and 2015.
Net cash provided
by operations increased from a net cash inflow of Ps. 494 million
during fiscal year ended June 30, 2015 to a net cash inflow of Ps.
4,055 million during fiscal year ended June 30, 2016. The increase
in net cash provided by operating activities was primarily due to
an increase in inventories of Ps. 53 million; a decrease in trade
and other receivables of Ps. 7 million; a decrease in trading
properties of Ps. 229 million, an increase in trade and other
payables for Ps. 37 million that was partially offset by an
increase of Ps. 50 million in derivative financial instruments, a
decrease in payroll and social security liabilities of Ps. 33
million and an increase of Ps. 143 million in provisions during
fiscal year ended June 30, 2016 compared to fiscal year ended June
30, 2015.
Our operating
activities resulted in net cash inflows of Ps. 4,055 million for
the fiscal year ended on June 30, 2016, mainly due to operating
gains of Ps. 5,035 million, an increase of 182 million in trade and
other payables, a decrease of Ps. 135 million in biological assets,
a decrease in trading properties of Ps. 229 million and an increase
of Ps. 52 million in payroll and social security liabilities,
partially offset by the income tax paid of Ps. 811 million, an
decrease of Ps. 79 million in inventories, and an increase of Ps.
487 million in trade and other receivables.
Fiscal Year ended June 30, 2015 and 2014.
Net cash provided
by operations decreased from a net cash inflow of Ps. 883 million
during fiscal year ended June 30, 2014 to a net cash inflow of Ps.
494 million during fiscal year ended June 30, 2015. The decrease in
net cash provided by operating activities was primarily due to a
decrease in biological assets of Ps. 172 million and an increase of
Ps. 748 million in trade and other receivables; that was partially
offset by an increase of Ps. 296 million in operating gains, a
decrease in inventories of Ps. 65 million and an increase of Ps.
315 million in trade and other payables during fiscal year ended
June 30, 2015 compared to fiscal year ended June 30,
2014.
Our operating
activities resulted in net cash inflows of Ps. 494 million for the
fiscal year ended on June 30, 2015, mainly due to operating gains
of Ps. 1,199 million, an increase of Ps. 145 million in trade and
other payables, a decrease of Ps. 115 million in biological assets,
and an increase of Ps. 85 million in payroll and social security
liabilities, partially offset by the income tax paid of Ps. 430
million, an decrease of Ps. 132 million in inventories, and an
increase of Ps. 480 million in trade and other
receivables.
Net cash used in investing activities
Fiscal Year ended June 30, 2016 and 2015.
Net cash used in
investing activities increased from a net cash outflow of Ps. 872
million during fiscal year ended on June 30, 2015 to a net cash
inflow of Ps. 8,652 million during fiscal year ended on June 30,
2016. This variation was mainly due to an increase in cash
incorporated by business combination of Ps. 9,193 million, a
decrease in acquisition of interest in associates and joint
ventures of Ps. 1,242 million, an increase in disposal of
investment in financial assets for Ps. 9,642 million; this increase
was partially offset by an increase purchases of investment
properties of Ps. 638 million, a decrease of Ps. 1,053 million from
sale of investment properties and an increase in purchases of
property, plant and equipment of Ps. 924 million, an increase in
acquisition of investment in financial instruments of Ps. 8,903
million and an increase in loans granted to associates and joint
ventures of Ps. 852 million during fiscal year ended June 30, 2016
compared to fiscal year ended June 30, 2015.
Our investing
activities resulted in net cash inflows of Ps. 8,652 million for
the fiscal year ended on June 30, 2016 mainly due to the sale of
financial instruments, investment properties and associates and
joint ventures of Ps. 14,129 million, and Ps. 1,394 million,
respectively, and cash incorporated by business combination of Ps.
9,193 million and dividends received of Ps. 593 million; partially
offset by cash outflows related to acquisitions of investments in
financial assets of Ps. 13,513 million, investment properties of
Ps. 888 million, property, plant and equipment (including suppliers
advances) of Ps. 1,152 million, loans granted to associates and
joint ventures of Ps. 852 million, and capital contributions to
associates and joint ventures of Ps. 207 million.
176
Fiscal Year ended June 30, 2015 and 2014.
Net cash used in
investing activities increased from a net cash outflow of Ps. 886
million during fiscal year ended on June 30, 2014 to a net cash
inflow of Ps. 872 million during fiscal year ended on June 30,
2015. This variation was mainly due to a decrease in acquisition of
investment properties of Ps. 22 million, an increase of cash
arising from the sale of farms of Ps. 201 million, an increase in
the inflows of cash arising from the sale of financial instruments
of Ps. 616 million and the sale of investment properties of Ps.
2,045 million; this increase was partially offset by an increase in
acquisitions of investments in financial assets of Ps. 927 million,
a decrease in acquisition of interest in associates and joint
ventures of Ps. 110 million and an increase in acquisition of
property, plant and equipment of Ps. 88 million during fiscal year
ended June 30, 2015 compared to fiscal year ended June 30,
2014.
Our investing
activities resulted in net cash inflows of Ps. 872 million for the
fiscal year ended on June 30, 2015 mainly due to the sale of
financial instruments, farms, investment properties and associates
and joint ventures for Ps. 4,487 million, Ps. 328 million, Ps.
2,447 million, and Ps. 56 million, respectively, and dividends
collected for Ps. 18 million; partially offset by cash outflows
related to acquisitions of investments in financial instruments for
Ps. 4,610 million, investment properties for Ps. 250 million,
property, plant and equipment (including advances) for Ps. 236
million and subsidiaries, associates and joint ventures for Ps.
1,242 million, and capital contributions to associates and joint
ventures for Ps. 126 million.
Net cash used in financing activities
Fiscal Year ended June 30, 2016 and 2015.
Net cash used in
financing activities decreased from a net cash outflow of Ps.1,776
million during fiscal year ended June 30, 2015 to a net cash
outflow of Ps. 4,495 million during fiscal year ended June 30,
2016, mainly due to an increase of Ps. 3,219 million in payments of
non-convertible notes, an increase in payments of borrowings of Ps.
9,697 million, an increase of Ps. 1,160 million in acquisitions of
non-controlling interest in subsidiaries, an increase in interest
paid for Ps. 3,308, and an increase payment of derivative financial
instruments of Ps. 387 million; the decrease was partially offset
by an due to an increase cash inflows associated with the issuance
of non-convertible notes of Ps. 7,319 million, increase in the cash
arising from borrowings from financial entities of Ps. 5,689
million, an increase in proceeds from derivative financial
instruments of Ps. 2,091 million, during fiscal year ended June 30,
2016 compared to fiscal year ended June 30, 2015.
Our financing
activities resulted in net cash outflows of Ps. 4,495 million for
the fiscal year ended on June 30, 2016 mainly due to the
cancellation of non-convertible notes, financial loans and
financial interests for Ps. 4,291 million, Ps. 11,031 million and
Ps. 4,107 million, respectively, acquisition of non-controlling
interest in subsidiaries for Ps. 1,192, payment of dividends for
Ps. 239 million, payment of derivative financial instruments for
Ps. 620 million, and repurchase of non-convertible notes for Ps.
209 million; partially offset by cash inflows associated with the
issuance of non-convertible notes for Ps. 8,012 million, borrowings
taking from financial entities for Ps. 7,187 million and from
derivative financial instruments for Ps. 2,093
million.
Fiscal Year ended June 30, 2015 and 2014.
Net cash used in
financing activities decreased from a net cash outflow of Ps.446
million during fiscal year ended June 30, 2014 to a net cash
outflow of Ps. 1,776 million during fiscal year ended June 30,
2015, mainly due to an increase of Ps. 494. million in the
cancellation of non-convertible notes and financial interests, an
increase of Ps. 744 million in payments of financial loans, a
decrease in the inflow of cash arising from the issuance of
non-convertible notes of Ps. 359 million, an increase of Ps. 31
million in acquisitions of non-controlling interest, an increase in
the repurchase of non-convertible notes of Ps. 142, a decrease in
the proceeds from derivative financial instruments of Ps. 60
million and a decrease of Ps. 123 million in contributions from
non-controlling interest; the decrease was partially offset by an
increase in the cash arising from borrowings from financial
entities of Ps. 705 million, a decrease in dividends paid of Ps.
210 million, a decrease in the repurchase of equity interest of Ps.
65 million and an increased of Ps. 182 million in sale of equity
interest in subsidiaries to non-controlling interest, during fiscal
year ended June 30, 2015 compared to fiscal year ended June 30,
2014.
Our financing
activities resulted in net cash outflows of Ps. 1,776 million for
the fiscal year ended on June 30, 2015 mainly due to the
cancellation of non-convertible notes, financial loans and
financial interests of Ps. 1,072 million, Ps. 1,334 million and Ps.
799 million, respectively, payment of dividends of Ps. 34 million,
payment of seller financing of shares of Ps. 106 million, capital
reduction of subsidiaries of Ps. 228 million, payment of derivative
financial instruments of Ps. 233 million, and repurchase of
non-convertible notes and equity interest of Ps. 305 million and
Ps. 33 million, respectively; partially offset by cash inflows
associated with the issuance of non-convertible notes of Ps. 693
million, borrowings taking from financial entities of Ps. 1,498
million and from associates and joint ventures of Ps. 22 million,
contribution from non-controlling interest of Ps. 16 million, and
sale of equity in subsidiaries to non-controlling interest of Ps.
182 million.
Indebtedness
The following table
sets forth the scheduled maturities of our outstanding debt as of
June 30, 2016:
|
|
Currency
|
Anual
Average Interest Rate
|
Nominal
value
|
|
Agricultural
business
|
|
|
|
|
Cresud ´s
Series XIV Notes
|
US$
|
1.50%
|
64
|
|
Cresud ´s
Series XV Notes
|
Ps.
|
23.63%
|
176
|
|
Cresud ´s
Series XVI Notes
|
US$
|
1.50%
|
218
|
|
Cresud ´s
Series XVII Notes
|
Ps.
|
Badlar + 375
bp.
|
171
|
|
Cresud ´s
Series XVIII Notes
|
US$
|
4.00%
|
68
|
|
Cresud ´s
Series XIX Notes
|
Ps.
|
27.50%
|
187
|
|
Cresud ´s
Series XX Notes
|
US$
|
2.50%
|
36
|
|
Cresud ´s
Series XXI Notes
|
Ps.
|
Badlar + 375
bp.
|
384
|
|
Cresud ´s
Series XXII Notes
|
US$
|
4.00%
|
44
|
|
Bank
loans
|
US$
|
Libor + 300 bp. or
6% (the higher)
|
30
|
|
Bank
loans
|
Ps.
|
15.01%
|
31
|
|
Bank
loans
|
Ps.
|
Rate Survey PF
30-59 days
|
40
|
|
Bank
loans
|
US$
|
3.50%
|
15
|
|
Bank
loans
|
US$
|
10.75% - 7.14% to
14.5%
|
6
|
|
Bank
loans
|
Bol.
|
7% -
10.19%
|
14
|
|
Operations
Center in Argentina
|
|
|
|
|
IRSA Commercial
Properties’ 2017 Notes
|
$
|
Badlar + 4
bp.
|
407
|
|
IRSA Commercial
Properties’ 2023 Notes
|
US$
|
8.75%
|
360
|
|
IRSA Commercial
Properties’ 2017 Notes
|
US$
|
7.88%
|
-
|
|
IRSA’s 2017
Notes
(1)
|
US$
|
8.50%
|
75
|
|
IRSA’s 2017
Notes
|
$
|
Badlar + 450
bp.
|
11
|
|
IRSA’s 2020
Notes
|
US$
|
11.50%
|
75
|
|
Financial
Leases
|
US$
|
3.2% al
14.3%
|
1
|
|
Related
Party
|
$
|
Badlar
|
15
|
|
Bank
loans
|
$
|
15.25%
|
1
|
|
Bank
loans
|
$
|
26.50%
|
7
|
|
Bank
loans
|
$
|
23.00%
|
36
|
|
Related
Party
|
$
|
Badlar /
8,50%
|
6
|
|
Related
Party
|
$
|
15.25%
|
6
|
|
Related
Party
|
$
|
24.00%
|
6
|
|
Seller
financing
|
US$
|
N/A
|
2
|
|
Seller
financing
|
US$
|
3.50%
|
5
|
|
Bank
overdrafts
|
$
|
from 22% to
39%
|
-
|
177
|
Operations
Center in Israel
|
|
|
|
|
Non -convertible
Notes IDBD Serie G
|
NIS
|
4.50%
|
802
|
|
Non -convertible
Notes IDBD Serie I
|
NIS
|
4.95%
|
1.013
|
|
Non -convertible
Notes IDBD Serie J
|
NIS
|
6.60%
|
309
|
|
Non -convertible
Notes DIC Serie D
|
NIS
|
5.00%
|
103
|
|
Non -convertible
Notes DIC Serie F
|
NIS
|
4.95%
|
2.719
|
|
Non -convertible
Notes DIC Serie G
|
NIS
|
6.35%
|
8
|
|
Non -convertible
Notes DIC Serie H
|
NIS
|
4.45%
|
124
|
|
Non -convertible
Notes DIC Serie I
|
NIS
|
6.70%
|
513
|
|
Non -convertible
Notes Shufersal Serie B
|
NIS
|
5.20%
|
1.024
|
|
Non -convertible
Notes Shufersal Serie C
|
NIS
|
5.45%
|
114
|
|
Non -convertible
Notes Shufersal Serie D
|
NIS
|
2.99%
|
413
|
|
Non -convertible
Notes Shufersal Serie E
|
NIS
|
5.09%
|
392
|
|
Non -convertible
Notes Shufersal Serie F
|
NIS
|
4.30%
|
317
|
|
Non -convertible
Notes Cellcom Serie B
|
NIS
|
5.30%
|
185
|
|
Non -convertible
Notes Cellcom Serie D
|
NIS
|
5.19%
|
599
|
|
Non -convertible
Notes Cellcom Serie E
|
NIS
|
6.25%
|
164
|
|
Non -convertible
Notes Cellcom Serie F
|
NIS
|
4.60%
|
715
|
|
Non -convertible
Notes Cellcom Serie G
|
NIS
|
6.99%
|
285
|
|
Non -convertible
Notes Cellcom Serie H
|
NIS
|
1.98%
|
950
|
|
Non -convertible
Notes Cellcom Serie I
|
NIS
|
4.14%
|
804
|
|
Non -convertible
Notes PBC Serie C
|
NIS
|
5.00%
|
550
|
|
Non -convertible
Notes PBC Serie D
|
NIS
|
4.95%
|
1.317
|
|
Non -convertible
Notes PBC Serie E
|
NIS
|
4.95%
|
974
|
|
Non -convertible
Notes PBC Serie F
|
NIS
|
7.05%
|
669
|
|
Non -convertible
Notes PBC Gav-Yam Serie E
|
NIS
|
4.55%
|
283
|
|
Non -convertible
Notes PBC Gav-Yam Serie F
|
NIS
|
4.75%
|
1.226
|
|
Non -convertible
Notes PBC Gav-Yam Serie G
|
NIS
|
6.41%
|
215
|
|
Non -convertible
Notes PBC Ispro Serie B
|
NIS
|
5.40%
|
255
|
|
Bank loans and
others
|
NIS
|
Prime +
1.3%
|
333
|
|
Bank loans and
others
|
NIS
|
Prime +
1%
|
80
|
|
Bank loans and
others
|
NIS
|
Prime +
0.65%
|
63
|
|
Bank loans and
others
|
NIS
|
6.90%
|
150
|
|
Bank loans and
others
|
NIS
|
4.95%
|
1
|
|
Bank loans and
others
|
NIS
|
4.95%
|
1
|
|
Bank loans and
others
|
NIS
|
3.25%
|
1
|
|
Bank loans and
others
|
US$
|
5.66%
|
13
|
|
Bank loans and
others
|
US$
|
5.21%
|
197
|
|
Bank loans and
others
|
US$
|
Libor +
5%
|
223
|
|
Bank loans and
others
|
NIS
|
4.60%
|
200
|
178
|
|
|
|
|
|
|
Total
|
||
|
|
|
Agricultural
business
|
|
Urban
properties and investments
|
|
|||
|
|
|
|
Operations
Center in Argentina
|
Operations
Center in Israel
|
Total
|
|
||
|
|
|
|
|
|
|
|
|
|
|
Less than 1
year
|
|
1,226
|
|
2,813
|
19,437
|
22,250
|
|
23,476
|
|
More than 1 and up
to 2 years
|
|
1,210
|
|
19
|
16,826
|
16,845
|
|
18,055
|
|
More than 2 and up
to 3 years
|
|
500
|
|
1
|
19,535
|
19,536
|
|
20,036
|
|
More than 3 and up
to 4 years
|
|
1,332
|
|
17
|
4,643
|
4,660
|
|
5,992
|
|
More than 4 and up
to 5 years
|
|
40
|
|
1,063
|
7,092
|
8,155
|
|
8,195
|
|
More than 5
years
|
|
34
|
|
5,313
|
36,169
|
41,482
|
|
41,516
|
|
|
|
4,342
|
|
9,226
|
103,702
|
112,928
|
|
117,270
|
(1)
On September 9,
2016, we announced our intention to redeem all outstanding Series I
Notes for a total amount of US$74,554,000. The redemption took
place on October 11, 2016. For more information see
“Recent Development”
Operations Center in
Argentina
On March 3, 2016, IRSA and
IRSA CP announced that they would launch offers to buy in cash: (i)
11.50% Class II Notes due 2020 and issued by IRSA for principal
amount up to US$76.5 million, (ii) any and 8.50% Class 1 Notes due
2017 and issued by IRSA, and (iii) any and 7.875% Class 1 Notes
notes due 2017 and issued by IRSA CP.
On March 23, 2016, IRSA CP
issued Notes in an aggregate principal amount of US$360 million
under its Global Notes Program. Class II Notes accrue interest
semi-annually, at an annual fixed rate of 8.75% and mature on March
23, 2023. The issue price was 98.722% of nominal
value.
IRSA CP’s
Notes due 2023 are subject to certain covenants, events of default
and limitations, such as the limitation on incurrence of additional
indebtedness, limitation on restricted payments, limitation on
transactions with affiliates, and limitation on merger,
consolidation and sale of all or substantially all
assets.
To incur additional
indebtedness, IRSA CP is required to meet a minimum 2.00 to 1.00
Consolidated Interest Coverage Ratio. The Consolidated Interest
Coverage Ratio is defined as Consolidated EBITDA divided by
consolidated interest expense. Consolidated EBITDA is defined as
operating income plus depreciation and amortization and other
consolidated non-cash charges.
The Class II Notes
contain financial covenants limiting IRSA CP’s ability to
declare or pay dividends in cash or in kind, unless the following
conditions are met at the time of payment:
a)
no Event of Default
shall have occurred and be continuing;
b)
IRSA CP may incur
at least US$1.00 worth of additional debt pursuant to the
“Restriction on Additional
Indebtedness”;
c)
and the aggregate
amount of such dividend exceeds the sum of:
i.
100% of cumulative
EBITDA for the period (treated as one accounting period) from July
1, 2015 through the last day of the last fiscal quarter ended prior
to the date of such Restricted Payment
minus
an amount equal to 150% of
consolidated interest expense for such period;
and
ii.
any reductions of
Indebtedness of IRSA on a consolidated bais after the Issue Date
any reductions of Indebtedness of after the Issue Date exchanged
for to Capital Stock of the IRSA or its
Subsidiaries.
On April 7, 2016, the
Meeting of IRSA’s Notes holders by majority vote approved the
proposed amendments to IRSA’s 2017 Trust Indenture, which
included basically the elimination of all restrictive covenants on
such class effective as of April 8, 2016.
During the months of March,
April and May of 2016, the Company acquired all IRSA CP’s
7.875% Notes Class I due 2017 for a total amount US$120 million and
US$75.4 million of IRSA Notes. On October 11, 2016 the Company
acquired the remaining US$74.6 million of IRSA’s 8.50% Notes
due 2017, so the following notes remains outstanding:
·
IRSA’s Notes
Class II at 11.50% maturing in 2020 US$71.4
million.
Such payments were accounted
for as a cancellation of debt.
In relation to financial
covenants under 11.50% Notes due in 2020 issued by IRSA, the
Meeting of Noteholders held on March 23, 2016
approved:
i)
to modify the
covenant on Limitation on Restricted Payments, so that the original
covenant was replaced so as to take into consideration IRSA’s
capability to make any restricted payment provided that (a) no
Event of Default has occurred and persisted, and (b) IRSA may incur
at least US$1.00 of additional debt pursuant to the Limitation on
Additional Indebtedness; and
ii)
the exclusion of
IDBD or any of its subsidiaries for purposes of the definition of
“Subsidiary” or any of the definitions or commitments
under the Trust Indenture of Notes due in 2020 and issued by IRSA
(regardless of whether the financial statements of any of these
companies has any time been consolidated into IRSA’s
financial statements).
iii)
a Supplementary
Trust Indenture reflecting all the amendments approved, entered
into with the Bank of New York Mellon on March 28,
2016.
179
Operations Center in
Israel
IDBD has certain
financial restrictions and covenants in connection with its
financial debt, included in its debentures and loans from banks and
financial institutions.
As of June 30,
2016, IDBD reported that the application of the “Liquidity
Covenant” and the “Economic Equity Covenant” (as
described below) is currently suspended.
Note that, it was
agreed between IDBD and the relevant lending corporations that the
parties would work to formulate an arrangement, to replace or amend
the current financial covenants by December 31, 2016.
If such arrangement
is not reached, then with respect to the results for IDBDs first
quarter of 2017 and thereafter, the previous financial covenants
will re-apply, in which case IDBD estimates that it will not be
able to comply with the thresholds which were determined in the
past with respect to the Liquidity Covenant and the Economic Equity
Covenant with respect to IDBD’s results for the first quarter
of 2017 and thereafter. IDBD estimates it will not be able to
fulfill the covenant which stipulates that the balance of cash and
marketable securities will not fall below the scope of forecasted
current maturities for the two quarters subsequent to the reporting
quarter (the “Liquidity Covenant”). Regarding the
Economic Equity Covenant, it is noted that the economic equity as
of June 30, 2016, amounted to a positive balance of NIS 247
million, significantly lower than the thresholds which were
determined in the past as part of the Economic Equity
Covenant.
In view of and due
to the decrease in Mr. Ben Moshe’s ownership of IDBD,
effective as of February 2015 and thereafter, in March 2016 IDBD
reached understandings with its lending corporations with regard to
an amendment of the control covenant and additional amendments
relating to restrictions on the sale of main holdings.
As per IDBD’s
position, as of June 30, 2016, there were no conditions that
established grounds for calling IDBD’s obligations to its
financial creditors for immediate payment. Without derogating from
the IDBD’s position, it is noted that the decision of the
bondholders (Series I) dated April 21, 2016, to call the full
balance of IDBD’s debt due to bondholders for immediate
repayment and the decision to take steps for dissolution are liable
to raise grounds for the financial creditors. According to an
opinion that IDBD received, the conditions required for it to call
the bonds were not fulfilled. On July 18, 2016, the Court handed
down its judgment and accepted the consensus motion filed by the
trustee to dismiss the claim.
As of June 30,
2016, IDBD’s loans which are subject to the aforementioned
financial covenants, were classified under current liabilities, in
consideration of the fact that IDBD has reached agreement with its
principal lenders to extend the arrangements as specified in the
financial covenants of the loan agreements until March 31, 2017 for
a period shorter than twelve months.
On August 2, 2016
IDBD issued a new Series of Debentures in the Israeli market for an
amount of NIS 325 million due November 2019 at an annual interest
rate adjustable by CPI plus 4.25%. The notes are pledged by shares
of Clal Insurance Enterprise Holdings Ltd, subject to the approval
of the Commissioner of Capital Markets, Insurance and Savings. IDBD
worked to get the authorization to constitute the guarantee through
the filing of an application to the Supreme Court asking for such
approval. In case IDBD does not get the required approval, funds
must be repaid with interest plus a penalty. on September 15, 2016,
the High Court of Justice gave a partial judgment and decision,
according to which it was decided, to reject the
petition for the most part and to grant an order which
instructs the Commissioner to appear and show a reason for her
opposition to the request of the company to pledge up to 5% of the
shares of Clal Holdings, subject to an outline agreed to at the
time by the company. Furthermore, the company maintains the right
to accede to a proposal for compromise which was raised in the
context of the discussion. A hearing date was set for January
2017.
Likewise, on August
4, 2016, DIC reopened its Series of Debentures due 2025 an
additional amount of NIS 360 million. The placement was made at an
IRR of 5.70%.
Pursuant to the
decision of the Supreme Court sitting as the High Court of Justice
in connection with the petition that the company submitted in
connection with the pledge of the shares of Clal Holdings in
September 2016, on October 13, 2016, the Board of Directors of IDBD
decided to execute a partial early redemption of the debentures of
the company, that is to be carried out on November 1, 2016, as
follows:
• The company
will carry out a partial early redemption of the debentures
in an amount of approximately NIS 239 million of par value
(“the redeemed portion”) and in a total of
approximately NIS 244 million with respect to principal, interest
and compensation for the redeemed portion.
• The
determining date for the eligibility to receive the early
redemption of the principal of the debentures is
25.10.2016.
• The early
redemption represents 73.7% of the unpaid balance of the principal
of the debentures, which is also the original balance of the series
of the debentures.
• The rate of
interest (including the compensation for carrying out the early
redemption as an increment of 3% with respect to the period from
August 3, 2016 through October 21 2016) that will be
paid upon the partial early redemption of the redeemed portion of
the principal is approximately 1.8%.
• The rate of
interest (including the compensation for carrying out the early
redemption as an increment of 3% with respect to the period from
August 3, 2016 through October 31 2016) that will be paid in
the context of the early redemption, which is calculated out of the
balance of the unpaid balance of the principal on the date of the
early redemption (NIS 325 million linked to the CPI) is
approximately 1.3%.
• Pursuant to
the “known” CPI (index with respect to the month of
September 2016, which was published on 14.10.2016) as compared with
the base index published with respect to the month of June 2016, no
linkage increments will apply with respect to the redeemed portion
upon early redemption.
• The unpaid
balance of the principal of the debentures after executing the
early redemption (without linkage) will stand at an amount of
approximately NIS 86 million par value, which represents
approximately 26.3%, of the original balance of the principal of
the debentures. The company will act to pledge the shares of Clal
Holdings against the balance of the unpaid principal of the
debentures (after carrying out the early redemption). As is
required according to the trust indenture.
• Pursuant to
what is stated in the trust indenture, the redeemed portion will be
paid in relation to all of the holders of the debentures, pro- rata
according to the par value of the held debentures.
180
IDBD is continuing
to act in order to reach consents with the relevant financing
corporations in order to arrange over time the calculated financial
covenants that were determined in the provisions of its loan
agreements, and additional contractual issues that exist in the
loan agreements.
Off balance sheet arrangements
We currently have
no agreement that is not included in the balance sheet or
significant transactions with non-consolidated entities that are
not reflected in our Audited Consolidated Financial Statements. All
of our interests and/or relationships with our subsidiaries or
controlled entities on a joint basis are recorded in our Audited
Consolidated Financial Statements.
C.
RESEARCH AND DEVELOPMENTS, PATENTS AND LICENSES
Investments in
technology, in our agricultural business, amounted to Ps. 10, Ps.
10 and Ps. 9 million for fiscal years 2016, 2015 and 2014
respectively. Our total technology investments aimed to increase
the productivity of purchased land have amounted to Ps.455 million
since fiscal year 1995.
We reach our
objectives within this area through the implementation of domestic
and international technological development projects focusing
mainly on:
|
•
|
Quality and
productivity improvement.
|
|
•
|
Increase in
appreciation value of land through the development of marginal
areas.
|
|
•
|
Increase in the
quality of food in order to achieve global food safety standards.
We aim to implement and perform according to official and private
quality protocols that allow us to comply with the requirements of
our present and future clients. Regarding official regulations, in
2003 we implemented the Servicio Nacional de Sanidad y Calidad
Agroalimentaria law on animal identification for livestock in six
farms. Simultaneously, in 2004 we implemented Global GAP Protocols
(formerly EurepGap) with the objective of complying with European
Union food safety standards and as a mean for continuous
improvement of the internal management and system production of our
farms. Our challenge is to achieve global quality
standards.
|
|
•
|
Certification of
suitable quality standards, since in recent years worldwide
agriculture has evolved towards more efficient and sustainable
schemes in terms of environmental and financial standpoints, where
the innocuousness and quality of the production systems is becoming
increasingly important. In this context, Good Agricultural
Practices (GAP) have emerged, as a set of practices seeking to
ensure the innocuousness of agricultural products, the protection
of the environment, the workers’ safety and well-being, and
agricultural health, with a view to improving conventional
production methods. Certification of such standards allows to
demonstrate the application of Good Agricultural Practices to
production systems and ensures product traceability, allowing to
impose stricter controls to verify the enforcement of the
applicable laws.
|
|
•
|
The implementation
of a system of control and assessment of agricultural tasks for
analyzing and improving efficiency in the use of agricultural
machinery hired. For each of the tasks, a minimum standard to be
fulfilled by contractors was set, which has led to do an
improvement in the plant stand upon sowing, a better use of
supplies and lower harvesting losses.
|
We have several
trademarks registered with the Instituto Nacional de la Propiedad
Industrial, the Argentine institute for industrial property. We do
not own any patents nor benefit from licenses from third
parties.
A substantial part
of Cellcom’s operations are subject to the Communications
Law, regulations enacted by the Ministry of Communications, and the
provisions of the licenses granted to Cellcom by the Minister of
Communications. Cellcom’s activies which include providing
cellular service, landline, international telephone services and
internet access, and infrastructure services are subject to
licensing. For more information, please see “Legal framework
– Operations Center in Israel”
D.
TREND INFORMATION
International
Macroeconomic Outlook
As reported in the
IMF’s “World Economic Outlook”, global GDP
expanded by 3.1% in 2015, slightly below the projections mainly as
a result of a strong decline in activity during the last quarter in
the year. World growth is expected to reach 3.2% in 2016 and 3.5%
in 2017. In 2016 and 2017, growth in developed economies is
expected to remain steady at about 2%, driven by the growth in the
United States of 2.5%, and in the Euro area, of 1.5%.
As of April 2016,
emerging and developing economies have recorded growth rates of 4%,
also slightly below the projections. They are expected to grow 4.1%
and 4.7% by the end of 2016 and 2017. Emerging economies continue
facing challenges as regards the inflow of foreign capital.
Countries which are more flexible in terms of foreign exchange
responded better to the global flow of capital than in previous
decelerations.
During 2014 and
2015, the commodities markets suffered a strong decline. Mainly,
oil exhibited a sustained negative trend until reaching a
historical low in February 2016. During 2016, the commodities
markets exhibited a strong recovery with a 31.6% rise in oil
prices. Soybean reversed the decline it had suffered in 2014 and
2015 and rose 33.6%.
IMF’s
forecasts indicate that inflation in the economies of emerging and
developing markets will decrease from 4.7% in 2015 to 4.5% in 2016,
due to the decline in the prices of raw materials and the effects
of last year’s currency depreciations evening
out.
Average inflation
in advanced economies will remain below the goals set by central
banks, mostly as a result of the lower price of oil. As of April
2016, the general level of inflation in advanced economies averaged
0.3%, the lowest since the global financial crisis.
Argentine
macroeconomic context
On October, 2016,
IMF published its growth projection for 2016 for 1.8% decline of
the GDP. This correction was due to the change in policies
implemented by the new government administration aimed at balancing
certain macroeconomic distortions. Growth is expected to strengthen
to 2.7 percent in 2017 on the back of moderating inflation and more
supportive monetary and fiscal policy stances.
181
Shopping center and
supermarket sales reached a total Ps. 4,374 million in April 2016,
which represents a 41.4% increase as compared to the same period
last year. Accumulated sales for the first four months of the year
totaled Ps. 14,586 million, representing a 29.2% increase as
compared to the same period last year.
The INDEC reports
that, as of April 2016, industrial activity in Argentina decreased
by 6.7% as compared to the same month in 2015. Manufacturing
production accumulated a 2.4% decline during the first four months
of the year as compared to the same period last year.
Regarding the
balance of payments, in the first quarter of 2016 the current
account deficit reached US$ 4,013 million, with US$ 1,403 million
allocated to the goods and services trade balance, and US$ 2,572
million to the income account, which represents 72% of the foreign
direct investment return.
During the first
quarter of 2016, the financial account showed a surplus of US$
8,510 million resulting from net income from the non-financial
public sector and the Argentine Central Bank (“BCRA”)
for US$ 6,233 million, from the non-financial private sector for
US$ 1,701 million, and from the financial sector for US$ 576
million. The stock of international Reserves fell by US$ 5,844
million in 2015. During the first half of 2016, reserves grew by
US$ 4,944 million. At July, reserves stood at US$ 25,512
million.
Total gross
external debt increased by US$ 10,605 million during the first
quarter of 2016 and stood at US$ 163,236 million at March
2016. The non-financial public sector and Argentine
Central Bank debt was estimated at US$ 92,469 million, having
increased by US$ 8,593 million during the first quarter of 2016.
The Argentine Central Bank’s government security and bond
outstanding balance increased by US$ 3,431 million during the first
quarter of 2016. At the end of this quarter, the balance was US$
43,794 million. The non-financial private debt grew US$
2,261 million during the first quarter of 2016. At March 2016, such
debt stood at US$ 67,621 million. The financial sector
debt excluding the Argentine Central Bank decreased by US$ 250
million during the first quarter of 2016, reaching a total of US$
3,145 million.
In connection with
the fiscal sector, revenues recorded a year-on-year increase of
38.9% as of March 2016, whereas primary expenditure grew by 38.7%
during the same period. In local financial markets, the Private
Badlar rate in Pesos ranged from 20% to 30% in the period from July
2015 to June 2016, averaging 28% in June 2016 against 20% in June
2015. The Argentine Central Bank discontinued its controlled
floating exchange rate policy in December 2015; consequently, the
Peso sustained a 63% nominal depreciation in the period from July
2015 to June 2016. At June 2016, the exchange rate stands at
Ps.14.50 pesos per US$1.00. In June 2016,
Argentina’s country risk decreased by 97 basis points in
year-on-year terms, maintaining a high spread vis-à-vis the
rest of the countries in the region. The debt premium paid by
Argentina was at 518 basis points in June 2016, compared to the 352
basis points paid by Brazil and 213 basis points paid by
Mexico.
Agriculture
and Cattle Raising Sector in Argentina
Agriculture
Argentina has
positioned itself over the years as one of the world’s
leading food producers and exporters. It is the second largest
country in South America after Brazil and has particularly
favorable natural conditions for diversified agricultural
production: vast extensions of fertile land and varied soil and
weather patterns.
During the decade
of the nineties, the Argentine agriculture and cattle raising
industry experienced sweeping changes, such as a significant
increase in production and yield (thanks to a sustained
agricultural modernization process), relocation of production
(crops vs. livestock) and a significant restructuring process
within the industry, as well as increased land concentration.
Taking advantage of a favorable international context, the
agriculture and cattle raising sector has been one of the major
drivers of the Argentine recovery after the economic and financial
crisis of 2002.
During the
2015/2016 crop season, soybean production was over 56 million tons,
a decrease of 7% as compared to the previous season.
Corn production
reached 28 million tons, 2.5% lower than in the previous
year.
Wheat production
reached 11.3 million tons, 19% lower than in the previous
year.
The policies
implemented by the new government have led to better projections
for the agricultural industry. Mainly, the strong devaluation of
the peso and tax reductions on exports have improved the situation
of agricultural growers. Withholding taxes on corn and wheat have
been fully eliminated, whereas withholding taxes on soybean have
been lowered by 5% (to 30% down from 35%). As a result of these
measures, the production of soybean, corn and wheat, are expected
to increase to 57, 36.5 and 14.4 million tons
respectively.
Cattle
As reported by
SENASA, with an aggregate stock of 52,636,778 heads as of March 31,
2016, the Cattle stock has increased by 2.3% as compared to the
same period of the previous year. For the third year in a row, the
Cattle stock surpassed 51 million heads.
As reported by the
Argentine Chamber of Beef Commerce and Industry (Cámara de la
Industria y Comercio de Carnes y Derivados de la República
Argentina, “Ciccra”), consumption of cattle beef per
capita was 55.9 kilograms per year on average for the first quarter
of 2016, accounting for a year-on-year fall of 5.9%. This decrease
in consumption reflects the fact that the consumers’ salaries
were restated in 2015, whereas prices have risen after the
devaluation of the Argentine peso in December 2015. However, the
effects of the devaluation of the Argentine peso, along with the
reduction in export taxes, generate a promising scenario for Cattle
exports.
Milk Sector
The United States
Department of Agriculture projects that milk production in
Argentina for 2015 will be 11.6 million tons, higher than in the
previous year. However, milk production for 2016 faces a tough
scenario, as the elimination of withholding taxes on corn adversely
affected the input/product ratio as concerns milk. Moreover,
international prices remain depressed.
The challenge faced
by the international context, coupled with unfavorable weather
conditions in the sector would imply that the most efficient
producers will remain in business, causing production per cow to
increase.
Evolution
of Shopping Centers in Argentina
Private consumption
continues to be a significant component of economic activity,
although in the past months there has been a slight deceleration in
its growth rate. At June 2016, the Consumer Confidence Index (CCI)
had shown a 22.2% decline as compared to June 2015, as well as a
1.9% increase as compared to June 2014. Sales in shopping centers
in April 2016 reached a total amount of Ps. 4,374 million, which
represented a 41.4% increase compared to the same month in 2015.
Accumulated sales for the first four months of the year totaled Ps.
14,586 million and reached a 29.2% variation compared to the same
period the previous year.
182
According to
Colliers International, as of June 2016, the A+ and A office
inventory remained stable since the fourth quarter of 2015 at
1,655,954 sqm. In terms of rental availability, there was a 1%
decrease in the vacancy rate to 6.4% during the second quarter of
2016 compared to the same period the previous year. Thus, the
vacancy rate has remained at a stable range between 6% and 8% since
2010. These values indicate that the market is healthy in terms of
its operations, allowing an optimum level of supply with balanced
values. According to the market segments, class A properties show a
vacancy rate of 7% for the entire stock, while A+ properties
buildings show a vacancy rate of 5%.
During the second
quarter of 2016, net absorption was negative at 400 sqm, i.e., more
meters than the ones that have been occupied have become vacant, a
situation that was not seen since 2012. This behavior of demand is
mainly explained by the sub-market Zona Norte GBA, which
concentrates most of the spaces that have become vacant. On the
other hand, it is verified that the area that has become vacant in
A+ properties (-2,908 sqm) was mostly absorbed by class A
properties (as it was 2,474 sqm).
During the second
quarter of 2016, rental prices remained steady as compared to the
general average prices seen over the past ten years (US$ 24.8 per
square meter). Compared to the previous quarter, a 2.5% increase
was recorded (from US$ 24.1 per square meter to US$ 24.7 per square
meter). This slight increase shows a 1.4% increase in rental prices
for A+ properties (US$ 27.2 per square meter in the second quarter
against US$ 26.8 per square meter in the first quarter) and a 2.4%
increase in rental prices for A properties (US$ 23.4 per square
meter in the second quarter against US$ 22.9 per square meter in
the first quarter). The spread between both categories is US$ 3.8
and reached US$ 12 in low vacancy periods.
In turn, the
sub-market Catalinas is currently the one with the best prices in
the market. The average value of the properties in such area
amounts to US$ 27.9 per square meter. This value is expected to
increase over the next few months due to the addition of new towers
with prices already over US$ 35 per square meter in the
inventory.
At June 2016, the
sub-market Zona Norte GBA shows average rental prices of US$ 23.3,
almost at the same values of June 2015. Moreover, during the same
month, the vacancy rate was 8.9%, compared to 9.5% in June
2015.
Israeli
macroeconomic context
According to the
OECD, for the year ended at December 31, 2015, Israel’s
growth reached 2.5%. Israel’s economic growth is projected to
remain at 2.5% in 2016, before rising to 3% in 2017.
Since March 2015,
the Bank of Israel has kept interest rates at 0.10% and has
continued with its policy to intervene in the currency market to
support economic policies. For both July and August 2016, the
Monetary Committee also decided to leave the interest rate at the
same level. Similar to the announcements of the interest rate
decisions for November and December of 2015, all announcements in
the first half of 2016 included guidance that monetary policy is
expected to remain accommodative for a considerable
time.
Since March 2015,
the Bank of Israel has pursued a policy to intervene in the
currency market. It continued to purchase foreign currency,
purchasing US$4 billion, about US$0.9 billion of which were
purchased as part of the program intended to offset the effects of
natural gas production on the exchange rate. The rest were
purchased as part of a program designed to moderate excessive
fluctuations in the exchange rate.
During the twelve
months ending June 30, 2016, the CPI in Israel declined by 0.8%.
The energy component continued to contribute to the decline of the
CPI, as a result of the sharp decline in global oil prices, even
though this trend reversed itself during the first half of the
year.
During the first
half of 2016, the shekel remained stable in terms of the nominal
effective exchange rate (the average in June relative to the
average in December), and relative to the U.S. dollar. Relative to
the euro, the shekel appreciated by about 3%. Various models of the
equilibrium exchange rate indicate that the shekel may be
overvalued.
Activity in the
housing market remained roburst during the reviewed period: Home
prices continued to increase, and the volumes of transactions and
of new mortgages originated remain high. At the beginning of the
first half of 2016, the Research Department presented a forecast in
which it projected that inflation would return to within the target
range at the beginning of 2017, and that the Bank of Israel
interest rate would increase gradually starting in the last quarter
of 2016.
In regards to the
seasonality, in Israel retail segment business results are subject
to seasonal fluctuations as a result of the consumption behavior of
the population proximate to the Pesach holidays (March and/or
April) and Rosh Hashanah and Sukkoth holidays (September and/or
October). This also affects the balance sheet values of inventory,
customers and suppliers. Our revenues from cellular services are
usually affected by seasonality with the third quarter of the year
characterized by higher roaming revenues due to increased incoming
and outgoing tourism.
In 2016, the
Passover holiday fell at the end of April, compared to 2015 when it
was at the beginning of April. The timing of the holiday affects
Shufersal’s sales and special offers in the second quarter of
2016, compared to last year. The Passover holiday in the
second quarter of 2016 had a greater effect on Shufersal’s
results than in the corresponding quarter in 2015, therefore
analysis of the results for the first half of the year compared to
the corresponding period in 2015 better represents the changes
between the periods.
E.
OFF-BALANCE SHEET ARRANGEMENTS
Agricultural Business
In the ordinary
course of business, FyO guarantees certain brokerage transactions.
Under the agreement, FyO guarantees the performance of the producer
in case it does not comply with the physical delivery. We have
recourse against the non-performing party. As of June 30, 2016, the
value of transacted merchandise for which guarantees were granted
amounted to Ps. 102.7 million. As of the date of this annual
report, there were non-performing parties under the agreements for
which we had to respond as guarantor. As of the date of this annual
report, the value of transacted merchandise for which guarantees
were granted amounted to Ps. 65.8 million.
Urban Properties and Investment Business
As of June 30,
2016, IRSA did not have any off-balance sheet transactions,
arrangements or obligations with unconsolidated entities or others
that are reasonably likely to have a material effect on our
financial condition, results of operations or
liquidity.
183
F.
TABULAR DISCLOSURE OF CONTRACTUAL OBLIGATIONS
The followings
tables show our contractual obligations, as of June 30,
2016.
Where the interest
payable is not fixed, the amount disclosed has been determined by
reference to the existing conditions at the reporting
date.
Payments
due by period
(in millions of
Pesos)
|
As
of June 30, 2016
|
Less
than 1 year
|
Between
1 and 2 years
|
Between
2 and 3 years
|
Between
3 and 4 years
|
More
than 4 years
|
Total
|
|
Trade and other
payables
|
14,287
|
438
|
562
|
54
|
4
|
15,345
|
|
Borrowings
(Excluding finance lease liabilities)
|
25,260
|
21,093
|
31,601
|
10,176
|
59,037
|
147,167
|
|
Finance lease
obligations
|
2,265
|
2,093
|
1,809
|
1,487
|
3,398
|
11,052
|
|
Derivative
financial instruments
|
1128
|
178
|
15
|
-
|
-
|
1,321
|
|
Purchase
Obligations
|
105
|
47
|
58
|
-
|
|
210
|
|
Total
|
43,045
|
23,849
|
34,045
|
11,717
|
62,439
|
175,095
|
G.
SAFE HARBOR
See the discussion
at the beginning of this Item 5 and “Disclosure regarding
forward looking statements” in the introduction of this
annual report, for forward-looking statement safe harbor
provisions.
For information
about Production and Sales, please see Item 5.A.
“Consolidated Operating Results”.
A.
DIRECTORS AND SENIOR MANAGEMENT
Board
of Directors
We are managed by a
board of directors, which consists of ten directors and three
alternate directors. Each director and alternate director is
elected by our shareholders at an annual ordinary meeting of
shareholders for a three-year term, provided, however, that only
one third of the board of directors is elected each year. The
directors and alternate directors may be re-elected to serve on the
board unlimited number of times. There are no arrangements or
understandings pursuant to which any director or person from senior
managements is selected.
Our current board
of directors was elected at the shareholders’ meetings held
on October 31, 2013, November 14, 2014 and October 30, 2015, for
terms expiring in the years 2016, 2017 and 2018,
respectively.
Our current
directors are as follows:
|
Directors
(1)
|
Date
of Birth
|
Position
in Cresud
|
Term
Expires
(2)
|
Date
of Current Appointment
|
Current
Position Held Since
|
|
Eduardo Sergio
Elsztain
|
01/26/1960
|
Chairman
|
06/30/17
|
11/14/14
|
1994
|
|
Saúl
Zang
|
12/30/1945
|
First
Vice-Chairman
|
06/30/17
|
11/14/14
|
1994
|
|
Alejandro Gustavo
Elsztain
|
03/31/1966
|
Second
Vice-Chairman and CEO
|
06/30/16
(3)
|
10/31/13
|
1994
|
|
Gabriel A.G.
Reznik
|
11/18/1958
|
Regular
Director
|
06/30/18
|
10/30/15
|
2003
|
|
Jorge Oscar
Fernández
|
01/08/1939
|
Regular
Director
|
06/30/18
|
10/30/15
|
2003
|
|
Fernando
Adrián Elsztain
|
01/04/1961
|
Regular
Director
|
06/30/16
(3)
|
10/31/13
|
2004
|
|
Pedro Damaso
Labaqui Palacio
|
02/22/1943
|
Regular
Director
|
06/30/18
|
10/30/15
|
2006
|
|
Daniel E.
Mellicovsky
|
01/17/1948
|
Regular
Director
|
06/30/17
|
11/14/14
|
2008
|
|
Alejandro Gustavo
Casaretto
|
10/15/1952
|
Regular
Director
|
06/30/17
|
11/14/14
|
2008
|
|
Gastón Armando
Lernoud
|
06/04/1968
|
Alternate
Director
|
06/30/17
|
11/14/14
|
1999
|
|
Enrique
Antonini
|
03/16/1950
|
Alternate
Director
|
06/30/16
(3)
|
10/31/13
|
2007
|
|
Eduardo
Kalpakian
|
03/03/1964
|
Alternate
Director
|
06/30/16
(3)
|
10/31/13
|
2007
|
|
|
|
|
|
|
|
(1)
The business
address of our management is Moreno 877, 23rd Floor, (C1091AAQ)
Buenos Aires, Argentina.
(2)
Term expires at the
annual ordinary shareholders’ meeting.
(3)
These
position will be considerated in the annual ordinary
shareholders´meeting that will take place October 28,
2016.
Gabriel A. G.
Reznik, Jorge Oscar Fernandez, Pedro Dámaso Labaqui Palacio,
Daniel Elias Mellicovsky, Enrique Antonini and Eduardo Kalpakian,
qualify as independent, in accordance with the CNV’s
Rules.
The following is a
brief biographical description of each member of our board of
directors:
Eduardo Sergio
Elsztain
. Mr. Elsztain has been engaged in the real estate
business for more than twenty five years. He is Chairman of the
Board of Directors of IRSA Inversiones y Representaciones S.A.,
IRSA Commercial Properties, Cresud, BrasilAgro, Austral Gold Ltd.
and Banco Hipotecario SA, among others. He is also Chairman of IDBD
Development Corporation Ltd, Discount Investment Corporation. Mr.
Elsztain is also member of the World Economic Forum, the Council of
the Americas, the Group of 50 and Argentina’s Business
Association (AEA). He is President of Fundacion IRSA, which
promotes education among children and young people; President of
TAGLIT - Birthright Argentina; Co-Founder of Endeavor Argentina;
and Vice-President of the World Jewish Congress. He is Fernando
Adrián Elsztain’s cousin and Alejandro Gustavo Elsztain
and Daniel Ricardo Elsztain’s brother.
Saúl Zang.
Mr.
Zang obtained a law degree from University of Buenos Aires
(
Universidad de Buenos
Aires
). He is a member of the International Bar
Association and the Interamerican Federation of Lawyers. He is a
founding member of Zang, Bergel & Viñes law firm. He is
chairman of Puerto Retiro S.A., first vice-chairman of IRSA
Inversiones y Representaciones Sociedad Anónima and
vice-chairman of IRSA Propiedades Comerciales S.A., Tarshop S.A.,
and Fibesa S.A., among other companies. He is also director of
Banco Hipotecario S.A., Nuevas Fronteras S.A., Brasilagro Companhia
Brasileira de Propiedades Agricolas, IDBD Development Corporation
Ltd, BACS Banco de Crédito & Securitización S.A.,
Tarshop S.A., and Palermo Invest S.A., among other
companies.
184
Alejandro Gustavo
Elsztain.
Mr. Elsztain obtained a degree in agricultural
engineering from University of Buenos Aires (
Universidad de Buenos Aires)
. Currently
he is chairman of Fibesa S.A. and Cactus Argentina S.A., and second
vice-chairman of IRSA Inversiones y Representaciones Sociedad
Anónima. He is also vice-chairman of Nuevas Fronteras S.A.,
and Hoteles Argentinos S.A. He is also director of Brasilagro
Companhia Brasileira de Propiedades Agricolas and Emprendimientos
Recoleta S.A., among other companies. Mr. Alejandro Gustavo
Elsztain is brother of our Chairman Mr. Eduardo S. Elsztain and
Daniel Ricardo Elsztain, and cousin of Fernando Adrián
Elsztain.
Gabriel A. G.
Reznik.
Mr. Reznik obtained a degree in Civil Engineering
from University of Buenos Aires (
Universidad de Buenos Aires)
. He worked
for IRSA Inversiones y Representaciones Sociedad Anónima since
1992 until May 2005 at which time he resigned. He had formerly
worked for an independent construction company in Argentina. He is
director of Emprendimientos Recoleta S.A., and Puerto Retiro S.A.,
as well as member of the board of Banco Hipotecario S.A., among
other companies.
Jorge Oscar
Fernández.
Mr. Fernández obtained a
degree in Economic Sciences from University of Buenos Aires
(
Universidad de Buenos
Aires)
. He has performed professional activities at several
banks, financial corporations, insurance firms and
other companies related to financial services. He is also
involved in many industrial and commercial institutions and
associations
.
Fernando Adrián
Elsztain.
Mr. Elsztain studied architecture at University of
Buenos Aires (
Universidad de
Buenos Aires)
. He has been engaged in the real estate
business as a consultant and as managing officer of a real estate
company. He is chairman of the board of directors of Llao Llao
Resorts S.A., Palermo Invest S.A. and Nuevas Fronteras S.A. He is
also a director of IRSA Inversiones y Representaciones Sociedad
Anónima, IRSA Propiedades Comerciales S.A., and Hoteles
Argentinos S.A. He is also alternate director of Puerto Retiro S.A.
and Banco Hipotecario S.A., among other companies. He is cousin of
our CEO, Alejandro Elsztain, and of our Chairman, Mr. Eduardo S.
Elsztain.
Pedro Damaso Labaqui
Palacio.
Mr.
Labaqui obtained a law degree from University of Buenos Aires
(
Universidad de Buenos
Aires
). He is also director of Bapro Medios de Pago S.A.,
Permanent Syndic of Bayfe S.A. Fondos Comunes de Inversión,
director and member of the Supervisory Committee of J. Minetti
S.A.; and Director of REM Sociedad de Bolsa S.A.
Daniel E.
Mellicovsky.
Mr. Mellicovsky obtained a degree in accounting
from the University of Buenos Aires (Universidad de Buenos Aires).
He has served as director of several companies of the agricultural,
food supplies, financial and hotel development sectors
.
Alejandro Gustavo
Casaretto
Mr. Casaretto obtained a degree in agricultural
engineering from University of Buenos Aires (
Universidad de Buenos Aires)
. He has
served as our technical manager, farm manager, and technical
coordinator since 1975.
Gastón Armando
Lernoud.
Mr. Lernoud obtained a law degree from El Salvador
University (
Universidad de El
Salvador)
in 1992. He obtained a Masters degree in Corporate
Law in 1996 from Palermo University (
Universidad de Palermo)
. He was a
senior associate member of Zang, Bergel & Viñes law firm
until June 2002, when he joined our Company’s lawyers
team.
Enrique Antonini.
Mr. Antonini holds a degree in law from the University of Buenos
Aires
(Universidad de Buenos
Aires)
. He is currently a member of the board of directors
of Banco Mariva S.A. (since 1992), and Mariva Bursátil S.A.
(since 1997). He has also served as director of IRSA Inversiones y
Representaciones Sociedad Anónima from 1993 to 2002, and at
present he is alternate director of IRSA Inversiones y
Representaciones Sociedad Anónima. He is member of the Banking
Lawyers Committee and the International Bar
Association.
Eduardo Kalpakian.
Mr. Kalpakian holds a degree in business from the University of
Belgrano
(Universidad de
Belgrano)
. He has also an MBA from the CEMA University of
Argentina. He has been director for 25 years of Kalpakian Hnos.
S.A.C.I., a leading carpet manufacturer and flooring distributor in
Argentina. Currently is vice-chairman of such company’s board
and CEO. He is also vice-chairman of the board of La Dormida
S.A.A.C.E I.
Employment
contracts with our directors and certain senior
managers
We do not have
written contracts with our directors. However, Messrs. Eduardo S.
Elsztain, Saúl Zang, Alejandro G. Elsztain, Fernando A.
Elsztain, Alejandro G. Casaretto and Gastón Armando Lernoud
are employed by us under the Labor Contract Law No.
20,744.
Law No. 20,744
governs certain conditions of the labor relationship, including
remuneration, protection of wages, hours of work, holidays, paid
leave, maternity protection, minimum age requirements, protection
of young workers and suspension and termination of the
contract.
Senior
Management
Senior management performs
its duties in accordance with the instructions of our board of
directors. There are no arrangements by which a person is selected
as a member of our senior management.
The following table
shows information about our current senior management of the
Operations Center in Argentina (designated by the board of
directors meeting):
|
Name
|
Date
of Birth
|
Position
|
Current
Position Held Since
|
|
Alejandro G.
Elsztain
|
03/31/1966
|
CEO
|
1994
|
|
Carlos
Blousson
|
09/21/1963
|
General Manager for
Argentina and Bolivia Operations
|
2008
|
|
Matías I.
Gaivironsky
Alejandro
Casaretto
|
02/23/1976
10/15/1952
|
Chief Financial and
Administrative Officer
Chief Regional
Agricultural Officer
|
2011
2008
|
The following is a
biographical description of each of our senior managers who are not
directors:
Matías Iván Gaivironsky
. Mr.
Matías Gaivironsky obtained a degree in business
administration from Universidad de Buenos Aires. He has a Master in
Finance from Universidad del CEMA. Since 1997 he has served in
various positions at IRSA, IRSA CP and the Company, and he has
served as Chief Financial Officer since December 2011. In early
2016, he was also designated to add the funtions of Administrative
Officer. In 2008 he served as Chief Financial Officer in Tarshop
S.A. and was later appointed Manager of the Capital Markets and
Investor Relations Division of IRSA, IRSA CP and the
Company.
Carlos Blousson.
Mr. Blousson obtained
a degree in agricultural engineering from University of Burnos
Aires (
Universidad de Buenos
Aires
). He has been working as our Chief Sales Officer since
1996. Prior to joining us, he worked as a futures and options
operator at Vanexva Bursátil –Sociedad de Bolsa.
Previously, he worked as a farmland manager and a technical advisor
at Leucon S.A.
The following table
shows information about our current senior management of the
Operations Center in Israel:
|
Name
|
Date of birth
|
Position
|
Current position held since
|
|
Sholem
Lapidot
|
10/22/1979
|
Chief
Executive Officer
|
2016
|
|
Gil
Kotler
|
04/10/1966
|
Chief
Financial Officer
|
2016
|
|
Aaron
Kaufman
|
03/03/1970
|
VP
& General Counsel
|
2015
|
Sholem
Lapidot.
Mr.
Lapidot has studied Rabbinical Studies and Jewish Philosophy in
Argentina, Canada and Israel. He serves as Director in Discount
Investment Corp. He has been the chief executive officer of IDB
Development since January 2016.
Gil
Kotler.
Mr.
Kotler obtained a bachelors’ degree in economics and
accounting from Tel Aviv University in Israel in 1993. As well as a
GMP at Harvard Business School in 2011. He has been the chief
financial officer of IDB Development since April 2016.
Aaron
Kaufman.
Mr.
Kaufman obtained a law degree in Tel Aviv University in 1996. He
has been partner in Epstein Law Firm until November 2015, when he
joined IDBD as a VP and General Counsel.
185
Executive
Committee
Pursuant to our
by-laws, our day-to-day business is managed by an executive
committee consisting of a minimum of four and a maximum of seven
directors and one alternate member, among which there should be the
chairman, first vice-chairman and second vice-chairman of the board
of directors. The current members of the Executive Committee are
Messrs. Eduardo S. Elsztain, Saúl Zang, Alejandro Elsztain and
Fernando A. Elsztain.
The executive
committee is responsible for the management of the day-to-day
business pursuant to authority delegated by our board of directors
in accordance with applicable law and our by-laws. Our by-laws
authorize the executive committee to:
|
•
|
designate the
managers and establish the duties and compensation of such
managers;
|
|
•
|
grant and revoke
powers of attorney to attorneys-at-law on behalf of
us;
|
|
•
|
hire, discipline
and fire personnel and determine wages, salaries and compensation
of personnel;
|
|
•
|
enter into
contracts related to our business;
|
|
•
|
manage our
assets;
|
|
•
|
enter into loan
agreements for our business and set up liens to secure our
obligations; and
|
|
•
|
perform any other
acts necessary to manage our day-to-day business.
|
Supervisory
Committee
Our Supervisory
Committee is responsible for reviewing and supervising our
administration and affairs, and verifying compliance with the
bylaws and the decisions adopted at shareholders’ meetings
pursuant to the provision of the General Companies Law. The members
of the Supervisory Committee are appointed at the annual general
ordinary shareholders’ meeting for a term of one year. The
Supervisory Committee is composed of three members and three
alternate members.
The following table shows
information about the members of our Supervisory Committee, who
were elected in the annual general ordinary shareholders’
meeting which was held on October 30, 2015:
|
Member
|
Date
of Birth
|
Position
|
|
José Daniel
Abelovich
|
07/20/1956
|
Member
|
|
Marcelo Héctor
Fuxman
|
11/30/1955
|
Member
|
|
Noemí Ivonne
Cohn
|
05/20/1959
|
Member
|
|
Roberto Daniel
Murmis
|
04/07/1959
|
Alternate
Member
|
|
Alicia Graciela
Rigueira
|
12/02/1951
|
Alternate
member
|
|
Sergio Leonardo
Kolaczyk
|
11/28/1964
|
Alternate
member
|
All members of the
supervisory committee qualify as independent, in accordance with
CNV Resolution No. 400/2002 Rules.
Set forth below is
a brief biographical description of each member of our Supervisory
Committee:
José Daniel
Abelovich.
Mr. Abelovich obtained a degree in accounting
from the University of Buenos Aires (
Universidad de Buenos Aires)
. He is a
founding member and partner of Abelovich, Polano & Asociados
S.R.L. / firm member of Nexia International, a public accounting
firm in Argentina. Formerly, he had been a manager of Harteneck,
López y Cía/Coopers & Lybrand and has served as a
senior advisor in Argentina for the United Nations and the World
Bank. He is a member of the Supervisory Committees of IRSA
Inversiones y Representaciones Sociedad Anónima, IRSA
Propiedades Comerciales S.A,, Hoteles Argentinos S.A., Inversora
Bolívar, and Banco Hipotecario S.A, among other
companies.
Marcelo Héctor
Fuxman.
Mr. Fuxman obtained a degree in accounting from the
University of Buenos Aires (
Universidad de Buenos Aires)
. He is a
partner of Abelovich, Polano & Asociados S.R.L. / firm member
of Nexia International, a public accounting firm in Argentina. He
is also a member of the Supervisory Committees of IRSA Inversiones
y Representaciones Sociedad Anónima, IRSA Propiedades
Comerciales S.A, Hoteles Argentinos S.A., Inversora Bolívar,
and Banco Hipotecario S.A, among other companies.
Noemí Ivonne
Cohn.
Mrs. Cohn obtained a degree in accounting from the
University of Buenos Aires
(Universidad de Buenos
Aires)
. Mrs. Cohn is a partner at Abelovich, Polano
& Asociados S.R.L. / firm member of Nexia International a
public accounting firm in Argentina, and works in the audit
area. Mrs. Cohn worked in the audit area in Harteneck, Lopez
and Company, Coopers & Lybrand in Argentina and in Los Angeles,
California. Mrs. Cohn is member of the Supervisory Committees of
IRSA Inversiones y Representaciones Sociedad Anónima and the
Company, among other companies.
Roberto Daniel
Murmis.
Mr. Murmis holds a degree in accounting from the
University of Buenos Aires (
Universidad de Buenos Aires)
. Mr.
Murmis is a partner at Abelovich, Polano & Asociados S.R.L /
firm member of Nexia International. Mr. Murmis worked as an advisor
to the Public Revenue Secretariat, Argentine Ministry of Economy.
Furthermore, he is a member of the Supervisory Committee of IRSA
Inversiones y Representaciones Sociedad Anónima,, Futuros y
Opciones S.A., and Llao Llao Resorts S.A, among other
companies.
Alicia Graciela
Rigueira.
Mrs. Rigueira holds a degree in accounting from
the University of Buenos Aires
(Universidad de Buenos Aires)
. Since
1998 she has been a manager at Estudio Abelovich, Polano &
Asociados / firm member of Nexia International. From 1974 to 1998,
Mrs. Rigueira performed several functions in Harteneck, Lopez y
Cia. affiliated with Coopers & Lybrand. Mrs. Rigueira
lectured at the School of Economic Sciences of Lomas de Zamora
University.
Sergio Leonardo
Kolaczyk.
Mr. Kolaczyk obtained a degree in accounting from
the Universidad de Buenos Aires
(Universidad de Buenos Aires)
. He is a
professional of Abelovich, Polano & Asociados S.R.L. / firm
member of Nexia International. He is also an alternate member of
IRSA Inversiones y Representaciones Sociedad Anónima and IRSA
Propiedades Comerciales S.A’s Supervisory
Committees.
KEY
EMPLOYEES
There are no key
employees.
186
B.
COMPENSATION
Compensation of directors
Under the Argentine
Law, if the compensation of the members of the Board of Directors
is not established in the by-laws of the Company, it should be
determined by the shareholders’ meeting. The maximum amount
of total compensation to the members of the Board of Directors,
including compensation for technical or administrative permanent
activities, cannot exceed 25% of the earnings of the Company. That
amount should be limited to 5% when there is no distribution of
dividends to shareholders and will be increased proportionally to
the distribution, in accordance with the formulas and scales set
forth under the CNV’s Technical Rules. When one or more
directors perform special commissions or technical or
administrative activities, and there are no earnings to distribute
or they are reduced, the shareholding meeting shall approve
compensation in excess of the above metioned limits.
The compensation of
our directors for each fiscal year is determined pursuant to
Argentine law, and taking into consideration whether the directors
performed technical or administrative activities and our fiscal
year’s results. Once the amount is determined, it is
considered at the shareholders’ meeting.
At our
shareholders’ meeting held on October 30, 2015, a
compensations for an aggregate amount of Ps.14,310,941 was approved
for all of our directors for the fiscal year ended June 30,
2015.
Compensation of Supervisory Committee
Our
shareholders’ meeting held on October 30, 2015 further
approved by majority vote not to pay a compensation to our
Supervisory Committee.
Compensation of Senior Management
Our senior
management is paid a fixed amount established by taking into
consideration their background, capacity and experience and an
annual bonus which varies according to their individual performance
and our results.
The total and
aggregate compensation paid to our senior management of the
Operations Center in Argentina and the Agricultural Business for
the fiscal year 2015/2016, started in July 2015, was Ps.
4,943,802.
The aggregate
compensation paid to our Senior Management of the Operations Center
in Israel since we gained control of IDBD on October 11, 2015 and
until June 30, 2016, was Ps.11,36 million. For our CEO and CFO
total compensation was considered since they were appointed in
January 2016.
Compensation of the Audit Committee
The members of our
Audit Committee do not receive any additional compensation other
than that received for their services as members of our board of
directors.
Capitalization Program for our executive staff
During the fiscal
year ended June 30, 2007, the Company developed the design of a
capitalization program for its executive staff consisting in
contributions made by both the employees and the
Company.
Such program is
intended for certain employees selected by the Company that it
wishes to retain by increasing employee total compensation by means
of an extraordinary reward in so far as certain requirements are
fulfilled.
The payment of
contributions into the plan and participation therein are
voluntary. Once the intended beneficiary accepts to take part in
the plan, he/she may make two types of contributions: a monthly
contribution based on his/her salary and an extraordinary
contribution, based on his/her annual bonus. It is suggested that
contributions should be of up to 2.5% of salaries and of up to 15%
of the annual bonus. And then there is the contribution payable by
the Company which shall amount to 200% of the monthly contributions
and of 300% of the extraordinary contributions made by the
employees.
The funds resulting
from the contributions made by the participants are transferred to
an independent financial vehicle, specially created and situated in
Argentina in the form of a mutual fund with the approval of the
CNV. These funds can be freely redeemed at the request of
participants.
The funds resulting
from the contributions made by both companies are transferred to
another independent financial vehicle, separate from the one
previously mentioned.
In the future, the
participants shall have access to 100% of the benefits under the
plan (that is, including the contributions made by the Company for
the benefit of the employees into the financial vehicle specially
created) in any of the following circumstances:
·
ordinary retirement
as prescribed by labor law
·
total or permanent
disability, and
·
death.
In case of
resignation or termination without good cause, the participant may
redeem the amounts contributed by us only if he or she has
participated in the Plan for at least 5 years and if certain
conditions have been fulfilled.
During this fiscal
year ended June 30, 2016, the Company has made contributions to the
plan for Ps. 3.6 million.
Long Term Incentive Program
The
Shareholders’ Meetings held on October 31, 2011, October 31,
2012, and October 31, 2013, ratified the resolutions approved
thereat as regards the incentive plan for the Company’s
executive officers, up to 1% of its shareholders’ equity by
allocating the same number of own treasury stock (the
“Plan”), and delegated on the Board of Directors the
broadest powers to fix the price, term, form, modality, opportunity
and other conditions to implement such plan. In this sense and in
accordance with the new Capital Markets Law, the Company has made
the relevant filing with the CNV and pursuant to the comments
received from such entity, it has made the relevant amendments to
the Plan which, after the CNV had stated to have no further
comments, were explained and approved at the Shareholders’
Meeting held on November 14, 2014, where the broadest powers were
also delegated to the Board of Directors to implement such
plan.
The Company has
developed a medium and long term incentive and retention stock
program for its management team and key employees under which
share-based contributions were calculated based on the annual bonus
for the years 2011, 2012, 2013 and 2014.
The beneficiaries
under the Plan are invited to participate by the Board of Directors
and their decision to access the Plan was voluntary.
187
In the future, the
Participants or their successors in interest will have access to
100% of the benefit (Cresud’s shares contributed by the
Company) in the following cases:
·
if an employee
resigns or is dismissed for no cause, he or she will be entitled to
the benefit only if 5 years have elapsed from the moment of each
contribution.
·
retirement.
·
total or permanent
disability.
·
death.
While participants
are part of the program and until the conditions mentioned above
are met to receive the shares corresponding to the contributions
based on the 2011 to 2013 bonus, participants will receive the
economic rights corresponding to the shares assigned to them. As
provided under the plan, the shares of stock corresponding to the
2014 bonus were delivered in April 2015; moreover, an amount
equivalent to one salary was delivered in the form of shares of
stock to those employees who did not participate in the plan and
who had discharged services for a term of two years.
The shares
allocated to the Plan by the Company are shares purchased in 2009,
which the Shareholders’ Meeting held on October 31, 2011, has
specifically decided to allocate to the program.
Our CEO of the
Operations Centers in Isreal, has a stock option remuneration plan
which includes 5,310,000 options, that will be given in five
series, and which may be exercised for 5,310,000 ordinary shares,
par value NIS 1 per share of Discount
Investments.
Benefits
upon Termination of Employment
There are no
contracts providing for benefits to directors upon termination of
employment, other than those described under the following
sections: (i) Item 6 “Directors, Senior Management and
Employees – B. Compensation – Capitalization Plan and
(ii) Item 6 “Directors, Senior Management and Employees
– B. Compensation – Mid and Long Term Incentive
Program.
Internal
Control
Management uses the
Internal Control-Integrated Framework issued by the Committee of
Sponsoring Organizations of the Treadway Commission (the
“COSO Report”) to assess effectiveness of internal
control over financial reporting.
The COSO Report
sets forth that internal control is a process, effected by an
entity’s board of directors, management and other personnel,
designed to provide reasonable assurance regarding the achievement
of the entity’s objectives in the following
categories:
·
Effectiveness and
efficiency of operations
·
Reliability of
financial reporting
·
Compliance with
applicable laws and regulations
Based on the above,
the Company’s internal control system involves all levels of
the company actively involved in exercising control:
·
the board of
directors, by establishing the objectives, principles and values,
setting the tone at the top and making the overall assessment of
results;
·
the management of
each area is responsible for internal control in relation to
objectives and activities of the relevant area, i.e. the
implementation of policies and procedures to achieve the results of
the area and, therefore, those of the entity as a
whole;
·
the other personnel
plays a role in exercising control, by generating information used
in the control system or taking action to ensure
control.
AUDIT
COMMITTEE
In accordance with
the Capital Markets Law No. 26.831 and the Rules of the CNV, our
board of directors has established an audit committee which would
focus on assisting the board in exercising its duty of care,
compliance with disclosure requirements, the enforcement of
accounting policies, the management of our business risks, the
management of our internal control systems, ethical conduct of our
businesses, monitoring the sufficiency of our financial statements,
our compliance with the laws, independence and capacity of
independent auditors and performance of audit duties both by our
Company and our external auditors. These responsabilities are meant
to comply with the duties assigned by Law 26.831, the Technical
Rules of the CNV, and other applicable laws.
On November 5,
2015, our board of directors appointed Jorge Oscar Fernández,
Pedro Damaso Labaqui Palacio, Daniel Elías Mellicovsky and
Gabriel Adolfo Gregorio Reznik, all of them independent members, as
members of the audit committee. The board of directors named Jorge
Oscar Fernández as the financial expert in accordance with the
relevant SEC rules. We have a fully independent audit committee as
per the standards provided in Rule 10(A)-3(b)(1).
Remuneration
Committee
There is no
remuneration committee.
D.
EMPLOYEES
Operations Center in
Argentina
As of June 30,
2016, we had 2,879 employees.
As of such date, we
had 1,117 permanent and 9 temporary employees in our Agricultural
Business in Argentina, including our employees, FyO and SACPSA but
not those of Agro-Uranga S.A. Approximately 52% are under
collective labor agreements. We have good relations with each of
our employees.
We employ 161
people in our International Agricultural businesses, composed of
122 employees of Brasilagro and 39 employees in the companies
located in Bolivia.
Our Real Estate
Business had 1,753 employees. Our Development and Sale of
Properties and Other Non-Shopping Center Businesses segment had 31
employees, 4 of whom are represented by the Commerce Labor Union
(Sindicato de Empleados de Comercio, or SEC) and 10 by the
Horizontal Property Union (SUTERH). The Shopping Center segment had
964 employees including 461 under collective labor agreements. Our
Hotels segment had 758 employees with 622 represented by the
Tourism, Hotels and Gastronomy Union from the Argentine Republic
(
Unión de Trabajadores del
Turismo, Hoteleros y Gastronómicos de la República
Argentina
) (UTHGRA).
188
The following table
shows the number of employees in the Company’s various
businesses as of the dates mentioned below:
|
|
Agricultural
Business
(1)
|
Real
Estate Business
|
|||||||
|
|
Permanent
|
Temporary
|
Development
and Sale of Properties and Other Non-Shopping Center Businesses
(2)
|
Shopping
Centers
|
Hotels
(3)
|
Total
|
|
||
|
June 30,
2011
|
772
|
48
|
82
|
811
|
678
|
2,391
|
|
||
|
June 30,
2012
|
848
|
17
|
92
|
833
|
662
|
2,452
|
|
||
|
June 30,
2013
|
857
|
11
|
91
|
787
|
662
|
2,408
|
|
||
|
June 30,
2014
|
756
|
16
|
89
|
872
|
647
|
2,380
|
|
||
|
June 30,
2015
(4)
|
1,099
|
16
|
34
|
973
|
704
|
2,826
|
|
||
|
June 30,
2016
|
1,117
|
9
|
31
|
964
|
758
|
2,879
|
|
||
(1)
Agricultural
Business includes our employees and employees of FyO and SACPSA,
but not those of Agro-Uranga S.A.
(2)
Includes IRSA,
Consorcio Libertador S.A., and Consorcio Maipú 1300
S.A.
(3)
Hotels include
Intercontinental, Sheraton Libertador and Llao
Llao.
(4)
During April and
May 2015, the employees who were assigned to IRSA, and used to be
in charge of the building’s operations and the real estate
business, were transferred to IRSA Commercial
Properties.
Operations Center in
Israel
The following table
shows the number of employees as of March 31, 2016 of our Israeli
operating center divided by company:
|
IDBD
|
29
|
|
DIC
(1)
|
31
|
|
Shufersal
|
13,726
|
|
Cellcom
(2)
|
3,138
|
|
PBC
(3)
|
221
|
|
Other
(4)
|
1,042
|
|
Total
|
18,187
|
(1) Includes
Elron’s employees.
(2) Does not
include temporary or external employees.
(3) Includes 106
hotel and cleaning employees.
(4) Includes IDBG,
Bartan and IDB Tourism
E.
SHARE OWNERSHIP
Share ownership of
directors, members of the supervisory committee, and senior
management as of June 30, 2016.
The following table
sets forth the amount and percentage (expressed on a fully diluted
basis) of our shares beneficially owned by our directors,
Supervisory Committee and senior management as of June 30,
2016
(2)
:
|
Name
|
Position
|
Number
of Shares
|
Percentage
|
|
Directors
|
|
|
|
|
Eduardo Sergio
Elsztain
(1)
|
Chairman
|
154,993,977
|
30.90%
|
|
Saúl
Zang
|
First
vice-chairman
|
4,012,506
|
0.80%
|
|
Alejandro Gustavo
Elsztain
|
Second vice-
chairman / Chief Executive Officer
|
7,145,810
|
1.42%
|
|
Gabriel A. G.
Reznik
|
Director
|
-
|
-
|
|
Jorge Oscar
Fernández
|
Director
|
3,034,219
|
0.60%
|
|
Fernando
Adrián Elsztain
|
Director
|
-
|
-
|
|
Pedro Damaso
Labaqui Palacio
|
Director
|
6,000
|
0.00%
|
|
Daniel Elias
Mellicovsky
|
Director
|
-
|
-
|
|
Alejandro Gustavo
Casaretto
|
Director/Regional
manager of Agricultural Real Estate
|
135,035
|
0.03%
|
|
Gastón Armando
Lernoud
|
Alternate
Director
|
11,091
|
0.00%
|
|
Enrique
Antonini
|
Alternate
Director
|
-
|
-
|
|
Eduardo
Kalpakian
|
Alternate
Director
|
-
|
-
|
|
|
|
|
|
|
Senior
Management
|
|
|
|
|
Matias
Gaivironsky
|
Chief Financial and
Administrative Officer
|
83,080
|
0.02%
|
|
Carlos
Blousson
|
Chief Executive
Officer of the International Operation
|
9,986
|
0.00%
|
|
|
|
|
|
|
Supervisory
Committee
|
|
|
|
|
José Daniel
Abelovich
|
Member
|
-
|
-
|
|
Marcelo Héctor
Fuxman
|
Member
|
-
|
-
|
|
Noemí Ivonne
Cohn
|
Member
|
-
|
-
|
|
Roberto Daniel
Murmis
|
Alternate
member
|
-
|
-
|
|
Alicia Graciela
Rigueira
|
Alternate
member
|
-
|
-
|
|
Sergio Leonardo
Kolaczyk
|
Alternate
member
|
-
|
-
|
|
Executive
Committee
|
|
|
|
|
Eduardo Sergio
Elsztain
|
Member
|
154,993,977
|
30.90%
|
|
Saúl
Zang
|
Member
|
4,012,506
|
0.80%
|
|
Alejandro Gustavo
Elsztain
|
Member
|
7,145,810
|
1.42%
|
|
|
|
|
|
|
|
|
|
|
(1)
Includes (i)
154,898,780 shares beneficially owned by IFISA, for which Mr.
Eduardo S. Elsztain may be deemed beneficial owner, (ii) 880 common
shares beneficially owned by Consultores Venture Capital Uruguay
S.A. (iii) 752 common shares held by Consultores Asset Management
S.A. and (iv) 93,565 common shares owned directly by Mr. Eduardo S.
Elsztain.
(2)
David Alberto Perednik resigned his position as alternate director on September 29, 2016. For more information please see “Recent DevelopmentsResignation as alternate director.”
189
Option Ownership
No options to
purchase shares have been granted to our Directors, Senior
Managers, members of the Supervisory Committee, or Audit
Committee.
Employees’ Participation in our Capital Stock
There are no
arrangements for involving our employees in our capital stock or
related to the issuance of options, shares or securities other than
those described under the following sections: (i) Item 6:
Directors, Senior Management and Employees – B. Compensation
– Capitalization Plan and (ii) Item 6. Directors, Senior
Management and Employees – B. Compensation – Mid and
Long Term Incentive Program.
A.
MAJOR SHAREHOLDERS
Information
about Major Shareholders
Share
Ownership
The following table
sets forth information regarding ownership of our capital stock by
each person known to us to own beneficially at least 5% of our
common shares, ANSES (The Argentine Social Security National
Agency) and all our directors and officers as a group. Percentages
are expressed on a fully diluted basis.
|
|
Share Ownership as of
June 30, 2016
|
|
|
Shareholder
|
Number of Shares
|
Percentage
|
|
IFISA
(1)(2)
|
154,993,977
|
30.90%
|
|
Directors and
officers
(3)
|
14,541,717
|
2.90%
|
|
ANSES
|
17,862,157
|
3.56%
|
|
Total
|
187,397,851
|
37.36%
|
(1)
Eduardo S. Elsztain
is the Chairman of the board of directors of IFIS Limited, a
corporation organized under the laws of Bermuda and Inversiones
Financieras del Sur S.A., a corporation organized under the laws of
Uruguay. Mr. Elsztain holds (through companies controlled by him
and proxies) a majority of the voting power in IFIS Ltd., which
owns 100% of IFISA.
(2)
As a result, Mr.
Elsztain may be deemed beneficial owner of 30.90% of our total
shares, which includes (i) 154,898,780 shares beneficially owned by
Inversiones Financieras del Sur S.A., for which Mr. Eduardo S.
Elsztain may be deemed beneficial owner, (ii) 880 common shares
beneficially owned by Consultores Venture Capital Uruguay S.A.,
(iii) 752 common shares held by Consultores Asset Management S.A.
and (iv) 93,565 common shares owned directly by Mr. Eduardo S.
Elsztain.
(3)
Includes only
direct ownership of our Directors and Senior Management, other than
Mr. Eduardo S. Elsztain.
190
Change
in Capital Stock Ownership
|
|
As
of June 30,
|
||||
|
|
2016
|
2015
|
2014
|
2013
|
2012
|
|
IFISA
(1)(2)
|
30.9%
|
37.4%
|
39.3%
|
39.3%
|
38.8%
|
|
D.E. Shaw & Co
L.P.
(3)
|
-
|
-
|
0.7%
|
2.1%
|
3.2%
|
|
Senvest Management
LLC
|
4.7%
|
5.1%
|
3.6%
|
0.7%
|
0.3%
|
|
Directors and
officers
(4)
|
2.9%
|
2.3%
|
2.4%
|
2.2%
|
1.9%
|
|
ANSES
|
3.6%
|
3.6%
|
3.4%
|
3.4%
|
3.1%
|
(1)
Mr. Eduardo S.
Elsztain is the Chairman of the board of directors of IFIS Limited,
a corporation organized under the laws of Bermuda and Inversiones
Financieras del Sur S.A., a corporation organized under the laws of
Uruguay. Mr. Elsztain holds (through companies controlled by him
and proxies) a majority of the voting power in IFIS Ltd., which
owns 100% of IFISA.
(2)
As a result, Mr.
Eduardo S. Elsztain may be deemed beneficial owner of 30.90% of our
total shares, which includes (i) 154,898,780 shares beneficially
owned by Inversiones Financieras del Sur S.A., for which Mr.
Eduardo S. Elsztain may be deemed beneficial owner, (ii) 880 common
shares beneficially owned by Consultores Venture Capital Uruguay
S.A., (iii) 752 common shares held by Consultores Asset Management
S.A. (iv) 93,565 common shares owned directly by
Mr. Eduardo S. Elsztain.
(3)
According to the
Form filed with the SEC.
(4)
Includes only
direct ownership of our Directors and Senior Management, other than
Mr. Eduardo S. Elsztain.
Difference
in Voting Rights
Our major
shareholders do not have different voting rights.
Arrangements
for change in control
There are no
arrangements that may at a subsequent date in a change in
control.
Securities
held in the host country
As of June 30,
2016, our total issued and outstanding capital stock outstanding
consisted of 501,642,804 common shares. As of June 30,
2016, there were approximately 41,803,722 Global Depositary Shares
(representing 418,037,222 of our common shares, or 83.33% of all of
our outstanding shares held) in the United States by approximately
86 registered holders of Global Depositary Shares.
As of June 30, 2016
our directors and senior officers controlled, directly or
indirectly, approximately 33.79% of our common shares. As a result,
these shareholders have, and will continue to have, significant
influence on the election of our directors and the outcome of any
action requiring shareholder approval.
B.
RELATED PARTY TRANSACTIONS
We enter into
transactions with related parties on an arm’s-length basis. A
related party transaction means any transaction entered into
directly or indirectly by us or any of our subsidiaries that is
material based on the value of the transaction to (a) any director,
officer or member of our management or shareholders; (b) any entity
in which any such person described in clause (a) is interested; or
(c) any person who is connected or related to any such person
described in clause (a).
Agreement
for the Exchange of Corporate Services with IRSA and IRSA
CP
Considering that
each of IRSA, IRSA CP and us have operating areas which are
somewhat similar, the Board of Directors deemed it advisable to
implement alternatives aimed at reducing certain fixed costs of our
combined activities and to lessen their impact on operating results
while seizing and optimizing the individual efficiencies of each of
them in the different areas comprising the management of
operations.
To such end, on
June 30, 2004, a Master Agreement for the Exchange of Corporate
Services (“Frame Agreement") was entered into between IRSA,
IRSA CP and us, which was amended several times to bring it in line
with evolving requirements. The agreement has a term of 24 months,
is renewable automatically for equal periods, unless it is
terminated by any of the parties upon prior notice.
This agreement
currently provides for the exchange and sharing of services among
the following areas: Human Resources, Finance, Institutional
Relations, Administration and Control, Insurance, Security,
Agreements, Technical Tasks, Infrastructure and Services,
Procurement, Architecture and Design, Development and Works, Real
Estate, Hotels, Board of Directors, Board of directors of Real
Estate Business, General Manager Office, Board Safety, Audit
Committee, Real Estate Business Management, Human Resources of Real
Estate Business, Fraud Prevention, Internal Audit and Agricultural
Investment Management.
Pursuant to this
agreement, the companies hired Deloitte & Co., an external
consulting firm to review and evaluate half-yearly the criteria
used in the process of liquidating the corporate services, as well
as the basis for distribution and source documentation used in the
process indicated above, by means of a half-yearly
report.
The operations
indicated above allow both IRSA and IRSA CP to keep our strategic
and commercial decisions fully independent and confidential, with
cost and profit apportionment being allocated on the basis of
operating efficiency and equity, without pursuing individual
economic benefits for any of the related companies.
Offices
and Shopping centers spaces leases
Our
Chairman’s offices are located at Bolívar 108, City of
Buenos Aires. We have leased this property from Isaac Elsztain e
Hijos S.C.A., a company controlled by certain relatives of Eduardo
S. Elsztain, our chairman, and also from Hamonet S.A., a company
controlled by Fernando A. Elsztain, one of our Directors, and
certain of his relatives.
In addition, we,
IRSA, Tarshop, BACS, BHN Sociedad de Inversión S.A., BHN
Seguros Generales S.A. and BHN Visa S.A. rent offices owned by IRSA
CP in different buildings.
Furthermore, we
also let various spaces in our Shopping Centers (stores, stands,
storage space or advertising space) to third parties and related
parties such us Tarshop S.A. and BHSA.
Lease agreements
entered into with associates included similar provisions and
amounts to those included in agreements with third
parties.
Donations
granted to Fundación IRSA and Fundación Museo de los
Niños
Fundación IRSA
is a non-profit charity institution that seeks to support and
generate initiatives concerning education, the promotion of
corporate social responsibility and the entrepreneurial spirit of
the youth. It carries out corporate volunteering programs and
fosters donations by the Company’s employees. The main
members of Fundación IRSA's Board of Directors are: Eduardo S.
Elsztain (President); Saul Zang (Vice President I), Alejandro
Elsztain (Vice President II) and Mariana C. de Elsztain
(secretary). It finances its activities with donations from IRSA,
IRSA CP, Cresud and others related companies.
191
On October 31,
1997, IRSA CP entered into an agreement with Fundación IRSA
whereby 3,800 square meters of the constructed area at the Abasto
shopping center was granted under a gratuitous bailment agreement
for a term of 30 years. Subsequently, on October 29, 1999,
Fundación IRSA assigned free of cost all the rights of use
over such store and its respective obligations to Fundación
Museo de los Niños.
On November 29,
2005, IRSA CP signed another agreement with Fundación Museo de
los Niños granting under gratuitous bailment 2,670.11 square
meters of the constructed area at Alto Rosario shopping center for
a term of 30 years.
Fundación
Museo de los Niños has used these spaces to set up
“Museo de los Niños”, Abasto and “Museo de
los Niños, Rosario”, two interactive learning centers
intended for children and adults. Both agreements establish the
payment of common expenses and direct expenses related to the
services performed by these stores should be borne by
Fundación Museo de los Niños.
Legal
Services
We hire legal
services from Estudio Zang, Bergel & Viñes, in which
Saúl Zang is a partner. Mr. Zang is a member of our Board of
Directors and that of our related companies. During the fiscal
years ended June 30, 2016, 2015 and 2014 we paid Zang, Bergel &
Viñes Abogados an aggregate amount of approximately Ps.6
million, Ps.5 million and Ps.4 million, respectively, as payment
for legal services.
Purchase
of agrochemicals from Adama
Adama is a company
specialized in agrochemicals, particularly used in farming, and is
a worldwide leader in active ingredients used in agricultural
production. CRESUD, in the normal course of its business, acquires
agrochemical products and/or hires services from
Adama. On July 17, 2016, DIC reported that it had signed
an agreement with ChemChina to sell 40% of Adama Agricultural
Solutions Ltd.’s shares, indirectly controlled by IDBD
through DIC. For more information see “Recent
Developments.”
Hospitality
Services
We and our related
parties hire, in certain occasions, hotel services and lease
conference rooms for events to Nuevas Fronteras S.A. and Hoteles
Argentinos S.A., subsidiaries of IRSA.
Purchase
and sale of goods and/or service hiring
In the normal
course of its business and with the aim of making resources more
efficient, we, or our related parties, including our parent
company, in certain occasions purchases and/or hires services which
later sells and/or recovers for companies or other related parties,
based upon their actual utilization.
Borrowings
In the normal
course of its activities, we enter into diverse loan agreements or
credit facilities between our subsidiaries and/or other related
parties. These borrowings generally accrue interests at market
rates.
Financial
and service operations
We work with
several financial entities in Argentina for operations including,
but not limited to, credit, investment, purchase and sale of
securities and financial derivatives. Such entities include Banco
Hipotecario S.A. and its subsidiaries. Furthermore, Banco
Hipotecario S.A. and BACS Banco de Crédito y
Securitización S.A. usually act as underwriters in Capital
Market transactions.
In addition, we
have entered into agreements with BHSA, who provides collection
services for our Shopping Centers.
Transactions
with IFISA
On February 10,
2015, Dolphin, sold 71,388,470 IDBD shares to IFISA, for an amount
of US$ 25.6 million, US$ 4.0 million of which were paid upon
execution and the remaining balance of US$ 21.6 million were
financed for a term of up to 360 days and priced at Libor 1M (one
month) + 3%. On May 9, 2016, the parties agreed to extend the
expiration date for 30 days as from execution of the addenda, to be
automatically renewable every 30 days for a maximum term of 180
days, and increasing the rate to 9% since February 10,
2016.
On May 31, 2015,
IRSA, through Dolphin, sold to IFISA 46 million of warrants Series
4 for a total amount of NIS 0.46 million (equivalent to US$ 0.12
million at the time of the transaction), provided IFISA agreed to
exercise them fully when Dolphin were so required by
IDBD.
On July 28, 2015,
Dolphin granted a loan to IFISA for an amount of US$ 7.2 million,
due in July 2016, which accrues interest at Libor 1M (one month) +
3%. On May 9, the parties agreed to extend the expiration date to
June 8, 2016, to be automatically renewable every 30 days for a
maximum term of 180 days, and increased the rate to
9%.
On October 9, 2015,
IRSA granted a loan in the amount of US$ 40 million to IFISA. The
term of the loan is one year calculated from the disbursement and
will bear interest at a rate of 3% + Libor 1M, to be determined
monthly. On October 9, 2016, the parties agreed to extend the
expiration date to be automatically renewable every 30 days for a
maximum term of 180 days and increase the rate to 9%.
In February 2016,
DN B.V., a subsidiary of Dolphin, entered into an option contract
with IFISA whereby Dolphin is granted the right, but not the
obligation to acquire 92,665,925 shares of IDBD held by IFISA at a
share price of NIS 1.64 plus an annual interest of 8.5%. The
exercise date for the option extends for two years.
All transactions
are carried out at arm’s length.
On June 2014, the
Company – through its subsidiary, Real Estate Investment
Group IV LP – renewed a credit facility granted by IFISA, a
company indirectly controlled by Eduardo Sergio Elsztain, for a
total amount of 1.4 million shares of Hersha Hospitality Trust. The
transaction was agreed upon for a term of 30 days, which could be
renewed for up to 360 days; the facility was priced at Libor (3
months) + 50 bp. This credit facility was cancelled after the end
of fiscal year 2014 in order to sell the remaining amount of
Hersha.
As of June 30, 2016
we had current a credit line with IFISA of shares and/or GDRs of
IRSA for up to 3,500,000 GDRs. The expiration of this line will
operate in June 2017 and bears an annual fixed rate of
6%.
192
On June 18, 2012 we
entered a credit facility agreement with IFISA, pursuant to which
we agreed to lend to IFISA up to US$ 6.0 million, which will mature
on November 24, 2012, then it was extended until November 24, 2015,
at an interest rate equivalent to LIBOR (12 months) + 300 bp., date
in which was canceled.
Investment
in mutual funds of BACS Administradora de Activos S.A.
S.G.F.C.I.
We invest from time
to time our liquid fund in mutual funds managed by BACS
Administradora de Activos S.A. S.G.F.C.I., which is a subsidiary of
Banco Hipotecario, among other entities.
Credit line with IRSA Propiedades Comerciales S.A.
On July 5, 2016, IRSA renewed and
increased the credit line with IRSA Propiedades Comerciales S.A.
for up to US$ 120 million, in which IRSA Propiedades Comerciales
S.A. is the lender and IRSA is, directly or indirectly, the
borrower. The loan bears annual interest at a rate of 9% and
matures on June 24, 2017.
As of the date of this annual report,
the total amount due by IRSA to IRSA Commercial Properties amounts
to US$45 million.
Farmland
Lease Agreement San Bernardo
We lease a farmland
located in the Province of Córdoba, from San Bernardo de
Córdoba S.A. (formerly known as Isaac Elsztain e Hijos
S.C.A.), pursuant to a lease agreement effective as of August 2015.
The leased farmland has an extension of 12,600
hectares.
The rent to be paid
is the equivalent in Pesos of 3,5kg of beef per hectare. The beef
price will be set, taking into account the price per kilo of beef
quoted on Mercado de Hacienda de Liniers, the previous week of the
payment date. In addition, the parties have agreed in a
productivity prize of 15% of the weight that the cattle achieve
above 240.000kg. This prize will be payable on September 2016. This
lease contemplates the possibility of extension up to two periods
per year. Currently being agreed conditions of its
extension.
Consulting
Agreement
Pursuant to the
terms of the Consulting Agreement with Consultores Asset Management
effective as of November 7, 1994, Consultores Asset Management
provides us advisory services on matters related to capital
investments in all aspects of the agricultural business. One of our
shareholders and the Chairman of our board of directors is the
owner of 85% of the capital stock of Consultores Asset Management
and our First Vice Chairman of the board of directors holds the
remaining 15% of its capital stock.
Pursuant to the
terms of the Consulting Agreement, Consultores Asset Management
provides us with the following services:
|
•
|
advises with
respect to the investment of our capital in all aspects of
agricultural operations, including, among others, sales, marketing,
distribution, financing, investments, technology and business
proposals;
|
|
•
|
acts on our behalf
in such transactions, negotiating the prices, conditions, and other
terms of each operation; and
|
|
•
|
gives advice
regarding securities investments with respect to such
operations.
|
The Consulting
Agreement expressly provides that Consultores Asset Management may
not advise us with respect to transactions that are entirely
related to real estate.
Under the
Consulting Agreement, we pay Consultores Asset Management for its
services, an annual fee equal to 10% of our annual after-tax net
income.
During fiscal year
ended June 30, 2016 and 2014 there were not charges for consulting
agreement fees. During fiscal year ended June 30, 2015 the charge
for consulting agreement fees was of Ps. 11.4 million.
The Consulting
Agreement is subject to termination by either party upon not less
than 60 days prior written notice. If we terminate the Consulting
Agreement without cause, we will be liable to Consultores Asset
Management for twice the average of the amounts of the management
fee paid to Consultores Asset Management for the two fiscal years
prior to such termination.
Sale
of Advertising Space in Media
We and our related
parties usually execute agreements with third parties by which we
sell/acquire, for their future use rights to advertise in media
(TV, radio, newspapers, etc.) that are later used in advertising
campaigns.
Purchase
and sale of goods and/or service hiring
In the normal
course of its business and with the aim of making resources more
efficient, we, or our related parties, including our parent
company, in certain occasions purchases and/or hires services which
later sells and/or recovers for companies or other related parties,
based upon their actual utilization.
Investment
in Dolphin Fund Ltd.
As of the date of
this annual report, we have invested approximately US$544
million in Dolphin, through our subsidiaries. Dolphin Fund
Ltd, is an investment fund incorporated under the laws of Bermuda,
whose investment manager is Consultores Venture Capital Uruguay
S.A., a company controlled indirectly by our Chairman, Eduardo S.
Elsztain. Dolphin Netherlands is a subsidiary of Dolphin Fund Ltd,
incorporated in the Netherlands. Such investments were made in
order to carry out the investment in IDB Development Corp. For more
information please see Item 4. Information on the Company –
A. History and development of the Company – “Investment
of IDB Development Corporation Ltd. (IDBD).
193
Sale
of farmland "La Adela"
In July 2014 we
sold to our subsidiary IRSA the “La Adela” farm, with
an area approximately 1,058 hectares, located in the District of
Luján, Province of Buenos Aires, for a total amount of Ps. 210
million. Given its degree of development and closeness to the City
of Buenos Aires, this farm has a high urbanistic potential;
therefore, the purpose of selling it to IRSA is for it to launch a
new real estate development.
Transfer
of tax credits
Sociedad
Anónima Carnes Pampeanas S.A. (subsidiary of Cresud) and
Cresud, assigned credits to IRSA CP and other related parties
corresponding to value added tax export refunds related to such
companies’ business activity.
C.
INTERESTS OF EXPERTS AND COUNSEL
This section is not
applicable.
A.
AUDITED CONSOLIDATED STATEMENTS AND OTHER FINANCIAL
INFORMATION
See Item 18 for our
Audited Consolidated Financial Statements.
Legal
or arbitration proceedings
We are not engaged
in any material litigation or arbitration and no material
litigation or claim is known to us to be pending or threatened
against us, other than those described below.
Litigation with Exagrind S.A.
Cresud filed a
lawsuit through Inversiones Ganaderas S.A. (IGSA) (a former
subsidiary merged with the Company) on claims for damages and
losses produced by a fire in one of the Company's farms, “San
Rafael” farm, which is close to Exagrind’s property,
Tali Sumaj, in the Province of Catamarca, Argentina. The fire took
place on September 6, 2000. Exagrind claimed an amount of Ps. 2.9
million at that date. The extraordinary appeal to the High Court of
Justice of the Province of Catamarca, questioning the resolution
that ended the term to respond the case, arguing that at that
moment, the period was not completed, was favorably received.
Therefore, Cresud finally responded the case and showed proofs. As
of the consolidated financial statements date, the parties have
been notified that the term to submit allegations has started to
run. In March 2007, the court ordered an inhibition of assets which
was subsequently lifted. This decision was lifted in June 2007 and
Tali Sumaj farm on attachment has been accepted in replacement.
Exagrind S.A. requested that the measure be extended with an
attachment of bank accounts; this ruling has been challenged and to
date the accounts have not been attached. In June, 2010, the
Company sold the farm to a third party. Since the litigation is
still pending, the bond posted in favor of the buyer remains
effective as security for the obligations undertaken The Company
has recorded a provision amounting to Ps. 1.5 million, which is
included within “Labor, legal and other
claims”.
In addition, the
Company is involved in several legal proceedings, including tax,
labor, civil, administrative and other matters for which the
Company has not established provisions based on the information
assessed to date. In the opinion of management, the ultimate
disposition of any threatened or pending matters, either
individually or collectively, will not have a material adverse
effect on the consolidated financial position, liquidity and
results of operations of the Company. For ease of presentation, the
Company has categorized these matters between those arising out of
our agricultural and agro-industrial activities and those arising
out of our investment and development properties business
activities.
IRSA’s
and IRSA Commercial Properties’ legal or arbitration
proceedings
Operations Center in
Argentina
Set forth below is
a description of certain material legal proceedings to which IRSA
and IRSA Commercial Properties are a party. IRSA and IRSA
Commercial Properties are not engaged in any other material
litigation or arbitration and no other material litigation or claim
is known to IRSA to be pending or threatened against it or its
subsidiaries. Nevertheless, IRSA may be involved in other
litigation from time to time in the ordinary course of
business.
Puerto Retiro
On November 18,
1997, in connection with our acquisition of our subsidiary
Inversora Bolívar, we indirectly acquired 35.2% of the capital
stock of Puerto Retiro. Inversora Bolívar had purchased such
common shares of Puerto Retiro from Redona Investments Ltd. N.V. in
1996. In 1999, we, through Inversora Bolívar, increased our
interest in Puerto Retiro to 50.0% of its capital stock. On April
18, 2000, Puerto Retiro was served notice of a filing made by the
Argentine government, through the Ministry of Defense, seeking to
extend the bankruptcy of Indarsa to the Company. Upon filing of the
complaint, the bankruptcy court issued an order restraining the
ability of Puerto Retiro to dispose of, in any manner, the real
property it had purchased in 1993 from Tandanor. Puerto Retiro
appealed the restraining order which was confirmed by the Court on
December 14, 2000.
In 1991, Indarsa
had purchased 90% of Tandanor, a former government-owned company,
which owned a piece of land near Puerto Madero of approximately 8
hectares, divided into two parcels: Planta 1 and 2. After the
purchase of Tandanor by Indarsa, in June 1993, Tandanor sold
“Planta 1” to Puerto Retiro, for a sum of US$18 million
pursuant to a valuation performed by J.L. Ramos, a well-known real
estate brokerage firm in Argentina. Indarsa failed to pay to the
Argentine government the price for its purchase of the stock of
Tandanor, and as a result the Ministry of Defense requested the
bankruptcy of Indarsa. Since the only asset of Indarsa was its
holding in Tandanor, the Argentine government is seeking to extend
Indarsa’s bankruptcy to other companies or individuals which,
according to its view, acted as a single economic group. In
particular, the Argentine government has requested the extension of
Indarsa’s bankruptcy to Puerto Retiro which acquired Planta 1
from Tandanor.
The deadline for
producing evidence in relation to these legal proceedings has
expired. The parties have submitted their closing arguments and are
awaiting a final judgment. However, the judge has delayed his
decision until a final judgment in the criminal proceedings against
the former Defense Minister and former directors of Indarsa has
been delivered. It should be noticed, regarding the abovementioned
criminal procedure, that on February 23, 2011 it was resolved to
declare its expiration, and to dismiss certain defendants. However,
this resolution is not final because it was appealed. We cannot
give you any assurance that we will prevail in this proceeding, and
if the plaintiff’s claim is upheld by the courts, all of the
assets of Puerto Retiro would likely be used to pay Indarsa’s
debts and our investment in Puerto Retiro, would be lost. As of
June 30, 2016, we had not established any reserve with respect of
this contingency.
194
Tandanor has filed
a civil action against Puerto Retiro and the people charged in the
referred criminal case looking forward to be reimbursed from all
the losses which have arose upon the fraud committed. On March 7,
2015 Puerto Retiro responded filing certain preliminary objections,
such as prescription or limitation, lack of information to respond
the lawsuit, lack of legitimacy (active and passive). On July 12,
2016 Puerto Retiro was legally notified of the decision adopted by
the Tribunal Oral Federal N° 5 related to the preliminary
objections above mentioned. Two of them were rejected –lack
of information and lack of legitimacy (passive). We filed an appeal
with regard to the rejection of these two objections. But, on the
other hand, the other two objections will be studied at the moment
of deliver the sentence, which is an important step in order to
obtain a favorable decision.
Legal issues with the City Hall of Neuquén
In June 2001,
Shopping Neuquén requested that the City of Neuquén allow
it to transfer certain parcels of land to third parties so that
each participant in the commercial development to be constructed
would be able to build on its own land. Neuquén’s
Executive Branch previously rejected this request under Executive
Branch Decree N° 1437/2002 which also established the
expiration of the rights arising from Ordinance 5178 due to not
building the shopping center in time, including the loss of the
land and of any improvement and expenses incurred. As a result,
Shopping Neuquén had no right to claim indemnity charges and
annulled its buy-sell land contracts.
Shopping
Neuquén submitted a written appeal to this decision on January
21, 2003. It also sought permission to submit a revised schedule of
time terms for the construction of the shopping center, taking into
account the economic situation at that time and including
reasonable short and medium term projections. Neuquén’s
Executive Branch rejected this request in their Executive Branch
Decree 585/2003. Consequently, on June 25, 2003, Shopping
Neuquén filed an “Administrative Procedural
Action” with the High Court of Neuquén requesting, among
other things, the annulment of Executive Branch Decrees 1,437/2002
and 585/2003 issued by the City Executive Branch. On December 21,
2004, the High Court of Neuquén communicated its decision that
the administrative procedural action that Shopping Neuquén had
filed against the City of Neuquén had expired. Shopping
Neuquén filed an extraordinary appeal for the case to be sent
to the Argentine Supreme Court.
On December 13,
2006, while the case was under study in the Argentine Supreme
Court, Shopping Neuquén signed an agreement with both the City
and the Province of Neuquén that put an end to the lawsuit
between them and stipulated a new timetable for construction of the
commercial and housing enterprises (the “Agreement”).
Also, Shopping Neuquén was permitted to transfer certain
parcels to third parties so that each participant in the commercial
development to be constructed would be able to build on its own
land, with the exception of the land in which the shopping center
would be constructed. The Legislative Council of the City of
Neuquén duly ratified the Agreement. The City Executive Branch
promulgated the ordinance issued on February 12, 2007.
Shopping
Neuquén came to an agreement and paid all of the City’s
lawyers, including pending fees contested in court.
Shopping
Neuquén finished the construction and opened the shopping
center in March, 2015, obtaining also all necessary provincial and
city authorizations for it.
Arcos del Gourmet
In December 2011,
IRSA Commercial Properties started to develop, through our
subsidiary Arcos, the “Arcos” project located in the
neighborhood of Palermo, City of Buenos Aires. On December 10,
2013, Administrative and Tax Contentious Court of Appeal of the
City of Buenos Aires ratified an injunction that suspends the
opening of the shopping center on the grounds that it has failed to
obtain certain government permits. Despite the fact that the
construction has all government permits in place, IRSA Commercial
Properties has filed an appeal against the decision and have
requested that the injunction be lifted. In such sense, on April
10, 2014, the government of the City of Buenos Aires issued a new
environmental compliance certificate. IRSA Commercial Properties
obtained a favorable decision on this case based on procedural
grounds. Notwithstanding, the plaintiff appealed this decision, and
the file was placed on the Court of Appeal on September 23,
2014.
On the other hand,
there is another judicial process entitled “Federación
de Comercio e Industria de la Ciudad de Buenos Aires y Otros c/
Gobierno de la Ciudad Autónoma de Buenos Aires s/
Amparo”. On August 29, 2014 the lower court rendered a
decision rejecting the case. This resolution was appealed but
afterwards, was confirmed in December, 2014. Therefore, on December
18th, 2014, the “Arcos” Project was opened to the
public, operating normally nowadays. Notwithstanding, the plaintiff
appeared before the Superior Court of the City of Buenos Aires to
request the review of the case based on the constitutional’s
matters involved. The Court has not rendered a decision
yet.
Moreover, on May
18th, 2015 IRSA Commercial Properties was notified of the
revocation of the Agreement for the Reorganization for Use and
Exploitation Nº AF000261 (“Contrato de Readecuación
de Concesión de Uso y Explotación NºAF000261”
issued by the Agency for the Management of the State Assets
(“Agencia de Administración de Bienes del Estado”
or “AABE”) through Resolution Nº 170/2014. This
Resolution was not enacted due to breach of contract by Arcos del
Gourmet nor it has implied up to the date of this annual report the
interruption of the economic exploitation neither of the
functioning of the shopping center that IRSA Commercial Properties
operate there. IRSA Commercial Properties has filed the proper
administrative and judicial motions to revoke the Resolution and as
of the date of this annual report these proceedings are
ongoing.
Notwithstanding the
aforesaid, the “
Federación de Comercio e Industria de la
Ciudad de Buenos Aires
” has filed a motion for the
unhold of the injuction. On March 17, 2015 this request was
rejected. As a consequence, it has filed a complaint appeal,
process that has not been ended yet.
Other Litigation
As of July 5, 2006,
the
Administración Federal de
Ingresos Públicos
(“AFIP”) filed a
preliminary injunction with the Federal Court for Administrative
Proceedings against IRSA Commercial Properties for an aggregate
amount of Ps.3.7 million, plus an added amount, provisionally
estimated, of Ps.0.9 million for legal fees and interest. The main
dispute is about the income tax due for admission rights. In the
first instance, AFIP pleaded for a general restraining order. On
November 29, 2006, the Federal Court issued an order substituting
such restraining order for an attachment on the parcel of land
located in Caballito neighborhood, City of Buenos Aires, where IRSA
Commercial Properties is planning to develop a shopping center. As
of June 30, 2011, under court proceedings, the building was
subject to a legal attachment for Ps. 36.8 million. On December 12,
2012, the legal attachment was lifted and accredited in the file
concerned in February 2013.
After we sold the
Edificio Costeros, dique II, on November 20, 2009, we requested an
opinion to the Argentine Antitrust Authority as to whether it was
necessary to report this transaction. The Argentine Antitrust
Authoriry advise us that it was required to notify the transaction.
We challenged this decision, but it was confirmed. On December 5,
2011, we notified the transaction and on April 30, 2013 the
transaction was approved by the Argentine Antitrust Authority by
Resolution No. 38 as a result of that this legal proceeding was
concluded.
On January 15, 2007
we were notified of two claims filed against us before the
Argentine Antitrust Authority, one by a private individual and the
other one by the licensee of the shopping center, both opposing the
acquisition from the province of Córdoba of a property known
as Ex-Escuela Gobernador Vicente de Olmos. On February 1, 2007 we
responded the claims. On June 26, 2007, the Argentine Antitrust
Authority notified us that it has initiated a summary proceeding to
determine whether the completion of the transaction breaches the
Antitrust Law. As of the date of this filing the result of this
proceeding has not been determined.
195
On December 3,
2009, IRSA Commercial Properties filed a request for the Argentine
Antitrust Authority’s opinion regarding IRSA Commercial
Properties’ acquisition of common shares of Arcos del Gourmet
S.A. The Argentine Antitrust Authority advised the parties that the
transaction has to be notified. On December, 2010 the transaction
was filed with the Argentine Antitrust Authority. As of the date of
this annual report, the decision of the Argentine Antitrust
Authority is still pending.
On April 11, 2011,
Quality Invest requested the Argentine Antitrust Authority opinion
regarding Quality’s acquisition Property of a warehouse owned
by Nobleza Piccardo S.A.I.C. y F. located in San Martín,
Province of Buenos Aires. The Argentine Antitrust Authority stated
that there was an obligation to notify the situation, but Quality
Invest filed an appeal against this decision. Subsequently, the
Court of Appeals confirmed the Argentine Antitrust
Authorities’ decision regarding the obligation to notify and,
therefore, on February 23, 2012, the transaction was filed. As of
the date of this annual report, the Argentine Antitrust Authority
is analyzing this decision.
On august 23, 2011,
IRSA Commercial Properties notified the Argentine Antitrust
Authority the direct and indirect acquisition of common shares of
NPSF, the transaction involved the direct acquisition of 33.33% of
NPSF and 16.66% through our controlled vehicle Torodur S.A. As of
the date of this annual report the transaction is being analyzed by
the Argentine Antitrust Authority.
On June 16, 2012,
we sold to Cabaña Don Francisco S.A. certain Costeros Dique
IV’s functional units, to be used for office space, and
complementary units to be used for parking. In addition, we
assigned upon the purchaser all rights and interests arising from
lease agreements involving the conveyed units. As a result, an
advisory opinion was requested from the Argentine Antitrust
Authority as to the need to report such transaction. The Argentine
Antitrust Authority resolved that the transaction was exempt from
report on May 21, 2014, so this legal process was
finished.
On December 7,
2012, we filed with the Argentine Antitrust Authority the
adquisition of EHSA, which has the beneficial ownership of 50% of
La Rural S.A That company runs an exposition center known as Predio
Ferial de Palermo. As of the date of this annual report, the
Argentine Antitrust Authority is analyzing the
transaction.
Through the
issuance of Resolution N°. 16,521 dated February 17, 2011 the
CNV commenced a summary proceeding against the members of
IRSA’s board of directors and its supervisory committee
members (all of them at that time, including among others Eduardo
S. Elsztain), alleging certain formal errors in the Inventory and
Balance Sheet Book, specifically the failure by the Company to
comply with certain formalities in the presentation of a table
included in the Memoria (annual report); arising from an
investigation carried out by the CNV in October 2010. Applicable
law requires that the corrections of any errors in the annual
report include a legend identifying each error and the way in which
it was corrected, including insertion of the holographic signature
from the chairman of the board. In this case, we first corrected
the mistake and after the request from the CNV included the legend
and the holographic signature of the chairman, required by the
relevant formalities.
IRSA´s
response to the CNV’s allegations containing the arguments
for the defense was filed in March 2011 and the first hearing was
held in May 2011. In April, 2013, the CNV imposed (as a result of
the aforementioned alleged charge) a fine on the members of
IRSA´s board of directors and its supervisory committee
members. The fine imposed by the CNV amounts to Ps. 270,000
equivalent to US$ 49,632 and it was imposed to IRSA and the members
of the board together. The amount of the fine demonstrates the
immaterial nature of the alleged violations. Even though the fine
was paid, in April 2013, IRSA appealed such resolution, which is
still ongoing in Court Room N°. IV of the National Chamber of
Appeals in Federal Administrative Procedures (Cámara Nacional
de Apelaciones en lo Contencioso Administrativo
Federal).
For more
information see “Item. 3(d) Risk Factors—Risk related
to our Business—Our business is subject to extensive
regulation and additional regulations may be imposed in the
future”.
Class
actions in the United States
On May 9, 2016, a
putative shareholder class action was filed in the United States
District Court for the Eastern District of Pennsylvania against
IRSA, certain of its officers and directors, and Cresud. The
complaint asserts violations of the federal securities laws on
behalf of persons that purchased IRSA’s American Depositary
Receipts between November 3, 2014 and December 30, 2015, and
alleges that defendants made materially false and misleading
statements and omissions relating to IRSA’s investment in
IDBD. More specifically, the complaint alleges that
IRSA’s disclosures during that time period misrepresented and
failed to disclose that (1) IDBD’s US$6.7 billion net debt
should have been consolidated in IRSA’s financial statements
and (2) as so consolidated, IRSA’s debt would violate the
covenants specified in IRSA’s Global Notes
Indenture.
This class
action was transferred to the United States District Court for the
Southern District of New York on July 14, 2016, and referred to
Judge Vernon S. Broderick on July 19, 2016. A putative class
representative has filed a motion to be appointed as lead plaintiff
and to appoint class counsel. Such motion remains pending before
the Court. Defendants believe that there is no merit to the claims
alleged and intend to vigorously defend these actions.
Nevertheless, no assurance can be given that we will be successful
in defending these claims.
Operations Center in
Israel
Litigation
against IDB
In recent years
there has been an increasing trend of filing derivative and class
action claims in the area of corporate and securities laws in
Israel. While taking into account such issues and the financial
position of IDB and its holding structure, claims in considerable
amounts may be filed against IDB, including in connection with its
financial position and cash flows, with offerings that it makes,
and transactions that were carried out or not completed, including
with regards to the contentions and claims of the controlling
shareholders that took place in IDB.
Arbitration proceedings relating to the obtainment of control in
IDBD.
On May 7, 2014, a
transaction was agreed whereby the Company, acting indirectly
through Dolphin, acquired jointly with ETH (a non-related company
established under the laws of the State of Israel, which was
presented to Dolphin as a company controlled by Mordechay Ben
Moshé), an aggregate number of 106.6 million common shares in
IDBD, representing 53.30% of its stock capital, under the scope of
the debt restructuring Arrangement of IDBH, IDBD's parent company,
with its creditors.
Under the terms of
the agreement entered into between Dolphin and ETH (the
“Shareholders’ Agreement”), Dolphin acquired 50%
interest in this investment, and ETH acquired the remaining 50%.
The initial total investment amount was NIS 950, equivalent to
approximately US$ 272 at the exchange rate prevailing on that
date.
On May 28, 2015,
ETH launched the BMBY mechanism provided in the Shareholders’
Agreement (clause which establishes that each party of the
Shareholders' Agreement may offer to the counterparty to acquire
(or sell, as the case may be), the shares it holds in IDBD at a
fixed price). In addition, ETH further added that the purchaser
thereunder required to assume all obligations of
seller.
196
On June 10 and 11,
2015, Dolphin gave notice to ETH of its intention to buy all the
shares of IDBD held by ETH.
After certain
aspects of the offer were resolved through an arbitration process
brought by Dolphin and ETH, on September 24, 2015, the competent
arbitrator resolved that: (i) Dolphin and IFISA (related company to
the Company) were entitled to act as buyers in the BMBY process,
and ETH had to sell all of the IDBD shares held by it (92,665,925
shares) at a price of NIS 1.64 per share; (ii) The buyer had to
fulfill all of the commitments included in the Arrangement,
including the commitment to carry out Tender Offers; (iii) The
buyer had to pledge in favor of the Arrangement Trustees the shares
that were previously pledged in favor of the Arrangement Trustees
by the seller.
On October 11,
2015, the BMBY process concluded, and IFISA acquired all IDBD's
shares of stock held by ETH. Consequently, the Shareholders'
Agreement ceased and members of IDBD's Board of Directors
representing ETH submitted their irrevocable resignation to the
Board, therefore Dolphin was hence empowered to appoint the new
members to the Board. Additionally, on the same date, Dolphin
pledged additional shares as collateral to secure compliance with
the IDBD stock purchase agreement, thereby increasing the number of
pledged shares to 64,067,710. As a consequence, the Company gained
control of IDBD and started to consolidate financial statements as
from that date.
In addition to the
competent arbitrator’s decision issued on September 24, 2015,
ETH and Dolphin still have counterclaims of different kinds which
are subject to such arbitration proceeding. As of the filing date
of this Annual Report, the proceeding is still being
heard.
Litigation
against Clal Insurance and its subsidiaries
This exposure is
especially high in the areas of long-term savings and long-term
health insurance in which Clal Insurance operates, inter alia, in
view of the fact that in these areas the policies were issued
decades ago, while at present, after significant changes in the
regulatory environment and against the background of developments
in legal precedent and the Israeli authority’s position, the
same policies may be interpreted differently, retrospectively, and
may be subjected to different interpretation standards than those
that were customary at the time that the policies were made.
Moreover, in these areas the policies are valid for dozens of years
and, therefore, there is a risk that in those cases in which a
customer’s claim is accepted and a new interpretation is
given to the policy, the future profitability of Clal Insurance in
respect of the existing policy portfolio will also be affected.
This is in addition to the possible compensation that could be
given to the customers due to past activity.
Alongside these
aspects, during 2015 amendments were made to reflect a significant
reform in the field of approving an insurance program which allows
the Israeli authority, under certain conditions, to order the
insurer to stop introducing an insurance policy or to order an
insurer to make a change to an insurance policy, even with regard
to policies that have already been marketed by the insurer. It is
not possible to foresee to what extent insurers are exposed to
claims in connection with the provisions of the policy, the manner
of implementing the Israeli authority’s powers pursuant to
the insurance policy reform and its implications, which may be
raised, inter alia, by means of the procedural mechanism provided
in the Israeli Class Actions Law.
There are claims
that have been recognized as class action suits, claims for which
there are pending motions to have them certified as class action
suits, and other claims which are immaterial. These claims include
mainly claims of improper actions, not in accordance with laws,
licenses or breaches of agreements with customers or performance of
tort damages toward customers (especially misleading a customer, or
a negligent misrepresentation), causing damage, either monetary or
non-monetary, to customers. A significant amount of these claims
also include claims of charging excessive premiums and payment of
lower than called for insurance compensation. In addition, there
are pending motions to have claims certified as derivative
actions.
Sale
of shares of Clal Insurance Enterprises Holdings Ltd
On
August 21, 2013, on the background of concerns about the ability of
the previous controlling shareholders of IDBD (Dankner group) to
meet the requirements to have control over an insurance company,
set forth by the Commissioner of Capital Markets, Insurance and
Savings (which is a division within the Ministry of Finance of
Israel; the "Commissioner"), the Commissioner required that IDBD
transfer 51% of the shares in Clal to Mr. Moshe Terry ("the
Trustee") and to grant the Trustee an irrevocable power of attorney
with regard to the voting of such shares in Clal.
On
November 27, 2013, and as part of the debt arrangement In IDB
Holdings Corporation Ltd., the Commissioner set forth an outline to
enable the change of control in IDBD (as part of the debt
arrangement), whereby the Commissioner would not view such change
of control as being a breach of the Supervision of Financial
Services (Insurance) Law, 1981 (the "Insurance Law"), subject to
certain conditions, including terms whereby if until 31.12.2014 a
control permit for Clal Insurance will not be obtained for the new
controlling shareholders in IDBD, or, that an agreement for the
sale of the controlling stake in Clal Insurance will not have been
signed, then the Trustee will be authorized to sell the Clal
Insurance shares that the Trustee holds. Both groups that had
submitted proposals in the debt arrangement process (including the
Dolphin group) approved such outline.
On
December 30, 2014, the Commissioner sent an additional letter
setting a term by which IDBD’s control over and equity
interests in Clal were to be sold and giving directions as to the
Trustee’s continuity in office, among other
aspects.
The
sale arrangement outlined in the letter involves IDBD’s and
the Trustee’s interests in the sale process under different
options and timeframes. As of June 30, 2016, the current sale
arrangement involved the sale of the interest, as per the following
detail and by the following dates:
a. IDBD
would have to sell at least 5% of its equity interest in Clal per
each 4 month period beginning as of January 7, 2016.
b.
During each of the subsequent four-month periods, IDBD would have
to sell at least an additional 5% of its equity interest in
Clal.
c. If
IDBD sells more than 5% of its equity interest in Clal in any given
four-month period, the percentage in excess of the required 5%
would be offset against the percentage required in the following 4
month period.
197
IDBD
would be required to continue to sell all of its holdings in Clal
apart for such holdings that do not require a permit pursuant to
applicable law, or, alternatively, such holdings that IDBD will be
permitted to hold pursuant to applicable law.
In case
IDBD does not fulfill its obligation in the manner described in the
above paragraph the Trustee would be entitled to act upon the
specified arrangement in lieu of IDBD, pursuant to all powers that
had been vested under the representations of the trust letter. The
consideration for the sale would be transferred to IDBD, with the
expenses incurred in the sale process to be solely borne by
IDBD.
On May
7 ,2016 the Commissioner requested that the Trustee act to sell 5%
of the shares of Clal Insurance according to the December 30, 2014
letter. IDBD has objected to such sale, and notified the Trustee
that in case the Trustee shall sell shares then IDBD will consider
claiming against the Trustee for damages. As a result, on July 13,
2016 the Trustee applied to the Tel Aviv District Court to obtain
instruction on whether and how to sell such 5% of Clal Insurance
shares.
On May
26, 2016 IDBD's board decided to commence a competitive process for
the sale of a control stake in Clal. Following such decision, on
July 1, 2016 IDBD entered into an agreement with JP Morgan to serve
as an investment bank on behalf of IDBD for the sale of a control
stake in Clal.
In addition, in
June 2015, an application for a Israeli court to approve the
commencement of a class action against IDBD, IDBD’s directors
(some of which are also our directors), Dolphin Netherlands B.V.
and C.A.A Extra Holdings Ltd. was filed by individuals who argue
that IDBD’s controlling shareholders and board of directors
acted in concert to frustrate the sale of shares of Clal Insurance
Enterprises Holdings Ltd (or Clal) to JT Capital Fund. The
applicants argue that this caused them material damages as under
the terms of the debt restructuring of IDBD’s holding
company, IDB Holdings Corporation Ltd. with its creditors, they
would have been entitled to receive a larger payment had the above
mentioned sale been consummated. Furthermore, they allege that the
2014 and 2015 rights offerings of IDBD discriminated against the
minority shareholders. On March 21, 2016, the
respondents filed a motion to dismiss this class action
application. On June 2, 2016, the Court partially accepted this
motion, and ordered the applicants to file an amended class action
application that would include only the arguments and remedies with
respect to the said Clal transaction. On August 2, 2016, the
respondents filed a motion to appeal (regarding the decision not to
dismiss the arguments concerning the Clal transaction) and, on
August 14, 2016, the applicants filed an appeal (regarding the
decision to dismiss the arguments concerning the rights offering)
both before the Israeli Supreme Court. As of the date of this
annual report, the Supreme Court has decided that the motion to
appeal and the appeal will be heard jointly, and has ordered stay
of the proceedings.
Litigation
against Cellcom and its subsidiaries
In the normal
course of business, claims have been filed against Cellcom by its
customers. These are mostly motions for approval of class actions,
primarily concerning allegations of illegal collection of funds,
unlawful conduct or breach of license, or a breach of agreements
with customers, causing monetary and non-monetary damage to
them.
In addition, in the
normal course of business, claims have been filed against Cellcom
in issues related to the environment, including claims regarding
non-ionizing radiation from cellular handsets and claims in respect
of sites belonging to Cellcom. These are mostly motions for
approval of class actions, relating to allegations of unlawful
conduct or breach of license causing monetary and non-monetary
damage (including claims for future damages).
Litigation
against Adama and its subsidiaries
In the normal
course of business, Adama is involved in various legal claims
involving environmental claims for smell and noise hazards relating
to its site. claims by employees, subcontractors,
suppliers, authorities and others which concern, inter alia, claims
for breaches of provisions of the law regarding termination of
employment and obligatory payments to employees, claims for breach
of contract and patent infringement, and compulsory payments to
authorities.
Litigation
against Shufersal
In the normal
course of business, legal claims were filed against Shufersal by
its customers. These are mostly motions for certification of class
actions, which mainly concern claims of charging money unlawfully,
acting contrary to the law or a license, or a breach of the
agreements with customers, causing financial and non-financial loss
to them.
In addition in the
normal course of business, legal claims were filed with the courts
against Shufersal by employees, subcontractors, suppliers,
authorities and others, which relate mainly to claims of breaches
of the provisions of the law in relation to the termination of
workers’ employment and compulsory payments to employees,
claims of breaches of contract and compulsory payments to
authorities.
198
Dividends
policy
Pursuant to
Argentine law, the distribution and payment of dividends to
shareholders is valid only if they result from net and realized
earnings of the company pursuant to annual audited financial
statements approved by the shareholders. The approval, amount and
payment of dividends are subject to the approval by our
shareholders at our annual ordinary shareholders meeting. The
approval of dividends requires the affirmative vote of a majority
of the shares entitled to vote at the meeting.
In accordance with
Argentine law and our by-laws, net and realized profits for each
fiscal year are allocated as follows:
|
•
|
5% of such net
profits is allocated to our legal reserve, until such reserve
amounts to 20% of our capital stock;
|
|
•
|
a certain amount
determined at a shareholders’ meeting is allocated to
compensation of our directors and the members of our supervisory
committee; and
|
|
•
|
additional amounts
are allocated for the payment of dividends or to optional reserve
funds, or to establish reserves for whatever other purpose our
shareholders determine.
|
The following table
shows the dividend payout ratio and the amount of dividends paid on
each fully paid common share for the mentioned years. Amounts in
Pesos are presented in historical, non-inflation adjusted Pesos as
of the respective payment dates and refers to our unconsolidated
dividends.
|
Year
|
Total
Dividend
|
Dividend
per Common Share
(1)
|
|
|
(in
million of Ps.)
|
(in
Ps.)
|
|
2010
|
-
|
-
|
|
2011
|
69.0
|
0.138
|
|
2012
|
63.8
|
0.149
|
|
2013
|
120.0
|
0.242
|
|
2014
|
120.0
|
0.242
|
|
2015
|
-
|
-
|
|
2016
|
-
|
-
|
(1)
Corresponds to per
share payments. To calculate the dividend paid per ADS, the payment
per share should be multiplied by ten. Amounts in Pesos are
presented in historical Pesos as of the respective payment date.
See “Exchange Controls”.
From December 12,
2014, as resolved at the Shareholders’ Meeting held on
October 31, 2014 and reconvened on November 14, 2014, the ratable
distribution among the shareholders of 5,565,479 treasury shares
was approved, representing 0.0114% per share and 1.1406% of the
outstanding capital stock of 487,928,660.Future dividends with
respect to our common shares, if any, will depend on, among other
things, our results of operations, cash requirements, financial
condition, contractual restrictions, business opportunities,
provisions of applicable law and other factors that our
shareholders at a general shareholders’ meeting may deem
relevant. As a result, we cannot give you any assurance that we
will pay any dividends at any time in the future.
B.
SIGNIFICANT CHANGES
Annual
Shareholders’ Meeting
Our annual
shareholders’ meeting will be held on October 31, 2016, in
order to consider and approve, among others, the following matters:
(i) consideration of documents contemplated in section 234,
paragraph 1, of the Argentine Companies Law No. 19,550 for the
fiscal year ended June 30, 2016; (ii) Consideration of the result
of the fiscal year ended June 30, 2016 which resulted in a loss for
the amount of Ps. 1,401,856,585; (iii) consideration of Board of
Directors’ performance; (iv) consideration of Supervisory
Committee’s performance; (v) consideration of compensation
payable to the Board of Directors for Ps. 18,985,218 (total
compensation) for the fiscal year ended June 30, 2016; (vi)
consideration of compensation payable to the Supervisory Committee
for the fiscal year ended June 30, 2016; (vii) consideration of the
appointment of Regular Directors and Alternate Directors, as
applicable; (viii) appointment of Regular and Alternate Members of
the Supervisory Committee; (ix) appointment of Certifying
Accountant for the next fiscal year and determination of its
compensation. Delegation of powers; (x) updating of report on
Shared Services Agreement; (xi) treatment of amounts paid as
personal assets tax levied on the shareholders; (xii) consideration
of the renewal of the delegation to the Board of Directors of the
broadest powers to establish the time and currency of issuance, and
other terms and conditions of the issuance of notes under the
global note program, for up to US$300.000.000 currently in force in
accordance with approved by the shareholders' meeting dated October
31, 2012, and November 14, 2014 and its extension for an additional
amount of US$200.000.000 in accordance with approved by the
shareholders' meeting dated October 30, 2015; (xiii) consideration
of granting indemnities to Messrs. Directors, Syndics and Managers
who work or have worked in the Company in a manner subsidiary to
D&O policies; (xiv) consideration of special financial merger
statement of AGRO MANAGERS S.A .; special separate financial merger
statements of Cresud and consolidated financial merger statements
of Cresud with AGRO MANAGERS S.A. as June 30, 2016 as well as the
reports of the supervisory committee and the auditor. Consideration
of the preliminary merger by absorption with AGRO MANAGERS S.A. and
other related documentation. Authorizations and delegations.
Appointment of proxy to grant definitive agreements and other
formalities; (xv) consideration of the distribution of treasury
shares.
A.
OFFER AND LISTING DETAILS
The following
summary provides information concerning our share capital and
briefly describes all material provisions of our bylaws and the
Argentine Corporation Law.
Stock
Exchanges in which our securities are listed
Our common shares
are listed on the BASE under the trading symbol “CRES”
and on NASDAQ under the trading symbol “CRESY.” As of
June 30, 2016 our outstanding capital stock consisted of
501,642,804 common shares, Ps.1.00 par value per
share.
As of that date of
this annual report: (1) we had no other shares of any class or
series issued and outstanding; and (2) there are no outstanding
convertible notes to acquire our shares. Our common shares have one
vote per share. All outstanding shares are validly issued, fully
paid and non assessable. As of June 30, 2016, there were
approximately 4,782 holders of our common shares.
199
Price
history of our stock on the Buenos Aires Stock Exchange and
NASDAQ
Our common shares
are traded in Argentina on the BASE, under the trading symbol
“CRES.” Since March 1997, our ADRs, each presenting 10
common shares, have been listed on the NASDAQ under the trading
symbol “CRESY.” The Bank of New York is the depositary
with respect to the ADRs.
The table below
shows the high and low daily closing prices of our common shares in
Pesos and the quarterly trading volume of our common shares on the
BASE for the first quarter of 2012 through October 28, 2016. The
table below also shows the high and low daily closing prices of our
ADRs in U.S. Dollars and the quarterly trading volume of our ADRs
on the NASDAQ. Each ADR represents ten common shares.
|
|
BASE
|
NASDAQ
|
||||
|
|
Share
Volume
|
Price
Per Share (Ps.)
|
ADS
Volume
|
US$
per ADS
|
||
|
High
|
Low
|
High
|
Low
|
|||
|
Fiscal
Year 2012
|
|
|
|
|
|
|
|
1st
Quarter
|
812,635
|
7.03
|
5.30
|
5,037,399
|
16.49
|
10.70
|
|
2nd
Quarter
|
644,629
|
5.95
|
4.68
|
5,890,807
|
12.18
|
10.15
|
|
3rd
Quarter
|
609,305
|
6.90
|
5.33
|
10,708,801
|
13.38
|
11.20
|
|
4th
Quarter
|
1,328,881
|
6.45
|
4.45
|
15,006,469
|
12.06
|
6.86
|
|
Annual
|
3,395,450
|
7.03
|
4.45
|
36,643,476
|
16.49
|
6.86
|
|
Fiscal
Year 2013
|
|
|
|
|
|
|
|
1st
Quarter
|
1,324,543
|
5.87
|
4.83
|
6,183,866
|
8.80
|
7.35
|
|
2nd
Quarter
|
644,473
|
5.80
|
4.95
|
3,520,607
|
8.48
|
7.79
|
|
3rd
Quarter
|
1,376,099
|
8.10
|
5.70
|
6,124,332
|
9.66
|
8.29
|
|
4th
Quarter
|
1,299,335
|
8.30
|
5.75
|
5,946,018
|
9.61
|
7.04
|
|
Annual
|
4,644,450
|
8.30
|
4.83
|
21,774,823
|
9.66
|
7.04
|
|
Fiscal
Year 2014
|
|
|
|
|
|
|
|
1st
Quarter
|
2,178,046
|
8.30
|
5.70
|
5,589,075
|
8.73
|
7.15
|
|
2nd
Quarter
|
2,188,815
|
11.10
|
7.95
|
5,872,993
|
11.51
|
8.56
|
|
3rd
Quarter
|
1,022,808
|
11.20
|
8.60
|
3,422,480
|
9.87
|
8.37
|
|
4th
Quarter
|
2,459,599
|
14.15
|
9.16
|
6,982,485
|
12.90
|
9.01
|
|
Annual
|
7,849,268
|
14.15
|
5.70
|
21,867,033
|
12.90
|
7.15
|
|
Fiscal
Year 2015
|
|
|
|
|
|
|
|
1st
Quarter
|
1,688,010
|
16.45
|
12.00
|
5,524,817
|
14.08
|
10.58
|
|
2nd
Quarter
|
2,259,425
|
15.80
|
10.80
|
3,634,128
|
12.04
|
9.18
|
|
3rd
Quarter
|
1,331,000
|
17.90
|
12.00
|
7,600,906
|
14.83
|
9.92
|
|
4th
Quarter
|
1,483,096
|
16.90
|
15.00
|
5,736,086
|
13.98
|
12.50
|
|
Annual
|
6,761,531
|
17.90
|
10.80
|
22,495,937
|
14.83
|
9.18
|
|
Fiscal
Year 2016
|
|
|
|
|
|
|
|
1st
Quarter
|
728,810
|
17.50
|
12.10
|
4,299,192
|
13.14
|
9.33
|
|
2nd
Quarter
|
6,416,350
|
19.70
|
13.00
|
8,291,480
|
13.51
|
9.64
|
|
3rd
Quarter
|
3,388,664
|
18.70
|
12.70
|
5,390,231
|
12.63
|
9.22
|
|
4th
Quarter
|
51,785,675
|
21.30
|
14.15
|
12,876,863
|
14.13
|
9.88
|
|
Annual
|
62,319,499
|
21.30
|
12.10
|
30,857,766
|
14.13
|
9.22
|
|
Fiscal
Year 2017
|
|
|
|
|
|
|
|
1st
Quarter
|
48,775,713
|
27.50
|
22.00
|
8,216,910
|
18.00
|
14.62
|
|
July
2016
|
25,327,616
|
26.35
|
22.00
|
4,118,010
|
17.24
|
14.62
|
|
August
2016
|
11,900,312
|
27.00
|
24.20
|
2,263,618
|
17.75
|
16.19
|
|
September
2016
|
11,547,785
|
27.50
|
24.70
|
1,835,282
|
18.00
|
16.32
|
|
October 28,
2016
|
9,553,286
|
27.70
|
26.2
|
1,807,161
|
18.05
|
17.31
|
Source: Bloomberg
As of June 30, 2016
the outstanding ADRs represented 41,803,722 ADSs (equivalent to
418,037,220 common shares or 83.33% of our total common stock
capital).
B.
PLAN OF DISTRIBUTION
This item is not
applicable.
C.
MARKETS
Argentine
Securities Markets
In December 2012
the Argentine government has enacted a new Capital Markets Law,
which sets out the rules to govern capital markets, its players,
and the securities traded therein subject to the CNV
regulation and monitoring.
On September 5,
2013, the CNV has enacted the CNV Rules, by virtue of which it
regulates the new provisions of the Capital Markets Law for issuers
of securities, in regard to the initial public offering and
reporting duties.
Almost all the
provisions of the former Decree No. 677/2011 (the
“Transparency Decree”) have been incorporated in the
Capital Markets Law and in the CNV Rules. The Capital Markets Law
provides rules and provisions guided by the following goals and
principles:
·
Promoting the
participation of small investors, union associations, industry
groups and trade associations, professional associations and all
public savings entities in the capital market, particularly
encouraging mechanisms designed to promote domestic savings and
channel such funds towards the development of
production;
·
Strengthening
mechanisms for the protection of and prevention of abuses against
small investors for the protection of consumers’
rights;
·
Promoting access of
small and medium-sized companies to the capital
market;
·
Fostering the
creation of a federally integrated capital market through
mechanisms designed to achieve an interconnection of computer
systems from different trading markets, with the use of
state-of-the-art technology;
·
Encouraging simpler
trading procedures available to users to attain greater liquidity
and competitiveness in order to provide the most favorable
conditions for the implementation of
transactions.
200
The CNV is a
self-administered agency of the Argentine Government with
jurisdiction covering the territory of Argentina, governed by the
provisions of the Capital Markets Law, and the CNV Rules among
other related statutory regulations. The relationship of the CNV
and the Argentine Executive is maintained through the
Ministerio de Economía y Finanzas
Públicas
(Ministry of Economy and Public Finance),
which shall hear any appeals filed against decisions made by the
CNV, notwithstanding any other legal actions and remedies
contemplated in the Capital Markets Law.
The CNV supervises
and regulates the authorized markets in which the securities and
the collective investment products are traded, the corporations
authorized in the public offer regime, and all the other players
authorized to operate in the public offer regime, as the registered
agents, the trading agents, the financial advisors, the
underwriters and distributors, the brokers, the settlement and
clearing agents, the managers of collective investment products,
the custodians of collective investment products, the collective
depositories, and the risk rating agencies, among others. Argentine
institutional investors and insurance companies are regulated by
separate government agencies, whereas financial institutions are
regulated mainly by the Central Bank.
Before offering
securities to the public in Argentina, an issuer must meet certain
requirements established by the CNV with regard to the
issuer’s assets, operating history and management. Only
securities approved for a public offering by the CNV may be listed
on a stock exchange. However, CNV approval does not imply any kind
of certification as to the quality of the securities or the
solvency of the issuer, even though issuers of listed securities
are required to file unaudited quarterly financial statements and
audited annual financial statements in accordance with IFRS, as
issued by the IASB (excluding financial institutions under the
supervision of the Central Bank, insurance companies under the
supervision of the Insurance Superintendence and medium and small
enterprises) and various other periodic reports with the CNV and
the stock exchange on which their securities are listed, as well as
to report to the CNV and the relevant stock exchange any event
related to the issuer and its shareholders that may affect
materially the value of the securities traded.
In Argentina, debt
and equity securities traded on an exchange must, unless otherwise
instructed by their shareholders, be deposited with a Central
Securities Depository, in Argentina. Currently the only depositary
authorized to act in accordance with the Capital Markets Law and
CNV Rules, is Caja de Valores S.A. a corporation owned by the BCBA,
the MVBA and certain provincial exchange, and provides central
depositary facilities, as well as acting as a clearinghouse for
securities trading and as a transfer and paying agent for
securities transactions.
Before the
enactment of the Capital Markets Law and the CNV Rules there were
12 securities exchanges in Argentina, which were located in the
City of Buenos Aires, Bahía Blanca, Chaco, Corrientes,
Córdoba, La Plata, La Rioja, Mendoza, Rosario, Salta, Santa
Fe, and Tucumán. Six of these exchanges (the BASE, Rosario,
Córdoba, La Rioja, Mendoza, and Santa Fe) had affiliated stock
markets in accordance with the requirements of Law No. 17,811 which
was derogated by the Capital Markets Law.
Pursuant to the
Capital Markets Law, the CNV has authorized 6 stock markets since
September 2014, which are: Mercado Abierto Electrónico S.A.
(“MAE”), Mercado a Término de Buenos Aires S.A.,
Mercado a Término de Rosario S.A., MVBA, Mercado de Valores de
Córdoba S.A. y Mercado Argentino de Valores S.A.
The principal
exchange for the Argentine securities market under the previous
legislation was the BCBA. Under the new Capital Markets Law the
BCBA has been authorized to operate as qualified entity, under the
appointment of the MVBA. As a result of the foregoing, the MVBA is
currently the principal exchange market in Argentina in which the
securities are listed.
The MVBA is a
corporation consisting of 183 shareholders who used to be the sole
and exclusive individuals or entities authorized to trade in the
MVBA, either as principals or agents, before Capital Markets Law
became into force. Since then, all agents registered and authorized
to act as intermediaries by the CNV will be able to trade in any
securities exchange, including the BCBA as long as they obtain a
membership of such stock exchange, not applying any longer the
requirements to be a shareholder of such stock
exchange.
The securities that
may be listed on the MVBA are: stocks, corporate bonds, convertible
corporate bonds, close-ended investment funds, financial trust,
indexes, derivatives and public bonds. The MVBA is legally
qualified for admission, suspension, and delisting of securities
according to its own rules approved by the CNV.
Another relevant
exchange of the securities market in Argentina is the MAE, which
was recently authorized to operate by the CNV under the new
regulations. The MAE works as an electronic platform to process
Over the Counter transactions. It is an electronic exchange where
both government securities and corporate bonds are traded through
spot and forward contracts.
MAE brokers/dealers
members, include national banks, provincial banks, municipal banks,
private national banks, foreign banks, cooperative banks, financial
institutions, foreign exchange entities and pure brokers/dealers
(exclusively engaged in brokerage activities). Both Argentine or
foreign capital banks and financial institutions may be the
MAE’s brokers/dealers. Securities to be traded must be
registered with the pertinent supervising authorities and may be
traded in the MAE, in other exchanges or in both of them
concurrently.
Argentina’s
equity markets have historically been composed of individual
investors, though in recent years there has been an increase in the
level of investment by banks and insurance companies in these
markets; however, Argentine mutual funds (fondos comunes de
inversión) continue to have very low
participation.
Information
regarding the BCBA:
|
|
|
As
of June 30,
|
||
|
|
2016
|
|
2015
|
|
|
Market
capitalization (Ps. billion)
|
|
3,625
|
|
4,025
|
|
Average daily
trading volume
(1)
(Ps.
million)
|
310
|
|
150
|
|
|
Number of listed
companies
|
|
100
|
|
99
|
(1)
During the month of
June.
Although companies
may list all of their capital stock on the MVBA, in many cases a
controlling block is retained by the principal shareholders
resulting in only a relatively small percentage of many
companies’ stock being available for active trading by the
public on the MVBA. As of June 30, 2016, approximately 100
companies had equity securities listed on the MVBA. The Argentine
securities markets are substantially more volatile than the
securities markets in the United States and certain other developed
countries The Merval Index experienced a 30.1% decrease in 2011, a
15.9% increase in 2012, a 88.9% increase in 2013, a 59.1% increase
in 2014, a 36.1% increase in 2015 and a 25.8% increase during the
six months of 2016. In order to control price volatility, the MVBA
operates a system pursuant to which the negotiation of a particular
stock or debt security is suspended for a 15 minute period when the
price of the security registers a variation on its price between
10% and 15% and between 15% and 20%. Any additional 5% variation on
the price of the security after that results in additional 10
minute successive suspension periods.
201
D.
SELLING SHAREHOLDERS
This item is not
applicable.
E.
DILUTION
This item is not
applicable.
F.
EXPENSES OF THE ISSUE
This item is not
applicable.
A.
SHARE CAPITAL
This item is not
applicable.
B.
MEMORANDUM AND ARTICLES OF ASSOCIATION
Our
Corporate Purpose
Our legal name is
Cresud Sociedad Anónima Comercial, Inmobiliaria, Financiera y
Agropecuaria. We were incorporated under the laws of Argentina on
December 31, 1936 as a sociedad anónima (Stock Corporation)
and were registered with
Public Registry of
Commerce
on February 19, 1937 under number 26, on page 2,
book 45 of National by-laws Volume. Pursuant to our by-laws, our
term of duration expires on June 6, 2082.
Pursuant to article
4 of our by-laws our purpose is to perform the following
activities:
• commercial
activities with respect to cattle and products pertaining to
farming and animal husbandry;
• real
estate activities with respect to urban and rural
properties;
• financial
activities, except for those regulated by Law No. 21,526 of
financial entities;
• farming
and animal husbandry activities, for properties owned by us or by
third parties; and
• agency
and advice activities for which there is not required a specific
qualifying title.
Limited
Liability
Shareholders’
liability for losses is limited to their equity interest in us.
Notwithstanding the foregoing, under the Argentine Corporation Law
No. 19,550, shareholders who voted in favor of a resolution that is
subsequently declared void by a court as contrary to Argentine law
or a company’s by-laws (or regulation, if any) may be held
jointly and severally liable for damages to such company, other
shareholders or third parties resulting from such resolution. In
addition, a shareholder who votes on a business transaction in
which the shareholder’s interest conflicts with that of the
company may be liable for damages under the Argentine Corporation
Law, but only if the transaction would not have been validly
approved without such shareholder’s vote.
Capitalization
We may increase our
share capital upon authorization by our shareholders at an ordinary
shareholders’ meeting. Capital increases must be registered
with the public registry of commerce referred to as the Public
Registry of Commerce, and published in the
Boletín Oficial
. Capital
reductions may be voluntary or mandatory and must be approved by
the shareholders at an extraordinary shareholders’ meeting
(
asamblea extraordinaria
).
Reductions in capital are mandatory when losses have depleted
reserves and exceeded 50% of capital. As of june 30, 2016 our share
capital consisted of 501,642,804 common shares.
Our bylaws provide
that preferred stock may be issued when authorized by the
shareholders at an extraordinary shareholders’ meeting
(
asamblea extraordinaria
)
and in accordance with applicable regulations. Such preferred stock
may have a fixed cumulative dividend, with or without additional
participation in our profits, resolved by the shareholders’
meetings. We currently do not have outstanding preferred
stock.
Preemptive
Rights and Increases of Share Capital
Pursuant to our
by-laws and Argentine Corporation Law No. 19,550, in the event of
an increase in our share capital, each of our existing holders of
our common shares has a preemptive right to subscribe for new
common shares in proportion to such holder’s share ownership.
For any shares of a class not preempted by any holder of that
class, the remaining holders of the class will be entitled to
accretion rights based on the number of shares they purchased when
they exercised their own preemptive rights. Rights and accretion
rights must be exercised simultaneously within 30 days following
the time in which notices to the shareholders of a capital increase
and of the rights to subscribe thereto are published for three days
in the Boletín Oficial and a widely circulated newspaper in
Argentina. Pursuant to the Argentine Corporation Law, such 30-day
period may be reduced to 10 days by a decision of our shareholders
adopted at an extraordinary shareholders’ meeting
(
asamblea
extraordinaria
).
Additionally, the
Argentine Corporation Law permits shareholders at an extraordinary
shareholders’ meeting (
asamblea extraordinaria
) to suspend or
limit the preemptive rights relating to the issuance of new shares
in specific and exceptional cases in which the interest of the
Company requires such action and, additionally, under the following
specific conditions:
• the
issuance is expressly included in the list of matters to be
addressed at the shareholders’ meeting; and
• the
shares to be issued are to be paid in-kind or in exchange for
payment under pre-existing obligations.
Furthermore,
Article 12 of the Negotiable Obligations Law permits shareholders
at an extraordinary shareholders’ meeting (
asamblea extraordinaria
) to suspend
preemptive subscription rights for the subscription of convertible
bonds under the above-mentioned conditions. Preemptive rights may
also be eliminated, so long as a resolution providing so has been
approved by at least 50% of the outstanding capital stock with a
right to decide such matters and so long as the opposition to such
resolution does not surpass 5% of the share capital.
202
Shareholders’
Meetings and Voting Rights
Our bylaws provide
that shareholders’ meetings may be called by our board of
directors or by our Supervisory Committee or at the request of the
holders of shares representing no less than 5% of the common
shares. Any meetings called at the request of shareholders must be
held within 30 days after the request is made. Any shareholder may
appoint any person as its duly authorized representative at a
shareholders meeting, by granting a proxy. Co-owners of shares must
have single representation.
In general, the
following matters can be considered only at an extraordinary
shareholders’ meeting (
asamblea extraordinaria
):
|
•
|
matters that may
not be approved at an ordinary shareholders’
meeting;
|
|
•
|
the amendment of
our bylaws;
|
|
•
|
reductions in our
share capital;
|
|
•
|
redemption,
reimbursement and amortization of our shares;
|
|
•
|
mergers, and other
corporate changes, including dissolution and
winding-up;
|
|
•
|
limitations or
suspensions to preemptive rights to the subscription of the new
shares; and
|
|
•
|
issuance of
debentures, convertible negotiable obligations and bonds that do
not qualify as notes (obligaciones negociables).
|
In accordance with
our by-laws, ordinary and special shareholders’ meetings
(
asamblea extraordinaria
)
are subject to a first and second quorum call, the second to occur
upon the failure of the first. The first and second notice of
ordinary shareholders’ meetings may be made simultaneously.
In the event that both are made on the same day, the second must
occur at least one hour after the first. If simultaneous notice was
not given, the second notice must be given within 30 days after the
failure to reach quorum at the first. Such notices must be given in
compliance with applicable regulations.
A quorum for an
ordinary shareholders’ meeting on the first call requires the
presence of a number of shareholders holding a majority of the
shares entitled to vote and, on the second call, the quorum
consists of the number of shareholders present, whatever that
number. Decisions at ordinary shareholders’ meetings must be
approved by a majority of the votes validly exercised by the
shareholders.
A quorum for an
special shareholders’ meeting (
asamblea extraordinaria
) on the first
call requires the presence of persons holding 60% of the shares
entitled to vote and, on the second call, the quorum consists of
the number of shareholders present, whatever that number. Decisions
at special shareholders’ meeting (
asamblea extraordinaria
) generally must
be approved by a majority of the votes validly
exercised.
However, pursuant
to the Argentine Corporation Law, all shareholders’ meetings,
whether convened on a first or second quorum call, require the
affirmative vote of the majority of shares with right to vote in
order to approve the following decisions:
|
•
|
advanced winding-up
of the company;
|
|
•
|
transfer of the
domicile of the company outside of Argentina;
|
|
•
|
fundamental change
to the purpose of the company;
|
|
•
|
total or partial
mandatory repayment by the shareholders of the paid-in capital;
and
|
|
•
|
a merger or a
spin-off, when our company will not be the surviving
company.
|
Holders of common
shares are entitled to one vote per share. Owners of common shares
represented by ADRs exercise their voting rights through the ADR
Depositary, who acts upon instructions received from such
shareholders and, in the absence of instructions, votes in the same
manner as our majority of the shareholders present in the
shareholders’ meeting.
The holders of
preferred stock may not be entitled to voting rights. However, in
the event that no dividends are paid to such holders for their
preferred stock, the holders of preferred stock are entitled to
voting rights. Holders of preferred stock are also entitled to vote
on certain special matters, such as a transformation of the
corporate type, early dissolution, change to a foreign domicile,
fundamental change in the corporate purposes, total or partial
replacement of capital losses, mergers in which our company is not
the surviving entity, and spin-offs. The same exemption will apply
in the event the preferred stock is traded on any stock exchange
and such trading is suspended or canceled.
Dividends
and Liquidation Rights
The Argentine
Corporation Law establishes that the distribution and payment of
dividends to shareholders is valid only if they result from
realized and net earnings of the company pursuant to an annual
balance sheet approved by the shareholders. Our board of directors
submits our financial statements for the previous fiscal year,
together with the reports of our Supervisory Committee, to the
Annual Ordinary Shareholders’ Meeting. This meeting must be
held by October 30 of each year to approve the financial statements
and decide on the allocation of our net income for the year under
review. The distribution, amount and payment of dividends, if any,
must be approved by the affirmative vote of the majority of the
present votes with right to vote at the meeting.
The
shareholders’ meeting may authorize payment of dividends on a
quarterly basis provided no applicable regulations are violated. In
that case, all and each of the members of the board of directors
and the supervisory committee will be jointly and severally
unlimitedly liable for the refund of those dividends if, as of the
end of the respective fiscal year, the realized and net earnings of
the company are not sufficient to allow the payment of
dividends.
When we declare and
pay dividends on the common shares, the holders of our ADRs, each
representing the right to receive ten ordinary shares, outstanding
on the corresponding registration date, are entitled to receive the
dividends due on the common shares underlying the ADRs, subject to
the terms of the Deposit Agreement dated March 18, 1997 executed by
and between us, The Bank of New York, as depositary and the
eventual holders of ADRs. The cash dividends are to be paid in
Pesos and, except under certain circumstances, are to be converted
by the Depositary into U.S. Dollars at the exchange rate prevailing
at the conversion date and are to be paid to the holders of the
ADRs net of any applicable fee on the dividend distribution, costs
and conversion expenses, taxes and public charges. Since January
2002 and due to the devaluation of the Peso, the exchange rate for
the dividends will occur at a floating market rate.
Our dividend policy
is proposed from time to time by our board of directors and is
subject to shareholders’ approval at an ordinary
shareholders’ meeting. Declarations of dividends are based
upon our results of operations, financial condition, cash
requirements and future prospects, as well as restrictions under
debt obligations and other factors deemed relevant by our board of
directors and our shareholders.
Dividends may be
lawfully paid only out of our retained earnings determined by
reference to the financial statements prepared in accordance with
Argentine GAAP. In accordance with the Argentine Corporation Law,
net income is allocated in the following order: (i) 5% is retained
in a legal reserve until the amount of such reserve equals 20% of
the company’s outstanding capital; (ii) dividends on
preferred stock or common shares or other amounts may be retained
as a voluntary reserve, contingency reserve or new account, or
(iii) for any other purpose as determined by the company’s
shareholders at an ordinary shareholders’
meeting.
203
Our legal reserve
is not available for distribution. Under the applicable regulations
of the
Comisión Nacional de
Valores
, dividends are distributed
pro rata
in accordance with the number
of shares held by each holder within 30 days of being declared by
the shareholders for cash dividends and within 90 days of approval
in the case of dividends distributed as shares. The right to
receive payment of dividends expires three years after the date on
which they were made available to shareholders. The
shareholders’ meeting may authorize payment of dividends on a
quarterly basis provided no applicable regulations are violated. In
such case, all and each of the members of the board of directors
and the supervisory committee will be jointly and severally liable
for the refund of those dividends if, at the end of the respective
fiscal year, the realized and net earnings of the company are not
sufficient to allow for the payment of dividends.
|
•
|
to be applied to
satisfy its liabilities; and
|
|
•
|
to be
proportionally distributed among holders of preferred stock in
accordance with the terms of the preferred stock. If any surplus
remains, our shareholders are entitled to receive and share
proportionally in all net assets available for distribution to our
shareholders, subject to the order of preference established by our
bylaws.
|
Approval
of Financial Statements
Our fiscal year
ends on June 30 of each year, after which we prepare an annual
report which is presented to our board of directors and Supervisory
Committee. The board of directors submits our financial statements
for the previous fiscal year, together with the reports of our
Supervisory Committee, to the annual ordinary shareholders’
meeting, which must be held within 120 days of the close of our
fiscal year, in order to approve our financial statements and
determine our allocation of net income for such year. At least 20
days before the ordinary shareholders’ meeting, our annual
report must be available for inspection at our principal
office.
Right
of Dissenting Shareholders to Exercise Their Appraisal
Right
Whenever certain
actions are approved at an extraordinary shareholders’
meeting
(asamblea
extraordinaria
) (such as the approval of a merger, a
spin-off (except when the shares of the acquired company are
publicly traded), a fundamental change of corporate purpose, a
transformation from one type of corporation to another, a transfer
of the domicile of our company outside of Argentina or, as a result
of the action approved, the shares cease to be publicly traded) any
shareholder dissenting from the adoption of any such resolution may
withdraw from our company and receive the book value per share
determined on the basis of our latest financial statements, whether
completed or to be completed, provided that the shareholder
exercises its appraisal rights within ten days following the
shareholders’ meeting at which the resolution was
adopted.
In addition, to
have appraisal rights, a shareholder must have voted against such
resolution or act within 15 days following the shareholders’
meeting if the shareholder was absent and can prove that he was a
shareholder of record on the day of the shareholders meeting.
Appraisal rights are extinguished with respect to a given
resolution if such resolution is subsequently overturned at another
shareholders’ meeting held within 75 days of the previous
meeting at which the original resolution was adopted. Payment on
the appraisal rights must be made within one year of the date of
the shareholders’ meeting at which the resolution was
adopted, except where the resolution involved a decision that our
stock ceases to be publicly traded, in which case the payment
period is reduced to 60 days from the date of the
resolution.
Ownership
Restrictions
The CNV regulations
require that transactions that cause a person’s holdings of
capital stock of a registered Argentine company, to hold 5% or more
of the voting power, should be immediately notified to the CNV.
Thereafter, every change in the holdings that represents a multiple
of 5% of the voting power should also be notified.
Directors, senior
managers, executive officers, members of the supervisory committee,
and controlling shareholders of an Argentine company whose
securities are publicly listed, should notify the CNV on a monthly
basis, of their beneficial ownership of shares, debt securities,
and call and put options related to securities of such companies
and their controlling, controlled or affiliated
companies.
Holders of more
than 50% of the common shares of a company or who otherwise have
voting control of a company, as well as directors, officers and
members of the supervisory committee, must provide the CNV with
annual reports setting forth their holdings in the capital stock of
such companies and monthly reports of any change in their
holdings.
Tender
Offers
Tender offers under
Argentine law may be voluntary or mandatory. In either case, the
offer must be made addressed to all shareholders. In the case of a
mandatory tender offer, the offer must also be made to the holders
of subscription rights, stock options or convertible debt
securities that directly or indirectly may grant a subscription,
acquisition or conversion right on voting shares.
Capital Markets Law
No. 26,831 establishes that a person or entity wishing to acquire a
“significant holding” (“
participaciones significativas
”)
shall be required to launch a mandatory tender offer:
-
A mandatory tender
offer will not be required in those cases in which the purpose of
the acquisition of the “significant holding” is not to
acquire the control of a company.
The CNV defines a
“significant holding” as holdings that represent an
equal or a higher percentage than 15% and 51% of the voting shares
as the case may be:
-
When a person or an
entity intends to acquire more than 15% of the shares of a company,
a mandatory tender offer to purchase 50% of the corporate voting
capital is required by law.
-
If a person or an
entity owns between 15% and 51% of the shares of a company, and
wishes to increase its holdings by at least 6% within a 12 month
period, a mandatory tender offer to acquire shares representing at
least 10% of the voting capital will be legally
required.
-
When a person or an
entity wishes to acquire more than 51% of the shares of a company,
a mandatory tender offer to acquire 100% of the voting capital will
be legally required.
-
Finally, when a
shareholder controls 95% or more of the outstanding shares of a
company, (i) any minority shareholder may, at any time, demand that
the controlling party make an offer to purchase all of the
remaining shares of the minority shareholders and (ii) the
controlling party can issue a unilateral statement of intention to
acquire all of the remaining shares owned by the other
stockholders.
204
Pursuant to the
Argentine Corporation Law we may redeem our outstanding common
shares only under the following circumstances:
|
•
|
to cancel such
shares and only after a decision to reduce our capital stock (with
shareholder approval at an extraordinary shareholders’
meeting (asamblea extraordinaria);
|
|
•
|
to avoid
significant damage to our company under exceptional circumstances,
and then only using retained earnings or free reserves that have
been fully paid, which action must be ratified at the following
ordinary shareholders’ meeting; or
|
|
•
|
in the case of the
acquisition by a third-party of our common shares.
|
The Capital Markets
Law provides for other circumstances under which our company, as a
corporation whose shares are publicly listed, can repurchase our
shares. The following are necessary conditions for the acquisition
of our shares:
|
•
|
the shares to be
acquired shall be fully paid,
|
|
•
|
there shall be a
board of directors’ resolution containing a report of our
supervisory committee and audit committee. Our board of
director’s resolution must provide the purpose of the
acquisition, the maximum amount to be invested, the maximum number
of shares or the maximum percentage of capital that may be acquired
and the maximum price to be paid for our shares. Our board of
directors must give complete and detailed information to both
shareholders and investors,
|
|
•
|
the purchase shall
be carried out with net profits or with free or optional reserves,
and we must prove to the CNV that we have the necessary liquidity
and that the acquisition will not affect our solvency,
|
|
•
|
under no
circumstances may the shares acquired by our company, including
those that may have been acquired before and held by us as treasury
stock, be more than 10% of our capital stock or such lower
percentage established by the CNV after taking into account the
trading volume of our shares.
|
Any shares acquired
by us that exceed 10% of our capital stock must be disposed of
within 90 days from the date of acquisition originating the excess
without prejudice of the liability corresponding to our board of
directors.
Transactions
relating to the acquisition of our own shares may be carried out
through open market transactions or through a public
offering:
|
•
|
in the case of
acquisitions in the open market, the amount of shares purchased
daily cannot exceed 25% of the mean daily traded volume of our
shares during the previous 90 days.
|
|
•
|
in either case, the
CNV can require the acquisition to be carried out through a public
offering if the shares to be purchased represent a significant
percentage in relation to the mean traded volume.
|
Regulation of the
CNV as amended, provides general requirements that any company must
comply with in the case of the acquisition of its shares under the
Corporations Law or under the Capital Markets Law. The acquisition
of its shares by a company must be:
|
•
|
approved by a
resolution of the board of directors with a report of its
supervisory committee,
|
|
•
|
notice must be
given to the CNV with the expression of the motives of the
decision,
|
|
•
|
be carried out with
net profits or free reserves from the last financial statements and
approved by the board of directors,
|
|
•
|
the board of
directors has to prove to the CNV, that the company has the
necessary liquidity and that the acquisition does not affect its
solvency,
|
|
•
|
all shares acquired
by the company, including those that may have been acquired before
and held by it as treasury stock, may not exceed 10% of its capital
stock.
|
There are no legal
limitations to ownership of our securities or to the exercise of
voting rights pursuant to the ownership of our securities, by
non-resident or foreign shareholders.
Registrations
and Transfers
Our common shares
are held in registered, book-entry form. The registry for our
shares is maintained by
Caja de
Valores S.A.
at its executive offices located at 25 de mayo
362, (C1002ABH) Buenos Aires, Argentina. Only those persons whose
names appear on such share registry are recognized as owners of our
common shares. Transfers, encumbrances and liens on our shares must
be registered in our share registry and are only enforceable
against us and third parties from the moment registration takes
place.
Amendment
to the by-laws.
On the
shareholders’ meeting held on October 10, 2007, our
shareholders decided to amend the following sections of the
by-laws: (i) Section Thirteen in order to adapt the performance
bonds granted by directors to current rules and regulations, and
(ii) Section Sixteen in order to incorporate the possibility of
holding remote board meetings pursuant the provisions of section 65
of Executive Branch Decree 677/01.
On the
shareholders’ meeting held on October 31, 2012, our
shareholders decided to amend the Section XVII of the by-laws in
order to modify the quorum and majorities of the remote board
meetings.
On the
shareholder´s meeting held on October 31, 2014, our
shareholders decided to amend the following sections of the
by-laws: (i) Section First in order to comply with the Capital
Markets Law No. 26,831 and (ii) Section Twenty-Four in order to
incorporate the regulation of the shareholders’ meeting held
with shareholders present or communicated through teleconference
technologies.
205
C.
MATERIAL CONTRACTS
We do not have any
material contract entered into outside the ordinary course of
business other than some of the operations previously described
under the Related Party Transactions, the Recent Developments and
Our Indebtedness sections.
D.
EXCHANGE CONTROLS
Foreign Currency Regulation
Under Decree
No.260/2002, the Argentine government had set up an exchange market
through which all foreign currency exchange transactions are made.
Such transactions were subject to the regulations and requirements
imposed by the Argentine Central Bank. Under Communication
“A” 3471, as amended, the Central Bank established
certain restrictions and requirements applicable to foreign
currency exchange transactions.
Under Communication
“A” 6037, dated August 8th, 2016, no further
authorization is required for residents and non-residents to have
access to local exchange market and there is no amount or matter
that limits the access thereto.
Outflow
and Inflow of Capital
Inflow of capital
Under Argentine
Foreign Investment Law N° 21,382, as amended, and the wording
restated under Executive Branch Decree N° 1853/1993, the
purchase of stock of an Argentine company by an individual or legal
entity domiciled abroad or by an Argentine “foreign
capital” company (as defined under the Foreign Investment
Law) represents a foreign investment.
Under Decree
N° 616/2005, as amended by Decree Nº. 3/2015, the
Argentine government softened certain restrictions on the inflow
and outflow of foreign currency into and from the Argentine
exchange market, including that inflowing new indebtedness and debt
renewals by persons domiciled abroad must be agreed and cancelled
within periods not shorter than 120 calendar days –instead of
the 365.day period as originally established-, irrespective of the
method of payment. Additionally, such debt may not be prepaid
before the lapse of such period. Such restrictions do not apply to
(i) foreign trade financing, or (ii) primary public offering of
equity or debt instruments issued under the public offering
procedure and listed on self-regulated markets.
Obligation for the settlement of funds through the
MULC.
General rules. Exports.
Pursuant to
Executive Decree N° 1606/2011 and Communications
“A” 3602 and “A” 3493 of the Central Bank
any foreign currency derived from foreign trade must be settled
through the MULC.
Within 365 running
days as of the date of the disbursement of the funds abroad,
corresponding to the payment of exportation of goods, advance
payments of exports and pre financing loans for exports, such funds
must be settled through the MULC. Such funds shall be credited in a
local bank account duly opened in favor of the client, which may be
either in Pesos or in another currency.
Services
Communication
“A” 5264 set forth that the payments in foreign
currency received by residents for the export of services and
payment of losses for insurance policies hired with nonresidents
under the applicable rules must be settled through the MULC within
365 running days as of its collection abroad or locally or its
deposit in foreign bank accounts.
Such funds are
exempted to be settled through the MULC to the extent such
exemption is actually contemplated in the foreign exchange
regulations and such amounts are applied for the cancellation of
foreign financial indebtedness.
Outflow of capital, including the availability of cash or cash
equivalents
Exchange Transactions Inquiry Program
Communication
“A” 5850, of December 2015, revoke Communication
“A” 5245 that regulated an Exchange Transaction Inquiry
Program established on October 28, 2011, by the Federal
Administration of Public Revenues (Administración Federal de
Ingresos Públicos, “AFIP”) through which the
entities authorized by the Central Bank to deal in foreign exchange
were supposed to inquire and register through an IT system the
total Peso amount of each exchange transaction at the moment it is
closed.
Financial Indebtedness
Any transactions
arising from financial indebtedness of the financial sector,
private non-financial sector and local governments are no longer
subject to be settled in the foreign exchange market. However, if
settled in the foreign exchange market, then according to Decree
No. 616/2005 and 3/2015, these cannot be set off before the minimum
term of stay, which is 120 running days (except for bonds listed in
the authorized exchange stock markets).
Formation of off-shore assets by residents with and without
subsequent allocation to specific purposes
Under Communication
“A” 5850, 5899 and 6037 of the Central Bank, residents
shall have access to the local exchange market without prior
authorization of the Central Bank in order to purchase foreign
currency for the formation of off-shore assets
Outflow of funds for payment to non-residents
According to
Communication “A” 5264, amended by Communication
“A” 5377 (issued on December 14, 2012) and
Communication “A” 6037, there are no limits or
restrictions applicable for residents who access the foreign
exchange market to pay services, debts and profits to
non-residents. The access to the MULC requires the filing of
certain documentation by residents demonstrating the validity of
transactions in which the funds are purchased for its remittance
abroad.
Payment of services
As it was mentioned
above, there is no restriction applicable for payments to be made
to non-residents for performed services. The regulation covers all
types of services without making any specifications. The financial
entity shall require the filing of documentation supporting the
authenticity of the transaction, the service rendered by the
non-resident to the resident and the amount to be transferred
abroad.
Should performed
services are not related to the activities actually developed by
the resident; the financial entity shall require a copy of the
contract by which the payment obligation arises from and an auditor
report. Such requirements intend to demonstrate the actual
rendering of services to the non-resident and the existence of the
debt.
206
Payment of rents (interest, profits and dividends)
As of January 8,
2003, Communication “A” 3859, item 3, allowed Argentine
companies to transfer abroad profits and dividends related to
closed financial statements certified by independent accountants
without being required to obtain the prior authorization of the
Central Bank. Such Communication was replaced by Communication
“A” 5264, amended by Communication “A” 5377
and Communication “A” 6037.
The payments of
profits and dividends to non-residents or ADR’s is
authorized, insofar such payments are made according to financial
statements duly closed, audited and approved by shareholders’
meeting.
Payment of foreign financial indebtedness
Access to the
exchange market is allowed for payments of principal amounts
due.
In general terms,
access to MULC for payment of principal, interest and prepayment of
financial indebtedness incurred by Argentine residents in the
private non-financial sector and financial sector are allowed
subject to regulations set forth by Communications “A”
6037 of August 8th, 2016.
Pursuant to
Communication “A” 6037, no settlement in the local
exchange market is required for the repayment of principal and
interests, as long as it has been verified that the reporting
system has been complied with in accordance with Communication
“A” 3602. Additionally, the payment may only proceed if
the funds disbursed remain in Argentina for at least 120 calendar
days, in accordance with Decree No.616/2005.
Direct Investment Reporting System
Direct Investments made in Argentina by nonresidents
Under Communication
“A” 4237, the Central Bank established a reporting
system in connection with direct investments and real estate
investments made by nonresidents in Argentina and by residents
abroad.
Nonresidents must
comply every semester with the above mentioned reporting system if
the amount of the investment in Argentina reaches or exceeds U.S.
500,000. If such amount is not reached, the reporting system is
optional.
Direct investments made outside Argentina by Argentine
residents
Argentine residents
are required to meet the reporting system set forth in
Communication “A” 4237 every year if the value of their
investments abroad reaches or exceeds US$1.0 million and its under
US$5.0 million, and every semester if it reaches or exceeds US$5.0
million. If the value of such investments abroad does not reach
US$1.0 million, compliance with the reporting system is
optional.
Sales of foreign exchange to nonresidents
Access to local
exchange market shall be given as well to non residents for them to
transfer to their own foreign accounts the payments collected in
the country. Specific documentation that backs up the cause of the
payment may be required by the Central Bank.
For further details
regarding the exchange regulations applicable in Argentina,
investors should consult their professional advisers and read the
full text of Decree No.616/2005, and Communication “A”
6037 of the Central Bank. Interested parties may consult
such regulations through the website of the Ministry of Economy and
Public Finance (http://www.infoleg.gob.ar) or the Central Bank
(http://www.bcra.gob.ar).
Money
Laundering
Argentine Law
N° 25,246, as amended by Laws Nos.26,118, 26,268 and 26,683,
categorizes money laundering as a crime, which is defined as the
exchange, transfer, management, sale or any other use of money or
other assets obtained through a crime, by a person who did not take
part in such original crime, with the potential result that such
original assets (or new assets resulting from such original assets)
have the appearance of having been obtained through legitimate
means. In spite of the fact that there is a specific amount for the
money laundering category (Ps.300,000), the crimes committed for a
lower amount are also punished, but the prison sentence is
reduced.
After the enactment
of Law N° 26,683, money laundering was included in the Penal
Code as an independent crime against economic and financial order
and it was split from the title “Concealment” as
originally disposed. Therefore, money laundering is a crime which
may be prosecuted independently.
The money
laundering law created the Financial Information Unit (UIF). UIF is
in charge of the analysis, treatment and transmission of
information to prevent and impede the money laundering originating
from, among others:
a) Crimes related
to the traffic and illegal commercialization of drugs (Law N°
23,737)
b) Crimes related
to arms traffic (Law N° 22,415);
c) Crimes related
to illegal association of terrorist association
d) Crimes committed
by illegal associations organized to commit crimes for political or
racial purposes;
e) Crimes against
Public Administration
f) Crimes of
minor’s prostitution and child pornography
g) Crimes related
to terrorism financing
The UIF analyzes
the information received by entities that have the obligation to
report suspicious activities or operations and, as the case may be,
inform the Public Ministry to carry out the investigations that may
be considered relevant or necessary.
The money
laundering legal framework in Argentina also assigns information
and control duties to certain private sector entities, such as
banks, agents, non-profits organizations, stock exchanges,
insurance companies, according to the regulations of the Financial
Information Unit, and for financial entities, the Central Bank.
These regulations apply to many Argentine companies, including us.
These obligations consist mainly of: (i) maintaining internal
policies and procedures aimed at money laundering prevention and
financing of terrorism, especially through the application of the
policy “know your client”; (ii) reporting any
suspicious activity or operation and (iii) acting according the
Money Laundering Law with respect to the confidentiality of the
information obtained from the clients. For that purpose, each
entity involved must appoint an officer responsible for the
monitoring and control under the Money Laundering Law.
On May 8, 2009, and
in its capacity as obliged subject under the rules enacted by UIF,
the CNV issued Resolution No. 554 which incorporated within the
exchange market many provisions aimed at comply with money
laundering prevention pursuant to Law 25,246, as amended. In that
regard, such resolution established that any entity subject to the
supervision of CNV could only take part in securities transactions
if they were ordered by parties that were registered or domiciled
in jurisdictions not included in the list of tax havens detailed in
Executive Branch Decree No 1344/98. Furthermore, the Resolution
provided that securities transactions made by parties registered or
domiciled in jurisdictions that are not included in such list, but
that act as intermediaries of securities’ markets under the
supervision of an agency similar to the CNV, were allowed only if
such agency has signed a memorandum of mutual understanding with
the CNV.
207
On February 2,
2012, Resolution N° 554 was replaced by Resolution N° 602
so as to adapt and complement the instructions issued by UIF
applying to the entities under the supervision of CNV, including
some payment modalities and control proceedings for the reception
and deliver of funds to the clients, fixing amounts and instruments
to be used. Moreover, such resolution updated the reference to the
Decree which referred to tax havens (N° 1,037).
As part of a more
comprehensive modification of the rules that govern the scope of
supervision of CNV, derive from the enactment of the Capital
Markets Law and the CNV Rules, which stablished a new regime for
the public offer of securities, CNV issued a new re-arranged text
of its rules. Through the CNV Rules, the CNV incorporates a new
chapter of Money Laundering and Terrorist Financing including
dispositions related to the fulfillment of duties to be complied by
“Agentes de Negociación”, “Agentes de
Liquidación y Compensación”, “Agentes de
Distribución y Colocación” and “Agentes de
Administración de Productos de Inversión
Colectiva”, considered as obliged subject under the terms of
sections 4, 5 and 22 of article 20 of Law N° 25,246. Such
agents are obliged to comply with any provision arising from Law
N° 25,246 and its amendments, regulations enacted by UIF,
including decrees of National Executive Power with reference to the
decisions adopted by the United Nations Security Council, in the
fight against terrorism and to comply with the resolutions issued
by the Ministry of Foreign Affairs, International Trade and
Religion. Furthermore, “Agentes de Custodia de Productos de
Inversión Colectiva (Sociedades Depositarias de Fondos Comunes
de Inversión”); “Agentes de corretaje”,
“Agentes de depósito colectivo” and listed
companies with respect to contribution, irrevocable contributions
or indebtedness made by a shareholder or a third person to become a
shareholder in the future, are also reached by the
resolution.
Those subjects must
send by internet (through the online application of CNV) their tax
identification number. Additionally, in case of companies, it must
be informed the personal data of the “Compliance
Officer” (both regular and alternate).
The CNV Rules
provide that the subjects under their jurisdiction, may only take
action to transactions in the scope of public offering of
securities, stipulated, future or optional contracts of any nature
and other instruments and financial products when made or directed
by registered, domiciled or domestic subjects or those who reside
in dominions, jurisdictions, territories or associated states that
appear included in the list of cooperating countries provided in
article 2º, subsection b) of Decree N°
589/2013.
When those subjects
are not included in the referred list and, in their origin
jurisdictions, are only registered intermediates of an entity
subject to control and supervision of a body who fulfills similar
duties such as the CNV, the transactions shall only have effect
provided that the body in their origin jurisdiction has signed a
memorandum of understanding, cooperation and exchange of
information with the CNV.
With the purpose of
strengthen the requirements in order to grant the authorization to
operate in the exchange market, some new requisites were
established in connection with: (i) competence and capacity; (ii)
moral integrity and honesty and (iii) solvency. Such requisites are
subject to the appraisal of CNV and must be fulfilled by managers,
directors, auditors and any other individual who perform duties or
activities within the company.
Pursuant to Decree
360/2016 dated February 16, 2016, the Argentine government created
the “National Coordination Program for Combating Money
Laundering and Terrorist Financing” within the purview of the
Ministry of Justice and Human Rights. Its purpose is to rearrange,
coordinate and strengthen the anti-money laundering and
anti-terrorist financing system at national level, in light of the
actual risks that could impact the Argentine territory and the
global requirements to be met under the scope of the obligations
and international recommendations of the United Nations and FATF
standards.
Moreover, Law No.
27.260, which introduced certain tax modifications and a new regime
for residents to disclose undeclared assets, established that the
UIF would now be within the purview of the Ministry of Economy and
Finances.
Some other measures
are set forth related to listed companies or their shareholders or
beneficial owners who had been convicted or condemned in connection
with money laundering and/or terrorist financing activities or
appeared in the list published by the United Nation Security
Council.
United
States Taxation
The following
summary describes the material United States federal income tax
consequences of the ownership of our common shares and ADSs as of
the date hereof. The discussion set forth below is applicable to
U.S. Holders (as defined below). Except where noted, this
discussion deals only with U.S. Holders that hold our common shares
or ADSs as capital assets. This summary does not represent a
detailed description of the United States federal income tax
consequences applicable to you if you are subject to special
treatment under the United States federal income tax laws,
including if you are:
|
•
|
a
bank;
|
|
•
|
a dealer in
securities or currencies;
|
|
•
|
a financial
institution;
|
|
•
|
a regulated
investment company;
|
|
•
|
a real estate
investment trust;
|
|
•
|
an insurance
company;
|
|
•
|
a tax exempt
organization;
|
|
•
|
a person holding
our common shares or ADSs as part of a hedging, integrated or
conversion transaction, constructive sale or straddle;
|
|
•
|
a trader in
securities that has elected the mark-to-market method of accounting
for your securities;
|
|
•
|
a person liable for
alternative minimum tax;
|
|
•
|
a person who owns
or is deemed to own 10% or more of the voting stock of our
company;
|
|
•
|
a partnership or
other pass-through entity for United States federal income tax
purposes; or
|
|
•
|
a person whose
“functional currency” is not the U.S.
Dollar.
|
Furthermore, the
discussion below is based upon the provisions of the Internal
Revenue Code of 1986, as amended (the “Code”), and
regulations, rulings and judicial decisions thereunder as of the
date hereof, and such authorities may be repealed, revoked or
modified so as to result in United States federal income tax
consequences different from those discussed below. This summary
does not contain a detailed description of all the United States
federal income tax consequences to you in light of your particular
circumstances and does not address the Medicare tax on net
investment income, or the effects of any state, local or non-United
States tax laws. In addition, this summary is based, in part, upon
representations made by the depositary (the
“Depositary”) to us and assumes that the deposit
agreement governing the ADSs, and all other related agreements,
will be performed in accordance with their terms.
208
As used herein, the
term “U.S. Holder” means a beneficial owner of common
shares or ADSs that is for United States federal income tax
purposes:
|
•
|
an individual
citizen or resident of the United States;
|
|
•
|
a corporation
created or organized in or under the laws of the United States, any
state thereof or the District of Columbia;
|
|
•
|
an estate the
income of which is subject to United States federal income taxation
regardless of its source; or
|
|
•
|
a trust if it (1)
is subject to the primary supervision of a court within the United
States and one or more United States persons have the authority to
control all substantial decisions of the trust or (2) has a valid
election in effect under
|
|
|
applicable United
States Treasury regulations to be treated as a United States
person.
|
If a partnership
holds our common shares or ADSs, the tax treatment of a partner
will generally depend on the status of the partner and the
activities of the partnership. If you are a partner of a
partnership holding our common shares or ADSs, you should consult
your tax advisors.
IF
YOU ARE CONSIDERING THE PURCHASE, OWNERSHIP OR DISPOSITION OF
COMMON SHARES OR ADSS YOU SHOULD CONSULT YOUR OWN TAX ADVISOR
CONCERNING THE UNITED STATES FEDERAL INCOME TAX CONSEQUENCES TO YOU
AS WELL AS ANY CONSEQUENCES ARISING UNDER THE LAWS OF ANY OTHER
TAXING JURISDICTION.
ADSs
In general, for
United States federal income tax purposes, U.S. Holders of ADSs
will be treated as the owners of the underlying common shares that
are represented by the ADSs. Accordingly, deposits or withdrawals
of our common shares by U.S. Holders for ADSs will not be subject
to United States federal income tax.
Distributions on Common Shares or ADSs
Subject to the
discussion under “Passive Foreign Investment Company”
below, the gross amount of distributions on our common shares or
ADSs (including amounts withheld to reflect Argentine withholding
taxes, if any) will be taxable as dividends to the extent paid out
of our current or accumulated earnings and profits (as determined
under United States federal income tax principles). Such income
(including withheld taxes) will be includable in your gross income
as ordinary income on the day actually or constructively received
by you, in the case of common shares, or by the Depositary, in the
case of ADSs. Such dividends will not be eligible for the
dividends-received deduction allowed to corporations under the
Code.
With respect to
non-corporate United States investors, certain dividends received
from a qualified foreign corporation may be subject to reduced
rates of taxation. A foreign corporation is treated as a qualified
foreign corporation with respect to dividends received from that
corporation on shares (or ADSs representing such shares) that are
readily tradable on an established securities market in the United
States. United States Treasury Department guidance indicates that
our ADSs (which are listed on the NASDAQ), but not our common
shares, are readily tradable on an established securities market in
the United States. Thus, we do not believe that dividends that we
pay on our common shares that are not represented by ADSs currently
meet the conditions required for these reduced tax rates.
Non-corporate holders that do not meet a minimum holding period
requirement during which they are not protected from the risk of
loss or that elect to treat the dividend income as
“investment income” pursuant to Section 163(d)(4) of
the Code will not be eligible for the reduced rates of taxation
regardless of our status as a qualified foreign corporation. In
addition, the rate reduction will not apply to dividends if the
recipient of a dividend is obligated to make related payments with
respect to positions in substantially similar or related property.
This disallowance applies even if the minimum holding period has
been met.
The amount of any
dividend paid in Pesos will equal the U.S. Dollar value of the
Pesos received calculated by reference to the exchange rate in
effect on the date the dividend is actually or constructively
received by you, in the case of common shares, or by the
Depositary, in the case of ADSs, regardless of whether the Pesos
are converted into U.S. Dollars. If the Pesos received are not
converted into U.S. Dollars on the day of receipt, you will have a
basis in the Pesos equal to their U.S. Dollar value on the date of
receipt. Any gain or loss you realize on a subsequent conversion or
other disposition of the Pesos will be treated as United States
source ordinary income or loss.
Subject to certain
significant conditions and limitations, Argentine tax withheld from
dividends, if any, may be treated as foreign income tax eligible
for credit or deduction against your United States federal income
tax liability. For purposes of the foreign tax credit, dividends
paid on the common shares or ADSs will be treated as income from
sources outside the United States and will generally constitute
passive category income. Further, in certain circumstances, if you
have held ADSs or common shares for less than a specified minimum
period during which you are not protected from risk of loss, or are
obligated to make payments related to the dividends, you will not
be allowed a foreign tax credit for foreign taxes imposed on
dividends paid on ADSs or common shares. The rules governing the
foreign tax credit are complex. Investors are urged to consult
their tax advisors regarding the availability of the foreign tax
credit under their particular circumstances.
To the extent that
the amount of any distribution (including amounts withheld to
reflect Argentine withholding taxes, if any) exceeds our current
and accumulated earnings and profits for a taxable year, as
determined under United States federal income tax principles, the
distribution will first be treated as a tax-free return of capital,
causing a reduction in the adjusted basis of the ADSs or common
shares, and the balance in excess of adjusted basis will be taxed
as capital gain recognized on a sale or exchange. However, we do
not expect to keep earnings and profits in accordance with United
States federal income tax principles. Therefore, you should expect
that a distribution will generally be treated as a dividend (as
discussed above).
Taxation of Capital Gains
Subject to the
discussion under “Passive Foreign Investment Company”
below, upon the sale, exchange or other disposition of common
shares or ADSs, you generally will recognize capital gain or loss
equal to the difference between the U.S. Dollar value of the amount
realized upon the sale, exchange or other disposition and the
adjusted tax basis of the common shares or ADSs, determined in U.S.
Dollars. The capital gain or loss will be long-term capital gain or
loss if at the time of sale, exchange or other disposition you have
held the common shares or ADSs for more than one year. Capital
gains of individuals derived with respect to capital assets held
for more than one year are eligible for reduced rates of taxation.
The deductibility of capital losses is subject to limitations. Any
gain or loss you recognize will generally be treated as United
States source gain or loss. Consequently, you may not be able to
use the foreign tax credit arising from any Argentine tax imposed
on the disposition of common shares or ADSs unless such credit can
be applied (subject to applicable limitations) against tax due on
other income treated as derived from foreign sources.
209
Passive Foreign Investment Company
Based on the
current and projected composition of our income and the valuation
of our assets, including goodwill, we do not believe we were a PFIC
for United States federal income tax purposes for the taxable year
ending June 30, 2016, and we do not currently expect to become a
PFIC, although there can be no assurance in this regard. The
determination of whether we are a PFIC is made annually.
Accordingly, it is possible that we may be a PFIC in the current or
any future taxable year due to changes in our asset or income
composition or if our projections are not accurate. The volatility
and instability of Argentina’s economic and financial system
may substantially affect the composition of our income and assets
and the accuracy of our projections. In addition, this
determination is based on the interpretation of certain U.S.
Treasury regulations relating to rental income, which regulations
are potentially subject to differing interpretation.
In general, we will
be a PFIC for any taxable year in which either (i) at least 75% of
the gross income of our company for the taxable year is passive
income or (ii) at least 50% of the value (determined on the basis
of a quarterly average) of our assets is attributable to assets
that produce or are held for the production of passive income. For
this purpose, passive income generally includes dividends,
interest, royalties and rents (other than royalties and rents
derived in the active conduct of a trade or business and not
derived from a related person), annuities and gains from assets
that produce passive income. If we own at least 25% by value of the
stock of another corporation, we will be treated for purposes of
the PFIC tests as owning a proportionate share of the assets of the
other corporation, and as receiving directly a proportionate share
of the other corporation’s income.
If we are a PFIC
for any taxable year during which you hold common shares or ADSs in
our company, unless you make the mark-to-market election discussed
below, you will be subject to special tax rules discussed
below.
If we are a PFIC
for any taxable year during which you hold our common shares or
ADSs, you will be subject to special tax rules with respect to any
“excess distribution” received and any gain realized
from a sale or other disposition, including a pledge, of such
common shares or ADSs. Distributions received in a taxable year
that are greater than 125% of the average annual distributions
received during the shorter of the three preceding taxable years or
your holding period for the common shares or ADSs will be treated
as excess distributions. Under these special tax rules (i) the
excess distribution or gain will be allocated ratably over your
holding period for the common shares or ADSs, (ii) the amount
allocated to the current taxable year, and any taxable year prior
to the first taxable year in which we were a PFIC, will be treated
as ordinary income, and (iii) the amount allocated to each other
year will be subject to tax at the highest tax rate in effect for
that year and the interest charge generally applicable to
underpayments of tax will be imposed on the resulting tax
attributable to each such year.
If we are a PFIC
for any taxable year during which you hold our common shares or
ADSs and any of our non-United States subsidiaries is also a PFIC,
you would be treated as owning a proportionate amount (by value) of
the common shares of the lower tier PFIC for purposes of the
application of these rules. You are urged to consult your tax
advisors about the application of the PFIC rules to any of our
subsidiaries.
In addition,
non-corporate U.S. Holders will not be eligible for reduced rates
of taxation on any dividends received from us if we are a PFIC in
the taxable year in which such dividends are paid or in the
preceding taxable year.
In certain
circumstances, in lieu of being subject to the excess distribution
rules discussed above, you may make an election to include gain on
the stock of a PFIC as ordinary income under a mark-to-market
method provided that such stock is regularly traded on a qualified
exchange. Under current law, the mark-to-market election is only
available for stock traded on certain designated United States
exchanges and foreign exchanges which meet certain trading,
listing, financial disclosure and other requirements to be treated
as a qualified exchange under applicable United States Treasury
regulations. Consequently, the mark-to-market election may be
available to you with respect to the ADSs because the ADSs are
listed on the NASDAQ, which constitutes a qualified exchange under
the regulations, although there can be no assurance that the ADSs
will be regularly traded. You should note that only the ADSs and
not the common shares are listed on the NASDAQ. The common shares
are listed on the BASE. Consequently, the BASE would need to meet
the trading, listing, financial disclosure and other requirements
of the United States Treasury regulations. The ADSs or common
shares would also need to be regularly traded on such exchanges in
order for the ADSs or common shares to be potentially eligible for
the mark-to-market election.
If we are a PFIC in
any taxable year in which you hold our common shares or ADSs, but
you do not make a mark-to-market election until a subsequent
taxable year, you will be subject to special rules in the taxable
year of the election. You should consult your own tax advisors
regarding the application of the mark-to-market election in your
particular situation.
If you make an
effective mark-to-market election, you will include in income each
year that we are a PFIC as ordinary income, rather than capital
gain, the excess, if any, of the fair market value of your common
shares or ADSs at the end of the taxable year over your adjusted
tax basis in the common shares or ADSs and will be permitted an
ordinary loss in respect of the excess, if any, of the adjusted
basis of such common shares or ADSs over their fair market value at
the end of each such taxable year, but only to the extent of the
net amount previously included in income as a result of the
mark-to-market election. Your basis in the common shares or ADSs
will be adjusted to reflect any such income or loss amounts. Any
gain or loss on the sale of the common shares or ADSs will be
ordinary income or loss, except that such loss will be ordinary
loss only to the extent of the previously included net
mark-to-market gain.
If you make a
mark-to-market election it will be effective for the taxable year
for which the election is made and all subsequent taxable years
unless the common shares or ADSs are no longer regularly traded on
a qualified exchange or the Internal Revenue Service consents to
the revocation of the election. Mark-to-market inclusions and
deductions will be suspended during taxable years in which we are
not a PFIC, but would resume if we subsequently become a PFIC. You
are urged to consult your own tax advisor about the availability of
making such a mark-to-market election.
Alternatively, a
United States investor that owns common shares or ADSs in a PFIC
can sometimes avoid the rules described above by electing to treat
the company as a “qualified electing fund” under
Section 1295 of the Code. This option is not available to you
because we do not intend to comply with the requirements necessary
to permit you to make this election.
A U.S. Holder who
owns common shares or ADSs during any year that we are a PFIC must
generally file IRS Form 8621.
You should consult
your own tax advisors concerning the United States federal income
tax consequences of holding the common shares or ADSs if we are
considered a PFIC in any taxable year.
Argentine Personal Assets Tax
Amounts paid on
account of the Argentine personal assets tax, if any, will not be
eligible as a credit against your United States federal income tax
liability, but may be deductible subject to applicable limitations
in the Code.
Information Reporting and Backup Withholding
In general,
information reporting requirements will apply to distributions on
common shares or ADSs and to the proceeds of sale of a common share
or ADS paid to you within the United States (and in certain cases,
outside the United States), unless you are an exempt recipient.
Backup withholding may apply to such payments if you fail to
provide a correct taxpayer identification number or certification
of other exempt status or fail to report in full dividend and
interest income.
Any amounts
withheld under the backup withholding rules will be allowed as a
refund or a credit against your United States federal income tax
liability provided you furnish the required information to the
Internal Revenue Service.
210
Argentine
Taxation
The following
discussion is a summary of certain Argentine tax considerations
associated with an investment in, ownership or disposition of, the
common shares or the ADSs by (i) an individual holder that is
resident in Argentina, (ii) an individual holder that is neither
domiciled nor resident in Argentina, (iii) a legal entity organized
under the laws of Argentina, (iv) a permanent establishment in
Argentina of a foreign entity and (v) a legal entity that is not
organized under the laws of Argentina, that does not have a
permanent establishment in Argentina and is not otherwise doing
business in Argentina on a regular basis. The discussion is for
general information only and is based on current Argentine tax
laws. Moreover, while this summary is considered to be a correct
interpretation of existing laws in force as of the date of this
filing, no assurance can be given that the courts or administrative
authorities responsible for the administration of such laws will
agree with this interpretation or that changes in such laws or
interpretations will not occur.
PROSPECTIVE
INVESTORS ARE URGED TO CONSULT THEIR OWN TAX ADVISOR REGARDING THE
PARTICULAR TAX CONSEQUENCES ARISING UNDER ANY TAXING
JURISDICTION.
Income tax
Law No. 26,893,
enacted on September 12, 2013 and published in the Official Gazette
on September 23, 2013, introduced several amendments to Income Tax
Law No. 20,628 in connection with, among others, the
taxation of dividend distributions and gains derived from transfers
of shares and other securities, including the derogation of Section
78 of Decree No. 2,284/1991, which provided that foreign holders
with no permanent establishment in Argentina were exempt from
paying income tax on the capital gains arising from the sale or
other disposition of shares or ADSs.
On February 7,
2014, the Executive Branch issued Decree No. 2,334/13, which
regulates Law No. 26,893.
The changes
introduced by Law No. 26,893 are effective from the date of
publication of such law in the Official Gazette and are applicable
to taxable events consummated from such date onwards.
Taxation of Dividends
Until Law No.
26,893 became effective, dividends, whether in cash, in shares or
in kind, approved by our shareholders were not subject to income
tax withholding except for the application of the
“Equalization Tax” described below.
From the
effectiveness of Law No. 26,893, dividends are subject to an income
tax withholding (the “Dividend Tax”) at a 10% rate on
the amount of such dividends in respect of both Argentine and
non-Argentine resident shareholders. The “Dividend
Tax” has been repealed by Law No. 27.260 for dividend
payments since July 22, 2016.
An income tax
withholding will be applied to the amount of dividends distributed
in excess of a company’s net taxable income determined in
accordance with general income tax regulations for the fiscal years
preceding the date of the distribution of such dividends (the
“Equalization Tax”). The legislation requires that
companies withhold 35% of the amount of distributed dividends in
excess of the net taxable income of such distribution, as
determined in accordance with the income tax
law. Dividends distributed by an Argentine company are
not subject to this tax to the extent that those dividends arise
from dividend income or other distributions received by such
company from other Argentine companies.
Dividend
distributions made in kind (other than cash) will be subject to the
same tax rules as cash dividends. Stock dividends on fully paid
shares are not subject to Equalization Tax.
Certain tax
treaties contemplate the application of a ceiling tax rate on
dividends (i.e. 10% on gross dividends).
Taxation of Capital Gains
From the
effectiveness of Law No. 26,893 income from sale, exchange,
disposition or transfer of shares or ADSs is subject to income tax,
irrespective of the person that obtains such income, exception made
of transactions made by resident individuals involving shares and
other securities that are listed on securities exchanges or markets
and/or authorized to be offered to the public.
Resident individuals
Capital gains
obtained by resident individuals from the sale of shares and other
securities are subject to income tax at a 15% rate on
net income, unless such securities were traded in stock markets
and/or have public offering authorization, in which case an
exemption applies. The amendments introduced by the implementing
Decree No. 2,334/13 state that the exemption includes income
derived from the sale of shares and other securities made through a
stock exchange market duly authorized by the CNV.
It is not
clear whether the term “includes” (as used in the
implementing Decree 2334/2013) means that the exemption only refers
to sales of securities made through a stock exchange market duly
authorized by the CNV or whether the implementing Decree 2334/2013
intended to clarify that such sales were just one of the
possibilities that may be covered by the exemption (in addition to
publicly offering authorized securities, as provided in the
Argentine Income Tax Law). Certain qualified tax authorities have
publicly opined that the exemption exclusively refers to sales of
securities made through a stock exchange market duly authorized by
the CNV.
Losses arising from
the sale, exchange or other disposition of shares or ADSs can be
applied only to offset such capital gains arising from the sale,
exchange or other disposition of these securities, for a five-year
carryover period.
Foreign
beneficiaries
Capital gains
obtained by non-Argentine individuals or non-Argentine entities
from the sale, exchange or other disposition of
shares are subject to income tax, as the abovementioned
exemption for shares is not applicable to non-Argentine
beneficiaries. Therefore, the gain derived from the disposition of
shares by foreign beneficiaries is subject to Argentine income tax
at a 15% rate on the net capital gain or at a 13.5% rate on the
gross price at the seller´s election. However there is
currently no regulation under Argentine law with respect to how
this election is made. When both seller and buyer are
non-residents, the person liable to pay the tax shall be the buyer
of the shares, quotas, equity interests and other securities
transferred. However, as of the date of this annual report , no
regulations have been issued stipulating the withholding and
payment mechanism that the non-resident buyer should
follow.
Notwithstanding the
above, based on certain tax precedents, there may be support to
argue that gains obtained by a non-resident from the disposal of
ADSs should be regarded as foreign source income and, therefore,
not subject to Argentine income tax. As this is a controversial
issue, further analysis is required.
211
Argentine entities
Capital gains
obtained by Argentine entities (in general entities organized or
incorporated under Argentine law, certain traders and
intermediaries, local branches of non-Argentine entities, sole
proprietorships and individuals carrying on certain commercial
activities in Argentina) derived from the sale, exchange or other
disposition of shares or ADSs are subject to income tax at the rate
of 35%.
Losses arising from
the sale, exchange or other disposition of shares or ADSs can be
applied only to offset such capital gains arising from the sale,
exchange or other disposition of these securities, for a five-year
carryover period.
WE
RECOMMEND PROSPECTIVE INVESTORS TO CONSULT THEIR OWN TAX ADVISOR
REGARDING THE PARTICULAR TAX CONSEQUENCES CONCERNING THE SALE OR
OTHER DISPOSITIONS OF SHARES AND ADSs.
Value Added Tax
The sale, exchange,
disposition, or transfer of common shares or ADSs is not subject to
Value Added Tax.
Tax on Personal Assets
Argentine entities,
such as us, have to pay the personal assets tax corresponding to
Argentine and foreign domiciled individuals and foreign domiciled
entities for the holding of our shares. The applicable tax rate for
fiscal year 2016 is 0.25% and is levied on the proportional net
worth value (valor patrimonial proporcional), or the book value, of
the shares arising from the last balance sheet of the Argentine
entity calculated under Argentine GAAP. Pursuant to the Personal
Assets Tax Law, the Argentine company is entitled to seek
reimbursement of such paid tax from the applicable Argentine
domiciled individuals and/or foreign domiciled
shareholders.
Our shareholders
approved the absorption of personal asset tax by us for the years
2002 to 2015. There can be no assurance that in the future this tax
will be absorbed by us.
Tax on Minimum Notional Income (Impuesto a la Ganancia Mínima
Presunta, “IGMP”)
Entities domiciled
in Argentina, partnerships, foundations, sole proprietorships,
trusts, certain mutual funds organized in Argentina, and permanent
business establishments owned by foreign persons, among other
taxpayers, shall apply a 1% rate to the total value of assets held
by such persons, above an aggregate nominal amount of Ps.200,000.
Nevertheless, common shares and ADSs issued by entities subject to
such tax are exempt from the IGMP.
Law No. 27.260 has
repealed this tax for fiscal years commenced since January 1,
2019.
Turnover Tax
The gross
turnover tax is a local tax; therefore, the rules of the relevant
provincial jurisdiction should be considered, which may levy this
tax on the purchase and sale, exchange or other disposition of
common shares or ADSs, and/or the collection of dividends at an
average rate of 6%, unless an exemption is applicable. In the
particular case of the City of Buenos Aires, any transaction
involving common shares and/or the collection of dividends and
revaluations is exempt from this tax.
There is no gross income tax
withholding system applicable to the payments made to foreign
beneficiaries.
Stamp Tax
Stamp tax is a
local tax that is generally levied on the formal execution of
onerous transactions within a certain provincial jurisdiction or
outside a certain provincial jurisdiction but with effects in such
jurisdiction. Therefore, the rules of the relevant provincial
jurisdiction should be considered for the issuance of instruments
which implement onerous transactions (including issuance,
subscription, placement and transfer) involving the common shares
or ADSs, executed in those jurisdictions, or with effects in those
jurisdictions.
Notwithstanding,
for the City of Buenos Aires, any instrument related to the
transfer of shares which public offering is authorized by the CNV
is exempt from this tax.
Tax on Credits and Debits in Bank Accounts
Credits to and
debits from bank accounts held at Argentine financial institutions,
as well as certain cash payments, are subject to this tax, which is
assessed at a general rate of 0.6%. There are also increased rates
of 1.2% and reduced rates of 0.075%. Owners of bank accounts
subject to the general 0.6% rate may consider 34% of the tax paid
upon credits to such bank accounts as a tax credit while taxpayers
subject to the 1.2% rate may consider 17% of all tax paid upon
credits to such bank accounts as a credit. Such amounts can be
utilized as a credit for income tax or tax on presumed minimum
income.
Other Taxes
There are no
Argentine federal inheritance or succession taxes applicable to the
ownership, transfer or disposition of our common shares or ADSs.
The provinces of Buenos Aires and Entre Ríos establish a tax
on free transmission of assets, including inheritance, legacies,
donations, etc. Free transmission of our shares could be subject to
this tax. In the case of litigation regarding the shares before a
court of the City of Buenos Aires, a 3% court fee would be charged,
calculated on the basis of the claim.
Tax Treaties
Argentina has
entered into tax treaties with several countries. There is
currently no tax treaty or convention in effect between Argentina
and the United States.
212
F.
DIVIDENDS AND PAYING AGENTS
This section is not
applicable
G.
STATEMENT BY EXPERTS
This section is not
applicable.
H.
DOCUMENTS ON DISPLAY
We file annual,
quarterly and other information with the SEC. You may read and copy
any document that we file at the public reference rooms of the SEC
at 450 Fifth Street, N.W., Washington, D.C. 20549 and 500 West
Madison Street, Suite 1400, Chicago, Illinois 60661. You may obtain
information on the operation of the public reference rooms by
calling the SEC at 1-800-SEC-0330. Our Internet address is
http://www.cresud.com.ar
. It
should be noted that nothing on our website should be considered
part of this annual report on Form 20-F. You may request a copy of
these filings at no cost, by writing or calling the office at +54
(11)-4814-7800.
I.
SUBSIDIARY INFORMATION
This section is not
applicable.
In the normal
course of business, we are exposed to foreign exchange risk,
interest rate risks and other price risk, primarily related to
changes in exchange rates and interest rates. We manage our
exposure to these risks through the use of various financial
instruments, none of which are entered into for trading purposes.
We have established policies and procedures governing the use of
financial instruments, specifically as they relate to the type and
volume of such financial instruments. For further information on
our market risks, please see Note 4 to our Audited Consolidated
Financial Statements.
A.
Debt Securities
This item is not
applicable
B.
Warrants and Rights
This item is not
applicable
C.
Other Securities
This item is not
applicable
D.
American Depositary Shares
The Bank of New
York Mellon, as depositary for the ADSs (the
“Depositary”) collects its fees for delivery directly
from investors depositing shares or surrendering ADSs for the
purpose of withdrawal. The Depositary also collects taxes and
governmental charges from the holders of ADSs. The Depositary
collects these fees and charges by deducting those fees from the
amounts distributed or by selling a portion of distributable
property to pay the fees (after attempting by reasonable means to
notify the holder prior to such sale).
The Depositary has
agreed to reimburse or pay on our behalf, certain reasonable
expenses related to our ADS program and incurred by us in
connection with the program (such as NASDAQ listing fees, legal and
accounting fees incurred with preparation of Form 20-F and ongoing
SEC compliance and listing requirements, distribution of proxy
materials, investor relations expenses, etc). The Depositary
has covered all such expenses incurred by us for the period 2014 -
2015 for an amount of US$ 50,000, net of taxes.
The amounts the
Depositary reimbursed or paid are not perforce related to the fees
collected by the depositary from ADS holders.
The following
charges shall be incurred by any party depositing or withdrawing
shares or by any party surrendering receipts or to whom receipts
are issued (including, without limitation, issuance pursuant to a
stock dividend or stock split declared by us or an exchange
regarding the receipts or deposited securities or a distribution of
receipts), whichever applicable: (1) taxes and other
governmental charges, (2) such registration fees as may from
time to time be in effect for the registration of transfers of
shares generally on the share register of the Company or foreign
registrar and applicable to transfers of shares to the name of the
Depositary or its nominee or the custodian or its nominee on the
making of deposits or withdrawals hereunder, (3) such cable,
telex and fax transmission expenses as are expressly provided in
the deposit agreement, (4) such expenses as are incurred by
the Depositary in the conversion of foreign currency (5) a fee
of US$ 5.00 or less per 100 ADS (or portion), (6) a fee of US$
0.02 or less per ADS (or portion) for any cash distribution made
pursuant to the deposit agreement including, but not limited to,
and (7) a fee for the distribution of securities, such fee
being in an amount equal to the fee for the execution and delivery
of ADS referred to above which would have been charged as a result
of the deposit of such securities, but which securities are instead
distributed by the Depositary to owners.
5
According to the
information published in the Monetary Policy Report on July 2016 by
the Bank of Israel.
213
This section is not
applicable.
A. This section is
not applicable.
B. This section is
not applicable.
C. This section is
not applicable.
D. This section is
not applicable.
E. This section is
not applicable.
A.
DISCLOSURE CONTROLS AND PROCEDURES
We maintain
disclosure controls and procedures that are designed to ensure that
information required to be disclosed in the reports we file or
submit under the Exchange Act is recorded, processed, summarized
and reported within the time periods specified in the SEC’s
rules and forms, and that such information is accumulated and
communicated to management, including our Chief Executive Officer
and Chief Financial and Administrative Officer, to allow our
management to make timely decisions regarding required disclosure.
Any controls and procedures, no matter how well designed and
operated, can provide only reasonable assurance of achieving the
desired control objective. In connection with the preparation of
this Annual Report on Form 20-F, we carried out an evaluation under
the supervision and with the participation of members of our
management team, including our Chief Executive Officer and Chief
Financial and Administrative Officer, of the effectiveness of the
design and operation of our disclosure controls and procedures (as
defined in Rules 13a-15(e) and 15d-15(e) under the Exchange Act) as
of June 30, 2016. Based upon this evaluation our Chief Executive
Officer and Chief Financial and Administrative Officer concluded
that our disclosure controls and procedures as of the end of the
period covered by this Annual Report on Form 20-F were effective at
the reasonable assurance level.
B.
MANAGEMENT´S ANNUAL REPORT ON INTERNAL CONTROL OVER FINANCIAL
REPORTING
Our management is
responsible for establishing and maintaining adequate Internal
Control over Financial Reporting (as defined in Rules 13a-15(f) and
15d-15(f) under the Exchange Act). Our Internal Control over
Financial Reporting includes a series of procedures designed to
provide reasonable assurance regarding the reliability of financial
reporting and the preparation of consolidated financial statements
for external purposes, in accordance with International Financial
Reporting Standards and includes those policies and procedures that
(1) pertain to the maintenance of records that, in reasonable
detail, accurately and fairly reflect the transactions and
dispositions of our assets, (2) provide reasonable assurance that
transactions are recorded as necessary to permit preparation of
consolidated financial statements in accordance with International
Financial Reporting Standards and that a company’s receipts
and expenditures are being made only in accordance with
authorizations of our management and directors, and (3) provide
reasonable assurance regarding prevention or timely detection of
unauthorized acquisition, use, or disposition of our assets that
could have a material effect on our consolidated financial
statements.
Because of its
inherent limitations, Internal Control over Financial Reporting may
not prevent or detect misstatements. Also, projections of any
evaluation of effectiveness to future periods are subject to the
risk that controls may become inadequate because of changes in
conditions, or that the degree of compliance with policies and
procedures may deteriorate.
Management assessed
the effectiveness of our Internal Control over Financial Reporting
as of June 30, 2016. In making this assessment, management used the
criteria set forth by the Committee of Sponsoring Organizations of
the Treadway Commission (COSO) in Internal Control–Integrated
Framework (2013). Based on this evaluation, management concluded
that our Internal Control over Financial Reporting was effective as
of June 30, 2016. However, the management has excluded IDB
Development from its assessment of Internal Control over Financial
Reporting as of June 30, 2016 because it was acquired by us in
purchase business combinations during the fiscal year 2016. IDB
Development is an indirect subsidiary (through Tyrus S.A.) whose
total assets and total revenues represent 89% and 80%,
respectively, of our Audited Consolidated Financial Statements
amount as of and for the year ended June 30, 2016.
C.
ATTESTATION REPORT OF THE REGISTERED PUBLIC ACCOUNTING
FIRM
The effectiveness
of the Company’s internal control over financial reporting as
of June 30, 2016 has been audited by Price Waterhouse & Co
S.R.L, Buenos Aires Argentina- member firm of
PricewaterhouseCoopers International Limited-, an independent
registered public accounting firm, as stated in their report which
appears herein.
D.
CHANGES IN INTERNAL CONTROL OVER FINANCIAL REPORTING
There was no change
in our internal control over financial reporting occurred during
the period covered by this annual report that has materially
affected, or is reasonably likely to materially affect, our
internal control over financial reporting.
Item
16.
A.
AUDIT COMMITTEE FINANCIAL EXPERT
In our annual
ordinary shareholders’ meeting held on October 31, 2003, the
audit committee was unanimously approved. Pursuant to this plan,
the board of directors had to appoint the members of the audit
committee who hold expertise in corporate administration, finance
and accounting.
Our board of
directors established an audit committee which would assist the
Board in exercising its duty of care on disclosure requirements,
the enforcement of accounting policies, management of our business
risks, the management of our internal control systems, ethical
conduct of our businesses, monitoring the sufficiency of our
financial statements, our compliance with laws, independence and
capacity of independent auditors and performance of our internal
audit and our external auditors.
On November 5,
2015, our board of directors appointed Jorge Oscar Fernández,
Pedro Damaso Labaqui Palacio, Daniel Elías Mellicovsky and
Gabriel Adolfo Gregorio Reznik, all of them independent members, as
members of the audit committee. The board of directors named Jorge
Oscar Fernández as the financial expert in accordance with the
relevant SEC rules. We have a fully independent audit committee as
per the standards provided in Rule 10(A)-3(b)(1).
214
B.
CODE OF ETHICS
We have adopted a
code of ethics that applies to our directors, officers and
employees. Our code of ethics is posted in our website
www.cresud.com.ar. On July 25, 2005, our Code of Ethics was amended
by our board of directors. The amendment was reported in a report
on Form 6K on August 1, 2005.
If we make any
substantive amendment to the code of ethics or if we grant any
waivers, including any implicit waiver, from a provision of the
code of ethics, we will disclose the nature of such amendment or
waiver in a Form 6-K or in our next Forms 20-F to be filed with the
SEC.
C.
PRINCIPAL ACCOUNTANT FEES AND SERVICES
Audit Fees
During
the fiscal years ended June 30, 2016 and 2015, we were billed a
total amount of Ps. 15.7 million and Ps. 9.7 million, respectively,
for professional services rendered by our principal accountants for
the audit of our financial statements and other services normally
provided in connection with regulatory filings or
engagements.
Audit-Related Fees
During
the fiscal year ended june 30, 2016 no audit-related services were
provided. while as of June 30, 2015 we were billed a total amount
of Ps. 0.1 million for professional services rendered by our
principal accountants for other services related to the audit of
our financial statements and other services normally provided in
connection with regulatory filings or engagements.
Tax Fees
During
the fiscal year ended June 30, 2016 and 2015, we were billed a
total amount of nil and Ps.0.01 million, respectively for
professional services rendered by our principal accountants for tax
compliance, tax advice and tax planning
All Other Fees
During
the fiscal years ended June 30, 2016 we were billed a total amount
of Ps. 0.8 million for other professional services rendered by our
principal accountants., while as of June 30, 2015 no such
services were provided.
Audit Committee Pre-Approval Policies and Procedures
Our audit committee
approves, in advance, the engagement of auditors and their fees for
audit and non-audit services pursuant to paragraph (c)(7)(i)(c) of
Rule 2-01 of Regulation S-X.
Our Audit Committee
pre-approves all services, fees and services provided by the
external auditors to ensure auditors’ independence. One of
the main tasks of the Audit Committee is to give it opinion in
relation to the appointment of the external auditors, proposed by
the Board of Directors to the General Shareholder’s Meeting.
In order to accomplish such task, the Audit Committee
shall:
• Require
any additional and complementary documentation related to this
analysis;
• Verify
the independence of the external auditors;
• Analyze
different kinds of services that the external auditor would provide
to the company. This description must also include an estimate of
the fees payable for such services, specifically in order to
maintain the principle of independence;
• Inform
the fees billed by the external auditor, separating the services
related to audit services and other special services that could be
not included in the audit services previously
mentioned.
• Take
notice of any strategy proposed by of the external auditors and
review it in accordance with the reality other business and the
risks involved;
• Analyze
and supervise the working plan of the external auditors considering
the business’ reality and the estimated risks;
• Propose
adjustments (if necessary) to such working plan;
• Hold
meetings with the external auditors in order to: (a) analyze the
difficulties, results and conclusions of the proposed working plan;
(b) analyze eventual possible conflicts of interests, related party
transactions, compliance with the legal framework and information
transparency;
• Evaluate
the performance of external auditors and their opinion regarding
the Financial Statements.
D.
EXEMPTION FROM THE LISTING STANDARDS FOR AUDIT
COMMITTEES
This section is not
applicable.
E.
PURCHASES OF EQUITY SECURITIES BY THE ISSUER AND AFFILIATED
PURCHASERS
Issuer
Purchases of Equity Securities
On August 26, 2008,
our Board of Directors decided to establish a share repurchase plan
(the “2009 Plan”) under the provisions of the former
Section 68 of the Law No. 17,811 (as amended by the transparency
decree), currently amended and restated by the Capital Markets Law,
in order to help reduce the decline and fluctuations of the price
of our shares in the market.
215
During the fiscal
year 2009, under the 2009 Plan, we purchased 30,000,000 common
shares, for which we paid US$ 21.0 million and Ps.1.7 million, thus
fulfilling the terms and conditions of the 2009 Plan. As a result,
by the end of the fiscal year 2009 our investment in our own shares
amounted to 5.98% of total capital stock.
|
Period
|
Total
Number of Shares Purchased
|
Average
Price Paid per Share (Ps.)
|
Total
Number of Shares Purchased as Part of the Publicly Announced
Plan
|
Maximum
Number of Shares that may yet be purchased under the
plan
|
|
08/29/08 –
08/31/08
|
31,000
|
3.38
|
31,000
|
9,969,000
|
|
09/01/08 –
09/30/08
|
2,122,886
|
3.36
|
2,153,886
|
7,846,114
|
|
10/01/08 –
10/31/08
|
9,650,493
|
2.03
|
11,804,379
|
18,195,621
|
|
11/01/08 –
11/30/08
|
5,756,140
|
2.02
|
17,560,519
|
12,439,481
|
|
12/01/08 –
12/31/08
|
4,382,783
|
2.63
|
21,943,302
|
8,056,698
|
|
01/01/09 –
01/31/09
|
2,047,461
|
2.94
|
23,990,763
|
6,009,237
|
|
02/01/09 –
02/28/09
|
2,173,860
|
2.70
|
26,164,623
|
3,835,377
|
|
03/01/09 –
03/31/09
|
563,692
|
2.61
|
26,728,315
|
3,271,685
|
|
04/01/09 –
04/30/09
|
428,052
|
2.91
|
27,156,367
|
2,843,633
|
|
05/01/09 –
05/31/09
|
2,843,633
|
3.45
|
30,000,000
|
-
|
|
Total
|
30,000,000
|
|
|
|
In addition, during
November 2009, our Board of Directors, in accordance with the
resolutions of the Shareholders’ Meeting dated
October 29, 2009, decided to initiate the process of
distribution among the shareholders, on a
pro rata
basis, of 25,000,000 common
shares, repurchased under the 2009 Plan. The allotment of shares
was calculated over the outstanding capital stock up to October 29,
2009 of Ps. 471,538,610 (0.05301792784 shares per ADR). As a result
of the calculation of the allotment, the fractions were settled in
cash. 754 shares were not distributed.
On April 11, 2014
our Board of Directors decided to initiate a new shares repurchase
plan (the “2014 Plan”), under the terms of Article 64
of the Capital Markets Law and the rules of the CNV. Such
repurchases were made with our liquid and realized profits and free
reserves. As of November 14, 2014, we finalized the 2014 Plan
having repurchased a total of 8,633,316 shares, equivalent to 1.72%
of the share capital, by a total of Ps. 87.1 million.
|
Period
|
Total Number of Common Shares
Purchased
(1)
|
Average Price Paid per Share
|
Total Number of ADR’s Purchased
|
Average Price Paid per Share
|
Total Number of Shares Purchased as
Part of the Publicly Announced Plan
(2)
|
Maximum Number of Shares that may yet be purchased under the
plan
|
|
|
|
(Ps.)
|
|
(US$)
|
|
|
|
04/17/2014 - 04/30/2014
|
14,7
|
6.74
|
59,162
|
11.18
|
606,32
|
18,506,949
|
|
05/01/2014 - 05/31/2014
|
33,537
|
10.23
|
171,5
|
12.11
|
1,748,537
|
16,758,412
|
|
06/01/2014 - 06/30/2014
|
100,512
|
12.81
|
313,011
|
12.33
|
3,230,622
|
13,527,790
|
|
07/01/2014 - 07/31/2014
|
4
|
13.40
|
115,111
|
13.62
|
1,155,110
|
12,372,680
|
|
08/01/2014 - 08/31/2014
|
13,657
|
13.23
|
142,989
|
12.28
|
1,443,547
|
10,929,133
|
|
09/01/2014 - 09/30/2014
|
-
|
-
|
44,918
|
11.86
|
449,18
|
10,479,953
|
|
Total
|
166,406
|
|
846,691
|
|
8,633,316
|
|
(1)
As of the date of
transaction.
(2)
Correspond to the
sum of common shares and ADR’s purchased. Each ADR represents
10 common shares.
In addition, during
December 2014, our Board of Directors, in accordance with the
resolutions of the Shareholders’ Meeting dated November 14,
2014, decided to initiate the process of distribution among the
shareholders, on a
pro rata
basis, of 5,565,479 common shares, repurchased under the 2014 Plan.
The allotment of shares was calculated over the outstanding capital
stock up to December 12, 2014 of Ps. 487,928,660 (10 shares per
ADR). As a result of the calculation of the allotment, the
fractions were settled in cash. 746 shares were not
distributed.
As of June 30,
2016, our investment in own shares amounts to 1.30% of total
capital stock.
F.
CHANGE IN REGISTRANT’S CERTIFYING ACCOUNTANT
This section is not
applicable.
G.
CORPORATE GOVERNANCE
Compliance
with NASDAQ listing standards on corporate governance
Significant
differences between our corporate governance practices and U.S.
companies’ practices under NASDAQ Rules:
Our corporate
governance practices are governed by the applicable Argentine law;
particularly, the Argentine Corporations Law, the Capital Markets
Law and the rules of the CNV, as well as by ours
by-laws.
We have securities
that are registered with the Securities and Exchange Commission and
are listed on the NASDAQ, and are therefore subject to corporate
governance requirements applicable to NASDAQ-listed non-US
companies (a “NASDAQ-listed” company).
Pursuant to NASDAQ
Rule 5615(a)(3), NASDAQ -listed non-U.S. companies that are
categorized as “Foreign Private Issuers” may follow
home country corporate governance practices in lieu of certain of
the corporate governance requirements provided in NASDAQ Rules,
provided that the foreign private issuer complies with certain
mandatory sections of NASDAQ Rules, discloses each requirement that
it does not follow and describes the home country practice followed
in lieu of such requirement. The requirements of the NASDAQ Rules
and the Argentine corporate governance practices that we follow in
lieu thereof are described below:
216
|
NASDAQ
Standards for U.S. companies
|
CRESUD’S
CORPORATE PRACTICES
|
|
Rule
5250(d) - Distribution of Annual and Interim Reports.
|
In lieu of the
requirements of Rule
5250(d)
, we follow
Argentine law, which requires that companies issue publicly a
Spanish language annual report, including annual Audited
Consolidated Financial Statements prepared in accordance with
generally accepted accounting principles in Argentina, by filing
such annual report with the CNV and the stock exchange in which the
securities are listed, within 70 calendar days following the close
of our fiscal year. Interim reports must be filed with the CNV and
the stock exchange in which the securities are listed within 42
calendar days following the close of each fiscal quarter. We
provide our shareholders a copy of the annual and interim financial
reports upon request. English language translations of our annual
reports and interim reports are filed with the SEC on Form 20-F and
Form 6-K, respectively. We also send the English language
translation of our annual report and quarterly press releases on
its website. Furthermore, under the terms of the Deposit Agreement,
dated as of March 18, 1997, among us, The Bank of New York Mellon,
as depositary, and owners of ADSs issued thereunder, we are
required to furnish The Bank of New York Mellon with, among other
things, English language translations of their annual reports.
Annual reports are available for inspection by ADR holders at the
offices of The Bank of New York located at, 101 Barclay Street, 22
Floor, New York, New York. Finally, Argentine law requires that 20
calendar days before the date of a shareholders’ meeting, the
board of directors must provide to our shareholders, at our
executive office or through electronic means, all information
relevant to the shareholders’ meeting, including copies of
any documents to be considered by the shareholders (which includes
the annual report).
|
|
Rule
5605(b)(1) - Majority of Independent Directors.
|
In lieu of the
requirements of Rule 5605(b)(1), we follow Argentine law which does
not require that a majority of the board of directors be comprised
of independent directors. Argentine law instead requires that
public companies in Argentina, such as, us must have a sufficient
number of independent directors to be able to form an audit
committee of at least three members, the majority of which must be
independent pursuant to the criteria established by the
CNV.
|
|
Rule
5605(b)(2) - Executive Sessions of the Board of
Directors.
|
In lieu of the
requirements of Rule 5605(b)(2), we follow Argentine law which does
not require independent directors to hold regularly scheduled
meetings at which only such independent directors are present
(i.e., executive sessions). Our board of directors as a whole is
responsible for monitoring our affairs. In addition, under
Argentine law, the board of directors may approve the delegation of
specific responsibilities to designated directors or non-director
managers of the Company. Also, it is mandatory for public companies
to form a supervisory committee (composed of “syndics”)
which is responsible for monitoring our legal compliance under
Argentine law and compliance with our by-laws. Finally, our audit
committee has regularly scheduled meetings and, as such, such
meetings will serve a substantially similar purpose as executive
sessions.
|
|
Rule
5605(d)(B) - Compensation of Officers.
|
In lieu of the
requirements of Rule 5605(d)(B), we follow Argentine law which does
not require companies to form a compensation committee comprised
solely of independent directors. For the determination of the
compensation of the chief executive officer and all other executive
officers no decision of a majority of independent directors or a
compensation committee comprised solely of independent directors is
required under Argentine law. Under Argentine law, the board of
directors is the corporate body responsible for determining the
compensation of the chief executive officer and all other executive
officers, so long as they are not directors. In addition, under
Argentine law, the audit committee shall give its opinion about the
reasonableness of management’s proposals on fees and option
plans for our directors or managers.
|
|
Rule
5605(e) - Nomination of Directors.
|
In lieu of the
requirements of Rule 5605(e), we follow Argentine law which
requires that directors be nominated directly by the shareholders
at the shareholders’ meeting and that they be selected and
recommended by the shareholders themselves. Under Argentine law, it
is the responsibility of the ordinary shareholders’ meeting
to appoint and remove directors and to set their
compensation.
|
|
Rule
5605(c)(1) - Audit Committee Charter.
|
In lieu of the
requirements of Rule 5605(c)(1), we follow Argentine law which
requires that audit committees have a charter but does not require
that companies certify as to the adoption of the charter nor does
it require an annual review and assessment thereof. Argentine law
instead requires that companies prepare a proposed plan or course
of action with respect to those matters which are the
responsibility of our audit committee. Such plan or course of
action could, at the discretion of our audit committee, include a
review and assessment of the audit committee charter. We believe
that we are in compliance with the requirements for audit committee
charters provided for in the Sarbanes Oxley Act.
|
|
Rule
5605(c)(2) - Audit Committee Composition.
|
Argentine law does
not require that companies have an audit committee comprised solely
of independent directors and it is equally not customary business
practice in Argentina to have such a committee. Argentine law
instead requires that companies establish an audit committee with
at least three members comprised of a majority of independent
directors as defined by Argentine law. Nonetheless, although not
required by Argentine law, we have a three member audit committee
comprised of entirely independent directors in accordance with Rule
10(A)-3(b)(1) of the General rules and regulations promulgated
under the Securities Exchange Act of 1934, as independence is
defined in Rule 10(A)-3(b)(1). Further, Argentine law does not
require companies to identify or designate a financial expert. As
such, Although all the members of the audit committee have large
corporate experience, as of the date of this annual report, the
Board of Directors have not named designated a financial expert in
accordance with the relevant SEC ruleson the audit committee.
Although it is noted that all members of the audit committee have
had significant corporate experience. In addition, we have a
supervisory committee (
“comisión
fiscalizadora”
) composed of three
‘syndics’ which are in charge of monitoring the
legality, under Argentine law, of the actions of our board of
directors and the conformity of such actions with our
by-laws.
|
|
Rule
5620(c) - Quorum.
|
In lieu of the
requirements of Rule 4350(f), we follow Argentine law and our
bylaws, which distinguish between ordinary meetings and
extraordinary meetings and both of them can be celebrated using
teleconference technology, as long as the regulations related to
accreditation, registration and quorum are complied with and the
simultaneity of the shareholders and immediately of the process of
verbal communication and issuance of votes is guaranteed. The
supervisory committee shall state the regularity of the resolutions
adopted. The board of directors shall establish the rules and
technical matters related to remote participation pursuant to the
current rules and in conformity with the National Exchange
Commission regulations. Shareholders physically present at the time
and those using teleconference technologies will be taken into
consideration for the quorum. In connection with ordinary meetings,
a quorum consists of a majority of stocks entitled to vote. If no
quorum is present at the first meeting, a second meeting may be
called, in which the shareholders present or communicated through
teleconference technologies, regardless of their number, constitute
a quorum. Resolutions may be adopted by an absolute majority of the
votes present or communicated through teleconference technologies.
Argentine law, and our bylaws, requires in connection with
extraordinary meetings, that a quorum consist of 60% of the stock
entitled to vote. However, if such quorum is not present at the
first meeting, our bylaws provide that a second meeting may be
called and may be held with the number of shareholders present or
communicated through teleconference technologies. In both ordinary
and extraordinary meetings, decisions are adopted by an absolute
majority of votes present at the meeting or communicated through
teleconference technologies, except for certain fundamental matters
(such as mergers and spin-offs (when we are not the surviving
entity and the surviving entity is not listed on any stock
exchange), anticipated liquidation, change in its domicile outside
of Argentina, total or partial recapitalization of its statutory
capital following a loss, any transformation in our corporate legal
form or a substantial change in our corporate purpose, or the issue
of bonds) which require an approval by vote of the majority of all
the stock entitled to vote (all stock being entitled to only one
vote).
|
|
Rule
5620(b) -- Solicitation of Proxies.
|
In lieu of the
requirements of Rule 5620(b), we follow Argentine law which
requires that notices of shareholders’ meetings be published,
for five consecutive days, in the Official Gazette and in a widely
published newspaper in Argentina no earlier than 45 calendar days
prior to the meeting and at least 20 calendar days prior to such
meeting. In order to attend a meeting and be listed on the meeting
registry, shareholders are required to submit evidence of their
book-entry share account held at Caja de Valores S.A. up to three
business days prior to the scheduled meeting date. If entitled to
attend the meeting, a shareholder may be represented by proxy
(properly executed and delivered with a certified signature)
granted to any other person, with the exception of a director,
syndic, member of the Supervisory Committee, manager or employee of
the issuer, which are prohibited by Argentine law from acting as
proxies. In addition, our ADS holders receive, prior to the
shareholders’ meeting, a notice listing the matters on the
agenda, a copy of the annual report and a voting card.
|
|
Rule
5630(s) -- Conflicts of Interest
|
In lieu of the
requirements of Rule 5630(a), we follow Argentine law which
requires that related party transactions be approved by the audit
committee when the transaction exceeds one percent (1%) of the
corporation’s net worth, measured pursuant to the last
audited balance sheet,. Directors can contract with the corporation
only on an arm’s length basis. If the contract is not in
accordance with prevailing market terms, such transaction must be
pre-approved by the board of directors (excluding the interested
director). In addition, under Argentine law, a shareholder is
required to abstain from voting on a business transaction in which
its interests may be in conflict with the interests of the company.
In the event such shareholder votes on such business transaction
and such business transaction would not have been approved without
such shareholder’s vote, such shareholder may be liable to
the company for damages and the resolution may be declared
void.
|
217
H.
MINE SAFETY DISCLOSURES
This section is not
applicable.
We have responded
to Item 18 in lieu of responding to this Item.
Reference is made
to pages F-1 through F-309
Index to Financial
Statements (see page F-1).
Exhibit
No.
Description
of Exhibit
|
1.1*
|
By-laws
(Estatutos) of the registrant, which serve as the
registrant’s articles of incorporation and by-laws, and an
English translation thereof.
|
|
1.2****
|
English translation
of the amendment to the bylaws.
|
|
1.3*********
|
Amended and
restated English translation of the bylaws.
|
|
1.4**********
|
Amended and
restated English translation of the bylaws.
|
|
2.1*******
|
Indenture dated
September 7, 2011, among us, as issuer, the Bank of New York
Mellon, as trustee, co-registrar, principal paying agent and
transfer agent, Banco Santander Rio, S.A., as registrar, paying
agent, transfer agent and representative of the trustee in
Argentina, and The Bank of New York Mellon (Luxembourg) S.A., as
Luxembourg Paying and Transfer Agent, for the issuance of the US$
60,000,000, 7.50% Fourth Series, Class VIII Senior Notes Due
2014.
|
|
2.2
|
Indenture, dated
July 20, 2010, between IRSA Inversiones y Representaciones Sociedad
Anónima as Issuer, The Bank of New York Mellon as Trustee,
Co-Registrar, Principal Paying Agent and Transfer Agent, and Banco
Santander Río S.A. as Registrar, Paying Agent, Transfer Agent
and Representative of the Trustee in Argentina, with respect to
IRSA Inversiones y Representaciones S.A.’s US$400,000,000
Global Note Program, pursuant to which US$150,000,000 aggregate
principal amount of IRSA Inversiones y Representaciones Sociedad
Anónima’s 11.500% Notes due 2020, Series No. 2, were
issued.
|
|
2.3
|
First Supplemental
Indenture, dated March 28, 2016, between IRSA Inversiones y
Representaciones Sociedad Anónima as Issuer and The Bank of
New York Mellon as Trustee, Co-Registrar, Principal Paying Agent
and Transfer Agent to the Indenture, dated July 20, 2010, between
IRSA Inversiones y Representaciones Sociedad Anónima as
Issuer, The Bank of New York Mellon as Trustee, Co-Registrar,
Principal Paying Agent and Transfer Agent, and Banco Santander
Río S.A. as Registrar, Paying Agent, Transfer Agent and
Representative of the Trustee in Argentina, with respect to IRSA
Inversiones y Representaciones Sociedad Anónima’s
US$400,000,000 Global Note Program, pursuant to which
US$150,000,000 aggregate principal amount of IRSA Inversiones y
Representaciones Sociedad Anónima’s 11.500% Notes due
2020, Series No. 2, were issued.
|
|
2.4
|
Indenture, dated
March 23, 2016, between IRSA Propiedades Comerciales S.A. as
Issuer, The Bank of New York Mellon as Trustee, Co-Registrar,
Principal Paying Agent and Transfer Agent, and Banco Santander
Río S.A. as Registrar, Paying Agent, Transfer Agent and
Representative of the Trustee in Argentina, with respect to IRSA
Propiedades Comerciales S.A.’s US$500,000,000 Global Note
Program, pursuant to which US$360,000,000 000 aggregate principal
amount of IRSA Propiedades Comerciales S.A.’s 8.750% Notes
due 2023, Series No. 2, were issued.
|
|
2.5
|
First Supplemental
Indenture, dated March 23, 2016, between IRSA Propiedades
Comerciales S.A., as Issuer and The Bank of New York Mellon, as
Trustee, Co-Registrar, Principal Paying Agent and Transfer Agent,
The Bank of New York Mellon (Luxembourg) S.A., as Luxembourg Paying
Agent and Luxembourg Transfer Agent and Banco Santander Río
S.A., as Registrar, Paying Agent, Transfer Agent and Representative
of the Trustee in Argentina to the Indenture, dated March 23, 2016,
between IRSA Propiedades Comerciales S.A. as Issuer, The Bank of
New York Mellon as Trustee, Co-Registrar, Principal Paying Agent
and Transfer Agent, and Banco Santander Río S.A. as Registrar,
Paying Agent, Transfer Agent and Representative of the Trustee in
Argentina, with respect to IRSA Propiedades Comerciales
S.A.’s US$500,000,000 Global Note Program, pursuant to which
US$360,000,000 000 aggregate principal amount of IRSA Propiedades
Comerciales S.A.’s 8.750% Notes due 2023, Series No. 2, were
issued.
|
|
4.1*
|
Consulting
Agreement among Cresud S.A.C.I.F. y A. and Dolphin Fund Management
S.A. dated October 25, 1994.
|
|
4.2**
|
Agreement for the
exchange of Corporate Service between we, IRSA and IRSA Commercial
Properties, dated June 30, 2004.
|
|
4.3****
|
English translation
of the Amendment to the Agreement for the exchange of Corporate
Service among, IRSA and IRSA Commercial Properties and us, dated
August 23, 2007.
|
|
4.4*****
|
English translation
of the Third Agreement for the Implementation of the Amendment to
the Corporate Services Master Agreement, dated November 27,
2009.
|
|
4.5******
|
Amendment to the
Agreement for the exchange of Corporate Service between we, IRSA
and IRSA Commercial Properties, dated March 12, 2010.
|
|
4.6*******
|
English translation
of the Forth Agreement for the Implementation of the Amendment to
the Corporate Services Master Agreement, dated July 11,
2011.
|
|
4.7********
|
English translation
of the Fifth Agreement for the Implementation of the Amendment to
the Corporate Services Master Agreement, dated October 15,
2012.
|
|
4.8*********
|
English translation
of the Sixth Agreement for the Implementation of the Amendment to
the Corporate Services Master Agreement dated November 12,
2013.
|
|
4.9*********
|
English translation
of the Second Amendment to the Exchange of Operating Services
Agreement between the Company, Cresud and IRSA Commercial
Properties dated February 24, 2014.
|
|
4.10**********
|
English translation
of the Seventh Agreement for the Implementation of the Amendment to
the Corporate Services Master Agreement dated February 18,
2015.
|
|
4.11
|
English translation
of the Eighth Agreement for the Implementation of the Amendment to
the Corporate Services Master Agreement dated November 12,
2015.
|
|
8.1
|
List of
Subsidiaries.
|
|
11.1***
|
Code of
Ethics.
|
|
12.1
|
Certification
pursuant to Section 302 of the Sarbanes-Oxley Act of 2002 for Chief
Executive Officer.
|
|
12.2
|
Certification
pursuant to Section 302 of the Sarbanes-Oxley Act of 2002 for Chief
Financial Officer.
|
|
13.1
|
Certification
pursuant to 18 U.S.C. 1350, as adopted pursuant to Section 906 of
the Sarbanes-Oxley Act of 2002 for Chief Executive
Officer.
|
|
13.2
|
Certification
pursuant to 18 U.S.C. 1350, as adopted pursuant to Section 906 of
the Sarbanes-Oxley Act of 2002 for Chief Financial
Officer.
|
218
*Incorporated
herein by reference to the exhibit to the registrant’s
registration statement on Form F-1 (File No. 333-06548) filed with
the SEC on March 3, 1997.
** Incorporated
herein by reference to the report statement on Form 6-K (File No.
333-06548) filed with the SEC on July 1, 2004.
*** Incorporated
herein by reference to the registrant’s report on Form 6-K
(File No. 333-06548) filed with the SEC on August 1,
2005.
**** Incorporated
herein by reference to the annual report on Form 20-F (File No.
333-06548) filed with the SEC on December 27, 2007.
***** Incorporated
herein reference to the annual report on Form 20-F (File No.
333-06548) filed with the SEC on December 30, 2009.
****** Incorporated
herein reference to the annual report on Form 20-F (File No.
333-06548) filed with the SEC on December 30, 2010.
*******
Incorporated herein reference to the annual report on Form 20-F
(File No. 333-06548) filed with the SEC on December 28,
2011.
********
Incorporated herein reference to the annual report on Form 20-F
(File No. 333-06548) filed with the SEC on October 30,
2012.
*********
Incorporated herein reference to the annual report on Form 20-F
(File No. 333-06548) filed with the SEC on October 31,
2014.
**********
Incorporated herein reference to the annual report on Form 20-F
(File No. 333-06548) filed with the SEC on November 17,
2015.
SIGNATURES
The registrant
hereby certifies that it meets all of the requirements for filing
on Form 20-F and that it has duly caused and authorized the
undersigned to sign this annual report on its behalf.
|
|
CRESUD
SOCIEDAD ANÓNIMA COMERCIAL INMOBILIARIA FINANCIERA Y
AGROPECUARIA
|
|
|
|
|
|
|
|
|
Date October 31,
2016
|
By:
|
/s/ Matias I.
Gaivironsky
|
|
|
|
|
Name Matías I.
Gaivironsky
|
|
|
|
|
Title Chief
Financial and Administrative Officer
|
|
219
INDEX TO THE CONSOLIDATED FINANCIAL STATEMENTS
|
Cresud Sociedad Anónima Comercial, Inmobiliaria, Financiera y
Agropecuaria
|
|
|
|
Page
|
|
Report
of Independent Registered Public Accounting Firm
|
|
|
Glossary
of terms
|
F -
1
|
|
Consolidated
Statements of Financial Position as of June 30, 2016 and
2015
|
F -
2
|
|
Consolidated
Statements of (Operations) / Income for the fiscal years ended June
30, 2016, 2015 and 2014
|
F -
4
|
|
Consolidated
Statements of Comprehensive (Operations) / Income for the fiscal
years ended June 30, 2016, 2015 and 2014
|
F -
5
|
|
Consolidated
Statements of Changes in Shareholders’ Equity for the fiscal
years ended June 30, 2016, 2015 and 2014
|
F -
6
|
|
Consolidated
Statements of Cash Flows for the fiscal years ended June 30, 2016,
2015 and 2014
|
F -
9
|
|
Notes to the Consolidated Financial
Statements
|
F -
10
|
|
Schedule I
|
F
– 194
|
|
Schedule II
|
F -
197
|
|
Schedule III
|
F -
199
|
Report of Independent Registered Public Accounting
Firm
To
the Board of Directors and Shareholders of
Cresud
Sociedad Anónima Comercial, Inmobiliaria, Financiera y
Agropecuaria
In our opinion, the accompanying consolidated
statements of financial position and the related consolidated
statements of income, comprehensive income, changes in
shareholders’ equity and cash flows present fairly, in all
material respects, the financial position of Cresud Sociedad
Anónima, Comercial, Inmobiliaria, Financiera y Agropecuaria
and its subsidiaries at June 30, 2016 and 2015, and the results of
their operations and their cash flows for each of the three years
in the period ended June 30, 2016 in conformity with International
Financial Reporting Standards as issued by the International
Accounting Standards Board. In addition, in our opinion, the
financial statement schedules listed in the accompanying
index
present
fairly, in all material respects, the information set forth therein
when read in conjunction with the related
consolidated
financial statements.
Also, in our opinion, the Company maintained, in
all material respects, effective internal control over financial
reporting as of June 30, 2016, based on criteria established in
Internal Control - Integrated Framework 2013 issued by the
Committee of Sponsoring Organizations of the Treadway Commission
(COSO). The Company's management is responsible for these financial
statements and financial statement schedules, for maintaining
effective internal control over financial reporting and for its
assessment of the effectiveness of internal control over financial
reporting, included in accompanying Management’s Annual
Report on Internal Control Over Financial Reporting under Item 15.
Our responsibility is to express opinions on these financial
statements
,
on the financial statement schedules,
and on the Company's internal control over financial reporting
based on our integrated audits. We conducted our audits in
accordance with the standards of the Public Company Accounting
Oversight Board (United States). Those standards require that we
plan and perform the audits to obtain reasonable assurance about
whether the financial statements are free of material misstatement
and whether effective internal control over financial reporting was
maintained in all material respects. Our audits of the financial
statements included examining, on a test basis, evidence supporting
the amounts and disclosures in the financial statements, assessing
the accounting principles used and significant estimates made by
management, and evaluating the overall financial statement
presentation. Our audit of internal control over financial
reporting included obtaining an understanding of internal control
over financial reporting, assessing the risk that a material
weakness exists, and testing and evaluating the design and
operating effectiveness of internal control based on the assessed
risk. Our audits also included performing such other procedures as
we considered necessary in the circumstances. We believe that our
audits provide a reasonable basis for our
opinions.
The accompanying financial statements have been
prepared assuming that the Company will continue as a going
concern.
As discussed in Note 1 to the consolidated
financial statements, there are risks and uncertainties in relation
to the Company’s subsidiary IDB Development. These financial
statements do not include any adjustments related to the valuation
of IDBD’s assets and liabilities that would be required if
IDBD were not able to continue as a going-concern.
A company’s
internal control over financial reporting is a process designed to
provide reasonable assurance regarding the reliability of financial
reporting and the preparation of financial statements for external
purposes in accordance with generally accepted accounting
principles. A company’s internal control over financial
reporting includes those policies and procedures that
(i) pertain to the maintenance of records that, in reasonable
detail, accurately and fairly reflect the transactions and
dispositions of the assets of the company; (ii) provide
reasonable assurance that transactions are recorded as necessary to
permit preparation of financial statements in accordance with
generally accepted accounting principles, and that receipts and
expenditures of the company are being made only in accordance with
authorizations of management and directors of the company; and
(iii) provide reasonable assurance regarding prevention or
timely detection of unauthorized acquisition, use, or disposition
of the company’s assets that could have a material effect on
the financial statements.
Because of its
inherent limitations, internal control over financial reporting may
not prevent or detect misstatements. Also, projections of any
evaluation of effectiveness to future periods are subject to the
risk that controls may become inadequate because of changes in
conditions, or that the degree of compliance with the policies or
procedures may deteriorate.
As
described in “Management´s Annual Report on Internal
Control over Financial Reporting”, management has excluded
IDB Development from its assessment of internal control over
financial reporting as June 30, 2016 because it was acquired by the
Company in a purchase business combination during 2016. We have
also excluded IDB Development from our audit of internal control
over financial reporting. IDB Development is an indirect subsidiary
(through Tyrus S.A.) whose total assets and total revenue represent
89 % and 80 %, respectively, of the related consolidated
financial statement amounts as of and for the year ended June 30,
2016.
PRICE WATERHOUSE
& Co. S.R.L.
By: /s/ Carlos
Martín Barbafina (Partner)
Buenos Aires,
Argentina
October 31,
2016
|
|
|
|
|
|
|
|
|
|
|
|
|
|
|
|
|
|
|
|
Glossary of terms
The followings are
not technical definitions, but help the reader to understand
certain terms used in the wording of the notes to the Group’s
Financial Statements.
|
Terms
|
|
Definitions
|
|
Acres
|
|
Agropecuaria
Acres del Sud S.A.
|
|
Adama
|
|
Adama
Agricultural Solutions Ltd.
|
|
BACS
|
|
Banco
de Crédito y Securitización S.A.
|
|
Baicom
|
|
Baicom
Networks S.A.
|
|
Bartan
|
|
Bartan
Holdings and Investments Ltd.
|
|
BASE
|
|
Buenos
Aires Stock Exchange
|
|
BCRA
|
|
Central
Bank of the Argentine Republic
|
|
BHSA
|
|
Banco
Hipotecario S.A.
|
|
Bitania
|
|
Bitania
26 S.A.
|
|
BMBY
|
|
Buy
Me Buy You (Note 3.A.a)
|
|
Brasilagro
|
|
Brasilagro-Companhia
Brasileira de Propriedades Agrícolas
|
|
CAMSA
|
|
Consultores
Assets Management S.A.
|
|
Carnes
Pampeanas
|
|
Sociedad
Anónima Carnes Pampeanas S.A.
|
|
Cellcom
|
|
Cellcom
Israel Ltd.
|
|
Clal
|
|
Clal
Holdings Insurance Enterprises Ltd.
|
|
CNV
|
|
Securities
Exchange Commission
|
|
CODM
|
|
Chief
Operating Decision Maker
|
|
Condor
|
|
Condor
Hospitality Trust Inc.
|
|
Cresud,
the Company or us
|
|
Cresud
S.A.C.I.F. y A.
|
|
Cyrsa
|
|
Cyrsa
S.A.
|
|
DFL
|
|
Dolphin
Fund Ltd.
|
|
DIC
|
|
Discount
Investment Corporation Ltd.
|
|
DN
B.V.
|
|
Dolphin
Netherlands B.V.
|
|
Dolphin
|
|
Dolphin
Fund Ltd. and Dolphin Netherlands B.V.
|
|
EHSA
|
|
Entertainment
Holdings S.A.
|
|
ENUSA
|
|
Entretenimiento
Universal S.A.
|
|
ERSA
|
|
Emprendimiento
Recoleta S.A.
|
|
Financial
Statements
|
|
Consolidated
Financial Statements
|
|
ETHB
|
|
ETH
Bioenergía S.A.
|
|
ETH
|
|
C.A.A.
Extra Holdings Ltd.
|
|
CPF
|
|
Collective
Promotion Funds
|
|
IAS
|
|
International
Accounting Standards
|
|
IASB
|
|
International
Accounting Standards Board
|
|
IDB
Tourism
|
|
IDB
Tourism (2009) Ltd.
|
|
IDBD
|
|
IDB
Development Corporation Ltd.
|
|
IDBGI
|
|
IDB
Group Investment Inc.
|
|
IDBH
|
|
IDB
Holdings Corporation Ltd.
|
|
IFISA
|
|
Inversiones
Financieras del Sur S.A.
|
|
IFRIC
|
|
International
Financial Reporting Standards Interpretation Committee
|
|
IFRS
|
|
International
Financial Reporting Standard
|
|
MPIT
|
|
Minimun
Presumed Income Tax
|
|
Indarsa
|
|
Inversora
Dársena Norte S.A.
|
|
IRSA
|
|
IRSA
Inversiones y Representaciones Sociedad Anónima
|
|
IRSA
CP
|
|
IRSA
Propiedades Comerciales S.A.
|
|
Koor
|
|
Koor
Industries Ltd.
|
|
Lipstick
|
|
Lipstick
Management LLC
|
|
LRSA
|
|
La
Rural S.A.
|
|
Metropolitan
|
|
Metropolitan
885 Third Avenue Leasehold LLC
|
|
NASDAQ
|
|
National
Association of Securities Dealers Automated Quotation
|
|
NCN
|
|
Non-convertible
Notes
|
|
NFSA
|
|
Nuevas
Fronteras S.A.
|
|
New
Lipstick
|
|
New
Lipstick LLC
|
|
NIS
|
|
New
Israeli Shekel
|
|
NPSF
|
|
Nuevo
Puerto Santa Fe S.A.
|
|
NYSE
|
|
New York Stock
Exchange
|
|
Ombú
|
|
Ombú
Agropecuaria S.A.
|
|
PAMSA
|
|
Panamerican
Mall S.A.
|
|
PBC
|
|
Property
& Building Corporation Ltd.
|
|
PBEL
|
|
PBEL
Real Estate Ltd.
|
|
Puerto
Retiro
|
|
Puerto
Retiro S.A.
|
|
Quality
|
|
Quality
Invest S.A.
|
|
Rigby
|
|
Rigby
183 LLC
|
|
Shufersal
|
|
Shufersal
Ltd.
|
|
SRA
|
|
Sociedad
Rural Argentina
|
|
Tarshop
|
|
Tarshop
S.A.
|
|
TASE
|
|
Tel Aviv Stock
Exchange
|
|
Tender
offers
|
|
Share repurchase
commitment
|
|
Yuchan
|
|
Yuchán
Agropecuaria S.A.
|
|
Yatay
|
|
Yatay
Agropecuaria S.A.
|
F- 1
Cresud
Sociedad Anónima,
Comercial, Inmobiliaria, Financiera y Agropecuaria
Consolidated
Statements of Financial Position
as
of June 30, 2016 and 2015
(All amounts in
millions of Argentine Pesos, except otherwise
indicated)
|
|
Note
|
06.30.16
|
|
06.30.15
|
|
ASSETS
|
|
|
|
|
|
Non-current
assets
|
|
|
|
|
|
Investment
properties
|
10 and Schedule
I
|
49,766
|
|
3,475
|
|
Property, plant and
equipment
|
11
|
26,300
|
|
1,977
|
|
Trading
properties
|
12
|
4,472
|
|
130
|
|
Intangible
assets
|
13
|
11,814
|
|
176
|
|
Biological
assets
|
14
|
677
|
|
459
|
|
Investments in
joint ventures and associates
|
8,9
|
16,534
|
|
2,772
|
|
Deferred income tax
assets
|
25
|
1,658
|
|
653
|
|
Income tax
credit
|
|
173
|
|
160
|
|
Restricted
assets
|
|
129
|
|
4
|
|
Trade and other
receivables
|
17
|
3,773
|
|
427
|
|
Financial assets
held for sale
|
18
|
3,346
|
|
-
|
|
Investment in
financial assets
|
16
|
2,226
|
|
623
|
|
Derivative
financial instruments
|
19
|
8
|
|
208
|
|
Employee
benefits
|
|
4
|
|
-
|
|
Total
non-current assets
|
|
120,880
|
|
11,064
|
|
Current
Assets
|
|
|
|
|
|
Trading
properties
|
12
|
241
|
|
3
|
|
Biological
assets
|
14
|
455
|
|
120
|
|
Inventories
|
15
|
3,900
|
|
511
|
|
Restricted
assets
|
|
748
|
|
607
|
|
Income tax
credit
|
|
541
|
|
31
|
|
Financial assets
held for sale
|
18
|
1,256
|
|
-
|
|
Trade and other
receivables
|
17
|
14,158
|
|
1,772
|
|
Investment in
financial assets
|
16
|
9,673
|
|
504
|
|
Derivative
financial instruments
|
19
|
53
|
|
30
|
|
Cash and cash
equivalents
|
20
|
14,096
|
|
634
|
|
Total
current assets
|
|
45,121
|
|
4,212
|
|
TOTAL
ASSETS
|
|
166,001
|
|
15,276
|
|
SHAREHOLDERS’
EQUITY
|
|
|
|
|
|
Capital
and reserves attributable to equity holders of the
parent
|
|
|
|
|
|
Share
capital
|
|
495
|
|
495
|
|
Treasury
shares
|
|
7
|
|
7
|
|
Inflation
adjustment of share capital and treasury shares
|
|
65
|
|
65
|
|
Share
premium
|
|
659
|
|
659
|
|
Additional paid-in
capital from treasury shares
|
|
16
|
|
13
|
|
Legal
reserve
|
|
83
|
|
-
|
|
Other
reserves
|
27
|
1,086
|
|
579
|
|
Accumulated
Deficit
|
|
(1,390)
|
|
(245)
|
|
Equity
attributable to equity holders of the parent
|
|
1,021
|
|
1,573
|
|
Non-controlling
interest
|
|
14,211
|
|
2,330
|
|
TOTAL
SHAREHOLDERS’ EQUITY
|
|
15,232
|
|
3,903
|
The
accompanying notes are an integral part of these Consolidated
Financial Statements.
F- 2
Cresud Sociedad Anónima,
Comercial, Inmobiliaria, Financiera y Agropecuaria
Consolidated
Statements of Financial Position
as of June 30, 2016 and 2015
(Continued)
(All amounts in
millions of Argentine Pesos, except otherwise
indicated)
|
|
Note
|
06.30.16
|
|
06.30.15
|
|
LIABILITIES
|
|
|
|
|
|
Non-current
liabilities
|
|
|
|
|
|
Trade and other
payables
|
21
|
1,528
|
|
264
|
|
Borrowings
|
23
|
93,808
|
|
5,833
|
|
Deferred income tax
liabilities
|
25
|
7,662
|
|
151
|
|
Derivative
financial
instruments
|
19
|
121
|
|
270
|
|
Payroll and social
security
liabilities
|
|
21
|
|
5
|
|
Provisions
|
22
|
1,341
|
|
387
|
|
Employee
benefits
|
24
|
689
|
|
-
|
|
Total
non-current
liabilities
|
|
105,170
|
|
6,910
|
|
Current
liabilities
|
|
|
|
|
|
Trade and other
payables
|
21
|
18,443
|
|
1,307
|
|
Income tax and
minimum presumed income tax liabilities
|
|
624
|
|
142
|
|
Payroll and social
security
liabilities
|
|
1,856
|
|
230
|
|
Borrowings
|
23
|
23,488
|
|
2,466
|
|
Derivative
financial
instruments
|
19
|
147
|
|
263
|
|
Provisions
|
22
|
1,041
|
|
55
|
|
Total
current
liabilities
|
|
45,599
|
|
4,463
|
|
TOTAL
LIABILITIES
|
|
150,769
|
|
11,373
|
|
TOTAL
SHAREHOLDERS’ EQUITY AND LIABILITIES
|
|
166,001
|
|
15,276
|
The
accompanying notes are an integral part of these Consolidated
Financial Statements.
F- 3
Cresud Sociedad Anónima
,
Comercial, Inmobiliaria, Financiera y Agropecuaria
for
the fiscal years ended June 30, 2016, 2015 and 2014
(All amounts in
millions of Argentine Pesos, except otherwise
indicated)
|
|
Note
|
06.30.16
|
|
06.30.15
|
|
06.30.14
|
|
Revenues
|
28
|
35,384
|
|
5,652
|
|
4,604
|
|
Costs
|
29
|
(26,090)
|
|
(4,770)
|
|
(3,913)
|
|
Initial recognition
and changes in the fair value of biological assets and agricultural
produce at the point of harvest
|
|
1,660
|
|
1,324
|
|
1,152
|
|
Changes in the net
realizable value of agricultural produce after harvest
|
|
208
|
|
(34)
|
|
(17)
|
|
Gross
profit
|
|
11,162
|
|
2,172
|
|
1,826
|
|
Gain from disposal
of investment
properties
|
10
|
1,101
|
|
1,150
|
|
231
|
|
(Loss) / Gain from
disposal of
farmlands
|
|
(2)
|
|
550
|
|
91
|
|
General and
administrative
expenses
|
30
|
(2,244)
|
|
(618)
|
|
(533)
|
|
Selling
expenses
|
30
|
(6,279)
|
|
(474)
|
|
(354)
|
|
Other operating
results,
net
|
32
|
(44)
|
|
12
|
|
(75)
|
|
Profit
from
operations
|
|
3,694
|
|
2,792
|
|
1,186
|
|
Share of profit /
(loss) of joint ventures and associates
|
8,9
|
473
|
|
(1,026)
|
|
(410)
|
|
Profit
from operations before financing and taxation
|
|
4,167
|
|
1,766
|
|
776
|
|
Finance
income
|
33
|
1,974
|
|
241
|
|
288
|
|
Finance
cost
|
33
|
(7,719)
|
|
(1,685)
|
|
(2,852)
|
|
Other financial
results
|
33
|
(510)
|
|
156
|
|
(10)
|
|
Financial results,
net
|
33
|
(6,255)
|
|
(1,288)
|
|
(2,574)
|
|
(Loss)
/ Profit before income
tax
|
|
(2,088)
|
|
478
|
|
(1,798)
|
|
Income
tax
|
25
|
197
|
|
(303)
|
|
389
|
|
(Loss)
/ Profit for the
year
|
|
(1,891)
|
|
175
|
|
(1,409)
|
|
|
|
|
|
|
|
|
|
Attributable
to:
|
|
|
|
|
|
|
|
Equity holders of
the
parent
|
|
(1,038)
|
|
(250)
|
|
(1,068)
|
|
Non-controlling
interest
|
|
(853)
|
|
425
|
|
(341)
|
|
|
|
|
|
|
|
|
|
(Loss)
/ Profit per share attributable to equity holders of the parent
during the year:
|
|
|
|
|
|
|
|
Basic
|
|
(3.82)
|
|
0.36
|
|
(2.15)
|
|
Diluted
|
|
(i)
(3.82)
|
|
0.32
|
|
(i)
(2.15)
|
(i)
Due
to the loss for the year, there is no diluted effect on this
result.
The
accompanying notes are an integral part of these Consolidated
Financial Statements.
F- 4
Cresud Sociedad Anónima,
Comercial, Inmobiliaria, Financiera y Agropecuaria
Consolidated
Statements of Comprehensive (Operations) / Income
for
the fiscal years ended June 30, 2016, 2015 and 2014
(All amounts in
millions of Argentine Pesos, except otherwise
indicated)
|
|
06.30.16
|
|
06.30.15
|
|
06.30.14
|
|
(Loss) / Profit for
the
year
|
(1,891)
|
|
175
|
|
(1,409)
|
|
Other
comprehensive income / (loss):
|
|
|
|
|
|
|
Items
that may be reclassified subsequently to profit or
loss:
|
|
|
|
|
|
|
Currency
translation
adjustment
|
37
|
|
(521)
|
|
1,285
|
|
Share of currency
translation adjustment of joint ventures and associates accounted
for using the equity method
|
4,818
|
|
81
|
|
(17)
|
|
Share of change in
fair value of hedging instruments net of associates and joint
ventures accounted for using the equity method
|
(93)
|
|
-
|
|
-
|
|
Items
that may not be reclassified subsequently to profit or
loss:
|
|
|
|
|
|
|
Actuarial loss from
defined benefit plans net of income taxes
|
(42)
|
|
-
|
|
-
|
|
Other
comprehensive income / (loss) for the year
(i)
|
4,720
|
|
(440)
|
|
1,268
|
|
Total
comprehensive income / (loss) for the
year
|
2,829
|
|
(265)
|
|
(141)
|
|
|
|
|
|
|
|
|
Attributable
to:
|
|
|
|
|
|
|
Equity holders of
the parent
|
(646)
|
|
(441)
|
|
(437)
|
|
Non-controlling
interest
|
3,475
|
|
176
|
|
296
|
The
accompanying notes are an integral part of these Consolidated
Financial Statements.
F- 5
Cresud Sociedad Anónima,
Comercial, Inmobiliaria, Financiera y Agropecuaria
Consolidated
Statements of Changes in Shareholders’ Equity
for
the fiscal years ended June 30, 2016, 2015 and 2014
(All amounts in
millions of Argentine Pesos, except otherwise
indicated)
|
|
Attributable
to equity holders of the parent
|
|
|
||||||||
|
|
Share
capital
|
Treasury
Shares
|
Inflation
adjustment
of
share capital and treasury shares (i)
|
Share
premium
|
Additional
paid-in capital from Treasury Shares
|
Legal
reserve
|
Other
reserves
(Note
27)
|
Accumulated
Deficit
|
Subtotal
|
Non-controlling
interest
|
Total
Shareholders’ equity
|
|
Balances
as of June 30,
2015
|
495
|
7
|
65
|
659
|
13
|
-
|
579
|
(245)
|
1,573
|
2,330
|
3,903
|
|
Loss for the
year
|
-
|
-
|
-
|
-
|
-
|
-
|
-
|
(1,038)
|
(1,038)
|
(853)
|
(1,891)
|
|
Other comprehensive
income for the year
|
-
|
-
|
-
|
-
|
-
|
-
|
392
|
-
|
392
|
4,328
|
4,720
|
|
Total
comprehensive income / (loss) for the year
|
-
|
-
|
-
|
-
|
-
|
-
|
392
|
(1,038)
|
(646)
|
3,475
|
2,829
|
|
As
provided by Ordinary and Extraordinary Shareholders’ Meeting
held on October 30, 2015 and on November 26, 2015:
|
|
|
|
|
|
|
|
|
|
|
|
|
- Legal
reserve
|
-
|
-
|
-
|
-
|
-
|
83
|
-
|
(83)
|
-
|
-
|
-
|
|
- Reserve for
future
dividends
|
-
|
-
|
-
|
-
|
-
|
-
|
31
|
(31)
|
-
|
-
|
-
|
|
- Cash
dividends
|
-
|
-
|
-
|
-
|
-
|
-
|
-
|
-
|
-
|
(75)
|
(75)
|
|
IDBD business
combination (Note
3)
|
-
|
-
|
-
|
-
|
-
|
-
|
-
|
-
|
-
|
8,609
|
8,609
|
|
Reserve for
share-based compensation
|
-
|
-
|
-
|
-
|
-
|
-
|
17
|
-
|
17
|
39
|
56
|
|
Equity incentive
plan
granted
|
-
|
-
|
-
|
-
|
3
|
-
|
(4)
|
1
|
-
|
-
|
-
|
|
Transaction with
non-controlling interest
|
-
|
-
|
-
|
-
|
-
|
-
|
106
|
-
|
106
|
387
|
493
|
|
Cumulative
translation adjustment for interest held before business
combination
|
-
|
-
|
-
|
-
|
-
|
-
|
(58)
|
-
|
(58)
|
(33)
|
(91)
|
|
Acquisition of
subsidiaries
|
-
|
-
|
-
|
-
|
-
|
-
|
-
|
-
|
-
|
36
|
36
|
|
Capital
reduction
|
-
|
-
|
-
|
-
|
-
|
-
|
-
|
-
|
-
|
(4)
|
(4)
|
|
Share of changes in
subsidiaries’ equity
|
-
|
-
|
-
|
-
|
-
|
-
|
23
|
-
|
23
|
51
|
74
|
|
Dividends
distribution to non-controlling interest
|
-
|
-
|
-
|
-
|
-
|
-
|
-
|
-
|
-
|
(615)
|
(615)
|
|
Reimbursement
expired
dividends
|
-
|
-
|
-
|
-
|
-
|
-
|
-
|
6
|
6
|
-
|
6
|
|
Capital
contributions from non-controlling interest
|
-
|
-
|
-
|
-
|
-
|
-
|
-
|
-
|
-
|
11
|
11
|
|
Balances
as of June 30,
2016
|
495
|
7
|
65
|
659
|
16
|
83
|
1,086
|
(1,390)
|
1,021
|
14,211
|
15,232
|
(i)
Includes Ps. 1 and
Ps. 1 of inflation adjustment of Treasury Shares as of June 30,
2016 and June 30, 2015, respectively.
The accompanying
notes are an integral part of these Consolidated Financial
Statements.
F- 6
Cresud Sociedad Anónima,
Comercial, Inmobiliaria, Financiera y Agropecuaria
Consolidated
Statements of Changes in Shareholders’ Equity
for
the fiscal years ended June 30, 2016, 2015 and 2014
(All amounts in
millions of Argentine Pesos, except otherwise
indicated)
|
|
Attributable
to equity holders of the parent
|
|
|
||||||||||
|
|
Share
capital
|
Treasury
shares
|
Inflation
adjustment
of
share capital and treasury shares (i)
|
Share
premium
|
Additional
paid-
in
capital from treasury shares
|
Share
warrants
|
Legal
reserve
|
Special
reserve (1)
|
Other
reserves
(Note
27)
|
Accumulated
Deficit
|
Subtotal
|
Non-controlling
interest
|
Total
Shareholders’ equity
|
|
Balances
as of June 30, 2014
|
491
|
11
|
65
|
773
|
-
|
106
|
82
|
634
|
851
|
(1,066)
|
1,947
|
2,489
|
4,436
|
|
Profit for the
year
|
-
|
-
|
-
|
-
|
-
|
-
|
-
|
-
|
-
|
(250)
|
(250)
|
425
|
175
|
|
Other comprehensive
loss for the year
|
-
|
-
|
-
|
-
|
-
|
-
|
-
|
-
|
(191)
|
-
|
(191)
|
(249)
|
(440)
|
|
Total
comprehensive (loss) / income for the year
|
-
|
-
|
-
|
-
|
-
|
-
|
-
|
-
|
(191)
|
(250)
|
(441)
|
176
|
(265)
|
|
As
provided by Ordinary Shareholders’ Meeting held on November
14, 2014:
|
|
|
|
|
|
|
|
|
|
|
|
|
|
|
- Share
distribution
|
6
|
(6)
|
-
|
-
|
-
|
-
|
-
|
-
|
-
|
-
|
-
|
-
|
-
|
|
- Share
premium
|
|
|
|
(221)
|
-
|
-
|
-
|
-
|
-
|
221
|
-
|
-
|
-
|
|
- Legal
reserve
|
-
|
-
|
-
|
-
|
-
|
-
|
(82)
|
-
|
-
|
82
|
-
|
-
|
-
|
|
- Reserve for new
developments
|
-
|
-
|
-
|
-
|
-
|
-
|
-
|
-
|
(17)
|
17
|
-
|
-
|
-
|
|
- Other
reserves
|
-
|
-
|
-
|
-
|
-
|
-
|
-
|
(634)
|
-
|
634
|
-
|
-
|
-
|
|
- Reserve for
repurchase of shares
|
-
|
-
|
-
|
-
|
-
|
-
|
-
|
-
|
(113)
|
113
|
-
|
-
|
-
|
|
- Exercise of
warrants
|
-
|
-
|
-
|
1
|
-
|
-
|
-
|
-
|
-
|
-
|
1
|
-
|
1
|
|
Cash
dividends
|
-
|
-
|
-
|
-
|
-
|
-
|
-
|
-
|
-
|
-
|
-
|
(137)
|
(137)
|
|
Capital
reduction
|
-
|
-
|
-
|
-
|
-
|
-
|
-
|
-
|
-
|
-
|
-
|
(228)
|
(228)
|
|
Reserve for
share-based compensation
|
-
|
-
|
-
|
-
|
-
|
-
|
-
|
-
|
28
|
-
|
28
|
8
|
36
|
|
Acquisition of
treasury shares
|
(3)
|
3
|
-
|
-
|
-
|
-
|
-
|
-
|
(32)
|
-
|
(32)
|
-
|
(32)
|
|
Maturity of share
warrants
|
-
|
-
|
-
|
106
|
-
|
(106)
|
-
|
-
|
-
|
-
|
-
|
-
|
-
|
|
Equity incentive
plan granted
|
1
|
(1)
|
-
|
-
|
13
|
-
|
-
|
-
|
(16)
|
3
|
-
|
-
|
-
|
|
Transaction with
non-controlling interest
|
-
|
-
|
-
|
-
|
-
|
-
|
-
|
-
|
69
|
-
|
69
|
5
|
74
|
|
Reimbursement of
expired dividends
|
-
|
-
|
-
|
-
|
-
|
-
|
-
|
-
|
-
|
1
|
1
|
-
|
1
|
|
Capital
contribution from non-controlling interest
|
-
|
-
|
-
|
-
|
-
|
-
|
-
|
-
|
-
|
-
|
-
|
17
|
17
|
|
Balances
as of June 30, 2015
|
495
|
7
|
65
|
659
|
13
|
-
|
-
|
-
|
579
|
(245)
|
1,573
|
2,330
|
3,903
|
(i)
Includes Ps. 1 and
Ps. 1 of inflation adjustment of Treasury Shares as of June 31,
2015 and June 30, 2014, respectively.
The
accompanying notes are an integral part of these Consolidated
Financial Statements.
F- 7
Cresud Sociedad Anónima,
Comercial, Inmobiliaria, Financiera y Agropecuaria
Consolidated
Statements of Changes in Shareholders’ Equity
for
the fiscal years ended June 30, 2016, 2015 and 2014
(All amounts in
millions of Argentine Pesos, except otherwise
indicated)
|
|
Attributable
to equity holders of the parent
|
|
|
|||||||||
|
|
Share
capital
|
Treasury
shares
|
Inflation
adjustment
of
share capital and treasury shares (i)
|
Share
premium
|
Share
warrants
|
Legal
reserve
|
Special
reserve (1)
|
Other
reserves
(Note
27)
|
Accumulated
Deficit
|
Subtotal
|
Non-controlling
interest
|
Total
Shareholders’ equity
|
|
Balances
as of June 30,
2013
|
497
|
5
|
65
|
773
|
106
|
47
|
696
|
326
|
(27)
|
2,488
|
2,231
|
4,719
|
|
Loss for the
year
|
-
|
-
|
-
|
-
|
-
|
-
|
-
|
-
|
(1,068)
|
(1,068)
|
(341)
|
(1,409)
|
|
Other comprehensive
income for the
year
|
-
|
-
|
-
|
-
|
-
|
-
|
-
|
631
|
-
|
631
|
637
|
1,268
|
|
Total
comprehensive income / (loss) for the year
|
-
|
-
|
-
|
-
|
-
|
-
|
-
|
631
|
(1,068)
|
(437)
|
296
|
(141)
|
|
As
provided by Ordinary Shareholders´ Meeting held on October 31,
2013:
|
|
|
|
|
|
|
|
|
|
|
|
|
|
- Legal
reserve
|
-
|
-
|
-
|
-
|
-
|
35
|
(35)
|
-
|
-
|
-
|
-
|
-
|
|
- Other
reserves
|
-
|
-
|
-
|
-
|
-
|
-
|
(27)
|
-
|
27
|
-
|
-
|
-
|
|
- Cash
dividends
|
-
|
-
|
-
|
-
|
-
|
-
|
-
|
(120)
|
-
|
(120)
|
(134)
|
(254)
|
|
Reserve for
share-based
compensation
|
-
|
-
|
-
|
-
|
-
|
-
|
-
|
63
|
-
|
63
|
16
|
79
|
|
Transaction with
non-controlling
interest
|
-
|
-
|
-
|
-
|
-
|
-
|
-
|
7
|
-
|
7
|
84
|
91
|
|
Acquisition of
treasury
shares
|
(6)
|
6
|
-
|
-
|
-
|
-
|
-
|
(55)
|
-
|
(55)
|
-
|
(55)
|
|
Cancellation of
Brasilagro
warrants
|
-
|
-
|
-
|
-
|
-
|
-
|
-
|
(1)
|
-
|
(1)
|
-
|
(1)
|
|
Capital
reduction
|
-
|
-
|
-
|
-
|
-
|
-
|
-
|
-
|
-
|
-
|
(4)
|
(4)
|
|
Release of Reserve
for new developments resolved by Ordinary Shareholders’
Meeting held on April 11, 2014
|
-
|
-
|
-
|
-
|
-
|
-
|
-
|
-
|
-
|
-
|
-
|
-
|
|
Reimbursement
expired
dividends
|
-
|
-
|
-
|
-
|
-
|
-
|
-
|
-
|
2
|
2
|
-
|
2
|
|
Balances
as of June 30,
2014
|
491
|
11
|
65
|
773
|
106
|
82
|
634
|
851
|
(1,066)
|
1,947
|
2,489
|
4,436
|
(i)
Includes Ps. 1 and
Ps. 1 of inflation adjustment of Treasury Shares as of June 30,
2014 and June 30, 2013, respectively.
The
accompanying notes are an integral part of these Consolidated
Financial Statements.
F- 8
Cresud Sociedad Anónima,
Comercial, Inmobiliaria, Financiera y Agropecuaria
for
the fiscal years ended June 30, 2016, 2015 and 2014
(All amounts in
millions of Argentine Pesos, except otherwise
indicated)
|
|
Note
|
06.30.16
|
|
06.30.15
|
|
06.30.14
|
|
Operating
activities:
|
|
|
|
|
|
|
|
Cash generated from
operations
|
20
|
4,866
|
|
924
|
|
1,163
|
|
Income tax
paid
|
|
(811)
|
|
(430)
|
|
(280)
|
|
Net
cash generated from operating
activities
|
|
4,055
|
|
494
|
|
883
|
|
Investing
activities:
|
|
|
|
|
|
|
|
Cash incorporated
by business
combination
|
|
9,193
|
|
-
|
|
-
|
|
Acquisition of
interest in joint ventures and
associates
|
|
-
|
|
(1,242)
|
|
(1,132)
|
|
Capital
contributions to joint ventures and
associates
|
|
(207)
|
|
(126)
|
|
(60)
|
|
Sale of associates
and joint
ventures
|
|
9
|
|
-
|
|
-
|
|
Acquisition of
investment
properties
|
|
(888)
|
|
(250)
|
|
(272)
|
|
Sale of joint
ventures and
associates
|
|
-
|
|
56
|
|
23
|
|
Sale of investment
properties
|
|
1,394
|
|
2,447
|
|
402
|
|
Acquisition of
property, plant and equipment
|
|
(1,145)
|
|
(221)
|
|
(133)
|
|
Sale of property,
plant and equipment
|
|
3
|
|
12
|
|
1
|
|
Sale of
farmlands
|
|
-
|
|
316
|
|
126
|
|
Purchase of
properties
|
|
-
|
|
-
|
|
(6)
|
|
Acquisition of
intangible
assets
|
|
(137)
|
|
(10)
|
|
(15)
|
|
Acquisition of
investments in financial
instruments
|
|
(13,513)
|
|
(4,610)
|
|
(3,683)
|
|
Sale of investments
in financial
instruments
|
|
14,129
|
|
4,487
|
|
3,871
|
|
Loans granted to
joint ventures and
associates
|
|
(852)
|
|
-
|
|
(2)
|
|
Proceeds from loans
granted to joint ventures and
associates
|
|
80
|
|
10
|
|
2
|
|
Dividends
received
|
|
593
|
|
18
|
|
22
|
|
Suppliers
advances
|
|
(7)
|
|
(15)
|
|
(30)
|
|
Net
cash generated from (used in) investing
activities
|
|
8,652
|
|
872
|
|
(886)
|
|
Financing
activities:
|
|
|
|
|
|
|
|
Repurchase of
non-convertible
notes
|
|
(209)
|
|
(305)
|
|
(163)
|
|
Repurchase of
treasury
stock
|
|
-
|
|
(33)
|
|
(98)
|
|
Issuance of
non-convertible notes
|
|
8,012
|
|
693
|
|
1,052
|
|
Issuance of trust
debt titles
|
|
-
|
|
-
|
|
15
|
|
Repayment of
non-convertible
notes
|
|
(4,291)
|
|
(1,072)
|
|
(800)
|
|
Proceeds from
borrowings
|
|
7,187
|
|
1,498
|
|
793
|
|
Repayments of trust
debt
titles
|
|
-
|
|
(10)
|
|
(5)
|
|
Repayments of
seller financing of
shares
|
|
-
|
|
(106)
|
|
-
|
|
Repayment of
borrowings
|
|
(11,031)
|
|
(1,334)
|
|
(590)
|
|
Repayment of
borrowings to joint ventures and
associates
|
|
(6)
|
|
-
|
|
(2)
|
|
Proceeds from
exercise of options
granted
|
|
6
|
|
-
|
|
-
|
|
Proceeds of
borrowings from joint ventures and
associates
|
|
4
|
|
22
|
|
17
|
|
Cancellation of
Brasilagro
warrants
|
|
-
|
|
-
|
|
(1)
|
|
Repayments of
seller
financing
|
|
(72)
|
|
(3)
|
|
(1)
|
|
Acquisition of
non-controlling interest in
subsidiaries
|
|
(1,192)
|
|
(32)
|
|
(1)
|
|
Dividends
paid
|
|
(239)
|
|
(34)
|
|
(244)
|
|
Capital
distribution to non-controlling interest in
subsidiaries
|
|
(207)
|
|
(228)
|
|
(4)
|
|
Repayments of
derivative financial
instruments
|
|
(620)
|
|
(233)
|
|
(38)
|
|
Proceeds from
derivative financial
instruments
|
|
2,093
|
|
2
|
|
62
|
|
Receipts from
claims
|
|
90
|
|
-
|
|
-
|
|
Contributions from
non-controlling
interest
|
|
1
|
|
16
|
|
139
|
|
Sale of equity
interest in subsidiaries to non-controlling interest
|
|
86
|
|
182
|
|
-
|
|
Interest
paid
|
|
(4,107)
|
|
(799)
|
|
(577)
|
|
Net
cash used in financing
activities
|
|
(4,495)
|
|
(1,776)
|
|
(446)
|
|
Net
increase (decrease) in cash and cash
equivalents
|
|
8,212
|
|
(410)
|
|
(449)
|
|
Cash and cash
equivalents at beginning of
year
|
20
|
634
|
|
1,003
|
|
1,048
|
|
Foreign exchange
gain on cash and cash
equivalents
|
|
5,250
|
|
41
|
|
404
|
|
Cash
and cash equivalents at end of
year
|
20
|
14,096
|
|
634
|
|
1,003
|
The
accompanying notes are an integral part of these Consolidated
Financial Statements.
F- 9
Cresud Sociedad Anónima, Comercial, Inmobiliaria, Financiera y
Agropecuaria
Notes to the Consolidated Financial Statements
(Amounts in
millions of Argentine Pesos, except otherwise
indicated)
1.
The
Group’s business and general information
Cresud was founded
in 1936 as a subsidiary of Credit Foncier, a Belgian company
primarily engaged in providing rural and urban loans in Argentina
and administering real estate holdings foreclosed by Credit
Foncier. Credit Foncier was liquidated in 1959, and as part of such
liquidation, the shares of Cresud were distributed to Credit
Foncier’s shareholders. From the 1960s through the end of the
1970s, the business of Cresud shifted exclusively to agricultural
activities.
In 2002, Cresud
acquired a 19.85% interest in IRSA, a real estate company related
to certain shareholders of Cresud. In 2009, Cresud increased its
ownership percentage in IRSA to 55.64% and IRSA became
Cresud’s directly principal subsidiary.
Cresud and its
subsidiaries are collectively referred to hereinafter as the Group.
See Note 2.3. for a description of the Group’s
companies.
The Company is
domiciled in the Republic of Argentina. The address of its
registered office is Moreno 877, 23rd Floor, Buenos Aires,
Argentina.
IFISA is our parent
company and is a corporation established and domiciled in Uruguay
and IFIS Limited is the ultimate parent company of the
group.
The Board of
Directors has approved these Financial Statements for issue on
October 31, 2016.
As of June 30,
2016, the Group operates in two major lines of business: (i)
agricultural business and (ii) urban properties and investments
business, which is divided into two operations centers: (a)
Operations Center in Argentina and (b) Operations Center in Israel.
They are developed through several operating companies and the main
ones are listed below (Note 7):
F- 10
Cresud Sociedad Anónima, Comercial, Inmobiliaria, Financiera y
Agropecuaria
Notes to the Consolidated
Financial Statements
(Continued)
(Amounts
in millions of Argentine Pesos, except otherwise
indicated)
1.
The Group’s business and general
information
(Continued)
(i)
Remains in current
and non-current assets, as financial assets and other assets held
for sale (see Note 18).
(ii)
Corresponds to
Group’s joint ventures and associates, which are hence
excluded from consolidation.
F- 11
Cresud Sociedad Anónima, Comercial, Inmobiliaria, Financiera y
Agropecuaria
Notes to the Consolidated
Financial Statements
(Continued)
(Amounts
in millions of Argentine Pesos, except otherwise
indicated)
1.
The Group’s business and general
information
(Continued)
Agricultural business
Within the
agricultural business, the Group, through Cresud, engaged in the
operation of crop production, cattle feeding, raising, fattening
and slaughtering, milk production, sugarcane production, brokerage
activities and sale of supplies. The Group currently has
agricultural operations and investments in Argentina, Brazil,
Uruguay, Paraguay and Bolivia.
Cresud's shares are
listed on the Buenos Aires Stock Exchange ("BCBA", as per its
Spanish acronym) and in NASDAQ (National Association of Securities
Dealers Automated Quotation). Brasilagro’s shares are listed
and traded on both the Novo Mercado del BOVESPA and the
NYSE.
Urban Properties and Investments business
Operations
Center in Argentina
The activities of
the operations center in Argentina are mainly developed through
IRSA and IRSA’s principal subsidiary, IRSA CP. Through IRSA
and IRSA CP, the Group owns, manages and develops 16 shopping
centers across Argentina, a portfolio of office and other rental
properties in the Autonomous City of Buenos Aires, capital of
Argentina, and since 2009 it entered into the United States of
America (“USA”) real estate market, mainly through the
acquisition of non-controlling interests in office buildings and
hotels. Through IRSA and IRSA CP, the Group also develops
residential properties for sale. The Group, through IRSA, is also
involved in the operation of branded hotels. The Group uses the
term “real estate” indistinctively in these Financial
Statements to denote investment, development and/or trading
properties activities. IRSA CP's shares are listed and traded both
on the BASE (Merval: IRCP) and the NASDAQ (NASDAQ: IRCP). IRSA's
shares are listed both on the BASE (NASDAQ: IRSA) and the NYSE
(NYSE: IRS).
The activities of
the Group’s segment “Financial operations and
others” is carried out mainly through BHSA, where we have a
29.91% interest (without considering treasury shares). BHSA is a
commercial bank offering a wide variety of banking activities and
related financial services to individuals, small, medium-sized and
large corporations, including the provision of mortgaged loans.
BHSA’s shares are listed on the BCBA. Additionally, the Group
has a 42.81% indirect equityinterest in Tarshop whose main
activities are credit card and loan origination
transactions.
F- 12
Cresud Sociedad Anónima, Comercial, Inmobiliaria, Financiera y
Agropecuaria
Notes to the Consolidated
Financial Statements
(Continued)
(Amounts
in millions of Argentine Pesos, except otherwise
indicated)
1.
The Group’s business and general
information
(Continued)
Operations
Center in Israel
During the fiscal
year ended June 30, 2014, the Group made an investment in the
Israeli market, through DFL and DN B.V., in IDBD -an Israeli
company-, with an initial interest of 26.65%. IDBD is one of the
Israeli largest and most diversified conglomerates, which is
involved, through its subsidiaries and other investments, in
several markets and industries, including real estate, retail,
agribusiness, insurance, telecommunications, etc.; controlling or
equity interest in companies such as Clal (Insurance Company),
Cellcom (Telecommunications), Adama (Agrochemicals), Shufersal
(Supermarkets), PBC (Real Estate), among others. IDBD traded its
shares in TASE between May 2014 and March 2016. To date, it is only
listed as a “Debentures Company” under the Israeli law,
because some of its bonds are trading.
On October 11,
2015, the Group gained effective control over IDBD (Note 3). As a
result, the Group has consolidated significant figures of several
industries from IDBD and its subsidiaries.
IDBD has diverse
debts containing certain covenants which have been successively
negotiated, resulting in several waivers actually expiring in
December 2016. IDBD estimates that if the original covenants of
such loans were to become effective again, it would not be able to
honor them. Non-compliance could have the effect of creditors
requiring immediate repayment of the debt.
As a holding
company, IDBD’s main sources of funds derive from the
dividends distributed by its subsidiaries, which have experienced a
reduction in recent years. Yet, there are restrictions as to the
payment of dividends based on the indebtedness level in some
subsidiaries. IDBD has projected future cash flows and expects to
have the required liquidity to meet its commitments by issuing new
debt in Israel, selling financial assets including Clal and
dividend payouts by Clal. IDBD could also secure additional
financing through the private issuance of equity
securities.
On December 2013,
it was published in the Official Gazette of Israel the Promotion of
Competition and Reduction of Concentration The Law, 5774-2013
(“the Concentration Law”). This law has material
implications for IDBD and its investments, including the disposal
of the controlling interest in Clal, a potential delisting of IDBD
or DIC so as to no longer trade its shares publicly or a merger
between IDBD and DIC.
F- 13
Cresud Sociedad Anónima, Comercial, Inmobiliaria, Financiera y
Agropecuaria
Notes to the Consolidated
Financial Statements
(Continued)
(Amounts
in millions of Argentine Pesos, except otherwise
indicated)
1.
The Group’s business and general
information
(Continued)
All factors
mentioned above, mainly (i) IDBD’s current financial position
and need of financing to honor its financial debt and other
commitments, (ii) the renegotiation underway with financial
creditors, and (iii) the term set by Israel’s governmental
authorities to sell the equity interest in Clal and the potential
effects of such sale, in particular, on its market value, raise
significant uncertainties as to IDBD’s capacity to continue
as a going-concern. These financial statements do not include the
adjustments or reclassifications related to the valuation of
IDBD’s assets and liabilities that would be required if IDBD
were not able to continue as a going-concern.
The Group is and
will continue working to address the uncertainties described
above.
The
Group
The financial
position of IDBD and its subsidiaries at the operations center in
Israel does not affect the financial position of Cresud and its
subsidiaries at the operations center in Argentina.
Cresud and its
subsidiaries are not facing financial constraints and are compliant
with their financial commitments. In addition, the commitments and
other covenants resulting from IDBD´s debt do not have impact
on Cresud since such debt has no recourse against Cresud and it is
not granted by Cresud’s assets.
There are no
significant uncertainties as to the capacity of the Group, as a
whole, to operate as a going-concern perspective, with such
uncertainties being limited to the operation center in
Israel.
2.
Summary
of significant accounting policies
2.1.
Basis
of preparation of the Financial Statements
(i)
Basis of preparation
These Consolidated
Financial Statements have been prepared in accordance with IFRS
issued by IASB and IFRIC (known before as the Standards
Interpretation Committee “SIC”). All IFRS applicable as
of the date of these consolidated financial statements have been
applied.
Under IAS 29
“Financial Reporting in Hyperinflationary Economies”,
the financial statements of an entity whose functional currency
belongs to a hyperinflationary economy, regardless of whether they
apply historic cost or current cost methods, should be stated at
the current unit of measure as of the date of this consolidated
financial statements. For such purpose, in general, inflation is to
be computed in non-monetary items from the acquisition or
revaluation date, as applicable. In order to determine
whether an economy is to be considered hyperinflationary, the
standard lists a set of factors to be taken into account, including
an accumulated inflation rate near or above 100% over a three years
period.
F- 14
Cresud Sociedad Anónima, Comercial, Inmobiliaria, Financiera y
Agropecuaria
Notes to the Consolidated
Financial Statements
(Continued)
(Amounts
in millions of Argentine Pesos, except otherwise
indicated)
2.
Summary of significant accounting
policies
(Continued)
As of June 30,
2016, it is not possible to compute the accumulated inflation rate
for the three years period ending on that date based on the
official statistics of the INDEC (Argentina Statistics Office),
because in October 2015, the INDEC ceased to compute the Wholesale
Domestic Price Index (IPIM, as per its Spanish acronym), and
started to compute it again as from January 2016.
As of the date of
this consolidated financial statements, the Argentine peso does not
meet the conditions to be treated as the currency of a
hyperinflationary economy, pursuant to the guidelines set forth by
IAS 29. Therefore, these consolidated financial statements have not
been restated in constant currency.
However, over the
last years, certain macroeconomic variables affecting the
agricultural business and the urban properties and investment
business of the operations center Argentina, such as payroll costs,
input prices and service rates, have experienced significant annual
changes. This factor should be taken into consideration in
assessing and interpreting the financial situation and results of
operations of the Group in these consolidated financial
statements.
On October 11,
2015, the Group took over IDBD. IDBD’s fiscal year ends on
December 31 each year and the Group’s fiscal year ends on
June 30. IDBD’s quarterly and annual reporting follows the
guidelines of Israeli standards, which means that the information
is only available after the applicable statutory terms in
Argentina. Therefore, the Group is not able to include IDBD’s
quarterly results in its consolidated financial statements to be
filed with the CNV within the applicable statutory terms in
Argentina. The Group has started to consolidate IDBD’s
results of operations with a three-month lag, adjusted for the
effects of material transactions that may have taken place during
the reported period. Hence, IDBD’s results of operations for
the period beginning on October 11, 2015 (the acquisition date)
through March 31, 2016 are included in the Group’s
consolidated statement of comprehensive income for the fiscal year
ended June 30, 2016, adjusted by such material transactions
occurred between April 1 and June 30, 2016.
Given the
materiality of IDBD’s figures incorporated, the Group had to
change the format of its financial statements for the ease of
reading and analysis. The most significant change is in line with
the new organizational structure, which is split into two large
operations center, agricultural and urban properties and
investments business, the last one divided into Argentina and
Israel. In this regard, changes have been made to the notes and
tables and their respective order, classification and content in
the financial statements, on a geographic basis and taking into
consideration the significance of the Group's global operations
following IDBD's consolidation.
F- 15
Cresud Sociedad Anónima, Comercial, Inmobiliaria, Financiera y
Agropecuaria
Notes to the Consolidated
Financial Statements
(Continued)
(Amounts
in millions of Argentine Pesos, except otherwise
indicated)
2.
Summary of significant accounting
policies
(Continued)
(ii)
Current and non-current classification
The Group presents
current and non-current assets, and current and non-current
liabilities, as separate classifications in its statement of
financial position according to the operating cycle of each
activity.
Current assets and
current liabilities include assets and liabilities that are either
realized or settled within 12 months from the end of the fiscal
year.
All other assets
and liabilities are classified as non-current assets or non-current
liabilities. Current and deferred tax assets and liabilities
(income tax payable) are presented separately from each other and
from other assets and liabilities as current and non-current,
respectively.
(iii)
Presentation currency
The consolidated
financial statements are presented in millions of Argentine Pesos.
Unless otherwise stated or the context otherwise requires,
references to ‘Peso amounts’ or ‘Ps.’, are
of Argentine Pesos, references to ‘US$’ or ‘US
dollars’ are of United States dollars, references to
‘Rs.’ are of Brazilian Reais and references to "NIS"
are of New Israeli Shekel.
(iv)
Fiscal year-end
The fiscal year
begins on July 1 and ends on June 30 of the following
year.
(v)
Accounting criteria
The consolidated
financial statements have been prepared under the historical cost
criteria, as modified by financial assets and financial liabilities
(including derivative instruments) at fair value through profit or
loss, share-based payments at fair value, biological assets and
agricultural produce at the point of harvest measured at fair value
less costs to sell, and agricultural produce after harvest measured
at net realizable value and financial assets and other assets held
for sale and share-based compensation at fair value.
(vi)
Reporting cash flows
The Group reports
cash flows from operating activities using the indirect method.
Interest paid is presented within financing cash flows. Interest
received is presented within investing activities. The acquisitions
and disposals of investment properties are disclosed as cash flows
from investing activities as this most appropriately reflects the
Group’s business activities. Cash flows in respect to trading
properties are disclosed as cash flows from operating activities
because these items are routinely sold in the ordinary course of
business.
F- 16
Cresud Sociedad Anónima, Comercial, Inmobiliaria, Financiera y
Agropecuaria
Notes to the Consolidated
Financial Statements
(Continued)
(Amounts
in millions of Argentine Pesos, except otherwise
indicated)
2.
Summary of significant accounting
policies
(Continued)
(vii)
Use of estimates
The preparation of
consolidated financial statements at a certain date requires the
making estimates and evaluations affecting the amount of assets and
liabilities recorded and contingent assets and liabilities
disclosed at such date, as well as income and expenses recorded
during the year. Actual results might differ from the estimates and
evaluations made at the date of preparation of these financial
statements. The most significant judgments made by Management in
applying the Group’s accounting policies and the major
estimations and significant judgments are described in Note
5.
2.2.
New
accounting standards
The following
standards, amendments and interpretations have been published by
the IASB and by the IFRIC. Below we outline the standards,
amendments and interpretations that may potentially have an impact
on the Group at the time of application.
IFRS 16 "Leases".
Will supersede IAS 17
currently in force (and associated interpretations) and its scope
includes all leases, with a few specific exceptions. Under the new
standard, lessees are required to account for leases under one
single model in the balance sheet that is similar to the one used
to account for financial leases under IAS 17. There are two
exceptions to this rule: to recognize the lease of low-cost assets
(for example, personal computers) and short-term leases (for
instance, leases for a 12 months or shorter term). As regards the
lease commencement date, the lessee shall recognize the obligation
to make rental payments (for instance, leases payable) and an asset
that represents the right to use the leased asset during the term
of the lease agreement (rights of use). There is almost no changes
to lessor accounting. Become effective for the fiscal year
beginning on January 1, 2019, that is, fiscal year ended on June
30, 2020 for the Group. It may be applied earlier provided IFRS 15
is also adopted. The Group is currently assessing the potential
impact of the amendments on its financial statements.
Amendments to IAS 7 "Disclosure
initiative".
Amendments provide that the entity shall
disclose information so that users of the financial statements may
assess the changes in liabilities resulting from financing
activities, including both cash-flow and non-cash-flow derivatives.
Become effective for the fiscal year beginning on January 1, 2017,
that is, fiscal year ended on June 30, 2018 for the Group.
Comparative information for prior fiscal years is not mandatory.
Earlier adoption is permitted. The Group is currently assessing the
potential impact of the amendments on its financial
statements.
Amendments to IAS 12 "Recognition of deferred
tax assets for unrealized losses".
The amendments clarify
the accounting of deferred income tax assets in the case of
unrealized losses on instruments measured at fair value. Become
effective for the fiscal year beginning on January 1, 2017, that
is, fiscal year ended on June 30, 2018 for the Group. Earlier
adoption is permitted. The Group is currently assessing the
potential impact of the amendments on its financial
statements.
F- 17
Cresud Sociedad Anónima, Comercial, Inmobiliaria, Financiera y
Agropecuaria
Notes to the Consolidated
Financial Statements
(Continued)
(Amounts
in millions of Argentine Pesos, except otherwise
indicated)
2.
Summary of significant accounting
policies
(Continued)
Amendments to IAS 1 "Presentation of financial
statements".
Amendments establish guidance on grouping
significant items, provides for the disclosure of relevant
information for certain items and disclosures that are to be
included in relation to accounting policies adopted by each entity
and other additional disclosures in financial statements. Become
effective for the fiscal year beginning on January 1, 2016, that
is, fiscal year ended on June 30, 2017 for the Group. Earlier
adoption is permitted. The Group is currently assessing the
potential impact of the amendments on its financial
statements.
Cycle of annual improvements 2014. IFRS 5
“Non-current Assets Held for Sale and Discontinued
Operations”:
A new classification category has been
established for these assets and the amendment adds guidance on how
to treat changes to disposal plans for those assets classified as
held for sale. Become effective for the fiscal year beginning on
January 1, 2016, that is, fiscal year ended on June 30, 2017 for
the Group. The Group is currently assessing the potential impact of
the amendments on its financial statements.
Cycle of annual improvements 2014. IFRS 7
“Financial Instruments: Disclosures”:
It
clarifies that amendments established in December, 2011 on
offsetting financial assets and liabilities, and amendments
established in September, 2014 will be of retroactive application
to annual fiscal years as from January 1, 2013, in the first case,
and January 1, 2016 in the second case. In addition, it sets forth
the specific disclosure requirements related to servicing contracts
related to financial assets transferred. Become effective for the
fiscal year beginning on January 1, 2016, that is, fiscal year
ended on June 30, 2017 for the Group. The Group is currently
assessing the potential impact of the amendments on its financial
statements.
IAS 27 Revised “Separate Financial
Statements”.
On August 12, 2014 the IASB has released
an amendment to IAS 27 “Equity method in Separate Financial
Statements”. The amendment reinstates the equity method as an
option to account for investments in subsidiaries, joint ventures
and associates in separate financial statements. Amendments become
effective for the fiscal year beginning January 1, 2016, that is,
fiscal year ended June 30, 2017 for the Group. It may be applied
earlier. The Group is currently assessing the potential impact of
the amendments on its financial statements.
IFRS 9 “Financial
Instruments”.
It adds a new impairment model based on
expected losses and introduces some minor amendments to the
classification and measurement of financial assets. Additionally,
this amendment to IFRS 9 includes the new general hedge accounting
model, allow adoption of the treatment of fair value changes due to
own credit on liabilities designated at fair value through profit
or loss. The new standard replaces all previous versions of IFRS 9
and becomes effective for fiscal years starting on or after January
1, 2018, this is, for financial statements ended on June 30, 2019
for the Group. The Group is currently assessing the potential
impact of the amendments on its financial statements.
F- 18
Cresud Sociedad Anónima, Comercial, Inmobiliaria, Financiera y
Agropecuaria
Notes to the Consolidated
Financial Statements
(Continued)
(Amounts
in millions of Argentine Pesos, except otherwise
indicated)
2.
Summary of significant accounting
policies
(Continued)
IFRS 15 “Revenue from contracts with
customers”.
Replaces IAS 11 “Construction
contracts”, IAS 18 “Revenue”, IFRIC 13
“Customer loyalty programs”, IFRIC 15 “Agreements
for the construction of real estate”, IFRIC 18
“Transfer of assets from customers” and SIC-31
“Revenue – Barter transactions involving advertising
services”. Provides the new revenue recognition model derived
from contracts with customers. The core principle underlying the
model is satisfaction of obligations assumed with customers.
Applies to all contracts with customers, other than those covered
by other IFRSs, such as leases insurance and financial instruments
contracts. The standard does not address recognition of interest or
dividend income. IFRS 15 becomes effective for all fiscal years
beginning as from January 1, 2018, that is, for financial
statements ended on June 30, 2019 and may be adopted earlier.
Application is retroactive. As of the date of these consolidated
financial statements, the Group is assessing the impact that this
standard shall have on its financial position and the results of
operations.
Amendments to IAS
16
“Property, plant and
equipment” and IAS 38 “Intangible assets”.
The amendments provide further guidance on the calculation of
depreciation and amortization. Become effective for fiscal years
beginning on or after January 1, 2016, that is, fiscal year ended
June 30, 2017 for the Group. It may be applied earlier. The Group
is currently assessing the potential impact of the amendments on
its financial statements.
Modification to IFRS 11 “Joint
Arrangements”.
The amendments clarify accounting for
acquisitions where the business involves joint operations.
Amendments become effective for fiscal years beginning on or after
January 1, 2016, that is, fiscal year ended June 30, 2017 for the
Group. It may be applied earlier. The Group is currently assessing
the potential impact of the amendments on its financial
statements.
Amendments
to IAS 16 “Property, Plant and Equipment” and IAS 41
“Agriculture”
On June, 2014 the
International Accounting Standards Board issued the amendments to
IAS 16 “Property, Plant and Equipment” and to IAS 41
“Agriculture” whereby the bearer plant concept is
defined and bearer plants become part of the scope of IAS 16. A
bearer plant is defined as a living plant that is used in the
production or supply of agricultural produce, is expected to bear
produce for more than one period and has a remote likelihood of
being sold as agricultural produce, except for incidental scrap
sales. Before, bearer plants were not defined and those related to
agricultural production were covered by IAS 41.
Bearer plants are
solely used to develop produce. The only significant future
economic benefits derived from bearer plants result from the sale
of the agricultural produce they generate.
Bearer plants meet
the definition of property, plant and equipment of IAS 16 and their
operation is similar to that of manufacturing. As a result,
amendments require that bearer plants be accounted for as property,
plant and equipment and covered by IAS 16, rather than IAS 41. The
produce growing on bearer plants will continue to be governed by
IAS 41.
F- 19
Cresud Sociedad Anónima, Comercial, Inmobiliaria, Financiera y
Agropecuaria
Notes to the Consolidated
Financial Statements
(Continued)
(Amounts
in millions of Argentine Pesos, except otherwise
indicated)
2.
Summary of significant accounting
policies
(Continued)
Amendments become
effective for the fiscal year beginning January 1, 2016, that is,
fiscal year ended June 30, 2017 for the Group.
Group's sugarcane
fields are recognized as bearer plants under the new definition
included in IAS 41. Under IAS 8, modifications are to be applied
retrospectively; therefore, the sugar cane field will be
reclassified under “Property, plant and equipment” and
valued at depreciated cost and depreciated over its useful life
under the balance declining method based on the expected yield as
from June 30, 2016, with comparative balances being revised
retrospectively.
However, the
agricultural production growing in sugar cane field will remain
under “Biological assets” and will continue to be
valued at fair value minus selling costs.
These amendments
will imply changes in accounting policies and will have the
following impact on the financial situation and results of
operations of the Group, already recognized in the financial
statements as of June 30, 2016, 2015 and 2014:
|
Income
statement (summary)
|
|
June
30,
2016
(Published)
|
Increase
/ (Decrease)
|
June
30,
2016
(Adjusted)
|
June
30,
2015
(Published)
|
Increase
/ (Decrease)
|
June
30,
2015
(Adjusted)
|
June
30,
2014
(Published)
|
Increase
/ (Decrease)
|
June
30,
2014
(Adjusted)
|
|
Costs
|
|
(26,090)
|
(240)
|
(26,330)
|
(4,770)
|
(165)
|
(4,935)
|
(3,913)
|
(114)
|
(4,027)
|
|
Initial recognition
and changes in the fair value of biological assets and agricultural
produce at the point of harvest
|
|
1,660
|
108
|
1,768
|
1,324
|
95
|
1,419
|
1,152
|
48
|
1,200
|
|
Income tax
expense
|
|
197
|
6
|
203
|
(303)
|
(5)
|
(308)
|
389
|
(4)
|
385
|
|
(Loss)
/ Profit for the year
|
|
(1,891)
|
(126)
|
(2,017)
|
175
|
(75)
|
100
|
(1,409)
|
(70)
|
(1,479)
|
|
Attributable
to:
|
|
|
|
|
|
|
|
|
|
|
|
Equity holders of
the parent
|
|
(1,038)
|
(85)
|
(1,123)
|
(250)
|
(57)
|
(307)
|
(1,068)
|
(54)
|
(1,122)
|
|
Non-controlling
interests
|
|
(853)
|
(41)
|
(894)
|
425
|
(18)
|
407
|
(341)
|
(16)
|
(357)
|
|
(Loss)
/ Profit per share attributable to equity holders of the parent
during the year:
|
|
|
|
|
|
|
|
|
|
|
|
Basic
|
|
(3.82)
|
-
|
(3.82)
|
(0.36)
|
-
|
(0.36)
|
(2.15)
|
-
|
(2.15)
|
|
Diluted
|
|
(3.82)
|
-
|
(3.82)
|
(0.36)
|
-
|
(0.36)
|
(2.15)
|
-
|
(2.15)
|
F- 20
Cresud Sociedad Anónima, Comercial, Inmobiliaria, Financiera y
Agropecuaria
Notes to the Consolidated
Financial Statements
(Continued)
(Amounts
in millions of Argentine Pesos, except otherwise
indicated)
2.
Summary of significant accounting
policies
(Continued)
|
Statements
of financial position (summary)
|
|
June
30,
2016
(Published)
|
Increase
/ (Decrease)
|
June
30,
2016
(Adjusted)
|
June
30,
2015
(Published)
|
Increase
/ (Decrease)
|
June
30,
2015
(Adjusted)
|
|
Biological
assets
|
|
1,132
|
(20)
|
1,112
|
579
|
(18)
|
561
|
|
Property, plant and
equipment
|
|
26,300
|
549
|
26,849
|
1,977
|
348
|
2,325
|
|
Deferred income tax
assets
|
|
2,199
|
47
|
2,246
|
684
|
19
|
703
|
|
Total
Assets
|
|
45,121
|
576
|
45,697
|
15,276
|
349
|
15,625
|
|
Retained
earnings
|
|
(1,390)
|
21
|
(1,369)
|
(245)
|
44
|
(201)
|
|
Cumulative
translation adjustment
|
|
807
|
235
|
1,042
|
443
|
87
|
530
|
|
Total
Shareholders’ Equity
|
|
15,232
|
256
|
15,488
|
3,903
|
131
|
4,034
|
On the issue date
of these financial statements there are no other standards,
amendments and interpretations issued by the IASB and IFRIC that
are yet to become effective and that are expected to have a
material effect on the Group.
2.3.
Scope
of consolidation
(a)
Subsidiaries
Subsidiaries are
all entities (including structured entities) over which the Group
has control. The Group controls an entity when the Group is exposed
to, or has rights to, variable returns from its involvement with
the entity and has the ability to affect those returns through its
power over the entity. The Group also analyzes whether there is
control when it does not hold more than 50% of the voting rights of
an entity, but does have capacity to define its relevant activities
because of de-facto control.
The Group uses the
acquisition method of accounting to account for business
combinations The consideration transferred for the acquisition of a
subsidiary is the fair value of the assets transferred, the
liabilities incurred and the equity interests issued by the Group.
Acquisition costs are expensed as incurred. Identifiable assets
acquired and liabilities and contingent liabilities assumed in a
business combination are measured initially at their fair values at
the acquisition date.
The Group
recognizes any non-controlling interest in the acquire on an
acquisition-by-acquisition basis either at fair value or at the
non-controlling interest’s proportionate share of the
acquire’s net assets. The Group chooses the method to be used
on a case by case base.
The excess of the
sum of the consideration transferred, the amount of any
non-controlling interest in the acquire and the acquisition-date
fair value of any previous equity interest in the acquire over the
fair value of the identifiable net assets acquired is recorded as
goodwill. If the total of consideration transferred,
non-controlling interest recognized and previously held interest
measured is less than the fair value of the net assets of the
subsidiary acquired in the case of a bargain purchase, the
difference is recognized directly in the statements of income as
“Bargain purchases gains”.
F- 21
Cresud Sociedad Anónima, Comercial, Inmobiliaria, Financiera y
Agropecuaria
Notes to the Consolidated
Financial Statements
(Continued)
(Amounts
in millions of Argentine Pesos, except otherwise
indicated)
2.
Summary of significant accounting
policies
(Continued)
The Group conducts
its business through several operating and investment companies,
the principal companies are listed below:
Agricultural
business
|
|
|
|
June 30, 2016
|
June 30, 2015
|
June 30, 2014
|
|||
|
Name of the entity
|
Country
|
Main
activity
|
% of ownership interest held
by the Group (6)
|
% of ownership interest held
by the NCI
|
% of ownership interest held
by the Group (6)
|
% of ownership interest held
by the NCI
|
% of ownership interest held
by the Group (6)
|
% of ownership interest held
by the NCI
|
|
Direct equity interest:
|
|
|
|
|
|
|
|
|
|
Brasilagro-Companhia
Brasileira de Propiedades Agrícolas (1)
|
Brazil
|
Agricultural
|
42.18%
|
57.82%
|
39.76%
|
60.23%
|
39.63%
|
60.37%
|
|
Cactus
Argentina S.A. (2)
|
Argentina
|
Agro-industrial
|
-
|
-
|
-
|
-
|
97.13%
|
-
|
|
Sociedad
Anónima Carnes Pampeanas S.A.
|
Argentina
|
Agro-industrial
|
95.00%
|
5.00%
|
95.00%
|
-
|
39.38%
|
-
|
|
Futuros
y Opciones.Com S.A.
|
Argentina
|
Brokerage
|
59.59%
|
40.41%
|
59.59%
|
40.41%
|
59.59%
|
40.41%
|
|
FyO
Trading S.A.
|
Argentina
|
Brokerage
|
2.20%
|
97.80%
|
-
|
-
|
-
|
-
|
|
Granos
Olavarría S.A.
|
Argentina
|
Warehousing
and brokerage
|
2.20%
|
97.80%
|
-
|
-
|
-
|
-
|
|
Helmir
S.A.
|
Uruguay
|
Investment
|
100.00%
|
-
|
100.00%
|
-
|
100.00%
|
-
|
|
IRSA
Inversiones y Representaciones Sociedad Anónima
|
Argentina
|
Real
Estate
|
63.38%
|
36.23%
|
63.91%
|
35.70%
|
64.56%
|
34.55%
|
|
Doneldon
S.A.
|
Uruguay
|
Investment
|
100.00%
|
-
|
100.00%
|
-
|
100.00%
|
-
|
|
Interest indirectly held through BrasilAgro:
|
|
|
|
|
|
|
|
|
|
Araucária
Ltda.
|
Brazil
|
Agricultural
|
99.99%
|
0.01%
|
39.63%
|
60.37%
|
39.63%
|
60.37%
|
|
Cajueiro
Ltda.
|
Brazil
|
Agricultural
|
99.99%
|
0.01%
|
39.63%
|
60.37%
|
39.63%
|
60.37%
|
|
Ceibo
Ltda.
|
Brazil
|
Agricultural
|
99.99%
|
0.01%
|
39.63%
|
60.37%
|
39.63%
|
60.37%
|
|
Cremaq
Ltda.
|
Brazil
|
Agricultural
|
99.99%
|
0.01%
|
39.63%
|
60.37%
|
39.63%
|
60.37%
|
|
Engenho
de Maracajú Ltda.
|
Brazil
|
Agricultural
|
99.99%
|
0.01%
|
39.63%
|
60.37%
|
39.63%
|
60.37%
|
|
Flamboyant
Ltda.
|
Brazil
|
Agricultural
|
99.99%
|
0.01%
|
39.63%
|
60.37%
|
39.63%
|
60.37%
|
|
Jaborandi
Agrícola Ltda.
|
Brazil
|
Agricultural
|
99.99%
|
0.01%
|
39.63%
|
60.37%
|
39.63%
|
60.37%
|
|
Jaborandi
Propriedades Agrícolas S.A.
|
Brazil
|
Agricultural
|
99.99%
|
0.01%
|
39.63%
|
60.37%
|
39.63%
|
60.37%
|
|
Mogno
Ltda.
|
Brazil
|
Agricultural
|
99.99%
|
0.01%
|
39.63%
|
60.37%
|
39.63%
|
60.37%
|
|
Interest indirectly held through Futuros y Opciones.Com.
S.A.:
|
|
|
|
|
|
|
|
|
|
FyO
Trading S.A.
|
Argentina
|
Brokerage
|
96.37%
|
3.63%
|
59.63%
|
40.37%
|
59.63%
|
40.37%
|
|
Granos
Olavarría S.A.
|
Argentina
|
Warehousing
and
brokerage
|
96.37%
|
3.63%
|
59.63%
|
40.37%
|
59.63%
|
40.37%
|
|
Interest indirectly held through Helmir S.A.:
|
|
|
|
|
|
|
|
|
|
IRSA
Inversiones y Representaciones Sociedad Anónima
|
Argentina
|
Real
Estate
|
0.39%
|
99.61%
|
0.39%
|
35.70%
|
-
|
-
|
|
Sociedad
Anónima Carnes Pampeanas S.A.
|
Argentina
|
Agro-industrial
|
5.00%
|
95.00%
|
-
|
5%
|
-
|
-
|
|
Cactus
Argentina S.A. (2)
|
Argentina
|
Agro-industrial
|
-
|
-
|
-
|
-
|
2.87%
|
-
|
|
Agropecuaria
Acres del Sud S.A.
|
Bolivia
|
Agricultural
|
39.76%
|
60.24%
|
39.76%
|
-
|
39.76%
|
-
|
|
Yatay
Agropecuaria S.A.
|
Bolivia
|
Agricultural
|
30.70%
|
69.30%
|
30.70%
|
-
|
30.70%
|
-
|
F- 22
Cresud Sociedad Anónima, Comercial, Inmobiliaria, Financiera y
Agropecuaria
Notes to the Consolidated
Financial Statements
(Continued)
(Amounts
in millions of Argentine Pesos, except otherwise
indicated)
2.
Summary of significant accounting
policies
(Continued)
|
|
|
|
June 30, 2016
|
June 30, 2015
|
June 30, 2014
|
|||
|
Name of the entity
|
Country
|
Main
activity
|
% of ownership interest held
by the Group (6)
|
% of ownership interest held
by the NCI
|
% of ownership interest held
by the Group (6)
|
% of ownership interest held
by the NCI
|
% of ownership interest held
by the Group (6)
|
% of ownership interest held
by the NCI
|
|
Interest indirectly held through Doneldon: S.A.:
|
|
|
|
|
|
|
|
|
|
Agropecuaria
Acres del Sud S.A.
|
Bolivia
|
Agricultural
|
60.24%
|
39.76%
|
59.24%
|
-
|
59.24%
|
-
|
|
Ombú
Agropecuaria S.A.
|
Bolivia
|
Agricultural
|
100.00%
|
-
|
100.00%
|
-
|
100.00%
|
-
|
|
Yatay
Agropecuaria S.A.
|
Bolivia
|
Agricultural
|
69.30%
|
30.70%
|
69.31%
|
-
|
69.31%
|
-
|
|
Yuchán
Agropecuaria S.A.
|
Bolivia
|
Agricultural
|
100.00%
|
-
|
100.00%
|
-
|
100.00%
|
-
|
|
Sedelor
S.A.
|
Uruguay
|
Investment
|
100.00%
|
-
|
100.00%
|
-
|
100.00%
|
-
|
|
Codalis
S.A.
|
Uruguay
|
Investment
|
100.00%
|
-
|
100.00%
|
-
|
100.00%
|
-
|
|
Alafox
S.A.
|
Uruguay
|
Investment
|
100.00%
|
-
|
100.00%
|
-
|
100.00%
|
-
|
Urban
properties and investments business
|
Interest
indirectly held through IRSA:
|
|
|
|
|
|
|
|
|
|
IRSA CP
(5)
|
Argentina
|
Real
Estate
|
60.33%
|
39.67%
|
62.00%
|
37.94%
|
63.18%
|
36.82%
|
|
E-Commerce Latina
S.A. (5)
|
Argentina
|
Investment
|
63.77%
|
36.23%
|
65.00%
|
35.22%
|
66.01%
|
33.99%
|
|
Efanur
S.A.
|
Uruguay
|
Investment
|
63.77%
|
36.23%
|
65.00%
|
35.22%
|
66.01%
|
33.99%
|
|
Hoteles Argentinos
S.A.
|
Argentina
|
Hotel
|
51.02%
|
48.98%
|
52.00%
|
48.18%
|
52.81%
|
47.19%
|
|
Inversora
Bolívar S.A.
|
Argentina
|
Investment
|
63.77%
|
36.23%
|
65.00%
|
35.22%
|
66.01%
|
33.99%
|
|
Llao Llao Resorts
S.A. (3)
|
Argentina
|
Hotel
|
31.89%
|
68.11%
|
32.00%
|
67.61%
|
33.01%
|
66.99%
|
|
Nuevas Fronteras
S.A.
|
Argentina
|
Hotel
|
48.68%
|
51.32%
|
49.00%
|
50.55%
|
50.39%
|
49.61%
|
|
Palermo Invest
S.A.
|
Argentina
|
Investment
|
63.77%
|
36.23%
|
65.00%
|
35.22%
|
66.01%
|
33.99%
|
|
Ritelco
S.A.
|
Uruguay
|
Investment
|
63.77%
|
36.23%
|
65.00%
|
35.22%
|
66.01%
|
33.99%
|
|
Tyrus
S.A.
|
Uruguay
|
Investment
|
63.77%
|
36.23%
|
65.00%
|
35.22%
|
66.01%
|
33.99%
|
|
Interest
indirectly held through IRSA CP:
|
|
|
|
|
|
|
|
|
|
Arcos del Gourmet
S.A.
|
Argentina
|
Real
Estate
|
57.40%
|
42.60%
|
56.00%
|
44.15%
|
56.86%
|
43.14%
|
|
Emprendimiento
Recoleta S.A.
|
Argentina
|
Real
Estate
|
34.24%
|
65.76%
|
33.00%
|
66.69%
|
33.91%
|
66.09%
|
|
Fibesa
S.A.
|
Argentina
|
Real
Estate
|
63.77%
|
36.23%
|
62.00%
|
37.94%
|
63.18%
|
36.82%
|
|
Panamerican Mall
S.A.
|
Argentina
|
Real
Estate
|
51.02%
|
48.98%
|
50.00%
|
50.35%
|
50.54%
|
49.46%
|
|
Shopping
Neuquén S.A.
|
Argentina
|
Real
Estate
|
63.47%
|
36.53%
|
99.14%
|
0.86%
|
99.07%
|
0.93%
|
|
Torodur
S.A.
|
Uruguay
|
Investment
|
63.77%
|
36.23%
|
62.00%
|
37.94%
|
63.18%
|
36.82%
|
|
Interest
indirectly held through
Tyrus
S.A.:
|
|
|
|
|
|
|
|
|
|
Dolphin Fund Ltd.
(4)
|
Bermudas
|
Investment
|
58.00%
|
41.60%
|
55.00%
|
40.68%
|
56.88%
|
43.12%
|
|
I Madison
LLC
|
United
States
|
Investment
|
64.00%
|
36.23%
|
65.00%
|
35.22%
|
66.01%
|
33.99%
|
|
IRSA Development
LP
|
United
States
|
Investment
|
64.00%
|
36.23%
|
65.00%
|
35.22%
|
66.01%
|
33.99%
|
|
IRSA International
LLC
|
United
States
|
Investment
|
64.00%
|
36.23%
|
65.00%
|
35.22%
|
66.01%
|
33.99%
|
|
Jiwin
S.A.
|
Uruguay
|
Investment
|
64.00%
|
36.23%
|
65.00%
|
35.22%
|
66.01%
|
33.99%
|
|
Liveck
S.A.
|
Uruguay
|
Investment
|
64.00%
|
36.23%
|
65.00%
|
35.22%
|
66.01%
|
33.99%
|
|
Real Estate
Investment Group IV LP
|
Bermudas
|
Investment
|
100.00%
|
-
|
100.00%
|
-
|
100.00%
|
-
|
|
Real Estate
Investment Group V LP
|
Bermudas
|
Investment
|
100.00%
|
-
|
100.00%
|
-
|
100.00%
|
-
|
|
Real Estate
Strategies LLC
|
United
States
|
Investment
|
64.00%
|
36.23%
|
65.00%
|
35.22%
|
66.01%
|
33.99%
|
|
Interest
indirectly held through
Efanur
S.A.:
|
|
|
|
|
|
|
|
|
|
Real Estate
Strategies LP
|
United
States
|
Investment
|
43.00%
|
57.38%
|
43.00%
|
56.71%
|
44.12%
|
55.88%
|
|
Interest
indirectly held through Dolphin Fund Ltd.
|
|
|
|
|
|
|
|
|
|
IDB Development
Corporation Ltd. (7)
|
Israel
|
Investment
|
44.00%
|
56.46%
|
-
|
-
|
-
|
-
|
F- 23
Cresud Sociedad Anónima, Comercial, Inmobiliaria, Financiera y
Agropecuaria
Notes to the Consolidated
Financial Statements
(Continued)
(Amounts
in millions of Argentine Pesos, except otherwise
indicated)
2.
Summary of significant accounting
policies
(Continued)
|
Name of the entity
|
Country
|
Main activity
|
% of ownership interest held by the Group (5)
|
% of ownership interest held by the NCI
|
|
Interest
indirectly held through IDBD:
|
|
|
|
|
|
Discount Investment
Corporation Ltd.
|
Israel
|
Investment
|
76.43%
|
23.57%
|
|
IDB Tourism (2009)
Ltd.
|
Israel
|
Holding
company in tourist services sector
|
100.00%
|
-
|
|
IDB Group
Investment Inc.
|
Israel
|
Investment
|
100.00%
|
-
|
|
Interest
indirectly held through Discount Investment Corporation
Ltd.:
|
|
|
|
|
|
Property &
Building Corporation Ltd.
|
Israel
|
Real
Estate
|
76.45%
|
23.55%
|
|
Gav
Yam Land Ltd.
|
Israel
|
Real
Estate
|
52.80%
|
47.20%
|
|
Israel
Property Rental Corporation Ltd. (ISPRO)
|
Israel
|
Real
Estate
|
76.45%
|
23.55%
|
|
MATAM
- Haifa Science Industries Center
|
Israel
|
Real
Estate
|
38.30%
|
61.70%
|
|
Neveh-Gad
Building & Development Ltd.
|
Israel
|
Real
Estate
|
76.45%
|
23.55%
|
|
Hadarim
Properties Ltd.
|
Israel
|
Real
Estate
|
76.45%
|
23.55%
|
|
PBC
USA Investment Inc.
|
United
States
|
Real
Estate
|
76.45%
|
23.55%
|
|
Shufersal
Ltd.
|
Israel
|
Supermarket
|
52.95%
|
47.05%
|
|
Shufersal
Real Estate Ltd.
|
Israel
|
Supermarket
|
52.95%
|
47.05%
|
|
Koor Industries
Ltd.(8)
|
Israel
|
Holding
company in the agrochemical sector
|
100.00%
|
-
|
|
Cellcom Israel Ltd.
(9)
|
Israel
|
Communication
services
|
41.77%
|
58.23%
|
|
Netvision
Ltd.
|
Israel
|
Communication
services
|
41.77%
|
58.23%
|
|
Elron Electronic
Industries Ltd.
|
Israel
|
Technology
development – Holding
|
50.32%
|
49.68%
|
|
Bartan Holdings and
Investment Ltd.
|
Israel
|
Holding
|
55.68%
|
44.32%
|
|
Epsilon Investment
House Ltd.
|
Israel
|
Holding
|
68.75%
|
31.25%
|
(1)
The Group has
consolidated the investment in Brasilagro considering that the
Company exercises “de facto control” over it. See Note
7 for further information regarding to Brasilagro.
(2)
As from July 1st,
2014, all transactions carried out by Cactus Argentina S.A., are
understood as if they had been made by and for Cresud S.A.C.I.F. y
A. due to the pre-merger commitment signed in September
2014.
(3)
The Group has
consolidated the investment in Llao Llao Resorts S.A. considering
their ownership interest held together with the Company's
participation in the making decisions.
(4)
Includes interest
indirectly held through Ritelco S.A.
(5)
Includes interest
indirectly held through Tyrus S.A.
(6)
Correspond to
interest directly held in each company.
(7)
Owns a 40% equity
interest of Adama.
(8)
The Group has
consolidated the interest in Cellcom taking into consideration its
equity interest and decision-making power given the fact that the
remaining interests are too disperse.
(9)
Until takeover was
secured, IDBD was valued at fair value in accordance with IAS 28
exception.
The Group takes
into account both quantitative and qualitative aspects in order to
determine which non-controlling interests in subsidiaries are
considered significant.
(b)
Changes in ownership interests in subsidiaries without change of
control
Transactions with
non-controlling interests that do not result in loss of control are
accounted for as equity transactions – that is, as
transactions with the owners in their capacity as owners. The
recorded amount is the difference between the fair value of the
consideration paid and/or receive and the relevant share acquired
and/or given of the carrying value of net assets of the
subsidiary.
F- 24
Cresud Sociedad Anónima,
Comercial, Inmobiliaria, Financiera y Agropecuaria
Notes to the Consolidated
Financial Statements
(Continued)
(All amounts in
millions of Argentine Pesos, except otherwise
indicated)
2.
Summary of significant accounting
policies
(Continued)
(c)
Disposal of subsidiaries with loss of control
When the Group
ceases to have control any retained interest in the entity is
re-measured at its fair value at the date when control is lost,
with changes in carrying amount recognized in profit or loss. The
fair value is the initial carrying amount for the purposes of
subsequently accounting for the retained interest as an associate,
joint venture or financial asset. In addition, any amounts
previously recognized in other comprehensive income in respect of
that entity are accounted for as if the Group had directly disposed
of the related assets or liabilities. This may mean that amounts
previously recognized in other comprehensive income are
reclassified to profit or loss.
(d)
Associates
Associates are all
entities over which the Group has significant influence but not
control, generally accompanying a shareholding of between 20% and
less than 50% of the voting rights. Investments in associates are
accounted for using the equity method of accounting, except as
otherwise indicated as explained below. Under the equity method,
the investment is initially recognized at cost, and the carrying
amount is increased or decreased to recognize the investor’s
share of the profit or loss of the investee after the date of
acquisition. The Group’s investment in associates includes
goodwill identified on acquisition.
IAS 28
“Investments in Associates” provides an exemption from
applying the equity method where investments in associates are held
through “Venture Capital Organizations” (VCO) or
venture capital entities, as defined in Spanish, even when the
Group is not a VCO. This type of investment may be accounted for at
fair value through profit or loss for the years because such
measure proves to be more useful to users of financial statements
than the equity method.
As of each year end
or upon the existence of evidence of impairment, a determination is
made as to whether there is any objective indication of impairment
in the value of the investments in associates. If this is the case,
the Group calculates the amount of impairment as the difference
between the recoverable amount of the associates and its carrying
value and recognizes the amount adjacent to "Share of profit /
(loss) of joint ventures and associates" in the statements of
income.
(e)
Joint arrangements
Joint arrangements
are arrangements of which the Group and other party or parties have
joint control bound by a contractual arrangement. Under IFRS 11,
investments in joint arrangements are classified as either joint
operations or joint ventures depending on the contractual rights
and obligations each investor has rather than the legal structure
of the joint arrangement. A joint venture is a joint arrangement
whereby the parties that have joint control of the arrangement have
rights to the net assets of the arrangement. A joint operation is a
joint arrangement whereby the parties that have joint control of
the arrangement have rights to the assets, and obligations for the
liabilities, relating to the arrangement. The Group has assessed
the nature of its joint arrangements and determined them to be
joint ventures.
F- 25
Cresud Sociedad Anónima,
Comercial, Inmobiliaria, Financiera y Agropecuaria
Notes to the Consolidated
Financial Statements
(Continued)
(All amounts in
millions of Argentine Pesos, except otherwise
indicated)
2.
Summary of significant accounting
policies
(Continued)
Investments in
joint ventures are accounted for under the equity method. Under the
equity method of accounting, interests in joint ventures are
initially recognized in the consolidated statements of financial
position at cost and adjusted thereafter to recognize the
Group’s share of the post-acquisition profits or losses in
the income statements and in other comprehensive income
respectively.
The Group
determines at each reporting date whether there is any objective
evidence that the investment amount in the joint ventures is
impaired. If this is the case, the Group calculates the amount of
impairment as the difference between the recoverable amount of the
joint venture and its carrying value and recognizes the difference
to "Share of profit / (loss) of joint ventures and associates" in
the statements of income.
2.4.
Segment
information
Operating segments
are reported in a manner consistent with the internal reporting
provided to the chief operating decision-maker
(“CODM”), the Group’s Executive Committer,
responsible for allocating resources and assessing performance of
them. The operating segments are included in Note 6.
2.5.
Foreign
currency translation
(a)
Functional and presentation currency
Items included in
the financial statements of each of the Group’s entities are
measured using the currency of the primary economic environment in
which the entity operates (‘the functional currency’).
The consolidated financial statements are presented in Argentine
Pesos, which is the Group’s presentation
currency.
(b)
Transactions and balances in foreign currency
Foreign currency
transactions are translated into the functional currency using the
exchange rates prevailing at the dates of the transactions. Foreign
exchange gains and losses resulting from the settlement of such
transactions and from the translation at year-end exchange rates of
monetary assets and liabilities denominated in foreign currencies
are recognized in the profit or loss for the year.
Foreign exchange
gains and losses are presented in the statements of income within
finance costs and finance income, as appropriate, unless they are
capitalized.
F- 26
Cresud Sociedad Anónima,
Comercial, Inmobiliaria, Financiera y Agropecuaria
Notes to the Consolidated
Financial Statements
(Continued)
(All amounts in
millions of Argentine Pesos, except otherwise
indicated)
2.
Summary of significant accounting
policies
(Continued)
(c)
Group companies
The results and
financial position of all the group entities (none of which has the
currency of a hyperinflationary economy) that have a functional
currency different from the presentation currency are translated
into the presentation currency as follows:
(i)
Assets, liabilities
and goodwill for each statement of financial position presented are
translated at the closing rate at the date of that financial
position;
(ii)
Income and expenses
for each statement of comprehensive income are translated at
average exchange rates (unless this average is not a reasonable
approximation of the cumulative effect of the rates prevailing on
the transaction dates, in which case income and expenses are
translated at the rate on the dates of the transactions);
and
(iii)
All resulting
exchange differences are recognized in the statement of
comprehensive income.
2.6.
Investment
properties
Investment
properties are those properties owned by the Group that are held
either to earn long-term rental income or for capital appreciation,
or both, and that is not occupied by the companies in the
consolidated Group. Investment property also includes property that
is being constructed or developed for future use as investment
property. The Group also classifies land whose future use has not
been determined yet as investment properties.
The Group’s
investment properties primarily comprise the Group’s
portfolio of shopping centers and offices, farmland leased out to
third parties, certain property under development and undeveloped
land.
Investment
properties are measured initially at cost. Cost comprises the
purchase price and directly attributable expenditures.
For properties
under development, capitalization of costs includes not only
financial costs, but also all costs directly attributable to works
in process, from commencement of construction until it is completed
and property is in conditions to start operating.
Direct expenses
related to lease contract negotiation (as well as payment to third
parties for services rendered and certain specific taxes related to
execution of such contracts) are capitalized as part of the book
value of the relevant investment properties and amortized over the
term of the lease.
F- 27
Cresud Sociedad Anónima,
Comercial, Inmobiliaria, Financiera y Agropecuaria
Notes to the Consolidated
Financial Statements
(Continued)
(All amounts in
millions of Argentine Pesos, except otherwise
indicated)
2.
Summary of significant accounting
policies
(Continued)
The Group has
adopted the cost model for all of its investment properties.
Therefore, at the date of each statement of financial position,
investment properties are carried at amortized cost, less
impairment losses, if any. Where individual components of an item
of investment property have different useful lives, they are
accounted for as separate items, which are depreciated separately.
Subsequent costs are included in the asset’s carrying amount
or recognized as a separate asset, as appropriate, only when it is
probable that future economic benefits associated with the item
will flow to the Group and the cost of the item can be measured
reliably.
Land and property
under constructions are not depreciated. Depreciation of the
remaining investment properties is calculated, based on a component
approach, using the straight-line method over the estimated useful
life of each component. The remaining useful life as of June 30,
2016 is as follows:
|
Shopping center
portfolio
|
Between 11 and 30
years
|
|
Offices and other
rental properties portfolio
|
Between 8 and 100
years
|
As of each year-end
an impairment test is performed on the recoverable value and/or
residual useful life of assets. If there be any indicators of
impairment, the recoverable amount and/or residual useful life of
impaired asset(s) is computed, and an impairment adjustment is
made, if applicable. The asset’s residual values and useful
lives are reviewed, if appropriate, at least at each financial
year-end.
An asset’s
carrying amount is written down immediately to its recoverable
amount if its carrying amount is greater than its estimated
recoverable amount.
Investment
properties are derecognized when they are disposed of or when they
are permanently withdrawn from use and no future economic benefits
are expected to arise from their disposals. Gains or losses on
disposals or retirements of investment properties are determined by
comparing the net disposal proceeds and their carrying amounts at
the date of disposal. The gains or losses are recognized in the
statements of income and disclosed separately under the line item
“Gain from disposal of investment property”. Proceeds
from the sale of such property are accounted for when the material
risks and benefits have been transferred to the
purchaser.
2.7.
Property,
plant and equipment
This category
primarily comprises land used for agricultural purposes, buildings
or portions of a building used for administrative and corporate
purposes, machines, computers and other equipment, motor vehicles,
furniture, fixtures and fittings and improvements to the
Group’s corporate offices.
The Group has also
several hotel properties. Based on the respective contractual
arrangements with hotel managers and / or given their direct
operators nature, the Group considers it retains significant
exposure to the variations in the cash flows of the hotel
operations, and accordingly, hotels are treated as owner-occupied
properties and classified under the line item “Property,
plant and equipment”.
F- 28
Cresud Sociedad Anónima,
Comercial, Inmobiliaria, Financiera y Agropecuaria
Notes to the Consolidated
Financial Statements
(Continued)
(All amounts in
millions of Argentine Pesos, except otherwise
indicated)
2.
Summary of significant accounting
policies
(Continued)
All property, plant
and equipment (“PPE”) are stated at acquisition cost
less depreciation and accumulated impairment, if any. The
acquisition cost includes expenditure that is directly attributable
to the acquisition of the items. For properties under development,
capitalization of costs includes not only financial costs, but also
all costs directly attributable to works in process, from
commencement of construction until it is completed and property is
in conditions to start operating.
Subsequent costs
are included in the asset’s carrying amount or recognized as
a separate asset, as appropriate, only when it is probable that
future economic benefits associated with the item will flow to the
Group and the cost of the item can be measured reliably. Such costs
may include the cost of improvements and replacement of parts as
they meet the conditions to be capitalized. The carrying amount of
those parts that are replaced is derecognized Repairs and
maintenance are charged as incurred in the statement of income.
Depreciation, based on a component approach, is calculated using
the straight-line method to allocate the cost over the
assets’ estimated useful lives. The remaining useful life as
of June 30, 2016 is as follows:
|
Buildings
and
facilities
|
Between
5 and 50 years
|
|
Machinery
and
equipment
|
Between
3 and 17 years
|
|
Communication
networks
|
Between
3 and 20 years
|
|
Others
|
Between
3 and 25 years
|
The assets’
net book amount and useful lives are reviewed, and adjusted if
appropriate, at least at each financial year-end.
An asset’s
carrying amount is written down immediately to its recoverable
amount if its carrying amount is greater than its estimated
recoverable amount.
Gains from the sale
of these assets are recognized when the significant risks and
rewards have transferred to the buyer. This will normally take
place on unconditional exchange, generally when legal title passes
to the buyer and it is probable that the buyer will pay. For
conditional exchanges, sales are recognized when these conditions
are satisfied.
Gains and losses on
disposals are determined by comparing the proceeds, with the
carrying amount. Gains and losses from the disposal of farmlands
are disclosed within “Gains from disposal of farmlands”
in the income statements. All other gains and losses from the
disposal of property, plant and equipment items are recognized
within “Other operating results, net” in the statement
of comprehensive income.
F- 29
Cresud Sociedad Anónima,
Comercial, Inmobiliaria, Financiera y Agropecuaria
Notes to the Consolidated
Financial Statements
(Continued)
(All amounts in
millions of Argentine Pesos, except otherwise
indicated)
2.
Summary of significant accounting
policies
(Continued)
2.8.
Leases
Leases are
classified at their inception as either operating or finance leases
based on the economic substance of the agreement.
A Group company is the lessor:
Properties leased
out to tenants under operating leases are included in
“Investment properties” in the statement of financial
position. See Note 2.23 for the recognition of rental income. The
Group does not have any assets leased out under finance
leases.
A Group company is the lessee:
The Group has
entered into some operating lease agreements, mainly related to
farming activities. By virtue of these contracts, the Group leases
land open for agricultural exploitation during the harvest year.
The lease price is generally set at a fixed amount in dollars or at
a certain number of quintals of soybeans (or equivalent measurement
unit) during the entire lease term. Lease payments can be made in
installments or in advance at the beginning of the lease. The lease
costs are recognized in the income statements according the harvest
of the crops The Group considers that this systematic base is more
representative of the time pattern of the leases’
benefits.
Additionally, the
Group acts as a lessee in other operating leases, mainly related to
agricultural business. Payments, including prepayments, made under
operating leases (net of any incentives received from the lessor)
are charged to the income statement on a straight-line basis over
the period of the lease.
The Group acquires
certain specific assets (especially machinery and computer
equipment) under finance leases. Finance leases are capitalized at
the commencement of the lease at the lower of the fair value of the
property and the present value of the minimum lease payments.
Capitalized lease assets are depreciated over the shorter of the
estimated useful life of the assets and the lease term. The finance
charges will be charged to the statements of income over the lease
period so as to produce a constant periodic rate of interest on the
remaining balance of the liability for each period. Liabilities
corresponding to finance leases, measured at discounted value, are
included in current and non-current borrowings
Operating leases
where the Group acts as lessee mainly include offices.
F- 30
Cresud Sociedad Anónima,
Comercial, Inmobiliaria, Financiera y Agropecuaria
Notes to the Consolidated
Financial Statements
(Continued)
(All amounts in
millions of Argentine Pesos, except otherwise
indicated)
2.
Summary of significant accounting
policies
(Continued)
2.9.
Intangible
assets
(a)
Goodwill
Goodwill represents
future economic benefits arising from assets that are not capable
of being individually identified and separately recognized by the
Group on an acquisition. Goodwill is initially measured as the
difference between the fair value of the consideration transferred,
plus the amount of non-controlling interest in the acquisition and,
in business combinations achieved in stages, the acquisition-date
fair value of the previously held equity interest in the
acquisition; and the net fair value of the identifiable assets and
liabilities assumed on the acquisition date.
Goodwill is not
amortized but tested for impairment on an annual basis, or more
frequently if there is indicator of impairment.
For the purpose of
impairment testing, assets are grouped at the lowest levels for
which there are separately identifiable cash flows, known as
cash-generating units (“CGU”). In order to determine
whether any impairment loss should be recognized, the book value of
CGU or CGU groups is compared against its recoverable value. Net
book value of CGU and CGU groups include goodwill and assets with
limited useful life (such as, investment properties, property,
plant and equipment, intangible assets and working capital
net).
If the recoverable
amount of the CGU is less than the carrying amount of the unit, the
impairment loss is allocated first to reduce the carrying amount of
any goodwill allocated to the unit and then to the other assets of
the unit pro-rata on the basis of the carrying amount of each asset
in the unit. Impairment losses recognized for goodwill are recorded
in the statement of income as a deduction from operating income and
not reversed in a subsequent periods.
Recoverable amount
of a CGU is the higher of fair value less costs-to-sell and
value-in-use. The fair value is the amount at which a
cash-generating unit may be sold in a current transaction between
unrelated, willing and duly informed parties. Value-in-use is the
present value of all estimated future cash flows expected to be
derived from CGU or CGU groups.
(b)
Computer software
Acquired computer
software licenses are capitalized on the basis of the costs
incurred to acquire and bring to use the specific software. These
costs are amortized over their estimated useful lives of 3 years.
Costs associated with maintaining computer software programs are
recognized as an expense as incurred.
F- 31
Cresud Sociedad Anónima,
Comercial, Inmobiliaria, Financiera y Agropecuaria
Notes to the Consolidated
Financial Statements
(Continued)
(All amounts in
millions of Argentine Pesos, except otherwise
indicated)
2.
Summary of significant accounting
policies
(Continued)
(c)
Branding and client relationships
This relates to the
fair value of brands and client relationships arising at the time
of the business combination with IDBD. They are subsequently valued
at cost, less the accumulated amortization or impairment. Client
relationships have a 12-year useful life, while brands have an
indefinite useful life.
(d)
Right to receive future units under barter agreements
The Group also
enters into barter transactions where the Group normally exchanges
undeveloped parcels of land with third-party developers for future
property to be constructed on the bartered land. The Group
generally receives monetary assets as part of the transactions
and/or a right to receive future units to be constructed by
developers. Such rights are initially recognized at cost (which is
the fair value of the land assigned) and such rights are not
adjusted later, unless there is any sign of
impairment.
At the date of each
statements of financial position, the Group reviews the carrying
amounts of its intangible assets to determine whether there is any
indicator that those assets have suffered an impairment loss. If
any such indicator exists, the recoverable amount of the asset is
estimated in order to determine the extent, if any, of the
impairment loss.
2.10.
Trading
properties
Trading properties
comprises those properties either intended for sale in the process
of construction for sale. Trading properties are carried at the
lower of cost and net realizable value. Where there is a change in
use of investment properties evidenced by the commencement of
development with a view to sale, the properties are reclassified as
trading properties at their cost, which is the carrying value at
the date of change in use. They are subsequently carried at the
lower of cost and net realizable value. Cost comprises all costs of
purchase, costs of conversion and other costs incurred in bringing
the trading properties to their present location and
condition.
2.11.
Inventories
Inventories include
assets held for sale in the ordinary course of the Group’s
business activities, assets in production or construction process
for sale purposes, and materials, supplies or other assets held for
consumption in the process of producing sales and/or
services.
Supplies used in
the Group's farming activities comprise fertilizers, agrochemicals,
vaccines, seeds, feed for livestock and other items. Harvested
agricultural produce comprise harvested crops, and raw
meat.
F- 32
Cresud Sociedad Anónima,
Comercial, Inmobiliaria, Financiera y Agropecuaria
Notes to the Consolidated
Financial Statements
(Continued)
(All amounts in
millions of Argentine Pesos, except otherwise
indicated)
2.
Summary of significant accounting
policies
(Continued)
For the
Group’s operations in Argentina and Brazil, harvested crops
are perpetually measured at net realizable value until the point of
sale because there is an active market in the produce, there is a
negligible risk that the produce will not be sold and there is a
well-established practice in the industry carrying the inventories
at net realizable value. Changes in net realizable value are
recognized in the income statements in the year in which they arise
under the line item “Changes in net realizable value of
agricultural produce after harvest”.
Inventories are
measured at the lower of cost or net realizable value.
Net realizable
value is the estimated selling price in the ordinary course of
business less selling expenses. It is determined on an ongoing
basis, taking into account the product type and aging, based on the
accumulated prior experience with the useful life of the product.
The Group periodically reviews the inventory and its aging and
books an allowance for impairment, as necessary.
The cost of
consumable supplies, materials and other assets is determined using
the weighted average cost method, the cost of inventories of mobile
phones, related accessories and spare parts is priced under the
moving average method, and the cost of the remaining inventories is
priced under the first in, first out (FIFO) method.
Cost comprises all
costs of purchase, costs of conversion and other costs incurred in
bringing the inventories to their present location and condition.
Inventories are recorded at the cash cost and the difference
between that and the actual amount paid is treated as finance
cost.
2.12.
Biological
assets and agriculture produce at the point of harvest
Biological assets
comprise unharvested crops (mainly corn, wheat, soybeans and
sunflower), sugarcane, livestock (breeding and dairy cattle and
cattle held for sale or meat production) and other less significant
biological assets such as sheep and tree plantations.
The Group
distinguishes between consumable and bearer biological assets.
Consumable biological assets are those assets that may be harvested
as agricultural produce or sold as biological assets, for example
livestock intended for the production of meat and/or livestock held
for sale. Bearer biological assets are those assets capable of
producing more than one harvest, for example sugarcane, dairy
cattle and breeding cattle. Consumable biological assets are
generally classified as current while bearer biological assets are
generally classified as non-current.
Expenses relating
to the agricultural activity include items as planting, harvesting,
irrigation, agrochemicals, fertilizers, veterinary services and
others. The Group elected to expense all such costs when incurred
and includes them as “Cost of agriculture production”
within Costs in the income statements (See Note 30). Therefore,
“Cost of agriculture production” represents the costs
expensed whilst the biological assets are growing.
F- 33
Cresud Sociedad Anónima,
Comercial, Inmobiliaria, Financiera y Agropecuaria
Notes to the Consolidated
Financial Statements
(Continued)
(All amounts in
millions of Argentine Pesos, except otherwise
indicated)
2.
Summary of significant accounting
policies
(Continued)
The line item
“Cost of sales of biological assets and agricultural
produce” within “Costs” in the income statements
represents the recognition as an expense of agricultural produce
held in inventory, valued at either cost or net realizable value,
as applicable (See Note 2.11), or biological assets valued at fair
value less costs to sell.
The fair value of a
biological asset in its present location and condition is
determined based on either the present value of expected net cash
flows from the biological asset discounted at a current
market-determined pre-tax rate or the current quoted market price
in the most relevant market.
Biological assets
are measured at fair value less costs to sell on initial
recognition and at each statement of financial position date,
except where fair value cannot be reliably measured. Cost
approximates fair value when little or no biological transformation
has taken place since the costs were originally incurred or the
impact of biological transformation on price is not expected to be
material. Costs to sell include all incremental costs directly
attributable to the sale of the biological assets, excluding
finance costs and income taxes.
The gain or loss
arising from initial recognition of a) agricultural produce and b)
biological assets at fair value less costs to sell and from a
change in fair value less costs to sell of a biological asset is
recognized in profit or loss in the period in which they are
incurred within the line item “Initial recognition and
changes in fair value of biological assets and agricultural produce
at the point of harvest”.
2.13.
Financial
instruments
The Group
classifies its financial assets in the following categories: those
to be measured subsequently at fair value, and those to be measured
at amortized cost. This classification depends on whether the
financial asset is a debt or an equity investment.
Debt investments
A debt investment
is classified as “amortized cost” only if both of the
following criteria are met: (i) the objective of the Group’s
business model is to hold the asset to collect the contractual cash
flows; and (ii) the contractual terms give rise on specified dates
to cash flows that are solely payments of principal and interest on
the principal outstanding. The nature of any derivatives embedded
in the debt investment are considered in determining whether the
cash flows of the investment are solely payment of principal and
interest on the principal outstanding and are not accounted for
separately.
If either of the
two criteria mentioned in the previous paragraph is not met, the
debt instrument is classified as “fair value through profit
or loss”. The Group has not designated any debt investment as
measured at fair value through profit or loss to eliminate or
significantly reduce an accounting mismatch. Changes in fair values
and gains from disposal of financial assets at fair value through
profit or loss are recorded within “Financial results,
net” in the statements of income.
F- 34
Cresud Sociedad Anónima,
Comercial, Inmobiliaria, Financiera y Agropecuaria
Notes to the Consolidated
Financial Statements
(Continued)
(All amounts in
millions of Argentine Pesos, except otherwise
indicated)
2.
Summary of significant accounting
policies
(Continued)
Equity investments
All equity
investments, which are not subsidiaries, associate companies and
joint venture of the Group, are measured at fair value. Equity
investments that are held for trading are measured at fair value
through profit or loss. For all other equity investments, the Group
can make an irrevocable election at initial recognition to
recognize changes in fair value through other comprehensive income
rather than profit or loss. The Group decided to recognize changes
in the fair value of equity investments through profit or
loss.
At initial
recognition, the Group measures a financial asset at its fair value
plus, in the case of a financial asset not at fair value through
profit or loss, transaction costs that are directly attributable to
the acquisition of the financial asset. Transaction costs of
financial assets carried at fair value though profit or losses are
expensed in the statements of income.
In general, the
Group uses the transaction price method to determine fair value of
a financial instrument upon initial recognition. In the other
cases, the Group merely records a gain or a loss upon initial
recognition only if the fair value of the instrument is supported
by other comparable and observable current market transactions in
the same instrument or from other available observable market data.
Any gain or loss not recognized upon initial recognition of a
financial asset are recognized later, only to the extent that there
are changes in the factors (including time) that market
participants would consider at the time of agreeing upon a
price.
A gain or loss on a
debt investment that is subsequently measured at amortized cost and
is not part of a hedging relationship is recognized in profit or
loss when the financial asset is derecognized or impaired and
through the amortization process using the effective interest rate
method. The Group is required to reclassify all affected debt
investments when and only when its business model for managing
those assets changes.
The Group assesses
at the end of each reporting period whether there is objective
evidence that a financial asset or group of financial assets
measured at amortized cost is impaired. A financial asset or a
group of financial assets is impaired and impairment losses are
incurred only if there is objective evidence of impairment as a
result of one or more events that occurred after the initial
recognition of the asset and that impairment can be reliably
estimated. The amount of the loss is measured as the difference
between the asset’s carrying amount and the present value of
estimated future cash flows (excluding future credit losses that
have not been incurred) discounted at the financial asset’s
original effective interest rate.
Financial assets
and liabilities are offset when there is a legally enforceable
right to offset the recognized amounts and there is an intention to
settle on a net basis, or realize the asset and settle the
liability simultaneously.
F- 35
Cresud Sociedad Anónima,
Comercial, Inmobiliaria, Financiera y Agropecuaria
Notes to the Consolidated
Financial Statements
(Continued)
(All amounts in
millions of Argentine Pesos, except otherwise
indicated)
2.
Summary of significant accounting
policies
(Continued)
2.14.
Derivative
financial instruments and hedging activities and
options
Derivative
financial instruments are initially recognized at fair value on the
date a derivative contract is entered into and are subsequently
re-measured at their fair value. The method of recognizing the
resulting gain or loss depends on whether the derivative is
designated as a hedging instrument, and if so, the nature of the
item being hedged.
The Group manages
exposures to various risks using hedging instruments that provide
the appropriate economic outcome. The Group does not use derivative
financial instruments for speculative purposes. To date, the Group
has used future contracts, commodities put and call options,
foreign exchange contracts and interest rate swaps as deemed
appropriate.
The Group’s
policy is to apply hedge accounting where it is both permissible
under IFRS 9, practical to do so and its application reduces
volatility, but transactions that may be effective hedges in
economic terms may not always qualify for hedge accounting under
IFRS 9. Trading derivatives are classified as a current asset or
liability on the statement of financial position. Gains and losses
on derivatives are classified according to their nature. Gains and
losses on commodity derivatives are classified within the line item
“Other operating income, net”. Gain and losses on all
other derivatives are classified in the income statements where the
results of the items covered are recognized.
The fair values of
financial instruments that are traded in active markets are
computed by reference to market prices. The fair value of financial
instruments that are not traded in an active market is determined
by using valuation techniques. The Group uses its judgment to
select a variety of methods and make assumptions that are mainly
based on market conditions existing at the end as each reporting
period.
The stock purchase
options involving shares of subsidiaries agreed at a fixed price
are accounted for under shareholders’ equity.
2.15.
Groups
of assets and liabilities held for sale
Groups of assets
and liabilities are classified as held for sale when the Group is
expected to recover their value by means of a sale transaction
(rather than through use) and where such sale is highly probable.
Groups of assets and liabilities held for sale are valued at the
lower of their net book value and fair value less selling
costs.
2.16.
Trade
and other receivables
Trade receivables
are recognized initially at fair value and subsequently measured at
amortized cost using the effective interest method.
F- 36
Cresud Sociedad Anónima,
Comercial, Inmobiliaria, Financiera y Agropecuaria
Notes to the Consolidated
Financial Statements
(Continued)
(All amounts in
millions of Argentine Pesos, except otherwise
indicated)
2.
Summary of significant accounting
policies
(Continued)
An allowance for
bad debts is recorded where there is objective evidence that the
Group may not be able to collect all receivables within their
original payment term. Indicators of bad debts include significant
financial distress of the debtor, the debtor potentially filing a
petition for reorganization or bankruptcy, or any event of default
or past due account.
In the case of
larger non-homogeneous receivables, the impairment provision is
calculated on an individual basis.
The Group
collectively evaluates smaller-balance homogeneous receivables for
impairment. For that purpose they are grouped on the basis of
similar risk characteristics and account asset type, collateral
type, past-due status and other relevant factors are taken into
account.
The amount of the
provision is the difference between the asset’s carrying
amount and the present value of estimated future cash flows,
discounted at the original effective interest rate. The carrying
amount of the asset is reduced through the use of a provision
account, and the amount of the loss is recognized in the statements
of income within “Selling expenses”. Subsequent
recoveries of amounts previously written off are credited against
“Selling expenses” in the statements of
income.
2.17.
Trade
and other payables
Trade payables are
initially recognized at fair value and subsequently measured at
amortized cost using the effective interest method.
2.18.
Borrowings
Borrowings are
recognized initially at fair value, net of costs incurred in the
transaction. Borrowings are subsequently stated at amortized cost.
Any difference between the proceeds (net of transaction costs) and
the redemption value is recognized as finance cost over the period
of the borrowings using the effective interest method.
2.19.
Provisions
Provisions are
recognized when (i) the Group has a present legal or constructive
obligation as a result of past events; (ii) it is probable that an
outflow of resources will be required to settle the obligation; and
(iii) a reliable estimate of the amount of the obligation can be
made. Provisions are not recognized for future operating
losses.
F- 37
Cresud Sociedad Anónima,
Comercial, Inmobiliaria, Financiera y Agropecuaria
Notes to the Consolidated
Financial Statements
(Continued)
(All amounts in
millions of Argentine Pesos, except otherwise
indicated)
2.
Summary of significant accounting
policies
(Continued)
The Group bases its
accruals on up-to-date developments, estimates of the outcomes of
the matters and legal counsel experience in contesting, litigating
and settling matters. As the scope of the liabilities becomes
better defined or more information is available, the Group may be
required to change its estimates of future costs, which could have
a material effect on its results of operations and financial
condition or liquidity.
Provisions are
measured at the present value of the expenditures expected to be
required to settle the obligation using a pre-tax rate that
reflects current market assessments of the time value of money and
the risks specific to the obligation. The increase in the provision
due to passage of time is recognized as finance cost.
(a)
Warranties
A provision for
warranties is recognized when the underlying products or services
are sold. The provision is based on historic data of the warranties
granted and all potential results are weighted against associated
probabilities.
(b)
Onerous contracts
A provision for
onerous contracts is recognized when the expected benefits are
lower than the costs of complying with contract obligations. The
provision is measured at the present value of the lower of expected
cost of terminating the contract and the net expected cost of
continuing the contract. Before recognizing a provision, the Group
recognizes the impairment of the assets related to the mentioned
contract.
2.20.
Employee
benefits
(a)
Defined contribution plans
The Group operates
a defined contribution plan. A defined contribution plan is a
pension plan under which the Group pays fixed contributions into a
separate entity. The Group has no legal or constructive obligations
to pay further contributions if the fund does not hold sufficient
assets to pay all employees the benefits relating to employee
service in the current and prior periods. The contributions are
recognized as employee benefit expenses in the statements of income
in the fiscal year when they are incurred.
F- 38
Cresud Sociedad Anónima,
Comercial, Inmobiliaria, Financiera y Agropecuaria
Notes to the Consolidated
Financial Statements
(Continued)
(All amounts in
millions of Argentine Pesos, except otherwise
indicated)
2.
Summary of significant accounting
policies
(Continued)
(b)
Termination benefits
Termination
benefits are payable when employment is terminated by the Group
before the normal retirement date, or whenever an employee accepts
voluntary redundancy in exchange for these benefits. The Group
recognizes termination benefits when it is demonstrably committed
to either terminating the employment of current employees according
to a detailed formal plan without possibility of withdrawal; or
providing termination benefits as a result of an offer made to
encourage voluntary redundancy.
(c)
Bonus plans
The Group
recognizes a liability and an expense for bonuses based on a
formula that takes into consideration the profit attributable to
the Company’s shareholders after certain adjustments. The
Group recognizes a provision where it is contractually obliged or
where there is a past practice that has created a constructive
obligation.
(d)
Defined benefit plans
Group’s net
obligation concerning defined benefit plans is calculated on an
individual basis for each plan, estimating the future benefits
employees have gained in exchange for their services in the current
and prior years. The benefit is disclosed at its present value, net
of the fair value of the plan assets. Calculations are made on an
annual basis by a qualified actuary.
(e)
Other long-term employee benefits
The net obligation
of IDBD and its subsidiaries concerning employee long-term
benefits, other than retirement plans, is the amount of the future
benefits employees have gained in exchange for their services in
the current and prior periods. These benefits are discounted at
their present values.
(f)
Share-based compensation plan
The fair value of
the equity settled awards is measured at the date of grant. The
Group measures the fair value using the valuation technique that it
considers to be the most appropriate to value each class of award.
Methods used may include Black-Scholes calculations or other models
as appropriate. The valuations take into account factors such as
non-transferability, exercise restrictions and behavioral
considerations.
The fair value of
the equity settled awards is recognized as an expense in the income
statements over the vesting period on a straight-line basis, taking
into consideration the best estimation of the awards that will
eventually vest. Such estimate shall be revised provided subsequent
information available indicates that the number of equity
instruments expected to vest differs from original
estimates.
F- 39
Cresud Sociedad Anónima,
Comercial, Inmobiliaria, Financiera y Agropecuaria
Notes to the Consolidated
Financial Statements
(Continued)
(All amounts in
millions of Argentine Pesos, except otherwise
indicated)
2.
Summary of significant accounting
policies
(Continued)
2.21.
Income
tax, deferred income tax and minimum presumed income
tax
The Group’s
tax expense for the year comprises the charge for tax currently
payable and deferred income. Tax is recognized in the statements of
income, except to the extent that it relates to items recognized in
other comprehensive income or directly in equity, in which case,
the tax is also recognized in other comprehensive income or
directly in equity, respectively.
The current income
tax charge is calculated on the basis of the tax laws enacted or
substantively enacted at the date of the statements of financial
position in the countries where the Company and its subsidiaries
operate and generate taxable income. The Group periodically
evaluates positions taken in tax returns with respect to situations
in which applicable tax regulation is subject to interpretation. It
establishes provisions where appropriate on the basis of amounts
expected to be paid to the tax authorities.
Deferred income tax
is recognized, using the liability method, on temporary differences
arising between the tax bases of assets and liabilities and their
carrying amounts. However, deferred tax liabilities are not
recognized if they arise from the initial recognition of goodwill;
deferred income tax is not accounted for if it arises from initial
recognition of an asset or liability in a transaction other than a
business combination that at the time of the transaction affects
neither accounting nor taxable profit or loss. Deferred income tax
is determined using tax rates (and laws) that have been enacted or
substantively enacted by the closing date of the consolidated
financial statements and are expected to apply when the related
deferred income tax asset is realized or the deferred income tax
liability is settled.
Deferred income tax
assets are recognized only to the extent that it is probable that
future taxable profit will be available against which the temporary
differences can be utilized.
Deferred income tax
is provided on temporary differences arising on investments in
subsidiaries, joint ventures and associates, except when
opportunity of the reversal of the temporary difference is
controlled by the Group and it is probable that the temporary
difference will not reverse in the foreseeable future.
Deferred income tax
assets and liabilities are offset when there is a legally
enforceable right to offset current tax assets against current tax
liabilities and when the deferred income taxes assets and
liabilities relate to income taxes levied by the same taxation
authority on either the same taxable entity or different taxable
entities where there is an intention to settle the balances on a
net basis.
The Group is able
to control the timing of dividends from its subsidiaries and hence
does not expect taxable profit. Hence deferred tax is recognized in
respect of the retained earnings of overseas subsidiaries only if
at the closing date of the Consolidated Statement of Financial
Position, dividends have been accrued as receivable or a binding
agreement to distribute past earnings in future has been entered
into by the subsidiary.
F- 40
Cresud Sociedad Anónima,
Comercial, Inmobiliaria, Financiera y Agropecuaria
Notes to the Consolidated
Financial Statements
(Continued)
(All amounts in
millions of Argentine Pesos, except otherwise
indicated)
2.
Summary of significant accounting
policies
(Continued)
Entities in
Argentina are subject to the Minimum Presumed Income Tax
(“MPIT”). Pursuant to this tax regime, an entity is
required to pay the greater of the income tax or the MPIT. The MPIT
provision is calculated on an individual entity basis at the
statutory asset tax rate of 1% and is based upon the taxable assets
of each company as of the end of the year, as defined by Argentine
law. Any excess of the MPIT over the income tax may be carried
forward and recognized as a tax credit against future income taxes
payable over a 10-year period. When the Group assesses that it is
probable that it will use the MPIT payment against future taxable
income tax charges within the applicable 10-year period recognizes
the MPIT as a current or non-current receivable, as applicable,
within “Trade and other receivables” in the Statements
of Financial Position.
2.22.
Cash
and cash equivalents
In the statement of
cash flows, cash and cash equivalents includes cash in hand,
deposits held at call with banks, and other short-term highly
liquid investments with original maturities of three months or
less. Bank overdrafts are not included.
2.23.
Revenue
recognition
Group's revenue is
measured at the fair value of the consideration received or
receivable.
Revenue derived
from the sale of goods is recognized when: (a) material risks and
benefits derived from title to property have been transferred; (b)
the company does not retain any management function on the assets
sold nor does it have any control whatsoever on such assets; (c)
the amount of revenues and costs associated to the transaction may
be measured on a reliable basis; and (d) the company is expected to
accrue the economic benefits associated to the
transaction.
Revenue derived
from the provision of services is recognized when (a) the amount of
revenue and costs associated to the services may be measured on a
reliable basis; (b) the company is expected to accrue the economic
benefits associated to the transaction, and (c) the level of
completion of services may be measured on a reliable
basis.
Agricultural and agricultural-related activities of the
Group:
Revenue from
Group’s agricultural activities comes primarily from sales of
agricultural produce and biological assets, from provision of
services related to the activity and from leases from
farmlands.
F- 41
Cresud Sociedad Anónima,
Comercial, Inmobiliaria, Financiera y Agropecuaria
Notes to the Consolidated
Financial Statements
(Continued)
(All amounts in
millions of Argentine Pesos, except otherwise
indicated)
2.
Summary of significant accounting
policies
(Continued)
The Group
recognizes revenue on product sales when the agricultural produce
or biological assets are delivered and the customers take ownership
and assume risk of loss, which is when the products are received by
the customer at its or a designated location or collected directly
by the customer from the cultivation bases, collection of the
relevant receivable is probable and the selling price is fixed or
determinable. Net sales of products represent the invoiced value of
goods, net of trade discounts and allowances, if any.
The Group also
provides agricultural-related (including but not limited to
watering and feedlot services) and brokerage services to third
parties. Revenue from services is recognized as services are
rendered.
The Group also
leases land to third parties under operating lease agreements.
Lease income is recognized on a straight-line basis over the period
of the lease.
Investment property activities:
●
Rental
and services - Shopping centers portfolio
Revenues derived
from business activities developed in the Group’s shopping
centers mainly include rental income under operating leases,
admission rights, commissions and revenue from several services
provided to the Group’s lessees.
Rental income from
shopping center properties leased out under operating leases,
admission rights and fees related to their real estate agent
business are recognized in the statements of income on a
straight-line basis over the term of the leases. When lease
incentives are granted, they are recognized as an integral part of
the net consideration for the use of the property and are therefore
recognized on the same straight-line basis.
Contingent rents,
being lease payments that are not fixed at the inception of a
lease, are recorded as income in the years in which they are
earned. Rent reviews are recognized when such reviews have been
agreed with tenants.
Lease contracts
also provide that common area maintenance charges and collective
promotion funds of the Group’s shopping centers are borne by
the corresponding lessees, generally on a proportionally basis.
These common area maintenance charges include all such expenses
convenient and necessary for various purposes including, but not
limited to, the operation, maintenance, management, safety,
preservation, repair, supervision, insurance and enhancement of the
shopping centers. The lessor is responsible for determining the
need and suitability of incurring a common area expense. The Group
makes the original payment for such expenses, which are then
reimbursed by the lessees. The Group considers that it acts as a
principal in these cases. Service charge income is presented
separately from property operating expenses. Property operating
expenses are expensed as incurred.
F- 42
Cresud Sociedad Anónima,
Comercial, Inmobiliaria, Financiera y Agropecuaria
Notes to the Consolidated
Financial Statements
(Continued)
(All amounts in
millions of Argentine Pesos, except otherwise
indicated)
2.
Summary of significant accounting
policies
(Continued)
●
Rental
and services - Offices and other rental properties
Rental income from
offices and other rental properties include rental income from
office leased out under operating leases, income for services and
expenses recovery paid from tenants.
Rental income from
offices and other rental properties leased out under operating
leases is recognized in the income statements on a straight-line
basis over the term of the leases. When lease incentives are
granted, they are recognized as an integral part of the net
consideration for the use of the property and are therefore
recognized on the same straight-line basis.
Lease contracts
also provide that common area maintenance expenses of the
Group’s offices and other rental properties are borne by the
corresponding lessees, generally on a proportionally basis. These
common area maintenance expenses include all such expenses
convenient and necessary for various purposes including, but not
limited to, the operation, maintenance, management, safety,
preservation, repair, supervision, insurance and enhancement of the
offices and other rental properties. The Group makes the original
payment for such expenses, which are then reimbursed by the
lessees. The Group considered that it acts as a principal in these
cases. The Group accrues reimbursements from tenants for
recoverable portions of all these expenses as service charge
revenue in the period the applicable expenditures are incurred and
is presented separately from property operating expenses. Property
operating expenses are recognized as incurred.
●
Revenue
from supermarkets
Revenue from the
sale of goods in the ordinary course of business are recognized at
the fair value of the consideration collected or receivable, net of
returns and discounts. When the credit term is short and financing
is that typical in the industry, consideration is not discounted.
When the credit term is longer than the industry’s average,
in accounting for the consideration, the Group discounts it to its
net present value by using the client’s risk premium or the
market rate. The difference between the fair value and the nominal
amount is accounted for under financial income. If discounts are
granted and their amount can be measured reliably, the discount is
recognized as a reduction of revenue.
Generally, the
Group recognizes revenue upon delivery of goods to the client. In
international sales, revenue is recognized upon loading goods with
the forwarder. Where two or more products are sold under one single
contract, the Group separates each component and gives them a
separate accounting treatment. The attribution of value to each
component is based on the relative fair value of each unit. Should
the fair value not be measurable on a reliable basis, then revenue
is attributed based on the difference arising between the total
amount of the executed contract and the fair value of the goods
delivered.
F- 43
Cresud Sociedad Anónima,
Comercial, Inmobiliaria, Financiera y Agropecuaria
Notes to the Consolidated
Financial Statements
(Continued)
(All amounts in
millions of Argentine Pesos, except otherwise
indicated)
2.
Summary of significant accounting
policies
(Continued)
As regards client
loyalty programs, the fair value of the consideration received or
receivable in relation to the initial sale is allocated across the
rewards credits and the other components of the sale. The amount
allocated to rewards credits is estimated based on the market value
of the goods to be delivered. The fair value of the right to
purchase products at a discount is calculated considering the
expected exchange ratio and the expected terms. Such amount is
deferred and revenue is recognized only where rewards credits are
exchanged and the Group has complied with its obligation to provide
the products at a discount, or else when such reward credits have
expired. The amount of revenue recognized under such circumstances
is based on the number of reward credits that have been exchanged
for products with discounts, in relation to the total number of
reward credits expected to be exchanged. Deferred revenue is then
reversed when reward credits are no longer likely to be
exchanged.
In addition, when
the Group acts as agent and not as main supplier in a transaction,
revenue is recognized at the net amount of commissions. Revenue
from commissions is recognized based on transactions conducted by
credit card companies at the rate and on the date they are
credited. Revenue from credit margins of credit cards is recognized
on the date the client is bound to pay and revenue for subscription
fees is recognized on a monthly basis.
●
Revenue
from communication services and sale of communication
equipment
Revenue derived
from the use of communication networks by the Group, including
mobile phones, Internet services, international calls, fixed line
calls, interconnection rates and roaming service rates, are
recognized when the service is provided, proportionally to the
extent the transaction has been realized, and provided all other
criteria have been met for revenue recognition.
Revenue from the
sale of mobile phone cards are initially recognized as deferred
revenue and then recognized as revenue as they are used or upon
expiration, whichever takes place earlier.
A transaction
involving the sale of equipment to a final user normally also
involves a service sale transaction. In general, this type of sale
is performed without a contractual obligation by the client to
consume telephone services for a minimum amount over a
predetermined period. As a result, the Group records the sale of
equipment separately and recognizes revenue pursuant to the
transaction value upon delivery of the equipment to the client.
Revenue from telephone services are recognized and accounted for as
they are provided. When the client is bound to make a minimum
consumption of services during a predefined period, the contract
formalizes a transaction of several elements and, therefore,
revenue from the sale of equipment is recorded at an amount that
should not exceed its fair value, and is recognized upon delivery
of the equipment to the client and provided the criteria for
recognition are met. The Group ascertains the fair value of
individual elements, based on the price at which it is normally
sold, after taking into account the relevant
discounts.
F- 44
Cresud Sociedad Anónima,
Comercial, Inmobiliaria, Financiera y Agropecuaria
Notes to the Consolidated
Financial Statements
(Continued)
(All amounts in
millions of Argentine Pesos, except otherwise
indicated)
2.
Summary of significant accounting
policies
(Continued)
Revenue derived
from long-term contracts is recognized at the present value of
future cash flows, discounted at market rates prevailing on the
transaction date. Any difference between the original credit and
its net present value is accounted for as interest income over the
credit term.
●
Revenue from tourism services
Revenue from the
provision of tourist services is recognized when the following
conditions are met:
●
the
revenue amount may be reliably measured;
●
the economic benefits associated to the transaction are expected to
have an impact on the Group;
●
the
degree of completion of the transaction may be measured on a
reliable basis; and
●
expenses incurred in relation to the transaction as well as all
necessary costs to finalize the transaction may be reliably
measured.
2.24.
Cost
of sales
The cost of sales
of supermarkets, includes the acquisition costs for the products
less discounts granted by suppliers, as well as all expenses
associated with storing and handling inventories. It also includes
operational and management costs for shopping centers held by the
Group as part of its real estate investments.
The Group’s
cost of sales in relation to the supply of communication services
mainly includes the costs to purchase equipment, salaries and
related expenses, service costs, royalties, ongoing license dues,
interconnection and roaming expenses, cell tower lease costs,
depreciation and amortization expenses and maintenance expenses
directly related to the services provided.
2.25.
Share
capital
Ordinary shares are
classified as equity. Incremental costs directly attributable to
the issue of new ordinary shares or options are shown in equity as
a deduction, net of tax, from the proceeds from this
issuance.
When any Group
company purchases the Company’s equity share capital
(treasury shares), the consideration paid, including any directly
attributable incremental costs (net of income taxes) is deducted
from equity attributable to the Company’s equity holders
until the shares are cancelled or reissued. When such ordinary
shares are subsequently reissued, any consideration received, net
of any directly attributable incremental transaction costs and the
related income tax effects, is included in equity attributable to
the Company’s equity holders.
F- 45
Cresud Sociedad Anónima,
Comercial, Inmobiliaria, Financiera y Agropecuaria
Notes to the Consolidated
Financial Statements
(Continued)
(All amounts in
millions of Argentine Pesos, except otherwise
indicated)
2.
Summary of significant accounting
policies
(Continued)
Instruments issued
by the Group that will be settled by the Company delivering a fixed
number of its own equity instruments in exchange for a fixed amount
of cash or another financial asset are classified as
equity.
2.26.
Comparability
of information
Balance items as of
June 30, 2015 and 2014 shown in these financial statements for
comparative purposes arise from the Consolidated Financial
Statements then ended. Certain reclassifications have been made in
order to present figures comparatively with those of this year. See
Note 2.1 (a)
As required by IFRS
3, the information of IDBD is included in the consolidated
financial statements of the Group as from the acquisition date, and
the prior periods are not modified by this situation. Therefore,
the consolidated financial information for years after the
acquisition is not comparative with prior years.
During the fiscal
year ended June 30, 2016, the Argentine Peso devalued against the
US$ and other currencies by around 65%. This has an impact in
comparative information presented in these Financial Statements,
due mainly to the currency exposure of our income and costs of
Agricultural Business and of income from Urban properties and
investments business line, especially from the “office and
other rental properties” segment, and our net assets and
liabilities (mainly assets and liabilities of the Operations Center
in Israel), in foreign currency.
Moreover, during
the year ended June 30, 2016, the Brazilian Reais (Rs.) has
depreciated against the Argentine Peso and other currencies by
around 17%, respectively, which affects the comparability of the
figures reported in the current financial statements given its
negative impact on the financial position and results of operations
of the Group, due mainly to the foreign exchange rate exposure to
net assets and liabilities denominated in foreign currency and
investments in joint ventures with a functional currency different
from the Brazilian Reais.
2.27.
Irrevocable
right of use of the capacity of underground communication
lines
Transactions
carried out to acquire an irrevocable right of use of the capacity
of underground communication lines are accounted for as service
contracts. The amount paid for the rights of use of the
communication lines is recognized as “Prepaid expenses”
under trade and other receivables, and is amortized over a
straight-line basis during the period set forth in the contract
(including the option term), which is the estimated useful life of
such capacity.
F- 46
Cresud Sociedad Anónima,
Comercial, Inmobiliaria, Financiera y Agropecuaria
Notes to the Consolidated
Financial Statements
(Continued)
(All amounts in
millions of Argentine Pesos, except otherwise
indicated)
3.
Acquisitions
and disposals
A.
IDBD
(a)
Control obtainment
On May 7, 2014, a
transaction was agreed whereby the Group, acting indirectly through
Dolphin, acquired jointly with ETH (a non-related company
established under the laws of the State of Israel to the Company
best knowledge controlled by Mordechay Ben Moshé), an
aggregate number of 106.6 million common shares in IDBD,
representing 53.30% of its stock capital, under the scope of the
debt restructuring arrangement of IDBH, IDBD's parent company, with
its creditors (the "Arrangement").
Under
the terms of the agreement entered into between Dolphin and ETH
(the "Shareholders' Agreement"), Dolphin acquired a 50% interest in
this investment, and ETH acquired the remaining 50%. The total
initial investment amount was NIS 950 million, equivalent to
approximately US$ 272 million at the exchange rate prevailing on
that date.
On
May 28, 2015, ETH launched the BMBY mechanism provided in the
Shareholders’ Agreement (clause which establishes that each
party of the Shareholders’ Agreement may offer to the
counterparty to acquire (or sell, as the case may be), the shares
it holds in IDBD at a fixed price). In addition, ETH further added
that the purchaser thereunder required to assume all obligations of
seller.
On
June 10 and 11, 2015, Dolphin gave notice to ETH of its intention
to buy all the shares of IDBD held by ETH.
After
certain aspects of the tender offer were resolved through an
arbitration process brought by Dolphin and ETH, on September 24,
2015, the competent arbitrator resolved that:
(i)
Dolphin
and IFISA (related Company to the Group) were entitled to act as
buyers in the BMBY process, and ETH had to sell all IDBD shares
held by it (92,665,925 shares) at price of NIS 1.64 per
share;
(ii)
The
buyer had to fulfill all of the commitments included in the
Arrangement, including the commitment to carry out Tender Offers
whose responsibility belonged to Dolphin;
(iii)
The
buyer had to pledge the shares that seller had pledged to them in
favor of the Arrangement trustees.
On October 11,
2015, the BMBY process concluded, and IFISA acquired all IDBD's
shares of stock held by ETH. Consequently, the Shareholders'
Agreement ceased and members of IDBD's Board of Directors
representing ETH submitted their irrevocable resignation to the
Board Dolphin was hence empowered to appoint the new members to the
Board. Additionally, on the same date, Dolphin pledged additional
shares as collateral to secure compliance with the IDBD stock
purchase agreement, thereby increasing the number of pledged shares
to 64,067,710. Consequently, the Group gained control of IDBD and
started to consolidate financial statements as from that
date.
F- 47
Cresud Sociedad Anónima,
Comercial, Inmobiliaria, Financiera y Agropecuaria
Notes to the Consolidated
Financial Statements
(Continued)
(All amounts in
millions of Argentine Pesos, except otherwise
indicated)
3.
Acquisitions and disposals
(Continued)
In addition to the
competent arbitrator’s decision issued on September 24, 2015,
ETH and Dolphin still have counterclaims of different kinds which
are subject to such arbitration proceeding. As of the filing date
of these financial statements, the proceeding is still being
heard.
The following chart
shows the consideration, the fair value of the acquired assets, the
assumed liabilities and the non-controlling interest as of the
acquisition date.
|
|
10.11.15
|
|
Fair
value of the interest in IDBD’s equity held before the
business combination and warrants
|
1,416
|
|
Total consideration
|
1,416
|
|
|
10.11.15
|
|
Fair value of identifiable assets and assumed
liabilities:
|
|
|
Investment
properties
|
29,586
|
|
Property,
plant and equipment
|
15,104
|
|
Intangible
assets
|
6,603
|
|
Investment
in joint ventures and associates
|
9,268
|
|
Financial
assets and other assets held for sale
|
5,129
|
|
Trading
properties
|
2,656
|
|
Inventories
|
1,919
|
|
Income tax credits for the
year
|
91
|
|
Trade
and other receivables
|
9,713
|
|
Investments in financial
assets
|
5,824
|
|
Cash
and cash equivalents
|
9,193
|
|
Deferred
income tax
|
(4,681)
|
|
Provisions
|
(969)
|
|
Borrowings
|
(60,306)
|
|
Derivative
financial instruments, net
|
(54)
|
|
Income tax liabilities
|
(267)
|
|
Employee
benefits
|
(405)
|
|
Trade
and other payables
|
(19,749)
|
|
Total net identifiable assets
|
8,655
|
|
Non-controlling
interest
|
(8,630)
|
|
Goodwill
|
1,391
|
|
Total
|
1,416
|
The Group assessed
the fair value of the investment property with the assistance of
qualified independent appraisers. As of the acquisition date, the
Group estimates that recognized assets are recoverable. The value
of the non-controlling interest in IDBD has been determined on a
proportional basis to the fair value of net acquired assets and the
fair value of warrants.
Following the
control of IDBD, the cumulative currency translation accumulated in
shareholders’ equity from the interest held in IDBD before
the business combination in the amount of Ps. 91 was recognized in
the statement of income. Such result was disclosed under "Other
operating results, net" line in the statement of
income.
F- 48
Cresud Sociedad Anónima,
Comercial, Inmobiliaria, Financiera y Agropecuaria
Notes to the Consolidated
Financial Statements
(Continued)
(All amounts in
millions of Argentine Pesos, except otherwise
indicated)
3.
Acquisitions and disposals
(Continued)
The revenues IDBD
has generated since October 11, 2015 and that have been disclosed
in the consolidated statement of income amount to Ps. 28,229. IDBD
has also run a net result of Ps. (1,984) during said period. If
IDBD had been included in the consolidation since July 1st, 2015,
the Group´s consolidated income statement would have shown
pro-forma revenues in the amount of Ps. 49,637 and pro-forma net
result of Ps. (1,992).
Later on, following the exercise of BMBY, Dolphin
has entered into an option agreement with IFISA that grants Dolphin
the right, but not the obligation, to acquire 92,665,925 shares in
IDBD which IFISA acquired in the BMBY process at a price per share
of NIS 1.64 plus an annual interest rate of 8.5%. The exercise date
for the option extends for two years. Additionally, Dolphin is
entitled to a first refusal right in case that IFISA agrees to sell
these shares to a third party. The value of the option agreement as
of June 30, 2016 is zero
.
(b)
Acquisition of non-controlling interest
Dolphin
was required to carry out the first tranche of tender offers in
December 2015. Before expiration of such first tranche, Dolphin and
the agreement trustees (the " trustees") entered into an extension
agreement (the "Extension Agreement"), which was replaced by the
final agreement approved by approximately 95% of the
non-controlling shareholders of IDBD (excluding IFISA) and by
warrants holders of IDBD on March 2, 2016 and by the competent
court on March 10, 2016. The major amendments to the Agreement
were:
(i)
Replacement
of the obligation to conduct tender offers as previously
established under an agreement whereby Dolphin would purchase all
the shares outstanding on March 29, 2016 from non-controlling
shareholders of IDBD (except for those held by IFISA) on March 31,
2016. On March 29, 2016, all IDBD shares would cease to be traded
in the TASE. On that date, all IDBD warrants held by
non-controlling shareholders would expire and Dolphin would make
capital contributions to IDBD or grant subordinate loans, as
described hereafter.
(ii)
The
price to be paid for each IDBD share held by non-controlling
shareholders on March 29, 2016 would be NIS 1.25 in cash, plus NIS
1.20 adjusted nominal value in bonds of the IDBD Series 9 (the
“IDBD Bonds”), which IDBD will issue directly to
non-controlling shareholders and holders of warrants, and Dolphin
will inject funds into IDBD equal to the adjusted nominal value of
IDBD Bonds. Additionally, Dolphin would undertake to pay NIS 1.05
(subject to adjustments) in cash if Dolphin, either directly or
indirectly, gain control of Clal, or else if IDBD sells a
controlling shareholding in Clal under certain parameters (the
“Clal payment”), which refers mainly to Clal’s
sale price (at a price which exceeds 75% of its book value upon
execution of the sale agreement, subject to adjustments) and, under
certain circumstances, the proportion of Clal shares sold by
IDBD.
F- 49
Cresud Sociedad Anónima,
Comercial, Inmobiliaria, Financiera y Agropecuaria
Notes to the Consolidated
Financial Statements
(Continued)
(All amounts in
millions of Argentine Pesos, except otherwise
indicated)
3.
Acquisitions and disposals
(Continued)
(iii)
The
warrants held by non-controlling shareholders that have not been
exercised until March 28, 2016 expired on March 31, 2016. Each
warrant holder was entitled to elect whether: (a) to receive IDBD
bonds (based on the adjusted nominal value) in an amount equal to
the difference between NIS 2.45 and the exercise price of the
warrants and be entitled to the Clal payment; or (b) to receive a
payment determined by an independent appraiser.
(iv)
Dolphin
compromised that would provide IDBD a total amount of NIS 515
million (the “Contribution to IDBD”), out of which it
has already contributed NIS 15 million in February 2016 and NIS 85
million in March 2016. The amount injected to IDBD would be reduced
by any capital contribution resulting from the exercise of warrants
held by non-controlling shareholders (maximum amount of
approximately NIS 37.5 million). The contribution to IDBD would
further cover the IDBD Bonds necessary to comply with the
transactions described above (between NIS 166.5 million and NIS 178
million), and the balance would be contributed until completing the
amount committed by Dolphin either as a capital contribution or as
a subordinated loan (between NIS 284.5 million and NIS 333.5
million).
(v)
Dolphin
had to pledge 28% of its IDBD shares, as well as all rights held by
Dolphin in relation to the subordinated loan granted in the amount
of NIS 210 million in December 2015, until the payment obligation
for Clal has been completed or has expired, after which the pledge
will be discharged. Should new shares be issued by IDBD, Dolphin
will have to pledge additional shares until completing the 28% of
all IDBD share capital. This pledge supersedes the existing pledge
on approximately 64 million shares of IDBD and all Dolphin’s
rights in relation to the Subordinated Loan.
(vi)
Additionally,
Dolphin agreed not to exercise its right to convert the
subordinated loans into shares of IDBD until the pledge described
above has been released. Should the pledge on subordinated loans be
exercised by the Arrangement Trustees, then those trustees may
convert the subordinated loans into shares; however, in such case,
the maximum percentage of the IDBD capital that may be pledged is
35%, and any shares in excess of such amount will be released from
the pledge.
As
a result of the description above, on March 31, 2016: (i) Dolphin
acquired all shares from IDBD’ non-controlling shareholders
(except for IFISAS), (ii) all warrants held by IDBD non-controlling
shareholders expired, and (iii) Dolphin made additional
contributions to IDBD via subordinated loans pursuant to the
agreement. All commitments to invest in IDBD by Dolphin have been
fully complied so that the only obligation still pending is the
Clal payment, provided the conditions herein described are met.
Additionally, Dolphin is bound to exercise its warrants in the
event the following conditions occur jointly:
(i)
An
agreement is reached to renegotiate the debt covenants of IDBD and
its subsidiaries;
(ii)
Control
over Clal is secured.
F- 50
Cresud Sociedad Anónima,
Comercial, Inmobiliaria, Financiera y Agropecuaria
Notes to the Consolidated
Financial Statements
(Continued)
(All amounts in
millions of Argentine Pesos, except otherwise
indicated)
5.
Acquisitions and disposals
(Continued)
Should
both situations take place, the obligation would amount to NIS 391
million. The warrants mature on February 10, 2018.
As
of June 30, 2016, IRSA’s indirect interest in IDBD was 68.28%
without considering dilution.
The
transaction described above represented the acquisition of an
additional interest of 19.28% in IDBD for a total amount of Ps.
1,249. As a result of this transaction, the non-controlling
interest was increased by Ps. 346 and the interest attributable to
the shareholders’ of the controlling parents was increased by
Ps. 234.
B.
Acquisition
and disposal of investment properties
During
the fiscal year ended June 30, 2016, the Group has sold certain
floors corresponding to Maipú 1300 Building, Intercontinental
Plaza, all the floors corresponding to Dique IV and Isla Sirgadero,
among others for a total amount of Ps. 1,393. All sales mentioned
above led to a combined profit for the Group of Ps. 1,101,
disclosed within the line “Gain from disposal of investment
properties” in the statement of income.
During
the fiscal year ended June 30, 2015, the Group acquired five plots
of farmlands in Luján for Ps. 210 and, through IRSA CP, a plot
of land in Córdoba for Ps. 3.1. Additionally the Group has
sold floors corresponding to Maipú 1300 building,
Intercontinental Plaza, Bouchard 551, the entire Madison 183
building and parking spaces in Bouchard 551, Libertador 498 and
Maipú 1300 for a total amount of Ps. 2,447. All sales
mentioned above led to a combined profit for the Group of Ps.
1,150, disclosed within the line “Gain from disposal of
investment properties” in the statement of
income.
During
the fiscal year ended June 30, 2014, the Group acquired, through
IRSA CP, a building next to Alto Palermo Shopping for US$ 3.8
million. Additionally the Group sold floors corresponding to
Maipú 1300 building, Bouchard 551 and the entire buildings
Mayo 589, Rivadavia 565, Costeros Dique IV Constitución 1159
and parking spaces in Maipú 1300, Bouchard 551 and Libertador
498 buildings for a total amount of Ps. 402. All sales mentioned
above led to a combined profit for the Group of Ps. 231, disclosed
within the line “Gain from disposal of investment
properties” in the statement of income.
C.
Changes
in non-controlling interest
IRSA
During the fiscal
year ended June 30, 2016, the Group sold a 0.93% interest in IRSA
for a total amount of Ps. 86.4. This resulted in an increase in
non-controlling interests of Ps. 20.6 and a increase in equity
attributable to holders of the parent of Ps. 40.3, net of tax
effect.
F- 51
Cresud Sociedad Anónima,
Comercial, Inmobiliaria, Financiera y Agropecuaria
Notes to the Consolidated
Financial Statements
(Continued)
(All amounts in
millions of Argentine Pesos, except otherwise
indicated)
3.
Acquisitions and disposals
(Continued)
During the fiscal
year ended June 30, 2015, the Group sold a 1.81% interest in IRSA
for a total amount of Ps. 181.8. This resulted in an increase in
non-controlling interests of Ps. 33.7 and a increase in equity
attributable to owners of the parent of Ps. 97.7, net of tax
effect.
The effects of
disposals of the ownership interest of IRSA on the equity
attributable to owners of the Group is summarized as
follows:
|
|
June
30,
2016
Ps.
|
|
June
30,
2015
Ps.
|
|
Carrying amount of
the non-controlling interests sold by the Group
|
(20.6)
|
|
(33.7)
|
|
Consideration
collected
|
86.4
|
|
181.8
|
|
Tax
effect
|
(25.5)
|
|
(50.4)
|
|
Reserve
recorded in equity
|
40.3
|
|
97.7
|
During the fiscal
year ended June 30, 2015, the Group acquired a 0.65% interest in
IRSA for a total amount of Ps. 50.7. This resulted in a decrease in
non-controlling interests of Ps. 12.7 and an decrease in equity
attributable to holders of the parent of Ps. 38, net of tax
effect.
The effect of
acquisition of the ownership interest of IRSA on the equity
attributable to owners of the Group is summarized as
follows:
|
|
June
30,
2015
Ps.
|
|
Carrying amount of
group’s interest acquired of
|
12.7
|
|
Consideration paid
for non-controlling interests
|
(50.7)
|
|
Reserve
recorded in equity
|
(38.0)
|
On June 10, 2014,
the Board of Directors of IRSA resolved to finish the stock
repurchase plan that was approved by resolution of the Board on
July 25, 2013, and modified by resolutions adopted on September 18,
2013, October 15, 2013 and October 22, 2013. During the term of the
Stock Repurchase Plan, IRSA has repurchased 4,904,697 shares for an
aggregate amount of Ps. 37,905,631.
Dolphin
During
year 2015, the Group through its subsidiaries, contributed an
amount of US$ 146 million in Dolphin. Such amount was also
allocated to increase Dolphin’s investment in IDBD. This
resulted in a decrease in non-controlling interests of Ps. 21 and
an increase in equity attributable to the holders of the
parent.
F- 52
Cresud Sociedad Anónima,
Comercial, Inmobiliaria, Financiera y Agropecuaria
Notes to the Consolidated
Financial Statements
(Continued)
(All amounts in
millions of Argentine Pesos, except otherwise
indicated)
3.
Acquisitions and disposals
(Continued)
D.
Sale
of Farmlands
Cresca
On April 3, 2014,
Cresca S.A. signed a bill of sale whereby it sells an area of
24,624 hectares located in Chaco Paraguayo. The total price was US$
14.7 million (equivalents to Ps. 116.9), which amount shall be
collectable as follows: US$ 1.8 million (equivalents to Ps. 14.3)
were collected upon the execution of the bill of sale, US$ 4.3
million (equivalents to Ps. 34.2) upon execution of the conveyance
deed; US$ 3.7 million (equivalents to Ps. 33.1) interest-free
between April and July, 2015; and US$ 4.9 million (equivalents to
Ps. 73.1) interest-free were collected in July, 2016, thus being
canceled all the mortgage had been granted in guarantee price
balance. Possession was delivered upon execution of the conveyance
deed. The Group has recognized gains of Ps. 19.1 as result of this
transaction.
Cremaq
On June 10, 2015,
Brasilagro sold the remaining area of 27,745 hectares of Cremaq
field, an establishment, located in the municipality of Baixa
Grande do Ribeiro (Piaui). The transaction price was fixed at Rs.
270 million (equal to Ps. 694), which have already been fully
collected, and Rs. 49.7 million (equal to Ps. 127.7) of which
remain under “Restricted Assets” on condition that the
public deed for 6,020 be registered and that an agreement for the
termination of possessory actions related to a disputed fraction be
notarized. The Group has recognized gains of Ps. 525.9 as result of
this transaction.
La Fon Fon II
On October 17,
2013, Yuchán signed a purchase-sale agreement involving a sale
subject to retention of title involving 1,643 hectares of "La Fon
Fon II" for an overall amount of US$ 7.21 million (equivalents to
Ps. 59). As of the balance sheet date, the amount of US$ 7.1
million (equivalents to Ps. 58.1) has been collected, and the
remaining balance amounts to US$ 0.12 million (equivalents to Ps.
0.9) that will be cancelled in 2 installments, starting in December
this year, and concluding in December 2017. Under the contract, the
conveyance will be recorded with the Registry once the price has
been fully paid off. On June 24, 2015, possession was granted by
Yuchán. During the year 2015 the Group recognized a profit
before tax of US$ 2.7 million (equivalents to Ps. 24.6) as result
of this transaction.
Araucária
On June 27, 2014,
Brasilagro sold a total area of 1,164 hectares of Araucaria
field.
The sale was priced
at Rs. 32.5 million (Ps. 117.5). The Group recorded a profit before
tax on the sale of the Araucaria farmland for an amount of Rs. 21.0
million (or Ps. 75.8).
F- 53
Cresud Sociedad Anónima,
Comercial, Inmobiliaria, Financiera y Agropecuaria
Notes to the Consolidated
Financial Statements
(Continued)
(All amounts in
millions of Argentine Pesos, except otherwise
indicated)
3.
Acquisitions and disposals
(Continued)
San Cayetano
On May 27, 2014,
Ombú signed a purchase-sale agreement involving a sale subject
to retention of title involving 883 hectares of "San Cayetano I"
establishment for an overall amount of US$ 4.2 million (equivalents
to Ps. 31).
On June 20, 2016,
an Agreement was signed to modify a Purchase-Sale Private Deed with
Reserve of Property Rights where the precise area of the property
has been determined to cover 855,3213; the parties have agreed to
adjust the sale price of the property by deduction US$ 0.1 million
(Ps. 1.4) from the total price.
The amount of US$
3.2 million (Ps. 23.6) of the price has already been paid, and the
balance will be paid in three installments, with the last
installment being due upon execution of the title conveyance
deed.
Under the contract,
the conveyance shall be recorded once the price has been fully
collected off. Possession was granted upon execution of the
contract. The Group recorded a gain of US$ 1.8 million (Ps.15.6) on
the sale.
E.
Acquisition
of additional interest in BHSA
During the year
ended June 30, 2015, the Group acquired 3,289,029 additional shares
of BHSA in a total amount of Ps. 14.2, thus increasing its interest
in such company from 29.77% to 29.99%, without consideration of
treasury shares. During the year ended June 30, 2016, the Group
sold 1,115,165 shares of BHSA in a total amount of Ps. 7.7, thus
increasing its interest to 29.91%, without considering treasury
shares.
F.
Disposal
of financial assets
During August 2014,
IRSA has sold through its subsidiary, Real Estate Investment Group
IV, the balance of 1 million shares in Hersha Hospitality Trust, at
an average price of US$ 6.74 per share.
G.
Sale
of Associates
On February 5,
2014, the Group, through Ritelco, sold its interest in Bitania,
representing 49% of its capital stock, for an amount of US$ 4.2
million. Such transaction generated a net gain of approximately Ps.
13.3 which are shown in the line "Other operating results, net" in
the statement of income.
F- 54
Cresud Sociedad Anónima,
Comercial, Inmobiliaria, Financiera y Agropecuaria
Notes to the Consolidated
Financial Statements
(Continued)
(All amounts in
millions of Argentine Pesos, except otherwise
indicated)
3.
Acquisitions and disposals
(Continued)
H.
BACS
The Group through
Tyrus, subscribed a purchase-sale agreement of shares of BACS,
representing an interest of 6.125%. The transaction amounts to US$
1.35 million. This operation is yet to be approved by the BCRA as
of June 30, 2016, according to regulations in force. The advance
payment related to this transaction is disclosed in “Trade
and other receivables”. On August 24, 2016 the operation was
approved by the BCRA.
The Group through
IRSA, on June 17, 2015, subscribed Convertible Notes, issued by
BACS for a nominal value of 100,000,000, which are convertible into
common shares.
On June 21, 2016 we
notified BACS on their right to convert all of the Convertible
notes into common shares.
As a consequence,
BACS initiated the relevant diligence before the Argentine Central
Bank in order to secure the authorization to issue the shares in
our favor.
I.
Rigby
capital reduction
On October 17,
2014, Rigby reduced its capital stock by distributing among
existing shareholders, proportionally to their shareholdings, the
gain made on the sale of the Madison building. The total amount
distributed is US$ 103.8
million
, of which the Group received US$
77.4 million (US$ 26.5 million through IRSA International and US$
50.9 million through IMadison LLC) and US$ 26.4 million were
distributed to other shareholders. As a result of such reduction,
the Group has decided to reverse the corresponding accumulated
conversion difference on a pro rata basis, which amounted to Ps.
188.3. This reversal has been recognized in the line “Other
operating results, net" in the statement of income.
4.
Financial
risk management and fair value
The Group's
activities expose it to a variety of financial risk: market risk
(including foreign currency risk, interest rate risk, indexing risk
due to specific clauses and other price risk), credit risk,
liquidity risk and capital risk. Within the Group, risk management
functions are conducted in relation to financial risks associated
to financial instruments to which the Group is exposed during a
certain period or as of a specific date.
The general risk
management policies of the Group and seek both to minimize adverse
potential effects on the financial performance of the Group and to
manage and control the financial risks effectively. The Group uses
financial instruments to hedge certain risk exposures when deemed
appropriate based on its internal management risk policies, as
explained below.
F- 55
Cresud Sociedad Anónima,
Comercial, Inmobiliaria, Financiera y Agropecuaria
Notes to the Consolidated
Financial Statements
(Continued)
(All amounts in
millions of Argentine Pesos, except otherwise
indicated)
4.
Financial risk management and fair value
(Continued)
Given the diversity
of characteristics in the activities conducted under its business
and operations center, the Group has decentralized the risk
management policies based on two significant line of business: (i)
agricultural business and (ii) urban properties and investments
business, which is divided into two: (a) Argentina and (b) Israel,
in order to identify and properly analyze the various types of
risks to which each of the subsidiaries is exposed.
4.1 Risk
management in the Agricultural Business:
The risks
management function within the Group is carried out in respect of
financial risks. Financial risks are risks arising from financial
instruments to which the Group is exposed during or at the end of
the reporting year. Financial risk comprises market risk (including
foreign currency risk, interest rate risk and other price risk),
credit risk, liquidity risk and capital risk.
The Group’s
diverse activities are exposed to a variety of financial risks in
the normal course of business. The Group’s overall risk
management program focuses on the unpredictability of financial
markets and seeks to minimize the Group’s capital costs by
using suitable means of financing and to manage and control the
Group’s financial risks effectively. The Group uses financial
instruments to hedge certain risk exposures when deemed appropriate
based on its internal management risk policies.
The Group’s
principal financial instruments comprise cash and cash equivalents,
receivables, payables, interest bearing assets and liabilities,
other financial liabilities, other investments and derivative
financial instruments. The Group manages its exposure to key
financial risks in accordance with the Group’s risk
management policies.
The Group’s
management framework includes policies, procedures, limits and
allowed types of derivative financial instruments. The Group has
established a Risk Committee, comprising Senior Management and a
member of the Audit Committee, which reviews and oversees
management’s compliance with these policies, procedures and
limits and has overall accountability for the identification and
management of risk across the Group.
This section
provides a description of the principal risks and uncertainties
that could have a material adverse effect on the Group’s
strategy, performance, results of operations and financial
condition. The risks and uncertainties, set out below, do not
appear in any particular order of potential materiality or
probability of occurrence.
F- 56
Cresud Sociedad Anónima,
Comercial, Inmobiliaria, Financiera y Agropecuaria
Notes to the Consolidated
Financial Statements
(Continued)
(All amounts in
millions of Argentine Pesos, except otherwise
indicated)
4.
Financial risk management and fair value
(Continued)
4.1
Risk
management in the Agricultural Business
(Continued)
(a)
Market
risk management
Market risk is the
risk that the fair value or future cash flows of a financial
instrument will fluctuate because of changes in market prices. The
Group’s market risks arise from open positions in foreign
currencies, interest-bearing assets and liabilities, commodity
price risk and equity securities price risks, to the extent that
these are exposed to general and specific market movements.
Management sets limits on the exposure to these risks that may be
accepted, which are monitored on a regular basis.
Foreign exchange risk and associated derivative financial
instruments:
The Group publishes
its consolidated financial statements in Argentine pesos but
conducts operations and holds positions in other currencies. As a
result, the Group is exposed to foreign currency exchange risk
through exchange rate movements, which affect the value of the
Group’s foreign currency positions. Foreign exchange risk
arises when future commercial transactions or recognized assets or
liabilities are denominated in a currency that is not the
entity’s functional currency.
The commercial
and/or agro-industrial activities of the Group's subsidiaries are
primarily developed in Argentina and have as functional currency
the Argentine Peso. The agricultural activities of the
Group’s subsidiaries are primarily developed in Argentina,
Brazil and Bolivia, where the functional currencies are the
respective local currencies. An important part of the business
activities of these subsidiaries is conducted in such local
currencies, thus not exposing the Group to foreign exchange risk.
Net financial position exposure to the functional currencies is
managed on a case-by-case basis, partly by entering into foreign
currency derivative instruments and/or by borrowing in foreign
currencies, or other methods, considered adequate by the
Management, according to circumstances.
Financial
instruments are considered sensitive to foreign exchange rates only
when they are not in the functional currency of the entity that
holds them. The following table shows the net carrying amounts of
its financial instruments denominated in US$, broken down by
functional currency in which the Company operates, for the years
ended June 30, 2016 and 2015. The amounts are presented in
Argentine Pesos, the presentation currency of the
Group:
|
|
|
Net
monetary position (Liability)/Asset (in million)
|
|
Net
monetary position (Liability)/Asset (in million)
|
|
|
|
June
30, 2016
|
|
June
30, 2015
|
|
Functional
currency
|
|
US$
|
|
US$
|
|
Argentine
Peso
|
|
(3,303)
|
|
(1,618)
|
|
Brazilian
Reais
|
|
268
|
|
153
|
|
Bolivian
Peso
|
|
(127)
|
|
(107)
|
|
Total
|
|
(3,162)
|
|
(1,572)
|
F- 57
Cresud Sociedad Anónima,
Comercial, Inmobiliaria, Financiera y Agropecuaria
Notes to the Consolidated
Financial Statements
(Continued)
(All amounts in
millions of Argentine Pesos, except otherwise
indicated)
4.
Financial risk management and fair value
(Continued)
4.1
Risk
management in the Agricultural Business
(Continued)
The Group estimates
that, other factors being constant, a 10% appreciation of the US
dollar against the respective functional currencies at year-end
would result in an additional loss before income tax for the year
ended June 30, 2016 and 2015 for an amount of Ps. 316 and Ps. 157,
respectively. A 10% depreciation of the US dollar against the
functional currencies would have an equal and opposite effect on
the statements of income.
On the other hand,
the Group also uses derivative instruments, such as forward foreign
exchange contracts to manage its exposure to foreign exchange risk.
As of June 30, 2016 the Group has future exchanges contract pending
for an amount of Ps. 25 (asset) and Ps. 31 (liability). As of June
30, 2015 there were future exchanges contract pending for an amount
of Ps. 10 (liability).
Interest rate risk:
The Group is
exposed to interest rate risk on its investments in debt
instruments, short-term and long-term borrowings and derivative
financial instruments.
The primary
objective of the Group’s investment activities is to preserve
principal while at the same time maximizing yields without
significantly increasing risk. To achieve this objective, the Group
diversifies its portfolio in accordance with the limits set by the
Group. The Group maintains a portfolio of cash equivalents and
short-term investments in a variety of securities, including both
government and corporate obligations and money market
funds.
The Group’s
interest rate risk principally arises from long-term borrowings
(Note 23). Borrowings issued at variable rates expose the Group to
cash flow interest rate risk. Borrowings issued at fixed rates
expose the Group to fair value interest rate risk. The Group
manages this risk by maintaining an appropriate mix between fixed
and floating rate interest bearing liabilities. These activities
are evaluated regularly to determine that the Group is not exposed
to interest rate movements that could adversely impact its ability
to meet its financial obligations and to comply with its borrowings
covenants.
The Group manages its cash flow interest rate risk
exposure by different hedging instruments, including but not being
limited to interest rate swap, depending on each particular case.
For example, interest rate swaps
have the economic effect of
converting borrowings from floating rates to fixed rates or
viceversa.
F- 58
Cresud Sociedad Anónima,
Comercial, Inmobiliaria, Financiera y Agropecuaria
Notes to the Consolidated
Financial Statements
(Continued)
(All amounts in
millions of Argentine Pesos, except otherwise
indicated)
4.
Financial risk management and fair value
(Continued)
4.1
Risk
management in the Agricultural Business
(Continued)
The interest rate
risk policy is approved by the Board of Directors. Management
analyses the Group’s interest rate exposure on a dynamic
basis. Various scenarios are simulated, taking into consideration
refinancing, renewal of existing positions and alternative
financing sources. Based on these scenarios, the Group calculates
the impact on profit and loss of a defined interest rate shift. The
scenarios are run only for liabilities that represent the major
interest-bearing positions. Trade payables are normally
interest-free and have settlement dates within one year. The
simulation is done on a regular basis to verify that the maximum
potential loss is within the limits set by management.
Note 23 shows a
breakdown of the Group’s fixed-rate and floating-rate
borrowings per currency denomination and functional currency of the
subsidiary issuing the loans for the years ended June 30, 2016 and
2015.
The Group estimates
that, other factors being constant, a 1% increase in floating rates
at year-end would decrease profit before income tax for the years
ended June 30, 2016 and 2015, in Ps. 70 and Ps. 14. A 1% decrease
in floating rates would have an equal and opposite effect on the
income statements.
This sensitivity
analysis provides only a limited, point-in-time view of this market
risk sensitivity of certain of the Group’s financial
instruments. The actual impact of the interest rate changes on the
Group’s financial instruments may differ significantly from
the impact shown in the sensitivity analysis.
Commodity price risk and associated derivative financial
instruments:
The Group’s
agricultural activities expose it to specific financial risks
related to commodity prices. Prices for commodities have
historically been cyclical, reflecting overall economic conditions
and changes in capacity within the industry, which affect the
profitability of entities engaged in the agricultural
industry.
Generally, the
Group uses derivative instruments to hedge risks arising out of its
agricultural business operations. The Group uses a variety of
commodity-based derivative instruments to manage exposure to price
volatility stemming from its integrated crop production activities.
These instruments consist mainly of crop forwards, future contracts
and put and call option contracts. Contract positions are designed
to ensure that the Group will receive a defined minimum price for
certain quantities of its production. The Group combines option
contracts with future contracts only as a means of reducing the
exposure towards the decrease in commodity prices, as being a
producer means that the price is uncertain until the time the
products are harvested and sold. The Group manages maximum and
minimum prices for each commodity and the idea is to choose the
best spot price at which to sell.
F- 59
Cresud Sociedad Anónima,
Comercial, Inmobiliaria, Financiera y Agropecuaria
Notes to the Consolidated
Financial Statements
(Continued)
(All amounts in
millions of Argentine Pesos, except otherwise
indicated)
4.
Financial risk management and fair value
(Continued)
4.1
Risk
management in the Agricultural Business
(Continued)
The Group generally
covers up to 50% of its crop production in order to finance its
operating costs. The hedge consists of taking positions on
purchased puts or sold futures and calls that assure a fixed exit
price. In the past, the Group has never kept a short position
greater than its crop inventories and does not intend to. On the
other hand, it is not the Group’s current intention to be
exposed in a long derivative position in excess of its actual
production.
The following
tables show the outstanding positions for each type of derivative
contract for the years ended June 30, 2016 and 2015. The amounts
are presented in thousands of Argentine Pesos.
|
|
|
June 30, 2016
|
||||||||
|
Type of derivative
contract
|
|
Tons
|
|
Margin
|
|
Premium paid or (collected)
|
|
Derivatives at fair value
|
|
Gain / (Loss) for valuation at fair value at year-end
|
|
Futures:
|
|
|
|
|
|
|
|
|
|
|
|
Sell
|
|
|
|
|
|
|
|
|
|
|
|
Corn
|
|
30,500
|
|
-
|
|
-
|
|
3
|
|
(4)
|
|
Soybeans
|
|
94,271
|
|
10
|
|
-
|
|
(29)
|
|
(15)
|
|
Purchase
|
|
|
|
|
|
|
|
|
|
|
|
Corn
|
|
11,100
|
|
-
|
|
-
|
|
(1)
|
|
-
|
|
Soybeans
|
|
2,300
|
|
-
|
|
-
|
|
-
|
|
-
|
|
Wheat
|
|
5,400
|
|
-
|
|
-
|
|
1
|
|
-
|
|
Options:
|
|
|
|
|
|
|
|
|
|
|
|
Sell put
|
|
|
|
|
|
|
|
|
|
|
|
Soybeans
|
|
12,247
|
|
-
|
|
(1)
|
|
-
|
|
-
|
|
Purchase put
|
|
|
|
|
|
|
|
|
|
|
|
Soybeans
|
|
12,747
|
|
-
|
|
5
|
|
3
|
|
(2)
|
|
Sale call
|
|
|
|
|
|
|
|
|
|
|
|
Soybeans
|
|
13,347
|
|
-
|
|
(4)
|
|
(7)
|
|
(3)
|
|
Wheat
|
|
2,900
|
|
-
|
|
-
|
|
-
|
|
(1)
|
|
Total
|
|
184,812
|
|
10
|
|
-
|
|
(30)
|
|
(25)
|
F- 60
Cresud Sociedad Anónima,
Comercial, Inmobiliaria, Financiera y Agropecuaria
Notes to the Consolidated
Financial Statements
(Continued)
(All amounts in
millions of Argentine Pesos, except otherwise
indicated)
4.
Financial risk management and fair value
(Continued)
4.1
Risk
management in the Agricultural Business
(Continued)
|
|
|
June 30, 2015
|
||||||||
|
Type of derivative
contract
|
|
Tons
|
|
Margin
|
|
Premium paid or (collected)
|
|
Derivatives at fair value
|
|
Gain / (Loss) for valuation at fair value at year-end
|
|
Futures:
|
|
|
|
|
|
|
|
|
|
|
|
Sell
|
|
|
|
|
|
|
|
|
|
|
|
Corn
|
|
8,600
|
|
1
|
|
-
|
|
(1)
|
|
(1)
|
|
Soybeans
|
|
107,727
|
|
5
|
|
-
|
|
(10)
|
|
(4)
|
|
Wheat
|
|
7,000
|
|
-
|
|
-
|
|
-
|
|
-
|
|
Purchase
|
|
|
|
|
|
|
|
|
|
|
|
Corn
|
|
1,400
|
|
-
|
|
-
|
|
-
|
|
-
|
|
Soybeans
|
|
2,200
|
|
-
|
|
-
|
|
-
|
|
-
|
|
Wheat
|
|
1,000
|
|
1
|
|
-
|
|
-
|
|
(1)
|
|
Options:
|
|
|
|
|
|
|
|
|
|
|
|
Sell put
|
|
|
|
|
|
|
|
|
|
|
|
Soybeans
|
|
9,952
|
|
(1)
|
|
-
|
|
(1)
|
|
(1)
|
|
Purchase put
|
|
|
|
|
|
|
|
|
|
|
|
Soybeans
|
|
20,412
|
|
-
|
|
3
|
|
1
|
|
(2)
|
|
Sale call
|
|
|
|
|
|
|
|
|
|
|
|
Soybeans
|
|
44,124
|
|
-
|
|
(3)
|
|
(7)
|
|
(4)
|
|
Total
|
|
202,415
|
|
6
|
|
-
|
|
(18)
|
|
(13)
|
|
|
|
June 30, 2014
|
||||||||
|
Type of derivative
contract
|
|
Tons
|
|
Margin
|
|
Premium paid or (collected)
|
|
Derivatives at fair value
|
|
Gain / (Loss) for valuation at fair value at year-end
|
|
Futures:
|
|
|
|
|
|
|
|
|
|
|
|
Sell
|
|
|
|
|
|
|
|
|
|
|
|
Corn
|
|
20,225
|
|
1
|
|
-
|
|
1
|
|
1
|
|
Soybeans
|
|
197,428
|
|
1
|
|
-
|
|
3
|
|
1
|
|
Wheat
|
|
1,100
|
|
-
|
|
-
|
|
-
|
|
-
|
|
Purchase
|
|
|
|
|
|
|
|
|
|
|
|
Corn
|
|
2,400
|
|
-
|
|
-
|
|
-
|
|
-
|
|
Soybeans
|
|
4,300
|
|
-
|
|
-
|
|
-
|
|
-
|
|
Wheat
|
|
1,700
|
|
-
|
|
-
|
|
-
|
|
-
|
|
Options:
|
|
|
|
|
|
|
|
|
|
|
|
Sell put
|
|
|
|
|
|
|
|
|
|
|
|
Soybeans
|
|
16,204
|
|
-
|
|
-
|
|
1
|
|
4
|
|
Total
|
|
243,357
|
|
2
|
|
-
|
|
5
|
|
6
|
Gains and losses on
commodity-based derivative instruments were Ps. 77 (loss), Ps. 8
(gain) and Ps. 15 (loss) for the years ended June 30, 2016, 2015
and 2014, respectively. These gains and losses are included in
“Other operating results, net” in the income
statements.
F- 61
Cresud Sociedad Anónima,
Comercial, Inmobiliaria, Financiera y Agropecuaria
Notes to the Consolidated
Financial Statements
(Continued)
(All amounts in
millions of Argentine Pesos, except otherwise
indicated)
4.
Financial risk management and fair value
(Continued)
4.1
Risk
management in the Agricultural Business
(Continued)
Crops future
contract fair values are computed with reference to quoted market
prices on future exchanges.
Other price risk
(b)
Credit
risk management
Credit risk refers
to the risk that counterparty will default on its contractual
obligations resulting in a financial loss to the Group. Credit
limits have been established to ensure that the Group deals only
with approved counterparties and that counterparty concentration
risk is addressed and the risk of loss is mitigated. Counterparty
exposure is measured as the aggregate of all obligations of any
single legal entity or economic entity to the Group.
The Group is
subject to credit risk arising from deposits with banks and
financial institutions, investments of surplus cash balances, the
use of derivative financial instruments and from outstanding
receivables. Credit risk is managed on a country-by-country basis.
Each local entity is responsible for managing and analyzing the
credit risk.
The Group’s
policy is to manage credit exposure to deposits, short-term
investments and other financial instruments by maintaining
diversified funding sources in various financial institutions. All
the institutions that operate with the Group are well known because
of their experience in the market and high quality credit. The
Group places its cash and cash equivalents, investments, and other
financial instruments with various high credit quality financial
institutions, thus mitigating the amount of credit exposure to any
one institution. The maximum exposure to credit risk is represented
by the carrying amount of cash and cash equivalents and short-term
investments in the statement of financial position.
The Group’s
primary objective for holding derivative financial instruments is
to manage currency exchange rate risk and interest rate risk and
commodities prices. The Group generally enters into derivative
transactions with high-credit-quality counterparties and, by
policy, limits the amount of credit exposure to each counter party.
The amounts subject to credit risk related to derivative
instruments are generally limited to the amounts, if any, by which
counterparty’s obligations exceed the obligations that the
Group has with that counterparty. The credit risk associated with
derivative financial instruments is representing by the carrying
value of the assets positions of these instruments.
The Group’s
policy is to manage credit risks associated with trade and other
receivables within defined trading limits. All Group’s
significant counterparties have internal trading limits. The
Group’s customers are distinguished between those customers
arising out of the investment and development properties activities
of the Group from those arising out of its agricultural and
agro-industrial operations. These two groups of customers are
monitored separately due to their distinct
characteristics.
F- 62
Cresud Sociedad Anónima,
Comercial, Inmobiliaria, Financiera y Agropecuaria
Notes to the Consolidated
Financial Statements
(Continued)
(All amounts in
millions of Argentine Pesos, except otherwise
indicated)
4.
Financial risk management and fair value
(Continued)
4.1
Risk
management in the Agricultural Business
(Continued)
Trade receivables
from agriculture and agro-industrial activities are primarily
derived from the sale of commodities, raw milk, cattle, and
sugarcane; receivables from feed lot operations and raw meat
products; receivables from the lease of farmland properties;
receivables from the sale of farmland properties; and, other
receivables from ancillary activities. Trade receivables from
agriculture and agro-industrial activities represent 39% and 24% of
the Group’s total trade receivables as of June 30, 2016 and
2015, respectively. In contrast with the investment and development
properties activities of the Group, the Group’s agribusiness
is conducted through several international subsidiaries. The Group
has subsidiaries in Argentina, Brazil and Bolivia. However,
Argentina and Brazil together concentrate more than 87% and 88% of
the Group’s grain production for the years ended June 30,
2016 and 2015, respectively. For the years ended June 30, 2016 and
2015, the grain production in Bolivia has not been significant
representing only 10% and 9% of the total Group’s crop sales,
respectively. Each country has its own established market for the
respective grain production. Generally, the entire country’s
grain production is sold in the domestic market to well-known
multinational exporters such as Molinos, Cargill or Bunge, and/or
local exporters. Prices for grains are also generally based on the
market prices quoted in the domestic markets which normally take as
reference the prices in international grain exchanges such as the
Chicago Board of Trade.
For the years ended
June 30, 2016 and 2015, 34% and 27% of sales of crops in Argentina
and Brazil were sold to well-known exporters. The Group performs
credit evaluations of its customers and generally does not require
collateral. Although sales are highly concentrated, the Group does
not believe that significant credit risk exists at the reporting
period due to the high credit rating of these
customers.
The Group
concentrates its cattle production in Argentina, where it is
entirely sold in the domestic market. The main buyers are
slaughterhouses and supermarkets and are well dispersed. Prices in
the cattle market in Argentina are basically fixed by local supply
and demand. The principal market is the Liniers Market in Buenos
Aires, which provides a standard in price formation for the rest of
the domestic markets. Live animals are sold by auction on a daily
basis in the market, whereas prices are negotiated by kilogram of
live weight and are mainly determined by local supply and demand.
Some supermarkets and meat packers establish their prices by
kilogram of processed meat. In these cases, processing yields
influences the final price.
Our cattle sales
are diversified, we are and will continue to be significantly
dependent on a number of third party relationships, mainly with our
customers for crop and milk sales. During the fiscal year 2016, we
sold our products to approximately 850 customers. Sales of
agricultural products to our ten largest customers represented
approximately 72% of our net sales for the fiscal year ended June
30, 2016. During fiscal year 2016, our biggest three customers were
Bunge Argentina S. A., Cargill S.A.C.I. and Vicentin S.A.I.C. which
represented, in the aggregate, approximately 31% of our net sales
in agricultural products, while the remaining seven customers in
the aggregate represented approximately 41% of our net sales in the
fiscal year 2016.
F- 63
Cresud Sociedad Anónima,
Comercial, Inmobiliaria, Financiera y Agropecuaria
Notes to the Consolidated
Financial Statements
(Continued)
(All amounts in
millions of Argentine Pesos, except otherwise
indicated)
4.
Financial risk management and fair value
(Continued)
4.1
Risk
management in the Agricultural Business
(Continued)
The Group’s
milk production is also based in Argentina. The Group has
historically sold its entire milk production to Mastellone Hnos.
S.A., which is the largest dairy company in Argentina. Sales to
Mastellone amounted to Ps. 65.0 and Ps. 71.9 for the years ended
June 30, 2016 and 2015, respectively, representing 2% and 3% of the
Group’s agricultural consolidated revenue for those years,
respectively, and 0.2% and 1% of the Group’s total revenues
in the respective years. Although sales are concentrated, the Group
does not believe that significant credit risk exists at the
reporting period due to the high credit rating of Mastellone. As
milk is a perishable product there is no ability for the Group to
mitigate pricing risk through inventory management. The Group
negotiates the prices of raw milk on a monthly basis in accordance
with domestic supply and demand. Prices for milk are based on a
large number of factors including fat and protein content, bacteria
levels and temperature. However, dairy prices have historically
tended to have reasonable correlation with prices of agricultural
inputs such as feed and fertilizer, and the Group monitors these
relationships in order to adapt its tactics to suit.
The Group’s
sugarcane production is based in Brazil and to a lesser extent in
Bolivia. Brazil concentrates more than 92% and 96% of the Group's
total sugarcane production as of June 30, 2016 and 2015,
respectively. Currently, the Group has a farm in Brazil dedicated
to sugar production and the entire output is sold to a third-party,
ETHB, under an exclusive agreement dated March 2008. ETHB is the
largest ethanol producer in Brazil. Under the agreement, ETHB is
contractually obligated to purchase the entire production of two
crop cycles of sugarcane comprising six agricultural years with
five cuts, with the possibility of extending them for another full
agricultural cycle upon prior agreement of the parties. The
duration of each cycle may be extended if the parties wish to do
so. Currently, the Group is selling to ETHB at market price. Sales
to ETHB amounted to Ps. 256 and Ps. 178 for the years ended June
30, 2016 and 2015, respectively, representing 9% and 8% of the
Group’s agricultural consolidated revenue for those years,
respectively. Although sales are concentrated, the Group does not
believe that significant credit risk exists at the reporting period
due to the high credit rating of ETHB.
The management does
not expect any significant losses resulting from the
non-performance by these counterparties.
The maximum
exposure to Group’s credit risk is represented by the
carrying amount of each financial asset in the statement of
financial position after deducting any impairment allowance. The
Group’s overall exposure of credit risk arising from trade
receivables is set out in Note 17.
F- 64
Cresud Sociedad Anónima,
Comercial, Inmobiliaria, Financiera y Agropecuaria
Notes to the Consolidated
Financial Statements
(Continued)
(All amounts in
millions of Argentine Pesos, except otherwise
indicated)
4.
Financial risk management and fair value
(Continued)
4.1
Risk
management in the Agricultural Business
(Continued)
(c)
Liquidity
risk management
The Group is
exposed to liquidity risks, including risks associated with
refinancing borrowings as they mature, the risk that borrowing
facilities are not available to meet cash requirements, and the
risk that financial assets cannot readily be converted to cash
without loss of value. Failure to manage liquidity risks could have
a material impact on the Group’s cash flow and statements of
financial position. Prudent liquidity risk management implies
maintaining sufficient cash, the availability of funding through an
adequate amount of committed credit facilities and the ability to
close out market positions. Due to the dynamic nature of the
underlying businesses, the Group aims to maintain flexibility in
funding its existing and prospective debt requirements by
maintaining diversified funding sources.
The Group monitors
its current and projected financial position using several key
internally generated reports: cash flow; debt maturity; and
interest rate exposure. The Group also undertakes sensitivity
analysis to assess the impact of proposed transactions, movements
in interest rates and changes in property values on the key
profitability, liquidity and balance sheet ratios.
The Group’s
debt and derivative positions are continually reviewed to meet
current and expected debt requirements. The Group maintains a
balance between longer-term and shorter-term financings. Short-term
financing is principally raised through bank facilities and
overdraft positions.
Medium- to
longer-term financing comprises public and private bond issues,
including private placements.
Financing risk is spread by
using a variety of types of debt. The maturity profile is managed
in accordance with Group’s needs, by spreading the repayment
dates and extending facilities, as appropriate.
The tables below
show financial liabilities, including Group’s derivative
financial liabilities groupings based on the remaining period at
the statement of financial position to the contractual maturity
date. The amounts disclosed in the tables are the contractual
undiscounted cash flows and as a result, they do not reconcile to
the amounts disclosed on the statement of financial position.
However, undiscounted cash flows in respect of balances due within
12 months generally equal their carrying amounts in the statement
of financial position, as the impact of discounting is not
significant. The tables include both interest and principal
flows.
F- 65
Cresud Sociedad Anónima,
Comercial, Inmobiliaria, Financiera y Agropecuaria
Notes to the Consolidated
Financial Statements
(Continued)
(All amounts in
millions of Argentine Pesos, except otherwise
indicated)
4.
Financial risk management and fair value
(Continued)
4.1
Risk
management in the Agricultural Business
(Continued)
When the interest
payable is not fixed, the amount disclosed has been determined by
reference to the existing conditions at the reporting
date.
|
As of June 30, 2016
|
Less than 1 year
|
Between 1 and 2 years
|
Between 2 and 3 years
|
Between 3 and 4 years
|
More than 4 years
|
Total
|
|
Trade and other
payables
|
614
|
-
|
-
|
-
|
-
|
614
|
|
Borrowings
(Excluding finance lease liabilities)
|
1,028
|
1,271
|
1,604
|
250
|
45
|
4,198
|
|
Finance lease
obligations
|
9
|
6
|
6
|
-
|
-
|
21
|
|
Derivative
financial
instruments
|
36
|
16
|
-
|
-
|
-
|
52
|
|
Total
|
1,687
|
1,293
|
1,610
|
250
|
45
|
4,885
|
|
As of June 30, 2015
|
Less than 1 year
|
Between 1 and 2 years
|
Between 2 and 3 years
|
Between 3 and 4 years
|
More than 4 years
|
Total
|
|
Trade and other
payables
|
391
|
-
|
2
|
2
|
-
|
395
|
|
Borrowings
(Excluding finance lease liabilities)
|
1,342
|
474
|
699
|
575
|
608
|
3,698
|
|
Finance lease
obligations
|
11
|
7
|
3
|
3
|
-
|
24
|
|
Derivative
financial
instruments
|
33
|
5
|
-
|
-
|
-
|
38
|
|
Total
|
1,777
|
486
|
704
|
580
|
608
|
4,155
|
(d)
Capital
risk management
The capital structure of the Group consists of
equity and net borrowings.
The type and maturity of the
Group’s borrowings are analyzed further in Note 23. The
Group’s equity is analyzed into its various components in the
statements of changes in equity.
Capital is managed
so as to promote the long-term success of the business and to
maintain sustainable returns for shareholders.
The Group seeks to
manage its capital requirements to maximize value through the mix
of debt and equity funding, while ensuring that Group entities
continue to operate as going concerns, comply with applicable
capital requirements and maintain strong credit
ratings.
The Group assesses
the adequacy of its capital requirements, cost of capital and
gearing (i.e. debt/equity mix) as part of its broader strategic
plan. The Group continuously reviews its capital structure to
ensure that (i) sufficient funds and financing facilities are
available to implement the Group’s property development and
business acquisition strategies, (ii) adequate financing facilities
for unforeseen contingencies are maintained, and (iii)
distributions to shareholders are maintained within the
Group’s dividend distribution policy. The Group also protects
its equity by taking out insurance.
F- 66
Cresud Sociedad Anónima,
Comercial, Inmobiliaria, Financiera y Agropecuaria
Notes to the Consolidated
Financial Statements
(Continued)
(All amounts in
millions of Argentine Pesos, except otherwise
indicated)
4.
Financial risk management and fair value
(Continued)
4.1
Risk
management in the Agricultural Business
(Continued)
The Group’s
strategy is to maintain key financing metrics namely, net debt to
total equity ratio (gearing) and loan-to value ratio (LTV) to
ensure that asset level performance is translated into enhanced
returns for shareholders whilst maintaining an appropriate risk
reward balance to accommodate changing financial and operating
market cycles.
The following table
details the key metrics in relation to managing its capital
structure of the Group. The levels of these metrics are within the
ranges established by the Group’s strategy.
|
|
June
30,
2016
|
|
June
30,
2015
|
|
|
|||
|
Gearing
ratio (i)
|
65.33%
|
|
56.63%
|
|
LTV
ratio (ii)
|
56.44%
|
|
55.21%
|
(i)
Calculated as total
debt over total capital (including equity plus total
debt).
(ii)
Calculated as total
debt over total property at fair value (including trading
properties, properties, plant and equipment, investment properties,
farmland rights to receive units under barter
agreements).
(e)
Other
non-financial risks
Nature risk:
The Group’s
revenue arising from agricultural activities depends significantly
on the ability to manage biological assets and agricultural
produce. The ability to manage biological assets and agricultural
produce may be affected by unfavorable local weather conditions and
natural disasters. Weather conditions such as floods, droughts,
hail, windstorms and natural disasters such as fire, disease,
insect infestation and pests are examples of such unpredictable
events. The Group manages this risk by locating its farmlands in
different geographical areas. The Group has not taken out insurance
for this kind of risks. The occurrence of severe weather conditions
or natural disasters may affect the growth of our biological
assets, which in turn may have a material adverse effect on the
Group’s ability to harvest agricultural produce in sufficient
quantities and in a timely way.
F- 67
Cresud Sociedad Anónima,
Comercial, Inmobiliaria, Financiera y Agropecuaria
Notes to the Consolidated
Financial Statements
(Continued)
(All amounts in
millions of Argentine Pesos, except otherwise
indicated)
4.
Financial risk management and fair value
(Continued)
4.2 Risk
management in the Urban Properties and investment business in
Argentina:
The risk management
function within the Group is carried out in respect of financial
risks. Financial risks are risks arising from financial instruments
to which the Group is exposed during or at the end of the reporting
period. Financial risk comprises market risk (including foreign
currency risk, interest rate risk and other price risk), credit
risk, liquidity risk and capital risk.
The Group’s
diverse activities are exposed to a variety of financial risks in
the normal course of business. The Group’s overall risk
management program focuses on the unpredictability of financial
markets and seeks to minimize the Group’s capital costs by
using suitable means of financing and to manage and control the
Group’s financial risks effectively. The Group uses financial
instruments to hedge certain risk exposures when deemed appropriate
based on its internal management risk policies.
The Group’s
principal financial instruments comprise cash and cash equivalents,
receivables, payables, interest bearing assets and liabilities,
other financial liabilities, other investments and derivative
financial instruments. The Group manages its exposure to key
financial risks in accordance with the Group’s risk
management policies.
The Group’s
management framework includes policies, procedures, limits and
allowed types of derivative financial instruments. The Group has
established a Risk Committee which was detailed in note
4.1.
This section
provides a description of the principal risks that could have a
material adverse effect on the Group’s strategy, performance,
results of operations and financial condition. The risks facing the
businesses, set out below, do not appear in any particular order of
potential materiality or probability of occurrence.
The analysis of
sensitivities to market risks included below are based on a change
in one factor while holding all other factors constant. In practice
this is unlikely to occur, and changes in some of the factors may
be correlated – for example, changes in interest rate and
changes in foreign currency rates.
This sensitivity
analysis provides only a limited, point-in-time view. The actual
impact on the Group’s financial instruments may differ
significantly from the impact shown in the sensitivity
analysis.
(f)
Market
risk management
The market risk is
the risk of changes in the market price of financial instruments
with whom the Group operates. The Group’s market risks arise
from open positions in foreign currencies, interest-bearing assets
and liabilities and equity securities of certain entities, to the
extent that these are exposed to market value movements. Management
sets limits on the exposure to these risks that may be accepted,
which are monitored on a regular basis.
F- 68
Cresud Sociedad Anónima,
Comercial, Inmobiliaria, Financiera y Agropecuaria
Notes to the Consolidated
Financial Statements
(Continued)
(All amounts in
millions of Argentine Pesos, except otherwise
indicated)
4.
Financial risk management and fair value
(Continued)
4.2
Risk
management in the Urban Properties and investment business in
Argentina
(Continued)
Foreign
exchange risk and associated derivative financial
instruments
As mentioned in
note 4.1, the Group publishes its consolidated financial statements
in Argentine pesos but conducts operations and holds positions in
other currencies. As a result, the Group is exposed to foreign
currency exchange risk through exchange rate movements, which
affect the value of the Group’s foreign currency positions.
Foreign exchange risk arises when future commercial transactions or
recognized assets or liabilities are denominated in a currency that
is not the entity’s functional currency.
The real estate,
commercial and/or financial activities of the Group's subsidiaries
in the operations center in Argentina have as functional currency
the Argentine Peso. A significant majority of the activity of these
subsidiaries is conducted in such local currency, thus not exposing
the Group to foreign exchange risk. Other Group's subsidiaries have
other functional currencies, principally US dollar. In the ordinary
course of business, the Group, through its subsidiaries, transacts
in currencies other than the respective functional currencies of
the subsidiaries. These transactions are primarily denominated in
US dollars and New Israeli Shekel. Net financial position exposure
to the functional currencies is managed on a case-by-case basis,
partly by entering into foreign currency derivative instruments
and/or by borrowing in foreign currencies, or other methods,
considered adequate by the Management, according to
circumstances.
Financial
instruments are considered sensitive to foreign exchange rates when
they are not in the functional currency of the entity that holds
them. The following table shows the net carrying amounts of the
Company’s financial instruments nominated in US$ and NIS
broken down by functional currency in which the Company operates,
for the years ended June 30, 2016 and 2015. The amounts are
presented in Argentine Pesos, the presentation currency of the
Group:
|
|
Net
monetary position (Liability)/Asset
|
|||
|
Functional
currency
|
June
30, 2016
|
June
30, 2015
|
||
|
|
US$
|
NIS
|
US$
|
NIS
|
|
Argentine
Peso
|
(5,370)
|
-
|
(2,576)
|
-
|
|
Uruguayan
Peso
|
6
|
-
|
(67)
|
-
|
|
US
Dollar
|
-
|
(7)
|
-
|
(245)
|
|
Total
|
(5,364)
|
(7)
|
(2,643)
|
(245)
|
The Group estimates
that, other factors being constant, a 10% appreciation of the US
dollar against the respective functional currencies at year-end
would increase loss before income tax for the year ended June 30,
2016 for an amount of Ps. 536. A 10% depreciation of the US dollar
against the functional currencies would have an equal and opposite
effect on the income statements.
F- 69
Cresud Sociedad Anónima,
Comercial, Inmobiliaria, Financiera y Agropecuaria
Notes to the Consolidated
Financial Statements
(Continued)
(All amounts in
millions of Argentine Pesos, except otherwise
indicated)
4.
Financial risk management and fair value
(Continued)
4.2
Risk
management in the Urban Properties and investment business in
Argentina
(Continued)
On the other hand,
the Group in its operations center Argentina, also uses derivative
instruments, such as forward foreign exchange contracts to manage
its exposure to foreign exchange risk. As of June 30, 2016 there
are exchanges contract pending for an amount of US$ 21 million. Net
book value of contracts amounts to Ps. (3).
Interest
rate risk
As explained in
note 4.1, the Group is exposed to interest rate risk on its
investments in debt instruments, short-term and long-term
borrowings and derivative financial instruments.
The Note 23 shows a
breakdown of the Group’s fixed-rate and floating-rate
borrowings per currency denomination and functional currency of the
subsidiary issuing the loans for the years ended June 30, 2016 and
2015.
The Group estimates
that, other factors being constant, a 1% increase in floating rates
at year-end would increase net loss before income tax for the year
ended June 30, 2016, in Ps. 13.7. A 1 % decrease in floating rates
would have an equal and opposite effect on the income
statement.
Other price risk
The
Group is exposed to equity securities price risk because of
investments held in entities that are publicly traded, which are
classified on the consolidated statement of financial position at
“fair value through profit or loss”. The Group
regularly reviews the prices evolution of these equity securities
in order to identify significant movements.
As
of June 30, 2016 and 2015 the total value of Group´s
investments in shares and derivative financial instruments of
public companies, in the operations center Argentina, amounts to
Ps. 822 and Ps. 1,803, respectively.
The Group estimates
that, other factors being constant, a 10% decrease in quoted prices
of equity securities and in derivative financial instruments
portfolio at year-end would generate a loss before income tax for
the year ended June 30, 2016 of Ps. 82. An increase of 10% on these
prices would have an equal and opposite effect in the statement of
income.
F- 70
Cresud Sociedad Anónima,
Comercial, Inmobiliaria, Financiera y Agropecuaria
Notes to the Consolidated
Financial Statements
(Continued)
(All amounts in
millions of Argentine Pesos, except otherwise
indicated)
4.
Financial risk management and fair value
(Continued)
4.2
Risk
management in the Urban Properties and investment business in
Argentina
(Continued)
(g)
Credit
risk management
The credit risk
arises from the potential non-performance of contractual
obligations by the parties, with a resulting financial loss for the
Group. Credit limits have been established to ensure that the Group
deals only with approved counterparties and that counterparty
concentration risk is addressed and the risk of loss is mitigated.
Counterparty exposure is measured as the aggregate of all
obligations of any single legal entity or economic entity to the
Group.
The Group is
subject to credit risk arising from deposits with banks and
financial institutions, investments of surplus cash balances, the
use of derivative financial instruments and from outstanding
receivables. Credit risk is managed on a country-by-country basis.
Each local entity is responsible for managing and analyzing the
credit risk.
The Group’s
policy is to manage credit exposure to deposits, short-term
investments and other financial instruments by maintaining
diversified funding sources in various financial institutions. All
the institutions that operate with the Group are well known because
of their experience in the market and high quality credit. The
Group places its cash and cash equivalents, investments, and other
financial instruments with various high credit quality financial
institutions, thus mitigating the amount of credit exposure to any
one institution. The maximum exposure to credit risk is represented
by the carrying amount of cash and cash equivalents and short-term
investments in the statement of financial position.
Trade receivables
related to leases and services provided by the Group represent a
diversified tenant base and account for 11% and 38% of the
Group’s total trade receivables as of June 30, 2016 and 2015,
respectively. The Group has specific policies to ensure that rental
contracts are transacted with counterparties with appropriate
credit quality. The majority of the Group’s shopping center,
offices and other rental properties’ tenants are well
recognized retailers, diversified companies, professional
organizations, and others. Owing to the long-term nature and
diversity of its tenancy arrangements, the credit risk of this type
of trade receivables is considered to be low. Generally, the Group
has not experienced any significant losses resulting from the
non-performance of any counterpart to the lease contracts and, as a
result, the allowance for doubtful account balance is low.
Individual risk limits are set based on internal or external
ratings in accordance with limits set by the Group. If customers
are independently rated, these ratings are used. If there is no
independent rating, risk control assesses the credit quality of the
customer, taking into account its past experience, financial
position, actual experience and other factors. Based on the
Group’s analysis, the Group determines the size of the
deposit that is required from the tenant at inception. Management
does not expect any losses from non-performance by these
counterparties. See Note 17 for details.
F- 71
Cresud Sociedad Anónima,
Comercial, Inmobiliaria, Financiera y Agropecuaria
Notes to the Consolidated
Financial Statements
(Continued)
(All amounts in
millions of Argentine Pesos, except otherwise
indicated)
4.
Financial risk management and fair value
(Continued)
4.2
Risk
management in the Urban Properties and investment business in
Argentina
(Continued)
On the other hand,
property receivables related to the sale of trading properties
represent 0.3% and 17% of the Group’s total trade receivables
as of June 30, 2016 and 2015, respectively. Payments on these
receivables have generally been received when due. These
receivables are generally secured by mortgages on the properties.
Therefore, the credit risk on outstanding amounts is considered
very low.
(h)
Liquidity
risk management
The Group is
exposed to liquidity risks, including risks associated with
refinancing borrowings as they mature, the risk that borrowing
facilities are not available to meet cash requirements, and the
risk that financial assets cannot readily be converted to cash
without loss of value. Failure to manage liquidity risks could have
a material impact on the Group’s cash flow and statement of
financial position. Prudent liquidity risk management implies
maintaining sufficient cash, the availability of funding through an
adequate amount of committed credit facilities and the ability to
close out market positions. Due to the dynamic nature of the
underlying businesses, the Group aims to maintain flexibility in
funding its existing and prospective debt requirements by
maintaining diversified funding sources.
The Group monitors
its current and projected financial position using several key
internally generated reports: cash flow; debt maturity; and
interest rate exposure. The Group also undertakes sensitivity
analysis to assess the impact of proposed transactions, movements
in interest rates and changes in property values on the key
profitability, liquidity and balance sheet ratios.
The Group’s
debt and derivative positions are continually reviewed to meet
current and expected debt requirements. The Group maintains a
balance between longer-term and shorter-term financings. Short-term
financing is principally raised through bank facilities and
overdraft positions.
Medium to
longer-term financing comprises public and private bond issues,
including private placements.
Financing risk is spread by
using a variety of types of debt. The maturity profile is managed
in accordance with Group’s needs, by spreading the repayment
dates and extending facilities, as appropriate.
The following
tables show financial liabilities, including Group’s
derivative financial liabilities groupings based on the remaining
period at the statement of financial position to the contractual
maturity date. The amounts disclosed in the tables are the
contractual undiscounted cash flows and as a result, they do not
reconcile to the amounts disclosed on the statement of financial
position. However, undiscounted cash flows in respect of balances
due within 12 months generally equal their carrying amounts in the
statement of financial position, as the impact of discounting is
not significant. The tables include both interest and principal
flows.
F- 72
Cresud Sociedad Anónima,
Comercial, Inmobiliaria, Financiera y Agropecuaria
Notes to the Consolidated
Financial Statements
(Continued)
(All amounts in
millions of Argentine Pesos, except otherwise
indicated)
4.
Financial risk management and fair value
(Continued)
4.2
Risk
management in the Urban Properties and investment business in
Argentina
(Continued)
Where the interest
payable is not fixed, the amount disclosed has been determined by
reference to the existing conditions at each reporting
date.
|
As
of June 30, 2016
|
Less
than 1 year
|
Between
1 and 2 years
|
Between
2 and 3 years
|
Between
3 and 4 years
|
More
than 4 years
|
Total
|
|
Trade and other
payables
|
627
|
204
|
1
|
-
|
-
|
832
|
|
Borrowings
(Excluding finance lease liabilities)
|
3,518
|
494
|
475
|
491
|
6,760
|
11,738
|
|
Finance lease
obligations
|
2
|
1
|
1
|
-
|
-
|
4
|
|
Derivative
financial
instruments
|
3
|
-
|
-
|
-
|
-
|
3
|
|
Total
|
4,150
|
699
|
477
|
491
|
6,760
|
12,577
|
|
As
of June 30, 2015
|
Less
than 1 year
|
Between
1 and 2 years
|
Between
2 and 3 years
|
Between
3 and 4 years
|
More
than 4 years
|
Total
|
|
Trade and other
payables
|
356
|
11
|
3
|
-
|
-
|
370
|
|
Borrowings
(Excluding finance lease liabilities)
|
883
|
2,822
|
32
|
143
|
1,510
|
5,390
|
|
Finance lease
obligations
|
2
|
1
|
1
|
-
|
-
|
4
|
|
Derivative
financial
instruments
|
264
|
237
|
-
|
-
|
-
|
501
|
|
Total
|
1,505
|
3,071
|
36
|
143
|
1,510
|
6,265
|
(i)
Capital
risk management
The capital structure of the Group consists of
shareholders’ equity and net borrowings.
The type and
maturity of the Group’s borrowings are analyzed further in
Note 23. The Group’s equity is analyzed into its various
components in the statement of changes in equity.
Capital is managed
so as to promote the long-term success of the business and to
maintain sustainable returns for shareholders.
The Group seeks to
manage its capital requirements to maximize value through the mix
of debt and equity funding, while ensuring that Group entities
continue to operate as going concerns, comply with applicable
capital requirements and maintain strong credit
ratings.
The Group assesses
the adequacy of its capital requirements, cost of capital and
gearing (i.e. debt/equity mix) as part of its broader strategic
plan. The Group continuously reviews its capital structure to
ensure that (i) sufficient funds and financing facilities are
available to implement the Group’s property development and
business acquisition strategies, (ii) adequate financing facilities
for unforeseen contingencies are maintained, and (iii)
distributions to shareholders are maintained within the
Group’s dividend distribution policy. The Group also protects
its equity in assets by taking out insurance.
F- 73
Cresud Sociedad Anónima,
Comercial, Inmobiliaria, Financiera y Agropecuaria
Notes to the Consolidated
Financial Statements
(Continued)
(All amounts in
millions of Argentine Pesos, except otherwise
indicated)
4.
Financial risk management and fair value
(Continued)
4.2
Risk
management in the Urban Properties and investment business in
Argentina
(Continued)
The Group’s
strategy is to maintain key financing metrics namely, net debt to
total equity ratio (gearing) and loan-to-value ratio (LTV) to
ensure that asset level performance is translated into enhanced
returns for shareholders whilst maintaining an appropriate risk
reward balance to accommodate changing financial and operating
market cycles.
The following table
details the key metrics in relation to managing its capital
structure of the Group. The levels of these metrics are within the
ranges established by the Group’s strategy.
|
|
June
30,
2016
|
|
June
30,
2015
|
|
Gearing ratio
(i)
|
89.24%
|
|
63.45%
|
|
LTV ratio
(ii)
|
29.39%
|
|
20.42%
|
(i)
Calculated as total
of current and non-current borrowings over total current and
non-current borrowings plus equity of the parent
company.
(ii)
Calculated as total
current and non-current borrowings over total properties at fair
value (including trading properties, property, plants and
equipment, investment properties and rights to receive future units
under barter agreements).
Property
risk
There are several
risks affecting the Group’s property investments. The
composition of the Group’s property portfolio including asset
concentration and lot size may affect liquidity and relative
property performance. The Group has a large multi-asset portfolio
and monitors its concentration and average lot size.
A change in trends
and economic conditions causes shifts in customer demands for
properties and impacts on new lettings, renewal of existing leases
and reduces rental growth. In addition, increases risk of tenant
insolvencies. The Group conducts several actions to mitigate some
of these risks whenever possible. The variety of asset types and
geographical spread as well as a diversified tenant base, with
monitoring of its concentration, helps mitigating these
risks.
F- 74
Cresud Sociedad Anónima,
Comercial, Inmobiliaria, Financiera y Agropecuaria
Notes to the Consolidated
Financial Statements
(Continued)
(All amounts in
millions of Argentine Pesos, except otherwise
indicated)
4.
Financial risk management and fair value
(Continued)
4.2
Risk
management in the Urban Properties and investment business in
Argentina
(Continued)
The development,
administration and profitability of shopping centers are impacted
by various factors including: the accessibility and the
attractiveness of the area where the shopping center is located,
the intrinsic attractiveness of them, the flow of people, the level
of sales of each rental unit, the increasing competition from
internet sales, the amount of rent collected from each rental unit
and the fluctuations in occupancy levels. In the event that there
is an increase in operational costs, caused by inflation or other
factors, it could have a material adverse effect on the Group if
its tenants are unable to pay their higher rent obligations due to
the increase in expenses. Argentine Law No. 24,808 provides that
tenants may rescind commercial lease agreements after the initial
six months upon not less than sixty days written notice, subject to
penalties of only one-and-a-half month rent if the tenant rescinds
during the first year of the lease, and one-month rent if the
tenant rescinds during the second year of the lease. The exercise
of such rescission rights could materially and adversely affect the
Group.
Risks associated
with development properties activities include the following: a)
the potential abandonment of development opportunities; b)
construction costs exceeding original estimates, possibly making a
project uneconomical; c) occupancy rates and rents at newly
completed projects may be insufficient to make the project
profitable. On the other hand: a) the Group may not be able to
obtain financing on favorable terms for the development of the
project; b) construction and lease-up may not be completed on
schedule, resulting in increased debt service expense and
construction costs; c) the Group may not be able to obtain, or
delay in obtaining, all necessary zoning, land-use, building,
occupancy and other required governmental permits and
authorizations; d) preconstruction buyers may default on their
purchase contracts or units in new buildings may remain unsold upon
completion of constructions; and e) prices for residential units
may be insufficient to cover development cost. The Group also takes
several actions to monitor these risks and respond appropriately
whenever it is under its control. The Group has in-house property
market research capability and development teams that monitor
development risks closely. The Group generally adopts conservative
assumptions on leasing and other variables and monitors the level
of committed future capital expenditure on development programs
relative to the level of undrawn facilities.
The Group’s
hotel properties face specific risks as well. The success of the
Group’s hotel properties will depend, in large part, upon the
Group’s ability to compete in areas such as access, location,
quality of accommodations, room rate structure, quality and scope
of food and beverage facilities and other services and amenities.
The Group’s hotels may face additional competition if other
companies decide to build new hotels or improve their existing
hotels such that they are more attractive to potential guests. In
addition, their profitability depends on (i) the Group’s
ability to form successful relationships with international
operators to run the hotels; (ii) changes in travel patterns,
including seasonal changes; and (iii) taxes and governmental
regulations which influence or determine wages, prices, interest
rates, construction procedures and costs.
F- 75
Cresud Sociedad Anónima,
Comercial, Inmobiliaria, Financiera y Agropecuaria
Notes to the Consolidated
Financial Statements
(Continued)
(All amounts in
millions of Argentine Pesos, except otherwise
indicated)
4.
Financial risk management and fair value
(Continued)
4.3 Risk
management in the Urban Properties and investment business in
Israel
Given the diversity
of the activities conducted by IDBD and its subsidiaries, and the
resulting risks, IDBD manages the exposure to its own key financial
risks and those of its wholly-owned subsidiaries (except for IDB
Tourism) in conformity with a centralized risk management policy,
with the non-wholly owned IDBD subsidiaries being responsible for
establishing the risk policy, taking action to cover market risks
and managing their activities in a decentralized fashion. Both IDBD
as holding and each subsidiary are responsible for managing their
own financial risks in accordance with agreed global guidelines.
The Chief Financial Officers of each entity are responsible for
managing the risk management policies and systems, the definition
of hedging strategies, insofar as applicable and based on any
restriction that may be apply as a result of financial liability,
the supervision of its implementation and the answer to such
restrictions. The management framework includes policies,
procedures, limits and allowed types of derivative financial
instruments.
This section
provides a description of the principal risks related to the
operations center in Israel that could have a material adverse
effect on the IDBD’s strategy, performance, results of
operations and financial condition. The risks facing the
businesses, set out below, do not appear in any particular order of
potential materiality or probability of occurrence.
(a)
Market
risk management
Foreign
currency risk
Real estate,
business and/or financial activities of IDBD subsidiaries in the
operations center in Israel are developed mainly in Israeli
currency, although some operations, mostly borrowing, are expressed
in US’ dollars, thereby exposing IDBD to a foreign currency
risk.
Net financial
position exposure to the functional currencies is managed in a
decentralized way on a case-by-case basis, by using different
foreign currency derivative instruments and/or by borrowing in
foreign currencies, as the case may be, or by other methods
considered adequate by the Management, according to
circumstances.
As of June 30,
2016, the Israeli subsidiaries’ net financial position which
exposes the Group to the foreign currency risk amounts to Ps.
1,686. The Group estimates that, other factors being constant, a 5%
appreciation of the US dollar against the Israeli currency would
increase loss before income tax for the year ended June 30, 2016
for an amount of Ps. 84.3. An equivalent depreciation of the
Israeli currency would have an equal but opposite effect in the
income statement.
F- 76
Cresud Sociedad Anónima,
Comercial, Inmobiliaria, Financiera y Agropecuaria
Notes to the Consolidated
Financial Statements
(Continued)
(All amounts in
millions of Argentine Pesos, except otherwise
indicated)
4.
Financial risk management and fair value
(Continued)
4.3
Risk
management in the Urban Properties and investment business in
Israel
(Continued)
Risk
of fluctuations of the Consumer Price Index ("CPI") of
Israel
IDBD has financial
liabilities indexed by the Israeli CPI. As of the date of this
consolidated financial statements, more than half of the financial
liabilities arising from the center of operations in Israel were
adjusted by the Israeli CPI.
Net financial
position exposure to the Israeli CPI fluctuations is managed in a
decentralized way on a case-by-case basis, by using different
derivative financial instruments, as the case may be, or by other
methods, considered adequate by the Management, according to
circumstances.
The Group estimates
that, other factors being constant, a 1% appreciation of the CPI
would increase loss before income tax for the year ended June 30,
2016 for an amount of Ps. 415. An equivalent depreciation of the
CPI would have result in a profit before income tax for the year
June 30, 2016 for an amount of Ps. 319.
Interest rate risk
The IDBD’s
interest rate risk principally arises from long-term borrowings
(Note 23). Borrowings issued at a flooting rate expose IDBD to cash
flow interest rate risk, are partially offset by financial assets
at floating interest rate. Borrowings issued at fixed rates expose
IDBD to fair value interest rate risk.
IDBD manages the
exposure to this risk on a dynamic basis. Various scenarios are
simulated by IDBD, taking into consideration refinancing, renewal
of existing positions, alternative financing sources or hedging
instruments, maintaining an appropriate mix between fixed and
floating rate interest bearing liabilities. The exposure to the
interest rate risk is managed in a decentralized way and is
monitored regularly by different management offices with a view to
confirming that there are no adverse effects over its ability to
meet its financial obligations and to comply with its borrowings
covenants.
As of the date of
these financial statements, the 96% of the Group’s long-term
financial borrowings in the operations center in Israel are at
fixed interest rate; therefore, IDBD is not significantly exposed
to the interest rate fluctuation risk
IDBD estimates
that, other factors being constant, a 1% increase in floating rates
at year-end would increase net loss before income tax for the year
ended June 30, 2016, in Ps. 25, approximately. An equivalent
decrease of the floating rates would have result in a profit before
income tax for the year June 30, 2016 for an amount of Ps.
26.
F- 77
Cresud Sociedad Anónima,
Comercial, Inmobiliaria, Financiera y Agropecuaria
Notes to the Consolidated
Financial Statements
(Continued)
(All amounts in
millions of Argentine Pesos, except otherwise
indicated)
4.
Financial risk management and fair value
(Continued)
4.3
Risk
management in the Urban Properties and investment business in
Israel
(Continued)
Other price risk
IDBD is exposed to
equity securities price risk or derivative financial instruments
price risk because of investments held in entities that are
publicly traded.
As indicated in
Note 18, investment in Clal is classified on the statements of
financial position at “fair value through profit or
loss” and represents the most significant IDBD’s
exposure to price risk. IDBD has not used hedging against these
risks.
IDBD
regularly reviews the prices evolution of these equity securities
in order to identify significant movements.
(b)
Credit
risk management
The credit risk
arises from the potential non-performance of contractual
obligations by the parties, with a resulting financial loss for
IDBD. IDBD’s credit risk, as well as that of its wholly-owned
subsidiaries (except for IDB Tourism), is managed in a centralized
manner by IDBD. In contrast, the credit risk of the other
subsidiaries is managed in a decentralized fashion by each
subsidiary. Each entity is responsible for managing and analyzing
the credit risk and limits have been established to ensure that
IDBD deals only with approved counterparties and that counterparty
concentration risk is addressed and the risk of loss is mitigated.
Counterparty exposure is measured as the aggregate of all
obligations of any single legal entity or economic entity to
IDBD.
IDBD and
subsidiaries invest their surplus liquidity so as to obtain a fair
return on it, while maintaining a suitable return-risk ratio, in
solid channels – mainly short-term shekel deposits in a
number of major Israeli financial institutions, and they also
invest in liquid securities, which mainly include trust funds,
exchange traded funds, government and corporate bonds with a rating
of at least A- and corporate bonds abroad have been rated with the
international rating of Investment Grade and above. In addition,
the maximum percentage of securities of a single issuer, which IDBD
or a subsidiary holds in its portfolio does not exceed 10% of the
value of its investment portfolio. IDBD and subsidiaries carry out
transactions in derivative financial instruments only through
banking corporations and entities that are required to maintain
collateral levels in accordance with scenarios.
F- 78
Cresud Sociedad Anónima,
Comercial, Inmobiliaria, Financiera y Agropecuaria
Notes to the Consolidated
Financial Statements
(Continued)
(All amounts in
millions of Argentine Pesos, except otherwise
indicated)
4.
Financial risk management and fair value
(Continued)
4.3
Risk
management in the Urban Properties and investment business in
Israel
(Continued)
IDBD’s
primary objective for holding derivative financial instruments is
to manage currency exchange rate risk, interest rate risk and
interest risk. IDBD generally enters into derivative transactions
with high-credit-quality counterparties and, by policy, limits the
amount of credit exposure to each counter party. The amounts
subject to credit risk related to derivative instruments are
generally limited to the amounts, if any, by which
counterparty’s obligations exceed the obligations that IDBD
has with that counterparty. The credit risk associated with
derivative financial instruments is representing by the carrying
value of the assets positions of these instruments.
IDBD’s policy
is to manage credit exposure to trade and other receivables
counterparties within defined trading limits. All of IDBD’s
significant counterparties are assigned internal credit
limits.
Trade receivables
from investment and development property activities are primarily
derived from leases and services from shopping centers, offices and
other rental properties; receivables from the sale of trading
properties and investment properties (primarily undeveloped land
and non-retail rental properties). IDBD has a large customer base
and is not dependent on any single customer. (Note
17).
There is not a high
credit risk concentration in trade receivables from
telecommunications and supermarket activity, as the business does
not rely on few customers and most of the transactions are paid in
cash or by credit card. (Note 17).
(c)
Liquidity
risk management
The most important
risk in the operations center in Israel is liquidity risk,
including risks associated with refinancing borrowings as they
mature, the risk that borrowing facilities are not available to
meet cash requirements, and the risk that financial assets cannot
readily be converted to cash without loss of value. Failure to
manage liquidity risks could have a material impact on IDBD’s
cash flow and statements of financial position. Prudent liquidity
risk management implies maintaining sufficient cash, the
availability of funding through an adequate amount of committed
credit facilities and the ability to close out market positions.
Due to the dynamic nature of the underlying businesses, IDBD aims
to maintain flexibility in funding its existing and prospective
debt requirements by maintaining diversified funding
sources.
IDBD monitors its
current and projected financial position using several key
internally generated reports: cash flow forecasts, debt maturity
and interest rate exposure. IDBD also undertakes sensitivity
analysis to assess the impact of proposed transactions, movements
in interest rates and changes in property values on the key
profitability, liquidity and balance sheet ratios.
F- 79
Cresud Sociedad Anónima,
Comercial, Inmobiliaria, Financiera y Agropecuaria
Notes to the Consolidated
Financial Statements
(Continued)
(All amounts in
millions of Argentine Pesos, except otherwise
indicated)
4.
Financial risk management and fair value
(Continued)
4.3
Risk
management in the Urban Properties and investment business in
Israel
(Continued)
The IDBD’s
debt and derivative positions are continually reviewed to meet
current and expected debt requirements. IDBD maintains a balance
between longer-term and shorter-term financings. Short-term
financing is principally raised through bank facilities and
overdraft positions.
Medium- to
longer-term financing comprises public and private bond issues,
including private placements.
Financing risk is spread by
using a variety of types of debt. The maturity profile is managed
in accordance with IDBD’s needs, by spreading the repayment
dates and extending facilities, as appropriate.
The table below
shows financial liabilities, including Group’s derivative
financial liabilities in the operations center Israel, groupings
based on the remaining period at the statements of financial
position to the contractual maturity date. The amounts disclosed in
the table are the contractual undiscounted cash flows and as a
result, they do not reconcile to the amounts disclosed on the
statements of financial position.
However,
undiscounted cash flows in respect of balances due within 12 months
generally equal their carrying amounts in the statements of
financial position, as the impact of discounting is not
significant. The tables include both interest and principal
flows.
Where the interest
payable is not fixed, the amount disclosed has been determined by
reference to the existing conditions at the reporting
date.
|
As
of June 30, 2016
|
Less
than 1 year
|
Between
1 and 2 years
|
Between
2 and 3 years
|
Between
3 and 4 years
|
More
than 4 years
|
Total
|
|
Trade and other
payables
|
13,046
|
234
|
561
|
54
|
4
|
13,899
|
|
Borrowings
|
20,714
|
19,328
|
29,522
|
9,435
|
52,232
|
131,231
|
|
Financial/
Operating leases
|
2,254
|
2,086
|
1,802
|
1,487
|
3,398
|
11,027
|
|
Derivative
financial
instruments
|
105
|
47
|
58
|
-
|
-
|
210
|
|
Purchase
obligations
|
1,089
|
162
|
15
|
-
|
-
|
1,266
|
|
Total
|
37,208
|
21,857
|
31,958
|
10,976
|
55,634
|
157,633
|
Given the current
financial liability conditions of the Operations Center in Israel,
in particular in the holding company IDBD, the main source of
funding has been capital contributions. See Note 26 that includes a
description of commitments and restrictions related to loans and
renegotiation processes under way.
F- 80
Cresud Sociedad Anónima,
Comercial, Inmobiliaria, Financiera y Agropecuaria
Notes to the Consolidated
Financial Statements
(Continued)
(All amounts in
millions of Argentine Pesos, except otherwise
indicated)
5.
Significant
judgments, key assumptions and estimates
The Group’s
significant accounting policies are stated in Note 2. Not all of
these significant accounting policies require management to make
subjective or complex judgments or estimates. The following section
is intended to provide an understanding of the policies that
management considers critical because of the level of complexity,
judgment or estimation involved in their application and their
impact on the consolidated financial statements. These judgments
involve assumptions or estimates in respect of future events.
Actual results may differ from these estimates.
|
Estimation
|
Main
assumptions
|
Potential
implications
|
Main
references
|
|
Business
combination - Allocation of acquisition prices
|
Assumptions
regarding timing, amount of future revenues and expenses, revenue
growth, expected rate of return, economic conditions, discount
rate, among others.
|
Should any of the
assumptions made be inaccurate the recognized combination may not
be correct.
|
|
|
Recoverable amounts
of cash-generating units (even those including goodwill),
associates and assets.
|
The discount rate
and the expected growth rate before taxes – in connection
with cash-generating units.
The discount rate
and the expected growth rate after taxes – in connection with
associates.
Cash flows are
determined based on past experiences with the asset or with similar
assets and in accordance with the Group’s best factual
assumption relative to the economic conditions expected to
prevail.
Business continuity
and share market value of the public companies in connection with
cash-generating units.
Appraisals made by
external appraisers and valuators with relation to the
assets’ fair value, net of realization costs (including real
estate assets).
|
Should any of the
assumptions made be inaccurate, this could lead to differences in
the recoverable values of cash-generating units.
|
Note 10 -
Investment properties
Note 11 - Property,
plant and equipment
Note 13 -
Intangible assets
|
|
Control, joint
control or significant influence
|
Judgment relative
to the determination that the Group holds an interest in the shares
of investees (considering the existence and influence of
significant potential voting rights), its right to designate
members in the executive management of such companies (usually the
Board of directors) based on the investees’ bylaws; the
composition and the rights of other shareholders of such investees
and their capacity to establish operating and financial policies
for investees or to take part in the establishment
thereof.
|
Accounting
treatment of investments as subsidiaries (consolidation) or
associates (equity method).
|
Note
2.3
|
|
Estimated useful
life of intangible assets, investment properties and property,
plant and equipment
|
Estimated useful
life of assets based on their conditions.
|
Recognition of
accelerated or decelerated depreciation by comparison against final
actual earnings (losses).
|
Note 10 -
Investment properties
|
|
Fair value
valuation of investment properties
|
Fair value
valuation made by external appraisers and valuators.
|
Incorrect exposure
of investment property values.
|
|
|
Income
tax
|
The Group estimates
the income tax amount payable for transactions where the
Treasury’s Claim cannot be clearly determined.
Additionally, the
Group evaluates the recoverability of assets due to deferred taxes
considering whether some or all of the assets will not be
recoverable.
|
Upon the improper
determination of the provision for income tax, the Group will be
bound to pay additional taxes, including fines and compensatory and
punitive interest.
|
|
|
Allowance for
doubtful accounts
|
A periodic review
is conducted of receivables risks in the Group’s
clients’ portfolios. Bad debts based on the expiration of
account receivables and account receivables’ specific
conditions.
|
Improper
recognition of charges / reimbursements of the allowance for bad
debt.
|
|
|
Hybrid financial
instrument related to the non-recourse loan from Koor
(Adama)
|
●
The value of
Adama’s shares.
●
Unobserved data
underlying the binomial model applied to the determination of the
embedded derivative instruments’ value.
|
Changes in losses
or profits resulting from the variation in the fair value of the
embedded derivative, and variations in the book amount of the
primary contract recognized as revenues or expenses from
financing.
|
|
|
Level 2 and 3
financial instruments
|
Main assumptions
used by the Group are:
●
Discounted
projected income as per discount rate
●
Values determined
in accordance with the company’s shares in equity funds on
the basis of its financial statements, based on fair value or
investment assessments.
●
Comparable market
multiple (EV/GMV ratio).
●
Underlying
asset price (market price) and share price volatility (historical)
and market interest rate (Libor curve).
|
Wrong recognition
of a charge to income.
|
|
|
Probability
estimate of contingent liabilities
|
Whether more
economic resources may be spent in relation to litigation against
the Group; such estimate is based on legal advisors’
opinions.
|
Charge / reversal
of provision in relation to a claim.
|
|
|
Biological
assets
|
Main assumptions
used in valuation are: yields, operating costs, selling expenses,
future of sales prices, discount rate.
|
Wrong
recognition/valuation of biological assets. See sensitivities
modeled on these parameters in Note 14.
|
|
F- 81
Cresud Sociedad Anónima,
Comercial, Inmobiliaria, Financiera y Agropecuaria
Notes to the Consolidated
Financial Statements
(Continued)
(All amounts in
millions of Argentine Pesos, except otherwise
indicated)
6.
Segment
information
IFRS
8 requires an entity to report financial and descriptive
information about its reportable segments, which are operating
segments or aggregations of operating segments that meet specified
criteria. Operating segments are component of an entity about which
separate financial information is available that is evaluated
regularly by the CODM. According to IFRS 8, the CODM represents a
function whereby strategic decisions are made and resources are
assigned. The CODM function is carried out by the President of the
Group, Mr. Eduardo S. Elsztain. In addition, and due to the
acquisition of IDBD, two responsibility levels have been
established for resource allocation and assessment of results of
the two operations centers, through executive committees in
Argentina and Israel.
Following
the control of IDBD, the Group reports its financial and equity
performance based on the new segment structure for the year-end
2016.
Segment
information is reported from the perspective of products and
services: (i) agricultural business and (ii) urban properties and
investment business. In addition, this last segment is reported
divided from the geographic point of view in two Operations Centers
to manage its global interests: Argentina and Israel. Within each
operations center, the Group considers separately the various
activities being developed, which represent reporting operating
segments given the nature of its products, services, operations and
risks. Management believes the operating segment clustering in each
operations center reflects similar economic characteristics in each
region, as well as similar products and services offered, types of
clients and regulatory environments.
Agricultural
business:
In the
third quarter, the Group has changed the
presentation of the agricultural business segments which are
reviewed by the CODM for a better alignment with the current
business vision and the metrics used to such end. Four operating
segments (crops, cattle, dairy and sugarcane) have been aggregated
into a single operating segment named “Agricultural
production”. Management consider for the aggregation the
nature of the production processes (growing of biological assets),
the methods used to distribute their products and the nature of the
regulatory environment (agricultural business)
. Therefore
this quarter three segments are considered:
●
The
"Agricultural
production"
segment consists of
planting, harvesting and sale of crops as wheat, corn, soybeans,
cotton and sunflowers; breeding, purchasing and/or fattening of
free-range cattle for sale to slaughterhouses and local livestock
auction markets; breeding and/or purchasing dairy cows for the
production of raw milk for sale to local milk and milk-related
products producers; and planting, harvesting and sale of
sugarcane.
●
The
“Land transformation and
sales”
segment comprises
gains from the disposal and development of farmlands
activities.
F- 82
Cresud Sociedad Anónima,
Comercial, Inmobiliaria, Financiera y Agropecuaria
Notes to the Consolidated
Financial Statements
(Continued)
(All amounts in
millions of Argentine Pesos, except otherwise
indicated)
6.
Segment information
(Continued)
●
The
"Other segments"
column includes, principally,
agricultural services (for example, irrigation); leasing of the
Group's farms to third parties; feedlot farming, slaughtering and
processing in the meat refrigeration plant; and brokerage
activities, among others.
The amounts
corresponding to the fiscal year ended June 30, 2015 and 2014, have
been retroactively adjusted to reflect changes in segment
information.
Urban
properties and investments:
●
Operations
Center in Argentina
Within this center,
the Group operates in the following segments:
o
The
“Shopping centers”
segment
includes assets and results of the activity of shopping centers
portfolio, principally comprised of lease and service revenues
related to rental of commercial space and other spaces in the
shopping centers of the Group.
o
The
“Office and others”
segment
includes the assets and the operating results of the activity of
lease of office space and other rental properties and service
revenues related to this activity.
o
The
“Sales and developments”
segment includes assets and the operating results of the sales of
undeveloped parcels of land and/or trading properties, as the
results related with its development and maintenance. Also included
in this segment are the results of the sales of real property
intended for rent, sales of hotels and other properties included in
the International segment.
o
The
"Hotels"
segment includes the operating
results of the hotels principally comprised of room, catering and
restaurant revenues.
o
The
“International”
segment
primarily includes assets and operating profit or loss from
business related to associates Condor and Lipstick. Through these
associates, the Group derives revenue from hotels and an office
building in United States, respectively. Until September 30, 2014,
this segment included revenue from a subsidiary that owned the
building located at 183 Madison Ave in New York, United States,
which was sold on September 29, 2014. Additionally, until October
11, 2015, this international segment only included results from the
investment in IDBD carried at fair value.
o
The
“Financial operations and
others”
segment primarily includes the financial
activities carried out by BHSA and Tarshop and other residual
financial operations.
F- 83
Cresud Sociedad Anónima,
Comercial, Inmobiliaria, Financiera y Agropecuaria
Notes to the Consolidated
Financial Statements
(Continued)
(All amounts in
millions of Argentine Pesos, except otherwise
indicated)
6.
Segment information
(Continued)
The CODM
periodically reviews the results and certain asset categories and
assesses performance of the operating segments corresponding to the
agricultural business and urban properties and investment business
of the operations center Argentina based on a measure of profit or
loss of the segment composed by the operating income plus the
equity in earnings of joint ventures and associates. The valuation
criteria used in preparing this information are consistent with
IFRS standards used for the preparation of the financial
statements, except for the following:
●
Operating results
of joint ventures: Cresca, Cyrsa, NPSF, Puerto Retiro, Baicom and
Quality are evaluated by the CODM applying proportional
consolidation method. Under this method the income/loss generated
and assets, are reported in the income statement line-by-line based
on the percentage held in joint ventures rather than in a single
item as required by IFRS. Management believes that the proportional
consolidation method provides more useful information to understand
the business return. Moreover, operating results of EHSA joint
venture is accounted for under the equity method. Management
believes that, in this case, this method provides more adequate
information for this type of investment, given its low materiality
and considering it is a company without direct trade operations,
where the main asset consists of an indirect interest of 25% of
LRSA.
●
Operating results
from shopping centers and offices do not include the amounts
pertaining to building administration expenses and collective
promotion funds ("FPC", as per its Spanish acronym) as well as
total recovered costs, whether by way of building administration
expenses or other concepts included under financial results (for
example default interest and other concepts). The CODM examines the
net amount from both concepts (total surplus or deficit between
building administration expenses and FPC and recoverable
expenses).
The assets’
categories examined by the CODM are: investment properties,
property, plant and equipment, trading properties, inventories,
right to receive future units under barter agreements, investment
in associates and goodwill. The sum of these assets, classified by
business segment, is reported under “assets by
segment”. Assets are allocated to each segment based on the
operations and/or their physical location.
Within the
operations center in Argentina, most revenue from its operating
segments is derived from, and their assets are located in,
Argentina, except for earnings of associates included in the
“International” segment located in United
States.
Revenues for each
reporting segments derive from a large and diverse client base and,
therefore, there is no revenue concentration in any particular
segment.
F- 84
Cresud Sociedad Anónima,
Comercial, Inmobiliaria, Financiera y Agropecuaria
Notes to the Consolidated
Financial Statements
(Continued)
(All amounts in
millions of Argentine Pesos, except otherwise
indicated)
6.
Segment information
(Continued)
●
Operations
Center in Israel:
Within this center,
the Group operates in the following segments:
o
The
“Real Estate”
segment
includes mainly assets and operating income derived from business
related to the subsidiary PBC. Through PBC, the Group operates
rental properties and residential properties in Israel, United
States and other parts of the world and carries out commercial
projects in Las Vegas, United States.
o
The
“Supermarkets”
segment
includes assets and operating income derived from the business
related to the subsidiary Shufersal. Through Shufersal, the Group
mainly operates a supermarket chain in Israel.
o
The
“Agrochemicals”
segment
includes income derived from the associate Adama. Adama is a
company specialized in agrochemicals, particularly for the
production of crops.
o
The
“Telecommunications”
segment
includes assets and operating income derived from the business
related to the subsidiary Cellcom. Cellcom is a provider of
telecommunication services and its main activities include the
provision of mobile phone services, fixed line phone services, data
and Internet, among others.
o
The
"Insurance"
segment includes the
investment in Clal. This company is one of the most important
insurance groups in Israel, and is mainly engaged in pension and
social security insurance, among others. As indicated in Note 18,
51% of the controlling shares of Clal are held in a trust following
the instructions of the Israel Securities Commission in order to
comply with the sale of the controlling shares of Clal. As a
result, the Company is not fully consolidated on a line-by-line
basis but rather in a single line as a financial instrument at fair
value, as required by the IFRS under the current circumstances
where no control is exercised.
o
The
"Others"
segment includes the assets and
income derived from other diverse business activities, such as
technological developments, tourism, gas and oil assets,
electronics, and others.
The CODM
periodically reviews the results and certain asset categories and
assesses performance of this operating segment based on a measure
of profit or loss of the segment composed by the operating income
plus the equity in earnings of joint ventures and associates. The
valuation criteria used in preparing this information are
consistent with IFRS standards used for the preparation of the
consolidated financial statements.
As indicated under
Note 2, the Group decided to consolidate income derived from its
operations center in Israel with a three month lag, adjusted for
the effects of significant transactions. Hence, operating results
of IDBD for the period extending from October 11, 2015 (acquisition
date) through March 31, 2016 are included in the Group’s
comprehensive income for the fiscal year ended June 30,
2016.
F- 85
Cresud Sociedad Anónima,
Comercial, Inmobiliaria, Financiera y Agropecuaria
Notes to the Consolidated
Financial Statements
(Continued)
(All amounts in
millions of Argentine Pesos, except otherwise
indicated)
6.
Segment information
(Continued)
Furthermore,
comparative information has not been modified for as of that date
the Group did not exercise control over IDBD. The assessment of
this investment was part of the international segment of the urban
properties and investment business in the operations center in
Argentina.
Goods and services
exchanged between segments are calculated based on market prices.
Intercompany transactions between segments, if any, are
eliminated.
As to those
business segments involving the operations center in Argentina
where assets are reported under the proportional consolidation
method, each reported asset includes the proportional share of the
Group in the same class of assets of the associates and/or joint
ventures. Only as an example, the amount of investment properties
reported includes (i) the balance of investment properties as
stated in the statement of financial position, plus (ii) the
Group’s share in the balances of investment properties of
joint ventures.
Within the
agricultural business, most revenue from its operating segments are
generated from and their assets are located in Argentina and
Brazil, mainly.
Within the urban
properties and investment business in the operations center in
Argentina, most revenue from its operating segments are generated
from and their assets are located in Argentina, except for earnings
of associates included in the “International” segment
located in USA.
Within the urban
properties and investment business in the operations center in
Israel, most revenue from its operating segments are generated from
and their assets are located in Israel, except for certain earnings
from the Real Estate segment generated outside Israel, mainly in
USA.
Within the
agricultural business and the urban properties and investments
business from the operations center in Argentina, the assets
categories reviewed by the CODM are: investment properties,
property, plant and equipment, trading properties, inventories,
biological assets, right to receive future units under barter
agreements, investment in joint ventures and associates and
goodwill. The aggregate of these assets, classified by business
segment, are disclosed as “segment assets”. Assets are
allocated to each segment based on the operations and/or their
physical location.
F- 86
Cresud Sociedad Anónima,
Comercial, Inmobiliaria, Financiera y Agropecuaria
Notes to the Consolidated
Financial Statements
(Continued)
(All amounts in
millions of Argentine Pesos, except otherwise
indicated)
6.
Segment information
(Continued)
Below is a
summarized analysis of the lines of business of the Group for the
year ended June 30, 2016:
|
|
Agricultural
business
|
|
Urban
properties and investments business
|
|
Total
|
||||
|
|
|
|
Operations Center in Argentina
|
|
Operations Center in
Israel
|
|
Subtotal
|
|
|
|
Revenues
|
2,912
|
|
3,284
|
|
28,229
|
|
31,513
|
|
34,425
|
|
Costs
|
(3,821)
|
|
(839)
|
|
(20,481)
|
|
(21,320)
|
|
(25,141)
|
|
Initial recognition
and changes in the fair value of biological assets and agricultural
produce at the point of harvest
|
1,717
|
|
-
|
|
-
|
|
-
|
|
1,717
|
|
Changes in the net
realizable value of agricultural produce after harvest
|
208
|
|
-
|
|
-
|
|
-
|
|
208
|
|
Gross
profit
|
1,016
|
|
2,445
|
|
7,748
|
|
10,193
|
|
11,209
|
|
Gain from disposal
of investment properties
|
-
|
|
1,056
|
|
45
|
|
1,101
|
|
1,101
|
|
Loss from disposal
of farmlands
|
(2)
|
|
-
|
|
-
|
|
-
|
|
(2)
|
|
General and
administrative expenses
|
(314)
|
|
(554)
|
|
(1,387)
|
|
(1,941)
|
|
(2,255)
|
|
Selling
expenses
|
(338)
|
|
(264)
|
|
(5,686)
|
|
(5,950)
|
|
(6,288)
|
|
Other operating
results, net
|
(70)
|
|
31
|
|
-
|
|
31
|
|
(39)
|
|
Profit
from operations
|
292
|
|
2,714
|
|
720
|
|
3,434
|
|
3,726
|
|
Share of profit /
(loss) of joint ventures and associates
|
23
|
|
99
|
|
338
|
|
437
|
|
460
|
|
Segment
profit
|
315
|
|
2,813
|
|
1,058
|
|
3,871
|
|
4,186
|
|
|
|
|
|
|
|
|
|
|
|
|
Investment
properties
|
11
|
|
3,340
|
|
-
|
|
3,340
|
|
3,351
|
|
Property, plant and
equipment
|
2,736
|
|
244
|
|
-
|
|
244
|
|
2,980
|
|
Trading
properties
|
-
|
|
253
|
|
-
|
|
253
|
|
253
|
|
Goodwill
|
10
|
|
25
|
|
-
|
|
25
|
|
35
|
|
Rights to receive
future units under barter agreements
|
-
|
|
90
|
|
-
|
|
90
|
|
90
|
|
Biological
assets
|
1,144
|
|
-
|
|
-
|
|
-
|
|
1,144
|
|
Inventories
|
660
|
|
28
|
|
-
|
|
28
|
|
688
|
|
Interests in joint
ventures and associates
|
54
|
|
964
|
|
-
|
|
964
|
|
1,018
|
|
Operating assets
from Operations Center in Israel
|
-
|
|
-
|
|
146,989
|
|
146,989
|
|
146,989
|
|
Total
segment assets
|
4,615
|
|
4,944
|
|
146,989
|
|
151,933
|
|
156,548
|
|
|
|
|
|
|
|
|
|
|
|
|
Operating
liabilities from Operations Center in Israel
|
-
|
|
-
|
|
132,865
|
|
132,865
|
|
132,865
|
F- 87
Cresud Sociedad Anónima,
Comercial, Inmobiliaria, Financiera y Agropecuaria
Notes to the Consolidated
Financial Statements
(Continued)
(All amounts in
millions of Argentine Pesos, except otherwise
indicated)
6.
Segment information
(Continued)
Below is a
summarized analysis of the lines of business of the Group for the
year ended June 30, 2015:
|
|
Agricultural
business
|
|
Urban
properties and investments business
|
|
Total
|
|
|
|
|
Operations Center in Argentina
|
|
|
|
Revenues
|
2,395
|
|
2,547
|
|
4,942
|
|
Costs
|
(3,419)
|
|
(633)
|
|
(4,052)
|
|
Initial recognition
and changes in the fair value of biological assets and agricultural
produce at the point of harvest
|
1,347
|
|
-
|
|
1,347
|
|
Changes in the net
realizable value of agricultural produce after harvest
|
(34)
|
|
-
|
|
(34)
|
|
Gross
profit
|
289
|
|
1,914
|
|
2,203
|
|
Gain from disposal
of investment properties
|
-
|
|
1,150
|
|
1,150
|
|
Gain from disposal
of farmlands
|
570
|
|
-
|
|
570
|
|
General and
administrative expenses
|
(247)
|
|
(378)
|
|
(625)
|
|
Selling
expenses
|
(286)
|
|
(195)
|
|
(481)
|
|
Other operating
results, net
|
(19)
|
|
29
|
|
10
|
|
Profit
from operations
|
307
|
|
2,520
|
|
2,827
|
|
Share of profit /
(loss) of joint ventures and associates
|
1
|
|
(1,037)
|
|
(1,036)
|
|
Segment
profit
|
308
|
|
1,483
|
|
1,791
|
|
|
|
|
|
|
|
|
Investment
properties
|
77
|
|
3,494
|
|
3,571
|
|
Property, plant and
equipment
|
2,079
|
|
256
|
|
2,335
|
|
Trading
properties
|
-
|
|
136
|
|
136
|
|
Goodwill
|
8
|
|
25
|
|
33
|
|
Rights to receive
future units under barter agreements
|
-
|
|
90
|
|
90
|
|
Biological
assets
|
588
|
|
-
|
|
588
|
|
Inventories
|
496
|
|
23
|
|
519
|
|
Interests in joint
ventures and associates
|
33
|
|
2,382
|
|
2,415
|
|
Total
segment assets
|
3,281
|
|
6,406
|
|
9,687
|
F- 88
Cresud Sociedad Anónima,
Comercial, Inmobiliaria, Financiera y Agropecuaria
Notes to the Consolidated
Financial Statements
(Continued)
(All amounts in
millions of Argentine Pesos, except otherwise
indicated)
6.
Segment information
(Continued)
Below is a
summarized analysis of the lines of business of the Group for the
year ended June 30, 2014:
|
|
Agricultural
business
|
|
Urban
properties and investments business
|
|
Total
|
|
|
|
|
Operations Center in Argentina
|
|
|
|
Revenues
|
1,813
|
|
2,157
|
|
3,970
|
|
Costs
|
(2,617)
|
|
(649)
|
|
(3,266)
|
|
Initial recognition
and changes in the fair value of biological assets and agricultural
produce at the point of harvest
|
1,172
|
|
-
|
|
1,172
|
|
Changes in the net
realizable value of agricultural produce after harvest
|
(17)
|
|
-
|
|
(17)
|
|
Gross
profit
|
351
|
|
1,508
|
|
1,859
|
|
Gain from disposal
of investment properties
|
-
|
|
231
|
|
231
|
|
Gain from disposal
of farmlands
|
91
|
|
-
|
|
91
|
|
General and
administrative expenses
|
(241)
|
|
(300)
|
|
(541)
|
|
Selling
expenses
|
(210)
|
|
(150)
|
|
(360)
|
|
Other operating
results, net
|
(29)
|
|
(49)
|
|
(78)
|
|
(Loss) / Profit
from operations
|
(38)
|
|
1,240
|
|
1,202
|
|
Share of profit /
(loss) of joint ventures and associates
|
11
|
|
(437)
|
|
(426)
|
|
Segment
(loss) / profit
|
(27)
|
|
803
|
|
776
|
|
|
|
|
|
|
|
|
Investment
properties
|
51
|
|
3,539
|
|
3,590
|
|
Property, plant and
equipment
|
2,417
|
|
238
|
|
2,655
|
|
Trading
properties
|
-
|
|
143
|
|
143
|
|
Goodwill
|
11
|
|
26
|
|
37
|
|
Rights to receive
future units under barter agreements
|
-
|
|
85
|
|
85
|
|
Assets held for
sale
|
-
|
|
1,358
|
|
1,358
|
|
Biological
assets
|
652
|
|
-
|
|
652
|
|
Inventories
|
433
|
|
18
|
|
451
|
|
Interests in joint
ventures and associates
|
37
|
|
1,966
|
|
2,003
|
|
Total
segment assets
|
3,601
|
|
7,373
|
|
10,974
|
F- 89
Cresud Sociedad Anónima,
Comercial, Inmobiliaria, Financiera y Agropecuaria
Notes to the Consolidated
Financial Statements
(Continued)
(All amounts in
millions of Argentine Pesos, except otherwise
indicated)
6.
Segment information
(Continued)
(I)
Agriculture line of business:
The following
tables present the reportable segments of the agriculture line of
business:
|
|
June
30, 2016
|
||||||
|
|
Agricultural
production
|
|
Land
transformation
and
sales
|
|
Others
|
|
Total
Agricultural
business
(i)
|
|
Revenues
|
1,689
|
|
-
|
|
1,223
|
|
2,912
|
|
Costs
|
(2,727)
|
|
(9)
|
|
(1,085)
|
|
(3,821)
|
|
Initial recognition
and changes in the fair value of biological assets and agricultural
produce at the point of harvest
|
1,717
|
|
-
|
-
|
-
|
|
1,717
|
|
Changes in the net
realizable value of agricultural produce
after
harvest
|
208
|
|
-
|
-
|
-
|
|
208
|
|
Gross
profit / (loss)
|
887
|
|
(9)
|
|
138
|
|
1,016
|
|
Loss from disposal
of farmlands
|
-
|
|
(2)
|
|
-
|
|
(2)
|
|
General and
administrative expenses
|
(256)
|
|
(1)
|
|
(57)
|
|
(314)
|
|
Selling
expenses
|
(247)
|
|
-
|
|
(91)
|
|
(338)
|
|
Other operating
results, net
|
(72)
|
|
-
|
|
2
|
|
(70)
|
|
Profit
/ (Loss) from operations
|
312
|
|
(12)
|
|
(8)
|
|
292
|
|
Share of profit /
(loss) of associates
|
26
|
|
-
|
|
(3)
|
|
23
|
|
Segment
profit / (loss)
|
338
|
|
(12)
|
|
(11)
|
|
315
|
|
|
|
|
|
|
|
|
|
|
Investment
properties
|
-
|
-
|
-
|
|
11
|
|
11
|
|
Property, plant and
equipment
|
2,673
|
|
13
|
|
50
|
|
2,736
|
|
Goodwill
|
10
|
|
-
|
|
-
|
|
10
|
|
Biological
assets
|
1,144
|
|
-
|
|
-
|
|
1,144
|
|
Inventories
|
499
|
|
-
|
|
161
|
|
660
|
|
Investments in
associates
|
54
|
|
-
|
|
-
|
|
54
|
|
Total
segment assets (ii)
|
4,380
|
|
13
|
|
222
|
|
4,615
|
(i)
From all of the
Group’s revenues corresponding to Agricultural Business, Ps.
2,212 are generated in Argentina and Ps. 700 in other countries,
principally in Brazil for Ps. 503.
(ii)
From all of the
Group’s assets included in the segment corresponding to
Agricultural Business, Ps. 2,062 are located in Argentina and Ps.
2,556 in other countries, principally in Brazil for Ps.
1,470.
F- 90
Cresud Sociedad Anónima,
Comercial, Inmobiliaria, Financiera y Agropecuaria
Notes to the Consolidated
Financial Statements
(Continued)
(All amounts in
millions of Argentine Pesos, except otherwise
indicated)
6.
Segment information
(Continued)
|
|
June
30, 2015
|
||||||
|
|
Agricultural
production
|
|
Land
transformation
and
sales
|
|
Others
|
|
Total
Agricultural
business
(i)
|
|
Revenues
|
1,400
|
|
-
|
|
995
|
|
2,395
|
|
Costs
|
(2,545)
|
|
(9)
|
|
(865)
|
|
(3,419)
|
|
Initial recognition
and changes in the fair value of biological assets and agricultural
produce at the point of harvest
|
1,347
|
|
-
|
|
-
|
|
1,347
|
|
Changes in the net
realizable value of agricultural produce
after
harvest
|
(34)
|
|
-
|
|
-
|
|
(34)
|
|
Gross
profit / (loss)
|
168
|
|
(9)
|
|
130
|
|
289
|
|
Gain from disposal
of farmlands
|
-
|
|
570
|
|
-
|
|
570
|
|
General and
administrative expenses
|
(210)
|
|
(2)
|
|
(35)
|
|
(247)
|
|
Selling
expenses
|
(193)
|
|
(2)
|
|
(91)
|
|
(286)
|
|
Other operating
results, net
|
(15)
|
|
(5)
|
|
1
|
|
(19)
|
|
(Loss)
/ Profit from operations
|
(250)
|
|
552
|
|
5
|
|
307
|
|
Share of profit of
associates
|
1
|
|
-
|
|
-
|
|
1
|
|
Segment
(loss) / profit
|
(249)
|
|
552
|
|
5
|
|
308
|
|
|
|
|
|
|
|
|
|
|
Investment
properties
|
-
|
|
-
|
|
77
|
|
77
|
|
Property, plant and
equipment
|
1,997
|
|
13
|
|
69
|
|
2,079
|
|
Goodwill
|
7
|
|
-
|
|
1
|
|
8
|
|
Biological
assets
|
587
|
|
-
|
|
1
|
|
588
|
|
Inventories
|
370
|
|
-
|
|
126
|
|
496
|
|
Investments in
associates
|
33
|
|
-
|
|
-
|
|
33
|
|
Total
segment assets (ii)
|
2,994
|
|
13
|
|
274
|
|
3,281
|
(i)
From all of the
Group’s revenues corresponding to Agricultural Business, Ps.
1,679 are generated in Argentina and Ps. 716 in other countries,
principally in Brazil for Ps. 578.
(ii)
From all of the
Group’s assets included in the segment corresponding to
Agricultural Business, Ps. 1,379 are located in Argentina and Ps.
1,902 in other countries, principally in Brazil for Ps.
1,186.
F- 91
Cresud Sociedad Anónima,
Comercial, Inmobiliaria, Financiera y Agropecuaria
Notes to the Consolidated
Financial Statements
(Continued)
(All amounts in
millions of Argentine Pesos, except otherwise
indicated)
6.
Segment information
(Continued)
|
|
June
30, 2014
|
||||||
|
|
Agricultural
production
|
|
Land
transformation
and
sales
|
|
Others
|
|
Total
Agricultural
business
(i)
|
|
Revenues
|
1,105
|
|
-
|
|
708
|
|
1,813
|
|
Costs
|
(2,011)
|
|
(8)
|
|
(598)
|
|
(2,617)
|
|
Initial recognition
and changes in the fair value of biological assets and agricultural
produce at the point of harvest
|
1,172
|
|
-
|
|
-
|
|
1,172
|
|
Changes in the net
realizable value of agricultural produce
after
harvest
|
(17)
|
|
-
|
|
-
|
|
(17)
|
|
Gross
profit / (loss)
|
249
|
|
(8)
|
|
110
|
|
351
|
|
Gain from disposal
of farmlands
|
-
|
|
91
|
|
-
|
|
91
|
|
General and
administrative expenses
|
(208)
|
|
(1)
|
|
(32)
|
|
(241)
|
|
Selling
expenses
|
(139)
|
|
(4)
|
|
(67)
|
|
(210)
|
|
Other operating
results, net
|
(29)
|
|
-
|
|
-
|
|
(29)
|
|
(Loss)
/ Profit from operations
|
(127)
|
|
78
|
|
11
|
|
(38)
|
|
Share of profit of
associates
|
11
|
|
-
|
|
-
|
|
11
|
|
Segment
(loss) / profit
|
(116)
|
|
78
|
|
11
|
|
(27)
|
|
|
|
|
|
|
|
|
|
|
Investment
properties
|
-
|
|
-
|
|
51
|
|
51
|
|
Property, plant and
equipment
|
2,365
|
|
7
|
|
45
|
|
2,417
|
|
Goodwill
|
10
|
|
-
|
|
1
|
|
11
|
|
Biological
assets
|
647
|
|
-
|
|
5
|
|
652
|
|
Inventories
|
334
|
|
-
|
|
99
|
|
433
|
|
Investments in
associates
|
34
|
|
-
|
|
3
|
|
37
|
|
Total
segment assets (ii)
|
3,390
|
|
7
|
|
204
|
|
3,601
|
(i)
From all of the
Group’s revenues corresponding to Agricultural Business, Ps.
1,279 million are generated in Argentina and Ps. 534 million in
other countries, principally in Brazil for Ps. 415
million.
(ii)
From all of the
Group’s assets included in the segment corresponding to
Agricultural Business, Ps. 1,252 million are located in Argentina
and Ps. 2,348 million in other countries, principally in Brazil for
Ps. 1,727 million.
F- 92
Cresud Sociedad Anónima,
Comercial, Inmobiliaria, Financiera y Agropecuaria
Notes to the Consolidated
Financial Statements
(Continued)
(All amounts in
millions of Argentine Pesos, except otherwise
indicated)
6.
Segment information
(Continued)
(II)
Urban properties line of business and investments
The following
tables present the reportable segments from the Operations Center
in Argentina:
|
|
June
30, 2016
|
||||||||||||
|
|
Shopping
Center
|
|
Offices
and others
|
|
Sales
and developments
|
|
Hotels
|
|
International
|
|
Financial
operations
and
others
|
|
Total
|
|
Revenues
(i)
|
2,406
|
|
340
|
|
3
|
|
534
|
|
-
|
|
1
|
|
3,284
|
|
Costs
|
(403)
|
|
(53)
|
|
(20)
|
|
(362)
|
|
-
|
|
(1)
|
|
(839)
|
|
Gross
profit / (loss)
|
2,003
|
|
287
|
|
(17)
|
|
172
|
|
-
|
|
-
|
|
2,445
|
|
Gain from disposal
of investment properties
|
-
|
|
-
|
|
1,056
|
|
-
|
|
-
|
|
-
|
|
1,056
|
|
General and
administrative expenses
|
(179)
|
|
(50)
|
|
(131)
|
|
(103)
|
|
(91)
|
|
-
|
|
(554)
|
|
Selling
expenses
|
(145)
|
|
(12)
|
|
(36)
|
|
(69)
|
|
-
|
|
(2)
|
|
(264)
|
|
Other operating
results, net
|
(42)
|
|
(6)
|
|
(8)
|
|
(2)
|
|
88
|
|
1
|
|
31
|
|
Profit
/ (Loss) from operations
|
1,637
|
|
219
|
|
864
|
|
(2)
|
|
(3)
|
|
(1)
|
|
2,714
|
|
Share of profit /
(loss) of joint ventures and associates
|
-
|
|
14
|
|
5
|
|
-
|
|
(151)
|
|
231
|
|
99
|
|
Segment
profit / (loss)
|
1,637
|
|
233
|
|
869
|
|
(2)
|
|
(154)
|
|
230
|
|
2,813
|
|
|
|
|
|
|
|
|
|
|
|
|
|
|
|
|
Investment
properties
|
2,282
|
|
879
|
|
173
|
|
-
|
|
-
|
|
6
|
|
3,340
|
|
Property, plant and
equipment
|
49
|
|
25
|
|
2
|
|
166
|
|
2
|
|
-
|
|
244
|
|
Trading
properties
|
1
|
|
-
|
|
252
|
|
-
|
|
-
|
|
-
|
|
253
|
|
Goodwill
|
14
|
|
6
|
|
5
|
|
-
|
|
-
|
|
-
|
|
25
|
|
Rights to receive
future units under barter agreements
|
-
|
|
-
|
|
90
|
|
-
|
|
-
|
|
-
|
|
90
|
|
Inventories
|
19
|
|
-
|
|
1
|
|
8
|
|
-
|
|
-
|
|
28
|
|
Investment in joint
ventures and associates
|
-
|
|
31
|
|
62
|
|
-
|
|
(832)
|
|
1,703
|
|
964
|
|
Total
segment assets (ii)
|
2,365
|
|
941
|
|
585
|
|
174
|
|
(830)
|
|
1,709
|
|
4,944
|
(i)
From all the
Group's revenues corresponding to the urban properties and
investment business of the Operations Center in Argentina, Ps.
3,284 are generated in Argentina. No external client represents 10%
or more of revenue of any of the reportable segments.
(ii)
From all of the
Group's assets included in the segment corresponding to the urban
properties and investment business of the operations Center in
Argentina, Ps. 5,618 are located in Argentina and Ps. (674) in
other countries, principally in United States for Ps. (832) and
Uruguay for Ps. 158, respectively.
F- 93
Cresud Sociedad Anónima,
Comercial, Inmobiliaria, Financiera y Agropecuaria
Notes to the Consolidated
Financial Statements
(Continued)
(All amounts in
millions of Argentine Pesos, except otherwise
indicated)
6.
Segment information
(Continued)
|
|
June
30, 2015
|
||||||||||||
|
|
Shopping
Center
|
|
Offices
and others
|
|
Sales
and developments
|
|
Hotels
|
|
International
|
|
Financial
operations
and
others
|
|
Total
|
|
Revenues
(i)
|
1,778
|
|
333
|
|
14
|
|
396
|
|
26
|
|
-
|
|
2,547
|
|
Costs
|
(291)
|
|
(36)
|
|
(19)
|
|
(279)
|
|
(7)
|
|
(1)
|
|
(633)
|
|
Gross
profit / (loss)
|
1,487
|
|
297
|
|
(5)
|
|
117
|
|
19
|
|
(1)
|
|
1,914
|
|
Gain from disposal
of investment properties
|
-
|
|
-
|
|
1,150
|
|
-
|
|
-
|
|
-
|
|
1,150
|
|
General and
administrative expenses
|
(135)
|
|
(59)
|
|
(50)
|
|
(78)
|
|
(56)
|
|
-
|
|
(378)
|
|
Selling
expenses
|
(113)
|
|
(21)
|
|
(9)
|
|
(52)
|
|
-
|
|
-
|
|
(195)
|
|
Other operating
results, net
|
(49)
|
|
(118)
|
|
13
|
|
-
|
|
185
|
|
(2)
|
|
29
|
|
Profit
/ (Loss) from operations
|
1,190
|
|
99
|
|
1,099
|
|
(13)
|
|
148
|
|
(3)
|
|
2,520
|
|
Share of (loss) /
profit of joint ventures and associates
|
-
|
|
(3)
|
|
(2)
|
|
1
|
|
(1,191)
|
|
158
|
|
(1,037)
|
|
Segment
profit / (loss)
|
1,190
|
|
96
|
|
1,097
|
|
(12)
|
|
(1,043)
|
|
155
|
|
1,483
|
|
|
|
|
|
|
|
|
|
|
|
|
|
|
|
|
Investment
properties
|
2,321
|
|
978
|
|
188
|
|
-
|
|
-
|
|
7
|
|
3,494
|
|
Property, plant and
equipment
|
48
|
|
31
|
|
1
|
|
175
|
|
1
|
|
-
|
|
256
|
|
Trading
properties
|
1
|
|
-
|
|
135
|
|
-
|
|
-
|
|
-
|
|
136
|
|
Goodwill
|
14
|
|
6
|
|
5
|
|
-
|
|
-
|
|
-
|
|
25
|
|
Rights to receive
future units under barter agreements
|
-
|
|
-
|
|
90
|
|
-
|
|
-
|
|
-
|
|
90
|
|
Inventories
|
16
|
|
-
|
|
-
|
|
7
|
|
-
|
|
-
|
|
23
|
|
Interests in joint
ventures and associates
|
-
|
|
21
|
|
47
|
|
-
|
|
910
|
|
1,404
|
|
2,382
|
|
Total
segment assets (ii)
|
2,400
|
|
1,036
|
|
466
|
|
182
|
|
911
|
|
1,411
|
|
6,406
|
(i)
From all the
Group's revenues corresponding to the urban properties and
investment business of the Operations Center in Argentina, Ps.
2,521 are originated in Argentina and Ps. 26 in United States. No
external client represents 10% or more of revenue of any of the
reportable segments.
(ii)
From all of the
Group's assets included in the segment corresponding to the urban
properties and investment business of the Operations Center in
Argentina, Ps. 4,767 are located in Argentina and Ps. 1,639 in
other countries, principally in United States for Ps. 1,533 and
Uruguay for Ps. 106, respectively.
F- 94
Cresud Sociedad Anónima,
Comercial, Inmobiliaria, Financiera y Agropecuaria
Notes to the Consolidated
Financial Statements
(Continued)
(All amounts in
millions of Argentine Pesos, except otherwise
indicated)
6.
Segment information
(Continued)
|
|
June
30, 2014
|
||||||||||||
|
|
Shopping
Center
|
|
Offices
and others
|
|
Sales
and developments
|
|
Hotels
|
|
International
|
|
Financial
operations
and
others
|
|
Total
|
|
Revenues
(i)
|
1,383
|
|
271
|
|
86
|
|
332
|
|
84
|
|
1
|
|
2,157
|
|
Costs
|
(297)
|
|
(45)
|
|
(35)
|
|
(217)
|
|
(54)
|
|
(1)
|
|
(649)
|
|
Gross
profit
|
1,086
|
|
226
|
|
51
|
|
115
|
|
30
|
|
-
|
|
1,508
|
|
Gain from disposal
of investment properties
|
-
|
|
-
|
|
231
|
|
-
|
|
-
|
|
-
|
|
231
|
|
General and
administrative expenses
|
(102)
|
|
(42)
|
|
(37)
|
|
(60)
|
|
(59)
|
|
-
|
|
(300)
|
|
Selling
expenses
|
(73)
|
|
(21)
|
|
(14)
|
|
(42)
|
|
-
|
|
-
|
|
(150)
|
|
Other operating
results, net
|
(47)
|
|
(3)
|
|
8
|
|
(3)
|
|
(1)
|
|
(3)
|
|
(49)
|
|
Profit
/ (Loss) from operations
|
864
|
|
160
|
|
239
|
|
10
|
|
(30)
|
|
(3)
|
|
1,240
|
|
Share of (loss) /
profit of joint ventures and associates
|
-
|
|
(1)
|
|
6
|
|
1
|
|
(616)
|
|
173
|
|
(437)
|
|
Segment
profit / (loss)
|
864
|
|
159
|
|
245
|
|
11
|
|
(646)
|
|
170
|
|
803
|
|
|
|
|
|
|
|
|
|
|
|
|
|
|
|
|
Investment
properties
|
2,275
|
|
834
|
|
423
|
|
-
|
|
-
|
|
7
|
|
3,539
|
|
Property, plant and
equipment
|
20
|
|
36
|
|
4
|
|
176
|
|
2
|
|
-
|
|
238
|
|
Trading
properties
|
1
|
|
-
|
|
142
|
|
-
|
|
-
|
|
-
|
|
143
|
|
Goodwill
|
9
|
|
12
|
|
5
|
|
-
|
|
-
|
|
-
|
|
26
|
|
Rights to receive
future units under barter agreements
|
-
|
|
-
|
|
85
|
|
-
|
|
-
|
|
-
|
|
85
|
|
Assets held for
sale
|
-
|
|
-
|
|
-
|
|
-
|
|
1,358
|
|
-
|
|
1,358
|
|
Inventories
|
11
|
|
-
|
|
1
|
|
6
|
|
-
|
|
-
|
|
18
|
|
Interests in joint
ventures and associates
|
-
|
|
23
|
|
38
|
|
22
|
|
629
|
|
1,254
|
|
1,966
|
|
Total
segment assets (ii)
|
2,316
|
|
905
|
|
698
|
|
204
|
|
1,989
|
|
1,261
|
|
7,373
|
(i)
From all the
Group's revenues corresponding to the urban properties and
investment business of the Operations Center in Argentina, Ps.
2,073 are originated mainly in Argentina and Ps. 84 in United
States. No external client represents 10% or more of revenue of any
of the reportable segments.
(ii)
From all of the
Group's assets included in the segment corresponding to the urban
properties and investment business of the Operations Center in
Argentina, Ps. 5,274 are located in Argentina and Ps. 2,099 in
other countries, principally in United States for Ps.
1,988.
F- 95
Cresud Sociedad Anónima,
Comercial, Inmobiliaria, Financiera y Agropecuaria
Notes to the Consolidated
Financial Statements
(Continued)
(All amounts in
millions of Argentine Pesos, except otherwise
indicated)
6.
6.
Segment
information
(Continued)
The following table
presents the reportable segments of the Operations Center in
Israel:
|
|
June
30, 2016
|
||||||||||||
|
|
Real
Estate
|
|
Supermarkets
|
|
Agrochemicals
|
|
Telecommunications
|
|
Insurance
|
|
Others
|
|
Total
|
|
Revenues
(i)
|
1,538
|
|
18,610
|
|
-
|
|
6,655
|
|
-
|
|
1,426
|
|
28,229
|
|
Costs
|
(837)
|
|
(13,925)
|
|
-
|
|
(4,525)
|
|
-
|
|
(1,194)
|
|
(20,481)
|
|
Gross
profit
|
701
|
|
4,685
|
|
-
|
|
2,130
|
|
-
|
|
232
|
|
7,748
|
|
Gain from disposal
of investment properties
|
45
|
|
-
|
|
-
|
|
-
|
|
-
|
|
-
|
|
45
|
|
General and
administrative expenses
|
(100)
|
|
(203)
|
|
-
|
|
(708)
|
|
-
|
|
(376)
|
|
(1,387)
|
|
Selling
expenses
|
(29)
|
|
(4,058)
|
|
-
|
|
(1,493)
|
|
-
|
|
(106)
|
|
(5,686)
|
|
Profit
/ (Loss) from operations
|
617
|
|
424
|
|
-
|
|
(71)
|
|
-
|
|
(250)
|
|
720
|
|
Share of profit /
(loss) of joint ventures and associates
|
97
|
|
-
|
|
334
|
|
-
|
|
-
|
|
(93)
|
|
338
|
|
Segment
profit /
(loss)
|
714
|
|
424
|
|
334
|
|
(71)
|
|
-
|
|
(343)
|
|
1,058
|
|
|
|
|
|
|
|
|
|
|
|
|
|
|
|
|
Operating assets
(ii)
|
60,197
|
|
29,440
|
|
-
|
|
27,345
|
|
4,602
|
|
25,405
|
|
146,989
|
|
Operating
liabilities
|
(49,452)
|
|
(23,614)
|
|
-
|
|
(21,657)
|
|
-
|
|
(38,142)
|
|
(132,865)
|
|
|
10,745
|
|
5,826
|
|
-
|
|
5,688
|
|
4,602
|
|
(12,737)
|
|
14,124
|
(i)
From all the
Group's revenues corresponding to the urban properties and
investment business of the Operations Center in Israel, Ps. 512 are
originated in United States and Ps. 27,717 in Israel. No external
client represents 10% or more of revenue of any of the reportable
segments.
(ii)
From all of the
Group's assets included in the segment corresponding to the urban
properties and investment business of the Operations Center in
Israel, Ps. 14,070 are located in United States, Ps. 786 in India
and the remaining in Israel.
F- 96
Cresud Sociedad Anónima,
Comercial, Inmobiliaria, Financiera y Agropecuaria
Notes to the Consolidated
Financial Statements
(Continued)
(All amounts in
millions of Argentine Pesos, except otherwise
indicated)
6.
Segment information
(Continued)
The
following tables present a reconciliation between the total results
of operations as per the segment information and the profit from
operation as per the statement of income. The adjustments relate to
the presentation of the results of operations of joint ventures
accounted for under the equity method under IFRS and the
non-elimination of the inter-segment transactions.
|
|
June
30, 2016
|
|
|
|
|
|
|
Total
segment
information
|
Adjustment
for share of profit / (loss) of joint ventures
|
Expenses
and
collective promotion funds
|
Adjustment
to
income
for
elimination
of
inter-segment
transactions
|
Total
statement
of income
|
|
Revenues
|
34,425
|
(89)
|
1,194
|
(146)
|
35,384
|
|
Costs
|
(25,141)
|
111
|
(1,207)
|
147
|
(26,090)
|
|
Initial recognition
and changes in the fair value of biological assets and agricultural
produce at the point of harvest
|
1,717
|
(57)
|
-
|
-
|
1,660
|
|
Changes in the net
realizable value of agricultural produce after harvest
|
208
|
-
|
-
|
-
|
208
|
|
Gross
profit / (loss)
|
11,209
|
(35)
|
(13)
|
1
|
11,162
|
|
Gain from disposal
of investment properties
|
1,101
|
-
|
-
|
-
|
1,101
|
|
Loss from disposal
of farmlands
|
(2)
|
-
|
-
|
-
|
(2)
|
|
General and
administrative expenses
|
(2,255)
|
5
|
-
|
6
|
(2,244)
|
|
Selling
expenses
|
(6,288)
|
8
|
-
|
1
|
(6,279)
|
|
Other operating
results, net
|
(39)
|
(2)
|
-
|
(3)
|
(44)
|
|
Profit
/ (Loss) from operations before share of
Profit
/ (Loss) of joint ventures and associates
|
3,726
|
(24)
|
(13)
|
5
|
3,694
|
|
Share of (loss) /
profit of joint ventures and associates
|
460
|
13
|
-
|
-
|
473
|
|
Profit
/ (Loss) from operations before financing and
taxation
|
4,186
|
(11)
|
(13)
|
5
|
4,167
|
F- 97
Cresud Sociedad Anónima,
Comercial, Inmobiliaria, Financiera y Agropecuaria
Notes to the Consolidated
Financial Statements
(Continued)
(All amounts in
millions of Argentine Pesos, except otherwise
indicated)
6.
Segment information
(Continued)
|
|
June
30, 2015
|
||||||||
|
|
Total
segment
information
|
|
Adjustment
for share of Profit / (Loss)
of
joint ventures
|
|
Expenses
and
collective promotion funds
|
|
Adjustment
to
income for elimination of
inter-segment
transactions
|
|
Total
statement
of income
|
|
Revenues
|
4,942
|
|
(53)
|
|
887
|
|
(124)
|
|
5,652
|
|
Costs
|
(4,052)
|
|
61
|
|
(901)
|
|
122
|
|
(4,770)
|
|
Initial recognition
and changes in the fair value of biological assets and agricultural
produce at the point of harvest
|
1,347
|
|
(23)
|
|
-
|
|
-
|
|
1,324
|
|
Changes in the net
realizable value of agricultural produce after harvest
|
(34)
|
|
-
|
|
-
|
|
-
|
|
(34)
|
|
Gross
profit /
(loss)
|
2,203
|
|
(15)
|
|
(14)
|
|
(2)
|
|
2,172
|
|
Gain from disposal
of investment properties
|
1,150
|
|
-
|
|
-
|
|
-
|
|
1,150
|
|
Gain / (Loss) from
disposal of farmlands
|
570
|
|
(20)
|
|
-
|
|
-
|
|
550
|
|
General and
administrative
expenses
|
(625)
|
|
4
|
|
-
|
|
3
|
|
(618)
|
|
Selling
expenses
|
(481)
|
|
6
|
|
-
|
|
1
|
|
(474)
|
|
Other operating
results,
net
|
10
|
|
3
|
|
-
|
|
(1)
|
|
12
|
|
Profit
/ (Loss) from operations before share of Profit / (Loss) of joint
ventures and associates
|
2,827
|
|
(22)
|
|
(14)
|
|
1
|
|
2,792
|
|
Share of (loss) /
profit of joint ventures and associates
|
(1,036)
|
|
10
|
|
-
|
|
-
|
|
(1,026)
|
|
Profit
/ (Loss) from operations before financing and
taxation
|
1,791
|
|
(12)
|
|
(14)
|
|
1
|
|
1,766
|
|
|
June
30, 2014
|
||||||||
|
|
Total
segment
information
|
|
Adjustment
for share of Profit / (Loss)
of
joint ventures
|
|
Expenses
and
collective promotion funds
|
|
Adjustment
to
income
for
elimination
of
inter-segment
transactions
|
|
Total
statement
of income
|
|
Revenues
|
3,970
|
|
(63)
|
|
736
|
|
(39)
|
|
4,604
|
|
Costs
|
(3,266)
|
|
60
|
|
(744)
|
|
37
|
|
(3,913)
|
|
Initial recognition
and changes in the fair value of biological assets and agricultural
produce at the point of harvest
|
1,172
|
|
(20)
|
|
-
|
|
-
|
|
1,152
|
|
Changes in the net
realizable value of agricultural produce after harvest
|
(17)
|
|
-
|
|
-
|
|
-
|
|
(17)
|
|
Gross
profit /
(loss)
|
1,859
|
|
(23)
|
|
(8)
|
|
(2)
|
|
1,826
|
|
Gain from disposal
of investment properties
|
231
|
|
-
|
|
-
|
|
-
|
|
231
|
|
Gain from disposal
of
farmlands
|
91
|
|
-
|
|
-
|
|
-
|
|
91
|
|
General and
administrative
expenses
|
(541)
|
|
5
|
|
-
|
|
3
|
|
(533)
|
|
Selling
expenses
|
(360)
|
|
6
|
|
-
|
|
-
|
|
(354)
|
|
Other operating
results,
net
|
(78)
|
|
4
|
|
-
|
|
(1)
|
|
(75)
|
|
Profit
/ (Loss) from operations before share of Profit / (Loss) of joint
ventures and associates
|
1,202
|
|
(8)
|
|
(8)
|
|
-
|
|
1,186
|
|
Share of (loss) /
profit of joint ventures and associates
|
(426)
|
|
16
|
|
-
|
|
-
|
|
(410)
|
|
Profit
/ (Loss) from operations before financing and
taxation
|
776
|
|
8
|
|
(8)
|
|
-
|
|
776
|
F- 98
Cresud Sociedad Anónima,
Comercial, Inmobiliaria, Financiera y Agropecuaria
Notes to the Consolidated
Financial Statements
(Continued)
(All amounts in
millions of Argentine Pesos, except otherwise
indicated)
6.
Segment information
(Continued)
The
following tables present a reconciliation between total segment
assets and liabilities and total assets as per the statement of
financial position. Adjustments are mainly related to the filing of
certain classes of assets in segment information and to the
proportional consolidation of joint ventures mentioned
previously.
|
|
June 30, 2016
|
|
June 30, 2015
|
|
June 30, 2014
|
||||||||||||||
|
|
Agricultural
business
|
|
Urban properties
and investments business
|
|
Total
|
|
Agricultural
business
|
|
Urban properties
and investments business
|
|
Total
|
|
Agricultural
business
|
|
Urban properties
and investments business
|
|
Total
|
||
|
|
|
|
Operations Center in Argentina
|
Operations Center in
Israel
|
Subtotal
|
|
|
|
|
|
Operations
Center in
Argentina
|
|
|
|
|
|
Operations
Center in
Argentina
|
|
|
|
Total
Assets per
segment
|
4,615
|
|
4,944
|
146,989
|
151,933
|
|
156,548
|
|
3,281
|
|
6,406
|
|
9,687
|
|
3,601
|
|
7,373
|
|
10,974
|
|
Less:
|
|
|
|
|
|
|
|
|
|
|
|
|
|
|
|
|
|
|
|
|
Proportionate share
in reportable assets per segment of joint ventures (*)
|
(529)
|
|
(117)
|
-
|
(117)
|
|
(646)
|
|
(382)
|
|
(95)
|
|
(477)
|
|
(294)
|
|
(149)
|
|
(443)
|
|
Measurement
adjustments at fair value
|
|
|
|
|
|
|
|
|
|
|
|
|
|
|
|
|
|
|
|
|
Plus:
|
|
|
|
|
|
|
|
|
|
|
|
|
|
|
|
|
|
|
|
|
Investments in
joint ventures (**)
|
233
|
|
203
|
-
|
203
|
|
436
|
|
177
|
|
181
|
|
358
|
|
64
|
|
308
|
|
372
|
|
Other
non-reportable assets (***)
|
3,102
|
|
6,561
|
-
|
6,561
|
|
9,663
|
|
2,794
|
|
2,914
|
|
5,708
|
|
2,606
|
|
2,275
|
|
4,881
|
|
Total
Consolidated assets as per Statement of financial
position
|
7,421
|
|
11,591
|
146,989
|
158,580
|
|
166,001
|
|
5,870
|
|
9,406
|
|
15,276
|
|
5,977
|
|
9,807
|
|
15,784
|
F- 99
Cresud Sociedad Anónima,
Comercial, Inmobiliaria, Financiera y Agropecuaria
Notes to the Consolidated
Financial Statements
(Continued)
(All amounts in
millions of Argentine Pesos, except otherwise
indicated)
6.
Segment information
(Continued)
(*) Below is a
detail of the proportionate share in assets by segment of joint
ventures included in the information reported by
segment.
|
|
June 30, 2016
|
|
June 30, 2015
|
|
June 30, 2014
|
||||||||||||||
|
|
Agricultural
business
|
|
Urban properties
and investments business
|
|
Total
|
|
Agricultural
business
|
|
Urban properties
and investments business
|
|
Total
|
|
Agricultural
business
|
|
Urban properties and investments business
|
|
Total
|
||
|
|
|
|
Operations Center in Argentina
|
Operations
Center in
Israel
|
Subtotal
|
|
|
|
|
|
Operations
Center in Argentina
|
|
|
|
|
|
Operations
Center in Argentina
|
|
|
|
Investment
properties
|
2
|
|
115
|
-
|
115
|
|
117
|
|
-
|
|
96
|
|
96
|
|
-
|
|
135
|
|
135
|
|
Property, plant and
equipment
|
509
|
|
(5)
|
-
|
(5)
|
|
504
|
|
366
|
|
(9)
|
|
357
|
|
273
|
|
-
|
|
273
|
|
Trading
properties
|
-
|
|
1
|
-
|
1
|
|
1
|
|
-
|
|
3
|
|
3
|
|
-
|
|
6
|
|
6
|
|
Goodwill
|
-
|
|
5
|
-
|
5
|
|
5
|
|
-
|
|
5
|
|
5
|
|
-
|
|
7
|
|
7
|
|
Biological
assets
|
12
|
|
-
|
-
|
-
|
|
12
|
|
9
|
|
-
|
|
9
|
|
11
|
|
-
|
|
11
|
|
Inventories
|
6
|
|
1
|
-
|
1
|
|
7
|
|
7
|
|
-
|
|
7
|
|
10
|
|
1
|
|
11
|
|
Total
proportionate share in assets per segment of joint
ventures
|
529
|
|
117
|
-
|
117
|
|
646
|
|
382
|
|
95
|
|
477
|
|
294
|
|
149
|
|
443
|
F- 100
Cresud Sociedad Anónima,
Comercial, Inmobiliaria, Financiera y Agropecuaria
Notes to the Consolidated
Financial Statements
(Continued)
(All amounts in
millions of Argentine Pesos, except otherwise
indicated)
6.
Segment information
(Continued)
(**)
Represents the
equity-accounted amount of those joint ventures, which were
proportionate-consolidated for segment information
purposes.
|
|
June 30, 2016
|
|
June 30, 2015
|
|
June 30, 2014
|
||||||||||||||
|
|
Agricultural
business
|
|
Urban properties
and investments business
|
|
Total
|
|
Agricultural
business
|
|
Urban properties
and investments business
|
|
Total
|
|
Agricultural
business
|
|
Urban properties
and investments business
|
|
Total
|
||
|
|
|
|
Operations Center in Argentina
|
Operations
Center in
Israel
|
Subtotal
|
|
|
|
|
|
Operations
Center in
Argentina
|
|
|
|
|
|
Operations
Center in Argentina
|
|
|
|
Total
Liabilities per segment
|
-
|
|
-
|
132,865
|
132,865
|
|
132,865
|
|
-
|
|
-
|
|
-
|
|
-
|
|
-
|
|
-
|
|
Plus:
|
|
|
|
|
|
|
|
|
|
|
|
|
|
|
|
|
|
|
|
|
Liabilities
corresponding to agricultural business and urban properties and
investment business of the operations center in
Argentina
|
5,323
|
|
12,581
|
-
|
12,581
|
|
17,904
|
|
4,209
|
|
7,165
|
|
11,374
|
|
4,213
|
|
7,136
|
|
11,349
|
|
Total
Consolidated liabilities as per Statement of financial
position
|
5,323
|
|
12,581
|
132,865
|
145,446
|
|
150,769
|
|
4,209
|
|
7,165
|
|
11,374
|
|
4,213
|
|
7,136
|
|
11,349
|
(***)
Includes deferred
income tax assets, income tax credit, restricted assets, trade and
other receivables, financial assets held for sale, investment in
financial assets, derivative financial instruments, employee
benefits, cash and cash equivalents and intangible assets except
for goodwill and right to receive units.
F- 101
Cresud Sociedad Anónima,
Comercial, Inmobiliaria, Financiera y Agropecuaria
Notes to the Consolidated
Financial Statements
(Continued)
(All amounts in
millions of Argentine Pesos, except otherwise
indicated)
7.
Information
about principal subsidiaries
The Group conducts
its business through several operating subsidiaries and holdings.
The Group considers that the subsidiaries below are the ones with
non-controlling interests material to the Group. As of June 30,
2016 and 2015 correspond to urban properties and investment
business from the operations center in Argentina and agricultural
business.
|
|
As of
June 30, 2016
|
|
Year
ended June 30, 2016
|
||||||||||||||||||||||||||||||||
|
|
Non-controlling
shareholders’ interest
%
|
|
Current
assets
|
|
Non-current
assets
|
|
Current
liabilities
|
|
Non-
current
liabilities
|
|
Net
assets
|
|
Book
value of
non-controlling
shareholders
|
|
Revenues
|
|
Net
(Loss)/
Incomes
|
|
Other
comprehensive (Loss)/ Income
|
|
Total
comprehensive
Loss/
income
|
|
Profit
(loss) attributable to non-controlling shareholders
|
|
Other
comprehensive loss
attributable
to
non-controlling
shareholders
|
|
Cash
of
operating
activities
|
|
Cash of
investment activities
|
|
Cash
of
financial
activities
|
|
Net
increase (decrease) in cash and cash equivalents
|
|
Dividends
distributed to non-controlling shareholders
|
|
Elron (1)
|
49.68%
|
|
2,145
|
|
922
|
|
82
|
|
31
|
|
2,954
|
|
2,522
|
|
3
|
|
(97)
|
|
(103)
|
|
(200)
|
|
(55)
|
|
(71)
|
|
(171)
|
|
(58)
|
|
13
|
|
(216)
|
|
-
|
|
PBC (1)
|
23.55%
|
|
10,435
|
|
47,546
|
|
9,925
|
|
37,567
|
|
10,489
|
|
8,419
|
|
1,538
|
|
621
|
|
(267)
|
|
354
|
|
370
|
|
(116)
|
|
1,039
|
|
280
|
|
(2,414)
|
|
(1,095)
|
|
(322)
|
|
Cellcom (1)
|
58.23%
|
|
9,368
|
|
16,113
|
|
7,629
|
|
13,210
|
|
4,642
|
|
3,795
|
|
6,655
|
|
(64)
|
|
(3)
|
|
(67)
|
|
(39)
|
|
-
|
|
1,442
|
|
(241)
|
|
(776)
|
|
425
|
|
(6)
|
|
Shufersal (1)
|
47.05%
|
|
9,929
|
|
18,764
|
|
13,202
|
|
10,411
|
|
5,080
|
|
3,596
|
|
18,610
|
|
312
|
|
(19)
|
|
293
|
|
193
|
|
(13)
|
|
769
|
|
(483)
|
|
(2,436)
|
|
(2,150)
|
|
(151)
|
|
BrasilAgro
|
57.82%
|
|
898
|
|
2,260
|
|
415
|
|
205
|
|
2,538
|
|
1,380
|
|
467
|
|
(21)
|
|
619
|
|
598
|
|
(12)
|
|
358
|
|
(66)
|
|
353
|
|
(426)
|
|
(139)
|
|
(9)
|
|
IRSA
|
36.23%
|
|
42,763
|
|
116,237
|
|
43,600
|
|
101,899
|
|
13,501
|
|
12,386
|
|
32,675
|
|
(1,872)
|
|
3,892
|
|
2,020
|
|
(618)
|
|
3,400
|
|
4,139
|
|
8,210
|
|
(3,968)
|
|
8,381
|
|
(615)
|
|
|
As of June 30, 2015
|
|
Year ended June 30, 2015
|
||||||||||||||||||||||||||||||||
|
|
Non-controlling shareholders’ interest
%
|
|
Current assets
|
|
Non-current assets
|
|
Current liabilities
|
|
Non-
current liabilities
|
|
Net assets
|
|
Book value of non-controlling shareholders
|
|
Revenues
|
|
Net
Income / (Loss)
|
|
Other comprehensive income
|
|
Total comprehensive
income
|
|
Profit (loss) attributable to non-controlling
shareholders
|
|
Other comprehensive loss
attributable to
non-controlling shareholders
|
|
Cash of
operating activities
|
|
Cash of investment activities
|
|
Cash of
financial activities
|
|
Net increase (decrease) in cash and cash equivalents
|
|
Dividends distributed to non-controlling shareholders
|
|
|
|
|
|
|
|
|
|
|
|
|
|
|
|
|
|
|
|
|
|
|
|
|
|
|
|
|
|
|
|
|
|
|
|
|
|
|
BrasilAgro
|
64.30%
|
|
1,896
|
|
8,347
|
|
2,691
|
|
4,682
|
|
2,870
|
|
872
|
|
2,509
|
|
164
|
|
106
|
|
270
|
|
81
|
|
|
|
736
|
|
301
|
|
(1,298)
|
|
(261)
|
|
|
|
IRSA
|
39.77%
|
|
1,315
|
|
1,667
|
|
583
|
|
195
|
|
2,204
|
|
1,257
|
|
321
|
|
59
|
|
(472)
|
|
(413)
|
|
-
|
|
|
|
(161)
|
|
(46)
|
|
11
|
|
(196)
|
|
|
N/A: Not
applicable. Not considered a significant non-controlling
interest.
(1)
Corresponds to the
Group's indirect interest. The percentage of the non-controlling
interest represents the equity interest which is not owned by
DIC.
F- 102
Cresud Sociedad Anónima,
Comercial, Inmobiliaria, Financiera y Agropecuaria
Notes to the Consolidated
Financial Statements
(Continued)
(All amounts in
millions of Argentine Pesos, except otherwise
indicated)
7.
Information about principal subsidiaries
(Continued)
Significant events
Cellcom
is the largest provider of mobile telecommunications in Israel, it
offers its services approximately to 2.9 million subscribers with a
wide range of services. By the end of 2014, the Company launched
television services over the Internet. Under Israeli laws, in order
for a shareholder to be able to exert control over a
Telecommunications Company, such shareholder must first secure the
approval of the Ministry of Communications of Israel. Such
approval, consequence of change in control of IDBD, has not yet
been obtained.
In
November 2015, Cellcom entered into an agreement, subject to
approval, with Golan Telecom Ltd. ("Golan") and its shareholders to
acquire all of Golan’s shares for a price of NIS 1,170
million, subject to certain adjustments. To complete the
transaction, Cellcom intends to raise funds by way of a public
offering and DIC expects to subscribe shares for up to NIS 100
million at that public offering to maintain its current equity
interests. During April 2016, the Anti-trust Commission of Israel
and the Ministry of Communications notified Cellcom their objection
to the transaction described above but failed to state the grounds
for such objection.
In
June 2016, Hot Mobile Ltd. ("Hot"), a mobile phone carrier of
Israel, announced it intended to enter into a non-exclusive
long-term agreement for the provision of hosting services to Golan
for the network used by Hot, which is subject to approval and
directives by the Israel regulatory authorities.
Cellcom
informed Golan that the transaction with Hot amounts to a material
breach of the stock purchase agreement (“SPA”)
mentioned above and of the intra-national roaming agreement (the
“Roaming Agreement”) between Cellcom and Golan,
including an exclusivity commitment in relation to the provision of
services and the commitment to not apply any material change to the
business acquired. Cellcom notified Golan and its shareholders that
unless the breach to the SPA and the Roaming Agreement were cured,
Cellcom would be entitled to terminate the SPA and claim the
immediate reimbursement of an aggregate amount of NIS 600 million,
in addition to the reimbursement of sums of money already paid by
Cellcom to Golan. Non-performance will allow Cellcom to claim
damages for the future payments that should have been made by Golan
until the end of the exclusivity period agreed upon between the
parties.
In
July 2016, Cellcom started a legal action against Golan, including
a motion filed to suspend the agreement between Golan and Hot; in
this respect, on July 21, 2016 the District Court issued a
temporary restraining order against finalizing the agreement
between Golan and Hot, as requested by Cellcom. In August 2016,
Golan filed a motion with the Supreme Court challenging the
temporary order.
F- 103
Cresud Sociedad Anónima,
Comercial, Inmobiliaria, Financiera y Agropecuaria
Notes to the Consolidated
Financial Statements
(Continued)
(All amounts in
millions of Argentine Pesos, except otherwise
indicated)
7.
Information about principal subsidiaries
(Continued)
Analysis of the impact of the Concentration Act law
As mentioned in
note 1 to these financial statements, IDBD is analyzing the
implications of the Concentration Act law. The alternatives under
evaluation include: (i) delisting of IDBD or DIC so that it becomes
a private company, or (ii) a merger between IDBD and DIC. At the
time of approval of these financial statements, the preceding
alternatives are merely under evaluation and there is no certainty
as to implementation of the structural changes described above or
the date of any such implementation. IDBD and DIC estimate that one
of these alternatives are likely to be carried out, allowing the
Group to continue holding control of Cellcom after December
2019.
As indicated for
IDBD, PBC is also assessing the implications of this Act in
relation to its holdings in controlled companies, for the purpose
of continuing to exercise control; and it believes it will continue
to do so.
IDBD and DIC assess
whether it is necessary to recognize deferred tax liabilities for
the temporary differences arising in relation to its investments in
subsidiaries. In this respect, IDBD, DIC and PBC estimate that if
each of them is required to dispose of its respective holdings in
subsidiaries, they would not be liable to income tax on the sale
and, for such reason, they did not recognize the deferred tax
liabilities related to this difference in these financial
statements.
8.
Interests
in joint ventures
Evolution in the
Group’s investments in joint ventures for the years ended
June 30, 2016 and 2015 were as follows:
|
|
June 30,
2016
|
|
June 30,
2015
|
|
Beginning
of the year
|
378
|
|
395
|
|
Capital
contribution
|
77
|
|
95
|
|
Balance
incorporated by business combination (Note 3)
|
960
|
|
-
|
|
Share of
profit
|
143
|
|
5
|
|
Currency
translation adjustment
|
645
|
|
28
|
|
Cash dividends
(i)
|
(17)
|
|
(34)
|
|
Capital reduction
(ii)
|
-
|
|
(111)
|
|
End
of the year
|
2,186
|
|
378
|
(i)
During the fiscal
year ended June 30, 2016, Ps. 7 corresponds to Cyrsa, Ps. 4 to NPSF
and Ps. 6 to Manaman. During the fiscal year ended June 30, 2015,
Ps. 31 corresponds to Cyrsa and Ps. 3 to NPSF.
(ii)
During the fiscal
year ended June 30, 2015, Cyrsa carried out a distribution to IRSA
due to capital reduction for Ps. 111.
F- 104
Cresud Sociedad Anónima,
Comercial, Inmobiliaria, Financiera y Agropecuaria
Notes to the Consolidated
Financial Statements
(Continued)
(All amounts in
millions of Argentine Pesos, except otherwise
indicated)
8.
Interests in joint ventures
(Continued)
The table below
shows the value of interests in joint ventures for the fiscal years
ended June 30, 2016 and 2015, as well as the Group’s interest
in comprehensive income/(loss) of such companies for the fiscal
years ended June 30, 2016, 2015 and 2014:
|
Name of the entity
|
Place of business / Country of incorporation
|
Main activity
|
Nature
of the
relationship
|
Common shares 1 vote
|
Value of Group's interest in equity
|
|
Group's interest in
comprehensive income / (Operations)
|
|
% of ownership interest held
|
|
|||||||
|
June 30,
|
June 30,
|
|
June 30,
|
Last financial statement issued
|
|||||||||||||
|
2016
|
2015
|
|
2016
|
2015
|
2014
|
|
2016
|
2015
|
2014
|
Share Capital (nominal value)
|
(Loss) / profit for the year
|
Shareholders' equity
|
|||||
|
Cresca
S.A.
|
Paraguay
|
Agricultural
|
(1)
|
138,154
|
230
|
176
|
|
54
|
26
|
2
|
|
50%
|
50%
|
50%
|
144
|
(i)
27
|
588
|
|
Mehadrin
|
Israel
|
Agricultural
|
(2)
|
1,509,889
|
985
|
-
|
|
433
|
-
|
-
|
|
45.41%
|
-
|
-
|
(*)
3
|
(*)
70
|
(*)
499
|
|
Others joint
ventures
|
|
|
(3)
|
|
971
|
202
|
|
301
|
7
|
25
|
|
|
|
|
-
|
-
|
-
|
|
|
|
|
|
|
2,186
|
378
|
|
788
|
33
|
27
|
|
|
|
|
|
|
|
(1)
Cresca is a joint
venture between the Company and Carlos Casado S.A. with agriculture
operations in Paraguay.
(2)
Mehadrin is a
company engaged in the production and exports of citrus, fruits and
vegetables. The Group has entered into a joint venture agreement in
relation to this company.
(3)
The group also has
interest in a number of individually immaterial joint ventures that
are accounted for using the equity method.
(i)
As per
financial statements for the six-month period ended June 30,
2016.
(*) Amounts in
millions of NIS.
F- 105
Cresud Sociedad Anónima,
Comercial, Inmobiliaria, Financiera y Agropecuaria
Notes to the Consolidated
Financial Statements
(Continued)
(All amounts in
millions of Argentine Pesos, except otherwise
indicated)
8.
Interests
in joint ventures
(Continued)
Information
about significant joint ventures
Set out below is
the summarized financial information for those joint ventures that
are material to the Group:
|
|
As of June 30, 2016
|
|
Year ended June 30, 2016
|
||||||||||||||||||||||||||||||||
|
|
Current assets
|
|
Non-current
assets
|
|
Current liabilities
|
|
Non-
current
liabilities
|
|
Net assets
|
|
Dividends distribution
|
|
Net assets at end of the year
|
|
% of ownership interest held
|
|
Investments in joint venture
|
|
Goodwill and others
|
|
Net book amount
|
|
Revenues
|
|
Net
Income / (loss)
|
|
Total
comprehensive income
|
|
Cash od
operating activities
|
|
Cash of investment activities
|
|
Cash of
financial activities
|
|
Changes in cash and cash equivalents
|
|
Cresca S.A.
|
144
|
|
668
|
|
325
|
|
25
|
|
462
|
|
-
|
|
462
|
|
50%
|
|
231
|
|
(1)
|
|
230
|
|
120
|
|
6
|
|
(6)
|
|
77
|
|
(60)
|
|
-
|
|
17
|
|
Mehadrin
|
2,475
|
|
2,814
|
|
2,678
|
|
673
|
|
1,938
|
|
-
|
|
1,938
|
|
45.41%
|
|
880
|
|
105
|
|
985
|
|
(*)
819
|
|
(*)
68
|
|
(*)
68
|
|
(*)
96
|
|
(*)
(4)
|
|
(*)
64
|
|
(*)
156
|
|
|
As of June 30, 2015
|
|
Year ended June 30, 2015
|
||||||||||||||||||||||||||||||||
|
|
Current assets
|
|
Non-current
assets
|
|
Current liabilities
|
|
Non-
current
liabilities
|
|
Net assets
|
|
Dividends distribution
|
|
Net assets at end of the year
|
|
% of ownership interest held
|
|
Investments in joint venture
|
|
Goodwill and others
|
|
Net book amount
|
|
Revenues
|
|
Net
Income / (loss)
|
|
Total
comprehensive income
|
|
Cash od
operating activities
|
|
Cash of investment activities
|
|
Cash of
financial activities
|
|
Changes in cash and cash equivalents
|
|
Cresca S.A.
|
71
|
|
544
|
|
54
|
|
205
|
|
356
|
|
-
|
|
356
|
|
50%
|
|
178
|
|
(1)
|
|
177
|
|
52
|
|
(3)
|
|
56
|
|
-
|
|
-
|
|
-
|
|
-
|
|
Cyrsa
|
17
|
|
43
|
|
24
|
|
1
|
|
35
|
|
31
|
|
35
|
|
50%
|
|
18
|
|
-
|
|
18
|
|
11
|
|
14
|
|
14
|
|
7
|
|
(7)
|
|
1
|
|
1
|
|
Puerto Retiro
(i)
|
1
|
|
46
|
|
4
|
|
9
|
|
34
|
|
-
|
|
34
|
|
50%
|
|
17
|
|
28
|
|
45
|
|
2
|
|
(2)
|
|
(2)
|
|
(2)
|
|
-
|
|
3
|
|
1
|
|
Quality
(ii)
|
4
|
|
150
|
|
6
|
|
2
|
|
146
|
|
-
|
|
146
|
|
50%
|
|
73
|
|
1
|
|
74
|
|
16
|
|
4
|
|
4
|
|
(16)
|
|
-
|
|
15
|
|
(1)
|
(i)
On April 18, 2000,
Puerto Retiro was notified of a filing made by the National
Government, through the Ministry of Defense, to extend the petition
in bankruptcy of Indarsa to Puerto Retiro.
At the request of plaintiff, the bankruptcy court
for the Buenos Aires District issued an order restraining the
ability of Puerto Retiro to sell or dispose in any manner the land.
Indarsa had acquired 90% of the capital stock of Tandanor to a
formerly estate owned company in 1991. Indarsa did not comply with
the payment of the outstanding price for the acquisition of the
stock of Tandanor, and therefore the Ministry of Defense requested
the bankruptcy of Indarsa, pursuing to extend the bankruptcy to
Puerto Retiro. In addition, Tandanor filed a civil action against
Puerto Retiro and other accused parties in the criminal case for
violation of section 174 subsection 5, under section 173 subsection
7 of Criminal Code. The claim expects that upon invalidation of
executive order that approved the bid of Dársena Norte plot of
land, Tandanor be reimbursed any other sum of money that it claims
to have lost due to the alleged fraudulent purchase-sale
transaction of the real property disputed in the case. The
Management and legal advisors of Puerto Retiro estimate that there
are legal and technical arguments sufficient to consider that the
request for bankruptcy will be denied by the court. However, given
the current status of the case, we cannot predict its outcome. On
July 12, 2016, Puerto Retiro S.A. has been notified of a ruling
rendered by the Federal Court 5 which decided on the defenses
raised by all co-defendants in the civil case. As regards the
defenses raised by Puerto Retiro S.A., the Court rejected them on
the grounds of legal defect and lack of procedural standing as
defendant, whereas in relation to the lack of standing to sue and
the statute of limitations defense, it deferred its treatment until
it renders a judgment on the merits of the case. Puerto Retiro S.A.
has filed a remedy for reversal with right to an appeal,
challenging both defenses.
(ii)
In
March 2011, Quality purchased an industrial plant located in San
Martín, Province of Buenos Aires. The facilities have the
necessary features and scales for multiple uses.
On January 20, 2015, Quality entered into an
Urbanization Agreement with the Municipality of San Martín
which contemplates a monetary compensation to the City Council
totaling Ps. 40, payable in two installments of Ps. 20 each. The
first of such installments was actually paid on June 30, 2015. On
January 5, 2016 the Official Bulletin of the Province of Buenos
Aires published the Order of Provincial Ratification (of the
Municipal Ordinance), whereby the urban parameters originally
requested entered into full force, thus concluding the legislative
enactment process. Even though validation is a condition precedent
to the Agreement’s effectiveness, the obligation to pay the
second installment will not become in force until the first drawing
is registered with the Dirección de Geodesia (Geodesy Office)
of the province of Buenos Aires. Quality is assessing several
alternatives in order to file the plan with the final
project.
(*)
Amount
in million of NIS.
F- 106
Cresud Sociedad Anónima,
Comercial, Inmobiliaria, Financiera y Agropecuaria
Notes to the Consolidated
Financial Statements
(Continued)
(All amounts in
millions of Argentine Pesos, except otherwise
indicated)
9.
Investments
in associates
Evolution of the
Group’s investment in associates for the years ended June 30,
2016 and 2015 were as follows:
|
|
June 30,
2016
|
|
June 30,
2015
|
|
Beginning
of the year
|
2,031
|
|
1,803
|
|
Acquisition /
increase in equity interest in associates
|
157
|
|
1,257
|
|
Unrealized profit /
(loss) from investments at fair value
|
77
|
|
(1,001)
|
|
Decrease for IDBD
business combination
|
(1,047)
|
|
-
|
|
Associates
incorporated by business combination (Note 3)
|
8,308
|
|
-
|
|
Capital
contribution
|
180
|
|
31
|
|
Share of profit /
(loss)
|
311
|
|
(30)
|
|
Currency
translation adjustment
|
4,173
|
|
53
|
|
Cash dividends
(ii)
|
(518)
|
|
(18)
|
|
Sale of equity
interest in associates
|
(4)
|
|
(34)
|
|
Reclassification to
financial instruments
|
-
|
|
(30)
|
|
Hedging
instruments
|
(93)
|
|
-
|
|
Defined benefit
plans
|
(10)
|
|
-
|
|
Impairment
|
(58)
|
|
-
|
|
End
of the year (i)
|
13,507
|
|
2,031
|
(i)
Includes a balance
of Ps. (841) and Ps. (363) reflecting interests in companies with
negative equity as of June 30, 2016 and 2015, respectively, which
are reclassified to “Provisions” (Note
22).
(ii)
During the fiscal
year ended June 30, 2016 the balance corresponds Ps. 10 to
Millenium, Ps. 495 to Adama, Ps. 10 to Emco and Ps. 3 to
Agro-Uranga. During the fiscal year ended June 30, 2015 the balance
corresponds to dividends received from BHSA.
F- 107
Cresud Sociedad Anónima,
Comercial, Inmobiliaria, Financiera y Agropecuaria
Notes to the Consolidated
Financial Statements
(Continued)
(All amounts in
millions of Argentine Pesos, except otherwise
indicated)
9.
Interests in associates
(Continued)
The table below
shows the value of the Group´s interest in associates for the
years ended June 30, 2016 and 2015, as well as the Group’s
interest in comprehensive income/(loss) of these companies for the
fiscal years ended June 30, 2016, 2015 and 2014:
|
Name of the entity
|
Place of business / country of incorporation
|
Main activity
|
Nature of the relationship
|
Common shares 1 vote
|
Value of Group's interest in equity
|
Group's interest in comprehensive income /
(operations)
|
% of ownership interest held
|
|
|
|
|||||
|
June 30,
|
June 30,
|
June 30,
|
Last financial statement issued
|
||||||||||||
|
2016
|
2015
|
2016
|
2015
|
2014
|
2016
|
2015
|
2014
|
Share capital
(nominal value)
|
Profit / (Loss)
for the year
|
Shareholders' equity
|
|||||
|
BHSA
|
Argentina
|
Financing
|
(1)
|
448,689,072
|
1,609
|
1,356
|
259
|
143
|
184
|
29.91%
|
29.99%
|
29.77%
|
1,500
|
837
|
5,234
|
|
IDBD
|
Israel
|
Investment
|
(2)
|
324,445,664
|
-
|
908
|
137
|
(917)
|
(508)
|
N/A
|
49.00%
|
26.65%
|
-
|
-
|
-
|
|
Adama
|
Israel
|
Agrochemical
|
(3)
|
55,196,352
|
10,847
|
-
|
4,141
|
-
|
-
|
40%
|
N/A
|
N/A
|
(**)
138
|
(**)
319
|
(**)
6,155
|
|
PBEL
|
India
|
Real
Estate
|
(4)
|
450,000
|
864
|
-
|
194
|
-
|
-
|
45.40%
|
N/A
|
N/A
|
(**)
1
|
(**)
(29)
|
(**)
(523)
|
|
Agro-Uranga
S.A.
|
Argentina
|
Agricultural
|
|
893,069
|
54
|
30
|
26
|
1
|
11
|
35.72%
|
35.72%
|
35.72%
|
3
|
74
|
119
|
|
Others
associates
|
|
|
(5)
|
|
133
|
(263)
|
(254)
|
(205)
|
(145)
|
N/A
|
N/A
|
N/A
|
-
|
-
|
-
|
|
|
|
|
|
|
13,507
|
2,031
|
4,503
|
(978)
|
(458)
|
|
|
|
|
|
|
(1)
BHSA
is a full-service commercial bank offering a wide variety of
banking activities and related financial services to individuals,
small- and medium-sized companies and large
corporations.
(2)
The
Group acquired IDBD on May 7, 2014. IDBD is one of the Israeli
biggest and most diversified investment groups. The Group has
valued its interest in IDBD at fair value through profit or loss
according to an exemption under IAS 28. See Note 3 for further
information. Since interest in IDBD was valued at fair value,
participation in financial statements and other comprehensive
statement of income of IDBD is not shown in the table above. Share
market value was 1.957 NIS as of June 30, 2015. (Note
3)
(3)
Adama
is specialized in the chemical industry, mainly, in the
agrochemical industry.
(4)
PBEL
is a real estate company with developments mainly in
India.
(5)
The
group also has interest in a number of individually immaterial
associates that are accounted for using the equity
method.
(*)
Amount in million
of dollars.
(**)
Amount
in million of NIS.
F- 108
Cresud Sociedad Anónima,
Comercial, Inmobiliaria, Financiera y Agropecuaria
Notes to the Consolidated
Financial Statements
(Continued)
(All amounts in
millions of Argentine Pesos, except otherwise
indicated)
9.
Interests in associates
(Continued)
Information
about significant associates
Set out below are
the summarized financial information of the significant Group's
associates as of June 30, 2016 and 2015:
|
|
As of June 30, 2016
|
|
Year ended June 30, 2016
|
||||||||||||||||||||||||||||||||
|
|
Current assets
|
|
Non-current
assets
|
|
Current liabilities
|
|
Non-
current
liabilities
|
|
Net assets
|
|
Dividends distribution
|
|
Net assets at end of the year (i)
|
|
% of ownership interest held
|
|
Interest in associates
|
|
Goodwill and others
|
|
Net book amount
|
|
Revenues
|
|
Net
income /
(loss)
|
|
Total
comprehensive income
|
|
Cash on
operating activities
|
|
Cash of investment activities
|
|
Cash
financial activities
|
|
Changes in cash and cash equivalents
|
|
BHSA
|
20,307
|
|
20,544
|
|
28,255
|
|
7,244
|
|
5,352
|
|
-
|
|
5,234
|
|
(ii)
30.66%
|
|
1,605
|
|
4
|
|
1,609
|
|
6,821
|
|
837
|
|
837
|
|
(9,462)
|
|
(410)
|
|
4,099
|
|
(2,756)
|
|
Adama
|
41,879
|
|
25,470
|
|
23,018
|
|
20,336
|
|
23,995
|
|
495
|
|
23,995
|
|
40.00%
|
|
9,598
|
|
1,249
|
|
10,847
|
|
5,854
|
|
328
|
|
265
|
|
87
|
|
(337)
|
|
(825)
|
|
(1,075)
|
|
PBEL
|
1,510
|
|
257
|
|
354
|
|
3,456
|
|
(2,043)
|
|
-
|
|
(2,043)
|
|
45.40%
|
|
(928)
|
|
1,792
|
|
864
|
|
-
|
|
(*)
(30)
|
|
(*)
(28)
|
|
(*)
45
|
|
(*)
(18)
|
|
(*)
(28)
|
|
(*)
(1)
|
|
|
As of June 30, 2015
|
|
Year ended June 30, 2015
|
||||||||||||||||||||||||||||||||
|
|
Current assets
|
|
Non-current
assets
|
|
Current liabilities
|
|
Non-
current
liabilities
|
|
Net assets
|
|
Dividends distribution
|
|
Net assets at end of the year (i)
|
|
% of ownership interest held
|
|
Interest in associates (iii)
|
|
Goodwill and others
|
|
Net book amount
|
|
Revenues
|
|
Net
income /
(loss)
|
|
Total
comprehensive income
|
|
Cash on
operating activities
|
|
Cash of investment activities
|
|
Cash
financial activities
|
|
Changes in cash and cash equivalents
|
|
BHSA
|
24,850
|
|
10,234
|
|
26,893
|
|
3,725
|
|
4,466
|
|
13
|
|
4,398
|
|
(ii)
30.74%
|
|
1,352
|
|
4
|
|
1,356
|
|
4,500
|
|
461
|
|
461
|
|
(3,334)
|
|
(46)
|
|
1,515
|
|
193
|
|
IDBD
(iii)
|
30,344
|
|
64,935
|
|
24,209
|
|
61,684
|
|
9,386
|
|
-
|
|
9,386
|
|
49%
|
|
N/A
|
|
N/A
|
|
1,529
|
|
43,296
|
|
713
|
|
151
|
|
2,909
|
|
1,389
|
|
(4,505)
|
|
(207)
|
(i)
Net
of non-controlling interest.
(ii)
Considering the
effect of treasury shares.
(iii)
The book value has
been computed based on the fair value of the investment (Note
3).
(*)
Amount in million of NIS.
F- 109
Cresud Sociedad Anónima,
Comercial, Inmobiliaria, Financiera y Agropecuaria
Notes to the Consolidated
Financial Statements
(Continued)
(All amounts in
millions of Argentine Pesos, except otherwise
indicated)
9.
Interests in associates
(Continued)
BHSA
In accordance with
the regulations of the “BCRA”, there are certain
restrictions on the distribution of profits by BHSA.
The fair value of
the Group’s investment in BHSA was estimated based on the
present value of future business cash flows. The principal premises
used to calculate the fair value as of June 30, 2016 were the
following:
-
The Group
considered the period 2017-2024 as horizon for the projection of
BHSA cash flows.
-
The “Private
BADLAR” interest rate was projected based on internal data
and information gathered from external consultants.
-
The projected
exchange rate was estimated in accordance with internal data and
external information provided by independent
consultants.
-
The discount rate
used to discount real dividend flows and calculate the fair value
is 12.41%.
Based on the
described premises, the Group estimated the fair value of its
investment in BHSA as of June 30, 2016 to be Ps.
3,246.
Adama
Adama is
specialized in the chemical industry, mainly, in the agrochemical
industry. In this framework, Adama is engaged in developing,
manufacturing and selling crop protection products, while also
operating in other areas based on its basic capacities (the
agricultural and chemical sectors), but to a immaterial
extent.
In 2011, Koor (a
wholly own subsidiary of DIC) sold 60% of Adama’s shares to
China National Agrochemical Corporation (“ChemChina”)
and was also granted a non-recourse loan in the aggregate amount of
US$ 960
million
, which is
secured by the remaining 40% of ADAMA shares held by Koor as of
June 30, 2016. The loan is disclosed in Note 21 under non-current
loans.
On July 17, 2016
DIC informed the market that it has accepted the tender offer by
ChemChina who intends to acquire 40% of Adama’s shares
currently held by Koor, indirectly controlled by IDBD through DIC.
In August 2016, Koor and a subsidiary of ChemChina executed the
corresponding agreement. The price of the transaction includes a
payment in cash of US$ 230 million plus the total repayment of the
non-recourse loan and its interests, which had been granted to Koor
by a Chinese bank.
The Group expects
that this sale transaction will be finalized during November, 2016,
subject to compliance with certain conditions, including obtaining
approvals by the Chinese regulatory and antitrust
authorities.
F- 110
Cresud Sociedad Anónima,
Comercial, Inmobiliaria, Financiera y Agropecuaria
Notes to the Consolidated
Financial Statements
(Continued)
(All amounts in
millions of Argentine Pesos, except otherwise
indicated)
10.
Investment
properties
Changes in the
Group’s investment properties for the years ended June 30,
2016 and 2015 were as follows:
|
|
Leased-out
farmland
|
|
Rental
properties (iii)
|
|
Undeveloped
parcels
of land
|
|
Properties
under
development
|
|
Total
(iv)
|
|
At
July 1, 2014
|
|
|
|
|
|
|
|
|
|
|
Costs
|
53
|
|
4,244
|
|
422
|
|
364
|
|
5,083
|
|
Accumulated
depreciation
|
(2)
|
|
(1,626)
|
|
-
|
|
-
|
|
(1,628)
|
|
Net book
amount
|
51
|
|
2,618
|
|
422
|
|
364
|
|
3,455
|
|
Year
ended June 30, 2015:
|
|
|
|
|
|
|
|
|
|
|
Opening net book
amount
|
51
|
|
2,618
|
|
422
|
|
364
|
|
3,455
|
|
Additions
|
8
|
|
66
|
|
2
|
|
186
|
|
262
|
|
Reclassifications
to trading properties
|
-
|
|
(3)
|
|
-
|
|
-
|
|
(3)
|
|
Reclassification of
property, plant and equipment
|
41
|
|
20
|
|
-
|
|
-
|
|
61
|
|
Reclassification to
property, plant and equipment
|
(12)
|
|
(8)
|
|
-
|
|
(9)
|
|
(29)
|
|
Transfers
(ii)
|
-
|
|
514
|
|
25
|
|
(539)
|
|
-
|
|
Disposals
|
-
|
|
(103)
|
|
(3)
|
|
(2)
|
|
(108)
|
|
Depreciation
charges (i)
|
(5)
|
|
(152)
|
|
-
|
|
-
|
|
(157)
|
|
Currency
translation adjustment
|
(6)
|
|
-
|
|
-
|
|
-
|
|
(6)
|
|
Closing
net book amount
|
77
|
|
2,952
|
|
446
|
|
-
|
|
3,475
|
|
At
June 30, 2015
|
|
|
|
|
|
|
|
|
|
|
Costs
|
84
|
|
4,599
|
|
446
|
|
-
|
|
5,129
|
|
Accumulated
depreciation
|
(7)
|
|
(1,647)
|
|
-
|
|
-
|
|
(1,654)
|
|
Net book
amount
|
77
|
|
2,952
|
|
446
|
|
-
|
|
3,475
|
|
Year
ended June 30, 2016:
|
|
|
|
|
|
|
|
|
|
|
Opening net book
amount
|
77
|
|
2,952
|
|
446
|
|
-
|
|
3,475
|
|
Assets incorporated
by business combination (Note 3)
|
-
|
|
25,256
|
|
1,439
|
|
2,891
|
|
29,586
|
|
Currency
translation adjustment
|
8
|
|
14,437
|
|
805
|
|
1,512
|
|
16,762
|
|
Additions
|
-
|
|
260
|
|
11
|
|
919
|
|
1,190
|
|
Reclassification to
trading properties
|
-
|
|
(4)
|
|
(67)
|
|
-
|
|
(71)
|
|
Transfers
|
-
|
|
1,330
|
|
(67)
|
|
(1,263)
|
|
-
|
|
Reclassification to
property, plant and equipment
|
(74)
|
|
63
|
|
-
|
|
(1)
|
|
(12)
|
|
Reclassification of
property, plant and equipment
|
(1)
|
|
-
|
|
-
|
|
-
|
|
(1)
|
|
Impairment (Note
33)
|
-
|
|
(182)
|
|
(77)
|
|
(80)
|
|
(339)
|
|
Disposals
|
(1)
|
|
(272)
|
|
(7)
|
|
-
|
|
(280)
|
|
Depreciation
charges (i)
|
-
|
|
(538)
|
|
(6)
|
|
-
|
|
(544)
|
|
Closing
net book amount
|
9
|
|
43,302
|
|
2,477
|
|
3,978
|
|
49,766
|
|
At
June 30, 2016
|
|
|
|
|
|
|
|
|
|
|
Costs
|
14
|
|
45,517
|
|
2,485
|
|
3,978
|
|
51,994
|
|
Accumulated
depreciation
|
(5)
|
|
(2,215)
|
|
(8)
|
|
-
|
|
(2,228)
|
|
Net book
amount
|
9
|
|
43,302
|
|
2,477
|
|
3,978
|
|
49,766
|
(i)
Depreciation
charges of investment property has been charged in
“Costs” in the income statement (Note 30).
(ii)
Includes transfers
due to the inauguration of Alto Comahue and Distrito Arcos Shopping
Centers.
(iii)
Distrito Arcos -
Injuction: In December 2013, the Judicial Branch confirmed an
injunction order that suspended the opening of the shopping center
on the grounds that it did not have certain governmental permits in
the context of two legal proceedings, where a final decision has
been rendered for the company. The plaintiff filed a petition for
the continuation of the preliminary injunction by means of an
extraordinary appeal of unconstitutionality which was by the lower
and appellate courts; consequently, it filed an appeal with the
Supreme Court of Justice of the Autonomous City of Buenos Aires,
which so far has not rendered a decision. Nowadays, the Shopping
Center Distrito Arcos is open to the public and operating
normally.
Distrito
Arcos - Concession status: The National State issued Executive
Order 1723/2012 whereby several plots of land located in prior rail
yards of Palermo, Liniers and Caballito rail stations ceased to be
used for rail purposes, in order to be used for development of
integral urbanization projects. In this respect and as part of
several measures related to other licensed persons and/or
concessionaires, we have notified in the file of proceedings the
corresponding Resolution 170/2014 revoking the Contract for
Reformulation of the Concession of Rights of use and Development
No. AF000261 issued by the Agencia de Administración de Bienes
del Estado (State Assets Administration Office, or AABE as per its
Spanish acronym). It should further be pointed out that such
measure: (i) has not been adopted due to non-compliance of our
subsidiary; (ii) to date has not involved the interruption of the
commercial development or operation of the shopping center, which
continues to operate under normal conditions. Notwithstanding the
foregoing, Arcos del Gourmet S.A. has filed the relevant
administrative remedies (appeal) and has also filed a judicial
action requesting that the revocation of such concession be
overruled. Furthermore, it has started a so-called “juicio de
consignación”, that is an action where the plaintiff
deposits with the court sums of money that the defendant refuses to
accept. Under this legal action, the company has deposited in due
time and form all rental payments under the Contract for
Reformulation of the Concession of Rights of Use and Development,
which the Company considers to have been unduly
revoked.
(iv)
Certain of the
Group’s investment property assets have been mortgaged or
otherwise restricted to secure some of the Group’s borrowings
and other payables. Book amount of those properties amounts to Ps.
15,544, Ps. 61 and Ps. 154 as June 30, 2016, 2015 and 2014,
respectively.
F- 111
Cresud Sociedad Anónima,
Comercial, Inmobiliaria, Financiera y Agropecuaria
Notes to the Consolidated
Financial Statements
(Continued)
(All amounts in
millions of Argentine Pesos, except otherwise
indicated)
10.
Investment properties
(Continued)
The following
amounts have been recognized in the statement of
income:
|
|
June 30,
2016
|
|
June 30,
2015
|
|
June 30,
2014
|
|
Rental and services
income
|
5,264
|
|
2,995
|
|
2,449
|
|
Cost of rental and
services
|
(2,396)
|
|
(1,234)
|
|
(1,142)
|
|
Development
expenses
|
(11)
|
|
(4)
|
|
(2)
|
|
Gain from disposal
of investment properties
|
1,101
|
|
1,150
|
|
231
|
As of June 30, 2016
and 2015, fair value of investment properties corresponding to the
urban properties and investment business of the operations center
in Argentina, amounts to Ps. 28,304 and Ps. 22,446, respectively.
The fair values are based on comparable values of certain qualified
external appraisers (Level 2 of fair value hierarchy) except in the
case of shopping centers, where fair value is based on the market
capitalization valuation (Level 3 of the fair value hierarchy). In
the first case, sale prices of comparable properties are adjusted
considering the specific aspects of each property, being the square
meter the most relevant premise. In the second case, was
computed considering the specific aspects of each property using a
weighted average capitalization rate of 10.9% and 12%, respectively
(a 9.8% to 13.3% range was considered for fiscal year 2016 and 10%
to 15% for fiscal year 2015).
As of June 30,
2016, the fair value of investment properties of the operations
center in Israel, amounts to Ps. 48,032. The fair values are based
on valuations performed by independent appraisers, who used the
methodologies of discounted cash flows and market capitalization
rates, as appropriate (Level 3 and 2 of the fair value hierarchy).
Independent appraisers estimated cash flows of the properties to
which they applied discount rates and / or capitalization rates
according to market data. They were determined considering the
specific characteristics of each asset (location, sales,
occupation, surface condition and type of property, etc.). Discount
rates used ranged fron 7% to 10% and capitalization rate used
ranged from 6% to 11%. The average occupancy of the properties was
96%.
F- 112
Cresud Sociedad Anónima,
Comercial, Inmobiliaria, Financiera y Agropecuaria
Notes to the Consolidated
Financial Statements
(Continued)
(All amounts in
millions of Argentine Pesos, except otherwise
indicated)
11. Property,
plant and equipment
Changes in the
Group’s property, plant and equipment for the years ended
June 30, 2016 and 2015 are as follows:
|
|
Owner
occupied farmland
(iii)
|
|
Buildings
and facilities
|
|
Machinery
and
equipment
|
|
Communication
networks
|
|
Others
(i)
|
|
Total
|
|
At
July 1, 2014
|
|
|
|
|
|
|
|
|
|
|
|
|
Cost
|
2,261
|
|
545
|
|
37
|
|
-
|
|
192
|
|
3,035
|
|
Accumulated
depreciation
|
(204)
|
|
(302)
|
|
(20)
|
|
-
|
|
(127)
|
|
(653)
|
|
Net book
amount
|
2,057
|
|
243
|
|
17
|
|
-
|
|
65
|
|
2,382
|
|
Year
ended June 30, 2015:
|
|
|
|
|
|
|
|
|
|
|
|
|
Opening net book
amount
|
2,057
|
|
243
|
|
17
|
|
-
|
|
65
|
|
2,382
|
|
Currency
translation adjustment
|
(223)
|
|
(6)
|
|
-
|
|
-
|
|
(7)
|
|
(236)
|
|
Additions
|
144
|
|
40
|
|
23
|
|
-
|
|
17
|
|
224
|
|
Reclassifications
of investment properties
|
12
|
|
8
|
|
5
|
|
-
|
|
4
|
|
29
|
|
Reclassifications
to investment properties
|
(41)
|
|
(20)
|
|
-
|
|
-
|
|
|
|
(61)
|
|
Disposals
|
(255)
|
|
(7)
|
|
|
|
-
|
|
(4)
|
|
(266)
|
|
Depreciation charge
(ii)
|
(54)
|
|
(19)
|
|
(9)
|
|
-
|
|
(13)
|
|
(95)
|
|
Closing
net book amount
|
1,640
|
|
239
|
|
36
|
|
-
|
|
62
|
|
1,977
|
|
At
June 30, 2015
|
|
|
|
|
|
|
|
|
|
|
|
|
Cost
|
1,833
|
|
560
|
|
125
|
|
-
|
|
140
|
|
2,658
|
|
Accumulated
depreciation
|
(193)
|
|
(321)
|
|
(89)
|
|
-
|
|
(78)
|
|
(681)
|
|
Net book
amount
|
1,640
|
|
239
|
|
36
|
|
-
|
|
62
|
|
1,977
|
|
Year
ended June 30, 2016:
|
|
|
|
|
|
|
|
|
|
|
|
|
Opening net book
amount
|
1,640
|
|
239
|
|
36
|
|
-
|
|
62
|
|
1,977
|
|
Incorporated by
business combination (Note 3)
|
-
|
|
8,224
|
|
1,719
|
|
3,536
|
|
1,625
|
|
15,104
|
|
Currency
translation adjustment
|
401
|
|
4,840
|
|
1,018
|
|
2,034
|
|
901
|
|
9,194
|
|
Additions
|
64
|
|
392
|
|
291
|
|
310
|
|
203
|
|
1,260
|
|
Reclassifications
of investment properties
|
84
|
|
(72)
|
|
-
|
|
-
|
|
-
|
|
12
|
|
Reclassifications
to investment properties
|
1
|
|
-
|
|
-
|
|
-
|
|
-
|
|
1
|
|
Disposals
|
-
|
|
-
|
|
-
|
|
-
|
|
(1)
|
|
(1)
|
|
Impairments (Note
33)
|
-
|
|
(10)
|
|
-
|
|
(3)
|
|
-
|
|
(13)
|
|
Depreciation charge
(ii)
|
(52)
|
|
(278)
|
|
(251)
|
|
(467)
|
|
(186)
|
|
(1,234)
|
|
Closing
net book amount
|
2,138
|
|
13,335
|
|
2,813
|
|
5,410
|
|
2,604
|
|
26,300
|
|
At
June 30, 2016
|
|
|
|
|
|
|
|
|
|
|
|
|
Cost
|
1,957
|
|
13,970
|
|
3,203
|
|
5,974
|
|
2,852
|
|
27,956
|
|
Accumulated
depreciation
|
181
|
|
(635)
|
|
(390)
|
|
(564)
|
|
(248)
|
|
(1,656)
|
|
Net book
amount
|
2,138
|
|
13,335
|
|
2,813
|
|
5,410
|
|
2,604
|
|
26,300
|
(i)
Includes furniture
and fixtures, vehicles and aircrafts.
(ii)
For the fiscal
years ended June 30, 2016 and 2015, depreciation charges of
property, plant and equipment were included in “Costs”
for an amount of Ps. 693 and Ps. 88, "General and administrative
expenses" for an amount of Ps. 131 and Ps. 6 and “Selling
expenses” for an amount of Ps. 413 and Ps. 1, respectively in
the statement of income.
(iii) The
active establishments include (Cremaq, Jatobá, Preferencia,
Chaparral, Araucaria and Planta frigorífica) have been
mortgaged to secure certain Group's borrowings for a total amount
of Ps. 844 and Ps. 855 as of June 30, 2016 and 2015,
respectively
F- 113
Cresud Sociedad Anónima,
Comercial, Inmobiliaria, Financiera y Agropecuaria
Notes to the Consolidated
Financial Statements
(Continued)
(All amounts in
millions of Argentine Pesos, except otherwise
indicated)
12.
Trading
properties
Changes in the
Group’s trading properties for the years ended June 30, 2016
and 2015 are as follows:
|
|
Completed
properties
|
|
Properties
under development (i)
|
|
Undeveloped
sites (ii)
|
|
Total
|
|
At
July 1, 2014
|
7
|
|
119
|
|
11
|
|
137
|
|
Additions
|
-
|
|
1
|
|
-
|
|
1
|
|
Currency
translation adjustment
|
-
|
|
(6)
|
|
-
|
|
(6)
|
|
Reclassifications
of investment properties
|
-
|
|
-
|
|
3
|
|
3
|
|
Disposals
|
(2)
|
|
-
|
|
-
|
|
(2)
|
|
At
June 30, 2015
|
5
|
|
114
|
|
14
|
|
133
|
|
Additions
|
51
|
|
291
|
|
13
|
|
355
|
|
Currency
translation adjustment
|
73
|
|
1,120
|
|
457
|
|
1,650
|
|
Reclassifications
of investment properties
|
-
|
|
67
|
|
4
|
|
71
|
|
Disposals
|
(1)
|
|
(151)
|
|
-
|
|
(152)
|
|
Transfers
|
-
|
|
142
|
|
(142)
|
|
-
|
|
Assets incorporated
by business combination (see Note 3)
|
108
|
|
1,724
|
|
824
|
|
2,656
|
|
At
June 30, 2016
|
236
|
|
3,307
|
|
1,170
|
|
4,713
|
(i)
Include
Liveck´s plots of land have been mortgaged to secure Group's
borrowings. The net book value of these assets amounts to Ps. 156
and Ps. 106 as of June 30, 2016 and 2015, respectively.
Additionally, the Group has contractual obligations not provisioned
related to these plots of land committed when certain properties
were acquired or real estate projects were approved, and amounts to
Ps. 120 and Ps. 71, respectively. The projected developments are
expected to be completed in 2029.
(ii)
The Group is owner
of an air space of approximately 23,000 square meters area on top
of Hipermercado Coto, near the Abasto Shopping Center. The Group
acquired rights to receive functional units, parking spaces, and
the rights to increase the height of such property. On June 2016, a
conditional Exchange Agreement was executed for a one year term, to
be later formalized through the execution of a conveyance deed. The
project will be a residential development for a consideration of
apartments covering an area of 3,621 square meters plus US$ 1
million. The consideration will be delivered no later than June
2021 for Tower I, and no later than September 2022 for Tower II.
The value in the bill of sale was set at US$ 7.5
million.
The Group also owns
a plot of land next to Córdoba Shopping. In May 2016, an
Exchange Agreement was executed for a building capacity of 13,500
square meters, subject to conditions for a term of one year, after
which it may be formalized through a title conveyance deed. The
project will be a mixed development, combining residential and
office space, and the consideration will include apartments
covering 2,160 square meters, parking space, and procedures to
obtain permits, combinations and subdivisions of 3 plots of land.
Delivery of the consideration will take place no later than May
2021 for Tower I and no later than July 2023 for Tower II. The
Exchange Value was set at US$ 4 million.
Both
above-mentioned contracts that are part of the Coto residential
project and the Córdoba Shopping exchange project include
conditions precedent and/or suspensive clauses
|
|
June 30,
2016
|
|
June 30,
2015
|
|
Non-current
|
4,472
|
|
130
|
|
Current
|
241
|
|
3
|
|
Total
|
4,713
|
|
133
|
F- 114
Cresud Sociedad Anónima,
Comercial, Inmobiliaria, Financiera y Agropecuaria
Notes to the Consolidated
Financial Statements
(Continued)
(All amounts in
millions of Argentine Pesos, except otherwise
indicated)
13. Intangible
assets
Changes in the
Group’s intangible assets for the years ended June 30, 2016
and 2015 are as follows:
|
|
Goodwill
|
|
Trademarks
|
|
Licenses
|
|
Customer
relations
|
|
Information
systems
and
software
|
|
Contracts
and
others
(ii)
(iii)
|
|
Total
|
|
At
July 1, 2014
|
|
|
|
|
|
|
|
|
|
|
|
|
|
|
Cost
|
30
|
|
-
|
|
-
|
|
-
|
|
36
|
|
137
|
|
203
|
|
Accumulated
amortization
|
-
|
|
-
|
|
-
|
|
-
|
|
(27)
|
|
(2)
|
|
(29)
|
|
Net book
amount
|
30
|
|
-
|
|
-
|
|
-
|
|
9
|
|
135
|
|
174
|
|
Year
ended June 30, 2015
|
|
|
|
|
|
|
|
|
|
|
|
|
|
|
Opening net book
amount
|
30
|
|
-
|
|
-
|
|
-
|
|
9
|
|
135
|
|
174
|
|
Currency
translation adjustment
|
(2)
|
|
-
|
|
-
|
|
-
|
|
(1)
|
|
-
|
|
(3)
|
|
Additions
|
-
|
|
-
|
|
-
|
|
-
|
|
7
|
|
5
|
|
12
|
|
Amortization charge
(i)
|
-
|
|
-
|
|
-
|
|
-
|
|
(5)
|
|
(2)
|
|
(7)
|
|
Closing
net book amount
|
28
|
|
-
|
|
-
|
|
-
|
|
10
|
|
138
|
|
176
|
|
At
June 30, 2015
|
|
|
|
|
|
|
|
|
|
|
|
|
|
|
Cost
|
28
|
|
-
|
|
-
|
|
-
|
|
41
|
|
142
|
|
211
|
|
Accumulated
amortization
|
-
|
|
-
|
|
-
|
|
-
|
|
(31)
|
|
(4)
|
|
(35)
|
|
Net book
amount
|
28
|
|
-
|
|
-
|
|
-
|
|
10
|
|
138
|
|
176
|
|
Year
ended June 30, 2016
|
|
|
|
|
|
|
|
|
|
|
|
|
|
|
Opening net book
amount
|
28
|
|
-
|
|
-
|
|
-
|
|
10
|
|
138
|
|
176
|
|
Assets incorporated
by business combination (Note 3)
|
1,391
|
|
2,131
|
|
515
|
|
2,474
|
|
635
|
|
848
|
|
7,994
|
|
Currency
translation adjustment
|
819
|
|
1,243
|
|
292
|
|
1,327
|
|
363
|
|
455
|
|
4,499
|
|
Additions
|
-
|
|
-
|
|
-
|
|
-
|
|
137
|
|
-
|
|
137
|
|
Disposals
|
-
|
|
-
|
|
-
|
|
-
|
|
(1)
|
|
-
|
|
(1)
|
|
Amortization charge
(i)
|
-
|
|
(19)
|
|
(48)
|
|
(582)
|
|
(187)
|
|
(155)
|
|
(991)
|
|
Closing
net book amount
|
2,238
|
|
3,355
|
|
759
|
|
3,219
|
|
957
|
|
1,286
|
|
11,814
|
|
At
June 30, 2016
|
|
|
|
|
|
|
|
|
|
|
|
|
|
|
Cost
|
2,238
|
|
3,378
|
|
817
|
|
3,923
|
|
1,202
|
|
1,478
|
|
13,036
|
|
Accumulated
amortization
|
-
|
|
(23)
|
|
(58)
|
|
(704)
|
|
(245)
|
|
(192)
|
|
(1,222)
|
|
Net book
amount
|
2,238
|
|
3,355
|
|
759
|
|
3,219
|
|
957
|
|
1,286
|
|
11,814
|
(i)
Amortization
charges of intangible assets are included in “General and
administrative expenses” in the statement of income. (Note
30). There are no impairment charges for any of the years
presented.
(ii)
Includes "Rights of
use". Correspond to Distrito Arcos Depreciation began in January,
2015, upon delivery of the shopping center.
(iii)
Includes "Right to
receive future units under barter agreements". Correspond to in
kind receivables representing the right to receive residential
apartments in the future under barter agreements. The ongoing
transactions are: A) Caballito: on June 29, 2011, the Group and
TGLT entered into a barter agreement for US$ 12.8 million. A
neighborhood association secured a preliminary injunction that
suspended the works to be carried out by TGLT in the property. Once
said preliminary injunction was deemed final, the Government of the
City of Buenos Aires and TGLT were served notice of the complaint.
The Group is not involved in these proceedings and has not been
sued or summoned as a third party by any of the parties involved in
the legal action. B) Beruti: on October 13, 2010, the Group and
TGLT entered into an agreement for US$ 18.8 million. An association
named Asociación Amigos Alto Palermo presented an injunction
requesting the prohibition of the construction and obtained a
suspense interim measure for this purpose. Later, the Court of
Appeals from the Autonomous City of Buenos Aires ordered the
lifting of such interim measure suspending the continuation of the
work. On June 11, 2015 final judgment was rendered in favor of IRSA
CP and TGLT.
F- 115
Cresud Sociedad Anónima,
Comercial, Inmobiliaria, Financiera y Agropecuaria
Notes to the Consolidated
Financial Statements
(Continued)
(All amounts in
millions of Argentine Pesos, except otherwise
indicated)
14.
Biological
assets
Changes in the
Group’s biological assets for the years ended June 30, 2016
and 2015 are as follows:
|
Agricultural
business
|
|||||||
|
|
Crops
fields
|
Sugarcane
fields
|
Cattle
|
Dairy
|
Other
cattle
|
Others
|
Total
|
|
At
June 30, 2014
|
147
|
143
|
303
|
37
|
6
|
5
|
641
|
|
Purchases
|
-
|
-
|
14
|
-
|
1
|
-
|
15
|
|
Initial recognition
and changes in fair value of biological assets (i)
|
897
|
162
|
162
|
13
|
-
|
1
|
1,235
|
|
Decrease due to
harvest
|
(960)
|
(198)
|
-
|
-
|
-
|
-
|
(1,158)
|
|
Sales
|
-
|
-
|
(118)
|
(10)
|
-
|
-
|
(128)
|
|
Addition from lease
agreement
|
-
|
22
|
-
|
-
|
-
|
-
|
22
|
|
Consume
|
-
|
-
|
(1)
|
-
|
-
|
(1)
|
(2)
|
|
Currency
translation adjustment
|
(30)
|
(16)
|
-
|
-
|
-
|
-
|
(46)
|
|
At
June 30, 2015
|
54
|
113
|
360
|
40
|
7
|
5
|
579
|
|
Purchases
|
-
|
-
|
31
|
-
|
4
|
-
|
35
|
|
Initial recognition
and changes in fair value of biological assets (i)
|
1,016
|
341
|
244
|
20
|
3
|
3
|
1,627
|
|
Decrease due to
harvest
|
(749)
|
(296)
|
-
|
-
|
-
|
-
|
(1,045)
|
|
Sales
|
-
|
-
|
(125)
|
(11)
|
(3)
|
-
|
(139)
|
|
Consume
|
-
|
-
|
(1)
|
-
|
-
|
(1)
|
(2)
|
|
Currency
translation adjustment
|
57
|
22
|
(2)
|
-
|
-
|
-
|
77
|
|
At
June 30, 2016
|
378
|
180
|
507
|
49
|
11
|
7
|
1,132
|
(i)
Biological assets
with a production cycle of more than one year (that is, sugarcane
and cattle) generated “Initial recognition and changes in
fair value of biological assets” amounting to Ps. 608 and Ps.
337 for the years ended June 30, 2016 and 2015, respectively. For
the years ended June 30, 2016 and 2015, amounts of Ps. 145 and Ps.
16, was attributable to price changes, and amounts of Ps. 124 and
Ps. 144, was attributable to physical changes,
respectively.
Crops and oilseeds
The Group’s
crops generally include crops and oilseeds (corn, wheat, soybean
and sunflower) as well as peanut. The Group measures biological
assets that have attained significant biological growth at fair
value less costs to sell. The Group measures biological assets that
have not attained significant biological growth or when the impact
of biological transformation on price is not expected to be
material, at cost less any impairment losses, which approximates
fair value.
F- 116
Cresud Sociedad Anónima,
Comercial, Inmobiliaria, Financiera y Agropecuaria
Notes to the Consolidated
Financial Statements
(Continued)
(All amounts in
millions of Argentine Pesos, except otherwise
indicated)
14.
Biological assets
(Continued)
The following table
shows the stages and average periods where the Group´s crops
have a significant biological growth, based on agronomical studies
and other inputs:
Argentina
|
Crops
|
Total
days (planting/harvest)
|
Average
days
(planting/harvest)
|
Significant
biological growth
|
Total
days (planting/significant growth)
|
Average
days (planting/significant growth)
|
|
Wheat
|
From 150 to
180
|
165
|
7 (milk grain
stage)
|
From 110 to
140
|
125
|
|
Corn
|
From 150 to
180
|
165
|
R3 (milk grain
stage)
|
From 80 to
110
|
95
|
|
Soybeans
|
From 120 to
160
|
140
|
R5 (beginning of
seed filling)
|
From 75 to
90
|
82.5
|
|
Sunflowers
|
From 120 to
150
|
135
|
R6 (end of
flowering stage)
|
From 80 to
100
|
90
|
|
Peanut
|
From 180 to
270
|
240
|
R5 (beginning of
seed filling)
|
From 90 to
100
|
95
|
|
Cotton
|
From 130 to
180
|
155
|
3 (end of flowering
stage)
|
From 90 to
120
|
105
|
Bolivia
|
Crops
|
Total
days (planting/harvest)
|
Average
days
(planting/harvest)
|
Significant
biological growth
|
Total
days (planting/significant growth)
|
Average
days (planting/significant growth)
|
|
Wheat
|
From 100 to
112
|
106
|
7 (milk grain
stage)
|
From 80 to
90
|
85
|
|
Corn
|
From 130 to
140
|
130
|
R3 (milk grain
stage)
|
From 88 to
96
|
92
|
|
Sorghum
|
From 110 to
130
|
120
|
7 (milk grain
stage)
|
From 80 to
90
|
85
|
|
Soybeans
|
From 110 to
120
|
117
|
R5 (Start of seed
filling at node)
|
From 75 to
85
|
80
|
|
Sunflowers
|
From 105 to
115
|
110
|
R6 (end of
flowering stage)
|
From 75 to
85
|
80
|
Brazil
|
Crops
|
Total
days (planting/harvest)
|
Average
days
(planting/harvest)
|
Significant
biological growth
|
Total
days (planting/significant growth)
|
Average
days (planting/significant growth)
|
|
Corn
|
From 125 to
150
|
137.5
|
R3 (milk grain
stage)
|
From 88 to
96
|
92
|
|
Soybeans
|
From 100 to
140
|
120
|
R5 (Start of seed
filling at node)
|
From 75 to
90
|
82.5
|
Sugarcane
The Group’s
sugarcane production is based in Brazil and to a lesser extent in
Bolivia. This crop’s production requires specific weather
conditions (tropical and subtropical climates) because it is a
perennial and long-term crop with an average life cycle of five
years. Each sugarcane planting generally yields five harvests. Once
the production life cycle is over, crop renewal is brought about.
The Group recognizes these crops at a fair value net of costs of
sales from the moment of planting.
F- 117
Cresud Sociedad Anónima,
Comercial, Inmobiliaria, Financiera y Agropecuaria
Notes to the Consolidated
Financial Statements
(Continued)
(All amounts in
millions of Argentine Pesos, except otherwise
indicated)
14.
Biological assets
(Continued)
Fair
value of biological assets
When an active
market exists for biological assets, the Group uses the quoted
market price in the principal market as a basis to determine the
fair value of its biological. Live cattle is measured at fair value
less selling costs, based on market quoted at an auction involving
cattle of the same age, breed and genetic merit adjusted, if
applicable, to reflect any difference. When there is no active
market or market-determined prices are not available, (for example,
unharvested crops with significant growth), the Group determines
the fair value of a biological asset in its present location and
condition based on the present value of expected net cash flows
from the biological asset discount
(“DCF”).
The DCF model
requires the input of highly subjective assumptions including
observable and unobservable data. The not observable information is
determined based on the best information available for example, by
reference to historical information of past practices and results,
statistics and agricultural information and other analytical
techniques. Key assumptions utilized in the DCF method include
future market prices, estimated yields at the point of harvest and
estimated future costs of harvesting and other costs.
Market prices are
generally determined by reference to observable data in the
principal market for the agricultural produce. Harvesting costs and
other costs are estimated based on historical and statistical data.
Yields are estimated based on several factors including the
location of the farmland and soil type, environmental conditions,
infrastructure and other restrictions and growth at the time of
measurement. Yields are subject to a high degree of uncertainty and
may be affected by several factors out of the Group’s control
including but not limited to extreme or unusual weather conditions,
plagues and other crop diseases.
The key assumptions
discussed above are highly sensitive. Reasonable shifts in
assumptions including but not limited to increases or decreases in
prices, costs and discount factors used may result in a significant
increase or decrease to the fair value of biological assets
recognized at any given time. Cash flows are projected based on
estimated production. Estimates of production in themselves are
dependent on various assumptions, in addition to those described
above, including but not limited to several factors such as
location, environmental conditions and other restrictions. Changes
in these estimates could materially impact on estimated production,
and could therefore affect estimates of future cash flows used in
the assessment of fair value. The valuation models and their
assumptions are reviewed periodically, and, if necessary,
adjusted.
As of June 30 of
each year, the Group’s biological assets that are subject to
a valuation model include unharvested crops and sugarcane
plantations.
F- 118
Cresud Sociedad Anónima,
Comercial, Inmobiliaria, Financiera y Agropecuaria
Notes to the Consolidated
Financial Statements
(Continued)
(All amounts in
millions of Argentine Pesos, except otherwise
indicated)
14.
Biological assets
(Continued)
The following
tables present the Group’s biological assets as of June 30,
2016 and 2015 and their allocation to the fair value
hierarchy:
|
|
|
June
30, 2016
|
||||||
|
|
Classification
|
Level
1
|
|
Level
2
|
|
Level
3
|
|
Total
|
|
Dairy
|
Production
|
-
|
|
49
|
|
-
|
|
49
|
|
Cattle
|
Production
|
-
|
|
432
|
|
-
|
|
432
|
|
Sugarcane
fields
|
Production
|
-
|
|
-
|
|
180
|
|
180
|
|
Other
cattle
|
Production
|
-
|
|
9
|
|
-
|
|
9
|
|
Others biological
assets
|
Production
|
7
|
|
-
|
|
-
|
|
7
|
|
Total
non-current biological assets
|
|
7
|
|
490
|
|
180
|
|
677
|
|
Cattle and cattle
for sale
|
Consumable
|
-
|
|
75
|
|
-
|
|
75
|
|
Other
cattle
|
Consumable
|
-
|
|
2
|
|
-
|
|
2
|
|
Crops
fields
|
Consumable
|
23
|
|
-
|
|
355
|
|
378
|
|
Total
current biological assets
|
|
23
|
|
77
|
|
355
|
|
455
|
|
Total
biological assets
|
|
30
|
|
567
|
|
535
|
|
1,132
|
|
|
|
June
30, 2015
|
||||||
|
|
Classification
|
Level
1
|
|
Level
2
|
|
Level
3
|
|
Total
|
|
Dairy
|
Production
|
-
|
|
40
|
|
-
|
|
40
|
|
Cattle
|
Production
|
-
|
|
295
|
|
-
|
|
295
|
|
Sugarcane
fields
|
Production
|
-
|
|
-
|
|
113
|
|
113
|
|
Other
cattle
|
Production
|
-
|
|
6
|
|
-
|
|
6
|
|
Others biological
assets
|
Production
|
5
|
|
-
|
|
-
|
|
5
|
|
Total
non-current biological assets
|
|
5
|
|
341
|
|
113
|
|
459
|
|
Cattle and cattle
for sale
|
Consumable
|
-
|
|
65
|
|
-
|
|
65
|
|
Other
cattle
|
Consumable
|
-
|
|
1
|
|
-
|
|
1
|
|
Crops
fields
|
Consumable
|
14
|
|
-
|
|
40
|
|
54
|
|
Total
current biological assets
|
|
14
|
|
66
|
|
40
|
|
120
|
|
Total
biological assets
|
|
19
|
|
407
|
|
153
|
|
579
|
During years ended
June 30, 2016 and 2015, there have been no transfers between the
several tiers used in estimating the fair value of the
Group’s biological assets, or reclassifications among their
respective categories.
The fair value less
estimated point of sale costs of agricultural produce at the point
of harvest amount to Ps. 1,097 and Ps. 1,218 for the years ended
June 30, 2016 and 2015, respectively.
F- 119
Cresud Sociedad Anónima,
Comercial, Inmobiliaria, Financiera y Agropecuaria
Notes to the Consolidated
Financial Statements
(Continued)
(All amounts in
millions of Argentine Pesos, except otherwise
indicated)
14.
Biological assets
(Continued)
The following table
presents the changes in Level 3 instruments for the years ended
June 30, 2016 and 2015:
|
|
Crops
fields with significant biological growth
|
|
Sugarcane
fields
|
|
At
June 30, 2014
|
137
|
|
143
|
|
Initial recognition
and changes in the fair value of biological
assets
|
462
|
|
162
|
|
Harvest
|
(558)
|
|
(198)
|
|
Lease
contract
|
-
|
|
22
|
|
Currency
translation adjustment
|
(1)
|
|
(16)
|
|
At
June 30, 2015
|
40
|
|
113
|
|
Initial recognition
and changes in the fair value of biological
assets
|
836
|
|
341
|
|
Harvest
|
(522)
|
|
(296)
|
|
Currency
translation adjustment
|
1
|
|
22
|
|
At
June 30, 2016
|
355
|
|
180
|
F- 120
Cresud Sociedad Anónima,
Comercial, Inmobiliaria, Financiera y Agropecuaria
Notes to the Consolidated
Financial Statements
(Continued)
(All amounts in
millions of Argentine Pesos, except otherwise
indicated)
14.
Biological assets
(Continued)
When no quoted
prices in an active market are available, the Group uses a range of
valuation models. The following table presents main
parameters:
|
|
|
Pricing model
|
|
|
|
|
|
Sensitivity (i)
|
|||||
|
|
|
|
|
|
|
|
2016
|
2015
|
2014
|
||||
|
Description
|
|
|
Parameters
|
|
Range
|
|
Increase
|
Decrease
|
Increase
|
Decrease
|
Increase
|
Decrease
|
|
|
Cattle (Level
2)
|
|
Comparable
market prices
|
|
Price
per livestock head/kg and per category
|
|
|
|
|
|
|
|
|
|
|
Crops fields (Level
3)
|
|
Discounted
cash flows
|
|
Yields
– Operating costs –Selling expenses - Future of sale
prices
|
|
Argentina
|
|
|
|
|
|
|
|
|
Yields:
0.0 - 11.5 tn./ha.
|
|
42
|
(42)
|
8
|
(8)
|
19
|
(19)
|
||||||
|
Future
of sale prices: 2,587 - 12,861 Ps./tn.
|
|
59
|
(59)
|
17
|
(17)
|
26
|
(26)
|
||||||
|
Operating
cost: 833 - 7,659 Ps./ha.
|
|
(24)
|
24
|
(11)
|
11
|
(14)
|
14
|
||||||
|
|
|
|
|
|
|
|
|
|
|
|
|
|
|
|
Sugarcane
fields
(Level
3)
|
|
Discounted
cash flows
|
|
Yields
– Operating costs –Selling expenses - Future of sale
prices
Discount
rate
|
|
Brazil:
|
|
|
|
|
|
|
|
|
Yields:
86.06 tn./ha.
|
|
32
|
(32)
|
21
|
(21)
|
23
|
(23)
|
||||||
|
|
|
|
Future
of sale prices: 79.51 Rs./tn.
|
|
92
|
(92)
|
12
|
(12)
|
7
|
(7)
|
|||
|
|
|
|
Operating
cost: 59.23 Rs./tn.
|
|
(43)
|
43
|
(31)
|
31
|
(25)
|
25
|
|||
|
|
|
|
|
|
|
|
|
|
|
|
|||
|
|
|
|
Bolivia:
|
|
|
|
|
|
|
|
|||
|
|
|
|
Yields:
51 - 116 tn./ha.
|
|
7
|
(7)
|
5
|
(5)
|
4
|
(4)
|
|||
|
|
|
|
Future
of sale prices: 23.50 - 23.40 US$/tn.
|
|
13
|
(13)
|
8
|
(8)
|
6
|
(6)
|
|||
|
|
|
|
Operating
cost: 275 - 500 US$/ha.
|
|
(9)
|
9
|
(5)
|
5
|
(3)
|
3
|
|||
|
|
|
|
|
|
|
Others:
|
|
|
|
|
|
|
|
(i)
Sensitivities have
been modeled considering a 10% change in the indicated variable,
all else being equal.
As of June 30, 2016
and 2015, the better and maximum use of biological assets shall not
significantly differ from the current use.
F- 121
Cresud Sociedad Anónima,
Comercial, Inmobiliaria, Financiera y Agropecuaria
Notes to the Consolidated
Financial Statements
(Continued)
(All amounts in
millions of Argentine Pesos, except otherwise
indicated)
15.
Inventories
Breakdown of
Group’s inventories as of June 30, 2016 and 2015 are as
follows:
|
|
June 30,
2016
|
|
June 30,
2015
|
|
Crops
|
325
|
|
270
|
|
Materials and
inputs
|
250
|
|
154
|
|
Seeds and
fodders
|
109
|
|
61
|
|
Beef
|
31
|
|
19
|
|
Hotel
supplies
|
9
|
|
7
|
|
Goods for resale
and supplies
|
2,849
|
|
-
|
|
Telephones and
others communication equipment
|
327
|
|
-
|
|
Total
inventories
|
3,900
|
|
511
|
As of June 30, 2016
and 2015 the cost of inventories recognized as expense amounted to
Ps. 946 and Ps. 950, respectively and they have been included in
“Costs” in the statements of income.
16.
Financial
instruments by category
The following note
shows the carrying amount of financial assets and financial
liabilities by category of financial instrument and a
reconciliation to the corresponding line item in the statements of
financial position, as appropriate. Since the line items
“Trade and other receivables” and “Trade and
other payables” contain both financial instruments and
non-financial assets or liabilities (such as prepayments, trade
payables in-kind and tax payables), the reconciliation is shown in
the columns headed “Non-financial assets” and
“Non-financial liabilities”. Financial assets and
liabilities measured at fair value are assigned based on their
different levels in the fair value hierarchy.
IFRS 9 defines the
fair value of a financial instrument as the amount for which an
asset could be exchanged, or a financial liability settled, between
knowledgeable, willing parties in an arm’s length
transaction. All financial instruments recognized at fair value are
allocated to one of the valuation hierarchy levels of IFRS 7. This
valuation hierarchy provides for three levels.
In the case of
Level 1, valuation is based on quoted prices (unadjusted) in active
markets for identical assets or liabilities that the Company can
refer to at the date of valuation.
In the case of
Level 2, fair value is determined by using valuation methods based
on inputs directly or indirectly observable in the market. If the
financial instrument concerned has a fixed contract period, the
used inputs for valuation must be observable for the whole of this
period.
F- 122
Cresud Sociedad Anónima,
Comercial, Inmobiliaria, Financiera y Agropecuaria
Notes to the Consolidated
Financial Statements
(Continued)
(All amounts in
millions of Argentine Pesos, except otherwise
indicated)
16.
Financial instruments by category
(Continued)
In the case of
Level 3, the Group uses valuation techniques not based on inputs
observable in the market. This is only permissible insofar as that
information is not available. The inputs used reflect the
Group’s assumptions regarding the factors which any market
player would consider in their pricing.
The Group’s
Finance Division has a team in place in charge of estimating
valuation of financial assets required to be reported in the
financial statements, including the fair value of Level 3
instruments. The team directly reports to the Chief Financial
Officer ("CFO"). The CFO and the valuation team discuss the
valuation methods and results upon the acquisition of an asset and,
if necessary, on a quarterly basis, in line with the Group’s
quarterly reports.
According to the
Group’s policy, transfers among the several categories of
valuation tiers are recognized when occurred, or when there are
changes in the prevailing circumstances requiring the
transfer.
Financial assets
and financial liabilities as of June 30, 2016 were as
follows:
|
|
Financial
assets at amortized cost
|
|
Financial
assets
at
fair value through profit or loss
|
|
Subtotal
financial
assets
|
|
Non-financial
assets
|
|
Total
|
||
|
|
|
|
Level
1
|
Level
2
|
Level
3
|
|
|
|
|
|
|
|
June
30, 2016
|
|
|
|
|
|
|
|
|
|
|
|
|
Assets
as per statement of financial position
|
|
|
|
|
|
|
|
|
|
|
|
|
Trade and other
receivables (excluding the allowance for doubtful accounts and
other receivables) (Note 17)
|
13,211
|
|
102
|
-
|
1,931
|
|
15,244
|
|
2,878
|
|
18,122
|
|
Investment in
financial assets:
|
|
|
|
|
|
|
|
|
|
|
|
|
-
Public companies´ securities
|
-
|
|
1,400
|
-
|
499
|
|
1,899
|
|
-
|
|
1,899
|
|
-
Private companies´ securities
|
-
|
|
-
|
15
|
1,324
|
|
1,339
|
|
-
|
|
1,339
|
|
-
Deposits
|
1,172
|
|
49
|
-
|
-
|
|
1,221
|
|
-
|
|
1,221
|
|
-
Bonds
|
(i)
121
|
|
4,169
|
-
|
-
|
|
4,290
|
|
-
|
|
4,290
|
|
- Mutual
funds
|
-
|
|
2,920
|
-
|
-
|
|
2,920
|
|
-
|
|
2,920
|
|
-
Others
|
-
|
|
90
|
-
|
140
|
|
230
|
|
-
|
|
230
|
|
Derivative
financial instruments (Note 19)
|
-
|
|
20
|
41
|
-
|
|
61
|
|
-
|
|
61
|
|
Financial assets
held for sale (Note 18)
|
|
|
4,602
|
-
|
-
|
|
4,602
|
|
-
|
|
4,602
|
|
Restricted
assets
|
(i)
877
|
|
-
|
-
|
-
|
|
877
|
|
-
|
|
877
|
|
Cash and cash
equivalents (excluding bank overdrafts) (Note 20)
|
6,359
|
|
7,737
|
-
|
-
|
|
14,096
|
|
-
|
|
14,096
|
|
Total
assets
|
21,740
|
|
21,089
|
56
|
3,894
|
|
46,779
|
|
2,878
|
|
49,657
|
(i) The fair values
approximate their respective carrying amounts.
F- 123
Cresud Sociedad Anónima,
Comercial, Inmobiliaria, Financiera y Agropecuaria
Notes to the Consolidated
Financial Statements
(Continued)
(All amounts in
millions of Argentine Pesos, except otherwise
indicated)
16.
Financial instruments by category
(Continued)
|
|
Financial
liabilities at amortized cost
|
|
Financial
liabilities at fair value
|
|
Subtotal
financial
liabilities
|
|
Non-financial
liabilities
|
|
Total
|
||
|
|
|
|
Level
1
|
Level
2
|
Level
3
|
|
|
|
|
|
|
|
June
30, 2016
|
|
|
|
|
|
|
|
|
|
|
|
|
Liabilities
as per statement of financial position
|
|
|
|
|
|
|
|
|
|
|
|
|
Trade and other
payables (Note 21)
|
18,917
|
|
-
|
-
|
-
|
|
18,917
|
|
1,054
|
|
19,971
|
|
Borrowings
(excluding finance lease liabilities) (Note 23)
|
106,271
|
|
-
|
-
|
10,999
|
|
117,270
|
|
-
|
|
117,270
|
|
Derivative
financial instruments (Note 19)
|
-
|
|
265
|
3
|
-
|
|
268
|
|
-
|
|
268
|
|
Total
liabilities
|
125,188
|
|
265
|
3
|
10,999
|
|
136,455
|
|
1,054
|
|
137,509
|
Financial assets
and financial liabilities as of June 30, 2015 were as
follows:
|
|
Financial
assets at amortized cost
|
|
Financial
assets at fair value through profit or loss
|
|
Subtotal
financial
assets
|
|
Non-financial
assets
|
|
Total
|
||
|
|
|
|
Level
1
|
Level
2
|
Level
3
|
|
|
|
|
|
|
|
June
30, 2015
|
|
|
|
|
|
|
|
|
|
|
|
|
Assets
as per statement of financial position
|
|
|
|
|
|
|
|
|
|
|
|
|
IDBD
(i)
|
-
|
|
907
|
-
|
-
|
|
907
|
|
-
|
|
907
|
|
Trade and other
receivables (excluding the allowance for doubtful accounts and
other receivables) (Note 17)
|
1,807
|
|
56
|
-
|
-
|
|
1,863
|
|
456
|
|
2,319
|
|
Investment in
financial assets:
|
|
|
|
|
|
|
|
|
|
|
|
|
-
Equity securities in public companies
|
-
|
|
88
|
-
|
349
|
|
437
|
|
-
|
|
437
|
|
- Equity
securities in private companies
|
-
|
|
102
|
-
|
-
|
|
102
|
|
-
|
|
102
|
|
-
Mutual funds
|
-
|
|
384
|
-
|
-
|
|
384
|
|
-
|
|
384
|
|
-
Bonds
|
(ii)
100
|
|
104
|
-
|
-
|
|
204
|
|
-
|
|
204
|
|
Derivative
financial instruments (Note 19)
|
-
|
|
231
|
-
|
7
|
|
238
|
|
-
|
|
238
|
|
Restricted
assets
|
611
|
|
-
|
-
|
-
|
|
611
|
|
-
|
|
611
|
|
Cash and cash
equivalents (excluding bank overdrafts) (Note 20)
|
521
|
|
113
|
-
|
-
|
|
634
|
|
-
|
|
634
|
|
Total
assets
|
3,039
|
|
1,985
|
-
|
356
|
|
5,380
|
|
456
|
|
5,836
|
(i) The Group has
reported its interest in the associate IDBD at fair value with
changes through profit or loss, as per IAS 28.
(ii)
The fair
values approximate their respective carrying amounts.
F- 124
Cresud Sociedad Anónima,
Comercial, Inmobiliaria, Financiera y Agropecuaria
Notes to the Consolidated
Financial Statements
(Continued)
(All amounts in
millions of Argentine Pesos, except otherwise
indicated)
16.
Financial instruments by category
(Continued)
|
|
Financial
liabilities at amortized cost
|
|
Financial
liabilities
at
fair value
|
|
Subtotal
financial
liabilities
|
|
Non-financial
liabilities
|
|
Total
|
||
|
|
|
|
Level
1
|
Level
2
|
Level
3
|
|
|
|
|
|
|
|
June
30, 2015
|
|
|
|
|
|
|
|
|
|
|
|
|
Liabilities
as per statement of financial position
|
|
|
|
|
|
|
|
|
|
|
|
|
Trade and other
payables (Note 21)
|
763
|
|
-
|
-
|
-
|
|
763
|
|
808
|
|
1,571
|
|
Borrowings
(excluding finance lease liabilities)(Note 23)
|
8,259
|
|
-
|
15
|
-
|
|
8,274
|
|
-
|
|
8,274
|
|
Derivative
financial instruments (Note 19)
|
|
|
|
|
|
|
|
|
|
|
|
|
- Commitment
to tender offer shares in IDBD
|
-
|
|
-
|
-
|
503
|
|
503
|
|
-
|
|
503
|
|
-
Foreign-currency contracts
|
-
|
|
-
|
10
|
-
|
|
10
|
|
-
|
|
10
|
|
- Crops
futures
|
-
|
|
11
|
-
|
-
|
|
11
|
|
-
|
|
11
|
|
- Crops
options
|
-
|
|
9
|
-
|
-
|
|
9
|
|
-
|
|
9
|
|
Total
liabilities
|
9,022
|
|
20
|
25
|
503
|
|
9,570
|
|
808
|
|
10,378
|
Liabilities carried
at amortized cost also include liabilities under finance leases
where the Group is the lessee and which therefore have to be
measured in accordance with IAS 17 “Leases”. The
categories disclosed are determined by reference to IFRS 9. Finance
leases are excluded from the scope of IFRS 7 “Financial
Instruments: Disclosures”. Therefore, finance leases have
been shown separately.
There were no level
transfers in the fiscal years filed.
The following are
details of the book value of financial instruments recognized,
which were offset in the statements of financial
position:
|
|
As
of June 30, 2016
|
|
||||
|
|
Gross
amounts recognized
|
|
Gross amounts offset
|
|
Net
amount presented
|
|
|
June
30, 2016
|
|
|
|
|
|
|
|
Financial
assets
|
|
|
|
|
|
|
|
Trade and other
receivables (excluding the allowance for doubtful accounts and
other receivables) (Note 17)
|
16,779
|
|
(1,296)
|
|
15,483
|
|
|
Financial
Liabilities
|
|
|
|
|
|
|
|
Trade and other
payables (Note 21)
|
(15,546)
|
|
1,296
|
|
(14,250)
|
|
|
|
As
of June 30, 2015
|
|
||||
|
|
Gross
amounts recognized
|
|
Gross amounts offset
|
|
Net
amount presented
|
|
|
June
30, 2015
|
|
|
|
|
|
|
|
Financial
assets
|
|
|
|
|
|
|
|
Trade and other
receivables (excluding the allowance for doubtful accounts and
other receivables) (Note 17)
|
1,961
|
|
(98)
|
|
1,863
|
|
|
Financial
Liabilities
|
|
|
|
|
|
|
|
Trade and other
payables (Note 21)
|
(859)
|
|
98
|
|
(761)
|
|
F- 125
Cresud Sociedad Anónima,
Comercial, Inmobiliaria, Financiera y Agropecuaria
Notes to the Consolidated
Financial Statements
(Continued)
(All amounts in
millions of Argentine Pesos, except otherwise
indicated)
16.
Financial instruments by category
(Continued)
Income, expense,
gains and losses on financial instruments can be assigned to the
following categories:
|
|
Financial
assets / liabilities at
amortized
cost
|
|
Financial
assets / liabilities at
fair
value through profit or loss
|
|
|
Total
|
|
June
30, 2016
|
|
|
|
|
|
|
|
Interest
income
|
689
|
|
116
|
|
|
805
|
|
Interest
expense
|
(2,716)
|
|
(23)
|
|
|
(2,739)
|
|
Foreign exchange
losses
|
(2,908)
|
|
6
|
|
|
(2,902)
|
|
Dividends
income
|
-
|
|
72
|
|
|
72
|
|
Fair value loss in
financial assets at fair value through profit or loss
(i))
|
-
|
|
(1,241)
|
|
|
(1,241)
|
|
Gain on the
revaluation of receivables arising from the sale of
farmland
|
-
|
|
33
|
|
|
33
|
|
Gain from
derivative financial instruments (except commodities)
|
-
|
|
1,089
|
|
|
1,089
|
|
Fair value gain on
associates
|
-
|
|
77
|
|
|
77
|
|
Loss from
repurchase of non-convertibles notes
|
(39)
|
|
-
|
|
|
(39)
|
|
Other financial
results
|
(875)
|
|
(106)
|
|
|
(981)
|
|
Net
result
|
(5,849)
|
|
23
|
|
|
(5,826)
|
|
|
Financial
assets / liabilities at
amortized
cost
|
|
Financial
assets / liabilities at
fair
value through profit or loss
|
|
|
Total
|
|
June
30, 2015
|
|
|
|
|
|
|
|
Interest
income
|
100
|
|
-
|
|
|
100
|
|
Interest
expense
|
(874)
|
|
-
|
|
|
(874)
|
|
Foreign exchange
losses
|
(562)
|
|
-
|
|
|
(562)
|
|
Dividends
income
|
17
|
|
-
|
|
|
17
|
|
Fair value gains
financial assets at fair value through profit or loss
|
-
|
|
188
|
|
|
188
|
|
Gain on the
revaluation of receivables arising from the sale of
farmland
|
-
|
|
53
|
|
|
53
|
|
Loss from
derivative financial instruments (except commodities)
|
-
|
|
(83)
|
|
|
(83)
|
|
Fair value gain on
associates
|
-
|
|
(1,001)
|
|
|
(1,001)
|
|
Loss from
repurchase of Non-convertible notes
|
(2)
|
|
-
|
|
|
(2)
|
|
Other financial
results
|
(125)
|
|
-
|
|
|
(125)
|
|
Net
result
|
(1,446)
|
|
(843)
|
|
|
(2,289)
|
F- 126
Cresud Sociedad Anónima,
Comercial, Inmobiliaria, Financiera y Agropecuaria
Notes to the Consolidated
Financial Statements
(Continued)
(All amounts in
millions of Argentine Pesos, except otherwise
indicated)
16.
Financial instruments by category
(Continued)
|
|
Financial
assets / liabilities at
amortized
cost
|
|
Financial
assets / liabilities at
fair
value through profit or loss
|
|
|
Total
|
|
June
30, 2014
|
|
|
|
|
|
|
|
Interest
income
|
119
|
|
-
|
|
|
119
|
|
Interest
expense
|
(715)
|
|
-
|
|
|
(715)
|
|
Foreign exchange
losses
|
(1,900)
|
|
-
|
|
|
(1,900)
|
|
Dividends
income
|
15
|
|
-
|
|
|
15
|
|
Fair value gains in
financial assets at fair value through profit or loss
|
-
|
|
379
|
|
|
379
|
|
Loss from
repurchase of Non-convertible Notes
|
(45)
|
|
-
|
|
|
(45)
|
|
Loss from
derivative financial instruments (except commodities)
|
-
|
|
(365)
|
|
|
(365)
|
|
Gain on the
revaluation of receivables arising from the sale of
farmland
|
-
|
|
21
|
|
|
21
|
|
Other financial
results
|
(83)
|
|
-
|
|
|
(83)
|
|
Net
result
|
(2,609)
|
|
35
|
|
|
(2,574)
|
The following table
presents the changes in Level 3 financial instruments for the years
ended June 30, 2016 and 2015:
|
|
Equity securities in public companies
|
|
Equity securities in private companies
|
|
Others
|
|
Warrants
of Condor
|
|
Investment in associate IDBD
|
|
Commitment
to
tender offer shares in IDBD
|
|
Trade and other receivables - Cellcom
|
|
Non-recourse loans
|
|
Total
|
|
Total as of June 30, 2014
|
211
|
|
-
|
|
-
|
|
-
|
|
-
|
|
(321)
|
|
-
|
|
-
|
|
(110)
|
|
Currency
translation adjustment
|
-
|
|
-
|
|
-
|
|
-
|
|
83
|
|
(45)
|
|
-
|
|
19
|
|
57
|
|
Transfer to Level
3
|
-
|
|
-
|
|
-
|
|
-
|
|
1,826
|
|
-
|
|
-
|
|
(86)
|
|
1,740
|
|
Transfer from
associates
|
-
|
|
30
|
|
-
|
|
-
|
|
-
|
|
-
|
|
-
|
|
-
|
|
30
|
|
Gains or losses for
the year (Note 33)
|
138
|
|
72
|
|
-
|
|
7
|
|
(1,001)
|
|
(137)
|
|
-
|
|
52
|
|
(869)
|
|
Balance as of June 30, 2015
|
349
|
|
102
|
|
-
|
|
7
|
|
908
|
|
(503)
|
|
-
|
|
(15)
|
|
848
|
|
Additions and
acquisitions
|
50
|
|
27
|
|
-
|
|
-
|
|
-
|
|
-
|
|
-
|
|
-
|
|
77
|
|
Write
off
|
-
|
|
-
|
|
-
|
|
-
|
|
-
|
|
500
|
|
-
|
|
-
|
|
500
|
|
Currency
translation adjustment
|
-
|
|
291
|
|
52
|
|
-
|
|
60
|
|
(18)
|
|
705
|
|
(3,610)
|
|
(2,520)
|
|
Obtainment of
control over IDBD
|
-
|
|
861
|
|
88
|
|
-
|
|
(1,047)
|
|
-
|
|
1,187
|
|
(7,336)
|
|
(6,247)
|
|
Gains and losses
for the year (Note 33)
|
100
|
|
43
|
|
-
|
|
(7)
|
|
79
|
|
21
|
|
39
|
|
(38)
|
|
237
|
|
Balance as of June 30, 2016
|
499
|
|
1,324
|
|
140
|
|
-
|
|
-
|
|
-
|
|
1,931
|
|
(10,999)
|
|
(7,105)
|
Securities and warrants of Condor
Upon initial
recognition of the new instrument (January, 2012), the
consideration paid for the Shares and Warrants of Condor was
assigned to both instruments based on the relative fair values of
those instruments upon acquisition. The fair value of these
instruments exceeded the transaction price and were determined
using a valuation technique that uses inputs not observable in the
market. As a result of the use of this technique, the Group has not
recognized a gain at the time of initial recognition.
F- 127
Cresud Sociedad Anónima,
Comercial, Inmobiliaria, Financiera y Agropecuaria
Notes to the Consolidated
Financial Statements
(Continued)
(All amounts in
millions of Argentine Pesos, except otherwise
indicated)
16.
Financial instruments by category
(Continued)
In March 2016, the
Group has exchanged its preferred Class C shares for a new Class D
preferred shares issued by Condor and, additionally, it has
received cash in the amount of US$ 1.2
million
and a promissory note for US$ 1.1
million related to dividends receivable.
In this new issue
the company “Stepstone Real Estate” has been added as
new partner by making a contribution of US$ 30 million, which will
be used to redeem Class A and B preferred shares and for the
acquisition of new hotels.
The new Class D
preferred shares will accrue annual interest at a rate of 6.25% and
will be convertible into common shares at a price of US$ 1.60
share.
There were no
changes to the warrants held by the Group.
The Board of
Directors of Condor is now formed by four directors of the company,
three directors appointed by Stepstone Real Estate and two
independent directors. In addition, the voting power held by the
company in Condor amounts to 49%, thus keeping significant
influence.
Investment in IDBD, associate and warrants
As described in
Note 3 until taking control over IDBD, the Group stated its equity
interest in IDBD as an associate measured at fair value, invoking
the exception under IAS 28 and the warrants to acquire IDBD’s
common shares were booked at their quoted prices. Since October 11,
2015, as result of consolidation, the equity interest in IDBD as an
associate and the warrants were eliminated following the
consolidation to add IDBD’s assets and liabilities on a
line-by-line basis.
Non-recourse loans
IDBD relied on an
independent appraiser to determine the value of the non-recourse
loan. The valuation model is a binomial tree where the main
variable is Adama’s share price.
F- 128
Cresud Sociedad Anónima,
Comercial, Inmobiliaria, Financiera y Agropecuaria
Notes to the Consolidated
Financial Statements
(Continued)
(All amounts in
millions of Argentine Pesos, except otherwise
indicated)
16.
Financial instruments by category
(Continued)
When no quoted
prices in an active market are available, fair values (particularly
with derivatives) are based on recognized valuation methods. The
Group uses a range of valuation models for the measurement of Level
2 and Level 3 instruments, details of which may be obtained from
the following table:
|
Description
|
|
Pricing model
|
|
Pricing method
|
|
Parameters
|
|
Range
|
|
Investment
in financial assets – Public companies securities - Preferred
shares of Condor
|
|
Binomial
tree
|
|
Theoretical
price
|
|
Underlying
asset price (Market price); share price volatility (historical) and
market interest-rate (Libor rate curve).
|
|
Underlying
asset price 1.4 to 1.7
Share
price volatility 58% to 78%
Money
market interest-rate
1.0%
to 1.3%
|
|
Investment
in financial assets – Public companies securities -
Promissory note
|
|
Discounted
cash flow
|
|
Theoretical
price
|
|
Market
interest-rate (Libor rate curve)
|
|
Money
market interest-rate
1.0%
to 1.3%
|
|
Derivative
financial instruments - Warrants of Condor
|
|
Black-Scholes
|
|
Theoretical
price
|
|
Underlying
asset price (Market price); share price volatility (historical) and
interest-rate curve (Libor rate).
|
|
Underlying
asset price 1.4 to 1.7
Share
price volatility 58% to 78%
Money
market interest-rate
1.0%
to 1.3%
|
|
Interest
rate swaps
|
|
Cash
flow
|
|
Theoretical
price
|
|
Interest
rate futures contract and cash flow
|
|
-
|
|
Call
option of Arcos
|
|
Discounted
cash flow
|
|
-
|
|
Projected
revenues and discounting rate.
|
|
-
|
|
Investments
in financial assets - Private companies - Avenida Inc.
|
|
Market
multiples
|
|
Theoretical
price
|
|
Comparable
market multiple (EV/GMV ratio)
|
|
Comparable
market multiple (EV/GMV ratio) 2.94x to 3.59x
|
|
Investments
in financial assets - Private companies - Others
|
|
Discounted
cash flows / NAV
|
|
Theoretical
price
|
|
Projected revenue
discounted at the discount rate / The value is calculated in
accordance with the company’s shares in the equity funds on
the basis of their financial statements, based on fair value or
investment assessments.
|
|
1 -
3.5
|
|
Investments
in financial assets - Others
|
|
Discounted
cash flows / NAV
|
|
Theoretical
price
|
|
Projected revenue
discounted at the discount rate / The value is calculated in
accordance with the company’s shares in the equity funds on
the basis of its financial statements, based on fair value or
investment assessments
|
|
1 -
3.5
|
|
Borrowings
- Non-recourse loan
|
|
Binomial
tree
|
|
Theoretical
price
|
|
Underlying
asset price (obtained by discounted cash flow valuation), capital
cost, market rate; control premium, underlying asset
volatility.
|
|
Underlying
asset price US$ 760MM to US$ 940MM, capital cost 11.8% to 14.4%,
discounted market interest rate 7.9% to 12.9%, control premium 3.3%
to 6.6%, underlying asset volatility 25.7% to 33.1%.
|
F- 129
Cresud Sociedad Anónima,
Comercial, Inmobiliaria, Financiera y Agropecuaria
Notes to the Consolidated
Financial Statements
(Continued)
(All amounts in
millions of Argentine Pesos, except otherwise
indicated)
17.
Trade
and other receivables
The table below
shows trade and other receivables of the Group as of June 30, 2016
and 2015:
|
|
June 30,
2016
|
|
June 30,
2015
|
|
Non-current
|
|
|
|
|
Trade
receivables
|
|
|
|
|
Trade, leases and
services receivable
|
2,015
|
|
63
|
|
Trade receivables
related to agricultural properties
|
54
|
|
104
|
|
Less: allowance for
doubtful accounts
|
(2)
|
|
(2)
|
|
Non-current
trade receivables
|
2,067
|
|
165
|
|
Other
receivables
|
|
|
|
|
Tax
credits
|
119
|
|
73
|
|
Guarantee
deposits
|
24
|
|
17
|
|
Prepayments
|
1,320
|
|
11
|
|
VAT
receivables
|
-
|
|
27
|
|
Loans
|
239
|
|
116
|
|
Others
|
4
|
|
18
|
|
Non-current
other receivables
|
1,706
|
|
262
|
|
Non-current
trade and other receivables
|
3,773
|
|
427
|
|
Current
|
|
|
|
|
Trade
receivables
|
|
|
|
|
Trade, leases and
services receivable
|
921
|
|
695
|
|
Receivables from
sale of agricultural products and farmlands leases
|
362
|
|
268
|
|
Trade receivables
related to agricultural properties
|
22
|
|
88
|
|
Deferred checks
received
|
304
|
|
-
|
|
Trade
receivables
|
5,970
|
|
-
|
|
Credit card
receivables
|
3,872
|
|
-
|
|
Less: allowance for
doubtful accounts
|
(189)
|
|
(118)
|
|
Current
trade receivables
|
11,262
|
|
933
|
|
Other
receivables
|
|
|
|
|
Tax
credits
|
180
|
|
117
|
|
Guarantee
deposits
|
78
|
|
39
|
|
Prepayments
|
681
|
|
145
|
|
VAT credit to be
transferred
|
11
|
|
-
|
|
Borrowings granted,
deposits, and other balances
|
1,243
|
|
392
|
|
Advance
payments
|
328
|
|
105
|
|
Others
|
375
|
|
41
|
|
Current
other receivables
|
2,896
|
|
839
|
|
Current
trade and other receivables
|
14,158
|
|
1,772
|
|
Total
trade and other receivables
|
17,931
|
|
2,199
|
The carrying
amounts of the Group’s trade and other receivables in foreign
currencies are detailed in Note 37.
Trade receivables
are generally presented in the statements of financial position net
of allowances for doubtful receivables. Impairment polices and
procedures by type of receivables are discussed in detail in Note
2.
F- 130
Cresud Sociedad Anónima,
Comercial, Inmobiliaria, Financiera y Agropecuaria
Notes to the Consolidated
Financial Statements
(Continued)
(All amounts in
millions of Argentine Pesos, except otherwise
indicated)
17.
Trade and other receivables
(Continued)
The fair values of
current trade and other receivables approximate their respective
carrying amounts, due to their short-term nature, as the impact of
discounting is not significant. Present value of non-current trade
receivables related to sales of equipment installments, as
performed by Cellcom (mainly in 36 installments), as of June 30,
2016 were calculated at a 3.3% discount rate. Other non-current
receivables conform to or approximate their fair values. Fair
values are based on discounted cash flows. (Level 3 of the fair
value hierarchy).
The evolution of
the Group’s provision for impairment of trade receivables
were as follows:
|
|
June 30,
2016
|
|
June 30,
2015
|
|
June 30, 2014
|
|
Beginning
of the year
|
120
|
|
90
|
|
87
|
|
Recovery
|
(53)
|
|
21
|
|
(14)
|
|
Used during the
year
|
(4)
|
|
(14)
|
|
(9)
|
|
Creation
|
113
|
|
21
|
|
24
|
|
Currency
translation adjustment
|
15
|
|
2
|
|
2
|
|
End
of the year
|
191
|
|
120
|
|
90
|
The Group’s
trade receivables comprise several classes. The maximum exposure to
credit risk at the reporting date is the carrying value of each
class of credit. (Note 4)
The Group has also
receivables with related parties. Neither of which are due nor
impaired.
Due to the distinct
characteristics of each type of receivables, an aging analysis of
past due unimpaired and impaired receivables are shown by type and
class as of June 30, 2016 and 2015 (includes receivables not past
due to reconcile with the amounts in the statements of financial
position):
|
|
Expired
|
|
|
|
|
|
|||
|
|
Up
to 3 months
|
3
to 6
months
|
Over
6 months
|
Not
past due
|
Allowance
|
Total
|
%
of representation
|
Additions
(reversals) for bad debts
|
|
|
Agricultural
products
|
60
|
7
|
8
|
256
|
18
|
349
|
2.6%
|
1
|
|
|
Shopping leases and
services
|
50
|
5
|
3
|
776
|
78
|
912
|
6.7%
|
12
|
|
|
Office leases and
services
|
1
|
3
|
7
|
18
|
6
|
35
|
0.3%
|
(6)
|
|
|
Hotel leases and
services
|
16
|
12
|
23
|
312
|
27
|
390
|
2.9%
|
1
|
|
|
Consumer
financing
|
-
|
-
|
-
|
-
|
15
|
15
|
0.1%
|
1
|
|
|
Hotel
operations
|
1
|
-
|
-
|
48
|
1
|
50
|
0.4%
|
-
|
|
|
Disposal of
properties
|
-
|
-
|
16
|
99
|
-
|
115
|
0.9%
|
-
|
|
|
Sale of
communication equipment
|
2,250
|
-
|
-
|
1,714
|
66
|
4,030
|
29.8%
|
-
|
|
|
Telecommunication
services
|
1,763
|
356
|
672
|
19
|
672
|
3,482
|
25.8%
|
61
|
|
|
Tourism
activities
|
16
|
12
|
20
|
219
|
51
|
318
|
2.3%
|
(3)
|
|
|
Sale of products
(supermarkets)
|
27
|
19
|
55
|
3,665
|
58
|
3,824
|
28.3%
|
4
|
|
|
Total
as of June 30, 2016
|
4,184
|
414
|
804
|
7,126
|
992
|
13,520
|
100%
|
71
|
|
|
|
|
|
|
|
|
|
|
|
|
|
Agricultural
products
|
4
|
1
|
3
|
199
|
16
|
223
|
18.3%
|
16
|
|
|
Shopping leases and
services
|
42
|
10
|
14
|
562
|
70
|
698
|
57.3%
|
14
|
|
|
Office leases and
services
|
40
|
4
|
2
|
12
|
9
|
67
|
5.5%
|
-
|
|
|
Hotel leases and
services
|
1
|
-
|
-
|
16
|
1
|
18
|
1.5%
|
-
|
|
|
Consumer
financing
|
-
|
-
|
-
|
5
|
15
|
20
|
1.6%
|
-
|
|
|
Disposal of
properties
|
-
|
-
|
-
|
183
|
9
|
192
|
15.8%
|
-
|
|
|
Total
as of June 30, 2015
|
87
|
15
|
19
|
977
|
120
|
1,218
|
100%
|
30
|
|
F- 131
Cresud Sociedad Anónima,
Comercial, Inmobiliaria, Financiera y Agropecuaria
Notes to the Consolidated
Financial Statements
(Continued)
(All amounts in
millions of Argentine Pesos, except otherwise
indicated)
18.
Financial
assets held for sale
Group’s
financial assets and other assets held for sale as of June 30, 2016
and 2015 were as follows:
|
|
June 30,
2016
|
|
June 30,
2015
|
|
Non-current
|
|
|
|
|
Clal
|
3,346
|
|
-
|
|
Non-current
financial assets held for sale
|
3,346
|
|
-
|
|
|
|
|
|
|
Current
|
|
|
|
|
Clal
|
1,256
|
|
-
|
|
Current
financial assets held for sale
|
1,256
|
|
-
|
|
Total
Financial assets held for sale
|
4,602
|
|
-
|
Clal is a holding
company that mainly operates in the insurance and pension markets
and in segments of pension funds. The company holds assets and
other businesses (such as insurance agencies) and is one of the
largest insurance groups in Israel. Clal mainly develops its
activities in three operating segments: long-term savings, general
insurance and health insurance.
Given that IDBD
failed to meet the requirements set forth by the Capital Markets,
Insurance and Savings Commission, which is dependent on the
Ministry of Finance of Israel, to have control over an insurance
company, on August 21, 2013, such commission required that IDBD
granted an irrevocable power of attorney to Mr. Moshe Tery ("the
Trustee") by 51% of the shareholding capital and vote in Clal, thus
transferring control over that investee.
On December 30,
2014, the Insurance Commission sent an additional letter setting a
term by which IDBD’s control over and equity interests in
Clal were to be sold and giving directions as to the
Trustee’s continuity in office, among other
aspects.
The sale
arrangement outlined in the letter involves IDBD’s and the
Trustee’s interests in the sale process under different
options and timeframes. As of June 30, 2016, the current sale
arrangement involved the sale of the interest in the stock exchange
or by over-the-counter trades, as per the following detail and by
the following dates:
a.
IDBD would have to
sell at least 5% of its equity interest in Clal from May 7,
2016.
b.
During each of the
subsequent four-month periods, IDBD would have to sell at least an
additional 5% of its equity interest in Clal.
c.
If IDBD sells more
than 5% of its equity interest in Clal in any given four-month
period, the percentage in excess of the required 5% would be offset
against the percentage required in the following
period.
F- 132
Cresud Sociedad Anónima,
Comercial, Inmobiliaria, Financiera y Agropecuaria
Notes to the Consolidated
Financial Statements
(Continued)
(All amounts in
millions of Argentine Pesos, except otherwise
indicated)
18.
Financial assets held for sale
(Continued)
In case IDBD does
not fulfills its obligation in the manner described in the above
paragraph the Trustee would be entitled to act upon the specified
arrangement in lieu of IDBD, pursuant to all powers that had been
vested under the representations of the trust letter. The
consideration for the sale would be transferred to IDBD, with the
expenses incurred in the sale process to be solely borne by
IDBD.
During February
2016, bondholders and minority shareholders filed a complaint
against the Insurance Commission and the Trustee so that the order
by the Trustee to sell the shares in the market was revoked, for
this would cause irreversible damage to the company and its
bondholders. As of the date of these Consolidated Financial
Statements, no decision has been rendered on the
complaint.
In June 30, 2016
the holding of IDBD to Clal was of 55%, and as a result of the
circumstances mentioned above, IDBD has accounted for it as an
available-for-sale financial asset. Valuation as of June 30, 2016
amounts to Ps. 4,602, and a loss of Ps. 1,951 were recorded,
reflecting the fall in the market price, in financial results,
net.
Claims against Clal
Clal set up a
reserve for all legal actions brought against Clal’s
investees out of the ordinary course of business in the amount of
approximately NIS 96 million (equivalent to Ps. 376 million at the
closing exchange rate). Most legal actions are related to consumer
claims and actions erasing from those claims. The total amount
claimed is NIS 29,200 million (equivalent to Ps. 114,275 million at
the closing exchange rate).
F- 133
Cresud Sociedad Anónima,
Comercial, Inmobiliaria, Financiera y Agropecuaria
Notes to the Consolidated
Financial Statements
(Continued)
(All amounts in
millions of Argentine Pesos, except otherwise
indicated)
19.
Derivative
financial instruments
Group’s
derivative financial instruments as of June 30, 2016 and 2015 are
as follows:
|
|
June 30,
2016
|
|
June 30,
2015
|
|
Assets
|
|
|
|
|
Non-current
|
|
|
|
|
Crops
options
|
-
|
|
2
|
|
Warrants IDBD (Note
3)
|
-
|
|
199
|
|
Warrant
Condor
|
-
|
|
7
|
|
Others
|
8
|
|
-
|
|
Total
non-current
|
8
|
|
208
|
|
Current
|
|
|
|
|
Foreign-currency
futures contracts
|
25
|
|
-
|
|
Crops
futures
|
-
|
|
1
|
|
Crops
options
|
7
|
|
-
|
|
Foreign-currency
options
|
2
|
|
-
|
|
Warrants IDBD (Note
3)
|
-
|
|
29
|
|
Interest-rate
swaps
|
4
|
|
-
|
|
Others
|
15
|
|
-
|
|
Total
current
|
53
|
|
30
|
|
Total
assets
|
61
|
|
238
|
|
Liabilities
|
|
|
|
|
Non-current
|
|
|
|
|
Crops
options
|
16
|
|
2
|
|
Foreign-currency
futures contracts
|
-
|
|
3
|
|
Commitment to
tender offer shares in IDBD (Note 3)
|
-
|
|
265
|
|
Forward
contracts
|
105
|
|
-
|
|
Total
non-current
|
121
|
|
270
|
|
Current
|
|
|
|
|
Foreign-currency
futures contracts
|
31
|
|
7
|
|
Foreign-currency
options
|
1
|
|
-
|
|
Crops
options
|
5
|
|
7
|
|
Crops
futures
|
17
|
|
11
|
|
Commitment to
tender offer shares in IDBD (Note 3)
|
-
|
|
238
|
|
Forward
contracts
|
93
|
|
-
|
|
Total
current
|
147
|
|
263
|
|
Total
liabilities
|
268
|
|
533
|
F- 134
Cresud Sociedad Anónima,
Comercial, Inmobiliaria, Financiera y Agropecuaria
Notes to the Consolidated
Financial Statements
(Continued)
(All amounts in
millions of Argentine Pesos, except otherwise
indicated)
20.
Cash
flow information
The following table
shows the balances of cash and cash equivalents as of June 30, 2016
and 2015:
|
|
June 30,
2016
|
|
June 30,
2015
|
|
Cash at bank and in
hand
|
6,259
|
|
438
|
|
Short-term bank in
deposits
|
100
|
|
84
|
|
Mutual
funds
|
7,737
|
|
112
|
|
Total
cash and cash equivalents
|
14,096
|
|
634
|
Following is a
detailed description of cash flows generated by the Group’s
operations for the years ended as of June 30, 2016, 2015 and
2014.
|
|
|
June
30,
2016
|
|
June
30,
2015
|
|
June
30,
2014
|
|
(Loss)
Profit for the year
|
|
(1,891)
|
|
175
|
|
(1,409)
|
|
Adjustments for
:
|
|
|
|
|
|
|
|
Income tax
expense
|
|
(197)
|
|
303
|
|
(389)
|
|
Depreciation and
amortization
|
|
2,769
|
|
259
|
|
297
|
|
Gain from disposal
of investment properties
|
|
(1,101)
|
|
(1,150)
|
|
(231)
|
|
Loss / (Gain) from
disposal of farmlands
|
|
2
|
|
(550)
|
|
(91)
|
|
Gain on the
revaluation of receivables arising from the sale of
farmland
|
|
(33)
|
|
(53)
|
|
(21)
|
|
(Gain) / Loss from
disposal of property, plant and equipment
|
|
(6)
|
|
1
|
|
-
|
|
Release of
investment property and property, plant and equipment
|
|
-
|
|
2
|
|
2
|
|
Impairment of
investment property
|
|
352
|
|
-
|
|
-
|
|
Dividends
income
|
|
(72)
|
|
(17)
|
|
(15)
|
|
Share based
payments
|
|
54
|
|
31
|
|
69
|
|
Unrealized (Gain) /
Loss on derivative financial instruments
|
|
(1,064)
|
|
131
|
|
350
|
|
Changes in fair
value of financial assets
|
|
1,286
|
|
(187)
|
|
(379)
|
|
Unrealized initial
recognition and changes in fair value of biological assets and
agricultural produce at the point of harvest
|
|
(615)
|
|
(105)
|
|
(406)
|
|
Changes in the net
realizable value of agricultural produce after harvest
|
|
(208)
|
|
34
|
|
17
|
|
Provisions
|
|
255
|
|
90
|
|
113
|
|
Financial results,
net
|
|
6,038
|
|
1,418
|
|
2,542
|
|
Share of loss of
joint ventures and associates
|
|
(473)
|
|
1,026
|
|
409
|
|
Reversal of
currency translation adjustment
|
|
(96)
|
|
(189)
|
|
-
|
|
Gain from disposal
of subsidiaries and joint ventures
|
|
(4)
|
|
(22)
|
|
-
|
|
Loss from
repurchase of Non-convertible notes
|
|
39
|
|
2
|
|
45
|
|
Changes
in operating assets and liabilities:
|
|
|
|
|
|
|
|
Decrease in
biological assets
|
|
135
|
|
115
|
|
287
|
|
Increase in
inventories
|
|
(79)
|
|
(132)
|
|
(197)
|
|
Decrease in trading
properties
|
|
229
|
|
-
|
|
7
|
|
(Increase) Decrease
in trade and other receivables
|
|
(487)
|
|
(480)
|
|
268
|
|
(Increase) Decrease
in derivative financial instruments
|
|
(46)
|
|
4
|
|
(6)
|
|
Increase (Decrease)
in trade and other payables
|
|
182
|
|
145
|
|
(170)
|
|
Increase in
employee benefits
|
|
52
|
|
85
|
|
72
|
|
Decrease in
provisions
|
|
(155)
|
|
(12)
|
|
(1)
|
|
Net
cash generated from operating activities before income tax
paid
|
|
4,866
|
|
924
|
|
1,163
|
F- 135
Cresud Sociedad Anónima,
Comercial, Inmobiliaria, Financiera y Agropecuaria
Notes to the Consolidated
Financial Statements
(Continued)
(All amounts in
millions of Argentine Pesos, except otherwise
indicated)
20.
Cash flow information
(Continued)
The following table
shows a detail of non-cash transactions occurred in the years ended
June 30, 2016, 2015 and 2014:
|
|
June 30,
2016
|
|
June 30,
2015
|
|
June 30,
2014
|
|
Increase in
restricted funds from the sale of farmlands
|
-
|
|
590
|
|
-
|
|
Reimbursement of
expired dividends
|
6
|
|
1
|
|
3
|
|
Dividends
payable
|
64
|
|
48
|
|
57
|
|
Dividends not
collected
|
4
|
|
-
|
|
-
|
|
Acquisition of
non-controlling interest
|
139
|
|
-
|
|
-
|
|
Payment of
non-convertible notes through a decrease in trade and other
receivables
|
22
|
|
-
|
|
-
|
|
Decrease in
borrowings through a decrease in investment in joint ventures and
associates
|
9
|
|
137
|
|
-
|
|
Increase in
financial assets through a decrease in trade and other
receivables
|
71
|
|
-
|
|
-
|
|
Increase in
financial assets through a decrease in investment in joint ventures
and associates
|
-
|
|
30
|
|
-
|
|
Increase in
financial assets through an increase in trade and other
payables
|
180
|
|
-
|
|
-
|
|
Increase in
property, plant and equipment through an increase in trade and
other payables and borrowings
|
116
|
|
2
|
|
1
|
|
Decrease in
property, plant and equipment and investment properties through an
increase in trade and other receivables
|
-
|
|
-
|
|
24
|
|
Decrease in
intangible assets through an increase in assets held for
sale
|
-
|
|
-
|
|
77
|
|
Increase in trading
properties through a decrease in intangible assets
|
-
|
|
-
|
|
7
|
|
Increase in trading
properties through a decrease in investment properties
|
71
|
|
-
|
|
-
|
|
Decrease in trading
properties through a decrease in trade and other
payables
|
-
|
|
1
|
|
-
|
|
Increase in
investment properties through an increase in
borrowings
|
302
|
|
-
|
|
-
|
|
Increase in
investment properties through a decrease in property, plant and
equipment
|
1
|
|
-
|
|
-
|
|
Decrease in
investment properties through an increase in property, plant and
equipment
|
-
|
|
-
|
|
12
|
|
Decrease in
investment properties through an increase in intangible
assets
|
-
|
|
-
|
|
1
|
|
Decrease in
investment properties through an increase in assets held for
sale
|
-
|
|
-
|
|
1,099
|
|
Decrease in trade
and other receivables through an increase in assets held for
sale
|
-
|
|
-
|
|
18
|
|
Decrease in trade
and other payables through an increase in liabilities directly
associated with assets classified as held for sale
|
-
|
|
-
|
|
170
|
|
Decrease in
borrowings through an increase in liabilities directly associated
with assets classified as held for sale
|
-
|
|
-
|
|
603
|
|
Decrease in
deferred income tax liabilities through an increase in liabilities
directly associated with assets classified as held for
sale
|
-
|
|
-
|
|
33
|
|
Increase in
restricted assets through a decrease in trade and other
payables
|
-
|
|
-
|
|
146
|
|
Stock plan
granted
|
(4)
|
|
(16)
|
|
-
|
|
Distribution of
treasury stock
|
-
|
|
(55)
|
|
-
|
|
Options
expired
|
-
|
|
106
|
|
-
|
|
Increase in
non-controlling interest hrough a decrease in assets from
derivative financial instruments
|
128
|
|
-
|
|
-
|
|
Decrease in
restricted assets through an increase in assets held for
sale
|
-
|
|
9
|
|
164
|
|
Decrease in
borrowings trough an increase of investment in associates, and
joint ventures
|
-
|
|
-
|
|
24
|
F- 136
Cresud Sociedad Anónima,
Comercial, Inmobiliaria, Financiera y Agropecuaria
Notes to the Consolidated
Financial Statements
(Continued)
(All amounts in
millions of Argentine Pesos, except otherwise
indicated)
20.
Cash flow information
(Continued)
Incorporation
for business combination
|
|
June
30,
2016
|
|
June
30,
2015
|
|
June
30,
2014
|
|
Investment
properties
|
29,586
|
|
-
|
|
-
|
|
Property,
plant and equipment
|
15,104
|
|
-
|
|
-
|
|
Trading
properties
|
2,656
|
|
-
|
|
-
|
|
Intangible
assets
|
6,603
|
|
-
|
|
-
|
|
Investments
in joint ventures and associates
|
9,268
|
|
-
|
|
-
|
|
Deferred
income tax
|
(4,681)
|
|
-
|
|
-
|
|
Trade
and other receivables
|
9,713
|
|
-
|
|
-
|
|
Investment
in financial assets
|
5,824
|
|
-
|
|
-
|
|
Derivative
financial instruments, net
|
(54)
|
|
-
|
|
-
|
|
Inventories
|
1,919
|
|
-
|
|
-
|
|
Income
tax credits
|
91
|
|
-
|
|
-
|
|
Financial
assets and other assets held for sale
|
5,129
|
|
-
|
|
-
|
|
Trade
and other payables
|
(19,749)
|
|
-
|
|
-
|
|
Borrowings
|
(60,306)
|
|
-
|
|
-
|
|
Provisions
|
(969)
|
|
-
|
|
-
|
|
Income
tax liabilities
|
(267)
|
|
-
|
|
-
|
|
Employee
benefits
|
(405)
|
|
-
|
|
-
|
|
Total
|
(538)
|
|
-
|
|
-
|
|
Non-controlling
interest
|
(8,630)
|
|
-
|
|
-
|
|
Goodwill
|
1,391
|
|
-
|
|
-
|
|
Total assets incorporated by business combination, net of cash and
cash equivalents
|
(7,777)
|
|
-
|
|
-
|
|
Cash incorporated by business combination
|
9,193
|
|
-
|
|
-
|
F- 137
Cresud Sociedad Anónima,
Comercial, Inmobiliaria, Financiera y Agropecuaria
Notes to the Consolidated
Financial Statements
(Continued)
(All amounts in
millions of Argentine Pesos, except otherwise
indicated)
21.
Trade
and other payables
Group’s trade
and other payables as of June 30, 2016 and 2015 were as
follows:
|
|
June 30,
2016
|
|
June 30,
2015
|
|
Non-current
|
|
|
|
|
Trade
payables
|
|
|
|
|
Trade
payables
|
525
|
|
216
|
|
Total
non-current trade payables
|
525
|
|
216
|
|
Other
payables
|
|
|
|
|
Payment plan for
payable taxes
|
-
|
|
24
|
|
Deferred
income
|
65
|
|
7
|
|
Taxes
payable
|
8
|
|
7
|
|
Others
|
930
|
|
10
|
|
Total
non-current other payables
|
1,003
|
|
48
|
|
Total
non-current trade and other payables
|
1,528
|
|
264
|
|
Current
|
|
|
|
|
Trade
payables
|
|
|
|
|
Admission
rights
|
188
|
|
143
|
|
Trade
payables
|
11,180
|
|
316
|
|
Accrued
invoices
|
612
|
|
223
|
|
Leases and services
payments received in advance
|
4,594
|
|
226
|
|
Guarantee
deposits
|
24
|
|
-
|
|
Total
current trade payables
|
16,598
|
|
908
|
|
Other
payables
|
|
|
|
|
Deferred
incomes
|
2
|
|
24
|
|
Taxes
payable
|
333
|
|
220
|
|
Dividends payable
to non-controlling shareholders
|
435
|
|
124
|
|
Others
|
1,075
|
|
31
|
|
Total
current other payables
|
1,845
|
|
399
|
|
Total
current trade and other payables
|
18,443
|
|
1,307
|
|
Total
trade and other payables
|
19,971
|
|
1,571
|
The fair value of
trade and other payables approximate their respective carrying
amounts, due to their short-term nature, the effect of discounting
is not significant. Fair values are based on discounted cash
flows
F- 138
Cresud Sociedad Anónima,
Comercial, Inmobiliaria, Financiera y Agropecuaria
Notes to the Consolidated
Financial Statements
(Continued)
(All amounts in
millions of Argentine Pesos, except otherwise
indicated)
22.
Provisions
The Group is
subject to claims, lawsuits and other legal proceedings in the
ordinary course of business, including claims from clients where a
third party seeks reimbursement or damages. The Group’s
responsability under such claims, lawsuits and legal proceedings
cannot be estimated with certainty. From time to time, the status
of each major issue is evaluated and its potential financial
exposure is assessed. If the potential loss involved in the claim
or proceeding is deemed probable and the amount may be reasonably
estimated, a liability is recorded. The Group estimates the amount
of such liability based on the available information and in
accordance with the provisions of the IFRS. If additional
information becomes available, the Group will make an evaluation of
claims, lawsuits and other outstanding proceeding, and will revise
its estimates.
The table below
shows the evolution in the Group's provisions for other liabilities
categorized by type of provision:
|
|
Legal
claims (i)
|
|
Investments
in
associates
and
joint ventures (ii)
|
|
Sited
dismantling and remediation (iii)
|
|
Onerous
contracts (iv)
|
|
Guarantees
and
other provisions (v)
|
|
Total
|
|
At
July 1, 2014
|
65
|
|
177
|
|
-
|
|
-
|
|
-
|
|
242
|
|
Additions
|
48
|
|
159
|
|
-
|
|
-
|
|
-
|
|
207
|
|
Unused amounts
reversed
|
(34)
|
|
-
|
|
-
|
|
-
|
|
-
|
|
(34)
|
|
Contributions
|
-
|
|
(2)
|
|
-
|
|
-
|
|
-
|
|
(2)
|
|
Currency
translation adjustment
|
-
|
|
29
|
|
-
|
|
-
|
|
-
|
|
29
|
|
As
of June 30, 2015
|
79
|
|
363
|
|
-
|
|
-
|
|
-
|
|
442
|
|
Additions
|
17
|
|
234
|
|
39
|
|
(16)
|
|
(10)
|
|
264
|
|
Unused amounts
reversed
|
(64)
|
|
-
|
|
-
|
|
-
|
|
(6)
|
|
(70)
|
|
Contributions
|
-
|
|
(18)
|
|
-
|
|
-
|
|
-
|
|
(18)
|
|
Liabilities
incorporated by business combination (Note 3)
|
424
|
|
-
|
|
47
|
|
199
|
|
299
|
|
969
|
|
Currency
translation adjustment
|
248
|
|
262
|
|
28
|
|
113
|
|
144
|
|
795
|
|
As
of June 30, 2016
|
704
|
|
841
|
|
114
|
|
296
|
|
427
|
|
2,382
|
(i)
Additions and
recoveries are included in "Other operating results,
net".
(ii)
Corresponds to
equity interests in associates with negative equity, mainly New
Lipstick. Additions and recoveries are included in "Share of profit
/ (loss) of joint ventures and associates". Additions and
recoveries are included in Costs.
(iii)
The Group’s
companies are required to recognize certain costs related to
dismantling assets and remediating sites here such assets are
located. The calculation of expenses are based on the dismantling
value for the current year, taking into consideration the best
estimate of future changes in prices, inflation, etc. and such
costs are capitalized at a risk-free interest rate. Volume
projections for retired or built assets are restated based on
expected changes from technological rulings and requirements.
Additions and recoveries are included in Costs.
(iv)
Provisions for
other contractual liabilities include a series of liabilities
resulting from a contractual liability or laws, regarding which
there is a high degree of certainty as to the terms and the
necessary amounts to discharge such liability. Additions and
recoveries are included in Costs.
(v)
Additions and
recoveries are included in Costs.
F- 139
Cresud Sociedad Anónima,
Comercial, Inmobiliaria, Financiera y Agropecuaria
Notes to the Consolidated
Financial Statements
(Continued)
(All amounts in
millions of Argentine Pesos, except otherwise
indicated)
22.
Provisions
(Continued)
Disclosure of total
provisions is as follows:
|
|
June 30,
2016
|
|
June 30,
2015
|
|
Non-current
|
1,341
|
|
387
|
|
Current
|
1,041
|
|
55
|
|
Total
|
2,382
|
|
442
|
On February 23,
2016, a class action was filed against IRSA, the Company, some
first-line managers and directors with the District Court of the
United States for the Central District of California. The
complaint, on behalf of people holding American Depositary Receipts
of IRSA between November 3, 2014 and December 30, 2015, claims
presumed violations to the US federal securities laws. In addition,
it argues that defendants have made material misrepresentations and
made some omissions related to the IRSA’s investment in
IDBD.
Such complaint was
voluntarily waived on May 4, 2016 by the plaintiff and filed again
on May 9, 2016 with the US District Court by the East District of
Pennsylvania.
Furthermore, the
Company, some of its first-line managers and directors are
defendants in a class action filed on April 29, 2016 with the US
District Court of the East District of Pennsylvania. The complaint,
on behalf of people holding American Depositary Receipts of the
Company between May 13, 2015 and December 30, 2015, claims
violations to the US federal securities laws. In addition, it
argues that defendants have made material misrepresentations and
made some omissions related to the IRSA’s investment in
IDBD.
Subsequently,
Cresud and IRSA requested that the complaint be moved to the
district of New York, which request was later granted.
The Company holds
that such allegations are meritless and intends to make a strong
defense in both actions. No provision was set up in connection with
the above mentioned.
IRSA
CP
On November 20,
2006, the Group, through IRSA CP, acquired through a public bidding
the building known as Exedificio-escuela Gobernador Vicente de
Olmos located in the city of Córdoba for the amount of Ps. 32.
This property is affected to a concession contract.
After the title
deed was made, the government of the province of Córdoba
declared the property to be of public use and subject to partial
expropriation in order to be used exclusively for the Libertador
San Martin Theatre.
F- 140
Cresud Sociedad Anónima,
Comercial, Inmobiliaria, Financiera y Agropecuaria
Notes to the Consolidated
Financial Statements
(Continued)
(All amounts in
millions of Argentine Pesos, except otherwise
indicated)
22.
Provisions
(Continued)
IRSA CP has
answered a complaint in an action and to challenge the law that
declared such public interest on unconstitutional grounds. In the
alternative, it has challenged the appraisal made by the plaintiff
and, additionally, it has claimed damages not included in the
appraisal and resulting immediately and directly from
expropriation.
At June 30, 2016,
the property is recorded under Investment Properties.
Claims
against Cellcom and its subsidiaries
In the normal
course of business, claims have been filed against Cellcom by its
customers. These are mostly motions for approval of class actions,
primarily concerning allegations of illegal collection of funds,
unlawful conduct or Breach of license, or a Breach of agreements
with customers, causing monetary and non
-
monetary damage to
them. The amounts claimed from Cellcom in consumer claims, amounted
to NIS 26,183 million.
Claims
against Shufersal and its subsidiaries
In the normal
course of business, legal claims were filed against Shufersal by
its customers. These are mostly motions for certification of class
actions, which mainly concern claims of changing money unlawfully,
acting contrary to the law or a license, or a Breach of the
agreements with customers, causing financial and non-financial loss
to them. The amounts of the claims amounted to NIS 809
million.
There are also
other claims by employees, subcontractors, suppliers which relate
mainly to claims of Breach of the provisions of the law in relation
to the termination of workers
'
employment and claims of Breaches of contract and compulsory
payments to authorities. The total amount which Shufersal was being
sued for these claims was NIS 26 million.
23.
Borrowings
Group’s
borrowings as of June 30, 2016 and 2015 are as
follows:
|
|
June 30,
2016
|
|
June 30,
2015
|
|
Non-current
|
|
|
|
|
Non-convertible
notes
|
69,997
|
|
5,427
|
|
Bank loans and
others
|
6,836
|
|
406
|
|
Non-recourse
loan
|
16,975
|
|
-
|
|
Non-current
borrowings
|
93,808
|
|
5,833
|
|
Current
|
|
|
|
|
Non-convertible
notes
|
15,595
|
|
636
|
|
Bank loans and
others
|
4,662
|
|
524
|
|
Bank
overdrafts
|
1,397
|
|
1,291
|
|
Other
borrowings
|
1,834
|
|
15
|
|
Current
borrowings
|
23,488
|
|
2,466
|
|
Total
borrowings
|
117,296
|
|
8,299
|
F- 141
Cresud Sociedad Anónima,
Comercial, Inmobiliaria, Financiera y Agropecuaria
Notes to the Consolidated
Financial Statements
(Continued)
(All amounts in
millions of Argentine Pesos, except otherwise
indicated)
23.
Borrowings
(Continued)
Urban
properties and investment business of the operations center in
Argentina
On
March 3, 2016, IRSA and IRSA CP announced that they would launch
offers to buy in cash: (i) 11.50% Class 2 NCN outstanding due in
2020 and issued by IRSA for a total nominal value of up to US$ 76.5
million, subject to a potential extension of the Offer Limit of NCN
due in 2020 for a nominal value of up to US$ 73.5 million, at
IRSA’s exclusive decision, (ii) each and every 8.50% Class 1
NCN outstanding due in 2017 and issued by IRSA, and (iii) each and
every 7.875% Class 1 NCN outstanding due in 2017 and issued by IRSA
CP.
On
March 23, 2016, IRSA CP issued NCN for a nominal amount of US$ 360
million under its Global NCN Program. Class II NCN accrue interest
semi-annually, at an annual fixed rate of 8.75% and are repayable
at maturity on March 23, 2023. The issue price was 98.722% of
nominal value.
IRSA
CP’s NCN maturing in 2023 are subject to certain Commitments,
Events of Breach and Limitations, including Limitations on
Additional Indebtedness, Limitations on Restricted Payments,
Limitations on Transactions with Affiliates, Limitations on the
Merger, Take-over Merger and Limitations on the Sale of all or a
substantial portion of the company’s Assets.
On
April 7, 2016, the Meeting of IRSA's NCN holders approved the
proposed amendments to the IRSA 2017 Trust Indenture, which
included basically the elimination of all financial restrictive
covenants on such class. Approximately 50.30% of holders of NCN due
2017 approved the amendments to the Trust Indenture for IRSA NCN
2017. As a consequence, a Supplementary Trust Agreement with the
Bank of New York Mellon was signed, all amendments approved the
Meeting, which came into force on April 8, 2016.
During
March, April and May the Group acquired all IRSA CP's NCN Class I
at 7.875% maturing in 2017 for a total amount US$ 120 million and
US$ 75.4 million of IRSA’S NCN. On October 11, 2016 IRSA,
acquired the remaining US$ 74.6 million of IRSA’S NCN at 8.5%
maturing in 2017, so the following notes remains
outstanding:
●
IRSA's
NCN Class II at 11.50% maturing in 2020 US$ 71.4
million.
Such
payments were accounted for as a cancellation of debt.
In
relation to financial covenants under 11.50% NCN due in 2020 issued
by IRSA, the Meeting of Noteholders held on March 23, 2016
approved:
i.
to
modify the covenant on Limitation on Restricted Payments, so that
the original covenant was replaced so as to take into consideration
IRSA’s capability to make any restricted payment provided
that (a) no Event of Default has occurred and persisted, and (b)
IRSA may incur at least US$ 1 of additional debt pursuant to the
Limitation on Additional Indebtedness; and
F- 142
Cresud Sociedad Anónima,
Comercial, Inmobiliaria, Financiera y Agropecuaria
Notes to the Consolidated
Financial Statements
(Continued)
(All amounts in
millions of Argentine Pesos, except otherwise
indicated)
23.
Borrowings
(Continued)
ii.
the
exclusion of IDBD or any of its subsidiaries for purposes of the
definition of “Subsidiary” or any of the definitions or
commitments under the Trust Indenture of Corporate Notes due in
2020 and issued by IRSA (regardless of whether the financial
statements of any of these companies has any time been consolidated
into IRSA’s financial statements).
iii.
a
Supplementary Trust Indenture reflecting all the amendments
approved, entered into with the Bank of New York Mellon on March
28, 2016.
Urban
properties and investment business of the operations center in
Israel
IDBD
has certain restrictions and financial covenants in connection with
its financial debt, included in its debentures, loans from banks
and financial institutions.
As
of June 30, 2016 IDBD reported that the application of the
“Liquidity Covenant” and the “Economic Equity
Covenant” (as described below) is currently
suspended.
It
was agreed between IDBD and the relevant lending coporations that
the parties would work to formulate an arrangement, to replace or
amend the current financial covenants by December 31,
2016.
If
such arrangement is not reached, the previous financial covenants
will re-apply then with respect to the results for IDBD´s
first quarter of 2017 and thereafter. In the event that these
covenants will re-apply, IDBD estimates that it will not be able to
meet the thresholds that were determined in the past with respect
to the Liquidity Covenant and the Economic Equity Covenant with
respect to IDBD´s results for the first quarter of 2017 and
thereafter.
Particularly,
if the previous financial covenants will re-apply, IDBD estimates
it will not be able to fulfill the covenant, which stipulates that
the balance of cash and marketable securities will not fall below
the scope of forecasted current maturities for the two quarters
subsequent to the reporting quarter (the “Liquidity
Covenant”). Regarding the Economic Equity Covenant, the
economic equity as of June 30, 2016, amounted to a positive balance
of NIS 247 million, significantly lower than the thresholds
determined in the past, as part of to the Economic Equity
Covenant.
In
view of and due to the decrease of Mr. Ben Moshe’s holding
rate in IDBD, beginning from February 2015 and thereafter, in March
2016 IDBD reached understandings with its lending corporations with
regard to an amendment of the control and additional amendments
relating to restrictions on the sale of main holdings.
F- 143
Cresud Sociedad Anónima,
Comercial, Inmobiliaria, Financiera y Agropecuaria
Notes to the Consolidated
Financial Statements
(Continued)
(All amounts in
millions of Argentine Pesos, except otherwise
indicated)
23.
Borrowings
(Continued)
As per IDBD´s
position, as of June 30, 2016
,
there were no
conditions that
established
grounds
for calling
IDBD´s obligations to
its
financial creditors
for immediate payment. Without
derogating from the IDBD´s
position,
it is noted that the decision of
the
bondholders (Series I)
dated April 21,2016 to call
the
full balance of IDBD´s
debt
to the bondholders for immediate
repayment
and the
decision to
take
steps for
dissolution are
liable to raise grounds for the financial creditors, for calling
for immediate repayment. According to IDBD’s legal advisor
opinion
, the conditions
giving
rise to a ground for demanding immediate repayment
of the
liabilities for the (Series I) bonds
were not fulfilled
. On
July 18, 2016, the Court
handed
down its judgment, in which the Court accepted the consensus motion
filed by
the trustee to strike
the motion for dissolution.
As
of June 30, 2016, IDBD´s loans which are subject to the
aforementioned financial covenants, at a scope of NIS 264 million,
were classified under current liabilities, in consideration of the
fact that IDBD has reached understandings with those relevant
lending entities, which extended the arrangements specified in the
financial covenants of the loan agreements until first quarter
calendar year 2017 only, in other words, for a period shorter than
twelve months.
.
On
August 2, 2016 IDBD issued a new Series of Debentures in the
Israeli market for an amount of NIS 325 million due November 2019
at an annual interest rate adjustable by CPI plus 4.25%. The notes
are pledged by shares of Clal Insurance Enterprise Holdings Ltd
(“Clal”), subject to the approval of the Commissioner
of Capital Markets, Insurance and Savings. IDBD is working to get
the authorization to constitute the guarantee and it filed an
application to the Supreme Court asking for such approval. In case
IDBD does not get the required approval, funds must be repaid with
interest plus a penalty. On September 15, 2016, the High Court of
Justice gave a partial judgment and decision, according to which it
was decided, to reject the petition for the most part and to grant
an order which instructs the Commissioner to appear and show a
reason for her opposition to the request of IDBD to pledge up to 5%
of the shares of Clal Holdings, subject to an outline agreed to at
the time by the IDBD. Furthermore, IDBD maintains the right to
accede to a proposal for compromise which was raised in the context
of the discussion. A hearing date was set for January
2017.
F- 144
Cresud Sociedad Anónima,
Comercial, Inmobiliaria, Financiera y Agropecuaria
Notes to the Consolidated
Financial Statements
(Continued)
(All amounts in
millions of Argentine Pesos, except otherwise
indicated)
23.
Borrowings
(Continued)
Pursuant
to the decision of the Supreme Court sitting as the High Court of
Justice in connection with the petition submitted by IDBD in
connection with the pledge of the shares of Clal Holdings in
September 2016, on October 13, 2016, the Board of Directors of the
IDBD decided to execute a partial early redemption of the
debentures, that is to be carried out on November 1, 2016, as
follows:
●
IDBD will carry out a partial early redemption of
the debentures in an amount of approximately NIS 239 million of par
value (“the redeemed portion”) and in a total of
approximately NIS 244 million with respect to principal, interest
and compensation for the redeemed portion.
●
The determining date for the eligibility to
receive the early redemption of the principal of the debentures is
10.25.2016.
●
The early redemption represents 73.7% of the
unpaid balance of the principal of the debentures, which is also
the original balance of the series of the
debentures.
●
The rate of interest (including the compensation
for carrying out the early redemption as an increment of 3% with
respect to the period from August 3, 2016 through October 21 2016)
that will be paid upon the partial early redemption of the redeemed
portion of the principal is approximately 1.8%.
●
The rate of interest (including the compensation
for carrying out the early redemption as an increment of 3% with
respect to the period from August 3, 2016 through October 31 2016)
that will be paid in the context of the early redemption, which is
calculated out of the balance of the unpaid balance of the
principal on the date of the early redemption (NIS 325 million
linked to the CPI) is approximately 1.3%.
●
Pursuant to the “known” CPI (index
with respect to the month of September 2016, which was published on
10.14.2016) as compared with the base index published with respect
to the month of June 2016, no linkage increments will apply with
respect to the redeemed portion upon early
redemption.
●
The unpaid balance of the principal of the
debentures after executing the early redemption (without linkage)
will stand at an amount of approximately NIS 86 million par value,
which represents approximately 26.3%, of the original balance of
the principal of the debentures. IDBD will act to pledge the shares
of Clal Holdings against the balance of the unpaid principal of the
debentures after carrying out the early redemption ( as is required
according to the trust indenture).
●
Pursuant to what is stated in the trust indenture,
the redeemed portion will be paid in relation to all of the holders
of the debentures, pro- rata according to the par value of the held
debentures.
IDBD
is continuing to act in order to reach consents with the relevant
financing corporations in order to arrange over time the calculated
financial covenants that were determined in the provisions of its
loan agreements, and additional contractual issues that exist in
the loan agreements.
F- 145
Cresud Sociedad Anónima,
Comercial, Inmobiliaria, Financiera y Agropecuaria
Notes to the Consolidated
Financial Statements
(Continued)
(All amounts in
millions of Argentine Pesos, except otherwise
indicated)
23.
Borrowings
(Continued)
The breakdown of
the borrowings of Operations Centers by Company as of June 30, 2016
was as follows:
|
|
|
|
Agricultural business
|
|
Urban
properties and investments business
|
|
|
|||||||||||||||
|
|
|
|
|
|
Operations Center in Argentina
|
|
Operations Center in Israel
|
|
|
|
|
|||||||||||
|
Debt
|
|
Cresud
|
BrasilAgro
|
Others
|
Subtotal
|
|
IRSA
|
IRSA CP
|
Others
|
Subtotal
Operations Center in Argentina
|
|
IDBD
|
DIC
|
Shufersal
|
Cellcom
|
PBC
|
Others
|
Subtotal
Operations Center in Israel
|
|
Subtotal
|
|
Total
|
|
Non-convertible
notes
|
|
3,283
|
-
|
-
|
3,283
|
|
2,287
|
5,799
|
-
|
8,086
|
|
7,807
|
12,436
|
10,037
|
15,277
|
28,666
|
-
|
74,223
|
|
82,309
|
|
85,592
|
|
Bank loans and
others
|
|
452
|
452
|
15
|
919
|
|
16
|
55
|
130
|
201
|
|
2,214
|
1,171
|
16
|
779
|
2,003
|
4,195
|
10,378
|
|
10,579
|
|
11,498
|
|
Non-recourse
loan
|
|
-
|
-
|
-
|
-
|
|
-
|
-
|
-
|
-
|
|
-
|
(i)
10,999
|
-
|
-
|
5,976
|
-
|
16,975
|
|
16,975
|
|
16,975
|
|
Bank
overdrafts
|
|
114
|
-
|
47
|
161
|
|
859
|
40
|
45
|
944
|
|
-
|
-
|
-
|
-
|
-
|
292
|
292
|
|
1,236
|
|
1,397
|
|
Other
borrowings
|
|
-
|
-
|
-
|
-
|
|
-
|
-
|
-
|
-
|
|
-
|
-
|
-
|
-
|
-
|
1,834
|
1,834
|
|
1,834
|
|
1,834
|
|
Total
debt
|
|
3,849
|
452
|
62
|
4,363
|
|
3,162
|
5,894
|
175
|
9,231
|
|
10,021
|
24,606
|
10,053
|
16,056
|
36,645
|
6,321
|
103,702
|
|
112,933
|
|
117,296
|
(i) IDBD has a
non-recourse loan, which was split into two components on the basis
of an independent appraiser’s report. The commitment to
transfer shares represents the main contract and was initially
recognized at fair value and, later, at its depreciated cost. The
derivative embedded represents a call option and is computed taking
into account future payments of interest on the loan. The main
contract and the embedded derivative ("non-recourse loan ") are
disclosed net in borrowings.
F- 146
Cresud Sociedad Anónima,
Comercial, Inmobiliaria, Financiera y Agropecuaria
Notes to the Consolidated
Financial Statements
(Continued)
(All amounts in
millions of Argentine Pesos, except otherwise
indicated)
23.
Borrowings
(Continued)
|
|
Agricultural business
|
||||||||||||||||||||
|
|
Company
|
|
Secure
/ Unsecure
|
|
Series
|
|
Currency
|
|
Rate
|
|
Adjustment factor
|
|
Payment date of principal
|
|
Interest
rate %
|
|
Capital nominal value in million
Issue currency
|
|
Value as of
June 30,
2016
|
|
Value as of
June 30,
2015
|
|
Non-convertible notes
|
Cresud
|
|
Unsecured
|
|
XIV
|
|
US$
|
|
Fixed
|
|
N/A
|
|
2018
|
|
1.50%
|
|
64
|
|
482
|
|
290
|
|
|
Cresud
|
|
Unsecured
|
|
XV
|
|
Ps.
|
|
Floating
|
|
N/A
|
|
2015
|
|
23.63%
|
|
176
|
|
-
|
|
121
|
|
|
Cresud
|
|
Unsecured
|
|
XVI
|
|
US$
|
|
Fixed
|
|
N/A
|
|
2018
|
|
1.50%
|
|
218
|
|
1,446
|
|
1,004
|
|
|
Cresud
|
|
Unsecured
|
|
XVII
|
|
Ps.
|
|
Floating
|
|
N/A
|
|
2016
|
|
Badlar
+ 375 bp.
|
|
171
|
|
-
|
|
172
|
|
|
Cresud
|
|
Unsecured
|
|
XVIII
|
|
US$
|
|
Fixed
|
|
N/A
|
|
2019
|
|
4.00%
|
|
68
|
|
512
|
|
309
|
|
|
Cresud
|
|
Unsecured
|
|
XIX
|
|
Ps.
|
|
Fixed
|
|
N/A
|
|
2016
|
|
27.50%
|
|
187
|
|
189
|
|
187
|
|
|
Cresud
|
|
Unsecured
|
|
XX
|
|
US$
|
|
Fixed
|
|
N/A
|
|
2019
|
|
2.50%
|
|
36
|
|
123
|
|
56
|
|
|
Cresud
|
|
Unsecured
|
|
XXI
|
|
Ps.
|
|
Floating
|
|
N/A
|
|
2017
|
|
Badlar
+ 375 bp.
|
|
384
|
|
197
|
|
-
|
|
|
Cresud
|
|
Unsecured
|
|
XXII
|
|
US$
|
|
Fixed
|
|
N/A
|
|
2019
|
|
4.00%
|
|
44
|
|
334
|
|
-
|
|
Subtotal
Non-convertible notes
|
|
|
|
|
|
|
|
|
|
|
|
|
|
|
|
|
|
|
3,283
|
|
2,139
|
|
|
|
|
|
|
|
|
|
|
|
|
|
|
|
|
|
|
|
|
|
|
|
|
Bank
loans and others
|
Cresud
|
|
Unsecured
|
|
-
|
|
US$
|
|
Floating
|
|
N/A
|
|
2022
|
|
Libor
+ 300 BP or 6% (the higher)
|
|
30
|
|
200
|
|
128
|
|
|
Cresud
|
|
Unsecured
|
|
-
|
|
Ps.
|
|
Fixed
|
|
N/A
|
|
2016
|
|
15.01%
|
|
31
|
|
17
|
|
7
|
|
|
Cresud
|
|
Unsecured
|
|
-
|
|
Ps.
|
|
Floating
|
|
TEPF
|
|
2017
|
|
Rate
Survey PF 30-59 days
|
|
40
|
|
11
|
|
19
|
|
|
Cresud
|
|
Unsecured
|
|
-
|
|
US$
|
|
Fixed
|
|
N/A
|
|
-
|
|
3.50%
|
|
15
|
|
225
|
|
-
|
|
|
Cresud
|
|
Secured
|
|
-
|
|
US$
|
|
Fixed
|
|
N/A
|
|
2020
|
|
10.75%
- 7.14% to 14.5%
|
|
6
|
|
1
|
|
1
|
|
|
BrasilAgro
|
|
Secured
|
|
-
|
|
Rs.
|
|
Floating
|
|
TJLP
|
|
-
|
|
TJLP
+ 3 to 4.40
|
|
-
|
|
7
|
|
10
|
|
|
BrasilAgro
|
|
Secured
|
|
-
|
|
Rs.
|
|
Floating
|
|
TJLP
|
|
-
|
|
TJLP
+ 3.45 to 4.45 SELIC + 3.45
|
|
-
|
|
211
|
|
184
|
|
|
BrasilAgro
|
|
Secured
|
|
-
|
|
Rs.
|
|
Floating
|
|
N/A
|
|
-
|
|
7.51
to 15.12
|
|
-
|
|
130
|
|
75
|
|
|
BrasilAgro
|
|
Secured
|
|
-
|
|
Rs.
|
|
Floating
|
|
TJLP
|
|
-
|
|
TJLP
+ 5.50 to 8.70
|
|
-
|
|
-
|
|
3
|
|
|
BrasilAgro
|
|
Unsecured
|
|
-
|
|
Rs.
|
|
Fixed
|
|
N/A
|
|
-
|
|
6.92%
|
|
-
|
|
21
|
|
22
|
|
|
BrasilAgro
|
|
Secured
|
|
-
|
|
Rs.
|
|
Floating
|
|
N/A
|
|
-
|
|
100%
CDI
|
|
-
|
|
82
|
|
86
|
|
|
BrasilAgro
|
|
Secured
|
|
-
|
|
Rs.
|
|
Floating
|
|
N/A
|
|
-
|
|
1.6905
+ Exchange rate variation
|
|
-
|
|
-
|
|
29
|
|
|
BrasilAgro
|
|
Secured
|
|
-
|
|
Rs.
|
|
Floating
|
|
N/A
|
|
-
|
|
IGP-M
|
|
-
|
|
-
|
|
58
|
|
|
Doneldon
|
|
Secured
|
|
-
|
|
Bol.
|
|
Fixed
|
|
N/A
|
|
-
|
|
6%
annual
|
|
-
|
|
11
|
|
-
|
|
|
Doneldon
|
|
Secured
|
|
-
|
|
Bol.
|
|
Fixed
|
|
N/A
|
|
-
|
|
7%
- 10.19%
|
|
14
|
|
-
|
|
3
|
|
|
Carnes
Pampeanas
|
|
Secured
|
|
-
|
|
Ps.
|
|
Floating
|
|
N/A
|
|
-
|
|
6%
annual
|
|
-
|
|
3
|
|
-
|
|
Subtotal
bank loans and others
|
|
|
|
|
|
|
|
|
|
|
|
|
|
|
|
|
|
|
919
|
|
625
|
|
Bank
overdrafts
|
|
|
|
|
|
|
|
|
|
|
|
|
|
|
|
|
|
|
161
|
|
609
|
|
Total
|
|
|
|
|
|
|
|
|
|
|
|
|
|
|
|
|
|
|
4,363
|
|
3,373
|
F- 147
Cresud Sociedad Anónima,
Comercial, Inmobiliaria, Financiera y Agropecuaria
Notes to the Consolidated
Financial Statements
(Continued)
(All amounts in
millions of Argentine Pesos, except otherwise
indicated)
23.
Borrowings
(Continued)
|
|
Operations Center in Argentina
|
|||||||||||||||||
|
|
Company
|
|
Secure
/ Unsecure
|
|
Series / Class
|
|
Currency
|
|
Rate
|
|
Payment date of principal
|
|
Interest
rate %
|
|
Capital nominal value in million
Issue currency
|
|
Value as of
June 30,
2016
|
Value as of
June 30,
2015
|
|
Non-convertible notes
|
IRSA
CP
|
|
Unsecured
|
|
Class
I
|
|
Ps.
|
|
Fixed
/ Floating
|
|
2017
|
|
Badlar
+ 4 bp.
|
|
407
|
|
409
|
-
|
|
|
IRSA
CP
|
|
Unsecured
|
|
Class
II
|
|
US$
|
|
Fixed
|
|
2023
|
|
8.75%
|
|
360
|
|
5,273
|
-
|
|
|
IRSA
CP
|
|
Unsecured
|
|
Series
I
|
|
US$
|
|
Fixed
|
|
2017
|
|
7.88%
|
|
-
|
|
-
|
1,034
|
|
|
IRSA
|
|
Unsecured
|
|
Class
I
|
|
US$
|
|
Fixed
|
|
2017
|
|
8.50%
|
|
75
|
|
1,159
|
1,401
|
|
|
IRSA
|
|
Unsecured
|
|
Class
VI
|
|
Ps.
|
|
Floating
|
|
2017
|
|
Badlar
+ 450bps
|
|
11
|
|
127
|
11
|
|
|
IRSA
|
|
Unsecured
|
|
Class
V
|
|
Ps.
|
|
Floating
|
|
2015
|
|
Badlar
+ 395ps
|
|
-
|
|
-
|
214
|
|
|
IRSA
|
|
Unsecured
|
|
Class
II
|
|
US$
|
|
Fixed
|
|
2020
|
|
11.50%
|
|
75
|
|
1,118
|
1,265
|
|
Total
Non-convertible notes
|
|
|
|
|
|
|
|
|
|
|
|
|
|
|
|
|
8,086
|
3,925
|
|
|
|
|
|
|
|
|
|
|
|
|
|
|
|
|
|
|
|
|
|
Bank
loans
|
IRSA
|
|
Secured
|
|
-
|
|
US$
|
|
Fixed
|
|
2020
|
|
3.2%
to 14.3%
|
|
1
|
|
1
|
-
|
|
and
others
|
IRSA
|
|
Unsecured
|
|
-
|
|
Ps.
|
|
Floating
|
|
2017
|
|
Badlar
|
|
15
|
|
14
|
14
|
|
|
IRSA
CP
|
|
Secured
|
|
-
|
|
US$
|
|
Fixed
|
|
2020
|
|
3.2%
to 14.3%
|
|
-
|
|
5
|
3
|
|
|
IRSA
CP
|
|
Unsecured
|
|
-
|
|
Ps.
|
|
Fixed
|
|
2016
|
|
15.25%
|
|
1
|
|
1
|
4
|
|
|
IRSA
CP
|
|
Unsecured
|
|
-
|
|
Ps.
|
|
Fixed
|
|
2017
|
|
26.50%
|
|
7
|
|
7
|
10
|
|
|
IRSA
CP
|
|
Unsecured
|
|
-
|
|
Ps.
|
|
Fixed
|
|
2016
|
|
23%
|
|
36
|
|
36
|
106
|
|
|
IRSA
CP
|
|
Unsecured
|
|
-
|
|
Ps.
|
|
Fixed
|
|
2015
/ 2016
|
|
15.25%
/ 15.01%
|
|
-
|
|
-
|
75
|
|
|
IRSA
CP
|
|
Unsecured
|
|
-
|
|
Ps.
|
|
Fixed
/ Floating
|
|
2016
|
|
Badlar
/ 8.50%
|
|
6
|
|
6
|
8
|
|
|
HASA
|
|
Unsecured
|
|
-
|
|
Ps.
|
|
Fixed
|
|
2016
|
|
15.25%
|
|
6
|
|
6
|
4
|
|
|
LLAO
LLAO
|
|
Unsecured
|
|
-
|
|
Ps.
|
|
Fixed
|
|
2016
|
|
15.25%
|
|
1
|
|
1
|
3
|
|
|
NFSA
|
|
Unsecured
|
|
-
|
|
Ps.
|
|
Fixed
|
|
2016
|
|
24%
|
|
6
|
|
6
|
7
|
|
|
LIVECK
|
|
Secured
|
|
-
|
|
US$
|
|
Fixed
|
|
2017
|
|
n/a
|
|
2
|
|
35
|
21
|
|
|
LIVECK
|
|
Secured
|
|
-
|
|
US$
|
|
Fixed
|
|
n/a
|
|
3.50%
|
|
5
|
|
83
|
50
|
|
Total
bank loans and others
|
|
|
|
|
|
|
|
|
|
|
|
|
|
|
|
|
201
|
305
|
|
Other
borrowings
|
|
|
|
|
|
|
|
|
|
|
|
|
|
|
|
|
-
|
15
|
|
Bank
overdrafts
|
|
|
|
|
|
|
|
|
|
|
|
|
|
|
|
|
944
|
682
|
|
Subtotal
Operations Center in Argentina
|
|
|
|
|
|
|
|
|
|
|
|
|
|
|
|
|
9,231
|
4,927
|
F- 148
Cresud Sociedad Anónima,
Comercial, Inmobiliaria, Financiera y Agropecuaria
Notes to the Consolidated
Financial Statements
(Continued)
(All amounts in
millions of Argentine Pesos, except otherwise
indicated)
23.
Borrowings
(Continued)
|
|
Operations Center in Israel
|
||||||||||||||||||
|
|
Company
|
|
Secure
/ Unsecure
|
|
Series
|
|
Currency
|
|
Rate
|
|
Adjustment factor
|
|
Payment date of principal
|
|
Interest
rate %
|
|
Capital nominal value in million
Issue currency
|
|
Value as of
June 30,
2016
|
|
|
IDBD
|
|
Unsecured
|
|
G
|
|
NIS
|
|
Fixed
|
|
CPI
|
|
2016
– 2018
|
|
4.50%
|
|
802
|
|
3,534
|
|
Non-convertible notes
|
IDBD
|
|
Unsecured
|
|
I
|
|
NIS
|
|
Fixed
|
|
CPI
|
|
2020
– 2025
|
|
4.95%
|
|
1,013
|
|
3,164
|
|
|
IDBD
|
|
Unsecured
|
|
J
|
|
NIS
|
|
Fixed
|
|
N/A
|
|
2015
– 2018
|
|
6.60%
|
|
309
|
|
1,109
|
|
|
|
|
|
|
|
|
|
|
|
|
|
|
|
|
|
|
|
|
|
|
|
DIC
|
|
Unsecured
|
|
D
|
|
NIS
|
|
Fixed
|
|
CPI
|
|
2012
– 2016
|
|
5.00%
|
|
103
|
|
510
|
|
|
DIC
|
|
Unsecured
|
|
F
|
|
NIS
|
|
Fixed
|
|
CPI
|
|
2017
– 2025
|
|
4.95%
|
|
2,719
|
|
9,427
|
|
|
DIC
|
|
Unsecured
|
|
G
|
|
NIS
|
|
Fixed
|
|
N/A
|
|
2012
– 2016
|
|
6.35%
|
|
8
|
|
31
|
|
|
DIC
|
|
Unsecured
|
|
H
|
|
NIS
|
|
Fixed
|
|
CPI
|
|
2014
– 2019
|
|
4.45%
|
|
124
|
|
541
|
|
|
DIC
|
|
Unsecured
|
|
I
|
|
NIS
|
|
Fixed
|
|
N/A
|
|
2010
– 2018
|
|
6.70%
|
|
513
|
|
1,927
|
|
|
|
|
|
|
|
|
|
|
|
|
|
|
|
|
|
|
|
|
|
|
|
Shufersal
|
|
Unsecured
|
|
B
|
|
NIS
|
|
Fixed
|
|
CPI
|
|
2015
– 2019
|
|
5.20%
|
|
1,024
|
|
5,161
|
|
|
Shufersal
|
|
Unsecured
|
|
C
|
|
NIS
|
|
Fixed
|
|
N/A
|
|
2010
– 2017
|
|
5.45%
|
|
114
|
|
459
|
|
|
Shufersal
|
|
Unsecured
|
|
D
|
|
NIS
|
|
Fixed
|
|
CPI
|
|
2014
– 2029
|
|
2.99%
|
|
413
|
|
1,584
|
|
|
Shufersal
|
|
Unsecured
|
|
G
|
|
NIS
|
|
Fixed
|
|
N/A
|
|
2014
– 2029
|
|
5.09%
|
|
392
|
|
1,580
|
|
|
Shufersal
|
|
Unsecured
|
|
F
|
|
NIS
|
|
Fixed
|
|
CPI
|
|
2020
– 2028
|
|
4.30%
|
|
317
|
|
1,253
|
|
|
|
|
|
|
|
|
|
|
|
|
|
|
|
|
|
|
|
|
|
|
|
Cellcom
|
|
Unsecured
|
|
B
|
|
NIS
|
|
Fixed
|
|
CPI
|
|
2013
– 2017
|
|
5.30%
|
|
185
|
|
880
|
|
|
Cellcom
|
|
Unsecured
|
|
D
|
|
NIS
|
|
Fixed
|
|
CPI
|
|
2013
– 2017
|
|
5.19%
|
|
599
|
|
2,865
|
|
|
Cellcom
|
|
Unsecured
|
|
E
|
|
NIS
|
|
Fixed
|
|
N/A
|
|
2012
– 2017
|
|
6.25%
|
|
164
|
|
673
|
|
|
Cellcom
|
|
Unsecured
|
|
F
|
|
NIS
|
|
Fixed
|
|
CPI
|
|
2017
– 2020
|
|
4.60%
|
|
715
|
|
3,032
|
|
|
Cellcom
|
|
Unsecured
|
|
G
|
|
NIS
|
|
Fixed
|
|
N/A
|
|
2017
– 2019
|
|
6.99%
|
|
285
|
|
1,230
|
|
|
Cellcom
|
|
Unsecured
|
|
H
|
|
NIS
|
|
Fixed
|
|
CPI
|
|
2018
– 2024
|
|
1.98%
|
|
950
|
|
3,483
|
|
|
Cellcom
|
|
Unsecured
|
|
I
|
|
NIS
|
|
Fixed
|
|
N/A
|
|
2018
– 2025
|
|
4.14%
|
|
804
|
|
3,114
|
|
|
|
|
|
|
|
|
|
|
|
|
|
|
|
|
|
|
|
|
|
|
|
PBC
|
|
Unsecured
|
|
C
|
|
NIS
|
|
Fixed
|
|
CPI
|
|
2009
– 2017
|
|
5%
|
|
550
|
|
2,666
|
|
|
PBC
|
|
Unsecured
|
|
D
|
|
NIS
|
|
Fixed
|
|
CPI
|
|
2020
– 2025
|
|
4.95%
|
|
1,317
|
|
6,641
|
|
|
PBC
|
|
Unsecured
|
|
F
|
|
NIS
|
|
Fixed
|
|
CPI
|
|
2015
– 2023
|
|
4.95%
|
|
974
|
|
4,195
|
|
|
PBC
|
|
Unsecured
|
|
G
|
|
NIS
|
|
Fixed
|
|
N/A
|
|
2015
– 2025
|
|
7.05%
|
|
669
|
|
3,054
|
|
|
PBC
|
|
Unsecured
|
|
Gav-Yam
Series E
|
|
NIS
|
|
Fixed
|
|
CPI
|
|
2014
– 2018
|
|
4.55%
|
|
283
|
|
1,375
|
|
|
PBC
|
|
Unsecured
|
|
Gav-Yam
Series F
|
|
NIS
|
|
Fixed
|
|
CPI
|
|
2021
– 2026
|
|
4.75%
|
|
1,226
|
|
8,535
|
|
|
PBC
|
|
Unsecured
|
|
Gav-Yam
Series G
|
|
NIS
|
|
Fixed
|
|
N/A
|
|
2013
– 2017
|
|
6.41%
|
|
215
|
|
907
|
|
|
PBC
|
|
Unsecured
|
|
Ispro
Series B
|
|
NIS
|
|
Fixed
|
|
CPI
|
|
2007
– 2021
|
|
5.40%
|
|
255
|
|
1,293
|
|
Total
Non-convertible notes
|
|
|
|
|
|
|
|
|
|
|
|
|
|
|
|
|
|
|
74,223
|
|
|
|
|
|
|
|
|
|
|
|
|
|
|
|
|
|
|
|
|
|
|
Bank
loans
|
IDBD
|
|
Unsecured
(1)
|
|
-
|
|
NIS
|
|
Floating
|
|
Prime
interest rate
|
|
2015
– 2018
|
|
Prime
+ 1.3%
|
|
333
|
|
1,117
|
|
and
others
|
IDBD
|
|
Unsecured
(1)
|
|
-
|
|
NIS
|
|
Floating
|
|
Prime
interest rate
|
|
2015
– 2019
|
|
Prime
+ 1%
|
|
80
|
|
265
|
|
|
IDBD
|
|
Unsecured
|
|
-
|
|
NIS
|
|
Floating
|
|
Prime
interest rate
|
|
2015
– 2020
|
|
Prime
+ 0.65%
|
|
63
|
|
198
|
|
|
IDBD
|
|
Secured
(2)
|
|
-
|
|
NIS
|
|
Fixed
|
|
CPI
|
|
2015
– 2018
|
|
6.90%
|
|
150
|
|
634
|
|
|
|
|
|
|
|
|
|
|
|
|
|
|
|
|
|
|
|
|
|
|
|
DIC
|
|
Unsecured
|
|
-
|
|
NIS
|
|
Fixed
|
|
N/A
|
|
2015
– 2017
|
|
5.39%
|
|
45
|
|
167
|
|
|
DIC
|
|
Unsecured
|
|
-
|
|
NIS
|
|
Floating
|
|
Prime
interest rate
|
|
2015
– 2018
|
|
2.12%
|
|
111
|
|
397
|
|
|
DIC
|
|
Unsecured
|
|
-
|
|
NIS
|
|
Fixed
|
|
N/A
|
|
2015
– 2018
|
|
5.90%
|
|
86
|
|
311
|
|
|
DIC
|
|
Unsecured
|
|
-
|
|
NIS
|
|
Fixed
|
|
Prime
interest rate
|
|
2015
– 2018
|
|
2.20%
|
|
86
|
|
296
|
|
|
|
|
|
|
|
|
|
|
|
|
|
|
|
|
|
|
|
|
|
|
|
Shufersal
|
|
Secured
|
|
-
|
|
NIS
|
|
Fixed
|
|
CPI
|
|
2015
– 2017
|
|
4.95%
|
|
1
|
|
4
|
|
|
Shufersal
|
|
Secured
|
|
-
|
|
NIS
|
|
Fixed
|
|
CPI
|
|
2015
– 2017
|
|
4.95%
|
|
1
|
|
3
|
|
|
Shufersal
|
|
Secured
|
|
|
|
NIS
|
|
Fixed
|
|
CPI
|
|
2015
– 2017
|
|
4.75%
|
|
-
|
|
2
|
|
|
Shufersal
|
|
Secured
|
|
-
|
|
NIS
|
|
Fixed
|
|
CPI
|
|
2015
– 2017
|
|
4.40%
|
|
-
|
|
2
|
|
|
Shufersal
|
|
Secured
|
|
-
|
|
NIS
|
|
Fixed
|
|
CPI
|
|
2015
– 2017
|
|
3.25%
|
|
1
|
|
5
|
F- 149
Cresud Sociedad Anónima,
Comercial, Inmobiliaria, Financiera y Agropecuaria
Notes to the Consolidated
Financial Statements
(Continued)
(All amounts in
millions of Argentine Pesos, except otherwise
indicated)
23.
Borrowings
(Continued)
|
|
Company
|
|
Secure
/ Unsecure
|
|
Series
|
|
Currency
|
|
Rate
|
|
Adjustment factor
|
|
Payment date of principal
|
|
Interest rate %
|
|
Capital nominal value in million
Issue currency
|
|
Value as of
June 30,
2016
|
|
|
|
|
|
|
|
|
|
|
|
|
|
|
|
|
|
|
|
|
|
|
|
PBC
|
|
Unsecured
|
|
-
|
|
NIS
|
|
Floating
|
|
CPI
|
|
2015
– 2020
|
|
1.97%
|
|
40
|
|
154
|
|
|
PBC
|
|
Unsecured
|
|
-
|
|
NIS
|
|
Floating
|
|
CPI
|
|
2020
|
|
2.65%
|
|
83
|
|
311
|
|
|
PBC
|
|
Unsecured
|
|
-
|
|
NIS
|
|
Fixed
|
|
N/A
|
|
2015
– 2020
|
|
3.07%
|
|
19
|
|
76
|
|
|
PBC
|
|
Unsecured
|
|
-
|
|
NIS
|
|
Fixed
|
|
N/A
|
|
2016
|
|
1.70%
|
|
301
|
|
1,176
|
|
|
PBC
|
|
Secured
|
|
-
|
|
NIS
|
|
Floating
|
|
CPI
|
|
2011
– 2018
|
|
1.55%
|
|
69
|
|
286
|
|
|
PBC
|
|
Unsecured
|
|
-
|
|
NIS
|
|
Floating
|
|
CPI
|
|
2002
– 2019
|
|
1.73%
|
|
62
|
|
327
|
|
|
PBC
|
|
Secured
|
|
-
|
|
NIS
|
|
Floating
|
|
CPI
|
|
2008
– 2016
|
|
1.95%
|
|
7
|
|
32
|
|
|
PBC
|
|
Secured
|
|
-
|
|
NIS
|
|
Floating
|
|
CPI
|
|
2015
– 2023
|
|
1.87%
|
|
106
|
|
409
|
|
|
PBC
|
|
Secured
|
|
-
|
|
NIS
|
|
Floating
|
|
CPI
|
|
2014
– 2022
|
|
1.77%
|
|
83
|
|
323
|
|
|
PBC
|
|
Secured
|
|
-
|
|
NIS
|
|
Floating
|
|
CPI
|
|
2013
– 2021
|
|
1.87%
|
|
55
|
|
219
|
|
|
PBC
|
|
Secured
|
|
-
|
|
NIS
|
|
Floating
|
|
CPI
|
|
2015
– 2022
|
|
1.86%
|
|
42
|
|
165
|
|
|
PBC
|
|
Secured
|
|
-
|
|
NIS
|
|
Floating
|
|
CPI
|
|
2011
– 2019
|
|
1.26%
|
|
36
|
|
149
|
|
|
PBC
|
|
Secured
|
|
-
|
|
NIS
|
|
Floating
|
|
CPI
|
|
2009
– 2017
|
|
1.80%
|
|
8
|
|
36
|
|
|
PBC
|
|
Secured
|
|
-
|
|
NIS
|
|
Floating
|
|
CPI
|
|
2022
|
|
1.88%
|
|
93
|
|
366
|
|
|
PBC
|
|
Secured
|
|
-
|
|
NIS
|
|
Fixed
|
|
N/A
|
|
2016
– 2016
|
|
1.26%
|
|
40
|
|
156
|
|
|
PBC
|
|
Secured
|
|
-
|
|
NIS
|
|
Floating
|
|
CPI
|
|
2015
– 2020
|
|
1.57%
|
|
22
|
|
85
|
|
|
PBC
|
|
Secured
|
|
-
|
|
NIS
|
|
Floating
|
|
CPI
|
|
2020
|
|
2.14%
|
|
50
|
|
188
|
|
|
PBC
|
|
Unsecured
|
|
-
|
|
NIS
|
|
Floating
|
|
CPI
|
|
2009
– 2016
|
|
12.16%
|
|
3
|
|
11
|
|
|
|
|
|
|
|
|
|
|
|
|
|
|
|
|
|
|
|
|
|
|
|
Bartan
|
|
Unsecured
|
|
-
|
|
NIS
|
|
Floating
|
|
Prime
interest rate
|
|
2015
– 2022
|
|
2.35%
|
|
2
|
|
8
|
|
|
Bartan
|
|
Secured
|
|
|
|
NIS
|
|
Floating
|
|
Prime
interest rate
|
|
2022
|
|
2.89%
|
|
5
|
|
19
|
|
|
Bartan
|
|
Secured
|
|
-
|
|
NIS
|
|
Floating
|
|
Prime
interest rate
|
|
2022
|
|
2.95%
|
|
4
|
|
16
|
|
|
|
|
|
|
|
|
|
|
|
|
|
|
|
|
|
|
|
|
|
|
|
IDB
Tourism
|
|
Unsecured
|
|
-
|
|
US$
|
|
Floating
|
|
Libor
interest rate
|
|
2020
|
|
5.66%
|
|
13
|
|
51
|
|
|
IDB
Tourism
|
|
Unsecured
|
|
-
|
|
US$
|
|
Floating
|
|
Libor
interest rate
|
|
2015
– 2018
|
|
5.21%
|
|
197
|
|
767
|
|
|
|
|
|
|
|
|
|
|
|
|
|
|
|
|
|
|
|
|
|
|
|
IDBG
|
|
Unsecured
|
|
-
|
|
US$
|
|
Floating
|
|
Libor
interest rate
|
|
2015
- 2015
|
|
Libor
+ 5%
|
|
223
|
|
869
|
|
|
|
|
|
|
|
|
|
|
|
|
|
|
|
|
|
|
|
|
|
|
|
Cellcom
|
|
Unsecured
|
|
-
|
|
NIS
|
|
Fixed
|
|
-
|
|
2016
– 2021
|
|
4.60%
|
|
200
|
|
778
|
|
Total
bank loans and others
|
|
|
|
|
|
|
|
|
|
|
|
|
|
|
|
|
|
|
10,378
|
|
Bank
overdrafts
|
|
|
|
|
|
|
|
|
|
|
|
|
|
|
|
|
|
|
292
|
|
Non-recourse
loans
|
|
|
|
|
|
|
|
|
|
|
|
|
|
|
|
|
|
|
16,975
|
|
Others
|
|
|
|
|
|
|
|
|
|
|
|
|
|
|
|
|
|
|
1,834
|
|
Subtotal
Operations Center in Israel
|
|
|
|
|
|
|
|
|
|
|
|
|
|
|
|
|
|
|
103,702
|
(1)
Corresponds to a
bank loan for NIS 750 million, where repayment of principal had
been deferred for three years starting March 2014 until March
2018.
(2)
In May 2012, IDBD
was granted a secured loan for NIS 150 by the financial
institutions of Menorah Group. Principal is repayable in two
installments of NIS 50 million and NIS 100 million in 2017 and
2018, respectively. As part of the loan, IDBD granted the lender
any stock call option on the shares it held in DIC, representing
approximately 1.7% of the share capital issued by this
company.
F- 150
Cresud Sociedad Anónima,
Comercial, Inmobiliaria, Financiera y Agropecuaria
Notes to the Consolidated
Financial Statements
(Continued)
(All amounts in
millions of Argentine Pesos, except otherwise
indicated)
23.
Borrowings
(Continued)
As of June 30, 2016
and 2015, total borrowings include collateralized liabilities
(seller financing, leases and bank loans) of Ps. 73,694 and Ps.
156,428, respectively. These borrowings are mainly collateralized
by investment properties and properties, plant and equipment of the
Group (Notes 10 and 11).
Borrowings also
include liabilities under finance leases where the Group is the
lessee and which therefore have to be measured in accordance with
IAS 17 “Leases”. Information related to liabilities
under finance leases is disclosed in Note 33.
The maturity of the
Group's borrowings (excluding obligations under finance leases) and
the Group's exposure to fixed and variable interest rates is as
follows:
|
|
June 30, 2016
|
|
June 30, 2015
|
||||||||||
|
|
Agricultural
business
|
|
Urban properties
and investments
|
|
Total
|
|
Agricultural
business
|
|
Urban properties
and investments
|
|
Total
|
||
|
|
|
|
Operations Center in Argentina
|
Operations Center in
Israel
|
Subtotal
|
|
|
|
|
|
Operations
Center in Argentina
|
|
|
|
Do
accrue interest:
|
|
|
|
|
|
|
|
|
|
|
|
|
|
|
Less than one
year
|
1,195
|
|
2,573
|
18,172
|
20,745
|
|
21,940
|
|
1,202
|
|
1,051
|
|
2,253
|
|
Between 1 and 2
years
|
1,205
|
|
16
|
16,826
|
16,842
|
|
18,047
|
|
417
|
|
2,415
|
|
2,832
|
|
Between 2 and 3
years
|
500
|
|
1
|
19,535
|
19,536
|
|
20,036
|
|
848
|
|
(113)
|
|
735
|
|
Between 3 and 4
years
|
1,332
|
|
14
|
4,643
|
4,657
|
|
5,989
|
|
710
|
|
-
|
|
710
|
|
Between 4 and 5
years
|
40
|
|
1,063
|
7,092
|
8,155
|
|
8,195
|
|
218
|
|
-
|
|
218
|
|
More than 5
years
|
34
|
|
5,303
|
36,169
|
41,472
|
|
41,506
|
|
40
|
|
1,274
|
|
1,314
|
|
|
4,306
|
|
8,970
|
102,437
|
111,407
|
|
115,713
|
|
3,435
|
|
4,627
|
|
8,062
|
|
Do
not accrue interest:
|
|
|
|
|
|
|
|
|
|
|
|
|
|
|
Less than one
year
|
31
|
|
240
|
1,265
|
1,505
|
|
1,536
|
|
21
|
|
180
|
|
201
|
|
Between 1 and 2
years
|
5
|
|
3
|
-
|
3
|
|
8
|
|
4
|
|
1
|
|
5
|
|
Between 2 and 3
years
|
-
|
|
-
|
-
|
-
|
|
-
|
|
4
|
|
-
|
|
4
|
|
Between 3 and 4
years
|
-
|
|
3
|
-
|
3
|
|
3
|
|
1
|
|
-
|
|
1
|
|
Between 4 and 5
years
|
-
|
|
10
|
-
|
10
|
|
10
|
|
-
|
|
-
|
|
-
|
|
|
36
|
|
256
|
1,265
|
1,521
|
|
1,557
|
|
30
|
|
181
|
|
211
|
|
|
4,342
|
|
9,226
|
103,702
|
112,928
|
|
117,270
|
|
3,465
|
|
4,808
|
|
8,273
|
F- 151
Cresud Sociedad Anónima,
Comercial, Inmobiliaria, Financiera y Agropecuaria
Notes to the Consolidated
Financial Statements
(Continued)
(All amounts in
millions of Argentine Pesos, except otherwise
indicated)
23.
Borrowings
(Continued)
The fair value of
current and non-current borrowings for the years ended June 30,
2016 and 2015 is as follows:
|
|
|
|
|
|
|
|
|
|
|
|
|
|
|
June
30, 2016
|
|
June
30, 2015
|
||||||||
|
|
|
Urban
properties
|
|
|
|
Urban
properties
|
|
||||
|
|
Agricultural
Business
|
Operation
Center in Argentina
|
Operation
Center in Israel
|
Subtotal
|
Total
|
|
Agricultural
Business
|
Operation
Center in Argentina
|
Subtotal
|
Total
|
|
|
NCN
|
3,247
|
8,764
|
75,804
|
84,568
|
87,815
|
|
|
4,369
|
4,369
|
6,606
|
|
|
Bank loans and
others
|
997
|
269
|
13,597
|
13,866
|
14,863
|
|
2,237
|
340
|
340
|
943
|
|
|
Bank
overdrafts
|
161
|
944
|
292
|
1,236
|
1,397
|
|
603
|
682
|
682
|
1,291
|
|
|
Non-recourse
loan
|
-
|
-
|
16,976
|
16,976
|
16,976
|
|
609
|
-
|
-
|
-
|
|
|
Other
borrowings
|
-
|
-
|
1,834
|
1,834
|
1,834
|
|
-
|
15
|
15
|
15
|
|
|
Total
borrowings
|
4,405
|
9,977
|
108,503
|
118,480
|
122,885
|
|
3,449
|
5,406
|
5,406
|
8,855
|
|
24.
Employee
benefits
Equity Incentive Plan
The Group has an
equity incentive plan, created in September 30, 2011, which aims at
certain selected employees, directors and top management of the
Company, IRSA and IRSA CP (the “Participants”).
Participation in the plan is voluntary and employees are invited to
participate by the Board.
Under the Incentive
Plan, entitle the Participants to receive shares ("Contributions")
of the Company and IRSA, based on a percentage of their annual
bonus for the years 2011, 2012 and 2013, providing they remain as
employee of the Company for at least five years, among other
conditions, required to qualify such Contributions. These
contributions shall be held by the Company and IRSA, and as the
conditions established by the Plan are verified, such contributions
shall be transferred to the Participants.
As of June 30, 2016
and 2015, the Company set up a reserve for the Incentive Plan under
Shareholder’s Equity in the amount of Ps. 35 and Ps. 32,
respectively. The reserve was based on the fair value of the shares
to be granted under the Group’s contribution, on a
proportional basis to the employee’s permanence in the
Incentive Plan and adjusted for the probability that these
beneficiaries may leave the Group before the required term has
elapsed and/or the conditions to be entitled to the mentioned plan
benefits are met as of each period end.
As of June 30, 2016
and 2015, the Group recognized a charge in connection with the
Incentive Plan of Ps. 32.9 and Ps. 30.8, respectively. The total
cost of the plan that has not yet been recognized because the term
for the full granting of the benefit is still effective amounts to
Ps. 27.3 and Ps. 56.4, respectively. This cost is expected to be
recognized over an approximately two-year period.
During the fiscal
years ended June 30, 2016 and 2015, the Group granted 1 and 1.8
million shares, respectively, corresponding to the
Participants’ Contributions.
F- 152
Cresud Sociedad Anónima,
Comercial, Inmobiliaria, Financiera y Agropecuaria
Notes to the Consolidated
Financial Statements
(Continued)
(All amounts in
millions of Argentine Pesos, except otherwise
indicated)
24.
Employee benefits
(Continued)
Movements in the
number of matching shares outstanding under the incentive plan
corresponding to the Company´s contributions are as
follows:
|
|
June
30,
2016
|
|
June
30,
2015
|
|
At
the beginning
|
7,613,638
|
|
10,033,785
|
|
Additions
|
-
|
|
308,426
|
|
Granted
|
(1,028,766)
|
|
(1,883,077)
|
|
Disposals
|
(260,135)
|
|
(845,496)
|
|
At
the end
|
6,324,737
|
|
7,613,638
|
Defined contribution plan
The Group has a
defined contribution plan (the “Plan”) covering certain
selected managers in Argentina. The Plan was effective as from
January 1, 2006. Employees may begin participation voluntarily on
monthly enrolment dates. Participants may make pre-tax
contributions to the Plan of up to 2.5% of their monthly salary
(“Base Contributions”) and of up to 15% of their annual
bonus (“Extraordinary Contributions”). Under the Plan,
the Group matches employee contributions to the plan at a rate of
200% for Base Contributions and 300% for Extraordinary
Contributions.
All contributions
are invested in funds administered outside of the Group.
Participants or their assignees, as the case may be, will have
access to the 100% of the Company contributions under the following
circumstances:
(i)
ordinary retirement
in accordance with applicable labor regulations;
(ii)
total or permanent
incapacity or disability;
(iii)
death.
In case of
resignation or termination without good cause, the manager will
receives the Group’s contribution only if he or she has
participated in the Plan for at least 5 years.
Contributions made
by the Group under the Plan amount to Ps. 10, Ps. 5 and Ps. 3 for
the fiscal years ended June 30, 2016, 2015 and 2014,
respectively.
Established only by subsidiary undertakings
Brasilagro Stock Option Plan
The
Group’s subsidiary, Brasilagro, has a stock option plan (the
“Brasilagro Stock Option Plan”), under which Brasilagro
grants equity-settled options to certain directors and top
management (the “Participants” or
"Beneficiaries").
F- 153
Cresud Sociedad Anónima,
Comercial, Inmobiliaria, Financiera y Agropecuaria
Notes to the Consolidated
Financial Statements
(Continued)
(All amounts in
millions of Argentine Pesos, except otherwise
indicated)
24.
Employee benefits
(Continued)
The Board of
Directors approved the three tranches of Brasilagro’s Stock
Option Plan on August 11, 2010, July 3, 2012 and September 4, 2012,
respectively, and Brasilagro’s Board of Directors was
authorized to grant stock options to selected employees. Upon
exercise of each option, its beneficiary becomes entitled to
purchase one share of Brasilagro’s capital stock at the
exercise price set forth under the Plan.
Brasilagro’s
Stock Option Plan has five beneficiaries and grants 233,689,
206,425 and 206,425 stock options at an exercise price of Rs. 8.97
(Ps. 33.2), Rs. 8.25 (Ps. 30.5), and Rs. 8.52 (Ps. 31.5) per share,
respectively. The options may be exercised in full as from August
12, 2012, July 3, 2014 and September 4, 2014, respectively, and are
exercisable during three years as from the time they become
exercisable. As of June 30, 2015, none of the stock options was
exercised or cancelled and 177,213 expired. As of June 30, 2014,
none of the stock options was exercised, 109,054 were canceled and
68,159 expired.
The Group did not
recognize any charge for the fiscal year ended June 30, 2016
related to Brasilagro Stock Option Plan. During the fiscal years
ended June 30, 2015 and 2014, the Group had recognized a charge of
Ps. 0.2 and Ps. 2.5, respectively.
The fair value of
the Brasilagro’s awards was measured at the date of grant
using the Black-Scholes valuation technique.
Key grant-date fair
value and other assumptions under the Brasilagro Stock Option Plan
are detailed below:
|
Grant
date
|
|
Second
tranche
|
|
Third
tranche
|
|
Expected
volatility
|
|
41.62%
|
|
40.50%
|
|
Expected
life
|
|
5
years
|
|
5
years
|
|
Risk free
rate
|
|
9.37%
|
|
9.12%
|
|
Expected dividend
yield
|
|
0.50%
|
|
0.50%
|
|
Option’s fair
value
|
|
Rs. 3.6 (Ps.
13.32)
|
|
Rs. 4.08 (Ps.
15.10)
|
|
Exercise
price
|
|
Rs. 8.25 (Ps.
30.53)
|
|
Rs. 8.52 (Ps.
31.52)
|
|
Due
date
|
|
07/03/2017
|
|
09/04/2017
|
Movements in the
number of equity-settled options outstanding and their related
weighted average exercise prices under the Brasilagro Stock Option
Plan are as follows:
|
|
June
30, 2016
|
||||||||
|
|
First
tranche
|
Second
tranche
|
Third
tranche
|
||||||
|
|
Exercise
price
Options
|
|
Options
|
Exercise
price
Options
|
|
Options
|
Exercise
price
Options
|
|
Options
|
|
At the
beginning
|
Ps.
8.97
|
|
233,689
|
Ps.
8.25
|
|
206,425
|
Ps.
8.52
|
|
206,425
|
|
Granted
|
-
|
|
-
|
-
|
|
-
|
-
|
|
-
|
|
Cancelled
|
-
|
|
-
|
-
|
|
-
|
-
|
|
-
|
|
Exercised
|
-
|
|
(233,689)
|
-
|
|
-
|
-
|
|
-
|
|
Expired
|
-
|
|
-
|
-
|
|
-
|
-
|
|
-
|
|
At the
end
|
-
|
|
-
|
Ps.
8.25
|
|
206,425
|
Ps.
8.52
|
|
206,425
|
F- 154
Cresud Sociedad Anónima,
Comercial, Inmobiliaria, Financiera y Agropecuaria
Notes to the Consolidated
Financial Statements
(Continued)
(All amounts in
millions of Argentine Pesos, except otherwise
indicated)
24.
Employee benefits
(Continued)
|
|
June
30, 2015
|
||||||||
|
|
First
tranche
|
Second
tranche
|
Third
tranche
|
||||||
|
|
Exercise
price
Options
|
|
Options
|
Exercise
price
Options
|
|
Options
|
Exercise
price
Options
|
|
Options
|
|
At the
beginning
|
Ps.
8.97
|
|
301,848
|
Ps.
8.25
|
|
260,952
|
Ps.
8.52
|
|
260,952
|
|
Granted
|
-
|
|
-
|
-
|
|
-
|
-
|
|
-
|
|
Cancelled
|
-
|
|
-
|
-
|
|
-
|
-
|
|
-
|
|
Exercised
|
-
|
|
-
|
-
|
|
-
|
-
|
|
-
|
|
Expired
|
-
|
|
(68,159)
|
-
|
|
(54,527)
|
-
|
|
(54,527)
|
|
At the
end
|
Ps.
8.97
|
|
233,689
|
Ps.
8.25
|
|
206,425
|
Ps.
8.52
|
|
206,425
|
Brasilagro Warrants
On March 15, 2006,
the Board of Directors of Brasilagro approved the issuance of
512,000 share warrants (the "Brasilagro Warrants"), 256,000 of
which correspond to the first tranche, and 256,000 of which
correspond to the second tranche.
The first tranche
of Brasilagro Warrants were delivered to its founding shareholders
in March, 2006 before Brasilagro’s IPO. As reported by
Brasilagro in its IPO Prospectus, said warrants were granted to its
founding shareholders in recognition of their founding efforts,
their entrepreneurial spirit in preparing Brasilagro for its IPO,
the work done in developing the business plan, and their commitment
to the Company’s growth. The warrants were distributed among
the founding shareholders for no consideration.
As Brasilagro
received services from its founding shareholders in exchange for
share-based payments, the first issuance of Brasilagro Warrants are
within the scope of IFRS 2. However, due to the fact that these
warrants could have been fully exercised since March 15, 2009, that
is, before the transition date to the IFRS (July 1, 2009), and that
the fair value of the warrants had not been published, the Group
applied the exemption available under IFRS 1 for these equity
instruments.
Each lot of 1,000
Warrants grants the right to subscribe 100 shares of Brasilagro.
Brasilagro Warrants vest over a three-year period from the date of
grant at 33% every year, and are exercisable by their holders over
a fifteen-year period. The number of shares to be subscribed upon
exercise of the warrants shall be adjusted in the event of split or
reverse split of shares.
The 256,000
Brasilagro warrants under the first tranche, were exercisable as of
June 30, 2016 and 2015.
F- 155
Cresud Sociedad Anónima,
Comercial, Inmobiliaria, Financiera y Agropecuaria
Notes to the Consolidated
Financial Statements
(Continued)
(All amounts in
millions of Argentine Pesos, except otherwise
indicated)
24.
Employee benefits
(Continued)
Brasilagro Warrants
of the first issuance outstanding at each period end under have the
following expiry date and exercise prices:
|
|
|
Exercise
price per share
|
|
Shares
(i)
|
||
|
Expiry:
|
|
|
June
30,
2016
|
|
June
30,
2015
|
|
|
April 27,
2021
|
|
Rs
18.20
|
|
256,000
|
|
256,000
|
(i)
From
the Brasilagro Warrants under the first tranche 177,004 were owned
by the Company as of June 30, 2016 and 2015,
respectively.
Group’s
management believes that Brasilagro Warrants under the second
tranche (which are only exercisable if and when a transfer of
control or acquisition of a significant interest occurs) has a fair
value of zero as of any of the periods presented because the
exercise price will be equal to the price per share to be paid by
the party that obtains control or that acquires a significant
interest in Brasilagro.
Each lot of 1,000
warrants grants the right to subscribe 100 shares of Brasilagro.
Brasilagro Warrants of the second issuance are exercisable by their
holders during a fifteen-year period but only in the event of
change in control and/or acquisition of a material interest in
Brasilagro. The number of shares to be subscribed upon exercise of
the warrants shall be adjusted in the event of split or reverse
split of shares.
As Brasilagro
Warrants under the second issuance were delivered to provide
Brasilagro’s founding shareholders with a mechanism to
leverage their interest in Brasilagro, and not in exchange for
goods and/or services, they are not within the scope of IFRS 2.
Rather, they are accounted for as a derivative financial liability
in accordance with IAS 32 and IFRS 9.
Out of the warrants
under the second issuance 168,902 were held by the Company as of
June 30, 2016 and 2015.
F- 156
Cresud Sociedad Anónima,
Comercial, Inmobiliaria, Financiera y Agropecuaria
Notes to the Consolidated
Financial Statements
(Continued)
(All amounts in
millions of Argentine Pesos, except otherwise
indicated)
24.
Employee benefits
(Continued)
IDBD
Defined benefits
Defined benefits to
hired employees include post-employment benefits, retirement
benefits, share-based plans and other short and long term benefits.
The Group’s liabilities in relation to severance pay and/or
retirement benefits of Israeli employees are calculated in
accordance with Israeli laws.
|
|
June
30,
2016
|
|
Present value of
unfunded obligations
|
572
|
|
Present value of
funded obligations
|
1,070
|
|
Total
Present value of defined benefits obligations
|
1,642
|
|
Fair value of plan
assets
|
(1,101)
|
|
Recognized
liability for defined benefits obligations
|
541
|
|
Liability for other
long-term benefits
|
148
|
|
Total
recognized liabilities
|
689
|
|
Assets designed for
payment of benefits for employees
|
(4)
|
|
Net position from employee benefits
|
685
|
Plans associated to certain key members of management
IDBD, through its
subsidiaries, has granted share incentive plans to key members of
management. In April 2016, some modifications have been introduced
to the plans as regards exercise prices for each of the five
tranches of options, thus establishing a range of NIS 9.5
million
to NIS 12.5
million
. The share price at the
time of approval was NIS 7.73
million
.
25.
Taxation
The Group’s
income tax has been calculated on the estimated taxable profit for
the years ended June 30, 2016, 2015 and 2014, at the rates
prevailing in the respective tax jurisdictions. The subsidiaries of
the Group in the jurisdictions where the Group operates are
required to calculate their income taxes on a separate basis; thus,
they are not permitted to compensate subsidiaries’ losses
against subsidiaries income.
The details of the
provision for the Group’s income tax is as
follows:
|
|
June 30,
2016
|
|
June 30,
2015
|
|
June 30,
2014
|
|
Current income
tax
|
(673)
|
|
(687)
|
|
(268)
|
|
Deferred income
tax
|
853
|
|
391
|
|
676
|
|
MPIT
|
17
|
|
(7)
|
|
(19)
|
|
Income
tax expense
|
197
|
|
(303)
|
|
389
|
F- 157
Cresud Sociedad Anónima,
Comercial, Inmobiliaria, Financiera y Agropecuaria
Notes to the Consolidated
Financial Statements
(Continued)
(All amounts in
millions of Argentine Pesos, except otherwise
indicated)
25.
Taxation
(Continued)
The statutory tax
rate in the countries where the Group operates for all of the years
presented are:
|
Tax
jurisdiction
|
|
Income
tax rate
|
|
Argentina
|
|
35%
|
|
Brazil
|
|
between 25% -
34%
|
|
Uruguay
|
|
between 0% -
25%
|
|
Bolivia
|
|
25%
|
|
United
States
|
|
between 0% -
45%
|
|
Bermudas
|
|
0%
|
|
Israel
|
|
26.5%
|
Below is a
reconciliation between the income tax recognized and that which
would result from applying the prevailing tax rate, applicable in
the respective countries, on the profit / (loss) before income tax
for the years ended June 30, 2016, 2015 and 2014:
|
|
June 30,
2016
|
|
June 30,
2015
|
|
June 30,
2014
|
|
Gain / (loss) for
the year calculated at the tax rate prevailing in the respective
countries
|
90
|
|
(858)
|
|
550
|
|
Permanent
differences:
|
|
|
|
|
|
|
Share of profit /
(loss) of joint ventures and associates
|
475
|
|
543
|
|
(154)
|
|
Gain from disposal
of joint ventures and associates
|
-
|
|
-
|
|
9
|
|
Capital indexation
of foreign companies
|
-
|
|
-
|
|
1
|
|
Unrecognized tax
losses
|
(158)
|
|
(21)
|
|
(43)
|
|
Non-deductible
items
|
(253)
|
|
(8)
|
|
3
|
|
Adjustment of share
capital
|
-
|
|
4
|
|
-
|
|
Tax on personal
assets
|
(2)
|
|
-
|
|
-
|
|
Change in tax
rate
|
(357)
|
|
-
|
|
-
|
|
Unrecognized tax
losses carryforwards
|
(4)
|
|
-
|
|
-
|
|
Non-taxable
income
|
109
|
|
57
|
|
-
|
|
Others
|
297
|
|
(20)
|
|
23
|
|
Income
tax expense
|
197
|
|
(303)
|
|
389
|
Deferred tax assets
and liabilities of the Group as of June 30, 2016 and 2015 will be
recovered as follows:
|
|
June 30,
2016
|
|
June 30,
2015
|
|
Deferred income tax
assets to be recovered after more than 12 months
|
5,138
|
|
1,101
|
|
Deferred income tax
assets to be recovered within 12 months
|
1,969
|
|
374
|
|
Deferred
income tax assets
|
7,107
|
|
1,475
|
|
|
June 30,
2016
|
|
June 30,
2015
|
|
Deferred income tax
liabilities to be recovered after more than 12 months
|
(12,705)
|
|
(798)
|
|
Deferred income tax
liabilities to be recovered within 12 months
|
(406)
|
|
(175)
|
|
Deferred
income tax liabilities
|
(13,111)
|
|
(973)
|
F- 158
Cresud Sociedad Anónima,
Comercial, Inmobiliaria, Financiera y Agropecuaria
Notes to the Consolidated
Financial Statements
(Continued)
(All amounts in
millions of Argentine Pesos, except otherwise
indicated)
25.
Taxation
(Continued)
The movement in the
deferred income tax (opened by assets and liabilities) during the
years ended June 30, 2016 and 2015, without taking into
consideration the offsetting of balances within the same tax
jurisdiction, is as follows:
|
Deferred
income tax assets
|
|
Tax
loss carry-forwards
|
|
Advanced
payments from customers
|
|
Investments
|
|
Trade
and otherr receivables
|
|
Investment
properties and property, plant and equipment
|
|
Provisions
|
|
Inventories
|
|
Trading
properties
|
|
Others
|
|
Total
|
|
June
30, 2014
|
|
1,019
|
|
103
|
|
6
|
|
-
|
|
-
|
|
2
|
|
-
|
|
18
|
|
91
|
|
1,239
|
|
Charged/ (Credited)
to the statement of income
|
|
162
|
|
220
|
|
72
|
|
1
|
|
-
|
|
(1)
|
|
1
|
|
7
|
|
25
|
|
487
|
|
Changes of
non-controlling interest
|
|
(50)
|
|
-
|
|
-
|
|
-
|
|
-
|
|
-
|
|
-
|
|
-
|
|
-
|
|
(50)
|
|
Use of tax loss
carryforwards
|
|
(157)
|
|
-
|
|
-
|
|
-
|
|
-
|
|
-
|
|
-
|
|
-
|
|
-
|
|
(157)
|
|
Cumulative
translation adjustment
|
|
(41)
|
|
2
|
|
-
|
|
-
|
|
-
|
|
-
|
|
-
|
|
-
|
|
(5)
|
|
(44)
|
|
June
30, 2015
|
|
933
|
|
325
|
|
78
|
|
1
|
|
-
|
|
1
|
|
1
|
|
25
|
|
111
|
|
1,475
|
|
(Credited)/ Charged
to the statement of income
|
|
(16)
|
|
(161)
|
|
-
|
|
1
|
|
(4)
|
|
-
|
|
1
|
|
(8)
|
|
3
|
|
(184)
|
|
Changes of
non-controlling interest
|
|
(88)
|
|
-
|
|
-
|
|
-
|
|
-
|
|
-
|
|
-
|
|
-
|
|
-
|
|
(88)
|
|
Use of tax loss
carryforwards
|
|
(366)
|
|
-
|
|
-
|
|
-
|
|
-
|
|
-
|
|
-
|
|
-
|
|
-
|
|
(366)
|
|
Business
combinations
|
|
2,261
|
|
1,025
|
|
-
|
|
-
|
|
-
|
|
-
|
|
-
|
|
-
|
|
442
|
|
3,728
|
|
Cumulative
translation adjustment
|
|
1,661
|
|
598
|
|
-
|
|
-
|
|
6
|
|
1
|
|
-
|
|
-
|
|
276
|
|
2,542
|
|
June
30, 2016
|
|
4,385
|
|
1,787
|
|
78
|
|
2
|
|
2
|
|
2
|
|
2
|
|
17
|
|
832
|
|
7,107
|
F- 159
Cresud Sociedad Anónima,
Comercial, Inmobiliaria, Financiera y Agropecuaria
Notes to the Consolidated
Financial Statements
(Continued)
(All amounts in
millions of Argentine Pesos, except otherwise
indicated)
25.
Taxation
(Continued)
|
Deferred income tax liabilities
|
|
Investment properties
|
|
Properties, plant and equipment
|
|
Biological assets
|
|
Intangible assets
|
|
Investments
|
|
Inventories
|
|
Trade and other receivables
|
|
Others
|
|
Total
|
|
June
30, 2014
|
|
(514)
|
|
(121)
|
|
(157)
|
|
-
|
|
7
|
|
-
|
|
(73)
|
|
24
|
|
(834)
|
|
Charged/ (Credited)
to the statement of income
|
|
495
|
|
20
|
|
27
|
|
-
|
|
(20)
|
|
(2)
|
|
(611)
|
|
(30)
|
|
(121)
|
|
Reclassifications
from trading properties
|
|
(33)
|
|
-
|
|
-
|
|
-
|
|
-
|
|
-
|
|
-
|
|
-
|
|
(33)
|
|
Cumulative
translation adjustment
|
|
(1)
|
|
12
|
|
2
|
|
-
|
|
-
|
|
-
|
|
2
|
|
-
|
|
15
|
|
Junio
30, 2015
|
|
(53)
|
|
(89)
|
|
(128)
|
|
-
|
|
(13)
|
|
(2)
|
|
(682)
|
|
(6)
|
|
(973)
|
|
Charged/ (Credited)
to the statement of income
|
|
938
|
|
23
|
|
(117)
|
|
247
|
|
(837)
|
|
(17)
|
|
572
|
|
227
|
|
1,036
|
|
Business
combinations
|
|
(5,630)
|
|
-
|
|
-
|
|
(2,031)
|
|
-
|
|
-
|
|
(20)
|
|
(728)
|
|
(8,409)
|
|
Cumulative
translation adjustment
|
|
(3,205)
|
|
7
|
|
(1)
|
|
(1,076)
|
|
-
|
|
(35)
|
|
(13)
|
|
(442)
|
|
(4,765)
|
|
June
30, 2016
|
|
(7,950)
|
|
(59)
|
|
(246)
|
|
(2,860)
|
|
(850)
|
|
(54)
|
|
(143)
|
|
(949)
|
|
(13,111)
|
F- 160
Cresud Sociedad Anónima,
Comercial, Inmobiliaria, Financiera y Agropecuaria
Notes to the Consolidated
Financial Statements
(Continued)
(All amounts in
millions of Argentine Pesos, except otherwise
indicated)
25.
Taxation
(Continued)
Deferred income tax
assets are recognized for tax loss carry-forwards to the extent
that the realization of the related tax benefits through future
taxable profits is probable. Tax loss carry-forwards may have
expiration dates or may be permanently available for use by the
Group depending on the tax jurisdiction where the tax loss carry
forward is generated. Tax loss carry forwards in Argentina and
Uruguay generally expire within 5 years. Tax loss carry forward in
Bolivia expire within 3 years. Tax loss carry forwards in Brazil do
not expire. However, in Brazil, the taxable profit for each year
can only be reduced by tax losses up to a maximum of
30%.
As of June 30,
2016, the Group’s tax loss carry-forwards expiration dates
are as follows:
|
Jurisdiction
|
|
Tax
loss carry-forward
|
|
Due
date
|
|
Argentina
|
|
117
|
|
2017
|
|
Argentina
|
|
250
|
|
2018
|
|
Argentina
|
|
914
|
|
2019
|
|
Argentina
|
|
173
|
|
2020
|
|
Argentina
|
|
1,263
|
|
2021
|
|
Uruguay
|
|
16
|
|
2017
|
|
Uruguay
|
|
10
|
|
2018
|
|
Uruguay
|
|
18
|
|
2019
|
|
Uruguay
|
|
7
|
|
2020
|
|
Uruguay
|
|
5
|
|
2021
|
|
Bolivia
|
|
15
|
|
2017
|
|
Bolivia
|
|
9
|
|
2018
|
|
Bolivia
|
|
13
|
|
2019
|
|
Israel
|
|
68,049
|
|
Do not
expires
|
|
|
|
70,859
|
|
|
In order to fully
realize the deferred tax asset, the Group will need to generate
future taxable income. To this aim the Group made a projection for
future years when deferred assets will be deductible. Such
projection is based on aspects such as the expected performance of
the main macroeconomic variables affecting the business, production
issues, pricing, yields and costs that make up the operational
flows derived from the regular exploitation of fields and other
assets of the group, the flows derived from the performance of
financial assets and liabilities and the income generated by the
Group’s strategy of crop rotation. Such strategy implies the
purchase and/or development of fields in marginal areas or areas
with a high upside potential and periodical sale of such properties
that are deemed to have reached their maximum appreciation
potential.
Based on the
estimated and aggregate effect of all these aspects on the
Group’s performance, Management estimates that as at June 30,
2016, it is probable that the Company will realize all of the
deferred tax assets.
F- 161
Cresud Sociedad Anónima,
Comercial, Inmobiliaria, Financiera y Agropecuaria
Notes to the Consolidated
Financial Statements
(Continued)
(All amounts in
millions of Argentine Pesos, except otherwise
indicated)
25.
Taxation
(Continued)
The Group did not
recognize deferred income tax assets of Ps. 74,266.4 and Ps. 43.33
as of June 30, 2016 and 2015, respectively the main deferred income
tax asset not recognized is related to our subsidiary IDBD.
Although management estimates that the business will generate
sufficient income, pursuant to IAS 12, management has determined
that, as a result of the recent loss history and the lack of
verifiable and objective evidence due to the subsidiary’s
results of operations history, there is sufficient uncertainty as
to the generation of sufficient income to be able to offset the
losses within a reasonable timeframe, therefore, no deferred tax
asset is recognized in relation to these losses.
The Group did not
recognize deferred income tax liabilities of Ps. 825.18 and Ps.
71.83 as of June 30, 2016 and 2015, respectively, related to their
investments in foreign subsidiaries, associates and joint ventures.
In addition, the withholdings and/or similar taxes paid at source
may be creditable against the Group’s potential final tax
liability.
The Company does
not set up an allowance for MPIT and is considering filing a
declaratory action under the terms of section 322 of the Civil and
Commercial Procedural Code against the AFIP seeking certainty as to
the application of the MPIT for the fiscal year 2014, 2015 and
advance payments from 7 through 11 corresponding to fiscal year
2014, in relation to the decision by the Argentine Supreme Court in
the case “Hermitage” on September 15, 2010 and
“Perfil” on February 11, 2014. In such judicial
precedents, the Court had declared such tax to be unconstitutional
given that, under certain circumstances, it proves to be
unreasonable and inconsistent with the ability-to-pay
principle.
26.
Leases
The Group as lessee
Operating
leases:
In the ordinary
course of business, the Group enters into several operating lease
agreements. The Group conducts a portion of its agricultural
activities on land rented from third parties under operating lease
contracts averaging a harvest year. The Group uses rented land for
cultivation or cattle rising. Lease contracts are generally
renewable for additional harvest periods. Rent is generally payable
at intervals during the harvest year. Lease contracts vary but
payments are generally based on the market price of a particular
crop multiplied by a fixed amount of tons per hectare
leased.
Other contracts are
based on a fixed amount of US dollars per hectare. Rent expense for
the years ended as of June 30, 2016, 2015 and 2014 amounted to Ps.
79.7, Ps. 98.8 and Ps. 78.6, respectively and is included in the
line item "Cost" in the income statements.
As discussed in
Note 2.9, the Group is also using land in the Province of Salta
under rights of use agreement (the "Anta Agreement") for which the
Group is currently paying a rent fee of 10% of the production. Rent
expense for the years ended June 30, 2016, 2015 and 2014 amounted
to Ps. 4.5, Ps. 4.7 and Ps. 2.6, respectively, and is included in
the line item "Costs" in the income statements.
F- 162
Cresud Sociedad Anónima,
Comercial, Inmobiliaria, Financiera y Agropecuaria
Notes to the Consolidated
Financial Statements
(Continued)
(All amounts in
millions of Argentine Pesos, except otherwise
indicated)
26.
Leases
(Continued)
The Group leases
property or spaces for administrative or commercial use both in
Argentina and Israel under operating lease arrangements. The
agreements entered into include several clauses, including but not
limited, to fixed, variable or adjustable payments. Some leases
were agreed upon with related parties (Note 35). The amounts
involved have not been material for any of the filed
periods.
The Group also
rents office spaces under an operating lease with companies related
to the Chairman and Director of the Group. (Note 35).
The future
aggregate minimum lease payments the Group will have to cancel
under non-cancellable operating leases are as follows:
|
|
June 30, 2016
|
|
June 30, 2015
|
|
June 30, 2014
|
|
No
later than one year
|
3,907
|
|
38
|
|
44
|
|
Later
than one year not later than five years
|
6,859
|
|
48
|
|
84
|
|
More
than five years
|
2,254
|
|
84
|
|
102
|
|
|
13,020
|
|
170
|
|
230
|
Finance
leases
The Group rents
certain computer equipment under various finance leases for an
average term of three years. Book value of these assets under
finance leases is disclosed in Note 12.
At the commencement
of the lease term, the Group recognizes a lease liability equal to
the carrying amount of the leased asset. In subsequent periods, the
liability decreases by the amount of lease payments made to the
lessors using the effective interest method. The interest component
of the lease payments is recognized in the income statements. Book
value of liabilities under finance leases is disclosed in Note
26.
Lease liabilities
are effectively secured as the rights to the leased asset revert to
the lessor in the event of default.
The future
aggregate minimum lease payments under cancellable operating leases
are as follows:
|
|
June 30, 2016
|
|
June
30, 2015
|
|
June
30, 2014
|
|
No
later than one year
|
11
|
|
12
|
|
2
|
|
Later
than one year not later than five years
|
17
|
|
15
|
|
1
|
|
|
28
|
|
27
|
|
3
|
|
Future
finance charges
|
(2)
|
|
(2)
|
|
-
|
|
Present value of finance lease liabilities
|
26
|
|
25
|
|
3
|
F- 163
Cresud Sociedad Anónima,
Comercial, Inmobiliaria, Financiera y Agropecuaria
Notes to the Consolidated
Financial Statements
(Continued)
(All amounts in
millions of Argentine Pesos, except otherwise
indicated)
26.
Leases
(Continued)
The fair value of
finance lease liabilities is as follows:
|
|
June 30, 2016
|
|
June 30, 2015
|
|
June 30, 2014
|
|
No
later than one year
|
12
|
|
12
|
|
2
|
|
Later
than one year and not later than five years
|
14
|
|
13
|
|
1
|
|
Present value of finance lease liabilities
|
26
|
|
25
|
|
3
|
Under the terms of
these agreements, no contingent rents are payable. The interest
rate inherent is fixed at the contract date for all of the lease
term. The average interest rates on finance lease payables at June
30, 2016, 2015 and 2014 were 11.1%, 9.2% and 11.20%,
respectively.
The Group as lessor
Operating leases:
In the segment
Shopping Centers and Offices and others in the Operations Center
Argentina and in the segment Real Estate in the Operations Center
Israel, the Group enters into operating lease agreements typical in
the business. Given the diversity of properties and lessees, and
the various economic and regulatory jurisdictions where the Group
operates, the agreements may adopt different forms, such as fixed,
variable, adjustable leases, etc. For example, in the Operations
Center Argentina, operating lease agreements with lessees of
shopping centers generally include step-up clauses and contingent
payments. In Israel, agreements tend to be agreed upon for fixed
amounts, although in some cases they may include adjustment
clauses. Income from leases are recorded in the statement of income
under rental and service income in all of the filed
periods.
Rental properties
are considered to be investment property (Note 10). The book value,
depreciation charge, and accumulated depreciation are included in
Note 10.
Rental income of
the Group’s offices and other buildings amounted to Ps. 321,
Ps. 306 and Ps. 256 for the fiscal years ended June 30, 2016, 2015
and 2014, respectively and is included into “Revenue”
in the income statements.
The future minimum
proceeds under non-cancellable operating leases from Group’s
offices and other buildings are as follows:
|
|
June 30, 2016
|
|
June 30, 2015
|
|
June 30, 2014
|
|
2015
|
-
|
|
-
|
|
732
|
|
2016
|
-
|
|
982
|
|
523
|
|
2017
|
3,137
|
|
690
|
|
221
|
|
2018
|
3,237
|
|
323
|
|
59
|
|
2019
|
2,564
|
|
83
|
|
18
|
|
2020
|
1,988
|
|
24
|
|
14
|
|
Later
than 2020
|
5,577
|
|
-
|
|
-
|
|
|
16,503
|
|
2,102
|
|
1,567
|
F- 164
Cresud Sociedad Anónima,
Comercial, Inmobiliaria, Financiera y Agropecuaria
Notes to the Consolidated
Financial Statements
(Continued)
(All amounts in
millions of Argentine Pesos, except otherwise
indicated)
26.
Leases
(Continued)
Farmland leases
From time to time,
the Group leases certain farmlands. The leases have an average term
of one crop year. Rental income is generally based on the market
price of a particular crop multiplied by a fixed amount of tons per
hectare leased.
Rental income was
Ps. 22, Ps. 15.1 and Ps. 13.8 for the years ended June 30, 2016,
2015 and 2014 and is included within “Revenue” in the
income statements.
Even though all
leases described above are cancellable by law, the Group considered
them to be non-cancellable (see Note 2.28 for further
details).
The future
aggregate minimum lease proceeds under non-cancellable operating
leases from the Group are as follows:
|
|
June 30, 2016
|
|
June 30, 2015
|
|
June 30, 2014
|
|
No
later than one year
|
14
|
|
5
|
|
9
|
|
Later
than one year and not later than five years
|
-
|
|
1
|
|
1
|
|
More
than five years
|
-
|
|
-
|
|
2
|
|
|
14
|
|
6
|
|
12
|
Finance leases:
The Group does not
act as a lessor in connection with finance leases.
27.
Shareholders'
equity
Share capital and premium
The share capital
of the Group is represented by common shares with a nominal value
of Ps. 1 per share and one vote each. No other activity has been
recorded for the fiscal years ended June 30, 2016, 2015 and 2014 in
the capital accounts, other than those related to the acquisition
of treasury shares.
Inflation adjustment of share capital
The Group’s
financial statements were previously prepared on the basis of
general price-level accounting which reflected changes in the
purchase price of the Argentine Peso in the historical financial
statements through February 28, 2003. The inflation adjustment
related to share capital was appropriated to an inflation
adjustment reserve that formed part of shareholders' equity. The
balance of this reserve could be applied only towards the issuance
of common stock to shareholders of the Company. Resolution 592/11
of the CNV requires that at the transition date to IFRS certain
equity accounts, such as the inflation adjustment reserve, are not
adjusted and are considered an integral part of share
capital.
F- 165
Cresud Sociedad Anónima,
Comercial, Inmobiliaria, Financiera y Agropecuaria
Notes to the Consolidated
Financial Statements
(Continued)
(All amounts in
millions of Argentine Pesos, except otherwise
indicated)
27.
Shareholders' equity
(Continued)
Legal reserve
According to Law
No. 19,550, 5% of the profit of the year is separated to constitute
a legal reserve until they reach legal capped amounts (20% of total
capital). This legal reserve is not available for dividend
distribution and can only be released to absorb losses. The Group
has not reached the legal limit of this reserve.
Special reserve
Pursuant to CNV
General Ruling No. 609/12, the Company set up a special reserve, to
reflect the positive difference between the balance at the
beginning of retained earnings disclosed in the first financial
statements prepared according to IFRS and the balance at closing of
retained earnings disclosed in the last financial statements
prepared in accordance with previously effective accounting
standards. This reserve may not be used to make distributions in
kind or in cash, and may only be reversed to be capitalized, or
otherwise to absorb potential negative balances in Retained
Earnings. The Company reversed the above mentioned reserve to
absorb the accumulated deficit as of the fiscal year ended June 30,
2014.
Dividends
During the year
ended June 30, 2016, there were no distributions of
dividends.
Dividends
distributed during fiscal year ended June 30, 2015 amounted to Ps.
6. Dividends distributed during fiscal year ended June 30, 2014
amounted to Ps. 120.
Additional paid-in capital from treasury shares
Upon sale of the
treasury shares, the difference between the net realizable value of
the treasury shares sold and their acquisition cost shall be
recorded, whether it is a gain or a loss, as part of owners’
contributions not yet capitalized to be called “Additional
Paid-in Capital from Treasury Shares”.
F- 166
Cresud Sociedad Anónima,
Comercial, Inmobiliaria, Financiera y Agropecuaria
Notes to the Consolidated
Financial Statements
(Continued)
(All amounts in
millions of Argentine Pesos, except otherwise
indicated)
27.
Shareholders’ Equity
(Continued)
Group’s other
reserves at June 30, 2016, 2015 and 2014 were as
follows:
|
|
Cost
of treasury shares
|
Transactions
with non-controlling interest
|
Reserve
for
cumulative
translation adjustment
|
Reserve
for
share
based compensation
|
Reserve
for future dividends
|
Hedging
instruments
|
Reserve
for new developments
|
Reserve
for defined benefit plans
|
Reserve
for the acquisition of securities issued by the
Company
|
Other
subsidiaries
reserves
|
Total
other
reserves
|
|
Balance
as of June 30, 2013
|
-
|
(22)
|
3
|
8
|
-
|
-
|
337
|
-
|
-
|
-
|
326
|
|
Other comprehensive
income for the year
|
-
|
|
631
|
-
|
-
|
-
|
-
|
-
|
-
|
-
|
631
|
|
Total
comprehensive income for the year
|
-
|
-
|
631
|
-
|
-
|
-
|
-
|
-
|
-
|
-
|
631
|
|
Cash
dividends
|
-
|
-
|
-
|
-
|
-
|
-
|
(120)
|
-
|
-
|
-
|
(120)
|
|
Equity settled
compensation
|
-
|
-
|
-
|
63
|
-
|
-
|
-
|
-
|
-
|
-
|
63
|
|
Cancellation of
BrasilAgro warrants
|
-
|
-
|
-
|
(1)
|
-
|
-
|
-
|
-
|
-
|
-
|
(1)
|
|
Acquisition of
treasury shares
|
(55)
|
-
|
-
|
-
|
-
|
-
|
-
|
-
|
-
|
-
|
(55)
|
|
Release of reserve
for new developments resolved by Shareholders’ Meeting held
on April 11, 2014
|
-
|
-
|
-
|
-
|
-
|
-
|
(200)
|
-
|
200
|
-
|
-
|
|
Transaction with
non-controlling interest
|
-
|
7
|
-
|
-
|
-
|
-
|
-
|
-
|
-
|
-
|
7
|
|
Balance
as of June 30, 2014
|
(55)
|
(15)
|
634
|
70
|
-
|
-
|
17
|
-
|
200
|
-
|
851
|
|
Other comprehensive
loss for the year
|
-
|
-
|
(191)
|
-
|
-
|
-
|
-
|
-
|
-
|
-
|
(191)
|
|
Total
comprehensive loss for the year
|
-
|
-
|
(191)
|
-
|
-
|
-
|
-
|
-
|
-
|
-
|
(191)
|
|
Appropriation
of retained earnings resolved by Shareholders’ Meeting held
on November 14, 2014:
|
|
|
|
|
|
|
|
|
|
|
|
|
- Share
distribution
|
55
|
-
|
-
|
-
|
-
|
-
|
-
|
-
|
(55)
|
-
|
-
|
|
- Reserve for new
developments
|
-
|
-
|
-
|
-
|
-
|
-
|
(17)
|
-
|
|
-
|
(17)
|
|
- Reserve for
repurchase of share
|
-
|
-
|
-
|
-
|
-
|
-
|
-
|
-
|
(113)
|
-
|
(113)
|
|
Equity settled
compensation
|
-
|
-
|
-
|
28
|
-
|
-
|
-
|
-
|
-
|
-
|
28
|
|
Acquisition of
treasury shares
|
(32)
|
-
|
-
|
-
|
-
|
-
|
-
|
-
|
-
|
-
|
(32)
|
|
Awards granted
under equity incentive plan
|
-
|
-
|
-
|
(16)
|
-
|
-
|
-
|
-
|
-
|
-
|
(16)
|
|
Transaction with
non-controlling interest
|
-
|
69
|
-
|
-
|
-
|
-
|
-
|
-
|
-
|
-
|
69
|
|
Balance
as of June 30, 2015
|
(32)
|
54
|
443
|
82
|
-
|
-
|
-
|
-
|
32
|
-
|
579
|
|
Other comprehensive
income / (loss) for the year
|
-
|
-
|
422
|
-
|
-
|
(24)
|
-
|
(6)
|
-
|
-
|
392
|
|
Total
comprehensive income / (loss) for the year
|
-
|
-
|
422
|
-
|
-
|
(24)
|
-
|
(6)
|
-
|
-
|
392
|
|
Appropriation
of retained earnings resolved by Shareholders’ Meeting held
on October 30 and November 26, 2015:
|
|
|
|
|
|
|
|
|
|
|
|
|
- Reserve for
future dividends
|
-
|
-
|
-
|
-
|
31
|
-
|
-
|
-
|
-
|
-
|
31
|
|
Equity settled
compensation
|
-
|
-
|
-
|
17
|
-
|
-
|
-
|
-
|
-
|
-
|
17
|
|
Equity incentive
plan granted
|
-
|
-
|
-
|
(4)
|
-
|
-
|
-
|
-
|
-
|
-
|
(4)
|
|
Transaction with
non-controlling interest
|
-
|
106
|
-
|
-
|
-
|
-
|
-
|
-
|
-
|
-
|
106
|
|
Cumulative
translation adjustment before business combination
|
-
|
-
|
(58)
|
-
|
-
|
-
|
-
|
-
|
-
|
-
|
(58)
|
|
Share of changes in
subsidiaries’ equity
|
-
|
-
|
-
|
-
|
-
|
-
|
-
|
-
|
-
|
23
|
23
|
|
Balance
as of June 30, 2016
|
(32)
|
160
|
807
|
95
|
31
|
(24)
|
-
|
(6)
|
32
|
23
|
1,086
|
F- 167
Cresud Sociedad Anónima,
Comercial, Inmobiliaria, Financiera y Agropecuaria
Notes to the Consolidated
Financial Statements
(Continued)
(All amounts in
millions of Argentine Pesos, except otherwise
indicated)
28.
Revenues
|
|
June
30,
2016
|
|
June
30,
2015
|
|
June
30,
2014
|
|
Sale of trading
properties
|
191
|
|
10
|
|
63
|
|
Crops
|
1,015
|
|
950
|
|
818
|
|
Cattle
|
80
|
|
57
|
|
62
|
|
Dairy
|
65
|
|
72
|
|
54
|
|
Sugarcane
|
294
|
|
198
|
|
124
|
|
Supplies
|
63
|
|
55
|
|
70
|
|
Beef
|
966
|
|
806
|
|
549
|
|
Sale of
communication equipment
|
1,844
|
|
-
|
|
-
|
|
Revenue from
supermarkets
|
18,536
|
|
-
|
|
-
|
|
Revenues
from sales
|
23,054
|
|
2,148
|
|
1,740
|
|
Consignment
revenues
|
119
|
|
32
|
|
|
|
Rental and
services
|
5,264
|
|
2,995
|
|
2,449
|
|
Hotel
services
|
557
|
|
396
|
|
332
|
|
Communication
services
|
4,956
|
|
-
|
|
-
|
|
Tourism
services
|
1,152
|
|
-
|
|
-
|
|
Leases and
agricultural services
|
40
|
|
37
|
|
29
|
|
Commissions
|
66
|
|
38
|
|
47
|
|
Consumer
financing
|
171
|
|
-
|
|
-
|
|
Others
|
5
|
|
6
|
|
7
|
|
Revenue
from services
|
12,330
|
|
3,504
|
|
2,864
|
|
Total
revenues
|
35,384
|
|
5,652
|
|
4,604
|
29.
Costs
|
|
June
30,
2016
|
|
June
30,
2015
|
|
June
30,
2014
|
|
Cost of leases and
services
|
13
|
|
12
|
|
9
|
|
Other operative
costs
|
10
|
|
9
|
|
8
|
|
Cost
of property operations
|
23
|
|
21
|
|
17
|
|
Crops
|
1,707
|
|
1,753
|
|
1,508
|
|
Cattle
|
254
|
|
220
|
|
151
|
|
Dairy
|
135
|
|
133
|
|
104
|
|
Sugarcane
|
494
|
|
368
|
|
207
|
|
Supplies
|
49
|
|
43
|
|
56
|
|
Beef
|
837
|
|
655
|
|
446
|
|
Leases and
agricultural services
|
7
|
|
7
|
|
15
|
|
Consignment
costs
|
6
|
|
3
|
|
-
|
|
Commissions
|
11
|
|
12
|
|
8
|
|
Brokerage
operations
|
55
|
|
32
|
|
29
|
|
Others
|
9
|
|
7
|
|
8
|
|
Costs
of agricultural sales and services
|
3,564
|
|
3,233
|
|
2,532
|
|
Costs of leases and
services
|
2,432
|
|
1,224
|
|
1,129
|
|
Costs of trading
properties and developments
|
15
|
|
14
|
|
19
|
|
Costs from hotel
operations
|
381
|
|
278
|
|
216
|
|
Costs of sale of
communication equipment
|
1,304
|
|
-
|
|
-
|
|
Costs of
communication services
|
3,304
|
|
-
|
|
-
|
|
Costs of tourism
services
|
1,049
|
|
-
|
|
-
|
|
Costs of
supermarkets
|
13,867
|
|
-
|
|
-
|
|
Costs of sale and
developments
|
151
|
|
-
|
|
-
|
|
Total
costs
|
26,090
|
|
4,770
|
|
3,913
|
F- 168
Cresud Sociedad Anónima,
Comercial, Inmobiliaria, Financiera y Agropecuaria
Notes to the Consolidated
Financial Statements
(Continued)
(All amounts in
millions of Argentine Pesos, except otherwise
indicated)
30.
Expenses
by nature
The Group discloses
expenses in the statement of income by function of as part of the
line items “Costs”, “General and administrative
expenses” and “Selling expenses”.
The following
tables provide the additional required disclosure of expenses by
nature and their relationship to the function within the
Group.
|
|
June
30,
2016
|
|
June
30,
2015
|
|
June
30,
2014
|
|
Leases, services
charges and vacant property costs
|
142
|
|
45
|
|
54
|
|
Depreciation and
amortization
|
2,769
|
|
259
|
|
297
|
|
Doubtful
accounts
|
71
|
|
30
|
|
10
|
|
Advertising,
publicity and other selling expenses
|
964
|
|
238
|
|
184
|
|
Taxes, rates and
contributions
|
723
|
|
304
|
|
243
|
|
Maintenance and
repairs
|
1,135
|
|
436
|
|
336
|
|
Fees and payments
for services
|
2,092
|
|
286
|
|
252
|
|
Director´s
fees
|
207
|
|
134
|
|
124
|
|
Payroll and social
security liabilities
|
5,057
|
|
1,041
|
|
890
|
|
Cost of sale of
goods and services
|
14,861
|
|
63
|
|
61
|
|
Changes in
biological assets and agricultural produce
|
1,810
|
|
1,609
|
|
1,241
|
|
Supplies and
labor
|
1,135
|
|
1,113
|
|
886
|
|
Freights
|
159
|
|
138
|
|
90
|
|
Commissions and
expenses
|
21
|
|
28
|
|
19
|
|
Conditioning and
clearance
|
30
|
|
20
|
|
15
|
|
Travel expenses and
stationery
|
36
|
|
55
|
|
25
|
|
Management
fees
|
-
|
|
11
|
|
-
|
|
Export
expenses
|
25
|
|
-
|
|
-
|
|
Others
|
3,376
|
|
52
|
|
73
|
|
Total
|
34,613
|
|
5,862
|
|
4,800
|
F- 169
Cresud Sociedad Anónima,
Comercial, Inmobiliaria, Financiera y Agropecuaria
Notes to the Consolidated
Financial Statements
(Continued)
(All amounts in
millions of Argentine Pesos, except otherwise
indicated)
30.
Expenses by nature
(Continued)
For the year ended
June 30, 2016:
|
|
Group
costs
|
|
|
|
||||||||||
|
|
Cost
of agricultural sales and services
|
Cost
of agriculture production
|
Other
agricultural operative costs
|
Cost
of leases and services
|
Cost
of trading properties and developments
|
Cost
of
hotel
operations
|
Cost
of sale of communication equipment
|
Cost
of communication services
|
Cost
of tourism services
|
Cost
of
supermarkets
|
Total
costs
|
General
and administrative expenses
|
Selling
expenses
|
Total
|
|
Leases, services
charges and vacant property costs
|
33
|
1
|
-
|
47
|
1
|
2
|
-
|
-
|
45
|
-
|
129
|
9
|
4
|
142
|
|
Depreciation and
amortization
|
49
|
13
|
3
|
578
|
-
|
11
|
-
|
683
|
68
|
45
|
1,450
|
291
|
1,028
|
2,769
|
|
Doubtful
accounts
|
-
|
-
|
-
|
-
|
-
|
-
|
-
|
-
|
-
|
-
|
-
|
61
|
10
|
71
|
|
Advertising,
publicity and other selling expenses
|
-
|
-
|
-
|
282
|
-
|
-
|
-
|
-
|
-
|
-
|
282
|
-
|
682
|
964
|
|
Taxes, rates and
contributions
|
3
|
13
|
-
|
219
|
4
|
1
|
-
|
-
|
-
|
-
|
240
|
20
|
463
|
723
|
|
Maintenance and
repairs
|
17
|
24
|
1
|
611
|
8
|
57
|
-
|
-
|
61
|
-
|
779
|
79
|
277
|
1,135
|
|
Fees and payments
for services
|
173
|
5
|
1
|
17
|
-
|
15
|
-
|
675
|
-
|
-
|
886
|
456
|
750
|
2,092
|
|
Director´s
fees
|
-
|
-
|
-
|
-
|
-
|
-
|
-
|
-
|
-
|
-
|
-
|
207
|
-
|
207
|
|
Payroll and social
security liabilities
|
149
|
90
|
4
|
560
|
1
|
220
|
-
|
405
|
90
|
518
|
2,037
|
831
|
2,189
|
5,057
|
|
Cost of sale of
goods and services
|
-
|
-
|
-
|
40
|
152
|
48
|
1,304
|
13
|
-
|
13,304
|
14,861
|
-
|
-
|
14,861
|
|
Changes in
biological assets and agricultural produce
|
1,808
|
-
|
-
|
-
|
-
|
-
|
-
|
-
|
-
|
-
|
1,808
|
-
|
2
|
1,810
|
|
Supplies and
labor
|
78
|
1,056
|
-
|
-
|
-
|
-
|
-
|
-
|
-
|
-
|
1,134
|
-
|
1
|
1,135
|
|
Freights
|
1
|
13
|
-
|
-
|
-
|
-
|
-
|
-
|
-
|
-
|
14
|
-
|
145
|
159
|
|
Bank commissions
and expenses
|
10
|
-
|
-
|
-
|
-
|
-
|
-
|
-
|
-
|
-
|
10
|
7
|
4
|
21
|
|
Conditioning and
clearance
|
-
|
-
|
-
|
-
|
-
|
-
|
-
|
-
|
-
|
-
|
-
|
-
|
30
|
30
|
|
Travel and library
expenses
|
14
|
14
|
1
|
-
|
-
|
-
|
-
|
-
|
-
|
-
|
29
|
6
|
1
|
36
|
|
Export
expenses
|
-
|
-
|
-
|
-
|
-
|
-
|
-
|
-
|
-
|
-
|
-
|
-
|
25
|
25
|
|
Others
|
13
|
-
|
-
|
79
|
-
|
26
|
-
|
1,528
|
785
|
-
|
2,431
|
277
|
668
|
3,376
|
|
Total
expenses by nature
|
2,348
|
1,229
|
10
|
2,433
|
166
|
380
|
1,304
|
3,304
|
1,049
|
13,867
|
26,090
|
2,244
|
6,279
|
34,613
|
F- 170
Cresud Sociedad Anónima,
Comercial, Inmobiliaria, Financiera y Agropecuaria
Notes to the Consolidated
Financial Statements
(Continued)
(All amounts in
millions of Argentine Pesos, except otherwise
indicated)
30.
Expenses by nature
(Continued)
For the year ended
June 30, 2015:
|
|
Group
costs
|
|
|
|
|
|
|
||||||||||||
|
|
Cost
of
agricultural
sales and services
|
|
Cost
of agriculture production
|
|
Other
agricultural operative costs
|
|
Cost
of property operations
|
|
Cost
of trading properties and developments
|
|
Cost
of
hotel
operations
|
|
Total
costs
|
|
General
and administrative expenses
|
|
Selling
expenses
|
|
Total
|
|
Leases, services
charges and vacant property costs
|
14
|
|
-
|
|
-
|
|
17
|
|
1
|
|
-
|
|
32
|
|
10
|
|
3
|
|
45
|
|
Depreciation and
amortization
|
56
|
|
11
|
|
3
|
|
163
|
|
-
|
|
12
|
|
245
|
|
13
|
|
1
|
|
259
|
|
Doubtful
accounts
|
1
|
|
-
|
|
-
|
|
-
|
|
-
|
|
-
|
|
1
|
|
-
|
|
29
|
|
30
|
|
Advertising,
publicity and other selling expenses
|
-
|
|
-
|
|
-
|
|
173
|
|
-
|
|
7
|
|
180
|
|
-
|
|
58
|
|
238
|
|
Taxes, rates and
contributions
|
3
|
|
11
|
|
-
|
|
109
|
|
3
|
|
-
|
|
126
|
|
16
|
|
162
|
|
304
|
|
Maintenance and
repairs
|
13
|
|
21
|
|
-
|
|
326
|
|
7
|
|
34
|
|
401
|
|
32
|
|
3
|
|
436
|
|
Fees and payments
for services
|
151
|
|
6
|
|
-
|
|
9
|
|
1
|
|
1
|
|
168
|
|
110
|
|
8
|
|
286
|
|
Director´s
fees
|
-
|
|
-
|
|
-
|
|
-
|
|
-
|
|
-
|
|
-
|
|
134
|
|
-
|
|
134
|
|
Payroll and social
security liabilities
|
119
|
|
65
|
|
5
|
|
404
|
|
-
|
|
162
|
|
755
|
|
239
|
|
47
|
|
1,041
|
|
Cost of sale of
goods and services
|
-
|
|
-
|
|
-
|
|
-
|
|
2
|
|
61
|
|
63
|
|
-
|
|
-
|
|
63
|
|
Changes in
biological assets and agricultural produce
|
1,609
|
|
-
|
|
-
|
|
-
|
|
-
|
|
-
|
|
1,609
|
|
-
|
|
-
|
|
1,609
|
|
Supplies and
labor
|
14
|
|
1,094
|
|
1
|
|
-
|
|
-
|
|
-
|
|
1,109
|
|
-
|
|
4
|
|
1,113
|
|
Freights
|
2
|
|
12
|
|
-
|
|
-
|
|
-
|
|
-
|
|
14
|
|
-
|
|
124
|
|
138
|
|
Commissions and
expenses
|
9
|
|
-
|
|
-
|
|
-
|
|
-
|
|
-
|
|
9
|
|
15
|
|
4
|
|
28
|
|
Conditioning and
clearance
|
-
|
|
-
|
|
-
|
|
-
|
|
-
|
|
-
|
|
-
|
|
-
|
|
20
|
|
20
|
|
Travel and library
expenses
|
15
|
|
11
|
|
-
|
|
12
|
|
-
|
|
-
|
|
38
|
|
14
|
|
3
|
|
55
|
|
Management
fees
|
-
|
|
-
|
|
-
|
|
-
|
|
-
|
|
-
|
|
-
|
|
11
|
|
-
|
|
11
|
|
Others
|
7
|
|
-
|
|
-
|
|
12
|
|
-
|
|
1
|
|
20
|
|
24
|
|
8
|
|
52
|
|
Total
expenses by nature
|
2,013
|
|
1,231
|
|
9
|
|
1,225
|
|
14
|
|
278
|
|
4,770
|
|
618
|
|
474
|
|
5,862
|
F- 171
Cresud Sociedad Anónima,
Comercial, Inmobiliaria, Financiera y Agropecuaria
Notes to the Consolidated
Financial Statements
(Continued)
(All amounts in
millions of Argentine Pesos, except otherwise
indicated)
30.
Expenses by nature
(Continued)
For the year ended
June 30, 2014:
|
|
Group
costs
|
|
|
|
|
|
|
||||||||||||
|
|
Cost
of
agricultural
sales and services
|
|
Cost
of agriculture production
|
|
Other
agricultural operative costs
|
|
Cost
of property operations
|
|
Cost
of trading properties and developments
|
|
Cost
of
hotel
operations
|
|
Total
costs
|
|
General
and administrative expenses
|
|
Selling
expenses
|
|
Total
|
|
Leases, services
charges and vacant property costs
|
15
|
|
1
|
|
-
|
|
17
|
|
1
|
|
-
|
|
34
|
|
15
|
|
5
|
|
54
|
|
Depreciation and
amortization
|
46
|
|
8
|
|
3
|
|
217
|
|
1
|
|
11
|
|
286
|
|
9
|
|
2
|
|
297
|
|
Doubtful
accounts
|
-
|
|
-
|
|
-
|
|
-
|
|
-
|
|
-
|
|
-
|
|
-
|
|
10
|
|
10
|
|
Advertising,
publicity and other selling expenses
|
-
|
|
-
|
|
-
|
|
145
|
|
-
|
|
5
|
|
150
|
|
-
|
|
34
|
|
184
|
|
Taxes, rates and
contributions
|
2
|
|
9
|
|
-
|
|
87
|
|
2
|
|
-
|
|
100
|
|
14
|
|
129
|
|
243
|
|
Maintenance and
repairs
|
11
|
|
15
|
|
-
|
|
255
|
|
4
|
|
26
|
|
311
|
|
24
|
|
1
|
|
336
|
|
Fees and payments
for services
|
120
|
|
5
|
|
-
|
|
29
|
|
-
|
|
2
|
|
156
|
|
86
|
|
10
|
|
252
|
|
Director´s
fees
|
-
|
|
-
|
|
-
|
|
-
|
|
-
|
|
-
|
|
-
|
|
124
|
|
-
|
|
124
|
|
Payroll and social
security liabilities
|
93
|
|
56
|
|
6
|
|
362
|
|
-
|
|
121
|
|
638
|
|
213
|
|
39
|
|
890
|
|
Cost of sale of
goods and services
|
-
|
|
-
|
|
-
|
|
-
|
|
11
|
|
50
|
|
61
|
|
-
|
|
-
|
|
61
|
|
Changes in
biological assets and agricultural produce
|
1,240
|
|
-
|
|
-
|
|
-
|
|
-
|
|
-
|
|
1,240
|
|
-
|
|
1
|
|
1,241
|
|
Supplies and
labor
|
24
|
|
860
|
|
-
|
|
-
|
|
-
|
|
-
|
|
884
|
|
-
|
|
2
|
|
886
|
|
Freights
|
1
|
|
7
|
|
1
|
|
-
|
|
-
|
|
-
|
|
9
|
|
-
|
|
81
|
|
90
|
|
Commissions and
expenses
|
6
|
|
-
|
|
1
|
|
-
|
|
-
|
|
-
|
|
7
|
|
6
|
|
6
|
|
19
|
|
Conditioning and
clearance
|
-
|
|
-
|
|
-
|
|
-
|
|
-
|
|
-
|
|
-
|
|
-
|
|
15
|
|
15
|
|
Travel and library
expenses
|
13
|
|
7
|
|
-
|
|
-
|
|
-
|
|
-
|
|
20
|
|
4
|
|
1
|
|
25
|
|
Others
|
2
|
|
-
|
|
1
|
|
14
|
|
-
|
|
-
|
|
17
|
|
38
|
|
18
|
|
73
|
|
Total
expenses by nature
|
1,573
|
|
968
|
|
12
|
|
1,126
|
|
19
|
|
215
|
|
3,913
|
|
533
|
|
354
|
|
4,800
|
F- 172
Cresud Sociedad Anónima,
Comercial, Inmobiliaria, Financiera y Agropecuaria
Notes to the Consolidated
Financial Statements
(Continued)
(All amounts in
millions of Argentine Pesos, except otherwise
indicated)
31.
Employee
costs
|
|
June 30,
2016
|
|
June 30,
2015
|
|
June 30,
2014
|
|
Salaries, bonuses
and social security costs
|
4,880
|
|
999
|
|
785
|
|
Share-based
payments
|
48
|
|
31
|
|
95
|
|
Defined
contribution plan costs
|
17
|
|
11
|
|
10
|
|
Other costs and
employee benefits
|
112
|
|
-
|
|
-
|
|
Total
employee costs
|
5,057
|
|
1,041
|
|
890
|
32.
Other
operating results, net
|
|
June 30,
2016
|
|
June 30,
2015
|
|
June 30,
2014
|
|
(Loss) / Gain from
commodity derivative financial instruments
|
(77)
|
|
8
|
|
(15)
|
|
Tax on personal
assets
|
(6)
|
|
(15)
|
|
(14)
|
|
Gain from disposal
of interest in associates
|
4
|
|
22
|
|
-
|
|
Reversal of
currency translation adjustment (i)
|
97
|
|
188
|
|
-
|
|
Consulting
fees
|
1
|
|
4
|
|
-
|
|
Contingencies
(ii)
|
(5)
|
|
(29)
|
|
(18)
|
|
Donations
|
(58)
|
|
(40)
|
|
(34)
|
|
Project analysis
and assessment
|
-
|
|
-
|
|
(3)
|
|
Unrecoverable
VAT
|
-
|
|
(1)
|
|
|
|
Expenses related to
transfers of investment properties to subsidiaries
(iii)
|
-
|
|
(119)
|
|
-
|
|
Remediation income
at fair value from the interest held in an associate before
takeover
|
26
|
|
-
|
|
-
|
|
Others
|
(26)
|
|
(6)
|
|
9
|
|
Total
other operating results, net
|
(44)
|
|
12
|
|
(75)
|
(i)
As of June 30,
2016, Ps. 144 correspond to the reversal of currency translation
adjustment before business combination with IDBD and Ps. 4 to the
reversal of the translation reserve generated in Rigby, following
the partial repayment of principal of the company. As of June 30,
2015 pertains to the reversal of the translation reserve generated
in Rigby following the partial repayment of principal of the
company.
(ii)
Including costs and
legal expenses.
(iii)
On December 22,
2014, IRSA conveyed title on the properties located in Bouchard
710, Suipacha 652, BankBoston Tower, República Building,
Intercontinental Plaza Building and the plot of land next to the
latter, onto its subsidiary IRSA CP, which as from such date
continues to operate such properties. These transfers have had no
effects whatsoever in the consolidated financial statements of the
Group other than the expenses and taxes associated to the
transfer.
F- 173
Cresud Sociedad Anónima,
Comercial, Inmobiliaria, Financiera y Agropecuaria
Notes to the Consolidated
Financial Statements
(Continued)
(All amounts in
millions of Argentine Pesos, except otherwise
indicated)
33.
Financial
results, net
|
|
June 30,
2016
|
|
June 30,
2015
|
|
June 30,
2014
|
|
Financial
income
|
|
|
|
|
|
|
Interest
income
|
805
|
|
100
|
|
119
|
|
Foreign exchange
gains
|
1,097
|
|
124
|
|
154
|
|
Dividends
income
|
72
|
|
17
|
|
15
|
|
Financial
income
|
1,974
|
|
241
|
|
288
|
|
Financial
costs
|
|
|
|
|
|
|
Interest
expense
|
(2,739)
|
|
(874)
|
|
(715)
|
|
Foreign exchange
losses
|
(3,999)
|
|
(686)
|
|
(2,054)
|
|
Other financial
costs
|
(981)
|
|
(125)
|
|
(83)
|
|
Total
financial costs
|
(7,719)
|
|
(1,685)
|
|
(2,852)
|
|
Other
financial results:
|
|
|
|
|
|
|
Fair value (loss) /
gain on financial assets and liabilities at fair value through
profit or loss
|
(1,241)
|
|
188
|
|
379
|
|
Loss from
repurchase of Non-convertible Notes
|
(39)
|
|
(2)
|
|
(45)
|
|
Gain / (Loss) on
derivative financial instruments (except commodities)
|
1,089
|
|
(83)
|
|
(365)
|
|
Gain on the
revaluation of receivables arising from the sale of
farmland
|
33
|
|
53
|
|
21
|
|
Impairment of
investment properties and property, plant and
equipment
|
(352)
|
|
-
|
|
-
|
|
Total
other financial results
|
(510)
|
|
156
|
|
(10)
|
|
Total
financial results, net
|
(6,255)
|
|
(1,288)
|
|
(2,574)
|
34.
Earnings
per share
(a)
Basic
Basic earnings per
share amounts are calculated in accordance with IAS 33 by dividing
the profit attributable to equity holders of the Group by the
weighted average number of ordinary shares outstanding during the
year, excluding ordinary shares purchased by the Group and held as
treasury shares.
|
|
June
30,
2016
|
June
30,
2015
|
June
30,
2014
|
|
(Loss) / Gain
attributable to equity holders of the parent
|
(1,892)
|
(176)
|
(1,068)
|
|
Weighted average
number of ordinary shares in issue (in million)
|
495
|
492
|
496
|
|
Basic
earnings per share
|
(3.82)
|
0.36
|
(2.15)
|
F- 174
Cresud Sociedad Anónima,
Comercial, Inmobiliaria, Financiera y Agropecuaria
Notes to the Consolidated
Financial Statements
(Continued)
(All amounts in
millions of Argentine Pesos, except otherwise
indicated)
34.
Earnings per share
(Continued)
(b)
Diluted
Diluted earnings
per share amounts are calculated by adjusting the weighted average
number of ordinary shares outstanding to assume conversion of all
dilutive potential shares. As of June 30, 2016, 2015 and 2014 the
Group holds treasury shares with potentially dilutive effect. The
diluted earnings per share is as follows:
|
|
June
30,
2015
|
|
Gain attributable
to equity holders of the parent
|
176
|
|
Weighted average
number of ordinary shares in issue (in million)
|
554
|
|
Diluted
earnings per share
|
0.32
|
Since the Company
posted a loss for the years ended June 30, 2016 and 2014, there is
no diluted effect whatsoever.
35.
Related
party transactions
During the normal
course of business, the Group conducts transactions with different
entities or parties related to it.
As mentioned in
Note 3, on October 11, 2015, the Group took over IDBD. Before
takeover, the Group had entered into certain transactions with IDBD
as associate, mainly related to the subscription of warrants and/or
capital contributions, but had not conducted commercial
transactions. See Note 3 for further information related to
investment in IDBD.
Remunerations
of the Board of Directors
The Act No. 19,550
provides that the remuneration of the Board of Directors, where it
is not set forth in the Company’s by-laws, shall be fixed by
the Shareholders' Meetings. The maximum amount of remuneration that
the members of the Board are allowed to receive, including salary
and other performance-based remuneration of permanent
technical-administrative functions, may not exceed 25% of the
profits.
Such maximum amount
will be limited to 5% where no dividends are distributed to the
Shareholders, and will be increased proportionately to the
distribution, until reaching such cap where the total of profits is
distributed.
F- 175
Cresud Sociedad Anónima,
Comercial, Inmobiliaria, Financiera y Agropecuaria
Notes to the Consolidated
Financial Statements
(Continued)
(All amounts in
millions of Argentine Pesos, except otherwise
indicated)
35.
Related party transactions
(Continued)
Some of our
Directors are hired under the Employment Contract Act No. 20,744.
This Act rules on certain conditions of the work relationship,
including remuneration, salary protection, working hours,
vacations, paid leaves, minimum age requirements, workmen
protection and forms of suspension and contract
termination.
The remuneration of
directors for each fiscal year is based on the provisions
established by the Act No. 19,550, taking into consideration
whether such directors perform technical-administrative functions
and depending upon the results recorded by the Company during the
fiscal year.
Once such amounts
are determined, they should be approved by the Shareholders’
Meeting.
Senior
Management remuneration
The members of the
Senior or Top Management are appointed and removed by the Board of
Directors, and perform functions in accordance with the
instructions delivered by the Board itself.
The Society’s
Senior Management is composed of as follows:
|
Name
|
Date
of birth
|
Position
|
Actual
position since
|
|
Alejandro G.
Elsztain
|
03/31/1966
|
General
Manager
|
1994
|
|
Carlos
Blousson
|
09/21/1963
|
General Manager of
Operations in Argentina and Bolivia
|
2008
|
|
Matías I.
Gaivironsky
|
02/23/1976
|
Administrative and
Financial Manager
|
2011
|
|
Alejandro
Casaretto
|
10/15/1952
|
Regional
Agricultural Manager
|
2008
|
The remuneration
earned by Senior Management for their functions consists of an
amount that is fixed taking into account the manager's backgrounds,
capacity and experience, plus an annual bonus based on their
individual performance and the Group's results. Members of the
senior management participate in defined contribution and
share-based incentive plans that are described in Notes 24 and 25,
respectively.
The Senior
Management of the Operations Center in Israel is composed as
follows:
|
Name
|
Date
of birth
|
Position
|
Current
position held since
|
|
Sholem
Lapidot
|
10/22/1979
|
Chief Executive
Officer
|
2016
|
|
Gil
Kotler
|
04/10/1966
|
Chief Financial
Officer
|
2016
|
|
Aaron
Kaufman
|
03/03/1970
|
VP & General
Counsel
|
2015
|
Corporate
Service Agreement with IRSA and IRSA CP
Given that the
operating areas of our Company, IRSA and IRSA CP share certain
characteristics of affinity, the Board considered it was convenient
to implement alternatives that allows to reduce certain fixed
costs, with the aim of reducing their incidence on the operating
results, building on and enhancing the individual efficiencies of
each of the companies in the different areas that form part of
operating management.
F- 176
Cresud Sociedad Anónima,
Comercial, Inmobiliaria, Financiera y Agropecuaria
Notes to the Consolidated
Financial Statements
(Continued)
(All amounts in
millions of Argentine Pesos, except otherwise
indicated)
35.
Related party transactions
(Continued)
To such end, on
June 30, 2004, a Master Agreement for the Exchange of Corporate
Services (“Frame Agreement") was entered into between the
Company, IRSA and IRSA CP, which was amended on August 23, 2007,
August 14, 2008, November 27, 2009, March 12, 2010, July 11, 2011,
October 15, 2012, November 12, 2013, February 24, 2014, February
18, 2015 and November 12, 2015.
Under the current
Master Agreement corporate services are provided in the following
areas: Human Resources, Finance, Institutional Relations,
Administration and Control, Insurance, Security, Agreements,
Technical Tasks, Infrastructure and Services, Architecture and
Design, Development and Works, Real Estate, Hotels, Board of
Directors, Board of directors of Real Estate Business, General
Manager Office, Board Safety, Audit Committee, Real Estate Business
Management, Human Resources of Real Estate Business, Fraud
Prevention, Internal Audit, Planning, Shared Services Center,
Procurement and Environment and Quality.
Pursuant to this
agreement, the companies hired an external consulting firm to
review and evaluate half-yearly the criteria used in the process of
determining the amount of corporate services, as well as the basis
for distribution and source documentation used in the process
indicated above, by means of a half-yearly report.
It should be noted
that the operations indicated above allows our Company, IRSA and
IRSA CP to keep our strategic and commercial decisions fully
independent and confidential, with cost and profit apportionment
being made on the basis of operating efficiency and equity, without
pursuing individual economic benefits for any of the
companies.
Offices
and Shopping centers spaces leases
The offices of our
president are located at 108 Bolivar, in the Autonomous City of
Buenos Aires. The property has been rented to Isaac Elsztain e
Hijos S.A., a company controlled by some family members of Eduardo
Sergio Elsztain, our president, and to Hamonet S.A., a company
controlled by Fernando A. Elsztain, one of our directors, and some
of its family members.
In addition,
Tarshop, BACS, BHN Sociedad de Inversión S.A., BHN Seguros
Generales S.A. and BHN Visa S.A. rent offices owned by IRSA CP in
different buildings.
Furthermore, we
also let various spaces in our Shopping Centers (stores, stands,
storage space or advertising space) to third parties and related
parties such us Tarshop S.A. and BHSA.
Lease agreements
entered into with associates included similar provisions and
amounts to those included in agreements with third
parties.
F- 177
Cresud Sociedad Anónima,
Comercial, Inmobiliaria, Financiera y Agropecuaria
Notes to the Consolidated
Financial Statements
(Continued)
(All amounts in
millions of Argentine Pesos, except otherwise
indicated)
35.
Related party transactions
(Continued)
Donations
granted to Fundación IRSA and Fundación Museo de los
Niños
Fundación IRSA
is a non-profit charity institution that seeks to support and
generate initiatives concerning education, the promotion of
corporate social responsibility and the entrepreneurial spirit of
the youth. It carries out corporate volunteering programs and
fosters donations by the Group’s employees. The main members
of Fundación IRSA's Board of Directors are: Eduardo S.
Elsztain (President); Saul Zang (Vice President I), Alejandro
Elsztain (Vice President II) and Mariana C. de Elsztain
(secretary). It funds its activities with the donations made by us,
IRSA and IRSA CP. Fundación Museo de los Niños is a
non-profit association, created by the same founders of
Fundación IRSA and its Management Board is formed by the same
members as Fundación IRSA’s. Fundación Museo de los
Niños acts as special vehicle for the developments of "Museo
de los Niños, Abasto" and the "Museo de los Niños,
Rosario". On October 29, 1999, our shareholders approved the award
of the agreement “Museo de los Niños, Abasto” to
Fundación Museo de los Niños.
On October 31,
1997, IRSA CP entered into an agreement with Fundación IRSA
whereby it loaned 3,800 square meters of the area built in the
Abasto Shopping Center for a total term of 30 years, and on
November 29, 2005, shareholders of IRSA CP approved another
agreement entered into with Fundación Museo de los Niños
whereby 2,670.11 square meters built in the Shopping Center Alto
Rosario were loaned for a term of 30 years. Fundación IRSA has
used the available area to house the museum called “Museo de
los Niños, Abasto” an interactive learning center for
kids and adults, which was opened to the public in April
1999.
Legal
services
The Group hires
legal services from Estudio Zang, Bergel & Viñes, from
which Saúl Zang is a partner and sits at the Board of the
Group companies.
Purchase-Sale
of goods and/or services hiring
In
the normal course of its business and with the aim of make
resources more efficient, the Group, or its related parties,
including its parent company, in certain occasions purchase and/or
hire services which later sells and/or recover for companies or
other related parties, based upon their actual
utilization.
F- 178
Cresud Sociedad Anónima,
Comercial, Inmobiliaria, Financiera y Agropecuaria
Notes to the Consolidated
Financial Statements
(Continued)
(All amounts in
millions of Argentine Pesos, except otherwise
indicated)
35.
Related party transactions
(Continued)
Borrowings
In the normal
course of its activities, the Group enters into diverse loan
agreements or credit facilities between the group’s companies
and/or other related parties. These borrowings accrue interests at
market rates.
Financial
and service operations with BHSA
The
Company works with several financial entities in the Argentine
market for operations including, but not limited to, credit,
investment, purchase and sale of securities and financial
derivatives. Such entities include BHSA and its subsidiaries.
Furthermore, BHSA and BACS usually act as underwriters in Capital
Market transactions for the Company and its
subsidiaries.
In
addition, we have entered into agreements with BHSA, who provides
collection services for our Shopping Centers.
Transactions with IFISA
On February 10, 2015, Dolphin, sold 71,388,470
IDBD shares to IFISA, for an amount of US$ 25.6 million,
US$
4
million
of which were paid
upon execution and the remaining balance of US$ 21.6 million were
financed for a term of up to 360 days and priced at Libor 1M (one
month) + 3%
. On May 9, 2016, the
parties agreed to extend the expiration date for 30 days
as
from execution of the addenda
, to be
automatically renewable every 30 days for a maximum term of 180
days, and increasing the rate to 9% since February 10,
2016.
On
May 31, 2015, IRSA, through Dolphin, sold to IFISA 46 million of
warrants Series 4 for a total amount of NIS 0.46 million
(equivalent to US$ 0.12 million at the time of the transaction),
provided IFISA agreed to exercise them fully when Dolphin were so
required by IDBD.
On July 28, 2015,
the Group, through Dolphin granted a loan to IFISA for an amount of
US$ 7.2
million
, due in July
2016, which accrues interest at Libor 1M (one month) + 3%.
On May 9, the parties agreed to extend
the expiration date to June 8, 2016, to be automatically renewable
every 30 days for a maximum term of 180 days, and increased the
rate to 9%.
On October 9, 2015,
the Group, through REIG V granted a loan in the amount of US$ 40
million to IFISA.
The term of the loan
is one year calculated from the disbursement and bore interest at a
rate of 3% + Libor 1M, determined monthly.
On October 7,
2016, the Group extended the deadline for repayment within 30 days
from October 8, 2016, automatically renewable
for
periods of 30 days to a maximum of 180 days and settled interest at
a rate of 9% per annum.
F- 179
Cresud Sociedad Anónima,
Comercial, Inmobiliaria, Financiera y Agropecuaria
Notes to the Consolidated
Financial Statements
(Continued)
(All amounts in
millions of Argentine Pesos, except otherwise
indicated)
35.
Related party transactions
(Continued)
In
February 2016, DN B.V., a subsidiary of Dolphin, entered into an
option contract with IFISA whereby Dolphin is granted the right,
but not the obligation to acquire 92,665,925 shares of IDBD held by
IFISA at a share price of NIS 1.64 plus an annual interest of 8.5%.
The exercise date for the option extends for two
years.
In
June 2014, the Group – through Real Estate Investment Group
IV LP – renewed a credit facility granted by IFISA, a company
indirectly controlled by Eduardo Sergio Elsztain, for a total
amount of 1.4 million shares of Hersha Hospitality Trust. The
transaction was agreed upon for a term of 30 days, which could be
renewed for up to 360 days; the facility was priced at LIBOR (3
months) + 50 bp. This credit facility was cancelled after the end
of fiscal year 2014 in order to sell the remaining amount of
Hersha.
On June 30, 2016,
the Company had a credit facility with IFISA involving shares
and/or GDRs of IRSA for up to 3,500,000 GDRs. This credit facility
will expire in June 2017 and accrues interest at an annual fixed
rate of 6%.
On June 18, 2012,
Cresud signed a credit facility with IFISA for a maximum amount of
US$ 6, which expired on November 24, 2012, extended until November
24, 2015, at a rate of LIBOR (12 MONTH) + 300 bp.; the credit
facility was terminated on the expiration date.
Investment
in investment funds managed by BACS
San
Bernardo lease
We lease a rural
establishment in the Province of Córdoba, which is owned by
San Bernardo de Córdoba S.A. (previously denominated Isaac
Elsztain e hijos S.C.A.) pursuant to a lease agreement entered into
in August 2015, for a fraction of 12,600 hectares.
The consideration
for the lease was agreed at an amount equal to 3.5 kg of beef per
hectare. For computation purposes the price per kilo of beef
reported in the webpage of the Mercado de Hacienda de Liniers
(Cattle Market) is considered. In addition, a productivity premium
was agreed equal to 15% of the excess over 240,000 kilograms of
cattle in the establishment; this will be a one-off payment to be
effected in September 2016. The lease contract may be extended for
up to two annual periods. Currently, the parties are negotiating
the conditions for its extension.
F- 180
Cresud Sociedad Anónima,
Comercial, Inmobiliaria, Financiera y Agropecuaria
Notes to the Consolidated
Financial Statements
(Continued)
(All amounts in
millions of Argentine Pesos, except otherwise
indicated)
35.
Related party transactions
(Continued)
Consulting
Agreement
In accordance with
the terms of the Consulting Agreement, in force as from November 7,
1994, CAMSA provides us with advisory services on matters related
to capital expenditure in all areas of the agricultural business.
An 85% of the capital stock of CAMSA is held by one of our
shareholders and President of our Board of Directors, while the
remaining 15% of the capital stock is owned by our First Vice
President.
Based on the terms
and conditions of the Consulting Agreement, CAMSA provides us with
the following services:
●
advise in relation
to investing in all aspects of the agricultural business, including
sales, marketing, distribution, financing, investment, technology
and business proposals, among others;
●
acts on behalf of
our company in such transactions, negotiating prices, terms and
conditions and other terms of each transaction; and
●
provides advisory
services on investments in securities related to such
transactions.
The Consulting
Agreement expressly provides that CAMSA cannot provide advice on
transactions exclusively related to real property.
As regards the
Consulting Agreement, in consideration for its services we pay
CAMSA an annual fee equal to 10% of our annual net income after
tax. During fiscal years ended June 30, 2016 and 2014, no expense
was recorded in relation to this item, while in fiscal year 2015 we
paid Ps. 11,4.
The Consulting
Agreement can be revoked by any of the parties upon prior written
notice that should not exceed 60 days. If we revoke the Consulting
Agreement without cause, we will be liable to pay CAMSA twice the
average fee amounts paid for management services during the two
fiscal years preceding such revocation.
Sale
of advertising space in media
The Group
frequently enter into agreements with third parties whereby we
sell/acquire rights of use to advertise in media (TV, radio
stations, newspapers, etc.) that will later be used in advertising
campaigns. Normally, these spaces are sold and/or recovered to/from
other companies or other related parties, based on their actual
use.
F- 181
Cresud Sociedad Anónima,
Comercial, Inmobiliaria, Financiera y Agropecuaria
Notes to the Consolidated
Financial Statements
(Continued)
(All amounts in
millions of Argentine Pesos, except otherwise
indicated)
35.
Related party transactions
(Continued)
The
following is a summary of the balances with related parties as of
June 30, 2016:
|
Related
party
|
|
Description of
transaction
|
|
Investment in
financial assets
Non-current
|
|
Investment in
financial assets
Current
|
|
Trade and other
receivables Non-current
|
|
Trade and other
receivables Current
|
|
Trade and other
payables Current
|
|
Borrowings
Non-current
|
|
Borrowings
Current
|
|
Associates
|
|
|
|
|
|
|
|
|
|
|
|
|
|
|
|
|
|
Tarshop
|
|
Reimbursement of
expenses
|
|
-
|
|
-
|
|
-
|
|
1
|
|
-
|
|
-
|
|
-
|
|
|
|
Leases and/or
rights of use
|
|
-
|
|
-
|
|
-
|
|
-
|
|
(1)
|
|
-
|
|
-
|
|
New
Lipstick
|
|
Reimbursement of
expenses
|
|
-
|
|
-
|
|
-
|
|
4
|
|
-
|
|
-
|
|
-
|
|
Lipstick
|
|
Reimbursement of
expenses
|
|
-
|
|
-
|
|
-
|
|
1
|
|
-
|
|
-
|
|
-
|
|
Metropolitan
|
|
Reimbursement of
expenses
|
|
-
|
|
-
|
|
-
|
|
-
|
|
-
|
|
-
|
|
-
|
|
Agro-Uranga
S.A
|
|
Dividends
receivables
|
|
-
|
|
-
|
|
-
|
|
1
|
|
-
|
|
-
|
|
-
|
|
|
Brokerage
|
|
-
|
|
-
|
|
-
|
|
-
|
|
(1)
|
|
-
|
|
-
|
|
|
Agrofy
S.A.
|
|
Other
receivables
|
|
-
|
|
-
|
|
-
|
|
17
|
|
-
|
|
-
|
|
-
|
|
BHSA
|
|
Reimbursement of
expenses
|
|
-
|
|
-
|
|
-
|
|
1
|
|
(1)
|
|
-
|
|
-
|
|
|
Borrowings
|
|
-
|
|
-
|
|
-
|
|
-
|
|
-
|
|
(2)
|
|
(10)
|
|
|
BACS
|
|
Reimbursement of
expenses
|
|
-
|
|
-
|
|
-
|
|
1
|
|
-
|
|
-
|
|
-
|
|
|
|
Non-convertible
notes
|
|
100
|
|
21
|
|
-
|
|
-
|
|
-
|
|
-
|
|
-
|
|
Total
Associates
|
|
|
|
100
|
|
21
|
|
-
|
|
26
|
|
(3)
|
|
(2)
|
|
(10)
|
F- 182
Cresud Sociedad Anónima,
Comercial, Inmobiliaria, Financiera y Agropecuaria
Notes to the Consolidated
Financial Statements
(Continued)
(All amounts in
millions of Argentine Pesos, except otherwise
indicated)
35.
Related party transactions
(Continued)
|
Related
party
|
|
Description of
transaction
|
|
Investment in
financial assets
Non-current
|
|
Investment in
financial assets
Current
|
|
Trade and other
receivables Non-current
|
|
Trade and other
receivables Current
|
|
Trade and other
payables Current
|
|
Borrowings
Non-current
|
|
Borrowings
Current
|
|
Joint
Ventures
|
|
|
|
|
|
|
|
|
|
|
|
|
|
|
|
|
|
Cresca
S.A.
|
|
Loans
granted
|
|
-
|
|
-
|
|
162
|
|
-
|
|
-
|
|
-
|
|
-
|
|
Puerto
Retiro
|
|
Borrowings
|
|
-
|
|
-
|
|
-
|
|
3
|
|
-
|
|
-
|
|
-
|
|
NPSF
|
|
Reimbursement of
expenses
|
|
-
|
|
-
|
|
-
|
|
2
|
|
-
|
|
-
|
|
-
|
|
|
Borrowings
|
|
-
|
|
-
|
|
-
|
|
-
|
|
-
|
|
-
|
|
(6)
|
|
|
|
Share-based
payments
|
|
-
|
|
-
|
|
-
|
|
1
|
|
-
|
|
-
|
|
-
|
|
|
|
Management
fees
|
|
-
|
|
-
|
|
-
|
|
4
|
|
-
|
|
-
|
|
-
|
|
|
Quality
|
|
Reimbursement of
expenses
|
|
-
|
|
-
|
|
-
|
|
1
|
|
-
|
|
-
|
|
-
|
|
Cyrsa
|
|
Credit due to
capital reduction
|
|
-
|
|
-
|
|
-
|
|
3
|
|
-
|
|
-
|
|
-
|
|
Total
Joint Ventures
|
|
|
|
-
|
|
-
|
|
162
|
|
14
|
|
-
|
|
-
|
|
(6)
|
|
Other
related parties
|
|
|
|
|
|
|
|
|
|
|
|
|
|
|
|
|
|
CAMSA
|
|
Reimbursement of
expenses
|
|
-
|
|
-
|
|
-
|
|
9
|
|
-
|
|
-
|
|
-
|
|
Estudio Zang,
Bergel & Viñes
|
|
Legal
services
|
|
-
|
|
-
|
|
-
|
|
-
|
|
(1)
|
|
-
|
|
-
|
|
IFISA
|
|
Reimbursement of
expenses
|
|
-
|
|
-
|
|
-
|
|
1,074
|
|
-
|
|
-
|
|
-
|
|
|
|
Financial
operations
|
|
-
|
|
-
|
|
-
|
|
12
|
|
-
|
|
-
|
|
-
|
|
Museo de los
Niños
|
|
Leases and/or
rights of use
|
|
-
|
|
-
|
|
-
|
|
2
|
|
-
|
|
-
|
|
-
|
|
Boulevard Norte
S.A.
|
|
Reimbursement of
expenses
|
|
-
|
|
-
|
|
-
|
|
1
|
|
-
|
|
-
|
|
-
|
|
Ogden Argentina
S.A.
|
|
Borrowings
|
|
-
|
|
-
|
|
-
|
|
1
|
|
-
|
|
-
|
|
-
|
|
Consultores Venture
Capital Uruguay
|
|
Management
fees
|
|
-
|
|
-
|
|
-
|
|
2
|
|
-
|
|
-
|
|
-
|
|
Total
Other related parties
|
|
|
|
-
|
|
-
|
|
-
|
|
1,101
|
|
(1)
|
|
-
|
|
-
|
|
Directors
and Senior Management
|
|
|
|
|
|
|
|
|
|
|
|
|
|
|
|
|
|
Directors and
Senior Management
|
|
Fees
|
|
-
|
|
-
|
|
-
|
|
-
|
|
(29)
|
|
-
|
|
-
|
|
|
Advances
|
|
-
|
|
-
|
|
-
|
|
4
|
|
-
|
|
-
|
|
-
|
|
|
Total
Directors and Senior Management
|
|
|
|
-
|
|
-
|
|
-
|
|
4
|
|
(29)
|
|
-
|
|
-
|
|
Total
|
|
|
|
100
|
|
21
|
|
162
|
|
1,145
|
|
(33)
|
|
(2)
|
|
(16)
|
F- 183
Cresud Sociedad Anónima,
Comercial, Inmobiliaria, Financiera y Agropecuaria
Notes to the Consolidated
Financial Statements
(Continued)
(All amounts in
millions of Argentine Pesos, except otherwise
indicated)
35.
Related party transactions
(Continued)
The
following is a summary of the balances with related parties as of
June 30, 2015:
|
Related
party
|
|
Description of
transaction
|
|
Investment in
financial assets
Non-current
|
|
Trade and other
receivables Non-current
|
|
Trade and other
receivables Current
|
|
Trade and other
payables Current
|
|
Borrowings
Non-current
|
|
Borrowings
Current
|
|
Associates
|
|
|
|
|
|
|
|
|
|
|
|
|
|
|
|
Tarshop
|
|
Reimbursement of
expenses
|
|
-
|
|
-
|
|
2
|
|
-
|
|
-
|
|
-
|
|
|
|
Leases and/or
rights of use
|
|
-
|
|
-
|
|
-
|
|
(1)
|
|
-
|
|
-
|
|
New
Lipstick
|
|
Reimbursement of
expenses
|
|
-
|
|
-
|
|
3
|
|
-
|
|
-
|
|
-
|
|
Condor
|
|
Financial
operations
|
|
-
|
|
-
|
|
29
|
|
-
|
|
-
|
|
-
|
|
Lipstick
|
|
Reimbursement of
expenses
|
|
|
|
|
|
1
|
|
|
|
|
|
|
|
Agro-Uranga
S.A
|
|
Purchase of goods
and/or services
|
|
-
|
|
-
|
|
-
|
|
(1)
|
|
-
|
|
-
|
|
|
Sale of
inputs
|
|
-
|
|
-
|
|
1
|
|
-
|
|
-
|
|
-
|
|
|
BHSA
|
|
Advances
|
|
-
|
|
-
|
|
-
|
|
(1)
|
|
-
|
|
-
|
|
|
Borrowings
|
|
-
|
|
-
|
|
-
|
|
-
|
|
(8)
|
|
(22)
|
|
|
|
Leases and/or
rights of use
|
|
-
|
|
-
|
|
1
|
|
-
|
|
-
|
|
-
|
|
|
BACS
|
|
Reimbursement of
expenses
|
|
-
|
|
-
|
|
2
|
|
-
|
|
-
|
|
-
|
|
|
|
Non-convertible
notes
|
|
100
|
|
-
|
|
-
|
|
-
|
|
-
|
|
-
|
|
Total
Associates
|
|
|
|
100
|
|
-
|
|
39
|
|
(3)
|
|
(8)
|
|
(22)
|
F- 184
Cresud Sociedad Anónima,
Comercial, Inmobiliaria, Financiera y Agropecuaria
Notes to the Consolidated
Financial Statements
(Continued)
(All amounts in
millions of Argentine Pesos, except otherwise
indicated)
35.
Related party transactions
(Continued)
|
Related
party
|
|
Description of
transaction
|
|
Investment in
financial assets
Non-current
|
|
Trade and other
receivables Non-current
|
|
Trade and other
receivables Current
|
|
Trade and other
payables Current
|
|
Borrowings
Non-current
|
|
Borrowings
Current
|
|
Joint
Ventures
|
|
|
|
|
|
|
|
|
|
|
|
|
|
|
|
Cresca
S.A.
|
|
Loans
granted
|
|
-
|
|
114
|
|
-
|
|
-
|
|
-
|
|
-
|
|
Puerto
Retiro
|
|
Borrowings
|
|
-
|
|
-
|
|
2
|
|
-
|
|
-
|
|
-
|
|
NPSA
|
|
Reimbursement of
expenses
|
|
-
|
|
-
|
|
1
|
|
-
|
|
-
|
|
-
|
|
|
Borrowings
|
|
-
|
|
-
|
|
-
|
|
-
|
|
-
|
|
(8)
|
|
|
|
Leases and/or
rights of use
|
|
-
|
|
-
|
|
-
|
|
(1)
|
|
-
|
|
-
|
|
|
|
Management
fees
|
|
-
|
|
-
|
|
3
|
|
-
|
|
-
|
|
-
|
|
|
Baicom
|
|
Borrowings
|
|
-
|
|
1
|
|
-
|
|
-
|
|
-
|
|
-
|
|
|
|
Reimbursement of
expenses
|
|
-
|
|
-
|
|
1
|
|
-
|
|
-
|
|
-
|
|
Cyrsa
|
|
Credit due to
capital reduction
|
|
-
|
|
-
|
|
9
|
|
-
|
|
-
|
|
-
|
|
|
|
Borrowings
|
|
-
|
|
-
|
|
-
|
|
-
|
|
(14)
|
|
-
|
|
Total
Joint Ventures
|
|
|
|
-
|
|
115
|
|
16
|
|
(1)
|
|
(14)
|
|
(8)
|
|
Other
related parties
|
|
|
|
|
|
|
|
|
|
|
|
|
|
|
|
CAMSA
|
|
Management
fees
|
|
-
|
|
-
|
|
-
|
|
(7)
|
|
-
|
|
-
|
|
|
|
Reimbursement of
expenses
|
|
-
|
|
-
|
|
7
|
|
-
|
|
-
|
|
-
|
|
Estudio Zang,
Bergel & Viñes
|
|
Legal
services
|
|
-
|
|
-
|
|
-
|
|
(1)
|
|
-
|
|
-
|
|
IFISA
|
|
Financial
operations
|
|
-
|
|
-
|
|
323
|
|
-
|
|
-
|
|
-
|
|
Museo de los
Niños
|
|
Leases and/or
rights of use
|
|
-
|
|
-
|
|
1
|
|
-
|
|
-
|
|
-
|
|
Boulevard Norte
S.A.
|
|
Reimbursement of
expenses
|
|
-
|
|
-
|
|
1
|
|
-
|
|
-
|
|
-
|
|
Ogden Argentina
S.A.
|
|
Borrowings
|
|
-
|
|
-
|
|
1
|
|
-
|
|
-
|
|
-
|
|
Consultores Venture
Capital Uruguay
|
|
Management
fees
|
|
-
|
|
-
|
|
2
|
|
-
|
|
-
|
|
-
|
|
Total
Other related parties
|
|
|
|
-
|
|
-
|
|
335
|
|
(8)
|
|
-
|
|
-
|
|
Directors
and Senior Management
|
|
|
|
|
|
|
|
|
|
|
|
|
|
|
|
Directors and
Senior Management
|
|
Fees
|
|
|
|
|
|
|
|
(42)
|
|
-
|
|
-
|
|
Total
Directors and Senior Management
|
|
|
|
-
|
|
-
|
|
-
|
|
(42)
|
|
-
|
|
-
|
|
Total
|
|
|
|
100
|
|
115
|
|
390
|
|
(54)
|
|
(22)
|
|
(30)
|
F- 185
Cresud Sociedad Anónima,
Comercial, Inmobiliaria, Financiera y Agropecuaria
Notes to the Consolidated
Financial Statements
(Continued)
(All amounts in
millions of Argentine Pesos, except otherwise
indicated)
35.
Related party
transactions
(Continued)
The
following is a summary of the transactions with related parties for
the year ended as of June 30, 2016:
|
Related
party
|
|
Leases and/or
rights to use
|
|
Administration and
management fees
|
|
Sale of goods
and/or services
|
|
Compensation of
Directors and senior management
|
|
Legal
services
|
|
Financial
operations
|
|
Commissions
|
|
Donations
|
|
Associates
|
|
|
|
|
|
|
|
|
|
|
|
|
|
|
|
|
|
Agro-Uranga
S.A.
|
|
-
|
|
-
|
|
3
|
|
-
|
|
-
|
|
-
|
|
-
|
|
-
|
|
Tarshop
|
|
12
|
|
-
|
|
-
|
|
-
|
|
-
|
|
-
|
|
-
|
|
-
|
|
BACS
|
|
6
|
|
-
|
|
-
|
|
-
|
|
-
|
|
21
|
|
-
|
|
-
|
|
BHSA
|
|
3
|
|
-
|
|
-
|
|
-
|
|
-
|
|
(5)
|
|
-
|
|
-
|
|
Total
Associates
|
|
21
|
|
-
|
|
3
|
|
-
|
|
-
|
|
16
|
|
-
|
|
-
|
|
Joint
Ventures
|
|
|
|
|
|
|
|
|
|
|
|
|
|
|
|
|
|
Cyrsa
|
|
-
|
|
-
|
|
-
|
|
-
|
|
-
|
|
(3)
|
|
-
|
|
-
|
|
NPSA
|
|
-
|
|
3
|
|
-
|
|
-
|
|
-
|
|
(2)
|
|
-
|
|
-
|
|
Puerto
Retiro
|
|
-
|
|
-
|
|
-
|
|
-
|
|
-
|
|
1
|
|
-
|
|
-
|
|
Adama
|
|
-
|
|
-
|
|
16
|
|
|
|
|
|
|
|
|
|
|
|
ISPRO
|
|
-
|
|
-
|
|
9
|
|
|
|
|
|
|
|
|
|
|
|
Mehadrin
|
|
-
|
|
-
|
|
48
|
|
|
|
|
|
|
|
|
|
|
|
Total
Joint Ventures
|
|
-
|
|
3
|
|
73
|
|
-
|
|
-
|
|
(4)
|
|
-
|
|
-
|
|
Other
related parties
|
|
|
|
|
|
|
|
|
|
|
|
|
|
|
|
|
|
San Bernardo de
Córdoba S.A.
|
|
(1)
|
|
-
|
|
-
|
|
-
|
|
-
|
|
-
|
|
-
|
|
-
|
|
Fundación
IRSA
|
|
-
|
|
-
|
|
-
|
|
-
|
|
-
|
|
-
|
|
-
|
|
(8)
|
|
Hamonet
S.A.
|
|
(1)
|
|
-
|
|
-
|
|
-
|
|
-
|
|
-
|
|
-
|
|
-
|
|
Estudio Zang,
Bergel & Viñes
|
|
-
|
|
-
|
|
-
|
|
-
|
|
(6)
|
|
-
|
|
-
|
|
-
|
|
Isaac Elsztain e
Hijos S.C.A.
|
|
(1)
|
|
-
|
|
-
|
|
-
|
|
-
|
|
-
|
|
-
|
|
-
|
|
Condor
|
|
-
|
|
-
|
|
-
|
|
-
|
|
-
|
|
122
|
|
-
|
|
-
|
|
IFISA
|
|
-
|
|
-
|
|
-
|
|
-
|
|
-
|
|
39
|
|
-
|
|
-
|
|
Total
Other related parties
|
|
(3)
|
|
-
|
|
-
|
|
-
|
|
(6)
|
|
161
|
|
-
|
|
(8)
|
|
Directors
and Senior Management
|
|
|
|
|
|
|
|
|
|
|
|
|
|
|
|
|
|
Directors
|
|
-
|
|
-
|
|
-
|
|
(156)
|
|
-
|
|
-
|
|
-
|
|
-
|
|
Senior
Management
|
|
-
|
|
-
|
|
-
|
|
(16)
|
|
-
|
|
-
|
|
-
|
|
-
|
|
Total
Directors and Senior Management
|
|
-
|
|
-
|
|
-
|
|
(172)
|
|
-
|
|
-
|
|
-
|
|
-
|
|
Total
|
|
18
|
|
3
|
|
76
|
|
(172)
|
|
(6)
|
|
173
|
|
-
|
|
(8)
|
F- 186
Cresud Sociedad Anónima,
Comercial, Inmobiliaria, Financiera y Agropecuaria
Notes to the Consolidated
Financial Statements
(Continued)
(All amounts in
millions of Argentine Pesos, except otherwise
indicated)
35.
Related party
transactions
(Continued)
The
following is a summary of the transactions with related parties for
the year ended as of June 30, 2015:
|
Related
party
|
|
Leases and/or
rights to use
|
|
Administration and
management fees
|
|
Sale of goods
and/or services
|
|
Compensation of
Directors and senior management
|
|
Legal
services
|
|
Financial
operations
|
|
Commissions
|
|
Donations
|
|
Associates
|
|
|
|
|
|
|
|
|
|
|
|
|
|
|
|
|
|
Agro-Uranga
S.A.
|
|
-
|
|
-
|
|
8
|
|
-
|
|
-
|
|
-
|
|
-
|
|
-
|
|
Tarshop
|
|
9
|
|
-
|
|
-
|
|
-
|
|
-
|
|
-
|
|
-
|
|
-
|
|
BACS
|
|
4
|
|
-
|
|
-
|
|
-
|
|
-
|
|
-
|
|
-
|
|
-
|
|
BHSA
|
|
2
|
|
-
|
|
-
|
|
-
|
|
-
|
|
(15)
|
|
-
|
|
-
|
|
Total
Associates
|
|
15
|
|
-
|
|
8
|
|
-
|
|
-
|
|
(15)
|
|
-
|
|
-
|
|
Joint
Ventures
|
|
|
|
|
|
|
|
|
|
|
|
|
|
|
|
|
|
Cyrsa
|
|
-
|
|
-
|
|
-
|
|
-
|
|
-
|
|
(9)
|
|
-
|
|
-
|
|
NPSF
|
|
(1)
|
|
2
|
|
-
|
|
-
|
|
-
|
|
(1)
|
|
-
|
|
-
|
|
Puerto
Retiro
|
|
-
|
|
-
|
|
-
|
|
-
|
|
-
|
|
1
|
|
-
|
|
-
|
|
Total
Joint Ventures
|
|
(1)
|
|
2
|
|
-
|
|
-
|
|
-
|
|
(9)
|
|
-
|
|
-
|
|
Other
related parties
|
|
|
|
|
|
|
|
|
|
|
|
|
|
|
|
|
|
CAMSA
|
|
-
|
|
(11)
|
|
-
|
|
-
|
|
-
|
|
-
|
|
-
|
|
|
|
Fundación
IRSA
|
|
-
|
|
-
|
|
-
|
|
-
|
|
-
|
|
-
|
|
-
|
|
(5)
|
|
Estudio Zang,
Bergel & Viñes
|
|
-
|
|
-
|
|
-
|
|
-
|
|
(5)
|
|
-
|
|
-
|
|
-
|
|
Isaac Elsztain e
Hijos S.C.A.
|
|
(1)
|
|
-
|
|
-
|
|
-
|
|
-
|
|
-
|
|
-
|
|
-
|
|
Condor
|
|
-
|
|
-
|
|
-
|
|
-
|
|
-
|
|
161
|
|
-
|
|
-
|
|
IFISA
|
|
-
|
|
-
|
|
-
|
|
-
|
|
-
|
|
227
|
|
-
|
|
-
|
|
Total
Other related parties
|
|
(1)
|
|
(11)
|
|
-
|
|
-
|
|
(5)
|
|
388
|
|
-
|
|
(5)
|
|
Directors
and Senior Management
|
|
|
|
|
|
|
|
|
|
|
|
|
|
|
|
|
|
Directors
|
|
-
|
|
-
|
|
-
|
|
(134)
|
|
-
|
|
-
|
|
-
|
|
-
|
|
Senior
Management
|
|
-
|
|
-
|
|
-
|
|
(11)
|
|
-
|
|
-
|
|
-
|
|
-
|
|
Total
Directors and Senior Management
|
|
-
|
|
-
|
|
-
|
|
(145)
|
|
-
|
|
-
|
|
-
|
|
-
|
|
Total
|
|
13
|
|
(9)
|
|
8
|
|
(145)
|
|
(5)
|
|
364
|
|
-
|
|
(5)
|
F- 187
Cresud Sociedad Anónima,
Comercial, Inmobiliaria, Financiera y Agropecuaria
Notes to the Consolidated
Financial Statements
(Continued)
(All amounts in
millions of Argentine Pesos, except otherwise
indicated)
35.
Related party transactions
(Continued)
The
following is a summary of the transactions with related parties for
the year ended as of June 30, 2014:
|
Related
party
|
|
Leases and/or
rights to use
|
|
Administration and
management fees
|
|
Sale of goods
and/or services
|
|
Compensation of
Directors and senior management
|
|
Legal
services
|
|
Financial
operations
|
|
Donations
|
|
Associates
|
|
|
|
|
|
|
|
|
|
|
|
|
|
|
|
Agro-Uranga
S.A.
|
|
-
|
|
-
|
|
8
|
|
-
|
|
-
|
|
-
|
|
-
|
|
Tarshop
|
|
8
|
|
-
|
|
-
|
|
-
|
|
-
|
|
-
|
|
-
|
|
BACS
|
|
2
|
|
-
|
|
-
|
|
-
|
|
-
|
|
-
|
|
-
|
|
BHSA
|
|
1
|
|
-
|
|
-
|
|
-
|
|
-
|
|
26
|
|
-
|
|
Total
Associates
|
|
11
|
|
-
|
|
8
|
|
-
|
|
-
|
|
26
|
|
-
|
|
Joint
Ventures
|
|
|
|
|
|
|
|
|
|
|
|
|
|
|
|
Cyrsa
|
|
-
|
|
-
|
|
-
|
|
-
|
|
-
|
|
(21)
|
|
-
|
|
Cresca
S.A.
|
|
-
|
|
-
|
|
-
|
|
-
|
|
-
|
|
2
|
|
-
|
|
NPSF
|
|
(1)
|
|
1
|
|
-
|
|
-
|
|
-
|
|
-
|
|
-
|
|
Puerto
Retiro
|
|
-
|
|
-
|
|
-
|
|
-
|
|
-
|
|
1
|
|
-
|
|
Total
Joint Ventures
|
|
(1)
|
|
1
|
|
-
|
|
-
|
|
-
|
|
(18)
|
|
-
|
|
Other
related parties
|
|
|
|
|
|
|
|
|
|
|
|
|
|
|
|
Fundación
IRSA
|
|
-
|
|
-
|
|
-
|
|
-
|
|
-
|
|
-
|
|
(3)
|
|
Estudio Zang,
Bergel & Viñes
|
|
-
|
|
-
|
|
-
|
|
-
|
|
(4)
|
|
-
|
|
-
|
|
Isaac Elsztain e
Hijos S.C.A.
|
|
(1)
|
|
-
|
|
-
|
|
-
|
|
-
|
|
-
|
|
-
|
|
IFISA
|
|
-
|
|
-
|
|
-
|
|
-
|
|
-
|
|
22
|
|
-
|
|
Total
Other related parties
|
|
(1)
|
|
-
|
|
-
|
|
-
|
|
(4)
|
|
22
|
|
(3)
|
|
Directors
and Senior Management
|
|
|
|
|
|
|
|
|
|
|
|
|
|
|
|
Directors
|
|
-
|
|
-
|
|
-
|
|
(124)
|
|
-
|
|
-
|
|
-
|
|
Senior
Management
|
|
-
|
|
-
|
|
-
|
|
(30)
|
|
-
|
|
-
|
|
-
|
|
Total
Directors and Senior Management
|
|
-
|
|
-
|
|
-
|
|
(154)
|
|
-
|
|
-
|
|
-
|
|
Total
|
|
9
|
|
1
|
|
8
|
|
(154)
|
|
(4)
|
|
30
|
|
(3)
|
F- 188
Cresud Sociedad Anónima,
Comercial, Inmobiliaria, Financiera y Agropecuaria
Notes to the Consolidated
Financial Statements
(Continued)
(All amounts in
millions of Argentine Pesos, except otherwise
indicated)
36.
Cost
of sales and services provided
|
Description
|
Biological assets
|
Inventories
|
Agricultural services
|
Services and other operating costs
|
Trading properties
|
Hotels
|
Mobile phones
|
Supermarkets
|
Properties
|
Others
|
Total as of 06.30.16
|
Total as of 06.30.15
|
Total as of 06.30.14
|
|
Inventories as of 06.30.15
|
407
|
485
|
-
|
-
|
133
|
7
|
-
|
-
|
-
|
-
|
1,032
|
(i)
909
|
(ii)
583
|
|
|
|
|
|
|
|
|
|
|
|
|
|
|
|
|
Acquisition
for business combination
|
-
|
-
|
-
|
-
|
-
|
-
|
220
|
1,675
|
2,680
|
-
|
4,575
|
-
|
-
|
|
Initial
recognition and changes in the fair value of biological assets and
agricultural produce at the point of harvest
|
267
|
(95)
|
-
|
-
|
-
|
-
|
-
|
-
|
-
|
-
|
172
|
182
|
140
|
|
|
|
|
|
|
|
|
|
|
|
|
|
|
|
|
Changes
in the net realizable value of agricultural produce after
harvest
|
-
|
208
|
-
|
-
|
-
|
-
|
-
|
-
|
-
|
-
|
208
|
(34)
|
(17)
|
|
|
|
|
|
|
|
|
|
|
|
|
|
|
|
|
Decrease
due to harvest
|
-
|
1,247
|
-
|
-
|
-
|
-
|
-
|
-
|
-
|
-
|
1,247
|
1,228
|
1,029
|
|
Acquisitions
and classifications
|
32
|
1,501
|
-
|
-
|
-
|
-
|
1,233
|
13,304
|
191
|
-
|
16,261
|
1,255
|
1,144
|
|
Consume
|
(1)
|
(617)
|
-
|
-
|
-
|
-
|
-
|
-
|
-
|
-
|
(618)
|
(605)
|
(517)
|
|
Additions
|
-
|
-
|
-
|
-
|
71
|
-
|
-
|
-
|
354
|
-
|
425
|
1
|
13
|
|
Impairments
|
-
|
-
|
-
|
-
|
-
|
-
|
-
|
-
|
(158)
|
-
|
(158)
|
-
|
-
|
|
Disposals
|
-
|
-
|
-
|
-
|
(2)
|
1
|
-
|
-
|
-
|
-
|
(1)
|
(1)
|
(12)
|
|
Transfers
|
|
|
|
|
|
|
|
|
|
|
|
3
|
-
|
|
Expenses
incurred
|
-
|
118
|
81
|
1,645
|
15
|
361
|
3,292
|
621
|
644
|
1,224
|
8,001
|
1,666
|
1,495
|
|
Exchange
difference
|
-
|
(68)
|
-
|
-
|
49
|
-
|
107
|
1,214
|
1,580
|
4
|
2,886
|
(46)
|
(11)
|
|
Inventories as of 06.30.16
|
(567)
|
(650)
|
-
|
-
|
(251)
|
(8)
|
(327)
|
(2,888)
|
(4,462)
|
(27)
|
(9,180)
|
(iv)
(1,030)
|
(907)
|
|
Costs as of 06.30.16
|
138
|
2,129
|
81
|
1,645
|
15
|
361
|
4,525
|
13,926
|
829
|
1,201
|
24,850
|
-
|
-
|
|
Costs as of 06.30.15
|
128
|
1,825
|
59
|
1,224
|
14
|
278
|
|
|
|
-
|
-
|
3,528
|
-
|
|
Costs as of 06.30.14
|
76
|
1,444
|
54
|
1,130
|
19
|
216
|
|
|
|
1
|
-
|
|
2,940
|
(i) Includes
Ps. (13) corresponding to materials of IRSA and FYO and Ps. (2) of
meet due for slaughtering of Cactus as of June 30,
2014.
(ii) Includes
Ps. (10) corresponding to materials and inputs of IRSA as of June
30, 2013.
(iii) Includes
Ps. (11) corresponding to materials and inputs of IRSA as of June
30, 2012.
(iv) Includes
Ps. (18) corresponding to materials and inputs of IRSA and FYO and
Ps. (2) of meet due for slaughtering of SACPSA as of June 30, 2015.
Does not include Ps. 0.7 corresponding to fattening.
F- 189
Cresud Sociedad Anónima,
Comercial, Inmobiliaria, Financiera y Agropecuaria
Notes to the Consolidated
Financial Statements
(Continued)
(All amounts in
millions of Argentine Pesos, except otherwise
indicated)
37.
Foreign
currency assets and liabilities
Book
amounts of foreign currency assets and liabilities are as
follows:
|
Items
(3)
|
|
Amount
of foreign currency (2)
|
|
Prevailing
exchange rate (1)
|
|
Total
as of 06.30.16
|
|
Amount
of foreign currency (2)
|
|
Prevailing
exchange rate (1)
|
|
Total
as of 06.30.15
|
|
Assets
|
|
|
|
|
|
|
|
|
|
|
|
|
|
Trade and other receivables
|
|
|
|
|
|
|
|
|
|
|
|
|
|
Uruguayan
Peso
|
|
3
|
|
0.334
|
|
1
|
|
-
|
|
0.335
|
|
-
|
|
US
Dollar
|
|
43
|
|
14.940
|
|
637
|
|
29
|
|
8.988
|
|
263
|
|
Euros
|
|
12
|
|
16.492
|
|
195
|
|
-
|
|
10.005
|
|
-
|
|
Trade and other receivables related parties
|
|
|
|
|
|
|
|
|
|
|
|
|
|
US
Dollar
|
|
42
|
|
15.040
|
|
635
|
|
10
|
|
9.088
|
|
93
|
|
Total trade and other receivables
|
|
|
|
|
|
1,468
|
|
|
|
|
|
356
|
|
Investment in financial assets
|
|
|
|
|
|
|
|
|
|
|
|
|
|
US
Dollar
|
|
166
|
|
14.940
|
|
2,477
|
|
27
|
|
8.988
|
|
240
|
|
New
Israel Shekel
|
|
-
|
|
-
|
|
-
|
|
3
|
|
2.407
|
|
6
|
|
Pounds
|
|
1
|
|
19.763
|
|
19
|
|
1
|
|
14.134
|
|
10
|
|
Investment in financial assets
|
|
|
|
|
|
|
|
|
|
|
|
|
|
US
Dollar
|
|
33
|
|
14.940
|
|
499
|
|
|
|
|
|
-
|
|
Total Investment in financial assets
|
|
|
|
|
|
2,995
|
|
|
|
|
|
256
|
|
Derivative financial instruments
|
|
|
|
|
|
|
|
|
|
|
|
|
|
US
Dollar
|
|
1
|
|
14.940
|
|
15
|
|
1
|
|
8.988
|
|
10
|
|
New
Israel Shekel
|
|
-
|
|
-
|
|
-
|
|
95
|
|
2.407
|
|
228
|
|
Financial instruments related parties
|
|
|
|
|
|
|
|
|
|
|
|
|
|
US
Dollar
|
|
-
|
|
-
|
|
-
|
|
3
|
|
9.088
|
|
29
|
|
Total derivative financial instruments
|
|
|
|
|
|
15
|
|
|
|
|
|
267
|
|
Cash and cash equivalents
|
|
|
|
|
|
|
|
|
|
|
|
|
|
Uruguayan
Peso
|
|
-
|
|
-
|
|
-
|
|
-
|
|
0.335
|
|
-
|
|
US
Dollar
|
|
84
|
|
14.940
|
|
1,260
|
|
39
|
|
8.988
|
|
349
|
|
Euros
|
|
4
|
|
16.492
|
|
60
|
|
-
|
|
10.005
|
|
1
|
|
New
Israel Shekel
|
|
-
|
|
-
|
|
-
|
|
1
|
|
2.407
|
|
2
|
|
Total Cash and cash equivalents
|
|
|
|
|
|
1,320
|
|
|
|
|
|
352
|
F- 190
Cresud Sociedad Anónima,
Comercial, Inmobiliaria, Financiera y Agropecuaria
Notes to the Consolidated
Financial Statements
(Continued)
(All amounts in
millions of Argentine Pesos, except otherwise
indicated)
37.
Foreign currency assets and liabilities
(Continued)
|
Items
(3)
|
|
Amount
of foreign currency (2)
|
|
Prevailing
exchange rate (1)
|
|
Total
as of 06.30.16
|
|
Total
as of 06.30.15
|
|
Prevailing
exchange rate (1)
|
|
Amount
of foreign currency (2)
|
|
Liabilities
|
|
|
|
|
|
|
|
|
|
|
|
|
|
Trade and other payables
|
|
|
|
|
|
|
|
|
|
|
|
|
|
New
Israel Shekel
|
|
2
|
|
3.892
|
|
7
|
|
-
|
|
-
|
|
-
|
|
US
Dollar
|
|
100
|
|
15.040
|
|
1,502
|
|
13
|
|
9.088
|
|
118
|
|
Euros
|
|
3
|
|
16.640
|
|
54
|
|
-
|
|
-
|
|
-
|
|
Trade and other payables related parties
|
|
|
|
|
|
|
|
|
|
|
|
|
|
US
Dollar
|
|
2
|
|
15.040
|
|
31
|
|
-
|
|
-
|
|
-
|
|
Total trade and other payables
|
|
|
|
|
|
1,594
|
|
|
|
|
|
118
|
|
Borrowings
|
|
|
|
|
|
|
|
|
|
|
|
|
|
US
Dollar
|
|
1,945
|
|
15.040
|
|
29,246
|
|
616
|
|
9.088
|
|
5,598
|
|
Total borrowings
|
|
|
|
|
|
29,246
|
|
|
|
|
|
5,598
|
|
Derivative financial instruments
|
|
|
|
|
|
|
|
|
|
|
|
|
|
US
Dollar
|
|
1
|
|
15.040
|
|
19
|
|
1
|
|
9.088
|
|
9
|
|
New
Israel Shekel
|
|
-
|
|
-
|
|
-
|
|
210
|
|
2.3809
|
|
500
|
|
Total derivative financial instruments
|
|
|
|
|
|
19
|
|
|
|
|
|
509
|
(1)
Exchange
rate as of June 30, 2016 and 2015 according to Banco Nación
Argentina records.
(2)
Considering
foreign currencies those that differ from each Group’s
functional currency at each year-end.
(3)
The
Group uses derivative instruments as complement in order to reduce
its exposure to exchange rate movements. See Note 19.
38.
Negative
working capital
At the end of the
year, the Group carried a working capital deficit of Ps. 478 whose
treatment is being considered by the Board of Directors and the
respective Management.
39.
Subsequent
events
●
Sale
of farmlands
On July 5, 2016,
Cresud has sold the field “El Invierno” and “La
Esperanza” of 2,615 hectares of agricultural activity located
in “Rancul”, province of La Pampa. The total amount of
the transaction was fixed at US$ 6 million (equivalents to Ps.
90.1), US$ 5 million (equivalents to Ps. 75.1) of which have been
paid while the remaining balance of US$ 1 million (equivalents to
Ps. 15) – secured by a mortgage on the property – will
be paid in five equal, consecutive, annual installments, with the
last being due in August 2021. The estimated gain is Ps. 78.5 and
has been recorded in the first quarter of the fiscal year
2017.
F- 191
Cresud Sociedad Anónima,
Comercial, Inmobiliaria, Financiera y Agropecuaria
Notes to the Consolidated
Financial Statements
(Continued)
(All amounts in
millions of Argentine Pesos, except otherwise
indicated)
39.
Subsequent events
(Continued)
●
Acquisition
of equity interest in EHSA
On July 6, 2016,
the Group through IRSA CP acquired from FEG Entretenimientos S.A. a
25% shareholding in EHSA. The transaction amount for the
acquisition was set at Ps. 66.5, 50% of the amount has already been
paid while the remaining balance will be paid down in two equal
installments payable within 60 and 90 days. Later, the Group sold a
5% of the shares in the sum of Ps. 13.45. A 50% of that amount has
already been received. The remaining balance will be received in
two equal installments within 60 and 90 days. As a result, IRSA CP
holds 70% of the voting stock of EHSA, company whose main asset
consists of an indirect interest of 25% in LRSA.
●
Sale
of units in Intercontinental Building
On July 29, 2016,
IRSA Propiedades Comerciales executed a bill of sale for 1,702
square meters corresponding to two office floors and 16 parking
units in the Intercontinental Plaza building to an unrelated party.
The transaction amount was agreed upon at US$ 6.01 million: the sum
of US$ 1.60 million has already been paid, while the remaining
balance will be paid upon execution of the deed of conveyance and
delivery of possession.
●
IRSA
Non-convertible notes Classes VII and VIII
On September 1,
2016, Non-Convertible Notes Class VII and VIII were tendered under
the Program approved by the Shareholders’ Meeting for up to
US$ 300 million. The settlement took place on September 8, 2016.
The results of the offer are shown below:
Non-convertible
notes Class VII for an amount of Ps. 384.2 to be matured 36 months
after the issuing date, which accrue interest at an annual floating
interest rate, Badlar plus 299 basis points, interest payable on a
quarterly basis. Principal will be amortized in only one
installment due on September 9, 2019.
Non-convertible
notes Class VIII for a nominal value of US$ 184.5 million to be
matured 36 months after the issuing date, paid in and payable in US
Dollars, which will accrue interest at an annual fixed interest
rate of 7.0%, interest payable on a quarterly basis. Principal will
be amortized in only one installment due on September 9,
2019.
●
Non-convertible
notes in IDBD and subsidiaries
In July 2016,
Shufersal acquired Non-Convertible Notes Series B for a nominal
value of NIS 511 million with an increase of the issue of
Non-Convertible Notes Series F by a ratio of 1.175 for each NIS 1
of the Series B. The Non-Convertible Notes Series B acquired by
Shufersal were cancelled and delisted.
F- 192
Cresud Sociedad Anónima,
Comercial, Inmobiliaria, Financiera y Agropecuaria
Notes to the Consolidated
Financial Statements
(Continued)
(All amounts in
millions of Argentine Pesos, except otherwise
indicated)
40.
Subsequent events
(Continued)
●
Increase
stake in Shufersal
DIC acquired, on
September 12, 2016, 9,097,127 shares of Shufersal, such that the
amount of the company’s holdings in the issued capital of
Shufersal rose from approximately 53.89% to approximately 58.17%
(and approximately 56.61% in full dilution), for a total
consideration of NIS 133 million from the Bronfman-Fisher Group. It
also received an option (‘the option’) for the
acquisition of up to 9,097,127 additional shares of Shufersal that
the Bronfman-Fisher Group owns, at a strike price of NIS 14.62 for
each share of Shufersal (subject to accepted adjustments). The
option will be valid until December 12, 2016. In addition, when the
parties signed the agreement, it was determined that the directors
of Shufersal that were appointed by the Bronfman-Fisher Group would
give it notices of resignation from Shufersal’s Board of
Directors, with immediate effect.
●
Open
Sky Ltd. (IDB Tourism)
IDB Tourism is
involved in negotiations for the sale of its holdings in Open Sky
Ltd., under terms which have not yet been fully
formulated.
F- 193
Cresud Sociedad Anónima,
Comercial, Inmobiliaria, Financiera y Agropecuaria
Notes to the Consolidated
Financial Statements
(Continued)
(All amounts in
millions of Argentine Pesos, except otherwise
indicated)
Schedule
I
The following is a
summary of The Group´s investments in real state as of June
30, 2016 prepared in accordance with SEC Regulation S-X
12-28
|
|
|
|
|
Initial Costs
|
|
Subsequent Costs
|
|
Costs at year - end
|
|
|
|
|
|
|
|
|
|
|
||||||
|
Name
|
|
Encumbrances
|
|
Plot of land
|
|
Buildings, facilities and improvements (i)
|
|
Improvements / Additions / Disposals / Transfers Plot
|
|
Plot of land
|
|
Buildings, facilities and improvements (i)
|
|
Total
|
|
Accumulated depreciation
|
|
Net book value
|
|
Date of construction
|
|
Date of acquisition
|
|
Useful life as of 06.30.016
|
|
Shopping Center Properties:
|
|
|
|
|
|
|
|
|
|
|
|
|
|
|
|
|
|
|
|
|
|
|
|
|
|
Centro operaciones Argentina
|
|
|
|
|
|
|
|
|
|
|
|
|
|
|
|
|
|
|
|
|
|
|
|
|
|
Abasto
de Buenos Aires
|
|
-
|
|
10
|
|
455
|
|
16
|
|
10
|
|
471
|
|
481
|
|
(222)
|
|
259
|
|
nov-1998
|
|
Jul-1994
|
|
16
|
|
Alto
Palermo Shopping
|
|
-
|
|
9
|
|
583
|
|
14
|
|
9
|
|
597
|
|
606
|
|
(397)
|
|
209
|
|
oct-1990
|
|
Nov-1997
|
|
14
|
|
Alto
Avellaneda
|
|
-
|
|
18
|
|
312
|
|
31
|
|
18
|
|
343
|
|
361
|
|
(233)
|
|
128
|
|
oct-1995
|
|
Dec-1997
|
|
11
|
|
Alcorta
Shopping
|
|
-
|
|
11
|
|
213
|
|
16
|
|
11
|
|
229
|
|
240
|
|
(117)
|
|
123
|
|
jun-1992
|
|
Jun-1997
|
|
15
|
|
Alto
Noa
|
|
-
|
|
-
|
|
71
|
|
8
|
|
-
|
|
79
|
|
79
|
|
(46)
|
|
33
|
|
sep-1994
|
|
Mar-1995
|
|
13
|
|
Buenos
Aires Design
|
|
-
|
|
-
|
|
74
|
|
9
|
|
-
|
|
83
|
|
83
|
|
(77)
|
|
6
|
|
nov-1993
|
|
Nov-1997
|
|
2
|
|
Patio
Bullrich
|
|
-
|
|
10
|
|
206
|
|
11
|
|
10
|
|
217
|
|
227
|
|
(124)
|
|
103
|
|
sep-1988
|
|
Oct-1998
|
|
16
|
|
Alto
Rosario
|
|
-
|
|
26
|
|
140
|
|
21
|
|
26
|
|
161
|
|
187
|
|
(58)
|
|
129
|
|
nov-2004
|
|
Nov-2004
|
|
18
|
|
Mendoza
Plaza
|
|
-
|
|
11
|
|
174
|
|
12
|
|
11
|
|
186
|
|
197
|
|
(104)
|
|
93
|
|
jun-1994
|
|
Dec-1994
|
|
15
|
|
Dot
Baires Shopping
|
|
-
|
|
85
|
|
331
|
|
96
|
|
85
|
|
427
|
|
512
|
|
(138)
|
|
374
|
|
may-2009
|
|
Nov-2006
|
|
24
|
|
Córdoba
Shopping
|
|
Antichresis
|
|
1
|
|
104
|
|
1
|
|
1
|
|
105
|
|
106
|
|
(57)
|
|
49
|
|
mar-1990
|
|
Dec-2006
|
|
14
|
|
Distrito
Arcos
|
|
-
|
|
-
|
|
-
|
|
305
|
|
-
|
|
305
|
|
305
|
|
(26)
|
|
279
|
|
-
|
|
Nov-2009
|
|
15
|
|
Alto
Comahue
|
|
-
|
|
1
|
|
12
|
|
328
|
|
1
|
|
340
|
|
341
|
|
(22)
|
|
319
|
|
-
|
|
May-2006
|
|
30
|
|
Patio
Olmos
|
|
-
|
|
12
|
|
22
|
|
1
|
|
12
|
|
23
|
|
35
|
|
(9)
|
|
26
|
|
may-1995
|
|
Sep-2007
|
|
17
|
|
Soleil
Premium Outlet
|
|
-
|
|
23
|
|
56
|
|
38
|
|
23
|
|
94
|
|
117
|
|
(37)
|
|
80
|
|
-
|
|
Jul-2010
|
|
14
|
|
Total Shopping Center Properties
|
|
-
|
|
217
|
|
2,753
|
|
907
|
|
217
|
|
3,660
|
|
3,877
|
|
(1,667)
|
|
2,210
|
|
|
|
|
|
|
|
Office buildings and Other Rental Properties
Portfolio:
|
|
|
|
|
|
|
|
|
|
|
|
|
|
|
|
|
|
|
|
|
|
|
|
|
|
Centro operaciones Argentina
|
|
|
|
|
|
|
|
|
|
|
|
|
|
|
|
|
|
|
|
|
|
|
|
|
|
Alto
Palermo Shopping Annex
|
|
-
|
|
-
|
|
38
|
|
-
|
|
-
|
|
38
|
|
38
|
|
(8)
|
|
30
|
|
-
|
|
|
|
|
|
Dot
Building
|
|
-
|
|
13
|
|
75
|
|
56
|
|
13
|
|
131
|
|
144
|
|
(23)
|
|
121
|
|
sep-2010
|
|
Nov-2006
|
|
28
|
|
Anchorena
559
|
|
-
|
|
1
|
|
6
|
|
-
|
|
1
|
|
6
|
|
7
|
|
(4)
|
|
3
|
|
n/a
|
|
n/a
|
|
n/a
|
|
Anchorena
665
|
|
-
|
|
2
|
|
9
|
|
-
|
|
2
|
|
9
|
|
11
|
|
(1)
|
|
10
|
|
n/a
|
|
n/a
|
|
n/a
|
|
Zelaya
3102
|
|
-
|
|
1
|
|
-
|
|
-
|
|
1
|
|
-
|
|
1
|
|
-
|
|
1
|
|
n/a
|
|
n/a
|
|
n/a
|
|
Bouchard
710
|
|
-
|
|
40
|
|
49
|
|
2
|
|
40
|
|
51
|
|
91
|
|
(12)
|
|
79
|
|
-
|
|
Jun-2005
|
|
24
|
|
Bouchard
551
|
|
-
|
|
5
|
|
6
|
|
1
|
|
5
|
|
7
|
|
12
|
|
(3)
|
|
9
|
|
-
|
|
Mar-2007
|
|
28
|
|
Dique
IV
|
|
-
|
|
-
|
|
6
|
|
(6)
|
|
-
|
|
-
|
|
-
|
|
-
|
|
-
|
|
n/a
|
|
n/a
|
|
n/a
|
|
Intercontinental
Plaza (i)
|
|
-
|
|
2
|
|
120
|
|
(82)
|
|
2
|
|
38
|
|
40
|
|
(28)
|
|
12
|
|
jun-1996
|
|
Nov-1997
|
|
23
|
|
Libertador
498
|
|
-
|
|
1
|
|
6
|
|
1
|
|
1
|
|
7
|
|
8
|
|
(4)
|
|
4
|
|
n/a
|
|
n/a
|
|
n/a
|
F- 194
Cresud Sociedad Anónima,
Comercial, Inmobiliaria, Financiera y Agropecuaria
Notes to the Consolidated
Financial Statements
(Continued)
(All amounts in
millions of Argentine Pesos, except otherwise
indicated)
Schedule I
(Continued)
|
|
|
|
|
Initial Costs
|
|
Subsequent Costs
|
|
Costs at year - end
|
|
|
|
|
|
|
|
|
|
|
||||||
|
Name
|
|
Encumbrances
|
|
Plot of land
|
|
Buildings, facilities and improvements (i)
|
|
Improvements / Additions / Disposals / Transfers Plot
|
|
Plot of land
|
|
Buildings, facilities and improvements (i)
|
|
Total
|
|
Accumulated depreciation
|
|
Net book value
|
|
Date of construction
|
|
Date of acquisition
|
|
Useful life as of 06.30.016
|
|
Office buildings and Other Rental Properties
Portfolio:
|
|
|
|
|
|
|
|
|
|
|
|
|
|
|
|
|
|
|
|
|
|
|
|
|
|
Maipú
1300
|
|
-
|
|
2
|
|
15
|
|
(5)
|
|
2
|
|
10
|
|
12
|
|
(6)
|
|
6
|
|
n/a
|
|
n/a
|
|
n/a
|
|
Suipacha
664
|
|
-
|
|
3
|
|
12
|
|
2
|
|
3
|
|
14
|
|
17
|
|
(5)
|
|
12
|
|
n/a
|
|
n/a
|
|
n/a
|
|
Bank
Boston Tower
|
|
-
|
|
78
|
|
56
|
|
-
|
|
78
|
|
56
|
|
134
|
|
(4)
|
|
130
|
|
-
|
|
Aug-2007
|
|
25
|
|
República
Building
|
|
-
|
|
111
|
|
87
|
|
1
|
|
111
|
|
89
|
|
200
|
|
(9)
|
|
191
|
|
-
|
|
Apr-2008
|
|
24
|
|
Constitución
1111
|
|
-
|
|
-
|
|
1
|
|
-
|
|
-
|
|
1
|
|
1
|
|
(1)
|
|
-
|
|
n/a
|
|
n/a
|
|
n/a
|
|
Santa
María del Plata
|
|
-
|
|
13
|
|
-
|
|
-
|
|
13
|
|
-
|
|
13
|
|
-
|
|
13
|
|
n/a
|
|
n/a
|
|
n/a
|
|
Paseo
del Sol
|
|
-
|
|
-
|
|
7
|
|
-
|
|
-
|
|
7
|
|
7
|
|
-
|
|
7
|
|
n/a
|
|
n/a
|
|
n/a
|
|
Centro operaciones Israel:
|
|
|
|
|
|
|
|
|
|
|
|
|
|
|
|
|
|
|
|
|
|
|
|
|
|
Tivoli
|
|
-
|
|
171
|
|
1,241
|
|
-
|
|
124
|
|
1,969
|
|
2,093
|
|
(46)
|
|
2,047
|
|
apr-2011
|
|
Oct-2015
|
|
35
|
|
Kiryat
Ono Mall
|
|
-
|
|
316
|
|
696
|
|
8
|
|
502
|
|
1,115
|
|
1,617
|
|
(19)
|
|
1,598
|
|
nov-2007
|
|
Oct-2015
|
|
72
|
|
Shopping
Center Modi’in A
|
|
-
|
|
223
|
|
289
|
|
-
|
|
354
|
|
459
|
|
813
|
|
(8)
|
|
805
|
|
aug-2005
|
|
Oct-2015
|
|
81
|
|
HSBC
|
|
-
|
|
5,471
|
|
2,148
|
|
(370)
|
|
8,337
|
|
2,962
|
|
11,299
|
|
(74)
|
|
11,225
|
|
1927-1984
|
|
Oct-2015
|
|
35
|
|
Matam
park - Haifa
|
|
-
|
|
544
|
|
2,685
|
|
480
|
|
910
|
|
4,842
|
|
5,752
|
|
(90)
|
|
5,662
|
|
1979-2015
|
|
Oct-2015
|
|
63
|
|
Caesarea
- Maichaley Carmel
|
|
-
|
|
142
|
|
230
|
|
-
|
|
226
|
|
365
|
|
591
|
|
(8)
|
|
583
|
|
jun-1905
|
|
Oct-2015
|
|
76
|
|
Herzeliya
North
|
|
-
|
|
777
|
|
1,025
|
|
856
|
|
1,498
|
|
2,662
|
|
4,160
|
|
(35)
|
|
4,125
|
|
1996-2015
|
|
Oct-2015
|
|
89
|
|
Gav-Yam
Center - Herzeliya
|
|
-
|
|
748
|
|
817
|
|
-
|
|
1,187
|
|
1,297
|
|
2,484
|
|
(35)
|
|
2,449
|
|
1997-2006
|
|
Oct-2015
|
|
64
|
|
Neyar
Hadera Modi’in
|
|
-
|
|
186
|
|
248
|
|
-
|
|
295
|
|
393
|
|
688
|
|
(8)
|
|
680
|
|
jun-1905
|
|
Oct-2015
|
|
84
|
|
Gav
yam park - Beer Sheva
|
|
-
|
|
34
|
|
402
|
|
16
|
|
54
|
|
658
|
|
712
|
|
(12)
|
|
700
|
|
jul-1905
|
|
Oct-2015
|
|
97
|
|
Hazomet
Kfar Saba
|
|
-
|
|
-
|
|
74
|
|
-
|
|
-
|
|
117
|
|
117
|
|
-
|
|
117
|
|
jun-1905
|
|
Oct-2015
|
|
50
|
|
Bilu
|
|
-
|
|
-
|
|
54
|
|
-
|
|
-
|
|
86
|
|
86
|
|
-
|
|
86
|
|
jun-1905
|
|
Oct-2015
|
|
35
|
|
Mazkeret
Batia
|
|
-
|
|
-
|
|
69
|
|
-
|
|
-
|
|
109
|
|
109
|
|
-
|
|
109
|
|
jul-1905
|
|
Oct-2015
|
|
50
|
|
Netania
|
|
-
|
|
-
|
|
525
|
|
23
|
|
-
|
|
861
|
|
861
|
|
(12)
|
|
849
|
|
jun-1905
|
|
Oct-2015
|
|
31
|
|
Rishon
Le Zion
|
|
-
|
|
-
|
|
44
|
|
-
|
|
-
|
|
70
|
|
70
|
|
-
|
|
70
|
|
may-1905
|
|
Oct-2015
|
|
35
|
|
Rehovot
|
|
-
|
|
-
|
|
69
|
|
13
|
|
-
|
|
125
|
|
125
|
|
-
|
|
125
|
|
jun-1905
|
|
Oct-2015
|
|
35
|
|
Mizpe
Sapir
|
|
-
|
|
-
|
|
88
|
|
(10)
|
|
-
|
|
128
|
|
128
|
|
(4)
|
|
124
|
|
jun-1905
|
|
Oct-2015
|
|
35
|
|
Holon
|
|
-
|
|
191
|
|
15
|
|
-
|
|
303
|
|
24
|
|
327
|
|
-
|
|
327
|
|
jan-1969
|
|
Oct-2015
|
|
25
|
|
Haifa
|
|
-
|
|
15
|
|
-
|
|
-
|
|
24
|
|
-
|
|
24
|
|
-
|
|
24
|
|
jan-1970
|
|
Oct-2015
|
|
25
|
|
Others
|
|
-
|
|
1,781
|
|
3,938
|
|
195
|
|
3,018
|
|
5,830
|
|
8,848
|
|
(89)
|
|
8,759
|
|
n/a
|
|
Oct-2015
|
|
n/a
|
|
Total Office buildings and Other Rental Properties
Portfolio:
|
|
|
|
10,871
|
|
15,150
|
|
1,181
|
|
17,104
|
|
24,536
|
|
41,640
|
|
(548)
|
|
41,092
|
|
|
|
|
|
|
F- 195
Cresud Sociedad Anónima,
Comercial, Inmobiliaria, Financiera y Agropecuaria
Notes to the Consolidated
Financial Statements
(Continued)
(All amounts in
millions of Argentine Pesos, except otherwise
indicated)
Schedule I
(Continued)
|
|
|
|
|
Initial Costs
|
|
Subsequent Costs
|
|
Costs at year - end
|
|
|
|
|
|
|
|
|
|
|
||||||
|
Name
|
|
Encumbrances
|
|
Plot of land
|
|
Buildings, facilities and improvements (i)
|
|
Improvements / Additions / Disposals / Transfers Plot
|
|
Plot of land
|
|
Buildings, facilities and improvements (i)
|
|
Total
|
|
Accumulated depreciation
|
|
Net book value
|
|
Date of construction
|
|
Date of acquisition
|
|
Useful life as of 06.30.016
|
|
Undeveloped parcels of lands:
|
|
|
|
|
|
|
|
|
|
|
|
|
|
|
|
|
|
|
|
|
|
|
|
|
|
Centro operaciones Argentina:
|
|
|
|
|
|
|
|
|
|
|
|
|
|
|
|
|
|
|
|
|
|
|
|
|
|
Building
Annexed to Dot
|
|
-
|
|
25
|
|
-
|
|
-
|
|
25
|
|
-
|
|
25
|
|
-
|
|
25
|
|
-
|
|
Nov-2006
|
|
-
|
|
Lujan
plot of land
|
|
-
|
|
42
|
|
(18)
|
|
-
|
|
42
|
|
(18)
|
|
24
|
|
-
|
|
24
|
|
-
|
|
May-2012
|
|
-
|
|
Caballito
- Ferro
|
|
-
|
|
46
|
|
4
|
|
-
|
|
46
|
|
4
|
|
50
|
|
-
|
|
50
|
|
-
|
|
Nov-1997
|
|
-
|
|
Intercontinental
plot of land Tower B
|
|
-
|
|
2
|
|
-
|
|
-
|
|
2
|
|
-
|
|
2
|
|
-
|
|
2
|
|
-
|
|
-
|
|
-
|
|
Santa
María del Plata
|
|
-
|
|
159
|
|
64
|
|
-
|
|
159
|
|
64
|
|
223
|
|
-
|
|
223
|
|
-
|
|
Jul-1997
|
|
-
|
|
Pilar
|
|
-
|
|
2
|
|
1
|
|
-
|
|
2
|
|
1
|
|
3
|
|
-
|
|
3
|
|
-
|
|
-
|
|
-
|
|
Otros
|
|
-
|
|
3
|
|
2
|
|
-
|
|
3
|
|
2
|
|
5
|
|
-
|
|
5
|
|
-
|
|
-
|
|
-
|
|
Centro operaciones Israel:
|
|
|
|
|
|
|
|
|
|
|
|
|
|
|
|
|
|
|
|
|
|
|
|
|
|
Tivoli
|
|
-
|
|
15
|
|
-
|
|
-
|
|
24
|
|
-
|
|
24
|
|
-
|
|
24
|
|
apr-2011
|
|
Oct-2015
|
|
-
|
|
Queensridge
Towers
|
|
-
|
|
294
|
|
-
|
|
(71)
|
|
467
|
|
(201)
|
|
266
|
|
-
|
|
266
|
|
apr-2011
|
|
Oct-2015
|
|
-
|
|
Zarchini
Raanana
|
|
-
|
|
-
|
|
49
|
|
-
|
|
-
|
|
78
|
|
78
|
|
-
|
|
78
|
|
-
|
|
Oct-2015
|
|
-
|
|
Kurdani
|
|
-
|
|
-
|
|
-
|
|
-
|
|
-
|
|
-
|
|
-
|
|
-
|
|
-
|
|
-
|
|
Oct-2015
|
|
-
|
|
Others
|
|
-
|
|
1,076
|
|
5
|
|
(20)
|
|
1,801
|
|
(16)
|
|
1,785
|
|
(8)
|
|
1,777
|
|
n/a
|
|
Oct-2015
|
|
n/a
|
|
Total Undeveloped parcels of lands:
|
|
-
|
|
1,664
|
|
107
|
|
(91)
|
|
2,571
|
|
(86)
|
|
2,485
|
|
(8)
|
|
2,477
|
|
|
|
|
|
|
|
|
|
|
|
|
|
|
|
|
|
|
|
|
|
|
|
|
|
|
|
|
|
|
|
|
|
Properties under development
|
|
|
|
|
|
|
|
|
|
|
|
|
|
|
|
|
|
|
|
|
|
|
|
|
|
Centro operaciones Argentina:
|
|
|
|
|
|
|
|
|
|
|
|
|
|
|
|
|
|
|
|
|
|
|
|
|
|
PH
Office Park
|
|
-
|
|
-
|
|
-
|
|
7
|
|
-
|
|
7
|
|
7
|
|
-
|
|
7
|
|
in
progress
|
|
-
|
|
-
|
|
Catalinas
Norte
|
|
-
|
|
42
|
|
-
|
|
6
|
|
42
|
|
6
|
|
48
|
|
-
|
|
48
|
|
in
progress
|
|
Dec-1999
|
|
-
|
|
Centro operaciones Israel:
|
|
|
|
|
|
|
|
|
|
|
|
|
|
|
|
|
|
|
|
|
|
|
|
|
|
Tivoli
|
|
-
|
|
-
|
|
1,170
|
|
103
|
|
-
|
|
1,981
|
|
1,981
|
|
-
|
|
1,981
|
|
in
progress
|
|
Oct-2015
|
|
-
|
|
Ispro
Planet – Beer Sheva – Phase 1
|
|
-
|
|
154
|
|
294
|
|
296
|
|
245
|
|
817
|
|
1,062
|
|
-
|
|
1,062
|
|
in
progress
|
|
Oct-2015
|
|
-
|
|
Others
|
|
-
|
|
149
|
|
1,124
|
|
(879)
|
|
191
|
|
689
|
|
880
|
|
-
|
|
880
|
|
in
progress
|
|
Oct-2015
|
|
n/a
|
|
Total Properties under development
|
|
-
|
|
345
|
|
2,588
|
|
(467)
|
|
478
|
|
3,500
|
|
3,978
|
|
-
|
|
3,978
|
|
|
|
|
|
|
|
Total
|
|
-
|
|
13,097
|
|
20,598
|
|
1,530
|
|
20,370
|
|
31,610
|
|
51,980
|
|
(2,223)
|
|
49,757
|
|
|
|
|
|
|
(i)
The breakdown of
investment properties as of June 30, 2016, not includes leased
farmlands for the amount of Ps. 9 million.
F- 196
Cresud Sociedad Anónima,
Comercial, Inmobiliaria, Financiera y Agropecuaria
Notes to the Consolidated
Financial Statements
(Continued)
(All amounts in
millions of Argentine Pesos, except otherwise
indicated)
Schedule II
As at June 30, 2015
and 2014, IDBD was considered a significant associate pursuant to
SEC rule 3-09, set out below is summarized financial information of
IDBD as of those dates:
Summarized
statements of financial position
|
|
|
IDBD
(in
millions of pesos)
|
|
|
|
|
June
30,
2015
|
June
30,
2014
|
|
Assets
|
|
|
|
|
Non-
Current Assets
|
|
|
|
|
Investment in
associates
|
|
8,866
|
9,118
|
|
Other investments
and derivative financial instruments
|
|
833
|
5,856
|
|
Property, plant and
equipment
|
|
13,450
|
12,791
|
|
Investment
properties
|
|
27,299
|
24,317
|
|
Intangible
assets
|
|
11,419
|
12,580
|
|
Other non-current
assets
|
|
3,068
|
3,375
|
|
Total
non-current assets
|
|
64,935
|
68,037
|
|
Current
Assets
|
|
|
|
|
Other investments
and derivative financial instruments
|
|
5,251
|
8,354
|
|
Trade and other
receivables
|
|
6,101
|
6,878
|
|
Cash and cash
equivalents
|
|
8,375
|
10,829
|
|
Other current
assets
|
|
10,617
|
5,762
|
|
Total
current assets
|
|
30,344
|
31,823
|
|
Total
assets
|
|
95,279
|
99,860
|
|
Liabilities
|
|
|
|
|
Non-Current
Liabilities
|
|
|
|
|
Obligations
|
|
41,961
|
45,756
|
|
Bank loan and other
financial liabilities
|
|
7,553
|
6,747
|
|
Financial
instruments
|
|
7,274
|
8,072
|
|
Other non-current
liabilities
|
|
4,896
|
4,767
|
|
Total
non-current liabilities
|
|
61,684
|
65,342
|
|
Current
Liabilities
|
|
|
|
|
Obligations
|
|
7,002
|
7,899
|
|
Bank loan and other
financial liabilities
|
|
5,338
|
6,340
|
|
Trade
payables
|
|
6,053
|
5,923
|
|
Other current
liabilities
|
|
5,816
|
6,502
|
|
Total
current liabilities
|
|
24,209
|
26,664
|
|
Total
liabilities
|
|
85,893
|
92,006
|
|
Net
assets
|
|
9,386
|
7,854
|
|
Non-controlling
interest
|
|
8,526
|
8,643
|
|
Net
assets of the Parent company
|
|
860
|
(789)
|
F- 197
Cresud Sociedad Anónima,
Comercial, Inmobiliaria, Financiera y Agropecuaria
Notes to the Consolidated
Financial Statements
(Continued)
(All amounts in
millions of Argentine Pesos, except otherwise
indicated)
Schedule II
(Continued)
Summarized
statements of comprehensive income
|
|
IDBD
(in millions of pesos)
|
|
|
|
June
30,
2015
(period
of
twelve
months)
|
June
30,
2014
(period
of
six
months)
|
|
Gross
profit
|
7,316
|
9,564
|
|
Profit before
Income Tax
|
945
|
1,013
|
|
Income
tax
|
(232)
|
(592)
|
|
Profit from
continuing operations
|
713
|
421
|
|
Profit from
discontinued operations
|
-
|
144
|
|
Net Profit for the
period
|
713
|
565
|
|
Other comprehensive
income
|
(562)
|
221
|
|
Total comprehensive
income for the period
|
151
|
786
|
|
Profit attributable
to non-controlling interest
|
140
|
833
|
Summarized
statements of cash flows
|
|
IDBD
(in millions of pesos)
|
|
|
|
June
30,
2015
(period
of
twelve
months)
|
June
30,
2014
(period
of
six
months)
|
|
Net cash generated
by operating activities
|
2,909
|
3,346
|
|
Net cash generated
by investing activities
|
1,389
|
4,228
|
|
Net cash used in
financing activities
|
(4,505)
|
(11,805)
|
|
Net decrease in
cash and cash equivalents
|
(207)
|
(4,231)
|
|
|
|
|
|
Net decrease in
cash and cash equivalents from continuing operations
|
(207)
|
(6,935)
|
|
Net increase in
cash and cash equivalents from discontinued operations
|
-
|
2,704
|
|
Net decrease in
cash and cash equivalents
|
(207)
|
(4,231)
|
|
|
|
|
|
Cash and cash
equivalents at beginning of period
|
8,480
|
11,870
|
|
Foreign exchange
gain on cash and cash equivalents
|
107
|
2,846
|
|
Changes in cash
included in assets classified as held for sale
|
(5)
|
344
|
|
Cash and cash
equivalents at end of year
|
8,375
|
10,829
|
F- 198
Cresud Sociedad Anónima,
Comercial, Inmobiliaria, Financiera y Agropecuaria
Notes to the Consolidated
Financial Statements
(Continued)
(All amounts in
millions of Argentine Pesos, except otherwise
indicated)
Schedule III
The following is
condensed financial information of Cresud Sociedad Anónima,
Comercial, Inmobiliaria, Financiera y Agropecuaria
(“CRESUD” or the Company), the parent Company, prepared
in accordance with SEC Regulation S-X 12-04:
Statements
of Financial Position
as
of June 30, 2016 and 2015
|
|
06.30.16
|
|
06.30.15
|
|
ASSETS
|
|
|
|
|
Non-current
assets
|
|
|
|
|
Investment
properties
|
9
|
|
11
|
|
Property, plant and
equipment
|
488
|
|
471
|
|
Intangible
assets
|
17
|
|
18
|
|
Biological
assets
|
477
|
|
346
|
|
Investments in
subsidiaries, associates and joint ventures
|
2,560
|
|
2,501
|
|
Deferred income tax
assets
|
757
|
|
447
|
|
Income tax
credit
|
50
|
|
52
|
|
Total
Non-current assets
|
4,358
|
|
3,846
|
|
Current
assets
|
|
|
|
|
Biological
assets
|
442
|
|
113
|
|
Inventories
|
491
|
|
337
|
|
Income tax
credit
|
34
|
|
8
|
|
Trade and other
receivables
|
388
|
|
410
|
|
Derivative
financial instruments
|
15
|
|
-
|
|
Investment in
financial assets
|
22
|
|
53
|
|
Cash and cash
equivalents
|
11
|
|
18
|
|
Total
Current assets
|
1,403
|
|
939
|
|
TOTAL
ASSETS
|
5,761
|
|
4,785
|
|
SHAREHOLDERS’
EQUITY
|
|
|
|
|
Share
capital
|
495
|
|
495
|
|
Treasury
stock
|
7
|
|
7
|
|
Inflation
adjustment of share capital and treasury stock
|
65
|
|
65
|
|
Share
premium
|
659
|
|
659
|
|
Additional paid-in
capital from treasury stock
|
16
|
|
13
|
|
Legal
reserve
|
83
|
|
-
|
|
Other
reserves
|
1,086
|
|
579
|
|
Accumulated
deficit
|
(1,390)
|
|
(245)
|
|
TOTAL
SHAREHOLDERS’ EQUITY
|
1,021
|
|
1,573
|
|
LIABILITIES
|
|
|
|
|
Non-current
liabilities
|
|
|
|
|
Trade and other
payables
|
1
|
|
1
|
|
Borrowings
|
3,150
|
|
2,078
|
|
Provisions
|
10
|
|
10
|
|
Total
Non-current liabilities
|
3,161
|
|
2,089
|
|
Current
liabilities
|
|
|
|
|
Trade and other
payables
|
305
|
|
149
|
|
Payroll and social
security liabilities
|
85
|
|
58
|
|
Borrowings
|
1,166
|
|
911
|
|
Derivative
financial instruments
|
23
|
|
3
|
|
Provisions
|
-
|
|
2
|
|
Total
Current liabilities
|
1,579
|
|
1,123
|
|
TOTAL
LIABILITIES
|
4,740
|
|
3,212
|
|
TOTAL
SHAREHOLDERS’ EQUITY AND LIABILITIES
|
5,761
|
|
4,785
|
The
accompanying notes are an integral part of these condensed
financial information.
F- 199
Cresud Sociedad Anónima,
Comercial, Inmobiliaria, Financiera y Agropecuaria
Notes to the Consolidated
Financial Statements
(Continued)
(All amounts in
millions of Argentine Pesos, except otherwise
indicated)
Schedule III
(Continued)
Statements of Operations
for
the fiscal years ended June 30, 2016, 2015 and 2014
|
|
06.30.16
|
|
06.30.15
|
|
06.30.14
|
|
|
Revenues
|
1,079
|
|
754
|
|
609
|
|
|
Costs
|
(1,543)
|
|
(1,282)
|
|
(985)
|
|
|
Initial recognition
and changes in the fair value of biological assets and agricultural
produce at the point of harvest
|
1,164
|
|
697
|
|
662
|
|
|
Changes in net
realizable value of agricultural produce after harvest
|
207
|
|
(29)
|
|
(5)
|
|
|
Gross
profit
|
907
|
|
140
|
|
281
|
|
|
General and
administrative expenses
|
(151)
|
|
(109)
|
|
(116)
|
|
|
Selling
expenses
|
(214)
|
|
(149)
|
|
(93)
|
|
|
Other operating
results, net
|
(53)
|
|
(3)
|
|
(6)
|
|
|
Profit
/ (Loss) from operations
|
489
|
|
(121)
|
|
66
|
|
|
Share of (loss) /
profit of subsidiaries, associates and joint ventures
|
(429)
|
|
121
|
|
(528)
|
|
|
Profit
/ (Loss) before financing and
taxation
|
60
|
|
-
|
|
(462)
|
|
|
Finance
income
|
102
|
|
31
|
|
132
|
|
|
Finance
costs
|
(1,766)
|
|
(490)
|
|
(1,109)
|
|
|
Other financial
results
|
237
|
|
14
|
|
101
|
|
|
Financial results,
net
|
(1,427)
|
|
(445)
|
|
(876)
|
|
|
Loss
before Income tax
|
(1,367)
|
|
(445)
|
|
(1,338)
|
|
|
Income tax
gain
|
329
|
|
195
|
|
270
|
|
|
Loss
for the year
|
(1,038)
|
|
(250)
|
|
(1,068)
|
|
|
|
|
|
|
|
|
|
|
|
|
|
|
|
|
|
|
(Loss)
/ Profit per share for the year:
|
|
|
|
|
|
|
|
Basic
|
(3.82)
|
|
0.36
|
|
(2.15)
|
|
|
Diluted
|
(3.82)
|
(i)
|
0.32
|
|
(2.15)
|
(i)
|
(i)
Due
to the loss for the year, there is no diluted effect on this
result.
The accompanying
notes are an integral part of these condensed financial
information.
F- 200
Cresud Sociedad Anónima,
Comercial, Inmobiliaria, Financiera y Agropecuaria
Notes to the Consolidated
Financial Statements
(Continued)
(All amounts in
millions of Argentine Pesos, except otherwise
indicated)
Schedule III
(Continued)
Statements
of Comprehensive Income
for
the fiscal years ended June 30, 2016, 2015 and 2014
|
|
06.30.16
|
|
06.30.15
|
|
06.30.14
|
|
Loss for the
year
|
(1,038)
|
|
(250)
|
|
(1,068)
|
|
Other
comprehensive income:
|
|
|
|
|
|
|
Items
that may be reclassified subsequently to profit or
loss:
|
|
|
|
|
|
|
Currency
translation adjustment from subsidiaries, associates and joint
ventures…
|
422
|
|
(191)
|
|
631
|
|
Other comprehensive
loss from share of changes in subsidiaries’
equity
|
(30)
|
|
-
|
|
-
|
|
Other
comprehensive income for the year (i)
|
392
|
|
(191)
|
|
631
|
|
Total
comprehensive income for the year
|
(646)
|
|
(441)
|
|
(437)
|
(i)
Components
of other comprehensive income do not generate any impact on the
income tax.
The accompanying
notes are an integral part of these condensed financial
information.
F- 201
Cresud Sociedad Anónima,
Comercial, Inmobiliaria, Financiera y Agropecuaria
Notes to the Consolidated
Financial Statements
(Continued)
(All amounts in
millions of Argentine Pesos, except otherwise
indicated)
Schedule III
(Continued)
Statements
of Changes in Shareholders’ Equity
for
the fiscal years ended June 30, 2016, 2015 and 2014
|
|
Share
capital
|
Treasury
shares
|
Inflation
adjustment of share capital and treasury shares (i)
|
Share
premium
|
Additional
paid-in capital from Treasury Shares
|
Legal
reserve
|
Other
reserves
|
Accumulated
deficit
|
Total
Shareholders’ equity
|
|
|
|||||||||
|
|
|||||||||
|
Balance
as of June 30, 2015
|
495
|
7
|
65
|
659
|
13
|
-
|
579
|
(245)
|
1,573
|
|
Loss for the
year
|
-
|
-
|
-
|
-
|
-
|
-
|
-
|
(1,038)
|
(1,038)
|
|
Other comprehensive
income for the year
|
-
|
-
|
-
|
-
|
-
|
-
|
392
|
-
|
392
|
|
Total
comprehensive income for the year
|
-
|
-
|
-
|
-
|
-
|
-
|
392
|
(1,038)
|
(646)
|
|
As
provided by Ordinary and Extraordinary Shareholders’ Meeting
held on October 30, 2015 and on November 26, 2015:
|
|
|
|
|
|
|
|
|
|
|
- Reserve for
future dividends
|
-
|
-
|
-
|
-
|
-
|
-
|
31
|
(31)
|
-
|
|
- Legal
reserve
|
-
|
-
|
-
|
-
|
-
|
83
|
-
|
(83)
|
-
|
|
Equity-settled
compensation
|
-
|
-
|
-
|
-
|
-
|
-
|
17
|
-
|
17
|
|
Equity incentive
plan granted
|
-
|
-
|
-
|
-
|
3
|
-
|
(4)
|
1
|
-
|
|
Changes in interest
in subsidiaries
|
-
|
-
|
-
|
-
|
-
|
-
|
106
|
-
|
106
|
|
Cumulative
translation adjustment for interest held before business
combination
|
-
|
-
|
-
|
-
|
-
|
-
|
(58)
|
-
|
(58)
|
|
Share of changes in
subsidiaries’ equity
|
-
|
-
|
-
|
-
|
-
|
-
|
23
|
-
|
23
|
|
Reimbursement of
expired dividends
|
-
|
-
|
-
|
-
|
-
|
-
|
-
|
6
|
6
|
|
Balance
as of June 30, 2016
|
495
|
7
|
65
|
659
|
16
|
83
|
1,086
|
(1,390)
|
1,021
|
(i)
Includes Ps. 1 and
Ps. 1 of inflation adjustment of Treasury Shares as of June 30,
2016 and 2015, respectively.
The accompanying
notes are an integral part of these condensed financial
information.
F- 202
Cresud Sociedad Anónima,
Comercial, Inmobiliaria, Financiera y Agropecuaria
Notes to the Consolidated
Financial Statements
(Continued)
(All amounts in
millions of Argentine Pesos, except otherwise
indicated)
Schedule III
(Continued)
Statements
of Changes in Shareholders’ Equity
for
the fiscal years ended June 30, 2016, 2015 and 2014
|
|
Share
capital
|
Treasury
shares
|
Inflation
adjustment of share capital and treasury shares (i)
|
Share
premium
|
Additional
paid-in capital from Treasury Shares
|
Share
warrants
|
Legal
reserve
|
Special
reserve
|
Other
reserves
|
Accumulated
deficit
|
Total
Shareholders’ equity
|
|
Balance
as of June 30, 2014
|
491
|
11
|
65
|
773
|
-
|
106
|
82
|
634
|
851
|
(1,066)
|
1,947
|
|
Profit for the
year
|
-
|
-
|
-
|
-
|
-
|
-
|
-
|
-
|
-
|
(250)
|
(250)
|
|
Other comprehensive
loss for the year
|
-
|
-
|
-
|
-
|
-
|
-
|
-
|
-
|
(191)
|
-
|
(191)
|
|
Total
comprehensive income for the year
|
-
|
-
|
-
|
-
|
-
|
-
|
-
|
-
|
(191)
|
(250)
|
(441)
|
|
As
provided by Shareholders’ Meeting held on November 14,
2014:
|
|
|
|
|
|
|
|
|
|
|
|
|
- Share
Distribution
|
6
|
(6)
|
-
|
-
|
-
|
-
|
-
|
-
|
-
|
-
|
-
|
|
- Share
premium
|
|
|
|
(221)
|
-
|
-
|
-
|
-
|
-
|
221
|
-
|
|
- Legal
reserve
|
-
|
-
|
-
|
-
|
-
|
-
|
(82)
|
-
|
-
|
82
|
-
|
|
- Reserve for new
developments
|
-
|
-
|
-
|
-
|
-
|
-
|
-
|
-
|
(17)
|
17
|
-
|
|
- Other
reserves
|
-
|
-
|
-
|
-
|
-
|
-
|
-
|
(634)
|
-
|
634
|
-
|
|
- Reserve for
repurchase of shares
|
-
|
-
|
-
|
-
|
-
|
-
|
-
|
-
|
(113)
|
113
|
-
|
|
- Exercise of
warrants
|
-
|
-
|
-
|
1
|
-
|
-
|
-
|
-
|
-
|
-
|
1
|
|
Equity-settled
compensation
|
-
|
-
|
-
|
-
|
-
|
-
|
-
|
-
|
28
|
-
|
28
|
|
Purchase of
treasury shares
|
(3)
|
3
|
-
|
-
|
-
|
-
|
-
|
-
|
(32)
|
-
|
(32)
|
|
Maturity of share
warrants
|
-
|
-
|
-
|
106
|
-
|
(106)
|
-
|
-
|
-
|
-
|
-
|
|
Equity incentive
plan granted
|
1
|
(1)
|
-
|
-
|
13
|
-
|
-
|
-
|
(16)
|
3
|
-
|
|
Changes in interest
in subsidiaries
|
-
|
-
|
-
|
-
|
-
|
-
|
-
|
-
|
69
|
-
|
69
|
|
Reimbursement of
expired dividends
|
-
|
-
|
-
|
-
|
-
|
-
|
-
|
-
|
-
|
1
|
1
|
|
Balance
as of June 30, 2015
|
495
|
7
|
65
|
659
|
13
|
-
|
-
|
-
|
579
|
(245)
|
1,573
|
(i)
Includes Ps. 1 and
Ps. 1 of inflation adjustment of Treasury hares as of June 30, 2015
and 2014, respectively.
The
accompanying notes are an integral part of these condensed
financial information.
F- 203
Cresud Sociedad Anónima,
Comercial, Inmobiliaria, Financiera y Agropecuaria
Notes to the Consolidated
Financial Statements
(Continued)
(All amounts in
millions of Argentine Pesos, except otherwise
indicated)
Schedule III
(Continued)
Statements
of Changes in Shareholders’ Equity
for
the fiscal years ended June 30, 2016, 2015 and 2014
|
|
Share
capital
|
Treasury
shares
|
Inflation
adjustment of share capital and treasury shares (i)
|
Share
premium
|
Share
warrants
|
Legal
reserve
|
Special
reserve
|
Other
reserves
|
Accumulated
deficit
|
Total
Shareholders’ equity
|
|
Balance
as of June 30, 2013
|
497
|
5
|
65
|
773
|
106
|
47
|
696
|
326
|
(27)
|
2,488
|
|
Loss for the
year
|
-
|
-
|
-
|
-
|
-
|
-
|
-
|
-
|
(1,068)
|
(1,068)
|
|
Other comprehensive
income for the year
|
-
|
-
|
-
|
-
|
-
|
-
|
-
|
631
|
-
|
631
|
|
Total
comprehensive income for the year
|
-
|
-
|
-
|
-
|
-
|
-
|
-
|
631
|
(1,068)
|
(437)
|
|
As
provided by Shareholders’ Meeting held on October 31,
2013:
|
|
|
|
|
|
|
|
|
|
|
|
- Legal
reserve
|
-
|
-
|
-
|
-
|
-
|
35
|
(35)
|
-
|
-
|
-
|
|
- Other
reserves
|
-
|
-
|
-
|
-
|
-
|
-
|
(27)
|
-
|
27
|
-
|
|
- Cash
dividends
|
-
|
-
|
-
|
-
|
-
|
-
|
-
|
(120)
|
-
|
(120)
|
|
Equity-settled
compensation
|
-
|
-
|
-
|
-
|
-
|
-
|
-
|
63
|
-
|
63
|
|
Changes in interest
in subsidiaries
|
-
|
-
|
-
|
-
|
-
|
-
|
-
|
7
|
-
|
7
|
|
Purchase of
treasury shares
|
(6)
|
6
|
-
|
-
|
-
|
-
|
-
|
(55)
|
-
|
(55)
|
|
Cancellation of
BrasilAgro warrants
|
-
|
-
|
-
|
-
|
-
|
-
|
-
|
(1)
|
-
|
(1)
|
|
Reimbursement of
expired dividends
|
-
|
-
|
-
|
-
|
-
|
-
|
-
|
-
|
2
|
2
|
|
Balance
as of June 30, 2014
|
491
|
11
|
65
|
773
|
106
|
82
|
634
|
851
|
(1,066)
|
1,947
|
(i)
Includes Ps. 1 and
Ps. 1 of inflation adjustment of Treasury Shares as of June 30,
2014 and 2013, respectively.
The accompanying
notes are an integral part of these condensed financial
information.
F- 204
Cresud Sociedad Anónima,
Comercial, Inmobiliaria, Financiera y Agropecuaria
Notes to the Consolidated
Financial Statements
(Continued)
(All amounts in
millions of Argentine Pesos, except otherwise
indicated)
Schedule III
(Continued)
Statements
of Cash Flows
for
the fiscal years ended June 30, 2016, 2015 and 2014
|
|
06.30.16
|
|
06.30.15
|
|
06.30.14
|
|
Operating
activities:
|
|
|
|
|
|
|
Cash used in
operations
|
(97)
|
|
(232)
|
|
(158)
|
|
Net
cash used in operating activities
|
(97)
|
|
(232)
|
|
(158)
|
|
Investing
activities:
|
|
|
|
|
|
|
Acquisition of
subsidiaries, associates and joint ventures
|
-
|
|
(20)
|
|
-
|
|
Capital
contribution to subsidiaries, associates and joint
ventures
|
(20)
|
|
(1)
|
|
(7)
|
|
Proceeds from sale
of interest in companies
|
86
|
|
183
|
|
-
|
|
Purchases of
investment properties
|
(1)
|
|
(4)
|
|
(2)
|
|
Purchases of
property, plant and equipment
|
(33)
|
|
(60)
|
|
(38)
|
|
Proceeds from sale
of investment properties
|
1
|
|
-
|
|
-
|
|
Proceeds from sale
of property, plant and equipment
|
1
|
|
2
|
|
1
|
|
Proceeds from sale
of farmlands
|
-
|
|
162
|
|
-
|
|
Purchase of
investment in financial assets
|
(1,227)
|
|
(1,778)
|
|
(2,200)
|
|
Proceeds from
disposals of Investment in financial assets
|
1,340
|
|
2,145
|
|
2,238
|
|
Loans granted to
subsidiaries, associates and joint ventures
|
(3)
|
|
(8)
|
|
(52)
|
|
Proceeds from loans
granted to subsidiaries, associates and joint ventures
|
80
|
|
55
|
|
243
|
|
Cash incorporated
by merger net of cash paid
|
-
|
|
1
|
|
-
|
|
Dividends
received
|
85
|
|
43
|
|
15
|
|
Net
cash generated from investing activities
|
309
|
|
720
|
|
198
|
|
Financing
activities:
|
|
|
|
|
|
|
Repurchase of
equity interest
|
-
|
|
(32)
|
|
(55)
|
|
Proceeds from
issuance of non-convertible notes
|
390
|
|
803
|
|
834
|
|
Payment of
non-convertible notes
|
(186)
|
|
(1,079)
|
|
(603)
|
|
Repurchase of
non-convertible notes
|
(88)
|
|
(305)
|
|
(24)
|
|
Dividend
payments
|
-
|
|
-
|
|
(120)
|
|
Borrowings
|
852
|
|
523
|
|
118
|
|
Proceeds from
derivative financial instruments
|
142
|
|
(122)
|
|
-
|
|
Borrowings from
subsidiaries, associates and joint ventures
|
102
|
|
-
|
|
23
|
|
Payments of
borrowings
|
(1,114)
|
|
(102)
|
|
(12)
|
|
Payments of
borrowings from subsidiaries, associates and joint
ventures
|
(8)
|
|
-
|
|
-
|
|
Payment of seller
financing
|
(1)
|
|
-
|
|
-
|
|
Payments of
warrants
|
-
|
|
-
|
|
(1)
|
|
Proceeds from
warrants
|
-
|
|
1
|
|
-
|
|
Interest
paid
|
(310)
|
|
(210)
|
|
(185)
|
|
Net
Cash flows used in financing activities
|
(221)
|
|
(523)
|
|
(25)
|
|
Net
(decrease) / increase in cash and cash equivalents
|
(9)
|
|
(35)
|
|
15
|
|
Cash and cash
equivalents at beginning of the year
|
18
|
|
53
|
|
37
|
|
Currency
translation adjustment on cash and cash equivalents
|
2
|
|
-
|
|
1
|
|
Cash
and cash equivalents at end of the year
|
11
|
|
18
|
|
53
|
The
accompanying notes are an integral part of these condensed
financial information.
F- 205
Cresud Sociedad Anónima,
Comercial, Inmobiliaria, Financiera y Agropecuaria
Notes to the Consolidated
Financial Statements
(Continued)
(All amounts in
millions of Argentine Pesos, except otherwise
indicated)
Schedule III
(Continued)
1.
Basis
of preparation and summering of the significant accounting
policies
The Financial
Statements of the Company for the years ended June 30, 2016 and
2015 have been prepared in accordance with the Technical Resolution
N° 26 of the Argentine Federation of Professional Councils in
Economic Sciences ("FACPCE", as per its Spanish acronym), adopted
by the National Securities Commission ("CNV", as per its Spanish
acronym). This Technical Resolution differs from International
Accounting Standard ("IAS") 1 “Presentation of Financial
Statements” issued by the International Accounting Standards
Board ("IASB"), in reference to the accounting measurement criteria
of the investments in subsidiaries, joint ventures and associates,
which are accounted for under the equity method described by IAS 28
“Investments in Associates”. This criterion differs
from the provisions of paragraph 38 of IAS 27 “Separate
Financial Statements”, whereby such investments are measured
at cost or fair value. The Company adopted IFRS in the fiscal year
beginning on July 1st, 2012, being its transition date July 1st,
2011.
The CNV, through
General Resolutions N° 562/09 and 576/10, has provided for the
application of Technical Resolution N° 26 and its amendment
Technical Resolution N° 29 of the FACPCE, which adopt the
International Financial Reporting Standards (“IFRS”),
issued by the International Accounting Standards Board
(“IASB”), for companies subject to the public offering
regime ruled by Law 17,811, due to the listing of their shares or
corporate notes, and for entities that have applied for
authorization to be listed under the mentioned regime.
The principal
accounting policies adopted of these Financial Statements are
included in Note 2 to the Audited Consolidated Financial Statements
except for the accounting measurement criteria of the investments
in subsidiaries, joint ventures and associates explained in the
paragraph above.
F- 206
Cresud Sociedad Anónima,
Comercial, Inmobiliaria, Financiera y Agropecuaria
Notes to the Consolidated
Financial Statements
(Continued)
(All
amounts in millions of Argentine Pesos, except otherwise
indicated)
Schedule III
(Continued)
2.
Investment
in subsidiaries, associates and joint ventures
Set out below are
the changes in Company’s investment in subsidiaries,
associates and joint ventures for the fiscal years ended June 30,
2016 and 2015:
|
|
June
30,
2016
|
|
June
30,
2015
|
|
|
Beginning
of the year
|
2,493
|
|
2,901
|
|
|
Balance
incorporated by merger with Cactus
|
-
|
|
(63)
|
|
|
Acquisition of
subsidiaries (i)
|
66
|
|
(5)
|
|
|
Capital
contribution
|
127
|
|
1
|
|
|
Disposal of
interest in subsidiaries
|
(22)
|
|
(34)
|
|
|
Share of (loss) /
profit
|
(429)
|
|
121
|
|
|
Other comprehensive
loss from share of changes in subsidiaries’
equity
|
(30)
|
|
-
|
|
|
Currency
translation adjustment
|
364
|
|
(191)
|
|
|
Equity-settled
compensation
|
10
|
|
14
|
|
|
Dividends
distributed
|
(55)
|
|
(53)
|
|
|
Reimbursement of
expired dividends
|
6
|
|
1
|
|
|
Intergroup
transactions
|
3
|
|
(199)
|
|
|
Share of changes in
subsidiaries’ equity
|
24
|
|
-
|
|
|
End
of the year
|
2,557
|
(ii)
|
2,493
|
(ii)
|
(i)
Includes
the effect of changes in subsidiaries as consequence of repurchase
of equity interest.
(ii) Includes
a balance of Ps. (3) and Ps. (8) reflecting interests in companies
with negative equity as of June 30, 2016 and 2015, which is
reclassified to “Provisions”
F- 207
Cresud Sociedad Anónima,
Comercial, Inmobiliaria, Financiera y Agropecuaria
Notes to the Consolidated
Financial Statements
(Continued)
(All amounts in
millions of Argentine Pesos, except otherwise
indicated)
Schedule III
(Continued)
3.
Borrowings
Company´s
borrowings as of June 30, 2016 and 2015 are as
follows:
|
|
|
|
|
|
|
|
|
|
|
|
Value
as of
|
||
|
|
Secured
/ unsecured
|
|
Currency
|
|
Fixed
/ Floating
|
|
Effective
interest
rate %
|
|
Nominal
value
(in
millions)
|
|
June
30,
2016
|
|
June
30,
2015
|
|
Non-current
|
|
|
|
|
|
|
|
|
|
|
|
|
|
|
CRESUD NCN Class
XIV due 2018 (i)
|
Unsecured
|
|
US$
|
|
Fixed
|
|
1.50 %
|
|
32
|
|
481
|
|
290
|
|
CRESUD NCN Class
XVI due 2018 (ii)
|
Unsecured
|
|
US$
|
|
Fixed
|
|
1.50 %
|
|
109
|
|
1,649
|
|
999
|
|
CRESUD NCN Class
XVIII due 2019 (iii)
|
Unsecured
|
|
US$
|
|
Fixed
|
|
4.00%
|
|
34
|
|
510
|
|
308
|
|
CRESUD NCN Class
XIX due 2016
|
Unsecured
|
|
Ps.
|
|
Floating
|
|
Badlar + % + 350
bps
|
|
187
|
|
-
|
|
186
|
|
CRESUD NCN Class XX
due 2017 (iv)
|
Unsecured
|
|
US$
|
|
Fixed
|
|
2.5 %
|
|
18.2
|
|
-
|
|
168
|
|
CRESUD NCN Class
XXII due 2019 (v)
|
Unsecured
|
|
US$
|
|
Fixed
|
|
4.00%
|
|
22
|
|
335
|
|
-
|
|
Loan from Banco
Ciudad
|
Unsecured
|
|
US$
|
|
Floating
|
|
Libor + 300 bps or
6% (the higher)
|
|
15
|
|
172
|
|
117
|
|
Loan from Banco de
La Pampa
|
Unsecured
|
|
Ps.
|
|
Floating
|
|
Rate Survey PF
30-59 days
|
|
20
|
|
3
|
|
10
|
|
Non-current
borrowings
|
|
|
|
|
|
|
|
|
|
|
3,150
|
|
2,078
|
|
|
|
|
|
|
|
|
|
|
|
|
Value
as of
|
||
|
|
Secured
/ unsecured
|
|
Currency
|
|
Fixed
/ Floating
|
|
Effective
interest
rate %
|
|
Nominal
value
(in
millions)
|
|
June
30,
2016
|
|
June
30,
2015
|
|
Current
|
|
|
|
|
|
|
|
|
|
|
|
|
|
|
CRESUD NCN Class XV
due 2015
|
Unsecured
|
|
Ps.
|
|
Floating
|
|
23.67
%
|
|
176
|
|
-
|
|
121
|
|
CRESUD NCN Class
XVI due 2018 (ii)
|
Unsecured
|
|
US$
|
|
Fixed
|
|
1.50 %
|
|
109
|
|
10
|
|
5
|
|
CRESUD NCN Class
XVII due 2016
|
Unsecured
|
|
Ps.
|
|
Floating
|
|
Badlar + 250
bps
|
|
176
|
|
-
|
|
173
|
|
CRESUD NCN Class
XVIII due 2019 (iii)
|
Unsecured
|
|
US$
|
|
Fixed
|
|
4.00%
|
|
34
|
|
2
|
|
1
|
|
CRESUD NCN Class
XIX due 2016
|
Unsecured
|
|
Ps.
|
|
Floating
|
|
Badlar + 250
bps
|
|
187
|
|
189
|
|
1
|
|
CRESUD NCN Class XX
due 2017 (iv)
|
Unsecured
|
|
US$
|
|
Fixed
|
|
2.50%
|
|
18
|
|
278
|
|
3
|
|
CRESUD NCN Class
XXI due 2017
|
Unsecured
|
|
Ps.
|
|
Floating
|
|
Badlar + 375
bps
|
|
192
|
|
197
|
|
-
|
|
Loan from Banco
Ciudad
|
Unsecured
|
|
US$
|
|
Floating
|
|
Libor + 300 bps or
6% (the higher)
|
|
15
|
|
28
|
|
10
|
|
Loan from Banco de
La Pampa
|
Unsecured
|
|
Ps.
|
|
Floating
|
|
Rate Survey PF
30-59 days
|
|
20
|
|
7
|
|
7
|
|
Loan from Banco de
la Provincia de Buenos Aires
|
Unsecured
|
|
Ps.
|
|
Fixed
|
|
15.01%
|
|
24
|
|
17
|
|
7
|
|
Loan from Banco de
la Provincia de Buenos Aires
|
Unsecured
|
|
US$
|
|
Fixed
|
|
3.50%
|
|
15
|
|
225
|
|
-
|
|
Related parties
borrowings (Note 32)
|
Unsecured
|
|
US$
|
|
Fixed
|
|
4.21%
|
|
5
|
|
99
|
|
-
|
|
Bank
overdrafts
|
Unsecured
|
|
Ps.
|
|
Fixed
|
|
29.17%
|
|
-
|
|
114
|
|
583
|
|
Current
borrowings
|
|
|
|
|
|
|
|
|
|
|
1,166
|
|
911
|
|
Total
borrowings
|
|
|
|
|
|
|
|
|
|
|
4,316
|
|
2,989
|
(i)
Includes
an outstanding balance of Ps. 28 with ERSA as of
06.30.2016.
(ii)
Includes
an outstanding balance of Ps. 12, Ps. 133 and Ps. 16 with ERSA,
IRSA CP and PAMSA, respectively, as of 06.30.16.
(iii)
Includes
an outstanding balance of Ps. 8 with IRSA CP as of June 30,
2016.
(iv)
Includes
an outstanding balance of Ps. 35, Ps. 21 and Ps. 99 with ERSA, IRSA
CP and PAMSA, respectively as of 06.30.16 and include Ps. 22 and
Ps. 92 with ERSA and PAMSA, respectively, as of
06.30.15.
(v)
Includes
an outstanding balance of Ps. 15 with IRSA CP as of June 30,
2016.
F- 208
Cresud Sociedad Anónima,
Comercial, Inmobiliaria, Financiera y Agropecuaria
Notes to the Consolidated
Financial Statements
(Continued)
(All amounts in
millions of Argentine Pesos, except otherwise
indicated)
Schedule III
(Continued)
3.
Borrowings
(Continued)
Borrowings also
include liabilities under finance leases where the Company is the
lessee and which therefore have to be measured in accordance with
IAS 17 “Leases”.
The maturity of the
Company’s borrowings (excluding finance leases) and the
Company's exposure to fixed and variable interest rates was as
follows:
|
|
June
30,
2016
|
|
June
30,
2015
|
|
Do
accrue interest:
|
|
|
|
|
Less than one
year
|
1,135
|
|
890
|
|
Between 1 and 2
years
|
1,339
|
|
373
|
|
Between 2 and 3
years
|
458
|
|
810
|
|
Between 3 and 4
years
|
1,291
|
|
670
|
|
Between 4 and 5
years
|
23
|
|
181
|
|
More than 5
years
|
34
|
|
35
|
|
|
4,280
|
|
2,959
|
|
Do
not accrued interest
|
|
|
|
|
Less than one
year
|
31
|
|
21
|
|
Between 1 and 2
years
|
5
|
|
4
|
|
Between 2 and 3
years
|
-
|
|
4
|
|
Between 3 and 4
years
|
-
|
|
1
|
|
|
36
|
|
30
|
|
|
4,316
|
|
2,989
|
The fair value of
current borrowings at fixed-rate and current and non-current
borrowings at floating-rate equals their carrying amount, as the
impact of discounting is not significant. The fair value of all
debts that are not quoted in the market are valued at their
technical value that is nominal value plus accrued
interest.
F- 209
Cresud Sociedad Anónima,
Comercial, Inmobiliaria, Financiera y Agropecuaria
Notes to the Consolidated
Financial Statements
(Continued)
(All amounts in
millions of Argentine Pesos, except otherwise
indicated)
Schedule III
(Continued)
3.
Borrowings
(Continued)
The fair value of
current and non-current borrowings for the years ended June 30,
2016 and 2015 is as follows:
|
|
June
30,
2016
|
|
June
30,
2015
|
|
CRESUD Class XIV
NCN due 2018
|
481
|
|
261
|
|
CRESUD Class XV NCN
due 2015
|
-
|
|
121
|
|
CRESUD Class XVI
NCN due 2018
|
1,649
|
|
889
|
|
CRESUD Class XVII
NCN due 2016
|
-
|
|
173
|
|
CRESUD Class XVIII
NCN due 2019
|
510
|
|
-
|
|
CRESUD Class XIX
NCN due 2016
|
189
|
|
189
|
|
CRESUD Class XX NCN
due 2017
|
278
|
|
166
|
|
CRESUD Class XXI
NCN due 2017
|
197
|
|
-
|
|
CRESUD Class XXII
NCN due 2019
|
335
|
|
-
|
|
Bank
loans
|
452
|
|
151
|
|
Bank
overdrafts
|
114
|
|
583
|
|
Related
parties
|
99
|
|
-
|
|
Total
|
4,304
|
|
2,533
|
F-
210
REPORT
OF INDEPENDENT REGISTERED PUBLIC ACCOUNTING FIRM
To
the Board of Directors and Shareholders of
Banco
Hipotecario S.A.
We
have audited the accompanying consolidated balance sheets of Banco
Hipotecario S.A. and its subsidiaries (collectively referred to as
the “Bank”) as of June 30, 2016 and 2015 and the
related consolidated statements of income, of changes in
shareholders' equity and of cash flows for each of the three
twelve-month periods in the period ended June 30, 2016. These
financial statements are the responsibility of the Bank's
management. Our responsibility is to express an opinion on these
consolidated financial statements based on our audits.
We
conducted our audits in accordance with the standards of the Public
Company Accounting Oversight Board (United States). Those standards
require that we plan and perform an audit to obtain reasonable
assurance about whether the financial statements are free of
material misstatement. An audit includes examining, on a test
basis, evidence supporting the amounts and disclosures in the
financial statements. An audit also includes assessing the
accounting principles used and significant estimates made by
management, as well as evaluating the overall financial statement
presentation. We believe that our audits provide a reasonable basis
for our opinion.
In
our opinion, the consolidated financial statements referred to
above present fairly, in all material respects, the financial
position of Banco Hipotecario S.A. and its subsidiaries as of June
30, 2016 and 2015, and the results of their operations and their
cash flows for each of the three twelve-month periods in the period
ended June 30, 2016 in conformity with accounting rules prescribed
by the Banco Central de la República Argentina (the
“BCRA”).
The
Bank’s consolidated financial statements have been prepared
in accordance with Argentine Banking GAAP, which differs in certain
significant respects from U.S. GAAP. Such differences involve
methods of measuring the amounts shown in the consolidated
financial statements, as well as additional disclosures required by
U.S. GAAP and regulations of the SEC. These consolidated financial
statements include solely a reconciliation of net income and
shareholders’ equity to U.S. GAAP. Pursuant to Item 17 of
Form 20-F, this reconciliation does not include disclosure of all
information that would be required by U.S. GAAP and regulations of
the SEC. Information relating to the nature and effect of the
differences between accounting rules prescribed by the BCRA and
U.S. GAAP is presented in Note 34 to the consolidated financial
statements.
|
|
|
|
|
||||
|
Buenos
Aires, Argentina
|
|
|
|
|
|||
|
August 10, 2016, except for notes 37 and 39 as to
which the date is October
31
, 2016
|
|
|
|
|
|||
|
|
|
|
|
|
|||
|
|
|
|
|
|
|||
|
|
|
|
|
||||
|
Price Waterhouse & Co S.R.L.
|
|
|
|
|
|
|
|
|
|
|
|
|
|
|
|
|
|
By:/s/
Diego Sisto
|
|
|
|
|
|
||
|
Diego
Sisto
|
|
|
|
|
|
|
|
|
Partner
|
|
|
|
|
|
|
|
F- 211
As of June 30, 2016 and 2015
(Expressed in thousands of Argentine pesos, except share data and
as otherwise indicated)
|
|
June 30,
|
||||
|
|
2016
|
|
2015
|
||
|
ASSETS
|
|
|
|
|
|
|
|
|
|
|
|
|
|
Cash
and due from
banks…………………………………………...
|
Ps.
|
607,656
|
|
Ps.
|
492,233
|
|
Banks
and
correspondents…………………………………………..
|
|
2,694,184
|
|
|
2,709,342
|
|
|
|
3,301,840
|
|
|
3,201,575
|
|
|
|
|
|
|
|
|
Government
and corporate securities (Note
4)……………………..
|
|
5,269,499
|
|
|
5,271,583
|
|
|
|
|
|
|
|
|
Loans
(Note 5)
|
|
|
|
|
|
|
Mortgage
loans…………………………………………………...
|
|
2,429,322
|
|
|
2,413,401
|
|
Credit
card
loans………………………………………………….
|
|
10,573,083
|
|
|
8,500,601
|
|
Other
loans………………………………………………………..
|
|
9,203,915
|
|
|
8,334,879
|
|
|
|
22,206,320
|
|
|
19,248,881
|
|
Plus:
Accrued interest
receivable…………………………………
|
|
240,885
|
|
|
218,089
|
|
Less:
Allowance for loan losses (Note
6)……………………..….
|
|
(493,536)
|
|
|
(433,825)
|
|
|
|
21,953,669
|
|
|
19,033,145
|
|
|
|
|
|
|
|
|
Other
receivables from financial transactions (Note 7)
|
|
|
|
|
|
|
Collateral
receivable under repurchase
agreements………………
|
|
75,695
|
|
|
35,621
|
|
Amounts
receivable under derivative financial
instruments..……
|
|
54,281
|
|
|
4,785
|
|
Loans
in trust pending securitization
…………………………….
|
|
8,390
|
|
|
10,301
|
|
Amounts
receivable under reverse repurchase agreements of government and
corporate securities
…………..……...………..
|
|
541,283
|
|
|
94,597
|
|
Other
(Note
7)..……………….………………………….……….
|
|
6,177,987
|
|
|
3,247,013
|
|
|
|
6,857,636
|
|
|
3,392,317
|
|
Plus:
Accrued interest
receivable………………………………...
|
|
7,577
|
|
|
8,440
|
|
Less:
Allowance for Other receivables from financial
transactions…………………………………………….……….
|
|
(23,624)
|
|
|
(22,611)
|
|
|
|
6,841,589
|
|
|
3,378,146
|
|
|
|
|
|
|
|
|
Assets
under financial
leases………………………………………..
|
|
135,302
|
|
|
125,461
|
|
|
|
|
|
|
|
|
Investments
in other
companies…………………………………….
|
|
129,698
|
|
|
70,806
|
|
|
|
|
|
|
|
|
Miscellaneous
receivables (Note
8)..………..…….………………..
|
|
1,748,707
|
|
|
1,559,217
|
|
|
|
|
|
|
|
|
Bank
premises and equipment (Note
9)..……..….…………………
|
|
317,098
|
|
|
186,320
|
|
|
|
|
|
|
|
|
Miscellaneous
assets (Note
10)……..…………….………………...
|
|
253,467
|
|
|
60,413
|
|
|
|
|
|
|
|
|
Intangible
assets (Note
11)…….…………………..………………..
|
|
552,755
|
|
|
426,148
|
|
|
|
|
|
|
|
|
Items
pending
allocation……………………………………...…….
|
|
23,705
|
|
|
8,542
|
|
|
|
|
|
|
|
|
Total Assets
…………………...……..………………………….
|
Ps.
|
40,527,329
|
|
Ps.
|
33,321,356
|
The
accompanying notes are an integral part of these consolidated
financial statements.
F- 212
BANCO HIPOTECARIO SA AND SUBSIDIARIES
CONSOLIDATED BALANCE SHEET – (Continued)
As of June 30, 2016 and 2015
(Expressed in thousands of Argentine pesos, except share data and
as otherwise indicated)
|
|
June 30
|
||||
|
|
2016
|
|
2015
|
||
|
|
|
|
|
|
|
|
LIABILITIES AND SHAREHOLDERS' EQUITY
|
|
|
|
|
|
|
LIABILITIES
|
|
|
|
|
|
|
Deposits
|
|
|
|
|
|
|
Checking
accounts…………………………………………………
|
Ps.
|
1,564,438
|
|
Ps.
|
3,151,296
|
|
Saving
accounts……………………………………………………
|
|
2,848,403
|
|
|
2,953,065
|
|
Time
deposits………………………………………………………
|
|
12,908,292
|
|
|
11,898,186
|
|
Other
deposit
accounts……………………………………………..
|
|
178,137
|
|
|
188,604
|
|
|
|
17,499,270
|
|
|
18,191,151
|
|
Plus:
Accrued interest
payable…………………………………….
|
|
294,263
|
|
|
237,680
|
|
|
|
17,793,533
|
|
|
18,428,831
|
|
Other
liabilities from financial transactions
|
|
|
|
|
|
|
Other
banks and international entities (Note
14)…………………..
|
|
276,006
|
|
|
297,357
|
|
Bonds
(Note
15)……………………………………………………
|
|
9,270,847
|
|
|
4,926,694
|
|
Argentine
Central
Bank……………………………………………
|
|
113
|
|
|
115
|
|
Amounts payable
under derivative financial
instruments.……..…
|
|
669,472
|
|
|
334,874
|
|
Borrowings under
repurchase agreements collateralized by government
securities……...…………………………………….
|
|
66,973
|
|
|
93,660
|
|
Obligation to
return securities acquired under reverse repurchase agreements of
government and corporate securities (Note 13)….
|
|
590,154
|
|
|
34,481
|
|
Other……….………………………………………………….…...
|
|
3,216,262
|
|
|
1,867,191
|
|
|
|
14,089,827
|
|
|
7,554,372
|
|
Plus:
Accrued interest
payable…………………………………….
|
|
358,364
|
|
|
135,471
|
|
|
|
14,448,191
|
|
|
7,689,843
|
|
|
|
|
|
|
|
|
Miscellaneous
liabilities
|
|
|
|
|
|
|
Taxes………………………………………………………………
|
|
511,106
|
|
|
326,154
|
|
Sundry
creditors (Note
20)………………………………………...
|
|
945,888
|
|
|
1,468,191
|
|
Other
(Note
20)…………………………………………………….
|
|
384,410
|
|
|
272,415
|
|
|
|
1,841,404
|
|
|
2,066,760
|
|
|
|
|
|
|
|
|
Reserve
for contingencies (Note
12)………………………………...
|
|
300,059
|
|
|
221,950
|
|
|
|
|
|
|
|
|
Subordinated
bonds (Note
16)……………………..……………….
|
|
121,245
|
|
|
100,452
|
|
|
|
|
|
|
|
|
Items
pending
allocation………………………………………..…...
|
|
76,448
|
|
|
44,847
|
|
|
|
|
|
|
|
|
Non-controlling
interest
…………………………………………….
|
|
130,207
|
|
|
67,957
|
|
|
|
|
|
|
|
|
Total
Liabilities
………………..……………………………….
|
|
34,711,087
|
|
|
28,620,640
|
|
|
|
|
|
|
|
|
SHAREHOLDERS' EQUITY
|
|
|
|
|
|
|
|
|
|
|
|
|
|
Common
stock……………………………………………………….
|
|
1,463,365
|
|
|
1,463,365
|
|
Treasury
stock………………………………………………………..
|
|
54,149
|
|
|
54,149
|
|
Paid
in
capital………………………………………………………..
|
|
834
|
|
|
834
|
|
Inflation
adjustment on common
stock……………………………...
|
|
699,601
|
|
|
699,601
|
|
Reserves……………………………………………………………...
|
|
2,059,361
|
|
|
1,842,198
|
|
Retained
earnings…………………….....………………...………….
|
|
1,538,932
|
|
|
640,569
|
|
Total Shareholders'
Equity
…………….……………………...
|
|
5,816,242
|
|
|
4,700,716
|
|
Total Liabilities and
Shareholders' Equity
………………..…
|
Ps.
|
40,527,329
|
|
Ps.
|
33,321,356
|
The
accompanying notes are an integral part of these consolidated
financial statements.
F- 213
BANCO HIPOTECARIO SA AND SUBSIDIARIES
CONSOLIDATED STATEMENT OF INCOME
For the twelve-month periods ended June 30, 2016, 2015 and
2014
(Expressed in thousands of Argentine pesos, except share data and
as otherwise indicated)
|
|
|
June 30,
|
||||
|
|
|
2016
|
|
2015
|
|
2014
|
|
Financial
income
|
|
|
|
|
|
|
|
Interest
on loans and other receivables from financial
transactions………………………….
|
Ps.
|
6,520,816
|
Ps.
|
4,326,324
|
Ps.
|
3,779,073
|
|
Income
from government and corporate securities.
|
|
2,584,524
|
|
1,191,396
|
|
904,985
|
|
Other……………………………………….……..
|
|
13,177
|
|
6,250
|
|
12,186
|
|
|
|
9,118,517
|
|
5,523,970
|
|
4,696,244
|
|
Financial
expenses
|
|
|
|
|
|
|
|
Interest
on deposits and other liabilities from financial
transactions.…………………………
|
|
5,008,083
|
|
2,801,201
|
|
2,063,512
|
|
Contributions
and taxes on financial income….….
|
|
682,258
|
|
442,814
|
|
339,676
|
|
|
|
5,690,341
|
|
3,244,015
|
|
2,403,188
|
|
|
|
|
|
|
|
|
|
Gross brokerage
margin
…….....................................
|
Ps.
|
3,428,176
|
Ps.
|
2,279,955
|
Ps.
|
2,293,056
|
|
|
|
|
|
|
|
|
|
Provision
for loan losses (Note
6)……..…..….…….
|
|
356,492
|
|
375,270
|
|
303,348
|
|
Income
from services
|
|
|
|
|
|
|
|
Insurance
premiums………………..……………..
|
|
1,831,371
|
|
1,255,436
|
|
895,129
|
|
Commissions
(Note
21)……………..……………
|
|
1,783,121
|
|
1,295,325
|
|
866,616
|
|
Other
(Note
21)……………………..…………….
|
|
824,753
|
|
733,262
|
|
356,153
|
|
|
|
4,439,245
|
|
3,284,023
|
|
2,117,898
|
|
Expenses
for services
|
|
|
|
|
|
|
|
Insurance
claims………………………………….
|
|
59,077
|
|
149,871
|
|
174,715
|
|
Commissions
(Note
21)…………………………..
|
|
917,622
|
|
540,542
|
|
446,257
|
|
Contributions
and taxes on income from
services………………………………………..
|
|
112,991
|
|
78,457
|
|
61,666
|
|
|
|
1,089,690
|
|
768,870
|
|
682,638
|
|
Administrative
expenses
|
|
|
|
|
|
|
|
Salaries
and social security
contributions….…..….
|
|
2,337,388
|
|
1,775,548
|
|
1,284,840
|
|
Advertising
expenses……………………….…..…
|
|
167,040
|
|
179,542
|
|
118,277
|
|
Value
added tax and other
taxes…………………..
|
|
242,738
|
|
167,249
|
|
113,917
|
|
Directors’
and Syndics’
fees……………….…..….
|
|
102,926
|
|
65,788
|
|
71,027
|
|
Fees
for administrative
services…………………..
|
|
622,664
|
|
406,690
|
|
258,668
|
|
Maintenance
and
repairs..………………….……...
|
|
135,876
|
|
96,821
|
|
53,981
|
|
Electricity
and
communications...………………...
|
|
177,198
|
|
116,907
|
|
71,942
|
|
Depreciation
of bank premises and equipment…...
|
|
59,031
|
|
35,267
|
|
20,992
|
|
Rent……………………..………………….……...
|
|
132,311
|
|
97,482
|
|
69,774
|
|
Other……………………………………….…..….
|
|
514,293
|
|
425,595
|
|
277,361
|
|
|
|
4,491,465
|
|
3,366,889
|
|
2,340,779
|
|
|
|
|
|
|
|
|
|
Net
income from financial
transactions…….............
|
Ps.
|
1,929,774
|
Ps.
|
1,052,949
|
Ps.
|
1,084,189
|
The
accompanying notes are an integral part of these consolidated
financial statements.
F- 214
BANCO HIPOTECARIO SA AND SUBSIDIARIES
CONSOLIDATED STATEMENT OF INCOME – (Continued)
For the twelve-month periods ended June 30, 2016, 2015 and
2014
(Expressed in thousands of Argentine pesos, except share data
and as otherwise indicated)
|
|
|
June 30,
|
||||
|
|
|
2016
|
|
2015
|
|
2014
|
|
|
|
|
|
|
|
|
|
Miscellaneous
income
|
|
|
|
|
|
|
|
Penalty
interest….……………………………………
|
|
96,964
|
|
86,874
|
|
59,281
|
|
Loans
recoveries.…….………………………………
|
|
320,934
|
|
171,781
|
|
82,104
|
|
Other
(Note
22)……………….……………………...
|
|
128,645
|
|
58,875
|
|
47,543
|
|
|
|
546,543
|
|
317,530
|
|
188,928
|
|
Miscellaneous
expenses
|
|
|
|
|
|
|
|
Provision
for other contingencies and miscellaneous
receivables………………………………………...
|
|
290,563
|
|
132,614
|
|
67,564
|
|
Other
(Note
22)…………………………………….....
|
|
377,835
|
|
336,720
|
|
220,430
|
|
|
|
668,398
|
|
469,334
|
|
287,994
|
|
|
|
|
|
|
|
|
|
Income
before income taxes and Non-controlling
interest..…………………………………………......
|
Ps.
|
1,807,919
|
Ps.
|
901,145
|
Ps.
|
985,123
|
|
|
|
|
|
|
|
|
|
Income
taxes (Note
24)……………………………..….
|
|
698,387
|
|
377,613
|
|
369,127
|
|
Non-controlling
interest………………………..…….....
|
|
5,998
|
|
13,658
|
|
11,031
|
|
Net
income for the
period……..………………….
|
Ps.
|
1,115,530
|
Ps.
|
537,190
|
Ps.
|
627,027
|
The
accompanying notes are an integral part of these consolidated
financial statements.
F- 215
BANCO HIPOTECARIO SA AND SUBSIDIARIES
CONSOLIDATED STATEMENT OF CHANGES IN SHAREHOLDERS'
EQUITY
For the twelve-month periods ended June 30, 2016, 2015 and
2014
(Expressed in thousands of Argentine pesos, except share data
and as otherwise indicated)
|
|
|
Common
stock
(Note
26)
|
|
Paid
in capital (Note 26)
|
|
Treasury
stock (Note 26)
|
|
Inflation
adjustment of common stock
(Note
26)
|
Reserves
|
|
Retained
earnings
|
|
Total
shareholders’ equity
|
|||
|
|
Legal
(Note
26)
|
|
Voluntary
(Note
26)
|
|||||||||||||
|
|
|
|
|
|
|
|
|
|
|
|
|
|
|
|
|
|
|
Balance as of June 30,
2013……………...
|
Ps.
|
1,463,365
|
Ps.
|
834
|
Ps.
|
54,149
|
Ps.
|
699,601
|
Ps.
|
526,828
|
Ps.
|
367,601
|
Ps.
|
495,938
|
Ps.
|
3,608,316
|
|
|
|
|
|
|
|
|
|
|
|
|
|
|
|
|
|
|
|
Distribution of
retained earnings
approved by the
General Shareholders’ Meeting held on
08/23/13
|
|
-
|
|
-
|
|
-
|
|
-
|
|
68,721
|
|
244,886
|
|
(343,607)
|
|
(30,000)
|
|
|
|
|
|
|
|
|
|
|
|
|
|
|
|
|
|
|
|
Distribution of
retained earnings
approved by the
General Shareholders’ Meeting held on
04/24/14
|
|
-
|
|
-
|
|
-
|
|
-
|
|
84,190
|
|
-
|
|
(84,190)
|
|
-
|
|
|
|
|
|
|
|
|
|
|
|
|
|
|
|
|
|
|
|
Net
income for the period
|
|
-
|
|
-
|
|
-
|
|
-
|
|
-
|
|
-
|
|
627,027
|
|
627,027
|
|
|
|
|
|
|
|
|
|
|
|
|
|
|
|
|
|
|
|
Balance as of June 30,
2014……………...
|
Ps.
|
1,463,365
|
Ps.
|
834
|
Ps.
|
54,149
|
Ps.
|
699,601
|
Ps.
|
679,739
|
Ps.
|
612,487
|
Ps.
|
695,168
|
Ps.
|
4,205,343
|
|
|
|
|
|
|
|
|
|
|
|
|
|
|
|
|
|
|
|
Distribution of
retained earnings
approved by the
General Shareholders’ Meeting held on 04/24/14. Approval of
BCRA on 12/23/14
|
|
-
|
|
-
|
|
-
|
|
-
|
|
-
|
|
-
|
|
(41,817)
|
|
(41,817)
|
|
|
|
|
|
|
|
|
|
|
|
|
|
|
|
|
|
|
|
Distribution of
retained earnings
approved by the
General Shareholders’ Meeting held on
03/21/15.
|
|
-
|
|
-
|
|
-
|
|
-
|
|
109,994
|
|
439,978
|
|
(549,972)
|
|
-
|
|
|
|
|
|
|
|
|
|
|
|
|
|
|
|
|
|
|
|
Net
income for the period
|
|
-
|
|
-
|
|
-
|
|
-
|
|
-
|
|
-
|
|
537,190
|
|
537,190
|
|
|
|
|
|
|
|
|
|
|
|
|
|
|
|
|
|
|
|
Balance as of June 30,
2015……………...
|
Ps.
|
1,463,365
|
Ps.
|
834
|
Ps.
|
54,149
|
Ps.
|
699,601
|
Ps.
|
789,733
|
Ps.
|
1,052,465
|
Ps.
|
640,569
|
Ps.
|
4,700,716
|
|
|
|
|
|
|
|
|
|
|
|
|
|
|
|
|
|
|
|
Distribution of
retained earnings
approved by the
General Shareholders’ Meeting held on
04/13/16
|
|
-
|
|
-
|
|
-
|
|
-
|
|
217,163
|
|
-
|
|
(217,163)
|
|
-
|
|
|
|
|
|
|
|
|
|
|
|
|
|
|
|
|
|
|
|
Net
income for the period
|
|
-
|
|
-
|
|
-
|
|
-
|
|
-
|
|
-
|
|
1,115,530
|
|
1,115,530
|
|
|
|
|
|
|
|
|
|
|
|
|
|
|
|
|
|
|
|
Balance as of June 30,
2016……………...
|
Ps.
|
1,463,365
|
Ps.
|
834
|
Ps.
|
54,149
|
Ps.
|
699,601
|
Ps.
|
1,006,896
|
Ps.
|
1,052,465
|
Ps.
|
1,538,936
|
Ps.
|
5,816,242
|
The accompanying notes are an integral part of these consolidated
financial statements
F- 216
BANCO HIPOTECARIO SA AND SUBSIDIARIES
CONSOLIDATED STATEMENT OF CASH FLOWS
For the twelve-month periods ended June 30, 2016, 2015 and
2014
(Expressed in thousands of Argentine pesos, except share data and
as otherwise indicated)
|
|
|
2016
|
|
2015
|
|
2014
|
|
Cash flows from operating activities:
|
|
|
|
|
|
|
|
Net
income..……...………………………….………………………
|
Ps
.
|
1,115,530
|
Ps
.
|
537,190
|
Ps.
|
627,027
|
|
Adjustments to reconcile net income to net cash
provided by
Cash Flows from
operating activities:
|
|
|
|
|
|
|
|
Provision
for loan losses and for contingencies and miscellaneous
receivables, net of
reversals………………………………...……..
|
|
326,121
|
|
258,567
|
|
273,423
|
|
Net
gain on investment government
securities………………...…....
|
|
(642,081)
|
|
(179,430)
|
|
(89,484)
|
|
Gain
/ (loss) on derivative financial
instruments……..……..………
|
|
-
|
|
(63)
|
|
-
|
|
(Gain)
/ loss on equity
investments………........................................
|
|
(34,644)
|
|
(6,641)
|
|
-
|
|
Depreciation
and
amortization……………………………………...
|
|
191,298
|
|
114,799
|
|
66,103
|
|
Net
gain on sale of premises and equipment and miscellaneous
assets………………………………….…………………………...
|
|
(3,562)
|
|
(578)
|
|
(2,944)
|
|
Net
Indexing (CER and CVS) and interest of loans and deposits incurred
but not
paid…………………………………..……..……...
|
|
(318,632)
|
|
(177,558)
|
|
(19,112)
|
|
Non-controlling
interest…………………………………………......
|
|
(5,998)
|
|
(13,658)
|
|
(11,031)
|
|
Net
change in trading
securities………………………………….....
|
|
(756,478)
|
|
1,269,136
|
|
(858,189)
|
|
Net
change in other
assets……………..……………………………
|
|
(2,981,939)
|
|
(2,843,858)
|
|
(661,376)
|
|
Net
change in other
liabilities………….……………………………
|
|
1,939,825
|
|
1,179,439
|
|
1,391,036
|
|
Net cash (used in) operating
activities
…………………………....
|
|
(1,170,560)
|
|
137,345
|
|
715,453
|
|
|
|
|
|
|
|
|
|
Cash flows from investing activities:
|
|
|
|
|
|
|
|
(Increase)/Decrease
in loans,
net………………….………………...
|
|
(4,403,465)
|
|
(4,502,150)
|
|
(5,780,425)
|
|
Proceeds
from securitization of consumer
loans…………………....
|
|
894,363
|
|
401,331
|
|
749,589
|
|
Proceeds
from maturities of available for sale
securities.…...….......
|
|
417,797
|
|
808,876
|
|
81,100
|
|
Purchases
of investments in other companies, net of
sales…………
|
|
(19,500)
|
|
(45,000)
|
|
(10,013)
|
|
Proceeds
from sales, net of payments for purchases, of available for sale
securities……………………………………………………
|
|
657,857
|
|
(2,082,693)
|
|
(1,166,729)
|
|
Proceeds
from sale of premises and
equipment…………………….
|
|
(3,890)
|
|
8,491
|
|
1,874
|
|
Purchases
of premises and equipment, miscellaneous and intangible
assets……………………………………………….......
|
|
(637,847)
|
|
(350,659)
|
|
(212,026)
|
|
Net cash provided by investing
activities
……………………........
|
|
(3,094,685)
|
|
(5,761,804)
|
|
(6,336,630)
|
|
|
|
|
|
|
|
|
|
Cash flows from financing activities:
|
|
|
|
|
|
|
|
Increase
in deposits,
net…………………...………………………...
|
|
(691,881)
|
|
4,499,808
|
|
4,792,123
|
|
Principal
payments on bonds, notes, and other
debts……………….
|
|
(3,737,599)
|
|
(626,754)
|
|
(853,108)
|
|
Proceeds
from issuance of bonds, notes and other
debts……………
|
|
8,103,404
|
|
1,934,019
|
|
1,435,183
|
|
Payments
of debt issuance
cost……………………………………..
|
|
(90,494)
|
|
(19,406)
|
|
(12,855)
|
|
Distribution
of
dividends……………………………………...…….
|
|
-
|
|
(41,817)
|
|
(29,968)
|
|
(Decrease)/Increase
in borrowings,
net……………………………..
|
|
68,283
|
|
(23,518)
|
|
806,185
|
|
Net cash provided by financing
activities
………………………...
|
|
3,651,713
|
|
5,722,332
|
|
6,137,560
|
|
|
|
|
|
|
|
|
|
Net
increase/(decrease) in cash and cash
equivalents………………
|
|
(613,532)
|
|
97,873
|
|
516,383
|
|
Cash
and cash equivalents at the beginning of the
period…………..
|
|
3,201,575
|
|
3,008,168
|
|
2,217,327
|
|
Effect
of foreign exchange changes on cash and cash
equivalents....
|
|
713,797
|
|
95,534
|
|
274,458
|
|
Cash and cash equivalents at
the end of the period
……………
|
Ps.
|
3,301,840
|
Ps.
|
3,201,575
|
Ps.
|
3,008,168
|
|
|
|
|
|
|
|
|
|
Supplemental
disclosure of cash flow information:
|
|
|
|
|
|
|
|
Cash
paid for
interest…………………………………………..…
|
Ps.
|
4,078,196
|
Ps.
|
2,525,829
|
Ps.
|
1,555,976
|
|
Cash
paid for presumptive minimum income tax and income
tax.
|
|
523,373
|
|
343,504
|
|
113,576
|
|
Non-cash
transactions involving
securitizations………………....
|
|
372,198
|
|
151,576
|
|
165,249
|
The accompanying notes are an
integral part of these consolidated financial
statements
.
F- 217
BANCO
HIPOTECARIO SA AND SUBSIDIARIES
NOTES
TO THE CONSOLIDATED FINANCIAL STATEMENTS
As of and for the twelve-month periods ended June 30, 2016, 2015
and 2014
(Expressed in thousands of Argentine pesos, except share data
and as otherwise indicated)
1.
General
a. Description of business
Banco Hipotecario
SA
(herein
after referred to as the “Bank” or “BHSA”),
is a commercial bank, organized under the laws of
Argentina.
The Bank historically has provided general banking
services, focused on individual residential mortgage loans and
construction-project loans directly to customers as well as
indirectly through selected banks and other financial
intermediaries throughout Argentina. In 2004, as part of its
business diversification strategy, the Bank
resumed the
mortgage lending and expanded its product offerings, beginning to
offer personal loans, credit card loans and
also engaging in mortgage loan securitizations,
mortgage loan servicing, other corporate loans and mortgage-related
insurance in connection with its lending
activities.
b. Basis of presentation
The consolidated financial statements of the Bank
have been prepared in accordance with the rules of Banco Central de
la República Argentina (“Argentine Central Bank”
or “BCRA”) which prescribe the accounting reporting and
disclosure requirements for banks and financial institutions in
Argentina (“Argentine Banking GAAP”). Argentine Banking
GAAP differ in certain significant respects from generally accepted
accounting principles in the United States of America (“U.S.
GAAP”).
Such differences involve methods of measuring
the amounts shown in the consolidated financial statements, as well
as additional disclosures required by U.S. GAAP and regulations of
the Securities and Exchange Commission (“SEC”). These
consolidated financial statements include solely a reconciliation
of net income and shareholders’ equity to U.S. GAAP. Pursuant
to Item 17 of Form 20-F, this reconciliation does not include
disclosure of all information that would be required by U.S. GAAP
and Regulation S-X of the SEC. See note 34 for
details.
Certain disclosures
required by the Argentine Banking GAAP have not been presented
herein since they are not required under U.S. GAAP or the SEC and
are not considered to be relevant to the accompanying consolidated
financial statements taken as a whole.
Certain
reclassifications of prior year’s information have been made
to conform to current year presentation. Such reclassifications do
not have a significant impact on the Bank financial
statements.
c. Principles of consolidation
The consolidated financial statements include the
accounts of the Bank and its subsidiaries over which the Bank has
effective control.
The percentages directly or indirectly
held in those companies’ capital stock as of June 30, 2016
and 2015 are as follows:
|
Issuing Company
|
June 30,
|
|
|
2016
|
2015
|
|
|
BHN
Sociedad de Inversión Sociedad Anónima
|
99.99%
|
99.99%
|
|
BHN
Seguros Generales Sociedad Anónima (a)
|
99.99%
|
99.99%
|
|
BHN
Vida Sociedad Anónima (a)
|
99.99%
|
99.99%
|
|
BACS
Banco de Crédito y Securitización Sociedad
Anónima
|
87.50%
|
87.50%
|
|
BACS
Administradora de activos S.A. S.G.F.C.I.
|
85.00%
|
85.00%
|
|
Tarshop
S.A. (b)
|
80.00%
|
80.00%
|
|
BH
Valores SA
|
100.00%
|
100.00%
|
F- 218
BANCO
HIPOTECARIO SA AND SUBSIDIARIES
NOTES
TO THE CONSOLIDATED FINANCIAL STATEMENTS
As of and for the twelve-month periods ended June 30, 2016, 2015
and 2014
(Expressed in thousands of Argentine pesos, except share data
and as otherwise indicated)
(a)
On December 2, 2015, the Bank took notice of an observation raised
by the Superintendent of Financial Institutions reporting to the
Argentine Central Bank with regard to the insurance business
developed by Banco Hipotecario S.A. through BHN Vida S.A. and BHN
Seguros Generales S.A.
The
observation requires the enforcement of the credit scoring
regulations, which impose a 12.5% limit on interests in the capital
stock and voting rights of other companies.
In
reply, the Bank has claimed that such observation should be
revised, in that the Bank is allowed to conduct the business in
question pursuant to the Privatization Law No. 24,855 and its
regulations, in particular Decree No. 1394/98, as continuing
company of Banco Hipotecario Nacional.
(b)
On September 11, 2015, November 4, 2015 and June 23,2016, the Board
of Directors of Banco Hipotecario S.A. unanimously approved an
irrevocable capital contribution to Tarshop S.A. in the amount of
Ps.52,500, Ps.52,500 and Ps.250,000, respectively, to be made by
shareholders Banco Hipotecario S.A. and IRSA Propiedades
Comerciales S.A. (continuing company after Alto Palermo
S.A.’s change of corporate name) pro rata of their
shareholdings so that Tarshop S.A. should have sufficient resources
for its operating activities, in line with the capitalization
program previously approved.
All
significant intercompany accounts and transactions have been
eliminated in consolidation.
d. Presentation of financial statements in constant argentine
pesos
The financial
statements have been adjusted for inflation in conformity with the
guidelines set in Communication “A” 551 of the
Argentine Central Bank up to the financial year ended December 31,
1994, and prepared in accordance with the standards laid down by
CONAU 1 Circular. As from January 1, 1995, and according to the
authorization accorded by Resolution N° 388 of the Argentine
Central Bank's Superintendency of Financial and Exchange
Institutions, the Bank discontinued the adjustment for inflation of
its financial statements until December 31, 2001. As from January
1, 2002, as a result of the application of Communication
“A” 3702 which established the repeal of any legal and
regulatory rule that did not allow companies to restate their
accounting balances at period-end currency values, the Bank resumed
the application of the adjustment for inflation in accordance with
the rules issued in due time by the Argentine Central Bank using
the adjustment coefficient derived from the domestic wholesale
price index published by the National Statistics and Census
Institute (INDEC). Furthermore, it has been considered that the
accounting measurements derived from the changes in the purchasing
power of the currency between December 31, 1994 and 2001 are stated
in the currency value as of the latter date.
On March 25, 2003,
the Executive Branch issued Decree 664 establishing that the
financial statements for years ending as from that date are to be
stated in nominal currency. Consequently, in accordance with
Communication “A” 3921 of the BCRA, the restatement of
the financial statements was discontinued as from March 1,
2003.
Pursuant to the
Argentine professional accounting standards in effect in the City
of Buenos Aires, the financial statements must be stated in
constant currency. The restatement method and the need to apply it
arise from requirements contained in Technical Pronouncements No. 6
and No. 17 of the Argentine Federation of Professional Councils in
Economic Sciences (FACPCE), as amended by Technical Pronouncement
No. 39 issued by the referred entity on October 4, 2013 and
approved by the Professional Council in Economic Sciences of the
City of Buenos Aires on April 16, 2014. These standards provide
that the effects of inflation should be recognized in the financial
statements in the event that certain conditions in the Argentine
economy are met
F- 219
BANCO
HIPOTECARIO SA AND SUBSIDIARIES
NOTES
TO THE CONSOLIDATED FINANCIAL STATEMENTS
As of and for the twelve-month periods ended June 30, 2016, 2015
and 2014
(Expressed in thousands of Argentine pesos, except share data
and as otherwise indicated)
As of June 30,
2016, the cumulative inflation rate for three consecutive years
endede on such dates could not be calculated on the basis of
official data provided by the Argentine Institute of Statistics and
Census since, in October 2015, the referred entity discontinued the
calculation of the Wholesale Domestic Price Index (IPIM), and
resumed it in January 2016.
This circumstance
should be taken into account when analyzing and interpreting these
financial statements, which have been prepared in line with the
accounting standards issued by the Argentine Central Bank for
application by financial institutions.
2
.
Significant Accounting
Policies
The following is a
summary of significant accounting policies used in the preparation
of the consolidated financial statements.
2.1.
Foreign Currency Assets and Liabilities
US dollar assets
and liabilities have been valued at the rate of exchange between
the peso and the US dollar published by the Argentine Central Bank.
Assets and liabilities valued in foreign currencies other than the
US dollar were converted into the latter currency using the swap
rates communicated by the Argentine Central Bank’s operations
desk, in force at the close of operations on the last business day
of the fiscal period end.
Foreign currency
transactions net gains or losses are recorded within
“Financial income” or “Financial expenses”
in the accompanying consolidated statements of income.
2.2.
Interest accruals and adjustments of principal amounts (CER and
CVS)
Interest accruals
were determined using the exponential method for all lending and
certain borrowing transactions in local and foreign currency, and
interest accruals for loans overdue more than ninety days were
discontinued.
Adjustments of
principal amounts from application of the CER (Reference
Stabilization Index), and CVS were accrued as established by
Argentine Central Bank regulations, and interest accruals on loans
overdue more than ninety days were discontinued.
2.3.
Government and Corporate Securities
Securities
classified as "Holdings booked at fair market value", "Investment
in listed corporate securities" and "Securities issued by the BCRA"
with volatility published by the BCRA, have been valued at
period-end or year-end market quotation.
As of June 30, 2016
and 2015, the Bank maintains in its portfolio overdue income
coupons from the DICY and PARY bonds to be collected.
Securities
classified as “Holdings booked at cost plus return” and
“Securities issued by the BCRA” with no volatility
published by the BCRA or with volatility but which the Entity
decides to book under the first category, have been valued at their
acquisition cost subject to an exponential increase based on the
internal rate of return, net of contra accounts, if
applicable.
2.4.
Loans
The portfolio of
performing loans and loans due ninety days or less has been valued
in terms of the principal amounts actually lent, plus capitalized
interest, net of principal amortization collected and
F- 220
BANCO
HIPOTECARIO SA AND SUBSIDIARIES
NOTES
TO THE CONSOLIDATED FINANCIAL STATEMENTS
As of and for the twelve-month periods ended June 30, 2016, 2015
and 2014
(Expressed in thousands of Argentine pesos, except share data
and as otherwise indicated)
debt balance
refinancing, plus adjustments (from the application of the CER, and
CVS where applicable) and accrued interest receivable and less the
estimated reserve for loan losses.
Other loans to the
public sector:
i.
those loans were
valued at cost plus return, taking as cost their book value as of
December 31, 2010.
ii.
those originally
granted in foreign currency have been converted into Ps. at
the exchange rate of $1.40 per US dollar, as established by Law
25561, Decree 214 and complementary rules and amendments. Since
February 3, 2002, the CER has been applied to the amount of those
loans and maximum rates have been established, in accordance with
Decree 1579/02, if those assets were subjected to the Exchange of
Provincial Public Debt.
Loans to the
non-financial private sector originally granted in foreign currency
have been converted into pesos at the exchange rate of $1.00 per US
dollar, as established by Law 25561, Decree 214 and complementary
rules and amendments. Since February 3, 2002, the CER and CVS have
been applied to the amount of those loans and maximum rates have
been established, depending on the borrower.
2.5.
Other receivables for financial transactions
The individual
mortgage loans the trustee ownership of which was transferred by
the Bank and recorded in this caption have been valued and
converted into pesos following the criterion described in points
2.2. and 2.4.
The financial trust
participation certificates have been valued according to the equity
method of accounting. Financial trust debt securities have been
stated at cost plus return, index-adjusted by applying the CER to
the appropriate instruments.
Futures
transactions agreed upon that are mainly closed as hedging for the
position in foreign currency have been valued in accordance with
the balances pending settlement. Changes in these values, for all
derivative instruments, are recognized as a gain or loss under the
caption “Financial Income – Interest on loans and other
receivables from financial transactions” or “Financial
Expenses – Interest on deposits and other liabilities from
financial transactions”, respectively.
Unlisted negotiable
obligations have been valued at acquisition cost exponentially
increased according to the internal rate of return.
The Bank holds
Negotiable Obligations in its own portfolio, measured at their
residual value plus interest accrued.
Securities issued
by the BCRA and government securities held as collateral for OTC
transactions are valued as explained in item 2.3 of this
note.
Repo transactions
are carried at the value originally agreed upon, plus accrued
premiums.
2.6.
Receivables for financial leases
Receivables for
financial leases are carried at the current value of the periodic
installments and the residual value previously agreed upon,
calculated as per the conditions set forth in the respective lease
agreements, applying the internal rate of return and net of
allowances for loan losses.
2.7.
Investments in Other Companies
F- 221
BANCO
HIPOTECARIO SA AND SUBSIDIARIES
NOTES
TO THE CONSOLIDATED FINANCIAL STATEMENTS
As of and for the twelve-month periods ended June 30, 2016, 2015
and 2014
(Expressed in thousands of Argentine pesos, except share data
and as otherwise indicated)
Permanent equity
investments in companies where corporate decision are not
influenced, are accounted for the lower of cost and the equity
method. As of June 30, 2016 and 2015 these investments were
recorded at cost.
This caption mainly
includes the equity investments held in: Mercado Abierto
Electrónico Sociedad Anónima, ACH Sociedad Anónima,
Mercado de Valores de Buenos Aires Sociedad Anónima, and
SUPER–CARD S.A..
Additionally the
Bank has participations as protecting partner in mutual guarantee
companies and has made contributions to the companies’ risk
fund.
2.8.
Miscellaneous receivables
Miscellaneous
receivables have been valued at the amounts actually transacted,
plus interest accrued and net of allowances for loan losses or
impairment, if applicable.
2.9.
Bank Premises and Equipment and Miscellaneous Assets
Bank premises and
equipment are recorded at cost, adjusted for inflation (as
described in note 1.d), less accumulated depreciation.
Depreciation is
computed under the straight-line method over the estimated useful
lives of the related assets. The estimated useful lives for bank
premises and equipment are as follows:
|
Buildings
|
50
years
|
|
Furniture and
fixtures
|
10
years
|
|
Machinery and
equipment
|
5
years
|
|
Other
|
5
years
|
The cost of
maintenance and repairs
of these
properties
is charged to expense as incurred. The cost of
significant renewals and improvements is added to the carrying
amount of the respective assets. When assets are retired or
otherwise disposed of, the cost and related accumulated
depreciation are removed from the accounts, and any resulting gain
or loss is reflected in the consolidated statement of
income.
The Bank has
recorded under
“
Miscellaneous
assets” - properties
received in lieu
of payment of loans. These assets are initially recognized at the
lower of market value or the value of the loan, net of allowances
and subsequently, adjusted for inflation (as described in note
1.d), and depreciation. Depreciation of Miscellaneous assets is
also computed under the straight-line method over the estimated
useful of the related assets.
2.10.
Intangible Assets
,
Net
Software expenses
as well as start-up costs are carried at cost, adjusted for
inflation (as described in note 1.d), less accumulated
amortization. These intangible assets are amortized under the
straight-line method over their estimated useful life.
Goodwill is
recorded by the difference between the purchase price and the book
value of the net assets acquired in accordance with Argentine
Central Bank rules, and subsequently amortized in a straight line
basis over the estimated useful life of 60 months.
Given BHSA’s
role as Trustee of the PROCREAR Administrative and Financial Trust,
the Bank has capitalized increased direct expenses incurred in the
mortgage loan origination process, which
F- 222
BANCO
HIPOTECARIO SA AND SUBSIDIARIES
NOTES
TO THE CONSOLIDATED FINANCIAL STATEMENTS
As of and for the twelve-month periods ended June 30, 2016, 2015
and 2014
(Expressed in thousands of Argentine pesos, except share data
and as otherwise indicated)
disbursements would
not have been incurred by it had it not been for the grant of the
related loans in accordance with the provisions of Communication
“A” 5392. Such origination expenses are amortized in 60
monthly installments.
2.11
Housing, life and unemployment insurance premiums in lending
transactions and other transactions originated in its capacity of
insurer, in accordance with the franchise granted by the
privatization law
The Bank's policy
is to recognize the premium income when the corresponding loan
installment accrues, except for those loans that are more than
ninety days in arrears, and allocate the expenditures for claims to
the net income/(loss) for the year in which they
occur.
The Bank has set up
an insurance claim reserve for Ps.1,181 as of June 30, 2015 which
is shown in the "Provisions" caption under
Liabilities.
2.12.
Deposits
Deposits have been
valued at their placement value, plus adjustments from application
of the CER and accrued interest, where applicable. The fixed return
on each transaction is accrued on an exponential basis, while the
variable return on time deposits adjusted by applying the CER and
included in "Investment Accounts" is accrued at the pro rata agreed
upon rate of return based on the improvement in the price of the
financial asset or financial asset indicator, between the time the
transaction is arranged and the end of the month.
2.13.
Other liabilities from financial
transactions
Unsubordinated
negotiable obligations have been valued at their residual value
plus accrued interest.
Futures
transactions agreed upon that are mainly closed as hedging for the
position in foreign currency have been valued in accordance with
the balances pending settlement. Changes in these values, for all
derivative instruments, are recognized as a gain or loss under the
caption “Financial Income – Interest on loans and other
receivables from financial transactions” or “Financial
Expenses – Interest on deposits and other liabilities from
financial transactions”, respectively.
Repo transactions
are carried at the value originally agreed upon plus any accrued
premium amounts.
Reverse repo
transactions are carried at the book value of the underlying
securities in the manner discussed in note 2.3.
2.14.
Miscellaneous liabilities
They are valued at
the amounts actually transacted, plus accrued interest as of fiscal
period or year end.
2.15.
Provisions
The Bank estimates
contingencies and records them in Provisions, under Liabilities, if
applicable according to the estimated likelihood of occurrence.
These provisions cover various items, such as insurance risk,
provisions for lawsuits, provisions for taxes, other contingencies,
etc..
In
addition, the Bank has created the allowance required under
Communication “A” 5689 issued by the Argentine Central
Bank in order to provide for the total amount of administrative
and/or
F- 223
BANCO
HIPOTECARIO SA AND SUBSIDIARIES
NOTES
TO THE CONSOLIDATED FINANCIAL STATEMENTS
As of and for the twelve-month periods ended June 30, 2016, 2015
and 2014
(Expressed in thousands of Argentine pesos, except share data
and as otherwise indicated)
disciplinary
sanctions and criminal penalties supported by first instance
rulings, applied or pursued by the Argentine Central Bank, the
Financial Information Unit, the Argentine Securities Commission and
the Argentine Superintendence of Insurance.
2.16.
Dismissal indemnities
The Bank does not
set up any provisions to cover the risk of dismissal indemnities
involving the staff. The disbursements in respect thereof are
charged to the results for the period or year in which they
occur.
2.17.
Personnel benefits
The Bank has set up
provisions for its employees' retirement plans.
2.18.
Subordinated Bonds
Subordinated
negotiable obligations have been recorded at their residual value
plus interests accrued.
2.19.
Non-controlling interest
The breakdown of
supplementary equity interests
recorded
in “Non-controlling
interest
” in the accompanying
consolidated balance sheets
is as follows:
|
|
June
30,
|
||||
|
|
2016
|
|
2015
|
||
|
|
|
|
|
|
|
|
BACS Banco de
Crédito y Securitización
SA………………….
|
Ps.
|
42,228
|
|
Ps.
|
32,610
|
|
Tarshop
S.A………………………….……..………………….
|
|
87,979
|
|
|
35,347
|
|
Total
|
Ps.
|
130,207
|
|
Ps.
|
67,957
|
2.20.
Income Tax
Pursuant to Article
28 of Law 24855, Banco Hipotecario Sociedad Anónima is subject
to income tax, except for all the housing loan transactions carried
out prior to October 23, 1997, date of registration of its by-laws
with the Superintendence of Corporations.
The Bank charges to
income and sets up a provision under Liabilities for the income tax
determined on its taxable transactions in the fiscal year in which
those transactions are carried out.
The Bank recognizes
income tax charges and liabilities on the basis of the tax returns
corresponding to each fiscal year at the statutory tax rates. For
all the periods contemplated in these financial
statements
,
the corporate tax
rate was 35%. Under Argentine Banking GAAP the Bank does not
recognize deferred income taxes.
2.21.
Minimum notional income tax
In view of the
option granted by the BCRA by means of Communication "A" 4295, as
of June 30, 2015 the Bank capitalized as a minimum notional income
tax credit the tax amount paid in fiscal year 2012. Such credit was
recovered upon filing the income tax return for the fiscal year
2015.
2.22.
Shareholders' Equity
F- 224
BANCO
HIPOTECARIO SA AND SUBSIDIARIES
NOTES
TO THE CONSOLIDATED FINANCIAL STATEMENTS
As of and for the twelve-month periods ended June 30, 2016, 2015
and 2014
(Expressed in thousands of Argentine pesos, except share data
and as otherwise indicated)
Capital stock,
treasury shares, non-capitalized contributions, reserves, and
capital adjustment:
The Shareholders'
Equity account activity and balances prior to December 31, 1994
have been stated in the currency values prevailing at that date,
following the method mentioned in this Note. The transactions
carried out subsequent to that date have been recorded in currency
values of the period or year to which they correspond. The balances
of the Shareholders’ Equity accounts as of June 30, 2016 have
been restated up to February 28, 2003 as explained in the third
paragraph. The adjustment derived from the restatement of the
balance of "Capital Stock" was allocated to "Equity Adjustments".
The issued treasury shares added due to the termination of Total
Return Swap transaction are carried at nominal value.
a.
Results:
Income and expenses
have been recognized against the results for the fiscal year,
regardless of whether they have been collected or
paid.
The preparation of
the financial statements requires that the Bank’s Board of
Directors perform estimates affecting assets and liabilities, the
net income/ (loss) for the fiscal period or year and the
determination of contingent assets and liabilities at the date
thereof, such as allowances for loan losses and impairment, the
recoverable value of assets and provisions. Since these estimates
involve value judgments regarding the probability of occurrence of
future events, the actual net income/ (loss) may differ from the
estimated amount and thus generate losses or profits affecting
subsequent periods or years. All legal and regulatory rules in
force at the date of presentation of these financial statements
have been considered.
The financial
statement figures for the previous fiscal period or year, presented
for comparative purposes, include certain reclassifications and
adjustments that contemplate specific disclosure criteria so as to
present them on a consistent basis with those of the current fiscal
period or year.
2.23.
Statements of Cash Flows
The consolidated
statements of cash flows were prepared using the measurement
methods prescribed by the BCRA, but in accordance with the
presentation requirements of ASC 230.
For purposes of
reporting cash flows, “Cash and cash equivalents”
include “Cash and due from banks”.
2.24.
Use of Estimates
The preparation of
the consolidated financial statements requires management to make
estimates and assumptions that affect the reported amounts of
assets and liabilities and disclosures of contingent assets and
liabilities as of the financial statement dates and the reported
amounts of revenues and expenses during the reporting periods.
Significant estimates include those required in the accounting of
allowances for loan losses and the reserve for contingencies. Since
management’s judgment involves making estimates concerning
the likelihood of future events, the actual results could differ
from those estimates which would have a positive or negative effect
on future period results.
3. Restricted Assets
Certain of the
Bank's assets are pledged or restricted from use under various
agreements. The following assets were restricted at each balance
sheet date:
F- 225
BANCO
HIPOTECARIO SA AND SUBSIDIARIES
NOTES
TO THE CONSOLIDATED FINANCIAL STATEMENTS
As of and for the twelve-month periods ended June 30, 2016, 2015
and 2014
(Expressed in thousands of Argentine pesos, except share data
and as otherwise indicated)
|
|
June
30,
|
|||
|
|
2016
|
2015
|
||
|
Banco
Hipotecario S.A.
|
|
|
|
|
|
Securities issued
by the BCRA as collateral for OCT
transactions………………….…………………………………..
|
Ps.
|
138,376
|
Ps.
|
70,464
|
|
Government
securities as collateral for OCT
transactions………
|
|
335,135
|
|
40,200
|
|
Deposits in pesos
as collateral for visa credit card transactions...
|
|
289,199
|
|
117,723
|
|
Securities issued
by the BCRA as collateral for the custody of
securities……………………………………………………….
|
|
-
|
|
162,759
|
|
Government
securities as collateral for the custody of
securities.
|
|
14,350
|
|
-
|
|
Deposits in pesos
and in U$S as collateral for
leases…………...
|
|
1,316
|
|
754
|
|
Other
collaterals………………………………………………...
|
|
810
|
|
2
|
|
Ps.
|
779,186
|
Ps.
|
391,902
|
|
|
|
|
|
|
|
|
Tarshop
S.A.
|
|
|
|
|
|
Deposits in pesos
and in U$S as collateral for
leases…………...
|
Ps.
|
686
|
Ps.
|
505
|
|
Certificates of
participation in Financial Trusts granted as commercial pledge for
a loan
received………………………….
|
|
32,202
|
|
32,203
|
|
Time deposits
pledged for tax obligations arising from Financial
Trusts…………………………………………………………….
|
|
6,531
|
|
4,891
|
|
Deposits in pesos
related to Financial Trusts
transactions………
|
|
149,578
|
|
16,182
|
|
Receivables in
trust to secure an overdraft facility
received…….
|
|
79,069
|
|
|
|
Loans to secure the
future issuance of Financial
Trust….....…….
|
|
70,747
|
|
|
|
Deposits in pesos
as collateral for visa credit card transactions...
|
|
9,679
|
|
512
|
|
Government
securities as collateral for visa credit card
transactions……………………………………………………...
|
|
9,930
|
|
1,038
|
|
Ps.
|
358,422
|
Ps.
|
55,331
|
|
|
|
|
|
|
|
|
BACS
Banco de Crédito y Securitización S.A.
|
|
|
|
|
|
Receivables in
pledge loans to secure a loan
received……….…..
|
Ps.
|
39,889
|
Ps.
|
-
|
|
Securities and
pesos as collateral for OTC
transactions…………
|
|
15,713
|
|
-
|
|
Ps.
|
55,602
|
Ps.
|
-
|
|
|
|
|
|
|
|
|
BH
Valores S.A.
|
|
|
|
|
|
Mercado de Valores
de Buenos Aires SA’s share pledged on behalf of Chubb
Argentina de Seguros
SA……………………
|
Ps.
|
20,900
|
Ps.
|
4,000
|
|
|
|
|
|
|
|
|
|
|
|
|
|
Total
|
Ps.
|
1,214,110
|
Ps.
|
451,233
|
4.
Government and Corporate securities
Government
and Corporate Securities held by the Bank consist of the following
balances:
|
|
June 30,
|
||
|
|
2016
|
|
2015
|
|
Holding
booked at fair value
|
|
|
|
|
Governmentsecurities
inpesos…………………….Ps.
|
666,815
|
Ps.
|
1,581,383
|
|
Government
securities in US$..............................
|
1,835,746
|
|
340,053
|
|
Government
securities in Euros..............................
|
292,729
|
|
-
|
|
Bills
issued by Provincial Governments in US$.....
|
263,586
|
|
297,137
|
|
Bills
issued by Provincial Governments in pesos.....
|
25,890
|
|
7,133
|
F- 226
BANCO
HIPOTECARIO SA AND SUBSIDIARIES
NOTES
TO THE CONSOLIDATED FINANCIAL STATEMENTS
As of and for the twelve-month periods ended June 30, 2016, 2015
and 2014
(Expressed in thousands of Argentine pesos, except share data
and as otherwise indicated)
|
|
Ps.
|
3,084,766
|
|
Ps.
|
2,225,706
|
|
|
|
|
|
|
|
|
Holding
booked at cost plus return
|
|
|
|
|
|
|
Bills
issued by Provincial Governments in pesos...
|
Ps.
|
166,342
|
|
Ps.
|
66,916
|
|
Bills
issued by Provincial Governments in US$.…...
|
|
240,995
|
|
|
125,862
|
|
|
Ps.
|
407,337
|
|
Ps.
|
192,778
|
|
|
|
|
|
|
|
|
Investment
in listed corporate securities
|
|
|
|
|
|
|
Corporate
securities denominated in pesos….......…
|
Ps.
|
490,538
|
|
Ps.
|
430,855
|
|
|
Ps.
|
490,538
|
|
Ps.
|
430,855
|
|
|
|
|
|
|
|
|
Securities
issued by the BCRA
|
|
|
|
|
|
|
Quoted
bills and notes issued by the
BCRA………..
|
Ps.
|
278,519
|
|
Ps.
|
672,239
|
|
Unquoted
bills and notes issued by the BCRA……..
|
|
1,017,050
|
|
|
1,750,005
|
|
|
Ps.
|
1,295,569
|
|
Ps.
|
2,422,244
|
|
|
|
|
|
|
|
|
Allowances
|
Ps.
|
(8,711)
|
|
Ps.
|
-
|
|
|
|
|
|
|
|
|
Total
|
Ps.
|
5,269,499
|
|
Ps.
|
5,271,583
|
As of June 30,
2016, several bonds sold under repurchase agreements amounted to
Ps.75,695 and were recorded under the caption “Other
Receivables from Financial Transactions”.
The bank recorded
in their financial statements income from government and corporate
securities for an amount of Ps. 2,584,524 and Ps. 1,191,396 as of
June 30, 2016 and 2015, respectively.
5.
Loans
Descriptions of the
categories of loans in the accompanying balance sheets
include:
●
Mortgage loans:
●
Construction project loans
- loans made
to various entities for the construction of housing
units
●
Individual residential mortgage loans
-
mortgage loans made to individuals to finance the acquisition,
construction, completion, enlargement, and/or remodeling of their
homes
●
Other loans:
●
Certain financial and non-financial sector loans including loans to
credit card holders and to individuals
●
Public Loans – loans to National Government and
Provinces
Under Argentine
Central Bank regulations, the Bank must disclose the composition of
its loan portfolio by non-financial
public
, financial and non-financial private
sector
. Additionally, the
Bank must disclose
the type of
collateral pledged on non-financial private sector loans. The
breakdown of the Bank’s loan portfolio in this regard is as
follows:
F- 227
BANCO
HIPOTECARIO SA AND SUBSIDIARIES
NOTES
TO THE CONSOLIDATED FINANCIAL STATEMENTS
As of and for the twelve-month periods ended June 30, 2016, 2015
and 2014
(Expressed in thousands of Argentine pesos, except share data
and as otherwise indicated)
|
|
June
30,
|
||||
|
|
2016
|
|
2015
|
||
|
|
|
|
|
|
|
|
Non-financial
public
sector………………………………………
|
Ps.
|
160,847
|
|
Ps.
|
89,132
|
|
Financial
sector…………………………………………………..
|
|
462,776
|
|
|
348,549
|
|
Non-financial
private sector
|
|
|
|
|
|
|
With preferred
guarantees
(a)………………………………….
|
|
2,429,322
|
|
|
2,413,401
|
|
Without preferred
guarantees
...………………………………
|
|
|
|
|
|
|
Personal
loans………………………………………………
|
|
3,149,503
|
|
|
2,650,127
|
|
Credit Card Loans
…..………………………………………
|
|
10,573,083
|
|
|
8,500,601
|
|
Overdraft
facilities………………………………………….
|
|
890,819
|
|
|
685,978
|
|
Other loans
(b)………………………………………………
|
|
4,539,970
|
|
|
4,561,093
|
|
Accrued interest
receivable………………………………………
|
|
240,885
|
|
|
218,089
|
|
Reserve for loan
losses (see note
6)..……………………………
|
|
(493,536)
|
|
|
(433,825)
|
|
Total
|
Ps.
|
21,953,669
|
|
Ps.
|
19,033,145
|
______________
(a)
Preferred
guarantees include first priority mortgages or pledges, cash, gold
or public sector bond collateral, certain collateral held in trust,
or certain guarantees by the Argentine government.
(b)
Comprised
of:
|
|
June
30,
|
||||
|
|
2016
|
|
2015
|
||
|
|
|
|
|
|
|
|
Short term loans in
pesos
…..…………………………....
|
Ps.
|
2,464,250
|
|
Ps.
|
2,729,892
|
|
Short term loans in
US
dollars…………………………
|
|
646,036
|
|
|
692,190
|
|
Loans for the
financing of
manufacturers………………..
|
|
89,944
|
|
|
61,234
|
|
Export prefinancing
…………………….……………….
|
|
581,880
|
|
|
406,621
|
|
Other
loans….…………………...………………………
|
|
757,860
|
|
|
671,156
|
|
Total
|
Ps.
|
4,539,970
|
|
Ps.
|
4,561,093
|
6.
Allowance for loan losses
The activity in the
allowance for loan losses for the periods presented is as
follows:
|
|
June
30,
|
||||
|
|
2016
|
|
2015
|
||
|
|
|
|
|
|
|
|
Balance at
beginning of
period…………………………………..
|
Ps.
|
433,825
|
|
Ps.
|
356,267
|
|
Provision charged
to income
……………………………………
|
|
356,492
|
|
|
375,270
|
|
Loans charged
off………………………………………………...
|
|
(296,781)
|
|
|
(297,712)
|
|
Balance at end of
period………………………………………….
|
Ps.
|
493,536
|
|
Ps.
|
433,825
|
7.
Other receivables from financial transactions
The breakdown of
other receivables from financial transactions, by type of guarantee
for the periods indicated
, is
as follows:
F- 228
BANCO
HIPOTECARIO SA AND SUBSIDIARIES
NOTES
TO THE CONSOLIDATED FINANCIAL STATEMENTS
As of and for the twelve-month periods ended June 30, 2016, 2015
and 2014
(Expressed in thousands of Argentine pesos, except share data
and as otherwise indicated)
|
|
June
30,
|
||||
|
|
2016
|
|
2015
|
||
|
Preferred
guarantees, including deposits with the
|
|
|
|
|
|
|
Argentine Central
Bank……….……………………………..
|
Ps.
|
766,485
|
|
Ps.
|
434,689
|
|
Unsecured
guarantees
(a)………………………………………
|
|
6,098,728
|
|
|
2,966,068
|
|
Subtotal
|
|
6,865,213
|
|
|
3,400,757
|
|
Less: Allowance for
losses……....………………………………
|
|
(23,624)
|
|
|
(22,611)
|
|
Total
|
Ps.
|
6,841,589
|
|
Ps.
|
3,378,146
|
(a) Includes Ps.
54,281 and Ps. 4,785 of Amounts receivable under derivative
financial instruments, as of June 30, 2016 and 2015, respectively,
and Ps. 75,695 and Ps. 35,621 of Amounts receivable under
repurchase agreements, as of June 30, 2016 and 2015,
respectively.
The breakdown of
the caption “Other” included in the balance sheet is as
follows:
|
|
June
30,
|
||||
|
|
2016
|
|
2015
|
||
|
|
|
|
|
|
|
|
Subordinated bonds
(a)…….……………….………………….
|
Ps.
|
2,651,744
|
|
Ps.
|
1,452,436
|
|
Certificates of
participation (see note
19)………………………
|
|
946,515
|
|
|
388,250
|
|
Bonds held in the
Bank’s portfolio
(b).……..………………….
|
|
42,384
|
|
|
-
|
|
Bonds
unquoted………………………………………………....
|
|
215,149
|
|
|
192,621
|
|
Collateral for OTC
transactions…………………………………
|
|
488,237
|
|
|
114,034
|
|
Amounts receivable
from spot and forward sales pending
settlement………………………………………………………..
|
|
780,400
|
|
|
524,785
|
|
Other…………………………………………………………….
|
|
1,053,558
|
|
|
574,887
|
|
Total
|
Ps.
|
6,177,987
|
|
Ps.
|
3,247,013
|
(a) Includes Ps.
2,158,130 and Ps. 269,243 of debt securities related to
securitizations made by the bank and described in note 19, as of
June 30, 2016 and 2015, respectively.
(b) The Bank
carries some of its negotiable obligations as of June 30,
2016.
8.
Miscellaneous receivables
Miscellaneous
receivables are comprised of the following
for
the
periods indicated
:
|
|
June
30,
|
||||
|
|
2016
|
|
2015
|
||
|
|
|
|
|
|
|
|
Withholdings,
credits and prepaid income
tax…………………
|
Ps.
|
45,503
|
|
Ps.
|
33,812
|
|
Recoverable
expenses, taxes, and advances to third
parties……
|
|
62,291
|
|
|
60,935
|
|
Attachments for
non-restructured
ON………………………….
|
|
23,484
|
|
|
7,526
|
|
Guarantee deposit
(*)…………………………………………..
|
|
32,293
|
|
|
171,891
|
|
Guarantee deposit
for credit card
transactions…………………..
|
|
289,199
|
|
|
117,723
|
|
Presumptive minimum
income – Credit tax (see note
25)……...
|
|
77,041
|
|
|
61,561
|
|
Receivables from
master servicing
activities…………………..
|
|
838
|
|
|
787
|
|
Other Directors
fees…………………………………………….
|
|
36,379
|
|
|
13,749
|
|
Loans to Bank
staff……………………………………………..
|
|
188,177
|
|
|
179,588
|
|
Other……………………………………………………………
|
|
1,004,313
|
|
|
925,623
|
|
Subtotal
|
|
1,759,518
|
|
|
1,573,195
|
|
Less: Allowance for
collection
risks……………………………
|
|
(10,811)
|
|
|
(13,978)
|
|
Total
|
Ps.
|
1,748,707
|
|
Ps.
|
1,559,217
|
F- 229
BANCO
HIPOTECARIO SA AND SUBSIDIARIES
NOTES
TO THE CONSOLIDATED FINANCIAL STATEMENTS
As of and for the twelve-month periods ended June 30, 2016, 2015
and 2014
(Expressed in thousands of Argentine pesos, except share data
and as otherwise indicated)
(*) As of June 30,
2016 and 2015 includes Ps. 14,350 and Ps. 162,759 as collateral for
the custody of securities.
9.
Bank Premises and Equipment
The book values of
major categories of bank premises and equipment and total
accumulated depreciation as of the periods indicated are as
follows:
|
|
June
30,
|
||||
|
|
2016
|
|
2015
|
||
|
|
|
|
|
|
|
|
Land and
buildings……………………………………………….
|
Ps.
|
186,599
|
|
Ps.
|
117,090
|
|
Furniture and
fixtures…………………………………………….
|
|
79,259
|
|
|
63,915
|
|
Machinery and
equipment………………………………………..
|
|
278,772
|
|
|
185,369
|
|
Other……………………………………………………………...
|
|
50,059
|
|
|
40,106
|
|
Accumulated
depreciation………………………………………..
|
|
(277,591)
|
|
|
(220,160)
|
|
Total
|
Ps.
|
317,098
|
|
Ps.
|
186,320
|
10.
Miscellaneous assets
Miscellaneous
assets
consist
of the following
as of the end of each period:
|
|
June
30,
|
||||
|
|
2016
|
|
2015
|
||
|
|
|
|
|
|
|
|
Properties held for
sale…………………………………………...
|
Ps.
|
40,884
|
|
Ps.
|
33,587
|
|
Assets leased to
others…………………………………………...
|
|
26,339
|
|
|
22,656
|
|
Stationery and
supplies…………………………………………..
|
|
30,848
|
|
|
23,349
|
|
Advances for
purchase of goods
(*)……………………………
|
|
176,551
|
|
|
|
|
Other……………………………………………………………...
|
|
1,949
|
|
|
1,688
|
|
Accumulated
depreciation………………………………………..
|
|
(23,104)
|
|
|
(20,867)
|
|
Total
|
Ps.
|
253,467
|
|
Ps.
|
60,413
|
(*)
On April 20, 2016, by means of a
public auction conducted by the government of the City of Buenos
Aires, we acquired the building known as “Edificio del
Plata” to be our corporate headquarters and a branch, for
approximately US$68 million. As of June 30, 2016, we have paid 15%
of the acquisition price and according to Article 3 of Decree
208/16, we are required to pay the remaining 85% when executing the
public deed and entering into possession of the building, which
should occur within 365 days of the public auction.
11.
Intangible Assets
Intangible assets,
net of accumulated amortization, as of the end of
periods indicated are
as
follows:
|
|
June
30,
|
|||||
|
|
2016
|
|
2015
|
|||
|
|
|
|
|
|
|
|
|
Third parties fees,
re-engineering, restructuring and capitalized software
costs.................................................................................
|
Ps.
|
187,204
|
|
Ps.
|
131,714
|
|
|
Goodwill
(*)………………......………………………………….
|
|
15,078
|
|
|
18,508
|
|
|
Mortgage loan
origination expenses related to Pro.Cre.Ar (see note
31)…………………………………………………………
|
|
350,473
|
|
|
275,926
|
|
|
Total
|
Ps.
|
552,755
|
|
Ps.
|
426,148
|
|
(*) Goodwill is
mainly related to the acquisition of Tarshop, which has been
allocated to the Credit card segment - Tarshop.
F- 230
BANCO
HIPOTECARIO SA AND SUBSIDIARIES
NOTES
TO THE CONSOLIDATED FINANCIAL STATEMENTS
As of and for the twelve-month periods ended June 30, 2016, 2015
and 2014
(Expressed in thousands of Argentine pesos, except share data
and as otherwise indicated)
12.
Reserve
for contingencies
The reserve for
contingencies as of the end of each period is as
follows:
|
|
June
30,
|
||||
|
|
2016
|
|
2015
|
||
|
|
|
|
|
|
|
|
Legal Contingencies
(a)…………………………………………
|
Ps.
|
172,264
|
|
Ps.
|
78,863
|
|
Incurred but not
reported and pending insurance claims (b)..…...
|
|
-
|
|
|
1,181
|
|
Contingency risks
…..……………………………………………
|
|
93,494
|
|
|
112,043
|
|
Tax
Provision…………………………………………….……...
|
|
9,238
|
|
|
11,401
|
|
Bonds subject to
lawsuits
(c)…..………..……………….…….
|
|
24,463
|
|
|
14,290
|
|
Allowance for
administrative-disciplinary-criminal penalties ......
|
|
600
|
|
|
4,172
|
|
Total
|
Ps.
|
300,059
|
|
Ps.
|
221,950
|
(a) Includes legal
contingencies and expected legal fees.
(b) As of June 30,
2015 it is composed of debts to insured for Ps. 1,181 (outstanding
claims for Ps. 559 and IBNR for Ps. 622).
(c) Includes
negotiable obligations past due whose holders did not enter to the
comprehensive financial debt restructuring which ended on January,
2004.
13.
Other Liabilities from Financial Transactions - Obligation to
return securities acquired under reverse repurchase agreements of
government and corporate securities
The amounts
outstanding corresponding to the Obligation to return securities
acquired under reverse repurchase agreements of government and
corporate securities, as of the end of the twelve-month periods are
as follows:
|
|
June
30,
|
||||
|
|
2016
|
|
2015
|
||
|
|
|
|
|
|
|
|
Reverse repurchase
agreements collateralized by securities issued by the BCRA
(*)………………………………………………………………..
|
Ps.
|
126,200
|
|
Ps.
|
11,114
|
|
Reverse repurchase
agreements collateralized by other government securities
(*)………………………….………….………………………
|
|
463,954
|
|
|
23,367
|
|
Total
|
Ps.
|
590,154
|
|
Ps.
|
34,481
|
(*) The
transactions’ maturity date is July, 2016.
14.
Other Liabilities from Financial Transactions -
Other Banks and International Entities
The breakdown of
the bank debt is as follows:
|
Description
|
Average
Annual
interest
rate
|
Average
Maturity date
|
|
2016
|
|
|
2015
|
|
|
|
|
|
|
|
|
|
|
Interbank loans in
pesos…...….……...
|
38.11%
|
August,
2016
|
Ps.
|
276,006
|
|
Ps.
|
297,357
|
|
Total
|
|
|
Ps
|
276,006
|
|
Ps.
|
297,357
|
15.
Other Liabilities from Financial Transactions – Negotiable
obligations
F- 231
BANCO
HIPOTECARIO SA AND SUBSIDIARIES
NOTES
TO THE CONSOLIDATED FINANCIAL STATEMENTS
As of and for the twelve-month periods ended June 30, 2016, 2015
and 2014
(Expressed in thousands of Argentine pesos, except share data
and as otherwise indicated)
The balance of the
negotiable obligations has been included in the “Other
liabilities for financial transactions” caption. The residual
face values of the different negotiable obligation series issued
are as follows:
|
|
|
|
|
June
30,
|
|
|
|
Issue
date
|
Maturity
date
|
Annual interest rate
(a)
|
2016
|
2015
|
|
Banco
Hipotecario S.A.
|
|
|
|
|
|
|
Series 5 (US$
250,000 thousand)
|
04/27/06
|
04/27/16
|
9.750
%
|
-
|
1,914,484
|
|
Series XII (US$.
44,508 thousand)
|
08/14/13
|
08/14/17
|
3.95
%
|
439,845
|
358,989
|
|
Series XIV (Ps.
115,400)
|
11/11/13
|
11/11/15
|
Badlar
+375bp
|
-
|
115,400
|
|
Series XVI (Ps.
89,683)
|
01/31/14
|
01/31/16
|
Badlar
+425bp
|
-
|
89,683
|
|
Series XIX (Ps.
275,830)
|
05/16/14
|
11/16/15
|
Badlar
+375bp
|
-
|
275,830
|
|
Series XXI (Ps.
222,345)
|
07/30/14
|
01/30/16
|
Badlar
+275bp
|
-
|
222,345
|
|
Series XXII (Ps.
253,152)
|
11/05/14
|
08/05/15
|
LEBACx0.95
|
-
|
253,152
|
|
Series XXIII (Ps.
119,386)
|
11/05/14
|
05/08/16
|
Badlar
+325bp
|
-
|
119,386
|
|
Series XXIV (Ps.
27,505)
|
02/05/15
|
01/31/16
|
LEBACx0.95
|
-
|
27,505
|
|
Series XXV (Ps.
308,300)
|
02/05/15
|
08/05/16
|
9 months 27.5% and
then Badlar +450bp
|
298,413
|
298,496
|
|
Series XXVII (Ps.
281,740)
|
05/22/15
|
11/22/16
|
9 months 28.0% and
then Badlar +450bp
|
260,111
|
260,096
|
|
Series XXIX (US$
200,000 thousand)
|
11/30/15
|
11/30/20
|
9.75
%
|
2,984,000
|
-
|
|
Series XXIX
-Tranche II (US$ 150,000 thousand)
|
05/23/16
|
11/30/20
|
9.75
%
|
2,228,480
|
-
|
|
Series XXX (Ps.
314,611)
|
09/04/15
|
03/04/17
|
9 months 28.25% and
then Badlar +450bp
|
314,611
|
-
|
|
Series XXXI (US$
14,730 thousand)
|
09/04/15
|
09/04/18
|
2.00
%
|
219,772
|
-
|
|
Series XXXII (Ps.
265,770)
|
11/30/15
|
05/30/17
|
3 months 27.0% and
then Badlar +475bp
|
265,770
|
-
|
|
Series XXXIV (Ps.
264,030)
|
02/10/16
|
08/10/17
|
Badlar
+400bp
|
264,030
|
-
|
|
Series XXXV (Ps.
235,970)
|
02/10/16
|
02/10/19
|
Badlar
+499bp
|
235,970
|
-
|
|
Series XXXVI (Ps.
469,750)
|
05/18/16
|
11/18/17
|
Badlar
+425bp
|
469,750
|
-
|
|
|
|
|
|
||
|
Tarshop
S.A.
|
|
|
|
|
|
|
Series XI (Ps.
10,837)
|
05/23/13
|
05/23/16
|
Badlar+580bp
|
-
|
10,775
|
|
Series XII (Ps.
83,588)
|
08/09/13
|
08/09/15
|
15.0
%
|
-
|
83,112
|
|
Series XV (Ps.
119,755)
|
04/21/14
|
10/21/15
|
Badlar+490bp
|
-
|
113,967
|
|
Series XVII (Ps.
41,066)
|
11/26/14
|
08/26/15
|
LEBACx0.95
|
-
|
40,832
|
|
Series XVIII (Ps.
69,291)
|
11/26/14
|
05/26/16
|
Badlar+425bp
|
-
|
68,896
|
|
Series XIX (Ps.
6,314)
|
11/26/14
|
11/26/17
|
Badlar+525bp
|
3,950
|
6,280
|
|
Series XX (Ps.
69,100)
|
04/24/15
|
01/24/16
|
27.5
%
|
-
|
68,707
|
|
Series XXI (Ps.
80,500)
v
|
04/24/14
|
10/24/16
|
28.5
%
|
79,932
|
80,043
|
|
Series XXII (Ps.
126,667)
v
|
07/30/15
|
01/30/17
|
29.0
%
|
125,772
|
-
|
|
Series XXIII (Ps.
160,000)
v
|
11/16/15
|
05/16/17
|
Badlar+600bp
|
158,870
|
-
|
|
Series XXVI (Ps.
156,972)
v
|
01/26/16
|
07/26/17
|
Badlar+650bp
|
155,863
|
-
|
|
Series XXVII (Ps.
147,288)
|
05/04/16
|
11/04/17
|
Badlar+600bps
|
146,248
|
-
|
|
|
|
|
|
||
|
BACS
Banco de Crédito y Securitización S.A.
|
|
|
|
|
|
|
Series I (Ps.
130,435)
|
02/19/14
|
08/19/15
|
Badlar+450bp
|
-
|
130,435
|
|
Series III (Ps.
132,726)
|
08/19/14
|
05/19/16
|
Badlar
+275bp
|
-
|
132,726
|
|
Series IV (Ps.
105,555)
|
11/21/14
|
08/21/16
|
Badlar
+350bp
|
35,192
|
105,555
|
|
Series V (Ps.
150,000)
|
04/17/15
|
01/17/17
|
9 months 27.48% and
then Badlar +450bp
|
150,000
|
150,000
|
|
Series VI (Ps.
141,666)
|
07/23/15
|
04/24/17
|
9 months 27.5% and
then Badlar +450bp
|
141,666
|
-
|
|
Series VII (Ps.
142,602)
|
02/18/16
|
11/18/17
|
Badlar
+475bp
|
142,602
|
-
|
|
Series VIII (Ps.
150,000)
|
05/24/16
|
11/24/17
|
Badlar
+439bp
|
150,000
|
|
-
|
F- 232
BANCO
HIPOTECARIO SA AND SUBSIDIARIES
NOTES
TO THE CONSOLIDATED FINANCIAL STATEMENTS
As of and for the twelve-month periods ended June 30, 2016, 2015
and 2014
(Expressed in thousands of Argentine pesos, except share data
and as otherwise indicated)
|
|
|
|
|
|
|
|
|
|
|
|
|
|
|
|
|
|
|
|
|
9,270,847
|
|
4,926,694
|
(a)
As of June 30, 2016
Badlar rate was 21.87%
The contractual
maturities of the negotiable obligations are as follows as of June
30, 2016:
|
June 30,
2017……………………………..
|
Ps.
|
1,830,337
|
|
June 30,
2018……………………………..
|
|
1,772,288
|
|
June 30,
2019……………………………..
|
|
455,742
|
|
Thereafter………………………………...
|
|
5,212,480
|
|
Total
|
Ps.
|
9,270,847
|
The General
Shareholders' Meeting held on May 23, 2008, approved the creation
of a new Global Program for issuing Negotiable Obligations, not
convertible into shares, with or without collateral, for an amount
of up to two billion US dollars (US$ 2,000,000,000) or the
equivalent thereof in pesos.
On March 27, 2012,
the General Ordinary Shareholders’ Meeting approved the
extension of the Global Program for the issuance of notes referred
above. In addition, the meeting resolved to delegate on the Board
of Directors the broadest powers to determine the time, amount, as
well as the other terms and conditions of each Series to be issued.
Additionally, on April 24, 2014, the General Ordinary
Shareholders’ Meeting renewed such delegation of
powers.
On February 11,
2015 the Bank’s Board of Directors approved the increase in
the Program amount for up to US Dollars seven hundred million
(US$ 700,000,000) or its equivalent in pesos.
On May 6, 2015, the
Bank’s Board of Directors approved the increase in the
Program amount for up to US dollars eight hundred million
(US$ 800,000,000) or its equivalent in pesos.
On November 30,
2015, the Bank issued Notes in the international capital markets
for US Dollars two hundred million (US$ 200,000,000) at an
interest rate of 9.75% per annum, due in 2020.
On December 1, 2015
and December 2, 2015, the Bank repurchased and retired Series 5
Notes for US Dollars one hundred and twenty two million four
hundred ninety-seven thousand (US$ 122,497,000) and US Dollars
one hundred and fifty-five thousand (US$ 155,000),
respectively, for which it paid US Dollars one hundred two with
fifty cents (US$ 102.50) for each US$ 100 in face
value.
The General
Ordinary Shareholders held on April 13, 2016, approved the
extension of the Bank’s Global Program for the issuance of
notes for up to US dollars eight hundred million (US$ 800,000,000)
or its equivalent in pesos currently in force for a term of up to 5
years , or the longer period permitted by applicable
law.
On June 15, 2016
the Bank’s Board of Directors approved the increase in the
Program amount for up to US Dollars one billion (US$ 1,000,000,000)
or its equivalent in pesos.
16.
Subordinated Bonds
At the
Extraordinary General Shareholders’ Meeting of BACS Banco de
Crédito y Securitización S.A., dated December 12, 2013,
the issuance of Convertible Subordinated Negotiable Obligations
through private offering was approved for an amount of up to
Ps.100,000.
On June 22, 2015,
BACS issued negotiable obligations that are convertible into the
Company’s ordinary and book-entry shares for a principal
amount of Ps.100,000.
F- 233
BANCO
HIPOTECARIO SA AND SUBSIDIARIES
NOTES
TO THE CONSOLIDATED FINANCIAL STATEMENTS
As of and for the twelve-month periods ended June 30, 2016, 2015
and 2014
(Expressed in thousands of Argentine pesos, except share data
and as otherwise indicated)
The private
offering of the convertible negotiable obligations was solely
addressed to the Company’s shareholders. IRSA Inversiones y
Representaciones Sociedad Anónima subscribed all the
convertible negotiable obligations.
On June 21, 2016,
BACS Banco de Crédito y Securitización S.A. took notice
of IRSA Inversiones y Representaciones SA’s decision to
exercise its conversion rights over the subordinated bonds
convertible into common shares and the filings made before the
Argentine Central Bank and the Argentine Securities
Commission.
17.
Level I American Depositary Receipts Program
On March 27, 2006
the US Securities and Exchange Commission (SEC) has made effective
the Level I American Depositary Receipts, “ADR”
program.
This program allows
foreign investors to buy the Bank’s stock through the
secondary market where ADRs are traded freely within the United
States. The Bank of New York has been appointed as depositary
institution.
18.
Derivative Financial Instruments
The Bank has
carried out its financial risk management through the subscription
of several derivative financial instruments. Derivative instruments
are recorded under the captions “Other receivable from
financial transactions – Amounts receivable under derivative
financial instruments” or Liabilities: “Other
liabilities from financial transactions – Amounts payable
under derivative financial instruments” in the Consolidated
Balance Sheet, and the related gain or loss under the captions
“Financial Income – Interest on loans and other
receivables from financial transactions” or: “Financial
Expenses – Interest on deposits and other liabilities from
financial transactions”, respectively, in the Consolidated
Statement of Income.
The following are
the derivative financial instruments outstanding as of June 30,
2016 and 2015:
|
Type
of Contract
|
|
Notional
amount
|
|
Net
Book Value Asset/(Liabilities)
|
|
Fair
Value
|
|||
|
|
|
2016
|
2015
|
|
2016
|
2015
|
|
2016
|
2015
|
|
|
|
|
|
|
|
|
|
|
|
|
Forwards
(1)(a)
|
|
-
|
-
|
|
-
|
-
|
|
-
|
-
|
|
Futures
(2)
|
|
|
|
|
|
|
|
|
|
|
Purchases
(a)
|
|
9,671,321
|
2,405,951
|
|
12,773
|
(505)
|
|
12,773
|
(505)
|
|
Sales
(a)
|
|
(7,020,174)
|
(1,519,307)
|
|
|
||||
|
Interest rate swaps
(3)(b)
|
|
-
|
30,000
|
|
-
|
63
|
|
-
|
63
|
|
|
|
|
|
|
12,773
|
(442)
|
|
12,773
|
(442)
|
(a)Underlying:
Foreign currency.
(b)Underlying:
Interest rate.
1.
Forwards: US dollar
forward transactions have been carried out, the settlement of
which, in general, is made without delivery of the underlying asset
but by means of the payment in Pesos of currency differences. These
transactions were performed mainly as hedge for foreign currency
positions. Transactions with settlement in Pesos were made upon
maturity.
For these
transactions, as of June 30, 2016 and 2015 the Bank has recognized
losses for Ps.179,085 and Ps. 34,646, respectively.
2.
Futures: Future
currency transactions have been carried out through which the
forward purchase and sale of foreign currencies (US dollar) was
agreed upon. These transactions were
F- 234
BANCO
HIPOTECARIO SA AND SUBSIDIARIES
NOTES
TO THE CONSOLIDATED FINANCIAL STATEMENTS
As of and for the twelve-month periods ended June 30, 2016, 2015
and 2014
(Expressed in thousands of Argentine pesos, except share data
and as otherwise indicated)
performed as hedge
for foreign currency position. Settlement is carried on a daily
basis for the difference.
For these
transactions, as of June 30, 2016 and 2015, the Bank has recognized
gains for Ps.753,373 and losses for Ps. 51,899,
respectively.
3.
On February 18,
2015, OTC Transactions – Badlar rate swaps for agreed upon
fixed interest rate were conducted. These are settled by paying the
difference in Pesos.
For these
transactions, as of June 30, 2015, the Bank has recognized gains
for Ps. 391, respectively.
19.
Securitization of mortgage loans, consumer loans and credit card
loans
The Bank created
separate trusts under its US securitization program and
“Cédulas Hipotecarias Argentina – program”;
and a consumer trust under BACS’s Global Trust Securities
Program. For each mortgage or consumer trust, the Bank transfers a
portfolio of mortgages or consumer loans originated by banks and
other financial institutions in trust to the relevant trustee. The
trustee then issues Class A senior Bonds, Class B subordinated
bonds and certificates of participation. The trust’s payment
obligations in respect of these instruments are collateralized by,
and recourse is limited to, the trust’s assets consisting of
the portfolio of mortgage or consumer loans and any reserve fund
established by the Bank for such purpose. The securitizations were
recorded as sales, and accordingly, the mortgage and consumer loans
conveyed to the trusts are no longer recorded as assets of the
Bank.
At the date of
these financial statements the following trust funds are
outstanding:
|
|
Debt
Securities
Class
A1/AV
|
Debt
Securities
Class
A2/AF
|
Debt
Securities
Class
B
|
Certificates
of
Participation
|
Total
|
|
|
|
|
|
|
|
|
BACS III –
Issued on 12.23.2005
|
|
|
|
|
|
|
Face value in
Ps.
|
77,600
|
|
1,200
|
1,200
|
80,000
|
|
Declared Maturity
Date
|
03.20.2013
|
|
09.20.2013
|
08.20.2015
|
|
|
|
|
|
|
|
|
|
BACS Funding I
Issued on 11.15.2001 (*)
|
|
|
|
|
|
|
Face value in
Ps.
|
-
|
-
|
-
|
29,907
|
29,907
|
|
Declared Maturity
Date
|
|
|
|
11.15.2031
|
|
|
|
|
|
|
|
|
|
BACS Funding II
Issued on 11.23.2001 (*)
|
|
|
|
|
|
|
Face value in
Ps.
|
-
|
-
|
-
|
12,104
|
12,104
|
|
Declared Maturity
Date
|
|
|
|
11.23.2031
|
|
|
|
|
|
|
|
|
|
BHSA I Issued on
02.01.2002
|
|
|
|
|
|
|
Face value in
Ps.
|
-
|
-
|
-
|
43,412
|
43,412
|
|
Declared Maturity
Date
|
|
|
|
02.01.2021
|
|
|
|
|
|
|
|
|
|
CHA VI Issued on
04.07.2006
|
|
|
|
|
|
|
Face value in
Ps.
|
56,702
|
-
|
-
|
12,447
|
69,149
|
|
Declared Maturity
Date
|
12.31.2016
|
|
|
12.31.2026
|
|
|
|
|
|
|
|
|
|
CHA VII Issued on
09.27.2006
|
|
|
|
|
|
|
Face value in
Ps.
|
58,527
|
-
|
-
|
12,848
|
71,375
|
|
Declared Maturity
Date
|
08.31.2017
|
|
|
02.28.2028
|
|
|
|
|
|
|
|
|
|
CHA VIII Issued on
03.26.2007
|
|
|
|
|
|
|
Face value in
Ps.
|
61.088
|
-
|
-
|
13,409
|
74.497
|
|
Declared Maturity
Date
|
08.31.2024
|
|
|
08.31.2028
|
|
|
|
|
|
|
|
|
|
CHA IX Issued on
08.28.2009
|
|
|
|
|
|
|
Face value in
Ps.
|
192,509
|
-
|
-
|
10,132
|
202,641
|
|
Declared Maturity
Date
|
02.07.2027
|
|
|
07.07.2027
|
|
|
|
|
|
|
|
|
|
CHA X Issued on
08.28.2009
|
|
|
|
|
|
|
Face value in
Ps.
|
-
|
-
|
-
|
17,224
|
17,224
|
|
Face value en
US$
|
85,001
|
-
|
-
|
-
|
85,001
|
|
Declared Maturity
Date
|
01.07.2027
|
|
|
06.07.2028
|
|
|
|
|
|
|
|
|
|
CHA XI Issued on
12.21.2009
|
|
|
|
|
|
|
Face value in
Ps.
|
204,250
|
-
|
-
|
10,750
|
215,000
|
|
Declared Maturity
Date
|
03.10.2024
|
|
|
10.10.2024
|
|
|
|
|
|
|
|
|
|
CHA XII Issued on
07.21.2010
|
|
|
|
|
|
|
Face value in
Ps.
|
259,932
|
-
|
-
|
13,680
|
273,612
|
|
Declared Maturity
Date
|
11.10.2028
|
|
|
02.10.2029
|
|
|
|
|
|
|
|
|
|
CHA XIII Issued on
12.02.2010
|
|
|
|
|
|
|
Face value in
Ps.
|
110,299
|
-
|
-
|
5,805
|
116,104
|
|
Declared Maturity
Date
|
12.10.2029
|
|
|
04.10.2030
|
|
|
|
|
|
|
|
|
|
CHA XIV Issued on
03.18.2011
|
|
|
|
|
|
|
Face value in
Ps.
|
119,876
|
-
|
-
|
6,309
|
126,185
|
|
Declared Maturity
Date
|
05.10.2030
|
|
|
08.10.2030
|
|
|
|
|
|
|
|
|
(*)Trusts
subject to the pesification of foreign currency assets and
liabilities at the $1.00=US$1 rate established by Law 25561 and
Decree 214, as they were created under Argentine legislation.
Certain holders of Class A debt securities have started declarative
actions against the trustee pursuant to the application of the
pesification measures set forth in Law 25561 and Decree 214, in
order to maintain the currency of origin of said securities. In
these declarative actions, the Bank acted together with BACS as
third party. The trustee has duly answered to this claim, being the
final resolution to this situation is still pending.
F- 235
BANCO
HIPOTECARIO SA AND SUBSIDIARIES
NOTES
TO THE CONSOLIDATED FINANCIAL STATEMENTS
As of and for the twelve-month periods ended June 30, 2016, 2015
and 2014
(Expressed in thousands of Argentine pesos, except share data
and as otherwise indicated)
Tarshop SA has
created several financial trusts under its securitization program
(“Valores Fiduciarios Tarjeta Shopping – Global
program”) destined to assure its long-term financing
accessing directly to the capital market. The assets included in
the trusts relate to credit card coupons and advances in cash. The
table below presents the trusts issued and outstanding as of June
30, 2016:
|
|
Debt
Securities
|
Certificates
of
Participation
|
Total
|
|
|
|
|
|
|
Series
LXXXIII– Issued on 05.27.15
|
I
|
|
|
|
Face value in
Ps.
|
111,222
|
42,591
|
153,813
|
|
|
|
|
|
|
Series
LXXXIV– Issued on 03.12.15
|
|
|
|
|
Face value in
Ps.
|
104,865
|
39,019
|
143,884
|
|
|
|
|
|
|
Series LXXXV–
Issued on 05.20.15
|
|
|
|
|
Face value in
Ps.
|
128,500
|
47,800
|
176,300
|
|
|
|
|
|
|
Series
LXXXVI– Issued on 06.29.15
|
|
|
|
|
Face value in
Ps.
|
126,050
|
48,168
|
174,218
|
|
|
|
|
|
|
Series
LXXXVII– Issued on 10.01.15
|
|
|
|
|
Face value in
Ps.
|
141,066
|
57,091
|
198,157
|
|
|
|
|
|
|
Series
LXXXVIII– Issued on 04.01.16
|
|
|
|
|
Face value in
Ps.
|
148,489
|
65,472
|
213,961
|
|
|
|
|
|
|
Series
LXXXIX–Issued on 05.17.16
|
|
|
|
|
Face value in
Ps.
|
143,530
|
63,282
|
206,812
|
|
|
|
|
|
|
Series XC–
Issued on 06.28.16
|
|
|
|
|
Face value in
Ps.
|
150,025
|
66,162
|
216,187
|
|
|
|
|
|
|
Series XCI–
Privately issued on 05.15.16
|
|
|
|
|
Face value in
Ps.
|
102,581
|
39,893
|
142,474
|
|
|
|
|
|
|
Series XCII–
Privately issued on 06.15.16
|
|
|
|
|
Face value in
Ps.
|
82,622
|
32,131
|
114,753
|
|
|
|
|
|
|
Tarshop Privado
Series 1 - Privately issued on 08.21.15
|
|
|
|
|
Face value in
Ps.
|
1,162,400
|
329,362
|
1,491,762
|
|
|
|
|
|
|
Tarshop Privado
Series 1I - Privately issued on 12.23.15
|
|
|
|
F- 236
BANCO
HIPOTECARIO SA AND SUBSIDIARIES
NOTES
TO THE CONSOLIDATED FINANCIAL STATEMENTS
As of and for the twelve-month periods ended June 30, 2016, 2015
and 2014
(Expressed in thousands of Argentine pesos, except share data
and as otherwise indicated)
|
Face value in
Ps.
|
1,396,300
|
535,571
|
1,931,871
|
|
|
|
|
|
|
Tarshop Series 1 -
Privately issued on 09.15.15
|
|
|
|
|
Face value in
Ps.
|
77,799
|
27,201
|
105,000
|
|
|
|
|
|
BACS Banco de
Crédito y Securitización S.A. (BACS) has created separate
trusts which have personal loans, primary originated by
cooperatives and later acquired by BACS, as assets. The mentioned
trusts have been issued under the “Fideicomisos Financieros
BACS – Global program" for the securitization for a face
value up to Ps. 300,000. As of June 30, 2016 and 2015 there are no
trusts outstanding.
As of June 30, 2016
and 2015, the Bank held in its portfolio the following securities
corresponding to the abovementioned trusts:
F- 237
BANCO
HIPOTECARIO SA AND SUBSIDIARIES
NOTES
TO THE CONSOLIDATED FINANCIAL STATEMENTS
As of and for the twelve-month periods ended June 30, 2016, 2015
and 2014
(Expressed in thousands of Argentine pesos, except share data
and as otherwise indicated)
|
|
June
30,
|
||||
|
|
2016
|
|
2015
|
||
|
|
|
|
|
|
|
|
Class B debt
securities – BHN II
|
Ps.
|
-
|
|
Ps.
|
7,000
|
|
Class B debt
securities – BHN III
|
|
-
|
|
|
7,203
|
|
Class B debt
securities – BHN IV
|
|
-
|
|
|
79,351
|
|
Class A debt
securities – BHN IV
|
|
-
|
|
|
44
|
|
Class A debt
securities – CHA VI to CHA XIV
|
|
103,829
|
|
|
75,417
|
|
Class A debt
securities – BACS I
|
|
-
|
|
|
20,234
|
|
Class B debt
securities – BACS I
|
|
-
|
|
|
1,081
|
|
Debt securities
– BACS III
|
|
14,411
|
|
|
15,768
|
|
Debt securities
– Tarshop Series LXXIX
|
|
-
|
|
|
2,042
|
|
Debt securities
– Tarshop Series LXXXII
|
|
-
|
|
|
7,198
|
|
Debt securities
– Tarshop Series LXXXIII
|
|
998
|
|
|
13,530
|
|
Debt securities
– Tarshop Series LXXXIV
|
|
-
|
|
|
20,927
|
|
Debt securities
– Tarshop Series LXXXV
|
|
-
|
|
|
19,448
|
|
Debt securities
– Tarshop Series LXXXVII
|
|
27,260
|
|
|
-
|
|
Debt securities
– Tarshop Series XC
|
|
14,796
|
|
|
-
|
|
Debt securities
– Tarshop Series XCI
|
|
19,525
|
|
|
-
|
|
Debt securities
– Tarshop Privado Series I
|
|
98,453
|
|
|
-
|
|
Debt securities
– Tarshop Privado Series II
|
|
656,071
|
|
|
-
|
|
Debt securities
– Tarshop Series I
|
|
1,222,787
|
|
|
-
|
|
Subtotal
|
Ps.
|
2,158,130
|
|
Ps.
|
269,243
|
|
|
June
30,
|
||||
|
|
2016
|
|
2015
|
||
|
|
|
|
|
|
|
|
Certificates of
participation – BHN II
|
Ps.
|
-
|
|
Ps.
|
41,722
|
|
Certificates of
participation – BHN III
|
|
-
|
|
|
14,970
|
|
Certificates of
participation – CHA VI
|
|
13,737
|
|
|
13,592
|
|
Certificates of
participation – CHA VII
|
|
-
|
|
|
953
|
|
Certificates of
participation – CHA IX
|
|
10,181
|
|
|
10,677
|
|
Certificates of
participation – CHA X
|
|
26,578
|
|
|
26,085
|
|
Certificates of
participation – CHA XI
|
|
11,935
|
|
|
14,488
|
|
Certificates of
participation – CHA XII
|
|
14,440
|
|
|
18,298
|
|
Certificates of
participation – CHA XIII
|
|
4,277
|
|
|
5,330
|
|
Certificates of
participation – CHA XIV
|
|
4,173
|
|
|
5,401
|
|
Certificates of
participation – BHSA I
|
|
8,949
|
|
|
9,192
|
|
Certificates of
participation – BACS III
|
|
1,003
|
|
|
1,003
|
|
Certificates of
Participation – Tarshop Series LXXIX
|
|
-
|
|
|
48,523
|
|
Certificates of
Participation – Tarshop Series LXXX
|
|
-
|
|
|
47,053
|
|
Certificates of
Participation – Tarshop Series LXXXI
|
|
-
|
|
|
23,782
|
|
Certificates of
Participation – Tarshop Series LXXXII
|
|
-
|
|
|
24,551
|
|
Certificates of
Participation – Tarshop Series LXXXIII
|
|
22,045
|
|
|
34,032
|
|
Certificates of
Participation – Tarshop Series LXXXIV
|
|
19,797
|
|
|
23,486
|
|
Certificates of
Participation – Tarshop Series LXXXV
|
|
23,094
|
|
|
25,112
|
|
Certificates of
Participation – Tarshop Series LXXXVI
|
|
24,817
|
|
|
-
|
|
Certificates of
Participation – Tarshop Series LXXXVII
|
|
32,074
|
|
|
-
|
|
Certificates of
Participation – Tarshop Series LXXXVIII
|
|
42,178
|
|
|
-
|
|
Certificates of
Participation – Tarshop Series LXXXIX
|
|
41,048
|
|
|
-
|
|
Certificates of
Participation – Tarshop Series XC
|
|
48,088
|
|
|
-
|
|
Certificates of
Participation – Tarshop Series XCI
|
|
33,284
|
|
|
-
|
|
Certificates of
Participation – Tarshop Series XCII
|
|
(920)
|
|
|
-
|
F- 238
BANCO
HIPOTECARIO SA AND SUBSIDIARIES
NOTES
TO THE CONSOLIDATED FINANCIAL STATEMENTS
As of and for the twelve-month periods ended June 30, 2016, 2015
and 2014
(Expressed in thousands of Argentine pesos, except share data
and as otherwise indicated)
|
Certificates of
Participation – Tarshop Privado Series I
|
|
8,288
|
|
|
-
|
|
Certificates of
Participation – Tarshop Privado Series II
|
|
175,214
|
|
|
-
|
|
Certificates of
Participation – Tarshop Series I
|
|
382,235
|
|
|
-
|
|
Subtotal
|
Ps.
|
946,515
|
|
Ps.
|
388,250
|
|
Total
|
Ps.
|
3,105,151
|
|
Ps.
|
657,493
|
20.
Miscellaneous Liabilities
Sundry creditors
and other miscellaneous liabilities consist of the following as of
the end of each period:
|
|
June
30,
|
||||
|
|
2016
|
|
2015
|
||
|
Sundry
creditors:
|
|
|
|
|
|
|
Accrued fees and
expenses payable
…….…………….……...
|
Ps.
|
857,251
|
|
Ps.
|
1,291,772
|
|
Summary proceedings
in financial matters N° 1320 (*)……
|
|
-
|
|
|
53,632
|
|
Unallocated
collections……………………………………….
|
|
12,116
|
|
|
9,464
|
|
Withholdings and
taxes
payable……………………………...
|
|
57,288
|
|
|
96,350
|
|
Other………………………………………………………….
|
|
19,233
|
|
|
16,973
|
|
Total
|
Ps.
|
945,888
|
|
Ps.
|
1,468,191
|
(*)
The Bank’s Board of Directors granted its
approval to the actions undertaken by the Executive Committee
concerning the deposit of the penalties imposed on directors,
former directors, managers, former managers and statutory auditors
and the fact that such amounts were charged against the statement
of income in the framework of
Financial Summary Proceedings
No. 1320 (Note 30).
|
|
June
30,
|
||||
|
|
2016
|
|
2015
|
||
|
Other:
|
|
|
|
|
|
|
Directors and
Syndics accrued fees
payable………………….
|
Ps.
|
57,109
|
|
Ps.
|
47,829
|
|
Payroll
withholdings and
contributions……………………....
|
|
99,962
|
|
|
91,217
|
|
Gratifications………………………………………………....
|
|
180,553
|
|
|
68,810
|
|
Salaries and social
securities………………………………….
|
|
46,786
|
|
|
64,559
|
|
Total
|
Ps.
|
384,410
|
|
Ps.
|
272,415
|
21.
Income from Services and Expenses on Services
Income from Services
Commissions earned
consist of the following for each period:
|
|
June
30,
|
|||||||
|
|
2016
|
|
2015
|
|
2014
|
|||
|
|
|
|
|
|
|
|
|
|
|
Loan servicing fees
from third
parties…..………….
|
Ps.
|
50,844
|
|
Ps.
|
37,240
|
|
Ps.
|
30,854
|
|
Commissions for
credit
cards……...…………………
|
|
1,573,624
|
|
|
1,048,855
|
|
|
705,143
|
|
Other
…..……………………………………………
|
|
158,653
|
|
|
209,230
|
|
|
130,619
|
|
Total
|
Ps.
|
1,783,121
|
|
Ps.
|
1,295,325
|
|
Ps.
|
866,616
|
Other income from
services is comprised of the following for each
period:
|
|
June
30,
|
F- 239
BANCO
HIPOTECARIO SA AND SUBSIDIARIES
NOTES
TO THE CONSOLIDATED FINANCIAL STATEMENTS
As of and for the twelve-month periods ended June 30, 2016, 2015
and 2014
(Expressed in thousands of Argentine pesos, except share data
and as otherwise indicated)
|
|
2016
|
|
2015
|
|
2014
|
|||
|
|
|
|
|
|
|
|
|
|
|
Reimbursement of
loan expenses paid by third
parties………………………………………..………
|
Ps.
|
26,088
|
|
Ps.
|
19,547
|
|
Ps.
|
37,289
|
|
Income from
services from PROCREAR (note 31)…
|
|
244,130
|
|
|
106,619
|
|
|
30,947
|
|
Other
(*)….…………………………………………
|
|
554,535
|
|
|
607,096
|
|
|
287,917
|
|
Total
|
Ps.
|
824,753
|
|
Ps.
|
733,262
|
|
Ps.
|
356,153
|
(*) For the
twelve-month periods ended June 30, 2016, 2015 and 2014, includes
Ps. 426,829, Ps. 525,516 and Ps. 235,379, respectively, related to
other income services granted by Tarshop.
Expenses on Services
Commissions
expensed consist of the following for each period:
|
|
June
30,
|
|||||||
|
|
2016
|
|
2015
|
|
2014
|
|||
|
|
|
|
|
|
|
|
|
|
|
Structuring and
underwriting
fees…………………..
|
Ps.
|
54,879
|
|
Ps.
|
16,466
|
|
Ps.
|
14,254
|
|
Retail bank
originations……………………………...
|
|
12,073
|
|
|
7,690
|
|
|
6,327
|
|
Collections…………………………………………...
|
|
303
|
|
|
181
|
|
|
159
|
|
Aerolíneas
Argentinas
co-branding…………………
|
|
50,952
|
|
|
27,329
|
|
|
11,398
|
|
Services on
loans……………………………………..
|
|
754,359
|
|
|
452,188
|
|
|
373,412
|
|
Commissions paid to
real estate agents…………….
|
|
45,056
|
|
|
36,688
|
|
|
40,707
|
|
Total
|
Ps.
|
917,622
|
|
Ps.
|
540,542
|
|
Ps.
|
446,257
|
22.
Other Miscellaneous Income and Miscellaneous Expenses
Other miscellaneous
income is comprised of the following for each period:
|
|
June
30,
|
|||||||
|
|
2016
|
|
2015
|
|
2014
|
|||
|
|
|
|
|
|
|
|
|
|
|
Income on
operations with premises and equipment and miscellaneous
assets…………......................
|
Ps.
|
3,592
|
|
Ps.
|
578
|
|
Ps.
|
2,944
|
|
Rental
income…………….………………………..
|
|
2,976
|
|
|
2,267
|
|
|
2,290
|
|
Interest on loans
to bank
staff..…………………….
|
|
35,581
|
|
|
31,447
|
|
|
26,601
|
|
Income from equity
investments.…………………….
|
|
34,644
|
|
|
6,641
|
|
|
-
|
|
Other…..…………………………………………….
|
|
51,852
|
|
|
17,942
|
|
|
15,708
|
|
Total
|
Ps.
|
128,645
|
|
Ps.
|
58,875
|
|
Ps.
|
47,543
|
Other miscellaneous
expenses are comprised of the following for each
period:
|
|
June
30,
|
|||||||
|
|
2016
|
|
2015
|
|
2014
|
|||
|
|
|
|
|
|
|
|
|
|
|
Depreciation of
miscellaneous
assets………………..
|
Ps.
|
310
|
|
Ps.
|
340
|
|
Ps.
|
388
|
|
Gross revenue
tax……………………………………
|
|
9,206
|
|
|
7,126
|
|
|
4,395
|
|
Other
taxes…………………………………………...
|
|
178,828
|
|
|
117,464
|
|
|
78,784
|
|
Debit card
discounts…………………………………
|
|
24,718
|
|
|
20,624
|
|
|
14,285
|
|
Credit card and
others
discounts…………………….
|
|
59,807
|
|
|
40,577
|
|
|
43,422
|
|
Benefits
prepayments………………………………..
|
|
2,856
|
|
|
9,268
|
|
|
6,008
|
|
Donations……………………………………………
|
|
51,026
|
|
|
39,842
|
|
|
24,325
|
F- 240
BANCO
HIPOTECARIO SA AND SUBSIDIARIES
NOTES
TO THE CONSOLIDATED FINANCIAL STATEMENTS
As of and for the twelve-month periods ended June 30, 2016, 2015
and 2014
(Expressed in thousands of Argentine pesos, except share data
and as otherwise indicated)
|
Amortization of
goodwill……………………………
|
|
3,430
|
|
|
3,430
|
|
|
3,430
|
|
|
Payment Summary
proceedings in financial matters N° 1320
(*)………………………………………….
|
|
-
|
|
|
53,632
|
|
|
-
|
|
|
Other
…..……………………………………………
|
|
47,654
|
|
|
44,417
|
|
|
45,393
|
|
|
Total
|
Ps.
|
377,835
|
|
Ps.
|
336,720
|
|
Ps.
|
220,430
|
|
(*) During
The fiscal year 2015, the Bank’s Board of Directors granted
its approval to the actions undertaken by the Executive Committee
concerning the deposit of the penalties imposed on directors,
former directors, managers, former managers and statutory auditors
and the fact that such amounts were charged against the statement
of income in the framework of the Financial Summary Proceedings No.
1320 (Note 30).
23.
Balances in Foreign Currency
The balances of
assets and liabilities denominated in foreign currency (principally
in US dollars and Euros) are as follows:
|
|
US$
|
Euro
|
Yen
|
Total
|
|
|
(in
Pesos)
|
|||
|
Assets:
|
|
|
|
|
|
Cash and due from
banks…..………..………..
|
1,222,421
|
28,210
|
10
|
1,250,641
|
|
Government and
corporate securities..………..
|
2,351,646
|
292,729
|
-
|
2,644,375
|
|
Loans………………..………………………...
|
1,435,021
|
-
|
-
|
1,435,021
|
|
Other receivables
from financial transactions...
|
1,011,013
|
-
|
-
|
1,011,013
|
|
Miscellaneous
receivables………………….…
|
136,909
|
65
|
-
|
136,974
|
|
Items pending
allocation………………..….…
|
541
|
-
|
-
|
541
|
|
Total as of June
30, 2016
|
6,157,550
|
321,004
|
10
|
6,478,565
|
|
Total as of June
30, 2015
|
3,253,549
|
18,591
|
5
|
3,272,145
|
|
|
|
|
|
|
|
Liabilities:
|
|
|
|
|
|
Deposits………………………………………
|
2,458,279
|
-
|
-
|
2,458,279
|
|
Other liabilities
from financial transactions….
|
6,585,111
|
49
|
-
|
6,585,160
|
|
Miscellaneous
liabilities………………………
|
12,667
|
20
|
-
|
12,687
|
|
Items
pending
allocation……………………..
|
496
|
31
|
-
|
527
|
|
Total as of June
30, 2016
|
9,056,553
|
100
|
-
|
9,056,653
|
|
Total as of June
30, 2015
|
3,082,324
|
101,490
|
-
|
3,183,814
|
24.
Income Tax
In accordance with
Section 28 of Law 24,855, Banco Hipotecario Sociedad Anónima
is subject to income tax, except with respect to housing loan
transactions made before October 23, 1997, the date of registration
of its bylaws with the Superintendency of
Corporations.
The Bank records
the charges to income, when applicable, and a provision in its
liabilities for the tax applicable to its taxable transactions in
the fiscal year to which they refer.
As of December 31,
2015 and 2014, the Bank estimated income tax by applying the 35%
tax rate to its taxable income. The amount determined as income tax
was charged against income for the fiscal period under
“Income Tax”. The provision for income tax is recorded
under “Miscellaneous Liabilities –
Other”.
The Bank has a tax
net operating loss carry forward of Ps. 143,435 and Ps. 59,690 at
June 30, 2016 and 2015, respectively.
25.
Presumptive Minimum Income Tax
F- 241
BANCO
HIPOTECARIO SA AND SUBSIDIARIES
NOTES
TO THE CONSOLIDATED FINANCIAL STATEMENTS
As of and for the twelve-month periods ended June 30, 2016, 2015
and 2014
(Expressed in thousands of Argentine pesos, except share data
and as otherwise indicated)
The Bank is subject
to presumptive minimum income tax. Pursuant to this tax regime, the
Bank is required to pay the greater of the income tax or the
presumptive minimum income tax. Any excess of the presumptive
minimum income tax over the income tax may be carried forward and
recognized as a tax credit against future income taxes payable over
a 10-year period. The presumptive minimum income tax provision is
calculated on an individual entity basis at the statutory asset tax
rate of 1% and is based upon the taxable assets of each company as
of the end of the year, as defined by Argentine law. For financial
entities, the taxable basis is 20% of their computable
assets.
As of June 30, 2016
Tarshop recorded the Ps.76,144 tax credit.
26.
Shareholders' Equity
The following
information relates to the statements of changes in
the Bank’s
shareholders'
equity.
(a)
Common Stock
Prior to June 30,
1997, the Bank's capital stock consisted of assigned capital with
no par value owned 100% by the Argentine government. In accordance
with the by-laws approved as a result of the conversion of the Bank
to a
sociedad anónima
,
the Bank's capital stock was established at Ps.1,500,000 and
divided into four classes of ordinary common shares.
As of June 30,
2016, the Bank's capital stock consists of:
|
Shareholder
|
Class
of
Shares
|
Number
of
Shares
|
|
Total
%
Ownership
|
Voting
Rights
|
|
Argentine
government (through FFFRI) (b)
|
A
|
665,499,426
|
|
44.4%
|
1 vote
|
|
Banco Nación
, as trustee for the
Bank's
Programa de Propiedad
Participada
(a)
|
B
|
57,009,279
|
|
3.8%
|
1 vote
|
|
Argentine
government (through FFFRI)
|
C
|
75,000,000
|
|
5.0%
|
1 vote
|
|
Public investors
(c) (d)
|
D
|
702,491,295
|
|
46.8%
|
3
votes
|
|
|
|
1,500,000,000
|
|
100.0%
|
|
_______________
(a)
The Bank's
Programa de Propiedad
Participada
(“PPP”) is the Bank's employee stock
ownership plan. Under Decree 2127/2012 and Resolution 264/2013
issued by the Ministry of Economy and Public Finance, the PPP was
implemented. Under this plan, in a first stage, out of a total of
75,000,000, 17,990,721 Class B shares were converted into Class A
shares, to be allocated among the employees that have withdrawn
from the Bank in accordance with the implementation guidelines.
Upon delivery to the former employees, the 17,990,721 shares will
become Class D shares. The shares allocated to the Bank’s
current employees are designated as Class B shares, representing
the PPP.
On December 2,
2015, the Bank took notice of an observation raised by the
Superintendent of Financial Institutions reporting to the Argentine
Central Bank with regard to the insurance business developed by
Banco Hipotecario S.A. through BHN Vida S.A. and BHN Seguros
Generales S.A.
The observation
requires the enforcement of the credit scoring regulations, which
impose a 12.5% limit on interests in the capital stock and voting
rights of other companies.
In reply, the Bank
has claimed that such observation should be revised, in that the
Bank is allowed to conduct the business in question pursuant to the
Privatization Law No. 24,855 and
F- 242
BANCO
HIPOTECARIO SA AND SUBSIDIARIES
NOTES
TO THE CONSOLIDATED FINANCIAL STATEMENTS
As of and for the twelve-month periods ended June 30, 2016, 2015
and 2014
(Expressed in thousands of Argentine pesos, except share data
and as otherwise indicated)
its regulations, in
particular Decree No. 1394/98, as continuing company of Banco
Hipotecario Nacional, as set forth in the first paragraph of this
Note.
(b)
Under the Bylaws,
the affirmative vote of the holders of Class A Shares is required
in order to effectuate: (i) mergers or spin-offs; (ii) an
acquisition of shares (constituting a Control Acquisition or
resulting in the Bank being subject to a control situation); (iii)
the transfer to third parties of a substantial part of the loan
portfolio of the Bank, (iv) a change in the Bank’s corporate
purpose; (v) the transfer of the Bank’s corporate domicile
outside of Argentina, and (vi) the voluntary dissolution of the
Bank.
(c)
For so long as
Class A Shares represent more than 42% of the Bank’s capital,
the Class D Shares shall be entitled to three votes per share,
except that holders of Class D Shares will be entitled to one vote
per share in the case of a vote on: (i) a fundamental change in the
Bank’s corporate purpose; (ii) a change of the Bank’s
domicile to be outside of Argentina; (iii) dissolution prior to the
expiration of the Bank’s corporate existence; (iv) a merger
or spin-off in which the Bank is not the surviving corporation; and
(v) a total or partial recapitalization following a mandatory
reduction of capital.
(d)
By reason of the
expiration on January 29, 2009 of the Total Return Swap that had
been executed and delivered on January 29, 2004, Deutsche Bank AG
transferred to the Bank 71,100,000 ordinary Class “D”
shares in Banco Hipotecario Sociedad Anónima with face value $
1 each, which are available for the term and in the conditions
prescribed by the Argentine Companies Law, in its Section 221. The
General Ordinary Shareholders’ Meeting held on April 30, 2010
resolved to extend for a year, counted as from January 31, 2010,
the term for realizing the treasury shares held by the
Bank.
On April 30, 2010,
the General Extraordinary Shareholders’ Meeting resolved to
delegate upon the Board of Directors the decision to pay with the
treasury shares in portfolio the Stock Appreciation Rights (StAR)
coupons resulting from the debt restructuring as advisable based on
the contractually agreed valuation methods and their actual market
value after allowing the shareholders to exercise their preemptive
rights on an equal footing.
On June 16, 2010,
the Board of Directors resolved to launch a preemptive offer to
sell a portion of the Bank’s treasury shares, for a total of
36.0 million class D shares. The remaining shares would be
delivered in payment to the holders of Stock Appreciation Rights
(StAR) coupons arising from the debt restructuring, which fell due
on August 3, 2010. On July 26, 2010, within the framework of the
referred offer, the Bank sold approximately 26.9 million of the
shares mentioned above.
On August 3, 2010
the proceeds of the offer and the balance of the shares referred in
the preceding paragraph were made available to the holders of the
Stock Appreciation Rights (StAR) coupons. With the above-mentioned
offering, 999,312 Class D shares were sold in excess of those
required to pay off the obligation previously mentioned. In
connection with such excess sale, Ps. 554 were recorded as retained
earnings to reflect the addition of the shares to the
entity’s equity, which took place on January 29, 2009 as
detailed in this note, and a further Ps. 834 were booked as
Additional paid-in capital for the difference between the value as
added to the entity’s equity and the sales
value.
The General
Ordinary Shareholders’ Meeting held on April 24, 2013
resolved to allocate 35,100,000 Class D shares held by the Bank to
a compensation program for the personnel under the terms of Section
67 of Law 26831. This decision is pending approval of
CNV.
On April 24, 2014
the General Ordinary Shareholders’ Meeting acknowledged the
incentive or compensation program described in the preceding
paragraph and its extension to the personnel employed by the
subsidiaries BACS Banco de Crédito y Securitización S.A.,
BH Valores S.A., BHN Sociedad de Inversión S.A., BHN Vida S.A.
and BHN Seguros Generales S.A.
F- 243
BANCO
HIPOTECARIO SA AND SUBSIDIARIES
NOTES
TO THE CONSOLIDATED FINANCIAL STATEMENTS
As of and for the twelve-month periods ended June 30, 2016, 2015
and 2014
(Expressed in thousands of Argentine pesos, except share data
and as otherwise indicated)
The Class B shares
have been set aside for sale to the Bank's employees in the future
pursuant to the PPP on terms and conditions to be established by
the Argentine government. Any Class B shares not acquired by the
Bank's employees at the time the Bank implements the PPP will
automatically convert into Class A shares. The Class C shares are
eligible for sale only to companies engaging in housing
construction or real estate activities. Any Class B shares
transferred by an employee outside the PPP will automatically
convert to Class D shares or Class C shares transferred to persons
not engaged in construction or real estate activities will
automatically convert into Class D shares.
(b)
Distribution of profits
No profits may be
distributed when any financial year does not produce
profits.
Argentine Central
Bank Communication “A” 4152 dated June 2, 2004 left
without effect the suspension of the distribution of profits
established by Communication “A” 3574. However, those
banks that proceed to such distribution must be previously
authorized by the Financial and Exchange Institutions
Superintendency.
Through
Communiqué “A” 4526 dated April 24, 2006, the BCRA
established that when the Legal Reserve is used to absorb losses,
earnings shall not be distributed until the reimbursement thereof.
Should the balance prior to the absorption exceed 20% of the
Capital Stock plus the Capital Adjustment, profits may be
distributed once the latest value is reached.
For purposes of
determining distributable balances, the net difference arising from
the book value and the market quotation shall be deducted from
retained earnings, in the event the Entity records government debt
securities and/or debt securities issued by the BCRA not recorded
at market prices, with volatility published by such
entity.
Pursuant to its
Communication “A” 5072, BCRA established that no
dividend distribution shall be admitted in so far as: a) the
amounts deposited as minimum cash requirements on average –
in Pesos, foreign currency or in Government securities – were
less than the requirements pertaining to the most recently closed
position or the position as projected taking into account the
effect of the distribution of dividends, and/or b) the amounts
deposited as minimum capital requirements were less than the
requirements recalculated as previously mentioned plus a 30%
increase, and/or c) the Entity has received financial aid from the
BCRA on grounds of illiquidity as set forth in Section 17 of
BCRA’s Charter.
On January 27,
2012, the BCRA issued Communication “A” 5272 whereby it
established that for the calculation of the minimum capital
requirement, the minimum capital for operational risk shall be
included. On the same date, Communication “A” 5273 was
also issued, whereby the BCRA resolved to increase the percentage
referred to in the preceding paragraph, subsection b), from 30% to
75%.
Communication
“A” 5369 provided that as from January 1, 2013, for the
purposes of calculating the position of minimum capitals, the
capital requirement for credit risk due to securitizations must be
computed over all the transactions outstanding as of the
computation date.
On September 23,
2013 the Argentine Congress enacted Law N° 26,983 which amends
the Income Tax Law and sets forth that dividends or earnings in
money or in kind shall be levied with Income Tax at a 10% tax rate
payable in a final and lump sum.
The Ordinary
General Shareholders’ Meeting, held on April 13, 2011,
resolved to distribute the income for the year ended on December
31, 2010 as follows: Ps. 39,063 (20%), to be applied to
the
F- 244
BANCO
HIPOTECARIO SA AND SUBSIDIARIES
NOTES
TO THE CONSOLIDATED FINANCIAL STATEMENTS
As of and for the twelve-month periods ended June 30, 2016, 2015
and 2014
(Expressed in thousands of Argentine pesos, except share data
and as otherwise indicated)
legal reserve Ps.
100,000 (61.59%), to be paid out as cash dividends on ordinary
shares, and the balance, after the Board’s remuneration, to
be maintained as retained earnings. On September 20, 2012, the BCRA
reported that there were no objections against the Bank’s
distribution of cash dividends for Ps. 100,000, as requested. For
such reason, on October 10, 2012 such cash funds were made
available to the shareholders.
The Ordinary
General Shareholders’ Meeting, held on August 23, 2013,
resolved to distribute the income for the year ended on December
31, 2012 as follows: Ps. 68,721, to be applied to the legal
reserve; Ps. 30,000, to be paid out as cash dividends on ordinary
shares; and Ps. 244,886 to be maintained as retained earnings. This
decision has been approved by BCRA.
On April 24, 2014,
the Ordinary General Shareholders’ Meeting resolved to
distribute the income for the year ended on December 31, 2013 as
follows: Ps. 84,190, to be applied to the legal reserve; Ps.
42,000, to be paid out as cash dividends on ordinary shares; and
Ps. 294,760 to be maintained as retained earnings. Through Note
314/43/14 dated December 23, 2014, the Argentine Central Bank
authorized the Bank to distribute cash dividends for Ps. 42,000. At
its meeting dated January 7, 2015, the Board of Directors of Banco
Hipotecario S.A. resolved that these dividends should be made
available to the shareholders as of January 16, 2015.
On July 12, 2016 by
means of Communication "A" 6013 the Argentine Central Bank
published the updated text on “Distribution of profits”
effective as from January 1, 2016 by means of Communication
“A” 5827 and supplementary rules. The provisions of
this communication aim at converging towards international
principles and standards, among other changes, they stablish
additional capital margins.
27.
Employee Benefit Plan
The Bank is
obligated to make employer contributions to the National Pension
Plan System determined on the basis of the total monthly payroll.
These expenses are recorded in “Salaries and social security
contributions” under the “Administrative
expenses” caption in the accompanying consolidated statements
of income.
28.
Financial Instruments with Off-Balance Sheet Risk
In the normal
course of its business the Bank is party to financial instruments
with off-balance sheet risk in order to meet the financing needs of
its customers. These instruments expose the Bank to credit risk in
addition to amounts recognized in the balance sheets. These
financial instruments include commitments to extend
credit.
|
|
June
30,
|
||||
|
|
2016
|
|
2015
|
||
|
Commitments to
extend credit
|
|
|
|
|
|
|
Mortgage loans and
other loans
(a)….……………...
|
Ps.
|
165,636
|
|
Ps.
|
291,342
|
|
Credit card loans
(b)…..……………………..…….
|
|
22,947,873
|
|
|
14,049,429
|
|
Clearing items in
process
(c)..…………………………
|
|
234,515
|
|
|
137,944
|
|
Other guarantees
(d)………………………………….
|
|
483,644
|
|
|
57,739
|
(a)
Commitments to
extend credit are agreements to lend to a customer at a future
date, subject to such customers meeting of pre-defined contractual
milestones. Typically, the Bank will commit to extend financing for
construction project lending on the basis of the certified progress
of the work under construction. Most arrangements require the
borrower to pledge the land or buildings under construction as
collateral. In the opinion of management, the
F- 245
BANCO
HIPOTECARIO SA AND SUBSIDIARIES
NOTES
TO THE CONSOLIDATED FINANCIAL STATEMENTS
As of and for the twelve-month periods ended June 30, 2016, 2015
and 2014
(Expressed in thousands of Argentine pesos, except share data
and as otherwise indicated)
(b)
Bank’s
outstanding commitments do not represent unusual credit risk. The
Bank’s exposure to credit loss in the event of nonperformance
by the other party is represented by the contractual notional
amount of those commitments.
(c)
The Bank has a
unilateral and irrevocable right to reduce or change the credit
card limit, thus it considered there is no off-balance sheet risk.
In the opinion of management, the Bank’s outstanding
commitments do not represent unusual credit risk. The Bank’s
exposure to credit loss in the event of nonperformance by the other
party is represented by the contractual notional amount of those
commitments.
(d)
The Bank accounts
for items drawn on other banks in memorandum accounts until such
time as the related item clears or is accepted. In the opinion of
management, the Bank’s risk of loss on these clearing
transactions is not significant as the transactions primarily
relate to collections on behalf of third parties.
(e)
Mainly
includes the amounts given as collateral for transactions held by
customers.
29.
Adoption of International Financial Reporting
Standards
By virtue of its
General Resolution No. 562, the Argentine Securities Commission
(CNV) has decided to enforce the provisions under the Technical
Pronouncement No. 26 of the Argentine Federation of Professional
Councils in Economic Sciences (FACPCE) that adopts the
International Financial Reporting Standards (IFRS) for all the
companies overseen by CNV as from the fiscal years beginning on
January 1, 2012.
The Bank is not
obligated to apply these standards insofar as the CNV has excluded
all the entities for which CNV is empowered to accept the
accounting criteria laid down by other regulatory and/or oversight
authorities (financial institutions, insurance companies, etc.)
from using the IFRS.
On February 12,
2014, BCRA issued its Communication “A” 5541 whereby it
provides a roadmap to convergence between the informational and
accounting regime and IFRS. Pursuant to this Communication, the
entities and institutions must start to account for their financial
transactions and changes in accordance with the rules issued by
BCRA following the above-mentioned convergence regime as from the
fiscal years beginning on January 1, 2018. This roadmap includes
the following steps:
●
First
half of 2015
Financial
institutions must prepare and file their own convergence plan and
provide the name of the compliance officer appointed to such
end.
Disclosure of
guidelines to be observed by institutions regarding reconciliations
are to be filed with the BCRA.
●
Second
half of 2015
The institutions
shall file with the BCRA, together with the financial statements as
of the fiscal year’s closing date, a reconciliation of the
main asset, liability and shareholders’ equity captions with
the amounts that would result from applying the rules issued by the
BCRA under the scope of the IFRS convergence process. This
information shall include a special report by the independent
auditor and will be used exclusively by the BCRA for supervision
and regulation purposes, and will qualify as non-public.
Institutions shall report on the degree of progress made in the
IFRS Convergence Plan.
●
Year
2016
According to the
method and frequency established in due course, institutions shall
continue to report to the BCRA the degree of progress made by them
in the IFRS convergence process. In
F- 246
BANCO
HIPOTECARIO SA AND SUBSIDIARIES
NOTES
TO THE CONSOLIDATED FINANCIAL STATEMENTS
As of and for the twelve-month periods ended June 30, 2016, 2015
and 2014
(Expressed in thousands of Argentine pesos, except share data
and as otherwise indicated)
addition, they
shall continue to disclose in their published financial statements
that they are progressing in the IFRS Convergence Plan. There will
be an issuance of a CONAU Circular to communicate the new Minimum
Accounts Plan and Form of Financial Statements (New Informational
and Accounting Regime for Quarterly / Annual
Publication).
●
Year
2017
As of January 1,
2017, institutions shall prepare the opening financial statements
that will serve as basis for preparing their comparative financial
statements. In each quarterly statement, they shall include a
reconciliation of the main asset, liability and shareholders’
equity captions and results with the amounts that would result from
applying the rules issued by the BCRA under the scope of the IFRS
convergence process. Such reconciliations shall be supported by a
special report by the independent auditor. The quantitative
information and the degree of progress of the IFRS Convergence Plan
will be disclosed in a note to the published financial
statements.
●
Year
2018
As from the
financial statements starting on January 1, 2018, financial
institutions shall be required to record their transactions and
equity changes in accordance with the rules issued by the BCRA
under the IFRS convergence process. Therefore, as from the closing
of the first quarter, they shall prepare and submit their published
financial statements according to the above mentioned rules; the
independent auditor shall issue an opinion thereon and such
financial statements will be the ones used by the institutions for
all legal and corporate purposes.
On March 31, 2015
the Bank’s Board of Directors has approved (i) the
Implementation Plan for Convergence towards the International
Financial Reporting Standards dictated by the Communication
“A” 5541 for Financial Entities subject to supervision
of the BCRA; and (ii) the designation of the coordinators which
will have the obligation to inform the Board of Directors the
status and degree of progress of the project.
The plan contains
the creation of a work team; coordination with the management of
the related companies in which permanent investments are held,
controlled companies or companies in which significant influence is
exercised; design and communication of a training plan; identifying
impacts on operations and the information to be submitted that
requires the implementation of specific actions (adapting
information systems, internal control, etc.).
Half-yearly reports
must be made to the BCRA, showing the progress made in the
Implementation Plan. The first due date of this presentation
operates on September 30, 2015. Each half-yearly report shall
include a report issued by the Internal Audit
Department.
As of June 30,
2016, there have been two presentations relating to the progress of
the plan on September
30,
2015 and March 31, 2016. Both presentations were approved by the
Board of the entity and were accompanied by an audit report
approved by the internal Audit Committee.
On March 31, 2016,
was sent to BCRA the reconciliation of assets and liabilities
captions applying IFRS as of December 31, 2015, following the
guidelines established by Communication " A" 5844, together with
the special report the External Auditor.
Subsequently,
reconciliations of the balances as of June 30 and December 31 must
be sent, operating its due date on September 30 and March 31
respectively, until the B.C.R.A. arrange for its discontinuity. The
information must be accompanied by a special report of the External
Auditor.
30.
Commencement of summary proceedings
I –Summary
Proceedings before administrative
authorities:
F- 247
BANCO
HIPOTECARIO SA AND SUBSIDIARIES
NOTES
TO THE CONSOLIDATED FINANCIAL STATEMENTS
As of and for the twelve-month periods ended June 30, 2016, 2015
and 2014
(Expressed in thousands of Argentine pesos, except share data
and as otherwise indicated)
1.
On
February 19, 2014, the Bank was notified of Resolution No. 209/13
handed down by the Chairman of the Financial Information Unit
(UIF), whereby it ordered to commence summary proceedings against
the Bank, its directors (Messrs. Eduardo S. Elsztain; Mario Blejer;
Ernesto M. Viñes; Jacobo J. Dreizzen; Edgardo L. Fornero;
Carlos B. Písula; Gabriel G. Reznik; Pablo D. Vergara del
Carril; Mauricio E. Wior; Saul Zang); the Risk and Controlling
Manager, Mr. Gustavo D. Efkhanian and the Manager of the Money
Laundering Prevention and Control Unit Manager, Mr. Jorge Gimeno.
In these proceedings, an investigation is made into the
defendants’ liability for alleged violation of the provisions
of Section 21 of Law 25,246, as amended, and Resolution UIF No.
228/2007 due to certain defaults detected by the BCRA in the
inspection of the organization and in internal controls implemented
for the prevention of money-laundering derived from illegal
activities. On March 25, 2014, the relevant defenses and arguments
were filed in support of the Bank and the individuals subject to
the summary proceedings.
In the legal
counsel’s opinion, at the current stage of the proceedings
and based on the precedents existing at the UIF in connection with
similar cases, it is estimated that there are chances of imposing
an administrative penalty. The estimated and provisioned as of
December 31, 2015 amounts to Ps. 20.
2.
On
December 29, 2014, the Bank was notified of the Resolution passed
by the Superintendent of Financial and Foreign Exchange
Institutions No. 824 dated December 1, 2014 ordering the start of
Summary Proceedings No. 6086 on Foreign Exchange Matters (File
101.534/11) against Banco Hipotecario S.A. and a former Manager
(Mr. Gabriel Cambiasso) and five assistants (Claudio H. Martin;
Daniel J. Sagray; Rubén E. Perón; Marcelo D. Buzetti and
Pablo E. Pizarro) at the Cordoba Branch, in the terms of Section 8
of the Foreign Exchange Criminal Regime Law (as signed into law
pursuant to Decree No. 480/95). In the above-mentioned summary
proceedings, an investigation is made in connection with excesses
in the limits for selling foreign currency to two entities in the
City of Cordoba (for a combined amount of US$ 701,270), which
allegedly violate the provisions of Communication “A”
5085, paragraph 4.2.1.
On July 3, 2015 the
writ containing the defenses and arguments was filed with the
Central Bank and the relevant evidence was offered.
On April 12, 2016
the Argentine Central Bank ordered the production of evidence by
the parties, and all evidence previously offered was
produced.
In the legal
counsel’s opinion, at the current stage of the proceedings
there are legal and factual arguments that generate reasonable
expectations that the physical persons named defendants will be
acquitted. For such reason, no allowances have been created in this
regard.
3.
On
August 11, 2015, we were notified of Resolution No. 76/15 adopted
by the chairman of the Unidad de Información Financiera, which
initiated a summary proceeding (sumario) against us, our Board of
Directors (Eduardo Sergio Elsztain, Mario Blejer, Diego Luis
Bossio, Mariana González, Edgardo Luis José Fornero, Ada
Mercedes Maza, Mauricio Elías Wior, Saúl Zang, Ernesto
Manuel Viñes, Gabriel Adolfo Gregorio Reznik, Jacobo Julio
Dreizzen, Pablo Daniel Vergara del Carril and Carlos Bernardo
Pisula) and our compliance officer for an alleged violation to
section 21 a) of Law No.25,246 and to Resolution No.121/11. The UIF
initiated the proceeding after an audit by the Central Bank in 2013
detected certain weaknesses in our internal anti-money laundering
controls. As of the date of this offering memorandum, we have not
established any provisions in connection with this proceeding.
According to that resolution, the Bank and its directors would have
incurred - "prima facie" - in certain defaults related to the way
customers are identified, monitoring parameters , the definition of
the risk matrix and the updating procedures of background and
profiles of customer, among others.
F- 248
BANCO
HIPOTECARIO SA AND SUBSIDIARIES
NOTES
TO THE CONSOLIDATED FINANCIAL STATEMENTS
As of and for the twelve-month periods ended June 30, 2016, 2015
and 2014
(Expressed in thousands of Argentine pesos, except share data
and as otherwise indicated)
On September 23,
2015, the Bank raised depositions and defenses with the UIF along
with documentary evidence and produced informative evidence, IT
expert opinions and oral evidence. On April 13, 2016, the
production of evidence was ordered and all evidence was duly
produced.
Based on the
UIF’s backround on similar cases, the Bank is likely to be
imposed an administrative fine. Therefore, it was deemed reasonable
to create an allowance for this contingency amounting to Ps. 20,
which was booked on October 22, 2015.
4. On February 15,
2016 the Bank was notified of Resolution No. 1014 issued by the
Superintendent of Financial and Exchange Institutions by which it
was decided to conduct summary (Summary No. 1486) under the terms
of Article 41 of the Financial Institutions Law to Banco
Hipotecario SA and its president Mr. Eduardo S. Elsztain for
alleged violation of the rules of Communication "A" 4490 because of
his failure to report -within the deadline set by the legislation
applicable-, the appointment of new directors by the
shareholders’ meetings held on 27 March and 24 April 2013,
and having belatedly submitted documentation related to these
directors. It is worth mentioning that in all cases tried to
regular and alternate directors designated by the National
State.
On 29 February 2016
the defenses and rebuttals were presented and accompanied the
documentary evidence, which examined by the Management Contentious
Financial Affairs in the Central Bank.
in light of the
likelihood that the Bank could be imposed an administrative fine,
it was deemed reasonable to create an allowance for this
contingency amounting Ps.560, which was booked as of the closing
date of these financial statements
5. On May 10, 2016
the Bank was notified of Resolution No 219 dated April 22, 2016
handed down by the Superintendent of Financial and Foreign Exchange
Institutions in order to commence summary proceedings (Summary
Proceedings file No. 6845) in the terms of Section 8 of the Foreign
Exchange Criminal Law No. 19,359 (as signed into law pursuant to
Decree No. 480/95) against Banco Hipotecario S.A. its former
Manager Mr. Ricardo José González and Mrs. Luciana
Sabrina Fusco and Liliana Elisabeth Sabella, on grounds of alleged
breach of the rules contained in Communication “A” 5318
and “5322”, as supplemented, consisting in allegedly
selling foreign currency for US$ 69,620 under residential mortgage
transaction, without fulfilling the requirements set forth in the
above mentioned communications.
Notice was taken of
the proceedings and a request was filed for extending the deadline
for filing the relevant defenses and arguments.
6. Banco de
Crédito y Securitización S.A. has been notified of
Resolution No. 401 dated September 7, 2012 handed down by the
BCRA’s Superintendent of Financial and Exchange Institutions,
ordering to start summary proceedings against this Bank and its
Chairman, Mr. Eduardo S. Elsztain, due to the late filing of
documentation related to the appointment of the Bank’s
authorities. On October 9, 2012, the defenses and arguments of the
Bank’s rights were filed. Subsequently, the Bank was notified
of Resolution No. 729 dated October 23,
F- 249
BANCO
HIPOTECARIO SA AND SUBSIDIARIES
NOTES
TO THE CONSOLIDATED FINANCIAL STATEMENTS
As of and for the twelve-month periods ended June 30, 2016, 2015
and 2014
(Expressed in thousands of Argentine pesos, except share data
and as otherwise indicated)
2013 which imposed
on the Bank and its president Punishment of Call of Care by Article
41 paragraph 1 of the Law of Financial Institutions.
Through such
resolution determined fines of Ps. 320 and Ps. 393 to the bank and
its directors (Eduardo S. Elsztain and Ernesto M. Viñes ),
respectively. Such amounts were charged as a loss as of December
31, 2015.
BACS and the
Directors filed an appeal against Resolution No. 690 in due course.
The appeals are pending resolution by Panel IV of the National
Court of Appeals in Federal Administrative Contentious Matters in
the action styled “BACS BANCO DE CRÉDITO Y
SECURITIZACIÓN S.A. ET AL V. BANCO CENTRAL DE LA
REPÚBLICA ARGENTINA, in re. Financial Institutions Law No.
21,526, Section 42, Direct Appeal” (Case File No.
51,471/2015).
7. On November 25,
2014, Tarshop S.A. was notified by the Financial Information Unit
that summary proceedings had been filed, identified under
Resolution No. 234/14, for potential formal violations derived from
the alleged non-compliance with Section 21, paragraph a) of Law
25,246 and UIF Resolutions No. 27/11 and 2/12. Summonses were sent
to the Company (Tarshop S.A.), its Compliance Officer (Mauricio
Elías Wior) and the Directors then in office (Messrs. Eduardo
Sergio Elsztain, Saúl Zang, Marcelo Gustavo Cufré and
Fernando Sergio Rubín) for them to file their defenses. In the
legal counsel’s opinion, at the current stage of the
proceedings and based on the precedents existing at the UIF in
similar cases, it is likely that a penalty be imposed under the
scope of the administrative proceedings. For such reason,
allowances for Ps. 360 have been recorded in this
regard.
II –Summary Proceedings pending Court Decision
1.
On
October 31, 2014, BHSA was notified of Resolution No. 685 dated
October 29, 2014 handed down by the Superintendent of Financial and
Foreign Exchange Institutions in the summary proceedings in
financial matters No. 1320 whereby the Bank and its authorities had
been charged, on one hand, with the violation of the rules
governing financial aid to the Non-Financial Public Sector, with
excess over the limits of fractioned exposure to credit risk from
the non-financial public sector, with excess in the allocation of
assets to guarantee, with failure to satisfy minimum capital
requirements and with objections against the accounting treatment
afforded to the “Cer Swap Linked to PG08 and External
Debt” transaction and on the other hand, with delays in
communicating the appointment of new directors and tardiness in the
provision of documentation associated to the directors recently
elected by the shareholders’ meetings.
Resolution No. 685
then fined Banco Hipotecario S.A. with Ps,4,040 and also fined
BHSA’s directors (Eduardo S. Elsztain; Jacobo J. Dreizzen;
Carlos B. Písula; Edgardo L. Fornero; Gabriel G. Reznik; Pablo
D. Vergara del Carril; Ernesto M. Viñes; Saul Zang; Mauricio
E. Wior), former directors (Clarisa D. Lifsic de Estol; Federico L.
Bensadón; Jorge L. March and Jaime A. Grinberg), statutory
auditors (Messrs. Ricardo Flammini; José D. Abelovich; Marcelo
H. Fuxman; Alfredo H. Groppo; and Martín E. Scotto), the Area
Manager Gustavo D. Efkhanian and former managers (Gabriel G.
Saidón and Enrique L. Benitez) for an aggregate amount of
Ps.51,581.8. Under this decision, former Statutory Auditor Ms.
Silvana M. Gentile was acquitted.
On November 25,
2014, Banco Hipotecario and the other individuals affected by the
adverse decision lodged an appeal under Section 42 of the Financial
Institutions Law, that was sent by the BCRA to the National
Appellate Court with Federal Jurisdiction over Contentious and
Administrative Matters. Therefore, at present the case is being
heard by Panel I of such Appellate Court. Moreover, on December 30,
2014, the Bank and the individuals against whom sanctions were
imposed requested the levying of separate injunctions by such court
against the enforcements pursued by the BCRA for collection of the
fines.
F- 250
BANCO
HIPOTECARIO SA AND SUBSIDIARIES
NOTES
TO THE CONSOLIDATED FINANCIAL STATEMENTS
As of and for the twelve-month periods ended June 30, 2016, 2015
and 2014
(Expressed in thousands of Argentine pesos, except share data
and as otherwise indicated)
Upon being notified
of the resolution handed down on June 30 by the Appellate Court
that denied the motion for injunction filed by the Bank and by the
directors, managers and some of the statutory auditors and in order
to prevent further conflicts and financial damage that could result
from the actions to compel payment of fines, the Bank’s
Executive Committee decided to apply the indemnity rules regarding
directors, high ranking officers and statutory auditors, as an
alternative for the amounts not covered by the D&O insurance
policy approved by the Bank’s Board of Directors at its
meetings held on August 2, 2002 and May 8, 2013, and resolved to
deposit the amounts of the fines.
Such deposit,
including the amount corresponding to the fine imposed on the Bank
and the respective legal costs, totaled Ps. 57,671.9. Out this
amount, Ps. 53,631.9 were computed as losses for this period in the
manner described in the Minutes of the Meeting held by Banco
Hipotecario S.A.’s Executive Committee on July 2, 2015 and in
the Minutes of the Board Meeting held on July 15, 2015, and Ps.
4,040 were covered by a provision made in fiscal year
2014.
This
notwithstanding, in the brief filed with the court that is hearing
the proceedings to compel payment it was sustained that the amounts
deposited in the judicial accounts opened to such end were subject
to attachment, and a petition was filed for the respective amounts
to be invested in automatically renewable term deposits for 180
days in order to ensure the integrity of the funds until the
Appellate Court with Federal Jurisdiction over Contentious and
Administrative Matters hands down a decision on the appeal lodged
against Resolution No. 685/14 of the Argentine Central
Bank.
The request for
injunction were rejected and the Court made progress in the
proceedings for enforcing the fines against each of the defendants.
For such reason, a request was made for applying the amounts
subject to attachments to the payment of the relevant
fines.
2.
On
September 13, 2013, the Bank was notified of Resolution No. 611
handed down by the Superintendent of Financial and Foreign Exchange
Institutions, whereby it ordered to commence summary proceedings
against the Bank and the manager Christian Giummarra and the former
manager Aixa Manelli (Summary Proceedings No. 5469 on Foreign
Exchange Matters) charging them with alleged violation of the
foreign exchange laws in selling foreign currency to persons
prohibited from trading foreign currency by the Argentine Central
Bank. The cumulative amount derived from the alleged violation in
the sale of foreign currency is around US$ 39.9 thousand and Euro
1.1 thousand. The relevant defenses and arguments have been filed
and evidence has been offered in support of all the defendants
subject to the summary proceedings. Due to its related subject
matter, the record of this case was joined with Summary Proceedings
No. 5529 on Foreign Exchange Matters (File 101,327/10). Therefore,
its procedural status is described together with the
latter.
Moreover, on
October 8, 2013, the Bank was notified of Resolution No. 720 handed
down by the Superintendent of Financial and Foreign Exchange
Institutions, ordering to commence summary proceedings against the
Bank and its Organization and Procedures Manager, Mr. Christian
Giummarra, and the former Systems Manager, Ms. Aixa Manelli
(Summary Proceedings No. 5529 on Foreign Exchange Matters) in
accordance with Section 8 of the Criminal Foreign Exchange Regime
Law (
Ley de Régimen Penal
Cambiario
) –as amended by Decree 480/95- charging them
with alleged violation of the foreign exchange laws in selling
foreign currency to persons prohibited from trading foreign
currency by the Argentine Central Bank. The cumulative amount
derived from the alleged violation in the sale of foreign currency
is around US$ 86.4 thousand. The relevant defenses and
arguments were filed and evidence was offered in support of all the
defendants subject to the summary proceedings. The BCRA opened the
discovery stage, and evidence was produced in due
F- 251
BANCO
HIPOTECARIO SA AND SUBSIDIARIES
NOTES
TO THE CONSOLIDATED FINANCIAL STATEMENTS
As of and for the twelve-month periods ended June 30, 2016, 2015
and 2014
(Expressed in thousands of Argentine pesos, except share data
and as otherwise indicated)
time. Once the
discovery stage came to a conclusion, the attorneys submitted their
closing arguments. In mid- September 2015 the summary in which both
actions were accumulated) was sent by the Central Bank to Economic
Criminal Justice for sentencing. Involving the Court with
jurisdiction over Criminal Economic Matters No.2 (Dr. Pablo
Yadarola) - Secretary No. 3 (Dr. Fernando Stockfisz) .
In the legal
counsel’s opinion, at the current status of the proceedings,
there are legal and factual arguments that generate reasonable
expectations that the physical persons named defendants and Banco
Hipotecario S.A. will be acquitted and that therefore, there are
low chances that the Bank will be subject to the economic sanctions
set forth by the Criminal Foreign Exchange Regime Law (
Ley de Régimen Penal Cambiario
).
For such reason, no allowances have been created in this
regard.
3.
On August 26, 2014,
the Bank was notified of the Resolution passed by the
Superintendent of Financial and Foreign Exchange Institutions No.
416 dated August 7, 2014 ordering the start of Summary Proceedings
No. 5843 in the terms of Section 8 of the Foreign Exchange Criminal
Regime Law No. 19,359 (as signed into law pursuant to Decree No.
480/95). In the above-mentioned summary proceedings, Banco
Hipotecario, its directors (Messrs. Eduardo S. Elsztain; Jacobo J.
Dreizzen; Edgardo L. Fornero; Carlos B. Písula; Gabriel G.
Reznik; Pablo D. Vergara del Carril; Ernesto M. Viñes; Saul
Zang; and Mauricio E. Wior) and former directors (Ms. Clarisa D.
Lifsic de Estol and Mr. Federico L. Bensadón), and two former
managers (Messrs. Gabriel G. Saidón and Enrique L. Benitez),
are charged with failure to comply with the rules disclosed by
Communication “A” 3471 (paragraphs 2 and 3) and by
Communication “A” 4805 (Paragraph 2.2.) due to certain
transfers of currency made abroad between August and October 2008
to guarantee the “CER Swap Linked to PG08 and External
Debt” swap transaction for a total of US$ 45,968 thousand,
without the authorization of the Argentine Central Bank. BHSA has
been allowed to review the proceedings (case file No. 100.308/10)
which are being handled by the Argentine Central Bank’s
Department of Foreign Exchange Contentious Matters. The relevant
defenses and arguments were filed in support of the subjects to the
summary proceedings. The BCRA opened the discovery stage on March
16, 2015. Evidence was produced and the counsels for the
defense’s allegations were raised in due time. Upon
conclusion of the administrative stage of the proceedings, the case
file was sent to the Courts with Jurisdiction over Criminal
Economic Matters. On November 18, 2015, the Court with Jurisdiction
over Criminal Economic Matters No. 3, presided by Dr. Rafael E.
Caputo, Clerk’s Office No. 5, determined that it lacked
jurisdiction to hear the case; therefore, the proceedings were
forwarded to the Court with Jurisdiction over Criminal Economic
Matters No. 2, which has still not determined whether it has
competent jurisdiction
In the legal
counsel’s opinion, at the current stage of the proceedings
there are legal and factual arguments that generate reasonable
expectations that the physical persons named defendants and Banco
Hipotecario S.A. will be acquitted and that therefore, there are
low chances that the Bank will be subject to the economic sanctions
set forth by the Criminal Foreign Exchange Regime Law (
Ley de Régimen Penal Cambiario
).
For such reason, no allowances have been created in this
regard.
III –Concluded Summary Proceedings
1.
On
May 4, 2012 the Bank was notified of Resolution No. 186, dated
April 25, 2012 issued by the Superintendent of Financial and
Foreign Exchange Institutions whereby Summary Proceedings No. 4976
on Foreign Exchange Matters were commenced against the Bank, its
directors (Messrs. Eduardo S. Elsztain; Gabriel G. Reznik; Pablo D.
Vergara del Carril; Ernesto M. Viñes; Saul Zang; Carlos B.
Písula; Edgardo L. Fornero; Jacobo J. Dreizzen); former
directors (Ms. Clarisa D. Lifsic de Estol; Messrs. Julio A. Macchi;
Federico L.
F- 252
BANCO
HIPOTECARIO SA AND SUBSIDIARIES
NOTES
TO THE CONSOLIDATED FINANCIAL STATEMENTS
As of and for the twelve-month periods ended June 30, 2016, 2015
and 2014
(Expressed in thousands of Argentine pesos, except share data
and as otherwise indicated)
2.
Bensadón; and
Jorge M. Grouman) and the former Finance Manager Gabriel G.
Saidón, under section 8 of the Foreign Exchange Criminal
Regime Law (as signed into law by Decree No. 480/95).
In such
proceedings, charges were pressed for alleged violations of the
provisions of Communications “A” 3640, 3645, 4347 and
supplementary rules, due to the acquisition of good delivery silver
bars during the 2003-2006 period with funds arising from its
General Exchange Position.
The defenses to
which the Bank is entitled were raised in due time. Within the
period granted to such end, the Bank and the other defendants
produced the evidence previously offered. As soon as that stage in
the procedure came to a conclusion, the counsel for the defense
presented their closing arguments and in August 2014, the Argentine
Central Bank sent the case file to the competent court (therefore,
at present the case is being heard by the Court with Jurisdiction
over Criminal Economic Matters No. 7 presided by Judge Juan Galvan
Greenway), Clerk’s office No. 13, presided by Ms. Mariana
Zavala Duffau.
. III – BANCO
HIPOTECARIO S.A., Clarisa Diana LIFSIC, Eduardo Sergio Elsztain,
Gabriel Adolfo Gregorio REZNIK, Pablo Daniel VERGARA DEL CARRIL,
Ernesto Manuel VIÑES, Saúl ZANG, Edgardo Luis José
FORNERO, Federico León BENSADON, Jacobo Julio DREIZZEN, Jorge
Miguel GROUMAN, Gabriel Gustavo SAIDON, Julio Augusto MACCHI and
Carlos Bernardo PISULA WERE FULLY RELEASED OF LIABILITY for the
other charges pressed against them in this action in connection
with violation of the Criminal Foreign Exchange Regime Law under
these summary proceedings filed by the Argentine Central Bank
regarding the transactions recorded under slips Nos. 40729 and
41288 (according to the charges pressed in each case) as the
alleged conducts did not match with any of the offenses set forth
by law. IV – NO COURT COSTS WERE AWARDED (pursuant to
Sections 143 and 144 Code of Criminal Procedure).
On April 29, 2016,
final judgement was passed, whereby: I- The criminal charges files
against Banco Hipotecario S.A., Clarisa Diana Lifsic, Eduardo
Sergio Elsztain, Gabriel Adolfo Gregorio Reznik, Pablo Daniel
Vergara Del Carril, Ernesto Manuel Viñes, Saul Zang, Julio
Augusto Macchi, Carlos Bernardo Pisula, Edgardo Luis José
Fornero, Federico León Bensadón and Gabriel Gustavo
Saidón in connection with the transactions recorded under
slips No. 21683, 21749, 22065, 22136, WERE DECLARED PARTIALLY
STATUTE BARRED and the above mentioned persons WERE PARTIALLY
ACQUITTED as concerns the above mentioned deeds (Section 19 of Law
19,359 and Section 434 and 443, subsection 3 and 454 of the Code of
Criminal Procedure). II The criminal charges filed against Jacobo
Julio Dreizzen and Jorge Miguel Grouman, in connection with the
transactions recorded under slips No. 31034, 31042, 37270, 37973,
38476, 38511, 38651, 38693, 40005, 40066, 40190, 40304, 40687 and
40688 WERE DECLARED PARTIALLY STATUTE-BARRED and the above
mentioned persons WERE PARTIALLY ACQUITTED as concerns the above
mentioned deeds (Section 19 of Law 19,359 and Section 434 and 443,
subsection 3, and 454 of the Code of Criminal Procedure). III
–Banco Hipotecario S.A., Clarisa Diana Lifsic, Eduardo Sergio
Elsztain, Gabriel Adolfo Gregorio Reznik, Pablo Daniel Vergara del
Carril, Ernesto Manuel Viñes, Saúl Zang, Edgardo Luis
José Fornero, Federico León Bensadón, Jacobo Julio
Dreizzen, Jorge Miguel Grouman, Gabriel Gustavo Saidón, Julio
Augusto Macchi and Carlos Bernardo Pisula WERE FULLY RELEASED OF
LIABILITY for the other charges pressed against them in this action
in connection with violation of the Criminal Foreign Exchange
Regime Law under these summary proceedings filed by the Argentine
Central Bank regarding the transactions recorded under slips Nos.
40729 and 41288 (according to the charges pressed in each case) as
the alleged conducts did not match with any of the offenses set
forth by law. IV – IV – NO COURT COSTS WERE AWARDED
(pursuant to Sections 143 and 144 Code of Criminal
Procedure).
As no appeal was
lodged against it, the judgment became firm and
conclusive.
F- 253
BANCO
HIPOTECARIO SA AND SUBSIDIARIES
NOTES
TO THE CONSOLIDATED FINANCIAL STATEMENTS
As of and for the twelve-month periods ended June 30, 2016, 2015
and 2014
(Expressed in thousands of Argentine pesos, except share data
and as otherwise indicated)
On
October 7, 2014, BHSA had been notified of Resolution No. 513 dated
August 16, 2014 handed down by the Superintendent of Financial and
Foreign Exchange Institutions in the summary proceedings in
financial matters No. 1365 (on grounds of alleged failure to comply
with the minimum requirements in terms of internal controls under
Communication “A” 2525) whereby Banco Hipotecario S.A.
was imposed a fine for Ps. 112 and its directors (Messrs. Pablo D.
Vergara del Carril; Carlos B. Písula, Eduardo S. Elsztain,
Jacobo J. Dreizzen, Gabriel G. Reznik; Edgardo L. Fornero; Ernesto
M. Viñes; and Saul Zang) and former directors (Ms. Clarisa D.
Lifsic de Estol and Messrs. Jorge L. March; and Federico L.
Bensadón).
As required by
Section 42 of the Law of Financial Institutions, the fines were
paid and the relevant appeal was lodged with the National Appellate
Court with Federal Jurisdiction over Contentious and Administrative
Matters against the above-mentioned resolution. The fine of 112
thousand pesos was timely provisioned and paid by the
Bank.
Under judgment
dated June 21, 2016, the National Appellate Court with Federal
Jurisdiction over Contentious and Administrative Matters –
Panel IV, dismissedthe appeals lodged by Banco Hipotecario S.A. and
the defendant directors, and awarded court costs against the losing
appellants. The judgement became final and conclusive.
31.
Programa Crédito Argentino del Bicentenario para la Vivienda
Única y Familiar (PROCREAR)
On June 12, 2012,
the Argentine Executive Branch issued Decree No. 902 whereby it
ordered the creation of a Public Fiduciary Fund referred to as
Programa Crédito Argentino del Bicentenario para la Vivienda
Única Familiar (Argentine Single Family Housing Program for
the Bicentennial) (PROCREAR).
On that same date,
the Bank’s Board of Directors approved the Bank’s role
as trustee of the referred fund.
On July 18, 2012,
the Argentine State, as Trustor, and Banco Hipotecario S.A. as
Trustee, created the PROCREAR Administrative and Financial Trust,
and its underlying assets were transferred to it as trust
property.
The Trust’s
sole and irrevocable purpose is as follows: (i) to manage the trust
assets with the aim of facilitating the population’s access
to housing and the generation of job opportunities as economic and
social development policies, in compliance with the principles and
objectives set forth in Decree No. 902; (ii) the use by the Trustee
of the net proceeds of the placement of the Trust Bonds (Valores
Representativos de Deuda or VRDs) and cash contributions by the
Argentine State to originate loans for the construction of houses
in accordance with the provisions of Decree No. 902 and the credit
lines; and (iii) the repayment of the VRDs in accordance with the
terms of the agreement that creates the Trust and the provisions of
the Trust Law.
The Trust shall be
in effect for a term of thirty (30) years as from the date of
execution of the agreement (July 18, 2012).
In addition to the
obligations imposed on it under the Trust Law and the Commercial
Code, the Trustee is required to:
● perform the
obligations set forth in the Trust Agreement and follow the
instructions imparted on it by the Executive
Committee;
● carry out
its duties as Trustee with the loyalty, diligence and prudence of a
good businessman acting on the basis of the trust placed on
him;
● exercise
the powers granted to it under the Agreement, and preserve the
Trust Assets;
F- 254
BANCO
HIPOTECARIO SA AND SUBSIDIARIES
NOTES
TO THE CONSOLIDATED FINANCIAL STATEMENTS
As of and for the twelve-month periods ended June 30, 2016, 2015
and 2014
(Expressed in thousands of Argentine pesos, except share data
and as otherwise indicated)
● use the
Trust Assets for lawful purposes, in accordance with the provisions
of the Agreement and following the Executive Committee’s
instructions;
● identify
the Trust Property and record it in a separate accounting system,
segregated from its own assets or the assets of other trusts held
by it at present or in the future in the course of its
business;
● prepare the
Trust’s financial statements, hire the relevant audit firms
and comply with the applicable disclosure regulations;
● insure the
Trust Assets against risks that could affect their
integrity;
● invest or
reinvest the Trust’s funds in accordance with the provisions
of the Agreement and following the instructions imparted by the
Executive Committee.
In compliance with
Communication “A” 5392, the Bank has capitalized
mortgage loan origination expenses under this program (see note
2.13.).
32.
Capital Market Law
On December 27,
2012, the Capital Market Law No. 26,831 was promulgated,
considering a comprehensive amendment to the public offering regime
set forth by Law No. 17,811.
Insofar as concerns
the matters related to the Company’s business, this law
broadens the regulatory powers of the Argentine Government in
connection with the public offering of securities, through the
Argentine Securities Commission (CNV), and concentrates in this
agency the powers of authorization, supervision and oversight,
disciplinary authority and regulation of all capital market
players; further, it establishes that intermediary agents willing
to deal in a securities market are no longer required to be members
thereof, thus allowing the entry of other participants, and
delegates to the CNV the power to authorize, register and regulate
the various categories of agents.
On August 1, 2013,
Decree 1023/2013, partially regulating the Capital Markets Law, was
published in the Official Gazette, and on September 9, 2013,
General Resolution No. 622 of the CNV, approving the related
regulations, was published in the Official Gazette.
These regulations
implement a register of agents that participate in the capital
market. To take part in each of the activities regulated by this
resolution, agents had to be entered in that register in such
capacity by March 1, 2014.
For those agents
who have applied for registration with the final registry before
March 1, 2014 to comply with all the requirements, on February 7,
2014, the Argentine Securities Commission (CNV) extended the term
until December 31, 2014. On June 23, 2014 we were notified by
Mercado Abierto Electrónico S.A. that CNV mandated that the
Agents registered with MAE S.A. who have proceedings underway
before CNV for registration as Agent in any of the categories
authorized by currently applicable rules and regulations may
continue to do business normally up and until they start operating
in the new Agent category as per the CNV rules
(N.T.2013)
In turn, pursuant
to CNV Resolution No. 17,392 dated June 26, 2014, the Bank was
registered with the Registry of Financial Trustees prescribed by
Sections 6 and 7 of Chapter IV, Title V of the Rules, under No. 57.
And, on September 19, 2014, pursuant to CNV Resolution No. 2122,
the Bank has been registered as Settlement and Clearing Agent and
Comprehensive Trading Agent No. 40.
Pursuant to the
provisions of Section 45 of Law 26,831 and paragraph a), Section
20, Article VI, Chapter II, Title VII, and subsection j) of Section
7, Article IV, Chapter IV, Title V of Resolution No.622 of the CNV,
it is made known that Banco Hipotecario’s minimum capital
composed as required by the rules issued by the Argentine Central
Bank exceeds the minimum amount required under such resolution. On
the other hand, the Bank’s capital was duly paid in as of the
closing of
F- 255
BANCO
HIPOTECARIO SA AND SUBSIDIARIES
NOTES
TO THE CONSOLIDATED FINANCIAL STATEMENTS
As of and for the twelve-month periods ended June 30, 2016, 2015
and 2014
(Expressed in thousands of Argentine pesos, except share data
and as otherwise indicated)
the period and the
liquid balancing account is identified as BONAR 17 (Government
security carried at fair market value).
On October 22,
2014, the Board of Directors of Mercado de Valores de Buenos Aires
S.A. approved the registration of Banco Hipotecario S.A. in Mercado
de Valores de Buenos Aires S.A.’s Registry of Agents as
Settlement and Clearing Agent and Trading Agent –
Comprehensive (ALyC and AN as per the Spanish
acronyms).
On December 23,
2014, BHSA was authorized to operate under the provisions of Merval
Communication No. 15594.
Pursuant to
CNV’s Resolution No. 17.338 dated April 24, 2014, BACS Banco
de Crédito y Securitización S.A., was registered with the
Registry of Financial Trustees prescribed by Sections 6 and 7 of
Chapter IV, Title V of the Rules, under No. 55. And, on September
19, 2014, CNV communicated to BACS that in its capacity as
Settlement and Clearing Agent - Comprehensive and Trading Agent the
Bank has been assigned License No. 25. It must be noted that the
composition of BACS’ equity as of the end of the period was
correct and that the liquidity requirement takes the form of
Peso-denominated Lebacs.
As of the date of
these financial statements, BH Valores SA has been approved by CNV
as a Settlement and Clearing Agent in its own name under
Registration Number 189 in the terms of CNV’s General
Resolution No. 622.
According to the
minimum requirements laid down, BH Valores S.A.’s minimum
shareholders’ equity exceeds the amount prescribed by
CNV’s General Resolution No. 622 and its composition is
correct. As to the liquidity requirements, they have been satisfied
in the form of a deposit of the Government security called Bono de
la Nación Argentina $ Badlar Privada + 200 bps. Vto. 2017, as
discussed in Exhibit II to the Company’s financial
statements.
In view of the
latest tax, regulatory and operational developments that have
modified BH Valores S.A.’s commercial strategy and decreased
the competitive advantages of running such a business, the Board of
Directors of BH Valores S.A. has, as of the date of these financial
statements, decided to substantially diminish the volume of
operations with an eye towards suspending the operations of BH
Valores S.A. in the future to prevent two structures that are
presently highly similar in terms of their functions and have been
rendered redundant within the same conglomerate from
overlapping.
33.
Resolutions issued by the Argentine Central Bank
Financing line for production and financial inclusion
Under Communication
“A” 5874 dated December 31, 2015, the Argentine Central
Bank revised the name of the credit line in effect since 2012 and
started to publish the “Credit line for production and
financial inclusion purposes”.
The new line will
become effective on the first half of 2016. The financial
institutions subject to the provisions of this circular must record
a lending balance under this credit line amounting to at least 14%
of the deposits from the non-financial private sector in pesos,
calculated taking into account the monthly average daily balances
of November 2015, being able to attribute all the balances of loans
disbursed through the "Line of credit for productive investment "
in so far as the case of destinations also supported by this
line.
At least 75% of the
quota must be granted to SMEs. In calculating the quota, the
average daily balances of outstanding loans during the first half
of 2016 will be considered. The highest rate applicable under this
line should be a fixed nominal rate of 22% per annum for the first
36 months, except for the purchase of portfolio and mortgage loans
and loans for the acquisition of rights over trusts for the
construction of real property to individuals, which will be a mixed
interest rate. For clients who do not qualify as SMEs, the rate
will be freely agreed upon.
F- 256
BANCO
HIPOTECARIO SA AND SUBSIDIARIES
NOTES
TO THE CONSOLIDATED FINANCIAL STATEMENTS
As of and for the twelve-month periods ended June 30, 2016, 2015
and 2014
(Expressed in thousands of Argentine pesos, except share data
and as otherwise indicated)
Finally, under
Communication "A" 5975 dated May 17, 2016 the Argentine Central
Bank established the 2016 second quota under the "Fianncing line of
production and financial inclusion", whereby a lending balance
equal to at least 15.5 % of the non-financial private sector
deposits in pesos, calculated taking into account the monthly
average daily balances of May 2016, must be recorded under this
line.
At the closing of
these financial statements BHSA had recorded in average Ps.
1,401,724 as principal and interest under BHSA’s assets in
connection with this credit line.
Compliance with rules on term deposits and investments. Conditions
governing interest rates on term deposits
Pursuant to its
Communication “A” 5781, the Argentine Central Bank
raised the floor of the interest rates payable on term deposits and
the maximum amount of the placements that may obtain such benefit.
The rest of the transactions shall be agreed upon freely, that is,
without the involvement of the Argentine Central Bank.
It has been
determined that starting on July 27, 2015 the rates can’t be
less than the product arising from the last reference interest rate
and a coefficient according to the original term of the imposition,
as follows:
- from 30 to
44 days: 0.91
- from 45 to 59
days: 0.93
- from 60 to 89
days: 0.97
- from 90 to 119
days: 0.97
- from 120 to 179
days: 0.98
- from 180 days or
more: 0.99
These
minimum rates apply to all Peso-denominated term deposits of up to
Ps.1,000 on behalf of holders who are human and / or legal
persons.
Finally, the
Argentine Central Bank provides that failure to comply with the
minimum rate level shall result in an increase in minimum cash
requirements in Pesos for an amount equivalent to all relevant term
deposits for the month following that when the failure to comply
takes place. No offsets among term deposits are allowed. In
addition to the foregoing, summary proceedings shall be commenced
in accordance with the guidelines laid down by the Superintendent
of Financial and Foreign Exchange Institutions.
This regulation was
repealed by the Argentine Central Bank through Communication
“A” 5853, as described in the following
item.
Interest rates on lending transactions. Financing subject to
interest rate regulation by the Central Bank.
Under Communication
“A” 5590 dated June 10, 2014, the BCRA adopted a system
of benchmark interest rates for personal and pledge loans to
individuals not qualifying as SMEs and established a ceiling for
these kinds of loans that may not exceed the product arising from
multiplying the 90-day LEBACs’ cut-off interest rate by a
multiplier ranging from 1.25 to 2.0, depending on the kind of loan
and Bank Group. To this end, banks are divided into:
F- 257
BANCO
HIPOTECARIO SA AND SUBSIDIARIES
NOTES
TO THE CONSOLIDATED FINANCIAL STATEMENTS
As of and for the twelve-month periods ended June 30, 2016, 2015
and 2014
(Expressed in thousands of Argentine pesos, except share data
and as otherwise indicated)
- Group I:
financial institutions operating as financial agents of the
national, provincial and/or municipal governments and/or other
institutions accounting for at least 1% of the total deposits from
the non-financial private sector; and
- Group II; the
remaining institutions.
The BCRA publishes
the “benchmark interest rate” to be applied by the
financial institutions in each of these groups to each type of
loans (personal loans, pledge loans and portfolio purchases). The
rates applied by each institution to each loan within the lines
mentioned above may not exceed the “benchmark interest
rate” reported by the BCRA.
On December 17,
2015, under Communication "A" 5853 the BCRA repealed the above
mentioned Communications and thus eliminated any regulation on
rates, for both lending transactions and term deposits. This new
rule will became applicable to any loans agreed upon from December
17, 2015 onwards.
However, the BCRA
provides that financial institutions shall disclose the total
financial cost of lending transactions (by displaying it at their
offices and in press ads) subject to specific typeface size
requirements.
Moreover, it
establishes a timetable for violations detected until June 30, 2016
for transactions subject to regulated interest rates, i.e., those
outstanding as of December 16, 2015; and for violations detected
from January 1, 2016 onwards, the provisions set forth in
Communication “A” 5849 shall apply.
The mechanism
provided in such rule imposed the obligation to reimburse the
excess amount collected and any expenses incurred by clients in
filing their claims.
Protection granted to users of financial services
On March 23, 2016
following Communication "A" 5928 the Argentine Central Bank decided
that all savings accounts shall be free of charge, including the
use of debit cards and that the fees charged by the bank can be
raised by up to twenty percent (20 %), insofar as the customer is
informed of these increases at least 60 days before their effective
application in the case of products sold for a price. Bank shall be
free to determine the fees to be charged by them starting September
1, 2016.
Financial
institutions shall be under duty to inform their
competitors’s prices when they decide to change a price and
to insert a highlighted hyperlink on their website with the name
"Price Comparison " leading to BCRA’sweb page which will show
the charges applied by peer banks on their different
products.
Finally, under
Communication "A" 5993 dated June 22, 2016 the Argentine Central
Bank put an end to the "Financial service fees and/or charges "
reporting scheme and establishes a new transparency reporting
scheme, whereby financial institutions are required to disclose on
a monthly basis the fees and charges of the products and/or
services offered to users of financial services.
Assignment of financial and foreign exchange institutions’
foreign currency position
On December 17,
2015 under Communication "A " 5828, the BCRA provided that
financial institutions authorized to carry out foreign exchange
transactions, should sell to the BCRA their positive foreign
currency position as of the closing of business on December 16,
2015 valued at reference exchange rate prevailing on such date, and
could then repurchase it in full, on December 17, 18 or 21, 2015 at
the reference exchange rate prevailing on the repurchase
date.
F- 258
BANCO
HIPOTECARIO SA AND SUBSIDIARIES
NOTES
TO THE CONSOLIDATED FINANCIAL STATEMENTS
As of and for the twelve-month periods ended June 30, 2016, 2015
and 2014
(Expressed in thousands of Argentine pesos, except share data
and as otherwise indicated)
In orden to
exercise this option, the institutions filed a notice signed by
their highest local authority by 10 a.m. on the selected repurchase
date, sent to the General Transactions Sub-Management Department,
giving express notice of their decision to effect such
repurchase.
34.
Summary of Significant Differences between Argentine Banking GAAP
and U.S. GAAP
The Bank’s
consolidated financial statements have been prepared in accordance
with Argentine Banking GAAP, which differs in certain significant
respects from U.S. GAAP. Such differences involve methods of
measuring the amounts shown in the consolidated financial
statements, as well as additional disclosures required by U.S. GAAP
and regulations of the SEC. These consolidated financial statements
include solely a reconciliation of net income and
shareholders’ equity to U.S. GAAP. Pursuant to Item 17 of
Form 20-F, this reconciliation does not include disclosure of all
information that would be required by U.S. GAAP and regulations of
the SEC.
F- 259
BANCO
HIPOTECARIO SA AND SUBSIDIARIES
NOTES
TO THE CONSOLIDATED FINANCIAL STATEMENTS
As of and for the twelve-month periods ended June 30, 2016, 2015
and 2014
(Expressed in thousands of Argentine pesos, except share data
and as otherwise indicated)
I.
Differences
in measurement methods
As from March 1,
2003, inflation accounting was discontinued. The following
reconciliation does not include the reversal of the adjustments to
the consolidated financial statements for the effects of inflation,
because, as permitted by the Securities and Exchange Commission
(“SEC”), it represents a comprehensive measure of the
effects of price-level changes in the Argentine economy, and as
such, is considered a more meaningful presentation than historical
cost-based financial reporting for both Argentine GAAP and U.S.
GAAP.
The main
differences between Argentine GAAP and U.S. GAAP as they relate to
the Bank are described below, together with an explanation, where
appropriate, of the method used in the determination of the
necessary adjustments. References below to “ASC” are to
Accounting Standard Codification issued by the Financial Accounting
Standards Board in the United States of America.
The following
tables summarize the main reconciling items between Argentine GAAP
and U.S. GAAP:
Reconciliation of net income:
|
|
|
June
30,
|
||
|
2016
|
2015
|
2014
|
||
|
Net
income as reported under Argentine Banking GAAP
|
Ps.
|
1,115,530
|
537,190
|
627,027
|
|
U.S.
GAAP adjustments:
|
|
|
|
|
|
- Loan origination
fees and
costs………………….
|
(a)
|
(131,794)
|
(19,325)
|
27,525
|
|
- Loan loss reserve
...………………………………
|
(b)
|
(30,165)
|
(30,703)
|
(29,677)
|
|
- Derivative
financial
instruments...……………….
|
(c)
|
-
|
876
|
(941)
|
|
- Government
securities
…………………………...
|
(d)
|
(12,429)
|
18,230
|
(17,669)
|
|
- Financial
liabilities……….………………………
|
(e)
|
77,581
|
2,709
|
4,136
|
|
-
Securitizations…………………..………………..
|
(f)
|
(41,251)
|
16,434
|
(10,725)
|
|
- Intangible
assets………………………………….
|
|
|
|
|
|
Software
costs……………………………..…
|
(g)
|
1,522
|
(26,525)
|
(18,396)
|
|
Other intangible
assets……………………….
|
(g)
|
59
|
(3,156)
|
(4,793)
|
|
Business
combinations………...………...…..
|
(g)
|
990
|
991
|
989
|
|
- Impairment of
fixed and foreclosed assets.……...
|
(h)
|
1,116
|
944
|
983
|
|
- Miscellaneous
assets.………………………..…...
|
(n)
|
(30,848)
|
-
|
-
|
|
- Vacation
provision..……………………………..
|
(j)
|
(17,010)
|
(17,302)
|
(18,955)
|
|
- Insurance
technical
reserve..…………………….
|
(k)
|
(960)
|
2,780
|
1,398
|
|
- Capitalization of
interest
cost…….………………
|
(l)
|
(4,001)
|
775
|
301
|
|
- Financial
guarantees
issued...…….………………
|
(m)
|
(1,209)
|
-
|
-
|
|
- Deferred income
tax……………………………..
|
(o)
|
94,028
|
44,673
|
55,122
|
|
- Non-Controlling
interest..………………………..
|
(i)
|
(5,998)
|
(13,658)
|
(11,031)
|
|
Net
income in accordance with U.S. GAAP
|
Ps.
|
1,015,161
|
514,933
|
605,294
|
|
- Less Net (Gain) /
Loss attributable to the Non-Controlling
interest……………………………..….
|
(i)
|
18,311
|
4,369
|
10,284
|
|
Net
income attributable to Controlling interest in accordance with U.S.
GAAP
|
Ps.
|
1,033,472
|
519,302
|
615,578
|
|
Basic and diluted
net income per share in accordance with U.S. GAAP
|
|
6.937
|
3.519
|
4.136
|
|
Average number of
shares outstanding (in
thousands)………………………………………….
|
|
1,463,365
|
1,463,365
|
1,463,365
|
F- 260
BANCO
HIPOTECARIO SA AND SUBSIDIARIES
NOTES
TO THE CONSOLIDATED FINANCIAL STATEMENTS
As of and for the twelve-month periods ended June 30, 2016, 2015
and 2014
(Expressed in thousands of Argentine pesos, except share data
and as otherwise indicated)
Reconciliation of shareholders’ equity
|
|
|
June
30,
|
|
|
|
|
2016
|
2015
|
|
Total
shareholders' equity under Argentine Banking GAAP
|
Ps.
|
5,816,242
|
4,700,716
|
|
U.S.
GAAP adjustments:
|
|
|
|
|
- Loan origination
fees and
costs..…………………...
|
(a)
|
(222,687)
|
(90,893)
|
|
- Loan loss reserve
…………………………………..
|
(b)
|
(250,706)
|
(220,541)
|
|
- Government
securities…..………….………………
|
(d)
|
(4,697)
|
37,759
|
|
- Financial
liabilities…...…………………………….
|
(e)
|
87,863
|
10,282
|
|
-
Securitizations…………………...…………………
|
(f)
|
(56,693)
|
(15,442)
|
|
- Intangible
assets………………………………….…
|
|
|
|
|
Software
costs………………………….………
|
(g)
|
(62,366)
|
(63,888)
|
|
Other intangible
assets……………………...….
|
(g)
|
-
|
(59)
|
|
Business
combinations….………...………..…..
|
(g)
|
(186)
|
(1,176)
|
|
- Impairment of
fixed and foreclosed
assets…………
|
(h)
|
(36,263)
|
(37,379)
|
|
- Miscellaneous
assets
……………………….………
|
(n)
|
(30,848)
|
-
|
|
- Vacation
provision…………………………………
|
(j)
|
(74,644)
|
(57,634)
|
|
- Insurance
technical
reserve…………………………
|
(k)
|
(1,299)
|
(339)
|
|
- Capitalization of
interest
cost………………………
|
(l)
|
-
|
4,001
|
|
- Financial
guarantees
issued...…….………………
|
(m)
|
(1,209)
|
-
|
|
- Deferred income
Tax……………………….………
|
(o)
|
352,931
|
258,903
|
|
- Non-Controlling
interest..…………………………..
|
(i)
|
130,207
|
67,957
|
|
Total
Shareholders’ Equity under U.S. GAAP
|
Ps.
|
5,645,645
|
4,592,267
|
|
- Non-Controlling
Interest under U.S. GAAP…..…..
|
(i)
|
(118,063)
|
(68,126)
|
|
Consolidated
Parent Company Shareholders’ Equity under U.S.
GAAP
|
Ps.
|
5,527,582
|
4,524,141
|
Description of changes in shareholders’ equity under U.S.
GAAP:
|
|
Total
Shareholders’ Equity
|
|
|
Balance as of June
30, 2014
|
Ps.
|
4,031,065
|
|
Cash
dividends
|
|
(41,817)
|
|
Other Comprehensive
Income
|
|
15,591
|
|
Net income for the
twelve-month period in accordance with U.S. GAAP
|
|
519,302
|
|
Balance as of June
30, 2015
|
Ps.
|
4,524,141
|
|
Other Comprehensive
Income
|
|
(30,031)
|
|
Net income for the
twelve-month period in accordance with U.S. GAAP
|
|
1,033,472
|
|
Balance as of June
30, 2016
|
Ps.
|
5,527,582
|
a. Loan origination fees and costs
Under Argentine
Banking GAAP, the Bank does not defer loan origination fees and
costs on mortgage, personal and credit card loans, different from
those originated under the Pro.Cre.Ar program.
F- 261
BANCO
HIPOTECARIO SA AND SUBSIDIARIES
NOTES
TO THE CONSOLIDATED FINANCIAL STATEMENTS
As of and for the twelve-month periods ended June 30, 2016, 2015
and 2014
(Expressed in thousands of Argentine pesos, except share data
and as otherwise indicated)
Given the
bank’s role as Trustee of the PROCREAR Administrative and
Financial Trust, (see note 30), it has capitalized direct expenses
incurred in the mortgage loan origination process, which
disbursements would not have been incurred by it had it not been
for the grant of the related loans, in accordance with the
provisions of Communication “A” 5392. Such origination
expenses are amortized in 60 monthly installments.
In accordance with
U.S. GAAP, under ASC 310 loan origination fees and certain direct
loan origination costs should be recognized over the life of the
related loan as an adjustment of yield.
Therefore the
shareholders’ equity adjustment between Argentine Banking
GAAP and U.S. GAAP for Banco Hipotecario S.A. as of June 30, 2016
and 2015 amounted to Ps. (222,687) and (90,893),
respectively.
b. Loan loss reserve
The Bank’s
accounting for its allowance for loan losses differs in some
significant respects with practices of U.S.-based
banks.
Under Argentine
Banking GAAP, the allowance for loan losses is calculated according
to specific criteria. This criterion is different for commercial
loans (those in excess of Ps. 2,500) and consumer loans. Loan loss
reserves for commercial loans are principally based on the
debtors’ payment capacity and cash-flows analysis. Loan loss
reserves for consumer loans are based on the client’s aging.
Argentine banks may maintain other reserves to cover potential loan
losses which management believes to be inherent in the loan
portfolio, and other Argentine Central Bank required
reserves.
Under U.S. GAAP,
the allowance for loan losses should be in amounts adequate to
cover inherent losses in the loan portfolio, incurred at the
respective balance sheet dates. Specifically:
a)
Loans considered
impaired, in accordance with ASC 310-10 “Accounting for
Creditors for Impairment of a Loan”, are recorded at the
present value of the expected future cash flows discounted at the
loan’s effective contractual interest rate or at the fair
value of the collateral if the loan is collateral dependent. Under
ASC 310-10, a loan is considered impaired when, based on current
information, it is probable that the borrower will be unable to pay
contractual interest or principal payments as scheduled in the loan
agreement. ASC 310-10 applies to all loans except smaller-balance
homogeneous consumer loans, loans carried at the lower of cost or
fair value, debt securities, and leases.
The Bank applies
ASC 310-10 to all commercial loans classified as “With
problems”, “Insolvency Risks” and
“Uncollectible” or commercial loans more than 90 days
past due. The Bank specifically calculates the present value of
estimated cash flows for commercial loans in excess of Ps.2,500 and
more than 90 days past due. For commercial and other loans in legal
proceedings, loans in excess of Ps.2,500 are specifically reviewed
either on a cash-flow or collateral-value basis, both considering
the estimated time to settle the proceedings.
As of June 30, 2016
and 2015, the result of applying ASC 310-10, shows that the Bank
recorded an adjustment to shareholders’ equity for U.S. GAAP
purposes of Ps.60,574 and Ps. 39,753, respectively.
b)
In addition, the
Bank has performed a migration analysis for mortgage, credit cards
and consumer loans following the ASC 450-20 and historical loss
ratios were determined by analyzing historical losses, in order to
calculate the allowance required for smaller-balance impaired loans
and unimpaired loans for U.S. GAAP purposes. Loss estimates are
analyzed by loan type and thus for homogeneous groups of clients.
Such historical ratios were updated to
F- 262
BANCO
HIPOTECARIO SA AND SUBSIDIARIES
NOTES
TO THE CONSOLIDATED FINANCIAL STATEMENTS
As of and for the twelve-month periods ended June 30, 2016, 2015
and 2014
(Expressed in thousands of Argentine pesos, except share data
and as otherwise indicated)
c)
incorporate the
most recent data reflecting current economic conditions, industry
performance trends, geographic or obligor concentrations within
each portfolio segment, and any other pertinent information that
may affect the estimation of the allowance for loan
losses.
As a result of the
analysis mentioned before, the Bank recorded an adjustment to
shareholders’ equity for U.S. GAAP purposes of Ps. (193,715)
and Ps. (129,868), for 2016 and 2015, respectively.
d)
Under Argentine
Banking GAAP, loans that were previously charged-off, which are
subsequently restructured and become performing loans, are included
again in the Bank’s assets, according to the policies adopted
by the bank. Under U.S. GAAP recoveries of loans previously charged
off should be recorded when received. As of June 2016 and 2015, the
Bank recorded an adjustment to shareholders’ equity related
to reinstated loans of Ps. (48,146) and Ps. (62,502),
respectively.
e)
Effective
July 1, 2010, the Bank implemented new accounting guidance provided
by SFAS 166 and 167 (ASU 2009-16 and ASU 2009-17, respectively,
under the new codification), which amend the accounting for
transfers of financial assets and consolidation of variable
interest entities (VIEs). As a result of applying such guidance,
the Bank, or its subsidiaries, were deemed to be the primary
beneficiary of the securitization trusts because the Bank, or its
subsidiaries, have the power to direct the activities of these VIEs
through its servicing responsibilities and duties. Additionally,
the Bank, or its subsidiaries, through its retained interests held
in these securitizations have the obligation to absorb losses or
the right to receive benefits from the VIEs. As a result of the
analysis performed, the Bank should consolidate assets and
liabilities of those securitization trusts, elimininating the
investment in the retained interests and recording and adjustment
in the allowance for loan losses of such securitization
trusts.
As a result of the
analysis mentioned before, the Bank recorded an adjustment to
shareholders’ equity for U.S. GAAP purposes of Ps. (69,419)
and Ps. (67,924), for 2016 and 2015, respectively.
As a result of
analysis performed the breakdown of the shareholders’ equity
adjustment between Argentine Banking GAAP and U.S. GAAP between the
Bank’s adjustment and the reconsolidated securitization
trusts as of June 30, 2016 and 2015 is as follows:
|
|
2016
|
2015
|
|||||
|
|
Allowances under
Arg. Banking GAAP
|
Allowances under
U.S. GAAP
|
Adjustment to
shareholders’ equity
|
Allowances under
Arg. Banking GAAP
|
Allowances under
U.S. GAAP
|
Adjustment to
shareholders’ equity
|
|
|
|
|
|
|
|
|
|
|
|
Migration analysis
(*)
|
412,693
|
606,408
|
(193,715)
|
346,797
|
476,665
|
(129,868)
|
|
|
ASC
310-10
|
84,157
|
23,583
|
60,574
|
91,365
|
51,612
|
39,753
|
|
|
Reinstated
loans
|
-
|
48,146
|
(48,146)
|
-
|
62,502
|
(62,502)
|
|
|
Subtotal
|
496,850
|
678,137
|
(181,287)
|
438,162
|
590,779
|
(152,617)
|
|
(*) Migration
analysis of Banco Hipotecario and its subsidiaries.
F- 263
BANCO
HIPOTECARIO SA AND SUBSIDIARIES
NOTES
TO THE CONSOLIDATED FINANCIAL STATEMENTS
As of and for the twelve-month periods ended June 30, 2016, 2015
and 2014
(Expressed in thousands of Argentine pesos, except share data
and as otherwise indicated)
|
|
2016
|
2015
|
|||||
|
|
Allowances under
Arg. Banking GAAP
|
Allowances under
U.S. GAAP
|
Adjustment to
shareholders’ equity
|
Allowances under
Arg. Banking GAAP
|
Allowances under
U.S. GAAP
|
Adjustment to
shareholders’ equity
|
|
|
|
|
|
|
|
|
|
|
|
Reconsolidated
trusts
|
196,202
|
265,621
|
(69,419)
|
76,232
|
144,156
|
(67,924)
|
|
|
Subtotal
|
196,202
|
265,621
|
(69,419)
|
76,232
|
144,156
|
(67,924)
|
|
|
|
|
|
|
|
|||
|
Total
|
693,052
|
943,758
|
(250,706)
|
514,394
|
734,935
|
(220,541)
|
|
c. Derivative Financial Instruments
As mentioned in
notes 18 and 2.9. the Bank entered in several derivative
transactions, mainly, to hedge: i) the exchange rate risk attached
to liabilities denominated in foreign currency, and ii) interest
rate swaps to manage its interest rate risk.
Gains and losses
are recorded in earnings in each period.
Under U.S. GAAP,
the Bank accounts for derivative financial instruments in
accordance with ASC 815 which establishes the standards of
accounting and reporting derivative instruments, including certain
derivative instruments embedded within contracts (collectively
referred to as derivatives) and hedging activities. This statement
requires institutions to recognize all derivatives in the balance
sheet, whether as assets or liabilities, and to measure those
instruments at their fair value. If certain conditions are met, a
derivative may be specifically designated as (a) a hedge for the
exposure to changes in the fair value of a recorded asset or
liability or unrecorded firm commitment, (b) a hedge for the
exposure of future cash flows and (c) a hedge for the exposure of
foreign currency. If such a hedge designation is achieved then
special hedge accounting can be applied for the hedged transactions
that will reduce the volatility in the income statement to the
extent that the hedge is effective. In order for hedge accounting
to be applied the derivative and the hedged item must meet strict
designation and effectiveness tests.
The Bank’s
derivatives do not qualify for hedge accounting treatment under
U.S. GAAP. Therefore gains and losses are recorded in earnings in
each period.
Under U.S. GAAP,
the Bank’s estimates the fair value of the receivable and
payable on the derivative instrument using valuation techniques
with observable market parameters.
d. Government securities
The following table
summarizes the U.S. GAAP shareholders’ equity adjustment
related to other government securities, as of June 30, 2016 and
2015:
|
|
June 30,
|
||||
|
|
2016
|
|
2015
|
||
|
|
|
|
|
|
|
|
Discount
Bonds
|
Ps.
|
-
|
|
Ps.
|
(534)
|
|
Unquoted Securities
issued by the BCRA
|
|
1,525
|
|
|
1,352
|
|
Bills issued by
Provincial Governments
|
|
(10,167)
|
|
|
8,472
|
|
Other National
Government Bonds
|
|
3,945
|
|
|
28,469
|
|
Total
|
Ps.
|
(4,697)
|
|
Ps.
|
37,759
|
F- 264
BANCO
HIPOTECARIO SA AND SUBSIDIARIES
NOTES
TO THE CONSOLIDATED FINANCIAL STATEMENTS
As of and for the twelve-month periods ended June 30, 2016, 2015
and 2014
(Expressed in thousands of Argentine pesos, except share data
and as otherwise indicated)
●
Discount Bonds
●
As of June 30, 2004
the Bank held certain defaulted Argentine government bonds. Such
bonds were not quoted in the public market. On January 2005, the
Bank accepted the offer to exchange its defaulted government
securities for “Discount Bonds in pesos” issued under
the Argentine debt restructuring. On April 1, 2005 the government
securities were exchange.
For U.S. GAAP
purposes and in accordance with ASC 310 satisfaction of one
monetary asset (in this case a defaulted government securities) by
the receipt of another monetary asset (in this case Discount Bonds)
from the creditor is generally based on the market value of the
asset received in satisfaction of the debt. In this particular
case, the Bonds being received are significantly different in
structure and in interest rates than the securities swapped.
Therefore, the fair value of the Bonds was determined on the
balance sheet date based on their market value and will constitute
the cost basis of the asset. Any difference between the old asset
and the fair value of the new asset is recognized as a gain or
loss. The bonds arisen from the exchange have been
sold.
As of June 30, 2015
and 2015 the Discount Bonds were considered available for sale
securities for U.S. GAAP purposes according with ASC 320-10 and
recorded at fair value with the unrealized gains and losses
recognized as a charge or credit to equity through other
comprehensive income.
As of June 30, 2015
the following table shows the amortized cost, book value and fair
value of the mentioned bond.
|
|
2015
|
||||
|
|
Amortized
Cost U.S. GAAP
|
Book
Value Argentine Banking GAAP
|
Fair
Value – Book value under U.S. GAAP
|
Unrealized
(Loss)/Gain
|
Shareholders’
equity Adjustment
|
|
|
(In
thousands of $)
|
||||
|
|
|
|
|
|
|
|
Discount
Bonds
|
9,624
|
9,624
|
9,090
|
(11,013)
|
(534)
|
During the period
ended June 30, 2016, all Discount Bonds were sold. Therefore, the
2016 U.S. GAAP net income reconciliation includes the reversal of
the 2015 shareholders’ equity adjustment of Ps. (534) plus
Ps. 534 of gains previously recorded through other comprehensive
income, which that are being realized and reversed through the
income statement during the period ended June 30,
2016.
●
Other Bonds
Under Argentine
Banking GAAP, as of June 30, 2016 and 2015, some National
Government Bonds, unquoted securities issued by the BCRA and bills
issued by Provincial Governments have been recorded at cost. This
value increases monthly on the basis of the internal rate of return
resulting from the interest rate which, used as discount, matches
the cash flow’s present value with the initial
value.
Under U.S. GAAP
these securities were considered available for sale securities
according with ASC 320 and recorded at fair value with the
unrealized gains and losses recognized as a charge or credit to
equity through other comprehensive income.
As of June 30, 2016
and 2015 the following table shows the amortized cost, book value
and fair value of the mentioned bonds:
F- 265
BANCO
HIPOTECARIO SA AND SUBSIDIARIES
NOTES
TO THE CONSOLIDATED FINANCIAL STATEMENTS
As of and for the twelve-month periods ended June 30, 2016, 2015
and 2014
(Expressed in thousands of Argentine pesos, except share data
and as otherwise indicated)
|
|
2016
|
2015
|
||||||||
|
|
Amortized
Cost U.S. GAAP
|
Book
Value Argentine Banking GAAP
|
Fair
Value – Book value under U.S. GAAP
|
Unrealized
(Loss)/Gain
|
Shareholders’
equity Adjustment
|
Amortized
Cost U.S. GAAP
|
Book
Value Argentine Banking GAAP
|
Fair
Value – Book value under U.S. GAAP
|
Unrealized
(Loss)/Gain
|
Shareholders’
equity Adjustment
|
|
|
(In
thousands of $)
|
|||||||||
|
|
|
|
|
|
|
|
|
|
|
|
|
Unquoted
securities issued by the BCRA
|
1,251,461
|
1,251,461
|
1,252,986
|
1,525
|
1,525
|
1,719,856
|
1,719,856
|
1,721,208
|
1,352
|
1,352
|
|
Bills
issued by Provincial Governments
|
503,200
|
503,200
|
493,033
|
2,259
|
(10,167)
|
539,172
|
539,172
|
547,644
|
8,472
|
8,472
|
|
|
|
|
|
|
|
|
|
|
|
|
|
Other
National Government Bonds
|
377,990
|
377,990
|
381,935
|
3,945
|
3,945
|
648,921
|
648,921
|
677,390
|
28,469
|
28,465
|
The Bank has
evaluated whether there was a decline in the value of the security
that is other-than temporary as defined by ASC 320.
A number of factors
are considered in performing an impairment analysis of securities.
Those factors include, among others:
a.
Intent
and ability of the Bank to retain its investment for a period of
time that allows for any anticipated recovery in market
value;
b.
Expectation
to recover the entire amortized cost of the security;
c.
Recoveries
in fair value after the balance sheet date;
d.
The
financial condition and near-term prospects of the issuer,
including any specific events which may influence the operations of
the issuer (such as changes in technology that may impair the
earnings potential of the investment or the discontinuance of a
segment of a business that may affect the future earnings
potential).
e.
Likelihood
that it will be required to sell debt investments before recovery
of amortized cost.
The Bank also takes
into account
the length of time and
the extent to which the market value of the security has been less
than cost and
changes in global and regional economic
conditions and changes related to specific issuers or industries
that could adversely affect these values.
As of June 30, 2016
the fair value of the Bills issued by Provincial Governments is
less than its amortized cost. The Bank as a result of its analysis
has determined that, as of June 30, 2016, unrealized losses on some
Bills, are not temporary, consequently the Bank has recorded an
other-than temporary impairment for U.S. GAAP purposes. Therefore
the fair value of the security was determined on the balance sheet
date based on their market value and will constitute the new cost
basis for the asset. In addition, the bank has performed an
impairment analysis for the rest of their portfolio and no other
than temporary impairment were detected.
e. Financial liabilities
Bonds
As described in
note 15, the bank has issued several series of negotiable
obligations in different terms and conditions. Under Argentine
Banking GAAP, the costs of originating such instruments have been
charged to the Income Statement at the issuance date.
Under U.S.GAAP, and
according to ASC 835-30-45-3, issuance costs should be reported in
the balance sheet as deferred charges. In addition, ASC 470-10-35-2
states that debt issuance costs should be amortized over the same
period used in the interest cost determination.
F- 266
BANCO
HIPOTECARIO SA AND SUBSIDIARIES
NOTES
TO THE CONSOLIDATED FINANCIAL STATEMENTS
As of and for the twelve-month periods ended June 30, 2016, 2015
and 2014
(Expressed in thousands of Argentine pesos, except share data
and as otherwise indicated)
Subordinated
bonds
On June 22, 2015
BACS Banco de Crédito y Securitización S.A., issued
negotiable obligations that are convertible into the
Company’s ordinary and book-entry shares for a principal
amount of Ps.100,000. The private offering of the convertible
negotiable obligations was solely addressed to the Company’s
shareholders. IRSA Inversiones y Representaciones Sociedad
Anónima subscribed all the convertible negotiable
obligations.
Under Argentine
Banking GAAP the subordinated negotiable obligations have been
recorded at their residual value plus interests
accrued.
According to ASC
470-20-25-5, an embedded beneficial conversion feature present in a
convertible instrument shall be recognized separately at issuance
by allocating a portion of the proceeds equal to the intrinsic
value of that feature to additional paid in capital.
As of June 30, 2016
and 2015 the shareholder’s equity adjustment, for both
concepts, amounts to Ps. 87,863 and Ps. 10,282,
respectively.
f. Securitizations
For Argentine
Banking GAAP purposes, the debt securities and certificates
retained by the Bank are accounted for at cost plus accrued
interest for the debt securities, and the equity method is used to
account for the residual interest in the trust.
Under U.S. GAAP the
primary beneficiary of a variable interest entity (VIE) is required
to consolidate its assets and liabilities. An entity is considered
a VIE if it possesses one of the following
characteristics:
●
Insufficient
Equity Investment at Risk
●
Equity
lacks decision-making rights
●
Equity
with non-substantive voting rights
●
Lacking
the obligation to Absorb an Entity´s Expected
Losses
●
Lacking
the right to receive an Entity´s expected residual
returns
The primary
beneficiary is the party that has both (1) the power to direct the
activities of an entity that most significantly impact the
VIE’s economic performance; and (2) through its interests in
the VIE, the obligation to absorb losses or the right to receive
benefits from the VIE that could potentially be significant to the
VIE.
To assess whether
the Bank has the power to direct the activities of a VIE that most
significantly impact the VIE’s economic performance, the Bank
considers all facts and circumstances, including its role in
establishing the VIE and its ongoing rights and responsibilities.
This assessment includes, first, identifying the activities that
most significantly impact the VIE’s economic performance; and
second, identifying which party, if any, has power over those
activities.
As a consequence of
this assessment, the Bank was deemed to be the primary beneficiary
of certain securitization trusts because the Bank has the power to
direct the activities of these VIEs through its servicing
responsibilities and duties. Additionally, the Bank through its
retained interests held in these securitizations has the obligation
to absorb losses or the right to receive benefits from the
VIEs.
For U.S. GAAP
purposes, as of June 30, 2016 and 2015, the Bank consolidated
certain VIE’s in which the Bank had a controlling financial
interest and for which it is the primary beneficiary. Therefore,
the Bank reconsolidated their net assets, eliminated the gain or
loss recognized on the sale of receivables when the carrying value
of transferred credit card receivables differs from the amount of
cash and certificates of participation received, eliminated the
servicing liabilities and re-established its loan loss reserves
under ASC 450-20. See note 33.b. for allowance for loan
losses.
F- 267
BANCO
HIPOTECARIO SA AND SUBSIDIARIES
NOTES
TO THE CONSOLIDATED FINANCIAL STATEMENTS
As of and for the twelve-month periods ended June 30, 2016, 2015
and 2014
(Expressed in thousands of Argentine pesos, except share data
and as otherwise indicated)
No servicing assets
or liabilities have been recognized.
The total
shareholders’ equity adjustment between Argentine Banking
GAAP and U.S. GAAP as of June 30, 2016 and 2015 amounted to Ps.
(56,693) and Ps. (15,442), respectively.
Additional information required by U.S. GAAP
The Bank adopted
ASC 860-10 and ASC 810-10 which require additional disclosures
about its involvement with consolidated VIE’s and expanded
the population of VIE’s to be disclosed. The table below
presents the assets and liabilities of the financial trusts which
have been consolidated for U.S. GAAP purposes:
|
|
June
30,
|
||||
|
|
2016
|
|
2015
|
||
|
|
|
|
|
|
|
|
Cash and due from
banks
|
Ps.
|
224,
065
|
|
Ps.
|
88,236
|
|
Loans (net of
allowances)
|
|
4,425,255
|
|
|
2,235,655
|
|
Other
assets
|
|
1,181,403
|
|
|
1,149,023
|
|
Total
Assets
|
Ps.
|
5,830,723
|
|
Ps.
|
3,472,914
|
|
|
|
|
|
|
|
|
Debt
Securities
|
Ps.
|
4,575,569
|
|
Ps.
|
2,868,064
|
|
Certificates of
Participation
|
|
1,062,201
|
|
|
451,365
|
|
Other
liabilities
|
|
192,953
|
|
|
153,485
|
|
Total
Liabilities
|
Ps.
|
5,830,723
|
|
Ps.
|
3,472,914
|
As of June 30,
2016, the Bank’s maximum loss exposure, which amounted to Ps.
5,830,723, is based on the unlikely event that all of the assets in
the VIE’s become worthless and incorporates potential losses
associated with assets recorded on the Bank’s Balance Sheet.
Nevertheless, under Argentine Law the Debt securities will be paid
exclusively with the securitized assets.
g. Intangible Assets
Software
costs
Under Argentine
Banking GAAP fees paid for a re-engineering project and for
restructuring expenses incurred in relation to certain equity
transactions are recognized as an intangible asset and amortized in
a maximum of five years. Such cost should be expensed as incurred
under U.S. GAAP.
Under Argentine
Banking GAAP, the Bank capitalizes costs relating to all three of
the stages of software development. Under ASC 350-40 defines three
stages for the costs of computer software developed or obtained for
internal use: the preliminary project stage, the application
development stage and the post-implementation operation stage. Only
the second stage costs should be capitalized.
Shareholders’
equity adjustment between Argentine Banking GAAP and U.S. GAAP as
of June 30, 2016 and 2015 amounted to Ps. (62,366) and Ps.
(63,888), respectively.
Other
intangible assets
F- 268
BANCO
HIPOTECARIO SA AND SUBSIDIARIES
NOTES
TO THE CONSOLIDATED FINANCIAL STATEMENTS
As of and for the twelve-month periods ended June 30, 2016, 2015
and 2014
(Expressed in thousands of Argentine pesos, except share data
and as otherwise indicated)
On January 13,
2011, Tarshop S.A. acquired from APSA Media S.A., previously
Metroshop S.A., a portfolio of credit cards delinquent by less than
60 days; a contractual position in contracts for the issuance of
credit cards; the accounts of customers, the lease agreements and
movable property at certain branches and the contracts of
employment with personnel under a labor relationship.
Under Argentine
Banking GAAP, no intangible assets should be recognized in
accordance with these transactions.
Under U.S. GAAP,
ASC 350-30 defines that an intangible asset which is acquired
either individually or with a group of other assets shall be
recognized. Assets are recognized based on their cost to the
acquiring entity, which generally includes the transaction costs of
the assets acquisition, and no gain or loss is recognized unless
the fair value of noncash assets given as consideration differs the
assets’ carrying amount on the acquiring entity’s
books. The cost of a group of assets acquired shall be allocated to
the individual assets acquired or liabilities assumed based on
their relative fair values and shall not give rise to
goodwill.
Shareholders’
equity adjustment between Argentine Banking GAAP and U.S. GAAP as
of June 30, 2015 amounted to Ps. (59), respectively, related to the
contractual position in contracts for the issuance of credit cards
and the accounts of customers recorded as intangibles assets for
U.S. GAAP purposes.
Business
combination
i) Acquisition of
Tarshop S.A.
On August 30, 2010,
the Financial and Exchange Institutions Superintendency of the
Argentine Central Bank gave its consent to the purchase of 80% of
the share capital of Tarshop SA. Such shareholding consists of
107,037,152 non-endorsable, registered ordinary shares, par value 1
Peso per share, and entitled to one vote per share, in turn
equivalent to 107,037,152 votes.
The sales price
amounted to US$ 26.8 million, of which 20% (US$ 5.4 million) was
paid on December 29, 2009 and the remaining balance of the price
was cancelled on September 13, 2010.
Pursuant to
Argentine Central Bank rules, and due to the difference between the
acquisition cost and the estimated fair value of assets and
liabilities acquired, a goodwill amounting to Ps. 29,568 was
recorded under Intangible Assets – Goodwill. This goodwill is
subsequently charged to Income on a straight-line basis during 60
months.
As of June 30, 2016 and 2015
the Bank has a balance of Ps. 12,320 and Ps. 15,277, respectively,
related to the goodwill.
Under U.S. GAAP, ASC 805 requires the acquisition
of controlling interest of
Tarshop S.A.
to be accounted for as a business combination
applying the purchase method, recognizing all net assets acquired
at their fair value.
The intangible
assets identified as part of the acquisition where customer
relationships, trademark and workforce amounted to Ps. 24,394 as of
August 31, 2010 subject to amortization.
ii) Acquisition of
BACS Administradora de activos S.A. S.G.F.C.I.
On
April 26, 2012 BACS Banco de Crédito y Securitización
S.A. acquired 85% of the shares belonging to BACS Administradora de
activos S.A. S.G.F.C.I. (former FCMI Argentina Financial
Corporation S.A. S.G.F.C.I.). The purchase price was Ps. 6
million.
Pursuant to
Argentine Central Bank rules, and due to the difference between the
acquisition cost and the estimated fair value of assets and
liabilities acquired as of April 30, 2012, a goodwill amounting to
Ps. 4,728 was recorded under Intangible Assets – Goodwill.
This goodwill is subsequently charged to income on a straight-line
basis during 120 months.
As of June
30, 2016 and 2015 the Bank recorded such balance which amounted to
Ps. 2,758 and Ps. 3,231, respectively.
F- 269
BANCO
HIPOTECARIO SA AND SUBSIDIARIES
NOTES
TO THE CONSOLIDATED FINANCIAL STATEMENTS
As of and for the twelve-month periods ended June 30, 2016, 2015
and 2014
(Expressed in thousands of Argentine pesos, except share data
and as otherwise indicated)
Under
U.S. GAAP, ASC 805 requires the acquisition of controlling interest
of BACS Administradora de activos S.A. S.G.F.C.I. (former FCMI
Argentina Financial Corporation S.A. S.G.F.C.I.) to be accounted
for as a business combination applying the purchase method,
recognizing all net assets acquired at their fair
value.
Goodwill
amortization, under Argentine Banking GAAP has been reversed for
U.S. GAAP purposes.
h.
Impairment of fixed assets and
foreclosed assets
Under Argentine
Banking GAAP, fixed assets and foreclosed assets are restated for
inflation using the WPI index at February 28, 2003. As such, the
balances of fixed assets and foreclosed assets were increased
approximately 120%.
In accordance with
ASC 360-10 such assets are subject to impairment tests in certain
circumstances. Because projected cash flows associated with fixed
assets and foreclosed assets are insufficient to recover the
restated carrying amounts of the assets, those assets should be
tested for impairment. During 2002, in the absence of credible
market values for our fixed and foreclosed assets, the Bank under
U.S. GAAP reversed the restatement of fixed and foreclosed
assets.
Long-lived assets
are reviewed for impairment whenever events or changes in
circumstances indicate that the carrying amount may not be
recoverable.
As of June 2016 and
2015, no additional impairment was recorded in fixed and foreclosed
assets.
Shareholders’
equity adjustment between Argentine Banking GAAP and U.S. GAAP as
of June 30, 2016 and 2015 amounted to Ps. (36,263) and Ps.
(37,379), respectively. The differences between periods are due to
depreciation recorded under Argentine Banking GAAP.
i. Non-controlling interest
Argentine Banking
GAAP rules require recording non-controlling interests as a
component of the liabilities. ASC 810 requires recording such
interests as shareholders’ equity. In addition, the U.S. GAAP
adjustment represents the allocation to the non-controlling
interest of non-wholly owned subsidiaries of certain U.S. GAAP
adjustments related to such subsidiaries.
j. Vacation Provision
The Bank’s
policy for vacation benefits is to expense such benefits as taken.
For U.S. GAAP purposes, the vacation accrual is based on an accrual
basis, where earned but untaken vacation is recognized as a
liability.
Shareholders’
equity adjustment between Argentine Banking GAAP and U.S. GAAP as
of June 30, 2016 and 2015 amounted to Ps. (74,644) and Ps.
(57,634), respectively.
k. Insurance Technical reserve
F- 270
BANCO
HIPOTECARIO SA AND SUBSIDIARIES
NOTES
TO THE CONSOLIDATED FINANCIAL STATEMENTS
As of and for the twelve-month periods ended June 30, 2016, 2015
and 2014
(Expressed in thousands of Argentine pesos, except share data
and as otherwise indicated)
Until September
2003, the calculation of the local technical reserves performed by
the Bank was the same as that used under U.S. GAAP.
On September 2003, the National Insurance
Superintendency issued certain regulations on the calculation of
reserves introducing changes to the local regulations. F
or
U.S. GAAP purposes the Bank has accounted these insurance technical
reserves under ASC 944.
Therefore, the technical reserves for the
twelve-month periods ended June 30, 2016 and 2015 were adjusted for
U.S. GAAP purposes. Shareholders’ equity adjustment
as
of June 30, 2016 and 2015 amounted to Ps. (1,299) and Ps. (339),
respectively
.
l. Capitalization of interest cost
Under
Argentine Banking GAAP, during the process of construction of an
asset the capitalization of interest is not
recognized.
For U.S. GAAP purposes, as stated in ASC
835-20 the amount of interest cost to
be capitalized for qualifying assets is intended to be that portion
of the interest cost incurred during the assets’ acquisition
periods that theoretically could have been avoided (for example, by
avoiding additional borrowings or by using the funds expended for
the assets to repay existing borrowings) if expenditures for the
assets had not been made.
The
amount capitalized in an accounting period shall be determined by
applying an interest rate to the average amount of accumulated
expenditures for the asset during the period. The capitalization
rates used in an accounting period shall be based on the rates
applicable to borrowings outstanding during the
period.
The
total amount of interest cost capitalized in an accounting period
shall not exceed the total amount of interest cost incurred by the
enterprise in that period.
Shareholders’
Equity adjustment between Argentine Banking GAAP and U.S. GAAP as
of June 30, 2015 amounted to Ps. 4,001, respectively.
m. Financial guarantees issued
During the twelve-month period ended June 30,
2016, the Bank entered into different agreements to guarantee lines
of credit of selected customers. As of June 30, 2016, guarantees
granted by the Bank amounted to Ps
. 463,107
.
Under Argentine Banking GAAP the guarantees are
recorded in memorandum accounts. As of June 30, 2016, for U.S. GAAP
purposes the Bank recognized a liability for the fair value of the
obligations assumed at its inception in accordance with the
requirements of ASC 460. Such liabilities are being amortized over
the expected term of the guarantee. As of June 30, 2016, the fair
value of the guarantees less the estimated proceeds from collateral
amounted to Ps.
(1,209)
.
As
of June 30, 2016, the Bank maintained the following
guarantees:
|
|
As of June 30, 2016
|
|||||||
|
|
Maximum Potential Payments (*)
|
|
Estimated Proceeds from collateral resource
|
|
U.S. GAAP adjustment
|
|||
|
Financial
guarantees
|
Ps.
|
463,107
|
|
Ps.
|
4,398
|
|
Ps.
|
(1,209)
|
|
|
Ps.
|
463,107
|
|
Ps.
|
4,398
|
|
Ps.
|
(1,209)
|
(*)
The maximum potential payments represent a “worse-case
scenario”, and do not necessarily reflect expected results.
Estimated proceeds from collateral and recourse represent the
anticipated value of assets that could be liquidated or received
from other parties to offset the Company’s payments under
guarantees.
F- 271
BANCO
HIPOTECARIO SA AND SUBSIDIARIES
NOTES
TO THE CONSOLIDATED FINANCIAL STATEMENTS
As of and for the twelve-month periods ended June 30, 2016, 2015
and 2014
(Expressed in thousands of Argentine pesos, except share data
and as otherwise indicated)
n. Miscellaneous assets
Under
Argentine Banking GAAP, the stock of forms, books, prints,
stationery and other assets of a similar nature the entity has to
be used in the future, are booked under the caption
“Miscellaneous assets”.
For
U.S. GAAP purposes, the amounts expensed in these items should be
recognized as a cost incurred during the period.
Shareholders’
equity adjustment between Argentine Banking GAAP and U.S. GAAP as
of June 30, 2016 amounted to Ps. (30,848).
o. Deferred Income Tax
Argentine
Banking GAAP requires income taxes to be recognized on the basis of
amounts due in accordance with Argentine tax regulations. Temporary
differences between the financial reporting and income tax bases of
accounting are therefore not considered in recognizing income
taxes.
In accordance with
ASC 740-10 under U.S. GAAP income taxes are recognized on the
liability method whereby deferred tax assets and liabilities are
established for temporary differences between the financial
reporting and tax bases of our assets and liabilities. Deferred tax
assets are also recognized for tax loss carryforwards. Deferred tax
assets and liabilities are measured using enacted tax rates
expected to apply to taxable income in the years in which those
temporary differences are expected to be recorded or settled. The
effect on deferred tax assets and liabilities of a change in tax
rates is recognized in income in the period that includes the
enactment date. A valuation allowance is recognized for that
component of net deferred tax assets which is “more likely
than not” that it will not be recoverable.
As of June 30, 2016
and 2015, and based on the tax projections performed, the Bank
believes that is more likely than not that it will recover the net
operating tax loss carry forward and all the temporary differences,
with future taxable income.
In a consolidated
basis, the Bank has recognized a shareholders’ equity
adjustment between Argentine Banking GAAP and U.S. GAAP that
amounted to Ps. 352,931 and Ps. 258,903, as of June 30, 2016 and
2015, respectively.
ASC 740 prescribes
a comprehensive model for the recognition, measurement, financial
statement presentation and disclosure of uncertain tax positions
taken or expected to be taken in a tax return. Additionally, it
provides guidance on derecognition, classification, interest and
penalties, accounting in interim periods, disclosure and
transition. As of June 30, 2016, there were no uncertain tax
positions.
The Bank classifies
income tax-related interest and penalties as income taxes in the
financial statements. The adoption of this pronouncement had no
effect on the Bank’s overall financial position or results of
operations.
The following table
shows the tax years open for examination as of June 30, 2016, by
major tax jurisdictions in which the Bank operates:
F- 272
BANCO
HIPOTECARIO SA AND SUBSIDIARIES
NOTES
TO THE CONSOLIDATED FINANCIAL STATEMENTS
As of and for the twelve-month periods ended June 30, 2016, 2015
and 2014
(Expressed in thousands of Argentine pesos, except share data
and as otherwise indicated)
|
Jurisdiction
|
|
Tax
year
|
|
Argentina
|
|
2011 –
2015
|
p. Items in process of collection
The Bank does not
give accounting recognition to checks drawn on the Bank or other
banks, or other items to be collected until such time as the
related item clears or is accepted. Such items are recorded by the
Bank in memorandum accounts. U.S. banks, however, account for such
items through balance sheet clearing accounts at the time the items
are presented to the Bank.
The Bank’s
assets and liabilities would be increased by approximately Ps.
234,515 and Ps. 137,944, had U.S. GAAP been applied at June 30,
2016 and 2015, respectively.
II.
Additional
disclosure requirements:
q. Fair Value Measurements Disclosures
ASC 820-10 defines
fair value as the price that would be received to sell an asset or
paid to transfer a liability in an orderly transaction between
market participants at the measurement date. Effective January
2010, the Bank adopted new accounting guidance under ASC 820 that
requires additional disclosures including, among other things, (i)
the amounts and reasons for certain significant transfers among the
three hierarchy levels of inputs, (ii) the gross, rather than net,
basis for certain level 3 roll forward information, (iii) use of a
“class” rather than a “major category”
basis for assets and liabilities, and (iv) valuation techniques and
inputs used to estimate level 2 and level 3 fair value
measurements.
In addition, ASC
820-10 establishes a three-level valuation hierarchy for disclosure
of fair value measurements. The valuation hierarchy is based upon
the transparency of inputs to the valuation of an asset or
liability as of the measurement date. The three levels are defined
as follows.
●
Level
1 – inputs to the valuation methodology are quoted prices
(unadjusted) for identical assets or liabilities in active
markets.
●
Level
2 – inputs to the valuation methodology include quoted prices
for similar assets and liabilities in active markets, and inputs
that are observable for the asset or liability, either directly or
indirectly, for substantially the full term of the financial
instrument.
●
Level
3 – inputs to the valuation methodology are unobservable and
significant to the fair value measurement.
A financial
instrument’s categorization within the valuation hierarchy is
based upon the lowest level of input that is significant to the
fair value measurement.
Determination of fair value
Fair value is based
upon quoted market prices, where available. If listed prices or
quotes are not available, fair value is based upon internally
developed models that use primarily market-based or
independently-sourced market parameters, including interest rate
yield curves, option volatilities and currency rates. Valuation
adjustments may be made to ensure that financial instruments are
recorded at fair value. These adjustments include amounts to
reflect counterparty credit quality, the Bank’s
creditworthiness, liquidity and unobservable parameters that are
applied consistently over time.
F- 273
BANCO
HIPOTECARIO SA AND SUBSIDIARIES
NOTES
TO THE CONSOLIDATED FINANCIAL STATEMENTS
As of and for the twelve-month periods ended June 30, 2016, 2015
and 2014
(Expressed in thousands of Argentine pesos, except share data
and as otherwise indicated)
The Bank believes
its valuation methods are appropriate and consistent with other
market participants, the use of different methodologies, or
assumptions, to determine the fair value of certain financial
instruments could result in a different estimate of fair value at
the reporting date.
The
following section describes the valuation methodologies used by the
Bank to measure various financial instruments at fair value,
including an indication of the level in the fair-value hierarchy in
which each instrument is generally classified. Where appropriate,
the description includes details of the valuation models, the key
inputs to those models as well as any significant
assumptions.
Assets
(by Class of asset)
a)
Securities
As of June 30, 2016
and 2015 the Bank’s securities are classified within level
1of the valuation hierarchy using quoted prices available in the
active market. Level 1 securities includes government bonds and
instruments issued by BCRA and corporate securities. Furthermore
the Bank´s instruments issued by BCRA with no volatility
published by the BCRA and bills issued by Provincial Governments
are classified within Level 2 using quoted prices available of
similar assets.
b)
Securities receivable under repurchase agreements
The Bank’s
securities receivable under repurchase agreements which do not
qualify for sale accounting for U.S. GAAP purposes, are classified
within level 1 of the valuation hierarchy. To estimate the fair
value of these securities, quoted prices are available in an active
market.
c)
Derivatives
The fair value of
level 1 derivative positions are determined using quoted market
prices. The fair value of level 2 derivative positions are
determined using internally developed models that utilize market
observable parameters.
Liabilities
(by Class of liability)
d)
Derivatives
The fair value of
level 1 derivative positions are determined using quoted market
prices.
The following table
presents the financial instruments, by class of asset and
liabilities, carried at fair value as of June 30, 2016 and 2015, by
ASC 820-10 valuation hierarchy (as described above).
F- 274
BANCO
HIPOTECARIO SA AND SUBSIDIARIES
NOTES
TO THE CONSOLIDATED FINANCIAL STATEMENTS
As of and for the twelve-month periods ended June 30, 2016, 2015
and 2014
(Expressed in thousands of Argentine pesos, except share data
and as otherwise indicated)
|
|
Balances
as of June 30, 2016
|
|||
|
|
Total
carrying value
|
Quoted
market prices in active markets
(Level
1)
|
Internal
models with significant observable market parameters
(Level
2)
|
Internal
models with significant unobservable market parameters
(Level
3)
|
|
ASSETS
|
|
|
|
|
|
|
|
|
|
|
|
Government
and corporate securities
|
|
|
|
|
|
Trading
securities
|
2,592,155
|
2,592,155
|
-
|
-
|
|
Available for sale
securities
|
894,122
|
727,009
|
167,113
|
-
|
|
Instruments issued
by the BCRA
|
1,296,723
|
1,263,657
|
33,066
|
-
|
|
Corporate
securities
|
490,538
|
490,538
|
-
|
-
|
|
|
|
|
|
|
|
Other
receivables from financial transactions
|
|
|
|
|
|
Trading
securities
|
903,031
|
903,031
|
-
|
-
|
|
Available for sale
securities
|
260,298
|
260,298
|
-
|
-
|
|
Futures
|
50,637
|
50,637
|
-
|
-
|
|
|
|
|
|
|
|
Miscellaneous
assets
|
|
|
|
|
|
Trading
securities
|
14,350
|
14,350
|
-
|
-
|
|
|
|
|
|
|
|
TOTAL
ASSETS AT FAIR VALUE
|
6,501,854
|
6,301,675
|
200,179
|
-
|
|
|
|
|
|
|
|
LIABILITIES
|
|
|
|
|
|
|
|
|
|
|
|
Other
obligations from financial transactions
|
|
|
|
|
|
Trading
securities
|
(792,149)
|
(792,149)
|
-
|
-
|
|
Available for sale
securities
|
(71,880)
|
(53,307)
|
(18,573)
|
-
|
|
Futures
|
(37,864)
|
(37,864)
|
-
|
-
|
|
|
|
|
|
|
|
Deposits
|
|
|
|
|
|
Trading
securities
|
(776,687)
|
(776,687)
|
-
|
-
|
|
|
|
|
|
|
|
TOTAL
LIABILITIES AT FAIR VALUE
|
(1,678,580)
|
(1,660,007)
|
(18,573)
|
-
|
F- 275
BANCO
HIPOTECARIO SA AND SUBSIDIARIES
NOTES
TO THE CONSOLIDATED FINANCIAL STATEMENTS
As of and for the twelve-month periods ended June 30, 2016, 2015
and 2014
(Expressed in thousands of Argentine pesos, except share data
and as otherwise indicated)
|
|
Balances
as of June 30, 2015
|
|||
|
|
Total
carrying value
|
Quoted
market prices in active markets
(Level
1)
|
Internal
models with significant observable market parameters
(Level
2)
|
Internal
models with significant unobservable market parameters
(Level
3)
|
|
ASSETS
|
|
|
|
|
|
|
|
|
|
|
|
Government
and corporate securities
|
|
|
|
|
|
Trading
securities
|
1,244,278
|
1,244,278
|
-
|
-
|
|
Available for sale
securities
|
1,210,421
|
729,986
|
480,435
|
-
|
|
Instruments issued
by the BCRA
|
2,422,813
|
672,239
|
1,750,574
|
-
|
|
Corporate
securities
|
430,855
|
430,855
|
-
|
-
|
|
|
|
|
|
|
|
Other
receivables from financial transactions
|
|
|
|
|
|
Trading
securities
|
231,366
|
231,366
|
-
|
-
|
|
Available for sale
securities
|
231,400
|
231,117
|
283
|
-
|
|
Futures
|
182
|
182
|
-
|
-
|
|
Interest rate
swaps
|
575
|
575
|
-
|
-
|
|
|
|
|
|
|
|
Miscellaneous
assets
|
|
|
|
|
|
Trading
securities
|
162,759
|
162,759
|
-
|
-
|
|
|
|
|
|
|
|
TOTAL
ASSETS AT FAIR VALUE
|
5,934,649
|
3,703,357
|
2,231,292
|
-
|
|
|
|
|
|
|
|
LIABILITIES
|
|
|
|
|
|
|
|
|
|
|
|
Other
obligations from financial transactions
|
|
|
|
|
|
Trading
securities
|
(105,684)
|
(105,684)
|
-
|
-
|
|
Available for sale
securities
|
(247,143)
|
(247,143)
|
-
|
-
|
|
Futures
|
(687)
|
(687)
|
-
|
-
|
|
Interest rate
swaps
|
(512)
|
(512)
|
-
|
-
|
|
|
|
|
|
|
|
Deposits
|
|
|
|
|
|
Trading
securities
|
(99,515)
|
(99,515)
|
-
|
-
|
|
Available for sale
securities
|
(16,288)
|
(16,288)
|
-
|
-
|
|
|
|
|
|
|
|
TOTAL
LIABILITIES AT FAIR VALUE
|
(469,829)
|
(469,829)
|
-
|
-
|
q. Credit Risk disclosures
Allowance for credit losses and recorded investments in financial
receivables
The following table
presents the allowance for account receivables losses and the
related carrying amount of Financing Receivables for the periods
ended June 30, 2016 and 2015 respectively:
|
|
As of June 30, 2016
|
|||||||
|
|
Consumer Loan Portfolio
|
|
Commercial Loan Portfolio
|
|
Total
|
|||
|
Allowance for credit losses:
|
|
|
|
|
|
|
|
|
|
Ending
balance: individually evaluated for impairment
|
Ps.
|
-
|
|
Ps.
|
19,621
|
|
Ps.
|
19,621
|
|
Ending
balance: collectively evaluated for impairment
|
|
920,175
|
|
|
3,962
|
|
|
924,137
|
|
Ending Balance
|
Ps.
|
920,175
|
|
Ps.
|
23,583
|
|
Ps.
|
943,758
|
|
Financing receivables:
|
|
|
|
|
|
|
|
|
|
Ending
balance: individually evaluated for impairment
|
Ps.
|
-
|
|
Ps.
|
21,635
|
|
Ps.
|
21,635
|
|
Ending
balance: collectively evaluated for impairment
|
|
19,821,668
|
|
|
7,646,522
|
|
|
27,468,190
|
|
Ending Balance
|
Ps.
|
19,821,668
|
|
Ps.
|
7,668,157
|
|
Ps.
|
27,489,825
|
F- 276
BANCO
HIPOTECARIO SA AND SUBSIDIARIES
NOTES
TO THE CONSOLIDATED FINANCIAL STATEMENTS
As of and for the twelve-month periods ended June 30, 2016, 2015
and 2014
(Expressed in thousands of Argentine pesos, except share data
and as otherwise indicated)
|
|
As of June 30, 2015
|
|||||||
|
|
Consumer Loan Portfolio
|
|
Commercial Loan Portfolio
|
|
Total
|
|||
|
Allowance for credit losses:
|
|
|
|
|
|
|
|
|
|
Ending
balance: individually evaluated for impairment
|
Ps.
|
-
|
|
Ps.
|
26,410
|
|
Ps.
|
26,410
|
|
Ending
balance: collectively evaluated for impairment
|
|
683,323
|
|
|
25,202
|
|
|
708,525
|
|
Ending Balance
|
Ps.
|
683,323
|
|
Ps.
|
51,612
|
|
Ps.
|
734,935
|
|
Financing receivables:
|
|
|
|
|
|
|
|
|
|
Ending
balance: individually evaluated for impairment
|
Ps.
|
-
|
|
Ps.
|
44,496
|
|
Ps.
|
44,496
|
|
Ending
balance: collectively evaluated for impairment
|
|
15,266,470
|
|
|
6,853,897
|
|
|
22,120,367
|
|
Ending Balance
|
Ps.
|
15,266,470
|
|
Ps.
|
6,898,393
|
|
Ps.
|
22,164,863
|
The activity in the
allowance for loan losses for period is as follows:
|
|
As of June 30,
|
||||
|
|
2016
|
|
2015
|
||
|
Allowance for credit losses:
|
|
|
|
|
|
|
Beginning Balance
|
Ps.
|
734,935
|
|
Ps.
|
596,656
|
|
Charge-offs
|
|
(177,834)
|
|
|
(267,694)
|
|
Provision
for loan losses
|
|
386,657
|
|
|
405,973
|
|
Ending Balance
|
Ps.
|
943,758
|
|
Ps.
|
734,935
|
Account receivable charge-off and recoveries
Under Argentine
GAAP, recoveries on previously charge-off account receivable are
recorded directly to income and the amount of charge-off account
receivable in excess of amounts specifically allocated is recorded
as a direct charge to the income statement. The Bank does not
partially charge off troubled account receivable until final
disposition of the credit, rather, the allowance is maintained on a
credit-by –credit basis for its estimated settlement value.
Under U.S. GAAP, all charge off and recovery activity is recorded
through the allowance for account receivable losses account.
Further, account receivables are generally charged to the allowance
account when all or part of the credit is considered
uncollectible.
Impaired loans
ASC 310, requires a
creditor to measure impairment of a loan based on the present value
of expected future cash flows discounted at the loan’s
effective interest rate, or at the loan’s observable market
price or the fair value of the collateral if the loan is collateral
dependent. This Statement is applicable to all loans (including
those restructured in a troubled debt restructuring involving
amendment of terms), except large groups of smaller-balance
homogenous loans that are collectively evaluated for impairment.
Loans are considered impaired when, based on Management’s
evaluation, a borrower will not be able to fulfill its obligation
under the original loan terms.
F- 277
BANCO
HIPOTECARIO SA AND SUBSIDIARIES
NOTES
TO THE CONSOLIDATED FINANCIAL STATEMENTS
As of and for the twelve-month periods ended June 30, 2016, 2015
and 2014
(Expressed in thousands of Argentine pesos, except share data
and as otherwise indicated)
The following table
discloses the amounts of loans considered impaired in accordance
with ASC 310 updated by ASU 2010 - 20, as of June 30, 2016 and
2015:
|
|
As of June 30, 2016
|
|||||||
|
|
Recorded Investment
|
|
Unpaid Principal Balance
|
|
Related Allowance
|
|||
|
With no related allowance recorded:
|
|
|
|
|
|
|
|
|
|
Commercial
|
|
|
|
|
|
|
|
|
|
Impaired
Loans
|
Ps.
|
-
|
|
Ps.
|
-
|
|
Ps.
|
-
|
|
|
|
|
|
|
|
|
|
|
|
With an allowance recorded:
|
|
|
|
|
|
|
|
|
|
Commercial
|
|
|
|
|
|
|
|
|
|
Impaired
Loans
|
Ps.
|
21,635
|
|
Ps.
|
18,389
|
|
Ps.
|
19,621
|
|
Total
|
Ps.
|
21,635
|
|
Ps.
|
18,389
|
|
Ps.
|
19,621
|
|
|
As of June 30, 2015
|
|||||||
|
|
Recorded Investment
|
|
Unpaid Principal Balance
|
|
Related Allowance
|
|||
|
With no related allowance recorded:
|
|
|
|
|
|
|
|
|
|
Commercial
|
|
|
|
|
|
|
|
|
|
Impaired
Loans
|
Ps.
|
-
|
|
Ps.
|
-
|
|
Ps.
|
-
|
|
|
|
|
|
|
|
|
|
|
|
With an allowance recorded:
|
|
|
|
|
|
|
|
|
|
Commercial
|
|
|
|
|
|
|
|
|
|
Impaired
Loans
|
Ps.
|
44,496
|
|
Ps.
|
37,658
|
|
Ps.
|
26,410
|
|
Total
|
Ps.
|
44,496
|
|
Ps.
|
37,658
|
|
Ps.
|
26,410
|
The average
recorded investment in impaired loans amounted Ps. 1,983 and Ps.
42,349, as of June 30, 2016 and 2015, respectively. There is no
amount of interest income recognized during the time within the
period that the loans were impaired.
Non-accrual accounts receivables and Past due
Non-Accrual loans
are defined as those loans in the categories of: (a) Consumer
portfolio: “Medium Risk”, “High Risk”
and “Uncollectible”, and (b) Commercial portfolio:
“With problems”, “High Risk of Insolvency”
and “Uncollectible”.
The following table
represents the amounts of nonaccruals, as of June 30, 2016 and
2015, respectively:
F- 278
BANCO
HIPOTECARIO SA AND SUBSIDIARIES
NOTES
TO THE CONSOLIDATED FINANCIAL STATEMENTS
As of and for the twelve-month periods ended June 30, 2016, 2015
and 2014
(Expressed in thousands of Argentine pesos, except share data
and as otherwise indicated)
|
|
As of June 30,
|
|||||
|
|
2016
|
|
2015
|
|||
|
Consumer
|
|
|
|
|
|
|
|
Advances
|
Ps.
|
342
|
|
Ps.
|
187
|
|
|
Mortgage
Loans
|
|
26,996
|
|
|
30,739
|
|
|
Personal Loans
– BHSA
|
|
100,484
|
|
|
88,514
|
|
|
Personal Loans
– Financial trusts
|
|
92,396
|
|
|
52,827
|
|
|
Personal Loans
– Tarshop
|
|
-
|
|
|
-
|
|
|
Credit Card Loans
– BHSA
|
|
152,892
|
|
|
115,792
|
|
|
Credit card Loans
– Tarshop
|
|
316,083
|
|
|
109,319
|
|
|
Total
Consumer
|
Ps.
|
689,193
|
|
Ps.
|
397,378
|
|
|
Commercial
|
|
|
|
|
|
|
|
Performing
Loans
|
Ps.
|
|
|
Ps.
|
|
|
|
Impaired
Loans
|
|
21,635
|
|
|
44,496
|
|
|
Total
Commercial
|
Ps.
|
21,635
|
|
Ps.
|
44,496
|
|
|
|
|
|
|
|
|
|
|
Total
Non accrual loans
|
Ps.
|
710,828
|
|
Ps.
|
441,874
|
|
An aging analysis
of past due account receivables, segregated by class of account
receivables, as of June 30, 2016 and 2015 was as
follows:
|
|
As of June 30, 2016
|
||||||
|
|
30-90
|
91-180
|
181-360
|
|
|
|
|
|
|
Days
Past
|
Days
Past
|
Days
Past
|
Greater
|
Total
Past
|
Current
|
Total
|
|
|
Due
|
Due
|
Due
|
than
360
|
Due
|
|
Financing
|
|
Consumer
|
|
|
|
|
|
|
|
|
Advances
|
266
|
107
|
218
|
17
|
608
|
12,701
|
13,309
|
|
Mortgage
Loans
|
25,838
|
5,163
|
4,409
|
17,424
|
52,834
|
2,536,670
|
2,589,504
|
|
Personal Loans
– BHSA
|
111,179
|
46,890
|
53,051
|
543
|
211,663
|
2,916,970
|
3,128,633
|
|
Personal Loans
– Financial trusts
|
8,648
|
9,994
|
33,458
|
48,944
|
101,044
|
131,044
|
232,088
|
|
Personal Loans
– Tarshop
|
3,787
|
-
|
-
|
-
|
3,787
|
92,804
|
96,591
|
|
Credit Card Loans
– BHSA
|
111,061
|
78,226
|
74,571
|
95
|
263,953
|
9,627,352
|
9,891,305
|
|
Credit card Loans
– Tarshop
|
139,332
|
162,809
|
148,651
|
4,623
|
455,415
|
3,414,823
|
3,870,238
|
|
Total
Consumer Loans
|
400,111
|
303,189
|
314,358
|
71,646
|
1,089,304
|
18,732,364
|
19,821,668
|
|
|
|
|
|
|
|
|
|
|
Commercial:
|
|
|
|
|
|
|
|
|
Performing
Loans
|
1,763
|
-
|
-
|
-
|
1,763
|
7,644,759
|
7,646,522
|
|
Impaired
loans
|
-
|
6
|
3,673
|
17,956
|
21,635
|
-
|
21,635
|
|
Total
Commercial Loans
|
1,763
|
6
|
3,673
|
17,956
|
23,398
|
7,644,759
|
7,668,157
|
|
Total
|
401,874
|
303,195
|
318,031
|
89,602
|
1,112,702
|
26,377,123
|
27,489,825
|
F- 279
BANCO
HIPOTECARIO SA AND SUBSIDIARIES
NOTES
TO THE CONSOLIDATED FINANCIAL STATEMENTS
As of and for the twelve-month periods ended June 30, 2016, 2015
and 2014
(Expressed in thousands of Argentine pesos, except share data
and as otherwise indicated)
|
|
As of June 30, 2015
|
||||||
|
|
30-90
|
91-180
|
181-360
|
|
|
|
|
|
|
Days
Past
|
Days
Past
|
Days
Past
|
Greater
|
Total
Past
|
Current
|
Total
|
|
|
Due
|
Due
|
Due
|
than
360
|
Due
|
|
Financing
|
|
Consumer
|
|
|
|
|
|
|
|
|
Advances
|
904
|
119
|
62
|
6
|
1,091
|
17,846
|
18,937
|
|
Mortgage
Loans
|
24,196
|
6,707
|
4,350
|
19,682
|
54,935
|
2,662,466
|
2,717,401
|
|
Personal
Loans – BHSA
|
74,437
|
40,349
|
47,916
|
249
|
162,951
|
2,449,316
|
2,612,267
|
|
Personal Loans
– Financial trusts
|
94,144
|
31,334
|
21,030
|
463
|
146,971
|
727,455
|
874,426
|
|
Credit Card Loans
– BHSA
|
58,835
|
53,133
|
62,318
|
341
|
174,627
|
7,349,464
|
7,524,091
|
|
Credit card Loans
– Tarshop
|
112,302
|
49,500
|
53,187
|
6,632
|
221,621
|
1,297,727
|
1,519,348
|
|
Total
Consumer Loans
|
364,818
|
181,142
|
188,863
|
27,373
|
762,196
|
14,504,274
|
15,266,470
|
|
|
|
|
|
|
|
|
|
|
Commercial:
|
|
|
|
|
|
|
|
|
Performing
Loans
|
1,568
|
-
|
-
|
-
|
1,568
|
6,852,329
|
6,853,897
|
|
Impaired
loans
|
-
|
173
|
11,402
|
32,921
|
44,496
|
-
|
44,496
|
|
Total
Commercial Loans
|
1,568
|
173
|
11,402
|
32,921
|
46,064
|
6,852,329
|
6,898,393
|
|
Total
|
366,386
|
181,315
|
200,265
|
60,294
|
808,260
|
21,356,603
|
22,164,863
|
Financial
receivables that are past due 90 days or more do not accrue
interests.
Credit Quality
The following
tables contain the loan portfolio classification by credit quality
indicator set forth by the Argentine Central Bank.
Commercial
Portfolio
:
Loan
Classification
Description
1.
Normal Situation
The debtor is
widely able to meet its financial obligations, demonstrating
significant cash flows, a liquid financial situation, an adequate
financial structure, a timely payment record, competent management,
available information in a timely, accurate manner and satisfactory
internal controls. The debtor is in a sector of activity that is
operating properly and has good prospects.
2. With
Special Follow-up
Cash flow analysis
reflects that the debt may be repaid even though it is possible
that the customer’s future payment ability may deteriorate
without a proper follow-up.
This category is
divided into two subcategories:
(2.a). Under
Observation;
(2.b). Under
Negotiation or Refinancing Agreements.
3. With
Problems
Cash flow analysis
evidences problems to repay the debt, and therefore, if these
problems are not solved, there may be some losses.
4. High
Risk of Insolvency
Cash flow analysis
evidences that repayment of the full debt is highly
unlikely.
5.
Uncollectible
The amounts in this
category are deemed total losses. Even though these assets may be
recovered under certain future circumstances, inability to make
payments is evident at the date of the analysis. It includes loans
to insolvent or bankrupt borrowers.
F- 280
BANCO
HIPOTECARIO SA AND SUBSIDIARIES
NOTES
TO THE CONSOLIDATED FINANCIAL STATEMENTS
As of and for the twelve-month periods ended June 30, 2016, 2015
and 2014
(Expressed in thousands of Argentine pesos, except share data
and as otherwise indicated)
Credit quality
indicators for the commercial portfolio are reviewed, at a minimum,
on an annual basis.
Consumer
Portfolio
:
Loan
Classification
Description
1.
Normal Situation
Loans with timely
repayment or arrears not exceeding 31 days, both of principal and
interest.
2. Low
Risk
Occasional late
payments, with a payment in arrears of more than 32 days and up to
90 days. A customer classified as “Medium Risk” having
been refinanced may be recategorized within this category, as long
as he amortizes one principal installment (whether monthly or
bimonthly) or repays 5% of principal.
3.
Medium Risk
Some inability to
make payments, with arrears of more than 91 days and up to 180
days. A customer classified as “High Risk” having been
refinanced may be recategorized within this category, as long as he
amortizes two principal installments (whether monthly or bimonthly)
or repays 5% of principal.
4. High
Risk
Judicial
proceedings demanding payment have been initiated or arrears of
more than 180 days and up to one year. A customer classified as
“Uncollectible” having been refinanced may be
recategorized within this category, as long as he amortizes three
principal installments (whether monthly or bimonthly) or repays 10%
of principal.
5.
Uncollectible
Loans to insolvent
or bankrupt borrowers, or subject to judicial proceedings, with
little or no possibility of collection, or with arrears in excess
of one year.
Credit quality
indicators for the consumer portfolio are reviewed on a monthly
basis.
The following table
shows the account receivable balances categorized by credit quality
indicators for the periods ended June 30, 2016 and
2015:
F- 281
BANCO
HIPOTECARIO SA AND SUBSIDIARIES
NOTES
TO THE CONSOLIDATED FINANCIAL STATEMENTS
As of and for the twelve-month periods ended June 30, 2016, 2015
and 2014
(Expressed in thousands of Argentine pesos, except share data
and as otherwise indicated)
|
|
As
of June 30, 2016
|
|||||
|
|
"1"
|
"2"
|
"3"
|
"4"
|
"5"
|
|
|
|
Normal Situation
|
With special follow-up or Low Risk
|
With problems or Medium Risk
|
High risk of insolvency or High risk
|
Uncollectible
|
Total
|
|
Consumer
|
|
|
|
|
|
|
|
Advances
|
12,701
|
266
|
107
|
218
|
17
|
13,309
|
|
Mortgage
Loans
|
2,536,670
|
25,838
|
5,163
|
4,409
|
17,424
|
2,589,504
|
|
Personal Loans
– BHSA
|
2,916,970
|
111,179
|
46,890
|
53,051
|
543
|
3,128,633
|
|
Personal Loans
– Financial trusts
|
131,044
|
8,648
|
3,542
|
88,854
|
-
|
232,088
|
|
Personal Loans
– Tarshop
|
92,804
|
3,787
|
-
|
-
|
-
|
96,591
|
|
Credit Card Loans
– BHSA
|
9,627,352
|
111,061
|
78,226
|
74,571
|
95
|
9,891,305
|
|
Credit card Loans
– Tarshop
|
3,414,823
|
139,332
|
162,809
|
148,651
|
4,623
|
3,870,238
|
|
Total
Consumer Loans
|
18,732,364
|
400,111
|
296,737
|
369,754
|
22,702
|
19,821,668
|
|
|
|
|
|
|
|
|
|
Commercial:
|
|
|
|
|
|
|
|
Performing
loans
|
7,644,759
|
1,763
|
-
|
-
|
-
|
7,646,522
|
|
Impaired
loans
|
-
|
-
|
6
|
3,673
|
17,956
|
21,635
|
|
Total
Commercial Loans
|
7,644,759
|
1,763
|
6
|
3,673
|
17,956
|
7,668,157
|
|
Total Financing Receivables
|
26,377,123
|
401,874
|
296,743
|
373,427
|
40,658
|
27,489,825
|
|
|
As
of June 30, 2015
|
|||||
|
|
"1"
|
"2"
|
"3"
|
"4"
|
"5"
|
|
|
|
Normal Situation
|
With special follow-up or Low Risk
|
With problems or Medium Risk
|
High risk of insolvency or High risk
|
Uncollectible
|
Total
|
|
Consumer
|
|
|
|
|
|
|
|
Advances
|
17,846
|
904
|
119
|
62
|
6
|
18,937
|
|
Mortgage
Loans
|
2,662,466
|
24,196
|
6,707
|
4,350
|
19,682
|
2,717,401
|
|
Personal
Loans – BHSA
|
2,449,316
|
74,437
|
40,349
|
47,916
|
249
|
2,612,267
|
|
Personal Loans
– Financial trusts
|
796,527
|
24,931
|
31,418
|
21,550
|
-
|
874,426
|
|
Credit Card Loans
– BHSA
|
7,349,464
|
58,835
|
53,133
|
62,318
|
341
|
7,524,091
|
|
Credit card Loans
– Tarshop
|
1,297,727
|
112,302
|
49,500
|
53,187
|
6,632
|
1,519,348
|
|
Total
Consumer Loans
|
14,573,346
|
295,605
|
181,226
|
189,383
|
26,910
|
15,266,470
|
|
|
|
|
|
|
|
|
|
Commercial:
|
|
|
|
|
|
|
|
Performing
loans
|
6,852,329
|
1,568
|
-
|
-
|
-
|
6,853,897
|
|
Impaired
loans
|
-
|
-
|
173
|
11,402
|
32,921
|
44,496
|
|
Total
Commercial Loans
|
6,852,329
|
1,568
|
173
|
11,402
|
32,921
|
6,898,393
|
|
Total Financing Receivables
|
21,425,675
|
297,173
|
181,399
|
200,785
|
59,831
|
22,164,863
|
Troubled debt restructuring
According to BCRA
regulations, a refinancing is considered to exist whenever any of
the original contractually agreed conditions for a financing
transaction (term, capital, interest or rate) are
modified.
F- 282
BANCO
HIPOTECARIO SA AND SUBSIDIARIES
NOTES
TO THE CONSOLIDATED FINANCIAL STATEMENTS
As of and for the twelve-month periods ended June 30, 2016, 2015
and 2014
(Expressed in thousands of Argentine pesos, except share data
and as otherwise indicated)
We concluded that
all our refinanced loans comply with the conditions for considering
them as troubled debt restructuring (“TDR”) as defined
under U.S. GAAP. In accordance with ASC 310-40 a restructured loan
is considered a TDR if the debtor is experiencing financial
difficulties and the Bank grants a concession to the debtor that
would not otherwise be considered. Concessions granted could
include: reduction in interest rate to rates that are considered
below market, extension of repayment schedules and maturity dates
beyond original contractual terms.
The following table
presents for the financing receivables modified as troubled debt
restructurings within during the last two periods:
|
|
As of June 30, 2016
|
|||
|
|
Number of contracts
|
|
Post-modification Outstanding recorded investment
|
|
|
Consumer
|
|
|
|
|
|
Advances
|
35
|
|
Ps.
|
950
|
|
Mortgage
Loans
|
109
|
|
|
2,826
|
|
Personal
Loans
|
5,260
|
|
|
141,884
|
|
Credit Card Loans
– BHSA
|
12,038
|
|
|
195,570
|
|
Credit card Loans
– Tarshop
|
17,275
|
|
|
167,361
|
|
Total
Consumer
|
34,717
|
|
Ps.
|
508,591
|
|
|
|
|
|
|
|
Commercial
|
|
|
|
|
|
Performing
Loans
|
-
|
|
Ps.
|
-
|
|
Impaired
Loans
|
-
|
|
|
-
|
|
Total
Commercial
|
-
|
|
Ps.
|
-
|
|
|
|
|
|
|
|
Total
TDRs
|
34,717
|
|
Ps.
|
508,591
|
|
|
|
|||
|
|
|
|||
|
|
As of June 30, 2015
|
|||
|
|
Number of contracts
|
|
Post-modification Outstanding recorded investment
|
|
|
Consumer
|
|
|
|
|
|
Advances
|
63
|
|
Ps.
|
1,463
|
|
Mortgage
Loans
|
174
|
|
|
4,490
|
|
Personal
Loans
|
6,921
|
|
|
160,312
|
|
Credit Card Loans
– BHSA
|
21,472
|
|
|
245,522
|
|
Credit card Loans
– Tarshop
|
15,512
|
|
|
92,758
|
|
Total
Consumer
|
44,142
|
|
Ps.
|
504,545
|
|
|
|
|
|
|
|
Commercial
|
|
|
|
|
|
Performing
Loans
|
-
|
|
Ps.
|
-
|
|
Impaired
Loans
|
-
|
|
|
-
|
|
Total
Commercial
|
-
|
|
Ps.
|
-
|
|
|
|
|
|
|
|
Total
TDRs
|
44,142
|
|
Ps.
|
504,545
|
The following table
presents for, the financing receivables modified as troubled debt
restructurings within the previous 12 months and for which there
was a payment default during that period. We consider a TDR that
have subsequently defaulted if the borrower has failed to make
payments of either principal, interest or both for a period of 90
days or more from contractual due date.
F- 283
BANCO
HIPOTECARIO SA AND SUBSIDIARIES
NOTES
TO THE CONSOLIDATED FINANCIAL STATEMENTS
As of and for the twelve-month periods ended June 30, 2016, 2015
and 2014
(Expressed in thousands of Argentine pesos, except share data
and as otherwise indicated)
|
|
As of June 30,
|
||||||||
|
|
2016
|
|
2015
|
||||||
|
|
Number of contracts
|
|
Recorded investment
|
|
Number of contracts
|
|
Recorded investment
|
||
|
Consumer
|
|
|
|
|
|
|
|
|
|
|
Advances
|
8
|
|
Ps.
|
180
|
|
10
|
|
Ps.
|
197
|
|
Mortgage
Loans
|
100
|
|
|
2,203
|
|
25
|
|
|
783
|
|
Personal
Loans
|
1,176
|
|
|
26,913
|
|
1,116
|
|
|
21,602
|
|
Credit Card Loans
– BHSA
|
3,176
|
|
|
35,285
|
|
672
|
|
|
7,923
|
|
Credit card Loans
– Tarshop
|
5,574
|
|
|
36,315
|
|
5,146
|
|
|
26,253
|
|
Total
Consumer
|
10,034
|
|
Ps.
|
100,896
|
|
6,969
|
|
Ps.
|
56,758
|
|
|
|
|
|
|
|
|
|
|
|
|
Commercial
|
|
|
|
|
|
|
|
|
|
|
Performing
Loans
|
-
|
|
Ps.
|
-
|
|
-
|
|
Ps.
|
-
|
|
Impaired
Loans
|
-
|
|
|
-
|
|
-
|
|
|
-
|
|
Total
Commercial
|
-
|
|
Ps.
|
-
|
|
-
|
|
Ps.
|
-
|
|
|
|
|
|
|
|
|
|
|
|
|
Total
TDRs that subsequently defaulted
|
10,034
|
|
Ps.
|
100,896
|
|
6,969
|
|
Ps.
|
56,758
|
Allowance
for Credit Losses
Accounts receivable
balances are classified as uncollectible and written off from the
Consolidated Balance Sheet when 365 days past due and subsequently
recorded in memorandum accounts.
The activity in the
allowance for accounts receivables losses under U.S. GAAP for the
fiscal periods ended June 30, 2016 and 2015 was as
follows:
|
|
|
|||||||
|
|
Argentine Banking
GAAP
|
|
U.S.
GAAP
|
|
Adjustment
|
|||
|
June 30,
2015
|
Ps.
|
514,394
|
|
Ps.
|
734,935
|
|
Ps.
|
(220,541)
|
|
|
|
|
|
|
|
|
|
|
|
Variances
|
|
178,658
|
|
|
208,823
|
|
|
(30,165)
|
|
|
|
|
|
|
|
|
|
|
|
June 30,
2016
|
Ps.
|
693,052
|
|
Ps.
|
943,758
|
|
Ps.
|
(250,706)
|
s. Comprehensive income
ASC 220 establishes
standards for reporting and disclosure of comprehensive income and
its components (revenues, expenses, gains and losses) in the
financial statements. Comprehensive income is the total of net
income and other charges or credits to equity that are not the
result of transactions with owners.
The following
disclosure presented for the twelve-month periods ended June 30,
2016, 2015 and 2014, shows all periods in Argentine Banking GAAP
format reflecting U.S. GAAP income and comprehensive statement
adjustments.
F- 284
BANCO
HIPOTECARIO SA AND SUBSIDIARIES
NOTES
TO THE CONSOLIDATED FINANCIAL STATEMENTS
As of and for the twelve-month periods ended June 30, 2016, 2015
and 2014
(Expressed in thousands of Argentine pesos, except share data
and as otherwise indicated)
|
|
June
30,
|
|||||||
|
|
2016
|
|
2015
|
|
2014
|
|||
|
Income
Statement
|
|
|
|
|
|
|
|
|
|
|
|
|
|
|
|
|
|
|
|
Financial
income
|
Ps.
|
9,063,628
|
|
Ps.
|
5,559,510
|
|
Ps.
|
4,666,910
|
|
Financial
expenses
|
|
(5,612,760)
|
|
|
(3,241,306)
|
|
|
(2,399,052)
|
|
Net financial
income
|
Ps.
|
3,450,868
|
|
Ps.
|
2,318,204
|
|
Ps.
|
2,267,858
|
|
Provision for loan
losses
|
|
(386,657)
|
|
|
(405,973)
|
|
|
(333,025)
|
|
Income from
services
|
|
4,307,451
|
|
|
3,264,698
|
|
|
2,145,423
|
|
Expenses for
services
|
|
(1,089,690)
|
|
|
(768,870)
|
|
|
(682,638)
|
|
Administrative
expenses
|
|
(4,539,637)
|
|
|
(3,411,162)
|
|
|
(2,380,651)
|
|
Net income from
financial transactions
|
Ps.
|
1,742,335
|
|
Ps.
|
996,897
|
|
Ps.
|
1,016,967
|
|
Miscellaneous
income
|
|
546,543
|
|
|
317,530
|
|
|
188,928
|
|
Miscellaneous
expenses
|
|
(669,358)
|
|
|
(466,554)
|
|
|
(286,596)
|
|
Income before
income taxes and Non-controlling
interest....………………
|
Ps.
|
1,619,520
|
|
Ps.
|
847,873
|
|
Ps.
|
919,299
|
|
Income
taxes
|
|
(604,359)
|
|
|
(332,940)
|
|
|
(314,005)
|
|
Net
income under U.S. GAAP
|
Ps.
|
1,015,161
|
|
Ps.
|
514,933
|
|
Ps.
|
605,294
|
|
Less Net (Loss)
attributable to the Non-controlling
interest…………...
|
|
18,311
|
|
|
4,369
|
|
|
10,284
|
|
Net
income attributable Controlling interest in accordance with U.S.
GAAP……………………………..…
|
Ps
|
1,033,472
|
|
Ps
|
519,302
|
|
Ps
|
615,578
|
|
|
|
|
|
|
|
|
|
|
|
Other comprehensive
income (loss):
|
|
|
|
|
|
|
|
|
|
|
|
|
|
|
|
|
|
|
|
Unrealized gains
(loss) on securities
|
|
(30,031)
|
|
|
15,591
|
|
|
22,283
|
|
Other comprehensive income
(loss)
…………………………………
|
Ps
|
(30,031)
|
|
Ps
|
15,591
|
|
Ps
|
22,283
|
|
Comprehensive income
…..………..
|
Ps.
|
1,003,441
|
|
Ps.
|
534,893
|
|
Ps.
|
637,861
|
t. Risks and Uncertainties
All
transactions involving the purchase of foreign currency must be
settled through the single free exchange market (Mercado Único
Libre de Cambios, or “MULC”) where the Central Bank
supervises the purchase and sale of foreign currency. Under
Executive Branch Decree No. 260/2002, the Argentine government set
up an exchange market through which all foreign currency exchange
transactions are made. Such transactions are subject to the
regulations and requirements imposed by the Central Bank. Under
Communication “A” 3471, as amended, the Central Bank
established certain restrictions and requirements applicable to
foreign currency exchange transactions. If such restrictions and
requirements are not met, criminal penalties shall be
applied.
On
October 28, 2011, the Federal Administration of Public Revenues
(Administración Federal de Ingresos Públicos,
“AFIP”) established an Exchange Transactions Inquiry
Program (“Inquiry Program”) through which the entities
authorized by the Central Bank to deal in foreign exchange must
inquire and register through an IT system the total peso amount of
each exchange transaction at the moment it is closed. All foreign
exchange sale transactions, whether involving foreign currency or
banknotes, irrespective of their purpose or allocation, are subject
to this inquiry and registration system, which determines whether
Transactions are “Validated” or
“Inconsistent”.
Pursuant
to Communication “A” 5239, afterward replaced by
Communication “A” 5245, in the case of sales of foreign
exchange (foreign currency or banknotes) for the formation of
off-shore assets by residents without the obligation of
subsequently allocating it to specific purpose, entities authorized
to deal in foreign exchange may only allow transactions through the
MULC by those clients who have obtained the validation and who
comply with the rest of the requirements set forth in the
applicable foreign exchange regulations. Sales of foreign exchange
other than for the formation of off-shore assets by residents
without a specific purpose are also exempted from the Inquiry
Program, although, the financial entities must verify that the
other requirements established by the MULC are
accomplished.
F- 285
BANCO
HIPOTECARIO SA AND SUBSIDIARIES
NOTES
TO THE CONSOLIDATED FINANCIAL STATEMENTS
As of and for the twelve-month periods ended June 30, 2016, 2015
and 2014
(Expressed in thousands of Argentine pesos, except share data
and as otherwise indicated)
According
to Communication “A” 5264, as amended, in general terms
the access to the foreign exchange market for resident in order to
pay services, debts and profits to non-residents has no limits or
restrictions. The access to the MULC requires the filing of certain
documentation by residents evidencing the validity of transactions
for which the funds are purchase for its remittance abroad.
Communication “A” 5236, item 4.2. which regulated the
outflow of fund allowing residents to access to the MULC for the
formation of off-shore assets without a specific allocation by
residents has been suspended and, up to now, the Central Bank has
not issued any other measure or provisions in this
regard.
On
August 6, 2012, Resolution #3210 was replaced by Resolution #3356
enacted by AFIP. This resolution sets forth more restrictions for
the access to the foreign exchange market, in particular for the
outflow of funds made by residents. Both resolutions (3210 and
3356) are related with Communications “A” 5239
(currently abrogated) and 5245.
The
Argentine government may, in the future, impose additional controls
on the foreign exchange market and on capital flows from and into
Argentina, in response to capital flight or depreciation of the
Peso. These restrictions may have a negative effect on the economy
and on our business if imposed in an economic environment where
access to local capital is constrained.
u. U.S. GAAP estimates
Valuation reserves,
impairment charges and estimates of market values on assets and
step up bonds discounting, as established by the Bank for U.S. GAAP
purposes are subject to significant assumptions of future cash
flows and interest rates for discounting such cash flows. Losses on
the exchange of government and provincial bonds were significantly
affected by higher discount rates. Should the discount rates change
in future years, the carrying amounts and charges to income and
shareholders’ equity deficit will also change. In addition,
as estimates of future cash flows change, so too will the carrying
amounts which are dependent on such cash flows. It is possible that
changes to the carrying amounts of loans, investments and other
assets will be adjusted in the near term in amounts that are
material to the Bank’s financial position and results of
income.
v. Allowance for loan losses
Management believes
that the current level of allowance for loan losses recorded for
U.S. GAAP purposes are sufficient to cover incurred losses of the
Bank’s loan portfolio as of June 30, 2016 and 2015. Many
factors can affect the Bank’s estimates of allowance for loan
losses, including expected cash flows, volatility of default
probability, migrations and estimated loss severity. The process of
determining the level of the allowance for credit losses requires a
high degree of judgment. It is possible that others, given the same
information, may at any point in time reach different reasonable
conclusions. If market conditions and economic uncertainties exist,
it might result in higher credit losses and provision for credit
losses in future periods.
F- 286
BANCO
HIPOTECARIO SA AND SUBSIDIARIES
NOTES
TO THE CONSOLIDATED FINANCIAL STATEMENTS
As of and for the twelve-month periods ended June 30, 2016, 2015
and 2014
(Expressed in thousands of Argentine pesos, except share data
and as otherwise indicated)
35.
New authoritative pronouncements
During the
twelve-months ended June 30, 2016, the FASB has issued Accounting
Standards Updates. Those updates applicable for the Bank are
mentioned below:
ASU 2015-03
The
FASB issued in April 2015 the Accounting Standards Update No.
2015-03 “Interest—Imputation of Interest (Subtopic
835-30) — Simplifying the Presentation of Debt Issuance
Costs”. The Board is issuing this Update as part of its
initiative to reduce complexity in accounting standards (the
Simplification Initiative). The objective of the Simplification
Initiative is to identify, evaluate, and improve areas of U.S. GAAP
for which cost and complexity can be reduced while maintaining or
improving the usefulness of the information provided to users of
financial statements.
The
Board received feedback that having different balance sheet
presentation requirements for debt issuance costs and debt discount
and premium creates unnecessary complexity. Recognizing debt
issuance costs as a deferred charge (that is, an asset) also is
different from the guidance in IFRS, which requires that
transaction costs be deducted from the carrying value of the
financial liability and not recorded as separate assets.
Additionally, the requirement to recognize debt issuance costs as
deferred charges conflicts with the guidance in FASB Concepts
Statement No. 6, Elements of Financial Statements, which states
that debt issuance costs are similar to debt discounts and in
effect reduce the proceeds of borrowing, thereby increasing the
effective interest rate. Concepts Statement 6 further states that
debt issuance costs cannot be an asset because they provide no
future economic benefit.
To
simplify presentation of debt issuance costs, the amendments in
this Update require that debt issuance costs related to a
recognized debt liability be presented in the balance sheet as a
direct deduction from the carrying amount of that debt liability,
consistent with debt discounts. The recognition and measurement
guidance for debt issuance costs are not affected by the amendments
in this Update.
For
public business entities, the amendments in this Update are
effective for financial statements issued for fiscal years
beginning after December 15, 2015, and interim periods within those
fiscal years.
ASU 2015-15
In
August 2015, the FASB issued the Accounting Standards Update No.
2015-15 “Presentation and Subsequent Measurement of Debt
Issuance Costs Associated with Line-of-Credit Arrangements”.
The amendments in this Update provide guidance on accounting for
the costs on line-of-credit arrangements.
Given
the absence of authoritative guidance within Update 2015-03 for
debt issuance costs related to line-of-credit arrangements, the SEC
staff would not object to an entity deferring and presenting debt
issuance costs as an asset and subsequently amortizing the deferred
debt issuance costs ratably over the term of the line-of-credit
arrangement, regardless of whether there are any outstanding
borrowings on the line-of-credit arrangement.
The
impact of this ASU has not any significant effect in the U.S. GAAP
disclosures and financial information for the Bank.
ASU 2015-16
In
September 2015, FASB issued ASU 16 “Simplifying the
Accounting for Measurement-Period Adjustment”
F- 287
BANCO
HIPOTECARIO SA AND SUBSIDIARIES
NOTES
TO THE CONSOLIDATED FINANCIAL STATEMENTS
As of and for the twelve-month periods ended June 30, 2016, 2015
and 2014
(Expressed in thousands of Argentine pesos, except share data
and as otherwise indicated)
ASU 2016-01
In January 2016, the FASB issued
the Accounting Standards Update No. 2016-01 “Recognition and
Measurement of Financial Assets
and Financial Liabilities”.
The amendments in this Update: i) Require equity investments
(except those accounted for under the equity method of accounting
or those that
result in consolidation of the
investee) to be measured at fair value with changes in fair value
recognized in net income; ii) simplify the
impairment assessment of equity
investments without readily determinable fair values by requiring a
qualitative assessment to identify
impairment; iii) eliminate the
requirement for public business entities to disclose the method(s)
and significant assumptions used to
estimate the fair value that is
required to be disclosed for financial instruments measured at
amortized cost on the balance sheet; and
iv) require public business
entities to use the exit price notion when measuring the fair value
of financial instruments for disclosure
purposes; among other
changes.
For public business entities, the
amendments in this Update are effective for financial statements
issued for fiscal years beginning
after December 15, 2017, and
interim periods within those fiscal years.
The impact of this
Update has not any significant effect in the present U.S. GAAP
financial statements.
ASU 2016-02
Accounting Standard
Update 2016-02 “Leases (Topic 842)” was issued in
February 2016. The FASB is issuing this Update to increase
transparency and comparability among organizations by recognizing
lease assets and lease liabilities on the balance sheet and
disclosing key information about leasing arrangements. To meet that
objective, the FASB is amending the ASC and creating Topic 842,
Leases. The accounting applied by a lessor is largely unchanged
from that applied under previous GAAP.
For public business
entities, the amendments in this Update are effective for financial
statements issued for fiscal years beginning after December 15,
2018, and interim periods within those fiscal years.
The impact of this
Update has not any significant effect in the present U.S. GAAP
financial statements.
36.
BHN Inversión S.A.’s dividend distribution
On March 9, 2016
the Ordinary Shareholders' Meeting of BHN Sociedad de
Inversión S.A. approved the payment of cash dividends and / or
government securities for Ps 650,000 authorizing the Board to make
the distribution in the form and opportunity in the year 2016 sees
fit.
On March 30, 2016
BHN Sociedad de Inversión S.A. made a first payment of
dividends in government securities for Ps 330,000.
37.
BACS Banco de Crédito y Securitización S.A. -
Representations before the Central Bank to perform the activities
planned for a commercial bank of first grade
On October 20, 2015
the Extraordinary General Shareholders’ unanimously approved
to:
●
Delegate in the
Board of Directors
the broadest powers
to take all steps, events and presentations necessary for the
purposes of processing the license to operate as a commercial bank
of first grade to the Central Bank and also prepare, approve ,
manage and execute all documentation -whether public or private
instrument- that is required by the institution for the purpose of
the authorization, and
●
Authorize
the Board of Directors to delegate the powers mentioned in the
preceding point in one or more of its members or one or more of the
managers of the company
F- 288
BANCO
HIPOTECARIO SA AND SUBSIDIARIES
NOTES
TO THE CONSOLIDATED FINANCIAL STATEMENTS
As of and for the twelve-month periods ended June 30, 2016, 2015
and 2014
(Expressed in thousands of Argentine pesos, except share data
and as otherwise indicated)
38.
Supplementary services to the financial business
Pursuant to
Communication “A” 5700, the Argentine Central Bank
included changes in the rules on “Supplementary services to
the financial business and permitted activities”,
“Consolidated supervision” and “Minimum capitals
of financial institutions”.
As concerns the
scope of the supplementary services, it is allowed to hold
interests in the stock capital of companies engaged in the
development of two of the subject activities to the extent that, in
the opinion of the SEFyC, both activities are economically related
to each other and there are no legal inconsistencies that would
prevent them from being developed jointly.
The subject
activities include the issuance of credit, debit and similar cards.
This notwithstanding, provided that 25% of the total financing
amount as of the closing date of each month is not exceeded, loans
not subject to the credit card law may be extended to financial
services users, in which cases the provisions on “Interest
rates applicable to lending transactions” shall be complied
with.
On the other hand,
changes are introduced in the calculation of the regulatory capital
(responsabilidad patrimonial computable) to reflect the impact of
these amendments.
As a result of such
Communication, on March 16, 2015, Tarshop SA’s General
Extraordinary Shareholders’ Meeting approved an amendment to
its corporate purpose. According to such amendment, the company may
grant and market consumer loans and consumer credits and financing
for users of financial services pursuant to the Argentine Central
Bank’s rules and regulations, handle the collection of
utility bills, credits and similar items, render payroll and
supplier payment and revenue collection services.
In such regard, on
June 3, 2016, the Argentine Central Bank awarded the Company a
Provisional Authorization Code in the Register of Other
Non-Financial Credit Providers, and thus allowed it to start
granting consumer loans, in line with the amendment to the
corporate purpose recorded with the General Superintendency of
Corporations on January 8, 2016 under number 437, book 77 of
Corporations, and authorized by the Argentine Securities Commission
under Resolution No. 17,930 dated December 21, 2015.
39.
Subsequent events
Negotiable obligations
The following table
shows the amount, interest rate and maturity date of each series
issued after June 30, 2016:
F- 289
BANCO
HIPOTECARIO SA AND SUBSIDIARIES
NOTES
TO THE CONSOLIDATED FINANCIAL STATEMENTS
As of and for the twelve-month periods ended June 30, 2016, 2015
and 2014
(Expressed in thousands of Argentine pesos, except share data
and as otherwise indicated)
|
|
Issue
date
|
Maturity
date
|
Annual
interest rate
|
|
Banco
Hipotecario S.A.
|
|
|
|
|
Series XXXVIII (Ps.
145,200)
|
08/18/16
|
02/18/18
|
Badlar+300bp
|
|
Series XXXIX (Ps.
343,241)
|
08/18/16
|
08/18/19
|
Badlar+349bp
|
|
Series
XL (Ps. 6,078,320)
|
10/12/16
|
01/12/20
|
Badlar +
250bp
|
|
BACS
Banco de Crédito y Securitización S.A.
|
|
|
|
|
Series IX (Ps.
249,500)
|
07/27/16
|
07/27/18
|
Badlar
+345bp
|
|
|
|
|
|
|
Tarshop
S.A.
|
|
|
|
|
Class I (Ps.
204,033)
|
09/07/16
|
03/07/18
|
Badlar
+448bp
|
|
Class II (Ps.
67,360)
|
09/07/16
|
03/07/19
|
Badlar
+499bp
|
|
|
|
|
|
|
|
|
|
|
|
|
|
|
|
F- 290
NEW LIPSTICK LLC AND SUBSIDIARY
(A Limited Liability Company)
Table of Contents
|
|
Page
|
|
|
|
|
Consolidated
Financial Statements:
|
|
|
|
|
|
Independent
Auditors Report
|
F-292
|
|
|
|
|
Consolidated
Balance Sheets
As
of June 30, 2015 and 2014
|
F-293
|
|
|
|
|
Consolidated
Statements of Operations
For the
Years Ended June 30, 2015, 2014, and 2013
|
F-294
|
|
|
|
|
Consolidated
Statements of Changes in Members’ Deficit
For
the Years Ended June 30, 2015, 2014, and 2013
|
F-295
|
|
|
|
|
Consolidated
Statements of Cash Flows
For
the Years Ended June 30, 2015, 2014, and 2013
|
F-296
|
|
|
|
|
Consolidated Notes
to Financial Statements
June
30, 2015, 2014, and 2013
|
F-297
|
|
|
|
|
|
|
|
|
|
|
|
|
|
|
|
|
|
|
|
|
|
|
|
|
|
|
|
|
|
|
F- 291
INDEPENDENT AUDITORS REPORT
New Lipstick LLC and Subsidiary
We have audited the accompanying consolidated financial statements
of New Lipstick LLC and Subsidiary, which comprise the balance
sheets as of June 30, 2015 and 2014 the related statements of
operations, changes in members’ deficit and cash flows for
the years ended June 30, 2015, 2014 and 2013, and the related notes
to the consolidated financial statements.
Management’s Responsibility for the Consolidated Financial
Statements
Management is responsible for the preparation and fair presentation
of these consolidated financial statements in accordance with
accounting principles generally accepted in the United States of
America; this includes the design, implementation, and maintenance
of internal control relevant to the preparation and fair
presentation of financial statements that are free from material
misstatement, whether due to fraud or error.
Auditors’ Responsibility
Our responsibility is to express an opinion on these consolidated
financial statements based on our audits. We conducted our audits
in accordance with auditing standards generally accepted in the
United States of America. Those standards require that we plan and
perform the audit to obtain reasonable assurance about whether the
financial statements are free from material
misstatement.
An audit involves performing procedures to obtain audit evidence
about the amounts and disclosures in the consolidated financial
statements. The procedures selected depend on the auditors’
judgment, including the assessment of the risks of material
misstatement of the financial statements, whether due to fraud or
error. In making those risk assessments, the auditor considers
internal control relevant to the entity’s preparation and
fair presentation of the consolidated financial statements in order
to design audit procedures that are appropriate in the
circumstances, but not for the purpose of expressing an opinion on
the effectiveness of the entity’s internal control.
Accordingly, we express no such opinion. An audit also includes
evaluating the appropriateness of accounting policies used and the
reasonableness of significant accounting estimates made by
management, as well as evaluating the overall presentation of the
consolidated financial statements.
We believe that the audit evidence we have obtained is sufficient
and appropriate to provide a basis for our audit
opinion.
Opinion
In our opinion, the consolidated financial statements referred to
above present fairly, in all material respects, the financial
position of New Lipstick LLC and Subsidiary, as of June 30, 2015
and 2014, and the results of its operations and its cash flows for
the years ended June 30, 2015, 2014, and 2013, in accordance with
accounting principles generally accepted in the United States of
America.
/s/Marks Paneth
LLP
New York, NY
October 31, 2016
F- 292
|
NEW LIPSTICK LLC AND SUBSIDIARY
|
|||
|
(A LIMITED LIABILITY COMPANY)
|
|||
|
|
|
|
|
|
CONSOLIDATED BALANCE SHEETS
|
|||
|
AS OF JUNE 30,
|
|||
|
(Amounts in US dollars)
|
|||
|
|
|||
|
|
|
|
|
|
ASSETS
|
|||
|
|
|
|
|
|
|
|
|
|
|
|
2015
|
|
2014
|
|
|
|
|
|
|
Real
estate, net
|
$
140,469,010
|
|
$
142,358,747
|
|
Cash
and cash equivalents
|
1,075,395
|
|
851,726
|
|
Tenant
receivables, net of allowance for doubtful accounts of
|
|
|
|
|
$132,141
and $7,264 respectively
|
344,104
|
|
422,944
|
|
Prepaid
expenses and other assets
|
5,809,307
|
|
5,476,492
|
|
Due
from related party
|
125,029
|
|
120,274
|
|
Restricted
cash
|
3,477,967
|
|
6,155,597
|
|
Deferred
rent receivable
|
8,856,399
|
|
6,938,578
|
|
Lease
intangibles, net
|
26,533,839
|
|
30,012,973
|
|
Goodwill
|
5,422,615
|
|
5,422,615
|
|
|
|
|
|
|
Total
|
$
192,113,665
|
|
$
197,759,946
|
|
|
|
|
|
|
|
|
|
|
|
LIABILITIES AND MEMBERS' DEFICIT
|
|||
|
|
|
|
|
|
Liabilities:
|
|
|
|
|
Note
payable
|
$
113,201,357
|
|
$
113,201,357
|
|
Accrued
interest payable
|
316,216
|
|
313,950
|
|
Accounts
payable and accrued expenses
|
3,031,831
|
|
1,584,699
|
|
Due
to related parties
|
319,133
|
|
553,616
|
|
Deferred
revenue
|
918,800
|
|
619,885
|
|
Tenants’
security deposits
|
682,727
|
|
657,978
|
|
Deferred
ground rent payable
|
136,727,666
|
|
108,312,912
|
|
Lease
intangibles, net
|
42,365,499
|
|
45,279,291
|
|
|
|
|
|
|
Total
liabilities
|
297,563,229
|
|
270,523,688
|
|
|
|
|
|
|
Members'
deficit
|
(105,449,564)
|
|
(72,763,742)
|
|
|
|
|
|
|
Total
|
$
192,113,665
|
|
$
197,759,946
|
|
|
|
|
|
|
See
Notes to Consolidated Financial Statements
|
|
|
|
F- 293
|
|
|
|
|
|
(A LIMITED LIABILITY COMPANY)
|
|||||||
|
|
|
|
|
|
|||
|
CONSOLIDATED STATEMENTS OF OPERATIONS
|
|||||||
|
FOR THE YEARS ENDED JUNE 30,
|
|||||||
|
(Amounts in US dollars)
|
|||||||
|
|
|||||||
|
|
|
|
|
|
|
||
|
|
|
|
|
|
|
||
|
|
2015
|
|
2014
|
|
2013
|
||
|
Revenues
|
|
|
|
|
|
||
|
Base
rents
|
$
40,597,526
|
|
$
38,375,303
|
|
$
38,146,887
|
||
|
Tenant
reimbursements and escalations
|
6,903,479
|
|
5,427,358
|
|
5,354,160
|
||
|
Other
rental revenue
|
40,779
|
|
45,292
|
|
73,833
|
||
|
Other
revenue
|
1,622
|
|
-
|
|
-
|
||
|
Interest
income
|
-
|
|
-
|
|
625
|
||
|
|
|
|
|
|
|
||
|
Total
|
47,543,406
|
|
43,847,953
|
|
43,575,505
|
||
|
|
|
|
|
|
|
||
|
Expenses
|
|
|
|
|
|
||
|
Real
estate taxes
|
10,716,257
|
|
9,919,196
|
|
9,442,029
|
||
|
Utilities
|
2,927,214
|
|
2,598,340
|
|
2,511,198
|
||
|
Janitorial
|
2,056,750
|
|
2,157,449
|
|
2,054,086
|
||
|
Insurance
|
318,027
|
|
315,545
|
|
296,897
|
||
|
Repairs
and maintenance
|
2,262,799
|
|
1,445,342
|
|
1,332,208
|
||
|
Bad
debt expense
|
124,877
|
|
-
|
|
433,551
|
||
|
Security
|
1,047,372
|
|
912,362
|
|
846,602
|
||
|
General
and administrative
|
835,373
|
|
829,010
|
|
875,597
|
||
|
Management
fees
|
988,189
|
|
948,084
|
|
877,898
|
||
|
Elevator
|
311,875
|
|
286,013
|
|
174,475
|
||
|
HVAC
|
62,442
|
|
107,515
|
|
48,947
|
||
|
Tenant
reimbursable costs
|
154,557
|
|
122,139
|
|
159,564
|
||
|
Ground
rent
|
45,457,736
|
|
45,457,735
|
|
45,457,737
|
||
|
Interest
expense
|
4,786,205
|
|
4,789,913
|
|
4,843,275
|
||
|
Amortization
|
3,005,570
|
|
3,087,330
|
|
2,947,812
|
||
|
Depreciation
|
5,599,278
|
|
4,886,008
|
|
4,428,733
|
||
|
|
|
|
|
|
|
||
|
Total
|
80,654,521
|
|
77,861,981
|
|
76,730,609
|
||
|
|
|
|
|
|
|
||
|
Net
loss
|
$
(33,111,115)
|
|
$
(34,014,028)
|
|
$
(33,155,104)
|
||
|
|
|
|
|
|
|
||
See
Notes to Consolidated Financial Statements
F- 294
|
NEW LIPSTICK LLC AND SUBSIDIARY
|
|||||||
|
(A LIMITED LIABILITY COMPANY)
|
|||||||
|
|
|
|
|
||||
|
CONSOLIDATED STATEMENTS OF CHANGES IN MEMBERS' DEFICIT
|
|||||||
|
FOR THE YEARS ENDED JUNE 30,
|
|||||||
|
(Amounts in US dollars)
|
|||||||
|
|
|||||||
|
|
|
|
|
|
|
||
|
|
2015
|
|
2014
|
|
2013
|
||
|
|
|
|
|
|
|
||
|
Balance,
beginning of years
|
$
(72,763,742)
|
|
$
(43,679,661)
|
|
$
(20,096,088)
|
||
|
|
|
|
|
|
|
||
|
Contributions
from members
|
425,293
|
|
4,952,500
|
|
9,571,531
|
||
|
|
|
|
|
|
|
||
|
Distribution
to member
|
-
|
|
(22,553)
|
|
-
|
||
|
|
|
|
|
|
|
||
|
Net
loss
|
(33,111,115)
|
|
(34,014,028)
|
|
(33,155,104)
|
||
|
|
|
|
|
|
|
||
|
Balance,
end of years
|
$
(105,449,564)
|
|
$
(72,763,742)
|
|
$
(43,679,661)
|
||
|
|
|
|
|
|
|
||
|
|
|
|
|
|
|
||
F- 295
See
Notes to Consolidated Financial Statements
|
NEW LIPSTICK LLC AND SUBSIDIARY
|
||||||
|
(A LIMITED LIABILITY COMPANY)
|
||||||
|
CONSOLIDATED STATEMENTS OF CASH FLOWS
|
||||||
|
|
||||||
|
FOR THE YEARS ENDED JUNE 30,
|
||||||
|
(Amounts in US dollars)
|
||||||
|
|
||||||
|
|
|
|
|
|
|
|
|
|
|
2015
|
|
2014
|
|
2013
|
|
|
|
|
|
|
|
|
|
Operating
activities
|
|
|
|
|
|
|
|
Net
loss
|
|
$
(33,111,115)
|
|
$
(34,014,028)
|
|
$
(33,155,104)
|
|
Adjustments
to reconcile net loss to net cash
|
|
|
|
|
|
|
|
used
in operating activities:
|
|
|
|
|
|
|
|
Amortization
|
|
3,005,570
|
|
3,087,330
|
|
2,947,812
|
|
Depreciation
|
|
5,599,278
|
|
4,886,008
|
|
4,428,733
|
|
Bad
debt (recovery) expense
|
|
124,877
|
|
(3,827)
|
|
433,551
|
|
Deferred
rent
|
|
(1,917,821)
|
|
(1,929,668)
|
|
(1,972,066)
|
|
Below
market lease amortization
|
|
(2,475,983)
|
|
(2,821,032)
|
|
(3,287,160)
|
|
Above
market lease amortization
|
|
1,442,682
|
|
1,544,576
|
|
1,548,129
|
|
Above
market ground lease amortization
|
|
(437,809)
|
|
(437,809)
|
|
(437,808)
|
|
Deferred
ground rent
|
|
28,414,754
|
|
28,822,593
|
|
29,220,501
|
|
Changes
in operating assets and liabilities:
|
|
|
|
|
|
|
|
Restricted
cash
|
|
2,702,379
|
|
525,764
|
|
(2,616,256)
|
|
Due
from related party
|
|
(4,755)
|
|
-
|
|
4,000
|
|
Tenant
receivables
|
|
(46,037)
|
|
(86,094)
|
|
(78,989)
|
|
Prepaid
expenses and other assets
|
|
(332,815)
|
|
(340,620)
|
|
(233,930)
|
|
Accrued
interest payable
|
|
2,273
|
|
(3,019)
|
|
(3,332)
|
|
Accounts
payable and accrued expenses
|
|
349,380
|
|
33,811
|
|
(569,720)
|
|
Due
to related parties
|
|
(234,483)
|
|
208,304
|
|
34,445
|
|
Deferred
leasing costs
|
|
(994,677)
|
|
(1,526,938)
|
|
(795,940)
|
|
Unearned
revenue
|
|
298,915
|
|
310,488
|
|
51,876
|
|
Net
cash (used in) provided by operating activities
|
|
2,384,613
|
|
(1,744,161)
|
|
(4,481,258)
|
|
|
|
|
|
|
|
|
|
Investing
activities
|
|
|
|
|
|
|
|
Additions
to real estate
|
|
(2,586,237)
|
|
(3,700,979)
|
|
(4,934,785)
|
|
Net
cash used in investing activities
|
|
(2,586,237)
|
|
(3,700,979)
|
|
(4,934,785)
|
|
|
|
|
|
|
|
|
|
Financing
activities
|
|
|
|
|
|
|
|
Note
principal payments
|
|
-
|
|
(1,912)
|
|
(110,817)
|
|
Contributions
from members
|
|
425,293
|
|
4,952,500
|
|
9,571,531
|
|
Net
cash provided by financing activities
|
|
425,293
|
|
4,950,588
|
|
9,460,714
|
|
|
|
|
|
|
|
|
|
Net
(decrease) increase in cash and cash equivalents
|
|
223,669
|
|
(494,552)
|
|
44,671
|
|
|
|
|
|
|
|
|
|
Cash
and cash equivalents, beginning of years
|
|
851,726
|
|
1,346,278
|
|
1,301,607
|
|
|
|
|
|
|
|
|
|
Cash
and cash equivalents, end of years
|
|
$
1,075,395
|
|
$
851,726
|
|
$
1,346,278
|
|
|
|
|
|
|
|
|
|
Supplemental
disclosure of cash flow information:
|
|
|
|
|
|
|
|
Interest
paid
|
|
$
4,783,939
|
|
$
4,792,932
|
|
$
4,846,607
|
|
|
|
|
|
|
|
|
|
Schedule
of Noncash Investing Activities
|
|
|
|
|
|
|
|
Real
estate additions were financed through accounts
payable
|
|
$
1,691,693
|
|
$
568,390
|
|
$
507,133
|
|
|
|
|
|
|
|
|
|
Deferred
leasing costs additions were financed through accounts
payable
|
|
$
90,308
|
|
$
115,867
|
|
$
-
|
|
|
|
|
|
|
|
|
|
Schedule
of Noncash Financing Activities
|
|
|
|
|
|
|
|
Lobby
exhibit acquired in the year ended June 30, 2013, included in
real
|
|
|
|
|
|
|
|
estate,
and transferred to a 49% member of the Company as a
distribution.
|
|
$
-
|
|
$
22,553
|
|
$
-
|
|
See
Notes to Consolidated Financial Statements
|
|
|
|
|
|
|
F- 296
New Lipstick LLC and Subsidiary
(A Limited Liability Company)
Notes to Consolidated Financial Statements
June
30, 2015, 2014 and 2013
(Amounts in US dollars)
NOTE
1:
BUSINESS
Formation
and Property Description
New Lipstick LLC
(the "Company"), was organized as a Delaware limited liability
company and commenced operations on November 3, 2010. The Company
was formed among IRSA International, LLC ("IRSA"), Marciano
Investment Group, LLC ("Marciano"), Avi Chicouri ("AVI"), Par
Holdings, LLC ("PAR"), and Armenonville S.A. ("Armenonville"),
collectively (the "Members"). On December 15, 2010, Armenonville
assigned 100 percent of its membership interest to Lomas Urbanas
S.A. IRSA is a wholly-owned subsidiary of TYRUS S.A. ("TYRUS"), a
wholly-owned subsidiary of IRSA Inversiones y Representaciones
Sociedad Anonima, a company whose shares are listed on the Buenos
Aires and New York Stock Exchanges. The Company was formed in order
to acquire 100% interest in Metropolitan 885 Third Avenue Leasehold
LLC ("Metropolitan"), its wholly-owned subsidiary, and to provide
management services to Metropolitan.
Metropolitan was
organized for the purpose of acquiring and operating a 34 story
Class A office tower commonly known as the Lipstick Building
located at 885 Third Avenue in New York (the "Property").
Metropolitan leased the land which contains approximately 26,135
square feet. The Property was acquired on July 9, 2007 and contains
approximately 635,800 square feet of rentable space, consisting of
retail and office spaces.
On November 16,
2010 (the "Petition Date"), Metropolitan filed a voluntary
pre-packaged plan of reorganization under Chapter 11 of Title 11 of
the United States Bankruptcy Code (the "Chapter 11") in the
Southern District of New York (the "Bankruptcy Court") including a
disclosure statement and plan of reorganization (the "Plan"). The
Plan provided for, among other things, the extinguishment of 100%
of the shares of Metropolitan and the issuance of the membership
interest to the Company. The Plan was approved by Metropolitan's
members and the Bankruptcy Court approved the Plan on December 22,
2010 with an effective date of December 30, 2010 (the "Effective
Date").
Metropolitan
accounted for the reorganization using "fresh start accounting"
effective December 30, 2010. Accordingly, the forgiveness of debt
was reflected in the predecessor entity's final statement of
operations and all assets and liabilities were restated to reflect
their reorganization value.
The Company
operates under the guidelines of an Operating Agreement (the
"Agreement") entered into by the Members on November 15, 2010. The
manager of the Company is Lipstick Management, LLC
(“LM”), a company affiliated to IRSA.
The Agreement calls
for Class A and Class B Members. Class A Members are IRSA,
Marciano, and Armenonville and Class B Members are AVI and
PAR.
Class B Membership
interests of any Class B Member shall be automatically converted,
in whole and not in part, into an equal number of Class A
Membership interests on the earlier to occur of the date on which
LM certifies that all unreturned additional Class A capital
contributions and all unreturned Class A capital contributions have
been reduced to zero.
F- 297
New Lipstick LLC and Subsidiary
(A Limited Liability Company)
Notes to Consolidated Financial Statements
June
30, 2015, 2014 and 2013
(Amounts in US dollars)
NOTE
1:
BUSINESS
(CONTINUED)
Formation
and Property Description (continued)
Any Class A Member,
as defined in the Agreement, may transfer, directly or indirectly,
any or all of its percentage interest as a Member in the Company to
an unaffiliated third party, but the offering Member must first
offer the Right of First Offer ("ROFO") to each of the Class A
Members by written notice specifying the cash price and the other
terms and conditions of the offer. Upon receipt of the ROFO notice,
each of the offeree members has the right, exercisable in ten (10)
days, to accept or decline the offer.
The Company shall
continue perpetually until dissolution, liquidation or
termination.
The liability of
the members of the Company is limited to the members´ total
contribution, plus any amounts guaranteed by the
members.
The Company has
adopted a fiscal year end of June 30.
The terms of the
Agreement provide for initial capital contributions and percentage
interests as follows:
|
|
Percentage
of
Ownership
|
|
Initial
Capital Contributions
|
|
IRSA International,
LLC
|
49.00
|
|
$15,417,925
|
|
Marciano Investment
Group, LLC
|
42.00
|
|
13,215,365
|
|
Lomas Urbanas
S.A.
|
2.27
|
|
714,259
|
|
Avi
Chicouri
|
3.07
|
|
-
|
|
Par Holdings,
LLC
|
3.66
|
|
-
|
|
Total
|
100.00
|
|
$29,347,549
|
In accordance with
the Agreement, the Members may be required to make additional
capital contributions which are reasonably related to the
operations and/or leasing of the Property and its activities. The
Members contributed $ 425,293, $4,952,500, and $9,571,531 for the
years ended June 30, 2015, 2014, and 2013,
respectively.
Distributions
Distribution of
capital will be made to the Member at the times, and in aggregate
amounts determined by the Board of Directors of the Company.
Distributions amounted to $22,553 for the year ended June 30, 2014.
There were no distributions for the years ended June 30, 2015 and
2013.
Allocation
of Profit and Losses
The Company´s
profits and losses are allocated to the Members.
F- 298
New Lipstick LLC and Subsidiary
(A Limited Liability Company)
Notes to Consolidated Financial Statements
June
30, 2015, 2014 and 2013
(Amounts in US dollars)
NOTE
2:
SUMMARY OF SIGNIFICANT ACCOUNTING POLICIES
Principles
of Consolidation
The accompanying
consolidated financial statements of the Company include the
accounts of New Lipstick LLC and its wholly-owned subsidiary
Metropolitan.
All
significant intercompany accounts and
transactions have been eliminated.
Basis
of Accounting
The consolidated
financial statements have been prepared in accordance with
accounting principles generally accepted in the United States of
America ("GAAP").
Use
of Estimates
Management is
required to use estimates and assumptions in preparing financial
statements in conformity with GAAP. Those estimates and assumptions
affect the reported amounts of assets and liabilities, the
disclosure of contingent assets and liabilities, and the reported
revenues and expenses. Accordingly, actual results could differ
from those estimates.
Real
Estate
Real estate
consists of building, building improvements and tenant improvements
and is stated at cost. Building and improvements are depreciated
over 39 years. Tenant improvements are depreciated over the shorter
of the estimated useful life of the asset or the terms of the
respective leases.
Ordinary repairs
and maintenance are expensed as incurred; major replacements and
betterments are capitalized to building improvements and
depreciated over their estimated useful lives.
The Company reviews
its long-lived assets and certain identifiable intangibles for
impairment whenever events or changes in circumstances indicate
that the carrying amount of an asset may not be recoverable.
Recoverability of assets to be held and used is determined by a
comparison of the carrying amount of an asset to future net
undiscounted cash flows expected to be generated by the assets. If
the carrying value of the assets exceeds such cash flows, the
assets are considered impaired. The impairment charge to be
recognized is measured by the amount by which the carrying amount
of the assets exceeds their estimated fair value. No impairment was
recorded for the years ended June 30, 2015 and 2014.
Cash
and Cash Equivalents
The Company
considers all highly liquid investments with maturities of three
months or less upon acquisition to be cash
equivalents.
Concentration
of Credit Risk
Financial
instruments that potentially subject the Company to concentration
of credit risk consist of cash and cash equivalent accounts in
financial institutions. The Company maintains its cash balances at
two financial institutions. At times, such balances may be in
excess of the Federal Deposit Insurance Company (FDIC) insurance
limit. According to the FDIC insurance limit, deposits held in
noninterest-bearing transaction accounts are aggregated with any
interest-bearing deposits the Company may hold in the same
ownership category, and the combined total insured is up to at
least $250,000. As of June 30, 2015 and 2014, these balances
at one of the institutions, including tenant security and escrow
amounts, were in excess of federally insurable limits by
approximately $3,985,000 and $6,521,000, respectively.
F- 299
New Lipstick LLC and Subsidiary
(A Limited Liability Company)
Notes to Consolidated Financial Statements
June
30, 2015, 2014 and 2013
(Amounts in US dollars)
NOTE
2:
SUMMARY OF SIGNIFICANT ACCOUNTING POLICIES (CONTINUED)
Restricted
Cash
Restricted cash
represents amounts held in escrow, as required by the lender, to be
used for real estate taxes, insurance and other qualified
expenditures, as well as tenant security deposits.
Tenant
Receivables
The Company carries
its tenant receivables at the amount due pursuant to lease
agreements but uncollected at period end, less an allowance for
doubtful accounts. The Company evaluates its receivables and
establishes an allowance for doubtful accounts, based on a history
of past write-offs, collections and current
conditions.
Revenue
Recognition
The Company
recognizes base rent on a straight-line basis over the terms of the
respective leases. Deferred rent receivable represents the amount
by which straight-line rental revenue exceeded rents currently
billed in accordance with the lease agreements.
Capitalized below
market lease values are amortized as an increase to base rents (see
Note 4).
Capitalized above
market lease values are amortized as a decrease to base rents (see
Note 4).
The Company also
receives reimbursements from tenants for certain costs as provided
for in the lease agreements. These costs include real estate taxes,
utilities, insurance, common area maintenance and other recoverable
costs in excess of a base year amount. The reimbursements are
recognized when the tenants are billed.
Deferred income
represents rent collected in advance of being due.
Deferred
Ground Rents
Ground rent expense
is accounted for on a straight-line basis over the non-cancelable
terms of the ground leases. All future minimum increases in the
non-cancelable ground rents consist of either 2.5% or 3% annual
increases through May 1, 2068. This has resulted in deferred ground
rent payable in the amount of $136,727,666 and $108,312,912 as of
June 30, 2015 and 2014, respectively (see Note 6).
Lease
Intangibles
Leasing costs and
commissions incurred in connection with leasing activities are
capitalized and amortized on a straight-line basis over the lives
of the respective leases. Unamortized deferred leasing costs are
charged to amortization expense upon early termination of the
lease.
Above and below
market leases and above market ground lease values were recorded on
the Property's reorganization date based on the present value
(using an interest rate which reflected the risk associated with
the leases acquired) of the difference between (i) the contractual
amounts to be paid pursuant to the in-place leases and ground
lease, and (ii) management's estimate of fair market lease rates
for the corresponding in-place leases and ground lease, measured
over a period equal to the remaining non-cancelable term of the
leases.
F- 300
New Lipstick LLC and Subsidiary
(A Limited Liability Company)
Notes to Consolidated Financial Statements
June
30, 2015, 2014 and 2013
(Amounts in US dollars)
NOTE
2:
SUMMARY OF SIGNIFICANT ACCOUNTING POLICIES (CONTINUED)
Lease
Intangibles (continued)
Above market lease
values are capitalized as an asset and amortized as a decrease to
rental income over the remaining terms of the respective leases.
The above market ground lease value is capitalized as a liability
and amortized to ground rent expense over the remaining term of the
ground lease. Below market lease values are capitalized as a
liability and amortized as an increase to rental income over the
remaining terms of the respective leases.
The aggregate value
of in-place leases were measured based on the difference between
(i) the Property valued with existing in-place leases adjusted to
market rental rates, and (ii) the Property valued as if vacant,
based upon management's estimates. Factors considered by management
in their analysis included an estimate of carrying costs during the
expected lease-up periods considering current market conditions and
costs to execute similar leases. In estimating carrying costs,
management included real estate taxes, insurance and other
operating expenses and estimates of lost rentals at market rates
during the expected lease-up periods, which primarily were a year.
Management also estimated costs to execute similar leases including
leasing commissions, legal and other related expenses.
The value of
in-place leases are amortized to expense over the initial term of
the respective leases. As of June 30, 2015, the remaining terms
were ranging from three months to ten years.
Income
Taxes
No provision for
income taxes is necessary in the accompanying consolidated
financial statements because the Company is a disregarded entity
for federal and state income tax purposes. Income or loss of the
Company is includible in the separate income tax returns of the
Members. Prior to the effective date of reorganization on December
30, 2010, the Company was treated as a partnership for federal and
state income tax purposes. The Company performed a review for
uncertainty in income tax positions in accordance with
authoritative guidance. As of June 30, 2015, the Company does not
believe it has any uncertain tax positions that would qualify for
either recognition or disclosure in the consolidated financial
statements. The Company is no longer subject to federal or state
and local income tax examinations by tax authorities for tax years
ending before December 31, 2011. Management continually evaluates
expiring statutes of limitations, audits, proposed settlements,
changes in tax laws and new authoritative rulings.
The Company´s
income tax returns for its tax years commencing January 1, 2009,
through December 30, 2010, have been selected by the New York State
Department of Taxation and Finance for audit. Such audit is in its
preliminary stage. At this time, the Company has not been advised
of any proposed changes to its New York State income tax returns
filed for the tax years January 1, 2009 through December 30,
2010.
F- 301
New Lipstick LLC and Subsidiary
(A Limited Liability Company)
Notes to Consolidated Financial Statements
June
30, 2015, 2014 and 2013
(Amounts in US dollars)
NOTE
2:
SUMMARY OF SIGNIFICANT ACCOUNTING POLICIES (CONTINUED)
Goodwill
Goodwill represents
the excess of the cost of the December 30, 2010 acquisition of
Metropolitan over the net of the amounts assigned to assets
acquired, including identifiable intangible assets, and liabilities
assumed. In accordance with GAAP goodwill is not amortized but is
subject to annual impairment tests. Annual impairment tests are
performed by either comparing a “reporting units” (in
the Company’s case, the Company as a whole) estimated fair
value to its carrying amount or by doing a qualitative assessment
of a reporting units fair value from the last quantitative
assessment to determine if there is a potential
impairment.
A qualitative
assessment may be done when the results of the previous
quantitative test indicated the reporting unit’s estimated
fair value was significantly in excess of the carrying value of its
net assets and we do not believe there have been significant
changes in the reporting unit’s operations that would
significantly decrease its estimated fair value or significantly
increase its net assets. Management has selected the end of the
Company’s fiscal year as the date on which to either perform
its annual impairment tests for goodwill or make the determination
as to whether qualitative factors render it unnecessary. As of June
30, 2015 and 2014, the date of the impairment tests, no impairment
of goodwill was identified.
Reclassifications
Certain prior year
balances have been reclassified to conform to the current year
consolidated financial statement presentation.
Subsequent
Events
The Company has
evaluated for potential recognition and disclosure, events
subsequent to the date of the balance sheet through October 26,
2015, the date the consolidated financial statements were available
to be issued.
NOTE
3:
REAL ESTATE
At
June 30, real estate consists of the following:
|
|
2015
|
2014
|
|
Building
and improvements
|
$144,892,369
|
$144,879,174
|
|
Tenant
improvements
|
16,334,789
|
12,638,444
|
|
|
161,227,158
|
157,517,618
|
|
Less:
accumulated depreciation
|
(20,758,148)
|
(15,158,871)
|
|
Total
|
$140,469,010
|
$142,358,747
|
Depreciation
expense amounted to $5,599,278 and $4,886,008, and $4,428,733 for
the years ended June 30, 2015, 2014, and 2013,
respectively.
.
F- 302
New Lipstick LLC and Subsidiary
(A Limited Liability Company)
Notes to Consolidated Financial Statements
June
30, 2015, 2014 and 2013
(Amounts in US dollars)
NOTE
4:
LEASE INTANGIBLES
Lease intangibles
and the value of assumed lease obligations at June 30, 2015, were
as follows:
|
|
Leases
In-place
|
Leasing
Costs
|
Above
Market
Leases
|
Total
|
Below
Market
Leases
|
Above Market
Ground
Leases
|
Total
|
|
Cost
|
$27,149,892
|
$4,111,694
|
$15,316,749
|
$46,578,335
|
$30,470,806
|
$29,041,332
|
$59,512,138
|
|
Less:
accumulated
Amortization
|
(12,088,790)
|
(1,083,075)
|
(6,872,631)
|
(20,044,496)
|
(15,176,499)
|
(1,970,140)
|
(17,146,639)
|
|
Totals
|
$15,061,102
|
$3,028,619
|
$8,444,118
|
$26,533,839
|
$
15,294,307
|
$27,071,192
|
$42,365,499
|
Lease intangibles
and the value of assumed lease obligations at June 30, 2014 were as
follows:
|
|
Leases
In-place
|
Leasing
Costs
|
Above
Market
Leases
|
Total
|
Below
Market
Leases
|
Above Market
Ground
Leases
|
Total
|
|
Cost
|
$27,149,892
|
$ 3,142,576
|
$15,316,749
|
$45,609,217
|
$30,470,806
|
$29,041,332
|
$59,512,138
|
|
Less:
accumulated
Amortization
|
(9,520,879)
|
(645,416)
|
(5,429,949)
|
(15,596,244)
|
(12,700,516)
|
(1,532,331)
|
(14,232,847)
|
|
Totals
|
$17,629,013
|
$2,497,160
|
$9,886,800
|
$30,012,973
|
$17,770,290
|
$27,509,001
|
$45,279,291
|
The aggregate
amortization of leases in-place and leasing costs included in
amortization expense for the years ended June 30, 2015, 2014, and
2013 were $3,005,570, $3,087,330, and $2,947,812,
respectively.
The aggregate
amortization of above market ground leases included as a reduction
of ground rent expense for the years ended June 30, 2015, 2014, and
2013 were $437,809, $437,809, and $437,808,
respectively.
The aggregate
amortization of above market leases included as a reduction of base
rental income for the years ended June 30, 2015, 2014, and 2013
were $1,442,682, $1,544,576, and $1,548,129,
respectively.
The aggregate
amortization of below market leases included in base rental income
for the years ended June 30, 2015, 2014, and 2013 were $2,475,983,
$2,821,032, and $3,287,160, respectively.
The estimated
amortization of lease intangibles for each of the five years
subsequent to June 30, 2015 and thereafter is as
follows:
F- 303
New Lipstick LLC and Subsidiary
(A Limited Liability Company)
Notes to Consolidated Financial Statements
June
30, 2015, 2014 and 2013
(Amounts in US dollars)
NOTE
4:
LEASE INTANGIBLES (CONTINUED)
|
|
Leases
In-place
|
Leasing
Costs
|
Above
Market Leases
|
Total
|
Below
Market Leases
|
Above
Market Ground Leases
|
Total
|
|
|
|
|
|
|
|
|
|
|
2016
|
$
2,541,147
|
$448,938
|
$
1,407,364
|
$
4,397,449
|
$
2,463,176
|
$437,809
|
$2,900,985
|
|
2017
|
2,540,843
|
380,183
|
1,407,364
|
4,328,390
|
2,459,981
|
437,809
|
2,897,790
|
|
2018
|
2,483,557
|
278,611
|
1,407,364
|
4,169,532
|
2,387,551
|
437,809
|
2,825,360
|
|
2019
|
2,464,461
|
260,308
|
1,407,364
|
4,132,133
|
2,363,408
|
437,809
|
2,801,217
|
|
2020
|
2,462,742
|
213,759
|
1,407,364
|
4,083,865
|
2,356,387
|
437,809
|
2,794,196
|
|
Thereafter
|
2,568,352
|
1,446,820
|
1,407,298
|
5,422,470
|
3,263,804
|
24,882,147
|
28,145,951
|
|
Totals
|
$
15,061,102
|
$3,028,619
|
$
8,444,118
|
$26,533,839
|
$
15,294,307
|
$27,071,192
|
$42,365,499
|
NOTE
5:
NOTE PAYABLE
On December 30,
2010, Metropolitan’s existing note agreements with Royal Bank
of Canada (the “Lender”) were amended and restated. The
outstanding balance of the Amended Note was $115,000,000. The
Amended Note bears interest at (i) the London InterBank Offered
Rate ("LIBOR") plus 400 basis points, or (ii) Prime Rate plus Prime
Rate Margin, if converted into a Prime Rate Loan. The Amended Note
provides for a maximum interest rate of 5.25% through February 29,
2012 and 6.25% from March 1, 2012 through August 31, 2015 and
matures on August 1, 2017. The interest rate was 4.18% at June 30,
2015. Interest expense amounted to $4,786,205, $4,789,913, and
$4,843,275 for the years ended June 30, 2015, 2014, and 2013,
respectively.
Pursuant to a cash
management agreement with the Lender, all rents collected are
required to be deposited in a clearing account and all funds are
disbursed in accordance with the Loan agreement, including the
funding of all reserve accounts. In addition, after payment of debt
service, operating expenses and other expenses, as defined, forty
percent (40%) of all the remaining cash flow in the cash management
account is applied to the outstanding principal balance of the loan
on a monthly basis. As of June 30, 2015 and 2014, the outstanding
principal balance of the Amended Note is $113,201,357 and
$113,201,357, respectively.
The Amended Note is
collateralized by the Property including all related facilities,
amenities, fixtures and personal property owned by the
borrower.
The Company pledged
a first priority security interest in the Company’s
membership interest in Metropolitan to the Lender as collateral
security for the Amended Note.
The Property was
erected on a 26,135 square foot parcel of land (the "Site Area") of
which 20,635 square feet is subject to a ground lease (the "Ground
Lease") and an adjacent lot containing approximately 5,500 square
feet ("Lot A") subject to a ground sub-sublease (the "Ground
Sub-sublease").
F- 304
New Lipstick LLC and Subsidiary
(A Limited Liability Company)
Notes to Consolidated Financial Statements
June
30, 2015, 2014 and 2013
(Amounts in US dollars)
NOTE
6:
GROUND
LEASE (CONTINUED)
The Ground Lease
matures on the earlier of (i) April 30, 2077, (ii) the date of
termination of the Ground Sub-sublease term or (iii) a date if
sooner terminated. The Ground Lease provides for monthly ground
rent of approximately $925,000 through April 30, 2012, $1,321,000
through April 30, 2013, and provides for annual increases of 2.5%
beginning on May 1, 2013 through April 30, 2020.
On May 1, 2020, May
1, 2038 and every ten years thereafter through May 1, 2068,
(“Adjustment Years”) ground rent shall be adjusted to
be the greater of (a) 1.03 times the base rent payable during the
lease year immediately preceding the said Adjustment Year or (b) 7%
of the fair market value of the land.
Monthly ground rent
shall increase 3% annually for each lease year subsequent to the
Adjustment Year. The Ground Sub-sublease is subject to a ground
sublease and a prime lease. The ground sublease expires on April
29, 2080 (the "Ground Sublease"), and the prime lease matures on
April 30, 2080 (the "Prime Lease"). The Ground Sub-sublease matures
on the earlier of (i) April 30, 2077, (ii) the expiration or
earlier termination of the Prime Lease or (iii) the expiration or
earlier termination date of the Ground Sublease, except for reason
of default by the sublandlord as subtenant under the Ground
Sublease or the sublandlord as subtenant under the Prime Lease
provided that the lessees are not in default under the Ground
Sub-sublease or the Ground Sublease.
The Ground
Sub-sublease provides for monthly ground rent of $58,000 through
April 30, 2010, and approximately $63,000 beginning on May 1, 2010
through April 30, 2020. On May 1, 2020, May 1, 2040 and May 1,
2060, ground rent shall be adjusted to 8% of the fair market value
of Lot A, as defined.
For the year ended
June 30, 2015, Ground Lease and Ground Sub-sublease expense
amounted to $45,136,545 and $759,000, respectively, after giving
effect to straight-line rent adjustments of $28,414,754 and $0,
respectively. For the year ended June 30, 2014, Ground Lease and
Ground Sub-sublease expense amounted to $45,136,544 and $759,000,
respectively, after giving effect to straight-line rent adjustments
of $28,822,593 and $0, respectively. For the year ended June 30,
2013, Ground Lease and Ground Sub-sublease expenses amounted to
$45,136,545 and $759,000, respectively, after giving effect to
straight-line rent adjustments of $29,220,501 and $0,
respectively.
The Ground Lease
also provides the Company with an option to purchase the land (the
"Purchase Option"). The Purchase Option is exercisable on April 30,
2020, April 30, 2037 and on the last day of every tenth year
thereafter (the "Purchase Date"). The Purchase Price, as defined in
the Ground Lease, shall be the amount which together with all
ground rent paid by the Company on or before the applicable
Purchase Date yields an internal rate of return ("IRR") that equals
the Target IRR in respect to the applicable Purchase Date as
follows:
F- 305
New Lipstick LLC and Subsidiary
(A Limited Liability Company)
Notes to Consolidated Financial Statements
June
30, 2015, 2014 and 2013
(Amounts in US dollars)
NOTE
6:
GROUND
LEASE (CONTINUED)
|
Purchase Date
|
Target IRR
|
|
|
|
|
April
30, 2020
|
7.47%
|
|
April
30, 2037
|
7.67%
|
|
April
30, 2047
|
7.92%
|
|
April
30, 2057
|
8.17%
|
|
April
30, 2067
|
8.42%
|
|
April
30, 2077
|
8.67%
|
In the event the
Purchase Option is exercised on April 30, 2020, the Company shall
pay a purchase price of approximately $521 million which is based
upon an agreed land value of $317 million in July 2007, according
to a Target IRR of 7.47%. The Ground Lease also provides for an
option to demolish the Property ("Demolition Option") during the
period beginning on May 1, 2055, and ending on April 30, 2072 (the
"Demolition Period"). The Ground Lease lessor has the option to
cause the Company to purchase the Property ("Put Option") at a then
Put Price, as defined. The Put Option is exercisable during the
period subsequent to the Demolition Option and prior to April 30,
2072.
Future minimum
annual ground rents due before giving effect to the fair market
value adjustments which are not determinable at the present time
are as follows for the five years subsequent to June 30, 2015, and
thereafter:
|
|
Ground
Lease
|
|
Ground
Sub-Sublease
|
|
Total
|
|
|
|
|
|
|
|
|
2016
|
$
17,139,836
|
|
$
759,000
|
|
$
17,898,836
|
|
2017
|
17,568,332
|
|
759,000
|
|
18,327,332
|
|
2018
|
18,007,540
|
|
759,000
|
|
18,766,540
|
|
2019
|
18,457,729
|
|
759,000
|
|
19,216,729
|
|
2020
|
18,934,872
|
|
632,500
|
|
19,567,372
|
|
Thereafter
|
2,837,562,375
|
|
-
|
|
2,837,562,375
|
|
Total
|
$
2,927,670,684
|
|
$
3,668,500
|
|
$
2,931,339,184
|
F- 306
New Lipstick LLC and Subsidiary
(A Limited Liability Company)
Notes to Consolidated Financial Statements
June
30, 2015, 2014 and 2013
(Amounts in US dollars)
NOTE
7:
TENANT LEASES
The Company leases
space in the Property to tenants under long-term noncancelable
operating leases.
Future minimum
annual base rents due from noncancelable operating leases in each
of the five years subsequent to June 30, 2015 and thereafter are as
follows:
|
2016
|
$
39,207,929
|
|
2017
|
40,626,201
|
|
2018
|
38,220,542
|
|
2019
|
37,075,235
|
|
2020
|
36,531,739
|
|
Thereafter
|
59,314,354
|
|
Total
|
$
250,976,000
|
For the year ended
June 30, 2015, 2014, and 2013, approximately 71%, 75%, and 77%,
respectively, of the Company's base rent before amortization of
above and below market bases was from one law firm tenant. For the
year ended June 30, 2015, the approximate rental revenue from the
one law firm tenant amounted to $27,675,000 of which $0 amounts
remain outstanding. For the year ended June 30, 2014, the
approximate rental revenue from the one law firm tenant amounted to
$27,200,000 of which $0 amounts remain outstanding. For the year
ended June 30, 2013, the approximate rental revenue from the one
law firm tenant amounted to $26,900,000 of which $0 amounts
remained outstanding. Law firms accounted for approximately 79%,
83%, and 82% of the Property’s total base rent for the years
ended June 30, 2015, 2014, and 2013, respectively.
At June 30, 2015,
2014, and 2013, the Property was approximately 92%, 89%, and 86%
leased, respectively.
NOTE
8:
RELATED
PARTY TRANSACTIONS
On April 20, 2011,
Lipstick Management LLC (“LM”), an affiliate of the
Company, entered into an agreement with the Company’s lender
which provides that the Company would be directly responsible for
certain fees that are payable to Herald Square Properties LLC
(“HSP”). HSP is a 49% owner in LM. LM and the Company
are affiliated by common ownership. These fees are based on a
consulting agreement between LM and HSP which provides a monthly
fee of $12,000. As of January 1, 2013, the Company renewed the
contract with HSP which provides a monthly fee of $22,000. As of
January 1, 2014, the parties agreed to extend the agreement for one
year. The parties have the right to terminate this agreement at any
time upon thirty (30) days written notice served to the other
party. The total management consulting fee for the year ended June
30, 2015, 2014, and 2013, included in management fees in the
accompanying statement of operations, amounted to $264,000,
$264,000, and $204,000, respectively.
F- 307
New Lipstick LLC and Subsidiary
(A Limited Liability Company)
Notes to Consolidated Financial Statements
June
30, 2015, 2014 and 2013
(Amounts in US dollars)
NOTE
8:
RELATED
PARTY TRANSACTIONS (CONTINUED)
On May 3, 2011, the
Company entered into an asset management agreement with LM. The
Company is charged an asset management fee of 1% of its
consolidated gross revenues. Asset management fees incurred to LM
amounted to $449,189 for the year ended June 30, 2015, $409,084 for
the year ended June 30, 2014, and $398,898 for the year ended June
30, 2013, of which $38,280, $272,763, and $63,826 were unpaid at
June 30, 2015, 2014, and 2013, respectively, and is included in due
to related party in the accompanying balance sheet. Asset
management fees are included in management fees in the accompanying
statement of operations.
Effective August 1,
2011, LM leased office space from the Company. The term of the
agreement is for five years expiring July 31, 2016. The total
amount of rental income earned for the years ended June 30, 2015,
2014, and 2013 amounted to $203,916 for all three
years.
Balances with
related companies are as follows:
|
|
2015
|
|
2014
|
|
Due
from related party:
|
|
|
|
|
Lipstick
Management LLC
|
$123,959
|
|
$120,274
|
|
Rigby
183 LLC
|
405
|
|
|
|
I
Madison LLC
|
310
|
|
|
|
IRSA
International LLC
|
355
|
|
|
|
|
$
125,029
|
|
$120,274
|
The above amount
represents expenses paid by the Company on behalf of related
companies, which will be reimbursed by related
companies.
|
|
2015
|
|
2014
|
|
Due
to related party:
|
|
|
|
|
IRSA
International, LLC
|
$
(39,979)
|
|
$
(39,979)
|
|
Lipstick
Management LLC
|
(38,280)
|
|
(272,763)
|
|
IRSA
Inversiones y Representaciones
|
|
|
|
|
Sociedad
Anonima
|
(240,874)
|
|
(240,874)
|
|
|
$
(319,133)
|
|
$
(553,616)
|
F- 308
New Lipstick LLC and Subsidiary
(A Limited Liability Company)
Notes to Consolidated Financial Statements
June
30, 2015, 2014 and 2013
(Amounts in US dollars)
On December 30,
2010, a property management agreement was entered into with a third
party. The term of the property management agreement will continue
on a month-to-month basis. The Company is charged a monthly
property management fee of approximately $22,917. The total
property management fee for the years ended June 30, 2015, 2014,
and 2013, included in management fees in the accompanying statement
of operations, amounted to $275,000 of which $0 is unpaid as of
June 30, 2014 and 2013, and $22,917 was unpaid as of June 30,
2015.
F- 309
TABLE OF CONTENTS
Part IItem 1. Identity Of Directors, Senior Management and AdvisersItem 2. Offer Statistics and Expected TimetableItem 3. Key InformationItem 4. Information on The CompanyItem 4A. Unresolved Staff CommentsItem 5. Operating and Financial Review and ProspectsItem 3 Key Information D. Risk FactorsItem 6. Directors, Senior Management and EmployeesItem 7. Major Shareholders and Related Party TransactionsItem 8. Financial InformationItem 9. The Offer and ListingItem 10. Additional InformationItem 11. Quantitative and Qualitative Disclosures About Market RiskItem 12. Description Of Securities Other Than Equity SecuritiesPart IIItem 13. Defaults, Dividend Arrearages and DelinquenciesItem 14. Material Modifications To The Rights Of Security Holders and Use Of ProceedsItem 15. Controls and ProceduresPart IIIItem 17. Financial StatementsItem 18. Financial StatementsItem 19. ExhibitsNote 06. 30.16 06. 30.15Note 06. 30.16 06. 30.15 06. 30.14Note 3 Acquisitions and DisposalsNote 10 - Investment PropertiesNote 11 - Property, Plant and EquipmentNote 13 - Intangible AssetsNote 25 TaxationNote 17 Trade and Other ReceivablesNote 23 BorrowingsNote 16 Financial Instruments By CategoryNote 22 ProvisionsNote 14 Biological AssetsNote 1: BusinessNote 1: Business (continued)Note 2: Summary Of Significant Accounting PoliciesNote 2: Summary Of Significant Accounting Policies (continued)Note 3: Real EstateNote 4: Lease IntangiblesNote 4: Lease Intangibles (continued)Note 5: Note PayableNote 6: Ground LeasesNote 6: Ground Lease (continued)Note 7: Tenant LeasesNote 8: Related Party TransactionsNote 8: Related Party Transactions (continued)Note 9: Property Management