United
States
SECURITIES AND EXCHANGE COMMISSION
Washington, D.C. 20549
FORM 20-F
|
☐
|
|
REGISTRATION STATEMENT PURSUANT TO SECTION 12(b) OR (g) OF THE
SECURITIES EXCHANGE ACT OF 1934
|
OR
|
☒
|
|
ANNUAL REPORT PURSUANT TO SECTION 13 OR 15(d) OF THE SECURITIES
EXCHANGE ACT OF 1934
|
For the fiscal year ended: June 30, 2018
OR
|
☐
|
|
TRANSITION REPORT PURSUANT TO SECTION 13 OR 15(d) OF THE SECURITIES
EXCHANGE ACT OF 1934
|
OR
|
☐
|
|
SHELL COMPANY REPORT PURSUANT TO SECTION 13 OR 15(d) OF THE
SECURITIES EXCHANGE ACT OF 1934
Date of event requiring this shell company report ___
For the transition period from ___ to___
|
Commission file number: 001-29190
CRESUD SOCIEDAD ANONIMA COMERCIAL INMOBILIARIA FINANCIERA Y
AGROPECUARIA
(Exact name of Registrant as specified in its charter)
Cresud Inc.
(Translation of Registrant’s name into English)
Republic of Argentina
(Jurisdiction of incorporation or organization)
Moreno 877, 23
rd
Floor,
(C1091AAQ) City of Buenos Aires, Argentina
(Address of principal executive offices)
Matías Iván Gaivironsky
Chief Financial and Administrative Officer
Tel +(5411) 4323-7449 – finanzas@cresud.com.ar
Moreno 877, 24
th
Floor,
(C1091AAQ) City of Buenos Aires, Argentina
(Name, Telephone, E-mail and/or Facsimile number and Address of
Company Contact Person)
Securities registered or to be registered pursuant to Section 12(b)
of the Act:
|
Title of each class
|
|
|
|
Name of each exchange on which registered
|
|
|
|
|
||
|
American Depositary Shares (ADSs), each representing
ten shares of Common Stock
|
|
|
|
Nasdaq National Market of the
Nasdaq Stock Market
|
|
Common Stock, par value Ps. 1.00 per share
|
|
|
|
Nasdaq National Market of the
Nasdaq Stock Market*
|
|
*
|
Not for
trading, but only in connection with the registration of American
Depositary Shares, pursuant to the requirements of the Securities
and Exchange Commission.
|
Securities registered or to be registered pursuant to Section 12(g)
of the Act: None
Securities for which there is a reporting obligation pursuant to
Section 15(d) of the Act: None
Indicate
the number of outstanding shares of each of the issuer’s
classes of capital or common stock as of the period covered by the
annual report: 501,642,804.
Indicate
by check mark if the registrant is a well known seasoned issuer, as
defined in Rule 405 of the Securities Act:
☐
Yes
☒
No
If this
report is an annual or transition report, indicate by check mark if
the registrant is not required to file reports pursuant to Section
13 or 15 (d) of the Securities Exchange Act of 1934.
☒
Yes
☐
No
Indicate by check
mark whether the registrant (1) has filed all reports required to
be filed by Section 13 or 15(d) of the Securities Exchange Act of
1934 during the preceding 12 months (or for such shorter period
that the registrant was required to file such reports), and (2) has
been subject to such filing requirements for the past 90
days.
☒
Yes
☐
No
Indicate by check
mark whether the registrant has submitted electronically and posted
on its corporate Web site, if any, every Interactive Date File
required to be submitted and posted pursuant to Rule 405 of
Regulation S-T (232.405 of this chapter) during the preceding 12
months (or for such shorter period that the registrant was required
to submit and post such files).
☐
Yes
☒
No
Indicate by check
mark whether the registrant is a large accelerated filer, an
accelerated filer, or a non-accelerated filer. See definition of
“accelerated filer and large accelerated filer” in Rule
12b-2 of the Exchange Act. (check one):
Large accelerated filer
☐
Accelerated filer
☒
Non-accelerated filer
☐
Emerging growth company
☐
If an
emerging growth company that prepares its financial statements in
accordance with U.S. GAAP, indicate by check mark if the registrant
has elected not to use the extended transition period for complying
with any new or revised financial accounting standards†
provided pursuant to Section 13(a) of the Exchange Act.
☐
†The term
“new or revised financial accounting standard” refers
to any update issued by the Financial Accounting Standards Board to
its Accounting Standards Codification after April 5,
2012.
Indicate by check
mark which basis of accounting the registrant has used to prepare
the financial statements included in this filing:
|
|
|
|
|
|
|
U.S.
GAAP
|
☐
|
International
Financial Reporting Standards as issued by the International
Accounting Standards Board
|
☒
|
Other
☐
|
If
“Other” has been checked in response to the previous
question, indicate by check mark which financial statement item the
registrant has elected to follow.
☐
Item 17
☐
Item
18
If this
is an annual report, indicate by check mark whether the registrant
is a shell company (as defined in Rule 12b-2 of the Exchange
Act).
☐
Yes
☒
No
(APPLICABLE
ONLY TO ISSUERS INVOLVED IN BANKRUPTCY PROCEEDINGS DURING THE PAST
FIVE YEARS)
Indicate by check
mark whether the registrant has filed all documents and reports
required to be filed by Sections 12, 23 or 15(d) of the Securities
Exchange Act of 1934 subsequent to the distribution of securities
under a plan confirmed by the court. Yes
☐
No
☐
Please send copies of notices and communications from the
Securities and Exchange Commission to:
|
Carolina
Zang
|
|
David
Williams
|
|
|
|
Jaime
Mercado
|
|
Zang
Vergel & Viñes Abogados
|
|
Simpson
Thacher & Bartlett LLP
|
|
Florida
537 piso 18º
C1005AAK
Buenos Aires, Argentina.
|
|
425
Lexington Avenue
New
York, NY 10019
|
TABLE
OF CONTENTS
|
|
Page No.
|
|
|
|
|
Disclosure Regarding Forward-Looking Information
|
i
|
|
Certain Measures and Terms
|
i
|
|
Presentation of Financial and Certain Other
Information
|
ii
|
|
Market Data
|
iv
|
|
Part I
|
1
|
|
Item 1. Identity of Directors, Senior Management and
Advisers
|
1
|
|
Item 2. Offer Statistics and Expected Timetable
|
1
|
|
Item 3. Key Information
|
1
|
|
A. Selected Consolidated Financial Data
|
1
|
|
B. Capitalization and Indebtedness
|
9
|
|
C. Reasons for the Offer and Use of Proceeds
|
9
|
|
D. Risk Factors
|
10
|
|
Item 4. Information on the Company
|
76
|
|
A. History and Development of the Company
|
76
|
|
B. Business Overview
|
87
|
|
C. Organizational Structure
|
175
|
|
D. Property, Plants and Equipment
|
176
|
|
Item 4A. Unresolved Staff Comments
|
179
|
|
Item 5. Operating and Financial Review and Prospects
|
179
|
|
A. Consolidated Operating Results
|
179
|
|
B. Liquidity and Capital Resources
|
236
|
|
C. Research and Developments, Patents and Licenses
|
242
|
|
D. Trend Information
|
243
|
|
E. Off-Balance Sheet Arrangements
|
246
|
|
F. Tabular Disclosure of Contractual Obligations
|
246
|
|
G. Safe Harbor
|
246
|
|
Item 6. Directors, Senior Management and Employees
|
247
|
|
A. Directors and Senior Management
|
247
|
|
B. Compensation
|
250
|
|
C. Board Practices
|
252
|
|
D. Employees
|
253
|
|
E. Share Ownership
|
254
|
|
Item 7. Major shareholders and related party
transactions
|
255
|
|
A. Major Shareholders
|
255
|
|
B. Related Party Transactions
|
256
|
|
C. Interests of Experts and Counsel
|
260
|
|
Item 8. Financial Information
|
260
|
|
A. Audited Consolidated Statements and Other Financial
Information
|
260
|
|
B. Significant Changes
|
268
|
|
Item 9. The Offer and Listing
|
268
|
|
A. Offer and Listing Details
|
268
|
|
B. Plan of Distribution
|
269
|
|
C. Markets
|
270
|
|
D. Selling Shareholders
|
271
|
|
E. Dilution
|
271
|
|
F. Expenses of the Issue
|
272
|
|
Item 10. Additional Information
|
272
|
|
A. Share Capital
|
272
|
|
B. Memorandum and Articles of Association
|
272
|
|
C. Material Contracts
|
277
|
|
D. EXCHANGE CONTROLS
|
277
|
|
E. Taxation
|
282
|
|
F. Dividends and Paying Agents
|
288
|
|
G. Statement by Experts
|
288
|
|
H. Documents on Display
|
288
|
|
I. Subsidiary Information
|
288
|
|
Item 11. Quantitative and Qualitative Disclosures about Market
Risk
|
288
|
|
Item 12. Description of Securities Other than Equity
Securities
|
288
|
|
Part II
|
290
|
|
Item 13. Defaults, Dividend Arrearages and
Delinquencies
|
290
|
|
Item 14. Material Modifications to the Rights of Security Holders
and Use of Proceeds
|
290
|
|
Item 15. Controls and Procedures
|
290
|
|
A. Disclosure Controls and Procedures
|
290
|
|
B. Management´s Annual Report on Internal Control Over
Financial Reporting
|
290
|
|
C. Attestation Report of the Registered Public Accounting
Firm
|
290
|
|
D. Changes in Internal Control Over Financial
Reporting
|
291
|
|
Item 16. Reserved
|
291
|
|
Item 16A. Audit Committee Financial Expert
|
291
|
|
Item 16B. Code of Ethics
|
291
|
|
Item 16C. Principal Accountant Fees and Services
|
291
|
|
Item 16D. Exemption from the Listing Standards for Audit
Committees
|
292
|
|
Item 16E. Purchases of Equity Securities by the Issuer and
Affiliated Purchasers
|
292
|
|
Item 16F. Change in Registrant’s Certifying
Accountant
|
293
|
|
Item 16G. Corporate Governance
|
293
|
|
Item 16H. Mine Safety Disclosures
|
294
|
|
Part III
|
295
|
|
Item 17. Financial Statements
|
295
|
|
Item 18. Financial Statements
|
295
|
|
Item 19. Exhibits
|
295
|
DISCLOSURE REGARDING FORWARD-LOOKING INFORMATION
This
annual report includes forward-looking statements, principally
under the captions “Summary,” “Item 3.D. Risk
Factors,” “Item 4. Information on the Company”
and “Item 5. Operating and Financial Review and
Prospects.” We have based these forward-looking statements
largely on our current beliefs, expectations and projections about
future events and financial trends affecting our business. Many
important factors, in addition to those discussed elsewhere in this
annual report, could cause our actual results to differ
substantially from those anticipated in our forward-looking
statements, including, among other things:
Factors
that could cause actual results to differ materially and adversely
include but are not limited to:
● changes in
general economic, financial, business, political, legal, social or
other conditions in Argentina, Brazil in Latin America or in Israel
or changes in developed or emerging markets;
● changes in
capital markets in general that may affect policies or attitudes
toward lending to or investing in Argentina or Argentine companies,
including volatility in domestic and international financial
markets;
● inflation
and deflation;
●
fluctuations in prevailing interest rates;
● increases
in financing costs or our inability to obtain additional financing
on attractive terms, which may limit our ability to fund existing
operations and to finance new activities;
● current and
future government regulation and changes in law or in the
interpretation by Argentine courts of the recently adopted Civil
and Commercial Code, among others;
● adverse
legal or regulatory disputes or proceedings;
●
fluctuations and declines in the aggregate principal amount of
Argentine public debt outstanding;
● government
intervention in the private sector and in the economy, including
through nationalization, expropriation, labor regulation or other
actions;
●
restrictions on transfer of foreign currencies and other exchange
controls;
● increased
competition in the shopping mall sector, office or other commercial
properties and related industries;
● potential
loss of significant tenants at our shopping malls, offices or other
commercial properties;
● our ability
to take advantage of opportunities in the real estate market of
Argentina or Israel on a timely basis;
●
restrictions on energy supply or fluctuations in prices of
utilities in the Argentine market;
● our ability
to meet our debt obligations;
● shifts in
consumer purchasing habits and trends;
●
technological changes and our potential inability to implement new
technologies;
●
deterioration in regional, national or global businesses and
economic conditions;
● incidents
of government corruption that adversely impact the development of
our real estate projects.
●
fluctuations and declines in the exchange rate of the Peso and the
NIS against other currencies;
● risks
related to our investment in Israel; and
● the risk
factors discussed under “Item 3.D. Risk
Factors.”
You can
identify forward-looking statements because they contain words such
as “believes,” “expects,”
“may,” “will,” “should,”
“seeks,” “intends,” “plans,”
“estimates,” “anticipates,”
“could,” “target,” “projects,”
“contemplates,” “believes,”
“estimates,” “potential,”
“continue” or similar expressions.Forward-looking
statements include information concerning our possible or assumed
future results of operations, business strategies, financing plans,
competitive position, industry environment, potential growth
opportunities, the effects of future regulation and the effects of
competition. Forward-looking statements speak only as of the date
they were made, and we undertake no obligation to update publicly
or to revise any forward-looking
i
statements after we
distribute this annual report because of new information, future
events or other factors. In light of the risks and uncertainties
described above, the forward-looking events and circumstances
discussed in this annual report might not occur and are not
guarantees of future performance.
As of
June 30, 2018, the Company has established two operations centers
to manage its global business, which we refer to in this annual
report as the “Operation Center in Argentina” and the
“Operation Center in Israel.”
You
should not place undue reliance on such statements which speak only
as of the date that they were made. These cautionary statements
should be considered in connection with any written or oral
forward-looking statements that we might issue in the
future.
Available
information
We file
annual and current reports and other information with the United
States Securities and Exchange Commission, or “SEC.”
You may read and copy any document we file with the SEC at the
SEC’s Public Reference Room at 100 F Street, N.E.,
Washington, D.C. 20549. Please call the SEC at 1-800-SEC-0330 for
further information on the public reference room. The SEC also
maintains a website at http://www.sec.gov that contains reports and
other information regarding issuers that file electronically with
the SEC. The information contained on this website does not form
part of this annual report form 20-F.
You may
obtain a copy of these filings at no cost by writing to us at:
Moreno 877, 24
th
Floor, City of
Buenos Aires (C1091AAQ), Argentina or telephoning us at
+54 (11) 4814-7800.
PRESENTATION OF FINANCIAL AND CERTAIN OTHER
INFORMATION
As used
throughout this annual report, the terms “Cresud,”
“Group,” “we,” “us,” and
“our” refer to Cresud Sociedad Anónima Comercial,
Inmobiliaria, Financiera y Agropecuaria, together with our
consolidated subsidiaries, except where we make clear that such
terms refer only to the parent company.
The
terms “Argentine government” and
“government” refer to the federal government of
Argentina, the term “Central Bank” refers to the
Banco Central de la República
Argentina
(the Argentine Central Bank), the terms
“CNV” and “CNV Rules” refers to the
Comisión Nacional de
Valores
(the Argentine National Securities Commission) and
the rules issued by the CNV, respectively. In this annual report,
when we refer to “Peso,” “Pesos” or
“Ps.” we mean Argentine Pesos, the legal currency of
Argentina; when we refer to “U.S. dollar,” “U.S.
dollars” or “US$” we mean United States dollars,
the legal currency of the United States
; when we refer to
“NIS” we mean Israeli New Shekel.
Financial
Statements
This
annual report contains our Audited Consolidated Financial
Statements as of June 30, 2018 and 2017 for our fiscal years ended
June 30, 2018, 2017 and 2016 (our “Audited Consolidated
Financial Statements”). We preare our Audited Consolidated
Financial Statements in accordance with International Financial
Reporting Standards (“IFRS”) as issued by the
International Accounting Standards Board (“IASB”). Our
Audited Consolidated Financial Statements included elsewhere herein
have been audited by Price Waterhouse & Co S.R.L. City of
Buenos Aires, Argentina, member of PriceWaterhouseCoopers
International Limited, an independent registered public accounting
firm whose report is included herein.
IDB
Development Corporation Ltd. (“IDBD”) and Discount
Investment Corporation (“DIC”) report their quarterly
and annual results following the Israeli regulations, whose legal
deadlines are after the deadlines in Argentina and since IDBD and
DIC fiscal years end differently from IRSA, the results of
operations from IDBD and DIC are consolidated with a lag of three
months and adjusted for the effects of significant transactions
taking place in such period. For these reasons, it is possible to
obtain the quarterly results of IDBD and DIC in time so that they
can be consolidated by IRSA and reported to the CNV in its
Consolidated Financial Statements within the legal deadlines set in
Argentina. This way, the consolidated comprehensive income for the
year ended June 30, 2018 includes the results of IDBD and DIC for
the 12-month period from April 1, 2017 to March 31, 2018, adjusted
for the significant transactions that occurred between April 1,
2018 and June 30, 2018. In addition, IDBD’s results of
operations for the period beginning October 11, 2015 (the
acquisition of control) through March 31, 2016 are included in the
company’s consolidated comprehensive income for fiscal year
ended June 30, 2016, adjusted by significant transactions occurred
between April 1, 2016 and June 30, 2016.
As
required under Rule 3-09 of Regulation S-X, this annual report
contains the audited consolidated financial statements of December
31, 2017 d for the fiscal year ended December 31, 2016 and 2017 of
Banco Hipotecario S.A. (“Banco Hipotecario”), in which
IRSA holds a 29.91% equity interest. Such financial statements have
been prepared in conformity with the regulations set forth by the
Central Bank (“Argentine Banking GAAP”), which differ
in certain significant respects from accounting principles
generally accepted in the United States of America (“U.S.
GAAP”) and IFRS. Note 27 to the audited consolidated
financial statements of Banco Hipotecario provides a description of
the principal differences between Argentine Banking GAAP and IFRS
(as adopted by the Central Bank), as they relate to us, and a
reconciliation to IFRS (as adopted by the Central Bank) of the
consolidated balance sheet of Banco Hipotecario as of December 31,
2017 and of our consolidated income statement for the year ended
December 31, 2017. In addition, Note 32 to the audited consolidated
financial statements of Banco Hipotecario provides a description of
the principal differences between Argentine Banking GAAP and U.S.
GAAP, as they relate to us, and a reconciliation to U.S. GAAP of
our consolidated shareholders’ equity as of December 31, 2017
and 2016 and our consolidated net income for the years ended
December 31, 2017 and 2016.
ii
Effective January
1, 2018, Banco Hipotecario began preparing its consolidated
financial statements in accordance with IFRS, with certain criteria
of measurement and exposure specifically established by the Central
Bank (see note 27 to our audited consolidated financial
statements). As established in IFRS 1 “First Time Adoption of
International Financial Reporting Standards,” Banco
Hipotecarios’s transition date to IFRS (as adopted by the
Central Bank) is January 1, 2017.
The
Company has established two Operations Centers to manage its global
business, mainly through the following companies:
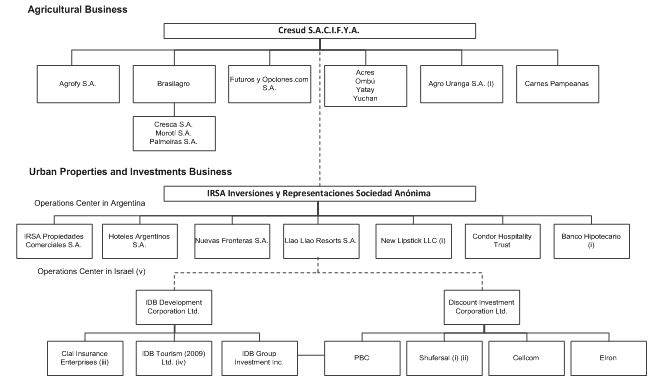
(i)
Corresponds to Company’s associates, which are hence excluded
from consolidation.
(ii)
The results are included in discontinued operations, due to the
loss of control in June 2018.
(iii)
Disclosed as financial assets held for sale.
(iv)
Assets and liabilities are disclosed as held for sale and the
results as discontinued operations.
(v) For
more information about the change within the Operations Center in
Israel see Note 4 to the Audited Consolidated Financial
Statements.
Inflation
We have
determined that, as of July 1, 2018, the Argentine economy
qualifies as a hyperinflationary economy according to the
guidelines to International Accounting Standard 29, Financial
Reporting in Hyperinflationary Economies (“IAS 29”)
since the total cumulative inflation in Argentina in the 36 months
prior to July 1, 2018, as measured by the wholesale price index
published by the INDEC, exceeded 100%. IAS 29 will be applicable to
our financial statements for periods ending after July 1,
2018. See Note 2.1(a) to our Audited Consolidated Finacial
Statements.
IAS 29
requires that the financial information recorded in a
hyperinflationary currency be adjusted by applying a general price
index and expressed in the measuring unit (the hyperinflationary
currency) current at the end of the reporting period. Therefore,
our audited consolidated financial statements included in this
annual report will be adjusted by applying a general price index
and expressed in the measuring unit (the hyperinflationary
currency) current at the end of the most recent reporting period.
We have not estimated yet the impact of the application of IAS 29
provisions in our audited consolidated financial statements. Our
Audited Consolidated Financial Statements included in this annual
report were not restated into constant currency.
For
more information, see “Risk Factors—Risks Relating to
Argentina—The peso qualifies as a currency of a
hyperinflationary economy under IAS 29. We cannot assure you
whether regulatory agencies of the Argentine national government
will require us to not apply IAS 29 to financial statements
furnished to such regulators” and
“—Continuing
inflation may have an adverse effect on the economy and our
business, financial condition and results of
operations.”
iii
Currency
translations and rounding
In this
annual report where we refer to “Peso,”
“Pesos,” or “Ps.” we mean Argentine Pesos,
the lawful currency in Argentina; when we refer to “U.S.
Dollars,” or “US$” we mean United States Dollars,
the lawful currency of the United States of America; when we refer
to “
Real
,”
“
Real
s,”
“Rs.” or “R$” we mean Brazilian
Real
, the lawful currency
in the Federative Republic of Brazil; when we refer to
“NIS,” we mean New Israeli Shekels, the lawful currency
of Israel; and when we refer to “Central Bank” we mean
the
Banco Central de la
República Argentina
(Argentine Central
Bank).
Our
functional and presentation currency is the Peso, and accordingly
our Financial Statements included in this annual report are
presented in Pesos. We have translated some of the Peso amounts
contained in this annual report into U.S. dollars for convenience
purposes only. Unless otherwise specified or the context otherwise
requires, the rate used to convert Peso amounts to U.S. dollars is
the seller exchange rate quoted by Banco de la Nación
Argentina of Ps.28.8500 per US$1.00 for information provided as of
June 30, 2018. The average seller exchange rate for the fiscal year
2018, quoted by Banco de la Nación Argentina was Ps.19.4888.
The U.S. dollar-equivalent information presented in this annual
report is provided solely for the convenience of investors and
should not be construed as implying that the Peso amounts
represent, or could have been or could be converted into, U.S.
dollars at such rates or at any other rate. The seller exchange
rate quoted by Banco de la Nación Argentina was Ps.36.7900 per
US$1.00 as of October 25, 2018. See “Item 3. Key
Information—Local Exchange Market and Exchange Rates.”
and “Item 3. Risk Factors— Continuing inflation may
have an adverse effect on the economy and our business, financial
condition and the results of our operations”.
We have
also translated certain NIS amounts into U.S. dollars at the offer
exchange rate for June 30, 2018 which was NIS 3.6553=U.S.$1.00. We
make no representation that the Peso, NIS or U.S. dollar amounts
actually represent or could have been or could be converted into
U.S. dollars at the rates indicated, at any particular rate or at
all. See “Item 3 – Key information - Local Exchange
Market and Exchange Rates.”
Certain
numbers and percentages included in this annual report have been
subject to rounding adjustments. Accordingly, figures shown for the
same category presented in various tables or other sections of this
annual report may vary slightly, and figures shown as totals in
certain tables may not be the arithmetic aggregation of the figures
that precede them.
Fiscal
years
References to
fiscal years 2018, 2017, 2016, 2015 and 2014 are to our fiscal
years starting on July 1 and ending on June 30 of each
such year.
Certain
measurements
In
Argentina the standard measure of area in the real estate market is
the square meter (m2), while in the United States and certain other
jurisdictions the standard measure of area is the square foot (sq.
ft.). All units of area shown in this annual report (
e.g.,
gross leasable area of buildings
(“GLA” or “gross leasable area”,) and size
of undeveloped land) are expressed in terms of square meters. One
square meter is equal to approximately 10.764 square feet. One
hectare is equal to approximately 10,000 square meters and to
approximately 2.47 acres.
As used
herein, GLA in the case of shopping malls, refers to the total
leasable area of the property, regardless of our ownership interest
in such property (excluding common areas and parking and space
occupied by supermarkets, hypermarkets, gas stations and co-owners,
except where specifically stated).
Market
share data
Information
regarding market share in a specified region or area is based on
data compiled by us from internal sources and from publications
such as Bloomberg, the International Council of Shopping Centers,
or “ICSC,” the Argentine Chamber of Shopping Centers
(Cámara Argentina de Shopping Centers), and Colliers
International. While we believe that these sources are reliable, we
have not independently verified the information prepared by these
sources.
iv
This
item is not applicable.
This
item is not applicable.
A.
SELECTED CONSOLIDATED FINANCIAL DATA
The
following selected consolidated financial data has been derived
from our Audited Consolidated Financial Statements as of the dates
and for each of the periods indicated below. This information
should also be read in conjunction with our Audited Consolidated
Financial Statements included under Item 8. “Financial
Information”, and the discussion in Item 5. “Operating
and Financial Review and Prospects”.
The
selected consolidated statements of income and other comprehensive
income data for the years ended June 30, 2018, 2017 and 2016 and
the selected consolidated statements of financial position data and
cash flow as of June 30, 2018 and 2017 have been derived from our
Audited Consolidated Financial Statements included in this annual
report, which have been audited by Price Waterhouse & Co S.R.L.
Buenos Aires, Argentina, member of PriceWaterhouseCoopers
International Limited, an independent registered public accounting
firm.
The
summarized consolidated statement of comprehensive income and cash
flow data for the fiscal year 2015 and 2014 and the summarized
consolidated statement of financial position data as of June 30,
2016, 2015 and 2014 have been derived from our audited consolidated
financial statements for the fiscal years ended June 30, 2016, 2015
and 2014 which have been retroactively recast to give effect to the
change of measurement basis for our investment properties. These
financial statements are not included in this annual
report.
We have
determined that, as of July 1, 2018, the Argentine economy
qualifies as hyperinflationary economy according to IAS 29. IAS 29
requires that the financial statements recorded in the currency of
a hyperinflationary economy be adjusted in terms of a measuring
unit current at the end of reporting period. We did not apply the
restatement criteria to the financial information for the periods
reported in this annual report since IAS 29 will be applicable to
our financial statementes for periods ending after July 1, 2018.
For more information on inflation, see “Operating and
Financial Review and Prospects — Factors Affecting our
Results of Operations—Effects of
Inflation.”
On
October 11, 2015, we acquired, through our subsidiary IRSA, control
of IDBD. In conformity with IFRS 3, IDBD’s information is
included in our financial statements since the acquisition date,
without affecting the information from previous years. Therefore,
the consolidated financial information for periods ending after the
acquisition date may not be comparable to previous periods. For
more information see, Item 5. “Operating and Financial Review
and Prospects-Factors Affecting Comparability of our
Results.”
Changes
in presentation of financial statements previously issued due to
change in accounting policies
Expenses relating
to the agricultural activity include items such as planting,
harvesting, irrigation, agrochemicals, fertilizers, veterinary
services and others. The Group chose not to continue to charge
these costs of production directly in the Statements of Income and
Other Comprehensive Income as they are incurred; instead, it
capitalized them as part of the cost of biological assets. Both
options are accept
able under
IAS
. The Group believes this change will help to better
understand the performance of the agribusiness activity and
therefore provides more information that is relevant to Management,
users of the Financial Statements and others.
The Company
has therefore retroactively modified the comparative amounts of the
Consolidated Financial Statements as required by IAS 8, reflecting
the aforementioned change, reducing “Cost” line and
increasing “Initial recognition and changes in the fair value
of biological assets and agricultural products at the point of
harvest” line in the Statements of Income and Other
Comprehensive Income in
Ps. 1,995 million,
Ps. 1,236, million, Ps. 1,236 million and Ps. 468 million as of
June 30, 2017, 2016, 2015 and 2014 respectively. There is no impact
in any of the total and subtotal amounts of the Financial
Statements
.
1
|
|
For
the fiscal year ended June 30,
|
|||||
|
|
2018
(1)
|
2018
|
2017
|
2016
|
2015
|
2014
|
|
|
(in
millions of US$)
|
(in
millions of Ps.; except per share data)
|
||||
|
|
|
|
|
|
|
|
|
|
|
|
|
|
|
|
|
Revenues
|
1,351
|
38,986
|
30,746
|
15,622
|
5,652
|
4,604
|
|
Costs
|
(859
)
|
(24,780
)
|
(19,330
)
|
(9,380
)
|
(3,379
)
|
(2,746
)
|
|
Initial recognition
and changes in the fair value of biological assets and agricultural
produce at the point of harvest
|
36
|
1,042
|
204
|
401
|
111
|
220
|
|
Changes in the net
realizable value of agricultural produce after harvest
|
11
|
303
|
(74
)
|
208
|
(34
)
|
(17
)
|
|
Gross
profit
|
539
|
15,551
|
11,546
|
6,851
|
2,350
|
2,061
|
|
|
-
|
-
|
-
|
-
|
-
|
-
|
|
Net gain from fair
value adjustment of investment properties
|
784
|
22,629
|
4,888
|
17,516
|
4,055
|
4,235
|
|
Gain / (loss) from
disposal of farmlands
|
31
|
906
|
280
|
(2
)
|
550
|
90
|
|
General and
administrative expenses
|
(153
)
|
(4,414
)
|
(3,628
)
|
(1,950
)
|
(607
)
|
(534
)
|
|
Selling
expenses
|
(184
)
|
(5,306
)
|
(4,503
)
|
(2,173
)
|
(474
)
|
(352
)
|
|
Other operating
results, net
|
40
|
1,152
|
(128
)
|
(110
)
|
17
|
(88
)
|
|
Management
fees
|
(19
)
|
(554
)
|
(200
)
|
(534
)
|
(145
)
|
(70
)
|
|
Profit
from operations
|
1,038
|
29,964
|
8,255
|
19,598
|
5,746
|
5,342
|
|
|
-
|
-
|
-
|
-
|
-
|
-
|
|
Share of (loss) /
profit of associates and joint ventures
|
(21
)
|
(603
)
|
96
|
534
|
(817
)
|
(322
)
|
|
Profit
from operations before financing and taxation
|
1,017
|
29,361
|
8,351
|
20,132
|
4,929
|
5,020
|
|
|
-
|
-
|
-
|
-
|
-
|
-
|
|
Finance
income
|
69
|
1,998
|
1,055
|
1,450
|
246
|
290
|
|
Finance
cost
|
(908
)
|
(26,209
)
|
(8,936
)
|
(7,351
)
|
(1,685
)
|
(2,852
)
|
|
Other financial
results
|
13
|
384
|
3,178
|
(145
)
|
149
|
(12
)
|
|
Financial results,
net
|
(826
)
|
(23,827
)
|
(4,703
)
|
(6,046
)
|
(1,290
)
|
(2,574
)
|
|
Profit
before income tax
|
191
|
5,534
|
3,648
|
14,086
|
3,639
|
2,446
|
|
Income
tax
|
(8
)
|
(233
)
|
(2,713
)
|
(5,785
)
|
(1,396
)
|
(1,090
)
|
|
Profit
for the year from continuing
operations
|
183
|
5,301
|
935
|
8,301
|
2,243
|
1,356
|
|
Profit from
discontinued operations after income tax
|
433
|
12,479
|
4,093
|
817
|
-
|
-
|
|
Profit
for the year
|
616
|
17,780
|
5,028
|
9,118
|
2,243
|
1,356
|
|
|
-
|
-
|
-
|
-
|
-
|
-
|
|
|
|
|
|
|
|
|
|
Profit
/ (loss)
from continuing
operations attributable to:
|
|
|
|
|
|
|
|
Equity
holders of the parent
|
(28
)
|
(772
)
|
461
|
4,951
|
954
|
641
|
|
Non-controlling
interest
|
211
|
6,073
|
474
|
3,350
|
1,289
|
715
|
|
|
-
|
-
|
-
|
-
|
-
|
-
|
|
Profit
for the year attributable to:
|
|
|
|
|
|
|
|
Equity
holders of the parent
|
187
|
5,392
|
1,511
|
5,167
|
954
|
641
|
|
Non-controlling
interest
|
429
|
12,388
|
3,517
|
3,951
|
1,289
|
715
|
2
|
|
IFRS
|
|||||
|
|
For
the fiscal year ended June 30,
|
|||||
|
|
2018
(1)
|
2018
|
2017
|
2016
|
2015
|
2014
|
|
|
|
|
|
|
|
|
|
Consolidated
Statements of Comprehensive Income
|
|
|
|
|
|
|
|
Profit for
the year
|
616
|
17,780
|
5,028
|
9,118
|
2,243
|
1,356
|
|
Other
comprehensive income / (loss):
|
|
|
|
|
|
|
|
Items
that may be reclassified subsequently to profit or
loss:
|
|
|
|
|
|
|
|
Currency
translation adjustment
|
447
|
12,910
|
3,718
|
(1,715
)
|
(445
)
|
1,268
|
|
Share of
other comprehensive income of associates and joint
ventures
|
119
|
3,426
|
354
|
5,100
|
-
|
-
|
|
Revaluation
surplus
|
7
|
192
|
|
|
|
|
|
Change in the
fair value of hedging instruments net of income taxes
|
(1
)
|
(19
)
|
124
|
3
|
-
|
-
|
|
Items
that may not be reclassified subsequently to profit or
loss:
|
|
|
|
|
|
|
|
Actuarial
loss from defined benefit plans
|
-
|
(12
)
|
(10
)
|
(10
)
|
-
|
-
|
|
Other
comprehensive income for the year from continuing
operations
|
572
|
16,497
|
4,186
|
3,378
|
(445
)
|
1,268
|
|
Other
comprehensive income for the year from discontinued
operations
|
15
|
435
|
1,170
|
1,641
|
-
|
-
|
|
Total
other comprehensive income for the year
|
587
|
16,932
|
5,356
|
5,019
|
(445
)
|
1,268
|
|
Total
comprehensive income for the year
|
1,203
|
34,712
|
10,384
|
14,137
|
1,798
|
2,624
|
|
|
-
|
-
|
-
|
-
|
-
|
-
|
|
|
|
|
|
|
|
|
|
Total
comprehensive income from continuing operations
|
756
|
21,798
|
5,121
|
11,679
|
1,798
|
2,624
|
|
Total
comprehensive income from discontinued operations
|
447
|
12,914
|
5,263
|
2,458
|
-
|
-
|
|
Total
comprehensive income for the year
|
1,203
|
34,712
|
10,384
|
14,137
|
1,798
|
2,624
|
|
|
|
|
|
|
|
|
|
Total
comprehensive income / (loss) from continuing operations
attributable to:
|
|
|
|
|
|
|
|
Equity
holders of the parent
|
(32
)
|
(926
)
|
(753
)
|
3,257
|
760
|
997
|
|
Non-controlling
interest
|
788
|
22,724
|
5,874
|
8,422
|
1,038
|
1,627
|
|
|
|
|
|
|
|
|
|
Total
comprehensive income for the year attributable to:
|
|
|
|
|
|
|
|
Attributable
to:
|
|
|
|
|
|
|
|
Equity
holders of the parent
|
253
|
7,308
|
2,603
|
5,715
|
760
|
997
|
|
Non-controlling
interest
|
950
|
27,404
|
7,781
|
8,422
|
1,038
|
1,627
|
|
|
|
|
|
|
|
|
|
For the fiscal year ended June 30,
|
||||||
|
|
2018
(1)
|
2018
|
2017
|
2016
|
2015
|
2014
|
|
(in millions of US$)
|
(in millions of Ps.)
-
|
|||||
|
CASH
FLOW DATA
|
|
|
|
|
|
|
|
Net cash generated
from operating activities
|
477
|
13,775
|
9,252
|
4,219
|
512
|
884
|
|
Net cash generated
from (used in) investing activities
|
(415
)
|
(11,972
)
|
(2,415
)
|
8,640
|
855
|
(886
)
|
|
Net cash used in
financing activities
|
(80
)
|
(2,299
)
|
1,899
|
(4,647
)
|
(1,777
)
|
(447
)
|
3
|
|
As
of fiscal year ended June 30,
|
|||||
|
|
2018
(1)
|
2018
|
2017
|
2016
|
2015
|
2014
|
|
|
(in
millions of US$)
|
(in millions of Ps.)
|
||||
|
Consolidated
Statements of Financial Position
|
|
|
|
|
|
|
|
ASSETS
|
|
|
|
|
|
|
|
Non-Current
Assets
|
|
|
|
|
|
|
|
Investment
properties
|
5,668
|
163,510
|
100,189
|
82,505
|
19,306
|
16,081
|
|
Property, plant and
equipment
|
716
|
20,646
|
31,150
|
26,801
|
2,213
|
2,510
|
|
Trading
properties
|
209
|
6,020
|
4,534
|
4,733
|
143
|
134
|
|
Intangible
assets
|
429
|
12,363
|
12,443
|
11,814
|
176
|
175
|
|
Biological
assets
|
31
|
900
|
671
|
497
|
346
|
302
|
|
Other
assets
|
7
|
189
|
-
|
-
|
-
|
-
|
|
Investment in
associates and joint ventures
|
858
|
24,747
|
8,227
|
17,175
|
3,190
|
2,704
|
|
Deferred income tax
assets
|
58
|
1,679
|
1,631
|
1,249
|
654
|
516
|
|
Income tax and MPIT
credits
|
16
|
453
|
229
|
173
|
161
|
177
|
|
Restricted
assets
|
75
|
2,178
|
528
|
129
|
4
|
51
|
|
Trade and other
receivables
|
316
|
9,129
|
5,456
|
3,773
|
427
|
475
|
|
Investment in
financial assets
|
59
|
1,704
|
1,772
|
2,226
|
623
|
275
|
|
Financial assets
held for sale
|
270
|
7,788
|
6,225
|
3,346
|
-
|
-
|
|
Derivative
financial instruments
|
1
|
30
|
31
|
8
|
208
|
-
|
|
Employee
benefits
|
-
|
-
|
-
|
4
|
-
|
-
|
|
Total
Non-Current Assets
|
8,713
|
251,336
|
173,086
|
154,433
|
27,451
|
23,400
|
|
|
-
|
-
|
-
|
-
|
-
|
-
|
|
Current
Assets
|
|
|
|
|
|
|
|
Trading
properties
|
112
|
3,232
|
1,249
|
241
|
3
|
5
|
|
Biological
assets
|
32
|
913
|
559
|
552
|
180
|
266
|
|
Inventories
|
81
|
2,324
|
5,036
|
3,900
|
511
|
440
|
|
Restricted
assets
|
147
|
4,248
|
541
|
748
|
607
|
-
|
|
Income tax and MPIT
credits
|
14
|
400
|
340
|
541
|
31
|
20
|
|
Financial assets
and other assets held for sale
|
155
|
4,466
|
2,337
|
1,256
|
-
|
1,648
|
|
Groups of assets
held for sale
|
180
|
5,192
|
2,681
|
-
|
-
|
-
|
|
Trade and other
receivables
|
596
|
17,208
|
18,336
|
14,158
|
1,773
|
1,438
|
|
Investment in
financial assets
|
889
|
25,646
|
11,853
|
9,673
|
504
|
495
|
|
Derivative
financial instruments
|
5
|
155
|
65
|
53
|
30
|
33
|
|
Cash and cash
equivalents
|
1,340
|
38,650
|
25,363
|
14,096
|
634
|
1,003
|
|
Total
Current Assets
|
3,551
|
102,434
|
68,360
|
45,218
|
4,273
|
5,348
|
|
|
-
|
-
|
-
|
-
|
-
|
-
|
|
TOTAL
ASSETS
|
12,264
|
353,770
|
241,446
|
199,651
|
31,724
|
28,748
|
|
|
-
|
-
|
-
|
-
|
-
|
-
|
|
SHAREHOLDERS’
EQUITY
|
|
|
|
|
|
|
|
|
|
|
|
|
|
|
|
Capital
and Reserves Attributable to Equity Holders of the
Parent
|
|
|
|
|
|
|
|
Share
capital
|
17
|
482
|
499
|
495
|
495
|
491
|
|
Treasury
shares
|
1
|
20
|
3
|
7
|
7
|
11
|
|
Share
warrants
|
-
|
-
|
-
|
-
|
-
|
106
|
|
Inflation
adjustment of share capital and treasury shares
|
2
|
65
|
65
|
65
|
65
|
65
|
|
Share
premium
|
23
|
659
|
659
|
659
|
659
|
773
|
|
Additional paid-in
capital from treasury shares
|
1
|
21
|
20
|
16
|
13
|
-
|
|
Legal
reserve
|
4
|
113
|
83
|
83
|
-
|
82
|
|
Other
reserves
|
116
|
3,334
|
2,496
|
1,299
|
812
|
1,184
|
|
Special
reserve
|
53
|
1,516
|
1,516
|
1,516
|
1,516
|
2,350
|
|
Retained
earnings
|
510
|
14,715
|
11,064
|
9,521
|
4,461
|
2,436
|
|
Equity
Attributable to Equity Holders of the Parent
|
727
|
20,925
|
16,405
|
13,661
|
8,028
|
7,498
|
|
Non-controlling
interest
|
1,885
|
54,396
|
32,768
|
23,539
|
6,528
|
5,729
|
|
TOTAL
SHAREHOLDERS’ EQUITY
|
2,612
|
75,321
|
49,173
|
37,200
|
14,556
|
13,227
|
4
|
|
-
|
-
|
-
|
-
|
-
|
-
|
|
LIABILITIES
|
|
|
|
|
|
|
|
Non-Current
Liabilities
|
|
|
|
|
|
|
|
Trade and other
payables
|
123
|
3,577
|
3,988
|
2,464
|
666
|
485
|
|
Borrowings
|
6,498
|
187,462
|
112,025
|
93,808
|
5,833
|
5,315
|
|
Deferred income tax
liabilities
|
921
|
26,563
|
23,125
|
19,204
|
5,889
|
4,623
|
|
Derivative
financial instruments
|
1
|
40
|
86
|
120
|
270
|
321
|
|
Payroll and social
security liabilities
|
3
|
76
|
140
|
20
|
5
|
5
|
|
Provisions
|
124
|
3,567
|
955
|
547
|
42
|
43
|
|
Employee
benefits
|
4
|
110
|
763
|
689
|
-
|
-
|
|
Total
Non-Current Liabilities
|
7,674
|
221,395
|
141,082
|
116,852
|
12,705
|
10,792
|
|
|
-
|
-
|
-
|
-
|
-
|
-
|
|
Current
Liabilities
|
|
|
|
|
|
|
|
Trade and other
payables
|
620
|
17,892
|
21,970
|
18,443
|
1,307
|
1,004
|
|
Income tax and MPIT
liabilities
|
21
|
595
|
817
|
624
|
142
|
73
|
|
Payroll and social
security liabilities
|
65
|
1,868
|
2,254
|
1,856
|
230
|
202
|
|
Borrowings
|
1,112
|
32,083
|
23,287
|
23,488
|
2,466
|
2,639
|
|
Derivative
financial instruments
|
11
|
314
|
114
|
147
|
263
|
53
|
|
Provisions
|
37
|
1,059
|
894
|
1,041
|
55
|
21
|
|
Group of
liabilities held for sale
|
112
|
3,243
|
1,855
|
-
|
-
|
937
|
|
Total
Current Liabilities
|
1,978
|
57,054
|
51,191
|
45,599
|
4,463
|
4,929
|
|
|
-
|
-
|
-
|
-
|
-
|
-
|
|
TOTAL
LIABILITIES
|
9,652
|
278,449
|
192,273
|
162,451
|
17,168
|
15,721
|
|
|
|
|
|
|
|
|
|
TOTAL
SHAREHOLDERS EQUITY AND LIABILITIES
|
12,264
|
353,770
|
241,446
|
199,651
|
31,724
|
28,948
|
5
|
|
As
of fiscal year ended June 30,
|
|||||
|
|
2018
(1)
(1)
|
2018
|
2017
|
2016
|
2015
|
2014
|
|
Other
Financial Data
|
(in
US$, except for percentages, ratios and number of
shares)
|
(in
Ps, except for percentages, ratios, number of shares, per share and
per ADS data)
|
||||
|
|
|
|
|
|
|
|
|
Basic net income
per share
(2)
|
(0.05
)
|
(1.55
)
|
0.93
|
10.00
|
2.68
|
(2.15
)
|
|
Diluted net income
per share
(3)
|
(0.05
)
|
(1.50
)
|
0.92
|
9.87
|
2.38
|
(2.15
)
|
|
Basic net income
per ADS
(2)(4)
|
(0.54
)
|
(15.54
)
|
9.26
|
100.02
|
26.80
|
(21.50
)
|
|
Diluted net income
per ADS
(3)(4)
|
(0.52
)
|
(14.96
)
|
9.22
|
98.69
|
23.80
|
(21.50
)
|
|
Capital
stock
|
18
|
502
|
502
|
502
|
502
|
502
|
|
Number of common
shares
|
501,642,804
|
501,642,804
|
501,642,804
|
501,642,804
|
501,642,804
|
501,562,730
|
|
Weighted –
average number of common shares outstanding
|
496,687,276
|
496,687,276
|
497,806,965
|
494,991,778
|
492,020,463
|
496,132,488
|
|
Diluted weighted
– average number of common shares
(5)
|
516,403,816
|
516,403,816
|
500,161,805
|
554,375,631
|
554,375,631
|
558,487,656
|
|
Dividends paid
(6)
|
14,00
|
395
|
0,00
|
0,00
|
0,00
|
0,00
|
|
Dividends per
share
|
0,00
|
0,80
|
0,00
|
0,00
|
0,00
|
0,00
|
|
Dividends per ADS
(4)
|
0,00
|
7,95
|
0,00
|
0,00
|
0,00
|
0,00
|
|
Depreciation and
amortization
|
136
|
3,936
|
3,518
|
1,612
|
112
|
297
|
|
Capital
expenditure
|
274
|
7,914
|
5,196
|
1,933
|
517
|
436
|
|
Working
Capital
|
1.573
|
45.380
|
17.169
|
(381,00
)
|
(190,00
)
|
419
|
|
Gross margin
(7)
|
0.39
|
0.39
|
0.37
|
0.43
|
0.41
|
0.43
|
|
Operating margin
(8)
|
0.75
|
0.75
|
0.27
|
1.22
|
1.00
|
1.11
|
|
Net margin
(9)
|
0.44
|
0.44
|
0.16
|
0.57
|
0.39
|
0.28
|
|
Ratio of current
assets to current liabilities
(10)
|
1.80
|
1.80
|
1.34
|
0.99
|
0.96
|
1.09
|
|
Ratio of
shareholders’ equity to total liabilities
(11)
|
0.27
|
0.27
|
0.26
|
0.23
|
0.85
|
0.84
|
|
Ratio of non
current assets to total assets
(12)
|
0.71
|
0.71
|
0.72
|
0.77
|
0.87
|
0.81
|
|
Ratio of
“Return on Equity” – ROE
(13)
|
0.29
|
0.29
|
0.12
|
0.35
|
0.16
|
0.11
|
|
(1)
|
Solely
for the convenience of the reader, we have translated Peso amounts
into U.S. dollars at the exchange rate quoted by Banco de La
Nación Argentina for June 30, 2018 which was Ps.28.25 =
US$1.00. We make no representation that the Peso or U.S. dollar
amounts actually represent, could have been or could be converted
into U.S. dollars at the rates indicated, at any particular rate or
at all. The seller exchange rate quoted by Banco de la Nación
Argentina was Ps.36.7900 per US$1.00 as of October 25,
2018
|
|
(2)
|
Basic
net income per share is computed by dividing the net income
available to common shareholders for the period by the weighted
average common shares outstanding during the period.
|
|
(3)
|
Diluted
net income per share is computed by dividing the net income for the
period by the weighted average number of common shares assuming the
total conversion of outstanding notes and exercise of outstanding
options. Due to the loss for the years 2016, 2015, 2014, 2013 and
2012, there is no diluted effect on this result.
|
|
(4)
|
Determined
by multiplying per share amounts by ten (one ADS equals ten common
shares).
|
|
(5)
|
Assuming
exercise of all outstanding warrants to purchase our common
shares.
|
|
(6)
|
The
shareholders’ meeting held in October 2017 approved the
distribution of a cash dividend for an amount of Ps.395 million for
the fiscal year ended June 30, 2017.
|
|
(7)
|
Gross
profit divided by the sum of revenues and initial recognition and
changes in fair value of biological assets and agricultural produce
at the point of harvest.
|
|
(8)
|
Operating
income divided by the sum of revenues and initial recognition and
changes in fair value of biological assets and agricultural produce
at the point of harvest.
|
|
(9)
|
Net
income divided by the sum of revenues and initial recognition and
changes in fair value of biological assets and agricultural produce
at the point of harvest.
|
|
(10)
|
Current
assets over current liabilities.
|
|
(11)
|
Shareholders’
equity over total liabilities.
|
|
(12)
|
Non-current
assets over total assets.
|
|
(13)
|
Profitability
refers to income for the year divided by average
shareholders’ equity.
|
6
Local
Exchange Market and Exchange Rates
Operations Center in Argentina
A.1.
Local Exchange Market and Exchange Rates
In the
period from 2001 to 2015, the Argentine government established a
series of exchange control measures that restricted the free
disposition of funds and the transfer of funds abroad. In 2011,
these measures had significantly curtailed access to the MULC by
both individuals and private sector entities. This made it
necessary, among other things, to obtain prior approval from the
Central Bank to enter into certain foreign exchange transactions
such as payments relating to royalties, services or fees payable to
related parties of Argentine companies outside
Argentina.
With
the change of government and political environment, in December
2015, one of the first measures taken by the Argentine government
was to lift the main restrictions that limited access to
individuals to the MULC. Through Communication “A”
5,850 and later, as the local economy stabilized, Communication
“A” 6,037, the Central Bank lifted the previous
limitations and allowed unrestricted access to the foreign exchange
market, subject to some requirements, as detailed
below.
The
following table shows the maximum, minimum, average and closing
exchange rates for each applicable period to purchases of U.S.
dollars.
|
|
Maximum
(1)(2)
|
Minimum
(1)(3)
|
Average
(1)(4)
|
At
closing
(1)
|
|
Fiscal
year ended:
|
|
|
|
|
|
June 30,
2014
|
8.0830
|
5.4850
|
6.9333
|
8.0830
|
|
June 30,
2015
|
9.0380
|
8.1630
|
8.5748
|
9.0380
|
|
June 30,
2016
|
15.7500
|
9.1400
|
12.2769
|
14.9900
|
|
June 30,
2017
|
16.5800
|
14.5100
|
15.4017
|
16.5800
|
|
June 30,
2018
|
28.8000
|
16.7500
|
19.4388
|
28.8000
|
|
Month
ended:
|
|
|
|
|
|
April 30,
2018
|
20.5000
|
20.0850
|
20.1834
|
20.4900
|
|
May 31,
2018
|
24.9400
|
21.1500
|
23.6783
|
24.9100
|
|
June 30,
2018
|
28.8000
|
24.8500
|
26.5665
|
28.8000
|
|
July 31,
2018
|
28.2500
|
27.1600
|
27.5241
|
27.3600
|
|
August 31,
2018
|
37.5500
|
27.2400
|
30.1129
|
36.7500
|
|
September 30,
2018
|
41.1500
|
36.8900
|
38.4341
|
41.1500
|
|
October (through
October 25, 2018)
|
39.5000
|
36.9000
|
37.0583
|
36.6900
|
Source
: Banco de la Nación
Argentina
(1)
Average between the offer exchange rate and the bid exchange rate
according to Banco de la Nación Argentina’s foreign
currency exchange rate.
(2) The
maximum exchange rate appearing in the table was the highest
end-of-month exchange rate in the year or shorter period, as
indicated.
(3) The
minimum exchange rate appearing in the table was the lowest
end-of-month exchange rate in the year or shorter period, as
indicated.
(4)
Average exchange rates at the end of the month.
7
Exchange
controls
Although most
exchange control regulations were lifted on August 2016, some
remain in place and we cannot give you any assurance that
additional exchange control regulations will not be adopted in the
future. Please see “Item 3. Key information—d)Risk
Factors—Risks Relating to Argentina—Exchange controls,
restrictions on transfers abroad and capital inflow restrictions
may limit the availability of international
credit.”
Exchange controls
regulations currently in effect in Argentina include the
following:
Registration requirements
All
incoming and outgoing funds to and from the MULC and any foreign
indebtedness (financial and commercial) are subject to registration
requirements before the Central Bank for informative purposes, in
accordance with Communication “A” 6,401, as
amended.
Corporate profits and dividends
Argentine companies
may freely access the MULC for remittances abroad to pay earnings
and dividends in so far as they arise from closed and fully audited
balance sheets and have satisfied applicable certification
requirements.
Pursuant to
Resolution E 1/2017 of the Ministerio de Hacienda and Communication
“A” 6,150 of the Argentine Central Bank, it was deleted
the obligation that required non-residents to perform portfolio
investments in the country intended for the holding of private
sector financial assets to maintain for a period of 120 days of
permanence the funds in the country.
As of
that resolution and the provisions of Communication “A”
6,244 of the Argentine Central Bank, there are no restrictions on
entry and exit in the MULC.
Restrictions on exports, imports and services
Regarding exports,
in 2016 the Central Bank relaxed certain rules related to the
inflow and outflow of foreign currency collected abroad as a result
of the collection of exports of goods, advance payments, and
pre-export financings, establishing that the deadline to repatriate
to Argentina the foreign currency is 10 years. The prior
10-business day period applicable for the transfer of funds
collected abroad as a result of the collection of exports of goods,
advance payments, and pre-export financings to a correspondent bank
account of a local financial institution (
cuenta de corresponsalía
) was
eliminated in December 2015. In relation to the export of services,
Communication “A” 6,137 the Central Bank eliminated the
obligation to repatriate to Argentina the foreign currency
obtained.
Regarding imports,
access to the foreign exchange market for the payment of imports
with customs clearance date as of December 17, 2015 can be
paid through the local foreign exchange market without any limit.
AFIP Regulation No. 3,252 published on January 5, 2012
which required importers to file affidavits was eliminated in
December 2015 and the import monitoring system (
Sistema Integral de Monitoreo de
Importaciones,
or “SIMI”) was created, which
established an obligation for importers to submit certain
information electronically. Importers do not have to repatriate the
goods within a specified period (previously this period was 365
calendar days from the date of access to the foreign exchange
market).
Regarding the
payment of services, access to the foreign exchange market for
payments of services rendered as from December 17, 2015 may be
carried out without restriction and without the Central
Bank’s prior authorization.
Direct investments
Communication A
6401 established a new reporting system of direct investments,
which replaced the reporting system established by Communications A
3602 and A 4237, applicable since December 31, 2017. As of date,
investors who are Argentine residents must comply with the
information regime if the value of their investments abroad reaches
or exceeds the equivalent of US$1,000,000 (measured in terms of 1)
the sum of the flows of external assets and liabilities during the
previous calendar year, and 2) the balance of holdings of external
assets and liabilities at the end of the previous calendar year).
If the value of investments abroad does not exceed the equivalent
of US$50,000,000, the information regime must be complied on an
annual basis (in case it is less than US$10,000,000, the
information regime will be annual but with a simplified form),
instead of quarterly. If the value of the investments is less than
the equivalent of US$1,000,000, compliance with said regime is
optional.
Future and forward operations
The
Central Bank has significantly amended the foreign exchange
regulations in derivatives by eliminating the restriction on the
execution of cross-border derivative transactions. In August 2016,
the Central Bank introduced new foreign exchange regulations on
derivative transactions which allowed local residents from entering
into derivative transactions with foreign residents. Moreover, the
regulations now provide that Argentine residents may access the
foreign exchange market to pay premiums, post collateral and make
payments related to forwards, futures, options and other
derivatives entered into in foreign exchanges or with non-resident
counterparties.
8
The
foreign exchange regulations now allow Argentine residents to enter
into derivative transaction with foreign counterparties without the
need for authorization of the Central Bank. They also allow them to
purchase foreign currency to make payments under such derivative
transactions.
Law No.
27,440 in its articles 188 to 194 introduces, among others, the
following modifications related to derivatives:
● The right
of the non-bankrupted party and the contracting party of an
insurance entity subject to a judicial liquidation process to be
resolv in advance the derivatives and passes granted by the
Bankruptcy Law No. 24,522 and Law No. 20,091 of the Insurance
Entities shall not apply;
● The
restriction for the exercise of the contractual mechanisms of early
termination, termination, settlement, compensation and execution of
guarantees contained in the derivatives established by the
Financial Entities Law No. 21,526 and the Central Bank regulations
shall not apply to.
Operation Center in Israel
The
following table shows the maximum, minimum, average and closing
exchange rates for each period applicable to purchases of New
Israeli Shekels (NIS).
|
|
Maximum
(1)(2)
|
Minimum
(1)(3)
|
Average
(1)(4)
|
At
closing
(1)
|
|
Fiscal
year ended:
|
|
|
|
|
|
June 30,
2014
|
3.6213
|
3.4320
|
3.5075
|
3.4320
|
|
June 30,
2015
|
3.9831
|
3.4260
|
3.8064
|
3.7747
|
|
June 30,
2016
|
3.9604
|
3.7364
|
3.8599
|
3.8596
|
|
June 30,
2017
|
3.8875
|
3.4882
|
3.6698
|
3.4882
|
|
June 30,
2018
|
3.6573
|
3.3902
|
3.5276
|
3.6573
|
|
Month
ended:
|
|
|
|
|
|
April 30,
2018
|
3.5995
|
3.5020
|
3.5380
|
3.5995
|
|
May 31,
2018
|
3.6260
|
3.5613
|
3.5881
|
3.5648
|
|
June 30,
2018
|
3.6573
|
3.5569
|
3.6064
|
3.6573
|
|
July 31,
2018
|
3.6708
|
3.6234
|
3.6439
|
3.6708
|
|
August 31,
2018
|
3.7173
|
3.6051
|
3.6606
|
3.6051
|
|
September 30,
2018
|
3.6373
|
3.5709
|
3.5893
|
3.6373
|
|
October 2018
(through October 25, 2018)
|
3.6982
|
3.6236
|
3.6483
|
3.6982
|
Source
: Bloomberg
(1)
Average between the offer exchange rate and the bid exchange rate
of the New Israeli Shekel against the U.S. dollar.
(2) The
maximum exchange rate appearing in the table was the highest
end-of-month exchange rate in the year or shorter period, as
indicated.
(3) The
minimum exchange rate appearing in the table was the lowest
end-of-month exchange rate in the year or shorter period, as
indicated.
(4)
Average exchange rates at the end of the month.
B.
CAPITALIZATION AND INDEBTEDNESS
This
section is not applicable.
C.
REASONS FOR THE OFFER AND USE OF PROCEEDS
This
section is not applicable.
9
D.
RISK FACTORS
You
should carefully consider the risks described below, in addition to
the other information contained in this annual report, before
making an investment decision. We also may face additional risks
and uncertainties not currently known to us, or which as of the
date of this annual report we might not consider significant, which
may adversely affect our business. In general, you take more risk
when you invest in securities of issuers in emerging markets such
as Argentina than when you invest in securities of issuers in the
United States, and certain other markets. You should understand
that an investment in our common shares and American Depositary
Shares (“ADSs”) involves a high degree of risk,
including the possibility of loss of your entire
investment.
Operations Center in Argentina
Risks relating to Argentina
As of
the date of this annual report, many of our operations, property
and customers are located in Argentina. As a result, the quality of
our assets, our financial condition and the results of our
operations are dependent upon the macroeconomic, regulatory, social
and political conditions prevailing in Argentina from time to time.
These conditions include growth rates, inflation rates, exchange
rates, taxes, foreign exchange controls, changes to interest rates,
changes to government policies, social instability, and other
political, economic or international developments either taking
place in, or otherwise affecting, Argentina.
Economic and political instability in Argentina may adversely and
materially affect our business, results of operations and financial
condition.
The
Argentine economy has experienced significant volatility in recent
decades, characterized by periods of low or negative GDP growth,
high and variable levels of inflation and currency depreciation and
devaluation. The economy has experienced high inflation and GDP
growth has been sluggish in the last few years.
During
2014, the Argentine economy saw a slowdown due to the increase in
exchange rates and decreases in commodity prices that adversely
impacted exports. The Argentine economy continues to confront high
rates of inflation and has an increasing need of capital
investment, with many sectors, particularly the energy sector,
operating near full capacity.
In
March 2014, the Argentine Government announced a new method
for calculating GDP recommended by the IMF changing the base year
to 2004 from 1993. On June 29, 2016, a recalculation of
estimated GDP growth rates based on 2004 prices was undertaken and
resulted in calculated rates of 2.4% in 2013, (2.5)% in 2014, 2.7%
in 2015, (1.8)% in 2016 and 2.9% in 2017. According to the INDEC,
GDP growth in the first and second quarter of 2018 compared with
the same quarter in the previous year was 3.9% and (4.2)%,
respectively. According to the IMF, the estimated Argentina's real
GDP growth will be (2.6)% in 2018 and (1.6)% in 2019. Economic
activity in the second quarter of 2018 has been adversely affected
by the Central Bank’s increase in the reference rate to 60%
during that period to curtail the weakening of the Argentine peso.
As of August 31, 2018, the depreciation of the peso against the
U.S. dollar was 50.1% comparing to the beginning of the year. In
the second half of 2017 and the first half of 2018, the percentage
of people below the poverty line was 25.7% and 27.3%, respectively.
The unemployment rate in the first and second quarter of 2018 was
9.1% and 9.6%, respectively. The June 2018 / May 2018 variation of
the Monthly Economic Activity Estimator was (1.3)%. On October 8,
2018, the IMF published the "World Economic Outlook" report,
estimating an unemployment rate of 8.9% in 2018 and 9.4% in
2019.
On
February 22, 2017, Minister of the Treasury Nicolas Dujovne
announced fiscal targets for the period 2017-2019, ratifying the
target set in the 2017 budget which established a primary deficit
target of 4.2% of GDP for 2017, 3.2% for 2018 and 2.2% for 2019. On
May 4, 2018, Minister Dujovne lowered the primary deficit
target for 2018 to 2.7% of GDP in an effort to achieve a balanced
budget by 2019. After agreeing to a stand-By arrangement with the
IMF in June 2018, the Argentine Government has adjusted its
primary fiscal deficit target to 1.0% of GDP for 2019 and intends
to balance the budget by the end of 2020. On August 10, 2018, the
IMF commenced its first review of the Argentine economy. This
review is taking place during a complex period in Argentina as a
bribery scandal, which involves many important businessmen, is
underway and the Argentine peso is experiencing significant
depreciation. On September 3, 2018, the Ministry of Treasury has
adjusted its targets to a primary fiscal deficit of 2.6% of GDP in
2018, a balanced budget in 2019 and a primary fiscal surplus of
1.0% of GDP in 2019, through reducing the public primary
expenditure, including reducing by half the amount of national
ministries, from 20 to 10, but increasing the spending on social
benefits, including the strengthening of the fair price of basic
products policy and the universal child allowance (asignación
universal por hijo) through the one-time granting of an
extraordinary subsidy of Ps. 1,200 in September 2018. On September
26, 2018, the Argentine Government agreed with the IMF an increase
in the total amount of the stand by agreement from US$50 billion to
US$57.1 billion. In this sense, the anticipated disbursements rise
from US$6 billion to US$13.4 billion in 2018, and from US$11.4
billion to US$22.8 billion in 2019. On September 17, 2018, the
Argentine Government summited to the Argentine Congress the budget
law for fiscal year 2019 bill, ratifying the aforementioned
budgetary targets. On September 26, 2018, the Central Bank
announced a new monetary policy scheme aiming to lowering the
inflation rate by adopting the following measures: (i) no increase
in the level of the monetary base until June 2019, when it will be
adjusted with the seasonality of December 2018 and June 2019; (ii)
maintenance of the reference rate at 60% until the deceleration of
inflation rate is taking place; (iii) implementation of a floating
exchange rate with intervention and non-intervention zones for the
U.S. dollar exchange rate between Ps.34 and Ps.44, with daily
adjustment at a rate of 3% per month until the end of 2018 and its
revision at the beginning of 2019, intervening in the purchase or
sale of foreign
currency for up to
US$150 million per day to the extent that the exchange rate reaches
the established upper or lower bound.
10
Since
coming into power in December 2015, the Macri administration has
adopted the following key economic and policy reforms.
●
INDEC reforms.
President
Macri appointed Mr. Jorge Todesca, previously a director of a
private consulting firm, as head of the INDEC, based on its
determination that INDEC had failed to produce reliable statistical
information, particularly with respect to the consumer price index,
or “CPI”, GDP and poverty and foreign trade data. On
January 8, 2016, the Argentine government declared a state of
administrative emergency relating to the national statistical
system and the INDEC, until December 31, 2016. During 2016,
the INDEC implemented certain methodological reforms and adjusted
certain macroeconomic statistics on the basis of these reforms.
Following the declared emergency, the INDEC ceased publishing
statistical data until a rearrangement of its technical and
administrative structure is finalized. During the course of
implementing these reforms, however, INDEC has used official
Consumer Price Index, or “CPI,” figures and other
statistical information published by the Province of San Luis and
the City of Buenos Aires. On June 29, 2016, the INDEC
published revised GDP data for the years 2004 through 2015. On
August 31, 2016, the IMF Executive Board met to consider the
progress made by Argentina in improving the quality of official GDP
and CPI data and noted the important progress made in strengthening
the accuracy of Argentina’s statistics. On November 10,
2016, the IMF lifted the existing censure on Argentina regarding
these data. In June 2017, INDEC began to publish revised
CPI figures based on statistical information from 39 cities in
Argentina.
●
Agreement with holdout
bondholders.
The Argentine government has settled claims
with substantially all of the holdout bondholders who had not
previously participated in Argentina’s sovereign debt
restructurings (in terms of claims) and regained access to the
international capital markets, issuing several new series of
sovereign bonds since President Macri took office.
●
Foreign exchange reforms.
The Macri administration eliminated a significant portion of
foreign exchange restrictions, including certain currency controls,
previously in effect. On August 9, 2016, the Central Bank
issued Communication “A” 6037 which substantially
changed the existing legal framework and eliminated certain
restrictions limiting access to the foreign exchange market
Mercado Único y Libre de
Cambios
, or “MULC.” On May 19, 2017, the
Central Bank issued Communication “A” 6244, which
unified the exchange control regulations and relaxed certain
controls on the foreign exchange market. In addition, on
December 26, 2017, the Central Bank implemented a new unified
regime effective as of December 31, 2017 that requires the
filing of an annual return, which is mandatory for any person whose
total cash flow or balance of assets and liabilities amounts to
US$1 million or more during the previous calendar year. The
principal measures adopted as of the date of this annual report
include:
i. the
reestablishment of Argentine residents’ rights to purchase
and remit foreign currency outside of Argentina without limit and
without specific allocation (
atesoramiento
);
ii. the
elimination of the mandatory, non-transferable and non-interest
bearing 30% deposit previously required in connection with certain
transactions involving foreign currency inflows;
iii. the
elimination of the requirement to transfer and settle the proceeds
from new foreign financial indebtedness incurred by the foreign
financial sector, the non-financial private sector and local
governments through the MULC;
iv. the
elimination of the minimum stay-period that required that proceeds
from certain foreign financial indebtedness must be held for a
minimum of 365 calendar days; and
v.
elimination of the requirement of minimum holding period (of 72
business hours) for purchases and subsequent sales of securities
that trade in Argentina and in foreign stock markets (such as the
GDSs
).
●
Foreign trade reforms.
The
Macri administration eliminated export duties on wheat, corn, beef
and regional products, and announced a gradual reduction of the
duty on soybeans by 5% to 30%. Pursuant to Decree
No. 1,343/16, published in the Official Gazette on
January 2, 2017, the Argentine Government announced a gradual
reduction of the duty on soybeans, beans, flour and soybean oil by
0.5 % per month from January 2018 to December 2019. In
addition, the 5% export duty on most industrial exports and export
duties on mining was eliminated. With respect to payments for
imports of goods and services, the Macri administration announced
the gradual elimination of restrictions on access to the MULC for
any transactions originated before December 17, 2015.
Regarding transactions executed after December 17, 2015, no
quantitative limitations apply. However, on September 4, 2018, the
Argentine Government issued Decree No. 793/2018 that reimplements
an export duty of
12% until December
31, 2020 on export of goods and services, with a cap of Ps.4 for
each U.S. dollar for primary goods and services and Ps.3 for the
rest of the manufactured goods.
11
●
National electricity state of
emergency and reforms.
Following years of minimal investment
in the energy sector, exacerbated by the Argentine
Government’s failure to implement tariff increases on
electricity and natural gas since the 2001-2002 economic crisis,
Argentina began to experience energy shortages in 2011. In response
to the growing energy crisis, on December 15, 2015, the Macri
administration declared a state of emergency, which remained in
effect until December 31, 2017. In addition, through
Resolution No. 6/2016 of the Ministry of Energy and Mining and
Resolution No. 1/2016 of the National Electricity Regulatory
Agency (
Ente Nacional Regulador de
la Electricidad
), the Macri administration announced the
elimination of a portion of energy subsidies then in effect and
implemented a substantial increase in electricity tariffs. As a
result, average electricity prices increased substantially and
could increase further in the future. Certain of Macri´s
Administration initiatives have been challenged in Argentine courts
and resulted in judicial injunctions or determinations that limit
such initiatives. On May 31, 2018, the Argentine Congress
approved a law seeking to limit the increase in energy tariffs
implemented by the Macri administration, which was subsequently
vetoed by President Macri.
● Tax
Amnesty Law. In July 2016, the Régimen de Sinceramiento
Fiscal, or “Tax Amnesty Law,” was introduced to promote
the voluntary disclosure of undeclared assets by Argentine
residents. The Tax Amnesty Law allowed Argentine tax residents
holding undeclared funds or assets located in Argentina or abroad
to (i) declare such property prior to March 31, 2017
without facing prosecution for tax evasion or being required to pay
past-due tax liabilities on those assets, if they could provide
evidence that the assets were held as of certain specified cut-off
dates, and (ii) keep the declared property outside Argentina
and not repatriate such property to Argentina. With respect to cash
that was not deposited in bank accounts by the specified cut-off
dates, such amounts had to be disclosed and deposited by
October 31, 2016 in special accounts opened at Argentine
financial entities. Depending on the amount declared and how soon
it was declared, the election to subscribe for certain investment
securities and the payment method used, those who took advantage of
the Tax Amnesty Law paid a special tax of between 0% and 15% on the
total amount declared. Alternatively, they could invest an
equivalent amount in Argentine Government bonds or a fund created
to finance, among other things, public infrastructure projects and
small- to medium-sized businesses. Taxpayers could elect to
subscribe for certain investment securities and reduce the tax
rates payable upon disclosure of previously undisclosed assets. On
April 4, 2017, the Minister of Finance announced that as a
result of the Tax Amnesty Law, assets totaling US$116,800 million
were declared.
●
Retiree Program. On June 29, 2016, the Argentine Congress
enacted the Historical Reparation Program for Retirees and
Pensioners (Programa de Reparación Histórica para
Jubilados y Pensionados). The main aspects of this Program,
designed to reform social security policies to comply with Supreme
Court decisions, include (i) payments to more than two million
retirees and retroactive compensation of more than 300,000 retirees
and (ii) creation of a universal pension for senior citizens,
which guarantees a pension for all people over 65 years of age who
would not otherwise be eligible to retire with a pension. The
Historical Reparation Program for Retirees and Pensioners will
provide retroactive compensation to retirees for a total amount of
more than Ps.47,000 million and expenses of up to Ps.75,000 million
to cover all potential beneficiaries.
●
Increase in transportation
fares
. In January 2018, the Macri administration
announced an increase in public transport fares in the Greater
Buenos Aires area effective as of February 1,
2018.
●
Correction of monetary
imbalances:
The Macri administration announced the adoption
of an inflation targeting regime in parallel with the floating
exchange rate regime and set inflation targets for the next four
years. The interannual inflation targets (comparing the rates as of
December of each year) announced in 2016 by the Central Bank,
were from 12% to 17% for 2017, from 8% to 12% for 2018, and from
3.5% to 6.5% for 2019. The Central Bank has increased the use of
stabilization policies to reduce excess monetary imbalances and
increased peso interest rates to offset inflationary pressure. On
December 27, 2017, the Argentine Government modified the
inflation targets for 2018, 2019 and 2020, increasing them to 15%,
10% and 5%, respectively. In June 2018, the Central Bank
further adjusted inflation targets to 27% for 2018, 17% for 2019,
13% for 2020 and 9% for 2021 in light of the Stand-By Agreement
with the IMF. In addition, on September 26, 2018, the Central Bank
announced a new monetary policy scheme aiming to lowering the
inflation rate mainly by adopting a floating exchange rate scheme,
maintaining the reference rate at 60% until the deceleration of
inflation rate is taking place and stopping the monetary base
growth until June 2019, when it will be adjusted with the
seasonality of December 2018 and June 2019. On October 8, 2018, the
IMF published the "World Economic Outlook" report, estimating an
inflation rate of 40.5% in 2018 and 20.2% in 2019.
12
●
Pension system reform
. On
December 19, 2017, the Argentine Congress enacted the Pension
Reform Law which, among other amendments, adjusted the values of
pensions and social benefits in accordance with inflation and
economic growth. Social security payments are subject to quarterly
adjustments each year. 70% of the quarterly adjustment will be
based on the CPI published by the INDEC and 30% on the variation in
the
Remuneración Imponible
Promedio de los Trabajadores Estables
(an index published by
the Ministry of Labor that measures the salary increases of state
employees). On December 20, 2017, Decree No. 1,058/17 was
published and, with the aim of avoiding divergence with the
application of the previous formula, established a compensatory
bonus for retirees, pensioners and beneficiaries of the universal
child allowance (
asignación
universal por hijo
). On September 3, 2018, the Argentine
Government announced the strengthening of the universal child
allowance through the one-time granting of an extraordinary subsidy
of Ps.1,200 in September 2018. The Pension Reform Law also amended
the Labor Law to extend the age at which private sector employers
may request the retirement of employees to 70 years of age
(compared to 65 years under the prior regime). Notwithstanding the
foregoing, private sector employees may still request pension
benefits from the ages of 65 and 60 for male and female employees,
respectively.
●
Tax reform.
On
December 27, 2017, the Argentine Congress approved the tax
reform law, enacted on December 28, 2017. The reform is
intended to eliminate certain inefficiencies in the Argentine tax
regime, diminish tax evasion, expand the tax base and encourage
investment, with the long-term goal of restoring fiscal balance.
The reform is part of a larger policy initiative of the Macri
administration intended to increase employment, make the Argentine
economy more competitive (by reducing the fiscal deficit, for
example) and diminish poverty. The main aspects of the tax reform
include the following: (i) capital gains on real estate sales
by Argentine tax residents (subject to certain exceptions,
including a primary residence exemption) acquired after enactment
of the tax reform will be subject to tax of 15%; (ii) gains on
currently exempt bank deposits and sales of securities (including
sovereign bonds) by Argentine tax residents is subject to tax of
(a) 5% in the case of those denominated in pesos, subject to
fixed interest rate and not indexed, and (b) 15% for those
denominated in a foreign currency or indexed; (iii) gains on
sales of shares listed on a stock exchange remain exempt;
(iv) corporate income tax will decline to 30% in 2018 and 2019
and to 25% in 2020; (v) social security contributions will be
gradually increased to 19.5% starting in 2022, in lieu of the
differential scales currently in effect; and (vi) the
percentage of tax on debits and credits that can be credited to
income tax will be gradually increased over a five-year period,
from the current 17% for credits to 100% for credits and debits.
The tax reform is to be implemented over a period of one to five
years (depending on each modification). For further information,
see “Taxation—”
—Argentine
Taxation”.
.
●
Corporate Criminal Liability
Law
. On November 8, 2017, the Argentine Congress
approved Law No. 27,401, which establishes a system of
criminal liability of corporate entities for criminal offenses
against public administration and national and cross-border bribery
committed by, among others, its shareholders, attorneys-in-fact,
directors, managers, employees, or representatives. Convicted legal
persons are subject to various sanctions including a fine of
between 1% and 20% of its annual gross revenue and the partial or
total suspension of its activities for up to ten years. In
addition, the law expands the national criminal jurisdiction to all
cases of bribery including those committed outside the Argentine
territory by citizens or companies with domicile or headquartered
in Argentina.
●
Public-Private Participation
Law
. On November 16, 2016, the Public-Private
Participation Law was passed by the Argentine Congress, and has
been regulated by Decree No. 118/2017. This new regime seeks
to replace existing regulatory frameworks (Decrees
No. 1,299/00 and 967/05) and supports the use of
public-private partnerships for a wide variety of purposes
including the design, construction, extension, improvement,
provision, exploitation and/or operation and financing of
infrastructure development, provision of public services, provision
of productive services, investments, applied research,
technological innovation and other associated services. The
Public-Private Participation Law also includes protection
mechanisms in favor of the private sector (contractors and lenders)
in order to promote the development of these
partnerships.
●
Productive Financing Law.
On May 9, 2018, the Argentine Chamber of Deputies approved Law
No. 27,440 called “
Ley
de Financiamiento Productivo
”, which creates a new
financing regime for micro-, small- and medium-sized companies
(“MiPyMEs”) and modifies Capital Markets Law
No. 26,831, Investment Funds Law No. 24,083 and Law
No. 23,576, among others, and implements certain tax
provisions and regulations for derivative financial
instruments.
●
Labor reform bill
. On
November 18, 2017, the Executive Branch submitted a draft
labor and social security reform bill to the Argentine Chamber of
Senators, intended to formalize employment, decrease labor
litigation, generate employment, increase productivity, protect
vulnerable populations and improve worker training. As of the date
of this annual report, the draft bill has not been considered by
the Argentine Congress.
13
●
Fiscal consensus and fiscal
liability
. On December 22, 2017, the Argentine Congress
enacted the “Fiscal Pact”, also known as the
“Fiscal Consensus”. The Fiscal Consensus includes a
commitment to lower distortive taxes by 1.5% of GDP over the next
five years, a withdrawal of lawsuits by provincial governments
against the Argentine Government and a Ps.21,000 million payment to
the Province of Buenos Aires for the year 2018 (which amount shall
be increased over the next five years) as a partial and progressive
solution to a long-standing conflict related to the Buenos Aires
Metropolitan Area Fund over the
Fondo del Conurbano Bonaerense
. The
Fiscal Consensus also set the basis for other policy reforms that
were implemented by the Macri administration in December 2017,
such as the tax reform, the pension system reform and the Fiscal
Responsibility Law (
Ley de
Responsbilidad Fiscal
). The fiscal deficit estimated for
2018 is 2.6% of 2018 GDP. The budget law for fiscal year 2019 bill
projects a balanced budget in 2019 and a primary fiscal surplus of
1.0% of GDP by 2020.
●
IMF stand-by arrangement:
On June 7, 2018, the Argentine Government entered into a US$50
billion, 36-month stand-by arrangement with the IMF, which was
approved by the IMF’s Executive Board on June 20, 2018.
As of July 31, 2018, the Argentine Government had drawn on a
first tranche of approximately US$15 billion, and the additional
available funds will be treated as precautionary. This measure was
intended to halt the significant depreciation of the peso during
the first half of 2018.
On
September 26, 2018, the Argentine Government agreed with the IMF to
increase the total amount of the stand-by arrangement from US$50
billion to US$57.1 billion. As a result, the anticipated
disbursements increased from US$6 billion to US$13.4 billion in
2018, and from US$11.4 billion to US$22.8 billion in 2019. On
October 26, 2018, the Executive Board of the IMF completed the
first review of Argentina’s economic performance under
the36-month stand-by arrangement, allowing to draw the equivalent
of US$5.7 billion, bringing total disbursements since June 2018 to
about US$20.4 billion. The Executive Board also approved an
augmentation of the stand-by arrangement to increase access to
about US$56.3 billion.
The
impact that these measures, and any future measures taken by a new
administration, will have on the Argentine economy as a whole and
the financial sector in particular cannot be predicted. Economic
liberalization may be disruptive to the economy and may fail to
benefit, or may harm, our business, financial condition and results
of operations. In particular, we have no control over the
implementation of the reforms to the regulatory framework that
governs its operations and cannot guarantee that these reforms will
be implemented or that they will be implemented in a manner that
will benefit our business. The failure of these measures to achieve
their intended goals could adversely affect the Argentine economy
and our business, financial position and results of
operations.
In this
context, as the date of this annual report, the Argentine economy
remains unstable, among others, for the following
reasons:
● a
persistent high rate of public spending and substantial fiscal
deficit;
● investments
as a percentage of GDP remain low;
● public debt
as a percentage of GDP remains high;
● the
inflation rate remains at high levels;
●
agricultural exports, which fueled the economic recovery, have been
affected by the drought and lower prices than in prior
years;
● rising of
international crude oil prices;
● the
availability of long-term credit to the private sector is
scarce;
● the current
trade deficit is high and could increase;
● the effects
of a restrictive U.S. monetary policy, which could generate an
increase in financial costs for Argentina;
●
fluctuations in the Central Bank’s monetary
reserves;
● uncertainty
with respect to the imposition of exchange and capital controls;
and
● other
political, social and economic events abroad that adversely affect
the current growth of the Argentine economy.
14
A
further decline in Argentine economic growth or an increase in
economic instability could adversely affect our business, financial
condition or results of operations. As of the date of this annual
report, the impact of the Macri administration’s policies on
the Argentine economy as a whole and on the banking sector in
particular cannot be predicted. In addition, congressional
elections were held on October 22, 2017 and President
Macri’s governing coalition obtained the largest share of
votes at the national level. Although the number of coalition
members in Congress increased (holding in the aggregate 108 of a
total of 257 seats in the House of Representatives and 24 of 72
seats in the Senate), the coalition still lacks a majority in
either chamber and, as a result, some or all of the policy
proposals to promote growth of the economy (including reducing the
fiscal deficit, controlling inflation and adopting fiscal and labor
reforms) may not be implemented, which could adversely affect
continued economic growth in Argentina. Higher rates of inflation,
any decline in GDP growth rates and/or other future economic,
social and political developments in Argentina, fluctuations in the
rate of exchange of the Peso against other currencies, and a
decline in consumer confidence or foreign direct investment, among
other factors, may materially and adversely affect the development
of the Argentine economy which could adversely affect our business,
financial condition or results of operations.
Continuing inflation may have an adverse effect on the economy and
our business, financial condition and the results of our
operations.
According to the
INDEC, the CPI was 10.8% in 2012, 10.9% in 2013, and 23.9% in 2014.
In November 2015, the INDEC suspended the publication of the
CPI.
Hence, there was
not an official CPI publication for the year 2015. An alternative
CPI report was informed by the INDEC’s official website,
depicting two alternative CPIs measurements: one published by the
City of Buenos Aires and the other by the Province of San Luis,
reaching 26.9% and 31.9%, respectively.
After implementing
certain methodological reforms and adjusting certain macroeconomic
statistics based on these reforms, in June 2016, INDEC
resumed publishing the CPI. The best available information for 2016
is the annual measurement of the index of consumer prices reported
by the City of Buenos Aires of 41%. In 2017, inflation began to
decrease in line with the Central Bank’s inflation targeting
policies. According to the INDEC, the CPI increased 24.8% in 2017
and 1.8%, 2.4%, 2.3%, 2.7%, 2.1%, 3.7%, 3.1%
, 3.9
and
6.5% for January, February, March, April, May, June, July, August,
and September 2018, respectively. At the end of 2017, Minister
Dujovne announced that the CPI targets previously set out in the
2017 budget were revised to 15% for 2018, 10% for 2019 and 5% for
2020. After agreeing to a stand-by arrangement with the IMF in
June 2018, the Argentine Government has adjusted its CPI
targets to 27% for 2018, 17% for 2019, 13% for 2020 and 9% for
2021. In August 2018, the Central Bank adjusted its CPI targets to
40.5% for 2018, 24.5% for 2017 and 18% for 2020. On October 8,
2018, the IMF published the "World Economic Outlook" report,
estimating an inflation rate in Argentina of 40.5% in 2018 and
20.2% in 2019.
On October 25, 2018, the Argentine Chamber of Deputies gave preliminary approval to the draft budget for fiscal year 2019, estimating a year-on-year inflation rate of 23% for 2019, and it is expected to be treated in the Argentine Chamber of Senators on November 14, 2018.
On October 25, 2018, the Argentine Chamber of Deputies gave preliminary approval to the draft budget for fiscal year 2019, estimating a year-on-year inflation rate of 23% for 2019, and it is expected to be treated in the Argentine Chamber of Senators on November 14, 2018.
Historically, high
rates of inflation have undermined the Argentine economy and the
Argentine Government’s ability to foster conditions for
stable growth. High rates of inflation may also undermine
Argentina’s competitiveness in international markets and
adversely affect economic activity and employment, as well as our
business, financial condition and the results of our
operations.
High
rates of inflation would also adversely affect economic activity,
employment, real salaries, consumption and interest rates. In
addition, the dilution of the positive effects of any depreciation
of the peso on the export-oriented sectors of the Argentine economy
would decrease the level of economic activity in the country. In
turn, a portion of the Argentine Government’s outstanding
debt is adjusted by the Coeficiente de Estabilización de
Referencia (or “CER”), a currency index tied to
inflation. Therefore, any significant increase in inflation would
generate an increase in Argentina’s debt measured in pesos
and, consequently, its financial obligations.
In
recent years, the Argentine Government has taken certain measures
to contain inflation, such as implementing a fair price program
that requires supermarkets to offer certain products at a
government-determined price, and agreements with workers’
unions to implement salary increases. Additionally, the Argentine
Government enacted Law No. 26,991 (the “Supply
Law”), which empowers it to intervene in certain markets when
it considers that any market participant is trying to impose prices
or supply restrictions. The Supply Law provides among others
pecuniary sanctions, suspension, seizure of operations, and
confiscation of goods. On September 3, 2018, the Argentine
Government further strengthened the fair price program by
incorporating more basic consumer goods and places of distribution
around the country into the program.
15
We
cannot assure you that inflation rates will not continue to
escalate in the future or that the measures adopted or that may be
adopted by the Argentine Government to control inflation will be
effective or successful. Inflation remains a challenge for
Argentina. For example, certain objectives of the Argentine
Government, such as the increase in tariffs to incentivize
investment in the energy sector, may create inflationary pressures.
Significant inflation could have an adverse effect on
Argentina’s economy and in turn could increase our costs of
operation, in particular labor costs, and may negatively affect our
business, financial condition and the results of our operations.
See “—We depend on macroeconomic and political
conditions in Argentina”.
The Peso qualifies as a currency of a hyperinflationary economy
under IAS 29. Accordingly, we will apply IAS 29 for periods ending
after July 1, 2018 and our historical audited consolidated
financial statements and other financial information will need to
be restated.
IAS 29
requires that financial statements of any entity whose functional
currency is the currency of a hyperinflationary economy, whether
based on the historical cost method or on the current cost method,
be stated in terms of the measuring unit current at the end of the
reporting period. IAS 29 does not establish a set inflation rate
beyond which an economy is deemed to be experiencing
hyperinflation. However, hyperinflation is commonly understood to
occur when changes in price levels are close to or exceed 100% on a
cumulative basis over the prior three years, along with the
presence of several other qualitative macroeconomic
factors.
During
the six-month period ended June 30, 2018, the decreasing trend
of inflation in Argentina noted in recent prior periods reversed,
with variations in different indexes being higher than in previous
months. The total cumulative inflation in Argentina in the 36
months prior to June 30, 2018, as measured by the wholesale
price index published by the INDEC, has exceeded 100%. Qualitative
macroeconomic factors, including the depreciation of the peso in
recent months, also support the conclusion that Argentina is now a
hyper-inflationary economy for accounting purposes.
Accordingly, IAS 29 will be applicable for financial
statements included in any of our filings with the SEC under the
Securities Act or the Exchange Act for periods ending after
July 1, 2018 and, therefore, our audited consolidated
financial statements and any unaudited interim financial statements
included in this annual report will need to be adjusted by applying
a general price index and expressed in the measuring unit (the
hyperinflationary currency) current at the end of the most recent
reporting period.
Pursuant to Decree
No. 664/2003, the Argentine Government prohibited regulatory
entities of the national government, fom receiving financial
information from regulated entities that includes adjustments for
inflation, changes in costs or other variations in taxes, prices or
tariffs. In addition, Law No. 23,928 prohibits Argentine
companies from including adjustments for inflation in their
financial statements. Given the current state of Argentine law, we
cannot assure you whether regulatory agencies of the Argentine
national government will require us to not apply IAS 29 to
financial statements furnished to such regulators. If regulatory
agencies in Argentina require us not to apply IAS 29, or to only
apply IAS 29 to certain, but not all, of the periods included in
our audited consolidated financial statements and unaudited interim
financial statements, the audited consolidated financial statements
and any unaudited interim financial statements included in this
prospectus may not be comparable to certain of our financial
statements furnished to regulators in Argentina.
We have
not estimated yet the impact of the application of IAS 29
provisions on our audited consolidated financial
statements.
We cannot assure that the accuracy of Argentina’s official
inflation statistics will comply with international
standards.
In
January 2007, the INDEC modified its methodology to calculate
the CPI. At the time that the INDEC adopted this change in
methodology, the Argentine Government replaced several key officers
at the INDEC, prompting complaints of governmental interference
from the technical staff at the INDEC. The IMF requested Argentina
to clarify the INDEC methodology used to calculate inflation
rates.
On
November 23, 2010, the Argentine Government began consulting
with the IMF for technical assistance in order to prepare new CPI
information with the aim of modernizing the current statistical
system. During the first quarter of 2011, a team from the IMF
started collaborating with the INDEC in order to create such an
index. Notwithstanding such efforts, subsequently published reports
by the IMF stated that its staff delivered alternative measures of
inflation for macroeconomic surveillance, including information
produced by private sources, and asserted that such measures
resulted in inflation rates considerably higher than those
published by the INDEC since 2007. Consequently, the IMF called on
Argentina to adopt measures to improve the quality of data used by
the INDEC. In a meeting held on February 1, 2013, the
Executive Board of the IMF emphasized that the progress in
implementing remedial measures since September 2012 had been
insufficient. As a result, the IMF issued a
declaration of
censure against Argentina in connection with the breach of its
related obligations and called on Argentina to adopt remedial
measures to address the inaccuracy of inflation and GDP data
immediately.
16
In
order to address the quality of official data, a new consumer price
index (the “IPCNu”), was enacted on February 13,
2014. Inflation as measured by the IPCNu was 23.9% in 2014, 31.6%
in 2015 and 31.4% in 2016. The IPCNu represents the first national
indicator in Argentina to measure changes in prices of household
goods for final consumption. While the previous price index only
measured inflation in the Greater Buenos Aires area, the IPCNu is
calculated by measuring prices of goods in the main urban centers
of the 23 provinces of Argentina and the City of Buenos Aires. On
December 15, 2014, the IMF recognized the evolution of
Argentine authorities to remedy the provision of data, but delayed
the definitive evaluation of the new price index.
On
January 8, 2016, based on its determination that the INDEC
historically failed to issue reliable statistical information, the
Macri administration issued
a necessity and
urgency
decree, suspending the publication of statistical
information. The INDEC suspended all publications of statistical
information until the process of technical reorganization was
completed and the administrative structure of the INDEC was
recomposed. At the end of this process of reorganization and
recovery, the INDEC gradually began to publish official
information. The INDEC recalculated historical GDP and the revised
measurements showed that the GDP increased 2.4% in 2013, contracted
2.5% in 2014, increased 2.7% in 2015, and contracted 1.8% in
2016.
On
November 9, 2016, the IMF, after analyzing the progress made
with respect to the accuracy of official statistics regarding the
CPI, decided to lift the censorship imposed in 2013, and determined
that the Argentine CPI currently complies with international
standards. However, we cannot assure you that such inaccuracy
regarding official economic indicators will not recur. If despite
the changes introduced by the Macri administration these
differences between the figures published by the INDEC and those
registered by private consultants persist, there could be a
significant loss of confidence in the Argentine economy, which
could adversely affect our business, financial condition and the
results of our operations.
High levels of public spending in Argentina could generate long
lasting adverse consequences for the Argentine
economy.
During
recent years, the Argentine Government has substantially increased
public spending. In 2015, government spending increased by 34.4% as
compared to 2014, resulting in a primary fiscal deficit of 3.8% of
GDP. In 2016, government spending increased by 42.8% as compared to
2015, resulting in a primary fiscal deficit of 4.2% of GDP. In
2017, government spending increased by 25.9% as compared to 2016,
resulting in a primary fiscal deficit of 3.8% of GDP. If government
spending continues to outpace revenues, the fiscal deficit is
likely to increase and past sources of funding to address such
deficit, such as the Central Bank and the Administración
Nacional de la Seguridad Social (“ANSES”) may be
utilized.
Any
such increasing deficit could have a negative effect on the
Argentine Government’s ability to access the long-term
financial markets, and in turn, could limit the access to such
markets for Argentine companies, which could adversely affect our
business, financial condition and the results of our
operations.
Argentina’s ability to obtain financing in the international
capital markets is limited, which may impair its ability to
implement reforms and public policies and foster economic
growth.
Argentina has had
limited access to foreign financing in recent years, primarily as a
result of a default in December 2001 by Argentina on its debt
to foreign bondholders, multilateral financial institutions and
other financial institutions. Argentina’s 2001 default and
its failure to fully restructure its sovereign debt and negotiate
with the holdout creditors has limited and may continue to limit
Argentina’s ability to access international capital markets.
In 2005, Argentina completed the restructuring of a substantial
portion of its defaulted sovereign indebtedness and settled all of
its debt with the IMF. Additionally, in June 2010, Argentina
completed the renegotiation of approximately 67% of the principal
amount of the defaulted bonds outstanding that were not swapped in
the 2005 restructuring. As a result of the 2005 and 2010 debt
swaps, Argentina has restructured approximately 92.1% of its
defaulted debt that was eligible for restructuring (the “Debt
Exchanges”). Holdout creditors that had declined to
participate in the exchanges commenced numerous lawsuits against
Argentina in several countries, including the United
States, Italy, Germany, and Japan.
As a
result of the litigation filed by holdout bondholders and their
related efforts to attach Argentina’s sovereign property
located in the United States and other jurisdictions,
Argentina’s ability to access the international capital
markets was severely limited. In February 2016, the Argentine
Government agreed with a group of Italian bondholders to pay in
cash the total principal amount of debt owed to such holders. In
mid-2016, the Argentine Government emerged from default and paid
US$900 million to the approximately 50,000 Italian bondholders who
owned government securities with defaulted payments part
due.
17
During
February 2016, U.S. federal court special master Daniel
Pollack ratified an agreement between the Argentine Government and
the holdout creditors led by Elliot Management, Aurelius Capital,
Davidson Kempner and Bracebridge Capital funds providing for a
US$4.65 billion payment in respect of defaulted sovereign bonds,
representing a 25% discount to the total principal amount of
principal and interest due on the defaulted bonds, as well as
attorney fees and expenses incurred. This agreement stipulated that
the terms of the settlement be approved by the Argentine Congress,
and that Law No. 26,017 (the “Padlock Law”) and
the Sovereign Payment Law be repealed.
In
March 2016, the Argentine Government submitted a bill to
Congress seeking authorization to consummate the settlement, which
was approved on April 1, 2016, by enactment of Law
No. 27,249 pursuant to which, the Argentine Government was
authorized to pay in cash up to US$11.6 billion to the holdout
bondholders. The proceeds for such payment were raised through an
issuance of sovereign debt in the international capital markets.
Among other provisions, the new law repealed the Padlock Law and
Sovereign Payment Law.
At the
beginning of April 2016, special master Daniel Pollack
announced that the Argentine Government had reached agreements with
additional holdout bondholders. As a result, the Argentine
Government has reached agreements with nearly 90% of the debt
holders that did not participate in the 2005 and 2010 bond exchange
transactions. On April 13, 2016, the Court of Appeals lifted
the restrictions on Argentina to fulfill its debt obligations. In
April 2016, the Argentine Government issued US$16.4 billion
principal amount of bonds. On April 22, 2016, the Argentine
Government paid amounts due under the agreement and the U.S. courts
removed all previously issued sanctions and injunctions. From
December 31, 2015 to December 31, 2017, Argentina’s
sovereign debt increased by US$80.3 billion, according to the
Ministry of the Treasury.
As of
the date of this annual report, proceedings initiated by holdouts
and other international creditors that did not accept
Argentina’s payment offer continue in several jurisdictions,
although the size of the claims involved has declined considerably.
The potential consequences of final judgments from courts in
various jurisdictions are unclear and further adverse rulings could
adversely affect the Argentine Government’s ability to issue
debt securities or obtain favorable terms when the need to access
the international capital markets arises, and consequently, our own
capacity to access these markets could also be
limited.
Foreign shareholders of
companies operating in Argentina have initiated investment
arbitration proceedings against Argentina
that have resulted and
could result in arbitral awards and/or injunctions against
Argentina and its assets and, in turn, limit its financial
resources.
In
response to the emergency measures implemented by the Argentine
Government during the 2001-2002 economic crisis, a number of claims
were filed before the International Centre for Settlement of
Investment Disputes (“ICSID”), against Argentina.
Claimants allege that the emergency measures were inconsistent with
the fair and equitable treatment standards set forth in various
bilateral investment treaties by which Argentina was bound at the
time.
Claimants have also
filed claims before arbitral tribunals under the rules of the
United Nations Commission on International Trade Law, or
“UNCITRAL,” and under the rules of the
International Chamber of Commerce (ICC). As of the date of this
annual report, it is not certain that Argentina will prevail in
having any or all of these cases dismissed, or that if awards in
favor of the plaintiffs are granted, that it will succeed in having
those awards annulled. Ongoing claims before the ICSID tribunal and
other arbitral tribunals could lead to new awards against
Argentina, which could have an adverse effect on our capacity to
access to the international capital markets.
The amendment of the Central Bank’s Charter and the
Convertibility Law may adversely affect the Argentine
economy.
On
March 22, 2012, the Argentine Congress passed Law
No. 26,739, which amended the Charter of the Central Bank and
Law No. 23,298 (the “Convertibility Law”). This
law amends the objectives of the Central Bank (established in its
Charter) and includes a mandate focused on promoting social equity
programs in addition to developing monetary policy and financial
stability.
A key
component of the Central Bank Charter amendment relates to the use
of international reserves. Pursuant to this amendment, Central Bank
reserves may be made available to the Argentine Government for the
repayment of debt or to finance public expenditures. During 2013,
U.S. dollar reserves held at the Central Bank decreased to US$30.6
billion from US$43.3 billion in 2012, while during 2014 reserves
increased to US$31.4 billion. The Central Bank’s foreign
currency reserves were US$25.6 billion as of December 31,
2015, US$39.3 billion as of December 30, 2016, US$55.1 billion
as of December 29, 2017 and US$52.7 billion as of
August 31, 2018.
The Argentine
Government’s use of Central Bank reserves to repay debt or to
finance public expenditures may make the Argentine economy more
vulnerable to higher rates of inflation or external shocks, which
could adversely affect our business, financial condition and the
results of our operations.
18
Significant fluctuations in the value of the Peso may adversely
affect the Argentine economy as well as our financial
performance.
Despite
the positive effects of the depreciation of the peso in 2002 on the
competitiveness of certain sectors of the economy, depreciation has
had a negative impact on the ability of Argentine businesses to
honor their foreign currency-denominated debt obligations,
initially resulting in high rates of inflation and significantly
reduced real wages, which has had a negative impact on businesses
that depend on domestic demand, such as utilities and the financial
industry, and has adversely affected the Argentine
Government’s ability to honor its foreign
currency-denominated debt obligations.
Since
the strengthening of foreign exchange controls began in late 2011,
and upon introduction of measures that gave private companies and
individuals limited access to foreign currency, the implied peso
exchange rate, as reflected in the quotations for Argentine
securities that trade in foreign markets compared to the
corresponding quotations in the local market, increased
significantly compared to the official exchange rate.
In
2015, the U.S. dollar to peso exchange rate increased 53% as
compared to 2014. In 2016, the U.S. dollar to peso exchange rate
increased 22% as compared to 2015. In 2017, the U.S. dollar to peso
exchange rate increased 18% as compared to 2016. This trend
continued in the first few months of 2018, with an increase of 7%
from December 31, 2017 to March 31, 2018. Further, the U.S. dollar
to peso exchange rate increased approximately 97.7%, from Ps.20.69
in April 27, 2018 to Ps.40.90 as of September 28, 2018. On October
25, 2018, the Argentine Chamber of Deputies gave preliminary
approval to the draft budget for fiscal year 2019, estimating an
average exchange rate of Ps.40.10 for US$1.00 in 2019, Ps.44.30 for
US$1.00 in 2020, Ps.48.20 for US$1.00 in 2021 and Ps.50.50 for
US$1.00 in 2022, and it is expected to be treated in the Argentine
Chamber of Senators on November 14, 2018.
As a
result of the significant depreciation of the peso against the U.S.
dollar, on October 11, 2018 the Central Bank increased the monetary
policy rate to 72.73% aiming to attract investments in this
currency. This high interest rate deteriorates the conditions for
accessing credit by individuals and legal entities, producing an
increase in debt levels paid off, which could adversely affect our
business, financial condition and the results of our
operations.
In
addition, high interest rates in pesos may not be sustainable in
the medium term, which could affect the level of economic activity
reducing consumption. As a result, a contraction in GDP is expected
for 2018.
A
significant further depreciation of the peso against the U.S.
dollar could have an adverse effect on the ability of Argentine
companies to make timely payments on their debts denominated,
indexed or otherwise connected to a foreign currency, could
generate very high inflation rates, reduce real salaries
significantly, and have an adverse effect on companies focused on
the domestic market, such as public utilities and the financial
industry. Such a potential depreciation could also adversely affect
the Argentine Government’s capacity to honor its foreign
debt, which could affect our capacity to meet obligations
denominated in a foreign currency which, in turn, could have an
adverse effect on our business, financial condition and the results
of our operations . While certain of our office leases are set in
U.S. dollars, we are only partially protected against depreciation
of the Peso and there can be no assurance we will be able to
maintain our U.S. dollar-denominated leases.
In
addition, on June 7, 2018, the Argentine Government entered
into a US$50 billion 36-month stand-by Arrangement with the IMF,
which was approved by the IMF’s Executive Board on
June 20, 2018. The Argentine Government has drawn on a first
tranche of approximately US$15 billion, and the additional
available funds will be treated as precautionary. This step was
intended to halt the significant depreciation of the peso. This
measure was intended to halt the significant depreciation of the
peso during the first half of 2018. On September 26, 2018, the
Argentine Government agreed with the IMF an increase the total
amount of the stand-by agreement from US$50 billion to US$57.1
billion.
Consequently,
disbursements are expected to increase from US$6 billion to US$13.4
billion in 2018, and from US$11.4 billion to US$22.8 billion in
2019. On October 26, 2018, the Executive Board of the IMF completed
the first review of Argentina’s economic performance under
the36-month stand-by arrangement, allowing to draw the equivalent
of US$5.7 billion, bringing total disbursements since June 2018 to
about US$20.4 billion. The Executive Board also approved an
augmentation of the stand-by arrangement to increase access to
about US$56.3 billion.
On
September 26, 2018, the Central Bank announced a new monetary
policy scheme aiming to lowering the inflation rate by adopting the
following measures: (i) no increase in the level of the monetary
base until June 2019, when it will be adjusted with the seasonality
of December 2018 and June 2019; (ii) maintenance of the monetary
policy rate at 60% until the deceleration of inflation rate is
taking place; (iii) implementation of a floating exchange rate with
intervention and non-intervention zones for the U.S. dollar
exchange rate between Ps.34 and Ps.44, with daily adjustment at a
rate of 3% per month until the end of 2018 and its revision at the
beginning of 2019, intervening in
the purchase or
sale of foreign currency for up to US$150 million per day to the
extent that the exchange rate reaches the established upper or
lower bound.
A
substantial appreciation of the peso against the U.S. dollar could
negatively impact the financial condition of entities whose foreign
currency-denominated assets exceed their foreign
currency-denominated liabilities. In addition, in the short-term, a
significant real appreciation of the peso would adversely affect
exports and could result in a slowdown in economic growth. This
could have a negative effect on GDP growth and employment as well
as reduce the Argentine public sector’s revenues by reducing
tax collection in real terms, given its current heavy reliance on
taxes on exports. As a result, the appreciation of the peso against
the U.S. dollar could also have an adverse effect on the Argentine
economy and, in turn, our business, financial condition and the
results of our operations.
19
Certain measures that may be taken by the Argentine Government may
adversely affect the Argentine economy and, as a result, our
business and the results of our operations.
Prior
to December 2015, the Argentine Government accelerated its
direct intervention in the economy through the implementation or
amendment of laws and regulations, including with respect to
nationalizations and/or expropriations; restrictions on production,
imports and exports; foreign exchange and/or transfer restrictions;
direct and indirect price controls; tax increases, changes in the
interpretation or application of tax laws and other retroactive tax
claims or challenges; cancellation of contract rights; and delays
or denials of governmental approvals, among others.
In
November 2008, the Argentine Government enacted Law
No. 26,425 which provided for the nationalization of the
Administradoras de Fondos de Jubilaciones y Pensiones (the
“AFJPs”). In April 2012, the Argentine Government
nationalized YPF S.A. and imposed major changes to the system under
which oil companies operate, principally through the enactment of
Law No. 26,714 and Decree No. 1,277/2012. In
February 2014, the Argentine Government and Repsol S.A. (the
former principal shareholder of YPF S.A.) announced that they had
reached an agreement on the compensation payable to Repsol S.A. for
the expropriation of YPF S.A. of US$5 billion payable in Argentine
sovereign bonds with various maturities. On April 23, 2014,
the agreement with Repsol S.A. was approved by the Argentine
Congress and on May 8, 2014, Repsol S.A. received the relevant
Argentine Government bonds. On July 10, 2018, the United
States Court of Appeals for the Second Circuit affirmed a U.S.
federal trial court decision, finding that Burford
Capital
Ltd’s
claim for more than US$3 billion in damages
against the Argentine government in connection with the
nationalization of YPF S.A. is subject to the jurisdiction of the
U.S. federal courts. The claim by Burford Capital Ltd has been
referred to the trial court for substantive
proceedings.
There
are other examples of intervention by the Argentine Government. In
December 2012 and August 2013, Argentine Congress established new
regulations relating to domestic capital markets. The regulations
generally provided for increased Argentine Government intervention
in the capital markets authorizing, for example, the CNV to appoint
observers with the ability to veto the decisions of the board of
directors of publicly listed companies under certain circumstances
and to suspend the board of directors for a period of up to 180
days. However, on May 9, 2018, the Argentine Congress approved Law
No. 27,440, which introduced modifications to the Capital Markets
Law, including the removal of the CNV’s power to appoint
supervisors with powers of veto over resolutions adopted by a
company’s board of directors.
We
cannot assure you that these or similar and other measures to be
adopted by the Argentine Government, such as expropriation,
nationalization, forced renegotiation or modification of existing
contracts, new tax policies, modification of laws, regulations and
policies that affect foreign trade, investment, among others, will
not have an adverse effect on the Argentine economy and, as a
consequence, adversely affect our business, financial condition and
the results of our operations.
The Argentine Government may mandate salary increases for private
sector employees, which would increase our operating
costs.
In the
past, the Argentine Government has passed laws, regulations and
decrees requiring companies in the private sector to maintain
minimum wage levels and provide specified benefits to employees. In
the aftermath of the Argentine economic crisis, employers both in
the public and private sectors experienced significant pressure
from their employees and labor unions to increase wages and provide
additional employee benefits. In August 2012, the Argentine
Government established a 25% increase in the minimum monthly salary
to Ps.2,875, effective as of February 2013. The Argentine
Government increased the minimum monthly salary to Ps.3,300 in
August 2013, to Ps.3,600 in January 2014, to Ps.4,400 in September
2014, to Ps.4,716 in January 2015, to Ps.5,588 in August 2015 and
to Ps.6,060 as of January 2016. In May 2016, the Argentine
Government announced a 33% increase in the minimum monthly salary
to be implemented in three installments as follows: Ps.8,060 as of
July 1, 2017, Ps.9,500 as of January 1, 2018 and Ps.10,000 in July
2018, an increase of 24% compared to the prior minimum. On August
8, 2018, the National Council for Employment, Productivity and
Minimum Wage (Consejo Nacional del Empleo, la Productividad y el
Salario M’nimo, Vital y Móvil), summoned by the National
Labor Ministry, issued Resolution No. 3/2018 increasing the minimum
monthly salary in four installments as follows: Ps.10,700 as of
September 1, 2018, Ps.11,300 as of December 1, 2018, Ps.11,900 as
of March 1, 2019 and Ps.12,500 as of June 2019, an increase of 25%
compared to the prior minimum.
It is
possible that the Argentine Government could adopt measures
mandating further salary increases and/or the provision of
additional employee benefits in the future. Any such measures could
have a material and adverse effect on our business, financial
condition and the results of our operations. On February 14, 2018,
the INDEC published new data regarding the evolution of private and
public-sector salaries. The total salaries index registered a
growth of 27.5% during 2017, as a result of the 26.5% increase in
salaries of the formal private sector and an increase of 31.5% in
the informal private sector.
20
Property values in Argentina could decline
significantly.
Property values are
influenced by multiple factors that are beyond our control, such as
a decrease in the demand for real estate properties due to a
deterioration of macroeconomic conditions or an increase in supply
of real estate properties that could adversely affect the value of
real estate properties. We cannot assure you that property values
will increase or that they will not be reduced. Many of the
properties we own are located in Argentina. As a result, a
reduction in the value of properties in Argentina could materially
affect our business and our financial statements due to the
valuation of our investment properties at fair market
value.
Restrictions on transfers of foreign currency and the repatriation
of capital from Argentina may impair our ability to pay dividends
and distributions.
According to
Argentine practices, the Argentine government may impose
restrictions on the exchange of Argentine currency into foreign
currencies and on the remittance to foreign investors of proceeds
from investments in Argentina in circumstances where a serious
imbalance develops in Argentina’s balance of payments or
where there are reasons to foresee such an imbalance. Beginning in
December 2001, the Argentine government implemented a number of
monetary and foreign exchange control measures that included
restrictions on the free disposition of funds deposited with banks
and on the transfer of funds abroad without prior approval by the
Central Bank. With the administration of President Macri, many of
the former restrictions were lifted.
On
January 7, 2003, the Central Bank issued communication
“A” 3859, as amended, which is still in force and
pursuant to which there are no limitations on companies’
ability to purchase foreign currency and transfer it outside
Argentina to pay dividends, provided that those dividends arise
from net earnings corresponding to approved and audited financial
statements. The transfer of funds abroad by local companies to pay
annual dividends only to foreign shareholders, based on approved
and fully audited financial statements, does not require formal
approval by the Central Bank.
Notwithstanding the
above, for many years, and as a consequence of a decrease in
availability of U.S. dollars in Argentina, the previous Argentine
government imposed informal restrictions on certain local companies
and individuals for purchasing foreign currency. These restrictions
on foreign currency purchases started in October 2011 and tightened
thereafter. As a result of these informal restrictions, local
residents and companies were prevented from purchasing foreign
currency through the MULC for the purpose of making payments
abroad, such as dividends, capital reductions, and payment for
imports of goods and services.
Such
restrictions and other foreign exchange control measures were
lifted by the new administration, moving towards opening
Argentina’s foreign exchange market. In this sense, on
December 17, 2015, Communication “A” 5850 of the
Central Bank reestablished the possibility for non-residents to
repatriate their investment capital and, Communication
“A” 6037 of the Central Bank defined the new
regulations that apply to the acquisition of foreign currency and
the elimination of all other restrictions that impair residents and
non-residents to have access to the foreign exchange market.
However, in the future, the Argentine government or the Central
Bank may impose formal restrictions to the payment of dividends
abroad, on capital transfers and establish additional requirements.
Such measures may negatively affect Argentina’s international
competitiveness, discouraging foreign investments and lending by
foreign investors or increasing foreign capital outflow which could
have an adverse effect on economic activity in Argentina, and which
in turn could adversely affect our business and results of
operations. Furthermore, any restrictions on transferring funds
abroad imposed by the government could undermine our ability to pay
dividends on our GDSs in U.S. dollars.
21
On
December 22, 2011, the Argentine Congress passed the Rural Land Law
in order to protect the ownership and sovereignty of certain rural
areas of Argentina (the “Rural Land Law”). The Rural
Land Law sets limits on the ownership of rural land by foreign
individuals or legal entities acting in Argentina (“Foreign
Persons”), setting a maximum allowable percentage ownership
for foreigners of 20%. Additionally, only 30% of the aforementioned
20% may be held by Foreign Persons of the same nationality, and
from the date of enactment of the Rural Land Act, a Foreign Person
may not own more than 1,000 hectares of rural land in total
throughout Argentine territory. The Rural Land Law states that it
will not affect any rights previously acquired by Foreign
Persons.
For the
purposes of the Rural Land Law, the definition of Foreign Person
includes Argentine companies in which a percentage higher than 51%
of the outstanding capital stock is owned by foreign individuals or
legal entities, or lower rates if the entity meets the proportions
necessary to form the social will. The following also falls within
the definition of Foreign Person (among others): (a) entities
controlled by a percentage greater than 25% by a foreign company,
or regardless of participation when such company holds enough votes
to form the social will of that company; (b) companies that issued
convertible notes, where a Foreign Person may exert over 25% of the
voting power necessary to form the social will; (c) transfers for
trusts whose beneficiaries are Foreign Persons in a percentage
higher than 25%, (d) joint ventures, holding companies and any
other legal persons present or in the future, and (e) foreign legal
persons under public law.
On
February 29, 2012, Executive Branch Decree No. 274/12 was published
regulating the Rural Land Law. The aforementioned decree
established a deadline of 60 days to the provinces to report the
total area of their departments, municipalities or political
divisions equivalent discriminating rural and urban land and rural
properties subject to the Rural Land Law and consequently owned by
Foreign Persons. Additionally, provinces should report the complete
list of foreign companies registered in their respective
jurisdictions. The decree also provides that foreign holders must
report their holdings within 180 days from the date of enactment of
regulations in the national register of rural land.
In
addition, on June 30, 2016, Executive Branch Decree No. 820/16 was
published modifying the Executive Branch Decree No. 274/12. For the
purpose of determining the ownership of the rural land, the Decree
No. 820/16 defines how to compute the acquisition of rural land,
when they occur as a result of transfers of share packages and how
soon transfer; and solves how to estimate equivalence with respect
to the core area, depending on the limits for each type of
exploitation, municipality, department and province.
We
cannot assure you that these or other measures that may be adopted
by the Argentine government in the future, such as further
restrictions or regulations, will not have a material adverse
effect on our operations, if our access to the acquisition or
holding of our actual or future properties is limited.
Exchange controls and restrictions on transfers abroad and capital
inflow restrictions, if re-imposed, could limit the availability of
international credit.
Until
December 2015, there were many foreign exchange restrictions
and controls that limited access to the MULC. However, in
December 2015, the Macri administration announced certain
reforms to the foreign exchange market with the intention of
providing greater flexibility and ease of access to the foreign
exchange market for individuals and private sector entities. On
December 16, 2015, the Central Bank issued Communication
“A” 5850, lifting most of the restrictions then in
place. Among these measures, free access to the MULC was granted
for the purchase of foreign currency intended for general purposes,
without the need for obtaining the Central Bank’s or the
Administración Federal de Ingresos Públicos (the
“AFIP”) previous consent, and the requirement to
deposit 30% of certain capital inflows into Argentina was
eliminated. Towards the end of 2016, the remaining exchange control
restrictions were also lifted when the Central Bank issued
Communications “A
”
6037
and “A” 6150, thereby granting free access to the MULC.
Pursuant to Resolution E 1/2017 of the Ministry of Treasury and
Communication “A” 6,150 modified by Communication
“A” 6,244 of the Central Bank, the obligation requiring
non-residents who make portfolio investments in the country aimed
at holding private sector financial assets to maintain for a period
of 120 days the funds in the country was abolished. Pursuant to
this resolution and the Central Bank Communication “A”
6,244, and its amendments, there are no restrictions on entry and
exit in the MULC. Accordingly, due to lifting most of the
restrictions to access to the MULC, the Central Bank eliminated the
obligation to enter and settle funds in foreign currency originated
from the export of services to non-residents through the MULC, to
the extent that they are not part of the Free On Board
(“FOB”) value and/or Cost, Insurance and Freight
(“CIF”) of assets exported, eliminated the requirement
of a minimum holding period of 72 business hours in relation to the
purchase and sale of public securities authorized to trade on the
different local and international stock markets, and eliminated the
requirement of compulsory entry and liquidation of flows resulting
from
external debt, including principal and interests. However, the
results of capital inflows in the exchange market must be acredited
on an account opened by a local financial
institution.
22
Although the Macri
administration eliminated such restrictions, we cannot assure you
that foreign exchange regulations will not be amended, or that new
regulations will not be enacted in the future imposing greater
limitations on funds flowing into and out of the Argentine foreign
exchange market. Any such new measures, as well as any additional
controls and/or restrictions, could materially affect our ability
to access the international capital markets and, may undermine our
ability to make payments of principal and/or interest on our
obligations denominated in a foreign currency or transfer funds
abroad to make payments on our obligations (which could affect our
financial condition and results of operations). Therefore,
Argentine resident or non-resident investors should take special
notice of these regulations (and their amendments) that limit
access to the foreign exchange market. In the future we may be
prevented from making payments in U.S. dollars and/or making
payments outside of Argentina due to the restrictions in place at
that time in the foreign exchange market and/or due to the
restrictions on the ability of companies to transfer funds
abroad
The Argentine economy could be adversely affected by political and
economic developments in other global markets.
Financial and
securities markets in Argentina are influenced, to varying degrees,
by economic and market conditions in other global markets. The
international scenario shows contradictory signals of global
growth, as well as high financial and exchange uncertainty.
Although such conditions may vary from country to country, investor
reactions to events occurring in one country may affect capital
flows to issuers in other countries, and consequently affect the
trading prices of their securities. Decreased capital inflows and
lower prices in the securities market of a country may have an
adverse effect on the real economy of those countries in the form
of higher interest rates and foreign exchange
volatility.
During
periods of uncertainty in international markets, investors
generally choose to invest in high-quality assets (“flight to
quality”) over emerging market assets. This has caused and
could continue to cause an adverse impact on the Argentine economy
and could continue to adversely affect the country’s economy
in the near future. On June 20, 2018, MSCI Inc., a leading
provider of indexes and portfolio construction and risk management
tools and services for global investors (“MSCI”),
reclassified and promoted Argentina to emerging markets status
after being dropped to frontier status in May 2009. The MSCI
Argentina Index will be included in the MSCI Emerging Markets Index
in May 2019. However, MSCI will continue to restrict the
inclusion in the index to only foreign listings of Argentinian
companies, such as American Depositary Receipts, as the feedback
from international institutional investors stated that higher
liquidity across the domestic market is needed before considering a
shift from offshore to onshore listings. MSCI will reevaluate this
decision as liquidity conditions the ByMA continue to
improve.
Most
emerging economies have been affected by the change in the U.S.
monetary policy, resulting in the sharp unwinding of speculative
asset positions, depreciations and increased volatility in the
value of their currencies and higher interest rates. The general
appreciation of the U.S. dollar resulting from a more restrictive
U.S. monetary policy contributed to the fall of the international
price of raw materials, increasing the difficulties of emerging
countries which are exporters of these products. There is global
uncertainty about the degree of economic recovery in the United
States, with no substantial positive signals from other developed
countries and an increased risk of a general deceleration in
developing countries, specifically China, which is the main
importer of Argentine commodities. Moreover, the recent challenges
faced by the European Union to stabilize certain of its member
economies, such as Greece, have had international implications
affecting the stability of global financial markets, which has
hindered economies worldwide. The Eurozone finance ministers, at a
meeting held in August 2015, agreed a third bailout deal for
Greece, which required the approval of several countries such as
Germany, one of its main creditors.
Although
economic conditions vary from country to country, investors’
perception of the events occurring in one country may substantially
affect capital flows into other countries. International
investors’ reactions to events occurring in one market
sometimes demonstrate a “contagion” effect in which an
entire region or class of investment is disfavored by international
investors. Argentina could be adversely affected by negative
economic or financial developments in other countries, which in
turn may have an adverse effect on our financial condition and the
results of our operations. Lower capital inflows and declining
securities prices negatively affect the real economy of a country
through higher interest rates or currency volatility. The Argentine
economy was adversely impacted by the political and economic events
that occurred in several emerging economies in the 1990s, including
those in Mexico in 1994, the collapse of several Asian economies
between 1997 and 1998, the economic crisis in Russia in 1998 and
the Brazilian depreciation in January 1999.
Likewise,
the “flight to quality” has also affected Argentina,
causing a deterioration of its sovereign spread that reached 783
basis points on September 4, 2018, based on the J.P. Morgan EMBI+
Index, worseningthe conditions for accessing new external
financing. On October 26, 2018, the Argentine country risk index
reached 670 basis points by.
Argentina
is affected by economic conditions of its major trade partners,
such as Brazil, which devalued its currency in early February 2015,
causing the Brazilian real to suffer the steepest depreciation in
over a decade. Brazil, which is Argentina’s main trading
partner, has experienced GDP contraction in recent years (3.5% in
2015 and 3.5% in 2016). Although Brazil’s economic outlook
seems to be improving, a further deterioration of economic
activity, a delay in Brazil’s expected economic recovery or a
slower pace of economic improvement in Brazil may have a negative
impact on Argentine exports and on the overall level of economic
and industrial activity in Argentina, particularly with respect to
the automotive industry. In February 2016, Standard &
Poor’s downgraded Brazil’s credit rating to BB. In
December 2015 and February 2016, Fitch Ratings and Moody’s,
respectively, also downgraded Brazil’s credit ratings to BB+
and Ba2, respectively. In 2017, Brazil experienced a slight
increase in its GDP, increasing by 1.0%. If the Brazilian
economy’s current recovery stalls or once again deteriorates,
the demand for Argentine exports may be adversely impacted. In
turn, on October 28, 2018, the presidential elections were held in
Brazil, with the conservative candidate Jair Bolsonaro as the
winner in the final round with 55.1% of the votes, who will take
office on January 1, 2019. We can not predict the impact on the
global economy, and particularly in Argentina, of the policies of
the Bolsonaro´s administration and, consequently, the results
of our business, financial condition and the results of our
operations.
23
Moreover, Argentina
may be affected by other countries that have influence over world
economic cycles, such as the United States or China. In particular,
China, which is the main importer of Argentine commodities, saw the
yuan depreciate since the end of 2015, which has adversely affected
companies with substantial exposure to that country. Depreciation
of the yuan continued during 2016, and Chinese economic growth
slowed in 2016 and 2017. The slowdown of the Chinese economy and
increased volatility of its financial markets could impact
financial markets worldwide, which, in turn, could increase the
cost and availability of financing both domestically and
internationally for Argentine companies. Starting in April 2018,
the U.S. imposed tariffs on steel and aluminum imports from China,
as well as Canada and countries in the European Union. On July 6,
2018, the United States imposed 25% tariffs on US$34 billion worth
of Chinese goods, which then led China to respond with similarly
sized tariffs on United States’ products. On July 10, 2018,
the Office of the U.S. Trade Representative (USTR) announced a 10%
tax on a US$200 billion list of 5,745 Chinese products, implemented
as of September 24, 2018. Also, on September 18, 2018, the Chinese
government announced a 5% to 10% tax on a US$60 billion list of
5,207 American goods, implemented as of September 24, 2018. A new
global economic and/or financial crisis or the effects of
deterioration in the current international context, could affect
the Argentine economy and, consequently, the results of our
operations, financial condition and the trading price for our
GDSs.
If
interest rates rise significantly in developed economies, including
the United States, Argentina and other emerging market economies
could find it more difficult and expensive to borrow capital and
refinance existing debt, which would negatively affect their
economic growth. In addition, if these developing countries, which
are also Argentina’s trade partners, fall into a recession;
the Argentine economy would be affected by a decrease in exports.
All of these factors could have a negative impact on us, our
business, operations, financial condition and
prospects.
In a
non-binding referendum on the United Kingdom’s membership in
the European Union on June 23, 2016, a majority of those who
voted approved the United Kingdom’s withdrawal from the
European Union. Any withdrawal by the United Kingdom from the
European Union (referred to as “Brexit”) would occur
after, or possible concurrently with, a process of negotiation
regarding the future terms of the United Kingdom’s
relationship with the European Union, which could result in the
United Kingdom losing access to certain aspects of the single EU
market and the global trade deals negotiated by the European Union
on behalf of its members. Negotiations for the exit of the United
Kingdom began in early 2017 and the probable date for the departure
is March 2019. As a result of Brexit, London could cease to be the
financial center of Europe and some banks have already announced
their intention to transfer many jobs to continental Europe and
Ireland and have indicated that Germany could replace London as the
financial center of Europe. The possible negative consequences of
Brexit include an economic crisis in the United Kingdom, a
short-term recession and a decrease of investments in public
services and foreign investment. The greatest impact of Brexit
would be on the United Kingdom, however the impact may also be
significant to the other member states.
24
As for
Argentina, the consequences of Brexit are linked to the weakening
of the pound and the euro, which has led to a significant
appreciation of the U.S. dollar worldwide. An appreciation of the
U.S. dollar and increased risk aversion could lead to a negative
effect on the price of raw materials, which would be reflected in
the products that Argentina exports to Europe. Another direct
consequence of “Brexit” could be a decrease in prices
of most commodities, a factor that could affect Argentina if prices
stay low in the long term. Bilateral trade could also suffer, but
would not be material, as the United Kingdom currently only
represents approximately 1% of Argentina’s total imports and
exports. In addition, it is possible that Brexit could complicate
Argentina’s ability to issue additional debt in the
international capital markets, as funding would be more
expensive.
Donald
Trump was elected president on November 8, 2016 and took
office on January 20, 2017. The election of the new
administration has generated volatility in the global capital
markets. The new administration has implemented a comprehensive tax
reform and has begun implementing more protectionist policies. The
U.S. Federal Reserve recently increased the U.S.
federal funds
target rate
, which has created additional volatility in the
U.S. and the international markets. Changes in social, political,
regulatory, and economic conditions in the United States or in laws
and policies governing foreign trade could create uncertainty in
the international markets and could have a negative impact on
emerging market economies, including the Argentine economy, which
in turn could adversely affect our business, financial condition
and results of operations. The effect of these protectionist
policies in the global economy remains uncertain.
Global
economic conditions may also result in depreciation of regional
currencies and exchange rates, including the Peso, which would
likely also cause volatility in Argentina. The effect of global
economic conditions on Argentina could reduce exports and foreign
direct investment, resulting in a decline in tax revenues and a
restriction on access to the international capital markets, which
could adversely affect our business, financial condition and
results of operations. A new global economic and/or financial
crisis or the effects of deterioration in the current international
context, could affect the Argentine economy and, consequently, our
results of operations, financial condition and the trading price
for our GDSs.
A decline in the international prices for Argentina’s main
commodity exports or appreciation of the peso against the U.S.
dollar could affect the Argentine economy and adversely affect the
foreign exchange market, and have an adverse effect on our business
financial condition and results of operations.
High
commodity prices have contributed significantly to the increase in
Argentine exports since the third quarter of 2002 as well as in
government revenues from export taxes. However, this reliance on
the export of commodities, such as soy, has made the Argentine
economy more vulnerable to fluctuations in their prices. For
example, the average monthly price of soybeans has decreased from
US$684 per metric ton in August 2012 to US$404 per metric ton in
August in July 2018. If international commodity prices decline, the
Argentine Government’s revenues would decrease significantly,
which could adversely affect Argentina’s economic
activity.
In
addition, adverse weather conditions can affect agricultural
production, which accounts for a significant portion of
Argentina’s export revenues. In 2018, Agentina suffered a
severe drought, resulting in a year-on-year contraction of GDP of
4.2% in the second quarter of 2018, mainly as a result of the
year-on-year decrease of 31.6% in the agricultural, livestock,
hunting and forestry sectors. These circumstances could have a
negative impact on the levels of government revenues, available
foreign exchange and the Argentine Government’s ability to
service its sovereign debt, and could either generate recessionary
or inflationary pressures, depending on the Argentine
Government’s reaction. Either of these results would
adversely impact Argentina’s economy growth and, therefore,
our business, financial condition and results of
operations.
A
significant increase in the real appreciation of the peso could
affect Argentina’s competitiveness, substantially affecting
exports, and this in turn could prompt new recessionary pressures
on the country’s economy and a new imbalance in the foreign
exchange market, which could lead to a high degree of volatility in
the exchange rate. More importantly, in the short term, a
significant appreciation of the real exchange rate could
substantially reduce Argentine public sector’s tax revenues
in real terms, given the strong reliance on taxes on exports
(withholdings). The occurrence of the foregoing could lead to
higher inflation and potentially materially and adversely affect
the Argentine economy, as well as our business, financial condition
and results of operations.
25
Restrictions on the supply of energy could negatively affect
Argentina’s economy.
As a
result of prolonged recession and the forced conversion of energy
tariffs into pesos and subsequent freeze of natural gas and
electricity tariffs in Argentina, there has been a lack of
investment in natural gas and electricity supply and transport
capacity in Argentina in recent years. At the same time, demand for
natural gas and electricity has increased substantially, driven by
a recovery in economic conditions and price constraints, which
prompted the Argentine Government to adopt a series of measures
that have resulted in industry shortages and/or higher costs. In
particular, Argentina has been importing natural gas to compensate
for shortages in local production. In order to pay for natural gas
imports the Argentine Government has frequently used Central Bank
reserves given the absence of foreign direct investment. If the
Argentine Government is unable to pay for imports of natural gas,
economic activity, business and industries may be adversely
affected.
The
Argentine Government has taken a number of measures to alleviate
the short-term impact of energy shortages on residential and
industrial users. If these measures prove to be insufficient, or if
the investment required to increase natural gas production and
electric energy transportation capacity and generation over the
medium- and long-term is not available, economic activity in
Argentina could be curtailed, and with it our operations. As a
first step of these measures, a series of tariff increases and
subsidy reductions (primarily applicable to industries and
high-income consumers) were implemented. On December 17, 2015,
and after publication of Decree No. 134/2015, the Macri
administration declared the National Electricity System Emergency
until December 31, 2017 and ordered the Ministry of Energy and
Mining to propose measures and guarantee the electrical supply.
Ministry of Energy and Mining Resolution No. 06/2016 of
January 2016 set new seasonal reference prices for power and
energy on the Mercado Eléctronico Mayorista (MEM) for the
period from February 1, 2016 to April 30, 2016 and set an
objective to adjust the quality and security of electricity
supply.
In
February 2016, the Argentine Government reviewed the schedule
of electricity and gas tariffs and eliminated the subsidies of
these public services, which would have resulted in increases of
500% or more in energy costs, except for low-income consumers. By
correcting tariffs, modifying the regulatory framework and reducing
the Argentine Government’s participation in the energy
sector, the Argentine Government sought to correct distortions in
the energy sector and make the necessary investments. In
July 2016, a federal court in the city of La Plata suspended
the increase in the gas tariff throughout the Province of Buenos
Aires. On August 3, 2016, a federal court in San Martín
suspended the increase in gas tariffs throughout the country until
a public hearing was held to discuss the rate increase. The
judgment was appealed to the Supreme Court, and on August 18,
2016, the Supreme Court ruled that the increase in the gas tariff
of residential users could not be imposed without a public hearing.
On September 16, 2016, the public hearing was held where it
was agreed that the gas tariff would increase by approximately 200%
in October 2016, with biannual increases through
2019.
As for
other services, including electricity, a public hearing was held on
October 28, 2016 to consider a proposed 31% tariff increase
sought by energy distributors. Subsequently, the Argentine
Government announced increases in electricity rates of between 60%
and 148%. On March 31, 2017, the Ministry of Energy and Mining
published a new tariff schedule with increases of approximately 24%
for supply of natural gas by networks that had been partially
regulated since April 1, 2017In addition, on November 17,
2017, a public hearing convened by the Minister of Energy and
Mining was held to update the tariff schedule for natural gas and
electricity. The new tariff schedule foresees a gradual reduction
of subsidies, resulting in an increase, between December 2017
and February 2018, between 34% and 57% (depending on the
province) for natural gas and 34% for electricity. In addition, on
May 31, 2018, the Argentine Congress approved a law seeking to
limit the increase in energy tariffs implemented by the Macri
administration, which was subsequently vetoed by President Macri.
On August 1, 2018, pursuant Resolution No. 208/2018 of the National
Electricity Regulatory Board (ENRE), the Ministry of Energy
published a new tariff schedule with increases in electricity
rates.
Changes
change in energy regulatory framework and the establishment of
increased tariffs for the supply of gas and electricity could
affect our cost structure and increase operating and public service
costs. Moreover, the significant increase in the cost of energy in
Argentina, could have an adverse effect on the Argentine economy,
and therefore, on our business, financial condition and results of
operations.
26
Failure to adequately address actual and perceived risks of
institutional deterioration and corruption may adversely affect the
Argentine economy and financial condition, which in turn could
adversely affect our business, financial condition and results of
operations.
The
lack of a solid institutional framework and the notorious incidents
of corruption that have been identified as a significant problem
for Argentina. In Transparency International’s Corruption
Perceptions Index survey, Argentina ranked 85 out of 180 in 2017,
95 out of 167 in 2016 and 106 out of 167 countries in 2015. In the
World Bank’s “Doing Business 2017” report,
Argentina ranked 116 out of 190 countries.
Recognizing that
the failure to address these issues could increase the risk of
political instability, distort decision-making processes and
adversely affect Argentina’s international reputation and its
ability to attract foreign investment, the Macri administration
announced various measures aimed at strengthening Argentina’s
institutions and reducing corruption. These measures include the
signing of collaboration agreements with with the judicial Branch
in corruption investigation, greater access to public information,
the seizure of assets of officials prosecuted for corruption, the
increase of the powers of the Argentine Anti-Corruption Office and
the approval of a new public ethics law, among others. The
Argentine Government’s ability to implement these initiatives
remains uncertain since it would require the participation of the
judiciary as well as the support of opposition legislators. We
cannot guarantee that the implementation of these measures will be
successful.
Current corruption investigations in Argentina could have an
adverse impact on the development of the economy and investor
confidence.
The
Argentine Government has announced a large-scale corruption
investigation in Argentina. The investigation relates to payments
over the past decade to government officials from businessmen and
companies who had been awarded large government contracts. As of
the date of this annual report, several Argentine businessmen,
mainly related to public works, and approximately fifteen former
government officials of the Fernández de Kirchner
administration are being investigated for bribery to the State. As
a result, on September 17, 2018, the former president of Argentina,
Cristina Fernandez de Kirchner, and several businessmen were
prosecuted for illegal association, and goods for Ps. 4 billion
were seized.
Depending
on the results of such investigations and the time it takes to
conclude them, the companies involved could face, among other
consequences, a decrease in their credit rating, be subject to
claims by their investors, as well as experiencing restrictions on
financing through the capital markets. These adverse effects could
hamper the ability of these companies to meet their financial
obligations on time. In connection with the aforementioned, the
lack of future financing for these companies could affect the
realization of the projects or works that are currently in
execution.
In
addition, the effects of these investigations could affect the
investment levels in infrastructure in Argentina, as well as the
continuation, development and completion of public works and
Public-Private Participation projects, which could ultimately lead
to lower growth in the Argentine economy.
As of
the date of this annual report, we have not estimated the impact
that this investigation could have on the Argentine economy.
Likewise, we cannot predict for how long corruption investigations
could continue, what other companies might be involved, or how
important the effects of these investigations might. In turn, the
decrease in investors’ confidence, among other factors, could
have a significant adverse impact on the development of the
Argentine economy, which could adversely affect our business,
financial condition and the results of our operations.
If Argentina’s implementation of laws relating to anti-money
laundering and to combating the financing of terrorism (AML/CRT)
are insufficient, Argentina may have difficulties in obtaining
international financing and/or attracting foreign direct
investments.
In
October 2010, the Financial Action Task Force
(“FATF”) issued a Mutual Evaluation Report (the
“Mutual Report”) on Anti-Money Laundering and Combating
the Financing of Terrorism in Argentina, including the evaluation
of Argentina as of the time of the on-site visit which took place
in November 2009. This report stated that since the latest
evaluation, finalized in June 2004, Argentina had not made
adequate progress in addressing a number of deficiencies identified
at the time, and the FATF has since placed Argentina on an enhanced
monitoring process. Moreover, in February 2011, Argentina,
represented by the Minister of Justice and Human Rights, attended
the FATF Plenary, in Paris, in order to present a preliminary
action plan. FATF granted an extension to implement changes. In
June 2011, Argentina made a high-level political commitment to
work with the FATF to address its strategic AML/CFT deficiencies.
In compliance with recommendations made by the FATF on money
laundering prevention, on June 1, 2011 the Argentine Congress
enacted Law No. 26,683. Under this law, money laundering is
now a
crime per se, and self-laundering money is also considered a crime.
Additionally, in June 2012, the Plenary meeting of the FATF
held in Rome highlighted the progress made by Argentina but also
urged the country to make further progress regarding its AML/CFT
deficiencies. Notwithstanding the improvements that Argentina made,
in October 2012 the FATF determined that certain strategic
AML/CFT deficiencies continued, and that Argentina would be subject
to continued monitoring.
27
Since
October 2013, Argentina has taken steps towards improving its
AML/CFT regime, including issuing new regulations to strengthen
suspicious transaction reporting requirements and expanding the
powers of the financial sector regulator to apply sanctions for
AML/CFT deficiencies. Such progress has been recognized by the
FATF. In this regard, the FATF (pursuant to its report dated
June 27, 2014) concluded that Argentina had made significant
progress in adopting measures to address AML/CFT deficiencies
identified in the Mutual Report, and that Argentina had
strengthened its legal and regulatory framework, including:
(i) reforming and strengthening penalties for money laundering
by enhancing the scope of reporting parties covered and
transferring AML/CFT supervision to the Financial Information Unit
(Unidad de Información Financiera or “UIF”) of the
Ministry of Treasury; (ii) enhancing terrorist financing
penalties, in particular by criminalizing the financing of
terrorist acts, terrorists, and terrorist organizations;
(iii) issuing, through the UIF, a series of resolutions
concerning customer due diligence (CDD) and record-keeping
requirements as well as other AML/CFT measures to be taken by
reporting parties; and (iv) creating a framework to comply
with United Nations Security Council Resolutions 1,267 and 1,373.
As a result of such progress, the FATF Plenary concluded that
Argentina had taken sufficient steps toward technical compliance
with the core and key recommendations and should thus be removed
from the monitoring process. In addition, on October 24, 2014,
the FATF acknowledged Argentina’s significant progress in
improving its AML/CFT regime and noted that Argentina had
established the legal and regulatory framework to meet commitments
in its action plan and would no longer be subject to the
FATF’s AML/CFT compliance monitoring process, and concluded
that Argentina would continue to work with the FATF and the
Financial Action Task Force of Latin America (Grupo de Acción
Financiera de América del Sur, or “GAFISUD”) to
address any other issues identified in its Mutual
Report.
In
February 2016, the “National Coordination Program for
the Prevention of Asset Laundering and the Financing of
Terrorism” was created by Executive Decree No. 360/2016
as an instrument of the Ministry of Justice and Human Rights,
charged with the duty to reorganize, coordinate and strengthen the
national system for the prevention of money laundering and the
financing of terrorism, taking into consideration the specific
risks that might impact Argentina and the global emphasis on
developing more effective compliance with international regulations
and the standards of the FATF. In addition, relevant
rules were modified to designate the Ministry of Justice and
Human Rights as the coordinator at the national level of public and
private agencies and entities, while the UIF coordinate activities
that relate to financial matters.
Recently, in the
context of the voluntary disclosure program under the Argentine tax
amnesty, Law No. 27,260 and its regulatory decree
No. 895/2016, clarified that the UIF has the power to
communicate information to other public agencies that deal with
intelligence and investigations if the UIF is in possession of
evidence that crimes under the Anti-Money Laundering Law may have
been committed. In addition, pursuant to the UIF Resolution
No. 92/2016, reporting agents must adopt special risk
management system to address the complying with the law as well as
to report operations carried out under the tax
amnesty.
Although Argentina
has made significant improvements in its AML/CFT regulations, and
is no longer subject to the FATF’s on-going global AML/CFT
monitoring process, no assurance can be given that Argentina will
continue to comply with AML/CFT international standards, or that
Argentina will not be subject to compliance monitoring in the
future, any of which could adversely affect Argentina’s
ability to obtain financing from international markets and attract
foreign investments.
28
We are exposed to risks in relation to compliance with
anti-corruption and anti-bribery laws and regulations.
Our
operations are subject to various anti-corruption and anti-bribery
laws and regulations, including the Corporate Criminal Liability
Law and the U.S. Foreign Corrupt Practices Act of 1977 (the
“FCPA”). Both the Corporate Criminal Liability Law and
the FCPA impose liability against companies who engage in bribery
of government officials, either directly or through intermediaries.
The anti-corruption laws generally prohibit providing anything of
value to government officials for the purposes of obtaining or
retaining business or securing any improper business advantage. As
part of our business, we may deal with entities in which the
employees are considered government officials. We have a compliance
program that is designed to manage the risks of doing business in
light of these new and existing legal and regulatory
requirements.
Although
we have internal policies and procedures designed to ensure
compliance with applicable anti-corruption and anti-bribery laws
and regulations, there can be no assurance that such policies and
procedures will be sufficient. Violations of anti-corruption laws
and sanctions regulations could lead to financial penalties being
imposed on us, limits being placed on our activities, our
authorizations and licenses being revoked, damage to our reputation
and other consequences that could have a material adverse effect on
our business, results of operations and financial condition.
Further, litigations or investigations relating to alleged or
suspected violations of anti-corruption laws and sanctions
regulations could be costly.
Risks
Relating to Brazil
The Brazilian government has exercised, and continues to exercise,
significant influence over the Brazilian economy, which, together
with Brazilian political and economic conditions, may adversely
affect us.
Our
business is dependent to a large extent on the economic conditions
in Brazil. From June 30, 2011 we consolidate our financial
statements with our subsidiary Brasilagro-Companhia Brasileira de
Propiedades Agricolas (“Brasilagro”).
We may
be adversely affected by the following factors, as well as the
Brazilian federal government’s response to these
factors:
● economic
and social instability;
● increase in
interest rates;
● exchange
controls and restrictions on remittances abroad;
●
restrictions and taxes on agricultural exports;
● exchange
rate fluctuations;
●
inflation;
● volatility
and liquidity in domestic capital and credit markets;
● expansion
or contraction of the Brazilian economy, as measured by GDP growth
rates;
● allegations
of corruption against political parties, elected officials or other
public officials, including allegations made in relation to the
Lava Jato investigation;
● government
policies related to our sector;
● fiscal or
monetary policy and amendments to tax legislation; and
● other
political, diplomatic, social or economic developments in or
affecting Brazil.
Historically, the
Brazilian government has frequently intervened in the Brazilian
economy and has occasionally made significant changes in economic
policies and regulations, including, among others, the imposition
of a tax on foreign capital entering Brazil (IOF tax), changes in
monetary, fiscal and tax policies, currency devaluations, capital
controls and limits on imports.
The
Brazilian economy has been experiencing a slowdown – GDP
growth rates were 3.9%, 1.8%, 2.7% and 0.1%, in 2011, 2012, 2013
and 2014, respectively, and GDP decreased 3.8% in 2015, 3.6% in
2016 and an increased 1% in 2017 and remained stable in the first
six months of 2018.
As a
result of investigations carried out in connection with the
Lava Jato
operation related
to corruption in Brazil, a number of senior politicians, including
congressmen, and executive officers of some of the major
state-owned companies in Brazil have resigned or been arrested
while others are being investigated for allegations of unethical
and illegal conduct. The matters that have come, and may continue
to come, to light as a result of, or in connection with, the
Lava Jato
operation and
other similar operations have adversely affected, and we expect
that they will continue to adversely affect, the Brazilian economy,
markets and trading prices of securities issued by Brazilian
issuers in the near future.
The
ultimate outcome of these investigations is uncertain, but they
have already had an adverse effect on the image and reputation of
the implicated companies, and on the general market perception of
the Brazilian economy, the political environment and the Brazilian
capital markets. The development of these investigations has
affected and may continue to adversely affect us. We cannot predict
if these investigations will bring further political or economic
instability to Brazil, or if new allegations will be raised against
high-level members of the Brazilian federal government. In
addition, we cannot predict the results of these investigations,
nor their effects on the Brazilian economy.
29
In addition, on
December 2, 2015, the Brazilian Congress opened impeachment
proceedings against Brazilian President Dilma Rousseff for
allegedly breaking federal budget laws during her term. On August
31, 2016, following a trial by the Senate, President Dilma Rousseff
was impeached and Vice-President Michel Temer was sworn in as
president. The president of Brazil has the power to determine
governmental policies and actions that relate to the Brazilian
economy and, consequently, affect the operations and financial
performance of businesses including us. The impeachment proceedings
have adversely affected and we expect that they will continue to
adversely affect the Brazilian markets and prices of securities
issued by Brazilian issuers or subsidiaries of Brazilian companies.
We cannot predict the effects of the recent impeachment proceedings
on the Brazilian economy. More recently, in May 2017, the
development of the investigations conducted by the Federal Police
Department and the
General
Federal Prosecutor’s Office has increased uncertainty with
respect to the future
prospects of the
Brazilian markets. Furthermore, although the Brazilian Superior
Electoral Court (Tribunal Superior Eleitoral) in a 4 to 3 vote has
recently acquitted Dilma Rousseff and Michel Temer of charges of
illegal campaign financing that could annul the presidential
election that took place in 2014 and ultimately could require
President Michel Temer to vacate the presidential office, this
decision may still be appealed to the Brazilian Supreme Court
(Supremo Tribunal Federal). In addition, a number of requests for
impeachment have been filed against Mr. Temer, as well as criminal
charges by the Brazilian Federal Prosecutor’s Office, which
could also result in his removal from office, after allegations
surfaced that Mr. Temer had allegedly been leading a political
corruption related criminal organization. Furthermore, recently a
Brazilian federal appeals court unanimously upheld the conviction
of former president Luís Inácio Lula da Silva on
corruption charges uncovered by the Lava Jato operation; however,
this decision can still be appealed to the Brazilian Supreme Court.
On April 7, 2018, Luís Inácio Lula da Silva began his
prison sentence. We cannot predict whether these investigations and
lawsuits as well as the imprisonment of Luís Inácio Lula
da Silva will bring about further economic and political
instability or if new allegations against high officers of the
Brazilian Federal Government will arise in the future. In addition,
we cannot predict the results of any such investigations, including
their effects over the Brazilian economy. The development of such
cases may negatively affect us.
Also, on October
28, 2018, the presidential elections were held in Brazil, with the
conservative candidate Jair Bolsonaro as the winner in the final
round with 55.1% of the votes, who will take office on January 1,
2019. We can not predict the impact on the global economy, and
particularly in Argentina, of the policies of the Bolsonaro´s
administration and, consequently, the results of our business,
financial condition and the results of our
operations.
Inflation, coupled with the
Brazilian government’s measures to fight inflation, may
hinder Brazilian economic growth and increase interest rates, which
could have a material adverse effect on us.
Brazil
has in the past experienced significantly high rates of inflation.
As a result, the Brazilian government adopted monetary policies
that resulted in Brazilian interest rates being among the highest
in the world. The Brazilian Central Bank’s Monetary Policy
Committee (
Comitê de
Política Monetária do Banco Central
), or COPOM,
establishes an official interest rate target for the Brazilian
financial system based on the level of economic growth, inflation
rate and other economic indicators in Brazil. Between 2004 and
2010, the official Brazilian interest rate varied from 19.75% to
8.75% per year. In response to an increase in inflation in 2010,
the Brazilian government increased the official Brazilian interest
rate, the SELIC rate, which was 10.75% per year on December 31,
2010. The SELIC rate has increased since then and, as of June 30,
2018, it was 1.07% per year. The inflation rates, as measured by
the General Market Price Index (
Índice Geral de
Preços-Mercado
), or IGP-M, and calculated by
Fundação Getúlio
Vargas
, or FGV, were 3.67% in 2014, 10.54% in 2015, 7.18% in
2016 and (-0.52%) in 2017. Cumulative inflation in the first six
months of 2018, calculated by the same index, was
5.39%%.
Inflation and the
government measures to fight inflation have had and may continue to
have significant effects on the Brazilian economy and our business.
In addition, the Brazilian government’s measures to control
inflation have often included maintaining a tight monetary policy
with high interest rates, thereby restricting the availability of
credit and slowing economic growth. On the other hand, an easing of
monetary policies of the Brazilian government may trigger increases
in inflation. In the event of an increase in inflation, we may not
be able to adjust our daily rates to offset the effects of
inflation on our cost structure, which may materially and adversely
affect us.
An
increase in interest rates may have a significant adverse effect on
us. In addition, as of June 30, 2018, certain of our loans were
subject to interest rate fluctuations such as the Brazilian
long-term interest rate (
Taxa de
Juros de Longo Prazo
), or TJLP, and the interbank deposit
rate (
Certificados de
Depósitos Interbancários
), or CDI. In the event of
an abrupt increase in interest rates, our ability to comply with
our financial obligations may be materially and adversely
affected.
A deterioration in general economic and market conditions or in
perceptions of risk in other countries, principally in emerging
countries or the United States, may have a negative impact on the
Brazilian economy and us.
Economic and market
conditions in other countries, including United States and Latin
American and other emerging market countries, may affect the
Brazilian economy and the market for securities issued by Brazilian
companies. Although economic conditions in these countries may
differ significantly from those in Brazil, investors’
reactions to developments in these other countries may have an
adverse effect on the market value of securities of Brazilian
issuers. Crises in other emerging market countries could dampen
investor enthusiasm for securities of Brazilian issuers or issuers
with Brazilian operations, including ours, which could adversely
affect the market price of our common shares. In the past, the
adverse development of economic conditions in emerging markets
resulted in a significant flow of funds out of the country and a
decrease in the quantity of foreign capital invested in Brazil.
Changes in the prices of securities of public companies, lack of
available credit, reductions in
spending, general
slowdown of the global economy, exchange rate instability and
inflationary pressure may adversely affect, directly or indirectly,
the Brazilian economy and securities market. Global economic
downturns and related instability in the international financial
system have had, and may continue to have, a negative effect on
economic growth in Brazil. Global economic downturns reduce the
availability of liquidity and credit to fund the continuation and
expansion of business operations worldwide.
In
addition, the Brazilian economy is affected by international
economic and market conditions generally, especially economic
conditions in the United States. Share prices on B3 S.A. –
Brasil, Bolsa, Balcão, or B3, for example, have historically
been sensitive to fluctuations in U.S. interest rates and the
behavior of the major U.S. stock indexes. An increase in interest
rates in other countries, especially the United States, may reduce
global liquidity and investors’ interest in the Brazilian
capital markets, adversely affecting the price of our common
shares.
30
Risks Relating to other Countries Where We Operate
Our business is dependent on economic conditions in the countries
where we operate or intend to operate.
We have
made investments in farmland in Argentina, Brazil, Paraguay and
Bolivia and we may possibly make investments in other countries in
and outside Latin America, as Israel and United States, among
others. Owing that demand for livestock and agricultural products
is usually correlated to economic conditions prevailing in the
local market, which in turn is dependent on the macroeconomic
condition of the country in which the market is located, our
financial condition and results of operations are, to a
considerable extent, dependent upon political and economic
conditions prevailing from time to time in the countries where we
operate. Latin American countries have historically experienced
uneven periods of economic growth, as well as recession, periods of
high inflation and economic instability. Certain countries have
experienced severe economic crises, which may still have future
effects. As a result, governments may not have the necessary
financial resources to implement reforms and foster growth. Any of
these adverse economic conditions could have a material adverse
effect on our business.
We face the risk of political and economic crises, instability,
terrorism, civil strife, expropriation and other risks of doing
business in emerging markets.
In
addition to Argentina and Brazil, we conduct or intend to conduct
our operations in other Latin American countries such as, Paraguay
and Bolivia, and other countries such as Israel, among others.
Economic and political developments in the countries in which we
operate, including future economic changes or crisis (such as
inflation or recession), government deadlock, political
instability, terrorism, civil strife, changes in laws and
regulations, expropriation or nationalization of property, and
exchange controls could adversely affect our business, financial
condition and results of operations.
In
particular, fluctuations in the economies of Argentina and Brazil
and actions adopted by the governments of those countries have had
and may continue to have a significant impact on companies
operating in those countries, including us. Specifically, we have
been affected and may continue to be affected by inflation,
increased interest rates, fluctuations in the value of the
Argentine Peso and Brazilian Real against foreign currencies, price
and foreign exchange controls, regulatory policies, business and
tax regulations and in general by the political, social and
economic scenarios in Argentina and Brazil and in other countries
that may affect Argentina and Brazil.
Although economic
conditions in one country may differ significantly from another
country, we cannot assure that events in one only country will not
adversely affect our business or the market value of, or market
for, our common shares and/or ADSs.
31
Governments in the countries where we operate or intend to operate
exercise significant influence over their economies.
Emerging market
governments, including governments in the countries where we
operate, frequently intervene in the economies of their respective
countries and occasionally make significant changes in monetary,
credit, industry and other policies and regulations. Governmental
actions to control inflation and other policies and regulations
have often involved, among other measures, price controls, currency
devaluations, capital controls and limits on imports. Our business,
financial condition, results of operations and prospects may be
adversely affected by changes in government policies or
regulations, including factors, such as:
● exchange
rates and exchange control policies;
● inflation
rates;
● labor
laws;
● economic
growth;
● currency
fluctuations;
● monetary
policy;
● liquidity
and solvency of the financial system;
● limitations
on ownership of rural land by foreigners;
●
developments in trade negotiations through the World Trade
Organization or other international organizations;
●
environmental regulations;
●
restrictions on repatriation of investments and on the transfer of
funds abroad;
●
expropriation or nationalization;
●
import/export restrictions or other laws and policies affecting
foreign trade and investment;
● price
controls or price fixing regulations;
●
restrictions on land acquisition or use or agricultural commodity
production
● interest
rates;
● tariff and
inflation control policies;
● import
duties on information technology equipment;
● liquidity
of domestic capital and lending markets;
● electricity
rationing;
● tax
policies;
● armed
conflict or war declaration; and
● other
political, social and economic developments, including political,
social or economic instability, in or affecting the country where
each business is based.
Uncertainty on
whether governments will implement changes in policy or regulation
affecting these or other factors in the future may contribute to
economic uncertainty and heightened volatility in the securities
markets, which may have a material and adverse effect on our
business, results of operations and financial condition. In
addition, an eventual reduction of foreign investment in any of the
countries where we operate may have a negative impact on such
country’s economy, affecting interest rates and the ability
of companies to access financial markets.
Local currencies used in the conduct of our business are subject to
exchange rate volatility and exchange controls.
The
currencies of many Latin American countries have experienced
substantial volatility in recent years. Currency movements, as well
as higher interest rates, have materially and adversely affected
the economies of many Latin American countries, including countries
in which account for or are expected to account for a significant
portion of our revenues. The depreciation of local currencies
creates inflationary pressures that may have an adverse effect on
us generally, and may restrict access to international capital
markets. On the other hand, the appreciation of local currencies
against the U.S. Dollar may lead to deterioration in the balance of
payments of the countries where we operate, as well as to a lower
economic growth.
32
In
2015, the U.S. dollar to peso exchange rate increased 53% as
compared to 2014. In 2016, the U.S. dollar to peso exchange rate
increased 22% as compared to 2015. In 2017, the U.S. dollar to peso
exchange rate increased 18% as compared to 2016. This trend
continued in the first few months of 2018, with an increase of 7%
from December 31, 2017 to March 31, 2018. Further, the U.S. dollar
to peso exchange rate increased approximately 97.7%, from Ps.20.69
in April 27, 2018 to Ps.40.90 as of September 28, 2018.
We cannot predict future
fluctuations in the exchange rate of the Argentine Peso or whether
the Argentine government will change its currency
policy.
Historically, the
Brazilian currency has historically suffered frequent fluctuations.
As a consequence of inflationary pressures, in the past, the
Brazilian government has implemented several economic plans and
adopted a series of exchange rate policies, including sudden
devaluations, periodic mini-devaluations during which the frequency
of adjustments has ranged from daily to monthly, floating exchange
rate systems, exchange controls and dual exchange rate markets.
Formally the value of the Real against foreign currencies is
determined under a free-floating exchange rate regime, but in fact
the Brazilian government is currently intervening in the market,
through currency swaps and trading in the spot market, among other
measures, every time the currency exchange rate is above or below
the levels that the Brazilian government considers appropriate,
taking into account, inflation, growth, the performance of the Real
against the U.S dollar in comparison with other currencies and
other economic factors. Periodically, there are significant
fluctuations in the value of the Real against the U.S. dollar.
During 2018, the Real depreciated 27% against the U.S.
dollar.
The
Israeli currency did not suffer important fluctuations during the
last years. During 2018, NIS depreciated 2.7% against the U.S.
dollar.
Future
fluctuations in the value of the local currencies relative to the
U.S. dollar in the countries in which we operate may occur, and if
such fluctuations were to occur in one or a combination of the
countries in which we operate, our results of operations or
financial condition could be adversely affected.
Inflation and certain government measures to curb inflation may
have adverse effects on the economies of the countries where we
operate or intend to operate our business and our
operations.
In the
past, high levels of inflation have adversely affected the
economies and financial markets of some of the countries in which
we operate, particularly Argentina and Brazil, and the ability of
their governments to create conditions that stimulate or maintain
economic growth. Moreover, governmental measures to curb inflation
and speculation about possible future governmental measures have
contributed to the negative economic impact of inflation and have
created general economic uncertainty. As part of these measures,
governments have at times maintained a restrictive monetary policy
and high interest rates that has limited the availability of credit
and economic growth.
A
portion of our operating costs in Argentina are denominated in
Argentine Pesos, most of our operating costs in Brazil are
denominated in Brazilian Reais and most of our operating costs in
Israel are nominated in NIS. Inflation in Argentina, Brazil or
Israel without a corresponding Peso, Real or NIS devaluation, could
result in an increase in our operating costs without a commensurate
increase in our revenues, which could adversely affect our
financial condition and our ability to pay our foreign currency
denominated obligations.
After
several years of price stability in Argentina, the devaluation of
the Peso in January 2002 imposed pressures on the domestic price
system that generated high inflation throughout 2002. In 2003,
inflation decreased significantly and stabilized. However, in
recent years, encouraged by the pace of economic growth, according
to the Instituto Nacional de Estadisticas y Censos, or
“INDEC” (Argentine Statistics and Census Agency), the
consumer price index increased by 9.5% in 2011, 10.8% in 2012, and
10.9% in 2013; while the wholesale price index increased 10.3% in
2009, 14.6% in 2010, 12.7% in 2011, 13.1% in 2012, 14.7% in 2013
and 28.3% in 2014. The accuracy of the measurements of the INDEC
has been questioned in the past, and the actual consumer price
index and wholesale price index could be substantially higher than
those indicated by the INDEC. See “—Risks Related to
Argentina— There are concerns about the accuracy of
Argentina’s official inflation
statistics.”
In
February 2014 the INDEC modified the methodology for the
calculation of the consumer price index (“CPI”) and the
gross domestic product. Under the new calculation methodology, the
CPI increased by 23.9% in 2014 and 11.9% as of October 2015 (for
the first nine months of 2015). However, opposition lawmakers
reported an inflation rate of 38.5% and 27.5%, respectively. In
December 2015, the Macri administration appointed a former director
of a private consulting firm to manage the INDEC. The new director
initially suspended the publication of any official data prepared
by INDEC and implemented certain methodological reforms and
adjusted certain indices based on those reforms. In January 25,
2016, INDEC published two alternative measures of the CPI for the
year 2015, 29.6% and 31.6%, which were based on data from the City
of Buenos Aires and the Province of San Luis. After
implementing these
methodological reforms in June 2016, the INDEC resumed its
publication of the consumer price index.
33
According to INDEC,
the CPI increased 24.8% in 2017 and 1.8%, 2.4%, 2.3%, 2.7%, 2.1%,
3.7%, 3.1%, 3.9% and 6.5% for January, February, March, April, May,
June, July, August and September 2018, respectively.
Brazil
has historically experienced high rates of inflation. Inflation, as
well as government efforts to curb inflation, has had significant
negative effects on the Brazilian economy, particularly prior to
1995. Inflation rates were 7.8% in 2007 and 9.8% in 2008, compared
to deflation of 1.7% in 2009, inflation of 11.3% in 2010, inflation
of 5.1% in 2011, inflation of 7.8% in 2012, inflation of 5.5% in
2013, inflation of 3.7% in 2014, inflation of 10.5% in 2015, 7.2%
in 2016, (0.53)% in 2017 and 5.39% for the first six months of
2018, as measured by the General Market Price Index (Indice Geral
de Preços — Mercado), compiled by the Getúlio
Vargas Foundation (Fundação Getúlio Vargas). A
significant proportion of our cash costs and our operating expenses
are denominated in Brazilian Reais and tend to increase with
Brazilian inflation. The Brazilian government’s measures to
control inflation have in the past included maintaining a tight
monetary policy with high interest rates, thereby restricting the
availability of credit and reducing economic growth. This policy
has changed in the last two years, when the Brazilian government
decreased the interest rate by 525 basis points. Subsequently, the
high inflation, arising from the lower interest rate, and the
intention to maintain this rate at low levels, led the Brazilian
government to adopt other measures to control inflation, such as
tax relief for several sectors of the economy and tax cuts for the
products included in the basic food basket. These measures were not
sufficient to control the inflation, which led the Brazilian
government to reinstate a tighter monetary policy. As a result,
interest rates have fluctuated significantly. The Special System
for Settlement and Custody (Sistema Especial de
Liquidação e Custódia, or “SELIC”)
interest rate in Brazil at year-end was 10.0% in 2013, 11.75% in
2014, 14.25% in 2015, 13.75% in 2016, and 7% in 2017 as determined
by the Comitê de Política Monetária, or COPOM. As of
June 30, 2018, the SELIC was 6.50%.
Supply
problems at our farms and processing facilities and impair our
ability to deliver our products to our customers in a timely manner
Argentina and/or Brazil may experience high levels of inflation in
the future, which may impact domestic demand for our products.
Inflationary pressures may also weaken investor confidence in
Argentina and/or Brazil, curtail our ability to access foreign
financial markets and lead to further government intervention in
the economy, including interest rate increases, restrictions on
tariff adjustments to offset inflation, intervention in foreign
exchange markets and actions to adjust or fix currency values,
which may trigger or exacerbate increases in inflation, and
consequently have an adverse impact on us. In an inflationary
environment, the value of uncollected accounts receivable, as well
as of unpaid accounts payable, declines rapidly. If the countries
in which we operate experience high levels of inflation in the
future and price controls are imposed, we may not be able to adjust
the rates we charge our customers to fully offset the impact of
inflation on our cost structures, which could adversely affect our
results of operations or financial condition.
Depreciation of the
Peso or the Real relative to the U.S. Dollar or the Euro may also
create additional inflationary pressures in Argentina or Brazil
that may negatively affect us. Depreciation generally curtails
access to foreign financial markets and may prompt government
intervention, including recessionary governmental policies.
Depreciation also reduces the U.S. Dollar or Euro value of
dividends and other distributions on our common shares and the U.S.
Dollar or Euro equivalent of the market price of our common shares.
Any of the foregoing might adversely affect our business, operating
results, and cash flow, as well as the market price of our common
shares.
Conversely, in the
short term, a significant increase in the value of the Peso or the
Real against the U.S. Dollar would adversely affect the respective
Argentine and/or Brazilian government’s income from exports.
This could have a negative effect on GDP growth and employment and
could also reduce the public sector’s revenues in those
countries by reducing tax collection in real terms, as a portion of
public sector revenues are derived from the collection of export
taxes.
Developments in other markets may affect the Latin American
countries where we operate or intend to operate, and as a result
our financial condition and results of operations may be adversely
affected.
The
market value of securities of companies such as us may be, to
varying degrees, affected by economic and market conditions in
other global markets. Although economic conditions vary from
country to country, investors’ perception of the events
occurring in one country may substantially affect capital flows
into and securities from issuers in other countries, including
latin american countries. Various Latin American economies have
been adversely impacted by the political and economic events that
occurred in several emerging economies in recent times.
Furthermore, Latin American economies may be affected by events in
developed economies which are trading partners or that impact the
global economy and adversely affect our activities and the results
of our operations.
34
Land in Latin American countries may be subject to expropriation or
occupation.
Our
land may be subject to expropriation by the governments of the
countries where we operate and intend to operate. An expropriation
could materially impair the normal use of our lands or have a
material adverse effect on our results of operations. In addition,
social movements, such as
Movimento dos Trabalhadores Rurais Sem Terra
and Comissão Pastoral da Terra in Brazil
, are active in
certain countries where we operate or intend to operate. Such
movements advocate land reform and mandatory property
redistribution by governments. Invasions and occupations of rural
areas by a large number of individuals is common practice for these
movements, and, in certain areas, including some of those in which
we are likely to invest, police protection and effective eviction
proceedings are not available to land owners. As a result, we
cannot assure you that our properties will not be subject to
invasion or occupation. A land invasion or occupation could
materially affect the normal use of our properties or have a
material adverse effect on us or the value of our common shares and
our ADSs.
We may invest in countries other than Argentina and Brazil and
cannot give you any assurance as to the countries in which we will
ultimately invest, and we could fail to list all risk factors for
each possible country.
We have
a broad and opportunistic business strategy therefore we may invest
in countries other than Argentina, Brazil and Israel including
countries in other emerging markets outside Latin America (e.g.,
Africa). As a result, it is not possible at this time to identify
all risk factors that may affect our future operations and the
value of our common shares and ADSs.
Disruption of transportation and logistics services or insufficient
investment in public infrastructure could adversely affect our
operating results.
One of
the principal disadvantages of the agricultural sector in the
countries in which we operate is that key growing regions lie far
from major ports. As a result, efficient access to transportation
infrastructure and ports is critical to the growth of agriculture
as a whole in the countries in which we operate and of our
operations in particular. Improvements in transportation
infrastructure are likely to be required to make more agricultural
production accessible to export terminals at competitive prices. A
substantial portion of agricultural production in the countries in
which we operate is currently transported by truck, a means of
transportation significantly more expensive than the rail
transportation available to U.S. and other international producers.
Our dependence on truck transportation may affect our position as a
low-cost producer so that our ability to compete in the world
markets may be impaired.
Even
though road and rail improvement projects have been considered for
some areas of Brazil, and in some cases implemented, substantial
investments are required for road and rail improvement projects,
which may not be completed on a timely basis, if at all. Any delay
or failure in developing infrastructure systems could reduce the
demand for our products, impede our products’ delivery or
impose additional costs on us. We currently outsource the
transportation and logistics services necessary to operate our
business. Any disruption in these services could result in supply
problems at our farms and processing facilities and impair our
ability to deliver our products to our customers in a timely
manner.
The result of our operations are dependent upon economic conditions
in Paraguay, in which we operate, and any decline in economic
conditions could harm our results of operations or financial
condition.
As of
June 30, 2018, 0.4% of our assets were located in Paraguay.
Paraguay has a history of economic and political instability,
exchange controls, frequent changes in regulatory policies,
corruption, and weak judicial security. However, in 2013, Paraguay
had the highest GDP growth rate in Latin America and the third
highest in the world with 14%. Since then, GDP has grown by 4% in
2014, 3% in 2015, 3.8% in 2016 and 4.3% in 2017. The
Paraguay’s GDP is closely related to the performance of the
Paraguayan agricultural sector, which can be volatile and could
adversely affect our business, financial condition and results of
operations.
The
exchange rate of Paraguay is free and floating and the Central Bank
of Paraguay participates actively in the exchange market in order
to reduce volatility. In 2017, the Paraguayan currency appreciated
against the dollar by 3.0%, while in 2016 the appreciation was
0.7%. Although the Paraguayan currency appreciated during 2017, the
local currency follows the regional and world trends. A significant
depreciation of the local currency could adversely affect our
business, financial condition and results of operations. However,
since most of our costs of raw materials and supplies are
denominated in U.S. dollars, a significant depreciation of the
local currency could adversely affect our business, financial
condition and results of operations, as well as impact other
expenses, such as as professional fees and maintenance
costs.
In addition, a
significant deterioration in the economic growth of Paraguay or any
of its main trading partners, such as Brazil or Argentina, could
have a material impact on the trade balance of Paraguay and could
adversely affect their economic growth, which could adversely
affect our business, financial condition and results of
operations.
35
The result of our operations are dependent upon economic conditions
in Bolivia, in which we operate, and any decline in economic
conditions could harm our results of operations or financial
condition.
As of
June 30, 2018, 0.4% of our assets were located in Bolivia. Bolivia
is exposed to frequent has a history of economic, social and
political instability, exchange controls, frequent changes in
regulatory frameworks policies, civic and labour strikes, high tax
rates and corruption among state officials, the judiciary and also
the private sector.
Bolivia
is exposed to high risk of social unrest, causing marches and
roadblocks deployed by protesters to pressure the government,
increasing disruption risks. Furthermore, protests over
environmental issues often overlap significantly with labour
disputes, which can escalate into disruptive forms of protest,
including site occupations.
In
turn, the Bolivian economy is the 14th largest in Latin America and
is heavily dependent on export commodities such as natural gas and
minerals. Bolivia’s GDP growth over the last decade has been
among the highest in Latin America, growing by 6.8% in 2013, 5.5%
in 2014, 4.9% in 2015, 4.3% in 2016 and 4.2% in 2017.averaging 5%
per year. Within this context, inflation has been relatively low
and under control for the last 30 years. The inflation rate for
2017 was around 2.7% with a slightly higher figure expected for
2018. In addition, Bolivia it is in the process of becoming an
active partner of MERCOSUR, a common market aiming to gradually
integrate economic activity among Brazil, Argentina, Uruguay,
Paraguay and Bolivia.
A
significant deterioration in the global and internal
macroeconomics, political stability or social unrest of Bolivia,
could have a material impact on their economic growth, which could
adversely affect our business, financial condition and results of
operations.
Risks Relating to Our Business
Fluctuation in market prices for our agriculture products could
adversely affect our financial condition and results of
operations.
Prices
for cereals, oilseeds and by-products, like those of other
commodities, have historically been cyclical and sensitive to
domestic and international changes in supply and demand and can be
expected to fluctuate significantly. In addition, the agricultural
products and by-products we produce are traded on commodities and
futures exchanges and thus are subject to speculative trading,
which may adversely affect us. The prices that we are able to
obtain for our agriculture products depend on many factors beyond
our control, including:
● prevailing
world prices, which historically have been subject to significant
fluctuations over relatively short periods of time, depending on
worldwide demand and supply;
● changes in
the agricultural subsidy levels in certain important countries
(mainly the United States and countries in the European Union) and
the adoption of other government policies affecting industry market
conditions and prices;
● changes to
trade barriers of certain important consumer markets (including
China, India, the U.S. and the E.U.) and the adoption of other
governmental policies affecting industry market conditions and
prices;
● changes in
government policies for biofuels;
● world
inventory levels, i.e., the supply of commodities carried over from
year to year;
● climatic
conditions and natural disasters in areas where agricultural
products are cultivated;
● the
production capacity of our competitors; and
● demand for
and supply of competing commodities and substitutes.
Our
financial condition and results of operations could be materially
and adversely affected if the prices of our agricultural products
decline.
36
Unpredictable weather conditions, pest infestations and diseases
may have an adverse impact on our crop yields and cattle
production.
The
occurrence of severe adverse weather conditions, especially
droughts, hail, or floods, is unpredictable and may have a
potentially devastating impact upon our crop production and, to a
lesser extent, our cattle and wool production, and may otherwise
adversely affect the supply and price of the agricultural
commodities that we sell and use in our business. The occurrence of
severe adverse weather conditions may reduce yields on our
farmlands or require us to increase our level of investment to
maintain yields. Additionally, higher than average temperatures and
rainfall can contribute to an increased presence of pest and
insects that may adversely impact our agricultural
production.
According to the
United States Department of Agriculture (“USDA”)
estimates, Argentina’s crops output (wheat, corn and soybean)
for the 2017/2018 season is expected to decrease by 23%, reaching a
production of 87.8 million tons, as compared to the previous cycle.
The forecast shows mainly an increase in the planted area, with a
focus on wheat and corn, which is additionally enhanced by a
slightly better expected yield in comparison with the 2016/2017
campaign. The estimated production of soybean is supposed to reach
37.8 million tons, the wheat production 18 million tons and the
corn production 32 million tons.
The
occurrence and effects of disease and plagues can be unpredictable
and devastating to agricultural products, potentially rendering all
or a substantial portion of the affected harvests unsuitable for
sale. Our agricultural products are also susceptible to fungus and
bacteria that are associated with excessively moist conditions.
Even when only a portion of the production is damaged, our results
of operations could be adversely affected because all or a
substantial portion of the production costs have been incurred.
Although some diseases are treatable, the cost of treatment is
high, and we cannot assure you that such events in the future will
not adversely affect our operating results and financial condition.
Furthermore, if we fail to control a given plague or disease and
our production is threatened, we may be unable to supply our main
customers, which could affect our results of operations and
financial condition.
As a
result, we cannot assure you that the current and future severe
adverse weather conditions or pest infestations will not adversely
affect our operating results and financial condition.
Our cattle are subject to diseases.
Diseases among our
cattle herds, such as mastitis, tuberculosis, brucellosis and
foot-and-mouth disease, can have an adverse effect on milk
production and fattening, rendering cows unable to produce milk or
meat for human consumption. Outbreaks of cattle diseases may also
result in the closure of certain important markets, such as the
United States, to our cattle products. Although we abide by
national veterinary health guidelines, which include laboratory
analyses and vaccination, to control diseases among the herds,
especially foot-and-mouth disease, we cannot assure that future
outbreaks of cattle diseases will not occur. A future outbreak of
diseases among our cattle herds may adversely affect our cattle and
milk sales which could adversely affect our operating results and
financial condition.
We may be exposed to material losses due to volatile crop prices
since a significant portion of our production is not hedged, and
exposed to crop price risk.
Due to
the fact that we do not have all of our crops hedged, we are unable
to have minimum price guarantees for all of our production and are
therefore exposed to significant risks associated with the level
and volatility of crop prices. We are subject to fluctuations in
crop prices which could result in receiving a lower price for our
crops than our production cost. We are also subject to exchange
rate risks related to our crops that are hedged, because our
futures and options positions are valued in U.S. Dollars, and thus
are subject to exchange rate risk.
In
addition, if severe weather or any other disaster generates a lower
crop production than the position already sold in the market, we
may suffer material losses in the repurchase of the sold
contracts.
37
The creation of new export taxes may have an adverse impact on our
sales and results of operations.
In
order to prevent inflation and variations in the exchange rate from
adversely affecting prices of primary and manufactured products
(including agricultural products), and to increase tax collections
and reduce Argentina’s fiscal deficit, the Argentine
government has imposed new taxes on exports. Pursuant to Resolution
No. 11/02 of the Ministry of Economy and Production, as amended by
Resolution No. 35/02, No. 160/2002, No. 307/2002 and No. 530/2002,
effective as of March 5, 2002, the Argentine government imposed a
20%, 10% and 5% export tax on primary and manufactured products. On
November 12, 2005, pursuant to Resolution No. 653/2005, the
Ministry of
Economy and
Production increased the tax on cattle exports from 5% to 10%, and
on January 2007 increased the tax on soybean exports from 23.5% to
27.5%. Pursuant to Resolutions No. 368/07 and No. 369/07 both dated
November 12, 2007, the Ministry of Economy and Production further
increased the tax on soybean exports from 27.5% to 35.0% and also
the tax on wheat and corn exports from 20.0% to 28.0% and from
20.0% to 25.0%, respectively. In early March 2008, the Argentine
government introduced a regime of sliding –scale export
tariffs for oilseed, grains and by-products, where the withholding
rate (in percentage) would increase to the same extent as the
crops’ price. Therefore, it imposed an average tax for
soybean exports of 46%, compared to the previous fixed rate of 35%.
In addition, the tax on exports of wheat was increased, from a
fixed rate of 28% to an average variable rate of 38%, and the tax
on exports of corn changed from a fixed rate of 25% to an average
variable rate of 36%. This tariff regime, which according to
farmers effectively sets a maximum price for their crops, sparked
widespread strikes and protests by farmers whose exports have been
one of the principal driving forces behind Argentina’s recent
growth. In April 2008, as a result of the export tariff regime,
farmers staged a 21-day strike in which, among other things,
roadblocks were set up throughout the country, triggering
Argentina’s most significant political crisis in five years.
These protests disrupted transport and economic activity, which led
to food shortages, a surge in inflation and a drop in export
registrations. Finally, the federal executive branch decided to
send the new regime of sliding-scale export tariffs to the federal
congress for its approval. The project was approved in the lower
chamber of the national congress but rejected by the Senate.
Subsequently, the federal government abrogated the regime of
sliding-scale export tariffs and reinstated the previous scheme of
fixed withholdings.
In
December 2015, the government of Mauricio Macri announced the
reduction of 35 to 30% of export duties on soybean and the removing
of all of the export duties for the rest of the products. To the
date, the Argentine government is analyzing the possibility of
reducing again the tax for soybean exports. In addition, Decree
1343/17 implemented a monthly reduction of 0.5% of the export duty
in force on soybean, wheat and soybean oil from January 2018 to
December 2019 inclusive.
On
September 4, 2018, pursuant to Decree 793/2018, the Argentine
Government restablished, until December 31, 2020, a 12% export tax
on commodities with a cap of Ps.4 for each dollar for primary
commodities and Ps.3 for the rest of the manufactured
products.
Export
taxes may have a material adverse effect on our sales and results
of operations. We produce exportable goods and, therefore, an
increase in export taxes is likely to result in a decrease in our
products’ price, and, therefore, may result in a decrease of
our sales. We cannot guarantee the impact of those or any other
future measures that might be adopted by the Argentine government
on our financial condition and result of operations.
An international credit crisis could have a negative impact on our
major customers which in turn could materially adversely affect our
results of operations and liquidity.
The
most recent international credit crisis that started in 2008 had a
significant negative impact on businesses around the world.
Although we believe that available borrowing capacity under the
current conditions and proceeds resulting from potential farmland
sales will provide us with sufficient liquidity through the current
economic environment, the impact of the crisis on our major
customers cannot be predicted and may be quite severe. A disruption
in the ability of our significant customers to access liquidity
could cause serious disruptions or an overall deterioration of
their businesses which could lead to a reduction in their future
orders of our products and the inability or failure on their part
to meet their payment obligations to us, any of which could have a
material adverse effect on our results of operations and
liquidity.
Government intervention in the markets may have a direct impact on
our prices.
The
Argentine government has set certain industry market conditions and
prices in the past. In order to prevent a substantial increase in
the price of basic products as a result of inflation, the Argentine
government is adopting an interventionist policy. In March 2002,
the Argentine government fixed the price for milk after a conflict
among producers and the government. Since 2005, the Argentine
government, in order to increase the domestic availability of beef
and reduce domestic prices, adopted several measures: it increased
turnover tax and established a minimum average number of animals to
be slaughtered. In March 2006, the registries for beef exports were
temporarily suspended. This last measure was softened once prices
decreased. There can be no assurance that the Argentine government
will not interfere in other areas by setting prices or regulating
other market conditions. Accordingly, we cannot assure you that we
will be able to freely negotiate all our products’ prices in
the future or that the prices or other market conditions that the
Argentine government could impose will allow us to freely negotiate
the price of our products.
38
We do not maintain insurance over all our crop storage facilities;
therefore, if a fire or other disaster damages some or all of our
harvest, we will not be completely covered.
Our
production is, in general, subject to different risks and hazards,
including adverse weather conditions, fires, diseases, pest
infestations and other natural phenomena. We store a significant
portion of our grain production during harvest due to the seasonal
drop in prices that normally occurs at that time. Currently, we
store a significant portion of our grain production in plastic
silos. We do not maintain insurance on our plastic silos. Although
our plastic silos are placed in several different locations, and it
is unlikely that a natural disaster affects all of them
simultaneously, a fire or other natural disaster which damages the
stored grain, particularly if such event occurs shortly after
harvesting, could have an adverse effect on our operating results
and financial condition.
Worldwide competition in the markets for our products could
adversely affect our business and results of
operations.
We
experience substantial worldwide competition in each of our markets
in which we operate, and in many of our product lines. The market
for cereals, oil seeds and by-products is highly competitive and
also sensitive to changes in industry capacity, producer
inventories and cyclical changes in the world’s economies,
any of which may significantly affect the selling prices of our
products and thereby our profitability. Argentina is more
competitive in the oilseed market than in the market for cereals.
Due to the fact that many of our products are agricultural
commodities, they compete in the international markets almost
exclusively on the basis of price. The market for commodities is
highly fragmented. Small producers can also be important
competitors, some of which operate in the informal economy and are
able to offer lower prices by meeting lower quality standards.
Competition from other producers is a barrier to expanding our
sales in the domestic/foreign market. Many other producers of these
products are larger than us, and have greater financial and other
resources. Moreover, many other producers receive subsidies from
their respective countries while we do not receive any such
subsidies from the Argentine government. These subsidies may allow
producers from other countries to produce at lower costs than us
and/or endure periods of low prices and operating losses for longer
periods than we can. Any increased competitive pressure with
respect to our products could materially and adversely affect our
financial condition and results of operations.
Social movements may affect the use of our agricultural properties
or cause damage to them.
Social
movements, such as the Landless Rural Workers’ Movement
(
Movimento dos Trabalhadores
Rurais Sem Terra
) and the Pastoral Land Commission
(
Comissão Pastoral da
Terra
) are active in Brazil and advocate land reform and
property redistribution by the Brazilian government. Invasion and
occupation of agricultural land by large numbers of people is a
common practice among the members of such movements and, in certain
regions, including those where we currently invest, remedies such
as police protection or eviction procedures are inadequate or
non-existent. As a result, we cannot assure you that our
agricultural properties will not be subject to invasion or
occupation by any social movement. Any invasion or occupation may
materially impair the use of our lands and adversely affect our
business, financial condition, and results of
operations.
If we are unable to maintain our relationships with our customers,
our business may be adversely affected.
Our
cattle sales are diversified but we are and will continue to be
significantly dependent on a number of third party relationships,
mainly with our customers for crop sales. During the fiscal year
2018, we sold our products to approximately 500 customers. Sales of
agricultural products to our ten largest customers represented
approximately 60% of our net agricultural sales for the fiscal year
ended June 30, 2018. Of these customers, our most important
customers were Cargill S.A.C.I., Cofco, ADM AGR, Bunge Alimentos S.
A. and Vicentin SACI.
We sell
our crop production mainly to exporters and manufacturers that
process the raw materials to produce meal and oil, products that
are sent to the export markets. The Argentine crop market is
characterized by a few purchasers and a great number of sellers.
Although most of the purchasers are international companies with
strong financial conditions, we cannot assure you that this
situation will remain the same in the future or this market will
not get more concentrated in the future.
We may
not be able to maintain or form new relationships with customers or
others who provide products and services that are important to our
business. Accordingly, we cannot assure you that our existing or
prospective relationships will result in sustained business or the
generation of significant revenues.
Our business is seasonal, and our revenues may fluctuate
significantly depending on the growing cycle.
Our
agricultural business is highly seasonal due to its nature and
cycle. The harvest and sale of crops (corn, soybean and sunflower)
generally occurs from February to June. Wheat is harvested from
December to January. Our operations and sales are affected by the
growing cycle of the crops we process and by decreases during the
summer
in the price of the
cattle we fatten. As a result, our results of operations have
varied significantly from period to period, and are likely to
continue to vary, due to seasonal factors.
39
A substantial portion of our assets is farmland that is highly
illiquid.
We have
been successful in partially rotating and monetizing a portion of
our investments in farmland. Ownership of a significant portion of
the land we operate is a key part of our business model. However,
agricultural real estate is generally an illiquid asset. Moreover,
the adoption of laws and regulations that impose limitations on
ownership of rural land by foreigners in the jurisdictions in which
we operate may also limit the liquidity of our farmland holdings.
See “—Risks Related to Argentina— The Rural Land
Law and its application.” As a result, it is unlikely that we
will be able to adjust our owned agricultural real estate portfolio
promptly in response to changes in economic, business or regulatory
conditions. Illiquidity in local market conditions may adversely
affect our ability to complete dispositions, to receive proceeds
generated from any such sales or to repatriate any such
proceeds.
The restrictions imposed on our subsidiaries’ dividend
payments may adversely affect us.
We have
subsidiaries, and therefore, dividends in cash and other permitted
payments of our subsidiaries constitute a major source of our
income. The debt agreements of our subsidiaries contain covenants
that may restrict their ability to pay dividends or proceed with
other types of distributions. If our subsidiaries are prevented
from making payments to us or if they are only allowed to pay
limited amounts, we may be unable to pay dividends or to repay our
indebtedness.
We could be materially and adversely affected by our investment in
Brasilagro.
We
consolidated our financial statements with our subsidiary
Brasilagro. Brasilagro was formed on September 23, 2005 to exploit
opportunities in the Brazilian agricultural sector. Brasilagro
seeks to acquire and develop future properties to produce a
diversified range of agricultural products (which may include
sugarcane, grains, cotton, forestry products and livestock).
Brasilagro is a startup company that has been operating since 2006.
As a result, it has a developing business strategy and limited
track record. Brasilagro’s business strategy may not be
successful, and if not successful, Brasilagro may be unable to
successfully modify its strategy. Brasilagro’s ability to
implement its proposed business strategy may be materially and
adversely affected by many known and unknown factors. If we were to
write-off our investments in Brasilagro, this would likely
materially and adversely affect our business. As of June 30, 2018,
we owned 43.29% of the outstanding common shares of
Brasilagro.
We are subject to extensive environmental regulation.
Our
activities are subject to a wide set of federal, state and local
laws and regulations relating to the protection of the environment,
which impose various environmental obligations. Obligations include
compulsory maintenance of certain preserved areas in our
properties, management of pesticides and associated hazardous waste
and the acquisition of permits for water use. Our proposed business
is likely to involve the handling and use of hazardous materials
that may cause the emission of certain regulated substances. In
addition, the storage and processing of our products may create
hazardous conditions. We could be exposed to criminal and
administrative penalties, in addition to the obligation to remedy
the adverse effects of our operations on the environment and to
indemnify third parties for damages, including the payment of
penalties for non-compliance with these laws and regulations. Since
environmental laws and their enforcement are becoming more
stringent in Argentina, our capital expenditures and expenses for
environmental compliance may substantially increase in the future.
In addition, due to the possibility of future regulatory or other
developments, the amount and timing of environmental-related
capital expenditures and expenses may vary substantially from those
currently anticipated. The cost of compliance with environmental
regulation may result in reductions of other strategic investments
which may consequently decrease our profits. Any material
unforeseen environmental costs may have a material adverse effect
on our business, results of operations, financial condition or
prospects.
As of
June 30, 2018, we owned land reserves extending over more than
355,395 hectares that were purchased at very attractive prices. In
addition, we have a concession over 106,400 hectares reserved for
future development. We believe that there are technological tools
available to improve productivity in these farmlands and,
therefore, achieve appreciation in the long term. However, current
or future environmental regulations could prevent us from fully
developing our land reserves by requiring that we maintain part of
this land as natural woodlands not to be used for production
purposes.
Increased energy prices and fuel shortages could adversely affect
our operations.
We
require substantial amounts of fuel oil and other resources for our
harvest activities and transport of our agricultural products. We
rely upon third parties for our supply of the energy resources
consumed in our operations. The prices for and availability of
energy resources may be subject to change or curtailment,
respectively, due to,
among other things,
new laws or regulations, imposition of new taxes or tariffs,
interruptions in production by suppliers, worldwide price levels
and market conditions. The prices of various sources of energy may
increase significantly from current levels. An increase in energy
prices could materially adversely affect our results of operations
and financial condition.
40
Over
the last few years, the Argentine government has taken certain
measures in order to reduce the use of energy during peak months of
the year by frequently cutting energy supply to industrial
facilities and large consumers to ensure adequate supply for
residential buildings. Also, the Macri administration in Argentina
declared a state of emergency with respect to the national energy
system which remained in effect until December 31, 2017. In
addition, through Resolution No. 6/2016 of the Ministry of
Energy and Mining and Resolution No. 1/2016 of the National
Electricity Regulatory Agency (Ente Nacional Regulador de la
Electricidad), the Macri administration announced the elimination
of a portion of energy subsidies then in effect and implemented a
substantial increase in electricity tariffs. As a result, average
electricity prices increased substantially and could increase
further in the future. If energy supply is cut for an extended
period of time or energy tariffs continue increasing and we are
unable to find replacement sources at comparable prices, or at all,
our business and results of operations could be adversely
affected.
Our level of debt may adversely affect our operations and our
ability to pay our debt as it becomes due.
We had,
and expect to have, substantial liquidity and capital resource
requirements to finance our business. As of June 30, 2018, our
consolidated financial debt amounted to Ps.206,633 million
(including IDBD’s debt outstanding as of that date plus
accrued and unpaid interest on such indebtedness and deferred
financing costs). We cannot assure you that we will have sufficient
cash flows and adequate financial capacity in the future. While the
commitments and other covenants applicable to IDBD’s debt
obligations do not have apply IRSA since such it is not recourse to
IRSA and it is not guaranteed by IRSA’s assets, these
covenants and restrictions may impair or restrict our ability to
operate IDBD and implement our business strategy.
The
fact that we are highly leveraged may affect our ability to
refinance existing debt or borrow additional funds to finance
working capital requirements, acquisitions and capital
expenditures. In addition, the recent disruptions in the global
financial markets, including the bankruptcy and restructuring of
major financial institutions, may adversely impact our ability to
refinance existing debt and the availability and cost of credit in
the future. In such conditions, access to equity and debt financing
options may be restricted and it may be uncertain how long these
economic circumstances may last. This would require us to allocate
a substantial portion of cash flow to repay principal and interest,
thereby reducing the amount of money available to invest in
operations, including acquisitions and capital expenditures. Our
leverage could also affect our competitiveness and limit our
ability to changes in market conditions, changes in the real estate
industry and economic downturns.
We may
not be able to generate sufficient cash flows from operations to
satisfy our debt service requirements or to obtain future
financing. If we cannot satisfy our debt service requirements or if
we default on any financial or other covenants in our debt
arrangements, the lenders and/or holders of our debt will be able
to accelerate the maturity of such debt or cause defaults under the
other debt arrangements. Our ability to service debt obligations or
to refinance them will depend upon our future financial and
operating performance, which will, in part, be subject to factors
beyond our control such as macroeconomic conditions and regulatory
changes in Argentina. If we cannot obtain future financing, we may
have to delay or abandon some or all of our planned capital
expenditures, which could adversely affect our ability to generate
cash flows and repay our obligations as they become
due.
We depend on our chairman and senior management.
Our
success depends, to a significant extent, on the continued
employment of Mr. Eduardo S. Elsztain, our chairman, and Alejandro
G. Elsztain, our chief executive officer, and second vice-chairman.
The loss of their services for any reason could have a material
adverse effect on our business. If our current principal
shareholders were to lose their influence on the management of our
business, our principal executive officers could resign or be
removed from office.
Our
future success also depends in part upon our ability to attract and
retain other highly qualified personnel. We cannot assure you that
we will be successful in hiring or retaining qualified personnel,
or that any of our personnel will remain employed by
us.
The Investment Company Act may limit our future
activities.
Under
Section 3(a)(3) of the Investment Company Act of 1940, as amended
(“Investment Company Act”), an investment company is
defined in relevant part to include any company that owns or
proposes to acquire investment securities that have a value
exceeding 40% of such company’s unconsolidated total assets
(exclusive of U.S. government securities and cash items).
Investments in minority interests of related entities as well as
majority interests in consolidated subsidiaries which themselves
are investment companies are included within the definition of
“investment securities” for purposes of the 40% limit
under the Investment Company Act.
Companies that are
investment companies within the meaning of the Investment Company
Act, and that do not qualify for an exemption from the provisions,
are required to register with the SEC and are subject to
substantial regulations with respect to capital structure,
operations, transactions with affiliates and other matters. In the
event such companies do not register under the Investment Company
Act, they may not, among other things, conduct public offerings of
their securities in the United States or engage in interstate
commerce in the United States. Moreover, even if we desired to
register with the SEC as an investment company, we could not do so
without an order of the Commission because we are a non-U.S.
corporation, and it is unlikely that the SEC would issue such an
order.
In
recent years we made a significant investment in the capital stock
of IRSA. As of June 30, 2018, we owned approximately 63.38% of
IRSA’s outstanding shares. Although we believe we are not an
“investment company” for purposes of the Investment
Company Act, our belief is subject to substantial uncertainty, and
we cannot give you any assurance that we would not be determined to
be an “investment company” under the Investment Company
Act. As a result, the uncertainty regarding our status under the
Investment Company Act may adversely affect our ability to offer
and sell securities in the United States or to U.S. persons. The
U.S. capital markets have historically been an important source of
funding for us, and our ability to obtain financing in the future
may be adversely affected by a lack of access to the U.S. markets.
If an exemption under the Investment Company Act is unavailable to
us in the future and we desire to access the U.S. capital markets,
our only recourse would be to file an application to the SEC for an
exemption from the provisions of the Investment Company Act which
is a lengthy and highly uncertain process.
Moreover, if we
offer and sell securities in the United States or to U.S. persons
and we were deemed to be an investment company under the investment
company act and not exempted from the application of the Investment
Company Act, contracts we enter into in violation of, or whose
performance entails a violation of, the Investment Company Act,
including any such securities, may not be enforceable against
us.
41
We hold Argentine securities which might be more volatile than U.S.
securities and carry a greater risk of default.
We
currently have and in the past have had certain investments in
Argentine government debt securities, corporate debt securities,
and equity securities. In particular, we hold a significant
interest in IRSA, an Argentine company that has suffered material
losses, particularly during the fiscal years 2001 and 2002.
Although our holding of these investments, excluding IRSA, tends to
be short term, investments in such securities involve certain
risks, including:
● market
volatility, higher than those typically associated with U.S.
government and corporate securities; and
● loss of
principal.
Some of
the issuers in which we have invested and may invest, including the
Argentine government, have in the past experienced substantial
difficulties in servicing their debt obligations, which have led to
the restructuring of certain indebtedness. We cannot assure that
the issuers in which we have invested or may invest will not be
subject to similar or other difficulties in the future which may
adversely affect the value of our investments in such issuers. In
addition, such issuers and, therefore, such investments, are
generally subject to many of the risks that are described in this
section with respect to us, and, thus, could have little or no
value.
Risks
relating to IRSA´s business in Argentina
IRSA is subject to risks inherent to the operation of shopping
malls that may affect IRSA´s profitability.
IRSA´s
shopping malls are subject to various factors that affect their
development, administration and profitability,
including:
● decline in
IRSA´s leases prices or increases in levels of default by its
tenants due to economic conditions, increases in interest rates and
other factors outside its control;
● the
accessibility and attractiveness of the area where the shopping
mall is located;
● the
intrinsic attractiveness of the shopping mall;
● the flow of
people and the level of sales of rental units in its shopping
malls;
● the
increasing competition from internet sales;
● the amount
of rent collected from tenant at IRSA´s shopping
mall;
● changes in
consumer demand and availability of consumer credit (considering
the limits imposed by the Central Bank to interest rates charged by
financial institutions), both of which are highly sensitive to
general macroeconomic conditions; and
●
fluctuations in occupancy levels in IRSA´s shopping
malls.
An
increase in IRSA´s operating costs, caused by inflation or by
other factors, could have a material adverse effect on us if
IRSA´s tenants are unable to pay higher rent as a result of
increased expenses. Moreover, the shopping mall business is closely
related to consumer spending and affected by prevailing economic
conditions. All of IRSA´s shopping malls and commercial
properties, under Operations Center in Argentina, are located in
Argentina, and, as a consequence, their business is vulnerable to
recession and economic downturns in Argentina. For example, during
the economic crisis in Argentina that began in 2001, consumer
spending decreased significantly, and higher unemployment,
political instability and high rates of inflation significantly
reduced consumer spending and resulted in lower sales that led some
tenants to shut down. Persistently poor economic conditions in
Argentina in the future could result in a decline in discretionary
consumer spending which will likely have a material adverse effect
on the revenues from shopping mall activity and thus on IRSA´s
business.
IRSA´s assets are highly concentrated in certain geographic
areas and an economic downturn in such areas could have a material
adverse effect on its results of operations and financial
condition.
For the
fiscal year ended June 30, 2018, 86% of IRSA´s sales from
leases and services provided by the Shopping Malls segment were
derived from shopping malls in the City of Buenos Aires and the
Greater Buenos Aires. In addition, all of IRSA´s office
buildings are located in the City of Buenos Aires and a substantial
portion of IRSA´s revenues in Argentina are derived from such
properties. Although IRSA owns properties and may acquire or
develop additional properties outside the City of Buenos Aires and
the Greater Buenos Aires area, IRSA expects to
continue to depend
to a large extent on economic conditions affecting those areas.
Consequently, an economic downturn in those areas could have a
material adverse effect on IRSA´s financial condition and
results of operations by reducing its rental income and adversely
affect its ability to meet its debt obligations and fund its
operations.
42
IRSA´s performance is subject to risks associated with our
properties and with the real estate industry.
IRSA´s
operating performance and the value of our real estate assets are
subject to the risk that its properties may not be able to generate
sufficient revenues to meet its operating expenses, including debt
service and capital expenditures, its cash flow and ability to
service its debt and to cover other expenses may be adversely
affected.
Events
or conditions beyond our control that may adversely affect our
operations or the value of our properties include:
● downturns
in the national, regional and local economic climate;
● volatility
and decline in discretionary consumer spending;
● competition
from other shopping malls and office, and commercial
buildings;
● local real
estate market conditions, such as oversupply or reduction in demand
for retail, office, or other commercial space;
● decreases
in consumption levels;
● changes in
interest rates and availability of financing;
● the
exercise by IRSA´s tenants of their legal right to early
termination of their leases;
● vacancies,
changes in market rental rates and the need to periodically repair,
renovate and re-lease space;
● increased
operating costs, including insurance expenses, employee expenses,
utilities, real estate taxes and security costs;
● civil
disturbances, earthquakes and other natural disasters, or terrorist
acts or acts of war which may result in uninsured or underinsured
losses;
● significant
expenditures associated with each investment, such as debt service
payments, real estate taxes, insurance and maintenance
costs;
● declines in
the financial condition of IRSA´s tenants and its ability to
collect rents when due;
● changes in
its or its tenants’ ability to provide for adequate
maintenance and insurance, possibly decreasing the useful life of
and revenue from property;
● changes in
law or governmental regulations (such as those governing usage,
zoning and real property taxes) or government action such as
expropriation, confiscation or revocation of concessions;
and
● judicial
interpretation of the Civil and Commercial Code (effect since
August 1, 2015) which may be adverse to its interests.
If any
one or more of the foregoing conditions were to affect IRSA´s
business, its financial condition and results of operations could
be materially and adversely affected.
An adverse economic environment for real estate companies such as a
credit crisis may adversely impact IRSA´s results of
operations and business prospects significantly.
The
success of IRSA´s business and profitability of its operations
depend on continued investment in real estate and access to capital
and debt financing. A prolonged crisis of confidence in real estate
investments and lack of credit for acquisitions may constrain its
growth. As part of IRSA´s strategy, the Company intends to
increase its properties portfolio though strategic acquisitions of
core properties at favorable prices, where IRSA believes it can
bring the necessary expertise to enhance property values. In order
to pursue acquisitions, IRSA may need access to equity capital
and/or debt financing. Any disruptions in the financial markets may
adversely impact its ability to refinance existing debt and the
availability and cost of credit in the near future. Any
consideration of sales of existing properties or portfolio
interests may be offset by lower property values. IRSA´s
ability to make scheduled payments or to refinance its existing
debt obligations depends on its operating and financial
performance, which in turn is subject to prevailing economic
conditions. If a recurrence of the disruptions in financial markets
remains or arises in the future, there can be no assurances that
government responses to such disruptions will restore investor
confidence, stabilize the markets or increase liquidity and the
availability of credit.
43
IRSA´s revenue and net income may be materially and adversely
affected by continuing inflation and any economic slowdown in
Argentina.
IRSA´s
business is mainly depends on consumer spending since a portion of
its revenue from its shopping mall segment derives directly from
the sales of its tenants. In addition, its tenants’ revenue
relies mainly on the sales to costumers. As a result, its revenue
and net income are impacted to a significant extent by economic
conditions in Argentina, including the development in the textile
industry and domestic consumption, which has suffered a significant
low in 2018. The Argentine economy and level of consumer spending
are influenced by many factors beyond its control, including
consumer perception of current and future economic conditions,
inflation, political uncertainty, level of employment, interest
rates, taxation and currency exchange rates.
Any
continuing economic slowdown, whether actual or perceived, could
significantly reduce domestic consumer spending in Argentina and
therefore adversely affect its business, financial condition and
results of operations.
The loss of tenants could adversely affect the operating revenues
and value of IRSA´s properties.
Although
no single tenant represents more than 3% of its revenue, if a
significant number of tenants at its retail or office properties
were to experience financial difficulties, including bankruptcy,
insolvency or a general downturn of business, or if IRSA failed to
retain them, its business could be adversely affected. Further, its
shopping malls typically have a significant “anchor”
tenant, such as well-known department stores that generate consumer
traffic at each mall. A decision by such tenants to cease
operations at its shopping malls or its office buildings, as
applicable, could have a material adverse effect on IRSA´s
financial condition and the results of its operations. In addition,
the closing of one or more stores with high consumer traffic may
motivate other tenants to terminate or to not renew their leases,
to seek rent relief and/or close their stores or otherwise
adversely affect the occupancy rate at the property. Moreover,
tenants at one or more properties might terminate their leases as a
result of mergers, acquisitions, consolidations, dispositions or
bankruptcies. The bankruptcy and/or closure of multiple stores, if
IRSA is not able to successfully re-lease the affected space, could
have a material adverse effect on both the operating revenues and
underlying value of the properties involved.
IRSA´s revenue and net income may be materially and adversely
affected by continuing inflation and any economic slowdown in
Argentina.
IRSA´s
business is mainly driven by consumer spending since a portion of
our revenue from our shopping mall segment derives directly from
the sales of our tenants. In addition, our tenants’ revenue
relies mainly on the sales to costumers. As a result, our revenue
and net income are impacted to a significant extent by economic
conditions in Argentina, including the development in the textile
industry and domestic consumption, which has suffered a significant
low in 2018. The Argentine economy and level of consumer spending
are influenced by many factors beyond our control, including
consumer perception of current and future economic conditions,
inflation, political uncertainty, level of employment, interest
rates, taxation and currency exchange rates.
Any continuing economic slowdown, whether actual
or perceived, could significantly reduce domestic consumer spending
in Argentina and therefore adversely affect our business, financial
condition and results of operations
.
IRSA may face risks associated with property
acquisitions.
IRSA
has in the past acquired, and intend to acquire in the future,
properties, including large properties that would increase the size
of IRSA´s company and potentially alter its capital structure.
Although IRSA believes that the acquisitions that the Company has
completed in the past and that are expected to undertake in the
future have, and will, enhance IRSA´s future financial
performance, the success of such transactions is subject to a
number of uncertainties, including the risk that:
●
IRSA may not be
able to obtain financing for acquisitions on favorable terms or at
all;
●
acquired properties
may fail to perform as expected;
●
the actual costs of
repositioning or redeveloping acquired properties may be higher
than IRSA´s estimates; and
●
acquired properties
may be located in new markets where IRSA may have limited knowledge
and understanding of the local economy, absence of business
relationships in the area or are unfamiliar with local governmental
and permitting procedures.
If IRSA acquire new
properties, it may not be able to efficiently integrate acquired
properties, particularly portfolios of properties, into its
organization and to manage new properties in a way that allows us
to realize cost savings and synergies, which could impair its
results of operations.
44
IRSA´s future acquisitions may not be profitable.
IRSA
seeks to acquire additional properties to the extent it manages to
acquire them on favorable terms and conditions and they meet its
investment criteria. Acquisitions of commercial properties entail
general investment risks associated with any real estate
investment, including:
● IRSA´s
estimates of the cost of improvements needed to bring the property
up to established standards for the market may prove to be
inaccurate;
● Acquired
properties may fail to achieve, within the time frames, the Company
projects, the occupancy or rental rates that expects to achieve at
the time we make the decision to acquire, which may result in the
properties’ failure to achieve the returns we
projected;
● IRSA´s
pre-acquisition evaluation of the physical condition of each new
investment may not detect certain defects or identify necessary
repairs, which could significantly increase its total acquisition
costs; and
● IRSA´s
investigation of a property or building prior to its acquisition,
and any representations the Company may receive from the seller of
such building or property, may fail to reveal various liabilities,
which could reduce the cash flow from the property or increase
IRSA´s acquisition cost.
If IRSA
acquires a business,the Company will be required to merge and
integrate the operations, personnel, accounting and information
systems of such acquired business. In addition, acquisitions of or
investments in companies may cause disruptions in its operations
and divert management’s attention away from day-to-day
operations, which could impair its relationships with its current
tenants and employees.
Properties IRSA acquires may subject us to unknown
liabilities.
Properties that
IRSA acquires may be subject to unknown liabilities and IRSA
generally would have no recourse, or only limited recourse to the
former owners of the properties in respect thereof. Thus, if a
liability were asserted against IRSA based on ownership of an
acquired property, the Company may be required to pay significant
sums to settle it, which could adversely affect its financial
results and cash flow. Unknown liabilities relating to acquired
properties could include:
● liabilities
for clean-up of undisclosed environmental
contamination;
● liabilities
related to changes in laws or in governmental regulations (such as
those governing usage, zoning and real property taxes);
and
● liabilities
incurred in the ordinary course of business.
IRSA´s dependence on rental income may adversely affect its
ability to meet its debt obligations.
A
substantial part of IRSA´s income is derived from rental
income from real property. As a result, its performance depends on
its ability to collect rent from tenants. IRSA´s income and
funds for distribution would be negatively affected if a
significant number of its tenants:
●
delay lease
commencements;
●
decline to extend
or renew leases upon expiration;
●
fail to make rental
payments when due; or
●
close stores or
declare bankruptcy.
Any of
these actions could result in the termination of leases and the
loss of related rental income. In addition IRSA cannot assure you
that any tenant whose lease expires will renew that lease or that
IRSA will be able to re-lease space on economically advantageous
terms or at all. The loss of rental revenues from a number of its
tenants and IRSA´s inability to replace such tenants may
adversely affect its profitability and its ability to meet debt
service and other financial obligations.
45
It may be difficult to buy and sell real estate quickly and
transfer restrictions may apply to part of IRSA´s portfolio of
properties.
Real
estate investments are relatively illiquid and this tends to limit
IRSA´s ability to vary its portfolio in response to economic
changes or other conditions. In addition, significant expenditures
associated with each investment, such as mortgage payments, real
estate taxes and maintenance costs, are generally not reduced when
circumstances cause a decrease in income from an investment. If
income from a property declines while the related expenses do not
decline, IRSA´s business would be adversely affected. Further,
if it becomes necessary or desirable for us to dispose of one or
more of its mortgaged properties, the Company may not be able to
obtain a release of the lien on the mortgaged property without
payment of the associated debt. The foreclosure of a mortgage on a
property or inability to sell a property could adversely affect its
business.
Some of the land IRSA has purchased is not zoned for development
purposes, and IRSA may be unable to obtain, or may face delays in
obtaining, the necessary zoning permits and other
authorizations.
IRSA
owns several plots of land which are not zoned for the type of
projects it intends to develop. In addition, IRSA does not yet have
the required land-use, building, occupancy and other required
governmental permits and authorizations for these properties. IRSA
cannot assure you that it will continue to be successful in its
attempts to rezone land and to obtain all necessary permits and
authorizations, or that rezoning efforts and permit requests will
not be unreasonably delayed or rejected. Moreover, IRSA may be
affected by building moratorium and anti-growth legislation. If
IRSA is unable to obtain all of the governmental permits and
authorizations needed to develop its present and future projects as
planned, the Company may be forced to make unwanted modifications
to such projects or abandon them altogether.
IRSA´s ability to grow will be limited if the Company cannot
obtain additional financing.
IRSA
must maintain
liquidity to fund IRSA´s working capital, service its
outstanding indebtedness and finance investment opportunities.
Without sufficient liquidity, the Company could be forced to
curtail its operations or IRSA may not be able to pursue new
business opportunities.
IRSA´s growth
strategy is focused on the development and redevelopment of
properties already owned and the acquisition and development of
additional properties. As a result, IRSA is likely to depend on an
important degree on the availability of debt or equity capital,
which may or may not be available on favorable terms or at all.
IRSA cannot assure you that additional financing, refinancing or
other capital will be available in the amounts required or on
favorable terms. IRSA´s access to debt or equity capital
markets depends on a number of factors, including the
market’s perception of risk in Argentina, of our growth
potential, its ability to pay dividends, its financial condition,
its credit rating and its current and potential future earnings.
Depending on these factors, IRSA could experience delays or
difficulties in implementing its growth strategy on satisfactory
terms or at all.
The
capital and credit markets have been experiencing extreme
volatility and disruption since the last credit crisis. If
IRSA´s current resources do not satisfy its liquidity
requirements, IRSA may have to seek additional financing. The
availability of financing will depend on a variety of factors, such
as economic and market conditions, the availability of credit and
our credit ratings, as well as the possibility that lenders could
develop a negative perception of the prospects of risk in
Argentina, of its company or the industry generally.IRSA may not be
able to successfully obtain any necessary additional financing on
favorable terms, or at all.
Disease outbreaks or other public health concerns could reduce
traffic in IRSA´s shopping malls.
As a
result of the outbreak of Swine Flu during the winter of 2009,
consumers and tourists dramatically changed their spending and
travel habits to avoid contact with crowds. Furthermore, several
governments enacted regulations limiting the operation of schools,
cinemas and shopping malls. Even though the Argentine government
only issued public service recommendations to the population
regarding the risks involved in visiting crowded places, such as
shopping malls, and did not issue specific regulations limiting
access to public places, a significant number of consumers
nonetheless changed their habits vis-à-vis shopping malls and
shopping malls. Similarly, the zika virus pandemic may result in
similar courses and outcomes. IRSA cannot assure you that a new
disease outbreak or health hazard (such as the Ebola outbreak in
recent years) will not occur in the future, or that such an
outbreak or health hazard would not significantly affect consumer
and/or tourists activity. The recurrence of such a scenario could
adversely affect its businesses and results of
operations.
46
Adverse incidents that occur in IRSA´s shopping malls may
result in damage to its reputation and a decrease in the number of
customers.
Given
that shopping malls are open to the public, with ample circulation
of people, accidents, theft, robbery and other incidents may occur
in IRSA´s facilities, regardless of the preventative measures
the Company adopts. In the event such an incident or series of
incidents occurs, shopping mall customers and visitors may choose
to visit other shopping venues that they believe are safer and less
violent, which may cause a reduction in the sales volume and
operating income of IRSA´s shopping malls
.
Argentine Law governing leases imposes restrictions that limit
IRSA´s flexibility.
Argentine laws
governing leases impose certain restrictions, including the
following:
● a
prohibition on including automatic price adjustment clauses based
on inflation increases in lease agreements; and
● the
imposition of a two-year minimum lease term for all purposes,
except in particular cases such as embassy, consulate or
international organization venues, room with furniture for
touristic purposes for less than three months, custody and bailment
of goods, exhibition or offering of goods in fairs or in cases
where due to the circumstances, the subject matter of the lease
agreement requires a shorter term.
As a
result of the foregoing, IRSA is exposed to the risk of increases
of inflation under its leases, and the exercise of rescission
rights by our tenants could materially and adversely affect our
business. IRSA cannot assure you that our tenants will not exercise
such right, especially if rent values stabilize or decline in the
future or if economic conditions deteriorate.
In
addition, on October 1, 2014, the Argentine Congress adopted a
new Civil and Commercial Code which is in force since
August 1, 2015. The Civil and Commercial Code requires that
lease agreements provide for a minimum term of two years, and a
maximum term of 20 years for residential leases and of
50 years for non-residential leases. Furthermore, the Civil
and Commercial Code modifies the regime applicable to contractual
provisions relating to foreign currency payment obligations by
establishing that foreign currency payment obligations may be
discharged in Pesos. This amends the prior legal framework,
pursuant to which debtors could only discharge their foreign
currency payment obligations by making payment in that currency.
Although certain judicial decisions have held that this feature of
the regulation can be set aside by the parties to an agreement, it
is still too early to determine whether or not this is legally
enforceable. Moreover, and regarding the new provisions for leases,
there are no judicial decisions on the scope of this amendment and,
in particular, in connection with the ability of the parties to any
contract to set aside the new provision and enforce such agreements
before an Argentine court.
IRSA
may be
liable for certain defects in our buildings.
According to the
Civil and Commercial Code, real estate developers (
i.e.
, any person who sells real estate
built by either themselves or by a third party contractor),
builders, technical project managers and architects are liable in
case of property damage—damages that compromise the
structural integrity of the structure and/or defects that render
the building no longer useful—for a period of three years
from the date of possession of the property, including latent
defects, even when those defects did not cause significant property
damage.
In
IRSA´s real estate developments, it usually acts as developers
and sellers while construction is carried out by third-party
contractors. Absent a specific claim, IRSA cannot quantify the
potential cost of any obligation that may arise as a result of a
future claim, and IRSA has not recorded provisions associated with
them in our financial statements. If IRSA was required to remedy
any defects on completed works, our financial condition and results
of operations could be adversely affected.
Eviction proceedings in Argentina are difficult and time
consuming.
Although Argentine
law permits an executive proceeding to collect unpaid rent and a
special proceeding to evict tenants, eviction proceedings in
Argentina are difficult and time-consuming. Historically, the heavy
workloads of the courts and the numerous procedural steps required
have generally delayed landlords’ efforts to evict tenants.
Eviction proceedings generally take between six months and two
years from the date of filing of the suit to the time of actual
eviction.
47
Historically, IRSA
has sought to negotiate the termination of lease agreements with
defaulting tenants after the first few months of non-payment in
order to avoid legal proceedings. Delinquency may increase
significantly in the future, and such negotiations with tenants may
not be as successful as they have been in the past. Moreover, new
Argentine laws and regulations may forbid or restrict eviction, and
in each such case they would likely have a material and adverse
effect on IRSA´s financial condition and results of
operation.
We are subject to risks inherent to the operation of office
buildings that may affect our profitability.
Office
buildings are subject to various factors that affect their
development, administration and profitability,
including:
● a decrease
in demand for office space;
● a
deterioration in the financial condition of IRSA´s tenants may
result in defaults under leases due to bankruptcy, lack of
liquidity or for other reasons;
●
difficulties or delays renewing leases or re-leasing
space;
● decreases
in rents as a result of oversupply, particularly of newer
buildings;
● competition
from developers, owners and operators of office properties and
other commercial real estate, including sublease space available
from IRSA´s tenants; and
●
maintenance, repair and renovation costs incurred to maintain the
competitiveness of IRSA´s office buildings.
If IRSA
is unable to adequately address these factors, any one of them
could adversely impact our business, which would have an adverse
effect on our financial condition and results of
operations.
IRSA´s investment in property development and management
activities may be less profitable than IRSA
anticipate.
IRSA is
engaged in the development and management of shopping malls, office
buildings and other rental properties, frequently through
third-party contractors. Risks associated with IRSA´s
development and management activities include the following, among
others:
● abandonment
of development opportunities and renovation proposals;
●
construction costs of a project may exceed our original estimates
for reasons including raises in interest rates or increases in the
costs of materials and labor, making a project
unprofitable;
● occupancy
rates and rents at newly completed properties may fluctuate
depending on a number of factors, including market and economic
conditions, resulting in lower than projected rental rates and a
corresponding lower return on IRSA´s investment;
●
pre-construction buyers may default on their purchase contracts or
units in new buildings may remain unsold upon completion of
construction;
● the
unavailability of favorable financing alternatives in the private
and public debt markets;
● aggregate
sale prices of residential units may be insufficient to cover
development costs;
●
construction and lease-up may not be completed on schedule,
resulting in increased debt service expense and construction
costs;
● failure or
delays in obtaining necessary zoning, land-use, building, occupancy
and other required governmental permits and authorizations, or
building moratoria and anti-growth legislation;
● significant
time lags between the commencement and completion of projects
subjects us to greater risks due to fluctuation in the general
economy;
●
construction may not be completed on schedule because of a number
of factors, including weather, labor disruptions, construction
delays or delays in receipt of zoning or other regulatory
approvals, or man-made or natural disasters (such as fires,
hurricanes, earthquakes or floods), resulting in increased debt
service expense and construction costs;
48
● general
changes in IRSA´s tenants demand for rental properties;
and
● IRSA may
incur capital expenditures that could result in considerable time
consuming efforts and which may never be completed due to
government restrictions.
In
addition, IRSA may face contractors’ claims for the
enforcement of labor laws in Argentina (sections 30, 31, 32 under
Law No. 20,744), which provide for joint and several liability.
Many companies in Argentina hire personnel from third-party
companies that provide outsourced services, and sign indemnity
agreements in the event of labor claims from employees of such
third company that may affect the liability of such hiring company.
However, in recent years several courts have denied the existence
of independence in those labor relationships and declared joint and
several liabilities for both companies.
While
IRSA´s policies with respect to expansion, renovation and
development activities are intended to limit some of the risks
otherwise associated with such activities, IRSA is nevertheless
subject to risks associated with the construction of properties,
such as cost overruns, design changes and timing delays arising
from a lack of availability of materials and labor, weather
conditions and other factors outside of our control, as well as
financing costs that, may exceed original estimates, possibly
making the associated investment unprofitable. Any substantial
unanticipated delays or expenses could adversely affect the
investment returns from these redevelopment projects and harm our
operating results.
Greater than expected increases in construction costs could
adversely affect the profitability of IRSA´s new
developments.
IRSA´s
businesses activities include real estate developments. One of the
main risks related to this activity corresponds to increases in
constructions costs, which may be driven by higher demand and new
development projects in the shopping malls and buildings sectors.
Increases higher than those included in the original budget may
result in lower profitability than expected.
IRSA faces significant competitive pressure.
IRSA´s
real estate activities are highly concentrated in the Buenos Aires
metropolitan area, where the real estate market is highly
competitive due to a scarcity of properties in sought-after
locations and the increasing number of local and international
competitors. Furthermore, the Argentine real estate industry is
generally highly competitive and fragmented and does not have high
barriers to entry restricting new competitors from entering the
market. The main competitive factors in the real estate development
business include availability and location of land, price, funding,
design, quality, reputation and partnerships with developers. A
number of residential and commercial developers and real estate
services companies compete with IRSA in seeking land for
acquisition, financial resources for development and prospective
purchasers and tenants. Other companies, including joint ventures
of foreign and local companies, have become increasingly active in
the real estate business and shopping mall business in Argentina,
further increasing this competition. To the extent that one or more
of IRSA´s competitors are able to acquire and develop
desirable properties, as a result of greater financial resources or
otherwise, our business could be materially and adversely affected.
If the Company is not able to respond to such pressures as promptly
as our competitors, or the level of competition increases, our
financial condition and results of our operations could be
adversely affected.
Substantially all
of IRSA´s shopping mall and commercial office properties are
located in Argentina. There are other shopping malls and numerous
smaller retail stores and residential properties within the market
area of each of our properties. The number of competing properties
in a particular area could have a material adverse effect both on
our ability to lease retail space in our shopping malls or sell
units in our residential complexes and on the amount of rent or the
sale price that IRSA is able to charge. The Company cannot assure
you that other shopping mall operators, including international
shopping mall operators, will not invest in Argentina in the near
future. If additional companies become active in the Argentine
shopping mall market in the future, such competition could have a
material adverse effect on our results of operations.
Substantially all
of IRSA´s offices and other non-shopping mall rental
properties are located in developed urban areas. There are many
office buildings, shopping malls, retail and residential premises
in the areas where our properties are located. This is a highly
fragmented market, and the abundance of comparable properties in
our vicinity may adversely affect our ability to rent or sell
office space and other real estate and may affect the sale and
lease price of our premises. In the future, both national and
foreign companies may participate in Argentina’s real estate
development market, competing with us for business
opportunities.
49
Some potential losses are not covered by insurance and certain
kinds of insurance coverage may become prohibitively
expensive.
IRSA
currently carries insurance policies that cover potential risks
such as civil liability, fire, loss profit, floods, including
extended coverage and losses from leases on all of IRSA´s
properties. Although IRSA believes the policy specifications and
insured limits of these policies are generally customary, there are
certain types of losses, such as lease and other contract claims,
terrorism and acts of war that generally are not insured under the
insurance policies offered in the national market. Should an
insured loss or a loss in excess of insured limits occur, IRSA
could lose all or a portion of the capital it has invested in a
property, as well as the anticipated future revenue from the
property. In such an event, IRSA might nevertheless remain
obligated for any mortgage debt or other financial obligations
related to the property. The Company cannot assure you that
material losses in excess of insurance proceeds will not occur in
the future. If any of IRSA´s properties were to experience a
catastrophic loss, it could seriously disrupt its operations, delay
revenue and result in large expenses to repair or rebuild the
property. If any of IRSA´s key employees were to die or become
incapacitated, the Company could experience losses caused by a
disruption in its operations which will not be covered by
insurance, and this could have a material adverse effect on
IRSA´s financial condition and results of
operations.
In
addition, IRSA cannot assure you that it will be able to renew its
insurance coverage in an adequate amount or at reasonable prices.
Insurance companies may no longer offer coverage against certain
types of losses, such as losses due to terrorist acts and mold, or,
if offered, these types of insurance may be prohibitively
expensive.
An uninsured loss or a loss that exceeds policies on IRSA´s
properties could subject us to lost capital or revenue on those
properties.
Under
the terms and conditions of the leases currently in force on
IRSA´s properties, tenants are required to indemnify and hold
us harmless from liabilities resulting from injury to persons, or
property, on or off the premises, due to activities conducted on
the properties, except for claims arising from its negligence or
intentional misconduct or that of IRSA´s agents. Tenants are
generally required, at the tenant’s expense, to obtain and
keep in full force during the term of the lease, liability and
property damage insurance policies. In addition, IRSAcannot ensure
that its tenants will properly maintain their insurance policies or
have the ability to pay the deductibles.
Should
a loss occur that is uninsured or in an amount exceeding the
combined aggregate limits for the policies noted above, or in the
event of a loss that is subject to a substantial deductible under
an insurance policy, IRSA could lose all or part of its capital
invested in, and anticipated revenue from, one or more of the
properties, which could have a material adverse effect on
IRSA´s operating results and financial condition.
Demand for IRSA´s premium properties may not be
sufficient.
IRSA
has focused on development projects that cater to affluent
individuals and have entered into property barter agreements
pursuant to which IRSA contributes its undeveloped properties to
ventures with developers who will deliver us units at premium
locations. At the time the developers return these properties to
us, demand for premium residential units could be significantly
lower. In such case, IRSA would be unable to sell these residential
units at the estimated prices or time frame, which could have an
adverse effect on its financial condition and results of
operations.
IRSA´s level of debt may adversely affect its operations and
its ability to pay its debt as it becomes due.
IRSA
had, and expect to have, substantial liquidity and capital resource
requirements to finance its business. As of June 30, 2018, its
consolidated financial debt amounted to Ps.206,633 million
(including IDBD’s debt outstanding as of that date plus
accrued and unpaid interest on such indebtedness and deferred
financing costs). IRSA cannot assure you that it will have
sufficient cash flows and adequate financial capacity in the
future. While the commitments and other covenants applicable to
IDBD’s debt obligations do not have apply IRSA since such it
is not recourse to IRSA and it is not guaranteed by IRSA’s
assets, these covenants and restrictions may impair or restrict its
ability to operate IDBD and implement its business
strategy.
The
fact that IRSA is highly leveraged may affect its ability to
refinance existing debt or borrow additional funds to finance
working capital requirements, acquisitions and capital
expenditures. In addition, the recent disruptions in the global
financial markets, including the bankruptcy and restructuring of
major financial institutions, may adversely impact its ability to
refinance existing debt and the availability and cost of credit in
the future. In such conditions, access to equity and debt financing
options may be restricted and it may be uncertain how long these
economic circumstances may last. This would require us to allocate
a substantial portion of cash flow to repay principal and interest,
thereby reducing the amount of money available to invest in
operations, including
acquisitions and
capital expenditures. Its leverage could also affect its
competitiveness and limit its ability to changes in market
conditions, changes in the real estate industry and economic
downturns.
50
IRSA
may not be able to generate sufficient cash flows from operations
to satisfy its debt service requirements or to obtain future
financing. If IRSA cannot satisfy its debt service requirements or
if IRSA default on any financial or other covenants in its debt
arrangements, the lenders and/or holders of its debt will be able
to accelerate the maturity of such debt or cause defaults under the
other debt arrangements. IRSA´s ability to service debt
obligations or to refinance them will depend upon its future
financial and operating performance, which will, in part, be
subject to factors beyond its control such as macroeconomic
conditions and regulatory changes in Argentina. If IRSA cannot
obtain future financing, IRSA may have to delay or abandon some or
all of its planned capital expenditures, which could adversely
affect its ability to generate cash flows and repay its obligations
as they become due.
The recurrence of a credit crisis could have a negative impact on
IRSA´s major customers, which in turn could materially
adversely affect its results of operations and
liquidity.
The
global credit crisis that began in 2008 had a significant negative
impact on businesses around the world. The impact of a future
credit crisis on its major tenants cannot be predicted and may be
quite severe. A disruption in the ability of IRSA significant
tenants to access liquidity could cause serious disruptions or an
overall deterioration of their businesses which could lead to a
significant reduction in their future orders of their products and
the inability or failure on their part to meet their payment
obligations to IRSA´s, any of which could have a material
adverse effect on the Company´s results of operations and
liquidity.
IRSA is subject to risks affecting the hotel industry.
The
full-service segment of the lodging industry in which IRSA´s
hotels operate is highly competitive. The operational success of
its hotels is highly dependent on its ability to compete in areas
such as access, location, quality of accommodations, rates, quality
food and beverage facilities and other services and amenities. Its
hotels may face additional competition if other companies decide to
build new hotels or improve their existing hotels to increase their
attractiveness.
In
addition, the profitability of IRSA´s hotels depends
on:
● its ability
to form successful relationships with international and local
operators to run its hotels;
● changes in
tourism and travel trends, including seasonal changes and changes
due to pandemic outbreaks, such as the A H1N1 and zika viruses, a
potential ebola outbreak, among others, or weather
phenomena’s or other natural events, such as the eruption of
the Puyehué and the Calbuco volcano in June 2011 and April
2015, respectively;
● affluence
of tourists, which can be affected by a slowdown in global economy;
and
● taxes and
governmental regulations affecting wages, prices, interest rates,
construction procedures and costs.
The shift of consumers to purchasing goods over the Internet, where
barriers to entry are low, may negatively affect sales at
IRSA´s shopping malls.
In
recent years, internet retail sales have grown significantly in
Argentina, even though the market share of such sales is still
modest. The Internet enables manufacturers and retailers to sell
directly to consumers, diminishing the importance of traditional
distribution channels such as retail stores and shopping malls.
IRSA believes that its target consumers are increasingly using the
Internet, from home, work or elsewhere, to shop electronically for
retail goods, and this trend is likely to continue. Retailers at
IRSA´s properties face increasing competition from online
sales and this could cause the termination or non renewal of their
lease agreements or a reduction in their gross sales, affecting its
Percentage Rent (as defined below) based revenue. If e commerce and
retail sales through the Internet continue to grow,
retailers’ and consumers’ reliance on IRSA´s
shopping malls could be materially diminished, having a material
adverse effect on its financial condition, results of operations
and business prospects.
IRSA´s business is
subject to extensive regulation and additional regulations may be
imposed in the future.
IRSA´s
activities are subject to Argentine federal, state and municipal
laws, and to regulations, authorizations and licenses required with
respect to construction, zoning, use of the soil, environmental
protection and historical patrimony, consumer protection, antitrust
and other requirements, all of which affect its ability to acquire
land, buildings and shopping malls, develop and build projects and
negotiate with customers. In addition, companies in this industry
are subject to increasing tax rates, the creation of new taxes and
changes in the taxation regime. IRSA is required to obtain licenses
and authorizations with different governmental authorities in order
to carry out its
projects.
Maintaining IRSA´s licenses and authorizations can be a costly
provision. In the case of non-compliance with such laws,
regulations, licenses and authorizations, IRSA may face fines,
project shutdowns, and cancellation of licenses and revocation of
authorizations.
51
In
addition, public authorities may issue new and stricter standards,
or enforce or construe existing laws and regulations in a more
restrictive manner, which may force IRSA´s to make
expenditures to comply with such new rules. Development activities
are also subject to risks relating to potential delays in obtaining
or an inability to obtain all necessary zoning, environmental,
land-use, development, building, occupancy and other required
governmental permits and authorizations. Any such delays or
failures to obtain such government approvals may have an adverse
effect on IRSA´s business.
In the
past, the Argentine government imposed strict and burdensome
regulations regarding leases in response to housing shortages, high
rates of inflation and difficulties in accessing credit. Such
regulations limited or prohibited increases on rental prices and
prohibited eviction of tenants, even for failure to pay rent. Most
of IRSA´s leases provide that the tenants pay all costs and
taxes related to their respective leased areas. In the event of a
significant increase in the amount of such costs and taxes, the
Argentine government may respond to political pressure to intervene
by regulating this practice, thereby negatively affecting its
rental income. IRSA cannot assure you that the Argentine government
will not impose similar or other regulations in the future. Changes
in existing laws or the enactment of new laws governing the
ownership, operation or leasing of properties in Argentina could
negatively affect the Argentine real estate market and the rental
market and materially and adversely affect IRSA´ss operations
and profitability.
IRSA is dependent on its Board of Directors and its
personnel.
IRSA´s
success, to a significant extent, depends on the continued
employment of Eduardo Sergio Elsztain and certain other members of
its board of directors and senior management, who have significant
expertise and knowledge of its business and industry. The loss or
interruption of their services for any reason could have a material
adverse effect on IRSA´s business and results of operations.
IRSA´s future success also depends in part upon IRSA´s
ability to attract and retain other highly qualified personnel.
IRSA cannot assure you that the Company will be successful in
hiring or retaining qualified personnel, or that any of its
personnel will remain employed by the Company.
Labor relations may negatively impact IRSA.
As
of June 30, 2018, 62.7% of its workforce was represented by unions
under two separate collective bargaining agreements. Although IRSA
currently enjoys good relations with its employees and their
unions, they cannot assure you that labor relations will continue
to be positive or that deterioration in labor relations will not
materially and adversely affect us.
IRSA´s results of operations include unrealized revaluation
adjustments on investment properties, which may fluctuate
significantly over financial periods and may materially and
adversely affect its business, results of operations and financial
condition.
As of June 30, 2018, IRSA had fair value gains on
investment properties
of Ps.22,605 million.
. Although the upward revaluation adjustments
reflect unrealized capital gains on its investment properties
during the relevant periods, the adjustments were not actual cash
flow or profit generated from the sales or rental of its investment
properties. Unless such investment properties are disposed of at
similarly revalued amounts, IRSA will not realize the actual cash
flow. The amount of revaluation adjustments has been, and will
continue to be, significantly affected by the prevailing property
markets and will be subject to market fluctuations in those
markets.
IRSA
cannot guarantee whether changes in market conditions will
increase, maintain or decrease the fair value gains on IRSA´s
investment properties at historical levels or at all. In addition,
the fair value of IRSA´s investment properties may materially
differ from the amount IRSA receive from any actual sale of an
investment property. If there is any material downward adjustment
in the revaluation of its investment properties in the future or if
its investment properties are disposed of at significantly lower
prices than their valuation or appraised value, its business,
results of operations and financial condition may be materially and
adversely affected.
Due to the currency mismatches between IRSA´s revenues and
liabilities, IRSA has currency exposure.
As of
June 30, 2018, the majority of IRSA´s liabilities in its
Operations Center in Argentina, such as its Series II and VIII
Notes issued by the us, and the Series II and IV issued by IRSA CP,
were denominated in U.S. dollars while its revenues are mainly
denominated in Pesos. This currency gap exposes IRSA to a risk of
volatility in the rate of exchange between the Peso and the U.S.
dollar, and IRSA´s financial results are adversely affected
when the U.S. dollar appreciates against the Peso. Any depreciation
of the Peso against the U.S. dollar correspondingly
increases the
nominal amount of IRSA´s debt in Pesos, which further
adversely effects IRSA´s results of operation and financial
condition and may increase the collection risk of IRSA´s
leases and other receivables from its tenants, most of which
generate Peso denominated revenues.
52
If the bankruptcy of Inversora Dársena Norte S.A. is extended
to IRSA´s subsidiary Puerto Retiro S.A., IRSA will likely lose
a significant investment in a unique waterfront land reserve in the
City of Buenos Aires.
On
April 18, 2000, Puerto Retiro S.A. (“Puerto Retiro”)
was served notice of a filing made by the Argentine Government,
through the Ministry of Defense, seeking to extend bankruptcy of
Inversora Dársena Norte S.A. (“Indarsa”) to the
Company. Upon filing of the complaint, the bankruptcy court issued
an order restraining the ability of Puerto Retiro to dispose of, in
any manner, the real property purchased in 1993 from Tandanor.
Indarsa had acquired 90% of the capital stock in Tandanor from the
Argentine Government in 1991. Tandanor’s main business
involved ship repairs performed in a 19-hectare property located in
the vicinities of La Boca neighborhood and where the Syncrolift is
installed. As Indarsa failed to comply with its payment obligation
for acquisition of the shares of stock in Tandanor, the Ministry of
Defense filed a bankruptcy petition against Indarsa, seeking to
extend it to us.
The evidentiary stage of the legal proceedings
has concluded. IRSA lodged an appeal from the injunction order, and
such order was confirmed by the Court of Appeals on December 14,
2000. The parties filed the arguments in due time and proper
manner. After the case was set for judgment, the judge ordered the
suspension of the judicial order and requested the case records to
issue of a decision based on the alleged existence of
pre-judgmental status in relation to the criminal case against
former officials of the Ministry of Defense and its former
executive officers.
For that reason the case will not be
assigned until a final judgment is issued in respect of the
criminal case.
It has
been made known to the commercial court that the expiration of the
statute of limitations has been declared in the criminal action and
the criminal defendants have been acquitted. However, this decision
was reversed by the Criminal Court (
Cámara de Casación Penal
). An
extraordinary appeal was filed and rejected, therefore an appeal
was directly lodged with the Argentine Supreme Court for improper
refusal to permit the appeal, and a decision is still
pending.
IRSA´s
Management and external legal counsel believe that there are
sufficient legal and technical arguments to consider that the
petition for an extension of the bankruptcy will be dismissed by
the court. However, in view of the particular features and progress
of the case, this assesment cannot be considered to be
conclusive.
In
turn, Tandanor filed a civil action against Puerto Retiro and the
other defendants in the criminal case for violation of Section 174
(5) based on Section 173 (7) of the Criminal Code. Such action
seeks -on the basis of the nullity of the decree that approved the
bidding process involving the Dársena Norte property- a
reimbursement in favor of Tandanor for all such amounts it has
allegedly lost as a result of a suspected fraudulent transaction
involving the sale of the property disputed in the
case.
In July
2013, the answer to the civil action was filed, which contained a
number of defenses. Tandanor requested the intervention of the
Argentine Government as third party co-litigant in this case, which
petition was granted by the Court. In March 2015, both the
Argentine Government and the criminal complainant answered the
asserted defenses. On July 12, 2016, Puerto Retiro was legally
notified of the decision adopted by the Tribunal Oral Federal No. 5
related to the preliminary objections above mentioned. Two of them
were rejected –lack of information and lack of legitimacy
(passive). IRSA filed an appeal with regard to this decision, which
was rejected. The other two objections were considered in the
verdict .
On
September 7, 2018, Court read its verdict, according to which the
preliminary objection of limitation filed by Puerto Retiro was
successful. .
However, the deadline
for appeals will not begin until The Court publishes the grounds of
the ruling, on November 30, 2018.
Nevertheless, in the
criminal procedure –where Puerto Retiro is not a party- Court
ordered the seizure (“
decomiso
”) of the land known as
“Planta 1”. This Court´s verdict is not final, as
it is subject to further appeals by any other party of the legal
proceeding.
Property ownership through joint ventures or minority participation
may limit IRSA´s ability to act exclusively in its
interest.
IRSA
develops and acquires properties in joint ventures with other
persons or entities when IRSA believes circumstances warrant the
use of such structures. For example, IRSA currently owns 50% of
Quality Invest S.A. (“Quality Invest”), a joint venture
that holds its investment in the Nobleza Piccardo plant. IRSA could
engage in a dispute with one or more of its joint venture partners
that might affect its ability to operate a jointly-owned property.
Moreover, IRSA´s joint venture partners may, at any time, have
business, economic or other objectives that are inconsistent with
IRSA´s objectives, including objectives that relate to the
timing and terms of any sale or
refinancing of a
property. For example, the approval of certain of the other
investors is required with respect to operating budgets and
refinancing, encumbering, expanding or selling any of these
properties. In some instances, IRSA´s joint venture partners
may have competing interests in its markets that could create
conflicts of interest. If the objectives of IRSA´s joint
venture partners are inconsistent with its own objectives, IRSA
will not be able to act exclusively in its interests.
If one
or more of the investors in any of IRSA´s jointly owned
properties were to experience financial difficulties, including
bankruptcy, insolvency or a general downturn of business, there
could be an adverse effect on the relevant property or properties
and in turn, on IRSA´s financial performance. Should a joint
venture partner declare bankruptcy, IRSA could be liable for its
partner’s common share of joint venture
liabilities.
53
Dividend restrictions in IRSA´s subsidiaries’ debt
agreements may adversely affect it.
Dividends paid by
IRSA´s subsidiaries are an important source of funds for
IRSA´s as are other permitted payments from subsidiaries. The
debt agreements of IRSA´s subsidiaries contain covenants
restricting their ability to pay dividends or make other
distributions. If IRSA´s subsidiaries are unable to make
payments to IRSA, or are able to pay only limited amounts, IRSA may
be unable to make payments on its indebtedness.
IRSA may face potential conflicts of interest relating to its
principal shareholders.
IRSA´s largest
beneficial owner is Mr. Eduardo S. Elsztain, through his indirect
shareholding through Cresud S.A.C.I.F.y A. (“Cresud”).
As of June 30, 2018, such beneficial ownership consisted of: (i)
366,788,243 common shares held by Cresud. See “Item 7 –
Major Shareholders and Related Party Transactions.” Conflicts
of interest between its management, Cresud and its affiliates may
arise in the performance of its business activities. As of June 30,
2018, Mr. Elsztain also beneficially owned (i) approximately 34.74%
of Cresud’s common shares and (ii) approximately 86.3% of the
common shares of its subsidiary IRSA Commercial Properties
(“IRSA CP”). We cannot assure you that its principal
shareholders and their affiliates will not limit or cause us to
forego business opportunities that its affiliates may pursue or
that the pursuit of other opportunities will be in its
interest.
Risks
Related to our Investment in Banco Hipotecario
Risks
Relating to the Argentine Financial System and Banco
Hipotecario
Capital stock in Banco Hipotecario
As of June 30,
2018, we owned, through IRSA, approximately 29.91% of the
outstanding capital stock of Banco
Hipotecario, which
represented 0,7% of our consolidated assets from our operations
center in Argentina as of such date. All of Banco
Hipotecario’s operations, properties and customers are
located in Argentina. Accordingly, the quality of Banco
Hipotecario’s loan portfolio, financial condition and results
of operations depend on economic, regulatory and political
conditions prevailing in Argentina. These conditions include growth
rates, inflation rates, exchange rates, changes to interest rates,
changes to government policies, social instability and other
political, economic or international developments either taking
place in, or otherwise affecting, Argentina.
The short-term structure of the deposit base of the Argentine
financial system, including Banco Hipotecario, could lead to a
reduction in liquidity levels and limit the long-term expansion of
financial intermediation.
Given
the short-term structure of the deposit base of the Argentine
financial system, credit lines are also predominantly short-term,
with the exception of mortgages, which represent a low proportion
of the existing credit base. Although liquidity levels are
currently reasonable, no assurance can be given that these levels
will not be reduced due to a future negative economic scenario.
Therefore, there is still a risk of low liquidity levels that could
increase funding
cost in the event of a withdrawal of a significant amount of the
deposit base of the financial system, and limit the long-term
expansion of financial intermediation including Banco
Hipotecario.
54
The growth and
profitability of Argentina’s financial system partially
depend on the development of long-term
funding.
Since
most deposits in the Argentine financial system are short-term, a
substantial portion of the loans have the same or similar
maturities, and there is a small portion of long-term credit lines.
The uncertainty with respect to the level of inflation in future
years, is a principal obstacle to a faster recovery of
Argentina’s private sector long-term lending. This
uncertainty has had, and may continue to have a significant impact
on both the supply of and demand for long-term loans as borrowers
try to hedge against inflation risk by borrowing at fixed rates
while lenders hedge against inflation risk by offering loans at
floating rates. If longer-term financial intermediation activity
does not grow, the ability of financial institutions, including
Banco Hipotecario, to generate profits will be negatively
affected.
Banco Hipotecario issues debt in the local and international
capital markets as one of its main sources of funding and its
capacity to successfully access the local and international markets
on favorable terms affects our cost of funding.
The
ability of Banco Hipotecario to successfully access the local and
international capital markets and on acceptable terms depends
largely on capital markets conditions prevailing in Argentina and
internationally. Banco Hipotecario have no control over capital
markets conditions, which can be volatile and unpredictable. If
Banco Hipotecario is unable to issue debt in the local and/or
international capital markets and on terms acceptable to us,
whether as a result of regulations, a deterioration in capital
markets conditions or otherwise, we would likely be compelled to
seek alternatives for funding, which may include short-term or more
expensive funding sources. If this were to happen, Banco
Hipotecario may be unable to fund our liquidity needs at
competitive costs and our business results of operations and
financial condition may be materially and adversely
affected.
The stability of the financial system depends upon the ability of
financial institutions, including Banco Hpotecario, to maintain and
increase the confidence of depositors.
The
measures implemented by the Argentine government in late 2001 and
early 2002, in particular the restrictions imposed on depositors to
withdraw money freely from banks and the “pesification”
and restructuring of their deposits, were strongly opposed by
depositors due to the losses on their savings and undermined their
confidence in the Argentine financial system and in all financial
institutions operating in Argentina.
If
depositors once again withdraw their money from banks in the
future, there may be a substantial negative impact on the manner in
which financial institutions, including Banco Hipotecario, conduct
their business, and on their ability to operate as financial
intermediaries. Loss of confidence in the international financial
markets may also adversely affect the confidence of Argentine
depositors in local banks.
In the
future, an adverse economic situation, even if it is not related to
the financial system, could trigger a massive withdrawal of capital
from local banks by depositors, as an alternative to protect their
assets from potential crises. Any massive withdrawal of deposits
could cause liquidity issues in the financial sector and,
consequently, a contraction in credit supply.
The
occurrence of any of the above could have a material and adverse
effect on Banco Hipotecario’s expenses and business, results
of operations and financial condition.
The asset quality of financial institutions is exposed to the
non-financial public sector’s and Central Bank’s
indebtedness.
Financial institutions carry significant
portfolios of bonds issued by the Argentine government and by
provincial governments as well as loans granted to these
governments. The exposure of the financial system to the
non-financial public sector’s indebtedness had been shrinking
steadily, from 49.0% of total assets in 2002 to 10.3% in
2015
, 9.2% in 2016, 10.4% in 2017 and 10.5% as of June 30,
2018. To an extent, the value of the assets held by Argentine
banks, as well as their capacity to generate income, is dependent
on the creditworthiness of the non-financial public sector, which
is in turn tied to the government’s ability to foster
sustainable long-term growth, generate fiscal revenues and reduce
public expenditure.
In
addition, financial institutions currently carry securities issued
by the Central Bank in their portfolios, which generally are
short-term. As of June 30, 2018, such securities issued by the
Central Bank represented approximately 9.4% of the
total
assets of the Argentine financial
system. As of June 30, 2018, Banco Hipotecario’s total
exposure to the public sector was Ps.3,856.8 million, which
represented 5.9% of its assets as of that date, and the total
exposure to securities issued by the Central Bank was Ps.10,660.3
million, which represented 22.2% of its total assets as of June 30,
2018.
55
The quality of Banco Hipotecario’s assets of banco
Hipotecario and that of other financial institutions may
deteriorate if the Argentine private sector is affected by economic
events in Argentina or international macroeconomic
conditions.
The
capacity of many Argentine private sector debtors to repay their
loans has in the past deteriorated as a result of certain economic
events in Argentina or macroeconomic conditions, materially
affecting the asset quality of financial institutions, including
us. From 2009 to 2011, the ratio of non-performing private sector
lending declined, with a record non-performing loan ratio of 1.4%
as of December 31, 2011 for the financial system as a whole. The
improvement was reflected in both the consumer loan portfolio and
the commercial portfolio. From 2012, the ratio of non-performing
private sector loans for the financial system as a whole increased,
reaching 2.0% as of December 31, 2014. In 2015, the ratio of
non-performing private sector lending of the financial system as a
whole decreased to 1.7% in 2016 and to 1.8% in 2017. Banco
Hipotecario experienced the following non-performing loan rates:
2.3%, 2.0%, 2.7% and 3.8% as of December 31, 2014, 2015, 2016 and
2017, respectively. The quality of its loan portfolio is highly
sensitive to economic conditions prevailing from time to time in
Argentina, and as a result if Argentina were to experience adverse
macroeconomic conditions, the quality of Banco Hipotecario’s
loan portfolio and the recoverability of our loans would likely be
adversely affected. This might affect the creditworthiness of Banco
Hipotecario’s loan portfolio and the results of
operations.
The Consumer Protection Law may limit some of the rights afforded
to Banco Hipotecario
Argentine Law
N° 24,240 (the “Consumer Protection Law”) sets
forth a series of rules and principles designed to protect
consumers, which include Banco Hipotecario’s customers. The
Consumer Protection Law was amended by Law N° 26,361 on March
12, 2008 to expand its applicability and the penalties associated
with violations thereof. Additionally, Law N° 25,065 (as
amended by Law N° 26,010 and Law N° 26,361, the
“Credit Card Law”) also sets forth public policy
regulations designed to protect credit card holders. Recent Central
Bank regulations, such as Communication “A” 5388, also
protect consumers of financial services.
In
addition, the Civil and Commercial Code has a chapter on consumer
protection, stressing that the rules governing consumer relations
should be applied and interpreted in accordance with the principle
of consumer protection and that a consumer contract should be
interpreted in the sense most favorable to it.
The
application of both the Consumer Protection Law and the Credit Card
Law by administrative authorities and courts at the federal,
provincial and municipal levels has increased. This trend has
increased general consumer protection levels. If Banco Hipotecario
is found to be liable for violations of any of the provisions of
the Consumer Protection Law or the Credit Card Law, the potential
penalties could limit some of Banco Hipotecario’s rights, for
example, with respect to its ability to collect payments due from
services and financing provided by us, and adversely affect Banco
Hipotecario’s financial results of operations. We cannot
assure you that court and administrative rulings based on the
newly-enacted regulation or measures adopted by the enforcement
authorities will not increase the degree of protection given to
Banco Hipotecario’s debtors and other customers in the
future, or that they will not favor the claims brought by consumer
groups or associations. This may prevent or hinder the collection
of payments resulting from services rendered and financing granted
by us, which may have an adverse effect on Banco
Hipotecario’s business and results of
operations.
Class actions against financial institutions for unliquidated
amounts may adversely affect the financial system’s
profitability.
Certain
public and private organizations have initiated class actions
against financial institutions in Argentina. The National
Constitution and the Consumer Protection Law contain certain
provisions regarding class actions. However, their guidance with
respect to procedural rules for instituting and trying class action
cases is limited. Nonetheless, through an ad hoc doctrine,
Argentine courts have admitted class actions in some cases,
including various lawsuits against financial entities related to
“collective interests” such as alleged overcharging on
products, interest rates and advice in the sale of public
securities, etc. If class action plaintiffs were to prevail against
financial institutions, their success could have an adverse effect
on the financial industry in general and indirectly on Banco
Hipotecario’s business.
56
Banco Hipotecario operates in a highly regulated environment, and
its operations are subject to regulations adopted, and measures
taken, by several regulatory agencies.
Financial
institutions are subject to a major number of regulations
concerning functions historically determined by the Central Bank
and other regulatory authorities. The Central Bank may penalize
Banco Hipotecario and its directors, members of the Executive
Committee, and members of its Supervisory Committee, in the event
of any breach the applicable regulation. Potential sanctions, for
any breach on the applicable regulations may vary from
administrative and/or disciplinary penalties to criminal sanctions.
Similarly, the CNV, which authorizes securities offerings and
regulates the capital markets in Argentina, has the authority to
impose sanctions on us and Banco Hipotecario’s Board of
Directors for breaches of corporate governance established in the
capital markets laws and the CNV Rules. The Financial Information
Unit (
Unidad de Información
Financiera
, or “UIF” as per its acronym in
Spanish) regulates matters relating to the prevention of asset
laundering and has the ability to monitor compliance with any such
regulations by financial institutions and, eventually, impose
sanctions.
IRSA
cannot assure you whether such regulatory authorities will commence
proceedings against Banco Hipotecario, its shareholders or
directors, or its Supervisory Committee, or penalize Banco
Hipotecario. This notwithstanding, and in addition to “Know
Your Customer” compliance, Banco Hipotecario has implemented
other policies and procedures to comply with its duties under
currently applicable rules and regulations.
In
addition to regulations specific to the banking industry, Banco
Hipotecario is subject to a wide range of federal, provincial and
municipal regulations and supervision generally applicable to
businesses operating in Argentina, including laws and regulations
pertaining to labor, social security, public health, consumer
protection, the environment, competition and price controls. IRSA
cannot assure that existing or future legislation and regulation
will not require material expenditures by Banco Hipotecario or
otherwise have a material adverse effect on Banco
Hipotecario’s consolidated operations.
The effects of legislation that restricts our ability to pursue
mortgage foreclosure proceedings could adversely affect
us.
The
ability to pursue foreclosure proceedings through completion, in
order to recover on defaulted mortgage loans, has an impact on
financial institutions activities. On December 13, 2006, pursuant
to Law No. 26,177, the “Restructuring Unit Law” was
created to allow all mortgage loans to be restructured between
debtors and the former Banco Hipotecario Nacional, insofar as such
mortgages had been granted prior to the effectiveness of the
Convertibility Law. Law No. 26,313, the “Pre-convertibility
Mortgage Loans Restructuring Law,” was enacted by the
Argentine Congress on November 21, 2007 and partially signed into
law on December 6, 2007 to establish the procedure to be followed
in the restructuring of mortgage loans within the scope of Section
23 of the Mortgage Refinancing System Law in accordance with the
guidelines established by the Restructuring Unit Law. To this end,
a recalculation was established for certain mortgage loans
originated by the former Banco Hipotecario Nacional before April 1,
1991.
Executive Branch
Decree No. 2,107/08 issued on December 19, 2008 regulated the
Pre-convertibility Mortgage Loans Restructuring Law and established
that the recalculation of the debt applies to the individual
mortgage loans from global operations in effect on December 31,
2008 and agreed upon prior to April 1, 1991, and in arrears at
least since November 2007 and remaining in arrears on December 31,
2008. In turn, the Executive Branch Decree No. 1,366/10, published
on September 21, 2010, expanded the universe of Pre-convertibility
loans subject to restructuring to include the individual mortgage
loans not originating in global operations insofar as they met the
other requirements imposed by Executive Branch Decree No. 2,107/08.
In addition, Law No. 26,313 and its regulatory decrees also
condoned the debts on mortgage loans granted before the
Convertibility Law in so far as they had been granted to deal with
emergency situations and in so far as they met the arrears
requirement imposed on the loans subject to
recalculation.
Subject
to the Central Bank’s supervision, Banco Hipotecario
implemented the recalculation of mortgage loans within the scope of
the aforementioned rules by adjusting the value of the new
installments to a maximum amount not in excess of 20% of household
income. In this respect, we estimate that Banco Hipotecario has
sufficient loan loss provisions to face any adverse economic impact
on the portfolio involved. We cannot assure that the Argentine
Government will not enact additional laws restricting our ability
to enforce our rights as a creditor and/or imposing a condition or
a reduction of principal on the amounts unpaid in our mortgage loan
portfolio. Any such circumstance could have a significant adverse
effect on our financial condition and the results of our
operations.
57
Increased competition and M&A activities in the banking
industry may adversely affect Banco
Hipotecario.
Banco
Hipotecario foresees increased competition in the banking sector.
If the trend towards decreasing spreads is not offset by an
increase in lending volumes, the ensuing losses could lead to
mergers in the industry. These mergers could lead to the
establishment of larger, stronger banks with more resources than
Banco Hipotecario. Therefore, although the demand for financial
products and services in the market continues to grow, competition
may adversely affect Banco Hipotecario’s results of
operations, resulting in shrinking spreads and
commissions.
Future governmental measures may adversely affect the economy and
the operations of financial institutions.
The
Argentine government has historically exercised significant
influence over the economy, and financial institutions, in
particular, have operated in a highly regulated environment. We
cannot assure you that the laws and regulations currently governing
the economy or the banking sector will remain unaltered in the
future or that any such changes will not adversely affect Banco
Hipotecario’s business, financial condition or results of
operations and Banco Hipotecario’s ability to honor its debt
obligations in foreign currency.
Several
legislative bills to amend the Financial Institutions Law have been
sent to the Argentine Congress. If the law currently in force were
to be comprehensively modified, the financial system as a whole
could be substantially and adversely affected. If any of these
legislative bills were to be enacted or if the Financial
Institutions Law were amended in any other way, the impact of the
subsequent amendments to the regulations on the financial
institutions in general, Banco Hipotecario’s business, its
financial condition and the results of operations is
uncertain.
Law
N° 26,739 was enacted to amend the Central Bank’s
charter, the principal aspects of which are: (i) to broaden the
scope of the Central Bank’s mission (by establishing that
such institution shall be responsible for financial stability and
economic development while pursuing social equity); (ii) to change
the obligation to maintain an equivalent ratio between the monetary
base and the amount of international reserves; (iii) to establish
that the board of directors of the institution will be the
authority responsible for determining the level of reserves
required to guarantee normal operation of the foreign exchange
market based on changes in external accounts; and (iv) to empower
the monetary authority to regulate and provide guidance on credit
through the financial system institutions, so as to “promote
long-term production investment.”
In
addition, the Civil and Commercial Code, among other things,
modifies the applicable regime for contractual provisions relating
to foreign currency payment obligations by establishing that
foreign currency payment obligations may be discharged in Pesos.
This amends the legal framework, pursuant to which debtors may only
discharge their foreign currency payment obligations by making
payment in the specific foreign currency agreed upon in their
agreements; provided however that the option to discharge in Pesos
a foreign currency obligation may be waived by the debtor is still
under discussion.
However, in recent
years some court decisions have established the obligation to pay
the in foreign currency when it was so freely agreed by the
parties.
IRSA is not able to ensure that any current or
future laws and regulations (including, in particular, the
amendment to the Financial Institutions Law and the amendment to
the Central Bank’s charter) will not result in significant
costs to the Company, or will otherwise have an adverse effect on
Banco Hipotecario’s operations.
Banco
Hipotecario’s
obligations as trustee of
the Programa de Crédito Argentino del Bicentenario para la
Vivienda Única Familiar (“PROCREAR”) trust are
limited.
Banco
Hipotecario currently acts as trustee of the PROCREAR Trust, which
aims to facilitate access to housing solutions by providing
mortgage loans for construction and developing housing complexes
across Argentina. Under the terms and conditions of the PROCREAR
Trust, all the duties and obligations under the trust have to be
settled with the trust estate. Notwithstanding, if the
aforementioned is not met, Banco Hipotecario could have its
reputation affected. In addition, if the Argentine government
decides to terminate the PROCREAR Trust and/or terminate Banco
Hipotecario’s role as trustee of the PROCREAR Trust, this may
adversely affect Banco Hipotecario’s results of
operations.
The exposure of Banco Hipotecario to individual borrowers could
lead to higher levels of past due loans, allowances for loan losses
and charge-offs.
A
substantial portion of Banco Hipotecario’s loan portfolio
consists of loans to individual customers in the lower-middle to
middle income segments of the Argentine population. The quality of
Banco Hipotecario’s portfolio of loans to individuals is
dependent to a significant extent on economic conditions prevailing
from time to time in Argentina. Lower-middle to middle income
individuals are more likely to be exposed to and adversely affected
by adverse developments in the Argentine economy than corporations
and high-income individuals. As a result, lending to these segments
represents higher risk than lending to such other market segments.
Consequently, Banco Hipotecario may experience higher levels of
past due amounts, which could result in higher provisions for loan
losses.
Therefore, there can be no assurance that the levels of past due
amounts and subsequent charge-offs will not be materially higher in
the future.
58
An increase in fraud or transaction errors may adversely affect
Banco Hipotecario.
As with
other financial institutions, Banco Hipotecario is susceptible to,
among other things, fraud by employees or outsiders, unauthorized
transactions by employees and other operational errors (including
clerical or record keeping errors and errors resulting from faulty
computer or telecommunications systems). Given the high volume of
transactions that may occur at a financial institution, errors
could be repeated or compounded before they are discovered and
remedied. In addition, some of our transactions are not fully
automated, which may further increase the risk that human error or
employee tampering will result in losses that may be difficult to
detect quickly or at all. Losses from fraud by employees or
outsiders, unauthorized transactions by employees and other
operational errors might adversely affect Banco Hipotecario’s
reputation, business, the results of operations and financial
condition.
Risks relating to IRSA´s business in the United
States
If IRSA is not able to occupy the vacant lease positions of its
buldings they could suffer a negative impact in the cash flows of
the property that could adversely affect IRSA´s business,
financial condition and results
On July
2008, IRSA decided to expand internationally into the United
States, taking advantage of certain investment opportunities
generated after the global financial crisis. IRSA acquired a 49%
interest in Metropolitan 885 3rd Ave ("Metropolitan"), whose main
asset is a 34-story building with 59,000 sqm of gross leasable area
named Lipstick Building, located at 885 Third Avenue, New York. The
building is currently 97% occupied and comprises 54,340 sqm of
office, 720 sqm of retail and 3,940 sqm of below grade storage and
potential amenity space. Latham & Watkins occupies 40,035
sqm of the office and storage space on a lease expiring on June 30,
2021. In April 2018, Latham & Watkins communicated to
IRSA its intention to not renew its lease. As a consequence of
that, new investments and capital expenditures will be required to
upgrade the lobby, amenity spaces and common areas of the building
in order to maximize building rents going forward, as well as to
market the impending vacancy in the building.
If IRSA
is not able to lease the space that Latham & Watkins occupies
with other tenants, the cash flows of the property that IRSA
receives from this will decrease, which could adversely affect
IRSA´s business, financial condition and results of
operation
Operations Center in Israel
Risks
relating to Israel
The implementation of the Law to Promote Competition and Reduce
Concentration, 5774-2013 may have implications on IDBD, DIC and
their respective subsidiaries.
In
December 2013, the Law to Promote Competition and Reduce
Concentration, 5774- 2013, was published in the Official Gazette
(hereinafter, in this section: the “
Reduced Centralization
Act
”):
1. According to the
provisions of the Reduced Centralization Act, a pyramid structure
for the control of “reporting corporations” (in
general, corporations whose securities were offered to and are held
by the public) is restricted to 2 tiers of reporting corporations
(where a first tier company may not include a reporting corporation
which does not have a controlling shareholder). In accordance with
transitional provisions which were determined in the Reduced
Centralization Act, a third tier company or higher tier company is
no longer entitled to control reporting corporations, except for
corporations as stated above which are under its control as of the
publication date of the Law in the Official Gazette (hererin, the
“
Publication
Date
”), regarding which it will be required to
discontinue control by no later an December 2017 (the
“
2017
Requirement
”). It is noted that so long as a reporting
corporation is considered a second tier company in accordance with
the law, it is not entitled to control reporting corporations, and
insofar as, on the publication date, it holds control of reporting
corporations, it must discontinue its control of such corporations
by no later than December 2019 (the “
2019 Requirement
”).
2. On the date of
the Reduced Centralization Act’s publication in the Official
Gazette, DIC was considered a third tier company, and the reporting
corporations controlled by DIC were considered fourth and fifth
tier companies. In May 2014, the control of IDBD changed as part of
the completion of the creditors’ settlement in IDB Holding
Corporation Ltd. (“
IDB
Holding
”), and subsequently, DIC ceased being
considered a third tier company, and is as of that date was
considered a second tier company
3. In August 2014,
the Boards of Directors of IDBD and DIC each resolved to appoint
(separate) advisory committees to evaluate various alternatives for
dealing with the implications of the law, and of its fulfillment of
the restrictions specified therein, with respect to the control of
companies through a pyramid structure, with the intention to allow
the continued control by IDBD and/or DIC of “other tier
companies” (which are currently directly held by DIC) also
after December 2019. It is noted that the alternatives which were
evaluated by the advisory committee of DIC’s Board of
Directors included, inter alia, possible structural changes to all
tiers (i.e., both on the tier of IDBD, which was DIC’s
controlling shareholder at the time, and on the tiers of DIC, PBC
and its investee companies), including a preliminary evaluation of
several alternatives with respect to the 2017
Requirement.
4. Further to the
above, due to the fact that some of the possible actions and/or
structural changes may have included transactions in which
DIC’s controlling shareholders may have had a personal
interest, and in accordance with the recommendations of the
advisory committee, the DIC’s Board of Directors resolved, on
March 22, 2017, to authorize the audit committee to evaluate
various alternatives for the DIC’s dealing with the
requirements of the Reduced Centralization Act with respect to the
2017 Requirement, and also in light of the 2019 requirement and
possible structural changes on the first tier (i.e., IDBD and its
holdings, at the time, in DIC). DIC was also informed, at that
time, by IDBD that IDBD is also evaluating various alternatives for
dealing with the requirements of the law with respect to the 2017
requirement, and also in consideration of the 2019 requirement, and
accordingly, the Board of Directors of IDBD established an
independent committee of the Board, which is comprised of outside
and independent directors only (herein, the “
Committee
”).
59
5. With the consent
of the DIC’s audit committee, as stated above, it held a
series of discussions, in which it evaluated several alternatives
for the manner by which DIC, and all tiers in the Group, will
address the 2017 requirement, including an evaluation of the
feasibility of alternatives to which DIC is not directly party, and
an evaluation of the feasibility of other alternatives. The
committee’s work was accompanied by external independent
advisors, who were appointed and chosen by the
committee.
6. in parallel, and
further to a series of discussions which were held by the
independent committee of IDBD, the aforementioned independent
committee of IDBD decided that the preferred alternative, from the
perspective of IDBD, in terms of IDBD’s response to the 2017
requirement, is the alternative in which IDBD sells all of its
shares in DIC (as of the date of implementation of the alternative)
to a special purpose entity (which will be a private company
incorporated in Israel, and a “non-reporting
corporation”, as this term is defined in the Securities Law,
5728-1968) wholly owned by corporations under the control of the
controlling shareholder of IDB Development, Mr. Eduardo Elsztain
(the “
Preferred
Alternative
”).
7. Further to the
decision of the independent committee of the Board of Directors of
IDBD on this matter, on May 25, 2017, the Audit Committee and Board
of Directors of IDBD, respectively, adopted the recommendations of
the aforementioned committee, and its decision regarding the
preferred alternative for IDBD’s dealing with the 2017
requirement.
8. In light of the
decisions of the independent committee, the audit committee and the
Board of Directors of IDBD, the audit committee of DIC on August
16, 2017, decided that the aforementioned alternative is preferred,
from its perspective for the way in which DIC should cope with the
provisions of the Reduced Centralization Act in relation to the
requirement for 2017, and that it will continue evaluating, if
necessary, and insofar as may be required, additional potential
alternatives for DIC’s dealing with the provisions of the
Reduced Centralization Act.
9. Further to the
foregoing, in September 2017, following the negotiations between
the committee, with the accompaniment of its independent advisors
(legal and economic), and Dolphin Netherlands, as well as
additional discussions between the parties, and following the
receipt of the committee’s approval, IDBD and Dolphin
Netherlands signed a memorandum of understanding in connection with
the implementation of the transaction (herein, the
“
Transaction
”)
for the sale of all DIC shares which are held by IDBD to a private
company which is incorporate, or which incorporated, in Israel,
which is affiliated with Dolphin Netherlands, and controlled by
DIC’s controlling shareholder, based on the principles which
were determined by the committee (herein, the “
Memorandum of Understanding
”). In
October 2017, after discussions had been held with the holders of
IDBD's bonds and their representatives, and also after meetings had
been held of the holders of all of the series of IDBD's bonds, and
after the receipt of the Committee's approval, IDBD and Dolphin
Netherlands signed on an amendment to the Memorandum of
Understanding.
10. On November 22,
2017, after the legally required approvals were received, the
transaction was completed. Accordingly, inter alia, all of
DIC’s shares which were held by IDBD (106,780,853 shares)
were transferred to Dolphin IL., a private company incorporated in
Israel, and which is wholly owned by Dolphin Netherlands (herein:
the “
Buyer
”),
the Buyer issued the debenture to IDBD, and additionally, IDBD
received a total of NIS 70 million from the buyer, in accordance
with the determined terms of the transaction. Additionally, within
the framework of the completion of the transaction, as part of the
collateral which was provided by the buyer to IDB Development, in
connection with the debenture, the buyer deposited 9,636,097 DIC
shares with I.B.I. Trust Management, which serves as the trustee
for the debenture on behalf of IDBD and the Buyer, in accordance
with the debenture’s terms.
11. Beginning from
the transaction closing date, DIC ceased being considered a second
tier company, and is now considered a first tier company only, as
defined in the Reduced Centralization Act, which led to the
postponement of the application of the requirements of the Reduced
Centralization Act with respect to reporting corporations which
constitute other tier companies, and which under his control until
December 2019.
60
12. As part of the
process in IDBD of dealing with the requirements of the provisions
of the Reduced Centralization Act, in November 2017, IDBD sold all
of the shares of DIC which were held by it to Dolphin IL
Investments Ltd. (“
Dolphin
IL
”), a private company incorporated in Israel, which
is wholly owned by Dolphin Netherlands B.V. (“
Dolphin Netherlands
”), a
corporation controlled by the Company’s controlling
shareholder (in this section, the “
Transaction
”). Accordingly,
beginning on the closing date of the transaction, IDBD no longer
holds control of any “other tier companies”, and
therefore, it now complies with the requirements of the Reduced
Centralization Act with respect to pyramid structures. For more
information, see “Item 4.Business Overview - General
regulations applicable to our business in Israel - Reduced
Centralization Act.”.
13. DIC’s
Board of Directors appointed an advisory committee in order to
evaluate various alternatives for DIC’s dealing with the
implications of the Reduced Centralization Act, and for its
fulfillment of the restrictions specified therein, with respect to
the control of companies through a pyramid structure.
Follwing the
Transaction, DIC became a first tier company, as this term is
defined in the Reduced Centralization Act, which led to the
postponement of the requirement to apply the provisions of the
Reduced Centralization Act with respect to reporting corporations
which are other tier companies, and which are under the DIC’s
control, to December 2019.
Bearing
that in mind in June 2018, a transaction was completed in which DIC
sold 16.6% of the issued share capital of Shufersal, for a total
net consideration of NIS 848 million. DIC’s stake in the
issued share capital of Shufersal decreased to approximately 33.6%,
and on the sale date, it ceased holding control of
Shufersal.
DIC
continues to consider various alternatives for dealing with the
demand for 2019.
These
alternatives may include possible structural changes in some of the
companies in the DIC Group, that are affected by the demand for
2019 (that is, at the level of DIC's layer or at the level of PBC
or companies under its control).
61
The deterioration of the global economy and changes in capital
markets in Israel and around the world may affect IDBD, DIC and
their respective subsidiaries.
A recession or deterioration of capital markets
around the world and in Israel (including volatility in securities
prices, exchange rates and interest rates), are affecting and may
have a negative affect IDBD, DIC and their subsidiaries, on the
profits of operations due to lower
demand for products of
the subsidiaries of IDBD or DIC, on the value of the marketable
securities or other assets owned by them, liquidity and equity
position of IDBD, DIC and their subsidiaries, raise of capital or
Access the capital markets in Israel and abroad, on the financial
ratios of IDBD, DIC and their respective subsidiaries, which could
limit their ability to or financial covenants under IDBD's credit
agreement and other financial agreements, on their
ratings,
their
ability to distribute dividends;
Certain
subsidiries import or buy raw materials which are required for
their activities, and therefore, their business results may also be
affected by changes in the prices of raw materials around the
world.
Changes in legislation and regulation may have an impact on
IDBD's
and DIC’s
operations.
In
recent years, an increase in legislation and regulation had a
negative effect in various operating segments in the Israeli
economy, including in the segments in which IDBD
and DIC
operate.
New
legislation in various areas in Israel and abroad, such as
concentration, promotion of competition and antitrust laws, tax
laws, regulation of the communication market, supervision of the
insurance business operations, capital investments initiatives,
companies and securities laws, laws pertaining to the supervision
of prices of products and services, increased competition in the
food market, consumer protection laws, environmental laws, planning
and construction laws, that have had a negative effect and
sometimes a significantly negative effect, on the business
operations, on their financial results and on the prices of their
securities, and the results of IDBD's, DIC's and of their
subsidiaries. Additionally, the segments in which IDBD operates are
subject to regulation by government agencies and may impose
penalties to breach of those regulations. An increase of these
penalties, monetary or otherwise may effect in our reports of
operations. The Company believes that the foregoing has a
significant impact on IDBD, DIC and on their business
operations.
Some of
IDBD's and DIC´s subsidiaries operate of Israel, have
securities which are traded on foreign stock exchanges. Changes in
legislation and in the regulatory policies of those foreign
countries, as well as the characteristics of the business
environment in the country of operation, may affect the financial
results and the business position of these companies.
In
addition, changes in IFRS or in the accounting principles which
apply to IDBD, DIC and their subsidiaries may have a negative
impact on their financial results of IDBD and its subsidiaries, on
their fulfillment of financial covenants, permits and licenses
under which we distribute dividends.
IDBD, DIC and their subsidiaries are exposed to fluctuations of the
interest rate and the value of the risks.
IDBD,
DIC and their subsidiaries are exposed to changes in interest rates
and price indexes, and to changes in exchange rates which affect,
directly or indirectly, their business results and the value of
their assets and liabilities (due to the scope of their CPI-linked
liabilities and due to their investments in real estate properties
outside Israel). There is also an effect on capital attributable to
shareholders of IDBD, with respect to the reserve for adjustments
to capital due to the translation of financial statements of
subsidiaries in foreign currency, primarily Real Estate
Corporations in Las Vegas and foreign subsidiaries of Property
& Building (“
PBC
”).
IDBD
and DIC hold assets and manages its business affairs in Israel.
Therefore, almost all of IDBD’s and DIC´s assets,
liabilities, income and expenses are in NIS. IDBD’s and
DIC´s financing income and expenses are also subject to
volatility due to changes in interest rates on loans from banks and
deposits which were deposited in banks. IDBD’s and DIC´s
policy regarding the management of market risks, certain
subsidiaries used, in 2016, derivative financial instruments with
the aim of adjusting, where possible, the linkage basis of its
financial assets and liabilities (hedging transactions). However,
an increase of the rate at which the company finance our operations
or the lack of financing at acceptable terms, may have an adverse
effect on IDBD’s and DIC´s results of
operations.
62
IDBD, DIC and their subsidiaries are exposed to risks associated
with foreign operations.
IDBD,
DIC and their subsidiaries operate in the real estate segment
outside Israel, and primarily in the United States, both in the
revenue-generating properties segment and in the residential
construction segment. Material adverse changes in the state of the
economy in a country in which such properties are located affect
the results of operation and the ability to finance those
operations under reasonable conditions.
A
global economic crisis and a recession in the global economy may
adversely affect the various markets in which IDBD, DIC and their
subsidiaries operate, especially in the United States. The
characteristics of the business environment outside Israel,
including the local regulation, the purchasing power of consumers,
the financing possibilities (under reasonable conditions, if at
all), and the selection of entities (including local entities in
Israel) which are engaged in the field on financing with whom the
collaboration is done with, and these entities business status, may
affect the possibilities for financing, their terms, and the
success of the foreign operation, and accordingly, may have an
adverse effect on their business operations and the results of
operations of IDBD, DIC and their subsidiaries.
Some activities of IDBD, DIC and/or subsidiaries may be restricted
by the terms of certain government grants and benefits and/or
budgetary policy.
Some of
the subsidiaries of IDBD and DIC receive funds from government
entities, such as grants for research and development activities,
which are provided in accordance with the Encouragement of
Industrial Research and Development Law, 5744-1984, and regulations
enacted pursuant thereto, as well as grants and/or various tax
benefits which are provided in accordance with the Encouragement of
Capital Investments Law, which are granted under certain
conditions. These conditions may restrict the activities of the
companies which receive such funds. Non-compliance of such
restrictions may lead to the imposition of various penalties,
including financial and criminal sanctions. Additionally, a
decrease or other changes in the budgets of the aforementioned
government entities, in a manner which prevents or reduces the
grants and/or benefits which the subsidiaries of IDBD and DIC
may receive from them in the future, may adversely affect the
operations and results of those companies.
Additionally,
investments of foreign entities, and particularly in the technology
and communication sectors, receive certain benefits derived from
the initiative for foreign investments by regulatory entities in
Israel, including certain tax benefits. If the aforementioned
benefits are and/or restricted it have a negative effect over the
results of the operations and the business results of IDBD and
DIC
Regional conflict may affect IDBD, DIC and their subsidiary’s
activities, especially Cellcom Israel Ltd. (“Cellcom”)
activities.
The
activities of
IDBD, DIC and their
subsidiaries
are located in Israel, as are some of its
suppliers. A significant part of Cellcom’s communication
network, as well as a significant part of Cellcom’s
information systems, are located within the range of missile
attacks launched from the Gaza Strip and Lebanon. Any damage caused
to the communication network and/or to the information systems may
adversely affect Cellcom’s ability to continue providing
services, in whole or in part, and/or may negatively affect
Cellcom's operations, which may may adversely affect its business
results and IDBD’s business. Additionally, negative effects
of this kind may materialize due to an increase in criticism of
Israel by international community (such as the increasing
international pressure to boycott Israeli companies, especially
when such companies operate in territories held by Israel in Judea
and Samaria, as IDBD and other Israeli operators are required to do
under our license), and could make it more difficult for us to
raise capital. In general, any armed conflict, terror attack or
political instability in the region may result in a decrease in
Cellcom’s income, including from roaming services of incoming
tourism, and may thereby adversely affect its business
results.
A deterioration in the political security and economical situation
in Israel may affect IDBD, DIC or their subsidiaries’
activities.
A
significant deterioration in the political-security situation in
Israel, and in light of the political instability in the Middle
East, may result in decreased demand for rental areas and
residential units, an exacerbation of the manpower deficit in the
construction and agriculture segment, and the increased costs of
works. These factors may adversely affect the results of the
results of operations of IDBD's operations, especially PBC's
operations. Additionally, all of Shufersal Ltd.’s
(“Shufersal”) income is produced in Israel, and a
significant part of the products sold by it are grown, produced or
processed in Israel. Therefore, the business results of Shufersal
are directly affected by the political, economic and security
conditions in Israel. A significant deterioration in the security
situation or political situation in Israel may adversely affect
Shufersal’s business operations, financial position and
results of operations, which in turn would have an negatively
effect on IDBD’s results of operations.
63
Shufersal’s
management routinely evaluates the possible impact and implication
of the general economic situation in Israel, in particular on the
retail food market. Developments and shocks in the Israeli economy,
as well as an economic downturn or recession due to an economic
crisis, may have negative effects on the food retail market in
Israel, and as a result, also on Shufersal’s revenues and
profitability, due to the intensification of competition and due to
changes in the consumption habits of its customers. Likewise, the
cost of living issue may affect Shufersal’s business results,
due to the considerable pressure from consumers which is being
applied on Shufersal to reduce the prices of the products which it
sells, and the increasing competition from the discount chains,
which are expanding their operations. Deceleration in the Israeli
economy may negatively impact Clal Insurance Enterprises
Holdings’ (“Clal”'s business, particularly in the
long term savings segment. Additionally, as a result of the
aforementioned deceleration, the risk associated with the exposure
of Clal to entities in Israel through its investments may increase
due to the deterioration of Israel's political and economic
situation.
IDBD, DIC and their subsidiaries are exposed to capital market and
finance regulations that may affect our ability to finance our
operations.
IDBD,
DIC and some of their subsidiaries are affected by the "Proper
Conduct of Banking Directives" of the Commissioner of Banks in
Israel, which include, inter alia, restrictions on the volume of
loans that a banking corporation in Israel can provide to a
“single borrower”, one "group of borrowers", and
borrowers and the largest "borrower groups" in the banking
corporation (as these terms are defined in the said directives).
These restrictions might impose difficulties on the ability of
IDBD, DIC and some of their subsidiaries to borrow additional
amounts from banks in Israel and/or their ability to refinance its
obligations through bank credit and/or on their ability to perform
investments for which bank credit is required, and/or on their
ability to invest in companies which have taken out credit in a
larger scope than certain banks in Israel, and on their ability to
perform certain business activities in collaboration with entities
which have taken credit, as aforesaid. However, in recent years the
scope of credit used from the banking system in Israel to the group
of borrowers which includes IDBD has decreased, including due to
the change in its control.
Furthermore,
legislation and regulation which applies to investments by
institutional entities, including those relating to the granting of
credit to business groups, may have an impact on the possibilities
of raising capital from institutional entities, including the terms
and the price of such capital raise.
The
desire of banking corporations to reduce their credit exposure to
corporations controlled by the controlling shareholder of IDBD and
DIC, may adversely affect the rating of IDBD´s or DIC's bonds
and/or make it difficult for DIC to raise capital and/or refinance
its obligations, if it wishes to do so (and/or worsen the
conditions for carrying out such debt refinancing).
Risks
relating to our business in Israel
IDBD, DIC and their subsidiaries are exposed to changes in permits
and licenses.
IDBD,
DIC and some of their subsidiaries operate under certain approvals,
permits or licenses which were granted to them by various
authorities in parallel, such as the Commissioner of the Capital
Market Insurance and Saving (the "
Commissioner
"), the Ministry of
Communication, the Ministry of Environmental Protection, and the
Commissioner of Oil Affairs in the Ministry of National
Infrastructures, Energy and Water, the Minister of Transportation
(with respect to the granting of licenses for operational and
commercial operation of flights). A breach of the terms of these
approvals, permits or licenses may lead to the imposition of
penalties and other liabilities (including criminal) against IDBD
or the relevant subsidiaries, including fines and/or revocation of
such approvals, licenses or permits. Revocation of such approvals,
permits or licenses may prevent of finance opportunity certain
businesses or retained the way we currently operate, which may
adversely affect such subsidiaries (such as companies in the
insurance sector). Some licenses are subject to an expiration date,
and are subject to renewal from time to time, in accordance with
their terms and the provisions of the law. There is no certainty
that we will be able to renew such licenses in the future and/or
under which conditions. Non-renewal of a permit or license, as
stated above, and/or the directives of regulators in sectors in
which subsidiaries of IDBD and DIC operates, may have an adverse
effect on the business position, capital, cash flows and
profitability of our consolidated that operate under such permit or
license, and accordingly, our results of operations of
IDBD.
64
Litigation, including actions on consumer issues and environmental
protection issues may have an impact on IDBD, DIC and their
respective subsidiaries.
Subsidiaries of
IDBD, primarily Clal, and subsidiaries of DIC primarily including
Cellcom, Shufersal and Clal, may be subject, from time to time, to
litigation, including class actions, related to consumer and
environmental issues, which may involve material amounts, which may
have an adverse effect on our results of operations. We cannot
anticipate the results of such claims, which may have an adverse
effect on the our operations, or the cost to.
IDBD and DIC and their respective subsidiaries may face
environmental risks.
Some of
the subsidiaries which are held by IDBD or by DIC, are subject to
various requirements from different authorities which oversee
environmental protection. In recent years, there is an ongoing
trend of increased regulatory requirements with respect to the
environment, health and agriculture, in Israel, which has caused an
increase in the amount of costs of operations of IDBD, DIC and
their respective subsidiaries. Changes in the policy of those
supervising authorities, new regulation or enhanced requirements to
comply with these regulations may affect the profitability of the
relevant subsidiaries, and in turn, the profitability of IDBD and
DIC, respectively.
IDBD and DIC maybe exposed to restrictions by virtue of agreements
with financing entities.
The
provisions of existing or future financing agreements of IDBD and
DIC and the scope of the debt of IDBD or DIC and its maturity
dates have a significant impact on IDBD, DIC and their businesses,
with regard to agreements with financing entities.
i. Loan from a
guaranteed creditor of IDBD, dated May 2012, (entities from the
Menorah group (“Menorah”)), according to which IDBD
received from financial entities of the Menorah Group a CPI-linked
loan bearing CPI-linked interest at an annual rate of 6.9%, secured
by a pledge on shares of DIC and of Clal Holdings Insurance
Enterprises
ii. Loan from
financial institution, dated December 2016, according to which IDBD
signed a loan agreement with a financial institution which had
extended a loan to IDBD.
iii. In March 2017,
IDBD signed an agreement with a banking corporation, according to
which the (semi-annual and equal) principal payments of the loan
will be scheduled for earlier dates, such that, in place of an
arrangement whereby the balance of payments will be repaid on a
semi-annual basis, until January 2019, they will be repaid in three
payments in 2017, such that the first payment was paid on March 8,
2017, and amounted to a total of NIS 26.7 million plus interest
until that date; the second payment was paid on June 29, 2017 and
amounted to a total of NIS 13.3 million (half of the unpaid balance
of the loan as of that date) plus interest until that date; and the
third payment was paid on November 22, 2017, and comprised the
entire unpaid balance of the loan
iv. In March 2017,
IDBD signed an agreement with a banking corporation, according to
which the (semi-annual) principal payments of the loans will be
scheduled for earlier dates, such that, in place of an arrangement
whereby the balance of payments will be repaid on a semi-annual
basis, until March 2018, they will be repaid in four payments in
2017, such that the first payment was paid on March 8, 2017, and
amounted to a total of NIS 83.3 million plus interest until that
date on the paid amount; the second payment was paid on March 13,
2017 and amounted to a total of NIS 83.3 million plus the interest
which accrued until that date; the third payment was paid on
September 18, 2017 and amounted to a total of NIS 41.7 million plus
the interest which accrued until that date; and the fourth payment
was paid on November 22, 2017, and comprised the entire unpaid
balance of the loan.
IDBD and DIC are exposed to potential steps if such will be taken
by its debenture holders.
The
taking of legal action against IDBD or DIC by their debenture
holders may harm the ability of IDBD or DIC to continue repaying
its debts according to their amortization schedules and may lead to
a demand to make future liabilities (mainly to the borrowing
corporations) for immediate repayment.
IDBD, DIC and some of their subsidiaries may be affected by
restrictions on the sale of assets and guarantees.
IDBD,
DIC and some of their subsidiaries are subject to legal and
contractual restrictions, including those which are included in
permits and licenses, which may restrict the possibility of
realizing its securities or the possibility of pledging them
(including due to restrictions on the realization of such pledges)
by IDBD, DIC or by their subsidiaries.
65
IDBD, DIC and some of its subsidiaries may be affected by changes
in legal proceedings in the field of companies laws and securities
laws.
In
recent years, an increasing trend has taken place in the filing of
class actions and derivative claims in the field of companies laws
and securities laws. In consideration of the above, and of the
financial position of IDBD and DIC and the group’s holding
structure, claims in material amounts may be filed against IDBD and
DIC, including in connection with its financial position and cash
flows, issuances which it performs, and transactions which were
performed or which were not completed, including in connection with
assertions and claims by the IDBD’s or DIC’s
controlling shareholders. For more information, see “Item 8.
Financial Information – Legal Proceedings – Operation
Center in Israel.”
Damage to the business situation of DIC
In view
of the amount of the DIC´s bond and the fact that it is
secured by a lien on DIC shares without the right of recourse to
Dolphin IL, IDBD is exposed to adverse changes in the business
condition of DIC and as a result to DIC's share price, in a manner
that the worsening of DIC's business and/or its financial situation
(including as a result of the weakening of the business and/or
financial situation of any of DIC's subsidiaries) may result in a
decrease in the value of DIC and as such harm the value of the
guarantee against the bond.
Furthermore, an
adverse impact on DIC's business may affect DIC's ability to
distribute dividends to its shareholders, including Dolphin IL,
which is a holding company, apart from holding DIC shares, and
therefore Dolphin IL’s repayment ability is affected, inter
alia, from the scope of dividends that DIC distributes, if
any.
In
addition, to the extent that regulatory changes (including
legislative amendments and changes in accounting standards) are
adopted, which are stringent with the conditions for distribution
of dividends, these may harm the ability of DIC to distribute
dividends to its shareholders and as a result affect the solvency
of Dolphin IL, which may affect the ability of Dolphin IL to repay
the
debt with
IDBD.
The outline for the sale of the shares of Clal
As long
as IDBD does not find a buyer for its controlling shares in Clal,
which will receive the approvals required by law, including the
approval of the Commissioner, the Commissioner is expected to
proceed with the realization of the outline set by her, carried out
by way of 5% tranches of the share capital of Clal, for the sale of
the holdings of IDBD in Clal. The sale of IDBD’s holdings in
the shares of Clal in accordance with the provisions of the outline
may result in a lower consideration than the consideration IDBD
would have received if it sold all of its shares of Clal as a
bundle (i.e. without the involvement of the Commissioner) including
the sale of the controlling interest.
IDBD and DIC
may be affected by cash requirements, reliance on cash flows of
subsidiaries and liquidity.
The
cash flows of DIC and IDBD are used to repay debt (principal and
interest payments), to finance general and administrative expenses,
to make investments, and, if relevant, to distribute dividends as
well. One of the main sources for DIC’s and IDBD´s
current cash flows includes dividends distributed by its
subsidiaries (if and insofar as any are distributed). An additional
source for DIC’s cash flows is the sale of assets, including
the sale of equity interests in subsidiaries. Changes in the amount
of dividends and/or in the value of asset realizations accordingly
affects IDBD´s and DIC’s cash flows.
Cellcom is exposed to aggressive competition.
The
communication market is characterized by significant competition in
many of its segments. The current, pr the increase, of competition
in most of the markets in which Cellcom operates, may cause any of
the following, which may have an adverse impact on Cellcom’s
profitability:
(a) An
additional decrease in the prices for our services;
(b) An
ineffective wholesale market for landline communication, including
due to the effective exclusion of Hot infrastructure, the effective
exclusion of telephone services from the wholesale market, the
offering of services not in accordance with the criteria of the
wholesale market, without implementation of enforcement measures by
the Ministry of Communication, or the pricing thereof in a manner
which could negatively affect Cellcom’s ability to offer
competitive services packages, and to compete against Bezeq and Hot
(due to their dominant status in the landline communication
market), or a change to the current regulation that will be less
favorable towards Cellcom, considering Cellcom's dependence on the
wholesale landline for supplying landline infrastructure services,
the increased competition by Bezeq and Hot, considering their
dominance in the landline market, particularly if the structural
separation which applies to the Bezeq and Hot groups is canceled
before the creation of an effective landline wholesale
market;
(c)
Cancellation or easement of the structural separation which applies
to the Bezeq and Hot groups;
(d) The
entry of new competitors into markets in which Cellcom is engaged,
or the entry of existing competitors into segments in which they
were not previously active, or were partially active;
66
(e)
Non-acquisition or wide independent deployment of a landline
infrastructure or entering into a cooperation agreement for the use
of such infrastructure with an operator who owns an infrastructure,
by Cellcom, taking into consideration the growth of Cellcom’s
television and internet services, especially if one of the
competitors, who currently does not own such an infrastructure,
will deploy infrastructure or will enter into such cooperation, and
this may limit the bandwidth included in Cellcom's proposals
vis-à-vis the competitors, since today it depends on the
stationary wholesale market;
(f)
Regulatory changes which facilitate the transition of customers
between operators;
(g) The
ability of some of Cellcom's competitors to obtain better access
and contractual terms with international suppliers or foreign
operators than Cellcom due to their affiliation with international
groups;
(h)
Should the transition to other frequencies, adversely affect
Cellcom's services or Cellcom will be required to bear the costs of
changing frequencies, which will not affect
competitors;
(i)
Continued increased competition in the end user equipment
market.
Changes in legislation or significant regulatory intervention may
have an adverse effect on Cellcom activities.
Cellcom
develops its activity in a highly regulated market and relies on a
license issued by the Ministry of Communications of Israel to
operate its business. Such License has to be renewed every six
years and may be amended without Cellcom’s consent. See
“Item 4. Business – Regulation –
Telecommunications.” Other changes in legislation and the
extent of such regulatory changes may have adverse effects on
Cellcom, including:
(a)
cancellation or
easement of the structural separation obligation which applies to
Bezeq and Hot, particularly if such cancellation or easement is
given before the creation of an effective wholesale market in the
landline communication market, including high tariffs for services
or non-enforcement of market regulation or a mechanism that does
not prevent Bezeq and Hot from reducing tariffs, thereby reducing
the gap between wholesale and retail tariffs ("margin squeeze") or
fail to enforce regulation with respect to the landline wholesale
market resulting in our continued inability to use additional
wholesale services;
(b)
competition-encouraging
tariffs;
(c)
the provision of
easements and benefits to competitors, over Cellcom;
(d)
granting
permissions for other operators to provide services to Cellcom
subscribers which were previously provided only by
Cellcom;
(e)
non-renewal of
Cellcom’s licenses and/or frequencies, or restriction of
their use, and non-allocation of additional frequencies, if
required;
(f)
the establishment
of additional requirements for the provision of easements to
competitors with respect to safety or health, including with
respect to the construction and operation of base
sites;
(g)
the establishment
of additional restrictions or requirements regarding the provision
of services and products and/or intervention in their terms of
marketing, advertising and provision, including regarding existing
agreements;
(h)
the establishment
of a higher standard of service;
(i)
Setting a timetable
for the implementation of new requirements in a license that cannot
be met;
(j)
the establishment
of a more stringent policy with respect to protection
privacy;
(k)
the imposition of
regulations on Cellcom’s television over internet service,
the establishment of non-beneficial conditions for the use of
digital terrestrial television
(
DTT) broadcasts, or the imposition of such non-beneficial
conditions on Cellcom and not on other operators of the television
over internet service.
(l)
Regulatory
developments also affect the risk factors of tariff oversight,
licensing of sites and the indemnification obligation, non-ionizing
radiation and dependence on licenses.
Cellcom may face difficulties in obtaining approvals related to the
construction and operation of certain infrastructure.
Cellcom
(and its competitors) encounters difficulties in obtaining some of
the required approvals for the construction and operation of base
sites, and particularly in obtaining the building permits from the
various planning authorities.
67
As of
December 31, 2017, Cellcom operated a small portion of our cell
sites without building permits or applicable exemptions and
approximately 33% of Cellcom's cell sites without building permits
in reliance on an exemption from the requirement to obtain a
building permit, mainly for radio access devices. Such reliance had
been challenged and under an interim order issued by the Supreme
Court of Israel in September 2010, Cellcom is unable to rely on the
exemption under cellular networks, other than to replace or
relocate existing radio access devices under certain conditions. In
2017, new draft regulations setting procedures for making changes
in existing radio access devices including replacement thereof and
for the construction of a limited number of new radio access
devices exempt from building permits, but requiring certain
municipal procedures, were deliberated in the Israeli Parliament's
Economic Committee.
The
difficulties encountered by Cellcom in obtaining the required
permits and approvals may adversely affect the currently existing
infrastructure, and the continued development of its mobile
network. Additionally, the inability to obtain these approvals on
time may also prevent Cellcom from achieving the service quality
targets set by in Cellcom’s mobile license, which may result
in loss of customers, which would adversely affect its business
results.
Cellcom depends significantly on its licenses
Cellcom
provides communication services under licenses granted by the
Ministry of Communication, which are subject to changes, including
changes that may negatively affect Cellcom’s interests and
operations. A breach of the terms of the licenses may result in the
revocation of the licenses. The inability to function as it
currently does or the imposition of fines may adversely affect
Cellcom’s operation and may result in Cellcom’s
inability to continue operating in each of the segments in which it
operates.
Cellcom depends significantly on technology and technological
improvements which require investments in order to maintain
competitive.
The
communication market is characterized by rapid and significant
changes in technology, requiring investment in advanced
technologies in order to stay competitive.
In
order to meet the increasing demand for data communication, Cellcom
is required to upgrade its transmission network, and also to invest
in its 4G network. To meet the growing demand for data traffic on
the fixed-line network and in order to find more cost-effective
alternatives for acquiring capacity from large-scale infrastructure
providers, Cellcom has begun deploying its infrastructure to
residential areas and promoting further alternatives. The
deployment of such infrastructure is expensive and requires
managerial attention that can be directed at other activities. In
addition, the Ministry of Communications is promoting the
replacement of Cellcom's MHz 850 frequencies with other frequencies
(some of which are not specifically specified in national outline
plan (TAMA) 36) that comply with the international standards for
the Israeli region, which, if implemented, will include a complex
and sensitive engineering project, which includes substantive
investments in Cellcom's network, including replacement of Radio
equipment in all the cellular sites, which may, during this
project, adversely affect the products and service of
Cellcom.
Cellcom dependens on certain suppliers.
Cellcom
is dependent on a number of suppliers that provide it with network
equipment, end-user equipment, content and content management
services, information systems and infrastructures. Cellcom's
business results may be adversely affected if any of its suppliers
will not supply its products and/or services at the required
quality or on time, or on terms which are not beneficial to
Cellcom, or provide Cellcom's competitors with better conditions or
if the suppliers fail to produce successful products/content in the
absence of an equivalent alternative. In addition, Cellcom relies
on agreements with foreign operators to provide cellular roaming
capabilities to its cellular subscribers, cellular services to its
cellular and cellular subscribers.
Cellcom may be affected by its debt.
Cellcom
has raised a significant amount of debt. This situation increases
Cellcom’s exposure to market changes, and makes it difficult
to respond quickly to changes in the industry and in the
competitive market conditions, including by raising additional
debt. As of June 30, 2018, Cellcom’s debenture balance value
in books amounts to approximately NIS 3,037.012 million. In
addition, in January 2018, Cellcom issued NIS 400.6 million par
value bonds (series 12) for the net consideration of NIS 400
million. In July 1, 2018, after the end of the reporting period,
Cellcom's issued NIS 220 million principal amount of additional
series K debentures according to its undertaking from June 2017. A
change for the worse in Cellcom’s results of operations, and
any additional reduction of Cellcom’s rating and its bonds
may adversely affect also the price and terms of Cellcom’s
current debt, and the raising of
additional debt. In
addition, as of today, interest rates are very low and an increase
in interest rates may increase debt raising costs in the
future.
68
Cellcom is a party to legal proceedings filed against it from time
to time, including applications for approval of claims as class
actions in material amounts.
In
addition, due to the volume and size of Cellcom's activity,
including the risk of discrepancies between the tariff plans and
the large information processed in Cellcom's information systems,
and in view of the frequent changes in Cellcom's activity and its
price plans following regulatory changes or changes in the market
and the involvement of thousands of sale representatives and
customer service representatives in the sale process, and the
connection with the customer following after, the risk of
discrepancy between the price plans and the information processed
in Cellcom's information systems or the provision of insufficient
information increases, and despite Cellcom's efforts to prevent
this, Cellcom has exposure to a large number of claims, including
class actions in material amounts.
The employees’ union may limit Cellcom's ongoing activity,
including the possibility of Cellcom making organizational and
personnel changes, and may demand managerial attention
In
addition, disagreements with representatives of the workers'
organization, such as disagreements regarding the renewal of the
collective agreement, may result in organizational steps and a
negative affect on Cellcom's customer services, and other required
changes that may in result fail or take place in a manner
materially different than planned, resulting in lower
savings
.
PBC results of operations may be affected by the increase of the
supply of rental areas.
A
significant decrease in the growth rate in the Israeli economy, and
a significant increase in the surplus supply of rental areas, due
to the construction of additional office and commercial areas which
may cause a decrease in the rental prices, and may affect the
income of PBC from revenue-generating properties.
Shufersal may be affected by the competition.
Competitive
pressures, including the responses of competitors and of the market
to Shufersal’s strategy and the manner of its implementation,
may result in adverse effects to Shufersal’s ability to deal
with the foregoing, and may lead to the reduction of prices, lower
margins, and the loss of market share in a manner which may have an
adverse effect on Shufersal’s business affairs, financial
position and results of operations.
Shufersal may have risks related to the collective labor
agreement.
Most of
Shufersal’s employees are covered by collective labor
agreement, and Shufersal cannot be certain that this agreement will
be renewed, from time to time, or renegotiated in the same or
familiar terms, or without involving any direct action by the
union, such as a strike. If a dispute arises with employees which
involves a strike or adverse effect to the activities of Shufersal
or such events may have an adverse effect on Shufersal’s
business affairs, financial position and results of operations.
Additionally, any re-negotiation of collective agreements results
in additional payroll expenses which may affect our profitability
and result of operations.
A defect in a product of Shufersal’s brand may imply a fall
in reputation.
Shufersal has a
wide variety of branded food and beverage products which enjoy many
years of reputation, as well as products under the private brand.
Negative publicity to this reputation by means of various
publications, or by other means, may affect Shufersal’s sales
and adversely affect Shufersal’s profitability, regardless of
the correctness of those publications. Additionally, a defect in a
certain product may also affect the brand under which Shufersal
sells that product, as well as the entire family of products which
is marketed under the same brand.
69
A failure in information processing and IT systems may adversely
affect Shufersal’s operating activities.
Shufersal makes use
of various information and IT systems. Shufersal’s central
information systems (and their backup systems) are located in and
around the logistical center which is used to manage its
distribution network. Shufersal takes various steps in order to
ensure the functionality and reliability of the various information
and IT systems, including by securing and backing up the
information. However, a collapse of the information and IT systems
may have an adverse effect on Shufersal’s operating
activities. In addition, Shufersal, like any other company, is
exposed to the risk of infiltration and theft by foreign entities
of its information and computer systems. Shufersal operates in
accordance with internal procedures to reduce its exposure to such
hacking activity, and it also has an insurance policy covering
cyber risks.
Shufersal growth may be limited by the Anti-trust law in case it
pursues any future operations in the food retail
segment.
Shufersal achieved
a significant part of its past growth by acquiring various retail
operations. Future acquisitions of various operations in the food
retail segment by Shufersal may require approval of the Antitrust
Authority, which may not be granted or under terms favorable to
Shufersal. In addition, our ability to grow through acquisitions
may be impaired and the restrictions of the Food Law. Due to this
limitations Shufersal may not be able to grow or take advantage of
certain market opportunities.
The termination of the operating agreement with Leumi Card Ltd may
imply a risk for Shufersal.
In
August 2017, Shufersal notified Leumi Card that it does not wish to
renew the operating agreement with Leumi Card in connection with
the issuance of “Shufersal” and “Yesh”
credit cards, therefore the agreement terminated on January 18,
2018. Accordingly, as of said date, credit cards are issued to
Shufersal's customers by Visa Cal. Following the termination of the
operating agreement with Leumi Card, Shufersal is required to
reissue the credit cards to its customers, which may impose costs
on Shufersal and may affect the volume of credit card activity,
including diminish the number of credit-card holders. In addition,
Shufersal terminated its cooperation with Paz, pursuant to which
benefits were granted to holders of Shufersal credit cards issued
by Leumi Card (such benefits will be granted for an additional year
from the date of termination of the cooperation). Ending this
cooperation may affect the number of credit card
holders.
Variations in interest rates may affect the value of
Clal.
One of
the primary exposure of Clal is to interest rate decreases, since
the average lifetime of its liabilities is significantly longer
than the average lifetime of the assets.A decrease in the interest
rate may lead to an impairment in the solvency ratio. In the
current interest rate environment, Clal is exposed to losses in
certain scenarios involving an interest rate decrease due to the
impact of such changes on the discount rates that are used in the
calculation of the reserves for pension, and in the liability
adequacy test (“LAT”) and in a scope which may exceed
the capital gains which will be created in that scenario with
respect to interest-sensitive assets. However, Clal may also be
exposed to certain scenarios of an increase in interest rates. It
should be noted that from a long-term perspective, Clal is also
exposed to a continuing low level of interest rates, with an
emphasis on the linked interest rate.
Clal may have to face risks related to inflation.
Clal is
exposed to an increase in the inflation rate, due to the fact that
the majority of insurance liabilities of Clal are adjusted on a
quarterly basis in accordance with the inflation rate, while the
assets held against them are not necessarily
CPI-linked.
In the
first half of 2018, inflation increased by 0.9% relative to the
CPI, with no change in the corresponding period last year. In
summary of the second quarter on 2018, inflation slightly increased
relative to the first quarter of 2018. Expectation based on the
capital market increased in all ranged. After the balance sheet
date, the Central Bureau of Statistics published the price index
for June 2018, which rose by approximately, and the index for July,
which remained unchanged,
According to the
estimate of the Bank of Israel's Research Division from July 2018,
in 2018, GDP is expected to grow at a rate of 3.7%, while in 2019,
it is expected to grow at a rate of 3.5%. The inflation rate in the
coming year is expected to amount to 1.4%. Then monetary interest
rate is expected to remain at its current level (0.1%) and to rise
to a rate of 0.25% in the last quarter.
70
Other assets price risk.
Some of
the assets of Clal and some of the assets managed for others are
invested in alternative investments, which include investments in
real estate and in real estate funds, investment funds,
non-marketable stocks and additional investment instruments which
are exposed changes in their value.
Clal may face credit risks.
Clal is
exposed to the possibility of financial loss as a result of the
insolvency of borrowers and other debtors (through financial assets
in the assets portfolio, through activities involving policies in
accordance with the Sales Law, and credit insurance) with respect
to its investments in debt instruments. Additionally, an increase
in insolvency of businesses in Israel may also increase the amounts
of claims of the directors
’
and officers
’
liability insurance sector in
which Clal operates, and the scope of employers’ debts with
respect to the non-transfer of payments for pension insurance with
respect to their employees. In its portfolio of assets, Clal is
exposed to the various market sectors, of which the main ones are
the banking and financial industries, the real estate in Israel
sector, and the infrastructure and energy sector. A decline in
activity, slowdowns or crisis in such sectors may have a negative
impact on our investments and, thus, on the results of our
operations.
Clal may face insurance risks.
Clal
is primarily exposed in the insurance activity mainly to risks
related to changes in the risk factors which affect the frequency
and severity of events compared to the actuarial assumptions and
the risk of a single large loss or accumulation of damages in
respect of a catastrophic event, that may have an adverse effect on
the business results of the Clal.
A decrease on the portfolio level may imply a risk for
Clal.
The
rates of cancellation, freezing and transfers constitute a
significant assumption in the life and health insurance businesses,
due to the fact that the profitability in this segment is based on
a margin in premiums, and on the collection of management fees
throughout the lifetime of the policy. The cancellation of policies
also leads to the write-off of deferred acquisition costs with
respect to those policies.
Clal may affront claims due to catastrophes.
Clal
may be subject to a sudden increase in claims due to a single large
impact event (catastrophe) with a large scope of damages, such as
an earthquake, which is considered a significant catastrophe event
to which Clal is exposed to. With regard to life and health
insurance, Clal is mainly exposed to other catastrophic events such
as war and terrorism risks in Israel.
Significant operations in
Clal are subject to detailed and complex
regulation
.
The
institutional entities in Clal are exposed to the risk of decline
below the minimum capital required, which may result in the
initiation of regulatory actions against them. In addition, the
operations of these institutional entities and agencies in Clal are
conditional upon holding the licenses and permits required for
activity in the areas of operations of Clal, including withstanding
the regulatory capital requirement. In particular, the insurance
and long-term savings activities are subject to regulatory
directives which change from time to time, with respect to products
which were sold over many years, and which have long insurance
coverage periods and/or savings periods.
Clal is
subject to restrictions and conditions by virtue of control permits
for the institutional entities which are under its control,
including the capital maintenance requirement.
Clal may face liquidity risks.
Clal
may face liquidity challenges due to the uncertainty associated
with the date in which Clal will be required to pay claims and
other benefits to policyholders and to other beneficiaries,
relative to the total amount of reserves which are available for
this purpose at that time. Liquidity risk may increase upon the
materialization of a significant catastrophic event.
Clal may have to face risks related to model, risk and underwriting
risk.
Clal is
exposed, in its insurance activities, to the risk of the selection
of a wrong model for pricing, for the estimation of insurance
liabilities, to risk of the use of incorrect parameters in models,
and to risk of the use of incorrect pricing as a result of
deficiencies in the underwriting process.
71
Clal is exposed to operational risks.
Risk of
loss due to inadequacy or failure of internal processes, people and
systems, or due to external events. In light of the scope of
activities of Clal, which manages, as of December 31, 2017, assets
totaling approximately NIS 181 billion (of which, a total of
approximately NIS 150 billion involve assets managed for others),
and despite the actions taken by it to identify the risks and to
establish appropriate controls, the scope of its exposure to the
operational risks of the type specified above is
significant.
Clal depends significantly on technology and technological changes
may imply investments in order to maintain
competitive.
A
significant part of the activities of Clal relies on different
information systems. The absence of sufficient infrastructure
and/or deficiencies and/or failures in the computerized information
systems may cause significant adverse effects to Clal operations. A
disruption of operations may have significant operating and
financial losses.
The activities of Clal depends of external suppliers, and any
change on them may imply a risk for Clal.
As part
of its activities, Clal engages in agreements with various
suppliers and service providers. Clal is exposed to the risk of
harm to its reputation and profitability as a result of harm to the
service quality which is provided to it and to its customers, as
well as risks associated with difficulty in finding an alternative
provider, if necessary.
Risks Related to the ADSs and the Common Shares.
Shares eligible for sale could adversely affect the price of our
common shares and American Depositary Shares.
The
market prices of our common shares and ADS could decline as a
result of sales by our existing shareholders of common shares or
ADSs, or the perception that these sales could occur. These sales
also might make it difficult for us to raise capital by selling
equity securities at a time and at the conditions that we may
deemed appropriate.
Eduardo Elsztain,
which as of June 30, 2018, was the beneficial owner of
approximately 34.74% of our common shares (or approximately
174,267,696 common shares which may be exchanged for an aggregate
of 17,426,769 ADSs), may sell or otherwise dispose of any or all of
its common shares or ADSs at any time. Sales of a large number of
our common shares and/or ADSs may have an adverse effect on the
market price of our common shares and the ADSs.
If we issue additional equity securities in the future, you may
suffer dilution, and trading prices for our equity securities may
decline.
We may
issue additional shares of our common stock for financing future
acquisitions or new projects or for other general corporate
purposes. Any such issuance could result in a dilution of your
ownership stake and/or the perception of any such issuances could
have an adverse impact on the market price of the
ADSs.
We are subject to certain different corporate disclosure
requirements and accounting standards than domestic issuers of
listed securities in the United States
There
is less publicly available information about the issuers of
securities listed on the Argentine stock exchanges than information
publicly available about domestic issuers of listed securities in
the United States and certain other countries.
Although
the ADSs are listed on the NASDAQ
Global Market, as
a foreign private issuer we are able to
rely on home country governance requirements rather than relying on
the NASDAQ corporate governance
requirements. See “Item 16G. Corporate
Governance—Compliance with NASDAQ
listing Standards on
Corporate Governance.” Additionally, as a foreign private
issuer, we are exempt from certain rules under the Exchange Act
including (i) the sections of the Exchange Act regulating the
solicitation of proxies, consents or authorizations in respect of a
security registered under the Exchange Act; (ii) the sections
of the Exchange Act requiring insiders to file public reports of
their stock ownership and trading activities and liability for
insiders who profit from trades made in a short period of time; and
(iii) the rules under the Exchange Act requiring the filing
with the SEC of quarterly reports on Form 10-Q containing
unaudited financial and other specified information, or current
reports on Form 8-K, upon the occurrence of specified
significant events. In addition, foreign private issuers are not
required to file their annual report on Form 20-F until four
months after the end of each fiscal year, while U.S. domestic
issuers that are accelerated filers are required to file their
annual
72
report
on Form 10-K within 75 days after the end of each fiscal
year. Foreign private issuers are also exempt from the Regulation
Fair Disclosure, aimed at preventing issuers from making selective
disclosures of material information. As a result of the above, you
may not have the same protections afforded to shareholders
companies that are not foreign private issuers.
Investors may not be able to effect service of process within the
U.S., limiting their recovery of any foreign judgment.
We are a publicly held corporation (sociedad anónima)
organized under the laws of Argentina. Most of our directors and
our senior managers, are located in Argentina. As a result, it may
not be possible for investors to effect service of process within
the United States upon us or such persons or to enforce against us
or them in United States courts judgments obtained in such courts
predicated upon the civil liability provisions of the United States
federal securities laws. We have been advised by our Argentine
counsel, Zang, Bergel & Viñes, that there is doubt
whether the Argentine courts will enforce, to the same extent and
in as timely a manner as a U.S. or foreign court, an action
predicated solely upon the civil liability provisions of the United
States federal securities laws or other foreign regulations brought
against such persons or against us.
If we are considered to be a passive foreign investment company for
United States federal income tax purposes, U.S. holders of our
common shares or
ADSs
would suffer negative
consequences.
Based
on the past and projected composition of our income and assets and
the valuation of our assets, including goodwill, we do not believe
we were a passive foreign investment company “PFIC” for
United States federal income tax purposes for the taxable year
ending June 30, 2018, and do not currently expect to become a PFIC,
although there can be no assurance in this regard. The
determination of whether we are a PFIC is made annually.
Accordingly, it is possible that we may be a PFIC in the current or
any future taxable year due to changes in our asset or income
composition or if our projections are not accurate. The volatility
and instability of Argentina’s economic and financial system
may substantially affect the composition of our income and assets
and the accuracy of our projections. In addition, this
determination is based on the interpretation of certain U.S.
Treasury regulations relating to rental income, which regulations
are potentially subject to differing interpretation. If we become a
PFIC, U.S. Holders (as defined in “Item 10. Additional
Information—Taxation—United States Taxation”) of
our common shares or
ADSs
will be subject to
certain United States federal income tax rules that have negative
consequences for U.S. Holders such as additional tax and an
interest charge upon certain distributions by us or upon a sale or
other disposition of our common shares or
ADSs
at a gain, as well as
reporting requirements. See “Item 10.
E—Taxation—United States Taxation—Passive Foreign
Investment Company” for a more detailed discussion of the
consequences if we are deemed a PFIC. You should consult your own
tax advisors regarding the application of the PFIC rules to your
particular circumstances.
Changes in Argentine tax laws may affect the tax treatment of our
common shares or
ADSs.
GDSs.
On
September 12, 2013, Law No. 26,893, which amended Law
No. 20,628 (the “Income Tax Law”), was enacted and
published in the Official Gazette on September 23, 2013.
According to the amendments, the distribution of dividends by an
Argentine corporation was subject to income tax at a rate of 10.0%,
unless such dividends were distributed to Argentine corporate
entities (the “Dividend Tax”).
The
Dividend Tax was repealed by Law No. 27,260, enacted on
June 29, 2016, and consequently no income tax withholding was
applicable on the distribution of dividends in respect of both
Argentine and non-Argentine resident shareholders, except when
dividends distributed were greater than the income determined
according to the application of the Income Tax Law, accumulated at
the fiscal year immediately preceding the year in which the
distribution is made. In such case, the excess was subject to a
rate of 35%, for both Argentine and non-Argentine resident
shareholders. This treatment still applies to dividends to be
distributed at any time out of retained earnings accumulated until
the end of the last fiscal year starting before January 1,
2018.
However, pursuant
to Law No. 27,430, dividends to be distributed out of earnings
accrued in fiscal years starting on or after January 1, 2018,
and other profits paid in cash or in kind —except for stock
dividends or quota dividends—by companies and other entities
incorporated in Argentina referred to in the Income Tax
Law, to Argentine resident individuals and foreign
beneficiaries will be subject to income tax at a 7% rate on profits
accrued during fiscal years, resident undivided estates starting
January 1, 2018 to December 31, 2019,
and at a 13% rate
on profits accrued in fiscal years starting January 1, 2020
and onwards. If dividends are distributed to Argentine corporate
taxpayers (in general, entities organized or incorporated under
Argentine law, certain traders and intermediaries, local branches
of foreign entities, sole proprietorships and individuals carrying
on certain commercial activities in Argentina), no dividend tax
should apply.
73
In
addition, capital gains originated from the disposal of shares and
other securities, including securities representing shares and
deposit certificates, are subject to capital gains tax. Law
No. 27,430 effective as of January 1, 2018, provides that
capital gains obtained by Argentine resident individuals from the
disposal of shares and GDSs are exempt from capital gains tax in
the following cases: (i) when the shares are placed through a
public offering authorized by the CNV, (ii) when the shares
are traded in stock markets authorized by the CNV, under segments
that ensure priority of price-time and interference of offers, or
(iii) when the sale, exchange or other disposition of shares
is made through an initial public offering and/or exchange of
shares authorized by the CNV.
Such
law also provides that the capital gains tax applicable to
non-residents for transactions entered into until December 30,
2017 is still due, although no taxes will be claimed to
non-residents with respect to past sales of Argentine shares or
other securities traded in the CNV’s authorized markets (such
as GDSs) as long as the cause of the non-payment was the absence of
regulations stating the mechanism of tax collection at the time the
transaction was closed. General Resolution (AFIP) No. 4,227,
which came into effect on April 26, 2018, stipulates the
procedures through which the income tax should be paid to the AFIP.
The payment of capital gains tax applicable for transactions
entered into before December 30, 2017 was due on June 11,
2018.
In
addition, Law No. 27,430 and Decree 279/2018 maintain the 15%
capital gains tax (calculated on the actual net gain or a presumed
net gain equal to 90% of the sale price) on the disposal of shares
or securities by non-residents. However, non-residents are exempt
from the capital gains tax on gains obtained from the sale of
(a) Argentine shares in the following cases: (i) when the
shares are placed through a public offering authorized by the CNV,
(ii) when the shares were traded in stock markets authorized
by the CNV, under segments that ensure priority of price-time and
interference of offers, or (iii) when the sale, exchange or
other disposition of shares is made through an initial public
offering and/or exchange of shares authorized by the CNV; and
(b) depositary shares or depositary receipts issued abroad,
when the underlying securities are shares (i) issued by
Argentine companies, and (ii) with authorization of public
offering. The exemptions will only apply to the extent the foreign
beneficiaries reside in, or the funds used for the investment
proceed from, jurisdictions considered as cooperating for purposes
of fiscal transparency.
In case
the exemption is not applicable and, to the extent foreign
beneficiaries do not reside in, or the funds do not arise from,
jurisdictions not considered as cooperative for purposes of fiscal
transparency, the gain realized from the disposition of shares
would be subject to Argentine income tax at a 15% rate on the net
capital gain or at a 13.5% effective rate on the gross price. In
case such foreign beneficiaries reside in, or the funds arise from,
jurisdictions not considered as cooperative for purposes of fiscal
transparency, a 35% tax rate on the net capital gain or at a 31.5%
effective rate on the gross price should apply.
Therefore, holders
of our common shares, including in the form of GDSs, are encouraged
to consult their tax advisors as to the particular Argentine income
tax consequences under their specific facts.
Holders of
our ADSs
may be
unable to exercise voting rights with respect to the common shares
underlying
the ADSs at our
shareholders’ meetings
.
As a
holder of
ADS
, we will not
treat you as one of our shareholders and you will not have
shareholder rights. The depositary will be the holder of the common
shares underlying your
ADSs
and holders may exercise voting rights with respect to the common
shares represented by the
ADSs
only in accordance with the deposit agreement relating to the
ADSs
. There are no provisions
under Argentine law or under our bylaws that limit the exercise by
ADS
holders of their voting
rights through the depositary with respect to the underlying common
shares. However, there are practical limitations on the ability of
ADS
holders to exercise their
voting rights due to the additional procedural steps involved in
communicating with these holders. For example, holders of our
common shares will receive notice of shareholders’ meetings
through publication of a notice in the CNV’s website, an
Official Gazette in Argentina, an Argentine newspaper of general
circulation and the bulletin of the Buenos Aires Stock Exchange,
and will be able to exercise their voting rights by either
attending the meeting in person or voting by proxy.
ADS
holders, by comparison, will not
receive notice directly from us. Instead, in accordance with the
deposit agreement, we will provide the notice to the
ADS
Depositary. If we
ask the
ADS
Depositary to do
so, the
ADS
Depositary will
mail to holders of
ADSs
the
notice of the meeting and a statement as to the manner in which
instructions may be given by holders. To exercise their voting
rights,
ADS
holders must then
instruct the
ADS
Depositary as
to voting the common shares represented by their
ADSs
. Under the deposit agreement, the
ADS
Depositary is not required
to carry out any voting instructions unless it receives a legal
opinion from us that the matters to be voted would not violate our
by
-
laws or Argentine law. We
are not required to instruct our legal counsel to give that
opinion. Due to these procedural steps involving the
ADS
Depositary, the process for exercising
voting rights may take longer for
ADS
holders than for holders of common
shares and common shares represented by
ADSs
may not be voted as you
desire.
74
Under Argentine law, shareholder rights may be fewer or less well
defined than in other jurisdictions.
Our
corporate affairs are governed by our by-laws and by Argentine
corporate law, which differ from the legal principles that would
apply if we were incorporated in a jurisdiction in the United
States, such as the States of Delaware or New York, or in other
jurisdictions outside Argentina. In addition, your rights or the
rights of holders of our common shares to protect your or their
interests in connection with actions by our board of directors may
be fewer and less well defined under Argentine corporate law than
under the laws of those other jurisdictions. Although insider
trading and price manipulation are illegal under Argentine law, the
Argentine securities markets are not as highly regulated or
supervised as the U.S. securities markets or markets in some other
jurisdictions. In addition, rules and policies against
self
−
dealing and
regarding the preservation of shareholder interests may be less
well defined and enforced in Argentina than in the United States,
putting holders of our common shares and
ADSs
at a potential
disadvantage.
Restrictions on the movement of capital out of Argentina may impair
your ability to receive dividends and distributions on, and the
proceeds of any sale of, the common shares underlying the
ADSs
.
The
Argentine government may impose restrictions on the conversion of
Argentine currency into foreign currencies and on the remittance to
foreign investors of proceeds from their investments in Argentina.
Argentine law currently permits the government to impose these kind
of restrictions temporarily in circumstances where a serious
imbalance develops in Argentina’s balance of payments or
where there are reasons to foresee such an imbalance. We cannot
assure you that the Argentine government will not take measures in
the future. In such a case, the
ADS
Depositary for the
ADSs
may hold the Pesos it cannot convert
for the account of the
ADS
holders who have not been paid.
The protections afforded to minority shareholders in Argentina are
different from and more limited than those in the United States and
may be more difficult to enforce.
Under
Argentine law, the protections afforded to minority shareholders
are different from, and much more limited than, those in the United
States and some other Latin American countries. For example, the
legal framework with respect to shareholder disputes, such as
derivative lawsuits and class actions, is less developed under
Argentine law than under U.S. law as a result of Argentina’s
short history with these types of claims and few successful cases.
In addition, there are different procedural requirements for
bringing these types of shareholder lawsuits. As a result, it may
be more difficult for our minority shareholders to enforce their
rights against us or our directors or controlling shareholder than
it would be for shareholders of a U.S. company.
We may not pay any dividends.
In
accordance with Argentine corporate law, we may pay dividends to
shareholders out of net and realized profits, if any, as set forth
in our Audited Financial Statements prepared in accordance with
IFRS. The approval, amount and payment of dividends are subject to
the approval by our shareholders at our annual ordinary
shareholders meeting. The approval of dividends requires the
affirmative vote of a majority of the shareholders entitled to vote
present at the meeting. As a result, we cannot assure you that we
will be able to generate enough net and realized profits so as to
pay dividends or that our shareholders will decide that dividends
will be paid.
75
Our ability to pay dividends is limited by law and our
by-laws.
In
accordance with Argentine corporate law, we may pay dividends in
Pesos out of retained earnings, if any, to the extent set forth in
our audited financial statements. Our ability to generate retained
earnings is subject to the results of our operations. Therefore,
our ability to pay dividends is subject to the compliance with the
Argentine Corporate Law.
You might be unable to exercise preemptive or accretion rights with
respect to the common shares underlying your GDSs.
Under
Argentine corporate law, if we issue new common shares as part of a
capital increase, our shareholders will generally have the right to
subscribe for a proportional number of common shares of the class
held by them to maintain their existing ownership percentage, which
is known as preemptive rights. In addition, shareholders are
entitled to the right to subscribe for the unsubscribed common
shares of either the class held by them or other classes which
remain unsubscribed at the end of a preemptive rights offering, on
a pro rata basis, which is known as accretion rights. Under the
deposit agreement, the GDS Depositary will not exercise rights on
your behalf or make rights available to you unless we instruct it
to do so, and we are not required to give that instruction. In
addition, you may not be able to exercise the preemptive or
accretion rights relating to the common shares underlying your GDSs
unless a registration statement under the US Securities Act of 1933
is effective with respect to those rights or an exemption from the
registration requirements of the Securities Act is available. We
are not obligated to file a registration statement with respect to
the common shares relating to these preemptive rights, and we
cannot assure you that we will file any such registration
statement. Unless we file a registration statement or an exemption
from registration is available, you may receive only the net
proceeds from the sale of your preemptive rights by the GDS
Depositary or, if the preemptive rights cannot be sold, they will
be allowed to lapse. As a result, US holders of common shares or
GDSs may suffer dilution of their interest in our company upon
future capital increases.
A.
HISTORY AND DEVELOPMENT OF THE COMPANY
General Information
Our
legal name is Cresud Sociedad Anónima Comercial, Inmobiliaria,
Financiera y Agropecuaria, and our commercial name is
“Cresud.” We were incorporated and organized on
December 31, 1936 under Argentine law as a stock corporation
(
sociedad anónima
) and
were registered with the Public Registry of Commerce of the City of
Buenos Aires (
Inspección
General de Justicia
), on February 19, 1937 under number 26,
on page 2, book 45 of National By-laws Volume. Pursuant to our
bylaws, our term of duration expires on July 6, 2082. Our
headquarters are located at Moreno 877, 23rd Floor (C1091AAQ),
Ciudad Autónoma de Buenos Aires, Argentina. Our telephone is
+54 (11) 4814-7800, and our website is
www.cresud.com.ar.
Information
contained in or accessible through our website is not a part of
this annual report on Form 20-F. All references in this annual
report on Form 20-F to this or other internet sites are inactive
textual references to these URLs, or “uniform resource
locators” and are for information purposes only. We assume no
responsibility for the information contained on these
sites.
History
We were
incorporated in 1936 as a subsidiary of
Credit Foncier
, a Belgian company
engaged in the business of providing rural and urban loans in
Argentina. We were incorporated to manage real estate holdings
foreclosed by
Credit Foncier.
Credit Foncier
was liquidated in 1959, and as part of such
liquidation, our shares were distributed to
Credit Foncier’s
shareholders and
in 1960 were listed on the former Buenos Aires Stock Exchange
(“BASE”). During the 1960s and 1970s, our business
shifted to exclusively agricultural activities.
76
In 1993
and 1994, Consultores Asset Management acquired, on behalf of
certain investors, approximately 22% of our shares on the BASE. In
late 1994, an investor group led by Consultores Asset Management
(including Dolphin Fund plc.) acquired additional shares increasing
their aggregate shareholding to approximately 51.4% of our
outstanding shares. In 1997, we increased our capital through a
rights offering and global public offering of ADRs representing our
common shares and listed such ADRs on the NASDAQ. We started our
agricultural activities with seven farmlands and 20,000 hectares
under management.
In
2002, we acquired a 19.85% interest in IRSA, a real estate company
related to certain shareholders of Cresud, and 2009, we increased
its ownership percentage in IRSA to 55.64% and IRSA became
Cresud’s directly principal subsidiary. As of June 30, 2018,
we had a 63.74% equity interest in IRSA (without considering
treasury shares) and a majority of our directors are also directors
of IRSA. IRSA is one of Argentina’s largest real estate
companies and is engaged in a range of diversified real estate
activities including residential properties, office buildings,
shopping malls and luxury hotels, as well as the sales and
development residential properties, it has a 29.9% interest in
Banco Hipotecario, one of the main financial institutions in the
country, and selected investments outside of Argentina. Also, IRSA
has international investments, both in the United States in
relation to the lease of office buildings (Lipstick Building) and
hotels, through "Condor" a hotel REIT in that country, and in
Israel, through IDBD and DIC, one of the largest and most
diversified investment groups of Israel, which, participates in
numerous markets and industry sectors, including real estate,
retail, agroindustry, insurance, telecommunications, among
others.
In
March 2008 we launched and offered to sell up to which 180 million
shares
in
the local and international markets, which
were fully
subscribed. In addition, each shareholder received, without
additional cost, one warrant for each share subscribed. The
proceeds allowed us to expand our international operations to
Paraguay and Bolivia.
As of
June 30, 2018, we owned, directly and though our subsidiaries, 23
farms and a concession, with a total area of 612,230 hectares
distributed in Argentina, Brazil, Bolivia and
Paraguay.
In line
with our international expansion strategy, in September of 2005 we
participated in the creation of Brasilagro with the purpose of
replicating our business model in Brazil. We created BrasilAgro
together with our partners, Cape Town Llc, Tarpon Investimentos
S.A., Tarpon Agro LLC, Agro Investments S.A. and Agro Managers S.A.
On May 2, 2006, BrasilAgro’s shares were listed on the Novo
Mercado of the Brazilian Stock Exchange (“BOVESPA”)
with the symbol AGRO3 and on November 8, 2012, Brasilagro’s
ADRs became listed on the NYSE, under the ticker LND. As of June
30, 2018, we held a 43.3% interest in Brasilagro’s stock
capital, which, as of June 30, 2018 has 8 farmland properties and
198,157 hectares under management Brazil and Paraguay.
As part
of a series of transactions that implied a further expansion of the
Company’s agricultural and cattle raising business in South
America, in July 2008, the Company purchased, through various
companies, 12,166 hectares located in Santa Cruz de la Sierra,
Republic of Bolivia, for a total price of US$ 28.9 million. In
September 2008, the Company entered into a series of agreements for
accessing the real estate, agricultural and cattle raising and
forestry markets of the Republic of Paraguay. Under these
agreements, a new company was organized together with Carlos Casado
S.A., named Cresca S.A. (“Cresca”), in which the
Company held a 50% interest and acted as adviser for the
agricultural, cattle raising and forestry exploitation of a
41,931-hectare rural property and up to 100,000 additional hectares
located in Paraguay. In 2016, together with our partner Carlos
Casado and after an attempt to sell Cresca to a third party, we
decided to split-up Cresca distributing Cresca´s assets among
the shareholders. We hold our assets in Paraguay through Palmeiras
and Morotí, two subsidiaries formed in Paraguay. In February
2018, the distribution of Cresca´s assets to its shareholders
was completed.
Significant acquisitions, dispositions and development of
business
Agricultural
business
Sale
and purchase of Farmlands
La Suiza
In June
29, 2018, Cresud sold non-related third party for the sale of a
fraction of 10,000 hectares of livestock activity of "La Suiza".
The total amount of the consideration was US$10 million, of which
US$3.0 million have been already paid. The remaining balance of
US$7 million, guaranteed by a mortgage on the property, will be
paid in ten installments of the same amount ending on June 2023,
accruing an annual interest of 4.5% over the remaining equal
consecutive balances. We reconded a gain for the transaction of
approximately to Ps.238 million.
77
La Esmeralda
On July
20, 2017, we entered into a purchase-sale agreement for all of
“La Esmeralda” establishment, consisting of 9,352
hectares devoted to agricultural and cattle farming activities in
the 9 de Julio district, Province of Santa Fe, Argentina. On June
25, 2018, we executed the deed and delivered of the property. The
amount of the transaction was set at US$ 19 million, of which US$7
million have been already paid. The balance, guaranteed with a
mortgage over the property, will be collected in four equal
installments ending in April 2022, accruing an annual interest of
4% on the balances. The gain from the sale amounts approximately to
Ps.410 million.
Araucária
In
March 2017, Brasilagro sold 274 hectares of the establishment
Araucária, a farmland located in the municipality of Mineiros,
of which 196 are developed and productive hectares. The sale price
amounts to 1,000 bags of soybeans per hectare, or R$13.2 million
(equivalents to Ps.48 million), of which so far 39,254 bags of
soybeans were paid upon closing (equivalent to R$2.4 million) and
we agree that the balance would be paid in four equal annual
installments. The Company has recognized gains of Ps.29.9 million
as result of this transaction.
In May
2017, Brasilagro sold 1,360 hectares of Araucária, of which
918 are developed and productive hectares. The sale price was set
at 280 bags of soy per hectare or R$ 17 million (equal to Ps. 67
million). Approximately 35% of the transaction price were paid upon
closing and we agreed that the remaining balance would be payable
in five equal annual installments. The Company has recognized gains
of Ps. 37.4 million as result of this transaction.
On May
3, 2018, Brasilagro sold 956 hectares of Araucaria, of which 660
arable hectares, for an amount equal to 1,208 soybean bags per
arable hectare or R$ 66.2 million (equal to Ps. 447.2 million or
R$/ha. 93,356). The company has recognized gains of Ps. 258 million
as result of this transaction.
Cuatro Vientos
On June
30, 2017, Yatay Agropecuaria S.A. sold to a third party the
establishment “Cuatro Vientos,” consisting of 2,658
hectares devoted to sugarcane and agricultural activity, located in
the Department of Santa Cruz in Bolivia. The transaction amounted
to US$14.23 million (US$/ha. 5,280) (equal to Ps.222
million).
To
date, US$7.42 million have been paid, with the remaining balance of
US$6.85 million being secured by a first lien mortgage. The
outstanding balance becomes due on December 28, 2017 . During the
year 2017 the Company recorded a profit before tax of US$4.5
million (equivalents to Ps.76.2 million) as result of this
transaction.
Finca Mendoza
On June
8, 2017, Cresud and Zander Express S.A. (co-owners with 40% and 60%
interests, respectively) executed a conveyance deed with Simplot
Argentina S.R.L. for the sale of 262 hectares of the plot of land
located in Luján de Cuyo, Province of Mendoza. The total
purchase was US$2.2 million, which were fully paid upon execution
of the deed. The Company has recognized gains of Ps.11.8 million as
result of this transaction.
Jatobá
In June
2017, Brasilagro sold 625 hectares of the property Jatobá
located in Jaborandi, Bahía. The transaction price was set at
amount equal to 300 bags of soy per hectare or R$10.1 million
(equal to Ps.41 million). So far, R$877 million have already been
paid, with the outstanding balance being payable in five equal
annual installments starting in July 2017. The Company has
recognized gains of Ps.32.1 million as result of this
transaction.
On June
13, 2018, Brasilagro entered into a contract for the sale of a
fraction of 9,784 hectares (7,485 hectares of agro-cultivable land)
of the Jatobá Establishment, a rural property located in the
Municipality of Jaborandi-BA, for a value of 285 bags per hectare
or R$ 177.8 million (approximately R$ 18,172/ hectare). On July 31,
2018, the buyer made the payment of the first quota of 300,000 bags
of soybean, for the value of R$23.2 million, in accordance with the
conditions set forth in the contract, obtaining the transfer of
possession and enabling the recognition of the income on behalf of
the Company. The remaining balance will be paid in seven annual
installments.
78
El Invierno and La Esperanza
On July
5, 2016, Cresud sold “El Invierno” and “La
Esperanza” consisting of 2,615 hectares of agricultural
activity located in Rancul, Province of La Pampa. The total
consideration for the transaction was set at US$6 million, of which
US$5 million have been paid while the remaining balance of US$1
million, secured by a mortgage on the property, will be paid in
five equal, consecutive, annual installments, with the last one
being due in August 2021. The Company has recognized gains of Ps.
71.6 million as result of this transaction.
São José
In
February 2017, Brasilagro entered into a sale and sharecropping
agreement for a farmland property located in the municipality of
São Raimundo das Mangabeiras, in the state of Maranhão.
The sale agreement consists in the acquisition of 17,566 hectares,
of which 10,000 are developed and productive lands, that will be
used for farming. The remaining 7,566 hectares consist of permanent
conservation and legal reservation areas. The purchase price is
R$100 million, which will be paid in full upon fulfillment of
certain prior conditions by sellers. The sharecropping consists of
15,000 hectares of cultivable and developed land, already planted
mostly with sugar cane. The agreement is valid for 15 years and
renewable for another 15-years.
Cresca disposal
In
December 2016, the shareholders of Cresca, Carlos Casado and
Brasilagro, one of our subsidiaries, started a corporate
reorganization and split-up of assets of this joint venture. On
June 8, 2017, the Shareholders’ Meeting approved the
reorganization plan
and division of assets
.
In February 2018, the
disposal of assets of Cresca was completed. As a result, the
Company, through Brasilagro, disposed their interest in the joint
venture and subsequently acquired a group of assets.
We own
and manage those asstes through Palmeiras and Morotí
(successor companies), both Paraguayan companies
and
subsidiareis of Brasilagro
, which continued the exploitation
previously carried out by Cresca. Cresca continues to exist with
the remaining assets consisting of cash and a receivable to cover
the expenses related to the disposal. The Company, through
Brasilagro, continues to hold a 50% interest in this residual
entity.
The
Company has recognized a gain of Ps.510 million as result of this
transaction, that has been recognized in the line “Other
operating results, net".
The
following table summarizes , the fair values of the assets acquired
and the liabilities assumed at acquisition date:
|
|
February 2018
|
|
|
In million of Ps.
|
|
Assets
|
941
|
|
Cash
and cash equivalents
|
1
|
|
Trade
and other receivables
|
27
|
|
Income
tax credit
|
12
|
|
Property,
plant and equipment
|
901
|
|
Liabilities
|
172
|
|
Trade
and other payables
|
11
|
|
Debts
with related parties
|
121
|
|
Taxes
payable
|
40
|
|
Equity
|
|
|
Currency
translation adjustment
|
9
|
|
Total fair value of identifiable assets and assumed
liabilities
|
778
|
Sale of FyO shares
On
November 9, 2017, Cresud sold to a non-related party 154,929 shares
of its subsidiary FyO, representing 9.49% of FyO’s capital
stock for an amount of US$ 3.04 million, which was paid . As a
result, Cresud reduced its equity interest in FyO from 59.59% to
50.10%.
This
transaction was accounted in equity, resulting in an increase in
non-controlling interest of Ps.10.2 million and an increase in the
equity holders of the parent of Ps.43 million.
79
Urban
properties and investments business
Operation Center in Argentina
Sale of ADS and shares from IRSA CP
During
October 2017 and February 2018, IRSA and its subsidiaries completed
the sale in the secondary market of 10,420,075 ordinary shares of
IRSA CP, par value Ps.1 per share, represented by American
Depositary Shares (“ADSs”), of four ordinary shares
each, which represents nearly 8.27% of IRSA CP´s capital, for
a total amount of Ps.2,489 million (US$ 140 million). After the
transaction, IRSA’s direct and indirect interest in IRSA CP
was reduced to approximately 86.34%. This transaction was accounted
in equity as an increase in the equity attributable to the parent
for an amount of Ps.172 million, net of taxes.
Acquisition of Philips Building
On June
5, 2017, the Company through IRSA CP acquired the Philips Building
located in Saavedra, Autonomous City of Buenos Aires, next to the
DOT Shopping Mall. The building has a potential construction area
of 7,755 square meters and is intended for office development and
lease. The acquisition price was US$ 29 million, which was fully
paid up as of June 30, 2017. Furthermore, IRSA CP has signed a
bailment contract with the seller for a term of 7 months and 15
days, which had expired automatically on January 19,
2018.
Operations Center in Israel
Purchase of DIC shares by Dolphin
On
November 22, 2017, all of DIC’s shares held by IDBD
(106,780,853 shares) were transferred to Dolphin IL., wholly owned
by Dolphin, which issued the debenture to IDBD, and a total of NIS
70 million as purchase price. Additionally, within the framework of
the completion of the transaction, as part of the collateral which
was provided by the buyer to IDB, in connection with the
debentures, Dolphin IL. deposited 9,636,097 DIC shares with I.B.I.
Trust Management, which serves as the trustee for the debenture on
behalf of IDBD and Dolphin IL, in accordance with the
debenture’s terms.
It
should be noted that the financial position of IDBD and its
subsidiaries at the Operations Center in Israel does not affect the
financial position of the Company and subsidiaries at the
Operations Center in Argentina. In addition, the commitments and
other covenants resulting from IDBD’s financial debt do not
have impact on the Company since such indebtedness has no recourse
against us and it is not granted by IRSA’s
assets.
On May
6, 2018, IDBD agreed on a SWAP on shares of DIC held by third
parties with a banking entity not related to the group for a period
of one year with the possibility of extending an additional year.
The total of shares subject to the agreement is 6,020,811 and the
value of the swap at the time of subscription is on average NIS
10,12 per share, approximately NIS 60 million (approximately Ps.342
million on the day of the transaction). The present transaction
will be settled in cash for the difference between the quotation at
the end of the agreement and the agreed price. For this
transaction, we have not increased its participation in DIC for
this transaction and granted guarantees on certain financial
assets.
As of June 30,
2018 we owned indirectly 76.57% of DIC and
as of the date of
this annual report we owned indirectly 77.92% of DIC, for more
information see "Recent Developments."
For
additional information please see “Operations Center in
Israel” .
Purchase of IDBD shares to IFISA
On
December 2017, Dolphin Netherlands BV, has executed a stock
purchase agreement for all of the shares that IFISA held of IDBD,
which amounted to 31.7% of the capital stock. In this way, as of
that date, Dolphin holds the 100% of IDBD's shares.
The
transaction was made at a price of NIS 398 million (equivalent to
NIS 1.894 per share and approximately to Ps.1,968 million as of the
date of the transaction). As consideration of the transaction all
receivables from IFISA to Dolphin have been canceled plus a payment
of US$ 33.7 million (equivalents to Ps.588 million as of the date
of the transaction). This transaction was accounted in equity as a
decrease in the equity attributable to the parent for an amount of
Ps.1,853 million.
80
Partial sale of Clal
On May
1, 2017, August 30, 2017, January 1, 2018 and May, 2018 continuing
with the instructions given by the Commissioner of Capital Markets,
Insurance and Savings of Israel, IDBD has sold in each of the
abovementioned dates a 5% of its stake in Clal through a swap
transaction. The consideration was set at an amount of
approximately NIS 644.5 million (equivalent to approximately
Ps.3,228 million considering exchange date at each date). After the
completion of the transaction, IDBD’s interest in Clal was
reduced to 34.8% of its share capital.
Agreement for the acquisition of New Pharm
On
April 6, 2017, Shufersal entered into an agreement (the
"agreement") with Hamashbir 365 Holdings Ltd. ("the seller" or
"Hamashbir") for the purchase of the shares of New Pharm Drugstores
Ltd. ("New Pharm"), representative of 100% of that Company’s
share capital ("the shares sold"). On December 20, 2017, the
transaction was completed and Shufersal became the sole shareholder
of New Pharm prior to the sale of a Shufersal store and approval of
the transaction by the antitrust commission. The price paid, net of
the respective adjustments to the transaction price, was NIS 126
million (equivalent to Ps.630 million at the date of the
transaction).
The
following table resumes consideration and fair value of the
acquired assets and the liabilities assumed:
|
|
December 2017
|
|
Fair value of identifiable assets and assumed
liabilities:
|
Million
of Ps.
|
|
Properties,
plant and equipment
|
200
|
|
Inventories
|
380
|
|
Trade
and other receivables
|
335
|
|
Cash
and cash equivalents
|
25
|
|
Borrowings
|
(260
)
|
|
Trade
and other payables
|
(930
)
|
|
Employee
benefits
|
(25
)
|
|
Provisions
|
(15
)
|
|
Total net identifiable assets
|
(290
)
|
|
Goodwill
(pending allocation)
|
920
|
|
Total
|
630
|
Revenues of New
Pharm recognized as of June 30, 2018 were not significant. If New
Pharm had been acquired since the beginning of the year, the
Company's consolidated statement of income for the year ended June
30, 2018 would show a net pro-forma discontinued operations result
of Ps.12,189 million.
Increase of interest in Cellcom
On June
27, 2018, Cellcom had raised its capital stock for a gross total of
NIS 280 million (approximately Ps.2,212 million as of that date).
DIC acquired 6,314,200 shares for a total amount of NIS 145.9
million (approximately Ps.1,152 million). In addition, on June 26,
2018, DIC engaged in a swap transaction with a bank of 1,150,000
shares of Cellcom from third parties (the “Swap
Shares”). The following are the main characteristics of the
transaction:
● DIC has the
votes rights but not the economics rights over the shares under the
swap transaction,
● The
maturity of the swap is 90 day
● The impact
of the swap transaction is the difference of the price per share
between the subscription date and the date of the
maturity.
After
the abovementioned transactions the equity interest that DIC has on
Cellcom rose from 42.07% to 43.14% and the percentage of voting
rights rose from 45.45% to 46.16% without consideration of the swap
transaction.
81
On
September 26, 2018, DIC extended the Swap Transaction in connection
with 200,000 of the Swap Shares only, until December 30, 2018,
under identical conditions, and at a price per Swap Share which was
the closing price of Cellcom stock on the Tel Aviv Stock Exchange
Ltd., on the last trading day before the extension of the Swap
Transaction, in the amount of 24.75 per share.
Negotiations between Israir and Sun d’Or
On June
30, 2017 IDB Tourism was at an advanced stage of negotiations with
Sun d’Or International Airlines Ltd. (“Sun
d’Or”), a subsidiary of El Al Israel Airlines Ltd. ("El
Al"), and on July 2, 2017 an agreement was signed, which has been
rejected by the antitrust commission on January 10,
2018.
As a
consequence of this process, the Company´s Financial
Statements as of June 30, 2018 and 2017 present the investment in
Israir as assets and liabilities held for sale, and a loss of
nearly NIS 56 million (approximately equivalent to Ps.231 million
as of December 31, 2016 when it was reclassified to discontinued
operation), as a result of measuring these net assets at the
estimated recoverable value. The Company is evaluating the reasons
for the objection and has appealed this situation. The Company
evaluated that the criteria to continue classifying the investment
as discontinued operations as established by IFRS 5 are
maintained.
Changes in interest in Shufersal
During
the fiscal year ended June 30, 2017, the Company, through DIC and
several transactions, increased its interest in Shufersal capital
stock by 7.7% upon payment of a net amount of NIS 235 million
(equivalent to approximately Ps.935 million) and in March 2017, DIC
sold 1.38% of Shufersal in an amount of NIS 50 million (equal to
Ps.210 million as of that date). Additionally, on December 24,
2017, DIC sold Shufersal shares, decreasing its stake from 53.30%
to 50.12%. The consideration with respect to the sale of the shares
amounted to NIS 169.5 million (equivalent to Ps.847 million on the
day of the transaction). Both transactions were accounted for as an
equity transaction generating an increase in the equity
attributable to the controlling shareholder in the amount of Ps.182
million and Ps.244 million, respectively.
On June
16, 2018, DIC announced the sale of a percentage of its stake in
Shufersal to institutional investors. The sale was completed on
June 21, 2018. The percentage sold amounted to 16.56% and the net
amount charged was approximatelyNIS 848 million (equivalent to
Ps.6,420 million on the day of the transaction), consequently DIC
lost control of Shufersal by which the Company deconsolidated the
subsidiary on that date.
Below
are the details of the sale:
|
|
Million
of Ps.
|
|
Cash
received
|
6,420
|
|
Remediation
of the fair value of the remaining inversion
|
13,164
|
|
Total
|
19,584
|
|
Net
assets disposed including goodwill
|
(8,501
)
|
|
Gain from the sale of a subsidiary, net of taxes (*)
|
11,083
|
(*)
Includes Ps.2,643 million as a result of the sale and Ps.8,440
million as a result of the remediation of the fair value of the new
stake.
The
following table details the net assets disposed:
82
|
|
June 30, 2018
|
|
|
Million
of Ps.
|
|
Investment
properties
|
4,489
|
|
Properties,
plant and equipment
|
29,001
|
|
Intangible
assets
|
7,108
|
|
Investments
in associates and joint ventures
|
401
|
|
Restricted
assets
|
91
|
|
Trade
and other receivables
|
12,240
|
|
Investments
in financial assets
|
2,846
|
|
Derivative
financial instruments
|
23
|
|
Inventories
|
6,276
|
|
Cash
and cash equivalents
|
5,579
|
|
TOTAL ASSETS
|
68,054
|
|
Borrowings
|
21,310
|
|
Deferred
income tax liabilities
|
2,808
|
|
Trade
and other payables
|
23,974
|
|
Provisions
|
447
|
|
Employee
benefits
|
1,279
|
|
Salaries
and social security liabilities
|
2,392
|
|
Income
tax and MPIT liabilities
|
8
|
|
TOTAL LIABILITIES
|
52,218
|
|
Non-controlling
interest
|
7,335
|
|
Net assets disposed including goodwill
|
8,501
|
Share-holding increase in DIC
On
September 23, 2016, Tyrus,
a subsidiary of the
Company,
acquired 8,888,888 of DIC’s shares from IDBD
for a total amount of NIS 100 million (equivalent to Ps.401
million), which represent 8.8% of the Company’s outstanding
shares at such date.
During
March 2017, IDBD exercised all of DIC’s Series 5 and 6
warrants for nearly NIS 210 million (approximately equivalent to
Ps.882 million), thereby increasing its direct interest in DIC to
nearly 70% of such company’s share capital as of that date
and the Company's equity interest to 79.47%. Subsequently, third
parties not related to the Company, exercised their warrants, thus
diluting the Company’s interest in DIC to 77.25%. This
transaction was accounted for as an equity transaction generating a
decrease in equity attributable to the controlling shareholder in
the amount of Ps.262 million.
Sale of Adama
On
August 2016, Koor a subsidiary of DIC, signed an agreement with
ChemChina to obtain the 40% of the shares of Adama held by Koor.
The price of the transaction included a payment in cash of US$ 230
million plus the total repayment of the non-recourse loan and its
interests, which had been granted to Koor by a Chinese bank. On
November 22, 2016, the sale transaction was finalized and Koor
received cash in the amount of US$ 230 million. As of June 30,
2017, the Company recorded a gain of Ps.4,216 million pursuant to
the sale. Our share in the results of Adama were retrospectively
classified as discontinued operations in the Company’s
Consolidated Statements of Income as from July 17,
2016.
Partial sale of equity interest in PBC
During
the fiscal year ended June 30, 2017, DIC sold 12% of its equity
interest in PBC for a total consideration of NIS 217 million
(approximately equivalent to Ps.810 million); as a result,
DIC’s interest in PBC has declined to 64.4%. This transaction
was accounted for as an equity transaction generating an increase
in equity attributable to the controlling shareholder in the amount
of Ps.22 million.
Partial sale of equity interest in Gav Yam
On
December 5, 2016, PBC sold 280,873 shares of its subsidiary Gav-Yam
Land Corporation Ltd. for an amount of NIS 391 million (equivalent
to Ps.1,616 million). As a result of this transaction, the equity
interest has decreased to 55.06%. This transaction was accounted
for as an equity transaction generating an increase in equity
attributable to the controlling shareholder in the amount of Ps.117
million.
Capital Expenditures
Our
capital expenditures totaled Ps. 9,061 million, Ps. 6,506 million
and Ps. 2,483 million for the fiscal years ended on June 30, 2018,
2017 and 2016, including other property and equipment acquired in
business combinations.
Our
capital expenditures consisted in the purchase of real estate and
farms, acquisition and improvement of productive agricultural
assets, completion of building a shopping center, construction of
real estate and acquisition of land reserves.
Our capital
expenditures for the new fiscal year will depend on the prices of
real estate, land for agriculture and cattle as well as the
evolution of commodity prices
.
83
Fiscal
Year Ended June 30, 2018
During
the fiscal year ended June 30, 2018, in our Urban properties and
investments business we invested Ps.7,597 million (including
Ps.2,127 million from Shufersal, whose assets were deconsolidated
due to the loss of control and Ps.324 million from business
combination), as follows: (a) acquisitions and improvements of
property, plant and equipment for Ps.4,201 million, primarily i)
Ps.1,084 million in buildings and facilities, mainly in
supermarkets in Israel through Shufersal, ii) Ps.971 million in
communication networks, iii) Ps.1,915 million in machinery and
equipment and others (which includes Ps.1,031 million invested
through Shufersal); iv) improvements in our hotels Sheraton
Libertador, Llao Llao and Intercontinental (Ps. 4 million, Ps. 6
million and Ps. 4 million, respectively), and v) Ps.217 million
related with business combination (mainly from the acquisition of
New Pharm); (b) improvements in our rental properties of Ps.722
million, primarily in our Operations Center in Israel; (c) the
development of properties for Ps.2,240 million, mainly in our
Operations Center in Israel; (d) Ps.327 million related to the
acquisition of land reserves, and (e) Ps.107 million related to
business combination.
In
addition, our main investments in our Agriculture business during
the fiscal year 2018 were Ps.1,464 million mainly due (a)
acquisition and development of owner occupied farmland for Ps.1,126
million (Ps.1,033 million of subsidiary Brasilagro, including
Ps.899 related to business combination with Cresca); (b) Ps.219
million in bearer plant; (c) Ps.58 million in other building and
facilities; (d) Ps.42 million machinery and equipment: (e) Ps.11
million in vehicles; (f) Ps.4 million in furniture and supplies;
and (g) Ps.4 million destined to suppliers advances for proprieties
acquisitions.
Fiscal
Year Ended June 30, 2017
During
the fiscal year ended June 30, 2017, in our urban properties and
investments business we invested Ps.5,482 million (including Ps.
1,434 million from Shufersal, whose assets were deconsolidated due
to the loss of control), mainly as follows: (a) Ps. 469 million
related with the acquisition of the Phillips building adjacent to
the shopping mall DOT; (b) improvements in our hotels Sheraton
Libertador, Llao Llao and Intercontinental (Ps. 5 million, Ps. 8
million and Ps. 4 million, respectively); (c) Ps. 1,298 million in
machinery and equipment and others (which include Ps. 688 million
invested through Shufersal); (d) Ps. 1,390 million related with the
development of properties; (e) Ps. 100 million destined to the
improvement of our shopping malls; (f) Ps. 57 million related to
the acquisition of land reserves; (g) Ps. 635 million destined to
improvements in our offices and other rental properties; (h) Ps.
721 million related to investment in buildings and facilities,
mainly within the Operations Center in Israel (which include Ps.
644 million invested through Shufersal); and (i) Ps. 711 million in
communication networks.
In
addition, our main investments in our Agriculture business during
the fiscal year 2017 were Ps.1,024 million, mainly due (a)
acquisition and development of owner occupied farmland for Ps.731
million (including Ps.652 million of subsidiary Brasilagro); (b)
Ps.183 million in bearer plant; (c) Ps.55 million in other building
and facilities; (d) Ps.35 million in machinery and equipment; (e)
Ps.13 million in vehicles; (f) Ps.1 million in furniture and
supplies; and (g) suppliers advances for proprieties acquisitions
for Ps.6 million.
Fiscal
Year Ended June 30, 2016
During
the fiscal year ended June 30, 2016, in our urban properties and
investments business we invested Ps. 2,369 million (without
considering Ps. 44,690 million related to addition of assets due to
the business combination with IDBD and including Ps. 550 million
from Shufersal, whose assets were deconsolidated due to the loss of
control), corresponding Ps. 585 million to discontinued operations
and Ps. 1,784 million to continuing operations, as follows: (a)
acquisitions and improvements of property, plant and equipment of
Ps. 1,172 million, primarily i) Ps. 379million in buildings and
facilities (which include Ps. 374 million invested through
Shufersal), ii) Ps. 310 million in communication networks, and iii)
Ps. 291 million in machinery and equipment; (b) improvements in our
rental properties of Ps. 260 million, primarily in our shopping
malls in the Operations Center in Argentina; and (c) the
development of properties for Ps. 919 million, mainly in our
Operations Center in Israel
In
addition, our main investments in our Agriculture business during
the fiscal year 2016 were Ps.114 million, mainly due (a)
acquisition and development of owner occupied farmland for Ps.65
million (including Ps.37 million of subsidiary Brasilagro), (b)
Ps.7 million in machinery and equipment, (c) Ps.3 million in
vehicles, (d) Ps.14 million in other building and facilities and,
(e) Ps.25 million in bearer plants.
84
Recent
Developments
Cresud’s Recent Developments
Own shares purchase plan
On July 27, 2018, we announced the ending of the own shares
purchase plan having acquired the equivalent to 20,656,215 ordinary
shares, representing almost 99.9% of the approved program and 4.1%
of our share capital.
Shareholders
’
Meeting
Our 2018 annual meeting of shareholders was held on October 29,
2018 and it was decided, among others, to:
●
Allocate Ps.4,983,567,387 of net income for the fiscal year ended
June 30, 2018 to the constitution of a special reserve that may be
used for new projects according to the business development plan of
the Company, or for the distribution of dividends;
●
Distribution
of own shares in portfolio to the shareholders in proportion to
their shareholdings for up to the amount of 20,656,215 ordinary
shares.
●
Re-elect regular and alternate directors due to expiration of
term;
●
Allocation of Ps. $9,646,487,544 of net income for fiscal year
ended June 30, 2017 which hadn’t been allocated, to the
constitution of a special reserve that may be allocated to new
projects according to the business development plan of the Company,
or to the distribution of dividends.
●
Approve of remuneration to the board of directors for the amount of
Ps. 140,599,334 for the fiscal year ended June 30,
2018.
●
Approve of remuneration to the Audit Committe for the amount of Ps.
900,000 for the fiscal year ended June 30, 2018
●
Amend
Articles Eighth (in relation to the Issuance of Shares), Eleventh
(as regards Negotiable Obligations), and Twenty-Second (as regards
the Audit Committee) of the By Laws in order to adapt to the new
legal provisions.
●
(i) Renew of
delegation to the board of directors of the broadest
powers to determine all the terms and
conditions not expressly approved by the shareholders’
meeting as well as the time, amount, term, placement method and
further terms and conditions of the various series and/or tranches
of notes issued under the Global Note Program for the issuance of
simple, non-convertible notes, secured or not, or guaranteed by
third parties, for a maximum outstanding amount of up to
US$500,000,000 (five hundred million US dollars) (or its equivalent
in any other currency) approved by the shareholders’ meeting
held on October 31, 2012 and renewed for a five years term by the
shareholders’ meeting held on October 31, 2017 (the
“Program”); (ii) authorize for the board of directors
to (a) approve, execute, grant and/or deliver any agreement,
contract, document, instrument and/or security related to the
creation of the program and/or the issuance of the various series
and/or tranches of notes thereunder; (b) apply for and secure
authorization by the Argentine Securities Commission to carry out
the public offering of such notes; (c) as applicable, apply for and
secure before any authorized securities market of Argentina and/or
abroad the authorization for listing and trading such notes; and
(d) carry out any proceedings, actions, filings and/or applications
related to the creation of the program and/or the issuance of the
various series and/or tranches of notes under the program; and
(iii) authorize for the board of directors to sub-delegate the
powers and authorizations referred to in items (i) and (ii) above
to one or more of its members.
Payment of dividends by Brasilagro
At
Brasilagro´s shareholders’ meeting held on October 16,
2018, the shareholders of Brasilagro approved dividends in the
amount of Rs.41.0 million, or Rs. 0.76 (or US$0.21) per share. Such
dividends shall be paid to shareholders on November 6, 2018, to
holders of record of Brasilagro´s shares as of October 16,
2018.
Payment of dividends by IRSA
At IRSA´s shareholders’ meeting held on October 29,
2018, IRSA´s shareholders approved a
dividend payable with shares of IRSA CP for up to
Ps.1,412 million to be distributed to IRSA´s shareholders
pro-rata of their interest in IRSA. The dividend shall be paid to
the shareholders on November 12, 2018, to holders of record of
IRSA´s shares as of November 9,
2018
.
IRSA’s Recent Developments
Shareholders’ Meeting
IRSA`s
2018 annual meeting of shareholders was held on October 29, 2018
and it was decided, among others:
●
Allocate
Ps. 4,983,567,387 of net income for the fiscal year ended June 30,
2018 to: (i) Payment of a dividend in shares of IRSA CP for up to a
total amount of Ps.1,412 million to be distributed to our
shareholders pro-rata of their interest in IRSA; and (ii) The
constitution of a special reserve that may be used for new projects
according to the business development plan of IRSA, to the
distribution of dividends, or for the cancellation of other
commitments, delegating the Board of directors the ability to apply
such reserve to any of such purposes;
●
Allocate
Ps.16,538,338,620 of net income for fiscal year ended June 30, 2017
which hadn’t been used, to the constitution of a special
reserve that may be used for to new projects according to the
business development plan of IRSA, or to the distribution of
dividends;
●
Approve
remuneration to the board of directors for the amount of Ps.
140,599,334 for the fiscal year enden June 30, 2018;
●
Approve
remuneration to the Supervisory Committe for the amount of Ps.
900,000 for the fiscal year ended June 30, 2018
●
Re-elect
regular and alternate directors due to expiration of
term;
●
Amend
Section Eighth (in relation to the Issuance of Shares), Ninth (as
regards Tender Offers), Eleventh (as regards Negotiable
Obligations), and Twenty-Second (as regards the Audit Committee) of
the By Laws.
●
(i)
Renew the delegation to the board of directors of the broadest
powers to determine all the terms and conditions not expressly
approved by the shareholders’ meeting as well as the time,
amount, term, placement method and further terms and conditions of
the various series and/or tranches of notes issued under the Global
Note Program for the issuance of simple, non-convertible notes,
secured or not, or guaranteed by third parties, for a maximum
outstanding amount of up to US$350,000,000 (three hundred and fifty
million US dollars) (or its equivalent in any other currency)
approved by the shareholders’ meeting held on October 31,
2017 (the “Program”); (ii) authorize for the board of
directors to (a) approve, execute, grant and/or deliver any
agreement, contract, document, instrument and/or security related
to the creation of the program and/or the issuance of the various
series and/or tranches of notes thereunder; (b) apply for and
secure authorization by the Argentine Securities Commission to
carry out the public offering of such notes; (c) as applicable,
apply for and secure before any authorized securities market of
Argentina and/or abroad the authorization for listing and trading
such notes; and (d) carry out any proceedings, actions, filings
and/or applications related to the creation of the program and/or
the issuance of the various series and/or tranches of notes under
the program; and (iii) authorize for the board of directors to
sub-delegate the powers and authorizations referred to in items (i)
and (ii) above to one or more of its members.
●
Approve
(i) a budget of up to Ps. 12,184,000 for the hiring of specialists
to collaborate with the development of the Compliance and Corporate
Governance program; and (ii) approve a budget of up to Ps. 300,000
to apply to certain advisory and consulting tasks that will be
required during the next fiscal year for a more exhaustive control
of the subsidiaries of IRSA
.
Operations Center in Argentina
Acquisition of Maltería Hudson by IRSA CP
In July
2018, IRSA CP announced the acquisition, of a property of 147,895
square meters of surface which includes a building of approximately
40,000 sqm known as “Maltería Hudson”, located in
the intersection of Route 2 and Buenos Aires - La Plata highway, in
the City of Hudson, Province of Buenos Aires. The price of the
operation was set at the amount of US$ 7.0 million.
Moreover, we
entered into an agreement to buy the two adjoining properties to
“La Maltería” of approximately 49,000 sqm and
57,000 sqm respectively, for a total amount of
US$720,825.
In
addition, IRSA CP granted an option ta a non-related third party to
buy from us between 15% to 30% of the outstanding shares of
“La Maltería S.A.” at the acquisition price plus a
certain interest for a six month period.
The
purpose of this acquisition is the future development of a
mixed-use project.
Operations Center in Israel
Extension of Swap Transaction in Connection with
Cellcom
In
connection to the sale of shares of Cellcom, DIC entered into a
swap financial transaction (the “Swap Transaction”)
with a banking institution, in connection with 1,150,000 ordinary
shares with a par value of NIS 0.01 each of Cellcom. On September
26, 2018, DIC extended such Swap Transaction in connection with
200,000 of additional shares, until December 30, 2018, under
identical conditions, and at a price per share which was the
closing price of Cellcom stock on the TASE on the last trading day
before the extension of the Swap Transaction, in the amount of
24.75 per share. It is noted that the Swap Transaction is a
differential transaction only, in which the Swap Shares will be
owned by DIC, although it will not be entitled to any returns in
respect thereof (if any). In accordance with international
accounting standards, the aforementioned transaction will have no
impact on DIC’s results, save for the payment of transaction
costs in a negligible sum.
IDBD’s Agreement with Bank Hapoalim, with regard to its
holdings in Clal Insurance Enterprises Holdings Ltd.
In
connection with a shareholders agreement between IDBD and Bank
Hapoalim Ltd. (“Bank Hapoalim”), with respect to
approximately 9.47% of the shares of Clal held by Bank Hapoalim, in
which, inter alia, IDBD was given right of first refusal regarding
the sale of the shares of Clal by Bank Hapoalim, IDBD reported on
October 16, 2018, that IDBD and Bank Hapoalim signed an agreement
pursuant to which IDBD was given a period of time to find several
buyers with whom Bank Hapoalim will engage, subject to any
applicable law, in transactions for the sale of (all of) the sold
shares, at a price of NIS 62 per share, in over the counter
transactions which will not be made subject to conditions, and
which will be completed on a single date, and no later than
November 10, 2018. If the transaction for the sale of shares of
Clal has not been completed by November 10, 2018, Bank Hapoalim
will be entitled to sell them. It was further determined in the
agreement that the shareholders agreement will be canceled on the
earlier of either the sale date or November 10, 2018.
It is
noted that IDBD is evaluating the possibility of engaging in swap
transaction(s) with banking institutions in connection with the
sold shares, under the same principles which applied to previous
swap transactions which IDBD performed with respect to shares of
Clal which were held by it in the months May 2017, August 2017,
January 2018, May 2018 and August 2018 (together, approximately 25%
of the shares of Clal).
IDBD
clarified that there is no certainty regarding the execution of the
aforementioned transaction, including regarding the sale of the
sold shares in accordance with the agreement, and the performance
of swap transactions in connection therewith by IDBD.
As of October 17,
2018, IDBD’s holdings in Clal amounts to approximately 29.8%
(of which, approximately 24.8% through the trustee), and in swap
transactions with respect to the shares of Clal - a rate of
approximately 25%.
85
Sale of Clal’s shares
On
September 4, 2018, the Company informed that pursuant to the
instructions given by the Commissioner of Capital Markets,
Insurance and Savings of Israel to the Trustee regarding the
guidelines related to the sale of Clal shares, on August 30, 2018,
IDBD sold 5% of its stake in Clal through a swap transaction, in
accordance with the same principles that applied to the swap
transaction made and informed to the market on 2017 and 2018. The
transaction was set at an amount of approximately NIS 173.0
million. After the completion of the transaction, IDBD’s
interest in Clal was reduced to 29.8% of its share capital. In
addition, IDBD is entitled to a potencial result, in the framework
of swap transactions, which amounts to 25% of Clal’s
shares.
Agreement to sell plot of land in USA
In
August 2018, a subsidiary of IDBG signed an agreement to sell a
plot of land next to the Tivoli project in Las Vegas for a
consideration of US$ 18 million (approximately Ps. 673 million). As
of June 30, 2018 the book value of the plot of land was classified
as assets held for sale according to IFRS 5
conditions.
Acquisition of DIC´s shares
On July
6, 2018, we acquired, through a subsidiary, 2,062,000 shares of
DIC, representing 1.36% of its share capital, for an amount of NIS
20,001,400, Following the completion of the transaction, our direct
and indirect stake in DIC increased to to 77.92% of its share
capital.
86
B.
BUSINESS OVERVIEW
General
We are
a leading Latin American agricultural company engaged in the
production of basic agricultural commodities with a growing
presence in the agricultural sector of Brazil, through our
investment in Brasilagro, as well as in other Latin American
countries. We are currently involved in several farming activities
including grains and sugarcane production, cattle raising and milk
production. Our business model focuses on the acquisition,
development and exploitation of agricultural properties having
attractive prospects for agricultural production and/or value
appreciation and the selective sale of such properties where
appreciation has been realized. In addition, we lease land to third
parties and perform agency and agro-industrial services, including
a meat packing plant. Our shares are listed on ByMA and the
NASDAQ.
We are
also directly and indirectly engaged in the real estate business
through our subsidiary IRSA and its subsidiaries and joint
ventures, one of Argentina’s leading real estate companies.
IRSA is engaged in the development, acquisition and operation of
shopping malls, premium offices, and luxury hotels in Argentina,
and owns selective investments outside Argentina, mainly through
IDBD and DIC, two of the largest and most diversified investment
groups of Israel. IRSA’s shares are listed on the ByMA and
the NYSE. We own 63.74% of the outstanding common shares of
IRSA.
During
fiscal years ended June 30, 2018, 2017 and 2016, we had
consolidated revenues of Ps.38,986 million, Ps.30,746 million and
Ps.15,622 million, and consolidated profit from operation, before
financing and taxation, of Ps.29,361 million, Ps.8,351 million and
Ps.20,132 million, respectively. During the fiscal years ended June
30, 2017 and June 30, 2018, our total consolidated assets increased
46.5% from Ps.241,446 million to Ps.353,770 million, and our
consolidated shareholders’ equity increased 53.2% from
Ps.49,173 million to Ps.75,321 million.
Following the
acquisition of IDBD through our subsidiary IRSA, we decided to
report our operations based on our main business lines:
“Agricultural Business” and “Urban Properties and
Investments Business” derived from our subsidiary IRSA, which
is in turn subdivided into two operations centers:
“Argentina” (including the businesses in Argentina and
the international investments in the Lipstick Building in New York
and the Condor Hospitality Trust Hotel REIT) and
“Israel” (including IDBD).
As from
fiscal year 2018 the CODM reviews the operating income/loss of each
business excluding the amounts related to management fees, being
such amount reviewed at an aggregate level outside each business.
Additionally, the CODM reviews certain corporate expenses
associated with each business in an aggregate manner and separately
from each of the segments, such expenses have been disclosed in the
"Corporate" segment of each operation center. Segment information
for the years 2017 and 2016 has been recast for the purposes of
comparability with the present year.
Our
Agricultural business is further comprised of four reportable
segments:
● The
“Agricultural production” segment consists of planting,
harvesting and sale of crops as wheat, corn, soybeans, cotton and
sunflowers; breeding, purchasing and/or fattening of free-range
cattle for sale to slaughterhouses and local livestock auction
markets; breeding and/or purchasing dairy cows for the production
of raw milk for sale to local milk and milk-related products
producers; agricultural services; leasing of the Company's farms to
third parties;
and
planting, harvesting and sale of sugarcane. Our Agricultural
production segment had assets of Ps.11,222 million and Ps.6,660
million as of June 30, 2018 and 2017, respectively, representing
95% of our agricultural business assets at both dates. Our
Agricultural production segment generated income from operations of
Ps.1,128 million, and loss from operations of Ps.(102) million for
fiscal years ended June 30, 2018, and 2017, respectively,
representing 45% and (29%), of our consolidated profit from
operations, from Agricultural Business for such years,
respectively.
87
The
segment “agricultural production” aggregate the crops,
cattle, dairy, sugarcane and agricultural rental and services
activities:
● Our
“Crops”
activity
consists
of planting, harvesting and
sale of crops as wheat, corn, soybeans, cotton, and sunflowers. The
Company is focused on the long-term performance of the land and
seeks to maximize the use of the land through crop rotation; the
use of technology and techniques. In this way, the type and
quantity of harvested crops change in each agricultural
campaign.
Our Crops
activity had assets of Ps.4,928 million and Ps.3,742 million as of
June 30, 2018 and 2017, respectively, representing 42% and 53% of
our agricultural business assets at such dates, respectively. Our
Crops
activity
generated profit from operations of Ps.789
million, loss from operations of Ps.(217) million, and profit from
operation of Ps.222 million for fiscal years ended June 30, 2018,
2017 and 2016, respectively, representing 32%, (61%) and 72%, of
our consolidated profit from operations from Agricultural Business
for such years, respectively.
● Our
“Cattle” activity consists of breeding, purchasing
and/or fattening of free-range cattle for sale to meat processors
and local livestock auction markets.
Our Cattle activity
had assets of Ps.1,780
million and Ps.1,281 million as of June 30, 2018 and 2017,
respectively, representing 15% and 18% of our agricultural business
assets at such dates, respectively. Our
Cattle
activity
generated profit from operations of Ps.53 million,
Ps.64 million and Ps.123 million for fiscal years ended June 30,
2018, 2017 and 2016 respectively, representing 2%, 18% and 40%, of
our consolidated profit from operations from Agricultural Business
for such years, respectively.
● Our
“Dairy”
activity
consists of breeding and/or purchasing dairy cows for the
production of raw milk for sale to local milk and milk-related
products producers.
Our Dairy
activity had assets of Ps.22 million and Ps.71 million as of June
30, 2018 and 2017, respectively, representing 0.2% and 1% of our
agricultural business assets at such dates, respectively. Our
Dairy
activity has not
generated profit/loss from operation
for the fiscal year ended June 30, 2018 but generated loss from
operation of Ps.(7) million and (5) million, for fiscal years ended
June 30, 2017 and 2016, representing (2%) and (2%), of our
consolidated profit from operations from Agricultural Business for
such years, respectively.
● Our
“Sugarcane” activity consists of planting, harvesting
and sale of sugarcane.
Our
Sugarcane
activity had assets of Ps.3,530 million and
Ps.1,184 million as of June 30, 2018 and 2017, respectively,
representing 30% and 17% of our agricultural business assets at
such dates, respectively. Our
Sugarcane
activity
generated profit from operations of Ps.125 million
for the fiscal year ended June 30, 2018, representing 5% of our
consolidated profit from operations from Agricultural Business for
such year and loss from operations of Ps.(44) million and Ps.48
million for fiscal years ended June 30, 2017 and 2016,
respectively, representing (12%) and (15%), of our consolidated
profit from operations from Agricultural Business for such
years.
● Our
“Agricultural rentals and Services” activity consists
of agricultural services (for example: irrigation) and leasing of
the Company’s farms to third parties. Our Agricultural
Rentals and Services activity had assets of Ps.962 million and
Ps.382 million as of June 30, 2018 and 2017, respectively,
representing 8% and 5% of our agricultural business assets at such
dates, respectively. Our Agricultural Rentals and Services activity
generated profit from operations of Ps.161 million, Ps.102 million
and Ps.53 million for fiscal years ended June 30, 2018, 2017 and
2016, respectively, representing 6.4%, 29% and 17% of our profit
from operations from Agricultural Business for such
years
.
● Our
“Land transformation and Sales” segment
comprises gains from the disposal and development
of farmlands activities.
Our
Land Transformation and Sales segment
had assets of Ps.18
million and Ps.12 million as of June 30, 2018 and 2017,
respectively, representing 0.2% and 0.2% of our agricultural
business assets at such dates, respectively. Our
Land Transformation and Sales
segment
generated profit from operations of
Ps.1,500 million, and Ps.599 million for fiscal years ended June
30, 2018, and 2017,
respectively, representing 60%, and 168%
of our profit from operations from Agricultural Business for such
years
.
88
● Our
“Other segments” includes, principally, feedlot
farming, slaughtering and processing in the meat refrigeration
plant; among others.
Our
Others segment had assets of Ps.522 million and Ps.341 million as
of June 30, 2018 and 2017, respectively, representing 4.4% and 4.9%
of our agricultural business assets at such dates, respectively.
Our Others activity generated losses from operations of Ps.(42)
million, Ps.(57) million and Ps.(65) million for fiscal years ended
June 30, 2018, 2017 and 2016, representing (1.7%), (16%) and (20%)
of our consolidated operating income from Agricultural Business for
such years, respectively.
The segment
“
Other segments
”
aggregate the activities
Agro-industrial and
Others:
● Our
“Agro-industrial”
activity
consists of feedlot farming and
the slaughtering and processing in the meat refrigerating plant.
Feedlot farming is distinctive and requires specific care and diets
which differ from those provided to free-range cattle. This
activity represents a separate operating activity due to the
distinctive characteristics of the cattle feedlot system and the
industrialized meat processing in the packing plant. Our
Agro-industrial activity had assets of Ps.178 million and Ps.127
million as of June 30, 2018 and 2017, respectively, representing 2%
and 2% of our agricultural business assets at such dates,
respectively. Our Agro-Industrial activity generated loss from
operations of Ps.63 million, Ps.111 million and Ps.(63) million for
fiscal years ended June 30, 2018, 2017 and 2016, representing (3%),
(31%) and (20%) of our consolidated operating income from
Agricultural Business for such years, respectively.
● Our
“Others” activity consists of the aggregation of the
remaining operating segments, which do not meet the quantitative
thresholds for disclosure. This
activity
includes the brokerage and sale of
inputs activities. Our Others activity had assets of Ps.344 million
and Ps.214 million as of June 30, 2018 and 2017, respectively,
representing 3% and 3% of our agricultural business assets at such
dates, respectively. Our Others activity generated profit from
operations of Ps.21 million, Ps.54 million and loss from operations
of Ps.(2) million for fiscal years ended June 30, 2018, 2017 and
2016, representing 0.8%, 15% and 0.6% of our consolidated operating
income from Agricultural Business for such years,
respectively.
● The
“Corporate” segment includes, principally, the
corporative expenses related to the agricultural business. Our
Corporate segment and corporate activity generated operating losses
of Ps.(89) million, and operating losses for Ps.(84) million for
fiscal years ended June 30, 2018, and 2017, representing (3.6)%,
and (23.6)% of our consolidated profit from operations from
Agricultural Business for such years, respectively
As of
fiscal year 2018, the CODM also reviews the office business as a
single segment and the entertainment business in an aggregate and
separate manner from offices, including that concept in the
"Others" segment. Segment information for years 2017 and 2016 has
been recast for the purposes of comparability with the present
year.
Operation Center in Argentina
We
operate our business in Argentina through six reportable segments,
namely “Shopping Malls,” “Offices,”
“Sales and Developments,” “Hotels,”
“International,” “Corporate” and
“Others” as further described below:
● Our
“Shopping Malls” segment includes the operating results
from our portfolio of shopping malls principally comprised of lease
and service revenue from tenants. Our Shopping Malls segment had
assets of Ps.40,557 million and Ps.28,885 million as of June 30,
2018 and 2017, respectively, representing 61.0% and 64.3% of our
operating assets for the Operations Center in Argentina at such
dates, respectively. Our Shopping Malls segment generated operating
income of Ps.14,060 million, operating income of Ps.4,258 million
and operating income of Ps.17,904 million for the fiscal years
ended June 30, 2018, 2017 and 2016, respectively, representing
61.6%, 63.6% and 91.5% of our consolidated operating income in
Argentina for such years, respectively.
89
● Our
“Offices” segment includes the operating results of our
lease and service revenues of office space and other non-retail
building properties principally comprised of lease and service
revenue from tenants. Our Offices and Others segment had assets of
Ps.13,179 million and Ps.7,508 million as of June 30, 2018 and
2017, respectively, representing and 19.8% and 16.7% of our
operating assets for the Operations Center in Argentina at such
dates, respectively. Our Offices and Others segment generated
operating income of Ps.5,270 million, operating income of Ps.1,650
million and operating income of Ps.1,418 million for the fiscal
years ended June 30, 2018, 2017 and 2016, respectively,
representing 23.1%, 24.7% and 7.2% of our consolidated operating
income for the Operations Center in Argentina for such years,
respectively.
● Our
“Sales and Developments” segment includes the operating
results of our acquisition and/or construction of housing and other
properties for sale in the ordinary course of business. Our Sales
and Developments segment had assets of Ps.10,884 million and
Ps.5,470 million as of June 30, 2018 and 2017, respectively,
representing 16.4% and 12.2% of our operating assets for the
Operations Center in Argentina for both years. Our Sales and
Developments segment generated operating income of Ps.4,785
million, Ps.822 million and Ps.685 million for the financial years
ended June 30, 2018, 2017 and 2016, respectively, representing
21.0%, 12.3% and 3.5% of our consolidated operating income for the
Operations Center in Argentina for such years,
respectively.
● Our
“Hotels” segment includes the operating results of our
hotels mainly comprised of room, catering and restaurant revenues.
Our Hotels segment had assets of Ps.183 million and Ps.178 million
as of June 30, 2018 and 2017, respectively, representing 0.3% and
0.4% of our operating assets for the Operations Center in
Argentina, respectively. Our Hotels segment generated operating
income of Ps.25 million, operating income of Ps.8 million and
operating losses of Ps.(2) million for the fiscal years ended June
30, 2017, 2017 and 2016, respectively, representing 0.1%, 0.1% and
0.0% of our consolidated operating income for the Operations Center
in Argentina for such years.
● Our
“International” segment includes investments that
mainly operate in the United States in relation to the lease of
office buildings and hotels in that country. We intend to continue
evaluating investment opportunities outside Argentina as long as
they are attractive investment and development options. Our
International segment had assets of Ps.(1,651) million and Ps.572
million as of June 30, 2018 and 2017, respectively, representing
2,5% and 1.3% of our operating assets for the Operations Center in
Argentina for such years. Our International segment generated
operating losses of Ps.(1,992) million, operating losses of
Ps.(212) million and operating losses of Ps.(652) million for the
fiscal years ended June 30, 2018, 2017 and 2016, respectively,
representing (8.7)%, (3.2)% and (3.3)% of our consolidated
operating income for the Operations Center in Argentina for such
years, respectively.
●
“Corporate”. Since this quarter, we have decided to
expose in a separate corporate segment those expenses related to
the holding structure. The Corporate segment generated an losses of
Ps.(152) million, an losses of Ps.(132) million and an losses of
Ps.(72) million during fiscal years 2018, 2017 and
2016.
● Our
“Others” segment primarily includes the financial
activities carried out by Banco Hipotecario and Tarshop S.A.
(“Tarshop”) and other residual financial operations and
corporate expenses related to the Operations Center in Argentina.
As of June 30, 2017, our investment in Banco Hipotecario generated
income of Ps.619 million. Tarshop is a company specialized in the
sale of consumer financing products and cash advances to
non-banking customers. Our Others segment had assets of Ps.3,320
million and Ps.2,301 million as of June 30, 2018 and 2017,
respectively, representing 5.0% and 5.1% of our operating assets
for the Operations Center in Argentina, respectively. Our Others
segment generated operating income of Ps.837 million, operating
income of Ps.296 million and operating income of Ps.284 million for
the fiscal years ended June 30, 2018, 2017 and 2016, respectively,
representing 3.7%, 4.4% and 1.4% of our consolidated operating
income for the Operations Center in Argentina for such
years.
90
Operation Center in Israel
We
operate our business in Israel through six reportable segments,
namely “Real Estate,” “Supermarkets,”
“Telecommunications,” “Insurances,”
“Corporate” and “Others” as further
described below:
● Our
“Real Estate” segment includes mainly assets and
operating income derived from business related to the subsidiary
PBC. PBC is engaged, independently and through its subsidiaries and
associate companies, some of which are public companies, in various
areas of the real estate industry in Israel and abroad. The main
operating segments of PBC include the revenue-generating properties
segment - its core activity, and the residential construction
segment. PBC is also engaged in the agriculture segment. Our Real
Estate segment had net reportable assets of Ps.29,836 million and
Ps.15,327 million as of June 30, 2018 and 2017, representing 58.1%
and 64.6% of our operating assets for the Operations Center in
Israel at such years, respectively. Our Real Estate segment
generated operating income of Ps.5,344 million, operating income of
Ps.2,557 million and operating of Ps.855 million for the fiscal
years ended June 30, 2018, 2017 and 2016, respectively,
representing 77.3% ,76.8% and 101.4% of our consolidated operating
income for the Operations Center in Israel for such years,
respectively.
● Our
“Supermarkets” segment includes assets and operating
income derived from the business related to the subsidiary
Shufersal. Shufersal operates both directly and through its
investee corporations, and owns the largest supermarket chain in
Israel in terms of sales volume. Our Supermarkets segment had net
reportable assets of Ps.13,304 million and Ps.9,282 million as of
June 30, 2018 and 2017, representing 25.9% and 39.1% of our
operating assets for the Operations Center in Israel at such years,
respectively. Our Supermarkets segment generated operating income
(which is included in discontinued operations) of Ps.2,287 million
and an operating income of Ps.1,837 million for the fiscal years
ended June 30, 2018 and 2017, respectively.
● Our
“Telecommunications” segment includes assets and
operating income derived from the business related to our
subsidiary Cellcom. Cellcom is a provider of communication
services, which offers to its customers primarily mobile
communication services, landline telephone services, international
telephone services, internet connectivity services and associated
services, and beginning in December 2014, also television over
internet services. Our Telecommunications segment had net
reportable assets of Ps.10,993 million and 6,616 million as of June
30, 2018 and 2017, representing 21.4% and (27.9) % of our operating
assets for the Operations Center in Israel at such years,
respectively. Our Telecommunications segment generated operating
losses of Ps.(196) million, operating losses of Ps.(253) million
and operating losses of Ps.(71) million for the fiscal years ended
June 30, 2018, 2017 and 2016, respectively, representing (2.8)%,
(7.6)% and (8.4) % of our consolidated operating income for the
Operations Center in Israel for such years,
respectively.
● Our
“Insurance” segment includes the investment in Clal.
Clal is a holding company which is primarily engaged in the
insurance, pension and provident funds segments, and in the holding
of assets and real and other related businesses (such as insurance
agencies), and which constitutes one of the largest insurance
groups in Israel. Our Insurance segment had net reportable
assets,net of Ps.11,040 million and Ps.8,562 million as of June 30,
2018 and 2017, representing 21.5% and 36.1% of our operating assets
for the Operations Center in Israel at such years,
respectively.
● Our
“Corporate” segment includes the assets and operating
results providing from the activities related to the holding
companies of the Operating Center in Israel, IDBD and DIC. Our
Corporate segment had reportable assets of Ps.(47,343) million and
(18,971) million as of June 30, 2018 and 2017, representing (92.2)
% and (79.9) % of our operating assets for the Operations Center in
Israel at such years, respectively. Our Others segment generated
operating income of Ps.60 million, operating losses of Ps.(432)
million and operating losses of Ps.(321) million for the fiscal
years ended June 30, 2018, 2017 and 2016, respectively,
representing 0.9%, (13.0)% and (38.1)%, of our consolidated
operating income for the Operations Center in Israel for such
years, respectively.
● Our
“Others” segment includes the assets and income derived
from other diverse business activities, such as technological
developments, oil and gas assets, electronics, and others. Our
Others segment had operating assets (liabilities), net of Ps.33,520
million and 2,913 million as of June 30, 2018 and 2017,
representing 65.3 % and 12.3 % of our operating assets for the
Operations Center in Israel at such years, respectively. Our Others
segment generated operating losses of Ps.(582) million, operating
losses of Ps.(380) million and operating losses of Ps.(54) million
for the fiscal years ended June 30, 2018, 2017 and 2016,
respectively, representing (8.4)%, (11.4)% and (6.4)%, of our
consolidated operating income for the Operations Center in Israel
for such years, respectively.
91
Agricultural
Business
As of
June 30, 2018, we owned 23 farms with approximately 612,230
hectares distributed in Argentina, Brazil, Bolivia and Paraguay.
During the fiscal year we used 103,704 hectares of the land we own
for crop production, approximately 88,074 hectares are for cattle
production, 85,000 hectares are for sheep production and
approximately 9,246 hectares are leased to third parties for crop
and cattle production. The remaining 355,395 hectares of land
reserves are primarily natural woodlands. In addition, we have the
rights to hold approximately 132,000 hectares of land under
concession for a 35-year period that can be extended for another 29
years. Out of this total, we have assigned 24,244 hectares for crop
production and 1,404 hectares for cattle production. Also, during
fiscal year 2018 ended on June 30, 2018, we leased 66,333 hectares
to third parties for crop production and 12,635 hectares for cattle
production.
The
following table sets forth, at the dates indicated, the amount of
land used for each production activity (including owned and leased
land, and land under concession):
|
|
2018
(1)
|
2017
(1)
|
2016
(1)
|
2015
(1)(6)
|
2014
(1)(6)
|
|
Crops
(2)
|
194,281
|
193,106
|
178,617
|
187,438
|
201,648
|
|
Cattle
(3)
|
102,113
|
102,516
|
85,392
|
88,643
|
95,160
|
|
Milk/Dairy
|
-
|
1,036
|
2,231
|
2,864
|
2,864
|
|
Sheep
|
85,000
|
85,000
|
85,000
|
85,000
|
85,000
|
|
Land Reserves
(4)
|
461,795
|
471,437
|
473,290
|
467,568
|
467,532
|
|
Own farmlands
leased to third parties
|
9,603
|
7,733
|
2,435
|
10,026
|
13,111
|
|
Total
(5)
|
852,792
|
860,828
|
826,965
|
841,539
|
865,315
|
(1)
Includes 35.72% of approximately 8,299 hectares owned by
Agro-Uranga S.A., an affiliated Argentine company in which we own a
non-controlling 35.72% interest.
(2)
Includes wheat, corn, sunflower, soybean, sorghum and
others.
(3)
Breeding and fattening.
(4) We
use part of our land reserves to produce charcoal, rods and fence
posts.
(5)
Since fiscal year 2012, includes Brasilagro.
(6)
Includes farms owned by Brasilagro and Cresud sold in 2014, 2015
and 2018.
Strategy
We seek
to maximize our return on assets and overall profitability
by:
(i) identifying,
acquiring and operating agricultural properties having attractive
prospects for increased agricultural production and/or medium or
long-term value appreciation and selectively disposing of
properties subsequently as appreciation is realized,
(ii) optimizing the
yields and productivity of our properties by implementing
state-of-the-art technologies and agricultural techniques;
and
(iii) preserving
the value of our significant long-term investment in the urban real
estate sector held through our subsidiary IRSA.
To such
end, we seek to:
● Maximize the value of our agricultural real estate
assets
We
conduct our agricultural activities with a focus on maximizing the
value of our agricultural real estate assets. We rotate our
portfolio of properties over time by purchasing properties which we
believe have a high potential for appreciation and selling them
selectively as opportunities arise to realize attractive capital
gains. We achieve this by relying on the following
principles:
✓ Acquiring under-utilized properties and enhancing their
land use.
This
principle includes:
(i) transforming
non-productive land into cattle feeding land,
(ii) transforming
cattle feeding land into land suitable for more productive
agricultural uses,
92
(iii)
enhancing the value
of agricultural lands by changing their use to more profitable
agricultural activities; and
(iv) reaching the
final stage of the real estate development cycle by transforming
rural properties into urban areas as the boundaries of urban
development continue to extend into rural areas.
To do
so, we generally focus on acquisitions of properties outside of
highly developed agricultural regions and/or properties whose value
we believe is likely to be enhanced by proximity to existing or
expected infrastructure.
✓ Applying modern technologies to enhance operating yields
and property values.
We
believe that an opportunity exists to improve the productivity and
long-term value of inexpensive and/or underdeveloped land by
investing in modern technologies such as genetically modified and
high yield seeds, direct sowing techniques, and machinery. We
optimize crop yield through land rotation, irrigation and the use
of fertilizers and agrochemicals. To enhance our cattle production,
we use genetic technology and have a strict animal health plan
controlled periodically through traceability systems. In addition,
we have introduced state-of-the-art milking technologies in our
dairy business.
✓ Anticipating market trends.
We seek
to anticipate market trends in the agribusiness sector
by:
(i)
identifying opportunities generated by economic development at
local, regional and worldwide levels;
(ii)
detecting medium and long-term increases or decreases in supply and
demand caused by changes in the world’s food consumption
patterns; and
(iii)
using land for the production of food or energy.
✓ International expansion.
We
believe that an attractive opportunity exists to acquire and
develop agricultural properties outside Argentina, and our
objective is to replicate our business model in other countries.
Although most of our properties are located in different areas of
Argentina, we have begun a process of expansion into other Latin
American countries, including Brazil, Bolivia, and
Paraguay.
●
Increase and optimize production yields
We seek
to increase and improve our production yields through the following
initiatives:
✓ Implementation of technology.
(i) To improve crop production,
we use state-of-the-art technology. We invest in machinery and the
implementation of agricultural techniques such as direct sowing. In
addition, we use high-potential seeds (GMOs) and fertilizers and we
apply advanced land rotation techniques. In addition, we consider
installing irrigation equipment in some of our farms.
(ii) To
increase cattle production, we use advanced breeding techniques and
technologies related to animal health. Moreover, we optimize the
use of pastures and we make investments in infrastructure,
including installation of watering troughs and electrical fencing.
In addition, we have one of the few vertically integrated cattle
processing operations in Argentina through Sociedad Anónima
Carnes Pampeanas S.A.
(iii)
In our milking facility, we have implemented an individual animal
identification system, using plastic tags for our cattle and
“RFID” tags. We use software from Westfalia Co. which
enables us to store individual information about each of our dairy
cows.
✓ Increased production.
Our
goal is to increase our crop, cattle and milk production in order
to achieve economies of scale by:
(i)
Increasing our owned land in various regions by taking advantage of
attractive land purchase opportunities. In addition, we expand our
production areas by developing lands in regions where agricultural
and livestock production is not developed to its full potential. We
believe in the use of technological tools for improving the
productivity of our land reserves and enhancing their long-term
value. However, current or future environmental regulations could
prevent us from fully developing our lands by demanding us to
maintain part of them as natural woodlands not allocated to
production.
93
(ii)
Diversifying our production and the weather risk by leasing farms,
thus expanding our product portfolio and optimizing our geographic
focus, in particular in areas that are not appealing in terms of
land value appreciation but with attractive productivity levels. We
believe that this diversification mix mitigates our exposure to
seasonality, commodity price fluctuations, weather conditions and
other factors affecting the agricultural and livestock
sector.
(iii)
Moreover, we believe that continuing to expand our agricultural
operations outside of Argentina will help us improve even more our
ability to produce new agricultural products, further diversifying
our mix of products, and mitigating our exposure to regional
weather conditions and country-specific risks.
Urban
Properties and Investments Business
We seek
to maintain the long-term value of our significant investment in
the urban real estate sector through IRSA. We believe that IRSA is
an ideal vehicle through which to participate in the urban real
estate market due to its substantial and diversified portfolio of
residential and commercial properties, the strength of its
management and what we believe are its attractive prospects for
future growth and profitability.
Following the
acquisition IRSA with IDBD in Israel, we decided to report our
operations based on our main business lines: “Agricultural
Business” and “Urban Properties and Investments
Business” derived from our subsidiary IRSA, which is in turn
subdivided into two operations centers: “Argentina”
(including the businesses in Argentina and the international
investments in the Lipstick Building in New York and the Condor
Hospitality Trust Hotel REIT) and “Israel” (including
IDBD).
Operations Center in Argentina
●
Shopping Malls.
Our main
purpose is to maximize our shareholders’ profitability. By
using our know-how in the shopping mall industry in Argentina as
well as our leading position, we seek to generate a sustainable
growth of cash flow and to increase the long-term value of our real
estate assets.
We
attempt to take advantage of the unsatisfied supply in different
urban areas of the region, as well as of our customers’
purchase experience. Therefore, we seek to develop new Shopping
Mall Properties in urban areas with attractive prospects for
growth, including Buenos Aires’ Metropolitan area, some
cities in the provinces of Argentina and possibly, other places
abroad. To achieve this strategy, the close business relationship
we have had for years with more than 1000 retail companies and
trademarks composing our selected group of tenants is of utmost
importance, as it allows us to offer an adequate mix of tenants for
each particular case.
●
Offices.
Since the Argentine
economic crisis in 2001 and 2002, there have been limited
investments in high-quality office buildings in Buenos Aires and,
as a result, we believe there is currently substantial demand for
top-notch office spaces. We seek to purchase and develop premium
office buildings in the core districts in the City of Buenos Aires
and other strategic locations that we believe offer attractive
returns and potential for long-term capital gain. We expect to
continue our focus on attracting premium corporate tenants to our
office buildings. Furthermore, we intend to selectively consider
new opportunities to acquire or construct new rental office
buildings.
●
Sales and Developments
. We
seek to purchase undeveloped properties in densely-populated areas
and build apartment complexes offering green space for recreational
activities. We also seek to develop residential communities by
acquiring undeveloped properties with convenient access to the City
of Buenos Aires, developing roads and other basic infrastructure
such as electric power and water, and then selling lots for the
construction of residential units. After the Argentine economic
crisis in 2001 and 2002, the scarcity of mortgage financing
restricted the growth in middle class home purchases and, as a
result, we mainly focused on the development of residential
communities for middle and high-income individuals, who do not need
to finance their home purchases. We seek to continue to acquire
undeveloped land at locations we consider attractive within and
outside Buenos Aires. In each case, our intention is to purchase
land with significant development or appreciation potential to
resell. We believe that holding a portfolio of desirable
undeveloped plots of land enhances our ability to make strategic
long-term investments and affords us a valuable pipeline of new
development projects for upcoming years.
●
Hotels.
We believe our
portfolio of three luxury hotels is positioned to take advantage of
the future growth in tourism and business travel in Argentina. We
seek to continue with our strategy to invest in high-quality
properties that are operated by leading international hotel
companies to capitalize on their operating experience and
international reputation.
94
●
International
. In this
segment, we seek investments that represent an opportunity of
capital appreciation potential in the long term. After the
international financial crisis in 2008, we took advantage of the
price opportunity in the real estate sector in the United States
and invested in two office buildings in Manhattan, New York. In
2015, we sold 74.5% of the office building located at Madison
Avenue, City of New York, for a total amount of US$ 185
million, and we have retained a 49.9% equity interest in a US
company whose main asset is the so-called “Lipstick”
office building located in the City of New York. In addition,
jointly with subsidiaries, we hold 28.7% of the voting power of the
REIT Condor Hospitality Trust (NYSE:CDOR) and we hold, through
Dolphin Fund, a 68.3% stake in the Israeli company IDBD, one of the
largest and most diversified investment groups of Israel, which,
through its subsidiaries, participates in numerous markets and
industry sectors, including real estate, retail, agroindustry,
insurance, telecommunications, etc. We intend to continue
evaluating -on a selective basis- investment opportunity outside
Argentina as long as they offer attractive investment and
development opportunities.
●
Corporate.
This segment
includes the expenses related to the corporate activities of the
Operations Center in Argentina.
●
Others.
Primarily includes
the financial activities through in Banco Hipotecario and Tarshop,
the main mortgage-lending bank in Argentina, as we believe that we
are able to reach good synergies in the long term between real
estate properties and the development of the mortgage loans market
in Argentina with a developed mortgage market.
Operations Center in Israel
We
develop our operations in Israel through IDBD and DIC. IDBD and DIC
are holding companies, which invests (directly and indirectly) in
companies, that operate in several different fields, primarily in
the communication, real estate, commerce, services and insurance
branches. IDBD and DIC strives to promote and maximize the value of
theirs existing investments, and to improve them, and also to sell
them in suitable cases, through influence and involvement in the
majority of its subsidiaries. This effect is realized, whether
through the appointment of directors on its behalf and the
provision of candidates on its behalf for corporate officer
positions, or through involvement in the business strategic
processes of the subsidiaries.
In
parallel with substantiating the control of the control group in
IDBD and DIC, in early 2016, the senior management of IDBD was
replaced, including the General Manager, CFO, VP Legal Counsel, VP
Accounting and Corporate Secretary.
Discount
Investments is a holding company that invests in companies which
operates in a variety of fields, mainly in communications, real
estate, commerce and services. DIC strives to promote and maximize
the value of its existing investments until they are sold in
appropriate cases
.
●
Real Estate.
PBC’s
policy is to continue to implement its growth strategy, to develop
its yield bearer properties and to increase revenues from this
activity, which is its main activity, by building on land, which
PBC owns, and locating new investments opportunities. Concurrently,
PBC will act to realize assets in which their improvement potential
was fully utilized and PBC will also act to maintain a strong
financial stability.
●
Supermarkets.
Shufersal’s strategy was re-launched in 2014, the main
elements of which are strengthening of Shufersal’s
competitive position, especially in the discount segment, develop
and grow Shufersal’s own brand, which includes the launch of
new products in more leading categories (such as pharma and
products for infants) alongside with the improvement of
relationships with its suppliers, the growth in sales of Shufersal
Online and other digital operations, including Shufersal App,
promotion of growth engines and development of specialized areas of
activity, which includes, development of “Shufersal for
Business” (Wholesale Sales Offers), and further
implementation of the streamlining plan and changes in internal
procedures while saving costs. In June 2018, a transaction was
completed in which DIC sold 16.6% of the issued share capital of
Shufersal, for a total net consideration of NIS 848 million,
according to which DIC’s holdings in Shufersal decreased to
approximately 33.6% and therfore ceased to be the controlling
shareholder of Shufersal. Thus, after the date of the said sale we
ceased to consolidate the financial statements of Shufersal in its
financial statements
95
●
Telecommunications.
Cellcom’s business strategy is divided into the following
categories:
o Cell site
construction and licensing – Cellcom construct cell sites
based on its strategy to expand the geographical coverage and
improve the quality of its network and as necessary to replace
other obsolete cell sites.
o Sales and
customer care - Cellcom combine their sales and customer care
efforts in order to maximize sales opportunities alongside
accessible and quality customer service.
o Marketing -
Cellcom marketing strategy emphasizes their position as a
communications group and cellular market leader, its value for
money and its provision of a comprehensive solution for their
customers’ communication needs, by offering services bundles
for families and for the office for small and mid-sized businesses.
Cellcom aims to provide its customers with a comprehensive quality
experience through the various means of communications that they
use, including their mobile handset, tablet and laptop. Alongside
its focus on packages for a fixed sum, Cellcom has substantially
reduced the number of calling plans available to its customers,
thus reducing its back office operation.
Insurance.
Clal has an advanced research
department and an effective trading execution, to ensure a
competitive advantage in order to achieve a fair long-term yield
for policy holders, maximizing income from investments in
accordance with the company’s risk appetite and the structure
of liabilities in the portfolios.
Corporate.
This segment includes the
expenses related to the activities of holding
companies.
●
Others.
Includes the
assets and income from other miscellaneous businesses, such as
technological developments, tourism, oil and gas, electronics, and
other sundry activities.
Our
Principal Business Activities
During
the fiscal year ended June 30, 2018, we conducted our operations on
23 owned farms and 48 leased farms.
The
following charts show, for fiscal year 2018, the surface area in
operation for each line of business, as well as the hectares held
as land reserves:
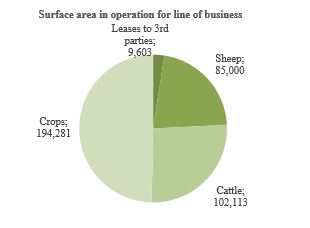
96
The
following chart illustrates, for the fiscal year ended on June 30,
2018, the surface area in operation and the hectares held as land
reserves, classified into own, under lease or under
concession:
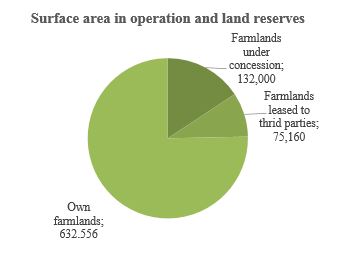
Agricultural Business
Land
Transformation and Sales
Land
Acquisitions
We
intend to increase our farmland portfolio by acquiring large
extensions of land with high appreciation potential. We also intend
to transform the land acquired from non-productive to cattle
breeding, from cattle breeding to farming, applying
state-of-the-art technology to improve farming yields so as to
generate higher land appreciation.
In our
view, the sector’s potential lies in developing marginal
areas and/or under-utilized areas. Thanks to the current
technology, we may achieve similar yields with higher profitability
than core areas, resulting in the appreciation of land
values.
Over
the past 15 years, prices of farmlands intended for agricultural
production have increased in the southern hemisphere (mainly South
America) but continue to be relatively low compared to the northern
hemisphere (U.S. and Europe). Our financial strength relative to
other Argentine producers gives us the chance to increase our land
holdings at attractive prices, improve our production scale and
create potential for capital appreciation.
Several
important intermediaries, with whom we usually work, bring
farmlands available for sale to our attention. The decision to
acquire farmlands is based on the assessment of a large number of
factors. In addition to the land’s location, we normally
carry out an analysis of soil and water, including the quality of
the soil and its suitability for our intended use (crops, cattle,
or milk production), classify the various sectors of the lot and
the prior use of the farmland; analyze the improvements in the
property, any easements, rights of way or other variables in
relation to the property title; examine satellite photographs of
the property (useful in the survey of soil drainage characteristics
during the different rain cycles) and detailed comparative data
regarding neighboring farms (generally covering a 50-km area).
Based on the foregoing factors, we assess the farmland in terms of
the sales price compared against the production potential of the
land and capital appreciation potential. We consider that
competition for the acquisition of farmlands is, in general,
limited to small farmers for the acquisition of smaller lots, and
that there is less competition for the acquisition of bigger
lots.
In
addition, we may consider the acquisition of farmlands in marginal
zones and their improvement by irrigation in non-productive areas
as well as the installation of irrigation devices in order to
obtain attractive production yields and create potential for
capital appreciation.
97
The following chart shows certain information concerning our land
acquisitions for each of the last 12 fiscal years ended on June
30:
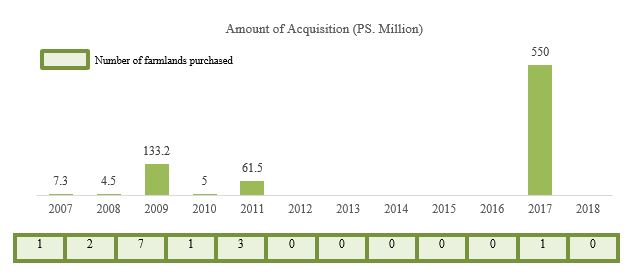
Land
Sales
We
periodically sell properties that have reached a considerable
appraisal to reinvest in new farms with higher appreciation
potential. We analyze the possibility of selling based on a number
of factors, including the expected future yield of the farmland for
continued agricultural and livestock exploitation, the availability
of other investment opportunities and cyclical factors that have a
bearing on the global values of farmlands.
The
following chart shows certain information concerning our land sales
for each of the last 12 fiscal years ended on June 30:

(1) Includes the
difference between the gross proceeds of sales (net of all taxes
and commissions) and the book value of the assets
sold.
(2) Includes the
sale of “La Adela” to our subsidiary IRSA. As it is a
transaction between related parties, it generates no results under
the IFRS and it is not included in the gain from disposal of farms
for Ps.569.5 million.
(3) Includes three
sales of farms and three fractions of land.
(4) Includes one
farmland sale and two fractions of land.
98
On July
20, 2017, we entered into a purchase-sale agreement for all of
“La Esmeralda” establishment, consisting of 9,352
hectares devoted to agricultural and cattle farming activities in
the 9 de Julio district, Province of Santa Fe, Argentina. On June
25, 2018, we executed the deed and delivered of the property. The
amount of the transaction was set at US$ 19 million, of which US$7
million have been already paid. The balance, guaranteed with a
mortgage on the property, will be collected in four equal
installments ending in April 2022, accruing an annual interest of
4% on the balances. The gain from the sale amounts approximately to
Ps.410 million.
Additionally,
i
n June
29, 2018, Cresud sold non-related third party for the sale of a
fraction of 10,000 hectares of livestock activity of "La Suiza".
The total a mount of the consideration was US$10 million, of which
US$3.0 million have been already paid. The remaining balance of
US$7 million, guaranteed by a mortgage on the property, will be
paid in ten installments of the same amount ending on June 2023,
accruing an annual interest of 4.5% over the remaining equal
consecutive balances. We reconded a gain for the transaction of
approximately to Ps.238 million.
Our
subsidiary Brasilagro has also made farmland sales during the year.
On May 3, 2018, Brasilagro sold 956 hectares of Araucaria, of which
660 arable hectares, for an amount equal to 1,208 soybean bags per
arable hectare or R$ 66.2 million (equal to Ps. 447.2 million or
R$/ha. 93,356). The company has recognized gains of Ps. 258 million
as result of this transaction.On June 13, 2018, the Company entered
into a contract for the sale of a fraction of 9,784 hectares (7,485
hectares of agro-cultivable land) of the Jatobá Establishment,
a rural property located in the Municipality of Jaborandi-BA, for a
value of 285 bags per hectare or R$ 177.8 million (approximately R$
18,172/ hectare). On July 31, 2018, the buyer made the payment of
the first quota of 300,000 bags of soybean, for the value of R$23.2
million, in accordance with the conditions set forth in the
contract, obtaining the transfer of possession and enabling the
recognition of the income on behalf of the Company. The remaining
balance will be paid in seven annual installments.
Farmland
Development
We
consider that there is great potential in farmland development
where, through the use of current technology, we may achieve
similar yields with higher profitability than in core
areas.
As of
June 30, 2018, we owned land reserves in the region extending over
more than 355,395 hectares of own farmlands that were purchased at
very attractive prices. In addition, we have a concession 106,352
hectares reserved for future development. We believe that there are
technological tools available to improve productivity in these
farms and, therefore, achieve appreciation in the long term.
However, current or future environmental regulations could prevent
us from fully developing our land reserves by requiring that we
maintain part of this land as natural woodlands not to be used for
production purposes.
During
fiscal year 2018, we developed 10,684 hectares in the region: 2,486
hectares in Argentina; 2,008 hectares in Paraguay and 6,190
hectares in Brasil.
|
Area
under Development
|
Developed
2017/2018
|
Developed
2016/2017
|
|
|
(hectares)
|
|
|
Argentina
|
2,486
|
2,172
|
|
Brazil
|
6,190
|
9,601
|
|
Paraguay
|
2,008
|
1,553
|
|
Total
|
10,684
|
13,326
|
(1)
6,643 completed hectares and 4,041 hectares under development
(1,484 in Argentina and 2,557 in Brasil).
99
Results
The following table shows this segment’s results for fiscal
year 2018, compared to the preceding fiscal
years
:
|
|
FY
2018
|
FY
2017
|
FY
2016
|
YoY
Var 2018 vs. 2017
|
|
|
(in
millions of Ps.)
|
%
|
||
|
Revenues
|
-
|
-
|
-
|
-
|
|
Costs
|
(12
)
|
(11
)
|
(9
)
|
9.1
|
|
Gross Loss
|
(12
)
|
(11
)
|
(9
)
|
9.1
|
|
Net
result for changes in fair value of investment
properties
|
96
|
331
|
22
|
(71.0
)
|
|
Gain
from disposition of farmlands
|
906
|
280
|
(2
)
|
223.6
|
|
Other
operating results, net
|
511
|
-
|
-
|
-
|
|
Profit from operations
|
1,500
|
599
|
10
|
150.4
|
|
Segment profit
|
1,500
|
599
|
10
|
150.4
|
Agricultural Production
Production
The
following table shows, for the fiscal years indicated, our
production volumes measured in tons:
|
Production
Volume (tons)
(1)
|
FY2018
|
FY2017
|
FY2016
|
|
Corn
|
381,443
|
302,513
|
220,234
|
|
Soybean
|
225,916
|
203,526
|
179,916
|
|
Wheat
|
32,297
|
29,905
|
15,578
|
|
Sorghum
|
4,131
|
4,922
|
1,051
|
|
Sunflower
|
6,221
|
3,853
|
3,053
|
|
Other
|
2,103
|
3,690
|
6,432
|
|
Total
Crops (tons)
|
652,111
|
548,409
|
426,264
|
|
Sugarcane
(tons)
|
924,776
|
1,062,860
|
1,228,830
|
|
Cattle
herd
|
10,566
|
7,626
|
7,714
|
|
Milking
cows
|
185
|
435
|
491
|
|
Cattle
(tons)
|
10,751
|
8,061
|
8,205
|
|
Milk
(liters)
|
3,891
|
13,968
|
16,273
|
(1)
Includes Brasilagro, 50% of CRESCA, Acres del Sud, Ombú, Yatay
and Yuchán. Agro-Uranga S.A. is not included.
The
segment “agricultural production” aggregate the crops,
cattle, dairy, sugarcane and agricultural rental and services
activities.
Crops and Sugarcane
Our
crop production is mainly based on crops and oilseeds and
sugarcane. Our main crops include soybean, wheat, corn, and
sunflower. Other crops, such as sorghum and peanut, are sown
occasionally and represent only a small percentage of total sown
land.
Below
is the geographical distribution of our agricultural production for
the last three fiscal years:
|
2018
Season
|
Argentina
|
Brazil
|
Bolivia
|
Paraguay
|
Total
|
|
|
(in
tons)
|
||||
|
Corn
|
344,713
|
18,913
|
6,690
|
11,127
|
381,443
|
|
Soybean
|
99,840
|
94,031
|
14,953
|
17,092
|
225,916
|
|
Wheat
|
32,297
|
-
|
-
|
-
|
32,297
|
|
Sorghum
|
2,836
|
-
|
1,295
|
-
|
4,131
|
|
Sunflower
|
6,221
|
-
|
-
|
-
|
6,221
|
|
Other
|
2,103
|
-
|
-
|
-
|
2,103
|
|
Total Crops and Other
|
488,010
|
112,944
|
22,938
|
28,219
|
652,111
|
|
Sugarcane
|
-
|
901,274
|
23,502
|
-
|
924,776
|
100
|
2017
Season
|
Argentina
|
Brazil
|
Bolivia
|
Paraguay
|
Total
|
|
(in tons)
|
|||||
|
Corn
|
253,164
|
31,969
|
9,410
|
7,970
|
302,513
|
|
Soybean
|
127,532
|
53,837
|
13,178
|
8,979
|
203,526
|
|
Wheat
|
29,905
|
-
|
-
|
-
|
29,905
|
|
Sorghum
|
44
|
-
|
4,879
|
-
|
4,923
|
|
Sunflower
|
3,853
|
-
|
-
|
-
|
3,853
|
|
Other
|
3,690
|
-
|
-
|
-
|
3,690
|
|
Total Crops and Other
|
418,188
|
85,806
|
27,467
|
16,949
|
548,410
|
|
Sugarcane
|
-
|
1,015,303
|
47,557
|
-
|
1,062,860
|
|
2016
Season
|
Argentina
|
Brazil
|
Bolivia
|
Paraguay
|
Total
|
|
(in tons)
|
|||||
|
Corn
|
189,709
|
19,982
|
3,574
|
6,969
|
220,234
|
|
Soybean
|
117,744
|
26,252
|
26,415
|
9,505
|
179,916
|
|
Wheat
|
15,525
|
-
|
53
|
-
|
15,578
|
|
Sorghum
|
56
|
-
|
697
|
298
|
1,051
|
|
Sunflower
|
3,053
|
-
|
-
|
-
|
3,053
|
|
Other
|
5,367
|
1,065
|
-
|
-
|
6,432
|
|
Total Crops and Other
|
331,454
|
47,299
|
30,739
|
16,772
|
426,264
|
|
Sugarcane
|
-
|
1,075,183
|
153,648
|
-
|
1,228,831
|
Sales
Below
is the total volume sold broken down into geographical areas,
measured in tons:
|
|
FY2018
|
FY2017
|
FY2016
|
||||||
|
Volume
of Sales
(3)
|
D.M.
(1)
|
F.M.
(2)
|
Total
|
D.M.
(1)
|
F.M.
(2)
|
Total
|
D.M.
(1)
|
F.M.
(2)
|
Total
|
|
Corn
|
290.7
|
6.0
|
296.7
|
266.5
|
-
|
266.5
|
217.3
|
37.9
|
255.2
|
|
Soybean
|
172.0
|
23.4
|
195.4
|
137.8
|
28.8
|
166.6
|
182.5
|
15.8
|
198.3
|
|
Wheat
|
44.6
|
-
|
44.6
|
11.9
|
1.5
|
13.4
|
17.3
|
29.3
|
46.6
|
|
Sorghum
|
1.1
|
-
|
1.1
|
5.3
|
-
|
5.3
|
1.0
|
-
|
1.0
|
|
Sunflower
|
4.6
|
-
|
4.6
|
4.1
|
-
|
4.1
|
10.4
|
-
|
10.4
|
|
Other
|
1.6
|
-
|
1.6
|
3.6
|
-
|
3.6
|
5.9
|
-
|
5.9
|
|
Total
Grains
(tons)
|
514.6
|
29.4
|
544.0
|
429.2
|
30.3
|
459.5
|
434.4
|
83.0
|
517.4
|
|
Sugarcane
(tons)
|
1,723.0
|
-
|
1,723.0
|
906.8
|
-
|
906.8
|
1,219.7
|
-
|
1,219.7
|
|
Cattle
herd
|
13.3
|
-
|
13.3
|
6.9
|
-
|
6.9
|
8.3
|
-
|
8.3
|
|
Milking
cows
|
1.5
|
-
|
1.5
|
1.1
|
-
|
1.1
|
0.7
|
-
|
0.7
|
|
Cattle
(tons)
|
14.8
|
-
|
14.8
|
8.0
|
-
|
8.0
|
9.0
|
-
|
9.0
|
|
Milk
(in th of liters)
|
3.9
|
-
|
3.9
|
13.3
|
-
|
13.3
|
16.9
|
-
|
16.9
|
(1)
Domestic Market.
(2)
Foreign Market.
(3)
Includes Brasilagro, 50% of CRESCA, Acres del Sud, Ombú, Yatay
and Yuchán. Excludes Agro-Uranga.
The
following table shows the sown surface area assigned to crop
production, classified into own, under lease, under concession and
leased to third parties for the fiscal years indicated below,
measured in hectares:
|
|
2018
(1)
|
2017
(1)
|
2016
(1)
|
|
Own
|
102,448
|
102,683
|
112,112
|
|
Under
lease
|
72,688
|
71,481
|
43,309
|
|
Under
concession
|
24,244
|
22,454
|
23,196
|
|
Leased
to third parties
|
9,533
|
7,663
|
2,365
|
|
Total
|
208,913
|
204,281
|
180,982
|
(1)
Sown land may differ from that indicated under “Uses of
Land,” since some hectares are sown twice in the same season
and therefore are counted twice.
101
|
|
Season
|
|
|
|
Stock
|
2018
|
2017
|
Variation
|
|
|
(in
tons)
|
%
|
|
|
Corn
|
88,184
|
39,528
|
123.1
|
|
Soybean
|
109,160
|
89,499
|
22.0
|
|
Sunflower
|
2,124
|
530
|
300.5
|
|
Sorghum
|
498
|
16
|
3,089.2
|
|
Wheat
|
5,990
|
20,259
|
(70.4
)
|
|
Sugarcane
|
4,424
|
-
|
-
|
|
Other
|
6,066
|
1,620
|
274.5
|
|
Total
|
216,446
|
151,452
|
42.9
|
We seek
to diversify our mix of products and the geographic location of our
farmlands to achieve an adequate balance between the two principal
risks associated with our activities: weather conditions and the
fluctuations in the prices of commodities. In order to reduce such
risks, we own and lease land in several areas of Argentina with
different climate conditions that allow us to sow a diversified
range of products. Our leased land for crops is mostly located in
the Pampas region, a favorable area for crop production. The leased
farms are previously studied by technicians who analyze future
production expectations based on the historic use of the land. The
initial duration of lease agreements is typically one or three
seasons. Leases of farms for production of crops generally consist
of lease agreements with payments based on a fixed amount of Pesos
per hectare or sharecropping agreements with payments in kind based
on a percentage of the crops obtained or a fixed amount of tons of
crops obtained or their equivalent value in Pesos. The principal
advantage of leasing farms is that leases do not require us to
commit large amounts of capital to the acquisition of lands but
allow us to increase our scale in the short term and reduce the
risk of inclement weather. The disadvantage of this strategy is
that the cost of leasing can increase over time, in part, because
increased demand for leased land increases the price of leased
land.
In
order to increase our production yields, we use, besides
state-of-the-art technology, labor control methods which imply the
supervision of the seeding’s quality (density, fertilization,
distribution, and depth), crop monitoring (determination of natural
losses and losses caused by harvester) and verification of bagged
crop quality. In this way, we work jointly with our suppliers to
achieve the best management of inputs, water and soil.
Wheat
seeding takes place from June to August, and harvesting takes place
from December to January. Corn, soybean and sunflower are sown from
September to December and are harvested from February to August.
Crops are available to be sold as commodities after the harvest
from December to June and we usually store part of our production
until prices recover after the drop that normally takes place
during the harvesting season. A major part of production,
especially soybean, wheat, corn and sorghum, is sold and delivered
to buyers pursuant to agreements in which price conditions are
fixed by reference to the market price at a specific time in the
future that we determine. The rest of the production is either sold
at current market prices or delivered to cover any futures contract
that we may have entered into.
Agro-Uranga
S.A.
We have
a 35.72% interest in AgroUranga S.A.. This company optimizes
production processes with special emphasis in soil conservation,
the application of rational techniques and care of the
environment.
At
present, with the assistance of its foreign trade team it is
seeking to develop new products so as to significantly increase
export volumes, encouraged by the world’s growing
demand.
Lease
of Farmlands
We
conduct our business on owned and leased land. Rental payments
increase our production costs, as the amounts paid as rent are
accounted for as operating expenses. As a result, production costs
per hectare of leased land are higher than for the land owned by
us.
Our
land leasing policy is designed to supplement our expansion
strategy, using our liquidity to make production investments in our
principal agricultural activities. On the other hand, our leasing
strategy provides us with an added level of flexibility in the
share of each of our products in total production, providing for
greater diversification.
102
The
initial duration of lease agreements is typically one crop season.
Leases of farms for production of crops consist in lease agreements
with payments based on a fixed amount of Pesos per hectare or
sharecropping agreements with payments in kind based on a
percentage of the crops obtained or a fixed amount of tons of crops
obtained or their equivalent value in Pesos. Leases of farmlands
for cattle breeding consist in lease agreements with fixed payments
based on a fixed amount of Pesos per hectare or steer kilograms or
capitalization agreements with payments in kind or in cash based on
the weight gain in kilograms.
During
fiscal year 2018, we leased to third parties a total of 48 fields,
covering 75,160 hectares, including 26,763 hectares in Brazil. Out
of the total leased area, 66,333 hectares were assigned to
agricultural production, including double crops, and 12,635
hectares to cattle raising. The properties for agricultural
production were leased, primarily, for a fixed price prior to
harvest and only a small percentage consisted of sharecropping
agreements.
The
following table shows a breakdown of the number of hectares of
leased land used for each of our principal production
activities:
|
|
2018
|
2017
|
2016
|
2015
|
2013
|
|
Crops
(1)
|
66,333
|
71,481
|
43,309
|
58,167
|
58,030
|
|
Cattle
|
12,635
|
12,635
|
12,635
|
13,501
|
18,549
|
Due to
the rise in the price of land, we adopted a policy of not
validating excessive prices and applying strict criteria upon
adopting the decision to lease, selecting those lands with values
that would ensure appropriate margins.
Results
The
following table shows the Company’s results for fiscal year
2018 for Crops an Sugarcane activities, compared to the preceding
fiscal years:
Crops
|
|
|
|
|
YoY var
|
|
|
FY 2018
|
FY 2017
|
FY 2016
|
2018 vs. 2017
|
|
|
(in
millions of Ps.)
|
%
|
||
|
Revenues
|
2,192
|
1,401
|
1,152
|
56.5
|
|
Costs
|
(1,769
)
|
(1,177
)
|
(939
)
|
50.3
|
|
Initial
recognition and changes in the fair value of biological assets and
agricultural produce
|
603
|
24
|
198
|
2,412.5
|
|
Changes
in the net realizable value of agricultural produce
|
303
|
(74
)
|
208
|
-
|
|
Gross profit
|
1,329
|
174
|
619
|
663.8
|
|
General
and administrative expenses
|
(180
)
|
(153
)
|
(124
)
|
17.6
|
|
Selling
expenses
|
(404
)
|
(329
)
|
(216
)
|
22.8
|
|
Other
operating results, net
|
20
|
79
|
(83
)
|
(74.7
)
|
|
Profit / (loss) from operations
|
765
|
(229
)
|
196
|
-
|
|
Share
of profit of associates and joint ventures
|
24
|
12
|
26
|
100.0
|
|
Activity profit / (loss)
|
789
|
(217
)
|
222
|
-
|
103
Sugarcane
|
|
|
|
|
YoY var
|
|
|
FY 2018
|
FY 2017
|
FY 2016
|
2018 vs. 2017
|
|
|
(in
millions of Ps.)
|
%
|
||
|
Revenues
|
757
|
355
|
294
|
113.2
|
|
Costs
|
(754
)
|
(352
)
|
-263
|
114.2
|
|
Initial
recognition and changes in the fair value of biological assets and
agricultural produce
|
241
|
20
|
55
|
1,105.0
|
|
Gross profit
|
244
|
23
|
86
|
960.9
|
|
General
and administrative expenses
|
(104
)
|
(52
)
|
(34
)
|
100.0
|
|
Selling
expenses
|
(15
)
|
(9
)
|
(8
)
|
66.7
|
|
Other
operating results, net
|
-
|
(6
)
|
4
|
(100.0
)
|
|
Profit / (loss) from operations
|
125
|
(44
)
|
48
|
-
|
|
Activity profit / (loss)
|
125
|
(44
)
|
48
|
-
|
Cattle
Our
cattle production involves the breeding and fattening of our own
animals. In some cases, if market conditions are favorable, we also
purchase and fatten cattle which we sell to slaughterhouses and
supermarkets. As of June 2018, our cattle aggregated 93,591 heads,
and we had a total surface area of 102,113 hectares of own and
leased lands devoted to this business activity. In addition, we
have leased to third parties 70 hectares assigned to these
activities.
During
the fiscal year ended June 30, 2018, our production was 10,751
tons, a 33.3% year-on-year increase. The following table sets
forth, for the fiscal years indicated below, the cattle production
volumes measured in tons:
|
|
2018
|
2017
|
2016
|
|
Cattle
production
(1)
|
10,751
|
8,061
|
8,205
|
(1)
Production measured in tons of live weight. Production is the sum
of the net increases (or decreases) during a given period in live
weight of each head of cattle owned by us.
Our
cattle breeding activities are carried out with breeding cows and
bulls and our fattening activities apply to steer, heifers and
calves. Breeding cows calve approximately once a year and their
productive lifespan is from six to seven years. Six months after
birth, calves are weaned and transferred to fattening pastures.
Acquired cattle are directly submitted to the fattening process.
Upon starting this process, cattle have been grazing for
approximately one year to one and a half year in order to be
fattened for sale. Steer and heifers are sold when they have
achieved a weight of 380–430 kg and 280–295 kg,
respectively, depending on the breed.
Pregnancy levels,
which have been improving over the years, showed satisfactory
levels of efficiency notwithstanding the adverse weather
conditions. Genetics and herd management are expected to further
improve pregnancy levels in the coming years. Reproductive
indicators improved thanks to the implementation of technologies,
which have included handling techniques and females’
artificial insemination with cattle genetics especially selected
for the stock which is purchased from specialized companies in
quality semen elaboration for meat production. We use veterinarian
products manufactured by leading national and international
laboratories. It is important to emphasize the work of a
veterinarian advising committee, who is external to us and visits
each establishment monthly to control and agree tasks.
Currently, the
cattle raising farms are officially registered as export farmlands
pursuant to the identification and traceability rules in force in
Argentina. Animals are individually identified, thus allowing for
the development of special businesses in this area.
104
Our
cattle stock is organized into breeding and fattening activities.
The following table shows, for the fiscal years indicated, the
number of heads of cattle for each activity:
|
|
2018
|
2017
|
2016
|
|
Breeding
stock
|
83,151
|
69,669
|
58,747
|
|
Winter
grazing stock
|
10,440
|
9,692
|
11,126
|
|
Total Stock (heads)
|
93,591
|
79,361
|
69,873
|
We seek
to improve cattle production and quality in order to obtain a
higher price through advanced breeding techniques. We cross breed
our stock of Indicus, British (Angus and Hereford) and Continental
breeds to obtain herds with characteristics better suited to the
pastures in which they graze. To enhance the quality of our herds
even further, we plan to continue improving our pastures through
permanent investment in seeds and fertilizers, an increase in the
watering troughs available in pastures, and the acquisition of
round bailers to cut and roll grass for storage
purposes.
Our
emphasis on improving the quality of our herd also includes the use
of animal health-related technologies. We comply with national
animal health standards that include laboratory analyses and
vaccination aimed at controlling and preventing disease in our
herd, particularly FMD.
Direct
costs of beef production consist primarily of crops for feeding and
dietary supplementation purposes, animal health and payroll costs,
among others.
Results
The
following table shows this activity’s results for fiscal year
2018, compared to the preceding fiscal years:
|
|
FY 2018
|
FY 2017
|
FY 2016
|
YoY var 2018 vs. 2017
|
|
|
(In
millions of Ps.)
|
%
|
||
|
Revenues
|
339
|
207
|
178
|
63.8
|
|
Costs
|
(297
)
|
(169
)
|
(137
)
|
75.7
|
|
Initial
recognition and changes in the fair value of biological assets and
agricultural produce
|
98
|
91
|
124
|
7.7
|
|
Gross profit
|
140
|
129
|
165
|
8.5
|
|
Profit from operations
|
53
|
64
|
123
|
(17.2
)
|
|
Activity profit
|
53
|
64
|
123
|
(17.2
)
|
Dairy
In
December 2017 we decided to discontinue our dairy activity
developed in the farm “El Tigre” in Argentina due to
the adverse conditions of the sector.
|
Milk
Production
|
FY2018
|
FY2017
|
FY2016
|
|
Average dairy cows
per day (heads)
|
880
|
1,472
|
1,951
|
|
Milk Production/
Dairy Cow/ Day (liters)
|
24.55
|
24.68
|
21.82
|
105
Results
The
following table shows this activity’s results for fiscal year
2018, compared to the two preceding fiscal years:
|
|
FY
2018
|
FY
2017
|
FY
2016
|
YoY
var 2018 vs. 2017
|
|
|
(In
millions of Ps.)
|
%
|
||
|
Revenues
|
91
|
97
|
65
|
(6.2
)
|
|
Costs
|
(65
)
|
(86
)
|
(61
)
|
(24.4
)
|
|
Gross
profit
|
10
|
3
|
3
|
233.3
|
|
(Loss)
from operations
|
-
|
(7
)
|
(5
)
|
(100.0
)
|
|
Activity
(loss)
|
-
|
(7
)
|
(5
)
|
(100.0
)
|
Leases
and Agricultural Services
We
lease own farms to third parties for agriculture, cattle breeding
and seed production, mainly in two types of farms. On the one hand,
we lease our farms under irrigation in the Province of San Luis
(Santa Bárbara and La Gramilla) to seed producers or enter
into production agreements whereby we render production services to
seed companies. These farms are ideal for obtaining steady
production levels, given the quality of their soil and the weather
conditions of the area, along with the even humidity provided by
irrigation.
On the
other hand, when market conditions are favorable, we lease farms
recently put into production after agricultural development. In
this way, we manage to reduce our production risk, ensuring fixed
rental income until the new farms reach stable productivity
levels.
In
addition, in this segment we include the irrigation service we
provide to our own farms leased to third parties.
Results
The
following table shows this activity’s results for fiscal year
2018, compared to the preceding fiscal years:
|
|
FY 2018
|
FY 2017
|
FY 2016
|
YoY
var 2018 vs. 2017
|
|
|
(in
millions of Ps.)
|
%
|
||
|
Revenues
|
224
|
137
|
76
|
63.5
|
|
Costs
|
(45
)
|
(26
)
|
(19
)
|
73.1
|
|
Gross profit
|
179
|
111
|
57
|
61.3
|
|
General
and administrative expenses
|
(15
)
|
(7
)
|
(3
)
|
114.3
|
|
Selling
expenses
|
(3
)
|
(1
)
|
(1
)
|
200.0
|
|
Other
operating results, net
|
-
|
(1
)
|
-
|
(100.0
)
|
|
Profit from operations
|
161
|
102
|
53
|
57.8
|
|
Activity profit
|
161
|
102
|
53
|
57.8
|
Other segments
This
segment includes, principally, feedlot farming, slaughtering and
processing in the meat refrigeration plant; among others. The
segment “Other segments” aggregate the activities
Agro-industrial and Others:
Agro-industrial
Activities
This
activity consists in the slaughtering and processing of beef in
meat packing plants.
Through
our subsidiary Sociedad Anónima Carnes Pampeanas S.A.
(“Carnes Pampeanas”) we own a meat packing plant in
Santa Rosa, Province of La Pampa, with capacity to slaughter and
process approximately 9,600 cattle heads per month.
During
the last years, the smaller supply of cattle has adversely affected
the value chain by reducing cold-storage plant utilization. This
has left several plants struggling to remain operational in view of
the poor returns and shortage of raw materials. Our investment in
Carnes Pampeanas has not escaped unscathed of this
situation.
106
Results
The
following table shows this activity’s results for fiscal year
2018, compared to preceding fiscal years:
|
|
FY2018
|
FY2017
|
FY
2016
|
YoY
var 2018 vs. 2017
|
|
|
(in
millions of Ps.)
|
%
|
||
|
Revenues
|
1,898
|
1,324
|
966
|
43.4
|
|
Costs
|
(1,816
)
|
(1,303
)
|
(925
)
|
39.4
|
|
Gross profit
|
82
|
21
|
41
|
290.5
|
|
General
and administrative expenses
|
(58
)
|
(43
)
|
(38
)
|
34.9
|
|
Selling
expenses
|
(121
)
|
(88
)
|
(67
)
|
37.5
|
|
Other
operating results, net
|
34
|
(1
)
|
1
|
-
|
|
Loss from operations
|
(63
)
|
(111
)
|
(63
)
|
(43.2
)
|
|
Activity loss
|
(63
)
|
(111
)
|
(63
)
|
(43.2
)
|
Others
This
activity includes part of our investment in Futuros y Opciones
(FyO), as crop trading is reflected in the Crops
activity.
Results
The
following table shows this activity’s results for fiscal year
2018, compared to preceding fiscal years:
|
|
FY2018
|
FY2017
|
FY
2016
|
YoY
var 2018 vs. 2017
|
|
|
(in
millions of Ps.)
|
%
|
||
|
Revenues
|
580
|
394
|
178
|
47.2
|
|
Costs
|
(452
)
|
(271
)
|
(140
)
|
66.8
|
|
Gross profit
|
128
|
123
|
38
|
4.1
|
|
General
and administrative expenses
|
(50
)
|
(29
)
|
(15
)
|
72.4
|
|
Selling
expenses
|
(60
)
|
(42
)
|
(23
)
|
42.9
|
|
Other
operating results, net
|
4
|
6
|
1
|
(33.3
)
|
|
Profit / (loss) from operations
|
22
|
58
|
1
|
(62.1
)
|
|
Share
of profit of associates and joint ventures
|
(1
)
|
(4
)
|
(3
)
|
(75.0
)
|
|
Activity profit / (loss)
|
21
|
54
|
(2
)
|
(61.1
)
|
Corporate
This
segment includes, principally, the corporative expenses related to
the agricultural business.
Results
The
following table shows the “Corporate” segment’s
results for fiscal year 2018, compared to preceding fiscal
years:
|
|
FY2018
|
FY2017
|
FY 2016
|
YoY
var 2018 vs. 2017
|
|
|
(in
millions of Ps.)
|
%
|
||
|
Revenues
|
-
|
-
|
-
|
-
|
|
Costs
|
-
|
-
|
-
|
-
|
|
Gross profit
|
-
|
-
|
-
|
-
|
|
General
and administrative expenses
|
(89
)
|
(84
)
|
(76
)
|
6.0
|
|
Loss from operations
|
(89
)
|
(84
)
|
(76
)
|
6.0
|
|
Segment loss
|
(89
)
|
(84
)
|
(76
)
|
6.0
|
Futuros
y Opciones.Com S.A. (FyO)
Futuros
y Opciones.com’s main business is crop trading (crop
brokerage, storage, futures and options, consulting and logistics
services) and sale and distribution of own inputs and third-party
products.
As
concerns the Crops business, revenues grew thanks to the increase
in invoiced volumes and prices compared to the previous fiscal
year. As well as the inputs business grew by 50% compared to the
previous year, due to the consolidation of the nutritional
specialties business.
107
During
fiscal year 2018, increased efforts were made in the
company’s cash flow analysis, generating financial income
from the investments made. Net financial income also increased
favorably compared to the previous year due to the effect of the
devaluation.
Concerning the
goals for next year, the Crops business is expected to keep growing
at the same pace as in the past years, aspiring to lead the crop
trading business and differentiating ourselves in the services
offered to clients. As concerns inputs, FyO’s goals include
consolidating its suite of products, increasing sales, improving
margins and focusing business on the sale of nutritional
specialties for the soil. Other objectives include becoming a
leading company in the knowledge of the crops markets, being
digital innovators and expanding the company’s reach into the
region.
AGROFY
S.A.U.
Agrofy,
of which CRESUD owns indirectly and through a subsidiary 35.17%,
continued to position itself in 2018 as the leading online platform
for agriculture, achieving in two years that 5,000 companies list
more than 50,000 products that are consulted by an average of 1.2
million monthly sessions in 10 different categories.
108
Farmland
Portfolio
(3)
As of
June 30, 2018, we owned, together with our subsidiaries, 23 farms,
with a total surface area of 612,230 hectares.
The
following table sets forth our farm portfolio as of June 30,
2018:
|
Use of farms owned and under concession as of June 30,
2018
|
|||||||||
|
|
Locality
|
Province
|
Date of
|
Surface
|
Main Business
|
Cattle
|
Sheep
|
Agriculture
|
Cattle
|
|
|
Locality
|
Province
|
Acquisition
|
Area (has)
|
(has)
|
(has)
|
(has)
|
(Head)
|
|
|
El
Recreo
|
Recreo
|
Catamarca
|
May
’95
|
12,395
|
Natural
woodlands
|
|
|
|
|
|
Los
Pozos
|
JV
González
|
Salta
|
May
’95
|
239,639
|
Cattle/
Agriculture/ Natural woodlands
|
43,419
|
|
14,697
|
47,489
|
|
San Nicolás
(1)
|
Rosario
|
Santa
Fe
|
May
‘97
|
1,431
|
Agriculture
|
|
|
1,409
|
|
|
Las Playas
(1)
|
Idiazabal
|
Cordoba
|
May
‘97
|
1,534
|
Agriculture
|
|
|
1,534
|
|
|
La
Gramilla/ Santa Bárbara
|
Merlo
|
San
Luis
|
Nov
‘97
|
7,072
|
Agriculture
Under irrigation
|
|
|
4,711
|
|
|
La
Suiza
|
Villa
Angela
|
Chaco
|
Jun
‘98
|
26,380
|
Agriculture/
Cattle
|
17,419
|
|
3,464
|
11,354
|
|
El
Tigre
|
Trenel
|
La
Pampa
|
Apr
‘03
|
8,360
|
Agriculture
|
240
|
|
6,695
|
2,708
|
|
San
Pedro
|
Concepción
de Uruguay
|
Entre
Rios
|
Sep
‘05
|
6,022
|
Agriculture
|
|
|
4,114
|
|
|
8
De Julio/ Estancia Carmen
|
Puerto
Deseado
|
Santa
Cruz
|
May
‘07/ Sep ‘08
|
100,911
|
Sheep
|
|
85,000
|
|
|
|
Cactus
Argentina
|
Villa
Mercedes
|
San
Luis
|
Dec
‘97
|
171
|
Natural
woodlands
|
101
|
|
|
|
|
Las Vertientes
(3)
|
Las
Vertientes
|
Cordoba
|
-
|
4
|
Silo
|
|
|
|
|
|
Las
Londras
|
Santa
Cruz
|
Bolivia
|
Nov
‘08
|
4,566
|
Agriculture
|
|
|
4,367
|
|
|
San
Rafael
|
Santa
Cruz
|
Bolivia
|
Nov
‘08
|
2,969
|
Agriculture
|
|
|
2,824
|
|
|
La
Primavera
|
Santa
Cruz
|
Bolivia
|
Jun
‘11
|
2,340
|
Agriculture
|
|
|
1,666
|
|
|
Marangatu/Udra
|
Mariscal
Estigarribia
|
Paraguay
|
Feb
‘09
|
59,490
|
Agriculture/
Natural woodlands
|
3,733
|
|
7,263
|
4,553
|
|
Finca
Mendoza
|
Lujan
de Cuyo
|
Mendoza
|
Mar
‘11
|
270
|
Natural
woodlands
|
|
|
|
|
|
Establecimiento Mendoza
(3)
|
Finca
Lavalle
|
Mendoza
|
Nov’03
|
9
|
Natural
woodlands
|
|
|
|
|
|
|
|
|
|
|
|
|
|
||
|
Jatoba
|
Jaborandi/BA
|
Brazil
|
|
30,981
|
Agriculture
|
5,005
|
|
15,887
|
8,319
|
|
Alto
Taquari
|
Alto
Taquari/MT
|
Brazil
|
|
5,394
|
Agriculture
|
|
|
3,687
|
|
|
Araucaria
|
Mineiros/GO
|
Brazil
|
|
5,534
|
Agriculture
|
|
|
4,124
|
|
|
Chaparral
|
Correntina/BA
|
Brazil
|
|
37,182
|
Agriculture
|
|
|
14,284
|
|
|
Nova
Buriti
|
Januária/MG
|
Brazil
|
|
24,211
|
Forestry
|
|
|
|
|
|
Preferência
|
Barreiras/BA
|
Brazil
|
|
17,799
|
Agriculture
/ Natural woodlands
|
6,376
|
|
|
8,121
|
|
São
José
|
São
Raimundo das Mangabeiras/MA
|
Brazil
|
|
17,566
|
Agriculture
|
|
|
10,222
|
|
|
Subtotal Owned
|
|
|
|
612,230
|
|
76,293
|
85,000
|
100,948
|
82,544
|
|
Agropecuaria
Anta SA
|
Las
Lajitas
|
Salta
|
|
132,000
|
|
1,404
|
|
24,244
|
6,584
|
|
Subtotal Under Concession
|
|
|
|
132,000
|
|
1,404
|
|
24,244
|
6,584
|
|
Total
|
|
|
|
744,230
|
|
77,697
|
85,000
|
125,192
|
89,128
|
(1) Hectares in
proportion to our 35.72% interest in Agro-Uranga S.A.
(2) Does not
include sheep or cattle in sold or rented fields.
(3) Do not include
Las Vertientes and Establecimineto Mendoza because size of the
farms.
Additional information about our Farmlands
Argentina
El Recreo
“El
Recreo” farm, located 970 kilometers northwest of Buenos
Aires, in the Province of Catamarca, was acquired in May 1995. It
has semi-arid climate and annual rainfall not in excess of 400 mm.
This farm is maintained as a productive reserve.
Los Pozos
“Los
Pozos” farm, located 1,600 kilometers northwest of Buenos
Aires, in the Province of Salta, was acquired in May 1995. This
property is located in a semi-arid area with average annual
rainfall of 500 mm. The area is naturally suited to cattle raising
and forestry activities (poles and fence posts), and it has
agricultural potential for summer crops such as sorghum and corn,
among others. For the fiscal year ended June 30, 2018, we used
14,697 hectares in agricultural production. As of June 30, 2018,
there were 47,489 heads of cattle in this farm.
109
San Nicolás
“San
Nicolás” is a 4,005 hectares farm owned by Agro-Uranga
S.A., and is located in the Province of Santa Fe, approximately 45
kilometers from the Port of Rosario. As of June 30, 2018, 6,236
hectares were planted for agricultural production, including double
crops. The farm has two plants of silos with a storage capacity of
14,950 tons.
Las Playas
“Las
Playas” farm has a surface area of 4,294 hectares and is
owned by Agro-Uranga S.A. It is located in the Province of
Córdoba, and it is used for agricultural purposes. As of June
30, 2018, the farm had a sown surface area, including double crops,
of 6,696 hectares for crop production.
La Gramilla and Santa Bárbara
These
farms have a surface area of 7,072 hectares in Valle de Conlara, in
the Province of San Luis. Unlike other areas in the Province of San
Luis, this valley has a high quality underground aquifer which
makes these farms well suited for agricultural production after
investments were made in the development of lands, wells and
irrigation equipment. In the course of the 2017/2018 crop season, a
total of 5,927 hectares were sown, 2,282 hectares of which were
sown under contractual arrangements with seed producers. We leased,
in turn, 12 hectares to third parties. The remaining hectares are
kept as land reserves.
La Suiza
“La
Suiza” farm has, at the end of the fiscal year 2018, a
surface area of 26,380 hectares and is located in Villa Ángela
in the Province of Chaco. It is used for raising cattle. As of June
30, 2017, “La Suiza” had a stock of approximately
11,354 heads of cattle. During the 2017/18 season, we used 4,286
hectares for agricultural production , including double
crops.
In June
29, 2018, Cresud sold non-related third party for the sale of a
fraction of 10,000 hectares of livestock activity of "La Suiza".
The total amount of the consideration was US$10 million, of which
US$3.0 million have been already paid. The remaining balance of
US$7 million, guaranteed by a mortgage on the property, will be
paid in ten installments of the same amount ending on June 2023,
accruing an annual interest of 4.5% over the remaining equal
consecutive balances. We reconded a gain for the transaction of
approximately to Ps.238 million.
El Tigre
“El
Tigre” farm was acquired on April 30, 2003 and has a surface
area of 8,360 hectares. This farm has a high-tech dairy facility
where we develop our milk production business in compliance with
the highest quality standards. It is located in Trenel in the
Province of La Pampa. As of June 30, 2018, 7,605 hectares were
assigned to crop production, including double crops. Our dairy
activity has been discontinued in December 2017 due to the adverse
conditions of the sector, selling all the cows in
production.
San Pedro
“San
Pedro” farm was purchased on September 1, 2005. It has a
surface area of 6,022 hectares and is located in Concepción
del Uruguay, Province of Entre Ríos, which is 305 kilometers
north of Buenos Aires. In the course of the 2017/2018 crop season,
5,057 hectares were used for agricultural production, including
double crops.
8 de Julio and Estancia Carmen
“8 de
Julio” farm was acquired on May 15, 2007, and has a surface
area of 90,000 hectares. It is located in the Department of Deseado
in the Province of Santa Cruz. Due to its large surface area, this
farm offers excellent potential for sheep production. In addition,
we believe the land has potential for future tourism and
recreational activities, as the southeast border of the farm
stretches over 20 kilometers of coast. "Estancia Carmen" was
acquired on September 5, 2008, and has a surface area of 10,911
hectares. It is located in the Province of Santa Cruz, next to our
"8 de Julio" farm.
Cactus
The
feedlot has a surface area of 171 hectares. It is located in Villa
Mercedes, Province of San Luis. Given its degree of urban
development and closeness to the city, we decided to discontinue
fattening activities in this facility.
110
Las Vertientes
The
“Las Vertientes” storage facility has a surface area of
4 hectares and 10,000 tons capacity, and is located in Las
Vertientes, Río Cuarto, in the Province of
Córdoba.
Finca Mendoza
On
March 2, 2011, the Company purchased, jointly with Zander Express
S.A., a rural property composed of thirteen plots of land located
in the District of Perdriel, Luján de Cuyo Department, in the
Province of Mendoza. As a result of this acquisition, Cresud has
become owner of a 40% undivided estate in all and each of the
properties, while Zander Express S.A. holds the remaining 60%. The
total agreed price for this transaction was US$ 4.0 million;
therefore, the amount of US$ 1.6 million was payable by
CRESUD.
On June
8, 2017, a title deed for the sale of 262 ha was signed. The total
price was US$ 2.2 million. The Group has recognized a gain of
Ps.11.8 million as a result of this transaction.
Bolivia
Las Londras
On
January 22, 2009, the bill of purchase for "Las Londras" farm was
cast into public deed; it has a surface area of 4,566 hectares, and
is located in the Province of Guarayos, Republic of Bolivia. During
the 2017/2018 crop season, it was used for crop
production.
San Rafael
On
November 19, 2008, the bill of purchase for "San Rafael" farm was
cast into public deed. This farm is located in the Province of
Guarayos, Republic of Bolivia, and has a surface area of 2,969
hectares, which were used for crop production during the 2017/2018
crop season.
La Primavera
On June
7, 2011, we acquired “La Primavera” farm, with a
surface area of approximately 2,340 hectares. During the 2017/2018
season, this farm was used for crop production.
Brazil
(through our subsidiary Brasilagro)
Jatobá
Jatobá is a
farm in the northeastern region of Brazil, with a total surface
area of 30,981 hectares, 15,887 of which are intended for
agriculture. Jatobá was acquired in March 2007 for R$ 33
million. We consider that this farm is in a very advantageous
location for the movement of crops, as it is close to the Candeias
Port, in the State of Bahia.
Araucária
Araucária is a
farm located in the municipal district of Mineiros, in the State of
Goiás, and it has a total surface area of 5,534 hectares,
4,124 of which are used for agriculture. Araucaria was acquired in
2007 for R$ 70.4 million. Before we purchased it, Araucária
had been used for crop planting. The farm was transformed, and at
present it is planted with sugarcane.
In May
2013, an area of 394 hectares (310 of which are used for
agriculture) was sold. The sale price was R$ 10.3 million. In May
2014, the sale of 1,164 hectares was agreed for a total amount of
R$ 41.3 million
In
March 2017, an area of 274 hectares was sold, of which 196 are
developed and productive hectares. The price of the sale is 1,000
bags of soybeans per hectare. The Group has recognized a gain of
Ps.29.9 million as a result of this transaction.
In May
2017, an area of 1,360 hectares was sold, of which 918 are
developed and productive hectares. The sale price is 280 bags of
soybeans per hectare. The Group has recognized a gain of Ps.37.4
million as a result of this transaction.
On May
3, 2018, has been subscribed a purchase-sale ticket for the sale of
a fraction of 956 hectares (660 productive) at a price of 1,208
bags of soybeans per hectare or R$ 61.6 million (R$ / ha 93,356).
The Group has recognized a gain of Ps.226.2 million as a result of
this transaction.
111
Alto Taquarí
Alto
Taquarí is located in the municipal district of Alto
Taquarí, State of Mato Grosso, and it has a total surface area
of 5,394 hectares, 3,687 of which are used for agriculture. The
farm was acquired in August 2007 for R$ 33.2 million. Before we
purchased it, the farm had been used for agriculture and cattle
raising. Following its transformation, it is being used for
sugarcane production.
Chaparral
Chaparral is a
37,182-hectare farm, with 14,284 hectares used for agriculture. It
is located in the municipal district of Correntina, State of Bahia.
The farm was acquired in November 2007 for R$ 47.9
million.
Nova Buriti
Located
in the municipal district of Januária, State of Minas Gerais,
Nova Buriti has a surface area of 24,211 hectares. Nova Buriti was
acquired in December 2007 for R$ 21.6 million. It is located in the
southeastern region of Brazil and it is close to the large iron
industries. At present, it is undergoing proceedings for obtaining
the environmental licenses required for starting
operations.
Preferencia
Preferência is
located in the municipal district of Barreiras, in the State of
Bahia. It has a total surface area of 17,799 hectares, 6,376 of
which are used for agricultural activities. It was acquired for R$
9.6 million in September 2008. The farm is being transformed into a
pasturing area and will be later developed for agricultural
purposes.
Sao José
Located
in São Raimundo das Mangabeiras, in the state of
Maranhão. With a total area of 17,566 hectares, of which
10,222 are destined to agricultural activity. It was acquired for a
value of R$ 100 million in February 2017.
Paraguay
(through our subsidiary Brasilagro)
Marangatú / Udra
We own,
through Brasilagro, the “Marangatú/UDRA” farms,
located in Mariscal José Félix Estigarribia, Department
of Boquerón, Paraguayan Chaco, Republic of Paraguay, totaling
59,490 hectares, out of which 7,263 hectares have been allocated to
agricultural production and 3,733 hectares to cattle
production.
Silos
As of
June 30, 2018, we had a storage capacity of approximately 25,620
tons (including 35.723% of the storage capacity of over 14,950 tons
available at Agro-Uranga).
The
following table shows, for the fiscal years presented, our storage
facilities:
|
As
of year ended June 30,
|
|||||
|
|
2018
(2)
|
2017
(2)
|
2016
(2)
|
2015
(2)
|
2014
(2)
|
|
Las Vertientes
(1)
|
10,000
|
10,000
|
10,000
|
10,000
|
10,000
|
|
San Nicolás
(1)
|
5,341
|
5,341
|
5,341
|
5,341
|
5,341
|
|
Brasilagro
|
10,279
|
10,279
|
10,279
|
10,279
|
90,200
|
|
Total
|
25,620
|
25,620
|
25,620
|
25,620
|
105,541
|
(1)
Owned by us through Agro-Uranga
(which represents 35.723% of the total capacity).
(2)
Includes Brasilagro.
Land
Management
In
contrast to traditional Argentine farms, run by families, we
centralize policy making in an Executive Committee that meets on a
weekly basis in Buenos Aires. Individual farm management is
delegated to farm managers who are responsible for farm operations.
The Executive Committee lays down commercial and production rules
based on sales, market expectations and risk
allocation.
We
rotate the use of our pasture lands between agricultural production
and cattle feeding and the frequency depends on the location and
characteristics of the farmland. The use of preservation techniques
(including exploitation by no till sowing) frequently allows us to
improve farm performance.
112
Subsequent to the
acquisition of the properties, we make investments in technology in
order to improve productivity and increase the value of the
property. It may be the case that upon acquisition, a given
extension of the property is under-utilized or the infrastructure
may be in need of improvement. We have invested in traditional
fencing and in electrical fencing, watering troughs for cattle
herds, irrigation equipment and machinery, among other
things.
Principal
Markets
Crops
Our
crop production is mostly sold in the domestic market. The prices
of our crops are based on the market prices quoted in Argentine
grains exchanges such as the Buenos Aires Grains Exchange (Bolsa de
Cereales de Buenos Aires) and the cereal exchanges in each country,
which take as reference the prices in international grains markets.
The largest part of this production is sold to exporters who offer
and ship this production to the international market. Prices are
quoted in relation to the month of delivery and the port in which
the product is to be delivered. Different conditions in price, such
as terms of storage and shipment, are negotiated between the end
buyer and ourselves.
Cattle
Our
cattle production is sold in the local market. The main buyers are
slaughterhouses and supermarkets.
Prices
in the cattle market in Argentina are basically fixed by local
supply and demand. The Liniers Market (on the outskirts of the
Province of Buenos Aires) provides a standard in price formation
for the rest of the domestic market. In this market live animals
are sold by auction on a daily basis. At Liniers Market, prices are
negotiated by kilogram of live weight and are mainly determined by
local supply and demand. Prices tend to be lower than in
industrialized countries. Some supermarkets and meat packers
establish their prices by kilogram of processed meat; in these
cases, the final price is influenced by processing
yields.
Customers
For the
fiscal year 2018, our sales from the agribusiness segment
(excluding sales of farms) were made to approximately 500
customers. Sales to our ten largest customers represented
approximately 45% to 50% of our net sales. Some of these customers
included Cargill, Granos Olavarría, Bunge Alimentos S.A., and
Amaggi & LD Commodities S.A. We have signed non-binding letters
of intent with some of our largest customers that allow us to
estimate the volume of the demand for certain products and to plan
production accordingly. We generally enter into short-term
agreements with a term of less than a year.
Marketing
Channels and Sales Methods
Crops
We
normally work with grains brokers and other intermediaries to trade
in the exchanges. We sell part of our production in advance through
futures contracts and buy and sell options to hedge against a drop
in prices. Approximately 87% of the futures and options contracts
are closed through the Buenos Aires Grains Exchange and 13% in the
Chicago Board of Trade for hedging purposes.
Our
storage capabilities allow us to condition and store crops with no
third-party involvement and thus to capitalize the fluctuations in
the price of commodities. Our largest storage facilities in
Argentina, with capacity for 10,000 tons, are located in “Las
Vertientes”, close to Río Cuarto, Province of
Córdoba. In addition, we store crops in silo bags. On the
other hand, in Brazil we have a total storage capacity of 10,279
tons.
Cattle
We have
several marketing channels. We sell directly to local meat
processors and supermarkets, as well as in markets and auctions.
Our customers include Carnes Pampeanas, Frigorífico Bermejo,
Arre Beef S.A., Sáenz Valiente Bullrich, and Colombo y
Magliano S.A. Prices are based on the price at Liniers
Market.
We are
usually responsible for the costs of the freight to the market and,
in general, we pay commissions on our transactions.
113
Inputs
The
current direct cost of our production of crops varies in relation
to each crop and normally includes the following costs: tillage,
seeds, agrochemicals and fertilizers. We buy in bulk and store
seeds, agrochemicals and fertilizers to benefit from discounts
offered during off-season sales.
Competition
The
agricultural and livestock sector is highly competitive, with a
huge number of producers. We are one of the leading producers in
Argentina and the region. However, if we compare the percentage of
our production to the country’s total figures, our production
would appear as extremely low, since the agricultural market is
highly atomized. Our leading position improves our bargaining power
with suppliers and customers. In general, we obtain discounts in
the region in the acquisition of raw materials and an excess price
in our sales.
Historically, there
have been few companies competing for the acquisition and leases of
farmlands for the purpose of benefiting from land appreciation and
optimization of yields in the different commercial activities.
However, we anticipate the possibility that new companies, some of
them international, may become active players in the acquisition of
farmlands and the leases of sown land, which would add players to
the market in coming years.
Seasonality
As is
the case with any company in the agro-industrial sector, our
business activities are inherently seasonal. Harvest and sales of
crops (corn, soybean and sunflower) in general take place from
February to June. Wheat is harvested from December to January. With
respect to our international market, in Bolivia climate conditions
allow a double season of soybean, corn and sorghum production and,
accordingly, these crops are harvested in April and October, while
wheat and sunflower are harvested during August and September,
respectively. Other segments of our activities, such as our sales
of cattle and our forestry activities tend to be more of a
successive character than of a seasonal character. However, the
production of beef is generally higher during the second quarter,
when pasture conditions are more favorable. In consequence, there
may be significant variations in results from one quarter to the
other.
Regulation
and Governmental Supervision of our Agricultural
Business
Argentina
Farming and Animal Husbandry Agreements
According to Law
No. 13,246, as amended by Law No. 22,298, all lease agreements
related to rural properties and land are required to have a minimum
duration of 3 years, except in the case of those designated as
“accidental agreements” pursuant to Section 39,
subsection a), Law No. 13,246. Upon death of the tenant farmer, the
agreement may continue with his successors. Upon misuse of the land
by the tenant farmer or default in payment of the rent, the land
owner may initiate an eviction proceeding.
Law No.
13,246, amended by Law No. 22,298, also regulates sharecropping
agreements pursuant to which one of the parties furnishes the other
with animals or land for the purpose of sharing benefits between
the parties. These agreements are required to have a minimum term
of duration of 3 years, although the rule of Section 39 of Law No.
13,246 on accidental agreements for smaller terms also applies in
this case. The agreement is not assignable under any circumstance
whatsoever, unless expressly agreed by the parties. Upon death,
disability of the tenant farmer or other impossibility, the
agreement may be terminated.
Quality control of Crops and Cattle
The
quality of the crops and the health measures applied on the cattle
are regulated and controlled by the Servicio Nacional de Sanidad y
Calidad Agroalimentaria (“SENASA”), which is an entity
within the Agro-industry Ministry that oversees farming and animal
sanitary activities.
Argentine law
establishes that the brands should be registered with each
provincial registry and that there cannot be brands alike within
the same province.
Sale and Transportation of Cattle
Even
though the sale of cattle is not specifically regulated, general
contract provisions are applicable. Further, every province has its
own rural code regulating the sale of cattle.
114
Argentine law
establishes that the transportation of cattle is lawful only when
it is done with the respective certificate that specifies the
relevant information about the cattle. The required information for
the certificate is established by the different provincial
regulations, the inter-provinces treaties and the regulations
issued by the SENASA.
Export Restriction of Beef
In
addition, the Secretary of Agriculture, Livestock, Fishing and Food
Products, within the orbit of the Ministry of Economy and Public
Finance, oversees the farming and animal sanitary
activities.
The
Secretary of Agriculture, Livestock, Fishing and Food Products is
in charge of distributing the annual regular quota of top quality
chilled beef without bones, the “Cuota Hilton.” The
destination of the Cuota Hilton is the European Union.
The
Secretary of Agriculture, Livestock, Fishing and Food Products
granted to our subsidiary Sociedad Anónima Carnes Pampeanas up
to 1,344 tons to export beef under the Cuota Hilton for the July
2018-June 2019 period.
Environment
The
development of our agribusiness activities depends on a number of
federal, provincial and municipal laws and regulations related to
environmental protection.
We may
be subject to criminal and administrative penalties, including
taking action to reverse the adverse impact of our activities on
the environment and to reimburse third parties for damages
resulting from contraventions of environmental laws and
regulations. Under the Argentine Criminal Code, persons (including
directors, officers and managers of corporations) who commit crimes
against public health, such as poisoning or dangerously altering
water, food or medicine used for public consumption and selling
products that are dangerous to health, without the necessary
warnings, may be subject to fines, imprisonment or both. Some
courts have enforced these provisions in the Argentine Criminal
Code to sanction the discharge of substances which are hazardous to
human health. At the administrative level, the penalties vary from
warnings and fines to the full or partial suspension of the
activities, which may include the revocation or annulment of tax
benefits, cancellation or interruption of credit lines granted by
state banks and a prohibition against entering into contracts with
public entities.
The
Forestry Legislation of Argentina prohibits the devastation of
forests and forested lands, as well as the irrational use of forest
products. Landowners, tenants and holders of natural forests
require an authorization from the Forestry Competent Authority for
the cultivation of forest land. The legislation also promotes the
formation and conservation of natural forests in properties used
for agriculture and farming purposes.
As of
June 30, 2015, we owned land reserves extending over 356,943
hectares, which are located in under-utilized areas where
agricultural production is not yet fully developed. We also have
107,584 hectares under concession as reserves for future
developments. We believe that technological tools are available to
improve the productivity of such land and enhance its long-term
value. However, existing or future environmental regulations may
prevent us from developing our land reserves, requiring us to
maintain a portion of such land as unproductive land
reserves.
In
accordance with legislative requirements, we have applied for
approval to develop certain parts of our land reserves and were
authorized to develop them partially and to maintain other areas as
land reserves. We cannot assure you that current or future
development applications will be approved, and if so, to what
extent we will be allowed to develop our land reserves. We intend
to use genetically modified organisms in our agricultural
activities. In Argentina, the development of genetically modified
organisms is subject to special laws and regulations and special
permits.
On
November 28, 2007, the Argentine Congress passed a law known as the
Forest Law which sets minimum standards for the conservation of
native forests and incorporates minimum provincial expenditures to
promote the protection, restoration, conservation and sustainable
use of native forests. The Forest Law prevents landowners,
including owners of native forests, from deforesting or converting
forested areas into non-forested land for other commercial uses
without prior permission from each local government that gives the
permit and requires the preparation, assessment and approval of an
environmental impact report. The Forest Law also provides that each
province should adopt its own legislation and regional regulation
map within a term of one year. Until such provincial implementation
is carried into effect, no new areas may be deforested. In
addition, the Forest Law also establishes a national policy for
sustainable use of native forests and includes the recognition of
native communities and aims to provide preferential use rights to
indigenous communities living and farming near the forest. In case
a
project affects
such communities, the relevant provincial authority may not issue
permits without formal public hearings and written consent of the
communities.
115
Besides, the Rules
issued by the CNV provide that publicly traded companies whose
corporate purpose includes environmentally hazardous activities
should report to their shareholders, investors and the general
public their compliance with the applicable environmental laws and
risks inherent to such activities, so as to be able to reasonably
assess such hazards.
Our
activities are subject to a number of national, provincial and
municipal environmental regulations. Section 41 of the Argentine
Constitution, as amended in 1994, provides that all Argentine
inhabitants have the right to a healthy and balanced environment
fit for human development and have the duty to preserve it.
Environmental damage shall bring about primarily the obligation to
redress it as provided by applicable law. The authorities shall
protect this right, the rational use of natural resources, the
preservation of the natural and cultural heritage and of
biodiversity, and shall also provide for environmental information
and education. The National Government shall establish minimum
standards for environmental protection and Provincial and Municipal
Governments shall determine specific standards and issue the
applicable regulations.
On
November 6, 2009, the Argentine Congress passed Law No. 25,675.
This law regulates the minimum standards for the achievement of a
sustainable environment and the preservation and protection of
biodiversity and sets environmental policy goals. Moreover, Law No.
25,675 establishes the activities that will be subject to an
environmental impact assessment procedure and certain requirements
applicable thereto. In addition, the Law sets forth the duties and
obligations that will be triggered by any damage to the environment
and imposes the obligation to restore it to its former condition
or, if that is not technically feasible, to pay a compensation in
lieu thereof. The Law also fosters environmental education and
provides for certain minimum obligations to be fulfilled by natural
and artificial persons.
Leases
Laws
and regulations governing the acquisition and transfer of real
estate, as well as municipal zoning ordinances, are applicable to
the development and operation of the Company’s
properties.
Currently,
Argentine law does not specifically regulate shopping mall lease
agreements. Since our shopping mall leases generally differ from
ordinary commercial leases, we have created provisions which govern
the relationship with our shopping mall tenants.
Argentine
law imposes certain restrictions on property owners,
including:
● a
prohibition to include price indexation clauses based on inflation
increases in lease agreements; and
● a two-year
minimum lease term is established for all purposes, except in
particular cases such as embassy, consulate or international
organization venues, room with furniture for touristic purposes for
less than three months, custody and bailment of goods, exhibition
or offering of goods in fairs or in cases where they are entered
into for a specific purpose expressly stated in the agreement that
is usually fulfilled within an agreed shorter term.
Rent Increase
In
addition, there are at present contradictory court rulings with
respect to whether the rent price can or cannot be increased during
the term of the lease agreement. Most of our lease agreements have
incremental rent increase clauses that are not based on any
official index. As of the date of this document, no tenant has
filed any legal action against us challenging incremental rent
increases, but we cannot assure that such actions will not be filed
in the future and, if any such actions were successful, that they
will not have an adverse effect on our company.
116
Limits on lease terms
Under
the Argentine Civil and Commercial Code lease terms may not exceed
fifty years, irrespective of the intended use of the property (save
in case of residential use, where the maximum term is twenty
years). Generally, terms in its lease agreements go from 3 to 10
years.
Early termination rights
The
Argentine Civil and Commercial Code provides that tenants of
properties may declare the early termination of lease agreements
after the first six months of the effective date. Such termination
is subject to penalties which range from one to one and a half
months of rent. If the tenant terminates the agreement during the
first year of the lease, the penalty is one and a half
month’s rent and, if the termination occurs after the first
year of lease, the penalty is one month’s rent.
It should be
noted that the Argentine Civil and Commercial Code became effective
on August 1, 2015 and that, among other rules, it repealed the
Urban Lease Law (No. 23,091), which provided for a rule similar to
the one described above, but (i) it established the obligation to
give at least 60 days’ prior notice of exercise of the early
termination right by the tenant; and (ii) it set forth in its
Section 29 that its provisions were mandatory. There are no court
rulings yet with respect to the new regulations related to: (i)
unilateral right to termination by tenant; i.e. whether the parties
may waive the tenant’s right to terminate the agreement
unilaterally; or in relation to (ii) the possibility of
establishing a penalty different from the penalty described above
in the event of unilateral termination by the lessee.
Other
Most of
our leases provide that the tenants pay all costs and taxes related
to the property in proportion to their respective leasable areas.
In the event of a significant increase in the amount of such costs
and taxes, the Argentine government may respond to political
pressure to intervene by regulating this practice, thereby
adversely affecting our rental income. The Argentine Civil and
Commercial Procedural Code enables the lessor to pursue collection
of outstanding rental payments through an “executory
proceeding” upon lessee’s payment default. In executory
proceedings debtors have fewer defenses available to prevent
foreclosure, making these proceedings substantially shorter than
ordinary ones. In executory proceedings, the origin of the debt is
not under discussion; the trial focuses on the formalities of debt
instrument itself. The Procedural Code also permits special
eviction proceedings, which are carried out in the same way as
ordinary proceedings. The Argentine Civil and Commercial Code
requires that a notice be given to the tenant demanding payment of
the amounts due in the event of breach prior to eviction, of no
less than ten days for leases for residential purposes, and
establishes no limitation or minimum notice for leases for other
purposes. However, historically, large court dockets and numerous
procedural hurdles have resulted in significant delays to eviction
proceedings, which generally last from six months to two years from
the date of filing of the suit to the time of actual
eviction.
Development and Use of the Land
Buenos
Aires Urban Planning Code. Our real estate activities are subject
to several municipal zoning, building, occupation and environmental
regulations. In the City of Buenos Aires, where the vast majority
of the real estate properties are located, the Buenos Aires Urban
Planning Code (Código de Planeamiento Urbano de la Ciudad de
Buenos Aires) generally restricts the density and use of property
and controls physical features of improvements on property, such as
height, design, set-back and overhang, consistent with the
city’s urban landscape policy. The administrative agency in
charge of the Urban Planning Code is the Secretary of Urban
Planning of the City of Buenos Aires.
Buenos
Aires Building Code. The Buenos Aires Building Code (Código de
Edificación de la Ciudad de Buenos Aires) supplements the
Buenos Aires Urban Planning Code and regulates the structural use
and development of property in the City of Buenos Aires. The Buenos
Aires Building Code requires builders and developers to file
applications for building permits, including the submission to the
Secretary of Work and Public Services (Secretaría de Obras y
Servicios Públicos) of architectural plans for review, to
assure compliance therewith.
We
believe that all of our real estate properties are in material
compliance with all relevant laws, ordinances and
regulations.
117
Sales and Ownership
Buildings Law.
Buildings Law No. 19,724 (Ley de Pre horizontalidad) was repealed
by the new Argentine Civil and Commercial Code which became
effective on August 1, 2015. The new regulations provide that for
purposes of execution of agreements with respect to built units or
units to be built under this regime, the owner is required to
purchase insurance in favor of prospective purchasers against the
risk of frustration of the operation pursuant to the agreement for
any reason. A breach of this obligation prevents the owner from
exercising any right against the purchaser – such as
demanding payment of any outstanding installments due –
unless he/she fully complies with his/her obligations, but does not
prevent the purchaser from exercising its rights against
seller.
Protection for the
Disabled Law. The Protection for the Disabled Law No. 22,431,
enacted on March 20, 1981, as amended, provides that in connection
with the construction and renovation of buildings, obstructions to
access must be eliminated in order to enable access by handicapped
individuals. In the construction of public buildings, entrances,
transit pathways and adequate facilities for mobility-impaired
individuals must be provided for.
Buildings
constructed before the enforcement of the Protection for the
Disabled Law must be adapted to provide accesses, transit pathways
and adequate facilities for mobility-impaired
individuals.
Those
pre-existing buildings, which due to their architectural design may
not be adapted to the use by mobility-impaired individuals, are
exempted from the fulfillment of these requirements.
The
Protection for the Disabled Law provides that residential buildings
must ensure access by mobility-impaired individuals to elevators
and aisles. Architectural requirements refer to pathways, stairs,
ramps and parking.
Real
Estate Installment Sales Law. The Real Estate Installment Sales Law
No. 14,005, as amended by Law No. 23,266 and Decree No. 2015/85,
imposes a series of requirements on contracts for the sale of
subdivided real estate property regarding, for example, the sale
price which is paid in installments and the deed, which is not
conveyed until final payment of such price. The provisions of this
law require, among other things:
The
registration of the intention to sell the property in subdivided
plots with the Real Estate Registry (Registro de la Propiedad
Inmueble) corresponding to the jurisdiction of the property.
Registration will only be possible with regard to unencumbered
property. Mortgaged property may only be registered where creditors
agree to divide the debt in accordance with the subdivided plots.
However, creditors may be judicially compelled to agree to the
division.
The
preliminary registration with the Real Estate Registry of the
purchase instrument within 30 days of execution of the
agreements.
Once
the property is registered, the installment sale may not occur in a
manner inconsistent with the Real Estate Installment Sales Law,
unless seller registers its decision to desist from the sale in
installments with the Real Estate Registry. In the event of a
dispute over the title between the purchaser and third-party
creditors of the seller, the installment purchaser who has duly
registered the purchase instrument with the Real Estate Registry
will obtain the deed to the plot. Further, the purchaser can demand
conveyance of title after at least 25% of the purchase price has
been paid, although the seller may demand a mortgage to secure
payment of the balance of the purchase price.
After
payment of 25% of the purchase price or the construction of
improvements on the property equal to at least 50% of the property
value, the Real Estate Installment Sales Law prohibits the
termination of the sales contract for failure by the purchaser to
pay the balance of the purchase price. However, in such event, the
seller may take action under any mortgage on the
property.
Other
Regulations
Consumer
Relationship. Consumer or End User Protection. The Argentine
Constitution expressly establishes in Section 42 that consumers and
users of goods and services have a right to protection of health,
safety and economic interests in a consumer relationship. Consumer
Protection Law No. 24,240, as amended, regulates several issues
concerning the protection of consumers and end users in a consumer
relationship, in the arrangement and execution of
contracts.
The
Consumer Protection Law, and the applicable sections of the
Argentine Civil and Commercial Code are intended to regulate the
constitutional right conferred under the Constitution on the
weakest party of the consumer relationship and prevent potential
abuses deriving from the stronger bargaining position of vendors of
goods and services in a mass-market economy where standard form
contracts are widespread.
118
As a
result, the Consumer Protection Law and the Argentine Civil and
Commercial Code deem void and unenforceable certain contractual
provisions included in consumer contracts entered into with
consumers or end users, including those which:
● deprive
obligations of their nature or limit liability for
damages;
● imply a
waiver or restriction of consumer rights and an extension of seller
rights; and
● impose the
shifting of the burden of proof against consumers.
In
addition, the Consumer Protection Law imposes penalties ranging
from warnings to fines from Ps.100 to Ps.5,000,000, the seizure of
merchandise, closing down of establishments for a term of up to
thirty (30) days, suspension of up to 5 years in the State
suppliers register, the forfeiture of concession rights,
privileges, tax regimes or special credits to which the sanctioned
party was entitled. These penalties may be imposed separately or
jointly.
The
Consumer Protection Law and the Argentine Civil and Commercial Code
define consumers or end users as the individuals or legal entities
that acquire or use goods or services free of charge or for a price
for their own final use or benefit or that of their family or
social group. In addition, both laws provide that those who though
not being parties to a consumer relationship as a result thereof
acquire or use goods or services, for consideration or for
non-consideration, for their own final use or that of their family
or social group are entitled to such protection rights in a manner
comparable to those engaged in a consumer
relationship.
In
addition, the Consumer Protection Law defines the suppliers of
goods and services as the individuals or legal entities, either
public or private, that in a professional way, even occasionally,
produce, import, distribute or commercialize goods or supply
services to consumers or users.
The
Argentine Civil and Commercial Code defines a consumer agreement as
such agreement that is entered into between a consumer or end user
and an individual or legal entity that acts professionally or
occasionally or a private or public company that manufactures goods
or provides services, for the purpose of acquisition, use or
enjoyment of goods or services by consumers or users for private,
family or social use.
It is
important to point out that the protection under the laws afforded
to consumers and end users encompasses the entire consumer
relationship process (from the offering of the product or service)
and it is not only based on a contract, including the consequences
thereof.
In
addition, the Consumer Protection Law establishes a joint and
several liability system under which for any damages caused to
consumers, if resulting from a defect or risk inherent in the thing
or the provision of a service, the producer, manufacturer,
importer, distributor, supplier, seller and anyone who has placed
its trademark on the thing or service shall be liable.
The
Consumer Protection Law excludes the services supplied by
professionals that require a college degree and registration in
officially recognized professional organizations or by a
governmental authority. However, this law regulates the
advertisements that promote the services of such
professionals.
The
Consumer Protection Law determines that the information contained
in the offer addressed to undetermined prospective consumers, binds
the offeror during the period in which the offer takes place and
until its public revocation. Further, it determines that
specifications included in advertisements, announcements,
prospectuses, circulars or other media bind the offeror and are
considered part of the contract entered into by the
consumer.
Pursuant to
Resolution No. 104/05 issued by the Secretariat of Technical
Coordination reporting to the Argentine Ministry of Economy, the
Consumer Protection Law adopted Resolution No. 21/2004 issued by
the Mercosur's Common Market Group which requires that those who
engage in commerce over the Internet (E-Business) shall disclose in
a precise and clear manner the characteristics of the products
and/or services offered and the sale terms. Failure to comply with
the terms of the offer is deemed an unjustified denial to sell and
gives rise to sanctions.
On
September 17, 2014, a new Consumer Protection Law was enacted by
the Argentine Congress –Law No. 26,993–. This law,
known as “System for Conflict Resolution in Consumer
Relationships,” provided for the creation of new
administrative and judicial procedures for this field of Law. It
created a two-instance administrative system: the Preliminary
Conciliation Service for Consumer Relationships (Servicio de
Conciliación Previa en las Relaciones de Consumo, COPREC) and
the Consumer Relationship Audit, and a number of courts assigned to
resolution of conflicts between consumers and producers of goods
and services (Fuero Judicial Nacional de Consumo). In order to file
a claim, the amount so claimed should not exceed a fixed amount
equivalent to 55 adjustable minimum living wages, which are
determined by the Ministry of Labor, Employment and Social
Security. The claim
is required to be filed with the administrative agency. If an
agreement is not reached between the parties, the claimant may file
the claim in court. The administrative system known as Preliminary
Conciliation Service for Consumer Relationships (COPREC) is
currently in full force and effect. However, the court system
(fuero judicial nacional de consumo) is not in force yet,
therefore, any court claims should be currently filed with the
existing applicable courts. A considerable volume of claims filed
against us are expected to be settled pursuant to the system
referred to above, without disregarding the full force and effect
of different instances for administrative claims existing in the
provincial sphere and the City of Buenos Aires, which remain in
full force and effect, where potential claims related to this
matter could also be fild.
119
Antitrust
Law
Law No.
25,156, as amended, prevents anticompetitive practices and requires
administrative authorization for transactions that according to the
Antitrust Law would lead to economic concentration. According to
this law, such transactions would include mergers, transfers of
goodwill, acquisitions of property or rights over shares, capital
or other convertible securities, or similar operations by which the
acquirer controls or substantially influences a company. Whenever
such a transaction involves a company or companies with accumulated
sales volume greater than Ps.200.0 million in Argentina, then the
respective transaction should be submitted for approval to the
Argentine Antitrust Authority (Comisión Nacional de Defensa de
la Competencia, or “CNDC”). The request for
authorization may be filed, either prior to the transaction or
within a week after its completion.
When a
request for authorization is filed, the CNDC may (i) authorize the
transaction, (ii) subordinate the authorization of the transaction
to the accomplishment of certain conditions, or (iii) reject the
authorization.
The
Antitrust Law provides that economic concentrations in which the
transaction amount and the value of each of the assets absorbed,
acquired, transferred or controlled in Argentina does not exceed
Ps.20 million are exempted from the administrative authorization.
Notwithstanding the foregoing, when all transactions effected in
the last twelve months exceed in total Ps.20 million or in total
Ps.60 million in the last 36 months, these transactions must be
notified to the CNDC.
As
Cresud’s consolidated annual sales volume exceeds Ps.200
million, we should give notice to the CNDC of any concentration
within the scope of the Antitrust Law.
Taxes on the Transfer of Property and Sale of Meat and
Grains
Value Added Tax.
This tax is applicable
to the sale of personal property, the hiring of works, the
rendering of services and the import of goods and services operated
in Argentina. The general tax rate is 21%.
The
value added tax law imposes a reduced rate, equal to 10.5% on the
sale price of live animals (including cattle, sheep, camels and
goats) as well as their meat and edible remains, fruits and
vegetables, all of which whether fresh, chilled, or frozen, which
have not undergone any cooking or manufacturing process turning
them into a manufactured product. This 10.5% reduced rate is also
applicable to the sale of grains (cereals and oilseeds, excluding
rice), and dry pulses (beans, peas, and lentils). In the case of
milk, the sale is subject to a 21% rate (except for sales to final
consumers, the federal government, the provinces, municipalities or
the City of Buenos Aires or any subordinate agencies, school or
university kitchens, health funds or entities under the scope of
paragraphs e), f), g) and m) of Section 20 of the Income Tax Law,
which are exempt).
The
sale of land and immovable property is not subject to this
tax.
Gross Sales Tax
. This is a local tax
(collected by the provinces and the City of Buenos Aires) that
levies gross revenues derived from the ordinary development of a
given business for profit. When the same business is developed in
more than one jurisdiction, the tax is applicable pursuant to the
regulations set forth in the Multilateral Agreement, which
establishes the proportions allocable to each of the jurisdictions
involved, so as to prevent double or multiple taxation. In the City
of Buenos Aires, gross revenues derived from livestock raising and
milk production are subject to this tax at a general rate of 1%. In
certain provinces, the sale or primary goods is not
taxable.
Stamp Tax
. This is a local tax that 23
provinces and the City of Buenos Aires collect based on similar
rules regarding subject matter, tax base and rates. In general,
this tax is levied on instrumented acts,
i.e.
executed and delivered by means of
documents (e.g. acts related to the constitution, transmission, or
expiration of rights, contracts, contracts for sales of stock and
company shares, public deeds relating to real property,
etc.).
Both in
the Province and the City of Buenos Aires (federal district) the
stamp tax rate applicable to the transfer by public deed of real
property is 3.6%. The purchase and sale of real estate through
public deed, however, is not taxable –up to a certain value
of the property- if the real estate is used for permanent dwelling
purposes, and provided that it is the only property owned by the
purchaser.
120
Urban Properties and Investments Business (through our subsidiary
IRSA)
We
decided to break down the operations of our subsidiary IRSA into an
Operation Center in Argentina and an Operation Center in Israel.
From the Operation Center in Argentina, we, through IRSA and its
subsidiaries, manage the businesses in Argentina and the
international investments in the Lipstick Building in New York and
the Condor Hospitality Trust Hotel REIT. From the Operation Center
in Israel, we manage IDBD and DIC. As of June 30, 2018, our
investment in IRSA’s common shares amounts to
63.74%.
Description
of main operations
Operation Center in Argentina.
Shopping
Malls
As of
June 30, 2018, IRSA owns, through its subsidiary IRSA CP, a
majority interest in a portfolio of 16 shopping malls in Argentina,
15 of which are operated by IRSA CP. Of IRSACP´S 16 shopping
malls, seven are located in the City of Buenos Aires, two in the
greater Buenos Aires area, and the rest located in different
provinces of Argentina (Alto Noa in the City of Salta, Alto Rosario
in the City of Rosario, Mendoza Plaza in the City of Mendoza,
Córdoba Shopping Villa Cabrera and Patio Olmos, operated by a
third party, in the City of Córdoba, La Ribera Shopping in
Santa Fe, through a joint venture, and Alto Comahue in the City of
Neuquén). On November 2018, IRSA plans to return Buenos Aires
Design to the city of Buenos Aires since the concession agreement
under which we operate will expire.
The
shopping malls IRSA operates comprise, as of June 30, 2018, a total
of 344,025 square meters (3,703,054 square feet) of gross leasable
area. Total tenant sales in IRSA´s shopping malls, as reported
by retailers, were Ps.43,130 million for the fiscal year ended
June 30, 2018 and Ps.34,426 million for fiscal year ended June
30, 2017, representing an increase of 25.3%. Tenant sales at
IRSA´s shopping malls are relevant to their revenues and
profitability because they are one of the factors that determine
the amount of rent that they charge our tenants. They also affect
the tenants’ overall occupancy costs as a percentage of the
tenant’s sales.
For the
fiscal year ended June 30, 2018, IRSA´s shopping malls
welcomed 110 million visitors and compared to 106 million for
the fiscal year ended June 30, 2017.
The
following graphic illustrates the total number of visitors at
IRSA´s shopping malls for the period from June 30,
2011-2018.
Total Number of Visitors Per Fiscal Year at IRSA´s Shopping
Malls
(in millions)
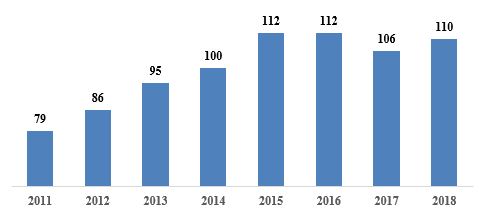
121
The
following table shows certain information concerning IRSA´s
shopping malls as of June 30, 2018:
|
Shopping
malls
|
Date
ofacquisition/development
|
Location
|
GLA(sqm)
(1)
|
Numberof
stores
|
Occupancyrate
(2)
|
Ourownershipinterest
|
Rental
revenue
|
|
|
|
|
|
|
(%)
|
(%)
|
(in
thousands of Ps.)
|
|
Alto
Palermo
|
Dec-97
|
City of Buenos
Aires
|
18,648
|
136
|
99.5
|
100.0
|
612,231
|
|
Abasto
Shopping
(3)
|
Nov-99
|
City of Buenos
Aires
|
36,796
|
170
|
99.1
|
100.0
|
619,216
|
|
Alto
Avellaneda
|
Dec-97
|
Province of Buenos
Aires
|
38,422
|
132
|
98.9
|
100.0
|
425,835
|
|
Alcorta
Shopping
|
Jun-97
|
City of Buenos
Aires
|
15,746
|
114
|
99.8
|
100.0
|
295,145
|
|
Patio
Bullrich
|
Oct-98
|
City of Buenos
Aires
|
11,397
|
86
|
97.1
|
100.0
|
169,028
|
|
Buenos Aires
Design
(4)
|
Nov-97
|
City of Buenos
Aires
|
13,735
|
62
|
96.1
|
53.68
|
63,257
|
|
Dot Baires
Shopping
|
May-09
|
City of Buenos
Aires
|
49,407
|
157
|
99.5
|
80.0
|
403,324
|
|
Soleil Premium
Outlet
|
Jul-10
|
Buenos Aires
Province
|
15,214
|
79
|
97.7
|
100.0
|
154,281
|
|
Distrito
Arcos
|
Dec-14
|
City of Buenos
Aires
|
14,169
|
68
|
99.7
|
90.0
|
158,452
|
|
Alto Noa
Shopping
|
Mar-95
|
Salta
|
19,063
|
88
|
96.8
|
100.0
|
110,981
|
|
Alto Rosario
Shopping
(5)
|
Nov-04
|
Santa
Fe
|
33,358
|
141
|
99.5
|
100.0
|
294,709
|
|
Mendoza Plaza
Shopping
|
Dec-94
|
Mendoza
|
42,867
|
141
|
98.3
|
100.0
|
177,865
|
|
Córdoba
Shopping
|
Dec-06
|
Córdoba
|
15,276
|
105
|
100.0
|
100.0
|
108,422
|
|
La Ribera
Shopping
(6)
|
Aug-11
|
Santa
Fe
|
10,530
|
68
|
94.9
|
50.0
|
36,197
|
|
Alto
Comahue
|
Mar-15
|
Neuquén
|
9,397
|
99
|
94.4
|
99.9
|
75,939
|
|
Patio
Olmos
(7)
|
Sep-07
|
Córdoba
|
—
|
—
|
—
|
—
|
—
|
|
Total
|
|
|
344,025
|
1,646
|
98.5
|
|
3,704,882
|
(1)
Gross leasable area of each property. Excludes common areas and
parking spaces.
(2)
Calculated by dividing occupied square meters by leasable
area.
(3)
Excludes Museo de los Niños (3,732 square
meters).
(4)
Concession Agreement is set to expire on November
2018.
(5)
Excludes Museo de los Niños (1,261 square
meters).
(6)
Owned through our joint venture Nuevo Puerto Santa
Fe S.A.
(7)
IRSA CP owns the historic building in the province of Cordoba where
Patio Olmos shopping is located, which mall is operated by a third
party.
122
The
following table sets forth the total retail sales for each of
IRSA´s shopping mall tenants for the fiscal years
indicated:
|
|
For
the fiscal years ended June 30,
|
||
|
|
2018
|
2017
|
2016
|
|
|
(in
millions of Ps.)
|
||
|
Alto
Palermo
|
5,034
|
4,169
|
3,499
|
|
Abasto
Shopping
|
5,674
|
4,604
|
4,043
|
|
Alto
Avellaneda
|
5,459
|
4,344
|
3,776
|
|
Alcorta
Shopping
|
2,754
|
2,207
|
1,899
|
|
Patio
Bullrich
|
1,526
|
1,236
|
1,061
|
|
Buenos Aires
Design
(1)
|
701
|
537
|
414
|
|
Dot Baires
Shopping
|
4,701
|
3,748
|
3,254
|
|
Soleil Premium
Outlet
|
2,224
|
1,726
|
1,282
|
|
Distrito
Arcos
|
1,831
|
1,455
|
962
|
|
Alto Noa
Shopping
|
1,983
|
1,587
|
1,325
|
|
Alto Rosario
Shopping
|
4,085
|
3,175
|
2,627
|
|
Mendoza Plaza
Shopping
|
3,441
|
2,734
|
2,369
|
|
Córdoba
Shopping Villa Cabrera
|
1,405
|
1,178
|
991
|
|
La Ribera
Shopping
(2)
|
1,030
|
771
|
634
|
|
Alto
Comahue
|
1,282
|
954
|
717
|
|
Total
sales
|
43,130
|
34,426
|
28,854
|
(1)
Concession agreement is set to expire on November 2018. We plan to
return the property to the City of Buenos Aires.
(2)
Owned by Nuevo Puerto Santa Fé S.A., in which IRSA´s a
joint venture partner.
Total sales by type of business
The
following table sets forth the retail sales of IRSA´s shopping
mall tenants by type of business for the fiscal years
indicated:
|
|
For
the fiscal years ended June 30,
|
||
|
|
2018
|
2017
|
2016
|
|
|
(in
millions of Ps.)
|
||
|
Anchor
Store
|
2,477
|
1,875
|
1,590
|
|
Clothing and
footwear
|
22,499
|
18,463
|
15,156
|
|
Entertainment
|
1,332
|
1,178
|
1,021
|
|
Home
|
1,210
|
957
|
784
|
|
Electronic
appliances
|
5,321
|
4,064
|
3,861
|
|
Restaurant
|
4,746
|
3,671
|
2,723
|
|
Miscellaneous
|
5,089
|
3,963
|
3,368
|
|
Services
|
456
|
255
|
351
|
|
Total
|
43,130
|
34,426
|
28,854
|
Occupancy rate
The
following table sets forth the occupancy rate expressed as a
percentage of gross leasable area of each of IRSA´s shopping
malls for the fiscal years indicated:
|
|
As
of June 30,
|
||
|
|
2018
|
2017
|
2016
|
|
|
(%)
|
||
|
Abasto
|
99.1
%
|
96.8
%
|
99.8
%
|
|
Alto
Palermo
|
99.5
%
|
99.3
%
|
99.5
%
|
|
Alto
Avellaneda
|
98.9
%
|
99.3
%
|
100.0
%
|
|
Alcorta
Shopping
|
99.8
%
|
98.1
%
|
89.1
%
|
|
Patio
Bullrich
|
97.1
%
|
97.6
%
|
99.1
%
|
|
Alto
Noa
|
96.8
%
|
99.4
%
|
100.0
%
|
|
Buenos Aires
Design
|
96.1
%
|
97.2
%
|
95.7
%
|
|
Mendoza
Plaza
|
98.3
%
|
97.1
%
|
95.2
%
|
|
Alto
Rosario
|
99.5
%
|
99.6
%
|
100.0
%
|
|
Córdoba
Shopping Villa Cabrera
|
100.0
%
|
98.1
%
|
99.2
%
|
|
Dot Baires
Shopping
|
99.5
%
|
99.9
%
|
100.0
%
|
|
Soleil Premium
Outlet
|
97.7
%
|
100.0
%
|
100.0
%
|
|
La Ribera
Shopping
|
94.9
%
|
97.6
%
|
99.3
%
|
|
Distrito
Arcos
|
99.7
%
|
100.0
%
|
97.0
%
|
|
Alto
Comahue
|
94.4
%
|
96.4
%
|
96.6
%
|
|
Porcentaje
Total
|
98.5
%
|
98.5
%
|
98.4
%
|
123
Rental price
The
following table shows the annual average rental price per square
meter for the fiscal years indicated:
(1)
|
|
For
the fiscal years endedJune 30,
|
||
|
|
2018
|
2017
|
2016
|
|
|
(in
Ps.)
|
||
|
Abasto
Shopping
|
16,828
|
14,736
|
9,964
|
|
Alto
Palermo
|
32,831
|
26,765
|
21,819
|
|
Alto
Avellaneda
|
11,083
|
9,537
|
7,801
|
|
Alcorta
Shopping
|
18,744
|
15,267
|
12,217
|
|
Patio
Bullrich
|
14,831
|
12,399
|
10,473
|
|
Buenos Aires
Design
|
4,776
|
4,077
|
3,403
|
|
Dot Baires
Shopping
|
8,385
|
6,727
|
5,468
|
|
Soleil Premium
Outlet
|
10,141
|
7,583
|
6,048
|
|
Distrito
Arcos
|
14,585
|
8,192
|
7,274
|
|
Alto Noa
Shopping
|
5,822
|
4,644
|
3,977
|
|
Alto Rosario
Shopping
|
8.835
|
7,772
|
6,299
|
|
Mendoza Plaza
Shopping
|
4,149
|
3,458
|
2,952
|
|
Córdoba
Shopping Villa Cabrera
|
7,098
|
5,682
|
4,512
|
|
La Ribera
Shopping
|
3,444
|
2,814
|
2,222
|
|
Alto
Comahue
|
11,694
|
5,956
|
5,017
|
(1)
Corresponds to consolidated annual accumulated rental prices
divided by gross leasable square meters. Does not include income
from Patio Olmos.
Accumulated rental income
The
following table shows the accumulated rental income for the fiscal
years indicated
:
|
|
For
the fiscal years ended June 30, (1)
|
||
|
|
2018
|
2017
|
2016
|
|
|
(in
thousands of Ps.)
|
||
|
Alto
Palermo
|
612,231
|
507,048
|
413,815
|
|
Abasto
Shopping
|
619,216
|
542,219
|
403,231
|
|
Alto
Avellaneda
|
425,835
|
343,930
|
279,949
|
|
Alcorta
Shopping
|
295,145
|
238,355
|
193,959
|
|
Patio
Bullrich
|
169,028
|
145,803
|
123,395
|
|
Buenos Aires
Design(2)
|
63,257
|
55,837
|
47,160
|
|
Dot Baires
Shopping
|
403,324
|
332,968
|
271,411
|
|
Soleil Premium
Outlet
|
154,281
|
115,468
|
84,615
|
|
Distrito
Arcos
|
158,452
|
120,351
|
81,252
|
|
Alto Noa
Shopping
|
110,981
|
88,515
|
75,724
|
|
Alto Rosario
Shopping
|
294,709
|
247,190
|
189,335
|
|
Mendoza Plaza
Shopping
|
177,865
|
148,239
|
124,118
|
|
Córdoba
Shopping Villa
Cabrera
|
108,422
|
87,752
|
70,302
|
|
La Ribera
Shopping(3)
|
36,197
|
28,293
|
21,884
|
|
Alto
Comahue
|
75,939
|
58,161
|
49,611
|
|
Total
|
3,704,882
|
3,060,134
|
2,429,763
|
(1) Includes Base
Rent, Percentage Rent, Admission Rights, Fees, Parking,
Commissions, Revenues from non-traditional advertising and Others.
Does not include Patio Olmos.
(2) Concession
agreement is set to expire on November 2018. We plan to return the
property to the City of Buenos Aires.
(3) Through our
joint venture Nuevo Puerto Santa Fé S.A.
124
Lease expirations
The
following table sets forth the schedule of estimated lease
expirations for IRSA’s shopping malls for leases in effect as
of June 30, 2018, assuming that none of IRSA’s tenants
exercise their option to renew or terminate their leases prior to
expiration:
|
|
As
of June 30, 2018
|
||||
|
Expiration
|
Number
ofagreements/stores
(1)
|
Square
metersdue to expire
|
Due
toexpire(%)
|
Amount
of leasepayments(in million of Ps.)
(3)
|
Agreements(%)
|
|
Vacant
stores
|
48
|
5,255
|
1.5
%
|
|
|
|
As of June 30,
2018
|
498
|
102,841
|
29.9
%
|
557.6
|
28.9
%
|
|
As of June 30,
2019
|
404
|
81,323
|
23.6
%
|
553.6
|
28.7
%
|
|
As of June 30,
2020
|
454
|
109,046
|
31.7
%
|
527.5
|
27.4
%
|
|
As of June 30, 2021
and subsequent years
|
242
|
45,560
|
13.2
%
|
289.1
|
15.0
%
|
|
Total
|
1,646
|
344,025
|
100.0
%
|
1,927.8
|
100.0
%
|
(1) Includes vacant
stores as of June 30, 2018. A lease may be associated with one or
more stores.
(2) Does not
reflect our ownership interest in each property.
(3) Reflects the
annual Base Rent of agreements due to expire as of June 30,
2018.
Five largest tenants of the portfolio
The
five largest tenants of the portfolio (in terms of sales) conforms
approximately 16% of their gross leasable area as of June 30, 2018
and represent approximately 9.2% of the annual base rent for the
fiscal year ending on that date.
New leases and renewals
The
following table shows certain information about IRSA´s lease
agreements as of June 30, 2018:
|
|
Number
ofagreements
|
Annualbase
rentamount (in millions of Ps.)
|
Annual
admission rights amount
(in
millions of Ps.)
|
Average
annual baserent per sqm (Ps.)
|
Number
of non-renewed agreements
(1)
|
Non-renewed
agreements (1) annual base rent amount
(in
millions of Ps.)
|
|
|
Type
of business
|
|
|
|
New
andrenewed
|
Formeragreements
|
|
|
|
Clothing and
footwear
|
307
|
31.3
|
92.2
|
9,783.7
|
7,448.4
|
645
|
1,031.1
|
|
Restaurant
|
55
|
5.2
|
12.7
|
11,754.9
|
8,270.7
|
155
|
177.6
|
|
Miscellaneous(2)
|
54
|
5.2
|
17.2
|
8,513.9
|
5,881.7
|
173
|
199.3
|
|
Home
|
26
|
4.2
|
6.7
|
2,690.5
|
1,748.4
|
116
|
162.2
|
|
Services
|
14
|
0.6
|
1.4
|
8,496.6
|
5,378.0
|
47
|
46.5
|
|
Entertainment
|
6
|
1.3
|
1.3
|
1,281.9
|
716.3
|
22
|
51.5
|
|
Anchor
Store
|
2
|
0.8
|
0
|
1,259.0
|
119.1
|
4
|
32.2
|
|
Total
|
464
|
48.6
|
131.5
|
6,463.8
|
4,654.4
|
1,162
|
1,700.5
|
(1)
Includes vacant stores as of June 30, 2018. Gross leasable area
with respect to such vacant stores is included under the type of
business of the last tenant to occupy such stores.
(2)
Miscellaneous includes anchor store.
Principal Terms of our Leases
Under
the Argentine Civil and Commercial Code lease terms may not exceed
20 or 50 years, except for leases regulated by Law
No. 25,248 which states leases on real property are not
subject to term restrictions. Generally, terms of IRSA’s
lease agreements range from three to ten years.
Leasable space in
IRSA’s shopping malls is marketed through an exclusive
arrangement with our wholly owned subsidiary and real estate broker
Fibesa S.A., or “Fibesa.” IRSA uses a standard
lease agreement for most tenants at its shopping malls, the terms
and conditions of which are described below. However, IRSA’s
largest or “anchor” tenants generally negotiate better
terms for their respective leases. No assurance can be given that
lease terms will be as set forth in the standard lease
agreement.
Rent
amount specified in our leases generally is the higher of
(i) a monthly Base Rent and (ii) a specified percentage
of the tenant’s monthly gross sales in the store, which
generally ranges between 2% and 10% of tenant’s gross sales.
In addition, pursuant to the rent escalation clause in most of our
leases, a tenant’s Base Rent generally increases 10% on a
semi-annualy and cumulative basis from the seventh (7
th
) month of
effectiveness of the lease. Although many of our lease agreements
contain price adjustment provisions, these are not based on an
official
index nor do they
reflect the inflation index. In the event of litigation, there can
be no assurance that we may be able to enforce such clauses
contained in our lease agreements.
125
In
addition to rent, IRSA charges most of its tenants an admission
right, which must be paid upon execution of the lease agreement and
upon its renewal. The admission right is normally paid as a lump
sum or in a small number of monthly installments. If the tenants
pay this fee in installments, the tenants are responsible for
paying the balance of any such unpaid amount if they terminate the
lease prior to its expiration. In the event of unilateral
termination and/or resolution for breach by the tenants, tenants
will not be refunded their admission payment without IRSA’s
consent. IRSA leases its stores, kiosks and spaces in its shopping
malls through its wholly-owned subsidiary Fibesa. IRSA charges its
tenants a fee for the brokerage services, which usually amounts to
approximately three months of the Base Rent plus the admission
right.
IRSA is
responsible for providing each shopping mall rental unit with
electricity, a main telephone switchboard, central air conditioning
and a connection to a general fire detection system. IRSA also
provides the food court tenants with sanitation and with gas
systems connections. Each tenant is responsible for completing all
necessary installations within its rental unit, in addition to
paying direct related expenses, including electricity, water, gas,
telephone and air conditioning. Tenants must also pay for a
percentage of total expenses and general taxes related to common
areas. IRSA determines this percentage based on different factors.
The common area expenses include, among others, administration,
security, operations, maintenance, cleaning and taxes.
IRSA
carries out promotional and marketing activities to draw consumer
traffic to its shopping malls. These activities are paid for with
the tenants’ contributions to the Common Promotional Fund, or
“CPF,” which is administered by us. Tenants are
required to contribute 15% of their rent (Base Rent plus Percentage
Rent) to the CPF. IRSA may increase the percentage tenants must
contribute to the CPF with up to 25% of the original amount set
forth in the corresponding lease agreement for the contributions to
the CPF. IRSA may also require tenants to make extraordinary
contributions to the CPF to fund special promotional and marketing
campaigns or to cover the costs of special promotional events that
benefit all tenants. IRSA may require tenants to make these
extraordinary contributions up to four times a year provided that
each extraordinary contribution may not exceed 25% of the
tenant’s preceding monthly lease payment.
Each
tenant leases its rental unit as a shell without any fixtures and
is responsible for the interior design of its rental unit. Any
modifications and additions to the rental units must be
pre-approved by IRSA. IRSA has the option to charge the tenant for
all costs incurred in remodeling the rental units and for removing
any additions made to the rental unit when the lease expires.
Furthermore, tenants are responsible for obtaining adequate
insurance for their rental units, which must cover, among other
things, damage caused by fire, glass breakage, theft, flood, civil
liability and workers’ compensation.
Control Systems
IRCP
has computer systems equipped to monitor tenants’ sales
(except stands) in all of its shopping malls. IRCP also conduct
regular audits of its tenants’ accounting sales records in
all of its shopping malls. Almost every store in IRSA’s
shopping malls has a point of sale that is linked to a main server.
IRCP uses the information generated from the computer monitoring
system to prepare statistical data regarding, among other things,
total sales, average sales and peak sale hours for marketing
purposes and as a reference for the internal audit. Most of
IRSA’s shopping mall lease agreements require the tenant to
have its point of sale system linked to IRSA’s
server.
Competition
IRSA is
the most important owner and administrator of Shopping Malls,
Offices Buildings an other commercial properties of Argentina in
terms of gross leasable area and number of rental properties. Given
that most of our shopping malls in a particular area could have a
material effect on IRSA’s ability to lease space in its
shopping malls and on the rent that IRSA is able to charge. IRSA
believes that due to the limited availability of large plots of
land and zoning restrictions in the City of Buenos Aires, it is
difficult for other companies to compete with IRSA in areas through
the development of new shopping malls. IRSA’s principal
competitor is Cencosud S.A. which owns and operates Unicenter
Shopping and the Jumbo hypermarket chain, among
others.
126
The following table shows certain information concerning the most
significant owners and operators of shopping malls in Argentina, as
of June 30, 2018:
|
Entity
|
Shopping
malls
|
Location
|
GLA
|
Marketshare(1)
|
|
|
|
|
|
(%)
|
|
IRSA
CP
|
Alto
Palermo
|
City of Buenos
Aires
|
18,648
|
1.43
|
|
|
Abasto
Shopping(3)
|
City of Buenos
Aires
|
36,796
|
2.83
|
|
|
Alto
Avellaneda(2)
|
Greater Buenos
Aires, Province
|
38,422
|
2.96
|
|
|
Alcorta
Shopping(2)
|
City of Buenos
Aires
|
15,746
|
1.21
|
|
|
Patio
Bullrich
|
City of Buenos
Aires
|
11,397
|
0.88
|
|
|
Buenos Aires
Design(5)
|
City of Buenos
Aires
|
13,735
|
1.06
|
|
|
Dot Baires
Shopping(4)
|
City of Buenos
Aires
|
49,407
|
3.80
|
|
|
Soleil Premium
Outlet (2)
|
Greater Buenos
Aires, Province
|
15,214
|
1.17
|
|
|
Distrito Arcos
(6)
|
City of Buenos
Aires
|
14,169
|
1.09
|
|
|
Alto
Noa(2)
|
Salta
|
19,063
|
1.47
|
|
|
Alto Rosario(2)
(3)
|
Santa
Fe
|
33,358
|
2.57
|
|
|
Mendoza
Plaza(2)
|
Mendoza
|
42,867
|
3.30
|
|
|
Córdoba
Shopping(2)
|
Córdoba
|
15,276
|
1.18
|
|
|
La Ribera
Shopping(7)
|
Santa
Fe
|
10,530
|
0.81
|
|
|
Alto
Comahue
|
Neuquén
|
9,397
|
0.72
|
|
Subtotal
|
|
|
344,025
|
26.47
|
|
Cencosud S.A.
|
|
|
277,203
|
21.33
|
|
Other
operators
|
|
|
678,354
|
52.20
|
|
Total
|
|
|
1,299,582
|
100.00
|
(1)
Corresponding to gross leaseable area in respect of total gross
leaseable area. Market share is calculated dividing square meteres
over total square metres.
(2)
Includes supermarkets.
(3)
Includes Museo de los Niños.
(4) We
own 80% of the equity of PAMSA.
(5)
IRCP´s effective participation in ERSA is 53.6%, which
operates the concession related to this property.
(6)
IRCP´s owns 90% of the equity of Arcos del Gourmet
S.A.
(7)
IRCP´s owns 50% of the equity of Nuevo Puerto Santa Fe
S.A.
Source:
Argentine Chamber of Shopping
Malls.
Seasonality
IRSA’s
business is directly affected by seasonality, influencing the level
of IRSA’s tenants’ sales. During Argentine summer
holidays (January and February) IRSA’s tenants’ sales
typically reach their lowest level, whereas during winter holidays
(July) and in Christmas (December) they reach their maximum level.
Clothing retailers generally change their collections in spring and
autumn, positively affecting IRSA’s shopping malls’
sales. Discount sales at the end of each season are also one of the
main seasonal factors affecting IRSA’s business.
Offices
According to
Colliers International, as of June 30, 2018, the A+ and A office
inventory increased as compared to 2017, at 1,899,183 square
meteres. In terms of rental availability, the vacancy rate
maintained without important changes around 7.3% during the second
quarter of 2018. These values indicate that the market is healthy
in terms of its operations, allowing an optimum level of supply
with balanced values.
Compared to the
previous quarter, the Premium Offices prices remained the same in
the order of US$ 25.8 per square meter compared to the previous
quarter, and showed a 5% increase compared to the same period last
year, which was was US$ 24.5 per square meter. There was a decrease
in rental prices for A+ properties of US$ 2.8 per square meter,
from US$ 25.6 per square meter in the first quarter of 2018 to US$
28.4 per square meter for the second quarter of 2018. In this
context, Catalinas presents as the zone with higher prices per
square meter, reaching an average of US$ 31.3. Likewise, the
industry reported a 2% increase in rental prices for A properties
compared to the first quarter of 2018, reaching an average of US$
23.1 per square meter, in which the North zone of Ciudad de Buenos
Aires reach the higher prices, reaching US$ 29.1 per square
meter.
127
Management of office buildings
IRSA
generally acts as the manager of the office properties in which we
own an interest. IRSA typically owns the entire building or a
substantial number of floors in the building. The buildings in
which IRSA owns floors is generally managed pursuant to the terms
of a condominium agreement that typically provides for control by a
simple majority of the interests based on owned area. As building
manager, IRSA handles services such as security, maintenance and
housekeeping, which is generally outsourced. The cost of the
services is passed through to, and paid for by, the tenants, except
in the case of our units that has not been leased, if any, for
which IRSA bears the cost. IRSA markets their leasable area through
commissioned brokers or directly by them.
Leases
IRSA
usually leases their offices and other rental properties by using
contracts with an average term of three years, with the exception
of a few contracts with terms of five years. These contracts are
renewable for two or three years at the tenant’s option.
Contracts for the rental of office buildings and other commercial
properties are generally stated in U.S. dollars, and in accordance
with Argentine law, they are not subject to inflation adjustment.
Rental rates for renewed periods are negotiated at market
value.
Properties
The
following table shows certain information regarding our office
buildings, as of June 30, 2018:
|
|
|
|
|
|
|
Annual
accumulated rental income (in thousands of Ps.)
(4)
|
||
|
|
Date
of Acquisition
|
Gross
Leaseable Area (sqm)
(1)
|
Occupancy
(2)
|
IRSA’s
Effective Interest
|
Monthly
Rental Income (in thousands of Ps.)
(3)
|
2018
|
2017
|
2016
|
|
Offices
|
|
|
|
|
|
|
|
|
|
República Building
(5)
|
4/28/08
|
19,885
|
98.4
%
|
100
%
|
16,112
|
126,318
|
112,758
|
75,122
|
|
Bankboston Tower
(5)
|
8/27/07
|
14,873
|
85.6
%
|
100
%
|
10,875
|
86,825
|
79,498
|
51,690
|
|
Bouchard
551
|
3/15/07
|
-
|
-
|
100
%
|
296
|
9,486
|
3,000
|
3,000
|
|
Intercontinental Plaza Building
(5)
|
11/18/97
|
2,979
|
100.0
%
|
100
%
|
1,910
|
20,435
|
18,810
|
29,078
|
|
Bouchard 710
(5)
|
6/1/05
|
15,014
|
100.0
%
|
100
%
|
14,094
|
121,129
|
85,465
|
67,250
|
|
Dique
IV
|
12/2/97
|
-
|
-
|
100
%
|
-
|
-
|
-
|
15,000
|
|
Maipú
1300
|
9/28/95
|
-
|
-
|
100
%
|
75
|
301
|
6,000
|
6,000
|
|
Libertador
498
|
12/20/95
|
-
|
-
|
100
%
|
-
|
8,289
|
7,000
|
6,000
|
|
Suipacha 652/64
(5)
|
11/22/91
|
11,465
|
86.2
%
|
100
%
|
4,373
|
33,631
|
30,007
|
22,507
|
|
Madero
1020
|
12/21/95
|
-
|
-
|
100
%
|
5
|
57
|
44
|
-
|
|
Dot Building
(5)
|
11/28/06
|
11,242
|
100.0
%
|
80,0
%
|
7,881
|
63,913
|
50,172
|
31,229
|
|
Philips Building
(5)
|
6/5/17
|
7,755
|
69.8
%
|
100
%
|
3,416
|
16,313
|
-
|
-
|
|
Subtotal Offices
|
|
83,213
|
92.3
%
|
N/A
|
59,037
|
486,697
|
392,754
|
306,876
|
|
|
|
|
|
|
|
|
|
|
|
Other Properties
|
|
|
|
|
|
|
|
|
|
Santa
María del Plata S.A
|
10/17/97
|
116,100
|
91.4
%
|
100
%
|
1,717
|
13,790
|
11,981
|
12,000
|
|
Nobleza Piccardo
(6)
|
05/31/11
|
109,610
|
78.0
%
|
50.0
%
|
1,731
|
6,269
|
13,217
|
2,172
|
|
Other Properties
(7)
|
N/A
|
23,240
|
64.8
%
|
N/A
|
1,875
|
19,860
|
12,838
|
11,000
|
|
Subtotal Other Properties
|
|
248,950
|
83.2
%
|
N/A
|
5,323
|
39,919
|
38,036
|
25,172
|
|
|
|
|
|
|
|
|
|
|
|
Total Offices and Others
|
|
332,163
|
85.5
%
|
N/A
|
64,360
|
526,616
|
430,790
|
332,048
|
(1)
Corresponds to the total leaseable surface area of each property as
of June 30, 2018. Excludes common areas and parking
spaces.
(2)
Calculated by dividing occupied square meters by leaseable area as
of June 30, 2018.
(3) The
lease agreements in effect as of June 30, 2018 were computed for
each property.
(4)
Corresponds to total consolidated lease agreements.
(5)
Through IRSA CP.
(6)
Through Quality Invest.
(7)
Includes the following properties: Ferro, Dot Adjoining Plot,
Anchorena 665, Anchorena 545 (Chanta IV) and Intercontinental
plot.
128
Occupancy
rate
The
following table shows the occupancy rate of IRSA´s offices for
fiscal years 2018 and 2017:
|
|
Occupancy
rate (1
)
|
||
|
|
As
of June 30,
|
||
|
|
2018
|
2017
|
2016
|
|
Offices:
|
(%)
|
||
|
República
Building
|
98.4
|
95.2
|
100.0
|
|
Bankboston
Tower
|
85.6
|
100.0
|
100.0
|
|
Intercontinental
Plaza
|
100.0
|
100.0
|
100.0
|
|
Bouchard
710
|
100.0
|
100.0
|
100.0
|
|
Suipacha
652/64
|
86.2
|
86.3
|
90.7
|
|
DOT
Building
|
100.0
|
100.0
|
100.0
|
|
Philips
|
69.8
|
—
|
—
|
|
Total
|
92.3
|
96.7
|
98.6
|
(1)
Leased square meters pursuant to lease agreements in effect as of
June 30, 2018, 2017 and 2016 over gross leasable area of
offices for the same periods
Annual
average income per surface area as of June 30, 2018, 2017 and
2016
(1)
:
|
|
Annual
average income per square meter
(1)
|
||
|
|
2018
(1)
|
2017
(1)
|
2016
(1)
|
|
Offices
|
(Ps./sqm)
|
||
|
Intercontinental
Plaza Building
|
5,970
|
4,853
|
4,291
|
|
Bouchard
710
|
8,068
|
5,692
|
4,539
|
|
Libertador
498
|
-
|
9,739
|
10,464
|
|
Suipacha
652/64
|
2,933
|
2,617
|
1,961
|
|
Bankboston
Tower
|
5,838
|
5,345
|
3,778
|
|
República
Building
|
6,353
|
5,671
|
3,615
|
|
Dot
Building
|
5,685
|
4,463
|
2,778
|
|
Philips
Building
|
2,104
|
|
|
(1)
Calculated by dividing annual rental income by the gross leaseable
area of offices based on our interest in each building as of June
30 for each fiscal year.
New agreements and renewals
The
following table sets forth certain Information on lease agreements
as of June 30, 2018:
|
Property
|
Number
of Agreements
(1)(5)
|
Annual
Rental Income
(2)
|
Rental
income per sqm New and Renewed
(3)
|
Previous
rental income per sqm
(3)
|
No.
of non-renewed agreements
|
Non-renewed
agreements Annual rental income
(4)
|
|
Intercontinental
Plaza Building
|
-
|
-
|
-
|
-
|
3
|
13,197,994
|
|
Bouchard
710
|
5
|
77,057,758
|
588
|
570
|
-
|
-
|
|
Della Paolera
265
|
1
|
8,055,709
|
538
|
498
|
1
|
1,523,898
|
|
Republica
Building
|
6
|
51,509,863
|
581
|
578
|
-
|
-
|
|
DOT
Building
|
2
|
15,357,876
|
553
|
515
|
-
|
-
|
|
Suipacha
664
|
1
|
7,884,678
|
332
|
332
|
-
|
-
|
|
Philips
Building
(6)
|
5
|
26,373,106
|
406
|
-
|
-
|
-
|
|
Total
Offices
|
20
|
186,238,990
|
530
|
443
|
4
|
14,721,892
|
(1) Includes new
and renewed agreements executed in fiscal year 2018.
(2) Agreements
stated in US dollars converted into Pesos at the exchange rate
prevailing in the initial month of the agreement multiplied by 12
months.
(3) Monthly
value.
(4) Agreements
stated in US dollars converted into Pesos at the exchange rate
prevailing in the last month of the agreement, multiplied by 12
months.
(5) Does not
include agreements of parking spaces, antennas or terrace
space.
(6) New Building,
contracts without previous rate.
129
Hotels
According to the
Hotel Vacancy Survey (EOH) prepared by INDEC, as of July 2018,
overnight stays at hotel and parahotel establishments were
estimated at 4.6 million, 3.1% lower than the same month the
previous year. Overnight stays of resident and nonresident
travelers decreased by 3.2% and 1.6%, respectively. Total travelers
who stayed at hotels during July 2018 were 1.9 million, which
represents a 5.0% decreased compared to the same month the previous
year. The number of resident and nonresident travelers decreased by
5.6% and 1.6%, respectively. The 3.7 million resident travelers
represented 83.3% of the total number of travelers who stayed at
hotels. The Room Occupancy Rate in April was 48.5%, showing a
decrease by 3.1% compared to the same month the previous year.
Moreover, the Bed Occupancy Rate for the same period was 39.6%,
which represents a decrease by 3.1% compared to the same month the
previous year.
During
fiscal year 2018, we kept our 76.34% interest in Intercontinental
hotel, 80.00% interest in Sheraton Libertador hotel and 50.00%
interest in Llao Llao.
The
following chart shows certain information regarding IRSA´s
luxury hotels:
|
|
|
|
|
|
|
Fiscal
Year Sales as of June 30 (in millions)
|
||
|
Hotels
|
Date
of Acquisition
|
IRSA’s
Interest
|
Number
of rooms
|
Occupancy
(1)
|
Average
Price per Room Ps.
(2)
|
2018
|
2017
|
2016
|
|
Intercontinental
(3)
|
01/11/1997
|
76.34
%
|
309
|
74.9
%
|
2,781
|
337
|
271
|
195
|
|
Sheraton Libertador
(4)
|
01/03/1998
|
80.00
%
|
200
|
76.1
%
|
2,728
|
212
|
151
|
119
|
|
Llao Llao
(5)
|
01/06/1997
|
50.00
%
|
205
|
56.9
%
|
6,713
|
439
|
301
|
220
|
|
Total
|
|
-
|
714
|
70.1
%
|
3,682
|
988
|
723
|
534
|
(1)
Accumulated average in the twelve-month period.
(2)
Accumulated average in the twelve-month period.
(3)
Through Nuevas Fronteras S.A.
(4)
Through Hoteles Argentinos S.A.
(5)
Through Llao Llao Resorts S.A.
Hotel Llao Llao, San Carlos de Bariloche, Province of Rio
Negro
In June
1997 IRSA acquired a 50% interest in Hotel Llao Llao from Llao Llao
Holding S.A. The remaining 50% is currently owned by the Sutton
Group. The Hotel Llao Llao is located on the Llao Llao peninsula,
25 kilometers from the City of San Carlos de Bariloche, and it is
one of the most important tourist hotels in Argentina. Surrounded
by mountains and lakes, this hotel was designed and built by the
famous architect Bustillo in a traditional alpine style and first
opened in 1938. The hotel was renovated between 1990 and 1993 and
has a total constructed surface area of 15,000 sqm and 158 original
rooms. The hotel-resort also includes an 18-hole golf course,
tennis courts, fitness facility, spa, game room and swimming pool.
The hotel is a member of
The Leading Hotels of the World,
Ltd., a prestigious luxury hospitality organization representing
430 of the world’s finest hotels, resorts and spas. The Hotel
Llao Llao is currently being managed by Compañía de
Servicios Hoteleros S.A., operator, among others, of the Alvear
Palace Hotel, a luxury hotel located in the Recoleta neighborhood
of Buenos Aires. During 2007, the hotel was subject to an expansion
and the number of suites in the hotel rose to 205
rooms.
Hotel Intercontinental, City of Buenos Aires
In
November 1997, IRSA acquired 76.34% of the Hotel Intercontinental.
The Hotel Intercontinental is located in the downtown City of
Buenos Aires neighborhood of Montserrat, near the Intercontinental
Plaza office building. Intercontinental Hotels Corporation, a
United States corporation, currently owns 24% of the Hotel
Intercontinental. The hotel’s meeting facilities include
eight meeting rooms, a convention center and a divisible 588 sqm
ballroom. Other amenities include a restaurant, a business center,
a sauna and a fitness facility with swimming pool. The hotel was
completed in December 1994 and has 309 rooms.
Hotel Sheraton Libertador, City of Buenos Aires
In
March 1998 IRSA acquired 100% of the Sheraton Libertador Hotel from
Citicorp Equity Investment for an aggregate purchase price of US$23
million. This hotel is located in downtown Buenos Aires. The hotel
contains 193 rooms and 7 suites, eight meeting rooms, a restaurant,
a business center, a spa and fitness facilities with a swimming
pool. In March 1999, we sold 20% of our interest in the Sheraton
Libertador
Hotel for
US$4.7 million to
Hoteles Sheraton de
Argentina. The hotel is currently managed by Sheraton Overseas
Management Corporation, a United States
corporation.
130
Bariloche Plot, “El Rancho,” San Carlos de Bariloche,
Province of Río Negro
On
December 14, 2006, through IRSA´s hotel operator subsidiary,
Llao Llao Resorts S.A., IRSA acquired a land consisting of 129,533
sqm of surface area in the City of San Carlos de Bariloche in the
Province of Río Negro. The total price of the transaction was
US$7 million, of which US$4.2 million were paid in cash and the
balance of US$2.8 million was financed by means of a mortgage to be
paid in 36 monthly, equal and consecutive installments of US$0.086
million each. The land is in the border of the Lago Gutiérrez,
close to the Llao Llao Hotel in an outstanding natural environment
and it has a large cottage covering 1,000 sqm of surface area
designed by the architect Ezequiel Bustillo.
Sale
and Development of Properties and Land Reserves
Residential Development Properties
The
acquisition and development of residential apartment complexes and
residential communities for sale is one of IRSA´s core
activities. IRSA´s development of residential apartment
complexes consists of the new construction of high-rise towers or
the conversion and renovation of existing structures such as
factories or warehouses. In connection with IRSA´s development
of residential communities, we frequently acquire vacant land,
develop infrastructure such as roads, utilities and common areas,
and sell plots of land for construction of single-family homes.
IRSA may also develop or sell portions of land for others to
develop complementary facilities such as shopping areas within
residential developments.
In
fiscal year ended June 30, 2018, revenues from the development and
sale of properties segment amounted to Ps.
120
million, compared to Ps.
99
million posted in the fiscal year ended
June 30, 2017.
Construction and
renovation works on IRSA´s residential development properties
are currently performed, under IRSA´s supervision, by
independent Argentine construction companies that are selected
through a bidding process. IRSA enters into turnkey contracts with
the selected company for the construction of residential
development properties pursuant to which the selected company
agrees to build and deliver the development for a fixed price and
at a fixed date. IRSA is generally not responsible for any
additional costs based upon the turnkey contract. All other aspects
of the construction, including architectural design, are performed
by third parties.
Another
modality for the development of residential undertakings is the
exchange of land for constructed square meters. In this way, IRSA
deliver undeveloped pieces of land and another firm is in charge of
building the project. In this case, we receive finished square
meters for commercialization, without taking part in the
construction works.
131
The following table
shows information about IRSACP´s land reserves as of June 30,
2018:
|
|
IRSACP´
s Ownership
|
Date
of acquisition
|
Land
surface
|
Buildable
surface
|
GLA
|
Saleable
surface
|
Book
Value
|
|
|
|
|
|
|
|
|
|
|
|
(%)
|
|
(sqm)
|
(sqm)
|
(sqm)
|
(sqm)
|
(Ps.
millions)
|
|
RESIDENTIAL
- BARTER AGREEMENTS
|
|
|
|
|
|
|
|
|
Beruti (Astor
Palermo) - BA City
|
100
|
Jun-08
|
—
|
—
|
—
|
—
|
151
|
|
CONIL - Güemes
836 – Mz. 99 & Güemes 902 – Mz. 95 &
Commercial stores - Buenos Aires
|
100
|
Jul-96
|
—
|
—
|
847
|
—
|
46
|
|
Total
Intangibles (Residential)
|
|
|
—
|
—
|
847
|
—
|
197
|
|
|
|
|
|
|
|
|
|
|
|
|
|
|
|
|
|
|
|
LAND
RESERVES
|
|
|
|
|
|
—
|
|
|
Polo Dot U building
- BA City
|
80
|
jun-06
|
5,273
|
32,000
|
32,000
|
—
|
1,098
|
|
Total
under Development
|
|
|
5,273
|
32,000
|
32,000
|
—
|
1,098
|
|
UOM Luján -
Buenos Aires
|
100
|
May-08
|
1,160,000
|
464,000
|
—
|
—
|
305
|
|
San Martin Plot (Ex
Nobleza Piccardo) - Buenos Aires (4)
|
50
|
May-11
|
159,995
|
500,000
|
—
|
—
|
2,812
|
|
La Plata - Greater
Buenos Aires
|
100
|
Mar-18
|
78,614
|
116,552
|
—
|
—
|
218
|
|
Subtotal
Mixed-uses
|
|
|
1,398,609
|
1,080,552
|
—
|
—
|
3,335
|
|
Coto Abasto air
space - BA City
(2)
|
100
|
Sep-97
|
—
|
21,536
|
—
|
15,831
|
6
|
|
Córdoba
Shopping Adjoining plots - Córdoba
(2)
|
100
|
Jun-15
|
8,000
|
13,500
|
—
|
2,160
|
239
|
|
Neuquén -
Residential plot - Neuquén
(2)
|
100
|
Jun-99
|
13,000
|
18,000
|
—
|
18,000
|
16
|
|
Subtotal
Residential
|
|
|
21,000
|
53,036
|
—
|
35,991
|
261
|
|
Caballito plot - BA
City
|
100
|
Jan-99
|
23,791
|
68,000
|
30,000
|
—
|
375
|
|
Tucumán plot -
Tucumán
(3)
|
100
|
Mar-10
|
18,620
|
10,000
|
10,000
|
—
|
—
|
|
Paraná plot -
Entre Ríos
(3)
|
100
|
Aug-10
|
10,022
|
5,000
|
5,000
|
—
|
—
|
|
Subtotal
Retail
|
|
|
52,433
|
83,000
|
45,000
|
—
|
375
|
|
Polo Dot - Offices
2 and 3 - BA City
|
80
|
Nov-06
|
12,800
|
44,957
|
33,485
|
—
|
1,582
|
|
Intercontinental
Plaza II - BA City
|
100
|
Feb-98
|
6,135
|
19,598
|
19,598
|
—
|
351
|
|
Córdoba
Shopping Adjoining plots - Córdoba
(2)
|
100
|
Jun-15
|
2,800
|
5,000
|
5,000
|
—
|
15
|
|
Subtotal
Offices
|
|
|
21,735
|
69,555
|
58,083
|
—
|
1,948
|
|
Total
Future Developments
|
|
|
1,493,777
|
1,286,143
|
103,083
|
35,991
|
5,919
|
|
Other
Land Reserves
(1)
|
|
|
1,899
|
182
|
7,297
|
262
|
182
|
|
Total
Land Reserves
|
|
|
1,500,949
|
1,318,325
|
142,380
|
36,253
|
7,199
|
(1) Includes Zelaya
3102-3103, Chanta IV, Anchorena 665 and Condominios del Alto
II
(2) These land
reserves are classified as Trading properties , therefore, their
value is maintained at historical cost. The rest of the land
reserves are classified as Investment Property, valued at market
value.
(3) Sign of the
deeds pending subject to certain conditions.
(4)
Through Quality Invest S.A.
132
The
following table shows information about IRSACP´s expansions on
its current assets as of June 30, 2018:
|
Expansions
|
Ownership
interest
|
Surface
|
Locations
|
|
|
(%)
|
(sqm)
|
|
|
Alto
Rosario
|
100
|
2,000
|
Santa
Fé
|
|
Mendoza Plaza -
Sodimac Store + Falabella
|
100
|
12,800
|
Mendoza
|
|
Alto Comahue -
Movie Theatres
|
99
|
2,200
|
Neuquén
|
|
Subtotal
Current Expansions
|
|
17,000
|
|
|
Alto Palermo
Adjoining Plot
|
100
|
4,000
|
BA
City
|
|
Dot Adjoining
Plot
|
80
|
16,765
|
BA
City
|
|
Other future
Expansions
(1)
|
100
|
85,290
|
|
|
Subtotal
Future Expansiones
|
|
106,055
|
|
|
Total
Shopping Malls
|
|
123,055
|
|
|
Patio Bullrich -
Offices / Hotel
|
100
|
10,000
|
BA
City
|
|
Philips
Building
|
100
|
20,000
|
BA
City
|
|
Subtotal
Future Expansions
|
|
30,000
|
|
|
Total
Offices
|
|
30,000
|
|
|
|
|
|
|
|
Total
Expansions
|
|
153,055
|
|
The
following chart shows information about IRSA´s land reserves
as of June 30, 2018:
|
|
IRSA´s
Interest
|
Date
of Acquisition
|
Surface
area(sqm)
|
Area
intended for contruction
(sqm)
|
Gross
Leasable Area(sqm)
|
Area
intended for sale(sqm)
|
Book
Value
(million
of Ps.)
|
|
|
|
|
|
|
|
|
|
|
INTANGIBLE
ASSETS – BARTER AGREEMENTS
|
|
|
|
|
|
|
|
|
Pereiraola
(Greenville) - Buenos Aires
|
100
%
|
4/21/10
|
-
|
-
|
-
|
35,239
|
7
|
|
Zetol -
Uruguay
|
90
%
|
6/1/09
|
147,060
|
-
|
-
|
92,817
|
80
|
|
Vista al Muelle -
Uruguay
|
90
%
|
6/1/09
|
130,688
|
-
|
-
|
89,918
|
127
|
|
Total
Intangibles (Residential)
|
|
|
277,748
|
-
|
-
|
217,974
|
214
|
|
|
|
|
|
|
|
|
|
|
LAND
RESERVES_
|
|
|
|
|
|
|
|
|
Catalinas –
CABA
(3)
|
100
%
|
05/26/10
|
3,648
|
58,100
|
35,313
|
4.896
|
1.601
|
|
Total
in development
|
|
|
3,648
|
58,100
|
35,313
|
4.896
|
1.601
|
|
La Adela - Buenos
Aires
|
100
%
|
8/1/14
|
9,871,600
|
3,951,227
|
-
|
-
|
433
|
|
Puerto Retiro
– CABA
(2)
|
50
%
|
5/18/97
|
82,051
|
246,153
|
-
|
-
|
44
|
|
Solares Santa
María - CABA
|
100
%
|
7/10/97
|
716,058
|
716,058
|
-
|
-
|
6,498
|
|
Subtotal
Mixed Uses
|
|
|
10,669,709
|
4,913,438
|
-
|
-
|
6,975
|
|
Caballito Block 35
- CABA
|
100
%
|
10/22/98
|
9,879
|
-
|
-
|
57,192
|
99
|
|
Subtotal
Residential Properties
|
|
|
9,879
|
-
|
-
|
57,192
|
99
|
|
Total
Future developments
|
|
|
10,679,588
|
4,913,438
|
-
|
57,192
|
7,074
|
|
Other
land reserves
|
|
|
6,932,987
|
-
|
-
|
4,713
|
687
|
|
Total
IRSA´s Land Reserves
|
|
|
17,616,223
|
4,971,538
|
35,313
|
61,910
|
9,362
|
(1) Includes Pilar
R8 Km 53, Pontevedra Plot, Mariano Acosta Plot, Merlo Plot, San
Luis Plot, Llao Llao Plot and Abril Manor House
(2) This land is
valued at historic cost.
(3) Includes
IRSACP´s and IRSA´s ownership in the
property.
133
Residential Properties (available for sale)
In the
residential market, IRSA acquires undeveloped properties
strategically located in densely populated areas of the City of
Buenos Aires, particularly properties located near shopping malls
and hypermarkets or those to be constructed. IRSA then develops
multi-building high-rise complexes targeting the middle- and high-
income market. These are equipped with modern comforts and
services, such as open “green areas,” swimming pools,
sports and recreation facilities and 24-hour security.
Condominios del Alto II – City of Rosario, Province of Santa
Fe (IRSA CP)
The
Condominios del Alto II project will be composed of two opposite
building blocks, commercially divided into 10 sub-blocks. The
project consists of a total of 189 apartments distributed in 6
stories and 195 parking spaces located in two basements. The
amenities include a swimming pool with solarium, a multiple use
room, sauna, a gym with dressrooms and a laundry. As of
June 30, 2018, the works in parcel H have been completed and
all the units (42 apartments and 47 parking spaces) subject to the
barter have been received, with 9 parking spaces available for
sale.
Barrio Chico – City of Buenos Aires
This is
a unique Project located in Barrio Parque, an exclusive residential
area in the City of Buenos Aires. During May 2006, the
commercialization of the project was launched with successful
results. The image of the product was originally developed under
the name “Barrio Chico” through advertisements in the
most important media. As of June 30, 2018, the project had been
completed and 2 parking spaces are yet to be sold.
Horizons, Vicente López, Olivos, Province of Buenos
Aires.
The
IRSA-CYRELA Project, developed over two adjacent blocks, was
launched in March 2008 under the name Horizons. Horizons is one of
the most significant developments in Greater Buenos Aires,
featuring a new concept in residential complexes given its emphasis
on the use of common spaces. This project includes two complexes
with a total of six buildings: one complex faces the river and
consists of three 14-floor buildings, the “Río”
complex, and the other one, facing Libertador Avenue, consists of
three 17-floor buildings, it is known as the “Parque”
complex, thus totaling 59,000 square meters built of saleable area
distributed in 467 units (excluding the units to be delivered as
consideration for the purchase of the lands). Horizons is a unique
and style-innovating residential complex offering 32 amenities,
including a meeting room, work zone, heated swimming pools, mansion
with spa, sauna, gym, children room, teen room, thematically
landscaped areas, and aerobic trail. The showroom was opened to the
public in March 2008 with great success. As of June 30, 2018, the
units were sold and the stock available for sale consisted of 1
parking space and 23 storage spaces.
Intangibles – Units to be received under barter
agreements
Beruti Plot – City of Buenos Aires (IRSA CP)
On
October 13, 2010, IRSA CP and TGLT entered into an exchange
agreement in connection with a plot of land located at Beruti
3351/59 in the City of Buenos Aires for cash and 2,170 square
meters in future residential apartments to be constructed by TGLT
on the plot. In accordance with the terms of the agreement, TGLT
had to deliver to IRSA CP (i) certain units to be determined,
representing 17.3% of the aggregate surface of the residential
space, (ii) a number of parking spaces to be determined,
representing 15.82% of the aggregate surface of the parking spaces,
(iii) all the commercial parking spots in the future building
and (iv) the sum of US$10.7 million. To ensure
performance of the obligations assumed by TGLT under the deed of
sale, a mortgage was granted in IRSA CP’s favor.
Finally, on
December 30, 2016, IRSA CP and TGLT signed the possession
certificate for 36 residential apartments totaling 2,413 square
meters, 32 residential parking spaces, and 171 commercial parking
spaces As of June 30, 2018, 3 apartments,15 residential parking
spaces and 171 commercial parking spaces remain available for
sale.
Conil – Avellaneda, Province of Buenos Aires (IRSA
CP)
These
plots of land IRSA owns, through IRSA CP, face Alto Avellaneda
shopping mall, totaling 2,398 square meters distributed in two
opposite corners and, according to urban planning standards, around
6,000 square meters may be built. Its intended use, either through
IRSA´s own development or sale to a third party, is
residential with the possibility of a retail space as well. In
November 2014, a barter deed was executed to carry out a
residential development, in consideration of which IRSA CP will
receive 1,389 square meters of retail stores located on the ground
floors of blocks 99 and 95 at Güemes 836 and Güemes 902,
respectively. The barter was valued at US$0.7
million.
Considerations for block 95 and 99 were estipulated to be delivered
in January 2018 and September 2018, respectively. In June 2018 an
extension to the barter agreement was signed. In consideration for
the delay and as compensation, IRSA CP will receive an additional
apartment (55.5 square meters) and one parking lot (14 square
meters).
134
Pereiraola (Greenville), Hudson – Province of Buenos
Aires
In
April de 2010 IRSA sold Pereiraola S.A., a company owner of certain
lands adjacent to Abril Club de Campo that comprised 130 hectares,
for US$11.7 million. The purchaser would develop a project that
includes the fractioning into lots, a condo-hotel, two polo fields,
and apartment buildings. The delivery to the Company of 39,634
square meters of lots amounting to approximately US$3 million was
included in the sale price. As of June 30, 2018, 10 lots were
deeded and 46 remain to be traded.
Zetol S.A. and Vista al Muelle S.A. – District of Canelones
– Uruguay
In the course of fiscal year 2009 IRSA acquired a
100% ownership interest in Liveck S.A., a company organized under
the laws of Uruguay. In June 2009, Liveck had acquired a 90% stake
in the capital stock of Vista al Muelle S.A. and Zetol S.A., two
companies incorporated under the laws of Uruguay, for
US$
7.8 million. The remaining 10%
ownership interest in both companies is in the hands of Banzey S.A.
These companies have undeveloped lands in Canelones, Uruguay, close
to the capital city of Uruguay, Montevideo.
IRSA
intends to develop in these 13 plots, with a construction capacity
of 182,000 sqm, an urban project that consists of the development
and comercialization of 1,860 apartments. Such project has the
“urban feasibility” status for the construction of
approximately 200,000 sqm for a term of 10 years, which was granted
by the Mayor’s Office of the Canelones department and by its
Local Legislature. Zetol S.A. and Vista al Muelle S.A. agreed to
carry out the infrastructure works for US$8 million as well as
minimum amount of sqm of properties. The satisfaction of this
commitment under the terms and conditions agreed upon will grant an
additional 10-year effective term to the urban feasibility
status.
The total purchase price for Zetol S.A. was
US$
7 million; of which
US$
2 million were paid. Sellers may
opt to receive the balance in cash or through the delivery of units
in the buildings to be constructed in the land owned by Zetol S.A.
equivalent to 12% of the total marketable meters to be
constructed.
Besides, Vista al Muelle S.A. owned since
September 2008 a plot of land purchased for
US$
0.83 million. Then, in February 2010, plots of
land were acquired for
US$
1
million, the balance of which as of to date amounts to
US$
0.28 million plus interest and will
be repaid in December 2014.
In December 2010, Vista al
Muelle S.A. executed the title deed of other plots for a total
amount of US$2.66 million, of which US$0.3 million were paid. The
balance will be repaid by delivering 2,334 sqm of units and/or
retail stores to be constructed or in cash.
On June
30, 2009, IRSA sold a 50% stake in Liveck S.A. to Cyrela Brazil
Realty S.A. for US$1.3 million.
On
December 17, 2010, together with Cyrela Brazil Realty S.A. IRSA
executed a stock purchase agreement pursuant to which IRSA
repurchased from Cyrela Brazil Realty S.A. a 50% shareholding in
Liveck S.A. for
US$
2.7 million.
Accordingly, as of June 30, 2016, IRSA’s stake, through
Tyrus, in Liveck is 100%.
As a
result of the plot barter agreements executed in due time between
the IMC, Zetol S.A. and Vista al Muelle S.A. in March 2014, the
parcel redistribution dealing was concluded. This milestone, as set
forth in the amendment to the Master Agreement executed in 2013,
initiates the 10-year term for the investment in infrastructure and
construction of the buildings mentioned above. At present, the
first tower is being developed.
Canteras Natal Crespo, La Calera – Province of
Córdoba
On June
26, 2013, IRSA sold 100% of its interest in Canteras Natal Crespo
S.A. representing 50% of its capital stock, to Euromayor S.A. de
Inversiones for US$4,215,000 according to the following payment
schedule: US$ 3,815,000 in cash and US$400,000 through the transfer
of almost 40,000 sqm for business purposes within the project to be
developed in the site known as Laguna Azul. Delivery of the
non-monetary consideration, which consist in 30,000 sqm, is
pending.
135
Projects under Development
Shopping Mall Expansions (IRSA CP)
During
the next fiscal year, IRSA CP will add approximately 17,000 sqm
from current malls’ expansions. We will add soon 6 movie
theatres in Alto Comahue of 2,200 sqm, an approximately 12,800 sqm
Sodimac store in Mendoza Plaza Shopping while expanding its
Falabella store and 2,000 sqm of expansion in Alto Rosario, where
we have recently opened a big Zara store.
During
the next fiscal year, IRSA CP expects to launch the works of
expansion of Alto Palermo shopping mall, the shopping mall with the
highest sales per square meter in its portfolio, that will add a
gross leasable area of approximately 4,000 square meters and will
consist in moving the food court to a third level by using the area
of an adjacent building acquired in 2015.
First Stage of Polo Dot (IRSA CP)
The
project called “Polo Dot”, located in the commercial
complex adjacent to IRSA CP’s shopping mall Dot Baires, has
experienced significant growth since our first investments in the
area. The total project will consist in 3 office buildings (one of
them could include a hotel) in land reserves owned by the Company
and the expansion of the shopping mall by approximately 15,000
square meters of GLA. At a first stage, IRSA CP is developing an
11-floor office building with an area of approximately 32,000
square meters on an existing building. The total estimated
investment amounts to Ps.1,360 million and as of June 30, 2018,
degree of progress was 74%.
Catalinas building (IRSA & IRSA CP)
The
building to be constructed will have 35,000 sqm of GLA consisting
of 30 office floors and 316 parking spaces, and will be located in
the “Catalinas” area in the City of Buenos Aires, one
of the most sought-after spots for Premium office development in
Argentina. IRSA CP acquired from IRSA certain units in the building
representing approximately 45% of the value of the development and
we maintain the remaining 55%. On December 4, 2015, we sold to
Globant S.A. 4,896 square meters corresponding to four office
floors. The price for the acquisition of these units was
(i) Ps.180.3 million paid at signing of the purchase
agreement; (ii) US$8.6 million is payable in 12 quarterly
installments that started in June 2016; and (iii) the
US$3.7 million balance is due when the property deed is
transferred. IRSA owns 16,012 square meters consisting of 14 floors
and 142 parking spaces in the building under construction. The
total estimated investment
for the whole
project
amounts to Ps.2,770 million and as of June 30, 2018,
work progress was 16%.
Mixed uses
Ex UOM – Luján, Province of Buenos Aires (IRSA
CP)
This
116 hectare plot of land is located at kilometer 62 Km of the West
Highway, in the intersection with Route 5 and was originally
purchased by Cresud. In May 2012, IRSA CP acquired the property
from Cresud. Our intention is to carry out a mixed use project,
taking advantage of the environment consolidation and the strategic
location of the plot. At present, negotiations are underway to
change the zoning parameters, thus making the project
feasible.
Ex Nobleza Piccardo Plant – San Martín, Province of
Buenos Aires (IRSA CP)
On
May 31, 2011, Quality Invest S.A. executed the title deed
pursuant to which IRSA CP purchased from Nobleza
Piccardo S.A.I.C. y F., or “Nobleza Piccardo” a
plot of land of 159,996 square meters located in the District of
San Martin, Province of Buenos Aires, currently intended for
industrial purposes and suitable in terms of characteristics and
scale for mixed-use developments. The price for the property was
set at US$33 million, of which 30% was paid upon signing. For
the remaining balance a mortgage was constituted in the first
degree of privilege over the property in favor of Nobleza Piccardo.
Capital plus interest, calculated at an annual rate of 7.5% over
the outstanding balance, was paid in full in March
2013.
On
May 16, 2012, the Municipality of San Martin granted a
pre-feasibility permit for commercial use, entertainment, events,
offices, etc., which would enable performance of a mixed-use
development thereon.
Pursuant to
Municipality Ordinance 11,706 enacted on December 30, 2014, a
rezoning permit was obtained for the plot of land to be used mainly
for commercial purposes, which considerably expanded the uses and
potential buildable square meters through new urban indicators. On
January 5, 2016, the Provincial Decree 1,835 was published in
the Official Gazette of the Province of Buenos Aires granting its
approval, and the new urban and rezoning standards thus became
effective.
136
As
approved in the Ordinance, on January 20, 2015, EFESUL S.A.
entered into a zoning agreement with the Municipality of San Martin
which governs various issues related to applicable regulations and
provides for a mandatory assignment of square meters in exchange
for monetary contributions subject to fulfillment of certain
administrative milestones of the rezoning process, the first of
which (for Ps.20,000,000) was paid to the Municipality ten days
after the execution of the aforementioned agreement.
Moreover, on
June 27, 2016, the plot subdivision plan was filed with the
Municipality, completing a significant milestone committed under
the zoning agreement.
On June
28, 2017, Quality Invest S.A. signed an agreement with EFESUL S.A.
(which owns 50% of Quality Invest S.A.) in order to assume the
obligations that the latter had assumed with the Municipality of
General San Martin within the framework of the aforementioned Urban
Agreement. These agreement contemplates a donation, which will be
paid based on the work progress that the Municipality develops on
the property initially transferred by EFESUL S.A.
In
addition, during July 2017, Quality Invest S.A.subscribed two
addendums to the aforementioned Urban Development Agreement, which
contemplate the following: 1) a new subdivision plan of the
property will be presented within 120 days of the addendum signing
and 2) the payment of the twelveth installment in cash was replaced
by the sum of Ps.71 million payables in 18 equal and consecutive
monthly installments.
On
March 8, 2018, it was agreed with the renowned Gehl Firm (Denmark)
- Urban Quality Consultant - the elaboration of a Master Plan,
generating a modern concept of New Urban District of Mixed Uses. In
addition, local consultants were also hired, such as: Guillermo
Oliveto (Consultant W) in Market Analysis, Gastón Biggio (GUT)
in naming and branding of the District, Colla & Colombo
Consultants in Business Analysis and Alejandro Langlois in
Vehicular Impact, among others. In this way, IRSA CPhas a clear
sizing and positioning of the business.
Regarding the
status of the project, we are working on the definition of the
Master-Plan that includes a mix of uses (Residential, Commercial,
etc.) in order to carry out a large-scale urban development
contemplating more of 500,000 square meters. The regulations for
this Master-Plan are framed in a zoning called the Main Commercial
District (
Distrito Comercial
Principal
), which entered into force in 2016 through the
publication of the Provincial Decree of the Municipal Ordinance
No.11,706.
Córdoba Shopping Mall Project (IRSA CP)
IRSA
CPowns a few plots adjacent to Córdoba Shopping Mall with a
construction capacity of approximately 17,300 square meters in the
center of the City of Córdoba.
In May
2016, a preliminary barter agreement was signed for 13,500 square
meters out of the total construction capacity, subject to certain
conditions, for a term of one year, at the end of which the deed
will be signed. It will be a mixed residential and office project
and, as part of the consideration, the Company will receive 2,160
square meters in apartments, parking spaces, shopping space, plus
IRSA CP will assume the management of permits, unifications and
subdivisions in 3 plots. The consideration will be delivered by May
2021 for Torre I and by July 2023 for Torre II. The value of the
barter was US$4 million.
Plot of land La Plata (IRSA CP)
On
March 22, 2018 IRSA CP acquired, directly and indirectly, 100% of a
plot of land of 78,614 square meters located in the city of La
Plata, Province of Buenos Aires. The price of the transaction was
US$7.5 million, which have been fully paid.
The
operation was made through the purchase of 100% of the shares of
common stock of the company Centro de Entretenimientos La Plata SA
("CELAP”) which owns of 61.85% of the property and the direct
purchase of the remaining 38.15% to of shares of common stock from
non-related third parties.
La Adela – Buenos Aires
During
2015 IRSA acquired the “La Adela” land reserve with an
area of approximately 1,058 hectares, located in the District of
Luján, Province of Buenos Aires, that was previously owned by
our controlling company CRESUD S.A.C.I.F. y A., for a total amount
of Ps.210 million. Given its degree of development and closeness to
the City of Buenos Aires, IRSA intends to develop a new real estate
project.
137
Puerto Retiro – City of Buenos Aires
At
present, this 8.3 hectare plot of land, which is located in one of
the most privileged areas of the city, near Catalinas, Puerto
Madero and Retiro and is the only privately owned waterfront
property facing directly Río de la Plata, is affected by a
zoning regulation defined as
U.P.
which prevents the property from
being used for any purposes other than strictly port
activities.
During
fiscal year 1998, IRSA initiated negotiations with the authorities
of the Government of the City of Buenos Aires in order to obtain a
rezoning permit for the property, allowing a change in the use of
the property and setting forth new regulations for its
development.
In
turn, Tandanor filed a civil action against Puerto Retiro S.A. and
the other defendants in the criminal case for violation of Section
174 (5) based on Section 173 (7) of the Criminal Code. Such action
seeks -on the basis of the nullity of the decree that approved the
bidding process involving the Dársena Norte property- the
restitution of the property and a reimbursement in favor of
Tandanor for all such amounts it has allegedly lost as a result of
a suspected fraudulent transaction involving the sale of the
property. Puerto Retiro has presented the allegation on the merit
of the evidence, highlighting that the current shareholders of
Puerto Retiro did not participate in any of the suspected acts in
the criminal case since they acquired the shares for consideration
and in good faith several years after the facts told in the
process. Likewise, it was emphasized that the company Puerto Retiro
is foreign - beyond its founders - to the bidding / privatization
carried out for the sale of Tandanor shares. The pronouncement of
the sentence is pending.
On
September 7, 2018, the Oral Federal Criminal Court No. 5 rendered a
decision. According to the sentence read by the President of the
Court, Puerto Retiro won the preliminary objection of limitation
filed in the civil action. However, in the criminal case, where
Puerto Retiro is not a party, it was ordered, among other issues,
the confiscation (decomiso) of the property owned by Puerto Retiro
known as Planta I. The grounds of the Court`s judgement will be
read on November 30, 2018. From that moment, all the parties might
file the appeals.
In the
criminal action, the claimant reported the violation by Puerto
Retiro of the injunction ordered by the criminal court consisting
in an order to stay (
prohibición de innovar
) and not to
contract with respect to the property disputed in the civil action.
As a result of such report, the Oral Federal Court (
Tribunal Oral Federal
) No. 5 started
interlocutory proceedings, and on June 8, 2017, it ordered and
carried out the closing of the property that was subject to lease
agreements with Los Cipreses S.A. and Flight Express S.A. with the
aim of enforcing the referred order. As a result, the proceedings
were forwarded to the Criminal Court for it to appoint the court
that will investigate the alleged commission of the crime of
contempt.
Our
legal counsel considers that there is a chance of success of the
defense of Puerto Retiro, always taking into account that this is a
complex issue subject to more than one interpretation by legal
scholars and case law
Solares de Santa María – City of Buenos
Aires
Solares
de Santa Mar’a is a 70-hectare property facing the Río
de la Plata in the south of Puerto Madero, 10 minutes from downtown
Buenos Aires. We are owners of this property in which we intend to
develop an entrepreneurship for mixed purposes, i.e. our
development project involves residential complexes as well as
offices, stores, hotels, sports and sailing clubs, services areas
with schools, supermarkets and parking lots, and we would need to
obtain all the necessary permits and authorizations
In the
year 2000, we filed a master plan for the Santa Mar’a del
Plata site, which was assessed by the Environmental Urban Plan
Council (
Consejo del Plan Urbano
Ambiental, “COPUA”
) and submitted to the Town
Treasurer’s Office for its consideration. In 2002, the
Government of the City of Buenos Aires issued a notice of public
hearing and in July 2006, the COPUA made some recommendations about
the project, and in response to such recommendations, on December
13, 2006, we filed an amendment to the project which included the
donation of 50% of the site to the City of Buenos Aires for public
use and a perimetrical pedestrian lane along the entire site on the
river bank.
In
March 2007, a committee of the Government of the City of Buenos
Aires, composed of representatives from the Legislative and
Executive Branches issued a report stating that such Committee had
no objections to our development plan and requested that the Town
Treasurer’s Office render a decision concerning the
development plan submitted. In November 2007, 15 years after the
Legislative Branch of the City of Buenos Aires granted the general
zoning standards for the site, the Mayor of the City of Buenos
Aires executed Decree No. 1584/07, setting forth certain rules for
the urban development of the project, including types of permitted
constructions and the obligation to assign certain spaces for
public use and convenience.
Notwithstanding
the approval of Decree No. 1584/07 in 2007, a municipal court
issued an injunction restricting the implementation of our proposed
development plan, due to objections made by a legislator of the
City of Buenos Aires. Notwithstanding the legality and validity of
Decree No. 1584/07, we entered into an agreement 5/10 that was
executed with the Government of the City of Buenos Aires, which has
been submitted with the Legislature of the City of Buenos Aires for
approval.
On
October 30, 2012 a new agreement was executed with the Government
of the City of Buenos Aires, replacing all prior agreements, and
such has been submitted to the Legislature for its consideration.
The agreement provided that if by February 28, 2014 the agreement
was not approved would become invalidated.
During
2016, a new Agreement was executed with the Executive Branch of the
City of Buenos Aires, including a new Bill of Law. The new Bill of
Law was submitted to the Legislative Branch of the City of Buenos
Aires for consideration and was approved by the relevant
commissions; yet, it was reserved as it had happened in 2012, and
its legislative treatment is still pending. The new Bill of Law may
remain in such status during legislative year 2018.
In
order to ensure the enactment of the desired law, treatment of the
previous bill must be resumed or a new Agreement including a Bill
of Law must be executed with the executive branch of the Government
of the City of Buenos Aires, and subsequently ratified through the
enactment of a Law by the Legislature of the Government of the City
of Buenos Aires.
138
Residential
Coto Residential Project (IRSA CP)
IRSA
CP
owns
the right to construct
above the premises of the Coto hypermarket that is close to Abasto
Shopping in the heart of the City of Buenos Aires which we acquired
in September 24, 1997. We estimate that it has a construction
capacity of 23,000 square feet (it also includes the right to
receive certain parking units). The premises are located within the
area between Agüero, Lavalle, Guardia Vieja and Gallo streets,
in the Abasto neighborhood.
In June
2016, a preliminary barter agreement was signed, pursuant to which
we will receive 3,621 square meters in apartments plus a monetary
payment of US$1 million. Such complex will have two towers: I
and II. The consideration for Torre I will be delivered by June
2021, while the consideration for Torre II will be delivered by
September 2022. The value of the
preliminary agreement
was set at
US$7.5 million.
Neuquén Residential Plot– Neuquén, Province of
Neuquén (IRSA CP)
Through
Shopping Neuquén S.A., IRSA CP owns a plot of 13,000 square
meters with construction capacity of 18,000 square meters of
residential properties in an area with significant growth
potential. This area is located close to the shopping mall Alto
Comahue, the hypermarket currently in operation and a hotel to be
constructed in months to come.
Caballito Plot – City of Buenos Aires
On June
29, 2011, IRSA and TGLT, a residential developer, entered into an
agreement to barter for the development of a plot of land located
at Méndez de Andes street in the neighborhood of Caballito in
the City of Buenos Aires for IRSA will receive from TGLT cash and
future residential apartments to be constructed by TGLT on the
mentioned plot of land. TGLT planned to construct an apartment
building with parking spaces.The value of the transaction was
agreed upon US$12.8 million and consisted on a payment in cash of
US$0.2 million (US$159,375) and the transfer to IRSA: (i) a number
of apartments to be determined representing 23.1% of total square
meters of residential space; (ii) a number of parking spaces to be
determined representing 21.1% of total square meters of parking
space; and (iii) in case TGLT built complementary storage rooms, a
number to be determined, representing 21.1% of square meters of
storage space. TGLT was committed to build, finish and obtain
authorization for the three buildings making up the project within
36 to 48 months. TGLT mortgaged the land in favor of IRSA as
guarantee.
A
neighborhood association named
Asociación Civil y Vecinal SOS
Caballito
secured a preliminary injunction which suspended
the works to be carried out by TGLT in the abovementioned property.
On April 2018 TGLT and IRSA terminated the barter agreement and
IRSA recovered the land. In July 2018, the Supreme Court of Justice
issued a favorable final decision allowing the construction of
57,192 sqm of apartments on the plot.
Retail
Caballito Plot – City of Buenos Aires (IRSA CP)
In
November 1997, IRSA CP acquired a property of approximately 23,791
square meters in the City of Buenos Aires, in the neighborhood of
Caballito, one of the most densely populated of the city. During
the fiscal year 2018, the Company decided to present a new project
that may consist of four plots with a total surface area of 24,200
square meters and with a total covered area of 142,500 square
meters, and an open space of 14,300 square meters. The development
may have mainly residential use, with buildings from 5 to 10 floors
over the four plots, with 1,075 apartments of 1 to 4 rooms with a
total covered area of 92,750 square meters.
139
Between
the four plots, the project may include a commercial galleries of
approximate 11,000 additional square meters, which would generate
an outdoor walk through almost the entire extension of the
property.
Construction
permits have been approved for the four plots with the uses
described above. However, the Company have not yet decided when
launching it.
Offices
Polo Dot 2nd and 3rd Stages – City of Buenos Aires (IRSA
CP)
These
two parcels of 6,400 square meters with a construction capacity of
33,485 square meters each, are located adjoining to where the
extension of Dot Baires Shopping is planned. In April 2018, both
plots were unified into a single one of 12,800 square
meters.
Intercontinental Plaza II Plot - City of Buenos Aires (IRSA
CP)
In
the heart of the neighborhood of Monserrat, just a few meters from
the most trafficked avenue in the city and the financial center, is
the Intercontinental Plaza complex consisting of an office tower
and the exclusive Hotel Intercontinental. In the current plot of
6,135 square meters a second office tower of 19,600 square meters
and 25 stories could be built to supplement the tower currently
located in the intersection of Moreno and Tacuari
streets.
Other
Land Reserves
Other Land Reserves – Pilar, Pontevedra, Mariano Acosta,
Merlo, San Luis Plot, Llao Llao Plot and Casona Abril remaining
surface
IRSA
grouped here those plots of land with a significant surface area
the development of which is not feasible in the short term either
due to their current urban and zoning parameters, their legal
status or the lack of consolidation of their immediate environment.
This group totals around 7 million sqm.
Isla Sirgadero
On
September 3, 2015, the entire property of 10,083,270 sqm was sold
to several companies for US$3.9 million, payable in 16 quarterly
installments, plus an installment in kind, land resulting from the
final blueprint, equivalent to 10% of the surface area. Delivery of
the non-monetary consideration, consisting in 1,083,327 sqm, is
pending.
International
Lipstick Building, New York, United States
The
Lipstick Building is a landmark building in the City of New York,
located at Third Avenue and 53
th
Street in Midtown
Manhattan, New York. It was designed by architects John Burgee and
Philip Johnson (Glass House and Seagram Building, among other
renowned works) and it is named after its elliptical shape and red
façade. Its gross leaseable area is approximately 58,000 sqm
and consists of 34 floors.
As of
June 30, 2018, the building’s occupancy rate was 96.9%, thus
generating an average rent of US$77.50 per sqm.
|
|
As
of June 30,
|
|
|
|
Lipstick
|
2018
|
2017
|
YoY
Var
|
|
Gross Leaseable
Area (sqm)
|
58,092
|
58,094
|
-
|
|
Occupancy
|
96.9
%
|
95.2
%
|
1.7
p.p.
|
|
Rental price
(US$/sqm)
|
77.5
|
69.2
|
12.79
%
|
During
2018 we have successfully refinanced the "Lipstick" building debt,
reducing it from US$ 113 million to US$ 53 million, extending the
term to April 30, 2020 and reducing the loan interest rate from the
Libor + 4% to Libor + 2%.
Latham & Watkins occupies 40,035 sqm of the office and storage
space on a lease expiring on June 30, 2021. In April 2018,
Latham & Watkins communicated its intention of not be renewing
its lease. For more information see “Risk Factors –
Risks relating to our business in the United
States.”
140
Investment in Condor Hospitality Trust
IRSA
maintains its investment in the Condor Hospitality Trust Hotel REIT
(NYSE: CDOR) mainly through its subsidiary Real Estate
Investment Group VII (“REIG VII
”), in which IRSA holds a 100% interest. Condor is a REIT
listed in NYSE focused on medium-class hotels located in various
states of the United States of America, managed by various
operators and franchises.
Condor's investment
strategy is to build a branded premium, select service hotels
portfolio within the top 100 Metropolitan Statistical Areas ("MSA")
with a particular focus on the range of MSA 20 to 60. Since the
beginning of the reconversion of the hotel portfolio in 2015,
Condor has acquired 14 high quality select service hotels in its
target markets for a total purchase price of approximately US$ 277
million. In addition, during this time, it has sold 53 legacy
assets for a total value of approximately US$ 161
million.
As of
June 30, 2018, the Company held 2,245,100 common shares of
Condor’s capital stock, accounting for approximately 18.9% of
that company’s capital stock and votes. The Company also held
325,752 Series E preferred shares, and a promissory note
convertible into 64,964 common shares (at a price of US$ 10.4
each).
On September 27, 2018, Condor has initiated a process to evaluate
strategic alternatives to enhance shareholder value. This review
process, which will be conducted with the assistance of financial
and legal advisors, will consider the full range of potential
strategic alternatives, which includes but is not limited to,
acquisitions, business combinations, joint ventures, public and
private capital raises, recapitalization, and sale transaction
options. Condor has engaged KeyBanc Capital Markets as financial
advisor and McGrath North as legal counsel to assist in the review
and will engage such other advisors, as it deems
appropriate.
Others
Our interest in Banco Hipotecario
As of
June 30, 2018, IRSA helds a 29.91% interest in Banco Hipotecario.
Established in 1886 by the argentine government and privatized in
1999, Banco Hipotecario has historically been Argentina’s
leading mortgage lender, provider of mortgage-related insurance and
mortgage loan services. All of its operations are located in
Argentina where it operates a nationwide network of 64 branches in
the 23 Argentine provinces and the City of Buenos Aires, and 15
additional sales offices throughout Argentina. Additionally, its
subsidiary Tarshop S.A. ., a credit card and small loans company,
has 24 sales offices.
Banco
Hipotecario is a commercial bank that provides universal banking
services, offering a wide variety of banking products and
activities, including a wide range of individual and corporate
loans, deposits, credit and debit cards, insurance, brokerage,
asset management and related financial services to individuals,
small-and medium-sized companies and large corporations. As of
February 28, 2018, Banco Hipotecario ranked eleventh in the
Argentine financial system in terms of shareholders’ equity
and fifteenth in terms of total assets. As of June 30, 2018, Banco
Hipotecario’s shareholders’ equity was Ps.8,719.2
million, its consolidated assets were Ps.81,717 million, and its
net income for the twelve-month period ended December 31, 2017 was
Ps.1,539 million. Since 1999, Banco Hipotecario’s shares have
been listed on BYMA (the Buenos Aires Stock Exchange), and since
2006 it has had a Level I ADR program.
Banco
Hipotecario conducts its operations through the following business
units:
●
retail banking, which provides a full range of retail banking
products and services to individual
clients;
●
wholesale banking, which provides a full range of commercial
banking products and services to large
Argentine
companies, small and medium enterprises (“SMEs”) and
public-sector entities;
●
finance, which manages our funding, excess liquidity and
investments in securities; and
●
insurance, which provides a wide range of life,
property, unemployment and other insurance
products
to both wholesale and retail clients.
Banco
Hipotecario continues its business strategy of diversifying its
loan portfolio. As a result, non-mortgage loans increased from
Ps.14,845.9 million as of December 31, 2014 to Ps.17,944.7 million
as of December 31, 2015, from Ps.24,305.4 million as of December
31, 2016 to Ps.35,810.7 million as of June 30, 2017 and to
Ps.41,797 million as of June 30, 2018 increasing the interest in
the aggregate loan portfolio to the non-financial private sector
(without considering mortgage loans) from 84.1% as of December 31,
2014 to 90.6% as of June 30, 2018. Non-performing loans represented
4.5% of its total portfolio as of June 30, 2018.
Furthermore, Banco
Hipotecario has diversified its funding sources, by developing its
presence in the local and international capital markets and
increasing its deposit base. Its financial debt represented 53.5%
of the total financing as of June 30, 2018.
Its
subsidiaries include BACS, a bank specialized in investment
banking, assets securitization and asset management, BHN Vida S.A.,
a life insurance company, BHN Seguros Generales S.A., a
homeowners’ insurance company and Tarshop S.A.
141
Tarjeta
Shopping S.A. is a company founded in 1995 that is dedicated to the
issuance, processing and administration of credit cards, obtaining
cash and consumer financing in stores. In 2010, Banco Hipotecario
S.A. acquired an 80% of the company form us and the remaining 20%
is held by IRSA CP.
Others
Assets
La Rural (Exhibition and Convention Center)
LRSA
holds usufruct rights for the commercial operation of the
emblematic “Predio Ferial de Palermo” (Palermo
exhibition center) in the City of Buenos Aires. IRSA CP indirectly
holds a 35% interest in it.
In July
2016, IRSA acquired from FEG Entretenimientos S.A. 25% of the
shares of EHSA, in which IRSA already held 50% of the share. IRSA
also acquired a 1.25% interest in ENUSA from Mr. Marcelo Figoli.
The aggregate acquisition price for such acquisitions was Ps.66.5
million.
In
addition, immediatly after its acquisition,IRSA sold 5% of the
shares of EHSA to Mr. Diego Finkelstein, who already owned a 25%
equity interest. The sale amount was fixed in the sum of Ps.13.45
million. As a result, IRSA now holds 70% of the shares in EHSA and
Mr. Diego Finkelstein holds the remaining 30%.
EHSA
holds, both directly and indirectly, 100% of the shares of OASA and
95% of the shares of ENUSA. OASA holds 50% of the voting stock of
LRSA, a company that holds the right to commercially operate the
emblematic “Predio Ferial de Palermo” in the City of
Buenos Aires, and SRA holds the remaining 50%. In addition, OASA
manages LRSA pursuant to agreements entered into with SRA that
include the right to appoint the Chairman—with casting vote
on certain matters—and the general manager of
LRSA.
Furthermore, ENUSA
is mainly engaged in organizing entertainment events for trade
fairs.
On
August 4, 2017, a 15-year concession agreement for the Exhibition
and Convention Center of the City of Buenos Aires was executed by
the joint venture "LA RURAL S.A. - OFC S.R.L. - OGDEN ARGENTINA S.A
(“OASA”). – ENTRETENIMIENTO UNIVERSAL S.A. UNION
TRANSITORIA (“EUSA”)", which was granted pursuant a
public bidding process.
The
members of the joint venture hold the following interests: (a) LRSA
5%; (b) OFC SRL20%; (c) OASA 55%; and (d) EUSA 20%.
The
shareholders of LRSA are Sociedad Rural Argentina, which is the
owner of a 50% interest, and OASA, which holds the remaining 50%
equity interest.
OASA
and EUSA are controlled companies of EHSA, whose shareholders are
us, with a 70% interest, and Diego Finkelstein, who holds the
remaining 30%.
Consequently, IRSA
indirectly hold a 50.0% interest in the joint venture.
The
Exhibition and Convention Center has a surface area of
approximately 22,800 sqm and may accommodate approximately 5,000
attendees. It has a main exhibit hall and an ancillary hall,
offices and meetings rooms, arranged in three underground levels
that were designed to blend into the landscape extending from the
School of Law of the University of Buenos Aires to Parque
Thays.
TGLT (real estate)
TGLT is
a real estate company listed on the ByMA which is mainly engaged in
residential development projects in Argentina and Uruguay. During
fiscal year 2018, IRSA sold approximately 3.7 million ordinary
shares of TGLT, reducing our stake from 9.5% to 4.2%.
On
August 1, 2017, IRSA exercised our preemptive subscription and
accretion rights and purchased 22,225,000 Subordinated Notes
Convertible into Newly Issued Shares of TGLT for an aggregate
amount of US$22,225,000 (US$ 1 par value) due 2027. If all the
holders exercised their conversion rights under such Notes, the
company’s interest in TGLT would increase to 12.8% of its
stock capital, up from 4.2%.
DirecTv Arena
DirecTv Arena is an indoor stadium with unique
features intended for the performance of top-level international
events, including sporting and events. The price set for the
transaction amounted to US$4.2 million. In this way,
IRSA
continues to expand, through OASA,
which also owns a stake in LRSA and in the new Convention Center of
the City of Buenos Aires, its exposure to the activity of fair
events and entertainment, which could generate synergies with the
business of shopping centers.
OASA,
which is indirectly controlled by us in a 70%, has acquired a 60%
stake of 'La Arena S.A.' which developed and operates the
stadium known as 'DIRECTV ARENA', located at kilometer 35.5 of the
Pilar branch, Tortuguitas, in the province of Buenos
Aires.
142
Avenida (e-commerce)
IRSA
holds a 17.84% interest in Avenida. Avenida is an e-commerce
company. Recently, two of Avenida`s principal investors, who
decided not to inject any further funds in light of the significant
losses recorded by them.
On
January 20, 2017, Avenida issued shares of stock in a new round of
investment seeking commitments for US$3.8 million. We made a
US$460,000 contribution and capitalized a loan held with Avenida
for US$229,515 increasing our stake in Avenida to 17.84%. In such
round, Avenida set apart 385,103 shares to be allocated to an
equity plan.
Moreover, IRSA
holds a warrant entitling us to purchase up to 3,976,225 additional
preferred shares at a price of US$0.10 per share, exercisable until
the earlier of the expiration of an 18-month term or the date a new
equity security is issued, subject to certain conditions. If we
exercise such warrants, our interest in Avenida’s stock
capital would increase to 25%.
In this
context, Avenida has changed its management team and its business
model and strategy.
Operations Center in Israel
Investment
in IDB Development Corporation
Acquisition of Control of IDBD
On May
7, 2014, IRSA, acting indirectly through Dolphin, acquired, jointly
with E.T.H.M.B.M. Extra Holdings Ltd. (later CAA Extra Holdings
Ltd.) (“CAA,” company incorporated under the laws of
the State of Israel) controlled by Mordechay Ben Moshé,
entered into a transaction to acquire an aggregate of 106.6 million
common shares in IDBD representing 53.30% of its stock capital, in
the context of a debt restructuring transaction related to
IDBD’s holding company, IDBH. Under the terms of the
agreement, Dolphin and CAAexecuted a Shareholders’ Agreement
and Dolphin and CAA each acquired a 26.65% interest in IDBD. The
initial amount invested by each Company was NIS 475 million,
equivalent to approximately US$272 million at the exchange rate
prevailing on that date. On October 11, 2015, IFISA (a company
indirectly controlled by Eduardo S. Elsztain) acquired CAA, and the
directors appointed by CAAin IDBD tendered their irrevocable
resignation from the Board of Directors and Dolphin became entitled
to appoint new board members. Since that date, IRSA started to
consolidate IDBD into our financial statements.
Tender Offers
On
March 31, 2016, Dolphin satisfied its commitments under the debt
restructuring agreement of IDBD’s controlling company, IDBH,
with its creditors (the “Arrangement”). Such amendment
had been approved by 95% of IDBD’s minority shareholders on
March 2, 2016 and by the competent court on March 10, 2016. As a
result, as of April 3, 2016: (i) Dolphin purchased all the shares
held by IDBD’s minority shareholders; (ii) all the warrants
held by IDBD’s minority shareholders expired; and (iii)
Dolphin made additional contributions to IDBD in the form of a
subordinated loan, as described below.
The
price paid for each IDBD share to minority shareholders as of March
29, 2016 was: (i) NIS 1.25 per share in cash, resulting in a total
payment of NIS 159.6 million (US$42.2 million); (ii) NIS 1.20 per
share through the subscription and delivery of IDBD’s Series
I bonds (“IDBD Bonds”) that was paid by Dolphin at par;
therefore, it subscribed bonds for NIS 166.5 million, including the
payments due to warrant holders; and (iii) the commitment to pay
(a) NIS 1.05 per share (subject to adjustment) in cash if Dolphin
receives authorization to assume control of Clal Insurance Company
Ltd. and Clal Insurance Business Holdings Ltd. or (b) if IDBD sells
its control interest in Clal for a sale price per Clal share in
excess of 75% of its book value in such case Dolphin would be
required to pay approximately NIS 155.8 million (approximately
US$40.8 million).
Any
warrants held by minority shareholders that were not exercised as
of March 28, 2016, would be convertible at a price equal to the
difference (if positive) between NIS 2.45 and the warrant exercise
price, and payable in IDBD Bonds. In addition, Dolphin made a
capital contribution of NIS 348.4 million into IDBD, in exchange
for a subordinated loan, convertible into shares.
143
As
security for payment of each cash due to Clal shareholders, on
March 31, 2016, Dolphin granted a pledge over 28% of the stock
capital in IDBD it owns and its rights under a NIS 210 million
subordinated loan made on December 1, 2015 due from IDBD. If IDBD
issues new shares, additional shares shall be pledged until
reaching 28% of IDBD’s total stock capital.
Dolphin
has committed to abstain from exercising its right to convert the
subordinated loan into IDBD shares until the above mentioned pledge
is released. However, if the pledge is enforced, the
representatives of IDBH’s creditors will be entitled to
convert the subordinated debt into IDBD shares, up to a maximum of
35% of all IDBD shares outstanding.
On
April 3, 2016, IDBD’s shares were delisted from the TASE and
all the minority warrants were cancelled. IDBD continues to be
listed on TASE as a “Debentures Company” pursuant to
Israeli law, as it has bonds listed on such exchange.
Purchase of shares of IDBD to IFISA
In
December 1, 2017, Dolphin Netherlands B.V., has executed a share
purchase agreement
pursuant to which
Dolphin purchased all
all of the shares that IFISA held of
IDBD, which amounted to 31.7% of the capital stock. As of the end
of December 31, 2017, Dolphin controlled 100% of IDBD's
shares.
The
transaction was made at a price of NIS 398 million (equivalent to
NIS 1.968 per share and approximately to Ps.1,968 million as of the
date of the transaction). As consideration of the transaction all
receivables from Dolphin to IFISA have been canceled plus a payment
of US$ 33.7 million (equivalents to Ps.588 million as of the date
of the transaction). This transaction was accounted in equity as a
decrease in the equity holders of the parent for an amount of
Ps.2,923 million.
As of
the date of this annual report, the investment made from IRSA in
IDBD and DIC approximatelly is US$640 million, and IRSA’s
indirect equity interest reached 100% of IDBD’s undiluted
stock capital. For additional information please see
“
Significant acquisitions,
dispositions and development of
business
.”
Purchase
of DIC’s shares by Dolphin Netherlands B.V.
On August 22, 2017, under the scope of the Law to
Promote Competition and Reduce Concentration, Dolphin Netherlands
B.V. made a non-binding offer to purchase all the shares held by
IDBD in Discount
Investment Incorporation Ltd.
(“
DIC
”)
.
For
purposes of the transaction, an independent board committee has
been organized to assess the offer and negotiate its terms and
conditions. The Audit Committee has issued an opinion without
reservations as to the transaction in accordance with the terms of
section 72 and followings of the Capital Markets Law N°
26,831.
In
November 2017, Dolphin IL, a subsidiary of Dolphin Netherlands
B.V., has subscribed the final documents for the acquisition of the
total shares owned by IDBD in DIC.
The
transaction has been made for an amount of NIS 1,772 million
(equivalent to NIS 16.60 per share of DIC). The consideration was
paid NIS 70 million in cash (equivalent to Ps.348 million as of the
date of the transaction) and
a bond
at a nominal amount of
NIS 1,773 million (equivalent to
Ps.8,814 million as of the date of the transaction) was financed by
IDBD to Dolphin, maturing in five years, with the possibility of an
extension of three additional years in tranches of one year each,
that will accrue an initial interest of 6.5% annually, which will
increase by 1% annually in case of extension for each year. In
addition to these payment conditions the payment of NIS 70 million
in cash is added. Furthermore, guarantees have been implemented,
for IDBD bondholders and their creditors, through pledges of
different degree of privilege over DIC shares resulting from the
purchase. Moreover, a pledge will be granted in relation to
9,636,097 (equivalent to 6.38%) of the shares of DIC that Dolphin
currently holds in the first degree of privilege in favor of IDBD
and in second degree of privilege in favor of IDBD's creditors.
This transaction has no effect in the consolidation structure and
has been accounted in equity as a decrease in the equity holders of
the parent for an amount of Ps.114 million.
It
should be noted that the financial position of IDBD and its
subsidiaries at the Operations Center in Israel does not affect the
financial position of the Company and subsidiaries at the
Operations Center in Argentina. In addition, the commitments and
other covenants resulting from IDBD’s financial debt do not
have impact on the Company since such indebtedness has no recourse
against us and it is not granted by IRSA’s
assets.
In
Addition, other main investments include the debenture from Dolphin
IL (which was received in the transaction involving the sale of the
IDBD’s holdings in DIC in November 2017, as stated
above).
144
On May
6, 2018, IDBD agreed on a SWAP on shares of DIC held by third
parties with a banking entity not related to the group for a period
of one year with the possibility of extending an additional year.
The total of shares subject to the agreement is 6,020,811 and the
value of the swap at the time of subscription is on average NIS
10,12 per share, approximately NIS 60 million (approximately Ps.342
million on the day of the transaction). The present transaction
will be settled in cash for the difference between the quotation at
the end of the agreement and the agreed price. For this
transaction, we have not increased its participation in DIC for
this transaction and granted guarantees on certain financial
assets.
As of
June 30, 2018 we owned indirectly 76.57% of DIC
and as of the date
of this annual report we owned indirectly 77.92% of DIC, for more
information see "Recent Developments."
IDBD's
investee companies
As at
June 30, 2018, the investee companies which are held by IDBD
include IDB Tourism and Clal, which are presented under
discontinued operations, as well as IDBG (50%) and Modiin Energy
(18%), which are treated as investee companies accounted by the
treated at the equity method.
DIC
investee companies
As at
June 30, 2018, the main consolidated companies directly held by DIC
are Property & Building Ltd. (64.4%), Cellcom (43.1% in
capital, 47.2% in voting rights), and Elron (50.3%).
In
addition, other main investments include the debenture from Dolphin
IL (which was received in the transaction involving the sale of the
IDBD’s holdings in DIC in November 2017, as stated
above).
Segments
Within
the Operations Center in Israel, the Company operates in the
following segments though IDBD and DIC:
Real Estate (DIC)
PBC
operates in Israel and in the United States, within two separate
operating segments: the yield bearer property segment and the
residential construction segment. PBC ahs other investments in
agriculture, which is not material to DIC. As of June 30, 2018, PBC
owned rental properties in Israel for approximately 1,175,000
square meters (as compared with approximately 1,170,000 square
meters as of December 31, 2017), the HSBC Tower in New York with an
area of approximately 80,000 square meters, which according to a
valuation dated July 30, 2018 is estimated in an approxmate amount
of US$ 920 million, and the Tivoli project in Las Vegas, with
leaseable area of approximately 31,000 square meters of office
spaces and approximately 31,000 square meters of commercial space,
as of June 30, 2018 the occupancy rate stands of approximately 68%,
as well as land reserves of approximately 655,000 square meters in
Israel.
PBC’s
properties in Israel and in the United States are as
follows:
●
Areas rented for the use of offices and high tech industries
(“Office and Hi-Tech Uses”).
Business parks and office buildings for
hi-tech industries.
PBC has expertise in the provision of
solutions for the special requirements of this industry, and builds
designated buildings which are adjusted to the needs of the
lessees, and also provides management services for those
buildings.
Office buildings.
PBC’s office
buildings are located in high demand areas, and most are leased, at
high occupancy rates, generally for long lease periods. Areas for
office use are characterized by areas used as parking lots, which
constitute an inseparable part of the buildings. PBC’s
activities abroadmainly consist of the HSBC Tower on Fifth Avenue
in New York.
145
●
Areas rented for industry, workshop, logistics and storage uses
(“Industry and Logistics Uses”).
PBC’s areas
for industry and logistics uses in Israel are characterized by
areas with a large single space, service yards and large
operational areas. In light of the rent which can be collected for
areas of this kind, which is relatively low, and the fact that
their construction generally requires construction on large areas
of land, PBC concentrates, as do other companies operating in the
segment, most of its industrial areas in periphery areas and in
areas located close to airports and seaports. Shopping malls,
commercial centers and recreational areas (“Uses for
Commercial and Recreational Centers”).
●
Shopping Malls, Commercial centers and recreational areas (Uses for
commercial and recreational centers).
PBC’s areas
which are leased to commercial and recreational centers in Israel
include commercial centers, which are located in central areas or
areas near major junctions at highways from major cities,
conference centers and recreational centers. The areas of PBC which
are rented for commercial purposes abroad primarily include its
share in the Tivoli project in Las Vegas.
●
Associated
services in the revenue
– genereting properties segment in Israel.
PBC
also provides management and maintenance services, primarily to
lessees in areas which are used for office and commercial
purposes.
Geographical distribution
PBC
divides its properties into two main regions - Israel and the
United States, and five sub-regions: in Israel - North, Center and
South; in the United States - Northeast and West.
In
Israel is primarily due the fact that, in Central Israel, rent is
significantly higher than the average rent in Northern and Southern
Israel. The common uses in Central and Northern Israel are offices,
hi-tech and commerce, while in Southern Israel most properties are
used for logistics and industry, as well as commerce.
In the
United States, PBC’s properties are located in various
states, with different economic characteristics. In the United
States rent in the Northeast is significantly higher than the
average rent in the Western United States region, and vary by
locations and uses (luxury office and commercial buildings in the
Northeastern region, as compared to commercial centers in the
Western United States region), as well as the location of the
properties (large city centers such as New York, as compared to
residential neighborhoods in the Western region).
However, even
within each region (both in Israel and in the United States), there
are differences among sites, as well as difference, in some cases,
between the various properties in each site, due to the
characteristics of the property.
Mix of lessees
The
revenue-generating properties segment is characterized by a wide
variety of customers, including large and small companies and
business customers, as well as private customers.
PBC
leases include mainly medium and longer term rental contracts, and
in general, rental contracts in Israel involve unprotected leases,
and rental rates are linked to the consumer price index. The policy
of PBC is to prefer long term contracts with high-quality
lessees.
146
Leased
properties are tailored to the specific requirements of the
customer. Given the cost of customizing properties to the
lessee’s specific needs, related for buildings of this kind
are signed for long periods, and generally include options for the
lessee to extend the term period. Additionally, some of the
Group’s lessees perform, at their own expense, improvements
of the leased properties, and adapt them to their needs. Such
investments by lessees are more efficient than transferring to
other areas.
Presented below is
a corporate chart of PBC and its Subsidiaries as of December 31,
2017:
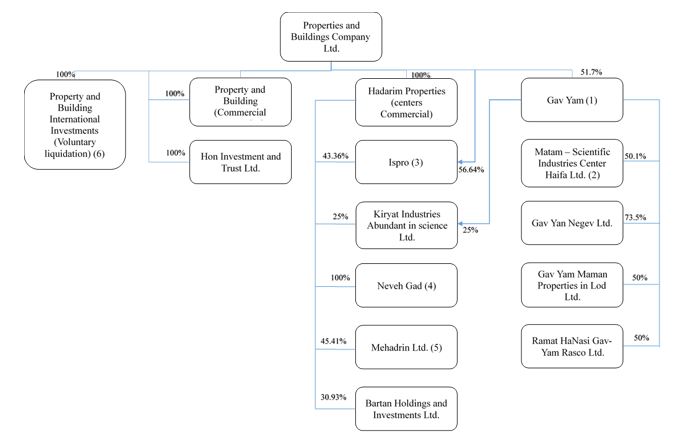
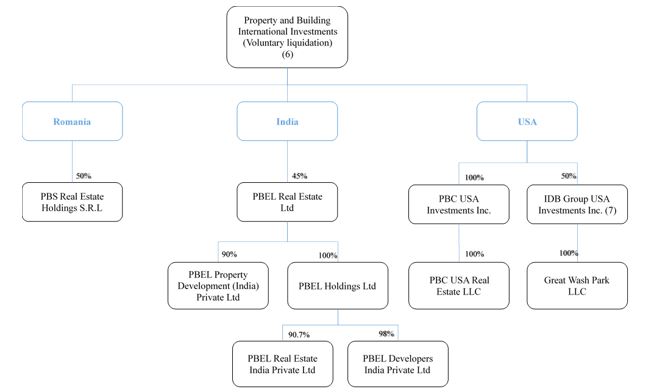
147
(1) Gav-Yam
is a public company whose securities are listed for trading on the
TASE. Most of Gav-Yam’s activities are in the
revenue-generating properties segment, primarily hi-tech parks,
business parks, offices and logistical centers, as well as
construction and marketing, together with a partner, of a
residential neighborhood in Haifa.In June 2017, Gav-Yam issued to
the public 131 thousand ordinary shares, for a total net
consideration of NIS 196 million. As a result of this issuance, the
holding rate of Property & Building in Gav-Yam decreased from
55.0% to 51.7%. As a result of the aforementioned sale, the Company
recorded its share in the increase in capital attributed to the
owners of in the amount of NIS 15 million
(2) Matam is
the rights holder to revenue-generating properties in Science Based
Industries Park, one of the largest hi-tech industry parks in
Israel, located in the southern suburbs of the city of
Haifa.
(3) Ispro is
a wholly owned company of PBC, whose activities primarily include
revenue-generating properties, primarily commercial centers and
logistical areas.
(4) Neveh-Gad
- a private company wholly owned by PBC, whose activities are
primarily in the residential construction segment.
(5) Mehadrin
is a public company whose securities are listed for trading on the
TASE. Most of Mehadrin’s activities are in the agricultural
segment. Hadarim Properties and Phoenix Holdings Ltd. (which holds,
through a wholly owned subsidiary, 41.4% of Mehadrin) are
considered to be joint holders, by virtue of the shareholders
agreement between them, of approximately 86.8% of the voting rights
and of the right to appoint directors in Mehadrin.
(6) PBC
International Investments was incorporated in Israel for the
purpose of operating in the field of revenue-generating properties
and residential construction abroad, through foreign subsidiaries
and associate companies. At the end of the liquadation PBC will
hold PBC international's subsidiaries directly.
(7) As of
June 30, 2018, IDB Group USA Investments Inc. ("
IDBG
") is a company incorporated in the
United States. IDBG was incorporated in 2005 and is held in equal
parts by PBC and IDBD, for the purpose of investing in real estate
projects in the USA. IDBG holds, together with additional
investors, real estate corporations which operate in Las Vegas. The
real estate corporation GW holds the rights to a commercial and
office areas (which is being built in stages). Tivoli project
(“GW” project) - As of proximate to the publication
date of the report, IDBG holds, directly and indirectly, the entire
share capital and voting rights of GW. The Tivoli project is
comprised of three phases, in a space of approximately 868,000
square feet of retail, office and hotel space (in this section: the
"
Project
"). The first two
phases, in a space of approximately 670,000 square feet were
completed and comprising of approximately 337,000 square feet of
office, and approximately 333,000 square feet of retail. Occupancy
rate as of the end of June 2018 is 68%. The third phase of the
Project remains under development with no completion date specified
at this time. IDBG obtained an independent third-party appraisal of
its investment property. The valuation was performed mainly by
discounting the future cash flows anticipated to be derived from
the Project. The discount rates used by the independent appraisers
was 8.5% as of June 30, 2018, and June 30, 2017, and was selected
based on the type of property and its intended use, its location
and the quality of the lessees. The capitalization rates used was
6.5% as of June 30, 2018 and June 30, 2017. The valuation concluded
that the fair value of the property as at June 30, 2018 to be $ 249
million (June 30, 2017 - $268 million), including $18 million in
respect of a parcel of land adjacent to the Project – see
below. Due to the change in fair value, IDBD incurred a loss of
approximately $ 22 million for the six months ended June 30, 2018
(June 30, 2017- $ 70 million).. GW has a mortgage loan from KeyBank
that bears interest at the 30-day LIBOR (2.09% as of June 30, 2018)
plus 5.0%. On January 3, 2018, PBC signed an amendment to the
mortgage loan with KeyBank and extended the loan maturity date to
December 31, 2018. As of June 30, 2018, the loan balance was
approximately $59 million, and GW is in compliance with interest
reserve obligations under the loan. The mortgage loan is
collateralized by a lien on the investment property. On January 3,
2017, IDBG signed an agreement for the receipt of a loan from an
Israeli financing institution for $ 41.4 million. The loan bears an
annual fixed interest rate of 7%. The loan principal will be repaid
in a single payment at the end of 24 months. .
In the second
quarter of 2018, PBC initiated an active program to locate a buyer
for a parcel of land adjacent to the Project intended for
multi-family residential development, which land was classified in
investment property. In August 2018 PBC signed a contract to sell
the land in consideration of $18 million. The contract provides
that PBC is entitled to additional consideration of up to $2.5
million if certain conditions are achieved. The closing of the
contract is subject to, among others, performance of due diligence
procedures by the purchaser and receipt of certain local
municipality approvals.
(8) TPD
Investment Limited (in England) – Until September 2017, PBC
and DIC, through England Hotels - Property & Building Ltd. (a
company wholly owned by PBC) (“Property & Building
Hotels”) owned rights (20%) to TPD Investment Limited
(“
TPD
” or the
“
English
Company
”), which primarily holds two hotels: the
Hilton in London, and the Hilton in Birmingham, as well as the
rights associated therewith (including approximately 1,900 hotel
rooms (cumulatively) and conference halls).. In March 2014, the
English partner (the “
English
Partner
”) in the English Company announced that
refinancing had been performed, in which the English Partner
announced, inter alia, to PBC, that it and its additional
partnerholding rate was diluted, each, to 6.39%. After the failure
of the negotiations which were conducted between PBC and the
additional partner with the English Partner, PBC filed, together
with the additional partner, in April 2014, a claim with the Court
in London, demanding that the English Partner acquire their
holdings in TPD, in accordance with their market value, as will be
determined by the Court, as well as additional conventional
remedies in accordance with English law (the “
Claim
”). In April 2017 PBC
received a ruling from the English Court, according to which its
English Partner in TBD and TBD are obligated to acquire PBC's
rights and the other Partner's rights in TBD in an amount of GBP 48
million (50% to PBC). On September 29, 2017 this ruling was
executed and the company received GBP 24 million.
148
The
following are the main Rental Properties and Properties under
development of PBC as of June 30, 2018:
|
Property's
Name
|
Fair
Value
(in
million of Ps.)
|
Date
of
construction
|
Date
of acquisition by PBC
|
Banking
/ financial institution -
Encumbrances
|
|
Commercial
centers
|
|
|
|
|
|
Kiryat
Ono Mall
|
3,914
|
Nov-07
|
2007
|
-
|
|
Shopping
Center Modi’in A
|
1,767
|
Aug-05
|
-
|
Bank
|
|
Ispro planet -BeerSheva
–
Phase
1
|
2,091
|
2016
|
-
|
-
|
|
High-tech buildings, offices
and industry
|
|
|
|
|
|
HSBC
|
25,194
|
1927-1984
|
2010
|
Bank
/ Financial institution
|
|
Matam
park - Haifa
|
12,822
|
1979-2015
|
1999
|
Bank
|
|
Herzeliya
North
|
9,003
|
1996-2015
|
1970
|
-
|
|
Gav-Yam
Center - Herzeliya
|
5,176
|
1997-2006
|
-
|
Bank
|
|
Neyar
Hadera Modi’in
|
1,665
|
2010-2016
|
2010
|
-
|
|
Holon
|
1,925
|
1960-1985
|
|
|
|
Gav
yam park - Beer Sheva
|
2,407
|
2013-2018
|
2011
|
Bank
and Financial institution
|
|
Others (including
trade centers)
|
18,862
|
-
|
-
|
-
|
|
Properties
in construction
|
|
|
|
|
|
Ispro planet -BeerSheva
–
Phase
2
|
252
|
in
progress
|
-
|
-
|
|
Amot
tozeret H'aaretz
|
2,777
|
in progress
|
-
|
-
|
|
Others
|
1,806
|
-
|
-
|
-
|
149
Activities of PBC in the residential construction segment in
Israel
PBC’s
residential construction segment develops and sells residential
units. The residential units are developed within residential
neighborhoods, including full environmental development and
associated community services. PBC’s residential construction
segment also includes the identification and development of new
lands including urban renewal projects (demolition-construction).
As of
December 31, 2017
, the
balance of approved construction rights for the projects in which
PBC was a partner amounted to approximately 1,866 residential
units(of which 1,127 units belong to PBC), where approximately 942
residential units are currently in construction (of which 680 units
belong to PBC).
In June 30, 2018, the
construction of and markting of 812 residential units. In the
second quarter of 2018, 55 housing units were sold (as compared
with approximately 80 housing units in the corresponding period
last year). In the first half of 2018, 105 residential units were
sold (as compared with approximately 160 residential units in the
corresponding period last year). In the first half of 2018,
PBC’s revenues from the sale of residential units amounted to
approximately NIS 194 million, as compared with approximately NIS
286 million in in the first half of 2017. In the first half of
2018, 379 housing units were occupied, compared to 27 housing units
in the corresponding period last year.
PBC builds and
markets, in the residential construction segment in Israel, as of
June 30, 2018
, approximately
812 residential units, of which 511 were sold, in 6 different
complexes throughout the country.
In June
2018 Gav-Yam's General Assembly approved the transaction for a
combination deal with Shufersal Real Estate (in this section:
“
Shufersal
”)
regarding land of 8,800 sqm owned by Shufersal in Ra'anana.
According to the agreement Shufersal will sell to Gav-Yam 69.5% of
the land in exchange for Gav-Yam Building on the land a project of
offices and retail with a total gross area of 41,000 sqm and a
parking lot of 1,000 places. The validity of the agreement is
subject to the fulfilment of the following conditions within 24
months of the signature date of the agreement: the transaction was
also approved by Shufersal's general assembly. The transaction is
conditional upon the approval of a detailed zoning plan for the
project.
In July
2018, PBC issued NIS 507 million par value debentures (Series I) by
way of expanding the series for a total gross consideration of NIS
500 million, which reflects an unlinked yield of
4.27%.
Supermarkets(DIC)
Shufersal is a
public company, which is included under the Tel Aviv 35 index,
which was incorporated in Israel, whose shares and debentures are
listed for trading on the TASE. It is primarily engaged in the
ownership and management of a supermarket chain - the largest and
leading chain in Israel, in terms of sales volume. Shufersal is
also active in the real estate segment and in the customer club
credit card segment. In December 2017 Shufersal completed the
acquisition of the entire share capital of New Pharm Drugstores
Ltd. (“New Pharm”), which operates in the drugstore
sector.
In June
2018, a transaction was completed in which DIC sold 16.6% of the
issued share capital of Shufersal, for a total net consideration of
NIS 848 million, according to which DIC’s holdings in
Shufersal decreased to approximately 33.6% and therfore ceased to
be the controlling shareholder of Shufersal. Thus, after the date
of the said sale DIC ceased to consolidate the financial statements
of Shufersal.
Accordingly,
commencing from the closing date of the said sale, Shufersal ceases
to be classified as a "second tier company" (nor is it a "first
tier company"), within the meaning of these terms in the the
Reduced Concentration Law.
Shufersal Group
employs approximately 13.5 thousand employees and has an annual
revenues of NIS 12.5 billion.
In
Israel, the retail segment business's results are subject to
seasonal fluctuations as a result of the consumption behavior of
the population proximate to the Passover holidays (March and/or
April) and Rosh Hashanah and Sukkoth holidays (September and/or
October). This also affects the balance sheet values of inventory,
customers and suppliers. Shufersal revenues from cellular services
are usually affected by seasonality with the third quarter of the
year, which is characterized by higher roaming revenues due to
increased incoming and outgoing tourism.
In
2018, the Passover holiday fell at the beginning of April, compared
to 2017 when it was at the middle of April. The timing of the
holiday affects Shufersal’s sales and special offers in the
second quarter of 2018, compared to last year. The Passover holiday
in the second quarter of 2018 had a smaller effect on
Shufersal’s results than in the corresponding quarter in
2017, therefore analysis of the results for the first half of the
year compared to the corresponding period in 2017 better represents
the changes between periods. On June 5, 2018, a wholly-owned
subsidiary of Shufersal entered into an agreement with Amot
Investments Ltd. ("Amot") whereby the subsidiary Amot will acquire
25% of the lease rights that Amot has in vacant real estate in the
Modi'in industrial zone, (in this section: "the Project"), where
the parties to the project will be 25% of the subsidiary and the
remaining 50% will be regarded to Amot, in unspecified parts, and
Shufersal will lease the logistics center, which will serve as an
automated center for the Shufersal's online operations. The total
investments in respect of the establishment of the automated
centers in Modi'in and Kadima, as aforesaid, are estimated at
approximately NIS 600 million, with most of the said amount being
in respect of the payment for the automation equipment and
construction, and will be spread over a period of four
years.
Shufersal operates
in four operating segments: the retail segment, the real estate
segment, the credit card customer club management segment and, as
from December 31, 2017, the New Pharm segment, as described
below:
Retail
segment. This segment includes the retail marketing of food and
other products in Shufersal branches and the manufacture of frozen
and fresh baked products that are sold mainly in the
Shufersal’s branches. As of June 30, 2018, Shufersal operated
276 branches (as compared with 272 and 277 branches at the end of
2017 (same as 2016) and 2015, respectively').
150
Shufersal owns the
largest supermarket chain in Israel in terms of sales
volume.
As of
December 2017, Shufersal operates two branches of this Segment, the
"Discount Discount Group" and the "Group of Neighborhood Branches".
These two groups include four different formats in the retail
segment, including an on-line format “Shufersal Online”
and organic food stores, throughout the country, with the aim of
satisfying its customers and providing them a buying experience
that differs and varies in each of the formats. Shufersal have a
mix of varied products organized in a number of sales departments
and sub departments in each store, including, in the health areas
that were placed in part of the branches, and it includes, among
other things, products sold under the private label of Shufersal,
with the view of offering the consumer a quality product,
strengthening price perception (a quality product for cheaper
prices than similar products in the same category), developing
consumer loyalty and improving profitability of the categories in
which the private label is sold. The area of manufacturing frozen
and fresh baked products is operated by a wholly owned subsidiary
of Shufersal.
Real
estate segment. The real estate activities of Shufersal were
separated, beginning on April 1, 2013, into Shufersal Real Estate
Ltd. (“Shufersal Real Estate”), a wholly owned
subsidiary whose assets include both branches which are rented to
Shufersal (which are classified in Shufersal’s Consolidated
Financial Statements as fixed assets) and real estate properties
which are rented out to third parties (which are classified as
investment property). The aforementioned properties do not include
Shufersal’s logistical center in Rishon Letzion (including
the attached branch), and Shufersal’s new logistical center
in Shoham. The real estate activity includes: (A) Real estate
development as an independent business segment; and (B) Integrating
Shufersal’s primary activity in the retail segment,
including: development of existing properties, acquisition of lands
for future development and operating regional and local operating
branches, and improving surrounding commercial areas to increase
the scope of activity in the complex. The neighborhood branches
group: 80 branches in the neighborhood branch format (“My
Shufersal”), with an emphasis on offering convenience,
availability, and personalized service, as well as 51 branches in
the very small branches format in neighborhoods and city centers,
operated primarily by franchisees (“Shufersal
Express”); The activity in the neighborhood branches group
also includes the “Organic Market” activity. Shufersal
operates, as of December 31, 2017, and 70 health markets throughout
the country, under the brand “Green,” and also operates
5 independent stores under the brand “Organic
Market.”
Presented below are
details regarding the real estate properties which are owned by
Shufersal Real Estate as of December 31, 2018:
|
|
Number
of properties
|
Total
area (thousands of square meters)
|
Fair
value (NIS millions)
|
Rent and annual management fees (NIS
thousands)
(2)
|
NOI (NIS thousands)
(3)
|
Average
yield
|
|
Branches rented to
Shufersal
|
70
|
Approx.131
|
1,702
(1)
|
125,051
|
118,311
|
7.1
%
|
|
Properties under
construction which will be rented to Shufersal and to
externals
|
2
|
Approx.5
|
21
(1)(5)
|
-
|
-
|
-
|
|
Real estate
properties which will be rented to externals
(4)
|
2
|
Approx.50
|
84
|
-
|
-
|
-
|
|
Real estate
properties rented to externals
|
20
|
Approx.54
|
504
|
43,091
|
23,977
|
4.77
%
|
|
Total
|
94
|
Approx.240
|
2,311
|
168,142
|
142,288
|
6.54
%
|
(1) The fair value
is in accordance with the presentation of these properties in the
books of Shufersal Real Estate. In the books of Shufersal, these
properties are classified according to their amortized cost of
acquisition, and not at fair value.
(2) Including
income from Miscellaneous.
(3) NOI at
Shufersal Real Estate - Shufersal Real Estate's gross profit in
annual terms.
(4) Not including
lot areas regarding which, in 2016, a zoning plan was approved
which permits construction at a scope of approximately 40,000 built
square meters, Some of which are classified in Shufersal's
financial statements as a branch, and that branch in 2017 amounts
to approximately NIS 11 million.
(5) The balance of
the depreciated cost in Shufersal's books is approximately NIS 998
million.
Until
January 11, 2018, the credit-card company that issued the credit
cards to the Shufersal's customers was Leumi Card Ltd.
("
Leumi Card
"), by virtue of
an agreement dated July 19, 2006 between the parties, for issuance
and operation of the credit cards to the Shufersal's customers. On
August 28, 2017, Shufersal notified Leumi Card that it did not wish
to renew the Leumi Card agreement, and accordingly, the agreement
was terminated on January 18, 2018.
As of
January 18, 2018, the credit cards are issued to Shufersal's
customers by Israel Credit Cards Ltd. and Diners Club Israel Ltd.
(jointly - "CAL"), pursuant to a memorandum of understanding signed
between Shufersal and CAL on November 2, 2017.
During
the first half of 2018, Shufersal began to establish the new credit
card club, during which 400,000 tickets were issued.
Accordingly, on
April 24, 2018, Shufersal was served with a statement of claim
filed by Leumi Card together with an application for temporary
injunctions against Shufersal and against the accountants of
Shufersal Finances, Limited Partnership (the "Partnership", PwC,
respectivaly) and the general partner of the partnership. In the
framework of the claim, the court was asked, among other things, to
issue an order declaring that all of Shufersal credit card activity
(with all of its income driven from it) belongs to the Partnership
and as such must be performed by it and even if the issuance and
operation services are provided by a company other than Leumi Card.
In addition, Leumi Card claimed that that the options granted to
Shufersal and
Leumi Card in the
partnership agreement are valid and have not expired. Moreover,
they requested to appoint a valuator for the purpose of valuing the
partnership. Shufersal rejected all of the said claims and
requested the Court to dismiss it in limine. On May 28, 2018,
Shufersal and Leumi Card notified the Court that the said dispute
was transfered to a mediator. At this preliminary stage it is not
possible to estimate the chances of this claim or the mediation
process.
151
New Pharm segment
. Following completion
of the transaction to acquire New Pharm Drugstores Ltd. on December
20, 2017 by Shufersal, the activity of the New Pharm segment
constitutes a reportable segment for Shufersal. As at December 31,
2017 New Pharm operates in the drugstore sector through 63 branches
that sell mainly cosmetics, convenience and toiletry products,
medicine and food supplements. As of December 31, 2017, was not
include results of New Pharm for the period from the date of
completing the transaction to the reporting date due to
immateriality. In Shufersal's estimation, New-Pharm's market share
in 2017 accounts for 4% of the total pharmaceutical
market.
Telecommunications (DIC)
Cellcom
is a public company which was incorporated in Israel, whose shares
are listed for trading on the TASE and on the New York Stock
Exchange, and whose debentures are listed for trading on the
TASE.
Cellcom
operates and sells to its customers various communication services.
Cellcom’s activity is divided in two main segments,
“Cellular” and “Fixed-line”. The cellular
segment includes the cellular communications services, end user
cellular equipment and supplemental services. The fixed-line
segment includes landline and long distance telephone services,
internet infrastructure and connectivity services, television
services, transmission services end user fixed-line equipment and
supplemental services.
In June
2018, Cellcom issued shares and options to the public in Israel and
received for a net proceeds of NIS 275 million. In addition, in
June 2018, DIC entered into a swap transaction with a banking
institution in connection with Cellcom shares, whereby DIC acquired
an additional 1% of the issued and paid-up share capital of Cellcom
(the "
Swap Transaction
").
The Swap Transaction is a differential transaction only, for a
period of 90 days, at the end of which DIC will be obligated to
resell the said shares. As part of the said issuance, DIC acquired
shares and warrants for Cellcom shares at a cost of NIS 146
million. Following the swap transaction and DIC's participation in
the issue, after completion of the issue, DIC holds 43.1% of the
issued and paid-up share capital of Cellcom (not including the
swapped shares) and 46.33% of the voting rights in Cellcom
(directly and indirectly).
Cellular
Segment.
Cellcom’s activity in the
mobile segment includes the provision of mobile communication
services in Israel, the sale of mobile equipment to end users, and
other supplementary services. Cellcom holds a general license from
the Ministry of Communication which is valid until the end of
January 2022 (the “
Mobile
License
”). - At the end of the second quarter of 2018,
Cellcom had approximately 2.809 million cellular subscribers.
During the second quarter of 2018, Cellcom's cellular subscriber
base decreased by approximately 13,000 net cellular subscribers.
This decrease resulted mainly from the removal M2M (machine to
machine) subscribers from Cellcom's cellular subscriber base,
according to Cellcom's active cellular subscriber calculation
method. Cellcom offers a broad range of cellular services through
our 2G, 3G and 4G network.
There is
intense competition in all aspects of the cellular communications
market in Israel, with a penetration rate (the ratio of cellular
subscribers to the Israeli population) of approximately 121%,
representing approximately 10.6 million cellular subscribers as of
December 31, 2017, and the average annual churn rate in Israel in
2017 is estimated to be 37%, higher than the churn rates in other
developed economies. Cellular´s churn rate for the second
quarter of 2018 totaled to 12.6%, compared to 10.8% in the second
quarter of 2017 . The monthly cellular Average Revenue per User
("ARPU") for the second quarter of 2018 totaled NIS 51.8 (US$14.2),
compared to NIS 57.0 (US$15.6) in the second quarter last year. The
decrease in ARPU resulted mainly from the ongoing erosion in the
prices of cellular services, resulting from the intense competition
in the cellular market.
Cellcom compete for market and revenue share with
seven other cellular communications operators: four mobile network
operators (Partner, Pelephone, Hot Mobile and Golan) and three
mobile virtual network operators (Rami Levy Hashikma Communications
Marketing Ltd., or Rami Levy, Azi Communications Ltd., or Azi, and
Cellact Communications Ltd., or Cellact). Xfone won frequencies in
the 2015 4G frequencies tender and received a cellular license in
2017. In April 2018, Marathon 018 Xfone Ltd., with which
Cellcom
entered into a network sharing
and hosting agreement, commenced operating in the Israeli cellular
market.
These
services include basic cellular telephony services, text and
multimedia messaging, advanced cellular content and data services
and other value-added services, and also offers international
roaming services, a wide selection of handsets from various leading
global manufacturers and repair services on most handsets offered
by us. Not all services are supported by all handsets or by all of
their networks.
End user equipment
- Creating a
connection between transactions for the provision of mobile
services and transactions for the acquisition of end user equipment
(including by way of the provision of airtime refunds for the
acquisition of end user equipment) is prohibited in Israel. This
prohibition has resulted in increased competition on the market.
The increasing competition in the mobile device sales segment has
resulted in a decrease in the scope of mobile devices sold by
Cellcom.
Cellcom
provides Golan national roaming services under our Sharing
Agreements and we provide the Joint Corporations services as a
subcontractor.
Basic cellular services
The main cellular service is basic cellular
telephony and data transfer, upload and download (in supporting
handsets). Both are included in packages price plans. In addition,
Cellcom offers many other services with enhancements and additional
features to our basic cellular telephony service, including voice
mail, cellular fax,
call waiting, call forwarding, caller
identification and conference calling.
152
Data
services can be used with handsets (in supporting models), cellular
modems and tablets. Cellcom provides their customers with a variety
of "internet data packages" for that purpose.
Cellcom
also offers both an outbound roaming service to our subscribers
when traveling outside of Israel and an inbound roaming service to
visitors to Israel who can “roam” on our
network.
Value-added services
In
addition to basic cellular telephony and data services, Cellcom
offers many value-added services, such as SMS and MMS, cloud backup
and content services such as "Cellcom Volume" (music application)
and "Cellcom tv" application. Business subscribers are offered with
multi SMS, M2M (machine to machine), "Double Net" services allowing
combined usage of cellular and landline networks in order to insure
continuous service, work force management, vehicles management
applications and IOT (internet of things) solutions such as "smart
city" end-to-end cellular and fixed line solutions.
Handsets
Cellcom
sells a wide selection of handsets (which for purposes of this
report may include other types of communications end-user
equipment, such as tablets) designed to meet individual
preferences. Prices of handsets vary based on handset features and
special promotions. Cellcom offers a variety of installment plans
for handsets and discounts for short term installment plans,
although in most cases, handsets are to be paid for in 36 monthly
installments. Cellcom is also required to provide cellular services
to subscribers who did not purchase their handsets from it,
provided that the handset model complies with the standards set by
the Ministry of Communications.
Cellcom
also sells modems and tablets to promote our data services. In
addition, Cellcom sell added value products to our customers, such
as smart watches.
Fixed line segment.
Cellcom’s
activity in fixed line services include our internet infrastructure
(for private customers based mostly on the landline wholesale
market and for business customers based on our landline
infrastructure) and connectivity services, Over the Top TV services
(“OTT
TV”)
, ILD services, landline telephony services and
transmission services (for business customers). Cellcom also offers
bundles of these services, including a triple offering (internet
service including infrastructure and connectivity, landline
telephony, TV service) and quatro offering (internet services,
landline telephony, TV service and cellular services). Cellcom also
offers landline transmission and data services to selected business
customers and telecommunications operators (including transmission
revenues from Golan according to the network sharing agreement as
of March and April 2017), using our fiber-optic infrastructure and
complementary microwave links, IP switchboard services and
operation and management of business telecommunications systems.
Additional services include cloud services and data protection
products solutions based on products and services offered by us and
by third party vendors and IOT solutions such as "smart city"
end-to-end cellular and fixed line solutions.
Internet infrastructure and Connectivity
Cellcom
is a major provider of internet connectivity services. Prior to the
formation of the landline wholesale market, the Israeli internet
market was characterized by a separation between the internet
infrastructure providers (mainly Bezeq and Hot) and the internet
connectivity service providers. Consequently, the internet customer
was required to enter into a contractual arrangement with both
types of these providers. The infrastructure provider is
responsible for the connection of the customer from his computer or
other device to the infrastructure provider's operator. The
internet service provider is responsible for providing access to
the customer from the infrastructure provider's operator, through
its own operator, to the local and global internet network. As of
May 2015, following the inception of the landline wholesale market,
Cellcom (and other operators) provides end-to-end internet service
(infrastructure and connectivity) using Bezeq's infrastructure.
Cellcom sells internet infrastructure services bundled with
internet connectivity, as well as with our other
services.
As
of June 30, 2018, Cellcom provides end-to-end internet service, to
approximately 248,000 households. In the second quarter of 2018,
Cellcom's subscriber base in the internet infrastructure field
increased by approximately 13,000 net households.
In
addition, Cellcom offers their internet subscribers value added
services, such as data protection services to our private
subscribers and connectivity integration solutions and global
communications solutions to their business customers, including
firewalls, anti-virus and anti-spam software, overseas internet
connectivity services and server hosting services. In addition,
Cellcom provides internet connectivity services that offer the
ability to filter the content viewed by the internet
users.
OTT TV services
As of December 2014,
Cellcom
offer OTT-TV services, branded 'Cellcom tv' mostly
to private customers. Cellcom tv is a hybrid OTT-DTT TV service
provided to the Israeli market. The service includes a set-top box
that enables linear channels, including based on the Israeli
digital terrestrial television (DTT) broadcasting, other commercial
channels and Video on Demand library subscription (SVoD), music
streaming service and additional advanced features such as cloud
recording and VoD playlist channels, for a highly competitive
price. Cellcom tv service can generally also be accessed by
smartphones, tablets, Smart TV and additional TV services'
equipment like Apple TV and Android TV devices (TV anywhere). Our
VoD catalogue and linear channels offer international and local
content from top content suppliers. As of June 30, 2018, Cellcom
provides OTT TV services to approximately 195,000
households.
In the second
quarter of 2018, Cellcom's subscriber base in the TV field
increased by 11,000 net households.
153
International Long Distance (“ILD”)
services
Cellcom is one of the major players in the Israeli
ILD market. Our principal service in the ILD market is the
provision of outgoing and incoming telephone calls with
substantially worldwide coverage.
Cellcom
provide these services mostly to post-paid
customers, but also to pre-paid customers mainly through the sale
of calling cards. Most of the customers of the pre-paid services
are foreign workers who reside in Israel.
In
addition, Cellcom provides "Hubbing" services to non-Israeli
international operators. Hubbing services are bridging services
between two non-Israeli international operators. Such services are
provided where there is no direct connection between two
non-Israeli international operators or where pricing differences in
different locations make such bridging service
desirable.
Landline telephony services
Cellcom
offers advanced, voice and data landline services to selected
business customers. Cellcom also offers basic landline telephony
services to private customers by VOB technology. Landline telephony
service enables an end user to conduct a telephone conversation
with another end user who uses either another landline or a
cellular telephone or computer, either in Israel or
overseas.
Cellcom
estimates that their current market share in the Israeli landline
telephony market is not material.
Internet of Things (“IOT”)
IOT
solutions provide the ability to connect various devices to the
internet. Cellcom, together with strategic partners, offers IOT
solutions based on a variety of communications solutions, including
landline (WiFi) and cellular. Cellcom offers smart city solutions
which include a central management and control system to manage the
various solutions, water and electricity meter readout from a-far,
smart parking, smart and efficient street lighting, smart cameras
which include analytic capabilities for security solutions, smart
sensors for efficient waste disposal, various environmental factors
and flood alert, stress buttons for educational institutions as
well as WiFi and broadband communication capabilities in public
areas.
Internet services - access and
infrastructure
– Bezeq and Hot are t he two main
internet infrastructure providers for the private sector. Also they
are the only groups that own infrastructure which offer internet
infrastructure services to both for to the internet access
providers and to end user customers. Bezeq also provides internet
infrastructure services to operators which do not own
infrastructure, within the framework of the wholesale landline
market. In 2014, IBC also began distributing its infrastructure and
providing broadband services in select areas. IBC’s license
allows it to provide broadband infrastructure services on the fiber
optic infrastructure of the Electric Corporation to other license
holders, and to large business customers. In 2016, IBC’s
shareholders announced their intention to raise capital by
introducing additional investors. As of the reporting date, Cellcom
is evaluating the possibility of investing in IBC. As of September
30, 2017, internet infrastructure services were provided by Bezeq
and Hot to approximately 1.12 million and 706,000 households in
Israel, respectively, with an immaterial quantity by
IBC.
Internet services
are provided, as of the reporting date, by the three major internet
providers: Cellcom, Bezeq International, Smile Telecom (a
subsidiary of Partner) and additional small providers, including
Xfone Communication Ltd. As of December 31, 2017, Cellcom had
approximately 222,000 households subscribed to our end-to-end
internet services. The internet provider market is highly
competitive, saturated and characterized by relatively low barriers
to entry. The competition primarily focuses on the ability to offer
high internet connectivity speeds relative to price. Internet
infrastructure service is not provided yet using Hot's
infrastructure (maximum tariffs for Hot's wholesale internet
infrastructure services - higher than those set for Bezeq's
services - were published by the MOC on June 2017) and it is
unclear when the service will be offered. Effective inclusion of
Hot's infrastructure in the wholesale market may increase the
amount of potential subscribers to Cellcom's triple play and bundle
offerings.
In
August 2018, following Cellcom's previous reports regarding a
possible investment in Israel Broadband Company, or IBC, Cellcom,
the Israeli Electric Company, or IEC, IBC and the other
shareholders and main creditors of IBC have entered a memorandum of
understanding, for an investment by Cellcom in IBC. By means of
IBC's licenses. IBC has the exclusive right to deploy fiber optic
over IEC's infrastructure. The MOU outlines the principles of the
transaction contemplated by the parties and in addition to standard
and customary conditions contains the following
stipulations:
With
respect to the terms of the transaction, Cellcom Israel (by itself
or with a group of investors it may arrange) will own 70% of IBC's
issued and outstanding share capital and the other 30% of IBC's
issued and outstanding share capital will be owned by IEC. The
consideration will be a total amount of approximately NIS 100
million and shall be used to settle generally all of IBC's
debts.
The
transaction is subject to entering a definitive agreement and
certain other documentation (including an updated agreement of IBC
with IEC and an IRU broadband service agreement between Cellcom and
IBC), or the Agreement, within a certain period from the MOU
execution.
The MOU
also contains precedent conditions precedent to the closing of the
transaction, including regulatory approvals (including with regards
to the change of IBC's deployment obligations) and tax
arrangements.
The
terms of the Agreement are subject to further negotiations between
the parties and approval of Cellcom's Board of Directors. If
entered, the execution of the transaction will be subject to the
said conditions precedent, including regulatory approvals. There is
no assurance that the parties will enter into the Agreement, or
that such Agreement will be approved and executed, nor as to its
timing and terms.
154
Furthermore, in
August 2018, the Minister of Communication, (“MOC”),
resolved to allow IBC to apply for a general unique
(infrastructure) license that the MOC intends to regulate, in lieu
of its current license. The new license will include, among others,
a deployment requirement to at least 40% of Israel's households in
10 years from receipt of the license, as opposed to a universal
deployment requirement in IBC's current license.
Multi-channel television services
– Multichannel pay-tv services are dominated by Hot (the
incumbent TV provider and monopoly in this field) and YES (a
subsidiary of Bezeq) with approximately 797,000 and 597,000
households, respectively, as of September 30, 2017. Cellcom began
operating in this segment at the end of December 2014, through a
hybrid television service which includes DTT broadcasts (television
channels provided by the digital cable television broadcast network
which operates in Israel and is distributed for free by the Second
Authority for Television and Radio (Idan+) (“DTT
Broadcasts”) and OTT TV services (television over internet),
with approximately 170,000 households subscribed to Cellcom tv
services as of December 31, 2017. In June 2017, Partner launched
its OTT TV solution which includes Netflix's (American internet
based VOD content provider) application integration (and offering
for a limited period), and in August and October 2017,
respectively, Hot and Yes each launched an OTT TV low cost brand
solution – branded Hot Next and Sting, respectively (Hot's
OTT TV solution is also to be marketed by Rami Levy). Also, Netflix
and Amazon Prime, another American internet based VOD content
provider, provide their services to viewers in Israel, as
complementary service to the existing competitors' content. In
March and September 2014, the Antitrust Commissioner published the
following requirements as a condition for the merger in the Bezeq
group, in order to facilitate opening up the multi-channel
television market to competition by reducing barriers to entry in
the television segment: (1) in general, Bezeq will not charge a fee
to internet providers with respect to the consumption of internet
provider services which are due to multi-channel television
broadcasts, and all of the existing exclusivity arrangements to
which Bezeq and Yes are party will be canceled, with respect to
non-original production television content, and the engagement of
exclusivity arrangements of this kind will be prohibited in the
future; and (2) The Bezeq / Yes group will allow new television
service providers to acquire certain original productions of Bezeq
for two years. The legal merger between Bezeq and Yes was completed
in 2015.
International call services
- Cellcom is
a large provider of international call services. Cellcom’s
main competitors are Bezeq (through its subsidiary - Bezeq
International) and Partner (through its subsidiary - Smile
Telecom), and additionally, there are other competitors, such as
Xfone Communication Ltd., Rami Levy, Golan and Hot, through their
wholly owned subsidiaries or related companies. As of September 30,
2016, Cellcom’s market share is estimated at approximately
20%, Bezeq International at approximately 35%, Smile Telecom at
approximately 24%, and Hot-Net at approximately 12%. The
international call service market is highly competitive, with the
competition primarily based on the operator’s ability to
offer attractive pricing. Regulatory changes in this market have
resulted in increased competition. In recent years, the use of
alternative communication technologies, such as voice over IP, have
resulted in reduction of the telephone market, and particularly,
international telephone services. This trend is expected to
continue in the future at a moderate rate. This trend, together
with the inclusion of international telephone services in mobile
service and landline service communication packages at no
additional charge, have resulted in a decrease in income from these
services. The adoption of the proposed changes in regulation of the
international telephone services market, which includes the
possibility for offering international telephone services by
landline operators and the mobile operator themselves, and not
through separate companies, may increase competition and adversely
affect Cellcom’s results of operations.
Local landline services
- The landline
telephone market has been controlled for many years by Bezeq, a
monopoly in the landline telephone market, which held approximately
2/3 of the landline telephone market share (and a larger market
share among business customers), according to the publications of
the Ministry of Communication, and Hot. Additional providers in the
landline telephone services market include Cellcom, Netvision
(wholly owned by Cellcom), Partner-012 Smile and Bezeq
International.
Cellcom’s
penetration into the landline telephone market is an important
component in Cellcom’s ability to offer a comprehensive
package of services to its subscribers. As of the reporting date,
Cellcom offers landline telephone services to business customers,
and through VOB technology, to its private customers.
Cellcom
estimates that its market share in the landline telephone services
market is immaterial. Insofar as the wholesale landline market will
include landline telephone, Cellcom will be able to offer home
landline telephone services to its private customers through the
wholesale market.
According to
Cellcom's second quarter 2017 results, in June 2017, the Ministry
of Communications published regulations setting Bezeq's resale
telephony service to be provided by Bezeq as of July 2017, as a
temporary 14 month alternative for wholesale landline telephony
service. In addition, the Ministry of Communications resolved that
Bezeq's obligation to offer wholesale telephony service, which was
to be offered by Bezeq as of May 2015, will be postponed until the
lapse of said resale telephony service period. The resolution
further notes that the Ministry of communications will consider the
resale telephony service as a permanent replacement of the
telephony wholesale service. The tariffs set for the resale
telephony service are substantially higher than those set for
Bezeq's telephony wholesale service. The Ministry of Communications
is holding a public hearing in relation to the aforementioned
tariffs, to be applied retroactively after its
conclusion.
Other landline services
- transmission
services and data communication services are provided by Bezeq,
Hot, Partner and Cellcom, and are intended for business customers
and communication operators. In 2016, the competition in this
segment increased, primarily due to the plans offered by Hot and
Partner.
155
Fixed assets and facilities
Most of
Cellcom’s fixed assets include the mobile network equipment,
which includes base sites which are distributed throughout the
country, which provide broad communication coverage for the vast
majority of populated areas in the country, as well as a
transmission network (which includes optic fibers in a total length
of approximately 1,900 km., and microwave infrastructure), which
provides connectivity for Cellcom between most of its base sites,
and through which Cellcom also provides, to select business
customers, transmission services, data transfer and advanced
landline communication services. In 2018, Cellcom's Long-Term
Evolution (“
LTE
”) network covers most of the
population of Israel and in 2018 Cellcom intends to continue the
deployment of this network in order to enable higher data
throughput rate.
Cellcom
has a backup network for disaster recovery with respect to its
engineering systems, which was intended to increase network
resiliency in case of damage to one of its components, and has
adopted a business continuity plan and a disaster recovery plan in
accordance with the requirements of its license.
During
the first quarter of 2018, Cellcom invested NIS 146 million (US$42
million) in fixed assets and intangible assets and others
(including, among others, investments in the Cellcom's
communications networks, information systems, software and TV
set-top boxes and capitalization of part of the customer
acquisition costs as a result of the adoption of IFRS 15), compared
to NIS 140 million (US$40 million) in the first quarter
2017..
As of
December 31, 2017, Cellcom rents 78 service centers and points of
sale. Additionally, Cellcom rents from various entities sites for
the purpose of the construction, maintenance and operation of
communication facilities which are used in Cellcom’s
communication network. Based on past experience, Cellcom encounters
difficulties in extending the leases of approximately 5% of the
sites used for communication facilities.
In June
2013, Cellcom renewed the permission agreement with the Israel Land
Administration, which manages the lands of the Development
Authority and the Jewish National Fund, for the use of land for the
construction and operation of small broadcast
facilities.
The
permission agreement determined that, subject to the receipt of
advance approval from the land managers, which will be given at the
request of Cellcom with respect to each site, Cellcom is entitled
to build and operate transmission facilities on land, during the
permission period, and specific permissions and contracts which
will be signed following the permission agreement are cancelable by
the land managers, by providing advance notice, in case of certain
events. Additionally, the permission agreement includes a
prohibition on the transfer of control of Cellcom without providing
a definition of the term control for this purpose.
Cellcom
has two main rental properties in Israel: (1) A long term agreement
for its technological center in Netanya, with an area of
approximately 11,000 square meters. The rental is for a period of
ten years, from August 2011, and Cellcom has the option to extend
the agreement for an additional period of 5 years, while in the
event that Cellcom does not exercise the option, it will be
required to pay compensation of approximately NIS 11 million. In
January 2015, Cellcom rented approximately 1,100 square meters
through a sublease for a period of five years, and in 2016, Cellcom
rented, through a sublease, an additional area of approximately
5,000 square meters, for a period of 6 years. The sublessees have
the option to extend the sublease for an additional period, under
certain conditions; and (2) A long term agreement for Cellcom
headquarters in Netanya, with an area of approximately 58,000
square meters (of which, approximately 26,000 square meters are
used for underground parking) until December 2022, which can be
extended by two additional periods of 5 years each. beginning in
2015, Cellcom has leased, through subleases, approximately one
quarter of the leased area for periods of up to five years. The
lessees have the option to extend the sublease for additional
periods. Cellcom also has two additional properties which it
leases: one in Haifa, with an area of approximately 8,900 square
meters, and the other in Rosh Ha’ayin, with an area of
approximately 3,300 square meters.
Intangible assets
Cellcom
has the right to use frequencies for the provision of communication
services in its communication networks.
In July
2018, following the Cellcom's previous reports regarding a
frequencies migration Cellcom shall be required to execute to
accord to European standards, the Ministry of Communications, or
MOC, notified Cellcom that its 850MHZ frequencies allocation shall
expire on February 1, 2022 and replaced by 900MHZ frequencies no
later than March 22, 2021. The method and schedule in which such
replacement will be executed, including interim frequencies
allocations as required, shall be formed separately. The MOC noted
Cellcom may use an interim leniency to the Planning and Building
Law, allowing, under certain conditions, replacement of cell sites
without obtaining a building permit. Cellcom is examining the
implications of the MOC's notification and possible courses of
action.
In
August 2015, Cellcom was allocated 3 megahertz (“MHz”)
in the 1800 MHz range for 4G networks (in light of Cellcom’s
existing 1800 MHz frequencies). As opposed to the frequencies which
were provided in the past to Cellcom, which are valid during
Cellcom’s license period, the frequencies won by Cellcom, as
part of the tender, were provided for a period of 10 years.
Additionally, in order to provide optimal performance on the 4G
network, Cellcom will require additional frequencies beyond those
which were allocated to it in accordance with the 4G frequencies
tender, and due to the fact that the Ministry of Communication
believes that, for this purpose, Cellcom will clear 12 MHz in the
1800 MHz frequencies which were allocated to it for the purpose of
the 2G network, Cellcom cleared such frequencies in locations where
the low use of the 2G network, in combination with advanced and
modern software programs which allow it, with minimum adverse
impact on the performance of the 2G network. Additionally, insofar
as the network sharing agreements with Electra and Xfone, are
realized, Cellcom will be able to enjoy 10 MHz in the 1800 MHz
frequencies of Golan and Xfone. If the aforementioned frequencies
are not
provided to
Cellcom, Cellcom will hold a lower number of frequencies than its
competitors, which may result in harm to Cellcom’s
competitive position.
156
The
Ministry of Communication is evaluating the possibility of
replacing 850 MHz frequencies with 900 MHz frequencies. This
process will require Cellcom to perform significant investments in
its networks.
Cellcom
is a member of the GSM association, which includes various
operators from all over the world which use GSM technology, and
which meet the standards of the association. As a member of the
association, Cellcom is entitled to make use of the
association’s intellectual property rights, including use of
the GSM logo and trademark.
Cellcom
has rights to a large number of trademarks and trade names which
are registered under the names of Cellcom and Netvision, as
applicable. Additionally, several patents are registered under
Cellcom’s name.
In
addition, the Ministry of Communication announced it intends to
publish a 5G frequencies tender in 2018 or thereafter.
Insurance (IDBD)
Clal
In
August 2013, the Commissioner of the Capital Market, Insurance and
Savings appointed a trustee for most of the Company’s
holdings in Clal Holdings Insurance Enterprises, and in December
2014 a time outline was established for the sale of its holdings of
Clal Holdings Insurance Enterprises ("The Outline"). In April 2017,
a ruling was given in which the Court ordered the trustee to sell
5% of the IDBD’s holding in Clal, within 30 days ("The
ruling"). In May and August 2017, and in January and May 2018, IDBD
cumulatively sold 20% of the shares of Clal, 5% at each time, and
in parallel, IDBD entered into commitments with two banking
corporations, in four swap transactions, according to which, at the
end of a period of 24 months from the date of each sale
transaction, accounting will take place between IDBD and those
banking corporations in respect of the difference between the
selling price of the shares being sold to a third party, and the
selling price of the shares as of the date of the
accounting.
In
August 2018, the Commissioner instructed the trustee to take action
for the sale of an additional 5% of the the shares in Clal, which
wall sold, in a manner of swap transaction, on August 30,
2018.
To be
noted that Clal's activity is considered a discontinued activity.
IDBD's holdings in Clal are held by a trustee appointed by the
Israeli Commissioner of Capital Market, Insurance and Saving
Authority (the "
Commissioner
").
On
March 7, 2018, Mr. Izzy Cohen, who served as CEO of Clal from
November 1, 2012, and Clal, announced Mr. Izzy Cohen’s
intention to terminate his tenure as CEO of Clal. The Board of
Directors of Clal decided on March 11, 2018, to appoint a committee
to locate and recommend a new CEO for Clal, headed by the Chairman
of the Board of Directors, Mr. Danny Naveh, which includes
directors of the Clal and Clal Insurance. On June 17, 2018, Clal's
board of directors and Clal Insurance approved the appointment of
Mr. Yoram Naveh as CEO of Clal and Clal Insurance as of July 1,
2018.
Clal is
a public company which was incorporated in 1987, in accordance with
the laws of the State of Israel. Clal is one of the leading
insurance and long-term savings groups in Israel. The shares of
Clal have been listed for trading on the stock exchange since 1988.
Clal is part of the IDBD Group, which holds as of June 30, 2018
about 34.81% of its shares and 34.47% on a fully diluted basis.
Clal offers a wide range of services and products to private and
corporate customers, such as,
inter alia
, non-life insurance, health
insurance, travel insurance, study fund, provident funds, pension
funds, etc. As of December 31, 2017, Clal Insurance employs over
4,400 people and markets its products through 2,090 insurance
agents, all of whom provide quality service and professional
support to their customers. As of March 31, 2018, Clal has NIS 192
billion under asset. Furthermore, Clal is constantly analyzing the
market to understand trends and changes in the industry and
adjusting accordingly. Clal Insurance consists of three insurance
segments: Non-Life Insurance, Long-Term Savings and
Health.
Non-Life Insurance
The
General Insurance domain in Clal Group is among the largest in
Israel. As of June 30, 2018, Clal holds 10.9% market share of the
premiums in the in the Non-Life Insurance Division and offers
coverage to private and corporate customers. Clal markets its
products through 1,466 non-life insurance agents, all of whom
provide quality service and professional support to their
customers. The Non-Life Insurance Segment offers a wide range of
insurance plans: automotive, property, liability, marine insurance,
personal accidents, guarantees and additional services. It`s vision
is to provide professional and high-level service to company`s
agents and customers, through constant improvements and new product
development.
Life Insurance and Long-Term Savings
As of
June 30, 2018, The Long-Term Savings Division holds a 13.7% market
share of the long-term savings market, as defined by the
Commissioner of Insurance and have assets in an approximate amount
of NIS 149,472 billion. As at June 30, 2018, Clal holds 17.3%
market share of the premiums in the in the Life Insurance Division.
There is no single customer or a limited number of customers of
which Clal is dependent. Clal has no single customer whose revenues
constitute 10% or more of Clal's total revenues in the Consolidated
Financial Statements. Clal markets insurances policies, from time
to time and in the normal course of business, to companies in the
IDBD Group (both policyholders in collective insurance, both as
members of central provident funds and as employers depositing for
pension savings for long-term savings products). This does not
exceed 5% of the Clal's total revenues in this segment. The
Long-Term Savings segment manages long-term assets, including life
insurance, pension and provident funds. The segment also provides
comprehensive solutions to private and corporate customers in all
sectors of the Israeli economy. Among the division's customers are
large corporations and many residents of the
State of Israel.
Its objectives are to support the company's distribution channels
and become a professional benchmark, helping to improve company
business results, profitability and value, while emphasizing
quality of service. The segment offers a variety of savings
options, enabling its customers to maintain a strong, solid
economic foundation in the event of death, accident or loss of
earning capacity. It also offers a variety of pension funds
designed to guarantee a monthly income for life in the event of
retirement, disability, or death, enabling economic stability for
the future even in difficult times.
157
On July
26, 2018, Clal's Board of Directors resolved to change the
organizational structure of Clal Group. As of September 1, 2018,
the life insurance and pension and provident divisions will be
merged into the long-term savings division. In addition, a new a
customer and distribution division will be
established.
Health Insurance
The
Health Insurance segment offers a wide range of products for
individuals, families and groups, specializing in comprehensive
solutions for specific market segments such as women and children.
As of June 30, 2018, Clal Insurance holds a 17.4% market share of
the premiums in the health insurance market in israel and offers
health insurance products such as surgeries in Israel and overseas,
transplants, medications, critical illness, long-term care,
personal accidents, travel and more. Health Insurance segment
vision is to establish Clal as a leading, innovative and
professional company in the field of health and nursing care
insurance, while providing a professional and timely service to its
agents and customers. The segment focuses on technological
innovation as well as on developing a range of innovative health
insurance products, enabling flexibility in creating health
insurance packages tailored for each client, based on his needs and
financial status. Each package is either derived from existing
packages, or custom-built for each customer. Clal markets most of
its products through 852 health agents, all of whom provide quality
service and professional support to their customers. The Health
Insurance segment is constantly growing, and is proud to provide
quality service to 400,000 members insured under private insurance
plans as well as an additional 2,000,000 members insured under
group insurance plans.
The
engagement of Clal Insurance in collective long-term care insurance
agreements of members of the Maccabi and Leumit health funds, which
will be completed in December 2018 and March 2019, respectively, as
of December 2017, the value of these funds is NIS 2,997 million. In
May 2018, Maccabi and Clalit Health Funds published new tenders for
the selection of an insurer for group long-term care insurance for
members of the health funds (the
“Tender
"), in a format different
from the format in Clal Insurance's existing agreement with
Maccabi) in such a manner that the winning insurer will bear only
20% of the insurance risk. Clal Insurance's proposal to continue
providing group long-term care insurance services to Maccabi
insurers did not win the public tender held by Maccabi, and
therefore Clal Insurance will continue to insure Maccabi's
policyholders in the current format, as stated, until December 31,
2018. It should be noted that according to publications in the
press the insurance company Phoenix won both the tender and the
fund Clalit Health Services and the Maccabi Health Fund tender, and
chose to be insurers of the Maccabi health fund It should be noted
that according to the Commissioner's instructions, an insurance
company cannot make more than one agreement for long-term care
insurance for members of the health fund (or some of them) if the
total number of insurees it insures in one agreement or more, as
stated above, exceeds 50% of the number of insureds in all the
existing agreements for long-term care insurance for members of the
health fund, unless the Commissioner approved otherwise and under
the terms he approved. To the best of Clal’s knowledge at
this stage Clalit Health Services has not yet issued an official
notice in connection with the results of the tender. Clal Insurance
is studying the results of the tender and its implications and the
assessments required of it.
Others with respect to IDBD
Includes the assets
and income from other miscellaneous businesses, such as oil and gas
assets.
Others with respect to DIC
Includes the assets
and income from other miscellaneous businesses, such as
technological developments, electronics, and other sundry
activities.
IDBG segment:
IDBD
holds 50% of IDBG which was incorporated under the laws of Delaware
(the remaining 50% is held by PBC which is a subsidiary wholly
owned by DIC). IDBG is a real estate corporation in the
construction and operation of a commercial and office project in
Las Vegas, Nevada (USA). IDBG activity was presented under the area
of activity of PBC in projects in Las Vegas.
IDBG
holds the real esatate corporation GW (100%), which holds all the
rights in the Tivoli project in Las Vegas, with a total area of
approx. 62 thousand square meters. For futher details regarding the
IDBG and the Tivoli project please see below PBC
Segment.
IDB Tourism segment (discontinued segment):
IDB
Tourism is a wholly-owned subsidiary of IDBD, which was
incorporated in Israel and commenced it operations in 1934. In
2014, IDB Tourism’s management decided to focus its business
activity on the sale of tourism services, in the framework of
tourism packages that were adapted to the preferences of the
Israeli public, to the incoming tourists to Israel. Until 2015, IDB
Tourism held three major companies operating in the field of
tourism: Terminal 1 Holdings Ltd. (formerly - Diesenhaus Ltd.),
Open Sky Ltd, and Israir Airlines & Tourism Ltd.
(“
Israir
”),
(Israir, Diesenhaus, Open Sky and related parties will be referred
to hereinafter as "the IDB Tourism Group").
In July
2017 IDBD, IDB Tourism and Israir, with El Al Israel Airlines Ltd.
and Sun D’Or, entered into an agreement for the sale of IDB
Tourism’s entire stake (100%) in Israir to Sun D’Or (in
this section: the "Transaction"). On January 10, 2018, IDBD
received a notice from the Anti-trust Authority, pursuant to which
the Antitrust Authority objected to the transaction, and expressed
the reasons for its objection. On
March 29, 2018, the
parties to the agreement filed an appeal against the
Authority’s decision and on June 20, 2018, the Acquisition
Agreement was terminated by mutual agreement among the parties so,
the Court dismissed the appeal. IDBD is examining alternatives in
connection with the sale of its holdings in IDBG Tourism and/or in
Israir and therefore IDBD is continuing to treat IDB Tourism as
held for sale and as a discontinued operation, in its financial
statements as of June 30, 2018, in accordance with IFRS 5. In
addition, in August 2018, after the date of the statement of IDBD
retained Giza Zinger Even Ltd. and with Epsilon Underwriting and
Issuing Ltd.(together: the "Consultants"), a company that is under
the control of DIC, for the purpose of advising on the sale and the
disposal of the IDBD's operations in the tourism and aviation
field. The Consultants will be entitled to fees that are comprised
of a retainer and a success fee in respect of the services, which
will be payable at the time of the completion of a transaction
(insofar as there may be one).
158
In August 2018, after the date of the financial
statement of of IDB’s second quarter 2018 financial position,
IDB Tourism entered into a memorandum of understanding with
Dizenhaus B.T.C. Ltd. (the "
Purchaser
"), the sale of 50% of the issued share capital
of a company that managed the incoming tourism operations and which
is held by Israir in consideration for an amount of NIS 26 million.
The completion of the transaction is subject to the completion of
due diligence process on and the receipt of approvals from third
parties, before November 30, 2018. In the event that the
transaction is not completed by that time, the transaction will be
terminated. At the time of the completion of the transaction,
Israir and the Purchaser will manage the incoming tourism activity
under a joint control agreement. Upon the completion of the
transaction, as aforesaid, IDBD is expected to record a capital
gain, which is estimated at approximately NIS 30 million, in
respect of the IDBD's share of the difference between the
consideration that Israir is expected to receive in respect of the
sale, with the addition of the fair value of the balance of the
said investment in the incoming tourism operations and the carrying
value of the investment as recorded in Israir's accounting records
as of June 30, 2018. This estimate of the gain will be adjusted in
accordance with IDBD’s share of the incoming tourism
operations' results from the end of the second quarter of 2018 and
until the time of the completion of the transaction. It should be
clarified that there is no certainty regarding the completion of
the transaction, including that the parties will make a commitment
under a purchase agreement, inter alia, as a result of the
non-receipt of the approvals that are required for the completion
of the transaction
.
Legal
Framework
Operations Center in Argentina
Regulation
and Government Supervision
The
laws and regulations governing the acquisition and transfer of real
estate, as well as municipal zoning ordinances, apply to the
development and operation of our properties. Currently, Argentine
law does not specifically regulate shopping mall lease agreements.
Since our shopping mall leases generally diverge from ordinary
commercial lease agreements, we have developed contractual
provisions which are tailored to the commercial relationship with
our shopping mall tenants.
Leases
Argentine law
imposes certain restrictions on property owners,
including:
● a
prohibition to include in lease agreements automatic price
adjustment clauses based on indexes; and
● a
minimum lease term of two years for all purposes, except in
particular cases such as embassy, consulate or international
organization venues, room with furniture for touristic purposes for
less than three months, custody and bailment of goods, exhibition
or offering of goods in fairs or in cases where due to the
circumstances, the subject matter of the lease agreement requires a
shorter term.
Rent increases
There
are contradictory court rulings regarding whether rents may be
increased during the term of a lease agreement. For example,
Section 10 of the Law No. 23,928, as amended by Public
Emergency Law No. 25,561 prohibits a rent adjustment under
leases subject to indexes, such as the consumer price index or the
wholesale price index. Most of our lease agreements have rent
increase clauses that are not based on any official index. As of
the date of this annual report, no tenant has filed any legal
action against us challenging incremental rent increases, but we
cannot assure that such actions will not be filed in the future
and, if any such actions were successful, that they will not have
an adverse effect on our business and results of
operations.
Lease term limits
Under
the Argentine Civil and Commercial Code lease terms may not exceed
twenty years (for residential purpose) or fifty years (all other
purposes). Generally, terms in our lease agreements range from 3 to
10 years.
Rescission rights
The
Argentine Civil and Commercial Code provides that tenants may
terminate lease agreements early after the first six months of the
effective date. Such termination is subject to penalties which
range from one to one-and-a-half months of rent. If the tenant
terminates the agreement during the first year of the lease, the
penalty is one-and-a-half month’s rent and if termination
occurs after the first year of lease, the penalty is one
month’s rent.
159
Other
The
Argentine Civil and Commercial Code, among other rules, repealed
the Urban Lease Law (No. 23,091), which provided for a rule
similar to the one described above, but established the obligation
to give at least 60 days’ prior notice of exercise of
the unilateral right to termination by the tenant. There are no
court rulings yet with respect to the new regulations related to:
(i) the unilateral right to termination by tenant;
i.e., whether the parties may waive the tenant’s right
to terminate the agreement unilaterally; or in relation to
(ii) the possibility of establishing a penalty different from
the penalty described above in the event of
termination.
While
current Argentine government policy discourages government
regulation of lease agreements, there can be no assurance that
additional regulations will not be imposed in the future by the
Argentine Congress, including regulations similar to those
previously in place. Furthermore, most of our leases provide that
the tenants pay all costs and taxes related to the property in
proportion to their respective leasable areas. In the event of a
significant increase in the amount of such costs and taxes, the
Argentine government may respond to political pressure to intervene
by regulating this practice, thereby adversely affecting our rental
income.
The
Argentine Civil and Commercial Code enables the lessor to pursue
what is known as an “executory proceeding” upon
lessees’ failure to pay rent. In executory proceedings,
debtors have fewer defenses available to prevent foreclosure,
making these proceedings substantially shorter. In executory
proceedings the origin of the debt is not under discussion; the
trial focuses on the formalities of the debt instrument itself. The
aforementioned code also permits special eviction proceedings,
which are carried out in the same way as ordinary proceedings. The
Argentine Civil and Commercial Code requires that a residential
tenant receive at least 10 days’ prior notice when a
landlord demands payment of the amounts due in the event of breach
prior to eviction but does not impose any such requirement for
other leases. However, court case backlog and numerous procedural
hurdles have resulted in significant delays to eviction
proceedings, which generally last from six months to two years from
the date of filing of the suit for eviction.
Development
and use of the land
In the
City of Buenos Aires, where the vast majority of our properties are
located, we are subject to the following regulations:
Buenos Aires Urban Planning Code
The
Buenos Aires Urban Planning Code (
Código de Planeamiento Urbano de la
Ciudad de Buenos Aires
) generally restricts the density and
use of property and regulates physical features of improvements to
property, such as height, design, set-back and overhang, consistent
with the city’s urban planning policy. The Secretary of Urban
Planning of the City of Buenos Aires (
Secretaría de Planeamiento Urbano
)
is responsible for implementing and enforcing the Buenos Aires
Urban Planning Code.
Buenos Aires Building Code
The
Buenos Aires Building Code (
Código de Edificación de la Ciudad
de Buenos Aires
) complements the Buenos Aires Urban Planning
Code and regulates the structural use and development of property
in the City of Buenos Aires. The Buenos Aires Building Code
requires builders and developers to file applications for building
permits, including the submission to the Secretary of Work and
Public Services (
Secretaría
de Obras y Servicios Públicos
) of architectural plans
for review, to monitor regulatory compliance.
Buenos Aires Authorizations and Licenses Code
The
Buenos Aires Authorizations and Licenses Code (
Código de Habilitaciones de la Ciudad de
Buenos Aires
) sets forth the conditions under which
authorizations or licenses to operate may be granted to business
establishments, and the rules and procedures these latter are
obliged to follow. The General Bureau of Authorizations and
Licenses (
Dirección General
de Habilitaciones y Permisos
) is responsible for
implementing and enforcing the Buenos Aires Authorizations and
Licenses Code.
In
other jurisdictions, our real estate activities are subject to
similar municipal zoning, building, occupation and environmental
regulations. These latter must adhere to federal standards.
Additionally, in some jurisdictions we may be subject to the
regulation concerning large commercial areas, which requires
governmental approval of the location of certain commercial
establishments. We believe that all of our real estate properties
are in material compliance with all applicable relevant laws,
ordinances and regulations.
Sales
and ownership
Real Estate Installment Sales Law
The
Real Estate Installment Sales Law No. 14,005, as amended by
Law No. 23,266 and Decree No. 2015/85, or “Real
Estate Installment Sales Act,” imposes a series of
requirements on contracts for the sale of subdivided real estate
property regarding, for example, that the purchase price for a
property is paid in installments and the deed, which is not
conveyed to the purchaser until the price has been paid in full.
The provisions of this law require, among other
things:
● The
registration of the intention to sell the property in subdivided
plots with the Real Estate Registry (
Registro de la Propiedad Inmueble
)
corresponding to the jurisdiction of the property. Registration is
only possible with regard to unencumbered property. Mortgaged
property may only be registered where creditors agree to divide the
debt in accordance with the subdivided plots. However, creditors
may be judicially compelled to agree to the partition.
● The
preliminary registration with the Real Estate Registry of the
purchase instrument within 30 days of execution of the
agreements.
160
Once
the property is registered, the installment sale must be completed
in a manner consistent with the Real Estate Installment Sales Act.
If a dispute arises over the title between the purchaser and
third-party creditors of the seller, the installment purchaser who
has duly registered the purchase instrument with the Real Estate
Registry will have title of the deed to the plot. Further, the
purchaser can demand conveyance of title after at least 25% of the
purchase price has been paid, although the seller may demand a
mortgage to secure payment of the balance of the purchase
price.
After
payment of 25% of the purchase price or advancement of at least 50%
of construction, the Real Estate Installment Sales Act prohibits
termination of the sales contract for failure by the purchaser to
pay the balance of the purchase price. However, in such event the
seller may exercise its rights under any mortgage on the
property.
Buildings Law
Buildings Law
No. 19,724 (
Ley de
Pre-horizontalidad
) was repealed by the Argentine Civil and
Commercial Code which provides that for purposes of execution of
sales agreements for units under construction, the owner or
developer must purchase insurance in favor of prospective
purchasers against the risk of frustration of the development
pursuant to the agreement for any reason. A breach of this
obligation precludes the owner from exercising any right against
the purchaser—such as demanding payment of any outstanding
installments due—unless he/she fully complies with their
obligations, but does not prevent the purchaser from exercising its
rights against the seller.
Protection for the Disabled Law
The
Protection for the Disabled Law No. 22,431, enacted on
March 16, 1981, as amended, provides that in connection with
the construction and remodeling of buildings, access by handicapped
persons must be provided. In the construction of public buildings,
entrances, transit pathways and adequate facilities for mobility
impaired individuals is required.
Buildings
constructed before the enforcement of the Protection for the
Disabled Law must be adapted to provide accesses, transit pathways
and adequate facilities for mobility-impaired individuals. Those
pre-existing buildings, which due to their architectural design may
not be adapted to the use by mobility-impaired individuals, are
exempted from the fulfillment of these requirements.
The
Protection for the Disabled Law provides that residential buildings
must ensure access by mobility impaired individuals to elevators
and aisles. Architectural requirements refer to pathways, stairs,
ramps and parking.
Other
regulations
Consumer relationship, consumer or end-user protection
The
Argentine Constitution expressly establishes in Article 42
that consumers and users of goods and services have a right to
protection of health, safety and economic interests in a consumer
relationship. Consumer Protection Law No. 24,240, as amended,
regulates several issues concerning the protection of consumers and
end users in a consumer relationship, in the arrangement and
execution of contracts.
The
Consumer Protection Law, and the applicable sections of the
Argentine Civil and Commercial Code are intended to regulate the
constitutional right conferred under the Constitution on the
weakest party to the consumer relationship and prevent potential
abuses deriving from the stronger bargaining position of vendors of
goods and services in a market economy where standard form
contracts are widespread.
As a
result, the Consumer Protection Law and the Argentine Civil and
Commercial Code deem void and unenforceable certain contractual
provisions included in consumer contracts entered into with
consumers or end users, including those which:
●
deprive obligations of their nature or limit liability for
damages;
● imply
a waiver or restriction of consumer rights and an extension of
seller rights; and
●
impose the shifting of the burden of proof from the consumer to the
seller in order to protect the consumers.
In
addition, the Consumer Protection Law imposes penalties ranging
from warnings to the forfeiture of concession rights, privileges,
tax regimes or special credits to which the sanctioned party may be
entitled, including closing down establishments for a term of up to
30 days.
The
Consumer Protection Law and the Argentine Civil and Commercial Code
define consumers or end users as the individuals or legal entities
that acquire or use goods or services, free of charge or for a
price for their own final use or benefit or that of their family or
social group. In addition, both laws extend consumer protections to
those who acquire or use goods or services, with or without
consideration, for their own final use or that of their family or
social group. The protection under the laws afforded to consumers
and end users encompasses the entire consumer relationship, from
the offering of the product or service, to cover more than just
those relationships established by means of a
contract.
The
Consumer Protection Law defines the suppliers of goods and services
as those who produce, import, distribute or commercialize goods or
supply services to consumers or users.
The
Argentine Civil and Commercial Code defines a consumer agreement as
an agreement that is entered into between a consumer or end user
and an individual or legal entity that acts professionally or
occasionally either with a private or public company that
manufactures goods or provides services, for the purpose of
acquisition, use or enjoyment of goods or services by consumers or
users for private, family or social use.
161
The
Consumer Protection Law establishes joint and several liability of
any producer, manufacturer, importer, distributor, supplier, seller
and anyone who has placed its trademark on the thing or service for
damages caused to consumers derived from a defect or risk inherent
in the thing or the provision of a service.
The
Consumer Protection Law excludes the services supplied by
professionals that require a college degree and registration in
officially recognized professional organizations or by a
governmental authority. However, this law regulates the
advertisements that promote the services of such
professionals.
The
Consumer Protection Law determines that the information contained
in the offer addressed to undetermined prospective consumers binds
the offeror during the period in which the offer takes place and
until its public revocation. Further, it determines that
specifications included in advertisements, announcements,
prospectuses, circulars or other media bind the offeror and are
considered part of the contract entered into by the
consumer.
Pursuant to
Resolution No. 104/2005 issued by the Secretariat of Technical
Coordination reporting to the Argentine Ministry of Treasury,
Consumer Protection Law adopted Resolution No. 21/2004 issued
by the Mercosur’s Common Market Group which requires that
those who engage in commerce over the Internet (E-Business)
disclose in a precise and clear manner the characteristics of the
products and/or services offered and the sale terms. Failure to
comply with the terms of the offer is deemed an unjustified denial
to sell and gives rise to sanctions.
On
September 17, 2014, the Argentine Congress enacted a revised
Consumer Protection Law through Law No. 26,993. This law,
known as “Conflict Resolution in Consumer Relationships
System,” provides for the creation of new administrative and
judicial procedures for this field of Law. It created a
two-instance administrative system: the Preliminary Conciliation
Service for Consumer Relationships (
Servicio de Conciliación Previa en las
Relaciones de Consumo
), or “COPREC,” and the
Consumer Relationship Audit, and a number of courts assigned to the
resolution of conflicts between consumers and producers of goods
and services (
Fuero Judicial
Nacional de Consumo
). In order to file a claim, the
amount claimed may not exceed a fixed amount equivalent to 55
adjustable minimum living wages, which are determined by the
Ministry of Labor, Employment and Social Security. The claim is
required to be filed with the administrative agency. If an
agreement is not reached between the parties, the claimant may file
the claim in court. COPREC is currently in full force and effect.
However, the court system (
Fuero
Judicial Nacional de Consumo
) is not in force yet.
Therefore, any court claim should be currently filed with the
existing applicable courts. A considerable volume of claims filed
against us are expected to be settled pursuant to the system
referred to above, without disregarding the full force and effect
of different instances for administrative claims existing in the
provincial sphere and the City of Buenos Aires, which remain in
full force and effect, where potential claims related to this
matter could also be filed.
Antitrust Law
Law
No. 25,156, as amended, or the “Antitrust Law,”
prevents collusive practices by market participants and requires
administrative approval for transactions that according to the
Antitrust Law constitute an economic concentration. According to
this law, mergers, transfers of goodwill, acquisitions of property
or rights over shares, capital or other convertible securities, or
similar transactions by which the acquirer controls or
substantially influences a company, are considered as an economic
concentration. Whenever an economic concentration involves a
company or companies and the aggregate volume of business in
Argentina of the companies concerned exceeds Ps.200.0 million,
the respective concentration must be submitted for approval to the
CNDC. The request for approval may be filed, either prior to the
transaction or within a week after its completion.
When a
request for approval is filed, the CNDC may (i) authorize the
transaction, (ii) subordinate the transaction to the
accomplishment of certain conditions or (iii) reject the
authorization.
The
Antitrust Law provides that economic concentrations in which the
transaction amount and the value of the assets subject to
acquisition or disposition do not exceed Ps.20.0 million each
are exempted from the administrative authorization. Notwithstanding
the foregoing, when the transactions concerned during the prior
12-month period exceed in the aggregate Ps.20.0 million or
Ps.60.0 million in the last 36 months, these transactions
must be notified to the CNDC.
As our
consolidated annual sales volume and our parent’s
consolidated annual sales volume exceed Ps.200.0 million, we
should give notice to the CNDC of any concentration provided for by
the Antitrust Law.
Money laundering
Argentine Law
No. 25,246, as amended by Laws Nos. 26,119, 26,268,
26,683 and 27,270, or the “Anti-Money Laundering Law,”
categorizes money laundering as a crime, which is defined as the
exchange, transfer, management, sale or any other use of money or
other assets obtained through a crime, by a person who did not take
part in such original crime, with the potential result that such
original assets (or new assets resulting from such original assets)
have the appearance of having been obtained through legitimate
means. The law sets forth a minimum of Ps.300,000 for punishable
offenses though crimes involving a lower amount are also
prosecuted, but the prison sentence that may be imposed is
reduced.
After
the enactment of Law No. 26,683, money laundering was included
in the Penal Code as an independent crime against economic and
financial order and it was split from the title
“Concealment” as originally disposed. Therefore, money
laundering is a crime which may be prosecuted
independently.
162
The
Anti-Money Laundering Law created the Financial Information Unit,
or “UIF,” is responsible for the analysis, treatment
and procurement of information to prevent money laundering
originating from, among others:
●
Crimes related to the traffic and illegal commercialization of
drugs (Law No. 23,737);
●
Crimes related to arms traffic (Law No. 22,415);
●
Crimes related to illegal association or terrorist
association;
●
Crimes committed by illegal associations organized to commit crimes
for political or racial purposes;
●
Crimes against Public Administration;
●
Crimes of minor’s prostitution and child pornography;
and
●
Crimes related to terrorism financing.
The UIF
analyzes the information received from entities that have the
obligation to report suspicious activities or operations and, as
the case may be, inform the Public Ministry to carry out the
investigations that may be considered relevant or
necessary.
The
anti-money laundering legal framework in Argentina also assigns
information and control duties to certain private sector entities,
such as banks, agents, non-profit organizations, stock exchanges,
insurance companies, according to the regulations adopted by the
UIF, and for financial entities, the Central Bank. These
regulations apply to many Argentine companies, including us. These
obligations consist mainly of: (i) maintaining internal
policies and procedures aimed at money laundering prevention and
financing of terrorism, especially through the application of the
policy “know your client;” (ii) reporting any
suspicious activity or operation and (iii) acting according to
the Anti-Money Laundering Law with respect to the confidentiality
of the information obtained from the clients. For that purpose,
each entity involved must appoint an officer responsible for the
monitoring and control under the Anti-Money Laundering
Law.
On
May 8, 2009, the CNV issued Resolution No. 554 which
incorporated within the exchange market provisions designed to
comply with money laundering prevention pursuant to Law
No. 25,246, as amended and as required by the UIF. This
resolution established that any entity subject to the supervision
of CNV could only take part in securities transactions if they were
ordered by parties that were registered or domiciled in
jurisdictions not included in the list of tax havens detailed in
Decree No. 1344/98. The resolution also provided that
securities offerings by foreign issuers under the supervision of a
regulator similar to the CNV, may be approved only if such
regulator has signed a memorandum of understanding with the CNV
regarding compliance with anti-money laundering
principles.
On
February 2, 2012, Resolution No. 554 was replaced by
Resolution No. 602, which extended the instructions issued by
UIF to the entities supervised by the CNV, including some payment
mechanisms and control proceedings for the receipt from and the
transfers of funds to registered or regulated entities or persons,
fixing amounts and instruments to be used. Moreover, this
resolution updated the reference to the Decree which referred to
tax havens (No. 1,037).
As part
of a more comprehensive modification of the rules that govern the
scope of supervision of CNV, derived from the enactment of the
revised Capital Markets Law and the CNV Rules, which established a
new regime for the public offer of securities, CNV issued a
revision of its rules to incorporate a new chapter of Anti-Money
Laundering Laws including provisions related to the fulfillment of
duties to be complied by “
Agentes de Negociación
,”
“
Agentes de Liquidación
y Compensación
,” “
Agentes de Distribución y
Colocación
” and “
Agentes de Administración de Productos de
Inversión Colectiva
,” each of which is considered
mandatory under the terms of sections 4, 5 and 22 of
article 20 of Law No. 25,246. Such agents are required to
comply with Law No. 25,246 and its amendments, regulations
enacted by UIF, including executive orders with reference to the
decisions adopted by the United Nations Security Council in the
fight against terrorism and to comply with the resolutions issued
by the Ministry of Foreign Affairs, International Trade and
Religion. Furthermore, “
Agentes de Custodia de Productos de
Inversión Colectiva
(
Sociedades Depositarias de Fondos Comunes de
Inversión
),” “
Agentes de corretaje
,”
“
Agentes de depósito
colectivo
” and listed companies with respect to
contribution, irrevocable contributions or indebtedness made by a
shareholder or a third person to become a shareholder in the
future, are also reached by the resolution.
Each of
these entities must send by internet (through the online
application of CNV) their tax identification number. Additionally,
in case of companies, the personal data of the “Compliance
Officer” (both regular and alternate) must also be
disclosed.
The CNV
Rules provide that entities it regulates may only take action
relating to public offerings of securities, stipulated, future or
optional contracts of any nature and other instruments and
financial products with registered, domiciled or domestic
counterparties known to CNV or foreign counterparties in
jurisdictions included on the list of cooperating countries
provided in article 2º, subsection b) of Decree
No. 589/2013.
Where a
counterparty is not included in the referred list and is from a
jurisdiction where it is regulated by an entity similar to CNV,
validity of the transactions will be granted if the foreign
regulator has signed a memorandum of understanding, cooperation and
exchange of information with the CNV.
163
With
the purpose of strengthening the requirements applicable to the
grant of authorization to operate in the capital markets,
additional requirements were established in connection with:
(i) competence and capacity; (ii) moral integrity and
honesty and (iii) solvency. Such requirements are subject to
the appraisal of CNV and must be fulfilled by managers, directors,
auditors and any other individual who performs duties or activities
within the company.
Pursuant to Decree
360/2016 dated February 16, 2016, the Argentine government
created the National Coordination Program for Combating Money
Laundering and Terrorist Financing within the purview of the
Ministry of Justice and Human Rights. Its purpose is to rearrange,
coordinate and strengthen the anti-money laundering and
anti-terrorist financing system at the national level, in light of
evolving risks that could impact Argentina and the global
requirements to be met under the scope of the obligations and
international recommendations of the United Nations and FATF
standards.
Moreover, Law
No. 27,260, which introduced certain tax modifications and a
new regime for residents to disclose undeclared assets currently,
due to the restrictions of the Ministry of Finance, the UIF is
within its purview, established that the UIF would now be within
the purview of the Ministry of Economy and Finances. Furthermore,
Resolution 4/2017 was recently issued by UIF by which specific due
diligence (commonly referred to as “know your client”)
is required when local and foreign depositors open a bank account
for financial investments.
On
March 5, 2018, the UIF Resolution No. 21/2018 on
guidelines for the management of risks of money laundering and
financing of terrorism and on the minimum compliance to be adopted
for the prevention of laundering was published in the Official
Gazette. In line with UIF Resolution No. 30/17 addressed to
the financial sector, UIF Resolution No. 21/2018 also moves
from a formalistic compliance approach to a risk-based approach, in
order to ensure that the measures implemented are commensurate with
the risks identified. In this way, the obligated subjects must
identify and evaluate their risks and, depending on this, adopt
management and mitigation measures. In this framework, they are
enabled to implement accredited technological platforms that allow
carrying out procedures at a distance, without personal display of
the documentation, without this conditioning the fulfillment of due
diligence duties.
UIF
Resolution No. 21/2018 provides that as of September 30,
2018, the obligors must have developed and documented the risk
identification and assessment methodology and, as of
December 31, 2018, they must have a technical report that
reflects the results of the implementation of the risk
identification and evaluation methodology. In this sense, as of
March 31, 2019, they must have adjusted their policies and
procedures and, in accordance with the results of the irrigation
self-assessment performed, they must be included in the money
laundering and terrorist financing prevention manual. Finally, as
of September 30, 2018, the compliance of the information
regimes will be deferred, starting from that date the obligation to
inform on the terms and conditions contemplated
therein.
Some
other measures are applicable to listed companies or their
shareholders or beneficial owners who had been convicted or
sentenced in connection with money laundering and/or terrorist
financing activities or appeared in the list published by the
United Nation Security Council.
Credit Card Law
Law
No. 25,065, as amended by Law No. 26,010 and Law
No. 26,361, governs certain aspects of the business activity
known as “credit card system.” Regulations impose
minimum contract contents and approval thereof by the Argentine
Ministry of Industry, as well as limitations on chargeable interest
by users and commissions charged by the retail stores subject to
the system. The Credit Card Law applies both to banking and
non-banking cards, such as “Tarjeta Shopping,” issued
by Tarshop S.A.. Pursuant to Communication “A” 5477
issued by the Central Bank, interest rates charged by non-financial
entities may not exceed the interest rate published by the
financial system for unsecured loans to individuals, as reported
monthly by the Central Bank by more than 25%.
Environmental Law
Our
activities are subject to a number of national, provincial and
municipal environmental provisions. Article 41 of the
Argentine Constitution, as amended in 1994, provides that all
Argentine inhabitants have the right to a healthy and balanced
environment fit for human development and have the duty to preserve
it. Environmental damage requires that the person or entity
responsible assume the obligation to restore the subject property
as provided by applicable law. The authorities must enforce the
protection of this right, the rational use of natural resources,
the preservation of the natural and cultural heritage and of
biodiversity, and shall also provide for environmental information
and education. The National Government must establish minimum
standards for environmental protection whereas Provincial and
Municipal Governments must set specific standards and regulatory
provisions.
On
November 6, 2002, the Argentine Congress passed Law
No. 25,675 to regulate the minimum standards for the
achievement of a sustainable environment and the preservation and
protection of biodiversity and to fix environmental policy goals.
This law establishes the activities that are subject to an
environmental impact assessment and sets forth certain requirements
applicable thereto. In addition, such Law sets forth the duties and
obligations triggered by any damage to the environment and provides
for restoration of the environment to its former condition or, if
that is not technically feasible, for payment of compensation in
lieu thereof. This Law also fosters environmental education and
provides for certain minimum reporting obligations to be fulfilled
by natural and legal entities.
In
addition, the CNV Rules require reporting of any events of any
nature and fortuitous acts that seriously hinder or could
potentially hinder performance of our activities, including any
events that generate or may generate significant impacts on the
environment, providing details on the consequences
thereof.
164
The
Argentine Civil and Commercial Code introduced as a novel feature
the acknowledgement of collective rights, including the right to a
healthy and balanced environment. Accordingly, the Argentine Civil
and Commercial Code expressly sets forth that the law does not
protect an abusive exercise of individual rights if such exercise
could have an adverse impact on the environment or on the
collective rights to environmental safety in general. For
additional information see “Item 3. Key
Information—Risk Factors—Risk Relating to Our
Business—Our business is subject to extensive regulation and
additional regulations may be imposed in the
future.”
Environmental
matters
We have
consistently acted responsibly regarding the environment in the
management of our operating activities by preventing and minimizing
the potential adverse environmental impacts of our activities. We
have adopted an environmental impact policy, which is used as a
reference for the realization of our investments.
We are
subject to environmental legislation under a series of laws,
ordinances, norms, and national, provincial and municipal
regulations of Argentina. Environmental obligations vary depending
on the project site, the site’s environmental conditions,
current and prior uses, and the activity to be developed.
Compliance with environmental laws may result in prior project
delays or imposed additional requirements that may result in
substantial costs, and curtail or infringe our commercial
activities. Before purchasing land or carrying out an investment,
we undertake or contract independent consultants to carry out an
environmental assessment of the plot to identify possible
environmental contingencies, as well as analyzing the possible
environmental impact of the investment or the development to be
carried out. Historically, our operations have not been negatively
affected by the existence or potential existence of pollutants, nor
by the failure to obtain environmental approvals or
permits.
We
intend to continue implementing plans for further improvement,
following our trajectory of respect for the environment, compliance
with the current regulations and optimizing the use of
resources.
Operations Center in Israel
IDBD
and DIC invest, either directly or through its subsidiaries,
associates and joint ventures in companies that operate in various
sectors of the economy in Israel. Both companies are directly
affected by the political, economic, military and regulatory
conditions of Israel. The main regulations applicable to
IDBD’s DIC’s business are described below. For more
information, see “Risk Factors–Risks related to IDBD
and IDBD’s subsidiaries.”
General
regulations applicable to our business in Israel
Proper Conduct of Banking Business
IDBD
and DIC and certain of their affiliates are subject to supervision
by the Israeli Supervisor of Banks relating to “Proper
Conduct of Banking Business” which impose, among others
limits on the aggregate principal amount of loans a financial
institution can have outstanding to a single borrower, a group of
related borrowers, and to the largest borrowers and groups of
related borrowers of a banking entity (as these terms are defined
in the aforesaid directives). IDBD and DIC, their controlling
shareholders and their affiliates are considered a single group of
borrowers for purposes of this regulation. These restrictions limit
the ability of IDBD and DIC, and their affiliates to borrow from a
single bank in Israel, their ability to make investments where they
require bank lines of credit, to invest in companies that have
loans outstanding from banks in Israel, and to make business
transactions together with groups that have such credit
outstanding. In the period from 2013 and until the date of
publication of the report, the concentration of credit risk of IDBD
and DIC, and their affiliates decreased as a result of a reduction
in the amount of utilized credit for the group that includes IDBD
and DIC, including as a result of a change of control that resulted
in a re-characterization of the group for purposes of applicable
regulation.However, in recent years, and until the publication date
of the report, the scope of credit used from the banking system in
Israel to the group of borrowers which includes DIC has decreased,
including due to the change in its control, within the framework of
the debt settlement in IDB Holdings and the sale of the
Group’s holdings in Adama shares.
In
December 2013, The Law to Promote Competition and Reduce
Concentration, 5774- 2013, was published in the Official Gazette
(hereinafter, in this section: the “
Reduced Centralization
Act
”):
1. According to the
provisions of the Reduced Centralization Act, a pyramid structure
for the control of “reporting corporations” (in
general, corporations whose securities were offered to and are held
by the public) is restricted to 2 tiers of reporting corporations
(where a first tier company may not include a reporting corporation
which does not have a controlling shareholder). In accordance with
transitional provisions which were determined in the Reduced
Centralization Act, a third tier company or higher tier company is
no longer entitled to control reporting corporations, except for
corporations as stated above which are under its control as of the
publication date of the Law in the Official Gazette (hererin, the
“
Publication
Date
”), regarding which it was required to discontinue
control by no later an December 2017 (the “
2017 Requirement
”). It is noted
that so long as a reporting corporation is considered a second tier
company in accordance with the law, it is not entitled to control
reporting corporations, and insofar as, on the publication date, it
holds control of reporting corporations, it must discontinue its
control of such corporations by no later than December 2019 (the
“
2019
Requirement
”).
2. On the date of
the Reduced Centralization Act’s publication in the Official
Gazette, DIC was considered a third tier company, and the reporting
corporations controlled by DIC were considered fourth and fifth
tier companies. In May 2014, the control of IDBD changed as part of
the completion of the creditors’ settlement in IDB Holding
Corporation Ltd. (“
IDB
Holding
”), and subsequently, DIC ceased being
considered a third tier company, and is as of that date was
considered a second tier company.
165
3. In August 2014,
the Boards of Directors of IDBD and DIC each resolved to appoint
(separate) advisory committees to evaluate various alternatives for
dealing with the implications of the law, and of its fulfillment of
the restrictions specified therein, with respect to the control of
companies through a pyramid structure, with the intention to allow
the continued control by IDBD and/or DIC of “other tier
companies” (which are currently directly held by DIC) also
after December 2019. It is noted that the alternatives which were
evaluated by the advisory committee of DIC’s Board of
Directors included, inter alia, possible structural changes to all
tiers (i.e., both on the tier of IDBD, which was DIC’s
controlling shareholder at the time, and on the tiers of DIC, PBC
and its investee companies), including a preliminary evaluation of
several alternatives with respect to the 2017
requirement.
4. Further to the
above, due to the fact that some of the possible actions and/or
structural changes may have included transactions in which
DIC’s controlling shareholders may have had a personal
interest, and in accordance with the recommendations of the
advisory committee, the DIC’s Board of Directors resolved, on
March 22, 2017, to authorize the audit committee to evaluate
various alternatives for the DIC’s dealing with the
requirements of the Reduced Centralization Act with respect to the
2017 requirement, and also in light of the 2019 requirement and
possible structural changes on the first tier (i.e., IDBD and its
holdings, at the time, in DIC). DIC was also informed, at that
time, by IDBD that IDBD is also evaluating various alternatives for
dealing with the requirements of the law with respect to the 2017
requirement, and also in consideration of the 2019 requirement, and
accordingly, the Board of Directors of IDBD established an
independent committee of the Board, which is comprised of outside
and independent directors only (herein, the “
Committee
”).
5. With the consent
of the DIC’s audit committee, as stated above, it held a
series of discussions, in which it evaluated several alternatives
for the manner by which DIC, and all tiers in the Group, will
address the 2017 requirement, including an evaluation of the
feasibility of alternatives to which DIC is not directly party, and
an evaluation of the feasibility of other alternatives. The
committee’s work was accompanied by external independent
advisors, who were appointed and chosen by the
committee.
6. in parallel, and
further to a series of discussions which were held by the
independent committee of IDBD, the aforementioned independent
committee of IDBD decided that the preferred alternative, from the
perspective of IDBD, in terms of IDBD’s response to the 2017
requirement, is the alternative in which IDBD sells all of its
shares in DIC (as of the date of implementation of the alternative)
to a special purpose entity (which will be a private company
incorporated in Israel, and a “non-reporting
corporation”, as this term is defined in the Securities Law,
5728-1968) wholly owned by corporations under the control of the
controlling shareholder of IDB Development, Mr. Eduardo Elsztain
(the “
Preferred
Alternative
”).
7. Further to the
decision of the independent committee of the Board of Directors of
IDBD on this matter, on May 25, 2017, the Audit Committee and Board
of Directors of IDBD, respectively, adopted the recommendations of
the aforementioned committee, and its decision regarding the
preferred alternative for IDBD’s dealing with the 2017
requirement.
8. In light of the
decisions of the independent committee, the audit committee and the
Board of Directors of IDBD, the audit committee of DIC on August
16, 2017, decided that the aforementioned alternative is preferred,
from its perspective for the way in which DIC should cope with the
provisions of the Reduced Centralization Act in relation to the
requirement for 2017, and that it will continue evaluating, if
necessary, and insofar as may be required, additional potential
alternatives for DIC’s dealing with the provisions of the
Reduced Centralization Act.
9. Further to the
foregoing, in September 2017, following the negotiations between
the committee, with the accompaniment of its independent advisors
(legal and economic), and Dolphin Netherlands, as well as
additional discussions between the parties, and following the
receipt of the committee’s approval, IDBD and Dolphin
Netherlands signed a memorandum of understanding in connection with
the implementation of the transaction (herein, the
“
Transaction
”)
for the sale of all DIC shares which are held by IDBD to a private
company which is incorporate, or which incorporated, in Israel,
which is affiliated with Dolphin Netherlands, and controlled by
DIC’s controlling shareholder, based on the principles which
were determined by the committee (herein, the “
Memorandum of Understanding
”). In
October 2017, after discussions had been held with the holders of
IDBD's bonds and their representatives, and also after meetings had
been held of the holders of all of the series of IDBD's bonds, and
after the receipt of the Committee's approval, IDBD and Dolphin
Netherlands signed on an amendment to the Memorandum of
Understanding.
10. On November 22,
2017, after the legally required approvals were received, the
transaction was completed. Accordingly, inter alia, all of
DIC’s shares which were held by IDBD (106,780,853 shares)
were transferred to Dolphin IL., a private company incorporated in
Israel, and which is wholly owned by Dolphin Netherlands (herein:
the “
Buyer
”),
the Buyer issued the debenture to IDBD, and additionally, IDBD
received a total of NIS 70 million from the buyer, in accordance
with the determined terms of the transaction. Additionally, within
the framework of the completion of the transaction, as part of the
collateral which was provided by the buyer to IDB Development, in
connection with the debenture, the buyer deposited 9,636,097 DIC
shares with I.B.I. Trust Management, which serves as the trustee
for the debenture on behalf of IDBD and the Buyer, in accordance
with the debenture’s terms.
11. Beginning from
the transaction closing date, DIC ceased being considered a second
tier company, and is now considered a first tier company only, as
defined in the Reduced Centralization Act, which led to the
postponement of the application of the requirements of the Reduced
Centralization Act with respect to reporting corporations which
constitute other tier companies, and which under his control until
December 2019.
12. DIC continues
to consider various alternatives for dealing with the demand for
2019. These alternatives may include possible structural changes in
some of the companies in the DIC Group, that are affected by the
demand for 2019 (that is, at the level of DIC's layer or at the
level of PBC or companies under its control).
166
13.
PBC is a Second
tier company and is the controlling shareholder of reporting
corporations (Gav-Yam, Mehadrin and Ispro), is also evaluating the
implications of the law on its aforementioned holdings, with DIC of
retaining control in Gav-Yam and Mehadrin. As DIC was informed,
according to the assessment of PBC, it will be able to retain
control of the reporting corporations which are under its control,
and therefore, the aforementioned law had no impact on its
financial statements as of December 31, 2017. PBC did not create a
deferred tax liability in case it is forced to realize such
holdings, and according to its assessment, it will not be required
to pay taxes with respect to the profits from the aforementioned
realization
Regulations
applicable to each of the businesses in Israel
Real Estate
In
recent years, there has been continued shortage in manpower in the
construction and agricultural industries which typically are labor
intensive and depend on foreign workers, including in the areas of
Judea and Samaria. The security situation in Israel, as well as the
shutdown of Judea and Samaria during certain periods of the year,
have resulted in continued shortage in the workforce, driven by
lower numbers of foreign workers from Judea and Samaria. In July
2015, the Minister of Finance increased the quota of foreign work
permits to approximately 20,000 through the end of 2016, as a means
to achieving the goal of increasing new construction projects by
70,000 during the year and to promote new housing starts to
alleviate the housing crisis. Given the shortage of skilled
workers, wages increased in general and in particular those of
foreign construction workers. The shortage and unavailability of a
skilled workforce, increased construction costs and resulted in
longer timetables for the execution of new projects.In addition,
PBC is subject, similar to other companies which operate in the
segment, to statutory restrictions, which regard to the planning
and construction of projects out, as well as to contracts with
purchasers and tenants, to planning and building laws, labor and
safety standards in Israel.
PBC's
engagements with tenants are subject to the provisions of the Lease
and Lending Law, 5731-1971 and in rare cases, subject to the Tenant
Protection Law (Consolidated Version) 5732-1972.
PBC is
subject to Legislation and standardization in the field of
construction, which includes, inter alia, planning and
construction, rental and sale, licensing, building permits,
maintaining safety at the construction site, and obtaining permits
to populate. In that regard, any entity that engages in the
construction and sale of housing units required to ensure that any
discrepancies (as defined in the Sale Law) are
rectified.
PBC is
obligated to engage with contractors who operates with compliance
to safety standards.
PBC is
subject to all Israeli standards, which relates to the quality of
work and materials.
Green
Building - PBC agenda is subject to acts with adequate protection
to environmental aspects.
Supermarkets
Labor Law
The
retail sector activities of Shufersal are subject to labor laws
including the Employment of Workers by Human Resources
Subcontractors Law, 5756-1996, the Extension Order in the Matter of
Contract Workers in the Cleaning Branch in the Private Sector, the
Minimum Wage Law, 5747-1987 and the Increased Enforcement of Labor
Laws Law, 5772-2011. As of June 30, 2018, Shufersal employed
approximately 15,000 workers, majority of which are subject to
minimum wage requirements. As of December 31, 2017, the majority of
Shufersal’s employees, in an estimated number of 11,000 of
Shufersal employees, are parties to a collective bargaining
agreement. On March 29, 2018, Shufersal and its said employees'
representatives signed an extension to the collective agreements
until December 31, 2019. In the last 25 years, Shufersal had
industrial quiet without shutdowns.
The
provisions of the Minimum Wage Law (Increase of Minimum Wage -
Emergency Provision), 5772 - 2015 and the amendment of the Minimum
Wage Law, 5747 – 1987, resulted in an increase in the minimum
wage effective from 2015 to December 31, 2017, of NIS 200 million
in Shufersal’s wage expense. In that regard, in 2017
(compared with 2016) the increase was in the amount of NIS 58
million. In Shufersal’s evaluation the increase of the
minimum wage in Israel, changes to labor laws in Israel and the
increased possibility of organized workers may detrimentally affect
the business results of Shufersal and result in higher wage
expenses of Shufersal.
Retail and Production
The
activities of Shufersal are also subject to consumer protection
laws, including the Food Law, the Defective Products Liability Law,
5740-1980, the Consumer Protection Law, 5741-1981, and the Consumer
Product and Service Price Supervision Law, 5756-1996 that allows a
consumer to institute a class action suit for damages caused to
consumers as a whole based on the causes of action set out in that
law.The Public Health Protection (Food) Law, 5776-2015, sets forth
quality standards and food safety measures and provides the
relevant regulator supervisory and criminal and administrative
enforcement powers. The provisions of the Food Protection Law
affect production activities of Shufersal, including importation
and food marketing activities. Shufersal is continuing the process
of implementing procedures to comply with the provisions of the
Food Protection Law that apply to its activities. Shufersal also
operates pharmacies in certain of its stores, and is therefore
subject to the provisions of the Pharmacists Ordinance (New
Version), 5741-1981.Shufersal is involved in manufacturing
activities at three owned facilities where it produces principally
private-branded baked goods which are subject to compliance with
applicable production and quality assurance standards. Shufersal is
continuously evaluating compliance of these facilities with the
provisions of the
Food Protection Law
and as of the date of this Annual Report, Shufersal believes its
operations comply in all material respects with the applicable
provisions of this law.
167
The
retail activities of each Shufersal store requires compliance with
the Business License Order (Businesses Requiring a License),
5773-2013, principally providing that they obtain a business
operating license for each unit. As of the date of this Annual
Report, there are two units that are subject to legal proceedings
regarding business licenses that are pending against Shufersal and
its directors. Shufersal’s operating units are also subject
to land development approvals and licensing, substantially all of
which are in compliance.On December 26, 2017, the Public Health
Protection Regulations (Food) (Food Marking), 5727 - 2017 (the
"Marking Regulations") were published - the Marking Regulations are
intended to make information accessible to consumers regarding the
nutritional value of pre-packaged food, using symbols that indicate
that food contains a high amount of sodium, sugars or saturated
fatty acids, to allow consumers to make informed choices about
their foods, and to promote their health. The main regulations
concern to manufacturers or importers of prepackaged food, which
include, inter alia, provisions which are expected to affect the
productive activities of Shufersal. These regulations will enter
into effect on January 1, 2020. Shufersal estimates that the said
regulations will not materially affect its financial results. To
the best of the Shufersal's knowledge, Shufersal complies with the
various legislative and regulatory requirements that apply on
it.
The Food Law and the Anti Trusts
Law
The Antitrust Law affects the activities of
Shufersal, especially with respect of the possibility of carrying
out future acquisitions for which approval is required from the
Antitrust Commissioner (the “Commissioner”) and the
influence on the trade arrangements of Shufersal with its
suppliers. The Food Law regulates Shufersal’s trade
arrangements with its suppliers which are regulated in detail which
are designed to promote competition in the food supply industry. As
of the date of this Annual Report, Shufersal believes that growth
through acquisitions of a significant entity in the retail market
would be limited. Moreover, provisions of the Food Law relating to
geographical competition of retailers may influence the ability of
Shufersal to expand organically through opening new stores in
certain areas and under certain circumstances Shufersal may be
required to close active branches under certain circumstances.The
Food Law includes the following three systems:
(a)
with respect to activities of suppliers and retail trade, the Food
Law prohibits:
i. a
supplier interfering with the retail price of the products of
another supplier;
ii. a
retailer interfering with a supplier in the matter of the consumer
price imposed by another retailer;
iii. a
large supplier imposing its market position to influence the
ordering or presentation of retail products within stores of a
large retailer (Shufersal is included in the list of large
retailers);
iv. a
large supplier interfering with the price a retailer charges
consumers for the products of that supplier, in the allocation of
sales areas at any rate for the products of the supplier, for the
acquisition of a product from the supplier in any scope from the
total retail purchases of the product and of competing products,
and for the purchase or sale of products which another supplier
supplies to the retailer, including purchase quantities and goals,
the sale area allocated to them in a store and any other commercial
condition sought to be imposed;v. a large retailer and a large
supplier agreeing to set the pricing of a basket of products at a
price that is lower than the marginal cost of production of the
related product or that would require a consumer to purchase a
minimum amount of the related product to achieve the reduces price;
vi. a large supplier conditioning the sale of its product to a
retailer on the purchase of another product of that large supplier;
and
vii. a
supplier forwarding payments to the large retailer, unless by way
of a price reduction of the product units.(b) Restrictions on
geographical competition of retailers have adversely affected
Shufersal’s expansion through organic growth and
acquisitions. On September 28, 2014 Shufersal received a
notification from the Antitrust Authority regarding demand areas of
Shufersal’s large stores (“Notice of Demand
Areas”). The stores that were the subject of the
Commissioner’s request under the Law are 14 stores located in
Haifa, 3 stores in Carmiel, 4 stores in Hadera, and 3 stores in
Safed. As of the date of this Annual Report, Shufersal has not been
required to close or dispose of any of its stores.(c) Provisions
designed to increase transparency of consumer prices,
inter alia,
by requiring a large
retailer to publish on the internet and without cost to consumers,
various data on prices of consumer goods it sells in its stores to
allow consumers to compare prices with those of other
retailers.
(d)
Provisions regarding the contemporaneous application of the Food
Law and the Antitrust law - In December 2015, the Commissioner
published a statement on the parallel application of the Antitrust
Law and the Food Law listing cases in which only the provisions of
the Food Law will apply and no additional regulation will be
required under the Antitrust Law. As of the date of the notice
Shufersal’s operations comply with the Food Law.
Shufersal’s acquisition of Clubmarket was approved by the
Commissioner in 2005, and within this framework the Commissioner
imposed a number of limitations on Shufersal’s activities
including: prohibiting Shufersal from pricing products that result
in a loss that is not proportionate to its business activities and
are aimed to affect the operations of competitors from the market;
prohibiting Shufersal from entering into agreements with suppliers
that impose restrictions on those suppliers from doing business
with competitors of Shufersal; and prohibiting Shufersal from
attempting to influence commercial conditions between its suppliers
and competitors.Shufersal obtained an exemption from the
Commissioner, available until October 14, 2018, regarding the
operation of the Fourth Chain, which is a label company owned by a
number of supermarket chains that was established to develop
consumer goods. The Commissioner’s decision took into account
the fact that Fourth Chain contracted with a third party that
develops products for it under a private brand and the stipulated
exemption exclusively permits these joint activities for the
development of the private brand. Shufersal believes the Fourth
Chain private label increases competition by establishing a
cost-effective alternative to dominant branded consumer
products.
168
The
findings of the Commissioner in the matter of the rules of conduct
among the largest store chains and the dominant suppliers in the
food supply market, including under the provisions of the Food Law,
and in the matter of the merger of Shufersal with Clubmarket, may
have a detrimental effect on Shufersal’s business, its
financial condition and operating results.
In
October 2016, Shufersal received a notice from the Antitrust
Authority about catchment areas of the large stores of Shufersal
("the catchment area notice"). The catchment area notice referred
to 132 large stores, with calculated rate of more than 30% but less
than 50%, and 38 large stores with calculated rate of over 50%. The
notice was accompanied by maps of catchment areas of those stores.
It is noted that after reviewing the catchment area maps that were
enclosed in the catchment area notice, the stores that may be
exposed to actions under the above temporary provision are as
follows: 19 stores in the Haifa area and 3 stores in the Zefat
area. It is noted that as of the date of this report, Shufersal had
not been required, under the temporary provision, to close any of
its stores. As at December 31, 2017, implementation of the Food Law
did not have any material impact on the business of
Shufersal.
Telecommunnications
Communications
Regulations
Cellcom’s operations are subject to general
legal provisions regulating the relationships and method of
contracting with its customers. These provisions include the
Consumer Protection Law, 5721-1981 and regulations promulgated
thereunder and other laws detailed below. A substantial part of
Cellcom’s operations are subject to the Communications Law,
regulations enacted by the Ministry of Communications, and the
provisions of the licenses granted to Cellcom by the Minister of
Communications. Cellcom’s actives which include providing
cellular service, landline, international telephone services and
internet access, and infrastructure services are subject to
licensing.
Supervision of Rates.
The Communications
Regulations (Telecommunications and Broadcasts) (Payments for
Interconnect), 5760 - 2000 requires cellular operators to phase in
gradual reduction of communications rates (i.e. payments that will
be made by an in-country operator, another cellular operator or
international operator to complete one minute of call time in the
network of a cellular operator or for the sending of an SMS between
cellular operators). This reduction has led to a considerable
reduction in Cellcom’s revenues.Moreover, in August 2013 the
Communications Law was amended to authorize the Minister of
Communications to set interconnection prices and regulate the use
of networks owned by another operator based not only on the cost
incurred to establish the network (according to the calculation
method to be determined by the Minister of Communication) plus a
reasonable profit, but also on one of the following: (1) flat
payment for a service provided by the license holder; (2) reference
to tariffs charged for a comparable service; or (3) reference to
the cost of these services or with the interconnection costs
charged in other countries. The Minister of Communications was also
empowered to give instructions on structural separation for the
providing various services, including segregating services provided
by a license holder from services provided to a
subscriber.
In the
last few years, contract termination charges for cellular plans
have been banned in the cellular and other communications markets,
other than for customers who have more than a certain number of
cellular lines or whose monthly payments exceed a certain amount
for bundled service. The elimination of these charges led to a
considerable increase in plan cancellations, increased the costs of
retaining and acquiring customers, and accelerated erosion of
rates.
Virtual Operators (MVNO).
The
Communications Law and related pronouncements regulate the
activities of virtual operators. Notwithstanding that the MVNO
regulations apply only to the activities of a virtual operator
which has an operating agreement with a cellular operator, the
regulations empower the Ministry of Communications together with
the Economic Ministry to impose terms of an agreement including
fixing the price to be charged for the services
provided. Other Third Generation Operators (UMTS). In 2012,
Golan and Hot Mobile began to offer UMTS services. The conditions
of the tender according to which Golan and Hot Mobile were granted
those licenses included a number of benefits and concessions,
including minimally low license fees and a mechanism to reduce the
royalties they undertook to pay for the frequencies based on the
operator’s market share in the private sector and setting
long timetables to meet the geographical coverage requirements of
the network and the right to use in-country migration services via
other cellular operators’ networks. The Communications Law
obliges the other cellular operators to provide in-country
migration services to Golan and Hot Mobile for a period ranging
from seven to ten years subject to certain conditions. In 2011,
Cellcom entered into a contract with Golan to provide in-country
migration services. Hot Mobile entered into a similar in-country
migration agreement with Pelephone and later with Partner (which
was subsequently replaced by a joint networks agreement with
Partner) without intervention from the Ministry of
Communications.
Regulation of Multi-Channel Television
Services
As at
the date of this Annual Report, television program streaming via
the Internet is not subject to regulation in Israel. Should the
recommendations of the committee for the examination of the
arrangement of commercial broadcasts be adopted and the committee
requires Cellcom to make additional investments or regulation is
imposed that is not beneficial for Cellcom’s streaming
services or for its ability to use the DTT infrastructures, the
results of Cellcom’s streaming services may be adversely
affected.
Cellcom’s Communications Licenses
Cellcom
holds a general license for providing cellular services, valid
until January 31, 2022, setting out conditions (including duties
and restrictions) applicable to its activities, officers and
shareholders holding certain percentages of Cellcom’s shares.
The license may be extended by the Ministry of Communications for
consecutive periods of six years, if Cellcom is in compliance with
the provisions of the license and law, and makes requisite
investments to its service and network. The Ministry of
Communications has amended the license conditions in the past, and
may amend them in the future, without Cellcom’s consent and
in a manner that may limit its ability to conduct business. The
license provides that Cellcom does not have exclusivity for
providing services.
169
The
cellular license can be revoked, suspended or limited in the
following cases: total holdings of the founding shareholders or
their successors (as defined in the license) is less than 26% of
the control shares of Cellcom; total holdings of Israeli parties
(as defined in the license), who are among the founding
shareholders or their successors, is less than 20% of the total
issued share capital and control shares of Cellcom; a majority of
directors are not Israeli citizens or residents of Israel; fewer
than 20% of the directors of Cellcom were appointed by Israeli
parties; an act or omission of Cellcom that adversely affects or
restricts competition in the cellular sector; the aggregate equity
of Cellcom, together with the aggregate equity of shareholders each
holding 10% or more of the share capital, is less than US$200
million.In light of the 2015 change in the control structure of
IDBD, the Cellcom control structure has also changed, and requires
the approval of the Ministry of Communications, including with
regard to Israeli holding requirements included in the licenses of
Cellcom, as Mr. Eduardo Elsztain is not a citizen of Israel. IDBD
and Cellcom formally applied to the Ministry of Communications to
approve these changes and amend the telecommunications licenses of
Cellcom accordingly. If the request is not approved and another
arrangement is not offered by the Ministry of Communications,
Cellcom may face sanctions, which under the terms of its license,
can include suspension or cancellation of its
licenses.
According to
Telecommunications Law, the Ministry of Communications may impose
on telecommunication companies, including Cellcom, financial
sanctions for breach of license and law. The amount of the sanction
is calculated as a percentage of the revenue of the operator, and
according to the degree of severity and extent of the breach, said
may be significant.In July 2015, Cellcom received (through a wholly
owned entity) a uniform and general license for the provision of
landline telephony services (which replaced the previous license
for providing this service), for the period ending April 2026. A
uniform and general license was also awarded to Netvision and
replaced its general license for providing internet access
services, international carriers, and a network access point for
the period ending February 2022. In addition, an entity, fully
controlled by Cellcom received a uniform and general license which
replaced the landline telephony service license, for the period
ending March 2026. These licenses can be extended for an additional
period of 10 years, under terms similar to the terms of extension
of the general cellular license.
The
Ministry of Communications has issued rules providing for
unification of all uniform licenses. The uniform license allows
providers to also offer virtual operator services. The process of
unifying the uniform licenses and the timetable have not yet been
determined and it is possible that this process will have a legal,
financial, tax and accounting effect on Cellcom’s and
Netvision’s businesses. The provision of a number of services
by one entity will require limitations also on discrimination
between operators.
Cellcom
holds other communications licenses: a special license for the
provision of data transmission and communication services in
Israel, a license to provide internet services, and licenses to
provide cellular services, landline telecommunication services and
internet services in the West Bank, for periods ending 2016-2018.
These licenses include conditions similar to those of the general
license for the provision of cellular services, as noted
above.
According to
regulations that apply to the uniform license, there are certain
limitations on cross ownership among license holders.
2.
Further Regulation Applicable to
Communications Services
In July
2014, the Ministry of Communications announced a public hearing on
the coverage and quality requirements for second-generation and
third generation networks. The proposed requirements are stricter
than those currently existing and if adopted, could have an adverse
effect on the results of Cellcom. Cellcom is unable to assess
whether the proposed changes will be adopted, and what the impact
of these changes will have in practice on Cellcom’s operating
results.In addition, in August 2014, the Ministry of Communications
announced a public hearing to consider call centers owned by
communications operators. In addition, the Ministry of
Communications proposed to amend the Communications Law
(Telecommunications and Broadcasting), 1982, providing that a
customer may claim pre-set financial compensation if the telephone
call center does not reply within an average response time or if
there is an overcharge error. Cellcom believes that adoption of
these proposed changes could have a material adverse effect on
Cellcom’s business.
3. Permits for Setting Up Base Sites
a.
Cellcom’s cellular services
generlly are provided through base sites across Israel, their
construction and licensing are included in TAMA 36 (District Zoning
Plan) – Part A - National Master Plan for Communications -
Small and Micro Broadcasting Facilities (“TAMA 36”),
and Radiation Law. Regulating the deployment of wireless access
devices, which are base sites with smaller dimensions, are, for the
most part, regulated by Communications Law and Radiation Law. The
construction of base sites requires a permit as per Planning and
Building Law, 1965 (“Planning and Building Law”), and
is subject to other approvals from multiple
regulators.
Legal
proceedings (civil, criminal and administrative) are pending
against Cellcom, under which a number of arguments were raised
concerning the legal compliance of some of Cellcom’s sites,
alleging failure to obtain permits under Planning and Building Law,
or based on development of sites in contravention of a
permit.
As of
December 31, 2017, Cellcom operated a small portion of Cellcom's
cell sites without building permits or applicable exemptions and
approximately 33% of Cellcom's cell sites without building permits
in reliance on an exemption from the requirement to obtain a
building permit, mainly for radio access devices. In 2010, the
Supreme Court issued a Temporary Order at the request of the
Government’s Attorney General, enjoining Cellcom, Partner,
and Pelephone from proceeding with construction of these facilities
on the basis of the exemption. A final determination of the
regulatory authorities regarding applications for exemptions is
pending as of the date of this Annual Report.In addition, Cellcom
provides in-building repeaters and micro-sites (“
femtocells
”) for its subscribers
seeking a solution to poor indoor reception. Based on an opinion
Cellcom received from legal counsel, Cellcom did not request
building permits for the repeaters that were installed on
roof
tops, which are a small fraction of all repeaters installed. It is
not clear whether the installation of a different type of
in-building repeaters and micro-sites requires a building permit.
Some require a specific permit while others require a permit from
the Ministry of Environmental Protection, depending on their
radiation levels. Cellcom also builds and operates microwave
facilities as part of its transmission network. The different types
of microwave facilities receive permits from the Ministry of
Environmental Protection regarding their radiation levels. Based on
an opinion of legal counsel, Cellcom believes that building permits
are not required for the installation of microwave facilities on
rooftops.
170
b.
Indemnification obligation
-
under Planning and Construction Law, local planning and building
committees may demand and receive, as a condition for granting a
building permit for a site, a letter of indemnity for claims under
Section 197 of Planning and Construction Law. By December 31, 2015,
Cellcom had executed approximately 400 letters of indemnity as a
condition for receiving permits. In some cases, Cellcom has not yet
been built any sites.
As a
result of the requirement to provide indemnification letters,
Cellcom may decide to construct new cell sites in alternative, less
suitable locations, to reduce capacity coverage or not to construct
them at all, which could impair the quality of Cellcom's service in
the affected areas.
c.
Radiation Law, Regulations and Permits
Thereunder
- Radiation Law, Regulations and Principles
thereunder included provisions relating to all aspects related to
regulating the issue of non-ionizing radiation, including,
inter alia
, levels of
exposure that are permissible.
In May
2012, the Ministries of Communications, Health and Environmental
Protection, based on their assessment of the potential health
consequences of fourth-generation telecommunications services in
Israel, including increased exposure to non-ionizing radiation,
issued a memorandum advising that deployment of the
fourth-generation network should be based on existing base
stations, other smaller base sites both internal and external, and
if possible, using the wired infrastructure so that data traffic
will be carried mainly through fixed communication lines and not
through any cellular infrastructure. In August 2014, the Ministry
of Communications allowed the use of fourth-generation
infrastructures, and in January 2015 fourth-generation frequencies
were awarded to cellular operators. The recommendations of May
2012, as noted, were not included in the tender documents or in
said approval.
As of
December 31, 2017, Cellcom were subject to five criminal and
administrative legal proceedings alleging that some of its cell
sites were built and have been used without the relevant permits or
not in accordance with the permits. As of the same date, a small
portion of Cellcom cell sites operated without building permits or
applicable exemptions. Although Cellcom is continually seeking to
obtain building permits for these sites, Cellcom may not be able to
obtain them and in several instances Cellcom may be required to
relocate these sites to alternative locations or to demolish them
without any suitable alternative. In addition, Cellcom may be
operating a significant number of its cell sites, in a manner which
is not fully compatible with the building permits issued for them,
although they are covered by permits from the Ministry of
Environmental Protection in respect of their radiation level. In
some cases Cellcom will be required to relocate these cell sites to
alternative locations, to reduce capacity coverage or to demolish
them without any suitable alternative.
In 2017
a draft regulations setting procedures for making changes in
existing radio access devices including replacement thereof and for
the construction of a limited number of new radio access devices
exempt from building permits, but requiring certain municipal
procedures, was deliberated in the Israeli Parliament's Economic
Committee.
4. Services in Judea and Samaria
The
Israeli Civil Administration in Judea and Samaria granted Cellcom a
non-exclusive license for the provision of cellular services to the
Israeli-populated areas in Judea and Samaria. This license is
effective until 2022.
Insurance
Areas of Activity of Clal Insurance Business Holdings
Clal
Holdings offers general insurance such as car insurance,
homeowners’ insurance, and credit and foreign trade risk
insurance, among others, as well as health insurance. The
activities of Clal Holdings and its subsidiaries are subject to the
provisions of laws applicable insurance companies and to regulatory
supervision. Clal Holdings’ subsidiaries are supervised by
the Capital Markets, Insurance and Savings Commissioner (the
“Insurance Commissioner”). Clal Insurance and its
subsidiary, Clalbit Financing, are supervised by the Israel
Securities Authority. Subsidiaries of the Clal Holdings Insurance
Group have been subject to administrative enforcement proceedings
and the imposition of fines. Clal Insurance is not in breach of any
material regulatory provision applicable to its
operations.
Capital Requirements of Insurance Companies
In
April 2018, the sublaw: Supervision of Financial Services
Regulations (Insurance) (Minimum Equity Required for an Insurer's
License) Regulations, 5778-2018 (the "Minimum Capital
Regualtions"), which nulify the Supervision of Financial Services
(Insurance) (Minimum Equity Required of an Insurer), Regulations,
1998. The Minimum Capital Regualtions prescribes minimum capital
different requirements for different segments in the insurance
field. The capital required for Long term insurance (e.g. life
insurance, long term health insurance and Liability insurance) is
NIS 15 million as compared to 52 million pursuant to the previous
regulations. The capital required for short term insurance (e.g.
general insurance and short term health insurance) is NIS 10
million as compared to NIS 59 million pursuant to the previous
regulations. The said Minimum Capital Regulations are expected to
increase competition in the insurance market due to the reduction
of the capital requirement for the purpose of obtaining an
insurance company license. At this stage, Clal Insurance cannot
expect the full implications of the regulations.
171
the
insurance and savings segments, in recent years and in particular
in 2017, there Commissioner if promoting a significant amount of
regulatory reforms, mainly those aimed to reduct insurance and
management fees. In particular, the Commissioner has set a special
pension funds, which will be a default choice for employees unless
they choose otherwise, which significantly reduce the management
fees. With respect to the said fund, the Commissioner also
intervenes with terms which regards to loss of work capacity, a
material change in compulsory insurance tariffs and changes in the
conditions and tariffs in health products. The regulatory
intervention creates changes in the structure of the engagement and
the interaction between institutional bodies, agents, employers and
customers, in a manner that can affect the ability of an
institutional body to link its revenues and expenses, impose
significant operating expenses on it and harm its profitability.
The implementation of some of the reforms began in 2017, and some
of them will be implemented in the future and / or are in various
stages of implementation or discussions. As of December 31, 2017,
Clal cannot estimate the full impact of the said measures and
regulations taken on the insurance and pension market in Israel.
The range of the proposed changes, the intervention in tariffs and
management fees, the operational load, the scope and complexity of
the regulatory changes, and the adjustments required in the
automation systems and work processes, affect the business model of
the insurance market in Israel and its profitability, among others
on the value of the business which will be sold (VNB) and the
solvency ratio to comply with pursuant to the Solvency
Directive.
Breakdown of an Insurer’s
Capital
– The Insurance Commissioner issued a circular
in August 2011 (“Circular”) that provides a framework
for determining the composition of an insurer’s equity, in
conjunction with the adoption in Israel of the Solvency II
Directive (“Directive” or “Solvency II”),
as amended and updated.
·
Initial (core) capital (basic tier
1), equals the components included in capital attributable to
shareholders of Clal Insurance. The overall capital ratio must be
at least 60% of the total equity of the insurer.·
Secondary (tier 2) capital includes
complex secondary capital instruments (excluding periodic accrued
interest payments), subordinate secondary capital instruments (as
defined by the Circular) and any other component or instrument
approved by the Insurance Commissioner. A complex secondary capital
instruments is one that is subordinated to any other instrument,
except for initial capital, including financial instruments
available to absorb losses by postponing payment of principal and
interest. The first repayment date of secondary capital instruments
will be after the end of the period that reflects the weighted
average maturity of insurance liabilities, plus two years, or after
20 years, whichever is first, but no earlier than eight years from
the date an instrument is issued. If the complex secondary capital
instrument includes an incentive for early redemption, the first
incentive payment date may not be earlier than five years from the
date of issue of the instrument.
·
Tertiary (tier 3) capital includes
complex tertiary capital instruments (excluding periodic accrued
interest payments) and any other component or instrument approved
by the Insurance Commissioner. A tertiary capital instrument is
subordinate to any other instrument, except for primary and
secondary capital, and includes financial instruments available to
absorb the insurer’s losses by postponing the payment of
principal. Tertiary capital will must be junior to secondary
capital and equal in the order of credit repayments. The first
repayment date on tertiary capital instruments may not be earlier
than five years from the date of issuance. If the complex tertiary
capital instrument includes an incentive for early redemption, the
first indentive payment date may not be earlier than five years
from the date of issue of the instrument. Tertiary capital may not
exceed 15% of the total capital of the insurer.
Insurance
liabilities include liabilities that are not yield dependent but
excludes any liability fully backed by lifetime indexed bonds and
net of any reinsurance costs. Approval of the Insurance
Commissioner is required for inclusion of hybrid capital
instruments (primary, secondary or tertiary) in equity. The
Circular includes a Temporary Order regarding the breakdown of an
insurer’s equity (“Temporary Order”), which will
apply until full implementation of the Directive in Israel, when
announced by the Insurance Commissioner. The Temporary Order
defines the secondary capital issued according to Capital
Regulations, before amendment, as subordinate secondary capital and
imposes a limit equal to 50% of basic capital.
Distribution of dividends
– In accordance with rules promulgated by the Insurance
Commissioner, a dividend distribution may not be approved, unless,
after giving pro forma effect to the proposed distribution, the
insurer has a ratio of recognized equity to required equity of at
least 100% pursuant to the provisions of any Solvency Directive, as
confirmed in filings with the Insurance Commissioner. Prior
approval of the Insurance Commissioner is not required for any
distribution of dividends if the total equity of the insurance
company, as defined in the Minimum Capital Regulations, after
giving effect to the distribution of the proposed dividend, exceeds
115% of the required equity.
In
November 2014, the Insurance Commissioner outlined solvency rules
(“rules” or “regime,” as applicable) based
on Solvency II, in Israel, in a letter addressed to managers of the
insurance companies (“Letter”). In the Letter, the
Insurance Commissioner outlined a plan to adopt the 2016 European
model for calculating capital and capital requirements for the
local market, effective as of the annual reports for 2016
(“First Adoption Date”). During a period to be
determined by the Insurance Commissioner and as conditions require,
insurance companies will also be required to comply with capital
requirements under existing regulations. The Letter stated that
until final adoption, insurance companies must prepare additional
quantitative assessment exercises (IQIS) for the 2014-2015 period.
These requirements are intended to assess the quantitative effects
of adopting the model, as well as providing data for calibrating
and adjusting the model. In addition, the Letter addressed an
initiative to develop a framework for quarterly reporting of
insurance companies’ solvency ratio. The Letter also referred
to the Commissioner’s intention to publish provisions for
managing capital and targets for internal capital, to address a gap
survey that insurers will undertake with respect to their risk
management systems, controls and corporate governance and a
consultation paper to promote the process of self-assessment of
risks and solvency (ORSA).In April 2015, the Insurance Commissioner
published a second letter titled “Plan for the Adoption of
Rules for Solvency, based on Solvency II” and provisions for
the IQIS4 exercises to be undertaken regarding the 2014 historical
financial statements. The letter emphasized that the exercise
reflects the decision of the Insurance Commissioner to impose
adjustments
required for the
Israeli insurance market. The Letter further stated in connection
with the proposed adoption of IQIS5 that the Insurance Commissioner
would continue to monitor developments in the European markets and
would consider adjustments relevant for Israel.
172
In July
2015, the Insurance Commissioner issued a letter concerning
“transitional provisions regarding the application of
solvency rules, based on Solvency II” (the “Letter on
Transitional Provisions”). The transitional provisions were
provided by reference to certain solvency rules set forth in the
European Directive relating to, inter alia, a gradual adoption of
capital requirements in respect of holdings of equity shares which
may a component to be included in the calculation of core capital.
In addition, the letter included transitional provisions regarding
submission of a plan to improve the capital ratios of insurance
companies whose ratios are negatively affected following adoption
of the new solvency rules beginning with the financial statements
for 2018. Adoption of the solvency rules are expected to change
both the recognized regulatory and required regulatory capital and
according to indications existing today, is expected to result in a
significant decline in the ratio between recognized capital and
required capital of Clal Insurance compared to capital ratios
calculated according to capital ratio requirements currently in
effect, and is expected to adversely affect the ability of Clal
Insurance and Clal Insurance Enterprises to distribute dividends
upon such adoption. However, as a rule, the capital requirements
under the solvency rule are intended to serve as a capital cushion
against more serious events, with a lower loss probability than the
capital requirements under current rules.In May 2015, the Board of
Directors of Clal Insurance Enterprises and the Board of Directors
of Clal Insurance directed its management team and the Risk
Management Committee, which also functions as the Solvency
Committee (“Committee”), to examine measures Clal
Insurance may be able to employ to improve its capital ratio, in
accordance with the new solvency rules and to recommend a course of
action to the Board, including in relation to business adjustments
and/or financial transactions related to Clal Insurance’s
capital, its breakdown, and/or its responsibilities. The Committee
and Management have begun this examination, and during the first
stage, recommended that the Board issue secondary capital
instruments. The Committee will continue to examine other measures
in an effort to prepare the company for possible adoption of these
proposed capital requirements, and related measures.Clal Insurance
has calculated its capital ratio using results as of December 31,
2014 (“Calculation Date”) and based on the IQIS4 rules
and has determined that it would be in compliance, as of the
Calculation Date, with the proposed capital requirements, in the
context of the transitional provisions, even before taking pro
forma account of the positive impact on the capital ratio provided
by the subsequent issuance of subordinated notes. The related
calculations were submitted to the Insurance Commissioner on August
31, 2015. The Insurance Commissioner has not yet published binding
provisions for adoption, and there is uncertainty regarding the
details of the final provisions. Clal Insurance will continue to
monitor the quantitative aspects of the proposed solvency rules
towards final adoption, in an effort to anticipate requisite
controls and capital requirements.On March 14, 2016, “IQIS
Provisions for 2015” (“Draft”) was published in
preparation for the adoption of Solvency II. Insurance companies
are required to submit an additional quantitative evaluation survey
on the basis of December 2015 results (“IQIS5”), by
June 30, 2016. The Draft was issued by reference to the European
legislation adapted for requirements of the local market and that
goes beyond provisions for quantitative evaluation surveys
previously issued. The main changes relate to establishing
risk-free interest curves, through extrapolation to the ultimate
forward rate point, the components of recognized capital, capital
requirements less investments in infrastructure (capital and debt),
adjusting capital requirements for management companies, and
updating the formula for calculating capital requirements for risk
premiums and reserves for general insurance. Clal Insurance is
unable to assess the overall impact of the changes based on the
provisions in the Draft to carry out a further quantitative
evaluation survey, and will carry out an assessment of the current
capital status, when the binding provisions will be finalized.
According to the Draft, the IQIS5 calculation will be a factor in
assessing preparedness of insurance companies and to the
implementation and scope of the final provisions to be
adopted.
Capital
requirements under the Capital Regulations are based on the
separate individual financial statements of an insurance company.
For purposes of calculating recognized capital, an investment by an
insurance company in an insurance company or a controlled
management company, and in other subsidiaries will be calculated on
the equity basis, according to a holding rate, which includes
indirect holdings.
The
minimum capital required of Clal Insurance has been reduced, with
approval of the Insurance Commissioner, by 35% of the original
difference attributed to the managing companies and provident funds
under its control. However, when calculating the amount of
dividends permitted for distribution, this difference will be added
at level of the capital structure. In September 2013, the Insurance
Commissioner notified Clal Insurance that the deducted amount to be
added back to the minimum capital required, will be after a
deduction for a tax reserve accrued by Clal Insurance following the
acquisition of provident fund operations. The approval of the
Insurance Commissioner, as noted above, will be canceled with
adoption of capital requirements under the Directive that will
replace the Capital Regulations.In March 2013, Clal Insurance
received a letter from the Insurance Commissioner regarding the
determination of credit ratings according to an internal model used
by Clal Insurance (“internal model”), to be applied as
a risk rating methodology for a subject insured, according to
conditions of the relevant sector. The Insurance Commissioner
authorized Clal Insurance to allocate capital for adjusted loans,
ranked according to its internal model and with reference to the
rates specified in the Capital Regulations. If there is an external
rating available, the capital allocation will be made using the
lower of the available ratings. The letter also requires Clal
Insurance to submit immediate and periodic reports as specified
regarding these activities that make the specified transactions
subject to review by the Commissioner of Insurance. As a result of
its compliance with the provisions of the letter, Clal
Insurance’s capital requirements were reduced by NIS 69
million, as at the end of the reporting period.
Permit Issued by the Insurance Commissioner to
the Former Controlling Shareholders of IDBH to Retain Control of
Clal Insurance Enterprises and Consolidated Institutional
Entitie
On May 8, 2014, legal counsel for the former
controlling shareholders of IDBD (Ganden, Manor, and Livnat Groups)
was notified by the Commissioner that in the context of
arrangements among the creditors of IDBH, and given that they no
longer controlled the Clal Insurance Enterprises Group, the
authorization previously issued by the Insurance Commissioner for
control of these entities was terminated, including, with respect
to Clal Insurance, Clal Credit Insurance and Clal Pension and
Provident Funds. IDBH undertook to supplement (or to cause its
controlled affiliates to supplement) the required equity of the
insurers in compliance with the Capital Regulations, subject to the
a cap of 50% of the required capital of an insurer, and that the
obligation will take effect only if the insurer’s equity is
determined to be negative, and such funding amount will then be
equal to the amount of negative capital,
up to the 50%
cap.In addition, IDBH undertook to contribute to the equity of Clal
Pension and Provident Funds up to the amount prescribed by the
Provident Fund Regulations, for as long as IDBH is the controlling
shareholder of the institutional entities. The authorization
specifies conditions and imposes restrictions on the ability of a
holding entity to impose liens on the equity of IDBD’s
institutional entities it holds. The former controlling
shareholders were also required, as long as any liens existed on
their equity interest of IDBH, to ensure that Clal Insurance
Enterprises complied with applicable capital requirements, such
that the equity of Clal Insurance Enterprises at no time was less
than the product of the holding rate of Clal Insurance Enterprises
in Clal Insurance and 140% of the required minimum equity of Clal
Insurance, calculated according to the Capital Regulations on
September 30, 2005 (as the holding rate was linked to the CPI of
September 2005).At the end of the reporting period, the required
minimum capital of Clal Insurance Enterprises was NIS 2.9 billion,
greater that the amount required based on the foregoing
calculation. The capital requirement is calculated on the basis of
the financial statements of Clal Insurance Enterprises. Following
termination of the control authorization, the former controlling
shareholders have questioned whether the capital requirements
applicable to Clal Insurance Enterprises thereunder continue to
apply.
173
Clal
Insurance is committed to finding a strategy to supplement its
required equity in compliance with the Capital Regulations if the
equity of Clal Credit Insurance becomes negative, and as long as
Clal Insurance is the controlling shareholder of Clal Credit
Insurance. Clal Insurance is committed to supplement the equity of
Clal Pension and Provident Funds as necessary to ensure it complies
with the minimum amount required by Income Tax Regulations (Rules
for Approval and Management of Provident Funds), 1964
(“Income Tax Regulations”). This commitment is valid as
long as Clal Insurance controls, directly or indirectly, Clal
Pension and Provident Funds.In February 2012, Supervision of
Financial Services Regulations (Provident Funds) (Minimum Capital
Required of a Management Company of a Provident Fund or Pension
Fund), 2012, was published along with Income Tax Regulations (Rules
for Approval and Management of Provident Funds) (Amendment 2), 2012
(“new regulations”).
Pursuant to the new
regulations, the capital requirements for management companies were
expanded to include capital requirements based on the volume of
assets under management and applicable annual expenses, but not
less than the initial capital of NIS 10 million. In addition,
liquidity requirements were also prescribed. A fund management
company may distribute dividends only to the extent of any excess
above the minimum amount of equity required by said regulations. In
addition, a fund management company must provide additional capital
in respect of controlled management companies. As at the end of the
reporting period, the management companies controlled by Clal
Insurance have capital balances in excess of the minimum capital
required by the capital regulations for management companies. In
light of capital regulations for management companies and in order
to finance the expansion of operating and investing activities of
Clal Pension and Provident Funds, the Boards of Directors of Clal
Insurance and Clal Pension and Provident Funds in 2015 and 2014
approved an subscribed shares of Clal Pension and Provident Funds
in consideration for NIS 100 million and NIS 80 million,
respectively.
Anti-Money Laundering.
In May
2017, the Prohibition on Money Laundering Order (Obligation to
Identify, Report and Maintain Records of Insurers, Insurance Agents
and Managing Companies in Order to Prevent Money Laundering and the
Financing of Terrorism), 2017, was published, which came into
effect in March 2018 (the “Prohibition on Money Laundering
Order”). The order consolidates and combines, under a single
framework regarding institutional entities. The following
regulations: the Prohibition on Money Laundering Order (Obligation
to Identify, Report and Maintain Records of Insurers and Insurance
Agents), 2001 and The Prohibition on Money Laundering Order
(Obligation to Identify, Report and Maintain Records of Provident
Funds and Managing Companies of Provident Funds), 2001. The main
changes in the order, relative to the current orders, include the
expansion of the application of the order to a new general fund,
provident fund for investment and provident fund for savings, and
with respect to an annuity paying provident fund in certain cases,
and regarding the reduction of the limit of accruals, deposits and
withdrawals which require the performance of actions in accordance
with the order. Additionally, an obligation was established to
perform a “know your customer” process upon engagement
in a life insurance contract or upon the opening of a provident
fund.
In
addition, in December 2016, the bill for amending the Prohibition
on Money Laundering Law (Amendment No. 19), 5766 - 2016 (the
"Amendment") was published and was yet to be approved. The
Amendment includes changes which expand the list of cases included
pursuant to the law, and also sets the right of the Authority for
the Prohibition of Money Laundering to transfer information to the
Commissioner of Insurance.
In
February 2018, the Management of Money Laundering and Financing of
Terror Risks in financial institutions circular was published (the
"Money Laundering Risk Management Circular"), which extends and
imposes additional obligations on institutional entities which are
not included in the Prohibition on Money Laundering
Order.
The Money Laundering Risk Management Circular.
The
main purpose of the Money Laundering Risk Management's Circular is
to establish directives regarding the implementation of orderly
processes for the identification and assessment of the risks of
money laundering and the financing of terrorism and the taking of
measures for their management and amortization, including the
guidelines regarding the adoption of a money laundering and terror
financing risk management policy for the approval of the Board of
Directors; Formulating a risk assessment document in which the
money laundering and terrorist financing risks in the institutional
body will be identified and evaluated; Implementation of measures
to reduce the risk of money laundering and the financing of
terrorism; And those responsible for fulfilling the obligations of
the prohibition of money laundering and the prevention of terrorism
in an institutional entity.
According to the
Clal’s estimate, the Prohibition on Money Laundering Order,
the Amendment and the said circular may have implications on the
sale process of insurance products, both within the framework of
the direct sale channels, and through agents, inter alia, in light
of the requirements of the order and their impact on the sale
processes, both in light of the need to implement a process of
learning about the
customer prior to
the sale process, and in light of the interpretation which will be
given for the aforementioned obligations, with respect to the
insurance companies, the insurance agents and the reciprocal
relationship between them.
174
C.
ORGANIZATIONAL STRUCTURE
Subsidiaries
and associated companies
The
following table includes a description of our direct subsidiaries
and associated companies as of June 30, 2018:
|
Subsidiaries
|
Effective
Ownership and Voting Power Percentage
|
Property/Activity
|
|
|
|
|
|
Agro-Uranga
S.A
|
35.72
%
|
Agro-Uranga S.A. is
an agricultural company which owns 2 farmlands (Las Playas and San
Nicolás) that have 8.299 hectares on the state of Santa Fe and
Córdoba.
|
|
|
|
|
|
|
|
|
|
Brasilagro
Companhia Brasileira de Propiedades Agrícolas
|
43.29
%
(1)
|
Brasilagro is
mainly involved in four areas: sugar cane, crops and cotton,
forestry activities, and livestock.
|
|
|
|
|
|
|
|
|
|
|
|
|
|
Agropecuaria Santa
Cruz S.A. (formerly known as Doneldon S.A.)
|
100
%
|
Agropecuaria Santa
Cruz S.A. is involved in investments in entities organized in
Uruguay or abroad through the purchase and sale of bonds, shares,
debentures and any kind of securities and commercial paper under
any of the systems or forms created or to be created, and in the
management and administration of the capital stock it owns on
companies controlled by it.
|
|
Futuros y
Opciones.Com S.A.
|
50.10
%
|
A leading
agricultural web site which provides information about markets and
services of economic and financial consulting through the Internet.
The company has begun to expand the range of commercial services
offered to the agricultural sector by developing direct sales of
supplies, crops brokerage services and cattle
operations.
|
|
Amauta Agro
S.A.
|
50.48
%
(2)
|
Amauta Agro
S.A.’s purpose is to engage, in its own name or on behalf of
or associated with third parties, in activities related to the
production of agricultural products and raw materials, export and
import of agricultural products and national and international
purchases and sales of agricultural products and raw
materials.
|
|
FyO Acopio S.A.
(formerly known as Granos Olavarria S.A.
|
59.63
%
(2)
|
FyO Acopio S.A. is
principally engaged to the warehousing of cereals and brokering of
grains.
|
|
|
|
|
|
Helmir
S.A.
|
100
%
|
Helmir S.A. is
involved in investments in entities organized in Uruguay or abroad
through the purchase and sale of bonds, shares, debentures and any
kind of securities and commercial paper under any of the systems or
forms created or to be created, and to the management and
administration of the capital stock it owns on companies controlled
by it.
|
|
IRSA Inversiones y
Representaciones Sociedad Anónima
|
63.74
%
(1)(3)
|
It is a leading Argentine company devoted to the development and
management of real estate.
|
|
|
|
|
|
|
|
|
|
Sociedad
Anónima Carnes Pampeanas S.A.
|
100
%
(3)
|
Sociedad
Anónima Carnes Pampeanas, a company that owns a cold storage
plant in Santa Rosa, Province of La Pampa, with capacity to
slaughter and process approximately 9,500 cattle head per
month.
|
|
|
||
(1)
Excludes effect of treasury stock.
(2)
Includes Futuros y Opciones.Com S.A.’s interest.
(3)
Includes Helmir’s interest.
175
D.
PROPERTY, PLANTS AND EQUIPMENT
Overview
of Agricultural Properties
As of
June 30, 2018, we owned, together with our subsidiaries, 23
farmlands, which have a total surface area of 612,230
hectares.
The
following table sets forth our properties’ size (in
hectares), primary current use and book value. The market value of
farmland is generally higher the closer a farmland is located to
Buenos Aires:
|
Owned
Farmlands as of June 30,2018
|
|||||||
|
|
Facility
|
Province
|
Country
|
Gross
Size
(in
hectares)
|
Date
of Acquisition
|
Primary
Current Use
|
Net
Book Value
(Ps. Millions)
(1)
|
|
|
|
|
|
|
|
|
|
|
1
|
El
Recreo
|
Catamarca
|
Argentina
|
12,395
|
May
95
|
Natural
woodlands
|
1.3
|
|
2
|
Los
Pozos
|
Salta
|
Argentina
|
239,639
|
May
’95
|
Cattle/
Agriculture/ Natural woodlands
|
244.4
|
|
3
|
San Nicolás/Las Playas
(2)
|
Santa
Fe/Córdoba
|
Argentina
|
2,965
|
May
‘97
|
Agriculture/
Dairy
|
17.6
|
|
4
|
La Gramilla/ Santa
Bárbara
|
San
Luis
|
Argentina
|
7,072
|
Nov
‘97
|
Agriculture Under
irrigation
|
186.7
|
|
5
|
La
Suiza
|
Chaco
|
Argentina
|
26,380
|
Jun
‘98
|
Agriculture/
Cattle
|
71.7
|
|
6
|
El
Tigre
|
La
Pampa
|
Argentina
|
8,360
|
Apr
‘03
|
Agriculture/
Dairy
|
34.2
|
|
7
|
San
Pedro
|
Entre
Rios
|
Argentina
|
6,022
|
Sep
‘05
|
Agriculture
|
134.5
|
|
8
|
8 De Julio/
Estancia Carmen
|
Santa
Cruz
|
Argentina
|
100,911
|
May
‘07/ Sep ‘08
|
Sheep
|
12.0
|
|
9
|
Administración
Cactus
|
San
Luis
|
Argentina
|
171
|
Dec
‘97
|
Natural
woodlands
|
0.4
|
|
10
|
Las
Vertientes
|
Cordoba
|
Argentina
|
4
|
-
|
Silo
|
0.4
|
|
11/12/13
|
Las Londras/San
Rafael/ La Primavera
|
Santa
Cruz
|
Bolivia
|
9,875
|
Nov-08/Jan-11
|
Agriculture
|
715.5
|
|
14
|
Marangatú/Udra
(3)
|
Mariscal
Estigarribia
|
Paraguay
|
59,490
|
Feb-09
|
Agriculture
/Natural Woodlands
|
1.224.0
|
|
15
|
Finca
Mendoza
|
Mendoza
|
Argentina
|
270
(4)
|
Mar
‘11
|
Natural
woodlands
|
0.0
|
|
16
|
Establecimiento
Mendoza
|
Mendoza
|
Argentina
|
9
|
Nov’03
|
Natural
woodlands
|
4.9
|
|
17/23
|
Brasilagro
(3)
|
|
Brazil
|
138,667
|
|
Agriculture/
Forestry/Cattle
|
2,759.0
|
|
Subtotal
|
|
|
612,230
|
|
|
5,406.6
|
|
(1) Acquisition
costs plus improvements and furniture necessary for the production,
less depreciation.
(2) Hectares and
carrying amount in proportion to our 35.72% interest in Agro-Uranga
S.A.
(3) See the section
“Overview of Brasilagro’s
Properties”.
(4) Corresponds to
our 40% ownership of Establecimiento Mendoza.
Overview of Brasilagro’s Properties
As of
June 30, 2018, we owned, together with our subsidiaries, 8
farmlands, which have a total surface area of 198,157 hectares,
acquired at a highly convenient value compared to the average of
the region, all of them with a great appreciation
potential.
|
|
|
Total
Area
|
|
Net
Book Value
|
|
Properties
|
Place
|
(ha)
|
Use
|
(Ps.
Millions)
|
|
Jatobá
Farmland
|
Jaborandi/BA
|
30,981
|
Agriculture
|
419
|
|
Alto Taquari
Farmland
|
Alto
Taquari/MT
|
5,394
|
Agriculture
|
264
|
|
Araucária
Farmland
|
Mineiros/GO
|
5,534
|
Agriculture
|
317
|
|
Chaparral
Farmland
|
Correntina/BA
|
37,182
|
Agriculture
|
603
|
|
Nova Buriti
Farmland
|
Januária/MG
|
24,211
|
Forestry
|
170
|
|
Preferência
Farmland
|
Barreiras/BA
|
17,799
|
Cattle
|
204
|
|
S
ão José
Farmland
|
M
aranhão/MA
|
17,566
|
Agriculture
|
782
|
|
M
oroti
Farmland
|
B
oqueron
Paraguai
|
59,490
|
Agriculture
|
1,224
|
|
Total Brazil
|
198,490
|
|
3,983
|
|
176
In the
ordinary course of business, the leases property or spaces for
administrative or commercial use both in Argentina and Israel under
operating lease arrangements. The agreements entered into include
several clauses, including but not limited, to fixed, variable or
adjustable payments.
Overview
of UrbanProperties andIinvestment business
In the
ordinary course of business, the leases property or spaces for
administrative or commercial use both in Argentina and Israel under
operating lease arrangements. The agreements entered into include
several clauses, including but not limited, to fixed, variable or
adjustable payments.
The
following table sets forth certain information about our properties
for the Operation Center in Argentina as of June 30,
2018:
|
Property
(6)
|
Date
of Acquisition
|
Leasable/
Sale
m2
(1)
|
Location
|
Net
Book
Value
Ps.
(2)
|
Use
|
Occupancy
rate
(7)
|
|
Edificio
República
|
Apr-08
|
19,885
|
City
of Buenos Aires
|
2,672
|
Office
Rental
|
95
%
|
|
Bankboston
Tower
|
Aug-07
|
14,873
|
City
of Buenos Aires
|
2,008
|
Office
Rental
|
100
%
|
|
Bouchard
551
|
mar-07
|
0
|
City
of Buenos Aires
|
97
|
Office
Rental
|
-
|
|
Intercontinental
Plaza
|
nov-97
|
2,976
|
City
of Buenos Aires
|
141
|
Office
Rental
|
100
%
|
|
Bouchard
710
|
jun-05
|
15,014
|
City
of Buenos Aires
|
1,882
|
Office
Rental
|
100
%
|
|
Dot
Building
|
nov-06
|
11,242
|
City
of Buenos Aires
|
1,304
|
Office
Rental
|
100
%
|
|
Santa
María del Plata
|
oct-97
|
116,100
|
City
of Buenos Aires
|
485
|
Other
Rentals
|
91
%
|
|
ALG Arena
(3)
|
|
|
|
153
|
Other
Rentals
|
|
|
Predio San
Martín (ex Nobleza Picardo)
|
may-11
|
109,610
|
Province
of Buenos Aires, Argentina
|
1,406
|
Other
Rentals
|
94
%
|
|
PH Office Park
(under construction)
(3
|
|
|
|
1,583
|
Other
Rentals
|
|
|
Other Properties
(5)
|
N/A
|
N/A
|
City
and Province of Buenos Aires
|
2,026
|
Mainly
Rental offices and properties under development
|
N/A
|
|
Abasto
(3)
|
nov-99
|
36,795
|
City
of Buenos Aires, Argentina
|
7,125
|
Shopping
Mall
|
96.8
%
|
|
Alto Palermo
(3)
|
Dec-97
|
18,945
|
City
of Buenos Aires, Argentina
|
7,356
|
Shopping
Mall
|
99.3
%
|
|
Alto Avellaneda
(3)
|
dic-97
|
36,063
|
Province
of Buenos Aires, Argentina
|
4,579
|
Shopping
Mall
|
99.3
%
|
|
Alcorta Shopping
(3)
|
jun-97
|
15,613
|
City
of Buenos Aires, Argentina
|
3,541
|
Shopping
Mall
|
98.1
%
|
|
Patio Bullrich
(3)
|
oct-98
|
11,760
|
City
of Buenos Aires, Argentina
|
1,891
|
Shopping
Mall
|
97.6
%
|
|
Alto Noa
(3)
|
nov-95
|
19,059
|
City
of Salta, Argentina
|
1,084
|
Shopping
Mall
|
97.2
%
|
|
Buenos Aires Design
(3)
|
Dec-97
|
13,967
|
City
of Buenos Aires, Argentina
|
11
|
Shopping
Mall
|
97.2
%
|
|
Mendoza Plaza
(3)
|
dic-94
|
42,867
|
Mendoza,
Argentina
|
1,770
|
Shopping
Mall
|
97.1
%
|
|
Alto Rosario
(3)
|
Dec-04
|
31,807
|
Santa
Fe, Argentina
|
3,378
|
Shopping
Mall
|
99.6
%
|
|
Córdoba Shopping –Villa
Cabrera
(3)(11)
|
dic-06
|
15,445
|
City
of Córdoba, Argentina
|
1,112
|
Shopping
Mall
|
98.1
%
|
|
Dot Baires Shopping
(3)
|
may-09
|
49,499
|
City
of Buenos Aires, Argentina
|
4,615
|
Shopping
Mall
|
99.9
%
|
|
Soleil Premium Outlet
(3)
|
jul-10
|
15,227
|
Province
of Buenos Aires, Argentina
|
1,477
|
Shopping
Mall
|
100,00
%
|
|
La Ribera Shopping
(3)
|
Aug-11
|
10,054
|
Santa
Fe, Argentina
|
218
|
Shopping
Mall
|
97.6
%
|
|
Distrito Arcos
(3)
|
dic-14
|
14,692
|
City
of Buenos Aires, Argentina
|
1,060
|
Shopping
Mall
|
100,00
%
|
|
Alto Comahue
(3)
|
mar-15
|
9,766
|
Neuquén,
Argentina
|
992
|
Shopping
Mall
|
96.4
%
|
|
Patio Olmos
(3)
|
sep-97
|
-
|
City
of Córdoba, Argentina
|
259
|
Shopping
Mall
|
N/A
|
|
Caballito
Plot of Land
|
nov-97
|
5,000
|
City
of Buenos Aires
|
376
|
Land
Reserve
|
N/A
|
|
Santa
María del Plata
|
oct-97
|
116,100
|
City
of Buenos Aires
|
6,013
|
Other
Rentals
|
91
%
|
|
Anexo Dot
(3
|
|
|
|
1,098
|
Land
Reserve
|
|
|
Catalinas
Norte
|
|
|
|
1,491
|
Land
Reserve
|
|
|
Luján plot of land
(3)
|
may-08
|
1,160,000
|
Province
of Buenos Aires, Argentina
|
306
|
Mixed
uses
|
N/A
|
|
Other Land Reserves
(4)
|
N/A
|
N/A
|
City
and Province of Buenos Aires
|
791
|
Land
Reserve
|
N/A
|
|
Intercontinental
(7)
|
nov-97
|
24,000
|
City
of Buenos Aires
|
62
|
Hotel
|
74
%
|
|
Sheraton Libertador
(8)
|
mar-98
|
37,600
|
City
of Buenos Aires
|
29
|
Hotel
|
73
%
|
|
Llao Llao
(9)(10)
|
jun-97
|
17,463
|
City
of Bariloche
|
78
|
Hotel
|
52
%
|
(1) Total leasable
area for each property. Excludes common areas and parking
spaces.
(2) Cost of
acquisition or development plus improvements, less accumulated
depreciation, less allowances.
(3) Through IRSA
CP.
(4) Includes the
following land reserves: Pontevedra Plot; Mariano Acosta, San Luis
Plot, Puerto Retiro Pilar plot and Merlo plot (through IRSA) and
Intercontinental Plot, Dot Adjoining Plot, Mendoza Plot, Mendoza
2.992 East Av. Plot and La Plata plot (through IRSA
CP).
(5) Includes the
following properties: Anchorena 665, Anchorena 545 (Chanta IV),
Zelaya 3102, 3103 y 3105, Madero 1020, La Adela, Paseo del Sol,
Edificio Phillips, EH UTTE, Libertador 498 and Suipacha
652.
(6) Percentage of
occupation of each property. The land reserves are assets that the
company remains in the portfolio for future
development.
(7) Through Nuevas
Fronteras S.A.
(8) Through Hoteles
Argentinos S.A.
(9) Through Llao
Llao Resorts S.A.
(10) Includes
Ps.21,900,000 of book value that corresponds to “Terreno
Bariloche.”
Included in
Investment Properties is the cinema building located at
Córdoba Shopping – Villa Cabrera, which is encumbered by
a right of antichresis as a result of loan due to Empalme by NAI
INTERNACIONAL II Inc. The total amount of the loan outstanding was
Ps.9.6 million as of June 30, 2018.
177
The
following table sets forth certain information about our properties
for the Operations Center in Israel as of June 30,
2018:
|
Property
|
Date
of acquisition
|
Location
|
Net
Book
Value
in million of Ps.
|
Use
|
|
|
|
|
|
|
|
Tivoli
|
oct-15
|
United
States
|
5,815
|
Rental
properties
|
|
Kiryat
Ono Mall
|
oct-15
|
Israel
|
3,914
|
Rental
properties
|
|
Shopping
Center Modi’in A
|
oct-15
|
Israel
|
1,767
|
Rental
properties
|
|
HSBC
|
oct-15
|
United
States
|
25,194
|
Rental
properties
|
|
Matam
park - Haifa
|
oct-15
|
Israel
|
12,822
|
Rental
properties
|
|
Holon
|
oct-15
|
Israel
|
1,925
|
Rental
properties
|
|
Herzeliya
North
|
oct-15
|
Israel
|
9,003
|
Rental
properties
|
|
Gav-Yam
Center - Herzeliya
|
oct-15
|
Israel
|
5,176
|
Rental
properties
|
|
Neyar
Hadera Modi’in
|
oct-15
|
Israel
|
1,665
|
Rental
properties
|
|
Gav
yam park - Beer Sheva
|
oct-15
|
Israel
|
2,407
|
Rental
properties
|
|
Haifa
|
oct-15
|
Israel
|
-
|
Rental
properties
|
|
Ispro
planet -BeerSheva -Phase1
|
oct-15
|
Israel
|
2,091
|
Rental
properties
|
|
Others
|
oct-15
|
Israel
|
18,862
|
Rental
properties
|
|
Tivoli
|
oct-15
|
United
States
|
371
|
Undeveloped
parcels of land
|
|
Others
|
oct-15
|
Israel
|
3,673
|
Undeveloped
parcels of land
|
|
Tivoli
|
oct-15
|
United
States
|
552
|
Properties
under development
|
|
Ispro
Planet – Beer Sheva – Phase 1
|
oct-15
|
Israel
|
252
|
Properties
under development
|
|
Amot
tozeret H'aaretz
|
oct-15
|
Israel
|
2,777
|
Properties
under development
|
|
Others
|
oct-15
|
Israel
|
1,806
|
Properties
under development
|
|
Total
|
|
|
100,072
|
|
Insurance
Agricultural Business
We
carry insurance policies with insurance companies that we consider
financially sound. We employ multi-risk insurance for our farming
facilities and industrial properties, which covers property damage,
negligence liability, fire, falls, collapse, lightning and gas
explosion, electrical and water damages, theft, and business
interruption. Such insurance policies have specifications, limits
and deductibles, which we believe, are customary. Nevertheless,
they do not cover damages to our crops. We carry directors and
officer’s insurance covering management’s civil
liability, as well as legally mandated insurance, including
employee personal injury. We also provide life or disability
insurance for our employees as benefits.
We
believe our insurance policies are adequate to protect us against
the risks for which we are covered. Nevertheless, some potential
losses are not covered by insurance and certain kinds of insurance
coverage may become prohibitively expensive.
The
types of insurance used by us are the following:
|
Insured
Property
|
Risk
Covered
|
Amount
Insured
|
Book
Value
|
|
|
|
(in
millions of Ps.)
|
|
|
Buildings,
machinery, silos, installation and furniture and
equipment
|
Theft, fire and
technical insurance
|
1,269
|
770
|
|
Vehicles
|
Theft, fire and
civil and third parties liability
|
38
|
19
|
Urban Properties and Investment Business
IRSA carries all-risk insurance for the shopping
malls and other buildings covering property damage caused
by fire, terrorist acts, explosion, gas leak, hail,
storms and wind, earthquakes, vandalism, theft and business
interruption. In addition, IRSA carries liability insurance
covering any potential damage to third parties or property caused
by the conduct of our business throughout Argentina. IRSA is in
compliance with all legal requirements related to mandatory
insurance, including insurance required by the Occupational Risk
Law (
Ley de
Riesgos del Trabajo
), life
insurance required under collective bargaining agreements and other
insurance required by laws and executive orders. IRSA´s
history of damages is limited to one single claim resulting from a
fire in Alto Avellaneda Shopping in March 2006, which loss was
substantiaxlly recovered from our insurers. These insurance
policies contain specifications, limits and deductibles which we
believe are adequate to the risks to which we are exposed in our
daily operations. IRSA also maintains liability insurance covering
the liability of our directors and corporate
officers.
178
Control
Systems
IRCP
has computer systems equipped to monitor tenants’ sales
(except stands) in all of its shopping malls. IRCP also conduct
regular audits of our tenants’ accounting sales records in
all of our shopping malls. Almost every store in its shopping malls
has a point of sale that is linked to our main server. IRCP uses
the information generated from the computer monitoring system to
prepare statistical data regarding, among other things, total
sales, average sales and peak sale hours for marketing purposes and
as a reference for the internal audit. Most of its shopping mall
lease agreements require the tenant to have its point of sale
system linked to our server.
On May
14, 2018 and July 23, 2018, we received a comment letter from the
staff of the SEC’s Division of Corporation Finance with
respect to our Annual Report filed on October 31, 2017, requesting
us to provide certain clarifications related to our calculations of
the fair market value of our shopping malls and offices properties,
among others. We filed responses on June 11, 2018 and August 15,
2018 and, on September 21, 2018, we received a subsequent letter
from the staff requesting us to clarify certain responses from our
letter filed on August 15, 2018. We submitted our response on
October 19, 2018 and we are awaiting the SEC’s response. As
of the date of the this Annual Report, we have not received
confirmation from the staff of the Division of Corporation Finance
of the SEC that its review process relating to our Annual Report
filed on October 31, 2017 has been completed. If we receive
additional comments from the staff, we intend to resolve such
additional comments promptly.
A.
CONSOLIDATED OPERATING RESULTS
The
following management’s discussion and analysis of our
financial condition and results of operations should be read
together with “Selected Consolidated Financial Data”
and our Audited Consolidated Financial Statements and related notes
appearing elsewhere in this annual report. This discussion and
analysis of our financial condition and results of operations
contains forward-looking statements that involve risks,
uncertainties and assumptions. These forward-looking statements
include such words as, “expects,”
“anticipates,” “intends,”
“believes” and similar language. Our actual results may
differ materially and adversely from those anticipated in these
forward-looking statements as a result of many factors, including
without limitation those set forth elsewhere in this annual report.
See
Item 3 “Key Information
– D. Risk Factors”
for a more complete
discussion of the economic and industry-wide factors relevant to
us.
General
We
prepare our Audited Financial Statements in Pesos and in accordance
with IFRS, as issued by the IASB, and with CNV Rules.
Our
Audited Consolidated Financial statements and the financial
information included elsewhere in this annual report have been
prepared in accordance with IFRS. We have determined that, as of
July 1, 2018, the Argentine economy qualifies as a
hyperinflationary economy according to the guidelines of IAS 29
since the total cumulative inflation in Argentina in the 36 months
prior to July 1, 2018 exceeded 100%. IAS 29 requires that the
financial information recorded in a hyperinflationary currency be
adjusted by applying a general price index and expressed in the
measuring unit (the hyperinflationary currency) current at the end
of the reporting period. Therefore, our audited consolidated
financial statements included in this annual report will be
adjusted by applying a general price index and expressed in the
measuring unit (the hyperinflationary currency) current at the end
of the most recent reporting period. We have not estimated yet the
impact of the application of IAS 29 provisions in our audited
consolidated financial statements.
Our
Audited Consolidated Financial Statements included in this annual
report were not restated into constant currency. For more
information, see “Financial
Information—Inflation.”
Revenue
Recognition
Our
revenue is measured at the fair value of the consideration received
or receivable.
Revenue
from the sale of property is recognized when: (a) material risks
and benefits derived from title to property have been transferred;
(b) the company does not retain any management function on the
assets sold nor does it have any control whatsoever on such assets;
(c) the amount of revenues and costs associated to the transaction
may be measured on a reliable basis; and (d) the company is
expected to accrue the economic benefits associated to the
transaction.
Revenue
derived from the provision of services is recognized when (a) the
amount of revenue and costs associated to services may be measured
on a reliable basis; (b) the company is expected to accrue the
economic benefits associated to the transaction, and (c) the level
of completion of services may be measured on a reliable
basis.
179
Agricultural
and agricultural-related activities:
Revenue
from our agricultural activities comes primarily from sales of
agricultural produce and biological assets, from provision of
services related to the activity and from leases from
farmlands.
We
recognize revenue on product sales when the agricultural produce or
biological assets are delivered and the customers take ownership
and assume risk of loss, which is when the products are received by
the customer at its or a designated location or collected directly
by the customer from the cultivation bases, collection of the
relevant receivable is probable and the selling price is fixed or
determinable. Net sales of products represent the invoiced value of
goods, net of trade discounts and allowances, if any.
We also
provide agricultural-related (including but not limited to watering
and feedlot services) and brokerage services to third parties.
Revenue from services is recognized as services are
rendered.
We also
lease land to third parties under operating lease agreements. Lease
income is recognized on a straight-line basis over the period of
the lease.
Investment
property activities:
Rental and
services - Shopping malls portfolio
Revenues derived
from business activities developed in our shopping malls mainly
include rental income under operating leases, admission rights,
commissions and revenue from several complementary services
provided to our lessees.
Rental
income from shopping mall, admission rights and commissions are
recognized in the Statements of Income on a straight-line basis
over the term of the leases. When lease incentives are granted,
they are recognized as an integral part of the net consideration
for the use of the property and are therefore recognized on the
same straight-line basis.
Contingent rents,
being lease payments that are not fixed at the inception of a
lease, are recorded as income in the periods in which they are
known and can be determined. Rent reviews are recognized when such
reviews have been agreed with tenants.
Lease
contracts also provide that common area maintenance charges and
collective promotion funds of our shopping malls are borne by the
corresponding lessees, generally on a proportionally basis. These
common area maintenance charges include all such expenses
convenient and necessary for various purposes including, but not
limited to, the operation, maintenance, management, safety,
preservation, repair, supervision, insurance and enhancement of the
Shopping malls. The lessor is responsible for determining the need
and suitability of incurring a common area expense. We make the
original payment for such expenses, which are then reimbursed by
the lessees. We consider that it acts as a principal in these cases
Service charge income is presented, separately from property
operating expenses. Property operating expenses are expensed as
incurred.
Rental and
services - Offices and other rental properties
Rental
income from offices and other rental properties include rental
income from office leased out under operating leases, income for
services and expenses recovery paid by tenant.
Rental
income from offices and other rental properties is recognized in
the Statements of Income on a straight-line basis over the term of
the leases. When lease incentives are granted, they are recognized
as an integral part of the net consideration for the use of the
property and are therefore recognized on the same straight-line
basis.
A
substantial portion of the Company’s leases require the
tenant to reimburse the Company for a substantial portion of
operating expenses, usually a proportionate share of the allocable
operating expenses. Such property operating expenses include
necessary expenses such as property operating, repairs and
maintenance, security, janitorial, insurance, landscaping, leased
properties and other administrative expenses, among others. We
manage its own rental properties. We make the original payment for
these expenses, which are then reimbursed by the lessees. We
consider that it acts as a principal in these cases. The accrues
reimbursements from tenants as service charge revenue in the period
the applicable expenditures are incurred and is presented
separately from property operating expenses. Property operating
expenses are expensed as incurred.
·
Revenues from supermarkets
Revenue
from the sale of goods in the ordinary course of business is
recognized at the fair value of the consideration collected or
receivable, net of returns and discounts. When the credit term is
short and financing is that typical in the industry, consideration
is not discounted. When the credit term is longer than the
industry’s average, in accounting for the consideration, the
Company discounts it to its net present value by using the
client’s risk premium or the market rate. The difference
between the fair value and the nominal amount is accounted for
under financial income. If discounts are granted and their amount
can be measured reliably, the discount is recognized as a reduction
of revenue.
Revenues from
supermarket have been recognized in discontinued
operations.
Revenue
from communication services and sale of communication
equipment
Revenue
derived from the use of communication networks by the Company,
including mobile phones, Internet services, international calls,
fixed line calls, interconnection rates and roaming service rates,
are recognized when the service is provided, proportionally to the
extent the transaction has been realized, and provided all other
criteria have been met for revenue recognition.
180
Revenue
from the sale of mobile phone cards is initially recognized as
deferred revenue and then recognized as revenue as they are used or
upon expiration, whichever takes place earlier.
A
transaction involving the sale of equipment to a final user
normally also involves a service sale transaction. In general, this
type of sale is performed without a contractual obligation by the
client to consume telephone services for a minimum amount over a
predetermined period. As a result, the Company records the sale of
equipment separately and recognizes revenue pursuant to the
transaction value upon delivery of the equipment to the client.
Revenue from telephone services is recognized and accounted for as
they are provided. When the client is bound to make a minimum
consumption of services during a predefined period, the contract
formalizes a transaction of several elements and, therefore,
revenue from the sale of equipment is recorded at an amount that
should not exceed its fair value, and is recognized upon delivery
of the equipment to the client and provided the criteria for
recognition are met. The Company ascertains the fair value of
individual elements, based on the price at which it is normally
sold, after taking into account the relevant
discounts.
Revenue
derived from long-term contracts is recognized at the present value
of future cash flows, discounted at market rates prevailing on the
transaction date. Any difference between the original credit and
its net present value is accounted for as interest income over the
credit term.
General
We
prepare our Audited Financial Statements in Pesos and in accordance
with IFRS, as issued by the IASB, and with CNV Rules.
Historically, we
measured the value of our portfolio of investment properties at
cost. Our Board of Directors resolved to change our accounting
policy for measuring the value of our investment property from the
cost model to the fair value model, as permitted under IAS 40.
Accordingly, we retroactively recast our previously issued
consolidated financial statements as of June 30, 2016 and 2015 and
for the fiscal years ended June 30, 2016, 2015 and 2014 as required
by IAS 40 and IAS 8.
Our
Audited Consolidated Financial statements and the financial
information included elsewhere in this annual report have been
prepared in accordance with IFRS. We have determined that, as of
July 1, 2018, the Argentine economy qualifies as a
hyperinflationary economy according to the guidelines of IAS 29
since the total cumulative inflation in Argentina in the 36 months
prior to July 1, 2018 exceeded 100%. IAS 29 requires that the
financial information recorded in a hyperinflationary currency be
adjusted by applying a general price index and expressed in the
measuring unit (the hyperinflationary currency) current at the end
of the reporting period. Therefore, our audited consolidated
financial statements included in this annual report will be
adjusted by applying a general price index and expressed in the
measuring unit (the hyperinflationary currency) current at the end
of the most recent reporting period. See “Risk
Factors—Risks Relating to Argentina—The peso qualifies
as a currency of a hyperinflationary economy under IAS 29.
Accordingly, we will apply IAS 29 for periods ending after July 1,
2018 and our historical audited consolidated financial statements
and other financial information will need to be restated.” We
have not estimated yet the impact of the application of IAS 29
provisions in our audited consolidated financial
statements.
Our
Audited Consolidated Financial Statements included in this annual
report were not restated into constant currency. For more
information, see “Financial
Information—Inflation.”
Effects of the global macroeconomic factors
Most of
our assets are located in Argentina, where we conduct our
operations, and in Israel and Brazil. Therefore, our financial
condition and the results of our operations are significantly
dependent upon economic conditions prevailing in both
countries.
The
table below shows Argentina’s GDP growth, inflation rates,
dollar exchange rates, the appreciation (depreciation) of the Peso
against the U.S. dollar, and the appreciation (depreciation) of the
NIS against the U.S. dollar for the indicated periods (inter-annual
information—which is the 12 month period preceding the
dates presented—is presented to conform to our fiscal year
periods).
|
|
Fiscal
year ended June 30,
|
||
|
|
2018
|
2017
|
2016
|
|
|
(inter-annual
data)
|
||
|
GDP
growth(4)
|
(4.2
)%
|
2.7
%
|
(3.4
)%
|
|
Inflation
(IPIM)(1)
|
44.1
%
|
14.2
%
|
26.7
%
|
|
Inflation
(CPI)
|
29.5
%
|
21.9
%
|
37.6
%
|
|
Depreciation of the
Peso against the U.S. dollar(2)
|
(73.7
)%
|
(10.6
)%
|
(65.9
)%
|
|
Average exchange
rate per US$1.00(3)
|
Ps.28.8000
|
Ps.16.5800
|
Ps.14.9900
|
|
Appreciation/
(depreciation) of the NIS against the U.S. Dollar
|
(4.8
)%
|
9.6
%
|
(2.3
)%
|
(1) IPIM
(Índice de Precios Internos al por Mayor) is the wholesale
price index as measured by the Argentine Ministry of
Treasury.
(2) Depreciation
during fiscal year 2016 was mostly due to the depreciation of the
Peso that took place on December 17, 2015.
(3) Represents
average of the selling and buying exchange rate
quoted by Banco de la Nación
Argentina as of June 30, 2018. As of October 25, 2018, the exchange
rate was 36.7900 per U.S. Dollar.
(4) Represents GDP
variation as of June 30, 2016.
Sources: INDEC,
Argentine Ministry of Treasury, Ministry of Treasury of the City of
Buenos Aires, Banco de la Nación Argentina and Central
Bank.
Argentine GDP
decreased 4,2% during our 2018 fiscal year, compared to an incrase
of 2.7% in our fiscal 2017. Shopping mall sales grew 31.2% in the
fiscal year 2018 compared to fiscal 2017. As of June 30, 2018, the
unemployment rate was at 9,6% of the country’s economically
active population compared to 8.7% as of June 30,
2017.
181
Changes
in short- and long-term interest rates, unemployment and inflation
rates may reduce the availability of consumer credit and the
purchasing power of individuals who frequent shopping malls. These
factors, combined with low GDP growth, may reduce general
consumption rates at our shopping malls. Since most of the lease
agreements in our shopping malls, our main source of revenue,
require tenants to pay a percentage of their total sales as rent, a
general reduction in consumption may reduce our revenue. A
reduction in the number of shoppers at our shopping malls and,
consequently, in the demand for parking, may also reduce our
revenues from services rendered.
Regarding
the macroeconomic environment of Brazil, growth is projected to
recover gradually and remain moderate. According to information
published by IMF, growth forecast is expected at 1.4 percent in
2018 and 2.4 percent in 2019. Inflation has continued on the
downside, allowing for prospects of faster monetary easing.
According to the OECD, investment has supported the recovery,
helped by lower interest rates and reforms that improved
confidence.
Regarding
Israel’s economy, and based on information published by OECD,
despite a decline in residential investment, activity remained
solid at the beginning of 2018, with strong public consumption and
good export performance, particularly of services. After picking up
to 3.3% in 2017, growth is projected to be around 3.7% in 2018 and
3.6% in 2019. Rising wage pressures are projected to lead to a
steady increase in inflation.
Effects of inflation
The
following are annual inflation rates during the fiscal years
indicated, based on information published by the INDEC, an entity
dependent of the Argentine Ministry of Treasury.
|
|
Consumerprice
index
|
Wholesaleprice
index
|
|
|
(inter-annual
data)
|
|
|
Fiscal
Year ended June 30,
|
|
|
|
2013
|
10.5
%
|
13.5
%
|
|
2014
|
15.0
%
|
27.7
%
|
|
2015
|
14.0
%
|
13.6
%
|
|
2016
|
37.6
%
(1)
|
26.7
%
|
|
2017
|
21.9
%
|
14.2
%
|
|
2018
|
29.5
%
|
44.1
%
|
(1)
Given the modifications to the system that INDEC uses to measure
CPI, there is no data for any price variations from July 1,
2015 to June 30, 2016. For that reason, we present aggregate
prices from January 1, 2016 to June 30, 2016, published
by INDEC.
The
curent structure of Company’s lease contracts for shopping
malls generally includes provisions that provide for payment of
variable rent based on sales of the Company’s shopping mall
tenants. Therefore, the projected cash flows for these properties
generally are highly correlated with GDP growth and inflation
rates.
Continuing
increases in the rate of inflation are likely to have an adverse
effect on our operations. Additionally, the minimum lease payments
we receive from our shopping mall tenants are generally adjusted in
accordance with the CER, an inflation index published by the
Central Bank. Although higher inflation rates in Argentina may
increase minimum lease payments, given that tenants tend to pass on
any increases in their expenses to consumers, higher inflation may
lead to an increase in the prices our tenants charge consumers for
their products and services, which may ultimately reduce their
sales volumes and consequently the portion of rent we receive based
on our tenants’ gross sales.
For the
leases of spaces at our shopping malls we use for most tenants a
standard lease agreement, the terms and conditions of which are
described below. However, our largest tenants generally negotiate
better terms for their respective leases. No assurance can be given
that lease terms will be as set forth in the standard lease
agreement.
The
rent specified in our leases generally is the higher of (i) a
monthly Base Rent and (ii) a specified percentage of the
store’s monthly gross sales, which generally ranges between
2% and 10% of such sales. In addition, pursuant to the rent
escalation clause in most of our leases, a tenant’s Base Rent
generally between increases 10% on a
semiannually
and cumulative basis from the
seventh (7
th
) month of
effectiveness of the lease. Although many of our lease agreements
contain price adjustment provisions, these are not based on an
official index nor do they reflect the inflation index. In the
event of litigation regarding these adjustment provisions, there
can be no assurance that we may be able to enforce such clauses
contained in our lease agreements. See “Item 4. Information
of the Company—Business Overview—Our Shopping
Malls—Principal Terms of our Leases.”
An
increase in our operating costs caused by higher inflation could
have a material adverse effect on us if our tenants are unable to
pay higher rent due to the increase in expenses. Moreover, the
shopping mall business is affected by consumer spending and by
prevailing economic conditions that affect potential
customers
In
addition, we measure the fair market value of our shopping malls
based upon the estimated cash flows generated by such assets which,
as discussed in previous paragraphs, is directly related to
consumer spending since a significant component of the rent payment
received from our tenants is tied to the sales realized by such
tenants (i.e is a percentage of the sales of our tenants).
Therefore, macreconomic conditions in Argentina, such as inflation,
have an impact in the fair market value of our shopping malls as
measured in Argentine pesos. Specifically, since our tenant’s
products have been adjusted (increased) to account for inflation of
the Argentine peso, our expected cash flows from our shopping malls
have similarly increased in nominal terms since rent is largely
dependent on sales of our tenants in pesos.
182
As
reflected in the chart below, the nominal fair market value of the
Company’s shopping mall properties as calculated in pesos has
increased significantly mainly due to the increasing inflation in
Argentina and the depreciation of the peso but, consequently, the
value of such properties, as measured in U.S. dollars, have
reflected lower increases or decreases in previous fiscal
years.
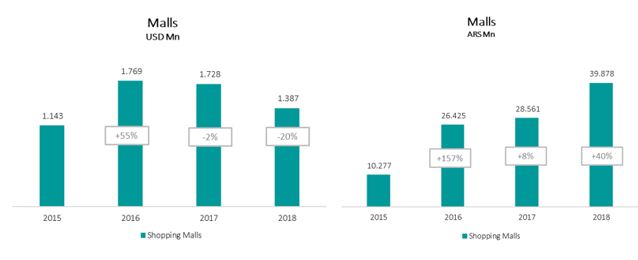
(*)
Offer exchange rate at the end of the period (Banco de la
Nación Argentina).
Seasonality
IRSA’s
shopping malls business is directly affected by seasonality,
influencing the level of IRSA’s tenants’ sales. During
Argentine summer holidays (January and February) IRSA’s
tenants’ sales typically reach are generally at their lowest
level, whereas during winter holidays (July) and in Christmas
(December) they reach their
maximum
level. Clothing retailers
generally change their collections in spring and autumn, positively
affecting IRSA’s shopping mall´s sales. Sales Discount
sales at the end of each season are also one of the main seasonal
factors affecting IRSA’s business.
In
Israel, the retail segment business´s results are subject to
seasonal fluctuations as a result of the consumption behavior of
the population proximate to the Passover holidays (March and/or
April) and Rosh Hashanah and Sukkoth holidays (September and/or
October). This also affects the balance sheet values of inventory,
customers and suppliers. Revenues from cellular services are
usually affected by seasonality, with the third calendar quarter of
the each year characterized by higher roaming revenues due to
increased incoming and outgoing tourism.
In
2018, the Passover holiday fell at the beggining of April, compared
to 2017 when it was at the middle of April. The timing of the
holiday affects Shufersal’s sales and special offers in the
second quarter of 2018, compared to last year. The Passover holiday
in the second quarter of 2018 had a smaller effect on
Shufersal’s results than in the corresponding quarter in
2017, therefore analysis of the results for the first half of the
year compared to the corresponding period in 2017 better represents
the changes between the periods.
Effects
of interest rate fluctuations
Most of
our U.S. dollar denominated debt accrues interest at a fixed rate.
An increase in interest rates will not necessary result in a
significant increase in our financing costs and may not materially
affect our financial condition or our results of
operations.
In
addition, a significant increase of interest rates could
deteriorate the terms and conditions in which our tenants obtain
financing from banks and financial institutions in the market. As a
consequence of that, if they suffer liquidity problems the
collection of our lease contracts could be affected by an increase
in the level of delinquency
Effects
of foreign currency fluctuations
A
significant portion of our financial debt is denominated in U.S.
dollars. Therefore, a devaluation or depreciation of the Peso
against the U.S. dollar would increase our indebtedness measured in
Pesos and materially affect our results of operations. Foreign
currency exchange rate fluctuations significantly increase the risk
of default on our lease receivables. Foreign currency exchange
restrictions that may be imposed by the Argentine government could
prevent or restrict our access to U.S. dollars, affecting our
ability to service our U.S. dollar-denominated
liabilities.
As
discussed above, we calculate the fair market value of our office
properties based on comparable sales transactions. Typically real
estate transactions in Argentina are transacted in U.S. dollars.
Therefore, a devaluation or depreciation of the Peso against the
U.S. dollar would increase the value of our real estate properties
measured in Pesos and an appreciation of the Peso would have the
opposite effect.
183

(*) Bid
exchange rate at end of period (Banco de la Nación
Argentina).
(**) FY
2015: Exchange Rate: Contado con Liquidacion –implicit
exchange rate given by the price is Pesos of a stock listed in
Buenos Aires and ADRs traded in New York. Sales offices: 95,005 GLA
(fy15) vs 79,048 GLA (fy16).
The
Argentine economy has experienced significant volatility in recent
decades, characterized by periods of low or negative GDP growth,
high rates of inflation and currency depreciation. Historically,
the public in Argentina has resorted to investing in real estate
assets to protect against currency depreciation and/or to protect
savings. Real estate transactions in Argentina, and in particular,
those involving office buildings and undeveloped land, have
historically been priced in U.S. dollars and transacted in U.S.
dollars or its peso equivalent at the exchange rate on the closing
date of the transaction. Even in the inflationary context, prices
in U.S. dollars for these real estate assets have generally
remained stable and even appreciated at rates that have outpaced
inflation. A significant depreciation or devaluation of the peso
against the U.S. dollar would increase the value of the Company`s
portfolio as measured in pesos. An appreciation of the peso against
the U.S. dollar would have the opposite effect.
After
several years of moderate inflation and variations in the nominal
exchange rate, in fiscal year 2013 the peso depreciated
approximately 32.5% against the U.S. dollar and 30.3% in fiscal
year 2014, including depreciation of approximately 21.6% in the
month of January 2014 alone. In fiscal year 2015, the peso
depreciated 52.7% against the dollar with a 33% depreciation in the
last weeks of December 2015 alone. During fiscal 2016, 2017 and
fiscal 2018, the Peso depreciated against the U.S. dollar by
approximately 65.9%, 10.6% and 73.3%, respectively, which caused an
impact on the comparability of our results of operations for the
year ended June 30, 2018 to our results of operations for the year
ended June 30, 2017 and for the year ended June 30, 2017 to our
results of operations for the year ended June 30, 2016, primarily
in our revenues from office rentals, the changes in fair value of
investment property and our net assets and liabilities denominated
in foreign currency. Likewise, during the third quarter of 2018 the
U.S. dollar to peso exchange rate increased approximately 27.7%,
from Ps.28.85 at the end of the second quarter of 2018 to Ps.36.85
as of August 30, 2018, and an increase of 27.5% as of the date of
this Annual Report, reaching Ps.36.79 as of October 25, 2018. The
accumulated depreciation of the Peso since the beginning of the
year 2018 and as of the date of this annual report reached 99.8%.
The depreciation of the Peso affected our assets and liabilities
denominated in foreign currency, as reflected in “financial
results, net” in our consolidated statement of comprehensive
income.
During
fiscal year 2018, Israeli New Shekel depreciated against the U.S.
dollar by approximately (4.8)%, while during fiscal year 2017 that
currency appreciated by 9.6%, which caused an impact on the
comparability of our results of IDBD´s operations for the year
ended June 30, 2018 to IDBD´s results of operations for the
year ended June 30, 2017. As of June 30, 2018, the offer exchange
rate was NIS 3.6594 per US$1.00, and NIS 3.6994 per US$1.00 on
October 25, 2018. For more information about the exchange rates,
see “Local Exchange Market and Exchange
Rates.”
Fluctuations in the market value of our investment properties as a
result of revaluations
Currently, our
interests in investment properties are revalued quarterly. Any
increase or decrease in the fair value of our investment
properties, based on appraisal reports commissioned from
independent appraisers, is recorded in our consolidated statement
of comprehensive income for the period during which revaluation
occurs as a net increase or decrease in the fair value of the
properties. The revaluation of our properties may therefore result
in significant fluctuations in the results of our
operations.
Property values are
affected by, among other factors, supply and demand of comparable
properties, the rate of economic or GDP growth in Argentina and in
particular in the provinces or regions in which our properties are
located, any asset enhancement initiatives or improvements
undertaken, prevailing interest rates, foreign exchange rates and
rates of inflation at the time of the appraisal, and political and
economic developments. For example, during the 2016 fiscal year,
there was a 65.5% depreciation of the Peso from Ps.9.088 to US$1.00
as of June 30, 2015 to Ps.15.04 to US$1.00 as of June 30,
2016, during the 2017 fiscal year, there was a 10.6% depreciation
of the Peso from Ps.15.04 to US$1.00 as of June 30, 2016 to
Ps.16.63 to US$1.00 as of June 30, 2017, and during the 2018 fiscal
year, there was a 74% depreciation of the Peso from Ps.16.63 yo
US$1.00 as of June 30, 2017 to Ps.28.85 to US$1.00 as of June 30,
2018, which had a significant impact on the
revaluation of
investment properties for fiscal years 2016 and 2018. The value of
the Company investment properties is determined in U.S. dollar
pursuant to the methodologies further described in “Critical
Accounting Policies and estimates” and then determined in
pesos (the Company functional and presentation currency). Retail
property markets have historically been cyclical and future
cyclical changes may result in fluctuations in the fair value of
our properties and adversely affect our financial condition and
results of operations.
Our results of
operations may be affected by foreign currency fluctuations and the
inflation in Argentina. For more information see
“—Effects of inflation” and “—Effects
of foreign currency
fluctuations.”
184
Factors
Affecting Comparability of our Results
Comparability
of information
Acquisition of IDBD
As
required by IFRS 3, the information of IDBD is included in our
consolidated financial statements of the Company as of October 11,
2015, and the prior periods are not modified by such
acquisitionsituation. Therefore, the consolidated financial
information for periods after the acquisition is not comparative
with prior periods. Additionally, results for the fiscal year ended
June 30, 2018 and 2017 includes financial information of IDBD for
the twelve full months of results ended March 31 of those years,
while results for the fiscal year ended June 30, 2016 includes the
results from IDBD for the period beginning October 11, 2015 through
March 31, 2016; adjusted for significant transactions that took
place between April 1
and June 30.
Hence, the result for suchreported periods are not
comparable.
The
balances as of June 30, 2017 and 2016, which are disclosed for
comparative porpoises arise from the Consolidated Financial
Statements as of June 30, 2017. Certain items from prior fiscal
years have been reclassified for consistency purposes, mainly due
to the loss of control of Shufersal which now is presented as a
discontinued operation.
Critical
Accounting Policies and Estimates.
Our
Audited Consolidated Financial Statements are prepared in
accordance with IFRSs as issued by the IASB, and the accounting
policies employed are set out in our Accounting Policies section in
the financial statements. In applying these policies, we make
estimates and assumptions that affect the reported amounts of
assets and liabilities and disclosure of contingent assets and
liabilities. The actual outcome could differ from those estimates.
Some of these policies require a high level of judgment because the
areas are especially subjective or complex.
The
discussion below should also be read in conjunction with our
disclosure of significant IFRS accounting policies, which is
provided in Note 2 to our Audited Consolidated Financial
Statements, “Summary of significant accounting
policies”.
Not all
of these significant accounting policies require management to make
subjective or complex judgments or estimates. The following is
intended to provide an understanding of the policies that
management considers critical because of the level of complexity,
judgment or estimations involved in their application and their
impact on the Consolidated Financial Statements. These judgments
involve assumptions or estimates in respect of future events.
Actual results may differ from these estimates.
185
|
Estimation
|
Main assumptions
|
Potential implications
|
|
Business
combination - Allocation of acquisition prices
|
Assumptions
regarding timing, amount of future revenues and expenses, revenue
growth, expected rate of return, economic conditions, discount
rate, among other.
|
Should
the assumptions made be inaccurate, the recognized combination may
not be correct.
|
|
Recoverable
amounts of cash-generating units (even those including goodwill),
associates and assets.
|
The
discount rate and the expected growth rate before taxes in
connection with cash-generating units.
The
discount rate and the expected growth rate after taxes in
connection with associates.
Cash
flows are determined based on past experiences with the asset or
with similar assets and in accordance with the Group’s best
factual assumption relative to the economic conditions expected to
prevail.
Business
continuity of cash-generating units.
Appraisals
made by external appraisers and valuators with relation to the
assets’ fair value, net of realization costs (including real
estate assets).
|
Should
any of the assumptions made be inaccurate, this could lead to
differences in the recoverable values of cash-generating
units.
|
|
Control,
joint control or significant influence
|
Judgment
relative to the determination that the Group holds an interest in
the shares of investees (considering the existence and influence of
significant potential voting rights), its right to designate
members in the executive management of such companies (usually the
Board of directors) based on the investees’ bylaws; the
composition and the rights of other shareholders of such investees
and their capacity to establish operating and financial policies
for investees or to take part in the establishment
thereof.
|
Accounting
treatment of investments as subsidiaries (consolidation) or
associates (equity method)
|
|
Estimated
useful life of intangible assets and property, plant and
equipment
|
Estimated
useful life of assets based on their conditions.
|
Recognition
of accelerated or decelerated depreciation by comparison against
final actual earnings (losses).
|
|
Fair
value valuation of investment properties
|
Fair
value valuation made by external appraisers and valuators. See Note
10.
|
Incorrect
valuation of investment property values
|
|
Income
tax expenses
|
The
Group estimates the income tax amount payable for transactions
where the Treasury’s Claim cannot be clearly
determined.
Additionally,
the Group evaluates the recoverability of assets due to deferred
taxes considering whether some or all of the assets will not be
recoverable.
|
Upon
the improper determination of the provision for income tax, the
Group will be bound to pay additional taxes, including fines and
compensatory and punitive interest.
|
|
Allowance
for doubtful accounts
|
A
periodic review is conducted of receivables risks in the
Group’s clients’ portfolios. Bad debts based on the
expiration of account receivables and account receivables’
specific conditions.
|
Improper
recognition of charges / reimbursements of the allowance for bad
debt.
|
|
Level 2
and 3 financial instruments
|
Main
assumptions used by the Group are:
●
Discounted
projected income by interest rate
●
Values determined
in accordance with the shares in equity funds on the basis of its
Financial Statements, based on fair value or investment
assessments.
●
Comparable market
multiple (EV/GMV ratio).
●
Underlying
asset price (Market price); share price volatility (historical) and
market interest-rate (Libor rate curve).
|
Incorrect
recognition of a charge to income / (loss).
|
|
Probability
estimate of contingent liabilities.
|
Whether
more economic resources may be spent in relation to litigation
against the Group; such estimate is based on legal advisors’
opinions.
|
Charge
/ reversal of provision in relation to a claim.
|
|
Qualitative
considerations for determining whether or not the replacement of
the debt instrument involves significantly different
terms
|
The
entire set of characteristics of the exchanged debt instruments,
and the economic parameters represented therein:
Average
lifetime of the exchanged liabilities; Extent of effects of the
debt terms (linkage to index; foreign currency; variable interest)
on the cash flows from the instruments.
|
Classification
of a debt instrument in a manner whereby it will not reflect the
change in the debt terms, which will affect the method of
accounting recording.
|
|
Biological
assets
|
Main
assumptions used in valuation are: yields, operating costs, selling
expenses, future of sales prices, discount rate.
|
Wrong
recognition/valuation of biological assets. See sensitivities
modeled on these parameters in Note 13.
|
Business
Segment Information
IFRS 8
requires an entity to report financial and descriptive information
about its reportable segments, which are operating segments or
aggregations of operating segments that meet specified criteria.
Operating segments are components of an entity about which separate
financial information is available that is evaluated regularly by
the CODM. According to IFRS 8, the CODM represents a function
whereby strategic decisions are made and resources are assigned.
The CODM function is carried out by the President of the Group, Mr.
Eduardo S. Elsztain. In addition, two responsibility levels have
been established for resource allocation and assessment of results
of the two operations centers, through executive committees in
Argentina and Israel.
Segment
information is reported from the perspective of products and
services: (i) agricultural business and (ii) urban properties and
investment business. In addition, this last segment is reported
divided from the geographic point of view in two Operations Centers
to manage its global interests: Argentina and Israel. Within each
operations center, the Group considers separately the various
activities being developed, which represent reporting operating
segments given the nature of its products, services, operations and
risks. Management believes the operating segment clustering in each
operations center reflects similar economic characteristics in each
region, as well as similar products and services offered, types of
clients and regulatory environments.
186
As from
fiscal year 2018 the CODM reviews the operating income/loss of each
business excluding the amounts related to management fees, being
such amount reviewed at an aggregate level outside each business.
Additionally, the CODM reviews certain corporate expenses
associated with each business in an aggregate manner and separately
from each of the segments, such expenses have been disclosed in the
"Corporate" segment of each operation center. Segment information
for the years 2017 and 2016 has been recast for the purposes of
comparability with the present year.
Agricultural
business:
In the
third quarter of the fiscal year 2018, we have changed the
presentation of the agricultural business segments which are
reviewed by the CODM for a better alignment with the current
business vision and the metrics used to such end. Four operating
segments (crops, cattle, dairy and sugarcane) have been aggregated
into a single operating segment named “Agricultural
production”. Management consider for the aggregation the
nature of the production processes (growing of biological assets),
the methods used to distribute their products and the nature of the
regulatory environment (agricultural business). Therefore this
quarter three segments are considered:
The
"Agricultural production"
segment consists of planting, harvesting and sale of crops as
wheat, corn, soybeans, cotton and sunflowers; the sale of grain
derivatives, such as flour and oil, breeding, purchasing and/or
fattening of free-range cattle for sale to meat processors and
local livestock auction markets.; agricultural services; leasing of
the Group's farms to third parties; and planting, harvesting and
sale of sugarcane.
The
“Land transformation and
sales”
segment comprises gains from the disposal and
development of farmlands activities
The
"Other”
segment
includes, principally, slaughtering and processing in the meat
refrigeration plant; and brokerage activities, among
others.
The
“Corporate”
segment includes corporate expenses related to agricultural
business.
The
amounts corresponding to the fiscal year ended June 30, 2017 and
2016, have been retroactively adjusted to reflect changes in
segment information.
Urban
properties and investments business:
Operations Center in Argentina
Within
this center, IRSA operates in the following segments:
The
“Shopping Malls”
segment includes results principally comprised of lease and service
revenues related to rental of commercial space and other spaces in
the shopping malls of the Company.
The
“Offices”
segment includes the operating results from lease revenues of
offices, other rental spaces and other service revenues related to
the office activities.
The
“Sales and
Developments”
segment includes the operating results
of the development, maintenance and sales of undeveloped parcels of
land and/or trading properties. Real estate sales results are also
included.
The
“Hotels”
segment
includes the operating results mainly comprised of room, catering
and restaurant revenues.
The
“International”
segment assets and operating profit or loss from business related
to associates Condor (hotels) and Lipstick (offices).
The
“Others”
segment
primarily includes the entertainment activities through La Arena
S.A. and La Rural S.A. and the financial activities carried out by
BHSA and Tarshop.
The
“Corporate”
segment primarily includes the expenses related to the corporate
activities of the Operations Center in Argentina
.
As of
fiscal year 2018, the CODM also reviews the office business as a
single segment and the entertainment business in an aggregate and
separate manner from offices, including that concept in the
"Others" segment. Segment information for years 2017 and 2016 has
been recast for the purposes of comparability with the present
year.
The
CODM periodically reviews the results and certain asset categories
and assesses performance of operating segments of this operations
center based on a measure of profit or loss of the segment composed
by the operating income plus the share of profit / (loss) of joint
ventures and associates. The valuation criteria used in preparing
this information are consistent with IFRS standards used for the
preparation of the Consolidated Financial Statements, except for
the following:
●
Operating results from joint
ventures are evaluated by the CODM applying proportional
consolidation method. Under this method the profit/loss generated
and assets are reported in the Statement of Income line-by-line
based on the percentage held in joint ventures rather than in a
single item as required by IFRS. Management believes that the
proportional consolidation method provides more useful information
to understand the business return. On the other hand, the
investment in the joint venture La Rural S.A. is accounted for
under the equity method since this method is considered to provide
more accurate information in this case.
187
●
Operating results from Shopping Malls and Offices segments do not
include the amounts pertaining to building administration expenses
and collective promotion funds (“FPC”, as per its
Spanish acronym) as well as total recovered costs, whether by way
of expenses or other concepts included under financial results (for
example default interest and other concepts). The CODM examines the
net amount from these items (total surplus or deficit between
building administration expenses and FPC and recoverable
expenses).
Revenues for each
reporting segments derive from a large and diverse client base and,
therefore, there is no revenue concentration in any particular
segment.
Operations Center in Israel
Within
this center, IRSA operates in the following segments:
The
“Real Estate”
segment through PBC, the Company operates rental properties and
residential properties in Israel, USA and other parts of the world
and carries out commercial projects in Las Vegas, USA.
The
“Supermarkets”
segment includes assets and operating income derived from the
business related to the subsidiary Shufersal. Through Shufersal,
the Group mainly operates a supermarket chain in
Israel.
The
“Telecommunications”
segment
includes Cellcom whose main activities include the provision of
mobile phone services, fixed line phone services, data and
Internet, among others.
The
"Insurance"
segment includes
the investment in Clal, insurance company which main activities
includes pension and social security insurance, among others. As
stated in Note 18, the Group does not have control over Clal;
therefore, the business is reported in a single line as a financial
asset held for sale and valued at fair value.
The
"Others"
segment includes
other diverse business activities, such as technological
developments, tourism, oil and gas assets, electronics, and
others.
The
"Corporate"
segment includes
the expenses related with the activities of the holding
companies.
The
CODM periodically reviews the results and certain asset categories
and assesses performance of operating segments of this operations
center based on a measure of profit or loss of the segment composed
by the operating income plus the share of profit / (loss) of
associates and joint ventures. The valuation criteria used in
preparing this information are consistent with IFRS standards used
for the preparation of the Consolidated Financial
Statements.
As
indicated under Note 2 of Consolidated Financial Statements, the
Company consolidates results derived from its operations center in
Israel with a three-month lag, adjusted for the effects of
significant transactions. Hence, IDBD’s results for the
period extending from October 11, 2015 (acquisition date) through
March 31, 2016 are included under comprehensive income of the Group
for the fiscal year ended June 30, 2016. For the fiscal years ended
June 30, 2018 and 2017, a full twelve-month period is consolidated,
also with a three-month lag and adjusted for the effects of
significant transactions.
Goods
and services exchanged between segments are calculated on the basis
of established prices. Intercompany transactions between segments,
if any, are eliminated.
Within
the agricultural business, most revenue from its operating segments
are generated from, and their assets are located in Argentina and
Brazil, mainly
Within
the Operations Center in Argentina, most revenue from its operating
segments is derived from, and their assets are located in,
Argentina, except for the share of profit / (loss) of associates
included in the “International” segment located in
USA.
Within
the urban properties and investment business in the operations
center in Israel, most revenue from its operating segments are
derived from and their assets are located in Israel, except for
certain earnings from the Real Estate segment which are generated
from activities outside Israel, mainly in USA.
Within
the agricultural business and the urban properties and investments
business from the operations center in Argentina, the assets
categories reviewed by the CODM are: investment properties,
property, plant and equipment, trading properties, inventories,
biological assets, right to receive future units under barter
agreements, investment in joint ventures and associates and
goodwill. The aggregate of these assets, classified by business
segment, are disclosed as “segment assets”. Assets are
allocated to each segment based on the operations and/or their
physical location.
188
Below is a
summarized analysis of the lines of business of the Company for the
year ended June 30, 2018:
|
|
Agricultural
business
|
Urban
properties and investments business
|
Total
|
||
|
|
|
Operations
Center in Argentina
|
Operations
Center in
Israel
|
Subtotal
|
|
|
|
|
|
(in
million of Ps.)
|
|
|
|
Revenues
|
6,081
|
5,308
|
86,580
|
91,888
|
97,969
|
|
Costs
|
(5,210
)
|
(1,067
)
|
(61,395
)
|
(62,462
)
|
(67,672
)
|
|
Initial recognition
and changes in the fair value of biological assets and agricultural
produce at the point of harvest
|
926
|
-
|
-
|
-
|
926
|
|
Changes in the net
realizable value of agricultural produce after harvest
|
303
|
-
|
-
|
-
|
303
|
|
Gross
profit
|
2,100
|
4,241
|
25,185
|
29,426
|
31,526
|
|
Gain from disposal
of farmlands
|
906
|
-
|
-
|
-
|
906
|
|
Net gain from fair
value of investment properties
|
96
|
21,275
|
2,160
|
23,435
|
23,531
|
|
General and
administrative expenses
|
(546
)
|
(903
)
|
(3,870
)
|
(4,773
)
|
(5,319
)
|
|
Selling
expenses
|
(649
)
|
(432
)
|
(16,986
)
|
(17,418
)
|
(18,067
)
|
|
Other operating
results, net
|
567
|
(78
)
|
467
|
389
|
956
|
|
Management
fees
|
-
|
-
|
-
|
-
|
-
|
|
Profit
from operations
|
2,474
|
24,103
|
6,956
|
31,059
|
33,533
|
|
Share of profit /
(loss) of joint ventures and associates
|
23
|
(1,269
)
|
(43
)
|
(1,312
)
|
(1,289
)
|
|
Segment
profit
|
2,497
|
22,834
|
6,913
|
29,747
|
32,244
|
|
|
|
|
|
|
|
|
Reportable
assets
|
11,762
|
66,472
|
266,802
|
333,274
|
345,036
|
|
Reportable
liabilities
|
-
|
-
|
(215,452
)
|
(215,452
)
|
(215,452
)
|
|
Net
reportable assets
|
11,762
|
66,472
|
51,350
|
117,822
|
129,584
|
Below
is a summarized analysis of the lines of business of the Company
for the year ended June 30, 2017:
|
|
Agricultural
business
|
Urban
properties and investments business
|
Total
|
||
|
|
|
Operations
Center in Argentina
|
Operations
Center in
Israel
|
Subtotal
|
|
|
|
|
|
(in
million of Ps.)
|
|
|
|
Revenues
|
3,915
|
4,311
|
68,422
|
72,733
|
76,648
|
|
Costs
|
(3,395
)
|
(910
)
|
(49,110
)
|
(50,020
)
|
(53,415
)
|
|
Initial recognition
and changes in the fair value of biological assets and agricultural
produce at the point of harvest
|
127
|
-
|
-
|
-
|
127
|
|
Changes in the net
realizable value of agricultural produce after harvest
|
(74
)
|
-
|
-
|
-
|
(74
)
|
|
Gross
profit
|
573
|
3,401
|
19,312
|
22,713
|
23,286
|
|
Net gain from fair
value of investment properties
|
331
|
4,489
|
374
|
4,863
|
5,194
|
|
Gain from disposal
of farmlands
|
280
|
-
|
-
|
-
|
280
|
|
General and
administrative expenses
|
(411
)
|
(683
)
|
(3,173
)
|
(3,856
)
|
(4,267
)
|
|
Selling
expenses
|
(500
)
|
(355
)
|
(13,093
)
|
(13,448
)
|
(13,948
)
|
|
Other operating
results, net
|
75
|
(68
)
|
(196
)
|
(264
)
|
(189
)
|
|
Management
fees
|
-
|
-
|
-
|
-
|
-
|
|
Profit
from operations
|
348
|
6,784
|
3,224
|
10,008
|
10,356
|
|
Share of profit /
(loss) of joint ventures and associates
|
8
|
(94
)
|
105
|
11
|
19
|
|
Segment
profit
|
356
|
6,690
|
3,329
|
10,019
|
10,375
|
|
|
|
|
|
|
|
|
Reportable
assets
|
7,013
|
44,914
|
178,964
|
223,878
|
230,891
|
|
Reportable
liabilities
|
-
|
-
|
(155,235
)
|
(155,235
)
|
(155,235
)
|
|
Net
reportable assets
|
7,013
|
44,914
|
23,729
|
68,643
|
75,656
|
189
Below
is a summarized analysis of the lines of business of the Company
for the year ended June 30, 2016:
|
|
Agricultural
business
|
Urban
properties and investments business
|
Total
|
||
|
|
|
Operations
Center in Argentina
|
Operations
Center in
Israel
|
Subtotal
|
|
|
|
(in
millions of Ps.)
|
||||
|
Revenues
|
2,909
|
3,284
|
27,077
|
30,361
|
33,270
|
|
Costs
|
(2,493
)
|
(659
)
|
(19,252
)
|
(19,911
)
|
(22,404
)
|
|
Initial recognition
and changes in the fair value of biological assets and agricultural
produce at the point of harvest
|
376
|
-
|
-
|
-
|
376
|
|
Changes in the net
realizable value of agricultural produce after harvest
|
208
|
-
|
-
|
-
|
208
|
|
Gross
profit
|
1,000
|
2,625
|
7,825
|
10,450
|
11,450
|
|
Net gain from fair
value of investment properties
|
22
|
18,167
|
(271
)
|
17,896
|
17,918
|
|
Loss from disposal
of farmlands
|
(2
)
|
-
|
-
|
-
|
(2
)
|
|
General and
administrative expenses
|
(315
)
|
(487
)
|
(1,360
)
|
(1,847
)
|
(2,162
)
|
|
Selling
expenses
|
(338
)
|
(264
)
|
(5,442
)
|
(5,706
)
|
(6,044
)
|
|
Other operating
results, net
|
(80
)
|
(12
)
|
(32
)
|
(44
)
|
(124
)
|
|
Management
fees
|
-
|
-
|
-
|
-
|
-
|
|
Profit
from operations
|
287
|
20,029
|
720
|
20,749
|
21,036
|
|
Share of profit /
(loss) of joint ventures and associates
|
23
|
126
|
123
|
249
|
272
|
|
Segment
profit
|
310
|
20,155
|
843
|
20,998
|
21,308
|
|
|
|
|
|
|
|
|
Reportable
assets
|
5,136
|
39,107
|
147,470
|
186,577
|
191,713
|
|
Reportable
liabilities
|
-
|
-
|
(132,989
)
|
(132,989
)
|
(132,989
)
|
|
Net
reportable assets
|
5,136
|
39,107
|
14,481
|
53,588
|
58,724
|
Agriculture line of business:
The
following tables present the reportable segments of the agriculture
line of business:
|
|
June
30, 2018
|
||||
|
|
Agricultural
production
|
Land
transformation
and
sales
|
Corporate
|
Others
|
Total
Agricultural
business
(i)
|
|
|
(in
millions of Ps.)
|
||||
|
Revenues
|
3,603
|
-
|
-
|
2,478
|
6,081
|
|
Costs
|
(2,930
)
|
(12
)
|
-
|
(2,268
)
|
(5,210
)
|
|
Initial recognition
and changes in the fair value of biological assets and agricultural
produce at the point of harvest
|
926
|
-
|
-
|
-
|
926
|
|
Changes in the net
realizable value of agricultural produce
after
harvest
|
303
|
-
|
-
|
-
|
303
|
|
Gross
profit / (loss)
|
1,902
|
(12
)
|
-
|
210
|
2,100
|
|
Gain from disposal
of farmlands
|
-
|
906
|
-
|
-
|
906
|
|
Net gain from fair
value of investment properties
|
-
|
96
|
-
|
-
|
96
|
|
General and
administrative expenses
|
(348
)
|
(1
)
|
(89
)
|
(108
)
|
(546
)
|
|
Selling
expenses
|
(468
)
|
-
|
-
|
(181
)
|
(649
)
|
|
Other operating
results, net
|
18
|
511
|
-
|
38
|
567
|
|
Management
fees
|
-
|
-
|
-
|
-
|
-
|
|
Profit
/ (Loss) from operations
|
1,104
|
1,500
|
(89
)
|
(41
)
|
2,474
|
|
Share of profit /
(loss) of associates
|
24
|
-
|
-
|
(1
)
|
23
|
|
Segment
profit / (loss)
|
1,128
|
1,500
|
(89
)
|
(42
)
|
2,497
|
|
|
|
|
|
|
|
|
Investment
properties
|
923
|
-
|
-
|
-
|
923
|
|
Property, plant and
equipment
|
7,093
|
18
|
-
|
117
|
7,228
|
|
Investments in
associates
|
39
|
-
|
-
|
44
|
83
|
|
Other reportable
assets
|
3,167
|
-
|
-
|
361
|
3,528
|
|
Total
segment assets (ii)
|
11,222
|
18
|
-
|
522
|
11,762
|
(i) From all of the
Company’s revenues corresponding to Agricultural Business,
Ps.4,451 million are originated in Argentina and Ps.1,630 million
in other countries, principally in Brazil for Ps.1,494
million.
190
(ii)
From all of the
Company’s assets included in the segment corresponding to
Agricultural Business, Ps.3,208 million are located in Argentina
and Ps.8,554 million in other countries, principally in Brazil for
Ps.7,703 million.
|
|
June
30, 2017
|
||||
|
|
Agricultural
production
|
Land
transformation
and
sales
|
Corporate
|
Others
|
Total
Agricultural
business
(i)
|
|
|
(in
millions of Ps.)
|
||||
|
Revenues
|
2,197
|
-
|
-
|
1,718
|
3,915
|
|
Costs
|
(1,810
)
|
(11
)
|
-
|
(1,574
)
|
(3,395
)
|
|
Initial recognition
and changes in the fair value of biological assets and agricultural
produce at the point of harvest
|
127
|
-
|
-
|
-
|
127
|
|
Changes in the net
realizable value of agricultural produce
after
harvest
|
(74
)
|
-
|
-
|
-
|
(74
)
|
|
Gross
profit / (loss)
|
440
|
(11
)
|
-
|
144
|
573
|
|
Net gain from fair
value of investment properties
|
-
|
331
|
-
|
-
|
331
|
|
Gain from disposal
of farmlands
|
-
|
280
|
-
|
-
|
280
|
|
General and
administrative expenses
|
(254
)
|
(1
)
|
(84
)
|
(72
)
|
(411
)
|
|
Selling
expenses
|
(370
)
|
-
|
-
|
(130
)
|
(500
)
|
|
Other operating
results, net
|
70
|
-
|
-
|
5
|
75
|
|
Management
fees
|
-
|
-
|
-
|
-
|
-
|
|
Profit
/ (Loss) from operations
|
(114
)
|
599
|
(84
)
|
(53
)
|
348
|
|
Share of profit /
(loss) of associates
|
12
|
-
|
-
|
(4
)
|
8
|
|
Segment
profit / (loss)
|
(102
)
|
599
|
(84
)
|
(57
)
|
356
|
|
|
|
|
|
|
|
|
Investment
properties
|
304
|
-
|
-
|
-
|
304
|
|
Property, plant and
equipment
|
4,531
|
12
|
-
|
97
|
4,640
|
|
Investments in
associates
|
45
|
-
|
-
|
4
|
49
|
|
Other reportable
assets
|
1,780
|
-
|
-
|
240
|
2,020
|
|
Total
segment assets (ii)
|
6,660
|
12
|
-
|
341
|
7,013
|
(i) From all of the
Company’s revenues corresponding to Agricultural Business,
Ps.3,035 million are originated in Argentina and Ps.880 million in
other countries, principally in Brazil for Ps.742
million.
(ii) From all of
the Company’s assets included in the segment corresponding to
Agricultural Business, Ps.2,554 million are located in Argentina
and Ps.4,459 million in other countries, principally in Brazil for
Ps.3,351million.
|
|
June
30, 2016
|
||||
|
|
Agricultural
production
|
Land
transformation
and
sales
|
Corporate
|
Others
|
Total
Agricultural
business
(i)
|
|
|
(in
millions of Ps.)
|
||||
|
Revenues
|
1,765
|
-
|
-
|
1,144
|
2,909
|
|
Costs
|
(1,419
)
|
(9
)
|
-
|
(1,065
)
|
(2,493
)
|
|
Initial recognition
and changes in the fair value of biological assets and agricultural
produce at the point of harvest
|
376
|
-
|
-
|
-
|
376
|
|
Changes in the net
realizable value of agricultural produce
after
harvest
|
208
|
-
|
-
|
-
|
208
|
|
Gross
profit / (loss)
|
930
|
(9
)
|
-
|
79
|
1,000
|
|
Net gain from fair
value of investment properties
|
-
|
22
|
-
|
-
|
22
|
|
Loss from disposal
of farmlands
|
-
|
(2
)
|
-
|
-
|
(2
)
|
|
General and
administrative expenses
|
(185
)
|
(1
)
|
(76
)
|
(53
)
|
(315
)
|
|
Selling
expenses
|
(248
)
|
-
|
-
|
(90
)
|
(338
)
|
|
Other operating
results, net
|
(82
)
|
-
|
-
|
2
|
(80
)
|
|
Management
fees
|
-
|
-
|
-
|
-
|
-
|
|
Profit
/ (Loss) from operations
|
415
|
10
|
(76
)
|
(62
)
|
287
|
|
Share of profit /
(loss) of associates
|
26
|
-
|
-
|
(3
)
|
23
|
|
Segment
profit / (loss)
|
441
|
10
|
(76
)
|
(65
)
|
310
|
|
|
|
|
|
|
|
|
Investment
properties
|
103
|
-
|
-
|
-
|
103
|
|
Property, plant and
equipment
|
3,187
|
18
|
-
|
42
|
3,247
|
|
Investments in
associates
|
54
|
-
|
-
|
-
|
54
|
|
Other reportable
assets
|
1,570
|
-
|
-
|
162
|
1,732
|
|
Total
segment assets (ii)
|
4,914
|
18
|
-
|
204
|
5,136
|
(i) From all of the
Company’s revenues corresponding to Agricultural Business,
Ps.2,209 million are originated in Argentina and Ps.700 million in
other countries, principally in Brazil for Ps.502
million.
191
(ii)
From all of the
Company’s assets included in the segment corresponding to
Agricultural Business, Ps.2,344 million are located in Argentina
and Ps.2,792 million in other countries, principally in Brazil for
Ps.1,716 million.
Urban properties line of business and investments
The
following tables present the reportable segments from the
Operations Center in Argentina:
|
|
June
30, 2018
|
|||||||
|
|
Shopping
Malls
|
Offices
|
Sales
and developments
|
Hotels
|
International
|
Corporate
|
Others
|
Total
|
|
|
(in
millions of Ps.)
|
|||||||
|
Revenues
(i)
|
3,665
|
532
|
120
|
973
|
-
|
-
|
18
|
5,308
|
|
Costs
|
(330
)
|
(46
)
|
(44
)
|
(624
)
|
-
|
-
|
(23
)
|
(1,067
)
|
|
Gross
profit / (loss)
|
3,335
|
486
|
76
|
349
|
-
|
-
|
(5
)
|
4,241
|
|
Net gain from fair
value of investment properties
|
11,340
|
4,932
|
4,771
|
-
|
-
|
-
|
232
|
21,275
|
|
General and
administrative expenses
|
(320
)
|
(87
)
|
(78
)
|
(193
)
|
(46
)
|
(151
)
|
(28
)
|
(903
)
|
|
Selling
expenses
|
(238
)
|
(57
)
|
(21
)
|
(114
)
|
-
|
-
|
(2
)
|
(432
)
|
|
Other operating
results, net
|
(57
)
|
(4
)
|
11
|
(17
)
|
(23
)
|
-
|
12
|
(78
)
|
|
Management
fees
|
-
|
-
|
-
|
-
|
-
|
-
|
-
|
-
|
|
Profit
/ (Loss) from operations
|
14,060
|
5,270
|
4,759
|
25
|
(69
)
|
(151
)
|
209
|
24,103
|
|
Share of profit /
(loss) of associates and joint ventures (**)
|
-
|
-
|
26
|
-
|
(1,923
)
|
-
|
628
|
(1,269
)
|
|
Segment
profit / (loss)
|
14,060
|
5,270
|
4,785
|
25
|
(1,992
)
|
(151
)
|
837
|
22,834
|
|
|
|
|
|
|
|
|
|
|
|
Investment
properties
|
40,468
|
13,133
|
10,670
|
-
|
-
|
-
|
625
|
64,896
|
|
Property, plant and
equipment
|
56
|
33
|
-
|
171
|
89
|
-
|
-
|
349
|
|
Investment in ) of
associates and joint ventures (*)
|
-
|
-
|
163
|
-
|
(1,740
)
|
-
|
2,595
|
1,018
|
|
Other reportable
assets
|
33
|
13
|
51
|
12
|
-
|
-
|
100
|
209
|
|
Total
segment assets (ii)
|
40,557
|
13,179
|
10,884
|
183
|
(1,651
)
|
-
|
3,320
|
66,472
|
(*)
Includes the investments in Condor for Ps.697 million and New
Lipstick for Ps.(2,437) million.
(**)
Includes the results of New Lipstick for Ps.(2,380)
million.
(i) From all the
revenues corresponding to the Operations Center in Argentina, the
100% are originated in Argentina. No external client represents 10%
or more of revenue of any of the reportable segments.
(ii) From all of
the assets corresponding to the Operations Center in Argentina
segments, Ps.68,123 million are located in Argentina and Ps.(1,651)
million in other countries, principally in USA for Ps.(1,653)
million and Uruguay for Ps.2 million.
|
|
June
30, 2017
|
|||||||
|
|
Shopping
Malls
|
Offices
|
Sales
and developments
|
Hotels
|
International
|
Corporate
|
Others
|
Total
|
|
|
(in
millions of Ps.)
|
|||||||
|
Revenues
(i)
|
3,047
|
434
|
99
|
725
|
-
|
-
|
6
|
4,311
|
|
Costs
|
(350
)
|
(29
)
|
(43
)
|
(484
)
|
-
|
-
|
(4
)
|
(910
)
|
|
Gross
profit / (loss)
|
2,697
|
405
|
56
|
241
|
-
|
-
|
2
|
3,401
|
|
Net gain from fair
value of investment properties
|
2,068
|
1,373
|
849
|
-
|
-
|
-
|
199
|
4,489
|
|
General and
administrative expenses
|
(261
)
|
(70
)
|
(40
)
|
(135
)
|
(43
)
|
(132
)
|
(2
)
|
(683
)
|
|
Selling
expenses
|
(188
)
|
(46
)
|
(21
)
|
(97
)
|
-
|
-
|
(3
)
|
(355
)
|
|
Other operating
results, net
|
(58
)
|
(12
)
|
(36
)
|
(1
)
|
27
|
-
|
12
|
(68
)
|
|
Management
fees
|
-
|
-
|
-
|
-
|
-
|
-
|
-
|
-
|
|
Profit
/ (Loss) from operations
|
4,258
|
1,650
|
808
|
8
|
(16
)
|
(132
)
|
208
|
6,784
|
|
Share of profit /
(loss) of associates and joint ventures
|
-
|
-
|
14
|
-
|
(196
)
|
-
|
88
|
(94
)
|
|
Segment
profit / (loss)
|
4,258
|
1,650
|
822
|
8
|
(212
)
|
(132
)
|
296
|
6,690
|
|
|
|
|
|
|
|
|
|
|
|
Investment
properties
|
28,799
|
7,422
|
5,328
|
-
|
-
|
-
|
247
|
41,796
|
|
Property, plant and
equipment
|
55
|
42
|
-
|
168
|
2
|
-
|
-
|
267
|
|
Investment in ) of
associates and joint ventures
|
-
|
-
|
95
|
-
|
570
|
-
|
2,054
|
2,719
|
|
Other reportable
assets
|
31
|
44
|
47
|
10
|
-
|
-
|
-
|
132
|
|
Total
segment assets (ii)
|
28,885
|
7,508
|
5,470
|
178
|
572
|
-
|
2,301
|
44,914
|
(i) From all the
revenues corresponding to the Operations Center in Argentina, the
100% are originated in Argentina. No external client represents 10%
or more of revenue of any of the reportable segments.
(ii) From all of
the assets corresponding to the Operations Center in Argentina
segments, Ps.44,152 million are located in Argentina and Ps.762 in
other countries, principally in USA for Ps.570 million and Uruguay
for Ps.192 million.
192
|
|
June
30, 2016
|
|||||||
|
|
Shopping
Malls
|
Offices
|
Sales
and developments
|
Hotels
|
International
|
Corporate
|
Others
|
Total
|
|
|
(in
millions of Ps.)
|
|||||||
|
Revenues
(i)
|
2,409
|
332
|
8
|
534
|
-
|
-
|
1
|
3,284
|
|
Costs
|
(250
)
|
(25
)
|
(20
)
|
(362
)
|
-
|
-
|
(2
)
|
(659
)
|
|
Gross
profit / (loss)
|
2,159
|
307
|
(12
)
|
172
|
-
|
-
|
(1
)
|
2,625
|
|
Net gain from fair
value of investment properties
|
16,132
|
1,226
|
773
|
-
|
-
|
-
|
36
|
18,167
|
|
General and
administrative expenses
|
(179
)
|
(85
)
|
(24
)
|
(103
)
|
(24
)
|
(72
)
|
-
|
(487
)
|
|
Selling
expenses
|
(145
)
|
(24
)
|
(23
)
|
(69
)
|
-
|
-
|
(3
)
|
(264
)
|
|
Other operating
results, net
|
(63
)
|
(6
)
|
(34
)
|
(2
)
|
92
|
-
|
1
|
(12
)
|
|
Management
fees
|
-
|
-
|
-
|
-
|
-
|
-
|
-
|
-
|
|
Profit
/ (Loss) from operations
|
17,904
|
1,418
|
680
|
(2
)
|
68
|
(72
)
|
33
|
20,029
|
|
Share of profit /
(loss) of associates and joint ventures
|
-
|
-
|
5
|
-
|
(130
)
|
-
|
251
|
126
|
|
Segment
profit / (loss)
|
17,904
|
1,418
|
685
|
(2
)
|
(62
)
|
(72
)
|
284
|
20,155
|
|
|
|
|
|
|
|
|
|
|
|
Investment
properties
|
26,613
|
5,534
|
4,575
|
-
|
-
|
-
|
37
|
36,759
|
|
Property, plant and
equipment
|
49
|
19
|
2
|
166
|
2
|
-
|
-
|
238
|
|
Investment in ) of
associates and joint ventures
|
-
|
-
|
62
|
-
|
143
|
-
|
1,762
|
1,967
|
|
Other reportable
assets
|
33
|
11
|
91
|
8
|
-
|
-
|
-
|
143
|
|
Total
segment assets (ii)
|
26,695
|
5,564
|
4,730
|
174
|
145
|
-
|
1,799
|
39,107
|
(i) From all our
revenues corresponding to the Operations Center in Argentina, the
100% are originated in Argentina. No external client represents 10%
or more of revenue of any of the reportable segments.
(ii) From all of
the assets corresponding to the Operations Center in Argentina
segments, Ps.38,804 million are located in Argentina and Ps.303
million in other countries, principally in USA for Ps.145 million
and Uruguay for Ps.158 million.
The
following table presents the reportable segments of the Operations
Center in Israel:
|
|
June 30, 2018
|
|
|||||||||||||
|
|
|
|
|
|
|
|
|
|
|
|
|
|
|
|
|
|
|
(in millions of Ps.)
|
|
|||||||||||||
|
|
June
30, 2018
|
||||||
|
|
Real
Estate
|
Supermarkets
|
Telecommunications
|
Insurance
|
Corporate
|
Others
|
Total
|
|
|
(in
millions of Ps.)
|
||||||
|
Revenues
(i)
|
6,180
|
60,470
|
19,347
|
-
|
-
|
583
|
86,580
|
|
Costs
|
(2,619
)
|
(44,563
)
|
(13,899
)
|
-
|
-
|
(314
)
|
(61,395
)
|
|
Gross
profit
|
3,561
|
15,907
|
5,448
|
-
|
-
|
269
|
25,185
|
|
Net gain from fair
value of investment properties
|
1,996
|
164
|
-
|
-
|
-
|
-
|
2,160
|
|
General and
administrative expenses
|
(363
)
|
(878
)
|
(1,810
)
|
-
|
(374
)
|
(445
)
|
(3,870
)
|
|
Selling
expenses
|
(115
)
|
(12,749
)
|
(3,974
)
|
-
|
-
|
(148
)
|
(16,986
)
|
|
Other operating
results, net
|
98
|
(177
)
|
140
|
-
|
434
|
(28
)
|
467
|
|
Management
fees
|
-
|
-
|
-
|
-
|
-
|
-
|
-
|
|
Profit
/ (Loss) from operations
|
5,177
|
2,267
|
(196
)
|
-
|
60
|
(352
)
|
6,956
|
|
Share of profit /
(loss) associates of and joint ventures
|
167
|
20
|
-
|
-
|
-
|
(230
)
|
(43
)
|
|
Segment
profit / (loss)
|
5,344
|
2,287
|
(196
)
|
-
|
60
|
(582
)
|
6,913
|
|
|
|
|
|
|
|
|
|
|
Operating
assets
|
134,038
|
13,304
|
49,797
|
12,254
|
21,231
|
36,178
|
266,802
|
|
Operating
liabilities
|
(104,202
)
|
-
|
(38,804
)
|
(1,214
)
|
(68,574
)
|
(2,658
)
|
(215,452
)
|
|
Net
reportable assets (ii)
|
29,836
|
13,304
|
10,993
|
11,040
|
(47,343
)
|
33,520
|
51,350
|
(i) From all our
revenues corresponding to the Operations Center in Israel, Ps.1,482
million are originated in USA (Ps.1,149 million in 2017) and the
remaining in Israel. No external client represents 10% or more of
the revenue of any of the reportable segments.
(ii) From all of
the assets corresponding to the Operations Center in Israel
segments, Ps.34,930 million are located in USA (Ps.21,781 million
in 2017), Ps.1,049 million in India (Ps.768 million in 2017) and
the remaining are located in Israel.
193
|
|
June
30, 2017
|
||||||
|
|
Real
Estate
|
Supermarkets
|
Telecommunications
|
Insurance
|
Corporate
|
Others
|
Total
|
|
|
(in
millions of Ps.)
|
||||||
|
Revenues
|
4,918
|
47,277
|
15,964
|
-
|
-
|
263
|
68,422
|
|
Costs
|
(2,333
)
|
(35,432
)
|
(11,183
)
|
-
|
-
|
(162
)
|
(49,110
)
|
|
Gross
profit
|
2,585
|
11,845
|
4,781
|
-
|
-
|
101
|
19,312
|
|
Net gain from fair
value of investment properties
|
261
|
113
|
-
|
-
|
-
|
-
|
374
|
|
General and
administrative expenses
|
(290
)
|
(627
)
|
(1,592
)
|
-
|
(384
)
|
(280
)
|
(3,173
)
|
|
Selling
expenses
|
(91
)
|
(9,517
)
|
(3,406
)
|
-
|
-
|
(79
)
|
(13,093
)
|
|
Other operating
results, net
|
46
|
(52
)
|
(36
)
|
-
|
(48
)
|
(106
)
|
(196
)
|
|
Management
fees
|
-
|
-
|
-
|
-
|
-
|
-
|
-
|
|
Profit
/ (Loss) from operations
|
2,511
|
1,762
|
(253
)
|
-
|
(432
)
|
(364
)
|
3,224
|
|
Share of profit /
(loss) associates of and joint ventures
|
46
|
75
|
-
|
-
|
-
|
(16
)
|
105
|
|
Segment
profit / (loss)
|
2,557
|
1,837
|
(253
)
|
-
|
(432
)
|
(380
)
|
3,329
|
|
|
|
|
|
|
|
|
|
|
Operating
assets
|
79,427
|
38,521
|
31,648
|
8,562
|
14,734
|
6,072
|
178,964
|
|
Operating
liabilities
|
(64,100
)
|
(29,239
)
|
(25,032
)
|
-
|
(33,705
)
|
(3,159
)
|
(155,235
)
|
|
Net
reportable assets
|
15,327
|
9,282
|
6,616
|
8,562
|
(18,971
)
|
2,913
|
23,729
|
|
|
June
30, 2016
|
||||||
|
|
Real
Estate
|
Supermarkets
|
Telecommunications
|
Insurance
|
Corporate
|
Others
|
Total
|
|
|
(in
millions of Ps.)
|
||||||
|
Revenues
|
1,538
|
18,610
|
6,655
|
-
|
-
|
274
|
27,077
|
|
Costs
|
(467
)
|
(14,076
)
|
(4,525
)
|
-
|
-
|
(184
)
|
(19,252
)
|
|
Gross
profit
|
1,071
|
4,534
|
2,130
|
-
|
-
|
90
|
7,825
|
|
Net gain from fair
value of investment properties
|
(294
)
|
23
|
-
|
-
|
-
|
-
|
(271
)
|
|
General and
administrative expenses
|
(100
)
|
(203
)
|
(708
)
|
-
|
(321
)
|
(28
)
|
(1,360
)
|
|
Selling
expenses
|
(29
)
|
(3,907
)
|
(1,493
)
|
-
|
-
|
(13
)
|
(5,442
)
|
|
Other operating
results, net
|
(19
)
|
(13
)
|
-
|
-
|
-
|
-
|
(32
)
|
|
Management
fees
|
-
|
-
|
-
|
-
|
-
|
-
|
-
|
|
Profit
/ (Loss) from operations
|
629
|
434
|
(71
)
|
-
|
(321
)
|
49
|
720
|
|
Share of profit /
(loss) associates of and joint ventures
|
226
|
-
|
-
|
-
|
-
|
(103
)
|
123
|
|
Segment
profit / (loss)
|
855
|
434
|
(71
)
|
-
|
(321
)
|
(54
)
|
843
|
|
|
|
|
|
|
|
|
|
|
Operating
assets
|
60,678
|
29,440
|
27,345
|
4,602
|
1,753
|
23,652
|
147,470
|
|
Operating
liabilities
|
(49,576
)
|
(23,614
)
|
(21,657
)
|
-
|
(10,441
)
|
(27,701
)
|
(132,989
)
|
|
Net
reportable assets
|
11,102
|
5,826
|
5,688
|
4,602
|
(8,688
)
|
(4,049
)
|
14,481
|
194
The following tables present a reconciliation between the total
results of operations as per the segment information and the profit
from operation as per the statement of income. The adjustments
relate to the presentation of the results of operations of joint
ventures accounted for under the equity method under IFRS and the
non-elimination of the inter-segment
transactions.
|
|
June
30, 2018
|
|||||
|
|
Total
segment
information
|
Joint
ventures (i)
|
Discontinued
operations (ii)
|
Adjustments
(iii)
|
Elimination
of inter-segment transactions and non-reportable assets /
liabilities (iv)
|
Total
Statement
of Income
|
|
|
(in
millions of Ps.)
|
|||||
|
Revenues
|
97,969
|
(46
)
|
(60,470
)
|
1,726
|
(193
)
|
38,986
|
|
Costs
|
(67,672
)
|
29
|
44,563
|
(1,760
)
|
60
|
(24,780
)
|
|
Initial recognition
and changes in the fair value of biological assets and agricultural
produce at the point of harvest
|
926
|
2
|
-
|
-
|
114
|
1,042
|
|
Changes in the net
realizable value of agricultural produce after harvest
|
303
|
-
|
-
|
-
|
-
|
303
|
|
Gross
profit / (loss)
|
31,526
|
(15
)
|
(15,907
)
|
(34
)
|
(19
)
|
15,551
|
|
Net gain / (loss)
from changes in fair value of investment properties
|
906
|
-
|
-
|
-
|
-
|
906
|
|
Gain from disposal
of farmlands
|
23,531
|
(738
)
|
(164
)
|
-
|
-
|
22,629
|
|
General and
administrative expenses
|
(5,319
)
|
14
|
878
|
-
|
13
|
(4,414
)
|
|
Selling
expenses
|
(18,067
)
|
6
|
12,749
|
-
|
6
|
(5,306
)
|
|
Other operating
results, net
|
956
|
19
|
177
|
-
|
-
|
1,152
|
|
Management
fees
|
-
|
-
|
-
|
(554
)
|
-
|
(554
)
|
|
Profit / (Loss) from operations before share
of
Profit / (Loss) of joint
ventures and associates
|
33,533
|
(714
)
|
(2,267
)
|
(588
)
|
-
|
29,964
|
|
Share of profit /
(loss) of joint ventures and associates
|
(1,289
)
|
706
|
(20
)
|
-
|
-
|
(603
)
|
|
Profit
/ (Loss) from operations before financing and taxation
|
32,244
|
(8
)
|
(2,287
)
|
(588
)
|
-
|
29,361
|
|
|
|
|
|
|
|
|
|
Reportable
assets
|
345,036
|
(470
)
|
(13,303
)
|
-
|
22,507
|
353,770
|
|
Reportable
liabilities
|
(215,452
)
|
-
|
-
|
-
|
(62,997
)
|
(278,449
)
|
|
Net
reportable assets
|
129,584
|
(470
)
|
(13,303
)
|
-
|
(40,490
)
|
75,321
|
|
|
June
30, 2017
|
|||||
|
|
Total
segment
information
|
Joint
ventures (i)
|
Discontinued
operations (ii)
|
Adjustments
(iii)
|
Elimination
of inter-segment transactions and non-reportable assets /
liabilities (iv)
|
Total
Statement
of Income
|
|
|
(in
millions of Ps.)
|
|||||
|
Revenues
|
76,648
|
(72
)
|
(47,168
)
|
1,490
|
(152
)
|
30,746
|
|
Costs
|
(53,415
)
|
45
|
35,488
|
(1,517
)
|
69
|
(19,330
)
|
|
Initial recognition
and changes in the fair value of biological assets and agricultural
produce at the point of harvest
|
127
|
8
|
-
|
-
|
69
|
204
|
|
Changes in the net
realizable value of agricultural produce after harvest
|
(74
)
|
-
|
-
|
-
|
-
|
(74
)
|
|
Gross
profit / (loss)
|
23,286
|
(19
)
|
(11,680
)
|
(27
)
|
(14
)
|
11,546
|
|
Net gain / (loss)
from changes in fair value of investment properties
|
5,194
|
(193
)
|
(113
)
|
-
|
-
|
4,888
|
|
Gain from disposal
of farmlands
|
280
|
-
|
-
|
-
|
-
|
280
|
|
General and
administrative expenses
|
(4,267
)
|
7
|
624
|
-
|
8
|
(3,628
)
|
|
Selling
expenses
|
(13,948
)
|
7
|
9,434
|
-
|
4
|
(4,503
)
|
|
Other operating
results, net
|
(189
)
|
(5
)
|
64
|
-
|
2
|
(128
)
|
|
Management
fees
|
-
|
-
|
-
|
(200
)
|
-
|
(200
)
|
|
Profit / (Loss) from operations before share
of
Profit / (Loss) of joint
ventures and associates
|
10,356
|
(203
)
|
(1,671
)
|
(227
)
|
-
|
8,255
|
|
Share of profit /
(loss) of joint ventures and associates
|
19
|
153
|
(76
)
|
-
|
-
|
96
|
|
Profit
/ (Loss) from operations before financing and taxation
|
10,375
|
(50
)
|
(1,747
)
|
(227
)
|
-
|
8,351
|
|
|
|
|
|
|
|
|
|
Reportable
assets
|
230,891
|
(583
)
|
-
|
-
|
11,138
|
241,446
|
|
Reportable
liabilities
|
(155,235
)
|
-
|
-
|
-
|
(37,038
)
|
(192,273
)
|
|
Net
reportable assets
|
75,656
|
(583
)
|
-
|
-
|
(25,900
)
|
49,173
|
195
|
|
June
30, 2016
|
|||||
|
|
Total
segment
information
|
Joint
ventures (i)
|
Discontinued
operations (ii)
|
Adjustments
(iii)
|
Elimination
of inter-segment transactions and non-reportable assets /
liabilities (iv)
|
Total
Statement
of Income
|
|
|
(in
millions of Ps.)
|
|||||
|
Revenues
|
33,270
|
(89
)
|
(18,607
)
|
1,194
|
(146
)
|
15,622
|
|
Costs
|
(22,404
)
|
74
|
14,063
|
(1,207
)
|
94
|
(9,380
)
|
|
Initial recognition
and changes in the fair value of biological assets and agricultural
produce at the point of harvest
|
376
|
(26
)
|
-
|
-
|
51
|
401
|
|
Changes in the net
realizable value of agricultural produce after harvest
|
208
|
-
|
-
|
-
|
-
|
208
|
|
Gross
profit / (loss)
|
11,450
|
(41
)
|
(4,544
)
|
(13
)
|
(1
)
|
6,851
|
|
Net gain / (loss)
from changes in fair value of investment properties
|
17,918
|
(379
)
|
(23
)
|
-
|
-
|
17,516
|
|
Gain from disposal
of farmlands
|
(2
)
|
-
|
-
|
-
|
-
|
(2
)
|
|
General and
administrative expenses
|
(2,162
)
|
5
|
200
|
-
|
7
|
(1,950
)
|
|
Selling
expenses
|
(6,044
)
|
8
|
3,862
|
-
|
1
|
(2,173
)
|
|
Other operating
results, net
|
(124
)
|
(2
)
|
19
|
-
|
(3
)
|
(110
)
|
|
Management
fees
|
-
|
-
|
-
|
(534
)
|
-
|
(534
)
|
|
Profit / (Loss) from operations before share
of
Profit / (Loss) of joint
ventures and associates
|
21,036
|
(409
)
|
(486
)
|
(547
)
|
4
|
19,598
|
|
Share of profit /
(loss) of joint ventures and associates
|
272
|
262
|
-
|
-
|
-
|
534
|
|
Profit
/ (Loss) from operations before financing and taxation
|
21,308
|
(147
)
|
(486
)
|
(547
)
|
4
|
20,132
|
|
|
|
|
|
|
|
|
|
Reportable
assets
|
191,713
|
(510
)
|
-
|
-
|
8,448
|
199,651
|
|
Reportable
liabilities
|
(132,989
)
|
-
|
-
|
-
|
(29,462
)
|
(162,451
)
|
|
Net
reportable assets
|
58,724
|
(510
)
|
-
|
-
|
(21,014
)
|
37,200
|
(i)
Represents the equity value of joint ventures that were
proportionately consolidated for information by segment
purposes.
(ii)
Corresponds to Shufersal’s deconsolidation, the Company lost
control in June 2018.
(iii)
Includes Ps.(34) million, Ps.(27) million and Ps.(13) million
corresponding to Expenses and FPC and Ps.(554) million, Ps.(200)
million and Ps.(534) million to management fees, as of June 30,
2018, 2017 and 2016, respectively.
(iv) Includes
deferred income tax assets, income tax and MPIT credits, trade and
other receivables, investment in financial assets, cash and cash
equivalents and intangible assets except for rights to receive
future units under barter agreements, net of investments in
associates with negative equity which are included in
provisions.
196
Results
of Operations for the fiscal years ended June 30, 2018 and
2017
Below
is a summary of the Company´s business lines and a
reconciliation between the total of the operating result according
to the information by segments and the operating result according
to the income statement for the years ended June 30, 2018 and
2017.
|
|
|
Urban
Properties and Investment business
|
|
|
|
|
|
|
||||||||||||||||||||||
|
|
Operations
Center
in Argentina
|
Operations
Center
in Israel
|
Agricultural
business
|
Subtotal
|
Total
segment
information
|
Joint
ventures (i)
|
discontinued
operations (ii)
|
Adjustments
(iii)
|
Elimination
|
Total
Statement of Income / Financial Position
|
||||||||||||||||||||
|
|
06.30.18
|
06.30.17
|
Var.
|
06.30.18
|
06.30.17
|
Var.
|
06.30.18
|
06.30.17
|
Var.
|
06.30.18
|
06.30.17
|
Var.
|
06.30.18
|
06.30.17
|
Var.
|
06.30.18
|
06.30.17
|
Var.
|
06.30.18
|
06.30.17
|
Var.
|
06.30.18
|
06.30.17
|
Var.
|
06.30.18
|
06.30.17
|
Var.
|
06.30.18
|
06.30.17
|
Var.
|
|
|
(in million
of Ps.)
|
|||||||||||||||||||||||||||||
|
Revenues
|
6,081
|
3,915
|
2,166
|
5,308
|
4,311
|
997
|
86,580
|
68,422
|
18,158
|
91,888
|
72,733
|
19,155
|
97,969
|
76,648
|
21,321
|
(46
)
|
(72
)
|
26
|
(60,470
)
|
(47,168
)
|
(13,302
)
|
1,726
|
1,490
|
236
|
(193
)
|
(152
)
|
(41
)
|
38,986
|
30,746
|
8,240
|
|
Costs
|
(5,210
)
|
(3,395
)
|
(1,815
)
|
(1,067
)
|
(910
)
|
(157
)
|
(61,395
)
|
(49,110
)
|
(12,285
)
|
(62,462
)
|
(50,020
)
|
(12,442
)
|
(67,672
)
|
(53,415
)
|
(14,257
)
|
29
|
45
|
(16
)
|
44,563
|
35,488
|
9,075
|
(1,760
)
|
(1,517
)
|
(243
)
|
60
|
69
|
(9
)
|
(24,780
)
|
(19,330
)
|
(5,450
)
|
|
Initial recognition and
changes in the fair value of biological assets and agricultural
products at the point of harvest
|
926
|
127
|
799
|
-
|
-
|
-
|
-
|
-
|
-
|
-
|
-
|
-
|
926
|
127
|
799
|
2
|
8
|
(6
)
|
-
|
-
|
-
|
-
|
-
|
-
|
114
|
69
|
45
|
1,042
|
204
|
838
|
|
Changes in the net
realizable value of agricultural products after
harvest
|
303
|
(74
)
|
377
|
-
|
-
|
-
|
-
|
-
|
-
|
-
|
-
|
-
|
303
|
(74
)
|
377
|
-
|
-
|
-
|
-
|
-
|
-
|
-
|
-
|
-
|
-
|
-
|
-
|
303
|
(74
)
|
377
|
|
Gross
profit / (loss)
|
2,100
|
573
|
1,527
|
4,241
|
3,401
|
840
|
25,185
|
19,312
|
5,873
|
29,426
|
22,713
|
6,713
|
31,526
|
23,286
|
8,240
|
(15
)
|
(19
)
|
4
|
(15,907
)
|
(11,680
)
|
(4,227
)
|
(34
)
|
(27
)
|
(7
)
|
(19
)
|
(14
)
|
(5
)
|
15,551
|
11,546
|
4,005
|
|
Net gain from fair
value adjustment of investment properties
|
96
|
331
|
(235
)
|
21,275
|
4,489
|
16,786
|
2,160
|
374
|
1,786
|
23,435
|
4,863
|
18,572
|
23,531
|
5,194
|
18,337
|
(738
)
|
(193
)
|
(545
)
|
(164
)
|
(113
)
|
(51
)
|
-
|
-
|
-
|
-
|
-
|
-
|
22,629
|
4,888
|
17,741
|
|
Gain from disposal of
farmlands
|
906
|
280
|
626
|
-
|
-
|
-
|
-
|
-
|
-
|
-
|
-
|
-
|
906
|
280
|
626
|
-
|
-
|
-
|
-
|
-
|
-
|
-
|
-
|
-
|
-
|
-
|
-
|
906
|
280
|
626
|
|
General and
administrative expenses
|
(546
)
|
(411
)
|
(135
)
|
(903
)
|
(683
)
|
(220
)
|
(3,870
)
|
(3,173
)
|
(697
)
|
(4,773
)
|
(3,856
)
|
(917
)
|
(5,319
)
|
(4,267
)
|
(1,052
)
|
14
|
7
|
7
|
878
|
624
|
254
|
-
|
-
|
-
|
13
|
8
|
5
|
(4,414
)
|
(3,628
)
|
(786
)
|
|
Selling
expenses
|
(649
)
|
(500
)
|
(149
)
|
(432
)
|
(355
)
|
(77
)
|
(16,986
)
|
(13,093
)
|
(3,893
)
|
(17,418
)
|
(13,448
)
|
(3,970
)
|
(18,067
)
|
(13,948
)
|
(4,119
)
|
6
|
7
|
(1
)
|
12,749
|
9,434
|
3,315
|
-
|
-
|
-
|
6
|
4
|
2
|
(5,306
)
|
(4,503
)
|
(803
)
|
|
Other operating
results, net
|
567
|
75
|
492
|
(78
)
|
(68
)
|
(10
)
|
467
|
(196
)
|
663
|
389
|
(264
)
|
653
|
956
|
(189
)
|
1,145
|
19
|
(5
)
|
24
|
177
|
64
|
113
|
-
|
-
|
-
|
-
|
2
|
(2
)
|
1,152
|
(128
)
|
1,280
|
|
Management
fees
|
-
|
-
|
|
-
|
-
|
|
-
|
-
|
|
-
|
-
|
|
-
|
-
|
|
-
|
-
|
-
|
-
|
-
|
-
|
(554
)
|
(200
)
|
(354
)
|
-
|
-
|
-
|
(554
)
|
(200
)
|
(354
)
|
|
Profit
/ (Loss) from operations
|
2,474
|
348
|
2,126
|
24,103
|
6,784
|
17,319
|
6,956
|
3,224
|
3,732
|
31,059
|
10,008
|
21,051
|
33,533
|
10,356
|
23,177
|
(714
)
|
(203
)
|
(511
)
|
(2,267
)
|
(1,671
)
|
(596
)
|
(588
)
|
(227
)
|
(361
)
|
-
|
-
|
-
|
29,964
|
8,255
|
21,709
|
|
Share of (loss) /
profit of associates and joint ventures
|
23
|
8
|
15
|
(1,269
)
|
(94
)
|
(1,175
)
|
(43
)
|
105
|
(148
)
|
(1,312
)
|
11
|
(1,323
)
|
(1,289
)
|
19
|
(1,308
)
|
706
|
153
|
553
|
(20
)
|
(76
)
|
56
|
-
|
-
|
-
|
-
|
-
|
-
|
(603
)
|
96
|
(699
)
|
|
Segment
profit / (loss)
|
2,497
|
356
|
2,141
|
22,834
|
6,690
|
16,144
|
6,913
|
3,329
|
3,584
|
29,747
|
10,019
|
19,728
|
32,244
|
10,375
|
21,869
|
(8
)
|
(50
)
|
42
|
(2,287
)
|
(1,747
)
|
(540
)
|
(588
)
|
(227
)
|
(361
)
|
-
|
-
|
-
|
29,361
|
8,351
|
21,010
|
Agricultural
business
Below
is a summary analysis of the business lines of Agricultural
business for the years ended June 30, 2018 and 2017
|
|
Agricultural production
|
Land transformation and sales
|
Corporate
|
Others
|
Total
|
||||||||||
|
|
06.30.18
|
06.30.17
|
Var.
|
06.30.18
|
06.30.17
|
Var.
|
06.30.18
|
06.30.17
|
Var.
|
06.30.18
|
06.30.17
|
Var.
|
06.30.18
|
06.30.17
|
Var.
|
|
|
(in million of Ps)
|
||||||||||||||
|
Revenues
|
3,603
|
2,197
|
1,406
|
-
|
-
|
-
|
-
|
-
|
-
|
2,478
|
1,718
|
760
|
6,081
|
3,915
|
2,166
|
|
Costs
|
(2,930
)
|
(1,810
)
|
(1,120
)
|
(12
)
|
(11
)
|
(1
)
|
-
|
-
|
-
|
(2,268
)
|
(1,574
)
|
(694
)
|
(5,210
)
|
(3,395
)
|
(1,815
)
|
|
Initial
recognition and changes in the fair value of biological assets and
agricultural products at the point of harvest
|
926
|
127
|
799
|
-
|
-
|
-
|
-
|
-
|
-
|
-
|
-
|
-
|
926
|
127
|
799
|
|
Changes
in the net realizable value of agricultural products after
harvest
|
303
|
(74
)
|
377
|
-
|
-
|
-
|
-
|
-
|
-
|
-
|
-
|
-
|
303
|
(74
)
|
377
|
|
Gross profit / (loss)
|
1,902
|
440
|
1,462
|
(12
)
|
(11
)
|
(1
)
|
-
|
-
|
-
|
210
|
144
|
66
|
2,100
|
573
|
1,527
|
|
Net
gain from fair value adjustment of investment
properties
|
-
|
-
|
-
|
96
|
331
|
(235
)
|
-
|
-
|
-
|
-
|
-
|
-
|
96
|
331
|
(235
)
|
|
Gain
from disposal of farmlands
|
-
|
-
|
-
|
906
|
280
|
626
|
-
|
-
|
-
|
-
|
-
|
-
|
906
|
280
|
626
|
|
General
and administrative expenses
|
(348
)
|
(254
)
|
(94
)
|
(1
)
|
(1
)
|
-
|
(89
)
|
(84
)
|
(5
)
|
(108
)
|
(72
)
|
(36
)
|
(546
)
|
(411
)
|
(135
)
|
|
Selling
expenses
|
(468
)
|
(370
)
|
(98
)
|
-
|
-
|
-
|
-
|
-
|
-
|
(181
)
|
(130
)
|
(51
)
|
(649
)
|
(500
)
|
(149
)
|
|
Other
operating results, net
|
18
|
70
|
(52
)
|
511
|
-
|
511
|
-
|
-
|
-
|
38
|
5
|
33
|
567
|
75
|
492
|
|
Profit / (Loss) from operations
|
1,104
|
(114
)
|
1,218
|
1,500
|
599
|
901
|
(89
)
|
(84
)
|
(5
)
|
(41
)
|
(53
)
|
12
|
2,474
|
348
|
2,126
|
|
Share
of profit of associates and joint ventures
|
24
|
12
|
12
|
-
|
-
|
-
|
-
|
-
|
-
|
(1
)
|
(4
)
|
3
|
23
|
8
|
15
|
|
Segment profit / (loss)
|
1,128
|
(102
)
|
1,230
|
1,500
|
599
|
901
|
(89
)
|
(84
)
|
(5
)
|
(42
)
|
(57
)
|
15
|
2,497
|
356
|
2,141
|
197
Urban
Properties and Investments Business
Operations
Center in Argentina
Below
is a summary analysis of the business lines of the Urban Properties
Investments Business - Operations Center in Argentina for the years
ended June 30, 2018 and 2017
|
|
Shopping Malls
|
Offices
|
Sales and developments
|
Hotels
|
Internacional
|
Corporate
|
Others
|
Total
|
||||||||||||||||
|
|
06.30.18
|
06.30.17
|
Var.
|
06.30.18
|
06.30.17
|
Var.
|
06.30.18
|
06.30.17
|
Var.
|
06.30.18
|
06.30.17
|
Var.
|
06.30.18
|
06.30.17
|
Var.
|
06.30.18
|
06.30.17
|
Var.
|
06.30.18
|
06.30.17
|
Var.
|
06.30.18
|
06.30.17
|
Var.
|
|
|
(in million of Ps.)
|
|||||||||||||||||||||||
|
Revenues
|
3,665
|
3,047
|
618
|
532
|
434
|
98
|
120
|
99
|
21
|
973
|
725
|
248
|
-
|
-
|
-
|
-
|
-
|
-
|
18
|
6
|
12
|
5,308
|
4,311
|
997
|
|
Costs
|
(330
)
|
(350
)
|
20
|
(46
)
|
(29
)
|
(17
)
|
(44
)
|
(43
)
|
(1
)
|
(624
)
|
(484
)
|
(140
)
|
-
|
-
|
-
|
-
|
-
|
-
|
(23
)
|
(4
)
|
(19
)
|
(1,067
)
|
(910
)
|
(157
)
|
|
Gross profit / (loss)
|
3,335
|
2,697
|
638
|
486
|
405
|
81
|
76
|
56
|
20
|
349
|
241
|
108
|
-
|
-
|
-
|
-
|
-
|
-
|
(5
)
|
2
|
(7
)
|
4,241
|
3,401
|
840
|
|
Net
gain from fair value adjustment of investment
properties
|
11,340
|
2,068
|
9,272
|
4,932
|
1,373
|
3,559
|
4,771
|
849
|
3,922
|
-
|
-
|
-
|
-
|
-
|
-
|
-
|
-
|
-
|
232
|
199
|
33
|
21,275
|
4,489
|
16,786
|
|
General
and administrative expenses
|
(320
)
|
(261
)
|
(59
)
|
(87
)
|
(70
)
|
(17
)
|
(78
)
|
(40
)
|
(38
)
|
(193
)
|
(135
)
|
(58
)
|
(46
)
|
(43
)
|
(3
)
|
(151
)
|
(132
)
|
(19
)
|
(28
)
|
(2
)
|
(26
)
|
(903
)
|
(683
)
|
(220
)
|
|
Selling
expenses
|
(238
)
|
(188
)
|
(50
)
|
(57
)
|
(46
)
|
(11
)
|
(21
)
|
(21
)
|
-
|
(114
)
|
(97
)
|
(17
)
|
-
|
-
|
-
|
-
|
-
|
-
|
(2
)
|
(3
)
|
1
|
(432
)
|
(355
)
|
(77
)
|
|
Other
operating results, net
|
(57
)
|
(58
)
|
1
|
(4
)
|
(12
)
|
8
|
11
|
(36
)
|
47
|
(17
)
|
(1
)
|
(16
)
|
(23
)
|
27
|
(50
)
|
-
|
-
|
-
|
12
|
12
|
-
|
(78
)
|
(68
)
|
(10
)
|
|
Profit / (Loss) from operations
|
14,060
|
4,258
|
9,802
|
5,270
|
1,650
|
3,620
|
4,759
|
808
|
3,951
|
25
|
8
|
17
|
(69
)
|
(16
)
|
(53
)
|
(151
)
|
(132
)
|
(19
)
|
209
|
208
|
1
|
24,103
|
6,784
|
17,319
|
|
Share
of profit of associates and joint ventures
|
-
|
-
|
-
|
-
|
-
|
-
|
26
|
14
|
12
|
-
|
-
|
-
|
(1,923
)
|
(196
)
|
(1,727
)
|
-
|
-
|
-
|
628
|
88
|
540
|
(1,269
)
|
(94
)
|
(1,175
)
|
|
Segment profit / (loss)
|
14,060
|
4,258
|
9,802
|
5,270
|
1,650
|
3,620
|
4,785
|
822
|
3,963
|
25
|
8
|
17
|
(1,992
)
|
(212
)
|
(1,780
)
|
(151
)
|
(132
)
|
(19
)
|
837
|
296
|
541
|
22,834
|
6,690
|
16,144
|
Operations Center in Israel
Below
is a summary analysis of the business lines of the Urban Properties
Investments Business - Operations Center in Israel for the years
ended June 30, 2018 and 2017
|
|
Real Estate
|
Supermarkets
|
Telecommunications
|
Corporate
|
Others
|
Total
|
||||||||||||
|
|
06.30.18
|
06.30.17
|
Var.
|
06.30.18
|
06.30.17
|
Var.
|
06.30.18
|
06.30.17
|
Var.
|
06.30.18
|
06.30.17
|
Var.
|
06.30.18
|
06.30.17
|
Var.
|
30.06.18
|
30.06.17
|
Var.
|
|
|
(in million of Ps.)
|
|||||||||||||||||
|
Revenues
|
6,180
|
4,918
|
1,262
|
60,470
|
47,277
|
13,193
|
19,347
|
15,964
|
3,383
|
-
|
-
|
-
|
583
|
263
|
320
|
86,580
|
68,422
|
18,158
|
|
Costs
|
(2,619
)
|
(2,333
)
|
(286
)
|
(44,563
)
|
(35,432
)
|
(9,131
)
|
(13,899
)
|
(11,183
)
|
(2,716
)
|
-
|
-
|
-
|
(314
)
|
(162
)
|
(152
)
|
(61,395
)
|
(49,110
)
|
(12,285
)
|
|
Gross profit / (loss)
|
3,561
|
2,585
|
976
|
15,907
|
11,845
|
4,062
|
5,448
|
4,781
|
667
|
-
|
-
|
-
|
269
|
101
|
168
|
25,185
|
19,312
|
5,873
|
|
Net
gain from fair value adjustment of investment
properties
|
1,996
|
261
|
1,735
|
164
|
113
|
51
|
-
|
-
|
-
|
-
|
-
|
-
|
-
|
-
|
-
|
2,160
|
374
|
1,786
|
|
General
and administrative expenses
|
(363
)
|
(290
)
|
(73
)
|
(878
)
|
(627
)
|
(251
)
|
(1,810
)
|
(1,592
)
|
(218
)
|
(374
)
|
(384
)
|
10
|
(445
)
|
(280
)
|
(165
)
|
(3,870
)
|
(3,173
)
|
(697
)
|
|
Selling
expenses
|
(115
)
|
(91
)
|
(24
)
|
(12,749
)
|
(9,517
)
|
(3,232
)
|
(3,974
)
|
(3,406
)
|
(568
)
|
-
|
-
|
-
|
(148
)
|
(79
)
|
(69
)
|
(16,986
)
|
(13,093
)
|
(3,893
)
|
|
Other
operating results, net
|
98
|
46
|
52
|
(177
)
|
(52
)
|
(125
)
|
140
|
(36
)
|
176
|
434
|
(48
)
|
482
|
(28
)
|
(106
)
|
78
|
467
|
(196
)
|
663
|
|
Profit / (Loss) from operations
|
5,177
|
2,511
|
2,666
|
2,267
|
1,762
|
505
|
(196
)
|
(253
)
|
57
|
60
|
(432
)
|
492
|
(352
)
|
(364
)
|
12
|
6,956
|
3,224
|
3,732
|
|
Share
of profit of associates and joint ventures
|
167
|
46
|
121
|
20
|
75
|
(55
)
|
-
|
-
|
-
|
-
|
-
|
-
|
(230
)
|
(16
)
|
(214
)
|
(43
)
|
105
|
(148
)
|
|
Segment profit / (loss)
|
5,344
|
2,557
|
2,787
|
2,287
|
1,837
|
450
|
(196
)
|
(253
)
|
57
|
60
|
(432
)
|
492
|
(582
)
|
(380
)
|
(202
)
|
6,913
|
3,329
|
3,584
|
198
Revenues - Fiscal year 2018 compared to fiscal year
2017
Total
revenues from sales, rentals and services, according to business
segment reporting, rose by 27.8%, from Ps.76,648 million in fiscal
year 2017 to Ps.97,969 million in fiscal year 2018. This was mainly
due to a Ps.2,166 million increase in the Agricultural Business and
a Ps.19,155 million increase in the Urban Properties and
Investments Business. Within the Urban Properties and Investments
Business, the change is attributable to the Operations Center in
Israel by Ps.18,158 million and to the Operations Center in
Argentina by Ps.997 million.
Agricultural
Business
Total
revenues, according to the income statement, rose by 57.6%, from
Ps.3,742 million in fiscal year 2017 to Ps.5,898 million in fiscal
year 2018. This was due to the following increases: Ps.1,437
million in the Agricultural Production segment and Ps.719 million
in the Others segment.
In
turn, revenues from our interests in joint ventures declined by
100%, or Ps. 30 million, mainly as a consequence of Cresca
S.A.’s spin-off.
On the
other hand, inter-segment revenues rose by 28.0%, from Ps.143
million in fiscal year 2017 to Ps.183 million in fiscal year 2018,
mainly as a result of the leases of croplands between our
subsidiary BrasilAgro and its subsidiaries, which were reclassified
from the Agricultural Production segment to the Rentals and
Services segment.
Hence,
according to business segment reporting and considering all our
joint ventures and inter-segment eliminations, our revenues
increased by 55.3%, from Ps.3,915 million in fiscal year 2017 to
Ps.6,081 million in fiscal year 2018.
Agricultural Production.
Total revenues
from the Agricultural Production segment rose by 64.0% from
Ps.2,197 million in fiscal year 2017 to Ps.3,603 million in fiscal
year 2018, primarily as a consequence of:
● a Ps.791
million increase in revenues from crop sales, resulting from a 32%
rise in the average price of crops sold, from Ps.3,049 per ton in
fiscal year 2017 to Ps.4,030 per ton in fiscal year 2018; along
with an increase of 84,545 tons in the volume of crops sold in
fiscal year 2018 vis-a-vis the previous fiscal year;
● a Ps.402
million rise in revenues from sugarcane sales, mainly attributable
to an increase of 816,146 tons (or 90%) in the volume of sugarcane
sold in fiscal year 2018 vis-a-vis the previous fiscal year,
following the inclusion of additional hectares from San José
farm in Brazil, coupled with a 12.3% increase in the average price
of sugarcane sold, from Ps.391.5 per ton in fiscal year 2017 to
Ps.439.5 per ton in fiscal year 2018;
● a Ps.126
million increase in revenues from cattle and milk sales, primarily
attributable to an increase of 2,332,724 kg. in the volume of
cattle sold in fiscal year 2018 compared to the previous fiscal
year, offset, in part, by a 14.4% decline in the average price of
cattle; and
● a Ps.87
million increase in revenues from rentals and services, mainly as a
consequence of: (i) a 65.7% rise in revenues from seed production
mainly caused by the higher volume attained (up by 19%), a 55%
increase in the selling price, and a 10% increase in the average
yield; (ii) a 45.3% increase in rental revenues in Brazil, caused
by a larger leased area and increased prices, driven by the
year-on-year increase in the average exchange rate; and (iii) a
Ps.12.6 million increase in revenues from Feedlot services and
pastures.
Others.
Total revenues from the Others
segment rose by 44.2% from Ps.1,718 million in fiscal year 2017 to
Ps.2,478 million in fiscal year 2018, as a consequence
of:
● a Ps.574
million increase in revenues from agro-industrial activities,
mainly due to a 117% rise in exports and a 24% rise in sales to the
domestic market. Kosher production began to be exported to Israel,
with the ensuing decline in average export price. Domestic
consumption prices have exhibited an upward trend, up by 18% for
fiscal year 2018 vis-a-vis the previous fiscal year. Export prices
fell by 25% (in terms of U.S. dollars) in fiscal year 2018 relative
to fiscal year 2017, due to the export mix and the decline in the
beef export quota known as
Cuota
Hilton
;
● a Ps.103
million rise in supply and crop exchange transactions;
● a Ps.72
million increase in sales of supplies; and
● a Ps.11
million increase in revenues from sales on consignment, brokerage
fees and others.
199
Urban
Properties and Investments Business
Revenue
from sales, leases and services, according to the income statement,
increased by Ps.6,084 million, from Ps.27,004 million during fiscal
year 2017 to Ps.33,088 million during fiscal year 2018 (out of
which Ps.6,978 million were generated by the Operations Center in
Argentina and Ps.86,580 million come from the Operations Center in
Israel, the latter are compensated with the effect of the
deconsolidation of Shufersal for Ps.60,470). Excluding revenues
from the Operations Center in Israel, revenues from sales, leases
and services increased by 21.4%.
On the
other hand, the corresponding revenues for expenses and collective
promotion fund increased by 15.8%, from Ps.1,490 million (out of
which Ps.1,375 million are allocated to the Shopping Malls segment
and Ps.115 million in the Office segment of the Operations Center
in Argentina) during fiscal year 2017, to Ps.1,726 million (out of
which Ps.1,608 million are allocated to the Shopping Malls segment
and Ps.118 million to the Office segment) during fiscal year
2018.
Likewise, revenues
from our joint ventures increased by 12.2%, from Ps.41 million
during fiscal year 2017 (out of which Ps.26 million are allocated
to the Shopping Malls segment, Ps.14 million to the Offices segment
and Ps.1 million to the Sales and Development Segment of the
Operations Center in Argentina) to Ps.46 million during fiscal year
2018 (of which Ps.33 million are allocated to the Shopping Malls
segment, Ps.8 million to the Offices segment and Ps.5 million to
the Sales and Development Segment of the Operations Center in
Argentina).
Finally, income
inter-segment remained the same in both years.
Furthermore,
according to the information by segments (taking into account the
revenue from our joint ventures and without considering the
revenues corresponding to the expenses and the fund of collective
promotions or the revenue between business segments), the revenue
experienced a growth of Ps.19,155 million, from Ps.72,733 million
during fiscal year 2017 to Ps.91,888 million during fiscal year
2018 (out of which Ps.86.580 million come from the Operations
Center in Israel and Ps.5,308 million come from the Operations
Center in Argentina). Without considering the income from the
Operations Center in Israel, the revenues, according to the
information by segments, increased by 23.1%.
Operations
Center in Argentina
Shopping Malls.
Revenues from the
Shopping Malls segment increased by 20.3% from Ps.3,047 million
during fiscal year 2017 to Ps.3,665 million during fiscal year
2018. This increase is mainly attributable to: (i) an increase of
Ps.576 million in revenues from base and percentage rents stemming
as a result of a 24.9% increase in our tenants' total sales, which
increased from Ps.34 million during fiscal year 2017 to Ps.43
million during fiscal year 2018; (ii) an increase of Ps.82 million
in revenue from admission fees; (iii) an increase of Ps.44 million
in parking revenues, partially offset by (iv) a decrease of Ps.63
million in the escalation rents.
Offices.
Revenues from the Offices
segment increased 22.6% from Ps.434 million during fiscal year 2017
to Ps.532 million during fiscal year 2018. They were affected by
the sales of investment properties carried out during fiscal year
2018, which generated a reduction in the total leasable area of the
segment. Rental revenue increased 22.6%, from Ps.419 million during
fiscal year 2017 to Ps.514 million during fiscal year 2018, mainly
due to the devaluation.
Sales and Developments.
Revenue from the
Sales and Developments segment registered an increase of 21.2%,
from Ps.99 million during fiscal year 2017 to Ps.120 million during
fiscal year 2018. This segment often varies significantly from year
to year due to the no recurrence of the different sales operations
carried out by the Company over time. This increase is mainly due
to the sales of apartment units and parking lots of Beruti, floors
and parking spaces of Maipú 1300, Libertador and
Intercontinental building and the sale of Baicom’s plot of
land.
Hotels.
Revenues from our Hotels segment
increased by 34.2% from Ps.725 million during fiscal year 2017 to
Ps.973 million during fiscal year 2018, mainly due to an increase
in the average room rate of our hotel portfolio (measure in
pesos).
Others.
Others segment revenues
increased 200.0% from Ps.6 million during fiscal year 2017 to Ps.18
million during fiscal year 2018. These are mainly due to the
increase in rental income of La Adela by 80% during the year 2018
and revenue from events recorded in Entertainment Holdings
S.A.
200
Operations
Center in Israel
Real estate.
Revenues from the Real
estate segment increased from Ps.4,918 million during the year
ended June 30, 2017 to Ps.6,180 million during the year ended June
30, 2018. This variation was due to (i) a 27% revaluation of the
Shekel against the Argentine peso, (ii) an increase in the rentable
square meters and (iii) an increase in the price per square meter
of the leases.
Supermarkets.
Revenue from the
Supermarkets segment increased from Ps.47,277 million during the
year ended June 30, 2017 to Ps.60,470 million during the year ended
June 30, 2018. This variation was due to (i) a 27% revaluation of
the Shekel against the Argentine peso.
Telecommunications.
Revenue from the
Telecommunications segment increased from Ps.15,964 million during
the year ended June 30, 2017 to Ps.19,347 million during the year
ended June 30, 2018. This variation was due to (i) a 27%
revaluation of the Shekel against the Argentine peso, (ii)
partially offset by the constant erosion in the revenues of mobile
services, which was partially offset by an increase in revenues
related to fixed lines, television and internet.
Others.
Revenue from the Other segment
increased from Ps.263 million during the year ended June 30, 2017
to Ps.583 million during the year ended June 30, 2018. This
variation was due to (i) a 27% revaluation of the Shekel against
the Argentine peso, and (ii) to the increase in income of Bartan
and Epsilon.
Costs - Fiscal year 2018 compared to fiscal year 2017
The
Comapany’s total costs, according to business segment
reporting, rose by 26.7%, from Ps.53,415 million in fiscal year
2017 to Ps.67,672 million in fiscal year 2018. This was due to a
Ps.1,815 million increase in the Agricultural Business and a
Ps.12,442 million increase in the Urban Properties and Investments
Business. Within the Urban Properties and Investments Business, the
change is attributable to the Operations Center in Israel by
Ps.12,285 million and to the Operations Center in Argentina by
Ps.157 million.
Agricultural
Business
Total
costs, according to the income statement, rose by 56.1%, from
Ps.3,299 million in fiscal year 2017 to Ps.5,149 million in fiscal
year 2018. Such increase was mainly attributable to: a Ps.1,141
million increase in the Agricultural Production segment; a Ps.1
million increase in the Land Transformation and Sales segment, and
an increase of Ps.708 million the Others segment.
In
turn, costs of our joint ventures declined by 100%, or Ps.27
million, as a consequence of Cresca S.A.’s
spin-off.
Similarly,
inter-segment costs fell by Ps.8 million, from Ps.69 million in
fiscal year 2017 to Ps.61 million in fiscal year 2018, mainly as a
result of the incremental cost of sales of crops and sugarcane
during the year, attributable to leases of croplands between our
subsidiary BrasilAgro and its subsidiaries, which were reclassified
from the Crops and Sugarcane segment to the Rentals and Services
segment.
Hence,
according to business segment reporting and considering all our
joint ventures and inter-segment eliminations, costs increased by
53.5%, from Ps.3,395 million in fiscal year 2017 to Ps.5,210
million in fiscal year 2018. Total costs in the Agricultural
Business, as a percentage of revenues derived from this segment,
declined from 86.7% in fiscal year 2017 to 85.7% in fiscal year
2018.
Agricultural Production.
Total costs in
our Agricultural Production segment rose by 61.9% from Ps.1,810
million in fiscal year 2017 to Ps.2,930 million in fiscal year
2018, primarily as a consequence of:
● a Ps.592
million increase in costs of sales of crops, mainly caused by a
18.4% rise in the volume of tons sold relative to the previous
fiscal year; and a 26.9% rise in the average cost per ton of crops
sold in fiscal year 2018, from Ps.2,563 million in fiscal year 2017
to Ps.3,252 million in fiscal year 2018, due to the higher average
market price for crops and the increase in the exchange
rate;
● a Ps.402
million rise in costs of sales of sugarcane, mainly attributable to
an increase of 816,146 tons (or 90%) in the volume of sugarcane
sold in fiscal year 2018 vis-a-vis the previous fiscal year,
following the inclusion of additional hectares from San José
farm in Brazil, coupled with a 12.7% increase in the average cost
of sugarcane per ton sold in fiscal year 2018, up from Ps.388.2 per
ton in fiscal year 2017 to Ps.437.3 per ton in fiscal year
2018;
● a Ps.107
million increase in costs of sales of cattle and milk, mainly as a
result of an increase of 2,332,724 kg. in the volume of cattle sold
in fiscal year 2018 compared to the previous fiscal year, offset,
in part, by a 8.2% decline in the average price of cattle sold;
and
● a Ps.19
million rise in costs of rentals and services, mainly attributable
to a Ps.15 million increase in the Feedlot service
cost.
201
Total costs of the
Agricultural Production segment, as a percentage of revenues
derived from this segment, declined from 82.4% in fiscal year 2017
to 81.3% in fiscal year 2018.
Land Transformation and Sales.
Total
costs in the Land Transformation and Sales segment rose by 9.1%
from Ps.11 million in fiscal year 2017 to Ps.12 million in fiscal
year 2018.
Others.
Total costs in the Others
segment rose by 44.1% from Ps.1,574 million in fiscal year 2017 to
Ps.2,268 million in fiscal year 2018, primarily as a consequence
of:
● a Ps.513
million increase in agro-industrial costs, mostly driven by the
incremental slaughtering volume, coupled with a strong rise in the
acquisition costs of all of its components;
● a Ps.98
million rise in supply and crop exchange transactions;
● a Ps.58
million increase in sales of supplies; and
● a Ps.25
million increase in revenues from sales on consignment, brokerage
fees and others.
Total
costs in the Others segment, as a percentage of revenues derived
from this segment, experienced a slight decline from 91.6% in
fiscal year 2017 to 91.5% in fiscal year 2018.
Urban
Properties and Investments Business
Total
consolidated costs, according to the income statement, registered
an increase of Ps.3,600 million, from Ps.16,031 million during
fiscal year 2017 to Ps.19,631 million during fiscal year 2018 (out
of which Ps.61,395 million come from the Operations Center in
Israel compensated with the effect of the deconsolidation of
Shufersal for Ps.44,563 and Ps.2,799 million from the Operations
Center in Argentina). Excluding costs from the Operations Center in
Israel, costs increased by 16.2%. Furthermore, total consolidated
costs measured as a percentage of total consolidated revenues
decreased from 59.4% during fiscal year 2017 to 59.3% during fiscal
year 2018, mainly from the Operations Center in Israel. Excluding
costs from the Operations Center in Israel, the total consolidated
costs measured as a percentage of total revenues decreased, from
41.9% in 2017 to 40.1% in 2018.
On the
other hand, the corresponding costs related to expense of the
Collective Promotions Fund increased by 16.0%, from Ps.1,517
million during the year 2017 (out of which Ps.1,399 million are
allocated to the Shopping Malls segment and Ps.118 million in the
Office segment of the Operations Center in Argentina) to Ps.1,760
million during fiscal year 2018 (out of which Ps.1,636 million are
allocated to the Shopping Malls segment and Ps.124 million to the
Office segment of Operations Center in Argentina) due mainly to
higher costs originated by our Shopping Malls, which increased by
16.9% from Ps.1,400 million during fiscal year 2017 to Ps.1,636
million during fiscal year 2018, mainly as a consequence of: (i) a
higher expense for salaries, social security and other personnel
administrative expenses of Ps.103 million; (ii) an increase in
maintenance, security, cleaning, repairs and related expenses of
Ps.88 million (mainly due to increases in security and cleaning
services and public service rates); and (iii) an increase in taxes,
fees and contributions and other expenses of Ps.51 million, among
other items.
Likewise, the costs
from our joint ventures showed a net increase of 55.6%, from Ps.18
million during fiscal year 2017 (out of which Ps.4 million are
allocated to the Shopping Malls segment, Ps.10 million at Offices
segment and Ps.4 million to the Sales and Development segment of
the Operations Center in Argentina) to Ps.28 million during fiscal
year 2018 (out of which Ps.4 million are allocated to the Shopping
Malls segment, Ps.19 million to the Offices segment and Ps.5
million to the Sales and Development segment of the Operations
Center in Argentina).
Finally, costs for
operations inter-segment did not present variations for the years
presented.
In this
way, according to the segment information (taking into account the
costs coming from our joint ventures and without considering the
costs corresponding to the expenses and collective promotion fund
or the costs for operations inter-segment), the costs evidenced an
increase of Ps.12,442 million, from Ps.50,020 million during fiscal
year 2017 to Ps.62,462 million during fiscal year 2018 (out of
which Ps.61,395 million come from the Operations Center in Israel
and Ps.1,067 million from the Operations Center in Argentina).
Excluding costs from the Operations Center in Israel, costs
increased by 17.3%. Likewise, total costs measured as a percentage
of total revenues, according to segment information, decreased from
68.8% during fiscal year 2017 to 68.0% during fiscal year 2018,
mainly due to the Operations Center in Israel. Excluding the effect
from the Operations Center in Israel, the total costs measured as a
percentage of total revenues decreased from 21.1% during fiscal
year 2017 to 20.1% during fiscal year 2018.
202
Operations
Center in Argentina
Shopping Malls.
Costs of the Shopping
Malls segment decreased by 5.7%, from Ps.350 million during fiscal
year 2017 to Ps.330 million during fiscal year 2018, mainly due to
a decrease in leases and expenses costs of Ps.46 million due to the
absorption of the deficit in the collective promotion fund. This
was partially compensated by; (i) an increase in salaries, social
security and other personnel administration expenses of Ps.15
million; (ii) an increase in maintenance, security, cleaning,
repairs and related expenses of Ps.8 million (mainly due to
increases in security and cleaning services and in public service
rates) and; (iii) an increase in amortization and depreciation of
Ps.14 million, among other items. The costs of the Shopping Malls
segment, measured as a percentage of the revenues of this segment,
decreased from 11.5% during the 2017 fiscal year to 9.0% during the
2018 fiscal year.
Offices.
The costs of the Offices
segment increased by 58.6%, from Ps.29 million during fiscal year
2017 to Ps.46 million during fiscal year 2018, mainly due to: (i)
an increase in leases and expenses of Ps.9 million; (ii) an
increase in maintenance, repairs and services expenses of Ps.6
million; (iii) an increase in taxes, fees and contributions of Ps.4
million and; (iv) an increase in fees and compensation for services
of Ps 3 million; partially offset by a decrease in depreciation and
amortization of Ps.5 million. The costs of the Offices segment,
measured as a percentage of the revenues of this segment, increased
from 6.7% during fiscal year 2017 to 8.6% during fiscal year
2018.
Sales and Developments.
Costs for this
segment often vary significantly from year to year due to the
non-recurrence of the different sales operations carried out by the
Company over time. The associated costs of our Sales and
Developments segment registered an increase of 2.3%, from Ps.43
million during fiscal year 2017 to Ps.44 million during fiscal year
2018. The costs of the Sales and development segment, measured as a
percentage of revenues from this segment decreased from 43.4%
during fiscal year 2017 to 36.7% during fiscal year
2018.
Hotels.
Costs for the Hotels segment
increased by 28.9%, from Ps.484 million during fiscal year 2017 to
Ps.624 million during fiscal year 2018, mainly as a result of: (i)
an increase of Ps.80 million in costs of salaries, social security
and other personnel expenses; (ii) an increase of Ps.50 million in
maintenance and repairs; (iii) higher expenses of Ps.7 million in
fees and compensation for services. The costs of the Hotels
segment, measured as a percentage of the revenues of this segment,
decreased from 66.8% during the year 2017 to 64.1% during the 2018
fiscal year.
Others.
Other segment costs increased by
475.0%, from Ps.4 million during fiscal year 2017 to Ps.23 million
during fiscal year 2018, mainly as a result of: (i) an increase of
Ps.7 million in concept of leases and expenses; (ii) an increase of
Ps.4 million in the charge for salaries, social security and other
personnel expenses; (iii) higher charges of Ps.4 million in taxes,
fees and contributions and; (iv) an increase of Ps.2 million in
fees and compensation for services.
Operations
Center in Israel
Real estate.
Real estate segment costs
increased from Ps.2,333 million during the year ended June 30, 2017
to Ps.2,619 million during the year ended June 30, 2018. This
variation was due to (i) a revaluation of 27% of the Shekel against
the Argentine peso, partially offset by (ii) a decrease in the cost
due to the lower sale of residential apartments.
Supermarkets.
Costs of the Supermarkets
segment increased from Ps 35,432 million during the year ended June
30, 2017 to Ps.44,563 million during the year ended June 30, 2018.
This variation was mainly due to the revaluation of 27% of the
Shekel against the Argentine peso, accompanied by an improvement in
the terms of negotiation with suppliers.
Telecommunications.
Costs of the
Telecommunications segment increased from Ps.11,183 million during
the year ended June 30, 2017 to Ps.13,899 million during the year
ended June 30, 2018. This variation was due to a revaluation of 27%
of the Shekel compared to the Argentine peso, partially offset by a
decrease in costs that accompanied the reduction in sales of mobile
services and a slight increase in costs related to television
content.
Others.
Costs of the Other segment
increased from Ps.162 million during the year ended June 30, 2017
to Ps.314 million during the year ended June 30, 2018. This
variation was due to (i) a revaluation of 27 % of the Shekel
against the Argentine peso, and (ii) an increase in costs that
accompanied the increase in revenues.
203
Initial recognition and changes in the fair value of biological
assets and agricultural produce at the point of harvest - Fiscal
year 2018 compared to fiscal year 2017
Our
revenues from initial recognition and changes in the fair value of
biological assets and agricultural produce at the point of harvest,
according to the income statement, rose by 410.8%, from Ps.204
million in fiscal year 2017 to Ps.1,042 million in fiscal year
2018.
In
turn, our revenues from initial recognition and changes in the fair
value of biological assets and agricultural produce at the point of
harvest derived from our interests in joint ventures shrank by
75.0% from Ps.8 million in fiscal year 2017 to Ps.2 million in
fiscal year 2018.
On the
other hand, inter-segment revenues from initial recognition and
changes in the fair value of biological assets and agricultural
produce at the point of harvest rose by Ps.45 million, from Ps.69
million in fiscal year 2017 to Ps.114 million in fiscal year
2018.
Hence,
according to business segment reporting and considering all our
joint ventures, revenues from initial recognition and changes in
the fair value of biological assets and agricultural produce at the
point of harvest rose by 629.1%, from Ps.127 million in fiscal year
2017 to Ps.926 million in fiscal year 2018. Such increase was
mainly driven by:
● a Ps.579
million increase in income from crop production mainly caused by:
(i) increased profits derived from Argentine-source corn and
soybean, primarily attributable to higher prices and the
substantial increase in the exchange rate, offset, in part, by
lower yields; and (ii) the profits derived from Brazilian soybean,
as a consequence of a more extensive harvested area and higher
yields and prices; and
● a Ps.221
million increase in profits from sugarcane production, mainly of
Brazilian source, as a consequence of incremental production due to
a more extensive area and higher prices, offset, in part, by lower
yields and rising costs.
Changes in the net realizable value of agricultural produce after
harvest - Fiscal year 2018 compared to fiscal year
2017
Revenues derived
from changes in the net realizable value of agricultural produce
after harvest, according to the income statement, experienced
substantial growth, from a loss of Ps.74 million in fiscal year
2017 to a gain of Ps.303 million in fiscal year 2018. This was
primarily originated in Argentina, following the profits made
during the current period as a result of the rising prices for
corn, soybean and wheat, vis-a-vis the loss posted during the
previous period, due to the adjustment of corn and soybean prices
after having reached record highs by the end of June
2016.
There
were neither interests in joint ventures nor inter-segment
eliminations in income from changes in the net realizable value of
agricultural produce after harvest; therefore, revenues derived
from changes in the net realizable value of agricultural produce
after harvest, according to business segment reporting, match the
figures disclosed in the income statement.
Gross Profits - Fiscal year 2018 compared to fiscal year
2017
As a
result of the above mentioned factors, the Company’s gross
profit, according to business segment reporting, rose by 35.4%,
from Ps.23,286 million in fiscal year 2017 to Ps.31,526 million in
fiscal year 2018. This was primarily attributable to: a 266.5% rise
in the Agricultural Business, from Ps.573 million in fiscal year
2017 to Ps.2,100 million in fiscal year 2018; a 30.4% increase in
profits from the Operations Center in Israel at the Urban
Properties and Investments Business, from Ps.19,312 million in
fiscal year 2017 to Ps.25,185 million in fiscal year 2018; and a
24.7% increase in the Operations Center in Argentina at the Urban
Properties and Investments Business, from Ps.3,401 million in
fiscal year 2017 to Ps.4,241 million in fiscal year
2017.
Agricultural
Business
As a
result of the above mentioned factors, our gross profit rose by
266.5%, from Ps.573 million in fiscal year 2017 to Ps.2,100 million
in fiscal year 2018.
Agricultural Production.
Gross profit
from this segment rose by 332.3% from Ps.440 million in fiscal year
2017 to Ps.1,902 million in fiscal year 2018.
Land Transformation and Sales.
Gross
loss from this segment increased by 9.1% from Ps.11 million in
fiscal year 2017 to Ps.12 million in fiscal year 2018.
Others.
Gross profit from this segment
rose by 45.8% from Ps.144 million in fiscal year 2017 to Ps.210
million in fiscal year 2018.
204
Urban
Properties and Investments Business
The
gross profit of Urban Properties and Investments Business,
according to the information by segments, increase by 29.6% from
Ps.22,713 million during fiscal year 2017 (out of which Ps.19,312
million come from the Operations Center in Israel and Ps.3.401
million from the Operations Center in Argentina) to Ps.29,426
million during fiscal year 2018 (out of which Ps.25,185 million
come from the Operations Center in Israel and Ps.4,241 million from
the Operations Center in Argentina).
Operations
Center in Argentina
Shopping Malls.
The gross profit of the
Shopping Malls segment increased by 23.7%, from Ps.2,697 million
during fiscal year 2017 to Ps.3,335 million for fiscal year 2018,
mainly as a result of the increase in the total sales of our
tenants, giving as a result, higher percentage leases under our
lease agreements. The gross profit of the Shopping Malls segment as
a percentage of the segment's revenues increased from 88.5% during
fiscal year 2017 to 91.0% during fiscal year 2018.
Offices.
The gross profit of the Offices
segment increased by 20.0% going from Ps.405 million for the fiscal
year 2017 to Ps.486 million during the fiscal year 2018. The gross
profit of the Offices segment, measured as a percentage of the
revenues of this segment, decreased slightly from 93.3% during
fiscal year 2017 to 91.5% during fiscal year 2018.
Sales and developments.
The gross result
of the Sales and Developments segment increased by 35.7%, from
Ps.56 million for fiscal year 2017 to Ps.76 million during fiscal
year 2018, mainly as a result of the higher sales recorded during
fiscal year 2018 and the decrease of maintenance and conservation
costs of these properties. The gross profit of the sales and
development segment, measured as a percentage of this segment's
revenues, increased from 56.6% during fiscal year 2017 to 63.3%
during fiscal year 2018.
Hotels.
Gross profit for the Hotels
segment increased by 44.8% from Ps.241 million for the year 2017
to
Ps.349
million during the year 2018. The gross profit of the Hotels
segment, measured as a percentage of the revenues of this segment,
increased slightly from 33.0% during fiscal year 2017 to 35.9%
during fiscal year 2018.
Others.
Gross profit from the Others
segment decreased by 350.0%, going from a profit of Ps.2 million
for the year 2017 to a loss of Ps.5 million during the year 2018.
The gross profit of the Other segment, measured as a percentage of
the revenues of this segment decreased from 33.0% during fiscal
year 2017 to 27.8% during fiscal year 2018
.
Operations
Center in Israel
Real Estate.
The gross profit of the
Real Estate segment increased from Ps.2,585 million during the year
ended June 30, 2017 to Ps.3,561 million during the year ended June
30, 2018. This variation was mainly due to a 27% revaluation of the
Shekel against the Argentine peso, accompanied by the reduction in
costs. The gross profit of the segment as a percentage of revenues
increased slightly from 52.6% during 2017, to 57.6% during the year
2018.
Supermarkets.
The gross profit of the
Supermarket segment increased from Ps.11,845 million during the
year ended June 30, 2017 to Ps.15,907 million during the year ended
June 30, 2018. This variation was mainly due to a 27% revaluation
of the Shekel against the Argentine peso, accompanied by an
improvement in the terms of negotiation with suppliers. The gross
profit of the segment as a percentage of revenues increased
slightly from 25.1% during 2017 to 26.3% during fiscal year
2018.
Telecommunications.
The gross profit of
the Telecommunications segment increased from Ps.4,781 million
during the year ended June 30, 2017 to Ps.5,448 million during the
year ended June 30, 2018. This variation was mainly due to a 27%
revaluation of the Shekel against the Argentine peso, partially
offset by the constant erosion in the revenues of the mobile
services, which was partially offset by an increase in revenues
related to fixed lines, television and internet. The gross profit
of the segment as a percentage of revenues decreased slightly from
29.9% during 2017 to 28.2% during fiscal year 2018.
Others.
Gross profit from the Others
segment increased from Ps.101 million during the year ended June
30, 2017 to Ps.269 million during the year ended June 30, 2018.
This variation was mainly due to a 27% revaluation of the Shekel
against the Argentine peso, and the increase in income of Bartan
and Epsilon.
205
Net income (loss) from changes in fair value of investment
properties - Fiscal year 2018 compared to 2017
The
Company’s net income (loss) from changes in fair value of
investment properties, according to business segment reporting,
rose by 353.0%, from Ps.5,194 million in fiscal year 2017 to
Ps.23,531 million in fiscal year 2018. This was mainly due to a
Ps.235 million decline in the Agricultural Business and a Ps.18,572
million increase in the Urban Properties and Investments Business.
Within the Urban Properties and Investments Business, the change is
attributable to the Operations Center in Israel by Ps.1,786 million
(gain) and to the Operations Center in Argentina contributed by
Ps.16,786 million (gain).
Agricultural
Business
The
decline in net income is mostly attributable to BrasilAgro, as a
result of fewer hectares leased to third parties from the
Jatobá farm.
Urban
Properties and Investments Business
The net
result from changes in the fair value of investment properties,
according to the income statement, increased by Ps.17,976 million,
from Ps.4,557 million during the year ended June 30, 2017 (from
which Ps.4,296 million came from the Operations Center in Argentina
and Ps.374 million from the Operations Center in Israel, offset by
the effect of the deconsolidation of Shufersal for Ps.113 million)
to Ps.22,533 million during the year ended June 30, 2018 (of which
Ps.20,537 million from the Operations Center in Argentina and
Ps.2,160 million from the Operations Center in Israel offset by the
effect of the deconsolidation of Shufersal for Ps.164
million).
Operations
Center in Argentina
The net
result of changes in the fair value of our investment properties
for the fiscal year ended June 30, 2018 was Ps.21,275 million
(Ps.11,340 million in our Shopping Malls segment, Ps.4,932 million
from the Offices segment; Ps.4,771 million from the Sales and
Developments segment, and Ps.232 million from the Other
segment).
The
net impact in the peso values of our properties was primarily a
consequence of:
(i)
a 44 basis points increase in the discount rate applied in
calculating the present value of projected cash flows used to
estimate fair value of our shopping mall properties that resulted
in a decrease in value of Ps.1,399.8 million, mainly as a result of
an increase of cost of capital in Argentina;
(ii)
a net positive impact of Ps.7,760.1 million generated by an
increase of Ps.7,012.3 million in the projected cash flows
considering estimated inflation for the shopping malls DCF, a
decrease of Ps.14,436.5 million due to the conversion into U.S.
dollars of the projected cash flows considering estimated US$/Ps.
exchange rates and a positive effect of Ps.15,184.3 million due to
the conversion of the value in dollars of our shopping malls into
pesos at the year-end exchange rate;
(iii)
an additional positive effect of Ps.4,970.0 million due to the
decrease in the income tax rate used in the methodology applied to
value discounted cash flows; such amendment was set forth by the
fiscal reform recently approved, where it was set forth that the
income tax rate will be gradually reduced to 30% for fiscal periods
beginning at January 1, 2018 through December 31, 2019, and to 25%
for fiscal periods beginning at January 1, 2020 onwards;
and
(iv)
our
segments Offices and Sales and Developments, increased Ps.9,543.0
million in the value of our properties as measured in pesos, mainly
as a result of the Peso depreciated in fiscal year 2018 by
approximately 73.5% against the U.S. dollar (from Ps.16.63 to
Ps.28.85 to US$1.00). In addition, we recorded a realized fair
value on disposal of office properties of Ps.160 million during the
fiscal year ended June 30, 2018 compared to Ps. 100 million in the
comparable period in 2017, due to the sale of leasable offices and
parking spaces at several buildings.
Operations
Center in Israel
Real Estate.
The net result of changes
in the fair value of investment properties increased from Ps.261
million during the year ended June 30, 2017 to Ps.1,996 million
during the year ended June 30, 2018. The variation was due to the
increase in the value of properties in Israel and the devaluation
of the Argentine peso against the Israeli shekel.
Supermarkets.
The net result of changes
in the fair value of investment properties segment of supermarkets
increased from Ps.113 million during the year ended June 30, 2017
to Ps.164 million during the year ended June 30, 2018. Said
variation it was due to the increase in the value of the properties
in Israel and the devaluation of the Argentine peso against the
Israeli shekel.
206
Gain / (loss) from disposal of farmlands – Fiscal year 2018
compared to 2017
Profits
from the sale of farms derived by the Land Transformation and Sales
segment rose by 223,6%, from a gain of Ps.280 million in fiscal
year 2017 to a gain of Ps.906 million in fiscal year
2018.
Fiscal year 2018
● On June 29,
2018 Cresud signed a deed with a non-related third party for the
sale of a fraction of 10,000 hectares of livestock activity of "La
Suiza". The total amount of the transaction was set at US$ 10
million, of which US$ 3 million have been already paid. The
remaining balance of US$ 7 million, guaranteed by a mortgage on the
property, will be collected in 10 installments of the same amount
ending on June 2023, which will accrue an annual interest of 4.5%
on the remaining balances. The gain of the transaction amounts
approximately to Ps.238 million.
● On July 20,
2017, the Company executed a purchase-sale agreement for all of
“La Esmeralda” establishment consisting of 9,352
hectares devoted to agricultural and cattle raising activities in
the 9 de Julio district, Province of Santa Fe, Argentina. On June
25, 2018, the Company has made effective with the sign of the deed
and delivery of the property, the sale of "La Esmeralda" farm. The
amount of the transaction was set at US$ 19 million, of which US$ 7
million have been already paid. The balance, guaranteed with a
mortgage on the property, will be collected in 4 installments of
the same amount ending in April 2022, which will accrue an annual
interest of 4% on the remaining balances. The gain from the sale
amounts approximately to Ps.410 million.
● On May 3,
2018, the Company though its subsidiary BrasilAgro, has entered
into a purchase-sale agreement for the partial sale 956 hectares
(660 arable hectares) of Araucaria Farm, located in Mineiros,
Brazil, for an amount of 1,208 soybean bags per arable hectare or
Rs. 66.2 million (equal to Ps.447.2 million) (Rs./ha. 93,356). The
Company has recognized gains of Ps.258 million as result of this
transaction.
207
Fiscal year 2017
●
On June 30, 2017, Yatay Agropecuaria S.A. sold the entire
“Cuatro Vientos” farm located in the Department of
Santa Cruz, Bolivia, to an independent third party, comprising
2,658 hectares intended for sugarcane and agricultural production.
The total price for the transaction was US$ 14.23 million (US$
5,280 per hectare) (equivalent to Ps.222 million), out of which US$
7.42 million was already paid and the remaining balance of US$ 6.85
million, which is secured by means of a first mortgage, will be
settled on December 28, 2017, along with the lifting of such
mortgage. The Company has recognized a gain of US$ 4.5 million
(equivalent to Ps.76.2 million) as a result of such transaction in
fiscal year 2017.
●
In June 2017, BrasilAgro sold a fraction of 625 hectares in the
Jatobá farm, located in Jaborandi, State of Bahia. The price
for the transaction was 300 soybean bags per hectare or Rs.10.1
million (equivalent to Ps.41 million), out of which Rs.877 thousand
was already settled and the remaining balance will be paid in five
annual installments, beginning in July 2017. The Company has
recognized a gain of Ps.32.1million as a result of this
transaction.
●
On June 8, 2017, Cresud and Zander Express S.A. (holders in common
ownership of a 40% and 60% interest, respectively) passed the legal
title to Simplot Argentina S.R.L. of a 262-hectare parcel of land
located on National Route No. 7, in Luján de Cuyo, Province of
Mendoza. The total transaction price was US$ 2.2 million, amount
which had been paid in full at the time the legal title to the
property was conveyed. The Company has recognized a gain of Ps.11.8
million as a result of this transaction.
●
In May 2017, BrasilAgro sold 1,360 hectares (including 918
developed and productive hectares) of “Araucária”,
an agricultural farm located in the District of Mineiros. The price
for this transaction was 280 soybean bags per hectare or Rs.17
million (equivalent to Ps.67 million), 35% of which will be cashed
within this year and the balance will be paid in five annual
installments. The Company has recognized a gain of Ps.37.4 as a
result of this transaction.
●
In March 2017, BrasilAgro sold 274 hectares (including 196
developed and productive hectares) of its
“Araucária” farm. The transaction price was 1,000
soybean bags per hectare or Rs.13.2 million (equivalent to Ps.48
million), out of which 39,254 soybean bags, or Rs.2.4 million, were
already cashed and the balance will be paid in four annual
installments. The Company has recognized a gain of Ps.29.9 million
as a result of this transaction.
●
On June 10, 2015, BrasilAgro sold the remaining area of 27,745
hectares of the Cremaq farm located in the municipal district of
Baixa Grande do Ribeiro (Piaui). The transaction price was Rs.270
million (equivalent to Ps.694 million) and was fully paid. The
Company recorded a gain of Ps.525.9 million as a result of this
transaction in fiscal year 2015. Due to a contractual requirement
that was pending as of the date of the transaction concerning a
license for the dismantling of an additional area, the Company did
not book a portion of such gain. In March 2017, the Company
fulfilled this requirement and recognized a gain of Ps.21
million.
●
On July 5, 2016, Cresud sold the entire “El Invierno”
and “La Esperanza” farms, comprising 2,615 hectares
used for agriculture and located in the District of
“Rancul”, Province of La Pampa. The total transaction
price was US$ 6 million, out of which US$ 5 million were
already paid and the remaining balance of US$ 1 million, secured
with a mortgage on the estate, will be paid in five equal,
consecutive and annual installments, with the last one being
payable in August 2021. We has recognized a gain of Ps.71.6 million
as a result of this transaction.
General and Administrative Expenses - Fiscal year 2018 compared to
fiscal year 2017
The
Company’s total General and Administrative Expenses,
according to business segment reporting, rose by 24.7%, from
Ps.4,267 million in fiscal year 2017 to Ps.5,319 million in fiscal
year 2018. This was mainly due to an increase of Ps.135 million in
the Agricultural Business and an increase of Ps.917 million in the
Urban Properties and Investments Business. Within the Urban
Properties and Investments Business, the change is attributable to
the Operations Center in Israel by Ps.697 million and to the
Operations Center in Argentina by Ps.220 million.
Agricultural
Business
General
and Administrative Expenses in the Agricultural Business, according
to the income statement, rose by 33.3%, from Ps.409 million in
fiscal year 2017 to Ps.545 million in fiscal year 2018. This was
due to increases of Ps.95 million, Ps.5 million and Ps.36 million
in the Agricultural Production, Corporate, and Others segments,
respectively. Such increases were mostly related to: (i) the
BrasilAgro subsidiary, in connection with incremental payroll
expenses, service fees and taxes, driven by the effects of the
increase in the exchange rate; (ii) Cresud, in connection with
payroll expenses, maintenance expenses and rentals, due to
inflation and the effects of the increase in the exchange rate on
US-dollar denominated charges, and (iii) Carnes Pampeanas and
FYO, in
which case payroll expenses accounted for the most substantial
increase, due to a larger headcount caused by incremental activity,
in addition to inflation.
208
In
turn, General and Administrative Expenses in our joint ventures
fell by Ps.1 million from Ps.2 million in fiscal year 2017 to Ps.1
million in fiscal year 2018.
Hence,
according to business segment reporting and considering all our
joint ventures and inter-segment eliminations, our general and
administrative expenses increased by 32.8%, from Ps.411 million in
fiscal year 2017 to Ps.546 million in fiscal year 2018. General and
Administrative Expenses, as a percentage of revenues derived from
the Agricultural Business, declined from 10.5% in fiscal year 2017
to 9.0% in fiscal year 2018.
Agricultural Production.
General and
Administrative Expenses associated with our Agricultural Production
segment rose by 37.0%, from Ps.254 million in fiscal year 2017 to
Ps.348 million in fiscal year 2018, mainly as a consequence of: a
Ps.27 million increase in general and administrative expenses
attributable to crop operations; a Ps.8 million rise in expenses
associated with cattle activities; a Ps.52 million increase in
expenses associated with sugarcane operations, and a Ps.8 million
increase in expenses associated with the Agricultural Rental and
Services business. General and Administrative Expenses, as a
percentage of revenues derived from the Agricultural Production
segment, fell from 11.6% in fiscal year 2017 to 9.7% in fiscal year
2018.
Land Transformation and Sales.
General
and Administrative Expenses related to our Land Transformation and
Sales segment remained steady at Ps.1 million.
Corporate.
General and Administrative
Expenses associated with our Corporate segment rose by 6.0%, from
Ps.84 million in fiscal year 2017 to Ps.89 million in fiscal year
2018, mainly as a consequence of rising expenses due to inflation,
offset by extraordinary severance payments in fiscal year 2017 and
an increase in directors’ fees below the inflation
standard.
Others.
General and Administrative
Expenses related to the Others segment increased by 50.0%, from
Ps.72 million in fiscal year 2017 to Ps.108 million in fiscal year
2018. General and Administrative Expenses, as a percentage of
revenues derived from this segment, experienced a slight increase
from 4.2% in fiscal year 2017 to 4.4% in fiscal year
2018.
Urban
Properties and Investments Business
Total
general and administrative expenses, according to the income
statement, recorded an increase of Ps.650 million, from Ps.3,219
million during fiscal year 2017 (of which Ps.3,173 million come
from the Operations Center in Israel offset by the effect from the
deconsolidation of Shufersal of Ps.624 million and Ps.670 million
from the Operations Center in Argentina) to Ps.3,869 million during
fiscal year 2018 (out of which Ps.3,870 million come from the
Operations Center in Israel, offset by the effect of
deconsolidation of Shufersal of Ps.878 million and Ps.877 million
from the Operations Center in Argentina). Excluding the effect from
the Operations Center in Israel, general and administrative
expenses increased by 30.9%. Total general and administrative
expenses measured as a percentage of revenues from sales, leases
and services decreased slightly from 11.9% during fiscal year 2017
to 11.7% during fiscal year 2018.
The
general and administrative expenses of our joint ventures increased
Ps.8 million, from Ps.5 million during fiscal year 2017 to Ps.13
million during fiscal year 2018.
Finally, general
and administrative expenses for operations inter-segment increased
Ps 5 million, from Ps.8 million during fiscal year 2017 to Ps.13
million during fiscal year 2018.
Furthermore,
according to the information by segments (taking into account the
general and administrative expenses from our joint ventures and
without considering those corresponding to the expenses of
collective promotions funds or operating expenses intra- segments),
the general and administrative expenses increased Ps.917 million,
from Ps.3,856 million during fiscal year 2017 (out of which
Ps.3,173 million come from the Operations Center in Israel and Ps
683 million from the Operations Center in Argentina) to Ps.4,773
million during fiscal year 2018 (of which Ps.3,870 million come
from the Operations Center in Israel and Ps.903 million from the
Operations Center in Argentina). Excluding the general and
administrative expenses from the Operations Center in Israel,
expenses increased by 32.2%. General and administrative expenses
measured as a percentage of revenues, according to the information
by segments, decreased slightly from 5.3% during fiscal year 2017
to 5.2% during fiscal year 2018. Without considering the effect
from the Operations Center in Israel, total general and
administrative expenses, measured as a percentage of total
revenues, increased, from 15.8% during 2017 to 17.0% during fiscal
year 2018.
209
Operations
Center in Argentina
Shopping Malls.
General and
administrative expenses of Shopping Malls increased by 22.6%, from
Ps.261 million during fiscal year 2017 to Ps.320 million during
fiscal year 2018, mainly as a result of: (i) an increase in fees to
directors of Ps.27 million; (ii) an increase of Ps.15 million in
salaries, social security and other personnel administration
expenses; (iii) an increase of Ps.8 million in maintenance, repairs
and services, mobility and travel expenses; and (iv) an increase of
Ps.4 million in amortizations and depreciation. The general and
administrative expenses of Shopping Malls as a percentage of
revenues from the same segment increased slightly from 8.6% during
fiscal year 2017 to 8.7% during fiscal year 2018.
Offices.
The general and administrative
expenses of our Offices segment increased by 24.3%, from Ps.70
million during fiscal year 2017 to Ps.87 million during fiscal year
2018, mainly as a result of: (i) an increase of Ps.4 million in
salaries, social security and other personnel expenses; (ii) an
increase in advertising and other commercial expenses of Ps.4
million; (iii) an increase of Ps.3 million in fees to directors
and; (iv) an increase of Ps.2 million in terms mobility expenses
and office supplies, among other concepts. General and
administrative expenses, measured as a percentage of revenues in
the same segment, increased slightly from 16.1% during fiscal year
2017 to 16.4% during fiscal year 2018.
Sales and developments.
General and
administrative expenses associated with our Sales and developments
segment increased by 95.0%, from Ps.40 million during fiscal year
2017 to Ps.78 million during fiscal year 2018, mainly as a result
of: (i) an increase of directors fees of Ps.13 million, (ii) an
increase in salaries, social security and other personnel expenses
of Ps.5 million; (iii) an increase of Ps.4 million in taxes, fees
and contributions and; (iv) an increase of Ps.4 million in fees and
compensation for services, among other items. General and
administrative expenses, measured as a percentage of revenues in
the same segment, increased from 40.4% during fiscal year 2017 to
65.0% during fiscal year 2018.
Hotels.
General and administrative
expenses associated with our Hotels segment increased by 43.0% from
Ps.135 million during fiscal year 2017 to Ps.193 million during
fiscal year 2018, mainly as a result of: (i) an increase of Ps.24
million in salaries, social security and other personnel expenses;
(ii) an increase of Ps.16 million in taxes, fees and contributions;
(iii) an increase of Ps.8 million in maintenance costs, repairs and
services and; (iv) an increase of Ps.7 million in fees and
compensation for services, among other items. General and
administrative expenses associated with the Hotels segment measured
as a percentage of this segment's revenues increased by 18.6% in
fiscal year 2017 to 19.8% in fiscal year 2018.
International.
General and
administrative expenses associated with our International segment
increased by 7.0%, from Ps.43 million during fiscal year 2017 to
Ps.46 million during fiscal year 2018, mainly due to salaries,
social security and other personnel expenses incurred in relation
to the investment in IDBD and Other expenses.
Corporate.
General and administrative
expenses associated with our Corporate segment increased by 14.4%,
from Ps.132 million during fiscal year 2017 to Ps.151 million
during fiscal year 2018, mainly due to (i) an increase of Ps.11
million in salaries, social security and other personnel expenses;
(ii) an increase of Ps.6 million in fees to directors, among other
items.
Others.
General and administrative
expenses associated with our Other segment increased by Ps.26 from
Ps.2 million during fiscal year 2017 to Ps.28 million during fiscal
year 2018, mainly due to (i) an increase of Ps.7 million in leases
and expenses; (ii) an increase of Ps.12 million related to
salaries, social security and other personnel expenses; (iii) a
higher expense of fees and compensation for services of Ps.5
million and; (iv) an increase of Ps.3 million in the maintenance,
repairs and services charge, among other items
.
Operations
Center in Israel
Real Estate.
General and administrative
expenses associated with the Real Estate segment increased from
Ps.290 million during the year ended June 30, 2017 to Ps.363
million during the year ended June 30, 2018. This variation was
mainly due to a 27% revaluation of the Shekel against the Argentine
peso accompanied by a decrease in fees for services The general and
administrative expenses associated with this segment measured as a
percentage of the revenues maintained at 5.9%.
Supermarkets.
General and administrative
expenses associated with the Supermarket segment increased from
Ps.627 million during the year ended June 30, 2017 to Ps.878
million during the year ended June 30, 2018. This variation was due
to (i) a 27% revaluation of the Shekel against the Argentine peso,
(ii) the consolidation of New Pharm in the last quarter of the year
and (iii) an increase in salary. The general and administrative
expenses associated with the segment measured as a percentage of
this segment's revenues remained mainly stable at 1.3% in fiscal
year 2017 and 1.5% for fiscal year 2018.
210
Telecommunications.
General and
administrative expenses associated with the Telecommunications
segment increased from Ps.1,592 million during the year ended June
30, 2017 to Ps.1,810 million during the year ended June 30, 2018.
This variation was due to (i) a 27% revaluation of the Shekel
against the Argentine peso and (ii) a reduction in personnel
expenses due to a downsizing of the company, which accompanied the
fall in revenues in a search for improvements efficiency. The
administrative and general expenses associated with the segment
measured as a percentage of this segment's revenues decreased from
10% in fiscal year 2017 to 9.4% in fiscal year 2018.
Corporate.
General and administrative
expenses associated with the Corporate segment decreased from
Ps.384 million during the year ended June 30, 2017 to Ps.374
million during the year ended June 30, 2018. This variation was due
to (i) a 27% revaluation of the Shekel against the Argentine peso,
compensated by a decrease in the personnel and cost structure of
DIC and IDBD, also accompanied by a reduction in Dolphin's legal
fees.
Others.
General and administrative
expenses associated with the Others segment increased from Ps.280
million during the year ended June 30, 2017 to Ps.445 million
during fiscal year 2018. This variation was due to (i) a 27%
revaluation of the Shekel against the Argentine peso and an
increase in the structure of Bartan and Epsilon.
Selling Expenses - Fiscal year 2018 compared to fiscal year
2017
The
Company’s total selling expenses, according to business
segment reporting, increased by 29.53%, from Ps.13,948 million in
fiscal year 2017 to Ps.18,067 million in fiscal year 2018. This was
mainly due to a Ps.149 million increase in the Agricultural
Business and a Ps.3,970 million increase in the Urban Properties
and Investments Business, attributable to a Ps.77 million rise in
the Operations Center in Argentina and a Ps.3,893 million increase
in the Operations Center in Israel.
Agricultural
Business
Selling
expenses associated with the Agricultural Business, according to
the income statement, rose by 29.6%, from Ps.496 million in fiscal
year 2017 to Ps.643 million in fiscal year 2018. This was due to
increases of Ps.96 million and Ps.51 million in the Agricultural
Production and Others segments, respectively.
In
turn, selling expenses associated with our interests in joint
ventures declined by 45.4% from Ps.2 million in fiscal year 2017 to
Ps.1 million in fiscal year 2018, in connection with our Cresca
S.A. joint venture.
On the
other hand, inter-segment eliminations rose by 150.0% from Ps.2
million in fiscal year 2017 to Ps.5 million in fiscal year
2018.
Hence,
according to business segment reporting and considering all our
joint ventures and inter-segment eliminations, selling expenses
increased by 29.8%, from Ps.500 million in fiscal year 2017 to
Ps.649 million in fiscal year 2018.
Agricultural Production.
Selling
expenses associated with the Agricultural Production segment rose
by Ps.98 million, from Ps.370 million in fiscal year 2017 to Ps.468
million in fiscal year 2018, mainly as a consequence of an increase
of Ps.75 million in selling expenses for crops and Ps.14 million in
selling expenses for cattle. Selling expenses, as a percentage of
revenues derived from the Agricultural Production segment, fell
from 16.8% in fiscal year 2017 to 13.0% in fiscal year
2018.
Others.
Selling expenses associated with
the Others segment increased by Ps.51 million, from Ps.130 million
in fiscal year 2017 to Ps.181 million in fiscal year 2018, as a
consequence of a Ps.18 million increase in selling expenses related
to the operations of our subsidiary FYO, and a Ps.33 million
increase in selling expenses related to the agro-industrial
business. Selling expenses, as a percentage of revenues derived
from the Others segment, fell from 7.6% in fiscal year 2017 to 7.3%
in fiscal year 2018.
Urban
Properties and Investments Business
Total
selling expenses, according to the income statement, show an
increase of Ps.656 million, from Ps.4,007 million during fiscal
year 2017 to Ps.4,663 million during fiscal year 2018 (out of which
Ps.16,986 million come from the Operations Center in Israel offset
by the deconsolidation of Shufersal of Ps.12,749 million and Ps.426
million from the Operations Center in Argentina). Excluding the
effect from the Operations Center in Israel, selling expenses
increased by 22.4%. Total consolidated selling expenses measured as
a percentage of revenues from sales, leases and services, decreased
from 14.8% for the year 2017 to 14.1% during the year
2018.
On the
other hand, the selling expenses of our joint ventures increased
Ps.1 million, from Ps.5 million in fiscal year 2017 to Ps.6 million
during fiscal year 2018.
211
Furthermore,
according to the information by segments (taking into account the
selling expenses from our joint ventures and without considering
those corresponding to the expenses of collective promotion fund or
the expenses for operations inter- segments), the selling expenses
increased Ps.3,970 million, from Ps.13,448 million during fiscal
year 2017 to Ps.17,418 million during fiscal year 2018 (out of
which Ps.16,986 million come from the Operations Center in Israel
and Ps.432 million from the Operations Center in Argentina).
Excluding the effect from the Operations Center in Israel, selling
expenses increased by 21.7%. Selling expenses measured as a
percentage of revenues, according to information by segments,
increased from 18.5% during fiscal year 2017 to 19.0% during fiscal
year 2018.
Operations
Center in Argentina
Shopping Malls.
Selling expenses of the
Shopping Malls segment increased by 26.6%, from Ps.188 million
during fiscal year 2017 to Ps.238 million during fiscal year 2018,
mainly as a consequence of: (i) an increase in taxes, fees and
contributions of Ps.28 million, due to higher expenses in the gross
income tax; and (ii) an increase of Ps.22 million related to
doubtful accounts. Selling expenses measured as a percentage of the
revenues of the Shopping Malls segment increased from 6.2% during
fiscal year 2017 to 6.5% during fiscal year 2018.
Offices.
Selling expenses associated
with our Offices segment increased by 23.9% from Ps.46 million
during fiscal year 2017 to Ps.57 million during fiscal year 2018.
This variation was generated mainly as a result of: (i) an increase
in Ps.16 million in the charge of doubtful accounts and; (ii) an
increase of Ps.4 million in taxes and contributions, partially
offset by a decrease of Ps.10 million in advertising and other
commercial expenses. Selling expenses associated with our Office
segment, measured as a percentage of this segment's revenues,
increased slightly, from 10.6% in fiscal year 2017 to 10.7% in
fiscal year 2018.
Sales and developments.
The selling
expenses associated with the sales and development segment did not
show variations between the years presented.
Hotels.
Selling expenses associated with
our Hotels segment increased 17.5%, from Ps.97 million during
fiscal year 2017 to Ps.114 million during fiscal year 2018, mainly
as a result of: (i) an increase of Ps.7 million salaries, social
security and other personnel expenses; (ii) an increase of Ps.4
million in advertising and other commercial expenses; (iii) a
higher charge of Ps.4 million in fees and compensation for
services, among other items. The selling expenses associated with
our Hotels segment measured as a percentage of this segment's
revenues decreased, going from 13.4% during fiscal year 2017 to
11.7% during fiscal year 2018.
Others.
Selling expenses associated with
our Others segment decreased by 33.3% from Ps.3 million during
fiscal year 2017 to Ps.2 million during fiscal year 2018, mainly
due to a decrease in advertising, and other commercial expenses.
The selling expenses associated with our Other segment measured as
a percentage of this segment's revenues decreased considerably,
from 50.0% during fiscal year 2017 to 11.1% during fiscal year
2018.
Operations
Center in Israel
Real Estate.
Selling expenses associated
with the real estate segment increased from Ps.91 million during
the year ended June 30, 2017 to Ps.115 million during the year
ended June 30, 2018. This variation was due to (i) a 27%
revaluation of the Shekel against the Argentine Peso. The selling
expenses associated with this segment measured as a percentage of
revenues remained stable at 1.9% during the 2017 fiscal year and
the 2018 fiscal year.
Supermarkets.
Selling expenses
associated with the Supermarket segment increased from Ps.9,517
million during the year ended June 30, 2017 to Ps.12,749 million
during the year ended June 30, 2018. This variation was due to (i)
a 27% revaluation of the Shekel against the Argentine peso, and
(ii) the consolidation of New Pharm in the last quarter of the 2018
fiscal year. Selling expense as a percentage of revenues increased
slightly, from 20.1% during fiscal year 2017 to 21.1% during fiscal
year 2018.
Telecommunications.
Selling expenses
associated with the Telecommunications segment increased from
Ps.3,406 million during the year ended June 30, 2017 to Ps.3,974
million during the year ended June 30, 2018. This variation was due
to (i) a 27% revaluation of the Shekel against the Argentine peso,
partially offset by (ii) a decrease in advertising expenses on the
mobile phone line. Selling expenses associated with this segment
measured as a percentage of revenues decreased, going from 21.3% in
fiscal year 2017 to 20.5% in fiscal year 2018.
Others.
Selling expenses associated with
the Others segment increased from Ps.79 million during the year
ended June 30, 2017 to Ps.148 million during the year ended June
30, 2018. This variation was due to (i) a 27% revaluation of the
Shekel against the Argentine peso and (ii) an increase in the
marketing expenses of Bartan's new services.
212
Other Operating results, net - Fiscal year 2018 compared to fiscal
year 2017
Our
Other Operating results, net, according to business segment
reporting, increased by Ps.1,145 million, from a loss of Ps.189
million in fiscal year 2017 to a gain of Ps.956 million in fiscal
year 2018. This was mainly due to a Ps.492 million increase in
profits from the Agricultural Business; a Ps.10 million increase in
losses in the Urban Properties and Investments Business at the
Operations Center in Argentina, and a Ps.663 million increase in
the Operations Center in Israel from a loss of Ps.196 million to a
gain of Ps.467 million.
Agricultural
Business
Other
Operating results, net associated with the Agricultural Business,
according to the income statement, rose by 639.8% from a gain of
Ps.77 million in fiscal year 2017 to a gain of Ps.570 million in
fiscal year 2018.
On the
other hand, inter-segment eliminations related to Other operating
results, net rose by 50.0% from a loss of Ps.2 million in fiscal
year 2017 to a loss of Ps.3 million in fiscal year
2018.
Hence,
according to business segment reporting and considering all our
joint ventures and inter-segment eliminations, Other operating
results, net increased by Ps.492 million, from a gain of Ps.75
million in fiscal year 2017 to a gain of Ps.567 million in fiscal
year 2018.
Agricultural Production.
Other Operating
results, net associated with our Agricultural Production segment
fell by Ps.52 million, from a gain of Ps.70 million in fiscal year
2017 to a gain of Ps.18 million in fiscal year 2018, primarily as a
result of BrasilAgro’s and Cresud’s commodity
derivatives.
Land Transformation and Sales.
Other
Operating results, net from this segment rose by Ps.511 million,
following Cresca’s spin-off.
Others.
Other Operating results, net
associated with the Others segment rose by Ps.33 million, from a
gain of Ps.5 million in fiscal year 2017 to a gain of Ps.38 million
in fiscal year 2018, primarily in connection with the operations of
our subsidiary FYO.
Urban
Properties and Investments Business
Other
operating results, net, according to the income statement,
registered an increase of Ps.787 million, going from a net loss of
Ps.205 million during fiscal year 2017 to a net profit of Ps.582
million during fiscal year 2018 (which a loss of Ps.62 million
comes from the Operations Center in Argentina and Ps.644 million
from the Operations Center in Israel, including the effect of
deconsolidating Shufersal).
Other
operating results, net from our joint ventures, had a variation of
Ps.24 million, going from a net income of Ps.5 million during
fiscal year 2017 (assigned to the Sales and Development segment of
the Operations Center in Argentina) to a net loss of Ps.19 million
during fiscal year 2018 (out of which a loss of Ps.15 million is
allocated to the Sales and Development segment and Ps.4 million is
allocated to the Shopping Malls segment within the Operations
Center in Argentina).
Furthermore,
according to the information by segments (taking into account the
other operating results, net from our joint ventures and without
considering those corresponding to the operations between business
segments), the line other operating results, net recorded an
increase of Ps.653 million, from a net loss of Ps.264 million
during fiscal year 2017 to a net profit of Ps.389 million during
fiscal year 2018. Excluding the effect from the Operations Center
in Israel, the other operating results decreased in Ps.10
million.
Operations
Center in Argentina
Shopping Malls.
The other operating
results, net, of the Shopping Malls segment decreased by 1.7%,
going from a loss of Ps.58 million during fiscal year 2017 to a
loss of Ps.57 million during fiscal year 2018, mainly as a result
of: (i) a lower expense related to donations of Ps.21 million,
partially offset by: (ii) a higher expense for lawsuits and
contingencies of Ps.12 million; and (iii) a higher income of Ps.6
million related to management fee. The other operating results,
net, of this segment, as a percentage of this segment's revenues,
decreased from 1.9% during fiscal year 2017 to 1.6% during fiscal
year 2018.
Offices.
The other operating results,
net, associated with our Offices segment decreased by 66.7%, going
from a Ps.12 million losses during fiscal year 2017 to a loss of
Ps.4 million during fiscal year 2018, mainly as a consequence of an
increase in the income from management fee of Ps.4 million and a
decrease in the expenses of lawsuits and other contingencies of
Ps.2 million, among other items. The other operating results, net,
of this segment, as a percentage of revenues, decreased from 2.8%
during fiscal year 2017 to 0.8% during fiscal year
2018.
213
Sales and developments.
The other
operating results, net, associated with our Sales and developments
segment increased by 130.6%, going from a loss of Ps.36 million
during fiscal year 2017 to a gain of Ps.11 million during fiscal
year 2018, mainly as a result of an increase in income from the
sale of property, plant and equipment of Ps.56 million, among other
items. The other operating results, net, of this segment, as a
percentage of this segment's revenues, went from 36.4% during
fiscal year 2017 to 9.2% during fiscal year 2018.
Hotels.
The other operating results,
net, associated with the Hotels segment decreased by Ps.16 million,
going from a loss of Ps.1 million during fiscal year 2017 to a loss
of Ps.17 million during fiscal year 2018, mainly due to a higher
expense related to claims and lawsuits and contingencies and
others. The other operating results, net, of this segment, as a
percentage of this segment's revenues increased from 0.1% in 2017
to 1.7% in 2018.
International.
The other operating
results, net, of this segment decreased by 185.2%, from a gain of
Ps.27 million during fiscal year 2017 to a loss of Ps.23 million
during fiscal year 2018, mainly due to the reset of the translation
difference occurred in fiscal year 2017 and a decrease in revenue
from management fees.
Others.
The other operating results,
net, associated with the Other segment did not show variations
between the years presented.
Operations
Center in Israel
Real Estate.
The other operating
results, net associated with the Real Estate segment increased from
Ps.46 million during the year ended June 30, 2017 to Ps.98 million
during the year ended June 30, 2018. This variation was due to (i)
a revaluation of 27% of the Shekel against the Argentine peso and
(ii) result from the sale of fixed assets.
Supermarkets.
The other operating
results, net associated with the Supermarket segment increased from
Ps.52 million losses during the year ended June 30, 2017 to Ps.177
million losses during the year ended June 30, 2018. This variation
was due to (i) a revaluation of 27% of the Shekel against the
Argentine peso (ii) an impairment of property, plant and
equipment.
Telecommunications.
The other operating
results, net associated with the Telecommunications segment went
from Ps.36 million losses during the year ended June 30, 2017 to
Ps.140 million gain during the year ended June 30, 2018. This
variation was due to (i) a revaluation of 27% of the Shekel against
the Argentine peso, offset by (ii) the sale of the subsidiary
Rimon.
Corporate.
The other operating results,
net associated with the Corporate segment went from Ps.48 million
losses during the year ended June 30, 2017 to Ps.434 million gain
during the year ended June 30, 2018. This variation was due to (i)
a revaluation of 27% of the Shekel against the Argentine peso,
offset by (ii) the favorable outcome of the trial won related to Ma
' ariv.
Others.
The other operating results, net
associated with the Others segment went from Ps.106 million losses
during the year ended June 30, 2017 to Ps.28 million losses during
the year ended June 30, 2018. This variation was due to (i) a
revaluation of 27% of the Shekel against the Argentine peso, and
(ii) a decrease in research and development expenses.
Management fees – Fiscal year 2018 compared to fiscal year
2017
The
Company entered into a management agreement with Consultores Asset
Management S.A., which provides for the payment of a fee equivalent
to 10% of our profits as advisory fees in connection with all kinds
of matters related to businesses and investments in the
agricultural, real estate, financial, hotel and other sectors.
Management fees amounted to Ps.554 million and Ps.200 million in
fiscal year 2018 and 2017, respectively.
Profit from Operations - Fiscal year 2018 compared to fiscal year
2017
Our
total consolidated profit from operations, according to the income
statement, rose by 263.0% from Ps.8,255 million in fiscal year 2017
to Ps.29,964 million in fiscal year 2018.
Total
loss from operations from our joint ventures rose by 251.7%, from
Ps.203 million in fiscal year 2017 to Ps.714 million in fiscal year
2018, primarily as a consequence of a decline in net income from
changes in fair value of investment properties.
On the
other hand, profit from operations related to common maintenance
expenses and collective promotion fund rose by 159.0%, from a loss
of Ps.227 million in fiscal year 2017 to a loss of Ps.588 million
in fiscal year 2018.
214
Profits
from operations derived from inter-segment operations did not
experience significant changes.
Hence,
according to business segment reporting (considering the profit
from operations from all our joint ventures and without considering
the profit from operations related to common maintenance expenses
and collective promotion fund and inter-segment operations), profit
from operations rose by 223.8% from Ps.10,356 million in fiscal
year 2017 (with Ps.348 million being attributable to the
Agricultural Business, and Ps.3,224 million and Ps.6,784 to the
Operations Center in Israel and the Operations Center in Argentina,
respectively, both centers of the Urban Properties and Investments
Business) to Ps.33,533 million in fiscal year 2018 (with Ps.2,474
million being attributable to the Agricultural Business, and
Ps.6,956 million and Ps.24,103 million to the Operations Center in
Israel and the Operations Center in Argentina, respectively, both
centers of the Urban Properties and Investments
Business).
Agricultural
Business
Profits
from operations from the Agricultural Business increased by
Ps.2,126 million (or 610.9%), from a gain of Ps.348 million in
fiscal year 2017 to a gain of Ps.2,474 million in fiscal year
2018.
Agricultural Production.
Profit from
operations from the Agricultural Production segment increased by
Ps.1,218 million, from a loss of Ps.114 million in fiscal year 2017
to a gain of Ps.1,104 million in fiscal year 2018.
Land Transformation and Sales.
Profit
from operations from the Land Transformation and Sales segment
increased by Ps.901 million, from a gain of Ps.599 million in
fiscal year 2017 to a loss of Ps.1,500 million in fiscal year
2018.
Corporate.
Profit from operations from
the Corporate segment declined by Ps.5 million from a loss of Ps.84
million in fiscal year 2017 to a loss of Ps.89 million in fiscal
year 2018.
Others.
Profit from operations from the
Others segment fell by Ps.12 million from a loss of Ps.53 million
in fiscal year 2017 to a loss of Ps.41 million in fiscal year
2018.
Urban
Properties and Investments Business
Profit
from operations in this segment increase by Ps.21.051 million, from
a profit of Ps.10,008 million in fiscal year 2017 to a profit of
Ps.31,059 million in fiscal year 2018.
The increase is due to an increase of Ps.17,319
million in the Operations Center in Argentina and an increase of
Ps.3,732 million in the Operations Center in
Israel.
Operations
Center in Argentina
Shopping Malls.
The operating result of
Shopping Malls increased by 230.2% during fiscal year 2018, from
Ps.4,258 million during fiscal year 2017 to Ps.14,060 million
during fiscal year 2018.
The
operating result of the Shopping Malls segment as a percentage of
the segment's revenues increased from 139.7% during fiscal year
2017 to 383.6% during fiscal year 2018.
Offices.
The operating result
corresponding to our Offices segment increased by 219.4%, going
from a profit of Ps.1,650 million during fiscal year 2017 to a
profit of Ps.5,270 million during fiscal year 2018. The variation
is mainly due to an increase of Ps.3,645 million profit from the
result of changes fair value of investment properties.
The
operating result of the Offices segment as a percentage of the
segment's revenues increased from 380.2% during fiscal year 2017 to
990.6% during fiscal year 2018.
Sales and developments.
The operating
result corresponding to our Sales and Developments segment
increased by 489.0%, going from Ps.808 million gain during fiscal
year 2017 to Ps.4,759 million during fiscal year 2018. This
increase is mainly due to higher revenues resulting from the sales
of Beruti apartments and parking units, floors and parking units of
Maipú 1300, Libertador 498 and Intercontinental Plaza office
building and the sale of Baicom’s land and also, by the net
results of changes in the fair value of investment properties,
which were partially offset by an increase in costs and general and
administrative expenses.
The
operating result of the Sales and development segment as a
percentage of the segment's revenues increased from 816.2% during
fiscal year 2017 to 3965.8% during fiscal year 2018.
Hotels.
The operating result
corresponding to the Hotels segment showed an increase of 212.5%,
going from a profit of Ps.8 million in fiscal year 2017 at a gain
of Ps.25 million during fiscal year 2018. This increase is mainly
due to the increase in the average room rate of our hotel portfolio
(measured in pesos), generating an increase in revenues.
The
operating result of the Hotels segment as a percentage of the
segment's revenues increased from 1.1% during fiscal year 2017 to
2.6% during fiscal year 2018.
215
International.
The operating result
corresponding to our International segment decreased by 331.3%,
going from a loss of Ps.16 million during fiscal year 2017 to a
loss of Ps.69 million during fiscal year 2018. This variation is
due to an increase in expenses general and administrative costs and
a decrease in other operating results.
Corporate.
The operating result
corresponding to our Corporate segment varied by 14.4%, going from
a loss of Ps.132 million during fiscal year 2017 to a loss of
Ps.151 million during fiscal year 2018, mainly affected by general
and administrative expenses.
Others.
The operating result
corresponding to our Others segment presented an increase of Ps.1
million, going from a gain of Ps.208 million during fiscal year
2017 to a gain of Ps.209 million during fiscal year 2018. The
variation is mainly due to a Ps.237 million increase in income from
the result of changes in the fair value of investment properties
(mainly generated by La Adela).
The
operating result of the Other segment as a percentage of the
segment's revenues increased from 3466.7% during fiscal year 2017
to 1161.1% during fiscal year 2018.
Operations
Center in Israel
Real Estate.
The operating result of the
Real Estate segment increased from Ps.2,511 million during the
fiscal year 2017 to Ps.5,177 million during fiscal year 2018. This
variation was due to (i) a revaluation of 27% of the Shekel against
the Argentine peso, (ii) the occupation of projects in Israel,
(iii) an increase in the number of square meters occupied and (iv)
a gain related to changes in the fair value of investment
properties.
Supermarkets.
The operating result of
the Supermarkets segment increased from Ps 1,762 million during the
fiscal year 2017 to Ps 2,267 million during the fiscal year 2018.
This variation was due to (i) a revaluation of 27% of the Shekel
against the Argentine peso, and (ii) the increase in the
participation of the Shufersal brand, the improvement in commercial
terms and the distribution channels and a better mix in the
components of the basket.
Telecommunications.
The operating result
of the Telecommunications segment increased from a loss of Ps.253
million during the fiscal year 2017 to a loss of Ps.196 million
during fiscal year 2018. This variation was due to (i) a
revaluation of 27% of the Shekel against to the Argentine peso,
(ii) increase in television subscribers and (iii) the continuous
erosion in service revenues, which was partially offset by the
decrease in operating expenses, due to the efficiency measures
implemented by Cellcom.
Corporate.
Operating income of the
Corporate segment increased from a loss of Ps.432 million during
the fiscal year 2017 to a gain of Ps.60 million during fiscal year
2018. This variation was due to (i) a revaluation of 27% of the
Shekel against the Argentine peso, and (ii) the positive outcome of
Ma'ariv's trial.
Others.
The operating result of the
Others segment went from a loss of Ps.364 million during the fiscal
year 2017 to a loss of Ps.352 million during the fiscal year 2018.
This variation was due to (i) a revaluation of 27% of the Shekel
compared to the Argentine peso, and (ii) an increase in the income
of Bartan and Epsilon.
Share of profit/(loss) of associates and joint ventures - Fiscal
year 2018 compared to fiscal year 2017
Share
of profit (loss) of associates and joint ventures, according to the
income statement, fell by 728.1%, from a gain of Ps.96 million in
fiscal year 2017 to a loss of Ps.603 million in fiscal year
2018.
In
addition, our share of profit (loss) from our interests in joint
ventures, primarily from Cresca S.A. (Agricultural Production
segment), Nuevo Puerto Santa Fe S.A. (Shopping Malls segment),
Quality Invest S.A. (Offices segment); and Cyrsa S.A., Puerto
Retiro S.A. and Baicom Networks S.A. (Sales and Developments
segment), experienced a 361.4% increase, from a gain of Ps.153
million in fiscal year 2017 to a gain of Ps.706 million in fiscal
year 2018, mainly attributable to profits derived from our Cresca
S.A. and Quality S.A. joint ventures.
According to
business segment reporting, our share of profit/(loss) of
associates and joint ventures declined by Ps.1,308 million from a
gain of Ps.19 million in fiscal year 2017 to a loss of Ps.1,289
million in fiscal year 2018 (out of which a gain of Ps.23 million
is attributable to the Agricultural Business, and losses in the
amount of Ps.1,269 million and Ps.43 million are attributable to
the Operations Center in Argentina and the Operations Center in
Israel, respectively, both of them from the Urban Properties and
Investments Business).
Agricultural
Business
Agricultural Production.
The profit from
our interests in associates in this segment rose by 100.0% from a
gain of Ps.12 million in fiscal year 2017 to a gain of Ps.24
million in fiscal year 2018, due to the profit from the investment
in Agro-Uranga S.A.
Others.
The loss from our interests in
associates in this segment declined by 75.0% from a loss of Ps.4
million in fiscal year 2017 to a loss of Ps.1 million in fiscal
year 2018, due to the profits from the investment in Agrofy
Global.
216
Urban
Properties and Investments Business
Operations
Center in Argentina
Shopping Malls.
In the information by
segments, the share of profit / (loss) of associates and joint
ventures Nuevo Puerto Santa Fe S.A. it is exposed consolidated,
line by line in this segment.
Offices.
In the information by segments,
share of profit / (loss) of associates and joint ventures Quality
S.A. it is exposed consolidated, line by line in this
segment.
Sales and developments.
The share of
profit / (loss) of associates and joint ventures Cyrsa S.A., Puerto
Retiro S.A. and Baicom Networks S.A. are exposed consolidated line
by line. The result from our participation in our associate Manibil
S.A., which are disclosed in this line, increased by Ps.12 million,
from Ps.14 million during fiscal year 2017 to Ps.26 million during
fiscal year 2018.
Hotels.
This segment does not present
results from the participation in associates and joint
ventures.
International.
The negative result
generated by our stake in associates of this segment increased by
881.1%, going from a loss of Ps.196 million during fiscal year 2017
to a loss of Ps.1,923 million during fiscal year 2018, mainly
generated by a negative result of our investment in New Lipstick
LLC of Ps.1,916 million.
Others.
The positive result generated by
our participation in associates of the Other segment, increased by
613.6%, from Ps.88 million during fiscal year 2017 to Ps.628
million during fiscal year 2018, mainly as a result of a gain from
of our investments in the BHSA for Ps.618 million and Entertainment
Holdings S.A. for Ps.14 million.
Operations
Center in Israel
Real estate.
The positive result share
of profit of associates and joint ventures of this segment
increased from Ps.46 million during the year ended June 30, 2017 to
Ps.167 million in the year ended June 30, 2018 due to an
improvement presented by Mehadrin and Pbel in their
results.
Supermarkets.
The positive result share
of profit of associates and joint ventures of this segment
decreased from Ps.75 million during the year ended June 30, 2017 to
Ps.20 million in the year ended June 30, 2018 due to a drop in the
investment performance of associates.
Others.
The negative result generated bu
our share of profit of associates and joint ventures of this
segment increased from Ps.16 million during the year ended June 30,
2017 to Ps.230 million in the year ended June 30, 2018 due to the
low performance of Elron's investments.
Financial results, net - Fiscal year 2018 compared to fiscal year
2017
Our
financial results, net rose by Ps.19,124 million, from a loss of
Ps.4,703 million in fiscal year 2017 to a loss of Ps.23,827 million
in fiscal year 2018. This was primarily due to (i) a Ps.11,187
million increase in exchange losses in the Agricultural Business
and in the Operations Center in Argentina within the Urban
Properties and Investments Business, primarily attributable to the
currency depreciation that took place in the current fiscal year;
(ii) a Ps.2,228 million increase in losses in Israel in connection
with December's debt swap, and (iii) a Ps.4,261 million decline in
income from fair value measurement of financial assets and
liabilities in Israel, mostly attributable to changes in fair value
measurement of CLAL’s shares (a loss of NIS 243 million in
2018 vis-a-vis a gain of NIS 613 million in 2017).
There
was a 73.5% fluctuation in the US-dollar selling exchange rate
during fiscal year 2018 (increasing from Ps.16.630 to US$ 1 as of
June 30, 2017 to Ps.28.850 to US$ 1 as of June 30, 2018) relative
to the previous fiscal year, when the US$/Ps.exchange rate had
fluctuated 10.6% only (from Ps.15.040 to US$ 1 as of June 30, 2016
to Ps.16.630 to US$ 1 as of June 30, 2017).
Income tax - Fiscal year 2018 compared to fiscal year
2017
The
Company applies the deferred tax method to calculate the income tax
corresponding to the periods presented, recognizing in this way the
temporary differences as tax assets and liabilities. The income tax
charge for the year went from a loss of Ps.2,713 million during
fiscal year 2017, to a loss of Ps.233 million during fiscal year
2018, out of which a gain of Ps.384 million come from the
Agricultural Business and a gain of Ps.151 million from the Urban
Properties and Investments Business, attributable to a gain of
Ps.828 million in the Operations Center in Israel and a loss of
Ps.677 million in the Operations Center in Argentina. The variation
is mainly due to the impact in the deffered income tax of the
Argentina and United States tax reforms offset by the increase in
profit before income tax of the year.
217
Profit for the year - Fiscal year 2018 compared to fiscal year
2017
As a
result of the factors described above, the profit of the year,
including the effect of discontinued operations, went from a profit
of Ps.5,028 million during fiscal year 2017 to a profit of
Ps.17,780 million during fiscal year 2018.
Profit / (loss) for the fiscal year attributable
to the controlling company’s shareholders went from a profit
of Ps.1,511 million in fiscal year 2017 to a profit of Ps.5,392
million in fiscal year 2018; and The non-controlling interest in
controlled companies went from a profit of Ps.3,517 million in
fiscal year 2017 to a profit of Ps.12,388 million in fiscal year
2018.
218
Results
of Operations for the fiscal years ended June 30, 2017 and
2016
Below
is a summary of the Company's business lines and a reconciliation
between the total of the operating result according to the
information by segments and the operating result according to the
income statement for the years ended June 30, 2017 and
2016
|
|
|
Urban
Properties and Investment business
|
|
|
|
|
|
|
||||||||||||||||||||||
|
|
Operations
Center
in Argentina
|
Operations
Center
in Israel
|
Agricultural
business
|
Subtotal
|
Total
segment information
|
Joint
ventures (i)
|
discontinued
operations (ii)
|
Adjustments
(iii)
|
Elimination
|
Total
Statement of Income / Financial Position
|
||||||||||||||||||||
|
|
06.30.17
|
06.30.16
|
Var.
|
06.30.17
|
06.30.16
|
Var.
|
06.30.17
|
06.30.16
|
Var.
|
06.30.17
|
06.30.16
|
Var.
|
06.30.17
|
06.30.16
|
Var.
|
06.30.17
|
06.30.16
|
Var.
|
06.30.17
|
06.30.16
|
Var.
|
06.30.17
|
06.30.16
|
Var.
|
06.30.17
|
06.30.16
|
Var.
|
06.30.17
|
06.30.16
|
Var.
|
|
(in million
of Ps.)
|
||||||||||||||||||||||||||||||
|
Revenues
|
3,915
|
2,909
|
1,006
|
4,311
|
3,284
|
1,027
|
68,422
|
27,077
|
41,345
|
72,733
|
30,361
|
42,372
|
76,648
|
33,270
|
43,378
|
(72
)
|
(89
)
|
17
|
(47,168
)
|
(18,607
)
|
(28,561
)
|
1,490
|
1,194
|
296
|
(152
)
|
(146
)
|
(6
)
|
30,746
|
15,622
|
15,124
|
|
Costs
|
(3,395
)
|
(2,493
)
|
(902
)
|
(910
)
|
(659
)
|
(251
)
|
(49,110
)
|
(19,252
)
|
(29,858
)
|
(50,020
)
|
(19,911
)
|
(30,109
)
|
(53,415
)
|
(22,404
)
|
(31,011
)
|
45
|
74
|
(29
)
|
35,488
|
14,063
|
21,425
|
(1,517
)
|
(1,207
)
|
(310
)
|
69
|
94
|
(25
)
|
(19,330
)
|
(9,380
)
|
(9,950
)
|
|
Initial recognition and
changes in the fair value of biological assets and agricultural
products at the point of harvest
|
127
|
376
|
(249
)
|
-
|
-
|
-
|
-
|
-
|
-
|
-
|
-
|
-
|
127
|
376
|
(249
)
|
8
|
(26
)
|
34
|
-
|
-
|
-
|
-
|
-
|
-
|
69
|
51
|
18
|
204
|
401
|
(197
)
|
|
Changes in the net
realizable value of agricultural products after
harvest
|
(74
)
|
208
|
(282
)
|
-
|
-
|
-
|
-
|
-
|
-
|
-
|
-
|
-
|
(74
)
|
208
|
(282
)
|
-
|
-
|
-
|
-
|
-
|
-
|
-
|
-
|
-
|
-
|
-
|
-
|
(74
)
|
208
|
(282
)
|
|
Gross
profit / (loss)
|
573
|
1,000
|
(427
)
|
3,401
|
2,625
|
776
|
19,312
|
7,825
|
11,487
|
22,713
|
10,450
|
12,263
|
23,286
|
11,450
|
11,836
|
(19
)
|
(41
)
|
22
|
(11,680
)
|
(4,544
)
|
(7,136
)
|
(27
)
|
(13
)
|
(14
)
|
(14
)
|
(1
)
|
(13
)
|
11,546
|
6,851
|
4,695
|
|
Net gain from fair
value adjustment of investment properties
|
331
|
22
|
309
|
4,489
|
18,167
|
(13,678
)
|
374
|
(271
)
|
645
|
4,863
|
17,896
|
(13,033
)
|
5,194
|
17,918
|
(12,724
)
|
(193
)
|
(379
)
|
186
|
(113
)
|
(23
)
|
(90
)
|
-
|
-
|
-
|
-
|
-
|
-
|
4,888
|
17,516
|
(12,628
)
|
|
Gain from disposal of
farmlands
|
280
|
(2
)
|
282
|
-
|
-
|
|
-
|
-
|
|
-
|
-
|
-
|
280
|
(2
)
|
282
|
-
|
-
|
-
|
-
|
-
|
-
|
-
|
-
|
-
|
-
|
-
|
-
|
280
|
(2
)
|
282
|
|
General and
administrative expenses
|
(411
)
|
(315
)
|
(96
)
|
(683
)
|
(487
)
|
(196
)
|
(3,173
)
|
(1,360
)
|
(1,813
)
|
(3,856
)
|
(1,847
)
|
(2,009
)
|
(4,267
)
|
(2,162
)
|
(2,105
)
|
7
|
5
|
2
|
624
|
200
|
424
|
-
|
-
|
-
|
8
|
7
|
1
|
(3,628
)
|
(1,950
)
|
(1,678
)
|
|
Selling
expenses
|
(500
)
|
(338
)
|
(162
)
|
(355
)
|
(264
)
|
(91
)
|
(13,093
)
|
(5,442
)
|
(7,651
)
|
(13,448
)
|
(5,706
)
|
(7,742
)
|
(13,948
)
|
(6,044
)
|
(7,904
)
|
7
|
8
|
(1
)
|
9,434
|
3,862
|
5,572
|
-
|
-
|
-
|
4
|
1
|
3
|
(4,503
)
|
(2,173
)
|
(2,330
)
|
|
Other operating
results, net
|
75
|
(80
)
|
155
|
(68
)
|
(12
)
|
(56
)
|
(196
)
|
(32
)
|
(164
)
|
(264
)
|
(44
)
|
(220
)
|
(189
)
|
(124
)
|
(65
)
|
(5
)
|
(2
)
|
(3
)
|
64
|
19
|
45
|
-
|
-
|
-
|
2
|
(3
)
|
5
|
(128
)
|
(110
)
|
(18
)
|
|
Management
fees
|
-
|
-
|
-
|
-
|
-
|
-
|
-
|
-
|
-
|
-
|
-
|
-
|
-
|
-
|
-
|
-
|
-
|
-
|
-
|
-
|
-
|
(200
)
|
(534
)
|
334
|
-
|
-
|
-
|
(200
)
|
(534
)
|
334
|
|
Profit
/ (Loss) from operations
|
348
|
287
|
61
|
6,784
|
20,029
|
(13,245
)
|
3,224
|
720
|
2,504
|
10,008
|
20,749
|
(10,741
)
|
10,356
|
21,036
|
(10,680
)
|
(203
)
|
(409
)
|
206
|
(1,671
)
|
(486
)
|
(1,185
)
|
(227
)
|
(547
)
|
320
|
-
|
4
|
(4
)
|
8,255
|
19,598
|
(11,343
)
|
|
Share of (loss) /
profit of associates and joint ventures
|
8
|
23
|
(15
)
|
(94
)
|
126
|
(220
)
|
105
|
123
|
(18
)
|
11
|
249
|
(238
)
|
19
|
272
|
(253
)
|
153
|
262
|
(109
)
|
(76
)
|
-
|
(76
)
|
-
|
-
|
-
|
-
|
-
|
-
|
96
|
534
|
(438
)
|
|
Segment
profit / (loss)
|
356
|
310
|
46
|
6,690
|
20,155
|
(13,465
)
|
3,329
|
843
|
2,486
|
10,019
|
20,998
|
(10,979
)
|
10,375
|
21,308
|
(10,933
)
|
(50
)
|
(147
)
|
97
|
(1,747
)
|
(486
)
|
(1,261
)
|
(227
)
|
(547
)
|
320
|
-
|
4
|
(4
)
|
8,351
|
20,132
|
(11,781
)
|
Agricultural
business
Below
is a summary analysis of the business lines of the Agricultural
business for the years ended June 30, 2017 and 2016
|
|
Agricultural production
|
Land transformation and sales
|
Corporate
|
Others
|
Total
|
||||||||||
|
|
06.30.17
|
06.30.16
|
Var.
|
06.30.17
|
06.30.16
|
Var.
|
06.30.17
|
06.30.16
|
Var.
|
06.30.17
|
06.30.16
|
Var.
|
06.30.17
|
06.30.16
|
Var.
|
|
|
(in million of Ps.)
|
||||||||||||||
|
Revenues
|
2,197
|
1,765
|
432
|
-
|
-
|
-
|
-
|
-
|
-
|
1,718
|
1,144
|
574
|
3,915
|
2,909
|
1,006
|
|
Costs
|
(1,810
)
|
(1,419
)
|
(391
)
|
(11
)
|
(9
)
|
(2
)
|
-
|
-
|
-
|
(1,574
)
|
(1,065
)
|
(509
)
|
(3,395
)
|
(2,493
)
|
(902
)
|
|
Initial
recognition and changes in the fair value of biological assets and
agricultural products at the point of harvest
|
127
|
376
|
(249
)
|
-
|
-
|
-
|
-
|
-
|
-
|
-
|
-
|
-
|
127
|
376
|
(249
)
|
|
Changes
in the net realizable value of agricultural products after
harvest
|
(74
)
|
208
|
(282
)
|
-
|
-
|
-
|
-
|
-
|
-
|
-
|
-
|
-
|
(74
)
|
208
|
(282
)
|
|
Gross profit / (loss)
|
440
|
930
|
(490
)
|
(11
)
|
(9
)
|
(2
)
|
-
|
-
|
-
|
144
|
79
|
65
|
573
|
1,000
|
(427
)
|
|
Net
gain from fair value adjustment of investment
properties
|
-
|
-
|
-
|
331
|
22
|
309
|
-
|
-
|
-
|
-
|
-
|
-
|
331
|
22
|
309
|
|
Gain
from disposal of farmlands
|
-
|
-
|
-
|
280
|
(2
)
|
282
|
-
|
-
|
-
|
-
|
-
|
-
|
280
|
(2
)
|
282
|
|
General
and administrative expenses
|
(254
)
|
(185
)
|
(69
)
|
(1
)
|
(1
)
|
-
|
(84
)
|
(76
)
|
(8
)
|
(72
)
|
(53
)
|
(19
)
|
(411
)
|
(315
)
|
(96
)
|
|
Selling
expenses
|
(370
)
|
(248
)
|
(122
)
|
-
|
-
|
-
|
-
|
-
|
-
|
(130
)
|
(90
)
|
(40
)
|
(500
)
|
(338
)
|
(162
)
|
|
Other
operating results, net
|
70
|
(82
)
|
152
|
-
|
-
|
-
|
-
|
-
|
-
|
5
|
2
|
3
|
75
|
(80
)
|
155
|
|
Profit / (Loss) from operations
|
(114
)
|
415
|
(529
)
|
599
|
10
|
589
|
(84
)
|
(76
)
|
(8
)
|
(53
)
|
(62
)
|
9
|
348
|
287
|
61
|
|
Share
of profit of associates and joint ventures
|
12
|
26
|
(14
)
|
-
|
-
|
-
|
-
|
-
|
-
|
(4
)
|
(3
)
|
(1
)
|
8
|
23
|
(15
)
|
|
Segment profit / (loss)
|
(102
)
|
441
|
(543
)
|
599
|
10
|
589
|
(84
)
|
(76
)
|
(8
)
|
(57
)
|
(65
)
|
8
|
356
|
310
|
46
|
219
Operations
Center in Argentina
Below
is a summary analysis of the business lines of the Operations
Center in Argentina for the years ended June 30, 2017 and
2016
|
|
Shopping Malls
|
Offices
|
Sales and developments
|
Hotels
|
Internacional
|
Corporate
|
Others
|
Total
|
||||||||||||||||
|
|
06.30.17
|
06.30.16
|
Var.
|
06.30.17
|
06.30.16
|
Var.
|
06.30.17
|
06.30.16
|
Var.
|
06.30.17
|
06.30.16
|
Var.
|
06.30.17
|
06.30.16
|
Var.
|
06.30.17
|
06.30.16
|
Var.
|
06.30.17
|
06.30.16
|
Var.
|
06.30.17
|
06.30.16
|
Var.
|
|
|
(in million of Ps.)
|
|||||||||||||||||||||||
|
Revenues
|
3,047
|
2,409
|
638
|
434
|
332
|
102
|
99
|
8
|
91
|
725
|
534
|
191
|
-
|
-
|
-
|
-
|
-
|
-
|
6
|
1
|
5
|
4,311
|
3,284
|
1,027
|
|
Costs
|
(350
)
|
(250
)
|
(100
)
|
(29
)
|
(25
)
|
(4
)
|
(43
)
|
(20
)
|
(23
)
|
(484
)
|
(362
)
|
(122
)
|
-
|
-
|
-
|
-
|
-
|
-
|
(4
)
|
(2
)
|
(2
)
|
(910
)
|
(659
)
|
(251
)
|
|
Gross profit / (loss)
|
2,697
|
2,159
|
538
|
405
|
307
|
98
|
56
|
(12
)
|
68
|
241
|
172
|
69
|
-
|
-
|
-
|
-
|
-
|
-
|
2
|
(1
)
|
3
|
3,401
|
2,625
|
776
|
|
Net
gain from fair value adjustment of investment
properties
|
2,068
|
16,132
|
(14,064
)
|
1,373
|
1,226
|
147
|
849
|
773
|
76
|
-
|
-
|
-
|
-
|
-
|
-
|
-
|
-
|
-
|
199
|
36
|
163
|
4,489
|
18,167
|
(13,678
)
|
|
General
and administrative expenses
|
(261
)
|
(179
)
|
(82
)
|
(70
)
|
(85
)
|
15
|
(40
)
|
(24
)
|
(16
)
|
(135
)
|
(103
)
|
(32
)
|
(43
)
|
(24
)
|
(19
)
|
(132
)
|
(72
)
|
(60
)
|
(2
)
|
-
|
(2
)
|
(683
)
|
(487
)
|
(196
)
|
|
Selling
expenses
|
(188
)
|
(145
)
|
(43
)
|
(46
)
|
(24
)
|
(22
)
|
(21
)
|
(23
)
|
2
|
(97
)
|
(69
)
|
(28
)
|
-
|
-
|
-
|
-
|
-
|
-
|
(3
)
|
(3
)
|
-
|
(355
)
|
(264
)
|
(91
)
|
|
Other
operating results, net
|
(58
)
|
(63
)
|
5
|
(12
)
|
(6
)
|
(6
)
|
(36
)
|
(34
)
|
(2
)
|
(1
)
|
(2
)
|
1
|
27
|
92
|
(65
)
|
-
|
-
|
-
|
12
|
1
|
11
|
(68
)
|
(12
)
|
(56
)
|
|
Profit / (Loss) from operations
|
4,258
|
17,904
|
(13,646
)
|
1,650
|
1,418
|
232
|
808
|
680
|
128
|
8
|
(2
)
|
10
|
(16
)
|
68
|
(84
)
|
(132
)
|
(72
)
|
(60
)
|
208
|
33
|
175
|
6,784
|
20,029
|
(13,245
)
|
|
Share
of profit of associates and joint ventures
|
-
|
-
|
-
|
-
|
-
|
-
|
14
|
5
|
9
|
-
|
-
|
-
|
(196
)
|
(130
)
|
(66
)
|
-
|
-
|
-
|
88
|
251
|
(163
)
|
(94
)
|
126
|
(220
)
|
|
Segment profit / (loss)
|
4,258
|
17,904
|
(13,646
)
|
1,650
|
1,418
|
232
|
822
|
685
|
137
|
8
|
(2
)
|
10
|
(212
)
|
(62
)
|
(150
)
|
(132
)
|
(72
)
|
(60
)
|
296
|
284
|
12
|
6,690
|
20,155
|
(13,465
)
|
Operations
Center in Israel
Below
is a summary analysis of the business lines of the Operations
Center in Israel for the years ended June 30, 2017 and
2016
|
|
Real Estate
|
Supermarkets
|
Telecommunications
|
Corporate
|
Others
|
Total
|
||||||||||||
|
|
06.30.17
|
06.30.16
|
Var.
|
06.30.17
|
06.30.16
|
Var.
|
06.30.17
|
06.30.16
|
Var.
|
06.30.17
|
06.30.16
|
Var.
|
06.30.17
|
06.30.16
|
Var.
|
30.06.17
|
30.06.16
|
Var.
|
|
|
(in million of Ps.)
|
|||||||||||||||||
|
Revenues
|
4,918
|
1,538
|
3,380
|
47,277
|
18,610
|
28,667
|
15,964
|
6,655
|
9,309
|
-
|
-
|
-
|
263
|
274
|
(11
)
|
68,422
|
27,077
|
41,345
|
|
Costs
|
(2,333
)
|
(467
)
|
(1,866
)
|
(35,432
)
|
(14,076
)
|
(21,356
)
|
(11,183
)
|
(4,525
)
|
(6,658
)
|
-
|
-
|
-
|
(162
)
|
(184
)
|
22
|
(49,110
)
|
(19,252
)
|
(29,858
)
|
|
Gross profit / (loss)
|
2,585
|
1,071
|
1,514
|
11,845
|
4,534
|
7,311
|
4,781
|
2,130
|
2,651
|
-
|
-
|
-
|
101
|
90
|
11
|
19,312
|
7,825
|
11,487
|
|
Net
gain from fair value adjustment of investment
properties
|
261
|
(294
)
|
555
|
113
|
23
|
90
|
-
|
-
|
-
|
-
|
-
|
-
|
-
|
-
|
-
|
374
|
(271
)
|
645
|
|
General
and administrative expenses
|
(290
)
|
(100
)
|
(190
)
|
(627
)
|
(203
)
|
(424
)
|
(1,592
)
|
(708
)
|
(884
)
|
(384
)
|
(321
)
|
(63
)
|
(280
)
|
(28
)
|
(252
)
|
(3,173
)
|
(1,360
)
|
(1,813
)
|
|
Selling
expenses
|
(91
)
|
(29
)
|
(62
)
|
(9,517
)
|
(3,907
)
|
(5,610
)
|
(3,406
)
|
(1,493
)
|
(1,913
)
|
-
|
-
|
-
|
(79
)
|
(13
)
|
(66
)
|
(13,093
)
|
(5,442
)
|
(7,651
)
|
|
Other
operating results, net
|
46
|
(19
)
|
65
|
(52
)
|
(13
)
|
(39
)
|
(36
)
|
-
|
(36
)
|
(48
)
|
-
|
(48
)
|
(106
)
|
-
|
(106
)
|
(196
)
|
(32
)
|
(164
)
|
|
Profit / (Loss) from operations
|
2,511
|
629
|
1,882
|
1,762
|
434
|
1,328
|
(253
)
|
(71
)
|
(182
)
|
(432
)
|
(321
)
|
(111
)
|
(364
)
|
49
|
(413
)
|
3,224
|
720
|
2,504
|
|
Share
of profit of associates and joint ventures
|
46
|
226
|
(180
)
|
75
|
-
|
75
|
-
|
-
|
-
|
-
|
-
|
-
|
(16
)
|
(103
)
|
87
|
105
|
123
|
(18
)
|
|
Segment profit / (loss)
|
2,557
|
855
|
1,702
|
1,837
|
434
|
1,403
|
(253
)
|
(71
)
|
(182
)
|
(432
)
|
(321
)
|
(111
)
|
(380
)
|
(54
)
|
(326
)
|
3,329
|
843
|
2,486
|
220
Revenues - Fiscal year 2017 compared to fiscal year
2016
Total
revenues from sales, rentals and services, according to business
segment reporting, rose by 130.4%, from Ps.33,270 million in fiscal
year 2016 to Ps.76,648 million in fiscal year 2017. This was mainly
due to a Ps.1,006 million increase in the Agricultural Business and
a Ps.42,372 million increase in the Urban Properties and
Investments Business. Within the Urban Properties and Investments
Business, the change is attributable to the Operations Center in
Israel by Ps.41,345 million and to the Operations Center in
Argentina by Ps.1,027 million.
Agricultural
Business
Total
revenues, according to the income statement, rose by 38.1%, from
Ps.2,710 million in fiscal year 2016 to Ps.3,742 in fiscal year
2017, as consequence of: a Ps.474 million increase and a Ps.558
million increase in the Agricultural Production segment and in the
Others segment, respectively.
In
turn, revenues from our interests in joint ventures declined by 50%
from Ps.60 million in fiscal year 2016 to Ps.30 million in fiscal
year 2017, mainly as a consequence of a 74.5% decline in crops sold
in Cresca, from Ps.51 million in fiscal year 2016 to Ps.13 million
in fiscal year 2017.
On the
other hand, inter-segment revenues rose by 2.9%, from Ps.139
million in fiscal year 2016 to Ps.143 million in fiscal year 2017,
mainly as a result of the leases of croplands between our
subsidiary BrasilAgro and its subsidiaries, which were reclassified
from the Agricultural Production segment to the Rentals and
Services segment and also as a result of revenues from cattle sales
to our subsidiary Carnes Pampeanas, which was reclassified from the
Agricultural Production segment to the Others segment.
Hence,
according to business segment reporting and considering all our
joint ventures and inter-segment eliminations, revenues increased
by 34.6%, from Ps.2,909 million in fiscal year 2016 to Ps.3,915
million in fiscal year 2017.
Agricultural Production.
Total revenues
from the Agricultural Production segment rose by 24.4% from
Ps.1,765 million in fiscal year 2016 to Ps.2,197 million in fiscal
year 2017, primarily as a consequence of:
● a Ps.249
million increase in revenues from crop sales, as a result of a
36.9% increase in the average price of crops sold, from Ps.2,226
per ton in fiscal year 2016 to Ps.3,049 per ton in fiscal year
2017; partially offset by a decline of 57,807 tons in the volume of
crops sold during fiscal year 2017 compared to the previous fiscal
year;
● a Ps.61
million increase in revenues from sugarcane sales, mainly
attributable to a 62.3% rise in the average price of sugarcane
sold, from Ps.241.2 per ton in fiscal year 2016 to Ps.391.5 per ton
in fiscal year 2017; and a decline of 312,880 tons (25.7%) in the
volume of sugarcane sold in fiscal year 2017 compared to the
previous fiscal year, primarily attributable to
BrasilAgro;
● a Ps.61
million increase in rental and services revenues, primarily
attributable to a 450% increase in revenues from seed production
primarily caused by an increase in the number of hectares used for
agricultural purposes, and an 11% increase in the selling price;
offset by a 18% decline in the average yield; and
● a Ps.61
million increase in revenues from sales of cattle and
milk.
Others.
Total revenues from the Others
segment increased by 50.2% from Ps.1,144 million in fiscal year
2016 to Ps.1,718 million in fiscal year 2017, as a consequence
of:
● a Ps.358
million rise in revenues from the Agro-industrial segment,
primarily as a consequence of a 30.3% increase in exports, a 35.3%
increase in sales to the domestic market, and a 50% increase in
sales of by-products. Domestic consumption prices exhibited an
upward trend and were 23% higher than in fiscal year 2016. Export
prices rose by 21.03% in Argentine Pesos in fiscal year 2017
compared to 2016, with an 8.5% increase in the slaughtering volume,
from 6,415 head per month in fiscal year 2016 to 6,960 in fiscal
year 2017;
● a Ps.65
million increase in sales of supplies;
● a Ps.77
million increase in sales on consignment;
● a Ps.4
million rise in commodity brokerage services;
● a Ps.42
million increase in supply and crop exchange transactions;
and
● a Ps.35
million rise in coverage, advertising, storage and other
services.
Urban
Properties and Investments Business
Revenues from
sales, leases and services, according to the income statement
increased by Ps.14,092 million, a 109.1% up from Ps.12,912 million
during fiscal year 2016 to Ps.27,004 million during fiscal year
2017 (out of which Ps.68,422 million were generated the Operations
Center in Israel compensated with the effect of the deconsolidation
of Shufersal for Ps.47.168 and Ps.5,750 million were generated in
the Operations Center in Argentina).
221
Revenues from
sales, leases and services in the operations Center In Israel are
not comparable year to year due to two main factors: (i) the
results of operations for the fiscal year ended June 30, 2016
include only six months of operations from the operations from the
Operations center in Israel, from October 11, 2015 (the date we
acquired control of IDBD) through March 31, 2016 (adjusted by such
material transactions occurred between April 1, 2016 and June 30,
2016,) while the results of operations for the fiscal year ended
June 30, 2017 include twelve months of operations from the
operations centers in Israel, from April 1, 2016 through March 31,
2017 (adjusted by such material transactions occurred between April
1st, 2017 and June 30, 2017) and (ii) fluctuations between the
Israeli Shekel, the functional currency of the Operation Center in
Israel and the Argentine Peso, our reporting currency, i.e. the
Israeli Shekel appreciated approximately 24% from 2016 to
2017.
In
turn, revenues from expenses and collective promotion fund
increased by 24.8%, from Ps.1,194 million (of which Ps.1,101
million are allocated to the Shopping Malls segment and Ps.93
million are allocated to the Offices segment within the Operations
Center in Argentina) during fiscal year 2016 to Ps.1,490 million
(of which Ps.1,375 million are allocated to the Shopping Malls
segment and Ps.115 million are allocated to the Offices segment
within the Operation Center in Argentina) during fiscal year
2017.
Furthermore,
revenues from interests in our joint ventures showed a 41.4%
increase, up from Ps.29 million during fiscal year 2016 (of which
Ps.20 million are allocated to the Shopping Malls segment, Ps.4
million to the Offices segment, and Ps.5 million to the Sales and
Developments segment within the Operations Center in Argentina) to
Ps.41 million during fiscal year 2017 (of which Ps.26 million are
allocated to the Shopping Malls segment, Ps.14 million to the
Offices segment, and Ps.1 million to the Sales and Developments
segment within the Operations Center in Argentina) during fiscal
year 2017.
Finally,
inter-segment revenues increased by 42.9%, from Ps.7 million during
fiscal year 2016 (of which Ps.6 million are allocated to the
Offices segment and Ps.1 million to the Hotels segment within the
Operations Center in Argentina) to Ps.10 million during fiscal year
2017 (of which Ps.7 million are allocated to the Offices segment
and Ps.3 million to the Hotels segment within the Operations Center
in Argentina).
Thus,
according to business segment reporting (taking into consideration
the revenues from our joint ventures and without considering the
revenues from expenses and collective promotion fund or
inter-segment revenues), revenues grew by Ps.42,372 million from
Ps.30,361 million during fiscal year 2016 to Ps.72,733 million
during fiscal year 2017 (of which Ps.68,422 million are derived
from the Operations Center in Israel and Ps.4,311 million are
derived from the Operations Center in Argentina).
Operations
Center in Argentina
Shopping Malls.
Revenues from the
Shopping Malls segment increased by 26.5% from Ps.2,409 million
during the 2016 fiscal year to Ps.3,047 million during the 2017
fiscal year. This increase is mainly attributable to: (i) an
increase of Ps.408 million in revenues from fixed and variable
leases as a result of a 19.4% increase in our tenants' total sales,
which went from Ps.42 million during fiscal year 2016 to Ps.50
million during fiscal year 2017; (ii) an increase of Ps.55 million
in revenue from admission rights, (iii) an increase of Ps.40
million in parking revenues, and (iv) an increase of Ps.135 million
in fee income, among other concepts.
Offices.
Revenues from the Offices
segment increased by 30.7% from Ps.332 million in 2016 to Ps.434
million in fiscal year 2017. They were affected by the partial
sales of investment properties made during the year 2017, which
generated a reduction in the total leasable area of the segment.
Lease revenue increased by 28.8%, from Ps.324 million during the
year ended June 30, 2016 to Ps.419 million during the year ended
June 30, 2017, mainly as a result of the devaluation.
Sales and developments.
Revenues from
the Sales and Developments segment registered an increase of Ps.91
million, from Ps.8 million during fiscal year 2016 to Ps.99 million
during fiscal year 2017. This segment often varies significantly
from one period to another due to the no recurrence of the
different sales operations carried out by the Company over time.
This increase is mainly due to the sales of the Beruti flats and
parking spaces in Rosario.
Hotels.
Revenues from our Hotels segment
increased 35.8% from Ps.534 million in 2016 to Ps.725 million in
2017, mainly due to an increase in the average room rate of our
hotel portfolio (measured in pesos).
Others.
Revenues from our Others segment
increased 500.0% from Ps.1 million in 2016 to Ps.6 million in
2017.
Operations
Center in Israel
Real estate.
Revenues from the Real
estate segment increased from Ps.1,538 million during fiscal year
2016 to Ps.4,918 million during fiscal year 2017. This variation
was due to (i) the comparability of the figures, (ii) a revaluation
of 24 % of the Shekel against the Argentine peso, and (iii) an
increase in the occupancy of the residential apartments during
2017, which allowed the sale to be accounted for.
Supermarkets.
Revenue from the
Supermarket segment increased from Ps.18,610 million during the
fiscal year 2016 to Ps.47,277 million during the fiscal year 2017.
This variation was due to (i) the comparability of the figures,
(ii) a revaluation of 24% of the Shekel against the Argentine
peso.
Telecommunications.
Revenues from the
Telecommunications segment increased from Ps.6,655 million during
the fiscal year 2016 to Ps.15,964 million during the fiscal year
2017. This variation was due to (i) the comparability of the
figures, (ii) a revaluation of 24% of the Shekel against the
Argentine peso.
222
Others.
Others segment revenues
decreased from Ps.274 million during fiscal year 2016 to Ps.263
million during fiscal year 2017. This variation was due to (i) the
comparability of the figures, (ii) a revaluation of 24% of the
Shekel against the Argentine peso, and (iii) the sale of some
DIC’s assets that generate income.
Costs - Fiscal year 2017 compared to fiscal year 2016
The
costs, according to business segment reporting, rose by 138.4%,
from Ps.22,404 million in fiscal year 2016 to Ps.53,415 million in
fiscal year 2017. This was due to a Ps.902 million increase in the
Agricultural Business and a Ps. 30,109 million increase in the
Urban Properties and Investments Business. Within the Urban
Properties and Investments Business, the change is attributable to
the Operations Center in Israel by Ps. 29,858 million and to
the Operations Center in Argentina by Ps. 251
million.
Agricultural
Business
Total
costs, according to the income statement, rose by 40.7%, from
Ps. 2,344 million in fiscal year 2016 to Ps. 3,299
million in fiscal year 2017, as a consequence of: a Ps. 427
million rise in the Agricultural Production segment; a Ps. 2
million increase in the Land Transformation and Sales segment, and
a Ps. 526 million increase in the Others segment.
In
turn, the cost of our joint ventures experienced a net decline of
Ps. 34 million, from Ps. 61 million in fiscal year 2016
to Ps. 27 million in fiscal year 2017, mainly as a consequence
of a Ps. 40 million decrease in the costs of Cresca’s
crops, from Ps. 51 million in fiscal year 2016 to Ps. 11
million in fiscal year 2017.
Similarly,
inter-segment costs fell by Ps. 19 million, from Ps. 88
million in fiscal year 2016 to Ps. 69 million in fiscal year
2017, mainly as a result of the decline in costs of cattle sales
during the year with our subsidiary Carnes Pampeanas, which were
reclassified from revenues from the Agricultural Production segment
(Cattle business) to costs of the Others segment (Agro-industrial
business). Hence, according to business segment reporting and
considering all our joint ventures and inter-segment eliminations,
costs increased by 36.2%, from Ps. 2,493 million in fiscal
year 2016 to Ps. 3,395 million in fiscal year
2017.
Agricultural Production.
Costs from the
Agricultural Production segment rose by 27.6% from Ps. 1,419
million in fiscal year 2016 to Ps. 1,810 million in fiscal
year 2017, primarily as a consequence of:
● a
Ps. 238 million increase in costs of crop sales, mainly
attributable to a 11.2% decline in the volume of tons sold relative
to the previous fiscal year; offset by a 41% rise in the average
cost per ton of crops sold in fiscal year 2017, from Ps. 1,817
in fiscal year 2016 to Ps. 2,563 in fiscal year 2017, due to
the higher average market price for crops;
● a
Ps. 89 million rise in costs of sugarcane sales, primarily
attributable to a 80.3% increase in the average price per ton of
sugarcane sold in fiscal year 2017, from Ps. 215.3 per ton in
fiscal year 2016 to Ps. 388.2 per ton in fiscal year 2017;
offset by a decline of 312,880 tons of sugarcane sold during fiscal
year 2017 compared to the previous fiscal year, particularly, by
our subsidiary BrasilAgro;
● a
Ps. 57 million increase in costs of sale of cattle and milk;
and
● a
Ps. 7 million rise in costs of rentals and
services.
Total
costs of our Agricultural Production segment, as a percentage of
revenues derived from this segment, increased from 80.4% in fiscal
year 2016 to 82.4% in fiscal year 2017.
Land Transformation and Sales.
Total
costs in the Land Transformation and Sales segment rose by 22.2%
from Ps. 9 million in fiscal year 2016 to Ps. 11 million
in fiscal year 2017.
Others.
Total costs in the Others
segment increased by 47.8% from Ps. 1,065 million in fiscal
year 2016 to Ps. 1,574 million in fiscal year 2017, primarily
as a consequence of:
● a
Ps. 378 million rise in agro-industrial costs due to an
inflationary context that hindered the increase in gross marginal
contribution. The reason for this increase is attributable to a
rise in the acquisition cost of all of its components, particularly
cattle, and to an increase in labor, to a lesser extent;
and
● a
Ps. 131 million increase primarily as a result of the
increased cost of sales of supplies, increased costs associated
with the brokerage business related to commodity trading
transactions, and increased costs of coverage, advertising and
storage services.
Total
costs in the Others segment, as a percentage of revenues derived
from this segment, declined from 93.1% in fiscal year 2016 to 91.6%
in fiscal year 2017.
Urban
Properties and Investments Business
Costs
increased by Ps.8,995 million, up from Ps.7,036 million during
fiscal year 2016 to Ps.16,031 million during fiscal year 2017 (out
of which Ps.49,110 million where generated in the Operations Center
in Israel compensated with the effect of the deconsolidation of
Shufersal for Ps.35,488 and Ps.2,409 million were generated in the
Operations Center in Argentina). Costs as a percentage of total
revenues experienced a slight increase from 54.5% during fiscal
year 2016 to 59.4% during fiscal year 2017.
223
The
costs, leases and services in the Operations Center in Israel are
not comparable year to year due to two main factors: (i) the
results of operations for the fiscal year ended June 30, 2016
include only six months of operations from the Operations Center in
Israel, from October 11, 2015 (the date control was acquired)
through March 31, 2016 (adjusted by such material transactions
occurred between April 1, 2016 and June 30, 2016.) While the
results of operations for the fiscal year ended June 30, 2017
include twelve months of operations from the Operations Center in
Israel, from April 1, 2016 through March 31, 2017 (adjusted by such
material transactions occurred between April 1, 2017 and June
30,2017) and (ii) fluctuations between the Israeli Shekel, the
functional currency of the Operations Center Israel and the
Argentine Peso, we reporting currency, i.e. the Israeli Shekel
appreciated approximately 24% from 2016 to 2017.
In
turn, costs from expenses and collective promotion fund increased
by 25.7%, from Ps.1,207 million during fiscal year 2016 (of which
Ps.1,113 million are allocated to the Shopping Malls segment and
Ps.94 million to the Offices segment within the Operations Center
in Argentina) to Ps.1,517 million during fiscal year 2017 (of which
Ps.1,399 million are allocated to the Shopping Malls segment and
Ps.118 million to the Offices segment within the Operations Center
in Argentina), mainly due to increased costs originated by our
Shopping Malls, which rose by 25.8% from Ps.1,113 million in fiscal
year 2016 to Ps.1,399 million in fiscal year 2017, mainly as a
result of: (i) an increase in maintenance, security, cleaning,
repair and other expenses of Ps.142 million (caused mainly by price
raises in security and cleaning services and in public utilities
rates); (ii) an increase in salaries, social security charges and
other personnel expenses of Ps.109 million; (iii) an increase in
taxes, rates and contributions, and other expenses of Ps.36
million, among others. Such change was also attributable to an
increase in expenses resulting from the Offices segment by Ps.23
million, from Ps.94 million during fiscal year 2016 to Ps.118
million during fiscal year 2017, mainly due to: (i) maintenance,
cleaning expenses, and rentals and expenses and others in the
amount of Ps.21 million; (ii) salaries and social security charges
by Ps.6 million; (iii) taxes, rates and contributions by Ps.4
million for the Operation Center in Argentina.
Operations
Center in Argentina
Shopping Malls.
Costs of the Shopping
Malls segment increased by 40.0%, from Ps.250 million during the
year 2016 to Ps.350 million during fiscal year 2017, mainly due to:
(i) an increase in leases costs and expenses for Ps.41 million;
(ii) an increase in maintenance, security, cleaning, repairs and
related expenses in Ps.30 million; (iii) an increase in salaries,
social security and other personnel administration expenses of
Ps.23 million and; (iv) an increase in fees and compensation for
services of Ps.3 million, among other items. The costs of the
Shopping Malls segment, measured as a percentage of the revenues of
this segment, increased from 10.4% during the year 2016 to 11.5%
during the year 2017.
Offices.
The costs of the Offices
segment increased by 16.0%, from Ps.25 million during the year 2016
to Ps.29 million during fiscal year 2017, mainly due to: (i) an
increase in taxes, rates and contributions of Ps.2 million; and
(ii) an increase in amortization and depreciation of Ps.2 million.
The costs of the Offices segment, measured as a percentage of the
revenues of this segment, decreased from 7.5% during the year 2016
to 6.7% during the year 2017.
Sales and developments.
Costs for this
segment often vary significantly from year to year due to the
non-recurrence of the different sales operations carried out by the
Company over time. The associated costs of our Sales and
development segment registered an increase of 115.0%, from Ps.20
million during the year 2016 to Ps.43 million during the year 2017.
The costs of the Sales and development segment, measured as a
percentage of the revenues of this segment decreased from 250.0%
during 2016 to 43.4% during fiscal year 2017.
Hotels.
The costs of the Hotels segment
increased by 33.7%, from Ps.362 million in 2016 to Ps.484 million
in 2017, mainly as a result of: (i) an increase of Ps.68 million in
costs of salaries, social security and other personnel expenses;
(ii) an increase of Ps.26 million in maintenance and repairs; (iii)
higher charges of Ps.30 million in food, beverages and other hotel
expenses, respectively. The costs of the Hotels segment, measured
as a percentage of the revenues of this segment, decreased from
67.8% during the year 2016 to 66.8% during the year
2017.
Others.
The Other segment costs did not
vary significantly with respect to 2016.
Operations
Center in Israel
Real estate.
Real estate segment costs
increased from Ps.467 million during fiscal year 2016 to Ps.2,333
million during the fiscal year 2017. This variation was due to (i)
the comparability of the figures, (ii) a revaluation of 24% of the
Shekel against the Argentine peso, and (iii) the occupation of
income generating projects in Israel., and the largest occupancy of
residential apartments. In addition, costs, as a percentage of the
revenue derived from this segment, represented 47.4% in 2017, while
it was 30.4% in 2016.
Supermarkets.
The costs of the
Supermarket segment increased from Ps 14,076 million during the
fiscal year 2016 to Ps 35,432 million during the fiscal year 2017.
This variation was due to (i) the comparability of the figures and
(ii) a revaluation of 24% of the Shekel against the Argentine peso.
In addition, costs, as a percentage of revenues derived from this
segment, represented 74.9%, in 2017, while it was 75.6% in
2016.
Telecommunications.
Costs of the
Telecommunications segment increased from Ps.4,525 million during
the fiscal year 2016 to Ps.11,183 million during the fiscal year
2017. This variation was due to (i) the comparability of the
figures and (ii) a revaluation of 24% of the Shekel against the
Argentine peso. In addition, costs, as a percentage of revenues
derived from this segment, represented 70.1%, in 2017, while it was
68.0% in 2016.
224
Others.
Other segment costs decreased
from Ps.184 million during fiscal year 2016 to Ps.162 million
during fiscal year 2017. This variation was due to (i) the
comparability of the figures, (ii) a revaluation of 24% of the
Shekel against the Argentine peso, and (iii) the sale of some
DIC’s assets. In addition, the costs, as a percentage of the
revenue derived from this segment, represented 61.6%, in 2017,
while it was 67.2% in 2016.
Initial recognition and changes in the fair value of biological
assets and agricultural produce at the point of harvest - Fiscal
year 2017 compared to fiscal year 2016
Revenues from
initial recognition and changes in the fair value of biological
assets and agricultural produce at the point of harvest, according
to the income statement, fell by 49.1%, from Ps. 401 million
in fiscal year 2016 to Ps. 204 million in fiscal year
2017.
In
turn, revenues from initial recognition and changes in the fair
value of biological assets and agricultural produce at the point of
harvest derived from our interests in joint ventures shrank by
126.9% from a gain of Ps. 26 million in fiscal year 2016 to a
loss of Ps. 7 million in fiscal year 2017.
On the
other hand, inter-segment revenues from initial recognition and
changes in the fair value of biological assets and agricultural
produce at the point of harvest rose by Ps. 19 million, from
Ps. 51 million in fiscal year 2016 to Ps. 70 million in
fiscal year 2017.
Hence,
according to business segment reporting and considering all our
joint ventures, revenues from initial recognition and changes in
the fair value of biological assets and agricultural produce at the
point of harvest declined by 66.2%, from Ps. 376 million in
fiscal year 2016 to Ps. 127 million in fiscal year 2017. Such
decline was mainly driven by:
● a
Ps. 174 million decline in profits from crop production,
primarily originating in Argentina due to lower margins per
hectare, mostly attributable to lower prices and increased
production costs and commercial expenses in respect of already
harvested soybean production and expected corn production, offset
by a positive change in Brazil, primarily as a consequence of
improved soybean yields which had been affected by a low level of
rains during the previous year, paired with a substantial positive
fluctuation in the exchange rate;
● a
Ps. 35 million decline in profits from sugarcane production,
primarily from Brazil as a consequence of a 13% fall in yields,
offset by a gain in expected production following the inclusion of
additional 15,000 productive hectares; and
● a
Ps. 33 million decline in profits from cattle production
primarily from Argentina, as a consequence of minor fluctuations in
prices for calves, heifers, cows and steer in fiscal year 2017
compared to the previous year; as well as a loss in Brazil in
fiscal year 2017 as costs outpaced revenues at the time of engaging
in this business.
Changes in the net realizable value of agricultural produce after
harvest - Fiscal year 2017 compared to fiscal year
2016
Revenues from
changes in the net realizable value of agricultural produce after
harvest, according to the income statement, experienced a
substantial decline, from a gain of Ps. 208 million in fiscal
year 2016 to a loss of Ps. 74 million in fiscal year 2017.
This fall was mainly caused in Argentina, as a consequence of: (i)
adjusted corn and soybean prices during the first half of 2017,
after prices had reached a record high by the end of June 2016, and
(ii) the widespread price increase that took place by the end of
the first half of 2016, caused by the elimination/reduction of
withholdings on the agricultural industry and the strong
devaluation of the Argentine Peso in respect of the US
dollar.
There
were neither interests in joint ventures nor inter-segment
eliminations in income from changes in the net realizable value of
agricultural produce after harvest; therefore, revenues derived
from changes in the net realizable value of agricultural produce
after harvest, according to business segment reporting, match the
figures disclosed in the income statement.
Gross Profits - Fiscal year 2017 compared to fiscal year
2016
As a
result of the above mentioned factors, the gross profit, according
to business segment reporting, rose by 103.4%, from Ps. 11,450
million in fiscal year 2016 to Ps. 23,286 million in fiscal
year 2017. This was primarily due to:
● a 42.7%
decline in the Agricultural Business, from Ps. 1,000 million
(gain) in fiscal year 2016 to Ps. 573 million in fiscal year
2017;
● a 146.8%
increase in the Operations Center in Israel at the Urban Properties
and Investments Business, from Ps. 7,825 million (gain) in
fiscal year 2016 to Ps. 19,312 million in fiscal year 2017;
and
● a 29.6%
increase in the Operations Center in Argentina at the Urban
Properties and Investments Business, from Ps. 2,625 million in
fiscal year 2016 to Ps. 3,401 million in fiscal year
2017.
Agricultural
Business
Gross
profit from the Agricultural Business fell by 42.7%, from
Ps. 1,000 million in fiscal year 2016 to Ps. 573 million
in fiscal year 2017.
Agricultural Production.
Gross profit
from this segment fell by 52.7% from Ps. 930 million in fiscal
year 2016 to Ps. 440 million in fiscal year 2017.
225
Land Transformation and Sales.
Gross
loss from this segment increased by 22.22% from Ps. 9 million
in fiscal year 2016 to Ps. 11 million in fiscal year
2017.
Others.
Gross profit from this segment
rose by 82.3% from Ps. 79 million in fiscal year 2016 to
Ps. 144 million in fiscal year 2017.
Urban
Properties and Investments Business
The
gross profit of Urban Properties and Investments Business,
according to the information by segments, increase by 117,3% from
Ps.10,450 million during fiscal year 2016 to Ps.22,713 million
during fiscal year 2017 (out of which Ps.19,312 million come from
the Operations Center in Israel and Ps.3,401 million from the
Operations Center in Argentina).
Operations
Center in Argentina
Shopping Malls.
The gross profit of the
Shopping Malls segment increased by 24.9%, from Ps.2,159 million
for the year 2016 to Ps.2,697 million during the fiscal year 2017,
mainly as a result of the increase in the total sales of our
tenants, giving as a result, higher percentage rents under our
lease agreements. The gross profit of the Shopping Malls segment as
a percentage of the segment's revenues decreased slightly from
89.6% during 2016, to 88.5% during fiscal year 2017.
Offices.
The gross profit of the Offices
segment increased by 31.9% from Ps.307 million for the year 2016 to
Ps.405 million during the fiscal year 2017. The gross profit of the
Offices segment, measured as a percentage of the revenues of this
segment, increased from 92.5% during fiscal year 2016 to 93.3%
during fiscal year 2017.
Sales and developments.
The gross result
of the Sales and developments segment increased by Ps.68 million,
going from a Ps.12 million losses for the year 2016 to a profit of
Ps.56 million during fiscal year 2017, mainly as a consequence of
the higher registered sales during fiscal year 2017 and the
decrease in maintenance and conservation costs of these
properties.
Hotels.
The gross profit of the Hotels
segment increased by 40.1% from Ps.172 million for the year 2016 to
Ps.241 million during the year 2017. The gross profit of the Hotels
segment, measured as a percentage of the revenues of this segment,
increased slightly from 32.4% during 2016 to 33.2% during fiscal
year 2017.
Others.
The gross profit of the Other
segment did not show variations between the years
presented.
Operations
Center in Israel
Real Estate.
The gross profit of the
Real Estate segment increased from Ps.1,071 million during the
fiscal year 2016 to Ps.2,585 million during the fiscal year 2017.
This variation was due to (i) the comparability of the figures and
(ii) a revaluation of 24% of the Shekel against the Argentine peso.
In 2017, gross profit as a percentage of revenues derived from this
segment represented 52.6%.
Supermarkets.
The gross profit of the
Supermarket segment increased from Ps.4,534 million during fiscal
year 2016 to Ps.11,845 million during the fiscal year 2017. This
variation was due to (i) the comparability of the figures and (ii)
a revaluation of 24% of the Shekel against the Argentine peso. In
2017, gross profit as a percentage of revenues derived from this
segment represented 25.1%.
Telecommunications.
The gross profit of
the Telecommunications segment increased from Ps.2,130 million
during fiscal year 2016 to Ps.4,781 million during the fiscal year
2017. This variation was due to (i) the comparability of the
figures and (ii) a revaluation of 24% of the Shekel against the
Argentine peso. In 2017, gross profit as a percentage of revenues
derived from this segment represented 29.9%.
Net gain from fair value adjustment of investment
properties
The
gain (loss) from fair value adjustment of the Company investment
properties fell by 71.0%, from Ps. 17,918 million in fiscal year
2016 to Ps. 5,193 million in fiscal year 2017. This was mainly due
to a Ps. 309 million increase in the Agricultural business and to a
Ps. 13,033 million decline in the Urban Properties and Investments
Business. Within the Urban Properties and Investments Business, the
change is attributable to the Operations Center in Israel (a gain
of Ps. 645 million) and to the Operations Center in Argentina (a
loss of Ps. 13,678 million).
Agricultural
Business
The
increase in the gain (loss) from fair value adjustment of
investment properties is mainly attributable to BrasilAgro since,
as of the previous year-end, there were no leased hectares and,
therefore, no gain (loss) from fair value adjustment of investment
properties was recorded, while as of the current year-end, there
were 6,300 leased hectares, particularly, in the Jatobá farm.
On the other hand, such results were offset by discontinued gains
from Cresud since last year a portion of Agroriego was leased and
such lease agreement was discontinued during the current
season.
226
Urban
Properties and Investments Business
Net
gain from fair value adjustment of investment properties, pursuant
to the income statement, decreased by Ps.12,937 million, from
Ps.17,494 million during fiscal year 2016 (of which a Ps.271
million loss derives from the Operations Center in Israel
compensated with the effect of the deconsolidation of Shufersal for
Ps.23 and a Ps.17,788 million income from the Operations Center in
Argentina) to Ps.4,557 million during fiscal year 2017 (of which
Ps.374 million derive from the Operations Center in Israel
compensated with the effect of the deconsolidation of Shufersal for
Ps.113 and Ps.4,296 million from the Operations Center in
Argentina).
The net
gain from fair value adjustment of investment properties, leases
and services in the Operations Center in Israel are not comparable
year to year due two main factors: (i) the results of operations
for the fiscal year ended Junes 30, 2016 include only six months of
operations from the Operations Center in Israel, from October 11,
2015 (the date control was acquired) through March 31, 2016
(adjusted by such material transactions occurred between April 1,
2016 and June 30, 2016) While the results of operations for the
fiscal year ended June 30, 2017 include twelve months of operations
from the Operations Center in Israel, from April1, 2016 through
March 31, 2017 (adjusted by such material transactions occurred
between April 1, 2017 and June 30, 2017) and (ii) fluctuations
between the Israeli Shekel, the functional currency of the
Operations Center Israel and the Argentine Peso, our reporting
currency, i.e. the Israeli Shekel appreciated approximately 24%
from 2016 to 2017.
Operations
Center in Argentina
The net
gain of changes in the fair value of our investment properties for
the fiscal year ended June 30, 2017 was Ps.4,489 million (Ps.2,068
million from our Shopping Malls segment, Ps.1,373 million from the
Offices segment and Ps.849 million from the Sales and Developments
segment and Ps.199 million from the Other segment).
The
significant increase in the peso values of our properties was
mainly due to: (i) a slight decrease of 16 basis points in the
discount rate used when applying the discounted cash flow valuation
methodology that increases the value of the investment properties;
which was mainly due to macroeconomic improvements that led to a
decrease in the cost of capital; and (ii) from June 2016 to June
2017, the Argentine peso depreciated close to 11% against the US
dollar (from Ps.14.99 per US$.1.00 to Ps.16.63 per US$.1.00) and
the value of our investment properties are referenced in dollars
since most of the real estate transactions in Argentina are made in
that currency.
The
significant increase in the value of our investment properties as
measured in Pesos was primarily due to:
(i) a
16 basis points decrease in the discount rate applied in
calculating the present value of the projected cash flows used to
estimate the fair value of our shopping mall properties that
resulted in an increase in value of Ps.725.6 million, mainly as a
result of a decrease in cost of debt for the Company from 7.50% to
5.15% explained by lower yields for the Company’s bonds
traded in the capital markets. In addition, a further improvement
in the prevailing conditions for capital raising by Argentine
entities, generated a 18 basis points decrease in the Country Risk
Premium from 4.85% to 4.67%. On the other hand, the Risk Free Rate
reached 2.35%, returning to 2015 levels and more than off-setting
improvements in the Country Risk Premium;
(ii) a
net positive impact of Ps.1,805.1 million generated by an increase
of Ps.4,537.3 million in the projected cash flows used to estimate
fair value of our shopping malls as a result of expected local
inflation, a decrease of Ps.5,524.5 million due to the conversion
into U.S. dollars of the projected cash flows considering estimated
forward US$/ARS exchange rates and a positive effect of Ps.2,792.3
million due to the conversion of the value in dollars of our
shopping malls into pesos at a higher exchange rate at year-end;
and
(iii)
our segments Offices and Sales and Developments, increased 2,222.0
million in the value of our properties as measured in pesos,
largely as a result of the Peso Depreciated in fiscal year 2017 by
approximately 10.6% against the U.S. dollar (from Ps. 15.04 to Ps.
16.63 to US$1.00) and higher value of our properties measured in
U.S. dollars.
Operations
Center in Israel
Real estate.
During fiscal year 2017,
the net result from changes in the fair value of investment
properties in the Real estate segment was Ps.261 million, which,
measured as a percentage of this segment's revenues, represented
5.3%. In 2016, the result of this segment was a loss of Ps.294
million. This variation is mainly due to the devaluation of the Las
Vegas project (Tivoli) and a small revaluation of the HSBC
building, offset by an increase in the fair value of the rest of
the investment properties.
Supermarkets.
During fiscal year 2017,
the net result of changes in the fair value of investment
properties in the Supermarkets segment was a gain of Ps.113
million. In 2016, the result of this segment was a gain of Ps.23
million.
Gain / (loss) from disposal of farmlands- Fiscal year 2017 compared
to fiscal year 2016
Profits
from the sale of farms derived by the Land Transformation and Sales
segment rose by 14,100%, from a loss of Ps. 2 million in fiscal
year 2016 to a gain of Ps. 280 million in fiscal year 2017, mainly
as a result of sales consummated this year and the lack of
operations the previous year.
Fiscal year 2017
On June
30, 2017, Yatay Agropecuaria S.A. sold the entire “Cuatro
Vientos” farm located in the Department of Santa Cruz,
Bolivia, to an independent third party, comprising 2,658 hectares
intended for sugarcane and agricultural production. The total price
for the transaction was US$ 14.23 million (US$ 5,280 per hectare)
(equivalent to Ps.222 million), out of which US$ 7.42 million was
already paid and the remaining balance of US$ 6.85 million, which
is secured by means of a first mortgage, will be settled on
December 28, 2017, along with the lifting of such mortgage. We have
recognized a gain of US$ 4.5 million (equivalent to Ps.76 million)
as a result of such transaction in fiscal year 2017.
227
●
In June 2017, BrasilAgro sold a fraction of 625 hectares in the
Jatobá farm, located in Jaborandi, State of Bahia. The price
for the transaction was 300 soybean bags per hectare or Rs.10.1
million (equivalent to Ps.41 million), out of which Rs.877 thousand
was already settled and the remaining balance will be paid in five
annual installments, beginning in July 2017. We have recognized a
gain of Ps.32.1million as a result of this
transaction.
●
On June 8, 2017, Cresud and Zander Express S.A. (holders in common
ownership of a 40% and 60% interest, respectively) passed the legal
title to Simplot Argentina S.R.L. of a 262-hectare parcel of land
located on National Route No. 7, in Luján de Cuyo, Province of
Mendoza. The total transaction price was US$ 2.2 million, amount
which had been paid in full at the time the legal title to the
property was conveyed. We have recognized a gain of Ps.11.8 million
as a result of this transaction.
●
In May 2017, BrasilAgro sold 1,360 hectares (including 918
developed and productive hectares) of “Araucária”,
an agricultural farm located in the District of Mineiros. The price
for this transaction was 280 soybean bags per hectare or Rs.17
million (equivalent to Ps.67 million), 35% of which will be cashed
within this year and the balance will be paid in five annual
installments. We have recognized a gain of Ps. 37.4 as a result of
this transaction.
●
In March 2017, BrasilAgro sold 274 hectares (including 196
developed and productive hectares) of its
“Araucária” farm. The transaction price was 1,000
soybean bags per hectare or Rs.13.2 million (equivalent to Ps.48
million), out of which 39,254 soybean bags, or Rs.2.4 million, were
already cashed and the balance will be paid in four annual
installments. We have recognized a gain of Ps.29.9 million as a
result of this transaction.
●
On June 10, 2015, BrasilAgro sold the remaining area of 27,745
hectares of the Cremaq farm located in the municipal district of
Baixa Grande do Ribeiro (Piaui). The transaction price was Rs.270
million (equivalent to Ps.694 million) and was fully paid. We
recorded a gain of Ps.525.9 million as a result of this transaction
in fiscal year 2015. Due to a contractual requirement that was
pending as of the date of the transaction concerning a license for
the dismantling of an additional area, the Company did not book a
portion of such gain. In March 2017, the Company fulfilled this
requirement and recognized a gain of Ps.21 million.
●
On July 5, 2016, Cresud sold the entire “El Invierno”
and “La Esperanza” farms, comprising 2,615 hectares
used for agriculture and located in the District of
“Rancul”, Province of La Pampa. The total transaction
price was US$ 6 million, out of which US$ 5 million were
already paid and the remaining balance of US$ 1 million, secured
with a mortgage on the estate, will be paid in five equal,
consecutive and annual installments, with the last one being
payable in August 2021. We have recognized a gain of Ps. 71.6
million as a result of this transaction.
General and Administrative Expenses
- Fiscal year 2017 compared to fiscal year 2016
Total
general and administrative expenses, according to business segment
reporting, rose by 97.4%, from Ps. 2,162 million in fiscal
year 2016 to Ps. 4,267 million in fiscal year 2017. This was
mainly due to an increase of Ps. 96 million in the
Agricultural Business and an increase of Ps. 2,009 million in
the Urban Properties and Investments Business. Within the Urban
Properties and Investments Business, the change is attributable to
the Operations Center in Israel by Ps. 1,813 million and to
the Operations Center in Argentina by Ps. 196
million.
Agricultural
Business
General
and Administrative Expenses from the Agricultural Business,
according to the income statement, rose by 31.5%, from Ps. 311
million in fiscal year 2016 to Ps. 409 million in fiscal year
2017. This was due to the following increases: Ps. 71 million
in the Agricultural Production segment, Ps. 8 million in the
Corporate segment, and Ps. 19 million in the Others
segment.
The
causes for the variation were: (i) the variation in Cresud’s
administrative expenses is mostly due to increases in expenses
associated to accountants’, IT and statutory auditors’
fees; (ii) an increase in general and administrative expenses of
our subsidiary BrasilAgro, mainly as a result of the integration of
Paraguay’s operations and our subsidiary FYO, due to
increased expenses associated to its business, particularly,
contracted services and salaries; and (iii) an increase in expenses
due to inflation.
In
turn, General and Administrative Expenses in our interests in joint
ventures declined by Ps. 2 million, from Ps. 4 million in
fiscal year 2016 to Ps. 2 million in fiscal year
2017.
Hence,
according to business segment reporting and considering all our
joint ventures and inter-segment eliminations, General and
Administrative Expenses increased by 30.5%, from Ps. 315
million in fiscal year 2016 to Ps. 411 million in fiscal year
2017.
Agricultural Production.
General and
administrative expenses associated with our Agricultural Production
segment rose by 37.3%, from Ps. 185 million in fiscal year
2016 to Ps. 254 million in fiscal year 2017, primarily as a
consequence of a Ps. 29 million increase in general and
administrative expenses attributable to crop operations, a
Ps. 19 million rise in expenses associated with the cattle
business, and a Ps. 18 million increase in expenses related to
sugarcane operations. General and Administrative Expenses, as a
percentage of revenues derived from this segment, experienced a
slight increase from 10.5% in fiscal year 2016 to 11.6% in fiscal
year 2017.
Land Transformation and Sales.
General
and Administrative Expenses related to our Land Transformation and
Sales segment remained steady at Ps. 1 million.
Corporate.
General and Administrative
Expenses associated with our Corporate segment rose by 10.5%, from
Ps. 76 million in fiscal year 2016 to Ps. 84 million in
fiscal year 2017, mainly as a consequence of rising expenses due to
inflation, partially offset by a decrease in accrued
directors’ fees.
228
Others.
General and Administrative
Expenses related to the Others segment increased by 35.8%, from
Ps. 53 million in fiscal year 2016 to Ps. 72 million in
fiscal year 2017. General and Administrative Expenses, as a
percentage of revenues derived from such segment, experienced a
slight decline from 4.6% in fiscal year 2016 to 4.2% in fiscal year
2017.
Urban
Properties and Investments Business
Total
general and administrative expenses, pursuant to the income
statement, increased by Ps.1,580 million, up from Ps.1,639 million
during fiscal year 2016 (of which Ps.1,360 million are attributable
to the Operations Center in Israel compensated with the effect of
the deconsolidation of Shufersal for Ps.200 and Ps.479 million to
the Operations Center in Argentina) to Ps.3,219 million during
fiscal year 2017 (of which Ps.3,173 million are attributable to the
Operations Center in Israel compensated with the effect of the
deconsolidation of Shufersal for Ps.624 and Ps.670 million to the
Operations Center in Argentina). Total general and administrative
expenses, as a percentage of revenues from sales, leases and
services, decreased slightly from 12.7% during fiscal year 2016 to
11.9% during fiscal year 2017.
General
administrative and expenses in the Operations Center in Israel are
not comparable year to year due two main factors: (i) the results
of operations for the fiscal year ended Junes 30, 2016 include only
six months of operations from the Operations Center in Israel, from
October 11, 2015 (the date control was acquired) through March 31,
2016 (adjusted by such material transactions occurred between April
1, 2016 and June 30, 2016) While the results of operations for the
fiscal year ended June 30, 2017 include twelve months of operations
from the Operations Center in Israel, from April1, 2016 through
March 31, 2017 (adjusted by such material transactions occurred
between April 1, 2017 and June 30, 2017) and (ii) fluctuations
between the Israeli Shekel, the functional currency of the
Operations Center Israel and the Argentine Peso, our reporting
currency, i.e. the Israeli Shekel appreciated approximately 24%
from 2016 to 2017.
In
turn, general and administrative expenses from our joint ventures
increased by Ps.4 million, from Ps.1 million in fiscal year 2016 to
Ps.5 million during fiscal year 2017.
Finally, general
and administrative expenses from inter-segment transactions did not
exhibit significant changes for the reported periods.
Therefore,
according to business segment reporting (taking into consideration
administrative expenses from our joint ventures and without
considering those related to expenses and collective promotion fund
or expenses related to inter-segment operations), general and
administrative expenses rose by Ps.2,009 million from Ps.1,847
million during fiscal year 2016 (of which Ps.1,360 million derive
from the Operations Center in Israel and Ps.487 million from the
Operations Center in Argentina) to Ps.3,856 million during fiscal
year 2017 (of which Ps.3,173 million are attributable to the
Operations Center in Israel and Ps.683 million to the Operations
Center in Argentina).
General and administrative
expenses as a percentage of revenues, pursuant to business segment
reporting, declined from 6.1% during fiscal year 2016 to 5.3%
during fiscal year 2017.
Operations
Center in Argentina
Shopping Malls.
The general and
administrative expenses of Shopping Malls increased by 45.8%, from
Ps.179 million in 2016 to Ps.261 million during fiscal year 2017,
mainly as a consequence of: (i) an increase of Ps.33 million in
salaries, social security and other personnel expenses; (ii) an
increase of Ps.25 million in fees and compensation for services;
(iii) an increase in fees to directors of Ps.14 million; and (iv)
an increase of Ps.7 million in maintenance expenses, repairs and
services, mobility and travel expenses, among other items. The
general and administrative expenses of Shopping Malls as a
percentage of this segment's revenues increased from 7.4% during
2016 to 8.6% during fiscal year 2017.
Offices.
The general and administrative
expenses of our Offices segment decreased by 17.6%, from Ps.85
million during fiscal year 2016 to Ps.70 million during fiscal year
2017, mainly as a result of: (i) a decrease of Ps.1 million in
salaries, social security and other personnel expenses and (ii) a
decrease in fees and compensation for services of Ps.15 million,
among other items offset by an increase in fees to Directors of
Ps.2 million. General and administrative expenses, measured as a
percentage of revenues in the same segment, decreased from 25.6%
during the year 2016 to 16.1% during fiscal year 2017.
Sales and developments.
General and
administrative expenses associated with our Sales and Developments
segment increased by Ps.16 million, from Ps.24 million during
fiscal year 2016 to Ps.40 million during fiscal year 2017, mainly
as a result of: (i) an increase in salaries, social security and
other personnel expenses of Ps.11 million; (ii) an increase in fees
to directors of Ps.2 million and; (iii) an increase of Ps.2 million
in maintenance, repairs and services expenses,
and (iv) an increase of
Ps.5 million
decrease in fees and compensation for services. General and
administrative expenses, measured as a percentage of revenues from
the same segment, decreased from 300.0% during the year 2016 to
40.4% during the year 2017.
Hotels.
General and administrative
expenses associated with our Hotels segment increased by 31.1% from
Ps.103 million during the year 2016 to Ps.135 million during fiscal
year 2017, mainly as a result of: (i) an increase of Ps.17 million
in salaries, social security and other personnel expenses; (ii) an
increase of Ps.6 million in maintenance, repairs and services
expenses; (iii) an increase of Ps.5 million in taxes, fees and
contributions and; (iv) an increase of Ps.5 million in the costs of
fees and compensation for services, among other items. General and
administrative expenses associated with the Hotels segment measured
as a percentage of this segment's revenues decreased from 19.3% in
2016 to 18.6% in fiscal year 2017.
International.
General and
administrative expenses associated with our International segment
increased by 79.2%, from Ps.24 million during the year 2016 to
Ps.43 million during fiscal year 2017, mainly by fees for services
incurred in connection with the investment in IDBD and Other
expenses.
229
Corporate.
General and administrative
expenses associated with our Corporate segment increased 83.3%,
from Ps.72 million during the year 2016 to Ps.132 million during
fiscal year 2017, mainly due to (i) an increase of Ps.19 million in
salaries, social security and other personnel expenses; (ii) an
increase of Ps.14 million in fees and compensation for services;
(iii) an increase of Ps.11 million in travel expenses, mobility and
office supplies and; (iv) an increase of Ps.8 million in fees to
directors, among other items.
Others.
General and administrative
expenses associated with our Other segment increased 100% from Ps.0
million in 2016 to Ps.2 million in 2017, mainly due to (i) an
increase of Ps.4 million in salaries, social charges and other
expenses of the staff compensated with a decrease in rents and
expenses.
Operations
Center in Israel
Real estate.
General and administrative
expenses for the Real Estate segment increased from Ps.100 million
during fiscal year 2016 to Ps.290 million during the fiscal year
2017. This variation was due to (i) the comparability of the
figures, (ii) a revaluation of 24% of the Shekel against the
Argentine peso, and (iii) a greater occupation of the investment
property and an increase in the number of employees.
Supermarkets.
The general and
administrative expenses of the Supermarkets segment increased from
Ps.203 million during the fiscal year 2016 to Ps.627 million during
the fiscal year 2017. This variation was due to (i) the
comparability of the figures, (ii) a revaluation of 24% of the
Shekel against the Argentine peso; and (iii) an increase in the
minimum salary accompanied by an increase in the number of
employees.
Telecommunications.
The general and
administrative expenses of the Telecommunications segment increased
from Ps.708 million during the fiscal year 2016 to Ps.1,592 million
during the fiscal year 2017. This variation was due to (i) the
comparability of the figures, (ii) a revaluation of 24% of the
Shekel against the Argentine peso, and (iii) an increase in the
efficiency of Cellcom that allowed to reduce expenses and the
decrease in depreciation and amortization expenses.
Corporate.
The general and
administrative expenses of the Corporate segment increased from
Ps.321 million during the fiscal year 2016 to Ps.384 million during
fiscal year 2017. This variation was due to (i) the comparability
of the figures, (ii) a revaluation of 24% of the Shekel against the
Argentine peso, and (iii) a considerable decrease in legal fees
during 2017.
Others.
General and administrative
expenses for the Others segment increased from Ps.28 million during
the fiscal year 2016 to Ps.280 million during the fiscal year 2017.
This variation was due to (i) the comparability of the figures,
(ii) a revaluation of 24% of the Shekel against the Argentine peso,
and (iii) an increase in payroll.
Selling Expenses - Fiscal year 2017 compared to fiscal year
2016
Total
selling expenses, according to business segment reporting,
increased by 130.8%, from Ps. 6,044 million in fiscal year
2016 to Ps. 13,948 million in fiscal year 2017. This was
primarily due to an increase of Ps. 162 million in the
Agricultural Business and an increase of Ps. 7,742 million in
the Urban Properties and Investments Business, which is
attributable to the Ps. 91 million increase in the Operations
Center in Argentina and the Ps. 7,651 million increase in the
Operations Center in Israel.
Agricultural
Business
Selling
expenses associated with our Agricultural Business, according to
the income statement, rose by 49.8%, from Ps. 331 million in
fiscal year 2016 to Ps. 496 million in fiscal year 2017. This
was due to increases of Ps. 125 million and Ps. 40
million in the Agricultural Production and Others segments,
respectively.
In
turn, selling expenses associated with our interests in joint
ventures declined by 60% from Ps. 5 million in fiscal year
2016 to Ps. 2 million in fiscal year 2017, in connection with
our Cresca joint venture.
Inter-segment
eliminations remained steady at Ps. 2 million in both fiscal
years.
Hence,
according to business segment reporting and considering all our
joint ventures and inter-segment eliminations, selling expenses
increased by 47.9%, from Ps. 338 million in fiscal year 2016
to Ps. 500 million in fiscal year 2017.
Agricultural Production.
Selling
expenses associated with the Agricultural Production segment fell
by Ps. 122 million, from Ps. 248 million in fiscal year
2016 to Ps. 370 million in fiscal year 2017, mainly as a
consequence of an increase of Ps. 113 million in crop selling
expenses. Selling expenses, as a percentage of revenues derived
from the Agricultural Production segment, increased from 14.1% in
fiscal year 2016 to 16.8% in fiscal year 2017.
Others.
Selling expenses associated with
the Others segment declined by Ps. 40 million, from
Ps. 90 million in fiscal year 2016 to Ps. 130 million in
fiscal year 2017, as a consequence of a Ps. 19 million
increase in selling expenses related to the operations of our
subsidiary FYO, and a Ps. 21 million increase in selling
expenses related to the agro-industrial business. Selling expenses,
as a percentage of revenues derived from the Others segment, fell
from 7.9 % during fiscal year 2016 to 7.6% during fiscal year
2017.
230
Urban
Properties and Investments Business
Total selling expenses of this business, pursuant
to the income statement, increased by Ps.2,165 million, up from
Ps.1,842 million during fiscal year 2016 to Ps.4,007 million during
fiscal year 2017 (of which Ps.13,093 million are attributable to
the Operations Center in Israel
compensated with the effect
of the deconsolidation of Shufersal for Ps.9,434
and Ps.348 million to the Operations Center in
Argentina). Selling expenses, as a percentage of revenues from
sales, leases and services, increased from 14.3% during fiscal year
2016 to 14.8% during fiscal year 2017.
In
turn, selling expenses associated to our joint ventures increased
by Ps.3 million from Ps.2 million in fiscal year 2016 to Ps.5
million in fiscal year 2017 for the Operation Center in
Argentina.
Therefore,
according to business segment reporting (taking into consideration
the selling expenses from our joint ventures and without
considering those related to expenses and collective promotion fund
or inter-segment expenses), selling expenses rose by Ps.7,742
million from Ps.5,706 million during fiscal year 2016 to Ps.13,448
million during fiscal year 2017 (of which Ps.13,093 million are
attributable to the Operations Center in Israel and Ps.355 million
to the Operations Center in Argentina). Without considering the
effect of the Operations Center in Israel, selling expenses rose by
34.5%. Selling expenses, as a percentage of revenues, pursuant to
business segment reporting, decreased from 18.8% during fiscal year
2016 to 18.5% during fiscal year 2017.
Operation Center in Argentina
Shopping Malls.
Selling expenses in the Shopping Malls
segment rose by 29.7%, up from Ps.145 million during fiscal year
2016 to Ps.188 million during fiscal year 2017, primarily as a
result of (i) higher taxes, rates and contributions of Ps.19
million, due to higher charges in gross income taxes; (ii) higher
loan loss charges of Ps.13 million; (iii) an increase in
advertising and other selling expenses of Ps.6 million; and (iv) an
increase of Ps.5 million in salaries, social securities and other
personnel expenses. Selling expenses, as a percentage of the
Shopping Malls segment’s revenues, rose from 6.0% during
fiscal year 2016 to 6.2% during fiscal year
2017.
Offices.
Selling expenses associated to our Offices segment
increased by 91.7%, from Ps.24 million during fiscal year 2016 to
Ps.46 million during fiscal year 2017. Such variation was mainly
due to higher loan loss charges of Ps.22 million, among other
factors. The selling expenses associated to our Offices segment, as
a percentage of this segment’s revenues, rose from 7.2%
during fiscal year 2016 to 10.6% during fiscal year
2017.
Sales and Developments.
Selling expenses for the Sales and
Developments segment decreased by Ps.2 million, from Ps.23 million
during fiscal year 2016 to Ps.21 million during fiscal year 2017,
mainly as a result of (i) a decrease in taxes, rates and
contributions of Ps.9 million; offset by (ii) an increase of Ps.3
million in salaries, social securities and other personnel
expenses; (iii) an increase in advertising and other selling
expenses of Ps.2 million; and (iv) higher loan loss charges of Ps.2
million.
Hotels.
Selling expenses associated to our Hotels segment
rose by 40.6%, from Ps.69 million during fiscal year 2016 to Ps.97
million during fiscal year 2017, mainly due to (i) an increase in
taxes, rates and contributions of Ps.35 million; and (ii) an
increase of Ps.9 million in salaries, social security and other
personnel expenses; among other factor,
and (iii) an
increase of Ps.11 million in advertising and other
selling expenses. Selling expenses associated to our Hotels segment
as a percentage of this segment’s revenues experienced a
slight increase from 12.9% during fiscal year 2016 to 13.4% during
fiscal year 2017.
Others.
Selling expenses associated to our Others segment
did not experience significant changes during the reported
periods.
Operation Center in Israel
Real Estate.
Selling expenses from the Real Estate
segment increased from Ps.29 million during fiscal year 2016 to
Ps.91 million during fiscal year 2017. Such variation was due to
(i) the comparability of the figures, (ii) a 24% revaluation of the
Shekel against the Argentine peso, and (iii) an increase in
marketing due to the higher efforts to increase the occupancy of
the investment properties and the promotion of new
projects.
Supermarkets.
Selling expenses from the Supermarket
segment increased from Ps.3,907 million during fiscal year 2016 to
Ps.9,517 million during fiscal year 2017. Such variation was due to
(i) the comparability of the figures and (ii) a 24% revaluation of
the Shekel against the Argentine peso.
Telecommunications.
Selling
expenses from the Telecommunications segment increased from
Ps.1,493 million during fiscal year 2016 to Ps.3,406 million during
fiscal year 2017. Such variation was due to (i) the comparability
of the figures, (ii) a 24% revaluation of the Shekel against the
Argentine peso, and (iii) the increased efficiency measures which
were implemented by Cellcom, which led to a decrease in advertising
expenses and other expenses.
Others.
Selling expenses from the Others segment
increased from Ps.13 million during fiscal year 2016 to Ps.79
million during fiscal year 2017. Such variation was due to (i) the
comparability of the figures, (ii) a 24% revaluation of the Shekel
against the Argentine peso, and (iii) due to commission and other
commercial costs related to the sale of some
assets.
231
Other Operating results, net -
Fiscal year 2017 compared to fiscal year 2016
Other
Operating results, net, according to business segment reporting,
increased by Ps. 65 million, from a loss of Ps.124 million in
fiscal year 2016 to a loss of Ps. 189 million in fiscal year
2017. This was mainly due to a Ps. 220 million increase in the
Urban Properties and Investments Business (Ps. 56 million
attributable to the Operations Center in Argentina and Ps. 164
million attributable to the Operations Center in Israel), partially
offset by a Ps. 155 million decline in the Agricultural
Business.
Agricultural
Business
Other
Operating results, net associated with the Agricultural Business,
according to the income statement, rose from a loss of Ps. 78
million in fiscal year 2016 to a gain of Ps. 77 million in
fiscal year 2017.
In
turn, Other Operating results, net from our interests in joint
ventures experienced a 100% decrease by Ps. 1 million from
fiscal year 2016 to fiscal year 2017, in connection with our Cresca
joint venture.
Besides, there was
a 100% variation in inter-segment eliminations for Other Operating
results, net from a loss of Ps. 1 million in fiscal year 2016
to a loss of Ps. 2 million in fiscal year 2017.
Hence,
according to business segment reporting and considering all our
joint ventures and inter-segment eliminations, Other Operating
results, net went from a loss of Ps. 80 million in fiscal year
2016 to a profit of Ps. 75 million in fiscal year
2017.
Agricultural Production.
Other Operating
results, net associated with our Agricultural Production segment
increased by Ps. 152 million, from a loss of Ps. 82
million in fiscal year 2016 to a gain of Ps. 70 million in
fiscal year 2017, primarily as a result of BrasilAgro’s and
Cresud’s commodity derivatives.
Others.
Other Operating results, net
associated with the Others segment rose by Ps. 3 million, from
a gain of Ps. 2 million in fiscal year 2016 to Ps. 5
million in fiscal year 2017, primarily as a result of the
operations of our subsidiary FYO.
Urban
Properties and Investments Business
Other operating results, net, pursuant to the
income statement, declined by Ps.174 million, from a net loss of
Ps.32 million during fiscal year 2016 to a net loss of Ps.206
million during fiscal year 2017 (Ps.74 million from the Operations
Center in Argentina and Ps.196 million from the Operations Center
in Israel
compensated with the effect of the deconsolidation
of Shufersal for Ps.64
). Such decline
is mostly attributable to a decrease in the exchange difference as
a result of consolidating IDBD for Ps.107
million.
Other
operating results, net from our joint ventures increased by Ps.3
million, from Ps.2 million during fiscal year 2016 (of which a Ps.4
million gain is allocated to the Sales and Developments segment and
a loss of Ps.2 million is allocated to the Shopping Malls segment
within the Operations Center in Argentina) to Ps.5 million during
fiscal year 2017 (allocated in our Sales and Developments segment
within the Operations Center in Argentina).
Finally,
other operating results from inter-segment operations decrease by
Ps.5 million, from Ps.5 million during fiscal year 2016 (of which
Ps.4 million are allocated to the Sales and Developments segment
and Ps.1 million allocated to the Offices segment within the
Operations Center in Argentina) to Ps.0 million during fiscal year
2017.
Therefore,
according to business segment reporting (taking into consideration
the other operating results, net from our joint ventures and
without considering those related to inter-segment operations),
other operating results, net decreased by Ps.220 million from a net
loss of Ps.44 million during fiscal year 2016 to a net loss of
Ps.264 million during fiscal year 2017. Without considering the
effect of the Operations Center in Israel, Other operating results
declined by Ps.56 million.
Operation Center in Argentina
Shopping Malls.
The operating results,
net, of the Shopping Malls segment decreased by 7.9%, going from a
loss of Ps.63 million during the year 2016 to a loss of Ps.58
million during fiscal year 2017, mainly as a result of (i) a higher
expense for lawsuits and contingencies of Ps.11 million; (ii) a
higher expense for donations of Ps.8 million; partially offset by:
(iii) a lower loss in other as a result of the fair value
adjustment during FY 2016 and; (iv) a lower expense for project
evaluations of Ps.5 million. The operating results, net of this
segment, as a percentage of this segment's revenues, decreased from
2.6% during 2016 to 1.9% during fiscal year 2017.
Offices.
The operating results, net
associated with our Offices segment decreased Ps.6 million, from a
loss of Ps.6 million during the year 2016 to a loss of Ps.12
million during fiscal year 2017, mainly as a result of the result
from the sale and disposal of property, plant and equipment, among
other concepts.
Sales and developments.
The operating
results, net associated with our Sales and Developments segment
decreased by Ps.2 million, going from a loss of Ps.34 million
during the year 2016 to a loss of Ps.36 million during fiscal year
2017, mainly as a result of the by sale and disposal of property,
plant and equipment.
Hotels.
The operating results, net
associated with the Hotels segment increased by Ps.1 million,
mainly due to a higher expense for lawsuits and
contingencies.
232
International.
The operating results,
net of this segment decreased by 70.7%, going from a net profit of
Ps.92 million during the year 2016 to a net profit of Ps.27 million
during fiscal year 2017, mainly due to the decrease in profit
generated by the partial reversal of the cumulative translation
adjustment. As of June 30, 2016, it corresponds mainly to the
reversal of the translation adjustment before the business
combination of IDBD.
Others.
The operating results, net
associated with our Other segment increased by Ps.11 million, going
from a net gain of Ps.1 million during 2016 to Ps.12 million during
fiscal year 2017, due to other expenses from Entertainment Holdings
S.A.
Operations
Center in Israel
Real estate.
During fiscal year 2017,
the operating results, net of the Real Estate segment totaled a
gain of Ps.46 million, compared to a loss of Ps.19 million in 2016
due to an impairment of some properties, plant and
equipment.
Supermarkets
During fiscal year 2017,
the operating results, net of the Supermarkets segment represented
a loss of Ps.52 million compared to a loss of Ps.13 million in
2016. This variation was due to (i) the comparability of the
figures, (ii) a revaluation of 24% of the Shekel against the
Argentine peso, and (iii) an increase in the impairment of the
supermarket stores.
Telecommunications
During fiscal year
2017, the operating results, net of the Telecommunications segment,
represented a loss of Ps.36 million, not resulting in 2016. This
variation was due to the comparability of the figures.
Corporate.
During fiscal year 2017, the
operating results, net of the Corporate segment, represented a loss
of Ps.48 million. This variation was due to the increase in
donations.
Others.
During fiscal year 2017, the
operating results, net of the Other segment, represented a loss of
Ps.106 million. This variation was due to (i) the comparability of
the figures and (ii) an increase in research and development
expenses as well as donations.
Management fees - Fiscal year 2017
compared to fiscal year 2016
The
Company entered into a management agreement with Consultores Asset
Management S.A., which provides for the payment of a fee equivalent
to 10% of our profits as advisory fees in connection with all kinds
of matters related to businesses and investments in the
agricultural, real estate, financial, hotel and other sectors.
Management fees amounted to Ps. 200 million and Ps. 535 million in
fiscal year 2017 and 2016, respectively.
Profit from Operations - Fiscal year 2017 compared to fiscal year
2016
Our
total consolidated profit from operations, according to the income
statement, fell by 57.9% from Ps. 19,598 million in fiscal
year 2016 to Ps. 8,255 million in fiscal year 2017 (with
Ps. 356 being attributable to the Agricultural Business;
Ps. 6,369 to the Operations Center in Argentina at the Urban
Properties and Investments Business, and Ps. 1,530 to the
Operations Center in Israel).
Total
loss from operations from our joint ventures declined by 50.4%,
from Ps. 409 million in fiscal year 2016 to Ps. 203
million in fiscal year 2017, primarily due to a decline in net
income from changes in fair value of investment
properties.
On the
other hand, profit from operations related to common maintenance
expenses and collective promotion fund rose by 58.5%, from a loss
of Ps. 547 million in fiscal year 2016 to a loss of
Ps. 227 million in fiscal year 2017.
Profits
from operations derived from inter-segment operations did not
experience significant changes.
Hence,
according to business segment reporting (considering the profit
from operations from all our joint ventures and without considering
the profit from operations related to common maintenance expenses
and collective promotion fund and inter-segment operations), profit
from operations declined by 50.77% from Ps. 21,036 million in
fiscal year 2016 to Ps. 10,356 million in fiscal year 2017
(with Ps. 348 million being attributable to the Agricultural
Business, and Ps. 3,224 million and Ps. 6,784 million to
the Operations Center in Israel and the Operations Center in
Argentina, respectively, both centers of the Urban Properties and
Investments Business).
Agricultural
Business
Profits
from operations from the Agricultural Business increased by
Ps. 61 million (21.2%), from a gain of Ps. 287 million in
fiscal year 2016 to a gain of Ps. 348 million in fiscal year
2017.
Agricultural Production.
Profit from
operations from the Agricultural Production segment fell by
Ps. 529 million, from a gain of Ps. 415 million in fiscal
year 2016 to a loss of Ps. 114 million in fiscal year
2017.
Land Transformation and Sales.
Profit
from operations from the Land Transformation and Sales segment
increased by Ps. 589 million, from a gain of Ps. 10
million in fiscal year 2016 to a loss of Ps. 599 million in
fiscal year 2017.
Corporate.
Profit from operations from
the Corporate segment fell by Ps. 8 million from a loss of
Ps. 76 million in fiscal year 2016 to a loss of Ps. 84
million in fiscal year 2017.
Others.
Profit from operations from the
Others segment fell by Ps. 9 million from a loss of
Ps. 62 million in fiscal year 2016 to a loss of Ps. 53
million in fiscal year 2017.
233
Urban
Properties and Investments Business
Profit
from operations in this segment decrease by Ps.10.741 million, from
a profit of Ps. 20,749 million in fiscal year 2016 to a profit of
Ps. 10,008 million in fiscal year 2017.
The decrease is due to a decrease of Ps.13,245
million in the Operations Center in Argentina and an increase of
Ps.2,504 million in the Operations Center in
Israel.
Operation Center in Argentina
Shopping Malls.
Profit from operations
in our Shopping Malls segment decreased by 76.2%, from Ps.17,904
million in income during fiscal year 2016 to Ps.4,258 million in
income during fiscal year 2017. This change is mainly due to a
Ps.14,064 million decrease in net gain from fair value adjustment
of investment properties. Profit from operations associated to our
Shopping Malls segment, as a percentage of this segment’s
revenues, decreased from 743.2% during fiscal year 2016 to 139.7%
during fiscal year 2017.
Offices.
Profit from operations in our
Offices and Others segment rose by 16.4%, from Ps.1,418 million in
income during fiscal year 2016 to Ps.1,650 million in income during
fiscal year 2017. The main changes are attributable to higher
income from partial disposals of investment properties during
fiscal year 2017 and net loss from fair value adjustment of
investment properties (Ps.91 million), partially offset by an
increase in Selling Expenses of Ps.22 million.
Sales and Developments.
Profit from
operations in our Sales and Developments segment rose by 18.8%, up
from income of Ps.680 million during fiscal year 2016 to income for
Ps.808 million during fiscal year 2017. Such increase was mainly
due to higher income from sales of the floors in the Beruti
building and parking spaces in Rosario (Ps.91 million) and the net
loss from fair value adjustment of investment properties (Ps.76
million).
Hotels.
Profit from operations in the
Hotels segment grew by Ps.10 million, up from a loss of Ps.2
million during fiscal year 2016 to a gain of Ps.8 million in income
during fiscal year 2017. The rise in the average rate per room in
our hotel portfolio (in Pesos), generated an increase in revenues,
along with higher costs (Ps.125 million), general and
administrative expenses (Ps.32 million) and selling expenses (Ps.28
million), among others.
International.
Profit from operations in
our International segment decreased by Ps.84 million from Ps.68
million in income during fiscal year 2016 to a Ps.16 million loss
during fiscal year 2017. The main changes resulted from a decrease
in Other income and expenses of Ps.117 million.
Corporate.
Profit from operations in our
Corporate segment increased 83.3%, going from a loss of Ps.72
million during the year 2016 to a loss of Ps.132 million during
fiscal year 2017. Its main variations were due to the increase in
General and administrative expenses.
Others.
Profit from operations for our
Others segment exhibited a decrees of Ps.1754 million, from a Ps.33
million profit during fiscal year 2016 to a Ps.208 million profit
during fiscal year 2017, mainly as a result of a Ps.41 million net
loss from fair value adjustment of investment
properties.
Operation
Center in Israel
Real Estate.
Profit from operations from
the Real Estate segment increased from Ps.629 million during fiscal
year 2016 to Ps.2,511 million during fiscal year 2017. Such
variation was due to (i) the comparability of the figures, (ii) a
24% revaluation of the Shekel against the Argentine peso, and (iii)
to the occupancy of revenue-generating projects in Israel. Also the
recording of revenues from the sale of apartments and real estate
is affected by the timing of the occupation of apartments, which
was higher in 2017 a reduction of costs and a profit related to the
changes in fair value of investment properties.
Supermarkets.
Profit from operations
from the Supermarket segment rose from Ps.434 million during fiscal
year 2016 to Ps.1,762 million during fiscal year 2017. Such
variation was due to (i) the comparability of the figures, (ii) a
24% revaluation of the Shekel against the Argentine peso, and (iii)
the increase in franchisees, the increase in the share of the
private brand, the improvement in trade terms, the components of
the basket, the mix of sales, and the increased efficiency due to
the implementation of the business plan.
Telecommunications.
Profit from
operations from the Telecommunications segment increased from a
loss of Ps.71 million during fiscal year 2016 to a loss of Ps.253
million during fiscal year 2017. Such variation was due to (i) the
comparability of the figures, (ii) a 24% revaluation of the Shekel
against the Argentine peso, and (iii) the continued erosion in
income from services, which was partly offset by the decrease in
operating expenses, due to the increased efficiency measures which
were implemented by Cellcom.
Corporate.
The profit from operations of
the Corporate segment went from a loss of Ps.321 million during the
fiscal year 2016 to a loss of Ps.432 million during the fiscal year
2017. This variation was due to (i) the comparability of the
figures, (ii) a 24% revaluation of the Shekel against the Argentine
peso, and (iii) the decrease in legal fees.
Others.
Profit from operations from the
Others segment went from a gain of Ps.49 million during fiscal year
2016 to a loss of Ps.364 million during fiscal year 2017. Such
variation was due to (i) the comparability of the figures, (ii) a
24% revaluation of the Shekel against the Argentine peso, and (iii)
the lack of income derived by the sale of some revenue generating
assets.
234
Share of profit/(loss) of associates and joint ventures - Fiscal
year 2017 compared to fiscal year 2016
Share
of profit (loss) of associates and joint ventures, according to the
income statement, decrease by 82.0%, from a gain of Ps. 534
million in fiscal year 2016 to a gain of Ps. 96 million in
fiscal year 2017.
In
addition, our share of profit (loss) from our interests in joint
ventures, primarily from Cresca S.A. (Agricultural Production
segment), Nuevo Puerto Santa Fe S.A. (Shopping Malls segment),
Quality Invest S.A. (Offices and Others segment); and Cyrsa S.A.,
Puerto Retiro S.A. and Baicom Networks S.A. (Sales and Developments
segment), experienced a 41.6% decline, from a gain of Ps. 262
million in fiscal year 2016 to a gain of Ps. 153 million in
fiscal year 2017.
According to
business segment reporting, our share of profit/(loss) of
associates and joint ventures increased by 93.0% from a loss of
Ps. 272 million in fiscal year 2016 to a gain of Ps. 19
million in fiscal year 2017 (out of which a gain of Ps. 8
million is attributable to the Agricultural Business, a loss of
Ps. 94 million is attributable to the Operations Center in
Argentina, and a gain of Ps. 105 million is attributable to
the Operations Center in Israel, both centers of the Urban
Properties and Investments Business).
Agricultural
Business
Agricultural Production.
The profit from
our interests in associates in this segment declined by 53.8% from
a gain of Ps. 26 million in fiscal year 2016 to a gain of
Ps. 12 million in fiscal year 2017, due to the profit from the
investment in Agro-Uranga S.A.
Others.
The loss from our interests in
associates in this segment increased by 33.3% from a loss of
Ps. 3 million in fiscal year 2016 to a loss of Ps. 4
million in fiscal year 2017, due to the profit from the investment
in Agrofy Global.
Urban
Properties and Investments Business
Operation
Center in Argentina
Shopping
Malls.
According to
business segment reporting, the share of profit of the joint
venture NPSF is presented on a line by line consolidated basis in
this segment.
Offices.
According to business segment
reporting, the share of profit of the joint venture Quality Invest
S.A. is presented on a line by line consolidated basis in this
segment.
Sales and
developments.
The share of
profit of joint ventures Cyrsa, Puerto Retiro S.A. and Baicom
Networks S.A. is presented on a line by line consolidated basis.
The share of profit / (loss) of our associate Manibil S.A.,
presented in this line, rose by Ps.9 million, from Ps.5 million
during fiscal year 2016 to Ps.14 million during fiscal year
2017.
Hotels.
Share of profit / (loss) of joint ventures
associated to our Hotel segment did not experience significant
changes during the reported periods.
International.
Our
share of loss of associates in this segment increased by 50.8%,
from a loss of Ps.130 million during fiscal year 2016 to a loss of
Ps.196 million during fiscal year 2017, mainly due to increased
losses from our investment in New Lipstick LLC for Ps.76 million
and the non-recurrence of losses by Ps.79 million from our
investment in IDBD; partially offset by increased gains from Condor
for Ps.88 million.
Others.
The share of profit of our associates in the
Others segment decreased by 64.9%, from Ps.251 million during
fiscal year 2016 to Ps.88 million during fiscal year 2017, mainly
due to: (i) lower gains from our investments in BHSA and BACS for
Ps.174 and Ps.13 million, respectively, partially offset by: (ii)
lower losses from our investment in Tarshop for Ps.24
million.
Operation Center in Israel
Real Estate.
During fiscal year 2017, the share of profit
of associates and joint ventures associated to the Real Estate
segment totaled Ps.46 million comparing to Ps.226 during fiscal
year 2016. Such variation was due to (i) the comparability of the
figures, (ii) a 24% revaluation of the Shekel against the Argentine
peso, and (iii) a decrease of sales in PBEL.
Supermarkets.
During
fiscal year 2017, the share of profit of associates and joint
ventures associated to the Supermarkets segment totaled Ps.75
million, comparing to a cero result from 2016. This is due to an
improvement in the associates of Shufersal which were considered
impaired in 2016.
Others.
During fiscal year 2017, the share of loss
of associates and joint ventures associated to the Others segment
totaled Ps.16 million, showing a decrease in comparison with the
loss of Ps.103 million in 2016, mainly due to the improvements of
the investments of Elron.
Financial results, net - Fiscal year 2017 compared to fiscal year
2016
Our
financial loss, net fell by Ps. 1,343 million, from a loss of
Ps. 6,046 million in fiscal year 2016 to a loss of
Ps. 4,703 million in fiscal year 2017. This was primarily
attributable to: (i) a Ps. 1,730 decline in foreign exchange
losses, net in fiscal year 2017; (ii) a Ps. 4,098 million
increase in income from fair value measurement of financial assets
in fiscal year 2017; offset by (i) a Ps. 3,786 million
increase in financial interest expense, net recorded in fiscal year
2017; and (ii) a Ps. 982 million decline in profits from
derivative instruments in fiscal year 2017.
235
Changes
in our financial losses, net were primarily attributable to (i) a
Ps. 4,308 million increase in income from fair value
measurement of financial assets attributable to our subsidiary
IDBD; (ii) a Ps. 1,729 million decline in foreign exchange
losses, resulting from the exchange rate having experienced less
depreciation than in the previous fiscal year; (iii) a Ps. 390
million decline in losses from valuation of financial instruments
in connection with the acquisition of IDBD; (iv) a Ps. 3,979
million increase in interest expense in respect of IDBD; and (v) a
Ps. 1,439 million decline in profits from foreign currency
futures.
There
was a 10.6% fluctuation in the US-dollar buying exchange rate
during fiscal year 2017 (increasing from Ps. 15.040 to US$ 1
as of June 30, 2016 to Ps. 16.630 to US$ 1 as of June 30,
2017) relative to the previous fiscal year when the
US$/Ps. exchange rate experienced a 65.5% fluctuation (from
Ps. 9.088 to US$ 1 as of June 30, 2015 to Ps. 15.040 to
US$ 1 as of June 30, 2016).
Income tax - Fiscal year 2017 compared to fiscal year
2016
The
Company applies the deferred tax method to calculate the income tax
corresponding to the periods presented, recognizing in this way the
temporary differences as tax assets and liabilities. The income tax
charge for the year went from a loss of Ps.5,785 million during
fiscal year 2016, to a loss of Ps. 2,713 million during fiscal year
2017.
For
purposes of determining the deferred assets and liabilities and
according to the legal provisions enacted as of the date of
issuance of this annual report, a tax rate has been applied to the
identified temporary differences and tax losses, which is that
expected to be in force at the time of their reversion or
use.
Profit for the year - Fiscal year 2017 compared to fiscal year
2016
As a
result of the factors described above, the profit of the year,
including the effect of discontinued operations, went from a profit
of Ps. 9,118 million during fiscal year 2016 to a profit of Ps.
5,028 million during fiscal year 2017.
Profit / (loss) for the fiscal year attributable
to the controlling company’s shareholders went from a profit
of Ps. 5,167 million in fiscal year 2016 to a profit of Ps. 1,511
million in fiscal year 2017; and The non-controlling interest in
controlled companies went from a profit of Ps. 3,951 million in
fiscal year 2016 to a profit of Ps. 3,517 million in fiscal year
2017, primarily due to the consolidation of our subsidiary
IDBD.
Discontinued
operations
The
results of Israir Open Sky, IDB Tourism and Shufersal operations,
the share of profit of Adama and the finance costs associated to
the non-recourse loan, until its sale, and the results from sale of
the investment in Adama have been reclassified in the Statements of
Income under discontinued operations.
B.
LIQUIDITY AND CAPITAL RESOURCES
Liquidity
Our
main sources of liquidity have historically been:
● cash
generated by operations;
● cash
generated by our issuance of common shares and non-convertible
notes;
● cash
proceeds from borrowings (including cash from bank loans and
overdrafts) and financing arrangements (including cash from the
exercise of warrants); and
● cash
proceeds from sale of investment and trading properties and
property, plant and equipment (including cash proceeds from the
sale of farmlands).
Our
main cash requirements or uses (other than in connection with our
operating activities) have historically been:
● acquisition
of subsidiaries and non-controlling interest in
subsidiaries;
● acquisition
of interest in associates and joint ventures;
● capital
contributions to associates and joint ventures;
● capital
expenditures in property, plant and equipment (including
acquisitions of farmlands) and investment and trading
properties;
● payments of
short-term and long-term debt and payment of the related interest
expense; and
●
payment of dividends.
Our
liquidity and capital resources include our cash and cash
equivalents, proceeds from operating activities, sales of
investment properties, trading properties and farms, obtained bank
borrowings, long-term debts incurred and capital
funding.
236
Cash Flows
The
table below shows our cash flow for the fiscal years ended June 30,
2018, 2017 and 2016:
|
|
For the fiscal year ended June 30,
|
||
|
|
2018
|
2017
|
2016
|
|
|
(in
million of Pesos)
|
||
|
Net
cash generated from operating activities
|
13,775
|
9,252
|
4,219
|
|
Net
cash (used in) / generated from investing activities
|
(11,972
)
|
(2,415
)
|
8,640
|
|
Net cash (used in) / generated from financing activities
|
(2,299
)
|
1,899
|
(4,647
)
|
|
Net (decrease) / increase in cash and cash equivalents
|
(496
)
|
8,736
|
8,212
|
As of
June 30, 2018, we had positive working capital of Ps.45,380 million
(calculated as current assets less current liabilities as of such
date).
As of
June 30, 2018, in our Agricultural Business, we had negative
working capital of Ps.3,772 million (calculated as current assets
less current liabilities as of such date).
As of
June 30, 2018, in our Urban Properties and Investments Business,
our Operation Center in Argentina had positive working capital of
Ps.7,806 million and our Operations Center in Israel had positive
working capital of Ps.41,346 million, resulting in a consolidated
positive working capital of Ps.49,152 million (calculated as
current assets less current liabilities as of such
date.
At the
same date, our Agricultural Business had cash and cash equivalents
of Ps.1,333 million while our Operations Center in Argentina had
cash and cash equivalents of Ps.3,925 million while our Operations
Center in Israel had cash and cash equivalents of Ps.33,392
million, totaling consolidated cash and cash equivalents for
Ps.38,650 million.
Net cash generated from operating activities
Fiscal Year ended June 30, 2018 and 2017
Net
cash generated from operating activities increased from a net cash
inflow of Ps.9,252 million during fiscal year ended
June 30, 2017 to a net cash
inflow of Ps.13,775 million during fiscal year ended June 30,
2018.
Net
cash generated from continuing operating activities increased from
a net cash inflow of Ps.5,972 million during fiscal year ended June
30, 2017 to a net cash inflow of Ps.9,631 million during fiscal
year ended June 30, 2018. Net cash generated from discontinued
operating activities increased from a net cash inflow of Ps.3,280
million during fiscal year ended June 30, 2017 to a net cash inflow
of Ps.4,144 million during fiscal year ended June 30,
2018.
The
increase in net cash generated from operating activities of
Ps.4,523 million, mainly due cash inflows in Profit of the year of
Ps.12,752 million, increase in Other financial results, net of
Ps.18,964 million, a bigger decrease in trade and other receivables
of Ps.1,157 million, and an increase in Net cash generated from
discontinued operating activities before income tax paid of Ps.864
million. This was partially offset by increase in Loss from
discontinued operations of Ps.8,386 million, a decrease in Net gain
from fair value adjustment of investment properties of Ps.17,729
million and a decrease in Income tax expense of Ps.2,480
million.
Our
operating activities resulted in net cash inflows of Ps.13,775
million for the fiscal year ended on June 30, 2018, mainly due to
operating gains of Ps.9,227 million, provided by continuing
operating gains of Ps.21,706 million, partially offset by
discontinued operating loss of Ps.12,479 million. There was an
increase in cash inflows due to the Net cash generated by
discontinued operating activities of Ps.4,144 million, a decrease
in biological assets of Ps.650 million, a Decrease in trading
properties of Ps.499 million, and an increase in trade and other
payables of Ps.960 million, offsetting by a cash outflows by an
increase in inventories of Ps.602 million.
Fiscal Year ended June 30, 2017 and 2016
Net
cash generated from operating activities increased from a net cash
inflow of Ps.4,219 million during fiscal year ended
June 30, 2016 to a net cash
inflow of Ps.9,252 million during fiscal year ended June 30,
2017.
Net
cash generated from continuing operating activities increased from
a net cash inflow of Ps.3,330 million during fiscal year ended June
30, 2016 to a net cash inflow of Ps.5,972 million during fiscal
year ended June 30, 2017. Net cash generated from discontinued
operating activities increased from a net cash inflow of Ps.889
million during fiscal year ended June 30, 2016 to a net cash inflow
of Ps.3,280 million during fiscal year ended June 30,
2017.
The
increase in net cash generated from operating activities of
Ps.5,033 million, mainly due cash inflows in Net gain from fair
value adjustment of investment properties of Ps.12,629 million, in
depreciation and amortization of Ps.1,918 million and in decrease
in in biological assets of Ps.1,493 million, and main while Net
cash generated from discontinued operating activities increase in
Ps.2,391 million. This was partially offset by a decrease in Profit
of the year of Ps.4,090 million, an increase in Loss from
discontinued operations of Ps.3,276 million, a decrease in Income
tax expense of Ps.3,072 million, in Others financial results, net
of Ps.2,863 million, in Unrealized initial recognition and changes
in fair value of biological assets and agricultural products at the
point of harvest of Ps.1,153 million.
237
Our
operating activities resulted in net cash inflows of Ps. 9,252
million for the fiscal year ended on June 30, 2017, mainly due to
operating gains of Ps. 5,798 million, provided by continuing
operating gains of Ps. 9,891 million, partially offset by
discontinued operating loss of Ps. 4,093 million. There was an
increase in cash inflows due to the Net cash generated from
discontinued operating activities of Ps. 3,280 million, a decrease
in biological assets of Ps.1,085 million, a decrease in trading
properties of Ps.510 million, and an increase in trade and other
payables of Ps.660 million, partially offset by a cash outflow for
an increase in
trade and
other receivables of Ps.1,107 million.
Net cash (used in) / generated from investing
activities
Fiscal Year ended June 30, 2018 and 2017
Net
cash used in investing activities increase from a net cash outflow
of Ps.2,415 million during fiscal year ended on June 30, 2017 to a
net cash outflow of Ps.11,972 million during fiscal year ended on
June 30, 2018.
Net
cash used in continuing investing activities increase from a net
cash outflow of Ps.5,164 million during fiscal year ended on June
30, 2017 to a net cash outflow of Ps.8,853 million during fiscal
year ended on June 30, 2018. Net cash used in discontinued
operating activities decrease from a net cash inflow of Ps.2,749
million during fiscal year ended June 30, 2017 to a net cash
outflow of Ps.3,119 million during fiscal year ended June 30,
2018.
This
variation was mainly due to an increase in net cash outflows in
Acquisition of investments in financial instruments of Ps.20,481
million, an increase in restricted assets, net of Ps.2,636 million,
and a net cash outflow in discontinued investing activities of
Ps.5,868 million. This was partially offset by an increase in
Proceeds from disposal of investments in financial assets of
Ps.19,272 million.
Our
investing activities resulted in net cash outflows of Ps.11,972
million for the fiscal year ended on June 30, 2018, mainly due to a
net cash outflows for Acquisition of investments in financial
instruments of Ps.27,128 million, Acquisition, improvements and
advance payments for constructions of investment properties of
Ps.3,200 million, Increase in restricted assets, net of Ps.3,032
million, for Acquisitions and improvements of property, plant and
equipment of Ps.2,436 million, and Net cash used in discontinued
investing activities of Ps.3,119 million. This was partially offset
by a net cash inflow for Proceeds from disposal of investments in
financial assets of Ps.26,057 million.
Fiscal Year ended June 30, 2017 and 2016
Net
cash used in investing activities decrease from a net cash inflow
of Ps.8,640 million during fiscal year ended on June 30, 2016 to a
net cash outflow of Ps.2,415 million during fiscal year ended on
June 30, 2017.
Net
cash used in continuing investing activities decrease from a net
cash inflow of Ps.8,667 million during fiscal year ended on June
30, 2016 to a net cash outflow of Ps.5,164 million during fiscal
year ended on June 30, 2017. Net cash used in discontinued
operating activities increase from a net cash outflow of Ps.27
million during fiscal year ended June 30, 2016 to a net cash inflow
of Ps.2,749 million during fiscal year ended June 30,
2017.
This
variation was mainly due to an increase in net cash outflows for
payment for subsidiary acquisition, net of cash acquired of
Ps.9,239 million, a decrease in Proceeds from disposal of
investments in financial assets of Ps. 7,328 million and in
Proceeds from sales of investment properties of Ps.1,035 million,
an increase in cash net outflows in Acquisitions and improvements
of property, plant and equipment of Ps.1,724 million. This was
partially offset by a decrease in cash outflows for Acquisition of
investments in financial instruments of Ps.7,220 million and an
increase in Net cash generated from discontinued investing
activities of Ps.2,776 million.
Our
investing activities resulted in net cash outflows of 2,415 million
for the fiscal year ended on June 30, 2017, mainly due to cash
outflows for Acquisition, improvements and advance payments for
constructions of investment properties of Ps.2,752 million,
Acquisitions and improvements of property, plant and equipment of
Ps.2,315 million, Acquisition of investments in financial
instruments of Ps.6,287 million; partially offset by Proceeds from
disposal of investments in financial assets of Ps.6,785 million,
and Net cash generated from discontinued investing activities of
Ps.2,749 million.
Net cash (used in) / generated from financing
activities
Fiscal Year ended June 30, 2018 and 2017
Net
cash used in financing activities decrease from a net cash inflow
of Ps.1,899 million during fiscal year ended on June 30, 2017 to a
net cash outflow of Ps.2,299 million during fiscal year ended on
June 30, 2018.
Net
cash used in continuing financing activities decrease from a net
cash inflow of Ps.4,502 million during fiscal year ended on June
30, 2017 to a net cash outflow of Ps.4,557 million during fiscal
year ended on June 30, 2018. Net cash generate from discontinued
operating activities increase from a net cash outflow of Ps.2,603
million during fiscal year ended June 30, 2017 to a net cash inflow
of Ps.2,258 million during fiscal year ended June 30,
2018.
This
variation was mainly due to a decrease in Proceeds from borrowings
of Ps.4,326 million, an increase in Repayment of borrowings of
Ps.3,814 million, Dividends paid to non-controlling interest in
subsidiaries of Ps.1,259 million and Interest paid of Ps.1,712
million. Partially offset by cash inflows for Proceeds / (payment)
of short term borrowings, net of Ps.1,751 million, and Net cash
used in discontinued financing activities of Ps.4,861
million.
238
Our
investing activities resulted in net cash outflows of Ps.2,299
million for the fiscal year ended on June 30, 2018, mainly due to
Repayment of borrowings of Ps.22,912 million, for Interest paid of
Ps.7,234 million, and Dividends paid to non-controlling interest in
subsidiaries of Ps. 1,259 million. This was partially offset by
cash inflows for Proceeds from borrowings of Ps.25,027 million,
Proceeds from sales of non-controlling interest in subsidiaries of
Ps.2,507 million, Contributions from non-controlling interest of
Ps.1,347 million, and Net cash generated from financing activities
of Ps.2,258 million.
Fiscal Year ended June 30, 2017 and 2016
Net
cash generate from financing activities increase from a net cash
outflow of Ps.4,647 million during fiscal year ended on June 30,
2016 to a net cash inflow of Ps.1,899 million during fiscal year
ended on June 30, 2017.
Net
cash generate from continuing financing activities increase from a
net cash outflow of Ps.1,538 million during fiscal year ended on
June 30, 2016 to a net cash inflow of Ps.4,502 million during
fiscal year ended on June 30, 2017. Net cash used in discontinued
operating activities decrease from a net cash outflow of Ps.3,109
million during fiscal year ended June 30, 2016 to a net cash
outflow of Ps.2,603 million during fiscal year ended June 30,
2017.
This
variation was mainly due to a decrease in Repayment of borrowings
of Ps.126,756 million, an increase in Proceeds from sales of
non-controlling interest in subsidiaries of Ps.2,442 million and a
decrease in Net cash used in discontinued financing activities of
Ps.506 million. This was partially offset by a decrease in Proceeds
from borrowings of Ps.118,074 million, a decrease in Proceeds from
derivative financial instruments of Ps.1,173 million, an increase
in cash outflows for Proceeds / (payment) of short term borrowings,
net of Ps.1,228 million, an increase in Dividends paid of Ps.1,896
million and Interest paid of Ps.2,349 million.
Our
investing activities resulted in net cash inflows of Ps. 1,899
million for the fiscal year ended on June 30, 2017, mainly due to
Proceeds from borrowings of Ps. 29,353 million, Proceeds from sales
of non-controlling interest in subsidiaries of Ps. 2,528 million.
This was partially offset by Repayment of borrowings of Ps. 19,098
million, Dividends paid of Ps. 2,135 million, Interest paid of Ps.
5,522 million, Proceeds / (payment) of short term borrowings, net
of Ps. 1,019 million and Net cash used in discontinued financing
activities of Ps. 2,603 million
.
Indebtedness
As of
June 30, 2018, we had total loans in the amount of Ps.219,545
million. The following table sets forth the scheduled maturities of
our outstanding debt:
|
|
|
Urban properties and investments
|
|
||
|
Capital
|
Agricultural Business
|
Operation Center in Argentina
|
Operation Center in
Israel
|
Subtotal
|
Total
|
|
Less
than 1 year
|
6,234
|
1,054
|
22,811
|
23,865
|
30,099
|
|
More
than 1 and up to 2 years
|
1,608
|
6,241
|
19,481
|
25,722
|
27,330
|
|
More
than 2 and up to 3 years
|
714
|
6,656
|
16,072
|
22,728
|
23,442
|
|
More
than 3 and up to 4 years
|
303
|
621
|
18,266
|
18,887
|
19,190
|
|
More
than 4 and up to 5 years
|
3,567
|
10,391
|
37,155
|
47,546
|
51,113
|
|
More
than 5 years
|
164
|
271
|
65,783
|
66,054
|
66,218
|
|
|
12,590
|
25,234
|
179,568
|
204,802
|
217,392
|
|
Interest
|
|
|
|
|
|
|
Less
than 1 year
|
127
|
468
|
1,246
|
1,714
|
1,841
|
|
More
than 1 and up to 2 years
|
38
|
30
|
-
|
30
|
68
|
|
More
than 2 and up to 3 years
|
-
|
33
|
-
|
33
|
33
|
|
More
than 3 and up to 4 years
|
3
|
5
|
-
|
5
|
8
|
|
More
than 4 and up to 5 years
|
-
|
-
|
-
|
-
|
-
|
|
More
than 5 years
|
-
|
33
|
-
|
33
|
33
|
|
|
168
|
569
|
1,246
|
1,815
|
1,983
|
|
Financial
Leases
|
154
|
16
|
-
|
16
|
170
|
|
|
12,912
|
25,819
|
180,814
|
206,633
|
219,545
|
|
|
|
Urban properties and investments
|
|
||
|
|
Agricultural Business
|
Operation
Center in Argentina
|
Operation
Center in
Israel
|
Subtotal
|
Total
|
|
Non-convertible
Notes
|
6,838
|
22,354
|
148,788
|
171,142
|
177,980
|
|
Bank
loans and others
|
5,469
|
2,778
|
32,026
|
34,804
|
40,273
|
|
Financial
Leases
|
154
|
16
|
-
|
16
|
170
|
|
Bank
overdrafts
|
451
|
671
|
-
|
671
|
1,122
|
|
|
12,912
|
25,819
|
180,814
|
206,633
|
219,545
|
239
|
|
|
|
|
Book value
|
|
|
Currency
|
Anual Average Interest Rate
|
Nominal value
|
(in million Ps.)
|
|
Agricultural business
|
|
|
|
|
|
Cresud´s
Series XVI Notes
|
US$
|
1.50
%
|
109
|
949
|
|
Cresud’s
Series XVIII Notes
|
US$
|
4.00
%
|
34
|
931
|
|
Cresud’s
Series XXII Notes
|
US$
|
4.00
%
|
22
|
595
|
|
Cresud’s
Series XXIII Notes
|
US$
|
6.50
%
|
113
|
3,322
|
|
Brasilagro’s
Notes
|
Rs.
|
106.5%
e 110% do CDI
|
-
|
1,041
|
|
Bank
loans
|
US$
|
5.60
%
|
40
|
956
|
|
Bank
loans
|
US$
|
Libor
6M + 300 bps. O 6% (la mayor)
|
20
|
271
|
|
Bank
loans
|
US$
|
4.5
%
|
4
|
116
|
|
Bank
loans
|
US$
|
2
%
|
3
|
81
|
|
Bank
loans
|
US$
|
5.25
%
|
5
|
143
|
|
Bank
loans
|
US$
|
2
%
|
6
|
159
|
|
Bank
loans
|
US$
|
2.20
%
|
8
|
225
|
|
Bank
loans
|
US$
|
3.90
%
|
18
|
518
|
|
Bank
loans
|
US$
|
3.80
%
|
5
|
144
|
|
Bank
loans
|
US$
|
3.80
%
|
15
|
438
|
|
Bank
loans
|
US$
|
5.60
%
|
5
|
144
|
|
Bank
loans
|
US$
|
4.05
%
|
10
|
291
|
|
Bank
loans
|
US$
|
5.60
%
|
12
|
348
|
|
Bank
loans
|
US$
|
3.50
%
|
5
|
144
|
|
Bank
loans
|
US$
|
4.40
%
|
12
|
344
|
|
Bank
loans
|
US$
|
3.00
%
|
5
|
147
|
|
Bank
loans
|
Rs.
|
TJLP +
2.70 Pré 9% a 10%
|
-
|
254
|
|
Bank
loans
|
Rs.
|
TJLP +
3.73% Pré 9% a 11%
|
-
|
44
|
|
Bank
loans
|
Rs.
|
Pré
4% a 9%
|
-
|
223
|
|
Bank
loans
|
Rs.
|
Pré
7.22% a 9%
|
-
|
318
|
|
Bank
loans
|
US$
|
5
%
|
14
|
29
|
|
Bank
loans
|
Ps.
|
20.69
%
|
-
|
12
|
|
Bank
loans
|
US$
|
5.60
%
|
-
|
101
|
|
Others
|
Ps.
|
6.00
%
|
-
|
19
|
|
Financial
Leases
|
US$
|
5.07
%
|
-
|
6
|
|
Financial
Leases
|
Rs.
|
6.62
%
|
-
|
12
|
|
Financial
Leases
|
Rs.
|
$
R/Kg 0.6462
|
-
|
136
|
|
Bank
overdrafts
|
Ps.
|
-
|
-
|
451
|
|
|
|
|
|
|
|
Operation
Center in Argentina
|
|
|
|
|
|
IRSA
Commercial Properties’ 2023 Notes
|
US$
|
8.75
%
|
360
|
10,480
|
|
IRSA
Commercial Properties’ 2020 Notes
|
US$
|
5.00
%
|
140
|
4,036
|
|
IRSA’s
2020 Notes
|
US$
|
11.50
%
|
71
|
2,155
|
|
IRSA’s
2019 Notes
|
Ps,
|
Badlar +
299ptos
|
384
|
389
|
|
IRSA’s
2019 Notes
|
US$
|
7.00
%
|
184
|
5,294
|
|
Bank
loans
|
US$
|
5.95
%
|
50
|
1,263
|
|
Bank
loans
|
US$
|
Libor +
1.9%
|
692
|
1,009
|
|
Bank
loans
|
Ps,
|
21.20
%
|
75
|
5
|
|
Seller
financing
|
US$
|
N/A
|
2
|
67
|
|
Financial
Leases
|
US$
|
from
3.20% to 14.40%
|
-
|
16
|
|
Bank
overdrafts
|
Ps,
|
from
25.00% to 63%
|
-
|
671
|
|
AABE
Debt
|
Ps,
|
Libor
|
44
|
85
|
|
Related
Party
|
Ps,
|
Badlar
|
7
|
6
|
|
Related
Party
|
Ps,
|
Badlar 8.5
%
|
6
|
3
|
|
Related
Party
|
Ps,
|
15.25
%
|
1
|
6
|
|
Others
|
US$
|
3.50
%
|
5
|
305
|
|
Others
|
US$
|
8.50
%
|
28
|
29
|
|
|
|
|
|
|
|
Operation Center in Israel
|
|
|
|
|
|
Non-convertible
Notes IDBD Serie I
|
NIS
|
4.95
%
|
1,013
|
7,040
|
|
Non-convertible
Notes IDBD Serie J
|
NIS
|
6.60
%
|
103
|
797
|
|
Non-convertible
Notes IDBD Serie K
|
NIS
|
4.84
%
|
86
|
668
|
|
Non-convertible
Notes IDBD Serie M
|
NIS
|
8.08
%
|
924
|
7,248
|
|
Non-convertible
Notes IDBD Serie N
|
NIS
|
5.15
%
|
993
|
7,826
|
|
Non-convertible
Notes DIC Serie F
|
NIS
|
4.95
%
|
1,872
|
14,960
|
|
Non-convertible
Notes DIC Serie H
|
NIS
|
4.45
%
|
62
|
584
|
|
Non-convertible
Notes DIC Serie J
|
NIS
|
4.52
%
|
2,582
|
21,004
|
|
Non-convertible
Notes Cellcom Serie F
|
NIS
|
4.60
%
|
429
|
3,599
|
|
Non-convertible
Notes Cellcom Serie G
|
NIS
|
6.99
%
|
86
|
712
|
|
Non-convertible
Notes Cellcom Serie H
|
NIS
|
1.98
%
|
950
|
7,221
|
|
Non-convertible
Notes Cellcom Serie I
|
NIS
|
4.14
%
|
804
|
6,338
|
|
Non-convertible
Notes Cellcom Serie J
|
NIS
|
2.62
%
|
103
|
813
|
|
Non-convertible
Notes Cellcom Serie K
|
NIS
|
3.75
%
|
304
|
2,399
|
|
Non-convertible
Notes Cellcom Serie L
|
NIS
|
2.66
%
|
401
|
3,143
|
|
Non-convertible
Notes PBC Serie D
|
NIS
|
4.95
%
|
1,317
|
13,262
|
|
Non-convertible
Notes PBC Serie F
|
NIS
|
4.95
%
|
742
|
6,377
|
|
Non-convertible
Notes PBC Serie G
|
NIS
|
7.05
%
|
528
|
4,772
|
|
Non-convertible
Notes PBC Serie H
|
NIS
|
4.55
%
|
102
|
807
|
|
Non-convertible
Notes PBC Serie I
|
NIS
|
4.75
%
|
1,390
|
11,311
|
|
Non-convertible
Notes PBC Gav-Yam Serie A
|
NIS
|
3.19
%
|
380
|
2,990
|
|
Non-convertible
Notes PBC Gav-Yam Serie F
|
NIS
|
4.75
%
|
1,877
|
20,049
|
|
Non-convertible
Notes PBC Gav-Yam Serie H
|
NIS
|
2.72
%
|
424
|
3,332
|
|
Non-convertible
Notes PBC Ispro Serie B
|
NIS
|
5.40
%
|
153
|
1,536
|
|
Bank
loans and others
|
NIS
|
2.40
%
|
166
|
1,302
|
|
Bank
loans and others
|
NIS
|
2.35
%
|
308
|
2,414
|
|
Bank
loans and others
|
NIS
|
2.20
%
|
171
|
1,333
|
|
Bank
loans and others
|
NIS
|
2.20
%
|
23
|
181
|
|
Bank
loans and others
|
NIS
|
4.60
%
|
200
|
1,596
|
|
Bank
loans and others
|
NIS
|
4.90
%
|
140
|
1,118
|
|
Bank
loans and others
|
NIS
|
5.10
%
|
200
|
1,598
|
|
Bank
loans and others
|
NIS
|
1.97
%
|
23
|
177
|
|
Bank
loans and others
|
NIS
|
2.65
%
|
83
|
646
|
|
Bank
loans and others
|
NIS
|
3.07
%
|
10
|
76
|
|
Bank
loans and others
|
NIS
|
1.55
%
|
19
|
157
|
|
Bank
loans and others
|
NIS
|
1.73
%
|
22
|
226
|
|
Bank
loans and others
|
NIS
|
1.87
%
|
77
|
608
|
|
Bank
loans and others
|
NIS
|
1.77
%
|
59
|
464
|
|
Bank
loans and others
|
NIS
|
1.87
%
|
35
|
282
|
|
Bank
loans and others
|
NIS
|
1.86
%
|
29
|
233
|
|
Bank
loans and others
|
NIS
|
2.10
%
|
59
|
462
|
|
Bank
loans and others
|
NIS
|
1.88
%
|
93
|
741
|
|
Bank
loans and others
|
NIS
|
1.26
%
|
114
|
902
|
|
Bank
loans and others
|
NIS
|
1.57
%
|
12
|
93
|
|
Bank
loans and others
|
NIS
|
2.14
%
|
50
|
386
|
|
Bank
loans and others
|
NIS
|
4.07
%
|
297
|
8,313
|
|
Bank
loans and others
|
NIS
|
5.91
%
|
100
|
2,800
|
|
Bank
loans and others
|
NIS
|
2.35
%
|
1
|
8
|
|
Bank
loans and others
|
NIS
|
3.00
%
|
1
|
8
|
|
Bank
loans and others
|
NIS
|
2.89
%
|
3
|
24
|
|
Bank
loans and others
|
NIS
|
2.95
%
|
2
|
16
|
|
Bank
loans and others
|
NIS
|
5.57
%
|
207
|
1,641
|
|
Bank
loans and others
|
NIS
|
7.00
%
|
145
|
1,160
|
|
Others
|
NIS
|
from
1.22% to 3.34%
|
347
|
3,061
|
240
Agricultural business
Series XVI Notes
On
November 18, 2013, we issued the Series XVI Notes, for US$ 109.1
(50% has already been amortized on May 18, 2018), bearing a fixed
interest rate of 1.5%
with an issuance price of 102.3%,
which matures on November 19, 2018.
Series XVIII Notes
On
September 12, 2014, we issued the Series XVIII Notes, for US$ 33.7,
bearing a fixed interest rate of 4.0%
with an issuance price of 102.179%,
which matures on September 12, 2019.
Series XXII Notes
On
August 12, 2015, we issued the Series XXII Notes, for US$ 22.7,
bearing a fixed interest rate of 4.0%
with an issuance price of 97.65%,
which matures on August 12, 2019.
Series XXIII Notes
On
February 16, 2018, we issued the Series XXIII Notes, for US$ 113.2,
bearing a fixed interest rate of 6.5% payable semiannually, which
matures on February 16, 2023.
Operations Center in Argentina
Offer to Purchase and Consent Solicitation Statement of Series I
and Series II Notes issued by IRSA, and Series I Notes issued by
IRSA CP.
On
March 3, 2016, IRSA and IRSA CP announced that they would launch
offers to buy in cash: (i) 11.50% Class II Notes due 2020 issued by
IRSA for principal amount up to US$76.5 million, (ii) any and 8.50%
Class I Notes due 2017 issued by IRSA, and (iii) any and 7.875%
Class I Notes notes due 2017 issued by IRSA CP.
On
April 7, 2016, the Meeting of IRSA’s Notes holders by
majority vote approved the proposed amendments to IRSA’s 2017
Trust Indenture, which included basically the elimination of all
restrictive covenants on such class effective as of April 8,
2016.
During
the months of March, April and May of 2016, the Company acquired
all IRSA CP’s 7.875% Notes Class I due 2017 for a total
amount US$120 million and US$75.4 million of IRSA Notes. On October
11, 2016 the Company acquired the remaining US$74.6 million of
IRSA’s 8.50% Notes due 2017, so the following notes remains
outstanding:
●
IRSA’s Notes
Class II at 11.50% maturing in 2020 US$71.4 million.
Such
payments were accounted for as a cancellation of debt.
In
relation to financial covenants under 11.50% Notes due in 2020
issued by IRSA, the Meeting of Noteholders held on March 23, 2016
approved:
i.
to modify the
covenant on Limitation on Restricted Payments, so that the original
covenant was replaced so as to take into consideration IRSA’s
capability to make any restricted payment provided that (a) no
Event of Default has occurred and persisted, and (b) IRSA may incur
at least US$1.00 of additional debt pursuant to the Limitation on
Additional Indebtedness; and
ii.
the exclusion of
IDBD or any of its subsidiaries for purposes of the definition of
“Subsidiary” or any of the definitions or commitments
under the Trust Indenture of Notes due in 2020 and issued by IRSA
(regardless of whether the financial statements of any of these
companies has any time been consolidated into IRSA’s
financial statements).
iii.
a
Supplementary Trust Indenture reflecting all the amendments
approved, entered into with the Bank of New York Mellon on March
28, 2016.
Series II Notes (Issued by IRSA CP)
On
March 23, 2016, IRSA CP issued Notes in an aggregate principal
amount of US$360 million under its Global Notes Program. Series II
Notes accrue interest semi-annually, at an annual fixed rate of
8.75% and mature on March 23, 2023. The issue price was 98.722% of
nominal value.
IRSA
CP’s Notes due 2023 are subject to certain covenants, events
of default and limitations, such as the limitation on incurrence of
additional indebtedness, limitation on restricted payments,
limitation on transactions with affiliates, and limitation on
merger, consolidation and sale of all or substantially all
assets.
241
To
incur additional indebtedness, IRSA CP is required to meet a
minimum 2.00 to 1.00 Consolidated Interest Coverage Ratio. The
Consolidated Interest Coverage Ratio is defined as Consolidated
EBITDA divided by consolidated interest expense. Consolidated
EBITDA is defined as operating income plus depreciation and
amortization and other consolidated non-cash charges.
The
Series II Notes contain financial covenants limiting IRSA
CP’s ability to declare or pay dividends in cash or in kind,
unless the following conditions are met at the time of
payment:
a)
no Event of Default
shall have occurred and be continuing;
b)
IRSA CP may incur
at least US$1.00 worth of additional debt pursuant to the
“Restriction on Additional Indebtedness”;
c)
and the aggregate
amount of such dividend exceeds the sum of:
i.
100% of cumulative
EBITDA for the period (treated as one accounting period) from July
1, 2015 through the last day of the last fiscal quarter ended prior
to the date of such Restricted Payment
minus
an amount equal to 150% of
consolidated interest expense for such period; and
ii.
any reductions of
Indebtedness of IRSA on a consolidated basis after the Issue Date
any reductions of Indebtedness of after the Issue Date exchanged
for to Capital Stock of the IRSA or its Subsidiaries.
Series VII and VIII Notes
On
September 8, 2016, IRSA issued Series VII and VIII Notes for an
aggregate amount of US$210 million:
a)
Series VII Notes
for a principal amount of Ps.384.2 million at BADLAR plus 299 bps
due on September 9, 2019.
b)
Series VIII Notes
for a principal amount of US$184.5 million at a fixed rate of 7%
due on September 9, 2019.
The
proceeds were mainly used to repay preexisting debt.
Series IV Notes (Issued by IRSA CP)
On
September 12, 2017, IRSA CP issued the Series IV Notes, for US$140
million, bearing a fixed interest rate of 5.0%, which matures on
September 14, 2020.
Operations Center in Israel
IDBD is
subject to certain restrictions and financial covenants in relation
to its financial debt, including its notes and loans from banks and
financial institutions. From September 2016, following the sale of
Adama and the increased value recorded by its subsidiaries in the
market, IDBD and DIC returned to the capital markets to refinance
its debts. In this regard, IDBD and DIC have completed successful
placements of debt, please find below a description of IDBD´s
and DIC last issuances of bonds in the capital markets to refinance
their outstanding debts:
In July
2017, IDBD issued a bond for a total amount of NIS 642.1 million at
5.30% fixed rate with maturity in 2022. In addition, in February
2017, IDBD issued a new Bond for NIS 1.060 million at 5.40% fixed
rate and maturity in 2019.
In
March 2017, DIC issued a NIS 555 million Bond at 4,06% plus CPI
with maturity in 2019.
These
bond issuances and the recent sale during fiscal year 2018 of a
16.65% stake in Shufersal, increased the liquidity of DIC and IDBD
and allows to reduce the level of leverage. For this reason, IDBD
and DIC received from Standard & Poor´s Maalot (S&P
Maalot) an improvement in their credits ratings, from ilCCC to
ilBBB- in the case of IDBD and from ilBBB- to ilBBB+ in the case of
DIC.
It
should be noted that the financial position of IDBD and its
subsidiaries in the operations center in Israel does not adversely
affect IRSA´s cash flows to satisfy the debts of
IRSA.
Moreover, the
commitments and other restrictions resulting from IDBD’s
indebtedness have no effects on IRSA, as it qualifies as
non-recourse debt against IRSA, and IRSA has not given its assets
as collateral for such debt either.
242
C.
RESEARCH AND DEVELOPMENTS, PATENTS AND LICENSES
Investments in
technology, in our agricultural business, amounted to Ps.53
million, Ps.48 million and Ps.10 million for fiscal years 2018,
2017 and 2016 respectively. Our total technology investments aimed
to increase the productivity of purchased land have amounted to
Ps.556 million since fiscal year 1995.
We
reach our objectives within this area through the implementation of
domestic and international technological development projects
focusing mainly on:
|
●
|
Quality
and productivity improvement.
|
|
●
|
Increase in
appreciation value of land through the development of marginal
areas.
|
|
●
|
Increase in the
quality of food in order to achieve global food safety standards.
We aim to implement and perform according to official and private
quality protocols that allow us to comply with the requirements of
our present and future clients. Regarding official regulations, in
2003 we implemented the Servicio Nacional de Sanidad y Calidad
Agroalimentaria law on animal identification for livestock in six
farms. Simultaneously, in 2004 we implemented Global GAP Protocols
(formerly EurepGap) with the objective of complying with European
Union food safety standards and as a mean for continuous
improvement of the internal management and system production of our
farms. Our challenge is to achieve global quality
standards.
|
|
●
|
Certification of
suitable quality standards, since in recent years worldwide
agriculture has evolved towards more efficient and sustainable
schemes in terms of environmental and financial standpoints, where
the innocuousness and quality of the production systems is becoming
increasingly important. In this context, Good Agricultural
Practices (GAP) have emerged, as a set of practices seeking to
ensure the innocuousness of agricultural products, the protection
of the environment, the workers’ safety and well-being, and
agricultural health, with a view to improving conventional
production methods. Certification of such standards allows to
demonstrate the application of Good Agricultural Practices to
production systems and ensures product traceability, allowing to
impose stricter controls to verify the enforcement of the
applicable laws.
|
|
●
|
The
implementation of a system of control and assessment of
agricultural tasks for analyzing and improving efficiency in the
use of agricultural machinery hired. For each of the tasks, a
minimum standard to be fulfilled by contractors was set, which has
led to do an improvement in the plant stand upon sowing, a better
use of supplies and lower harvesting losses.
|
We have
several trademarks registered with the Instituto Nacional de la
Propiedad Industrial, the Argentine institute for industrial
property. We do not own any patents nor benefit from licenses from
third parties.
A
substantial part of Cellcom’s operations are subject to the
Communications Law, regulations enacted by the Ministry of
Communications, and the provisions of the licenses granted to
Cellcom by the Minister of Communications. Cellcom’s
activities which include providing cellular service, landline,
international telephone services and internet access, and
infrastructure services are subject to licensing. For more
information, please see “Legal framework – Operations
Center in Israel”.
D.
TREND INFORMATION
International
Macroeconomic Outlook
As
reported in the IMF’s “World Economic Outlook,”
world growth is expected to reach 3.7% in 2018 and 2019. In 2018
growth in advanced economies is expected to remain above trend at
about 2.4%, before reaching 2.1 in 2019. The growth projected in
the United States is at 2.9% for 2018 and 2.5% for 2019, and in the
Euro area economy is projected to slow gradually from 2.4% in 2017,
to 2.0 in 2018 and 1.9 in 2019. Growth in Latin America is
projected to increase modestly from 1.3% in 2017 to 1.2% in 2018,
and further to 2.2% in 2019.
Many
emerging market and developing economies need to enhance resilience
through an appropriate mix of fiscal, monetary, exchange rate, and
prudential policies to reduce vulnerability to tightening global
financial conditions, sharp currency movements, and capital flow
reversals. Long-standing advice on the importance of reining in
excess credit growth where needed, supporting healthy bank balance
sheets, containing maturity and currency mismatches, and
maintaining orderly market conditions has become even more relevant
in the face of renewed market volatility. In general, allowing for
exchange rate flexibility will be an important means for cushioning
the impact of adverse external shocks, although the effects of
exchange rate depreciations on private and public sector balance
sheets and on domestic inflation expectations need to be closely
monitored. With debt levels rising rapidly in both emerging and
lowincome economies over the past decade, fiscal policy should
focus on preserving and rebuilding buffers where needed, through
growth-friendly measures that protect the most vulnerable. To raise
potential growth and enhance its inclusiveness, structural reforms
remain essential to alleviate infrastructure bottlenecks,
strengthen the business environment, upgrade human capital, and
ensure access to opportunities for all segments of
society.
Higher
energy prices have lifted headline year-over-year inflation rates
in advanced and emerging market and developing economies over the
past six months. Core inflation remains below central banks’
targets in most advanced economies. Core annual consumer price
inflation in the United States, where unemployment hovers around
multidecade lows, has exceeded 2 percent since March. Core
inflation in the United Kingdom averaged slightly more than 2
percent in the first half of 2018, lower than the last year. Core
inflation in emerging markets has also inched up, reflecting
pass-through effects from currency depreciation in some cases and
second-round effects of higher fuel prices in others.
The IMF’s
Primary Commodities Price Index rose 3.3% between February 2018 and
August 2018, driven by higher energy prices. Food prices fell amid
rising trade tensions, while the price of metals softened because
of weaker demand from China.
243
Argentine
macroeconomic context
On
August, 2018, the Central Bank of Argentina published that growth
is expected to decrease from 2.9 percent in 2017 to (2.6) percent
in 2018 due to the effect of the drought on agricultural
production, as well as the needed fiscal and monetary adjustment to
improve the sustainability of public finances and reduce high
inflation.
Shopping malls
sales reached a total Ps.6,886.4 million in June 2018, which
represents a 31.2% increase as compared to the same period last
year. Accumulated sales for the first six months of the year
totaled Ps.33,733.7 million, representing a 27.9% increase as
compared to the same period last year.
The
INDEC reported that, as of June 2018, industrial activity in
Argentina decreased by 8.1% as compared to the same month in 2017.
Textile industry accumulated a 1.0% increase during the first six
months of the year as compared to the same period last year.
Moreover, the monthly estimation of economic activity
(“EMAE”) as of July 2018, showed a reduction of 6.7%
compared with the same period of the previous year.
Regarding the
balance of payments, in the second quarter of 2018 the current
account deficit reached US$8,292 million, with US$4,363 million
allocated to the goods and services trade balance, and US$4,379
million to the net primary income, and a superávit of US$450
million to the net secondary income.
During
the second quarter of 2018, the financial account showed net income
of US$8,427 million, due to the net issue of liability assets of
US$420,601, partially offset by net adquisition of assets of US$
12,174 million. As a result of the Balance transactions, the stock
of international reserves increased by US$741 million during the
second quarter of 2018.
Total
gross external debt stock at the end of June 2018 is estimated at
US$261,483 million, with an increase of US$ 28,267 million, 3.3%
compared to the previous quarter 61% of the debt corresponds to the
Government; 8% to the Argentine Central Bank; 27% to non-financial
corporations and households,
2% to
deposit-taking companies and 1% to other financial
companies.
In
local financial markets, the Private Badlar rate in Pesos ranged
from 19.69% to 32.69% in the period from July 2017 to June 2018,
averaging 30.57% in June 2018 against 19.81% in June 2017. As of
June 30, 2018, the seller exchange rate quoted by Banco de la
Nación Argentina was of Ps.28.8500 pesos per US$1.00. As of
June 30, 2018, Argentina’s country risk increased by 175
basis points in year-on-year terms. The debt premium paid by
Argentina was at 610 basis points in June 2018, compared to the 332
basis points paid by Brazil and 211 basis points paid by
Mexico.
As of
September 28, 2018, the Private Badlar rate in Pesos peaked at
43.31%. As of September 28, 2018, the seller exchange rate quoted
by Banco de la Nación Argentina was of Ps.41.2500 pesos per
US$1.00. As of September 28, 2018, Argentina’s country risk
increased by 253 basis points in year-on-year terms. The debt
premium paid by Argentina was at 623 basis points in September 28,
2018, compared to the 293 basis points paid by Brazil and 180 basis
points paid by Mexico.
Agriculture
and Cattle Raising Sector in Argentina
Agriculture
Argentina
has positioned itself over the years as one of the world’s
leading food producers and exporters. It is the second largest
country in South America after Brazil and has particularly
favorable natural conditions for diversified agricultural
production: vast extensions of fertile land and varied soil and
weather patterns.
During
the decade of the nineties, the Argentine agriculture and cattle
raising industry experienced sweeping changes, such as a
significant increase in production and yield (thanks to a sustained
agricultural modernization process), relocation of production
(crops vs. livestock) and a significant restructuring process
within the industry, as well as increased land concentration.
Taking advantage of a favorable international context, the
agriculture and cattle raising sector has been one of the major
drivers of the Argentine recovery after the economic and financial
crisis of 2002.
According
to the World Agricultural Supply and Demand Estimates Repro
published by the United States Department of Agriculture on August
10, 2018, world soybean production for the season 2018/2019 is
expected to be about 367,1 million tons, an increase of 9% as
compared to the season 2017/2018.
World
corn production is expected to about 1,061.1 million tons for
season 2018/2019, 2,7% higher than in the previous
season.
244
The policies implemented by the new government
ever since taking office have led to better projections for the
agricultural industry. Mainly, the strong devaluation of the peso
and tax reductions on exports have improved the situation of
agricultural growers. Withholding taxes on corn and wheat have been
fully eliminated, whereas withholding taxes on soybean have been
lowered by 5% (to 30% down from 35%)
for fiscal years beginning on or after January 1,
2018 until December 31, 2019, and beginning on or after January 1,
2020 the tax rate will be further reduced to
25%.
Cattle
As
reported by SENASA, with an aggregate stock of 54,816,050 heads as
of March 31, 2018, the cattle stock has increased by 2.7% as
compared to the same period of the previous year. For the decade in
a row, the cattle stock surpassed 48 million heads.
As
reported by the Argentine Chamber of Beef Commerce and Industry
(Cámara de la Industria y
Comercio de Carnes y Derivados de la República
Argentina,
“Ciccra”), consumption of cattle beef
per capita was 58.6 kilograms per year on average for the second
quarter of 2018, accounting for a year-on-year increase of 3.5%.
Domestic consumption accounts for 90.8% of production, representing
a year-on-year increase of 4.4%.
Milk Sector
The
United States Department of Agriculture revised milk production in
Argentina for 2018 up 1% respect to December 2017, projecting 10.8
million tons, as a result of higher domestic prices, improved
weather conditions, and an increased productivity.
Although dairy
farmers have benefited from a return to normal weather and improved
pasture growth during the first half of 2018, the economic
environment is proving challenging, due to the severe drought that
had a negative impact on soybean export revenues, and the higher
energy costs and struggling fiscal pressures. These factors may be
partially offset by the Stand-By Arrangement of $50 billion with
the IMF that will allow Argentina to continue its economic reforms.
Nevertheless, the smaller and less efficient farmers will face
challenging conditions as the costs of production rise and their
margins are squeezed.
Urban Properties and Investment Business
Operations Center in Argentina
Evolution of Shopping Malls in Argentina
At
October 2018, the Consumer Confidence Index (CCI) showed a 3.1%
decline as compared to September 2018, and a 36% decrease as
compared to October 2017. Sales in Shopping Mall Properties in
October 2018 reached a total amount of Ps.6,096.7 million, which
represented a 23.2% increase compared to the same month in 2017.
Accumulated sales for the first eight months of the year totaled
Ps.47,137.8 million and reached a 26.6% percent variation compared
to the same period the previous year.
Evolution of Offices in Argentina
According to
Colliers International, as of June 30, 2018, the A+ and A office
inventory increased as compared to 2017, at 1,899,183 sqm. In terms
of rental availability, the vacancy rate maintained without
important changes around 7.3% during the second quarter of 2018.
These values indicate that the market is healthy in terms of its
operations, allowing an optimum level of supply with balanced
values.
Compared to the
previous quarter, the Premium Offices prices remained the same in
the order of US$ 25.8 per square meter compared to the previous
quarter, and showed a 5% increase compared to the same period last
year, which was US$ 24.5 per square meter. There was a decrease in
rental prices for A+ properties of US$ 2.8per square meter, from
US$ 25.6 per square meter in the first quarter of 2018 to US$ 28.4
per square meter for the second quarter of 2018. In this context,
Catalinas presents as the zone with higher prices per square meter,
reaching an average of US$ 31.3. Likewise, the industry reported a
2% increase in rental prices for A properties compared to the first
quarter of 2018, reaching an average of US$ 23.1 per square meter,
in which the North zone of Ciudad de Buenos Aires reach the higher
prices, reaching US$ 29.1 per square meter.
Evolution of the Hotel industry in Argentina
According to the
Hotel Vacancy Survey (EOH) prepared by INDEC, at June 2018,
overnight stays at hotel and parahotel establishments were
estimated at 2.6 million, 6.0% lower than the same month the
previous year. Overnight stays by resident and nonresident
travelers decreased by 5.6% and 6.4%, respectively. Total travelers
who stayed at hotels during June were 1.2 million, a 9.0% decrease
compared to the same month the previous year. The number of
resident and nonresident travelers decreased by 10.1% and 4.5%,
respectively. The 1.0 million resident travelers represented 80.5%
of the total number of travelers who stayed at hotels. The Room
Occupancy Rate in April was 34.4%, showing a slight decline
compared to the same month the previous year. Moreover, the Bed
Occupancy Rate for the same period was 24.8%, which represents a
slight decrease compared to June 2017.
245
Operations Center in Israel
Israeli
macroeconomic context
According to IMF
Israel report published on May, 2018, Israel’s growth is
expected to reach about 3.4% in 2018 and remain around this level
in the next few years owing to the completion of major projects.
Domestic and international conditions are supportive of an increase
in inflation, yet significant uncertainty remains around the timing
of such a rise. Housing price increases have slowed to only 2%
alongside a decline in turnover, but housing affordability remains
a problem.
Despite
a reversal of one-off factors boosting 2016 GDP, the economy grew
3.4% in 2017 owing to robust domestic demand and higher global
growth lifting exports by 3.7%,. Consumption growth reverted to
3.3% after an unusually high increase in 2016 when car purchases
surged ahead of vehicle tax hikes. Fixed investment rose 2.8% even
after a double-digit increase in 2016, bolstered by imported
machinery, such as Intel facility upgrades, and non-residential
construction.
Unemployment has
declined steadily, to below 4% in early 2018, supporting
broad-based wage growth. Nonetheless, inflation remains below the
1%–3% target range of the Bank of Israel, reflecting the
appreciation of the shekel, increased competition including
internet shopping, and government measures to lower the cost of
living.
The
Bank of Israel has held the policy rate at 0.1% since February 2015
and has stated that monetary policy in Israel will remain
accommodative as long as necessary to entrench inflation within the
target range.
In the
longer term, however, Israel faces challenges to growth and
stability from modest productivity growth despite its dynamic
hightech sector, sizable infrastructure needs that are especially
evident in high traffic congestion, and high poverty partly
reflecting the lower skills and labor participation of population
groups that will rise as a share of the working age population in
coming decades.
E.
OFF-BALANCE SHEET ARRANGEMENTS
Agricultural Business
In the
ordinary course of business, FyO guarantees certain brokerage
transactions. Under the agreement, FyO guarantees the performance
of the producer in case it does not comply with the physical
delivery. We have recourse against the non-performing party. As of
June 30, 2018, the value of transacted merchandise for which
guarantees were granted amounted to Ps.202 million. As of the date
of this annual report, there were non-performing parties under the
agreements for which we had to respond as guarantor. As of the date
of this annual report, the value of transacted merchandise for
which guarantees were granted amounted to Ps.477
million.
Urban Properties and Investment Business
As of
June 30, 2018, IRSA did not have any off-balance sheet
transactions, arrangements or obligations with unconsolidated
entities or others that are reasonably likely to have a material
effect on our financial condition, results of operations or
liquidity.
F.
TABULAR DISCLOSURE OF CONTRACTUAL OBLIGATIONS
The
followings tables show our contractual obligations, as of June 30,
2018.
|
As
of June 30, 2018
|
Less
than 1 year
|
Between
1 and 2 years
|
Between
2 and 3 years
|
Between
3 and 4 years
|
More
than 4 years
|
Total
|
|
|
(in
million of Ps.)
|
|||||
|
Trade and other
payables
|
16,404
|
1,318
|
1,338
|
10
|
3
|
19,073
|
|
Borrowings
(excluding finance lease liabilities)
|
37,454
|
36,003
|
30,996
|
25,746
|
129,458
|
259,657
|
|
Finance leases
obligation
|
38
|
7
|
3
|
-
|
137
|
185
|
|
Purchase
obligation
|
3,921
|
1,823
|
639
|
347
|
229
|
6,959
|
|
Derivative
financial instruments
|
122
|
16
|
-
|
-
|
46
|
184
|
|
Total
|
57,939
|
39,167
|
32,976
|
26,103
|
129,873
|
286,058
|
Where
the interest payable is not fixed, the amount disclosed has been
determined by reference to the existing conditions at the reporting
date.
G.
SAFE HARBOR
See the
discussion at the beginning of this Item 5 and “Disclosure
regarding forward looking statements” in the introduction of
this annual report, for forward-looking statement safe harbor
provisions.
For
information about Production and Sales, please see “Item 5.A.
Consolidated Operating Results.”
246
A.
DIRECTORS AND SENIOR MANAGEMENT
Board
of Directors
We are
managed by a board of directors, which consists of nine directors
and three alternate directors. Each director and alternate director
is elected by our shareholders at an annual ordinary meeting of
shareholders for a three-year term, provided, however, that of the
board of directors is elected each year. The directors and
alternate directors may be re-elected to serve on the board
unlimited number of times. There are no arrangements or
understandings pursuant to which any director or person from our
senior management is appointed.
Our
current board of directors was elected at the shareholders’
meetings held on October 30, 2015, October 31, 2016 and October 31,
2017 for terms expiring in the years 2018, 2019 and 2020,
respectively.Our current directors are as follows:
|
Directors
(1)
|
Date of Birth
|
Position in Cresud
|
Term Expires
(2)
|
Date of Current Appointment
|
Current Position Held Since
|
|
Eduardo
Sergio Elsztain
|
01/26/1960
|
Chairman
|
06/30/20
|
10/31/17
|
1994
|
|
Saúl
Zang
|
12/30/1945
|
First
Vice-Chairman
|
06/30/20
|
10/31/17
|
1994
|
|
Alejandro
Gustavo Elsztain
|
03/31/1966
|
Second
Vice-Chairman and CEO
|
06/30/19
|
10/31/16
|
1994
|
|
Gabriel
A.G. Reznik
|
11/18/1958
|
Regular
Director
|
06/30/21
|
10/29/18
|
2003
|
|
Jorge
Oscar Fernández
|
01/08/1939
|
Regular
Director
|
06/30/21
|
10/29/18
|
2003
|
|
Fernando
Adrián Elsztain
|
01/04/1961
|
Regular
Director
|
06/30/19
|
10/31/16
|
2004
|
|
Pedro
Damasco Labaqui Palacio
|
02/22/1943
|
Regular
Director
|
06/30/21
|
10/29/18
|
2006
|
|
Daniel
E. Mellicovsky
|
01/17/1948
|
Regular
Director
|
06/30/20
|
10/31/17
|
2008
|
|
Alejandro
Gustavo Casaretto
|
10/15/1952
|
Regular
Director
|
06/30/20
|
10/31/17
|
2008
|
|
Gastón
Armando Lernoud
|
06/04/1968
|
Alternate
Director
|
06/30/20
|
10/31/17
|
1999
|
|
Enrique
Antonini
|
03/16/1950
|
Alternate
Director
|
06/30/19
|
10/31/16
|
2007
|
|
Eduardo
Kalpakian
|
03/03/1964
|
Alternate
Director
|
06/30/19
|
10/31/16
|
2007
|
(1) The business
address of our management is Moreno 877, 23rd Floor, (C1091AAQ)
Buenos Aires, Argentina.
(2) Term expires at
the annual ordinary shareholders’ meeting.
Gabriel
A. G. Reznik, Jorge Oscar Fernandez, Pedro Dámaso Labaqui
Palacio, Daniel Elias Mellicovsky, Enrique Antonini and Eduardo
Kalpakian, qualify as independent, in accordance with the CNV
Rules.
The
following is a brief biographical description of each member of our
board of directors:
Eduardo Sergio
Elsztain.
Mr.
Elsztain has been engaged in the real estate business for more than
twenty-five years. He is the chairman of the board of Directors of
CRESUD, IRSA Propiedades Comerciales, IDB Development Corporation
Ltd, Discount Investment Corporation Ltd., Banco Hipotecario S.A.,
BrasilAgro Companhia Brasileira de Propiedades Agrícolas,
Austral Gold Ltd., Consultores Assets Management S.A., among other
companies. He also Chairs IRSA Foundation, is a member of the World
Economic Forum, the Council of the Americas, the Group of 50 and
the Argentine Business Association (AEA), among others. He is
co-founder of Endeavor Argentina and serves as VicePresident of the
World Jewish Congress. Mr. Eduardo Sergio Elsztain is Fernando
Adrián Elsztain’s cousin and Alejandro Gustavo
Elsztain’s and Daniel Ricardo Elsztain’s
brother.
Saúl
Zang.
Mr. Zang obtained a law degree from the
University of Buenos Aires. He is a member of the International Bar
Association and of the Interamerican Federation of Lawyers. He was
a founding partner of Zang, Bergel & Viñes Law Firm. Mr.
Zang is Vice-chairman of CRESUD, IRSA CP, Consultores Assets
Management S.A. and other companies like Fibesa S.A. and Chairman
at Puerto Retiro S.A. He is also director of IDB Development
Corporation Ltd., Discount Investment Corporation Ltd., Banco
Hipotecario S.A., BrasilAgro Companhia Brasileira de Propiedades
Agrícolas, BACS Banco de Crédito &
Securitización S.A., Tarshop S.A., Nuevas Fronteras S.A., and
Palermo Invest S.A., among other companies.
Alejandro Gustavo
Elsztain.
Mr. Elsztain obtained a degree in
agricultural engineering from University of Buenos Aires. He is
currently Second Vice-chairman of CRESUD, Executive Vice-chairman
of IRSA, Chairman at Fibesa S.A. and Vice-chairman at Nuevas
Fronteras S.A. and Hoteles Argentinos S.A. In addition, he is
Chairman of the israel’ companies Gav Yam and Mehadrin and
Vice-Chairman of Property & Building Corporation Ltd. He is
also a regular Director at IDB Development Corporation Ltd.,
BrasilAgro Companhia Brasileira de Propiedades Agrícolas,
Emprendimiento Recoleta S.A., among other companies. He is also
Chairman of Hillel Foundation Argentina. Mr. Alejandro Gustavo
Elsztain is brother of our Chairman, Eduardo Sergio Elsztain and of
Daniel Ricardo Elsztain. He is also Fernando Adrián
Elsztain’s cousin.
247
Gabriel A. G.
Reznik.
Mr. Reznik obtained a degree in Civil Engineering
from University of Buenos Aires (
Universidad de Buenos Aires)
. He worked
for IRSA since 1992 until May 2005 at which time he resigned. He
had formerly worked for an independent construction company in
Argentina. He is director of Banco Hipotecario.
Jorge Oscar
Fernández.
Mr. Fernández obtained a
degree in Economic Sciences from University of Buenos Aires
(
Universidad de Buenos
Aires)
. He has performed professional activities at several
banks, financial corporations, insurance firms and other companies
related to financial services. He is also involved in many
industrial and commercial institutions and associations
.
Fernando Adrián
Elsztain.
Mr. Elsztain studied architecture at Universidad
de Buenos Aires. He has been engaged in the real estate business as
a consultant and as managing officer of a real estate company. He
is chairman of the Board of Directors of Palermo Invest S.A. and
Nuevas Fronteras S.A. He is also a director of Hoteles Argentinos
S.A. and Llao Llao Resorts S.A., and an alternate director of Banco
Hipotecario and Puerto Retiro S.A. Mr. Fernando Adrián
Elsztain is cousin of our Chairman, Eduardo Sergio Elsztain, and
our directors Alejandro Gustavo Elsztain and Daniel Ricardo
Elsztain.
Pedro Damaso Labaqui
Palacio.
Mr.
Labaqui obtained a law degree from University of Buenos Aires
(
Universidad de Buenos
Aires
). He is also director of Bapro Medios de Pago S.A.,
permanent statutory auditor of Bayfe S.A. Fondos Comunes de
Inversión, director and member of the Supervisory Committee of
J. Minetti S.A., and Director of REM Sociedad de Bolsa
S.A.
Daniel E.
Mellicovsky.
Mr. Mellicovsky obtained a degree in accounting
from the University of Buenos Aires (Universidad de Buenos Aires).
He has served as director of several companies of the agricultural,
food supplies, financial and hotel development sectors
.
Alejandro Gustavo
Casaretto
Mr. Casaretto obtained a degree in agricultural
engineering from University of Buenos Aires (
Universidad de Buenos Aires)
. He has
served as our technical manager, farm manager, and technical
coordinator since 1975.
Gastón Armando
Lernoud.
Mr.
Lernoud obtained a law degree in Universidad El Salvador in 1992.
He obtained a Master in Corporate Law in Universidad de Palermo in
1996. He has been senior associate in Zang, Bergel & Viñes
Law Firm until June 2002, when he joined CRESUD as legal
counsel.
Enrique
Antonini.
Mr.
Antonini holds a degree in law from the School of Law of
Universidad de Buenos Aires. He has been director of Banco Mariva
S.A. since 1992 until today, and alternate director of Mariva
Bursátil S.A. since 2015. He is a member of the Argentine
Banking Lawyers Committee and the International Bar
Association.
Eduardo Kalpakian.
Mr. Kalpakian holds a degree in business from the University of
Belgrano
(Universidad de
Belgrano)
. He has also an MBA from the CEMA University of
Argentina. He has been director for 25 years of Kalpakian Hnos.
S.A.C.I., a leading carpet manufacturer and flooring distributor in
Argentina. Currently he is vice-chairman of such company’s
board and CEO. He is also vice-chairman of the board of La Dormida
S.A.A.C.E I.
Employment
contracts with our directors and certain senior
managers
Law No.
20,744 governs certain conditions of the labor relationship,
including remuneration, protection of wages, hours of work,
holidays, paid leave, maternity protection, minimum age
requirements, protection of young workers and suspension and
termination of the contract.
Senior
Management
Senior
management performs its duties in accordance with the instructions
of our board of directors. There are no arrangements by which a
person is selected as a member of our senior
management.
The
following table shows information about our current senior
management of the Operations Center in Argentina (designated by the
board of directors meeting):
|
Name
|
Date of Birth
|
Position
|
Current Position Held Since
|
|
Alejandro
G. Elsztain
|
03/31/1966
|
CEO
|
1994
|
|
Carlos
Blousson
|
09/21/1963
|
General
Manager for Argentina and Bolivia Operations
|
2008
|
|
Matías
I. Gaivironsky
|
02/23/1976
|
Chief
Financial and Administrative Officer
|
2011
|
|
Alejandro
Casaretto
|
10/15/1952
|
Chief
Regional Agricultural Officer
|
2008
|
The
following is a biographical description of each of our senior
managers who are not directors:
Matías Iván Gaivironsky
. Mr.
Matías Gaivironsky obtained a degree in business
administration from Universidad de Buenos Aires. He has a Master in
Finance from Universidad del CEMA. Since 1997 he has served in
various positions at IRSA, IRSA CP and the Company, and he has
served as Chief Financial Officer since December 2011. In early
2016, he was also designated as Administrative Officer. In 2008 he
served as Chief Financial Officer in Tarshop and was later
appointed Manager of the Capital Markets and Investor Relations
Division of IRSA, IRSA CP and the Company.
248
Carlos Blousson.
Mr. Blousson obtained
a degree in agricultural engineering from University of Burnos
Aires (
Universidad de Buenos
Aires
). He has been working as our Chief Sales Officer since
1996. Prior to joining us, he worked as a futures and options
operator at Vanexva Bursátil –Sociedad de Bolsa.
Previously, he worked as a farmland manager and a technical advisor
at Leucon S.A.
The
following table shows information about our current senior
management of the Operations Center in Israel:
|
Name
|
Date of birth
|
Position
|
Current position held since
|
|
Sholem
Lapidot
|
10/22/1979
|
Chief
Executive Officer
|
2016
|
|
Gil
Kotler
|
04/10/1966
|
Chief
Financial Officer
|
2016
|
|
Aaron
Kaufman
|
03/03/1970
|
VP
& General Counsel
|
2015
|
Sholem
Lapidot.
Mr.
Lapidot has studied Rabbinical Studies and Jewish Philosophy in
Argentina, Canada and Israel. Mr. Lapidot serves as CEO and
director in DIC and IDBD since January 2016., and as a director in
several subsidiaries of IDBD. Mr. Lapidot has been the CEO of IDBD
and DIC since January 2016.
Gil
Kotler.
Mr.
Kotler obtained a bachelors’ degree in economics and
accounting from Tel Aviv University in Israel in 1993 as well as a
GMP at Harvard Business School in 2011. He serves as the chief
financial officer of IDBD since April 2016 and the chief financial
officer of DIC since January 2016. Mr. Kotler also serves as a
director in several subsidiaries of IDBD.
Aaron
Kaufman.
Mr.
Kaufman obtained a law degree in Tel Aviv University in 1996. He
has been partner in Epstein Law Firm until November 2015, when he
joined IDBD as a VP and General Counsel. Mr. Kaufman serves as VP
and General Counsel in DIC since April 2016 and as a director in
several subsidiaries of IDBD.
Executive
Committee
Pursuant to our
by-laws, our day-to-day business is managed by an executive
committee consisting of a minimum of four and a maximum of seven
directors and one alternate member, among which there should be the
chairman, first vice-chairman and second vice-chairman of the board
of directors. The current members of the Executive Committee are
Messrs. Eduardo S. Elsztain, Saúl Zang, Alejandro Elsztain and
Fernando A. Elsztain.
The
executive committee is responsible for the management of the
day-to-day business pursuant to authority delegated by our board of
directors in accordance with applicable law and our by-laws. Our
by-laws authorize the executive committee to:
|
●
|
designate the
managers and establish the duties and compensation of such
managers;
|
|
●
|
grant
and revoke powers of attorney to attorneys-at-law on behalf of
us;
|
|
●
|
hire,
discipline and fire personnel and determine wages, salaries and
compensation of personnel;
|
|
●
|
enter
into contracts related to our business;
|
|
●
|
manage
our assets;
|
|
●
|
enter
into loan agreements for our business and set up liens to secure
our obligations; and
|
|
●
|
perform
any other acts necessary to manage our day-to-day
business.
|
Supervisory
Committee
Our
Supervisory Committee is responsible for reviewing and supervising
our administration and affairs, and verifying compliance with the
bylaws and the decisions adopted at shareholders’ meetings
pursuant to the provision of the General Companies Law. The members
of the Supervisory Committee are appointed at the annual general
ordinary shareholders’ meeting for a term of one year. The
Supervisory Committee is composed of three members and three
alternate members.
The
following table shows information about the members of our
Supervisory Committee, who were elected in the annual general
ordinary shareholders’ meeting which was held on October 31,
2016:
|
Member
|
Date of Birth
|
Position
|
|
José
Daniel Abelovich
|
07/20/1956
|
Member
|
|
Marcelo
Héctor Fuxman
|
11/30/1955
|
Member
|
|
Noemí
Ivonne Cohn
|
05/20/1959
|
Member
|
|
Roberto
Daniel Murmis
|
04/07/1959
|
Alternate
Member
|
|
Alicia
Graciela Rigueira
|
12/02/1951
|
Alternate
member
|
|
Gastón
Damián Lizitza
|
06/09/1972
|
Alternate
member
|
All
members of the supervisory committee qualify as independent, in
accordance with CNV Resolution No. 400/2002 Rules.
Set
forth below is a brief biographical description of each member of
our Supervisory Committee:
249
José Daniel
Abelovich.
Mr. Abelovich obtained a degree in accounting
from the University of Buenos Aires (
Universidad de Buenos Aires)
. He is a
founding member and partner of Abelovich, Polano & Asociados
S.R.L. / firm member of Nexia International, a public accounting
firm in Argentina. Formerly, he had been a manager of Harteneck,
López y Cía/Coopers & Lybrand and has served as a
senior advisor in Argentina for the United Nations and the World
Bank. He is a member of the Supervisory Committees of IRSA, IRSA
Propiedades Comerciales, Hoteles Argentinos S.A., Inversora
Bolívar, and Banco Hipotecario S.A, among other
companies.
Marcelo Héctor
Fuxman.
Mr. Fuxman obtained a degree in accounting from the
University of Buenos Aires (
Universidad de Buenos Aires)
. He is a
partner of Abelovich, Polano & Asociados S.R.L. / firm member
of Nexia International, a public accounting firm in Argentina. He
is also a member of the Supervisory Committees of IRSA, IRSA
Propiedades Comerciales, Inversora Bolívar, and Banco
Hipotecario, among other companies.
Noemí Ivonne
Cohn.
Mrs. Cohn obtained a degree in accounting from the
University of Buenos Aires
(Universidad de Buenos Aires)
. Mrs.
Cohn is a partner at Abelovich, Polano & Asociados S.R.L. /
firm member of Nexia International, public accounting firm in
Argentina, and works in the audit area. Mrs. Cohn worked in the
audit area in Harteneck, Lopez and Company, Coopers & Lybrand
in Argentina and in Los Angeles, California. Mrs. Cohn is member of
the Supervisory Committees of IRSA and IRSA Propiedades
Comerciales, among other companies.
Roberto Daniel
Murmis.
Mr. Murmis holds a degree in accounting from the
University of Buenos Aires (
Universidad de Buenos Aires)
. Mr.
Murmis is a partner at Abelovich, Polano & Asociados S.R.L /
firm member of Nexia International, a public accounting firm in
Argentina. Mr. Murmis worked as an advisor to the Public Revenue
Secretariat, Argentine Ministry of Economy. Furthermore, he is a
member of the Supervisory Committee of IRSA, IRSA Propiedades
Comerciales, Futuros y Opciones S.A., and Llao Llao Resorts S.A.,
among other companies.
Alicia Graciela
Rigueira.
Mrs. Rigueira holds a degree in accounting from
the University of Buenos Aires
(Universidad de Buenos Aires)
. Since
1998 she has been a manager at Estudio Abelovich, Polano &
Asociados / firm member of Nexia International, a public accounting
firm in Argentina. From 1974 to 1998, Mrs. Rigueira performed
several functions in Harteneck, Lopez y Cia. affiliated with
Coopers & Lybrand. Mrs. Rigueira lectured at the School of
Economic Sciences of Lomas de Zamora University.
Gastón Gabriel
Lizitza.
Mr. Lizitza obtained a degree in accounting at the
University of Buenos Aires. He is a partner at Abelovich, Polano
& Asociados S.R.L; an accounting firm in Argentina, member of
Nexia International. He is also a member of the Supervisory
Committee of BACSAA, Cresud SACIF and A, Futuros y Opciones.Com SA
and IRSA Inversiones y Representaciones Sociedad
Anónima.
KEY
EMPLOYEES
There
are no key employees.
B.
COMPENSATION
Compensation of directors
Under
the Argentine Law, if the compensation of the members of the Board
of Directors is not established in the by-laws of the Company, it
should be determined by the shareholders’ meeting. The
maximum amount of total compensation to the members of the Board of
Directors, including compensation for technical or administrative
permanent activities, cannot exceed 25% of the earnings of the
Company. That amount should be limited to 5% when there is no
distribution of dividends to shareholders and will be increased
proportionally to the distribution, in accordance with the formulas
and scales set forth under the CNV Rules. When one or more
directors perform special commissions or technical or
administrative activities, and there are no earnings to distribute
or they are reduced, the shareholding meeting shall approve
compensation in excess of the above metioned limits.
The
compensation of our directors for each fiscal year is determined
pursuant to Argentine law, and taking into consideration whether
the directors performed technical or administrative activities and
our fiscal year’s results. Once the amount is determined, it
is considered at the shareholders’ meeting.
At our
shareholders’ meeting held on October 31, 2018, a
compensation for an aggregate amount of Ps.
140
,
599
,
334
was approved for all of our directors for the fiscal year ended
June 30, 2018.
Compensation of Supervisory Committee
Our
shareholders’ meeting held on October 29, 2018 further
approved by majority vote a compensation for an aggregate amount of
Ps.900,000 to our Supervisory Committee for the fiscal year ended
June 29, 2018.
250
Compensation of Senior Management
Our
senior management is paid a fixed amount established by taking into
consideration their background, capacity and experience and an
annual bonus which varies according to their individual performance
and our results.
The
total and aggregate compensation paid to our senior management of
the Operations Center in Argentina and the Agricultural Business
for the fiscal year 2018, was Ps.26,609,721.
The
aggregate compensation to the Senior Management of the Operations
Center in Israel for the fiscal year ended June 30, 2018 and 2017
was of Ps.67 million ans Ps.13 million, respectively.
Compensation of the Audit Committee
The
members of our Audit Committee do not receive any additional
compensation other than that received for their services as members
of our board of directors.
Capitalization Program for our executive staff
During
the fiscal year ended June 30, 2007, the Company developed the
design of a capitalization program for its executive staff
consisting in contributions made by both the employees and the
Company.
Such
program is intended for certain employees selected by the Company
that it wishes to retain by increasing employee total compensation
by means of an extraordinary reward in so far as certain
requirements are fulfilled.
The
payment of contributions into the plan and participation therein
are voluntary. Once the intended beneficiary accepts to take part
in the plan, he/she may make two types of contributions: a monthly
contribution based on his/her salary and an extraordinary
contribution, based on his/her annual bonus. It is suggested that
contributions should be of up to 2.5% of salaries and of up to 15%
of the annual bonus. And then there is the contribution payable by
the Company which shall amount to 200% of the monthly contributions
and of 300% of the extraordinary contributions made by the
employees.
The
funds resulting from the contributions made by the participants are
transferred to an independent financial vehicle, specially created
and situated in Argentina in the form of a mutual fund with the
approval of the CNV. These funds can be freely redeemed at the
request of participants.
The
funds resulting from the contributions made by both companies are
transferred to another independent financial vehicle, separate from
the one previously mentioned.
In the
future, the participants shall have access to 100% of the benefits
under the plan (that is, including the contributions made by the
Company for the benefit of the employees into the financial vehicle
specially created) in any of the following
circumstances:
● ordinary
retirement as prescribed by labor law
● total or
permanent disability, and
●
death.
In case
of resignation or termination without good cause, the participant
may redeem the amounts contributed by us only if he or she has
participated in the Plan for at least 5 years and if certain
conditions have been fulfilled.
During
this fiscal year ended June 30, 2018 and 2017, the Company has
contributed to the plan for Ps.32 million and Ps.3.6 million,
repectively.
Long Term Incentive Program
The
Shareholders’ Meetings held on October 31, 2011, October 31,
2012, and October 31, 2013, ratified the resolutions approved
thereat as regards the incentive plan for the Company’s
executive officers, up to 1% of its shareholders’ equity by
allocating the same number of own treasury stock (the
“Plan”), and delegated on the Board of Directors the
broadest powers to fix the price, term, form, modality, opportunity
and other conditions to implement such plan. In this sense and in
accordance with the new Capital Markets Law, the Company has made
the relevant filing with the CNV and pursuant to the comments
received from such entity, it has made the relevant amendments to
the Plan which, after the CNV had stated to have no further
comments, were explained and approved at the Shareholders’
Meeting held on November 14, 2014, where the broadest powers were
also delegated to the Board of Directors to implement such
plan.
The
Company has developed a medium and long term incentive and
retention stock program for its management team and key employees
under which share-based contributions were calculated based on the
annual bonus for the years 2011, 2012, 2013 and 2014.
251
The
beneficiaries under the Plan are invited to participate by the
Board of Directors and their decision to access the Plan was
voluntary.
In the
future, the Participants or their successors in interest will have
access to 100% of the benefit (Cresud’s shares contributed by
the Company) in the following cases:
● if an
employee resigns or is dismissed for no cause, he or she will be
entitled to the benefit only if 5 years have elapsed from the
moment of each contribution.
●
retirement.
● total or
permanent disability.
●
death.
While
participants are part of the program and until the conditions
mentioned above are met to receive the shares corresponding to the
contributions based on the 2011 to 2013 bonus, participants will
receive the economic rights corresponding to the shares assigned to
them. As provided under the plan, the shares of stock corresponding
to the 2014 bonus were delivered in April 2015; moreover, an amount
equivalent to one salary was delivered in the form of shares of
stock to those employees who did not participate in the plan and
who had discharged services for a term of two years.
The
shares allocated to the Plan by the Company are shares purchased in
2009, which the Shareholders’ Meeting held on October 31,
2011, has specifically decided to allocate to the
program.
DIC's
CEO of the Operation Center in Israel, has a stock option plan
which includes 5,310,000 options, that will be given in five
series, and which may be exercised for 5,310,000 ordinary shares,
par value NIS per share of Discount Investments. DIC's CEO has
exercised the first stage and as of April 2017 holds 4,248,000
options. DIC's CFO of the Operation Center in Israel, has a stock
option plan which includes 621,362 options, which 124,272 of the
said options were exercised and as of April 2017 holds 497,090
options.
Long Term Incentive Plan based on Shares
Brasilagro´s
Long-Term Stock-Based Incentive Plan (“LTIP” or
“Plan”) was approved at our general meeting held on
October 2, 2017. Executive officers and other key employees are
eligible for the Plan, however members of the Board of Directors
are not eligible.
In
establishing the Plan, the Company seeks to foster the achievement
of the Company’s objectives, to strengthen the
participants’ commitment in achieving Brasilagro’s
goals, resulting in a mid-term alignment of interests. Since the
participants receive our shares, this causes them to aim at
improving the results of Brasilagro and appreciation of the price
of our common shares, aligning mid-term interests with Brasilagro.
Finally, there is a long-term alignment of interests, since the
vesting period and the potential for valuation of our common shares
under the LTIP Plan also encourage participants to generate better
long-term results, as well as remain in Brasilagro. The Plan helps
retain key executives and key employees for a longer period, which
is fundamental to Brasilagro’s long-term management and
strategies.
The
Long-Term Stock-Based Incentive Program No. 1 (“Program No.
1”) was established under the Plan and was duly approved at
the Board of Directors meeting held on February 2,
2018.
C.
BOARD PRACTICES
Benefits
upon Termination of Employment
There
are no contracts providing for benefits to directors upon
termination of employment, other than those described under the
following sections: (i) Item 6 “Directors, Senior Management
and Employees – B. Compensation – Capitalization Plan
and (ii) Item 6 “Directors, Senior Management and Employees
– B. Compensation – Mid and Long Term Incentive
Program.
Internal
Control
Management uses the
Internal Control-Integrated Framework issued by the Committee of
Sponsoring Organizations of the Treadway Commission (the
“COSO Report”) to assess effectiveness of internal
control over financial reporting.
The
COSO Report sets forth that internal control is a process, effected
by an entity’s board of directors, management and other
personnel, designed to provide reasonable assurance regarding the
achievement of the entity’s objectives in the following
categories:
- Effectiveness and
efficiency of operations
- Reliability of
financial reporting
- Compliance with
applicable laws and regulations
Based
on the above, the Company’s internal control system involves
all levels of the company actively involved in exercising
control:
- the board of
directors, by establishing the objectives, principles and values,
setting the tone at the top and making the overall assessment of
results;
- the management of
each area is responsible for internal control in relation to
objectives and activities of the relevant area, i.e. the
implementation of policies and procedures to achieve the results of
the area and, therefore, those of the entity as a
whole;
- the other
personnel plays a role in exercising control, by generating
information used in the control system or taking action to ensure
control.
252
AUDIT
COMMITTEE
In
accordance with the Capital Markets Law No. 26.831 and the Rules of
the CNV, our board of directors has established an audit committee
which would focus on assisting the board in exercising its duty of
care, compliance with disclosure requirements, the enforcement of
accounting policies, the management of our business risks, the
management of our internal control systems, ethical conduct of our
businesses, monitoring the sufficiency of our financial statements,
our compliance with the laws, independence and capacity of
independent auditors and performance of audit duties both by our
internal audit and our external auditors. These responsabilities
are meant to comply with the duties assigned by Law 26.831, the
Technical Rules of the CNV, and other applicable laws.
On
November 5, 2015, our board of directors appointed Jorge Oscar
Fernández, Pedro Damaso Labaqui Palacio, Daniel Elías
Mellicovsky and Gabriel Adolfo Gregorio Reznik, all of them
independent members, as members of the audit committee. The board
of directors named Jorge Oscar Fernández as the financial
expert in accordance with the relevant SEC rules. We have a fully
independent audit committee as per the standards provided in Rule
10(A)-3(b)(1).
Remuneration
Committee
There
is no remuneration committee.
D.
EMPLOYEES
Operations Center in Argentina
As of
June 30, 2018, we had 3,381 employees.
As of
such date, we had 888 employees in our Agricultural Business in
Argentina, including our employees, FyO and SACPSA but not those of
Agro-Uranga S.A. Approximately 70% are under collective labor
agreements. We have good relations with each of our
employees.
We
employ 416 people in our International Agricultural businesses,
composed of 395 employees of Brasilagro and 21 employees in the
companies located in Bolivia.
Our
Real Estate Business had 1,771 employees. Our Development and Sale
of Properties and Other Non-Shopping Mall Businesses segment had 31
employees, 4 of whom are represented by the Commerce Labor Union
(Sindicato de Empleados de Comercio, or SEC) and 10 by the
Horizontal Property Union (SUTERH). The Shopping Mall segment had
928 employees including 434 under collective labor agreements. Our
Hotels segment had 812 employees with 662 represented by the
Tourism, Hotels and Gastronomy Union from the Argentine Republic
(
Unión de Trabajadores del
Turismo, Hoteleros y Gastronómicos de la República
Argentina
) (UTHGRA).
The
following table shows the number of employees in the
Company’s various businesses as of the dates mentioned
below:
|
|
|
Urban
Business
|
|
|
|
||
|
|
Agricultural
Business
(1)
|
Sales
and Developments
|
Shopping
Mall
|
Hotels
(2)
|
Shared
Service Center
(3)
|
Corporate
Areas
(3)
|
Total
|
|
June 30,
2016
|
1,014
|
31
|
964
|
758
|
172
|
114
|
3,053
|
|
June 30,
2017
|
1,224
|
31
|
947
|
790
|
196
|
109
|
3,297
|
|
June 30,
2018
|
1,304
|
31
|
928
|
812
|
191
|
115
|
3,381
|
(1)
Agricultural Business includes Cresud, FyO , SACPSA, and from this
fiscal year we also include in this disclosure the employees of
Brasilagro, Cresca and Palmeira S.A.
(2)
Hotels
include Intercontinental, Sheraton Libertador and Llao
Llao.
(3)
See Service Sharing Agreement entered into with IRSA Inversiones y
Representaciones Sociedad Anónima and IRSA Propiedades
Comerciales S.A.
253
Operation Center in Israel
The
following table shows the number of employees as of June 30, 2018
of our Israeli operating center divided by company:
|
|
As of June 30,
|
||
|
|
2018
|
2017
|
2016
|
|
IDBD
|
1
|
24
|
29
|
|
DIC
(1)
|
39
|
18
|
31
(3)
|
|
Shufersal
|
15,155
|
13,790
|
13,792
|
|
Cellcom
(2)
|
3,988
|
2,940
|
3,158
|
|
Elron
|
13
|
13
|
-
|
|
Epsilon
|
50
|
51
|
48
|
|
IDB
Tourism
|
855
|
797
|
734
|
|
Modiin
|
1
|
-
|
-
|
|
PBC
(3)
|
614
|
118
|
115
|
(1)
Includes Gydrom’s and New Pharm’s
employees.
(2)
Includes Gav-Yam’s, Ispro’s, Nave’s, Hon’s
y Mehadrin’s employees.
(3)
includes Elron's employees.
E.
SHARE OWNERSHIP
Share
ownership of directors, members of the supervisory committee, and
senior management as of June 30, 2018.
The
following table sets forth the amount and percentage of our shares
beneficially owned by our directors, Supervisory Committee and
senior management as of June 30, 2018:
|
Name
|
Position
|
Number
of Shares
|
Percentage
|
|
Directors
|
|
|
|
|
Eduardo Sergio
Elsztain
(1)
|
Chairman
|
174,267,696
|
34.74
%
|
|
Saúl
Zang
|
First
vice-chairman
|
4,096,555
|
0.82
%
|
|
Alejandro Gustavo
Elsztain
|
Second vice-
chairman / Chief Executive Officer
|
6,463,410
|
1.29
%
|
|
Gabriel A. G.
Reznik
|
Director
|
-
|
-
|
|
Jorge Oscar
Fernández
|
Director
|
3,057,710
|
0.61
%
|
|
Fernando
Adrián Elsztain
|
Director
|
-
|
-
|
|
Pedro Damaso
Labaqui Palacio
|
Director
|
3,600
|
0.00
%
|
|
Daniel Elias
Mellicovsky
|
Director
|
-
|
-
|
|
Alejandro Gustavo
Casaretto
|
Director/Regional
manager of Agricultural Real Estate
|
122,576
|
0.02
%
|
|
Gastón Armando
Lernoud
|
Alternate
Director
|
9,676
|
0.00
%
|
|
Enrique
Antonini
|
Alternate
Director
|
-
|
-
|
|
Eduardo
Kalpakian
|
Alternate
Director
|
-
|
-
|
|
|
|
|
|
|
Senior
Management
|
|
|
|
|
Matias
Gaivironsky
|
Chief Financial and
Administrative Officer
|
83,723
|
0.02
%
|
|
Carlos
Blousson
|
Chief Executive
Officer of the International Operation
|
-
|
-
|
|
|
|
|
|
|
Supervisory
Committee
|
|
|
|
|
José Daniel
Abelovich
|
Member
|
-
|
-
|
|
Marcelo Héctor
Fuxman
|
Member
|
-
|
-
|
|
Noemi Ivonne
Cohn
|
Member
|
-
|
-
|
|
Roberto Daniel
Murmis
|
Alternate
member
|
-
|
-
|
|
Alicia Graciela
Rigueira
|
Alternate
member
|
-
|
-
|
|
Sergio Leonardo
Kolaczyk
|
Alternate
member
|
-
|
-
|
|
Executive
Committee
|
|
|
|
|
Eduardo Sergio
Elsztain
|
Member
|
174,267,696
|
34.74
%
|
|
Saúl
Zang
|
Member
|
4,096,555
|
0.82
%
|
|
Alejandro Gustavo
Elsztain
|
Member
|
6,463,410
|
1.29
%
|
(1)
Includes (i) 120,173,090 shares beneficially owned by IFISA, for
which Mr. Eduardo S. Elsztain may be deemed beneficial owner, (ii)
880 common shares owned by Consultores Venture Capital Uruguay S.A.
for which Mr. Eduardo S. Elsztain may be deemed beneficial owner,
iii) 54,000,000 common shares owned by Agroinvestment S.A. for
which Mr. Eduardo S. Elsztain may be deemed beneficial owner and
iv) 93,726 common shares directly owned by Mr. Eduardo S.
Elsztain.
254
Option Ownership
No
options to purchase shares have been granted to our Directors,
Senior Managers, members of the Supervisory Committee, or Audit
Committee.
Employees’ Participation in our share Capital
There
are no arrangements for involving our employees in our capital
stock or related to the issuance of options, common shares or
securities other than those described under the following sections:
(i) “Item 6 - Directors, Senior Management and Employees
– B. Compensation – Capitalization Program for our
executive staff” and (ii) “Item 6 - Directors, Senior
Management and Employees – B. Compensation – Long Term
Incentive Program”.
A.
MAJOR SHAREHOLDERS
Information
about Major Shareholders
Share
Ownership
The
following table sets forth information regarding ownership of our
capital stock by each person known to us to own beneficially at
least 5% of our common shares, ANSES (The Argentine Social Security
National Agency) and all our directors and officers as a
group.
|
|
Share
Ownership as of June 30, 2018
|
|
|
Shareholder
|
Number
of Shares
|
Percentage
|
|
Eduardo Sergio
Elsztain
(1)(2)
|
174,267,696
|
34.74
%
|
|
Newfoundland
Capital Management
(3)
|
45,606,160
|
9.09
%
|
|
Directors and
officers
(4)
|
13,837,250
|
2.76
%
|
|
ANSES
|
18,000,448
|
3.59
%
|
|
Total
|
251,711,554
|
50.18
%
|
(1) Eduardo S.
Elsztain is the Chairman of the board of directors of IFIS Limited,
a corporation organized under the laws of Bermuda and Inversiones
Financieras del Sur S.A., a corporation organized under the laws of
Uruguay. Mr. Elsztain holds (through companies controlled by him
and proxies) a majority of the voting power in IFIS Ltd., which
owns 100% of IFISA.
(2) As a result,
Mr. Elsztain may be deemed beneficial owner of 34.74% of our total
shares, which includes (i) 120,173,090 shares beneficially owned by
IFISA, for which Mr. Eduardo S. Elsztain may be deemed beneficial
owner, (ii) 880 common shares owned by Consultores Venture Capital
Uruguay S.A. for which Mr. Eduardo S. Elsztain may be deemed
beneficial owner, iii) 54,000,000 common shares owned by
Agroninvestment S.A. for which Mr. Eduardo S. Elsztain may be
deemed beneficial owner and iv) 93,726 common shares directly owned
by Mr. Eduardo S. Elsztain.
(3) According to
the Form filed with the SEC. as of June 30, 2018.
(4) Includes only
direct ownership of our Directors and Senior Management, other than
Mr. Eduardo S. Elsztain.
Change
in Share Ownership in the Company
|
|
As
of June 30,
|
||||
|
|
2018
|
2017
|
2016
|
2015
|
2014
|
|
IFISA
(1)(2)
|
34.74
%
|
30.8
%
|
30.9
%
|
37.4
%
|
38.2
%
|
|
Newfoundland
Capital Management
(3)
|
9.0
%
|
-
|
-
|
-
|
-
|
|
Senvest Management
LLC
(3)
|
0.7
%
|
3.3
%
|
4.8
%
|
5.1
%
|
2,2
%
|
|
Directors and
officers
(4)
|
2.8
%
|
2.8
%
|
2.9
%
|
2.9
%
|
2.0
%
|
|
ANSES
|
3.6
%
|
3.6
%
|
3.6
%
|
3.6
%
|
3.5
%
|
255
(1) Eduardo S.
Elsztain is the Chairman of the board of directors of IFIS Limited,
a corporation organized under the laws of Bermuda and Inversiones
Financieras del Sur S.A., a corporation organized under the laws of
Uruguay. Mr. Elsztain holds (through companies controlled by him
and proxies) a majority of the voting power in IFIS Ltd., which
owns 100% of IFISA.
(2) As a result,
Mr. Elsztain may be deemed beneficial owner of 34.74% of our total
shares, which includes (i) 120,173,090 shares beneficially owned by
IFISA, for which Mr. Eduardo S. Elsztain may be deemed beneficial
owner, (ii) 880 common shares owned by Consultores Venture Capital
Uruguay S.A. for which Mr. Eduardo S. Elsztain may be deemed
beneficial owner, iii) 54,000,000 common shares owned by
Agroninvestment S.A. for which Mr. Eduardo S. Elsztain may be
deemed beneficial owner and iv) 93,726 common shares directly owned
by Mr. Eduardo S. Elsztain.
(3) According to
the Form filed with the SEC.
(4) Includes only
direct ownership of our Directors and Senior Management, other than
Mr. Eduardo S. Elsztain.
Difference
in Voting Rights
Our
major shareholders do not have different voting
rights.
Arrangements
for change in control
There
are no arrangements that may at a subsequent date in a change in
control.
Securities
held in the host country
As of
June 30, 2018, our total issued and outstanding capital stock
outstanding consisted of 501,642,804 common shares. As of June 30,
2018, there were approximately 38,619,283 Global Depositary Shares
(representing 386,192,830 of our common shares, or 76.99% of all of
our outstanding shares held) in the United States by approximately
78 registered holders of Global Depositary Shares.
As of
June 30, 2018, our directors and senior officers controlled,
directly or indirectly, approximately 37.5% of our common shares.
As a result, these shareholders have, and will continue to have,
significant influence on the election of our directors and the
outcome of any action requiring shareholder approval.
B.
RELATED PARTY TRANSACTIONS
A
related party transaction is any transaction entered into directly
or indirectly by us or any of our subsidiaries that is material
based on the value of the transaction to (a) us or any director,
officer or member of our management or shareholders; (b) any entity
in which any such person described in clause (a) is interested; or
(c) any person who is connected or related to any such person
described in clause (a).
Offices
and shopping malls spaces leases
We rent
office space for our executive offices located at the
Intercontinental Plaza tower at Moreno 877 in the Autonomous City
of Buenos Aires, which IRSA CP has owned since December 2014. We
also rent space that IRSA CP own at the Abasto Shopping
Mall.
The
offices of Eduardo Sergio Elsztain, the chairman of our board of
directors and our controlling shareholder are located at 108
Bolivar, in the City of Buenos Aires. The property has been rented
to a company controlled by family members of Mr. Elsztain, and to a
company controlled by Fernando A. Elsztain, one of our directors,
and members of his family.
● In
addition, we, IRSA, Tarshop S.A., BACS Banco de Crédito y
Securitización S.A., BHN Sociedad de Inversión S.A.,
BHN Seguros Generales S.A. and BHN Visa S.A. rent offices owned by
IRSA CP in different buildings.
●
Furthermore, we also let various spaces in IRCP´s shopping
malls (stores, stands, storage space or advertising space) to third
parties and related parties such as Tarshop S.A. and Banco
Hipotecario S.A.
Lease
agreements entered into with associates have included similar
provisions and amounts to those included in agreements with third
parties.
Agreement
for the exchange of corporate services with IRSA and IRSA
CP
Considering that
each of IRSA CP, IRSA and us have operations that overlap to a
certain extent, our board of directors deemed it advisable to
implement alternatives designed to reduce certain fixed costs of
our combined activities and to mitigate their impact on our
operating results while seizing and optimizing the individual
efficiencies of each of them in the different areas comprising the
management of operations.
To such
end, on June 30, 2004, a Master Agreement for the Exchange of
Corporate Services, or the “Frame Agreement,” was
entered into between IRSA CP, IRSA and us, which was amended
several times to bring it in line with evolving operating
requirements. The goal of the amendment is to increase efficiency
in the distribution of corporate resources and reduce operating
costs. The agreement had an initial term of 24 months and is
renewable automatically for equal periods, unless it is terminated
by any of the parties upon prior notice.
256
The
Framework Agreement currently provides for the exchange and sharing
of services among the following areas: Corporate Human Resources,
Administration and Finance, Planning, Institutional Relations,
Compliance, Shared Service
Center, Security, Attorneys, Corporate Legal, Corporate
Environment and Quality, General Management to Distribute, Security
of Directory, Real Estate Business Administration, Real Estate
Business Human Resources, Technique, Infrastructure and Services,
Purchase and Contracting, Administrations and Authorizations,
Investments, Governmental Affairs, Hotels, Fraud Prevention,
Bolivar, Directory to Distribute and Real Estate Directory to
Distribute.
Pursuant to the Framework Agreement, we, IRSA CP
and IRSA hired Deloitte & Co., an external consulting
firm, to review and evaluate periodically the criteria used in the
process of liquidating the corporate services, as well as the basis
for distribution and source documentation used in the process
indicated above, by means of a half-yearly report.
The
operations indicated above allow both IRSA CP and IRSA to keep our
strategic and commercial decisions fully independent and
confidential, with cost and profit apportionment allocated on the
basis of operating efficiency and equity, without pursuing
individual economic benefits for any of the related
companies.
Hospitality
services
We and
our related parties hire, on certain occasions, hotel services and
lease conference rooms for events to Nuevas Fronteras S.A. and
Hoteles Argentinos S.A., subsidiaries of IRSA, all on
arm’s-length terms and conditions.
Financial
and service operations
We work
with several financial entities in Argentina for operations
including, but not limited to, credit, investment, purchase and
sale of securities and financial derivatives. Such entities include
Banco Hipotecario S.A. and its subsidiaries. Furthermore, Banco
Hipotecario S.A. and BACS Banco de Crédito y
Securitización S.A. usually act as underwriters in capital
market transactions.
Donations
granted to Fundación IRSA and Fundación Museo de los
Niños
Fundación IRSA
is a non-profit charity that seeks to support and generate
initiatives concerning education, the promotion of corporate social
responsibility and the entrepreneurial spirit of young adults. It
carries out corporate volunteer programs and fosters donations from
our employees. The main members of Fundación IRSA’s
board of directors are: Eduardo S. Elsztain (President), Saúl
Zang (Vice President I), Alejandro Elsztain (Vice President II) and
Mariana C. de Elsztain (Secretary). It finances its activities with
donations from us, IRSA, IRSA CP and other related
companies.
On
October 31, 1997, IRSA CP entered into an agreement with
Fundación IRSA whereby 3,800 square meters of the developed
area at Abasto Shopping was granted under a gratuitous bailment
agreement for a term of 30 years. Subsequently, on October 29,
1999, Fundación IRSA assigned free of cost all the rights of
use over such store and its respective obligations to
Fundación Museo de los Niños.
On
November 29, 2005, IRSA CP signed another agreement with
Fundación Museo de los Niños granting under gratuitous
bailment 2,670 square meters of the developed area at Alto Rosario
shopping mall for a term of 30 years.
Fundación
Museo de los Niños has used these spaces to set up Abasto
Shopping and Museo de los Niños and Rosario, two interactive
learning centers intended for children and adults. Both agreements
establish the payment of common charges and direct expenses related
to the services performed by these stores must be borne by
Fundación Museo de los Niños.
Borrowings
In the
normal course of our activities, we enter into diverse loan
agreements or credit facilities between the related companies
and/or other related parties. These loans accrue interest at
prevailing market rates.
Purchase
of financial assets
We
usually invest excess cash in several instruments that may include
those issued by related companies, acquired at issuance or from
unrelated third parties through secondary market
deals.
Investment
in mutual funds of BACS Administradora de Activos S.A.
S.G.F.C.I.
Banco
Hipotecario provides financial services to related parties or an
arms length basis. In addition, we invest from time to time our
liquid fund in mutual funds managed by BACS Administradora de
Activos S.A. S.G.F.C.I., which is a subsidiary of Banco
Hipotecario, among other entities.
257
Legal
services
We hire
legal services from Estudio Zang, Bergel & Viñes, in
which Saúl Zang, was founding a partner. Mr. Zang is a
member of our board of directors and that of our related
companies.
Property
purchase—sale
In the
ordinary course of business, we may acquire from or sell to our
related parties certain real estate properties used for rental
purposes or otherwise, subject to our Audit Committee’s
approval. The Audit Committee must render an opinion as to whether
the terms of these transactions can reasonably be expected to have
been obtained by us in a comparable transaction in
arm’s-length dealings with a non-related party. In addition,
if the Audit Committee so requires, valuation reports by
independent specialist third parties must be obtained.
Investment Properties transferred to IRSA CP
On
December 22, 2014, IRSA transferred to IRSA CP, 83,789 square
meters of its premium office portfolio including the buildings
República, Bouchard 710, Della Paolera 265, Intercontinental
Plaza and Suipacha 652 and the “Intercontinental II”
plot of land in order to consolidate assets for the main corporate
purpose to develop and operate commercial properties in Argentina.
Based on third party appraisals, the total purchase price of the
transaction was US$308.0 million, which was fully paid as of June
30, 2016.
On
April 7, 2016, IRSA sold to IRSA CP, 16,012 square meters covering
14 floors and 142 garages in a building to be developed in the area
of “Catalinas,” City of Buenos Aires. The price of the
transaction was established based on two components: a
“determined” or fixed part equal to
Ps.455.7 million corresponding to the price of the land
acquired based on the number of square meters of the plot, which
has been fully paid, and a “determinable” component,
where IRSA will transfer to IRSA CP the real cost per square meter
of the construction. Audit Committees had no objections with
respect to this transaction.
Purchase
of agrochemicals from Adama
Adama
is a company specialized in agrochemicals, particularly used in
farming, and is a worldwide leader in active ingredients used in
agricultural production. Cresud, in the normal course of its
business, acquires agrochemical products and/or hires services from
Adama. On July 17, 2016, DIC reported that it had signed an
agreement with ChemChina to sell 40% of Adama Agricultural
Solutions Ltd.’s shares, indirectly controlled by IDBD
through DIC. For more information see “Recent
Developments.”
Transactions
with IFISA
On
February 10, 2015, Dolphin, sold 71,388,470 IDBD shares to IFISA,
for an amount of US$ 25.6 million, US$4.0 million of which were
paid upon execution and the remaining balance of US$21.6 million
were financed for a term of up to 360 days and priced at Libor 1M
(one month) + 3%. On May 9, 2016, effective as of February 10,
2016, the parties agreed to extend the expiration date for 30 days
as from execution of the addenda, to be automatically renewable
every 30 days for a maximum term of 180 days, and increasing the
rate to 9% since February10, 2016. On November 22, 2016, effective
as of November 5, 2017, the parties agreed to extend the expiration
date for an additional period of 30 days to be automatically
renewable every 30 days for a maximum term of 180 days. Finally, on
April 10, 2017, effective as of April 6, 2017, the parties agreed
to fix the expiration date in February 5, 2018. Additionally, the
parties undertook to capitalize the interest until April 6, 2017,
therefore the new amount as remaining balance shall be US$24.6
million amount which shall accrued interest at a rate of 9% annual
basis.
On May
31, 2015, IRSA, through Dolphin, sold to IFISA 46 million of
warrants Series 4 for a total amount of NIS 0.46 million
(equivalent to US$ 0.12 million at the time of the transaction),
provided IFISA agreed to exercise them fully when Dolphin were so
required by IDBD. In June 2015, IFISA exercised all the warrants
Series 4.
On July
31, 2015, Dolphin granted a loan to IFISA for an amount of US$ 7.1
million, due in July 2016, which accrues interest at Libor 1M (one
month) + 3%. On May 9, the parties agreed to extend the expiration
date to June 8, 2016, to be automatically renewable every 30 days
for a maximum term of 180 days, and increased the rate to 9%. On
November 22, 2016, effective as of November 5, 2016, the parties
agreed to extend the expiration date until December 5, 2016 to be
automatically renewable every 30 days for a maximum term of 180
days. Additionally, IFISA create a first degree pledge over
12,915,000 IDBD’s shares in order to guarantee the payment of
the debt. Finally, on April 10, 2017, effective as of April 6,
2017, the parties agreed to fix the expiration date in February 5,
2018. Additionally, the parties undertook to capitalize the
interest until April 6, 2017, therefore the new amount as remaining
balance shall be US$7.9 million amount which shall accrued interest
at a rate of 9% annual basis.
258
On
October 9, 2015, IRSA, through its subsidiary Real Estate
Investment Group V LP, granted a loan in the amount of US $ 40
million to IFISA (the “Promissory Note”) . The term of
the loan is one year calculated from the disbursement and will bear
interest at a rate of 3% + Libor 1M, to be determined monthly. On
October 7, 2016, the parties agreed to extend the expiration date
to be automatically renewable every 30 days for a maximum term of
180 days and increase the rate to 9%. On April 10, 2017, effective
as of April 6, 2017, the parties agreed to extend the expiration
date until February 5, 2018. Additionally, the parties undertook to
capitalize the interest until April 6, 2016, therefore the new
amount shall be US$43.1 million which shall accrue interest at a
rate of 9% annual basis.
On
December 1, 2017, REIG V transferred and assigned all of its rights
and obligations under the Promissory Note to Dolphin Netherlands
B.V. In consideration for the assignment, Dolphin Netherlands B.V.
paid an amount of US$ 46.7 million comprising capital and
interest.
In
February 2016, Dolphin Netherlands B.V., a subsidiary of Dolphin,
entered into an option contract with IFISA whereby Dolphin is
granted the right, but not the obligation to acquire 92,665,925
shares of IDBD held by IFISA at a share price of NIS 1.64 plus an
annual interest of 8.5%. The exercise date for the option extends
for two years.
On
December 1, 2017, IFISA sold 210,056,395 shares of IDBD to Dolphin
Netherlands B.V. at a price of NIS 1.894 per share, totaling NIS
397,8 million or US$ 113.7 million, of which US$ 80 million has
been cancelled by offset of certain credits that Dolphin
Netherlands B.V. has against IFISA. Therefore, the balance of US$
33.7 million was transferred to IFISA.
All
transactions are carried out at arm’s length.
As of
June 30, 2016 we had current a credit line with IFISA of shares
and/or GDRs of IRSA for up to 3,500,000 GDRs at an interest rate of
6%. This line expired in June 2017. Currently, there are no GDRs
lent to IFISA.
On June
18, 2012 we entered a credit facility agreement with IFISA,
pursuant to which we agreed to lend to IFISA up to US$ 6.0 million,
which would mature on November 24, 2012, then it was extended until
November 24, 2015, at an interest rate equivalent to LIBOR (12
months) + 300 bp., date in which was canceled. Currently, there are
no funds disbursed to IFISA under this agreement.
Farmland
Lease Agreement San Bernardo
We
lease a farmland located in the Province of Córdoba, from San
Bernardo de Córdoba S.A. (formerly known as Isaac Elsztain e
Hijos S.C.A.), pursuant to a lease agreement effective as of August
2015. The leased farmland has an extension of 12,600
hectares.
The
rent to be paid is the equivalent in Pesos of 3,5kg of beef per
hectare. The beef price will be set, taking into account the price
per kilo of beef quoted on Mercado de Hacienda de Liniers, the
previous week of the payment date. In addition, the parties have
agreed in a productivity prize of 15% of the weight that the cattle
achieve above 240.000kg. This prize will be payable on September
2016. This lease contemplates the possibility of extension up to
two periods per year. Currently being agreed conditions of its
extension.
Consulting
Agreement
Pursuant to the
terms of the Consulting Agreement with Consultores Asset Management
effective as of November 7, 1994, as amended from time to time and
by the last amendment dated in September, 2017 in which certain
adjustments were implemented to the purpose of the agreement by
virtue of the broadness of Cresud’s business, Consultores
Asset Management provides us advisory services on matters related
to capital investments in all aspects of the agricultural, real
estate, financing and hotels business, among others. One of our
shareholders and the Chairman of our board of directors is the
owner of 85% of the capital stock of Consultores Asset Management
and our First Vice Chairman of the board of directors holds the
remaining 15% of its capital stock.
Pursuant to the
terms of the Consulting Agreement, Consultores Asset Management
provides us with the following services:
|
●
|
advises
with respect to the investment of our capital in all aspects of
operations in agricultural, real estate, financing, hotels, etc,
matters and business proposals;
|
|
●
|
acts on
our behalf in such transactions, negotiating the prices,
conditions, and other terms of each operation; and
|
|
●
|
gives
advice regarding securities investments with respect to such
operations.
|
Under
the Consulting Agreement, we pay Consultores Asset Management for
its services, an annual fee equal to 10% of our annual after-tax
net income.
259
During
fiscal year ended June 30, 2018 the charge for consulting agreement
fees was Ps.554 million of which Ps. 40 million have been paid as
of june 30, 2018. Regarding the payable account with respect to the
remeasurement of the fees corresponding the years 2012 to 2016
after giving effect to the change of the valuation method of the
investment properties CAMSA has agreed to defer the collection
until the parties will agree a new payment schedule where the first
instalment will be after July 2018.
The
Consulting Agreement is subject to termination by either party upon
not less than 60 days prior written notice. If we terminate the
Consulting Agreement without cause, we will be liable to
Consultores Asset Management for twice the average of the amounts
of the management fee paid to Consultores Asset Management for the
two fiscal years prior to such termination.
Investment
in Dolphin Fund Ltd.
As of
the date of this annual report, IRSA have invested approximately US
$544 million in Dolphin, through its subsidiaries. Dolphin Fund
Ltd, is an investment fund incorporated under the laws of Bermuda,
whose investment manager is Consultores Venture Capital Uruguay
S.A., a company controlled indirectly by our Chairman, Eduardo S.
Elsztain. Dolphin Netherlands is a subsidiary of Dolphin Fund Ltd,
incorporated in the Netherlands. Such investments were made in
order to carry out the investment in IDBD. For more information
please see Item 4. Information on the Company – A. History
and development of the Company). IRSA agreed with Dolphin to not
pay any fee to Dolphin related to this investment.
Loan
between Dolphin and IDBD
As
described in note 4.H to these Consolidated Financial Statements
Dolphin had granted a series of subordinated loans to IDBD
(“the debt”) which have the following characteristics:
i) they subordinated, even in the case of insolvency, to all
current or future debts of IDBD; (ii) will be reimbursed after
payment of all the debts to their creditors; (iii) accrues interest
at a rate of 0.5%, which will be added to the amount of the debt
and will be payable only on the date the subordinated debt is
amortized; (iv) Dolphin will not have a right to participate or
vote in the meetings with IDBD creditors with respect to the
subordinated debt; (v) as from January 1, 2016, Dolphin has the
right, at its own discretion, to convert the debt balance into IDBD
shares, at that time, whether wholly orpartially, including the
interest accrued over the debt until that date; (vi) should Dolphin
opt to exercise the conversion, the debt balance will be converted
so that Dolphin will receive IDBD shares according to a share price
that will be 10% less than the average price of the last 30 days
prior to the date the conversion option is exercised. In the event
there is no market price per share, this will be determined in
accordance with an average of three valuations made by external or
independent experts, who shall be determined it by mutual consent
and, in the event of a lack of consent, they will be set by the
President of the Institute of Certified Public Accountants in
Israel.
Transfer
of tax credits
Sociedad
Anónima Carnes Pampeanas S.A. (subsidiary of Cresud) and
Cresud, assigned credits to IRSA CP and other related parties
corresponding to value added tax export refunds related to such
companies’ business activity.
For
further information regarding related party transactions see
Note 31 to our Audited Financial Statements.
C.
INTERESTS OF EXPERTS AND COUNSEL
This
section is not applicable.
A.
AUDITED CONSOLIDATED STATEMENTS AND OTHER FINANCIAL
INFORMATION
See
Item 18 for our Audited Consolidated Financial
Statements.
Legal
or arbitration proceedings
We are
not engaged in any material litigation or arbitration and no
material litigation or claim is known to us to be pending or
threatened against us, other than those described
below.
260
Litigation with Exagrind S.A.
Exagrind S.A. filed
a lawsuit against Inversiones Ganaderas S.A. (IGSA) (a former
subsidiary merged with the Company ) and Tali Sumaj on claims for
damages and losses produced by a fire in one of the Company's
farms, “San Rafael” farm, which is close to
Exagrind’s property, Tali Sumaj, in the Province of
Catamarca, Argentina. The fire took place on September 6, 2000.
There is a lien on the property and Exagrind S.A. requested that
the measure be extended with an attachment of bank accounts. This
ruling has been challenged and to date the accounts have not been
attached. Moreover there is another judicial filed labeled
“Exagrind S.A. Estancia San Rafael c/ Inversiones Ganaderas
S.A. s/ Incidente de extension de responsabilidad” (147/11)
wherein Exagrid S.A. requested an injunction against Cresud, which
has not been implemented. Notwithstanding the forgoing, this
measure was appealed by Cresud and to date the accounts have not
been attached. The final decision is pending since 06/23/2015. The
Company has recorded a provision amounting to Ps.4.2 million, which
is included within “Labor, legal and other
claims”.
On
December 2017, the first instance judgment was rendered,pursuant to
which, Cresud was sentenced to pay damages to the plaintiff.
Notwithstanding, the amount of the damages will be determined at
the time of execution of such ruling. On April 4, 2018, court
granted us an appeal. The company estimates the amount of damages
will be approximately Ps.7,000,000. As of the date of this Annual
Report, the appellation court had not rendered any final decision
on the matter.
In
addition, the Company is involved in several legal proceedings,
including tax, labor, civil, administrative and other matters for
which the Company has not established provisions based on the
information assessed to date. In the opinion of management, the
ultimate disposition of any threatened or pending matters, either
individually or collectively, will not have a material adverse
effect on the consolidated financial position, liquidity and
results of operations of the Company. For ease of presentation, the
Company has categorized these matters between those arising out of
our agricultural and agro-industrial activities and those arising
out of our investment and development properties business
activities.
IRSA’s
and IRSA CP’ legal or arbitration proceedings
Operation Center in Argentina
Set
forth below is a description of certain material legal proceedings
to which we are a party. We are not engaged in any other material
litigation or arbitration and no other material litigation or claim
is known to us to be pending or threatened against us or our
subsidiaries. Nevertheless, we may be involved in other litigation
from time to time in the ordinary course of business.
Puerto Retiro
On
November 18, 1997, in connection with our acquisition of our
subsidiary Inversora Bolívar, we indirectly acquired 35.2% of
the capital stock of Puerto Retiro. Inversora Bolívar had
purchased such common shares of Puerto Retiro from Redona
Investments Ltd. N.V. in 1996. In 1999, we, through Inversora
Bolívar, increased our interest in Puerto Retiro to 50.0% of
its capital stock. On April 18, 2000, Puerto Retiro was served
notice of a filing made by the Argentine government, through the
Ministry of Defense, seeking to extend the bankruptcy of Indarsa to
the Company. Upon filing of the complaint, the bankruptcy court
issued an order restraining the ability of Puerto Retiro to dispose
of, in any manner, the real property it had purchased in 1993 from
Tandanor. Puerto Retiro appealed the restraining order which was
confirmed by the Court on December 14, 2000.
In
1991, Indarsa had purchased 90% of Tandanor, a former
government-owned company, which owned a piece of land near Puerto
Madero of approximately 8 hectares, divided into two parcels:
Planta 1 and 2. After the purchase of Tandanor by Indarsa, in June
1993, Tandanor sold “Planta 1” to Puerto Retiro, for a
sum of US$18 million pursuant to a valuation performed by J.L.
Ramos, a well-known real estate brokerage firm in Argentina.
Indarsa failed to pay to the Argentine government the price for its
purchase of the stock of Tandanor, and as a result the Ministry of
Defense requested the bankruptcy of Indarsa. Since the only asset
of Indarsa was its holding in Tandanor, the Argentine government is
seeking to extend Indarsa’s bankruptcy to other companies or
individuals which, according to its view, acted as a single
economic group. In particular, the Argentine government has
requested the extension of Indarsa’s bankruptcy to Puerto
Retiro which acquired Planta 1 from Tandanor.
261
The
deadline for producing evidence in relation to these legal
proceedings has expired. The parties have submitted their closing
arguments and are awaiting a final judgment. However, the judge has
delayed his decision until a final judgment in the criminal
proceedings against the former Defense Minister and former
directors of Indarsa has been delivered. It should be noticed,
regarding the abovementioned criminal procedure, that on February
23, 2011 it was resolved to declare its expiration, and to dismiss
certain defendants. However, this resolution is not final because
it was appealed. We cannot give you any assurance that we will
prevail in this proceeding, and if the plaintiff’s claim is
upheld by the courts, all of the assets of Puerto Retiro would
likely be used to pay Indarsa’s debts and our investment in
Puerto Retiro, would be lost. As of June 30, 2016, we had not
established any reserve with respect of this
contingency.
Tandanor has filed
a civil action against Puerto Retiro and the people charged in the
referred criminal case looking forward to be reimbursed from all
the losses which have arose upon the fraud committed. On March 7,
2015 Puerto Retiro responded filing certain preliminary objections,
such as limitation, lack of information to respond the lawsuit,
lack of legitimacy (active and passive). On July 12, 2016 Puerto
Retiro was legally notified of the decision adopted by the Tribunal
Oral Federal No. 5 related to the preliminary objections above
mentioned. Two of them were rejected –lack of information and
lack of legitimacy (passive). We filed an appeal with regard to
this decision, which was rejected. The other two objections were
considered in the verdict.
On
September 7, 2018, Court read its verdict, according to which the
preliminary objection of limitation filed by Puerto Retiro was
successful. However, the deadline for appeals will not begin until
The Court publishes the grounds of the ruling, on November 30,
2018. Nevertheless, in the criminal procedure –where Puerto
Retiro is not a party- Court ordered the seizure confiscation
(“
decomiso
”) of
the land known as “Planta 1”. This Court´s verdict
is not final, as it is subject to further appeals by any other
party of the legal proceeding.
Legal issues with the City Hall of Neuquén
In June
2001, Shopping Neuquén requested that the City of Neuquén
allow it to transfer certain parcels of land to third parties so
that each participant in the commercial development to be
constructed would be able to build on its own land.
Neuquén’s Executive Branch previously rejected this
request under Executive Branch Decree No. 1437/2002 which also
established the expiration of the rights arising from Ordinance
5178 due to not building the shopping center in time, including the
loss of the land and of any improvement and expenses incurred. As a
result, Shopping Neuquén had no right to claim indemnity
charges and annulled its buy-sell land contracts.
Shopping
Neuquén submitted a written appeal to this decision on January
21, 2003. It also sought permission to submit a revised schedule of
time terms for the construction of the shopping center, taking into
account the economic situation at that time and including
reasonable short and medium term projections. Neuquén’s
Executive Branch rejected this request in their Executive Branch
Decree 585/2003. Consequently, on June 25, 2003, Shopping
Neuquén filed an “Administrative Procedural
Action” with the High Court of Neuquén requesting, among
other things, the annulment of Executive Branch Decrees 1,437/2002
and 585/2003 issued by the City Executive Branch. On December 21,
2004, the High Court of Neuquén communicated its decision that
the administrative procedural action that Shopping Neuquén had
filed against the City of Neuquén had expired. Shopping
Neuquén filed an extraordinary appeal for the case to be sent
to the Argentine Supreme Court.
On
December 13, 2006, while the case was under study in the Argentine
Supreme Court, Shopping Neuquén signed an agreement with both
the City and the Province of Neuquén that put an end to the
lawsuit between them and stipulated a new timetable for
construction of the commercial and housing enterprises (the
“Agreement”). Also, Shopping Neuquén was permitted
to transfer certain parcels to third parties so that each
participant in the commercial development to be constructed would
be able to build on its own land, with the exception of the land in
which the shopping center would be constructed. The Legislative
Council of the City of Neuquén duly ratified the Agreement.
The City Executive Branch promulgated the ordinance issued on
February 12, 2007.
Shopping
Neuquén came to an agreement and paid all of the City’s
lawyers, including pending fees contested in court.
Shopping
Neuquén finished the construction and opened the shopping
center in March, 2015, obtaining also all necessary provincial and
city authorizations for it.
Arcos del gourmet
IRSA CP
has been named as a party in a case titled “
Federación de Comercio e Industria de la
Ciudad de Buenos Aires y Otros c/ Gobierno de la Ciudad
Autónoma de Buenos Aires s/ Amparo
.” The
plaintiff filed a petition for injunctive relief against the local
government claiming that the Arcos del Gourmet project lacked the
necessary environmental approvals and did not meet zoning
requirements. On August 29, 2014, the lower court rendered a
decision dismissing the case. This resolution was appealed but
affirmed in December 2014. Therefore, on December 18, 2014,
the “Arcos” Project was opened to the public, and
currently is operating normally. Notwithstanding, the plaintiff
appeared before the Superior Court of the City of Buenos Aires to
request the review of the case based on constitutional matters
allegedly at issue. On July 4, 2017, the Court ordered the
Appeals court to review the case. As of the date of this report,
the Court of Appeal hasn´t rendered a new sentence
yet.
262
On
May 18, 2015, we were notified that the AABE, revoked the
concession agreement granted to IRSA CP’s subsidiary Arcos
del Gourmet S.A., through Resolution No. 170/2014. On
June 2, 2015, IRSA CP filed before the AABE a request to
declare the notification void, as certain formal proceedings
required under Argentine law were not complied with by the AABE.
Furthermore, IRSA CP filed an administrative appeal requesting the
dismissal of the revocation of the concession agreement and a
lawsuit seeking to declare Resolution No. 170/2014 void. IRSA
CP also filed a lawsuit in order to judicially pay the monthly
rental fees of the property. As of the date of this annual report,
the “Distrito Arcos” shopping mall continues to operate
normally. As of the date of this report, the Court of Appeal
hasn´t rendered a new sentence yet.
Other Litigation
As of
July 5, 2006, the Administración Federal de Ingresos
Públicos (“AFIP”) filed a preliminary injunction
with the Federal Court for Administrative Proceedings against IRSA
CP for an aggregate amount of Ps.3.7 million, plus an added amount,
provisionally estimated, of Ps.0.9 million for legal fees and
interest. The main dispute is about the income tax due for
admission rights. In the first instance, AFIP pleaded for a general
restraining order. On November 29, 2006, the Federal Court issued
an order substituting such restraining order for an attachment on
the parcel of land located in Caballito neighborhood, City of
Buenos Aires, where IRSA CP is planning to develop a shopping
center. As of June 30, 2011, under court proceedings, the building
was subject to a legal attachment for Ps.36.8 million. On December
12, 2012, the legal attachment was lifted and accredited in the
file concerned in February 2013.
After
we sold the Edificio Costeros, dique II, on November 20, 2009, we
requested an opinion to the Argentine Antitrust Authority as to
whether it was necessary to report this transaction. The Argentine
Antitrust Authority advise us that it was required to notify the
transaction. We challenged this decision, but it was confirmed. On
December 5, 2011, we notified the transaction and on April 30, 2013
the transaction was approved by the Argentine Antitrust Authority
by Resolution No 38, as a result of that this legal proceeding was
concluded.
On
January 15, 2007 we were notified of two claims filed against us
before the Argentine Antitrust Authority, one by a private
individual and the other one by the licensee of the shopping
center, both opposing the acquisition from the province of
Córdoba of a property known as Ex-Escuela Gobernador Vicente
de Olmos. On February 1, 2007 we responded the claims. On June 26,
2007, the Argentine Antitrust Authority notified us that it has
initiated a summary proceeding to determine whether the completion
of the transaction breaches the Antitrust Law.On November 3, 2015
the transaction was approved by the Argentine Antitrust Authority
by Resolution No 544, as a result of that this legal proceeding was
concluded.
On
December 3, 2009, IRSA CP filed a request for the Argentine
Antitrust Authority’s opinion regarding IRSA CP’s
acquisition of common shares of Arcos del Gourmet S.A. The
Argentine Antitrust Authority advised the parties that the
transaction had to be notified. On December, 2010 the transaction
was filed with the Argentine Antitrust Authority. On October 31,
2016 the transaction was approved by the Argentine Antitrust
Authority by Resolution No 322, as a result of that this legal
proceeding was concluded.
On
April 11, 2011, Quality Invest requested the Argentine Antitrust
Authority opinion regarding Quality Invest’s acquisition
Property of a warehouse owned by Nobleza Piccardo located in San
Martín, Province of Buenos Aires. The Argentine Antitrust
Authority stated that there was an obligation to notify the
situation, but Quality Invest filed an appeal against this
decision. Subsequently, the Court of Appeals confirmed the
Argentine Antitrust Authorities’ decision regarding the
obligation to notify and, therefore, on February 23, 2012, the
transaction was filed. On March 8, 2016 the transaction was
approved by the Argentine Antitrust Authority by Resolution No 27,
as a result of that this legal proceeding was
concluded.
On
August 23, 2011, IRSA CP notified the Argentine Antitrust Authority
the direct and indirect acquisition of common shares of NPSF, the
transaction involved the direct acquisition of 33.33% of NPSF and
16.66% through our controlled vehicle Torodur S.A. On November 18,
2014 the transaction was approved by the Argentine Antitrust
Authority by Resolution No 235, as a result of that this legal
proceeding was concluded.
On June
16, 2012, we sold to Cabaña Don Francisco S.A. certain
Costeros Dique IV’s functional units, to be used for office
space, and complementary units to be used for parking. In addition,
we assigned upon the purchaser all rights and interests arising
from lease agreements involving the conveyed units. As a result, an
advisory opinion was requested from the Argentine Antitrust
Authority as to the need to report such transaction. The Argentine
Antitrust Authority resolved that the transaction was exempt from
report on May 21, 2014, so this legal process was
finished.
On
December 7, 2012, we notified the Argentine Antitrust
Authority of the acquisition of 50% of the common shares of EHSA,
which owns 50% of the common shares of La Rural, which operates a
convention mall (
Predio Ferial de
Palermo
); on July 25, 2017 the transaction was approved by
the Argentine Antitrust Authority. See “Item 3. Key
Information—Risk Factors—Risk Relating to Our
Business—Our business is subject to extensive regulation and
additional regulations may be imposed in the
future.”
On
February 28, 2018, Ogden Argentina S.A. notified the
Argentine Antitrust Authority the acquisition of common shares of
ALG Golf Center S.A. , the transaction involved the direct
acquisition of 60% of ALG Golf Center S.A. Ogden Argentina S.A is
indirectly controlled by IRSA CP. As of the date of this annual
report the transaction is being analyzed by the Argentine Antitrust
Authority.
263
Through
the issuance of Resolution No. 16,521 dated February 17, 2011 the
CNV commenced a summary proceeding against the members of
IRSA’s board of directors and its supervisory committee
members (all of them at that time, including among others Eduardo
S. Elsztain), alleging certain formal errors in the Inventory and
Balance Sheet Book, specifically the failure by the Company to
comply with certain formalities in the presentation of a table
included in the Memoria (annual report); arising from an
investigation carried out by the CNV in October 2010. Applicable
law requires that the corrections of any errors in the annual
report include a legend identifying each error and the way in which
it was corrected, including insertion of the holographic signature
from the chairman of the board. In this case, we first corrected
the mistake and after the request from the CNV included the legend
and the holographic signature of the chairman, required by the
relevant formalities.
IRSA’s
response to the CNV’s allegations containing the arguments
for the defense was filed in March 2011 and the first hearing was
held in May 2011. In April, 2013, the CNV imposed (as a result of
the aforementioned alleged charge) a fine on the members of
IRSA’s board of directors and its supervisory committee
members. The fine imposed by the CNV amounts to Ps.270,000
equivalent to US$49,632 and it was imposed against IRSA and the
members of the board together. The amount of the fine demonstrates
the immaterial nature of the alleged violations. Even though the
fine was paid, in April 2013, IRSA appealed such resolution, and in
October, 2015 the Court Room No. IV of the National Chamber of
Appeals in Federal Administrative Procedures (Cámara Nacional
de Apelaciones en lo Contencioso Administrativo Federal) confirmed
the resolution and fines imposed by the CNV.
For
more information see “Item. 3(d) Risk Factors—Risk
related to our Business—Our business is subject to extensive
regulation and additional regulations may be imposed in the
future.”
Class actions in the United States
On
February 23, 2016, a class action was filed against IRSA, Cresud
and some first-line managers and directors at the District Court of
the USA for the Central District of California. The complaint was
amended on February 13, 2017. As amended, the complaint, on
behalf of people who purchased or otherwise acquired American
Global Depositary Receipts of IRSA between November 3, 2014
February 11, 2015 and December 30, 2015, claims presumed violations
to the US federal securities laws. In addition, it argues that
defendants have made material misrepresentations and made some
omissions related to the Company’s investment in
IDBD.
Such
complaint was voluntarily waived on May 4, 2016 by the plaintiff
and filed again on May 9, 2016 with the US District Court for the
Eastern District of Pennsylvania.
Furthermore, the
Companies and some of its first-line managers and directors are
defendants in a class action filed on April 29, 2016 with the US
District Court for the Eastern District of Pennsylvania. The
complaint was amended on February 13, 2017. As amended, the
complaint, on behalf of people holding who purchased or otherwise
acquired American Global Depositary Receipts of Cresud between May
13, 2015 February 11, 2015 and December 30, 2015, presumes
violations to the US federal securities laws. In addition, it
argues that defendants have made material misrepresentations and
made some omissions related to the investment of the Company's
subsidiary, IRSA, in IDBD.
Subsequently, the
Companies requested the transfer of the claim to the district of
New York, which was accepted.
On
December 8, 2016, the Court appointed the representatives of each
presumed class as primary plaintiffs and the lead legal advisor for
each of the classes. On February 13, 2017, the plaintiffs of both
classes filed a document containing certain amendments. The
companies filed a petition requesting that the class action brought
by shareholders should be dismissed. On April 12, 2017, the Court
suspended the class action filed by Cresud shareholders until the
Court decides on the petition of dismissal of such the IRSA
shareholder class action. Filing information on the motion to
dismiss the collective remedy filed by shareholders of IRSA was
completed on July 7, 2017. On September 10, 2018, the Court issued
an order granting IRSA and Cresud’s motion to dismiss the
IRSA shareholder class action complaint in its entirety and
entered final judgment in favor of the Companies and against
plaintiffs . . On October 9, 2018, the IRSA shareholder
class action plaintiffs filed a notice of appeal to the United
States Court of Appeals for the Second Circuit. Briefing and
argument in this appeal will likely be completed in 2019. The
Cresud shareholder plaintiffs have filed a document acknowledging
that the Cresud shareholder complaint should be dismissed for the
same reasons set forth in the Court’s September 10, 2018
order, subject to a right of appeal by plaintiffs. The Court
has not entered final judgment yet.
The
companies continue to hold that such allegations are meritless and
will continue making a strong defense in both actions.
Operation Center in Israel
Litigation against IDBD and DIC
In
recent years there has been an increasing trend of filing
derivative and class action claims in the area of corporate and
securities laws in Israel. While taking into account such issues
and the financial position of IDBD, DIC and their holding
structure, claims in considerable amounts may be filed against IDBD
and DIC, including in connection with their financial position and
cash flows, with offerings that their makings, and transactions
that were carried out or not completed, including with regards to
the contentions and claims of the controlling shareholders that
took place in IDBD.
264
Arbitration proceedings relating to the obtainment of control in
IDBD.
On May
7, 2014, Dolphin acquired jointly with ETH (a non-related company
established under the laws of the State of Israel, which was
presented to Dolphin as a company controlled by Mordechay Ben
Moshé), an aggregate number of 106.6 million common shares in
IDBD, representing 53.3% of its stock capital, under the scope of
the debt restructuring Arrangement of IDBH, IDBD’s parent
company, with its creditors.
Under
the terms of the Shareholders’ Agreement, Dolphin and ETH
acquired each the remaining 50% of the 106.6 million common shares.
The initial total investment amount was NIS 950 million, equivalent
to approximately US$272 million at the exchange rate prevailing on
that date.
On May
28, 2015, ETH offered Dolphin to acquire Dolphin’s shares
pursuant to the BMBY mechanism provided in the Shareholders’
Agreement, which establishes that each party of the
Shareholders’ Agreement may offer to the counterparty to
acquire (or sell, as the case may be), the shares it holds in IDBD
at a fixed price. In addition, ETH further added that the purchaser
thereunder required to assume all obligations of
seller.
On June
10 and 11, 2015, Dolphin gave notice to ETH of its intention to buy
all the shares of IDBD held by ETH.
After
certain aspects of the offer were resolved through an arbitration
process brought by Dolphin and ETH, on September 24, 2015, the
competent arbitrator resolved that: (i) Dolphin and IFISA (related
company to the Company) were entitled to act as buyers in the BMBY
process, and ETH had to sell all of the IDBD shares held by it
(92,665,926 shares) at a price of NIS 1.64 per share; (ii) The
buyer had to fulfill all of the commitments included in the
Arrangement, including the commitment to carry out Tender Offers;
(iii) The buyer had to pledge in favor of the Arrangement Trustees
the shares that were previously pledged in favor of the Arrangement
Trustees by the seller.
On
October 11, 2015, the BMBY process concluded, and IFISA acquired
all IDBD’s shares of stock held by ETH. Consequently, the
Shareholders’ Agreement was terminated and members of
IDBD’s Board of Directors representing ETH submitted their
irrevocable resignation to the Board, therefore Dolphin was hence
empowered to appoint the new members to the Board. Additionally, on
the same date, Dolphin pledged additional shares as collateral to
secure compliance with the stock purchase agreement, thereby
increasing the number of pledged shares to 64,067,710.
In
addition to the competent arbitrator’s decision issued on
September 24, 2015, ETH and Dolphin still have counterclaims of
different kinds which are subject to such arbitration proceeding.
As of the filing date of this Annual Report, the proceeding is
still being heard.
Litigation against Clal Insurance and its subsidiaries
This
exposure is particularly increased in the areas of long-term
savings and long-term health insurance in which Clal Insurance is
engaged, inter alia, due to the fact that in those areas some
of the policies were issued decades ago, whereas today, due to the
significant regulatory changes, and due to the development in case
law and in the Commissioner’s position, the aforementioned
policies may retroactively be interpreted differently, and may be
subject to different interpretations than those which were in
practice at the time when they were made. Moreover, the policies in
the aforementioned segments have been in effect for decades,
meaning that exposure exists to the possibility that in cases where
the customer’s claim is accepted and a new interpretation is
provided for the terms of the policy, the future profitability of
Clal Insurance in respect will be affected by the existing policy
portfolio. This is in addition to the possible compensation that
could be given to the customers due to past activity.
Alongside these
aspects, during 2015 amendments were made to reflect a significant
reform in the field of approving an insurance program which allows
the Israeli authority, under certain conditions, to order the
insurer to stop introducing an insurance policy or to order an
insurer to make a change to an insurance policy, even with regard
to policies that have already been marketed by the insurer. It is
not possible to foresee to what extent insurers are exposed to
claims in connection with the provisions of the policy, the manner
of implementing the Israeli authority’s powers pursuant to
the insurance policy reform and its implications, which may be
raised, by means of the procedural mechanism provided in the
Israeli Class Actions Law.
There
are claims that have been recognized as class action suits, claims
for which there are pending motions to have them certified as class
action suits, and other claims which are immaterial. These claims
include mainly claims of improper actions, not in accordance with
laws, licenses or breaches of agreements with customers or
performance of tort damages toward customers (especially misleading
a customer, or a negligent misrepresentation), causing damage,
either monetary or non-monetary, to customers. A significant amount
of these claims also include claims of charging excessive premiums
and payment of lower than called for insurance compensation. In
addition, there are pending motions to have claims certified as
derivative actions.
Sale of shares of Clal
On
August 21, 2013, on the background of concerns about the ability of
the previous controlling shareholders of IDBD (Dankner group) to
meet the requirements to have control over an insurance company,
the Commissioner required that IDBD transfer 51% of the shares in
Clal to Mr. Moshe Terry (“the Trustee”) and to grant
the Trustee an irrevocable power of attorney with regard to the
voting of such shares in Clal.
265
On
November 27, 2013, and as part of the debt arrangement In IDBH, the
Commissioner set forth an outline to enable the change of control
in IDBD (as part of the debt arrangement), whereby the Commissioner
would not view such change of control as being a breach of the
Supervision of Financial Services (Insurance) Law, 1981 (the
“Insurance Law”), subject to certain conditions,
including terms whereby if until December 31, 2014 a control permit
for Clal Insurance will not be obtained for the new controlling
shareholders in IDBD, or, that an agreement for the sale of the
controlling stake in Clal Insurance will not have been signed, then
the Trustee will be authorized to sell the Clal Insurance shares
that the Trustee holds. Both groups that had submitted proposals in
the debt arrangement process (including the Dolphin group) approved
such outline.
On
December 30, 2014, the Commissioner sent an additional letter
setting a term by which IDBD’s control over and equity
interests in Clal were to be sold and giving directions as to the
Trustee’s continuity in office, among other aspects. For more
information, please see “Legal Framework – Operations
Center in Israel – Reduced Centralization
Act.”
On May
26, 2016 IDBD’s board decided to commence a competitive
process for the sale of a control stake in Clal. Following such
decision, on July 1, 2016 IDBD entered into an agreement with JP
Morgan to serve as an investment bank on behalf of IDBD for the
sale of a control stake in Clal.
In
addition, in June 2015, an application for a Israeli court to
approve the commencement of a class action against IDBD,
IDBD’s directors (some of which are also our directors),
Dolphin and C.A.A Extra Holdings Ltd. was filed by individuals who
argue that IDBD’s controlling shareholders and board of
directors acted in concert to frustrate the sale of shares of Clal
to JT Capital Fund. The applicants argue that this caused them
material damages as under the terms of the debt restructuring of
IDBD’s holding company, IDBH. with its creditors, they would
have been entitled to receive a larger payment had the above
mentioned sale been consummated. Furthermore, they allege that the
2014 and 2015 rights offerings of IDBD discriminated against the
minority shareholders. On March 21, 2016, the respondents
filed a motion to dismiss this class action application. On June 2,
2016, the Court partially accepted this motion, and ordered the
applicants to file an amended class action application that would
include only the arguments and remedies with respect to the said
Clal transaction. On August 2, 2016, the respondents filed a motion
to appeal (regarding the decision not to dismiss the arguments
concerning the Clal transaction) and, on August 14, 2016, the
applicants filed an appeal (regarding the decision to dismiss the
arguments concerning the rights offering) both before the Israeli
Supreme Court.
Following the
dismissal of the appeal proceedings by the Supreme, the petitioners
filed, in January 2018 in connection with a decision which was
given in the motion to summarily dismiss which was filed by the
respondents, in which the Court ordered the striking out, from the
motion to approve, of causes of action which fall under the
exemption condition which was included in the amendment to the Debt
Settlement, pertaining to damage which was allegedly caused due to
prejudice of rights, by virtue of the undertaking of the
controlling shareholder and the former controlling shareholder to
perform a tender offer for IDBD’s shares in accordance with
the Debt Settlement, the petitioners filed an amended motion to
approve the claim as a class action.
Dolphin, IDBD and
IDBD´s Directors filed a detailed joint response on May 7,
2018. A preliminary hearing is is scheduled for November 11,
2018.
Litigation against Cellcom and its subsidiaries
In the
normal course of business, claims have been filed against Cellcom
by its customers. These are mostly motions for approval of class
actions, primarily concerning allegations of illegal collection of
funds, unlawful conduct or breach of license, or a breach of
agreements with customers, causing monetary and non-monetary damage
to them.
Cellcom
have a pending (Civil, criminal and administrative proceedings) in
which allegations of illegality were raised against the operation
of a small portion of Cellcom's sites due to the lack of permits
under the Planning and Building Law or due to the construction of
the sites in deviation of the permit. As of December 31, 2017, a
small number of Cellcom sites operate without a permit. Cellcom may
operate a number of sites in a manner that does not fully comply
with the building permit under which they were established, even
though these sites were approved by the Ministry of Environmental
Protection in relation to their level of radiation.
Litigation against Shufersal
In the
normal course of business, legal claims were filed against
Shufersal by its customers. These are mostly motions for
certification of class actions, which mainly concern claims of
charging money unlawfully, acting contrary to the law or a license,
or a breach of the agreements with customers, causing financial and
non-financial loss to them.
In
addition in the normal course of business, legal claims were filed
with the courts against Shufersal by employees, subcontractors,
suppliers, authorities and others, which relate mainly to claims of
breaches of the provisions of the law in relation to the
termination of workers’ employment and compulsory payments to
employees, claims of breaches of contract and compulsory payments
to authorities.
266
Class action against IDBD regarding the sale of DIC
On
October 3, 2018, IDBD was served with notice of a class action
filed with the District Court in Tel Aviv Yafo (jointly – the
"Motion"). The Motion was initiated by an applicant alleging to
hold shares in DIC (the "Applicant"), against IDBD, against Dolphin
IL, against Mr. Eduardo Elsztain and against the Official Receiver
of the state of Israel, Seeking an injunction to annul the
sale of shares of DIC to Dolphin and to appoint a trustee to hold
those shares while the action is pending. The applicant claims that
the sale was not in compliance with the provisions of the Reduced
Centralization Law, in addition the plaintiff is seeking an order
for payment of monetary damages to the shareholders of DIC of
between NIS 58 and 73 million.
The
main allegation is that IDBD continues to be the controlling person
in DIC even after the completion of the sale of the shares of DIC
to Dolphin and that IDBD continues to be the controlling
shareholder of DIC and that its controlling shareholder, Mr.
Elsztain (in his capacity as chairman of the board of directors and
controlling person of DIC as well), had a personal interest
separate from the interest of the minority shareholders in DIC, and
that he and IDBD breached the duty of good faith and the duty of
care toward DIC, and additionally the controlling person of IDBD
breached his duty of trust and duty of care toward DIC, this being,
allegedly, due to the fact that the decision regarding the
preferred alternative for complying with the Reduced Centralization
Law's provisions was not brought before DIC's share holder's
meeting. The Applicant further alleges deprivation of the minority
shareholders in DIC.
We plan
to vigorously defend this motion as we understand that the sale of
the holdings in the shares of DIC by IDBD to Dolphin IL, IDBD
complies with the provisions of the Reduced Centralization
Law.
Class action against DIC regarding exit of the DIC's share from
indices
On
October 2, 2018, DIC was served with process of a class action,
which had been filed with the District Court of Tel Aviv Yafo
against DIC, against Mr. Eduardo Elsztain, against directors
serving in DIC who have an interest in the controlling person of
DIC, and against additional directors and officers serving in DIC,
in connection with the exit of DIC's share from the TA 90 and TA
125 indices of the TASE, whereon they had been traded on by an
applicant alleging to have held DIC's shares prior to February
1,.
The
applicant alleged that the persons names in the complain failed to
act to preserve DIC's share on the Indices which deprive of the
minority and could be considered as a breach of the Controlling
Person's duty of a good faith and care, as well as a breach of the
respondents' duties of trust and care toward DIC.
The
Court is requested, inter alia, to approve the action as a class
action and to charge the Respondents with compensating the members
of the group according to the damage caused estimated at
approximately NIS 17.6 million. The Company hold that such
allegations are meritless and will vigorously defend this
motion.
Dividends
policy
Pursuant to
Argentine law, the distribution and payment of dividends to
shareholders is valid only if they result from net and realized
earnings of the company pursuant to annual audited financial
statements approved by the shareholders. The approval, amount and
payment of dividends are subject to the approval by our
shareholders at our annual ordinary shareholders meeting. The
approval of dividends requires the affirmative vote of a majority
of the shares entitled to vote at the meeting.
In
accordance with Argentine law and our by-laws, net and realized
profits for each fiscal year are allocated as follows:
|
●
|
5% of
such net profits is allocated to our legal reserve, until such
reserve amounts to 20% of our capital stock;
|
|
●
|
a
certain amount determined at a shareholders’ meeting is
allocated to compensation of our directors and the members of our
supervisory committee; and
|
|
●
|
additional amounts
are allocated for the payment of dividends or to optional reserve
funds, or to establish reserves for whatever other purpose our
shareholders determine.
|
The
following table shows the dividend payout ratio and the amount of
dividends paid on each fully paid common share for the mentioned
years. Amounts in Pesos are presented in historical, non-inflation
adjusted Pesos as of the respective payment dates and refers to our
unconsolidated dividends.
267
|
Year
|
Total
Dividend
|
Dividend
per Common Share
(1)
|
|
|
(in
million of Ps.)
|
(in
Ps.)
|
|
2010
|
-
|
-
|
|
2011
|
69.0
|
0.138
|
|
2012
|
63.8
|
0.149
|
|
2013
|
120.0
|
0.242
|
|
2014
|
120.0
|
0.242
|
|
2015
|
-
|
-
|
|
2016
|
-
|
-
|
|
2017
|
-
|
-
|
|
2018
|
395.0
|
0.787
|
(1)
Corresponds to per
share payments. To calculate the dividend paid per ADS, the payment
per share should be multiplied by ten. Amounts in Pesos are
presented in historical Pesos as of the respective payment date.
See “Exchange Controls"
B.
SIGNIFICANT CHANGES
Shareholders
’
Meeting
Our 2018 annual meeting of shareholders was held on October 29,
2018 and it was decided, among others, to:
●
Allocate Ps.4,983,567,387 of net income for the fiscal year ended
June 30, 2018 to the constitution of a special reserve that may be
used for new projects according to the business development plan of
the Company, or for the distribution of dividends;
●
Distribution
of own shares in portfolio to the shareholders in proportion to
their shareholdings for up to the amount of 20,656,215 ordinary
shares.
●
Re-elect regular and alternate directors due to expiration of
term;
●
Allocation of Ps. $9,646,487,544 of net income for fiscal year
ended June 30, 2017 which hadn’t been allocated, to the
constitution of a special reserve that may be allocated to new
projects according to the business development plan of the Company,
or to the distribution of dividends.
●
Approve of remuneration to the board of directors for the amount of
Ps. 140,599,334 for the fiscal year ended June 30,
2018.
●
Approve of remuneration to the Audit Committe for the amount of Ps.
900,000 for the fiscal year ended June 30, 2018
●
Amend
Articles Eighth (in relation to the Issuance of Shares), Eleventh
(as regards Negotiable Obligations), and Twenty-Second (as regards
the Audit Committee) of the By Laws in order to adapt to the new
legal provisions.
●
(i) Renew of
delegation to the board of directors of the broadest
powers to determine all the terms and
conditions not expressly approved by the shareholders’
meeting as well as the time, amount, term, placement method and
further terms and conditions of the various series and/or tranches
of notes issued under the Global Note Program for the issuance of
simple, non-convertible notes, secured or not, or guaranteed by
third parties, for a maximum outstanding amount of up to
US$500,000,000 (five hundred million US dollars) (or its equivalent
in any other currency) approved by the shareholders’ meeting
held on October 31, 2012 and renewed for a five years term by the
shareholders’ meeting held on October 31, 2017 (the
“Program”); (ii) authorize for the board of directors
to (a) approve, execute, grant and/or deliver any agreement,
contract, document, instrument and/or security related to the
creation of the program and/or the issuance of the various series
and/or tranches of notes thereunder; (b) apply for and secure
authorization by the Argentine Securities Commission to carry out
the public offering of such notes; (c) as applicable, apply for and
secure before any authorized securities market of Argentina and/or
abroad the authorization for listing and trading such notes; and
(d) carry out any proceedings, actions, filings and/or applications
related to the creation of the program and/or the issuance of the
various series and/or tranches of notes under the program; and
(iii) authorize for the board of directors to sub-delegate the
powers and authorizations referred to in items (i) and (ii) above
to one or more of its members.
A.
OFFER AND LISTING DETAILS
The
following summary provides information concerning our share capital
and briefly describes all material provisions of our bylaws and the
Argentine Corporation Law.
Stock
Exchanges in which our securities are listed
Our
common shares are listed on the ByMA under the trading symbol
“CRES” and on NASDAQ under the trading symbol
“CRESY.” As of June 30, 2018 our outstanding capital
stock consisted of 501,642,804 common shares, Ps.1.00 par value per
share.
As of
that date of this annual report: (1) we had no other shares of any
class or series issued and outstanding; and (2) there are no
outstanding convertible notes to acquire our shares. Our common
shares have one vote per share. All outstanding shares are validly
issued, fully paid and non assessable. As of June 30, 2018, there
were approximately 8,804 holders of our common shares.
268
Price
history of our stock on the ByMA and NASDAQ
Our common shares are listed and traded on ByMA
under the ticker
“CRES.” Since March 1997, our
ADRs, each presenting 10 common shares, have been listed on the
NASDAQ under the trading symbol “CRESY.” The Bank of
New York is the depositary with respect to the ADRs.
The
following chart shows, for the period indicated, the maximum and
minimum closing listed prices of our common shares on the ByMA and
of our ADS on the NASDAQ.
|
|
ByMA
|
NASDAQ
|
||||
|
|
Share Volume
|
Price Per Share (Ps.)
|
ADS Volume
|
US$ per ADS
|
||
|
High
|
Low
|
High
|
Low
|
|||
|
Fiscal Year 2014
|
|
|
|
|
|
|
|
1st
Quarter
|
2,178,046
|
8.24
|
5.66
|
5,589,075
|
8.66
|
7.09
|
|
2nd
Quarter
|
2,188,815
|
11.01
|
7.89
|
5,872,993
|
11.42
|
8.50
|
|
3rd
Quarter
|
1,022,808
|
11.11
|
8.53
|
3,422,480
|
9.79
|
8.31
|
|
4th
Quarter
|
2,459,599
|
14.04
|
9.09
|
6,982,485
|
12.80
|
8.94
|
|
Annual
|
7,849,268
|
14.04
|
5.66
|
21,867,033
|
12.80
|
7.09
|
|
Fiscal Year 2015
|
|
|
|
|
|
|
|
1st
Quarter
|
1,688,010
|
16.32
|
11.91
|
5,524,817
|
13.97
|
10.50
|
|
2nd
Quarter
|
2,259,425
|
15.68
|
10.72
|
3,634,128
|
11.95
|
9.11
|
|
3rd
Quarter
|
1,331,000
|
17.76
|
11.91
|
7,600,906
|
14.72
|
9.84
|
|
4th
Quarter
|
1,483,096
|
16.77
|
14.89
|
5,736,086
|
13.87
|
12.40
|
|
Annual
|
6,761,531
|
17.76
|
10.72
|
22,495,937
|
14.72
|
9.11
|
|
Fiscal Year 2016
|
|
|
|
|
|
|
|
1st
Quarter
|
728,810
|
17.37
|
12.01
|
4,299,192
|
13.04
|
9.26
|
|
2nd
Quarter
|
6,416,350
|
19.55
|
12.90
|
8,291,480
|
13.41
|
9.57
|
|
3rd
Quarter
|
3,388,664
|
18.56
|
12.60
|
5,390,231
|
12.53
|
9.15
|
|
4th
Quarter
|
51,785,675
|
21.14
|
14.04
|
12,876,863
|
14.02
|
9.80
|
|
Annual
|
62,319,499
|
21.14
|
12.01
|
30,857,766
|
14.02
|
9.15
|
|
Fiscal Year 2017
|
|
|
|
|
|
|
|
1st
Quarter
|
48,775,713
|
27.29
|
21.83
|
8,216,910
|
17.86
|
14.51
|
|
2nd
Quarter
|
34,580,136
|
27.49
|
22.23
|
6,129,599
|
17.91
|
14.35
|
|
3rd
Quarter
|
29,312,012
|
30.80
|
25.55
|
5,963,830
|
20.07
|
15.95
|
|
4th
Quarter
|
21,714,333
|
34.45
|
29.25
|
5,095,079
|
21.95
|
18.19
|
|
Annual
|
134,382,194
|
34.45
|
21.83
|
25,405,418
|
21.95
|
14.35
|
|
Fiscal Year 2018
|
|
|
|
|
|
|
|
1st
Quarter
|
21,562,799
|
35.40
|
30.80
|
4,551,457
|
20.46
|
17.50
|
|
2nd
Quarter
|
28,428,453
|
41.55
|
32.15
|
6,146,634
|
23.02
|
18.35
|
|
3rd
Quarter
|
31,497,296
|
45.70
|
36.80
|
10,084,214
|
22.49
|
18.42
|
|
4th
Quarter
|
17,470,683
|
47.40
|
36.95
|
9,430,518
|
21.80
|
14.82
|
|
Annual
|
98,959,231
|
47.40
|
30.80
|
30,212,823
|
23.02
|
14.82
|
|
Fiscal Year 2019
|
|
|
|
|
|
|
|
1st
Quarter
|
13,664,913
|
58.85
|
41.05
|
7,259,095
|
17.04
|
13.01
|
|
For the month of:
|
|
|
|
|
|
|
|
July,
2018
|
5,480,787
|
46.45
|
41.05
|
2,268,718
|
16.97
|
14.64
|
|
August,
2018
|
4,619,183
|
54.95
|
42.50
|
2,668,573
|
17.04
|
13.01
|
|
September,
2018
|
3,564,943
|
58.85
|
51.70
|
2,321,804
|
15.21
|
13.34
|
|
October
(through October 25, 2018)
|
3,181,421
|
54.30
|
41.50
|
1,888,576
|
13.97
|
11.09
|
Source: Bloomberg
As of
June 30, 2018, the outstanding ADRs represented 38,619,283 ADSs
(equivalent to 386,192,830 common shares or 76.99% of our total
common stock capital).
B.
PLAN OF DISTRIBUTION
This
item is not applicable.
269
C.
MARKETS
Argentine
Securities Markets
In
December 2012, the Argentine government enacted Capital Markets Law
No 26,831, which sets out the rules governing capital markets, its
participants, and the rules by which securities traded therein are
subject to regulation and monitoring by the CNV. In
September 2013, the CNV issued General Resolution
No. 622/2013 (the “CNV Rules”) a new set of
rules further implementing and administering the requirements
of the Capital Markets Law. On May 9, 2018, the Argentine
Chamber of Deputies approved Law No. 27,440 called
“
Ley de Financiamiento
Productivo
”, which creates a new financing regime for
MiPyMEs and modifies Capital Markets Law
No. 26,831, Investment Funds Law No. 24,083 and Law
No. 23,576, among others, as well as certain related tax
provisions, and establishes regulations for derivative instruments,
all with the aim of achieving a modern and transparent financial
regulatory framework that contributes to the development of the
Argentine economy. On May 21, 2018, the Argentine Government
issued Decree No. 471/2018, which regulates certain aspects of
the Capital Markets Law as amended by Law
No. 27,440.
The
Capital Markets Law, as currently in effect, sets forth, among
others the following key goals and principles:
● Promoting
the participation of small investors, employee unions, industry
groups and trade associations, professional associations and all
public savings entities in the capital markets, promoting
mechanisms designed to promote domestic savings and channel such
funds toward the development of production;
● Strengthening
mechanisms to prevent abuses and protect small
investors;
● Promoting
access to the capital market by small and medium-sized
companies;
● Using
state-of-the-art technology to foster creation of an integrated
capital market through mechanisms designed to achieve
interconnection of computer systems among trading
markets;
● Encouraging
simpler trading procedures available to users to increase liquidity
and competitiveness to develop favorable conditions for transaction
execution;
●
Reducing systemic risk in the Argentine capital markets through
actions and resolutions aimed at implementing international best
practices;
●
promoting the integrity and transparency of the Argentine capital
markets; and
● promoting
financial inclusion.
The CNV
is a self-administered agency of the Argentine Government with
jurisdiction covering the territory of Argentina, governed by the
provisions of the Capital Markets Law, and the CNV Rules among
other related statutory regulations. The relationship of the CNV
and the Argentine Executive branch is maintained through the
Ministerio de Finanzas
(Ministry of Finance), which hears any appeals filed against
decisions made by the CNV, notwithstanding any other legal actions
and remedies contemplated in the Capital Markets Law.
The CNV
supervises and regulates the authorized markets in which the
securities and the collective investment products are traded, the
corporations authorized in the public offer regime, and all the
other players authorized to operate in the public offer regime, as
the registered agents, the trading agents, the financial advisors,
the underwriters and distributors, the brokers, the settlement and
clearing agents, the managers of collective investment products,
the custodians of collective investment products, the collective
depositories, and the risk rating agencies, among others. Argentine
institutional investors and insurance companies are regulated by
separate government agencies, whereas financial institutions are
regulated mainly by the Central Bank.
Before
offering securities to the public in Argentina, an issuer must meet
certain requirements established by the CNV with regard to its
assets, operating history and management. Only securities offerings
approved by the CNV may be listed on a stock exchange. However, CNV
approval does not imply certification as to the quality of the
securities or the solvency of the issuer issuers of listed
securities are required to file unaudited quarterly financial
statements and audited annual financial statements prepared in
accordance with IFRS, as issued by the IASB (excluding financial
institutions under the supervision of the Central Bank, insurance
companies under the supervision of the Insurance Superintendence
and medium and small enterprises) and various other periodic
reports with the CNV and the stock exchange on which their
securities are listed. In addition, issuers must report to the CNV
and the relevant stock exchange any event related to the issuer and
its shareholders that may affect materially the value of the
securities traded.
In
Argentina, debt and equity securities traded on an exchange must,
unless otherwise instructed by their shareholders, be deposited
with a Central Securities Depository based in Argentina. Currently
the only depositary authorized to act in accordance with the
Capital Markets Law and CNV Rules is Caja de Valores S.A., a
corporation owned by ByMA which provides central depositary
facilities, as well as acting as a clearinghouse for securities
trading and as a transfer and paying agent for securities
transactions.
270
Law No. 27,440
streamlines the regulation of mutual funds, public offerings of
securities, of negotiable obligations and regulation of
intermediaries and securities markets, while incorporating a
long-awaited regulation for derivative instruments and the margins
and guarantees that cover them. Below is a summary of the main
amendments to the Capital Markets Law introduced by Law
No. 27,440:
● Eliminates
the CNV’s power to appoint supervisors with veto power over
resolutions adopted by an issuer’s board of directors without
a judicial order.
● Grants the
CNV the power to issue regulations to mitigate situations of
systemic risk, set maximum fees to be received by securities
exchanges, create or modify categories of agents, encourage the
simplification of the negotiation of securities and promote the
transparency and integrity of the capital markets, while
prohibiting the CNV from denying an issuer’s public offer
authorization request solely because of opportunity, merit or
convenience.
● Empowers
the CNV to regulate private offerings of securities.
● Grants
federal commercial courts jurisdiction to review resolutions or
sanctions issued by the CNV.
● Strengthens
due process guarantees in favor of persons on entities sanctioned
by the CNV and increases the amount of the fines, between
Ps.100,000 and Ps.100 million, which can be increased up to five
times the benefits perceived with the infraction.
● Returns
certain functions such as supervision, inspection and control of
agents and operations, to the stock exchanges and clearing houses
without this implying delegation of the powers of the
CNV.
● Allows the
CNV to regulate and set ownership limits of authorized markets to
restrict control concentration.
● Preemptive
rights may be exercised through the placement procedure determined
in a public offering prospectus, instead of the procedure set forth
in the Argentine General Companies Law. Preemptive right holders
have the right to subscribe for newly issued shares in proportion
to their shareholding prior to the capital increase. The
subscription price for the newly issued shares may not be less than
the public offering price. In order to use the public offering
regime for a preemptive rights offering the issuer must
(i) have an express provision in its bylaws adopting this
regime in lieu of the regime set forth in the Argentine General
Companies Law; and (ii) the issuer’s shareholders must
approve any issuance of equity securities or convertible debt
securities.
● Eliminates
share accretion rights, unless expressly provided for in a listed
company’s bylaws.
● Allows
foreign entities to participate in all shareholder meetings through
authorized agents.
● Establishes
guidelines to set the offer price in a mandatory tender
offer.
●
Allows the
offeror to freely set the offer price in a voluntary tender
offer.
Information regarding the ByMA
(1)
|
|
As
of June 30,
|
|
|
|
2018
|
2017
|
|
Market
capitalization (in billions of Ps.)
|
8,248
|
5,557
|
|
Average daily
trading volume
(2)
(in millions of
Ps.)
|
1,142
|
452
|
|
Number of listed
companies
(3)
|
100
|
101
|
(1)
Reflects Merval historical data.
(2)
During the month of June.
(3)
Includes companies that received authorization for
listing.
Although companies
may list all of their capital stock on the ByMA, in many cases a
controlling block is retained by the listed company’s
shareholders, resulting in a relatively small percentage of many
companies’ stock being available for active trading by the
public.
As of
June 30, 2018, approximately 100 companies had equity
securities listed on, or being transitioned to the ByMA. The
Argentine securities markets generally have substantially more
volatility than securities markets in the United States and certain
developed countries. The Merval index experienced a 36.1% increase
in 2015, a 44.9% increase in 2016, 77.7% increase in 2017 and a
13.4% decrease for the six months of 2018. In order to avoid major
fluctuations in securities prices, the ByMA operates a system
pursuant to which the negotiation of a particular security is
suspended for 15 minutes when the price of the security registers a
variation between 10% and 15% and between 15% and 20%, during any
trading session. Any additional 5% variation in the price of the
security results in additional 10 minutes successive
suspension periods.
NASDAQ Stock Market
Our
ADRs are listed and traded in the NASDAQ Global Market under the
trading symbol “CRESY”.
D.
SELLING SHAREHOLDERS
This
item is not applicable.
E.
DILUTION
This
item is not applicable.
271
F.
EXPENSES OF THE ISSUE
This
item is not applicable.
A.
SHARE CAPITAL
This
item is not applicable.
B.
MEMORANDUM AND ARTICLES OF ASSOCIATION
Our
Corporate Purpose
Our
legal name is Cresud Sociedad Anónima Comercial, Inmobiliaria,
Financiera y Agropecuaria. We were incorporated under the laws of
Argentina on December 31, 1936 as a sociedad anónima (Stock
Corporation) and were registered with
Public Registry
on February 19, 1937
under number 26, on page 2, book 45 of National by-laws Volume.
Pursuant to our by-laws, our term of duration expires on June 6,
2082.
Pursuant to article
4 of our by-laws our purpose is to perform the following
activities:
●
commercial activities with respect to cattle and products
pertaining to farming and animal husbandry;
●
real estate activities with respect to urban and rural
properties;
●
financial activities, except for those regulated by Law No. 21,526
of financial entities;
●
farming and animal husbandry activities, for properties owned by us
or by third parties; and
●
agency and advice activities for which there is not required a
specific qualifying title.
Limited
Liability
Shareholders’
liability for losses is limited to their equity interest in us.
Notwithstanding the foregoing, under the Argentine Corporation Law
No. 19,550, shareholders who voted in favor of a resolution that is
subsequently declared void by a court as contrary to Argentine law
or a company’s by-laws (or regulation, if any) may be held
jointly and severally liable for damages to such company, other
shareholders or third parties resulting from such resolution. In
addition, a shareholder who votes on a business transaction in
which the shareholder’s interest conflicts with that of the
company may be liable for damages under the Argentine Corporation
Law, but only if the transaction would not have been validly
approved without such shareholder’s vote.
Capitalization
We may
increase our share capital upon authorization by our shareholders
at an ordinary shareholders’ meeting. Capital increases must
be registered with the Public Registry, and published in the
Official Gazette (
Bolet’n
Oficial)
. Capital reductions may be voluntary or mandatory
and must be approved by the shareholders at an extraordinary
shareholders’ meeting (
asamblea extraordinaria
). Reductions in
capital are mandatory when losses have depleted reserves and
exceeded 50% of capital. As of June 30, 2018 our share capital
consisted of 501,642,804 common shares.
Our
bylaws provide that preferred stock may be issued when authorized
by the shareholders at an extraordinary shareholders’ meeting
(
asamblea extraordinaria
)
and in accordance with applicable regulations. Such preferred stock
may have a fixed cumulative dividend, with or without additional
participation in our profits, resolved by the shareholders’
meetings. We currently do not have outstanding preferred
stock.
Preemptive
Rights and Increases of Share Capital
Pursuant to our
by-laws and Argentine Corporation Law No. 19,550, in the event of
an increase in our share capital, each of our existing holders of
our common shares has a preemptive right to subscribe for new
common shares in proportion to such holder’s share ownership.
For any shares of a class not preempted by any holder of that
class, the remaining holders of the class will be entitled to
accretion rights based on the number of shares they purchased when
they exercised their own preemptive rights. Rights and accretion
rights must be exercised simultaneously within 30 days following
the time in which notices to the shareholders of a capital increase
and of the rights to subscribe thereto are published for three days
in the Bolet’n Oficial and a widely circulated newspaper in
Argentina. Pursuant to the Argentine
Corporation Law,
such 30-day period may be reduced to 10 days by a decision of our
shareholders adopted at an extraordinary shareholders’
meeting (
asamblea
extraordinaria
).
272
Additionally, the
Argentine Corporation Law permits shareholders at an extraordinary
shareholders’ meeting (
asamblea extraordinaria
) to suspend or
limit the preemptive rights relating to the issuance of new shares
in specific and exceptional cases in which the interest of the
Company requires such action and, additionally, under the following
specific conditions:
●
the issuance is expressly included in the list of matters to be
addressed at the shareholders’ meeting; and
●
the shares to be issued are to be paid in-kind or in exchange for
payment under pre-existing obligations.
Furthermore,
Article 12 of the Negotiable Obligations Law permits shareholders
at an extraordinary shareholders’ meeting (
asamblea extraordinaria
) to suspend
preemptive subscription rights for the subscription of convertible
notes under the above-mentioned conditions. Preemptive rights may
also be eliminated, so long as a resolution providing so has been
approved by at least 50% of the outstanding capital stock with a
right to decide such matters and so long as the opposition to such
resolution does not surpass 5% of the share capital.
In
addition, Section 62 bis of the Capital Markets Law # 26,831, as
amended, sets forth that in case of capital increase of shares or
convertible notes offer through public offering and subject to the
two conditions indicated as follow, the preemptive right as set out
in Section 194 of the Argentine Corporations Act and Section 11 of
Negotiable Obligations Law shall be exercised exclusively through
the placement’s proceeding determined in the public offering
prospect. The owners of the shares and the convertible notes,
beneficiaries of the preemptive right, shall have priority in the
adjudication up to the amount of the shares that correspond to them
according to their ownership. The referred two conditions are: (i)
the inclusion of the disposition in the bylaws of the company and
(ii) the approval of the shareholders’ meeting that approves
the issuance of the shares and the convertible bonds. Unless the
bylaws dispose otherwise, the accretion right shall not be
applicable.
Shareholders’
Meetings and Voting Rights
Our
bylaws provide that shareholders’ meetings may be called by
our board of directors or by our Supervisory Committee or at the
request of the holders of shares representing no less than 5% of
the common shares. Any meetings called at the request of
shareholders must be held within 30 days after the request is made.
Any shareholder may appoint any person as its duly authorized
representative at a shareholders meeting, by granting a proxy.
Co-owners of shares must have single representation.
In
general, the following matters can be considered only at an
extraordinary shareholders’ meeting (
asamblea extraordinaria
):
|
●
|
matters
that may not be approved at an ordinary shareholders’
meeting;
|
|
●
|
the
amendment of our bylaws;
|
|
●
|
reductions in our
share capital;
|
|
●
|
redemption,
reimbursement and amortization of our shares;
|
|
●
|
mergers, and other
corporate changes, including dissolution and
winding-up;
|
|
●
|
limitations or
suspensions to preemptive rights to the subscription of the new
shares; and
|
|
●
|
issuance of
debentures, convertible negotiable obligations and bonds that do
not qualify as notes (obligaciones negociables).
|
In accordance with our by-laws, ordinary and
special shareholders’ meetings (
asamblea
extraordinaria
) are subject to
a first and second quorum call, the second to occur upon the
failure of the first. The first and second notice of ordinary
shareholders’ meetings may be made simultaneously. In the
event that both are made on the same day, the second must occur at
least one hour after the first. If simultaneous notice was not
given, the second notice must be given within 30 days after the
failure to reach quorum at the first. Such notices must be given in
compliance with applicable regulations.
In the case of special shareholders’
meetings the second call must be made within 30 days after the
failure to reach the quorum of the first by giving appropriate
notice according to applicable regulations.
A
quorum for an ordinary shareholders’ meeting on the first
call requires the presence of a number of shareholders holding a
majority of the shares entitled to vote and, on the second call,
the quorum consists of the number of shareholders present, whatever
that number. Decisions at ordinary shareholders’ meetings
must be approved by a majority of the votes validly exercised by
the shareholders.
A
quorum for an special shareholders’ meeting (
asamblea extraordinaria
) on the first
call requires the presence of persons holding 60% of the shares
entitled to vote and, on the second call, the quorum consists of
the number of shareholders present, whatever that number. Decisions
at special shareholders’ meeting (
asamblea extraordinaria
) generally must
be approved by a majority of the votes validly
exercised.
273
However, pursuant
to the Argentine Corporation Law, all shareholders’ meetings,
whether convened on a first or second quorum call, require the
affirmative vote of the majority of shares with right to vote in
order to approve the following decisions:
|
●
|
advanced winding-up
of the company;
|
|
●
|
transfer of the
domicile of the company outside of Argentina;
|
|
●
|
fundamental change
to the purpose of the company;
|
|
●
|
total
or partial mandatory repayment by the shareholders of the paid-in
capital; and
|
|
●
|
a
merger or a spin-off, when our company will not be the surviving
company.
|
Holders
of common shares are entitled to one vote per share. Owners of
common shares represented by ADRs exercise their voting rights
through the ADR Depositary, who acts upon instructions received
from such shareholders and, in the absence of instructions, votes
in the same manner as our majority of the shareholders present in
the shareholders’ meeting.
The
holders of preferred stock may not be entitled to voting rights.
However, in the event that no dividends are paid to such holders
for their preferred stock, the holders of preferred stock are
entitled to voting rights. Holders of preferred stock are also
entitled to vote on certain special matters, such as a
transformation of the corporate type, early dissolution, change to
a foreign domicile, fundamental change in the corporate purposes,
total or partial replacement of capital losses, mergers in which
our company is not the surviving entity, and spin-offs. The same
exemption will apply in the event the preferred stock is traded on
any stock exchange and such trading is suspended or canceled. Note
that the Company has not outstanding preferred stock.
Dividends
and Liquidation Rights
The
Argentine Corporation Law establishes that the distribution and
payment of dividends to shareholders is valid only if they result
from realized and net earnings of the company pursuant to an annual
balance sheet approved by the shareholders. Our board of directors
submits our financial statements for the previous fiscal year,
together with the reports of our Supervisory Committee, to the
Annual Ordinary Shareholders’ Meeting. This meeting must be
held on or before October 31 of each year to approve the financial
statements and decide on the allocation of our net income for the
year under review. The distribution, amount and payment of
dividends, if any, must be approved by the affirmative vote of the
majority of the present votes with right to vote at the
meeting.
The
shareholders’ meeting may authorize payment of dividends on a
quarterly basis provided no applicable regulations are violated. In
that case, all and each of the members of the board of directors
and the supervisory committee will be jointly and severally
unlimitedly liable for the refund of those dividends if, as of the
end of the respective fiscal year, the realized and net earnings of
the company are not sufficient to allow the payment of
dividends.
When we
declare and pay dividends on the common shares, the holders of our
ADRs, each representing the right to receive ten ordinary shares,
outstanding on the corresponding registration date, are entitled to
receive the dividends due on the common shares underlying the ADRs,
subject to the terms of the Deposit Agreement dated March 18, 1997
executed by and between us, The Bank of New York, as depositary and
the eventual holders of ADRs. The cash dividends are to be paid in
Pesos and, except under certain circumstances, are to be converted
by the Depositary into U.S. Dollars at the exchange rate prevailing
at the conversion date and are to be paid to the holders of the
ADRs net of any applicable fee on the dividend distribution, costs
and conversion expenses, taxes and public charges.
Dividends may be
lawfully paid only out of our retained earnings determined by
reference to the financial statements prepared in accordance with
Argentine GAAP. In accordance with the Argentine Corporation Law,
net income is allocated in the following order: (i) 5% is retained
in a legal reserve until the amount of such reserve equals 20% of
the company’s outstanding capital; (ii) dividends on
preferred stock or common shares or other amounts may be retained
as a voluntary reserve, contingency reserve or new account, or
(iii) for any other purpose as determined by the company’s
shareholders at an ordinary shareholders’
meeting.
Our
legal reserve is not available for distribution. Under the
applicable regulations of the
Comisión Nacional de Valores
,
dividends are distributed
pro
rata
in accordance with the number of shares held by each
holder within 30 days of being declared by the shareholders for
cash dividends and within 90 days of approval in the case of
dividends distributed as shares. The right to receive payment of
dividends expires five years after the date on which they were made
available to shareholders. The shareholders’ meeting may
authorize payment of dividends on a quarterly basis provided no
applicable regulations are violated. In such case, all and each of
the members of the board of directors and the supervisory committee
will be jointly and severally liable for the refund of those
dividends if, at the end of the respective fiscal year, the
realized and net earnings of the company are not sufficient to
allow for the payment of dividends.
274
|
●
|
to be
applied to satisfy its liabilities; and
|
|
●
|
to be
proportionally distributed among holders of preferred stock in
accordance with the terms of the preferred stock. If any surplus
remains, our shareholders are entitled to receive and share
proportionally in all net assets available for distribution to our
shareholders, subject to the order of preference established by our
bylaws.
|
Regardless the term
for dividend’s payment established by Comision Nacional de
Valores, regulations enacted by the Buenos Aires Stock Exchange set
forth that cash dividends must be paid within 10 days after their
approval by a shareholders’ meeting.
Approval
of Financial Statements
Our
fiscal year ends on June 30 of each year, after which we prepare an
annual report which is presented to our board of directors and
Supervisory Committee. The board of directors submits our financial
statements for the previous fiscal year, together with the reports
of our Supervisory Committee, to the annual ordinary
shareholders’ meeting, which must be held within 120 days of
the close of our fiscal year, in order to approve our financial
statements and determine our allocation of net income for such
year. At least 20 days before the ordinary shareholders’
meeting, our annual report must be available for inspection at our
principal office.
Right
of Dissenting Shareholders to Exercise Their Appraisal
Right
Whenever certain
actions are approved at an extraordinary shareholders’
meeting
(asamblea
extraordinaria
) (such as the approval of a merger, a
spin-off (except when the shares of the acquired company are
publicly traded), a fundamental change of corporate purpose, a
transformation from one type of corporation to another, a transfer
of the domicile of our company outside of Argentina or, as a result
of the action approved, the shares cease to be publicly traded) any
shareholder dissenting from the adoption of any such resolution may
withdraw from our company and receive the book value per share
determined on the basis of our latest financial statements, whether
completed or to be completed, provided that the shareholder
exercises its appraisal rights within ten days following the
shareholders’ meeting at which the resolution was
adopted.
In
addition, to have appraisal rights, a shareholder must have voted
against such resolution or act within 15 days following the
shareholders’ meeting if the shareholder was absent and can
prove that he was a shareholder of record on the day of the
shareholders meeting. Appraisal rights are extinguished with
respect to a given resolution if such resolution is subsequently
overturned at another shareholders’ meeting held within 75
days of the previous meeting at which the original resolution was
adopted. Payment on the appraisal rights must be made within one
year of the date of the shareholders’ meeting at which the
resolution was adopted, except where the resolution involved a
decision that our stock ceases to be publicly traded, in which case
the payment period is reduced to 60 days from the date of the
resolution.
Ownership
Restrictions
The CNV
regulations require that transactions that cause a person’s
holdings of capital stock of a registered Argentine company, to
hold 5% or more of the voting power, should be immediately notified
to the CNV. Thereafter, every change in the holdings that
represents a multiple of 5% of the voting power should also be
notified.
Directors, senior
managers, executive officers, members of the supervisory committee,
and controlling shareholders of an Argentine company whose
securities are publicly listed, should notify the CNV on a monthly
basis, of their beneficial ownership of shares, debt securities,
and call and put options related to securities of such companies
and their controlling, controlled or affiliated
companies.
Holders
of more than 50% of the common shares of a company or who otherwise
have voting control of a company, as well as directors, officers
and members of the supervisory committee, must provide the CNV with
annual reports setting forth their holdings in the capital stock of
such companies and monthly reports of any change in their
holdings.
Tender
Offers
Tender
offers under Argentine law may be voluntary or mandatory. In either
case, the offer must be made addressed to all shareholders. In the
case of a mandatory tender offer, the offer must also be made to
the holders of subscription rights, stock options or convertible
debt securities that directly or indirectly may grant a
subscription, acquisition or conversion right on voting
shares.
Capital
Markets Law No. 26,831 establishes that a person or entity wishing
to acquire a “significant holding” (“
participaciones significativas
”)
shall be required to launch a mandatory tender offer:
● A mandatory
tender offer will not be required in those cases in which the
purpose of the acquisition of the “significant holding”
is not to acquire the control of a company.
275
The CNV defines a
“significant holding” as holdings that represent an
equal or a higher percentage than 35% and higher than 50% of the
voting shares as the case may be:
● When a
person or an entity intends to acquire more than 35% of the shares
of a company, a mandatory tender offer to purchase 50% of the
corporate voting capital is required by law.
● When a
person or an entity wishes to acquire more than 50% of the shares
of a company, a mandatory tender offer to acquire 100% of the
voting capital will be legally required.
● Finally,
when a shareholder controls 95% or more of the outstanding shares
of a company, (i) any minority shareholder may, at any time, demand
that the controlling party make an offer to purchase all of the
remaining shares of the minority shareholders and (ii) the
controlling party can issue a unilateral statement of intention to
acquire all of the remaining shares owned by the other
stockholders.
Pursuant to the
Argentine Corporation Law we may redeem our outstanding common
shares only under the following circumstances:
|
●
|
to
cancel such shares and only after a decision to reduce our capital
stock (with shareholder approval at an extraordinary
shareholders’ meeting (asamblea extraordinaria);
|
|
●
|
to
avoid significant damage to our company under exceptional
circumstances, and then only using retained earnings or free
reserves that have been fully paid, which action must be ratified
at the following ordinary shareholders’ meeting;
or
|
|
●
|
in the
case of the acquisition by a third-party of our common
shares.
|
The
Capital Markets Law provides for other circumstances under which
our company, as a corporation whose shares are publicly listed, can
repurchase our shares. The following are necessary conditions for
the acquisition of our shares:
|
●
|
the
shares to be acquired shall be fully paid,
|
|
●
|
there
shall be a board of directors’ resolution containing a report
of our supervisory committee and audit committee. Our board of
director’s resolution must provide the purpose of the
acquisition, the maximum amount to be invested, the maximum number
of shares or the maximum percentage of capital that may be acquired
and the maximum price to be paid for our shares. Our board of
directors must give complete and detailed information to both
shareholders and investors,
|
|
●
|
the
purchase shall be carried out with net profits or with free or
optional reserves, and we must prove to the CNV that we have the
necessary liquidity and that the acquisition will not affect our
solvency,
|
|
●
|
under
no circumstances may the shares acquired by our company, including
those that may have been acquired before and held by us as treasury
stock, be more than 10% of our capital stock or such lower
percentage established by the CNV after taking into account the
trading volume of our shares.
|
Any
shares acquired by us that exceed 10% of our capital stock must be
disposed of within 90 days from the date of acquisition originating
the excess without prejudice of the liability corresponding to our
board of directors.
Transactions
relating to the acquisition of our own shares may be carried out
through open market transactions or through a public
offering:
|
●
|
in the
case of acquisitions in the open market, the amount of shares
purchased daily cannot exceed 25% of the mean daily traded volume
of our shares during the previous 90 days.
|
|
●
|
in
either case, the CNV can require the acquisition to be carried out
through a public offering if the shares to be purchased represent a
significant percentage in relation to the mean traded
volume.
|
276
Regulation of the
CNV as amended, provides general requirements that any company must
comply with in the case of the acquisition of its shares under the
Corporations Law or under the Capital Markets Law. The acquisition
of its shares by a company must be:
|
●
|
approved by a
resolution of the board of directors with a report of its
supervisory committee,
|
|
●
|
notice
must be given to the CNV with the expression of the motives of the
decision,
|
|
●
|
be
carried out with net profits or free reserves from the last
financial statements and approved by the board of
directors,
|
|
●
|
the
board of directors has to prove to the CNV, that the company has
the necessary liquidity and that the acquisition does not affect
its solvency,
|
|
●
|
all
shares acquired by the company, including those that may have been
acquired before and held by it as treasury stock, may not exceed
10% of its capital stock.
|
There
are no legal limitations to ownership of our securities or to the
exercise of voting rights pursuant to the ownership of our
securities, by non-resident or foreign shareholders.
Registrations
and Transfers
Our
common shares are held in registered, book-entry form. The registry
for our shares is maintained by
Caja de Valores S.A.
at its executive
offices located at 25 de mayo 362, (C1002ABH) Buenos Aires,
Argentina. Only those persons whose names appear on such share
registry are recognized as owners of our common shares. Transfers,
encumbrances and liens on our shares must be registered in our
share registry and are only enforceable against us and third
parties from the moment registration takes place.
Amendment
to the by-laws.
On the
shareholders’ meeting held on October 10, 2007, our
shareholders decided to amend the following sections of the
by-laws: (i) Section Thirteen in order to adapt the performance
bonds granted by directors to current rules and regulations, and
(ii) Section Sixteen in order to incorporate the possibility of
holding remote board meetings pursuant the provisions of section 65
of Executive Branch Decree 677/01.
On the
shareholders’ meeting held on October 31, 2012, our
shareholders decided to amend the Section XVII of the by-laws in
order to modify the quorum and majorities of the remote board
meetings.
On the
shareholder´s meeting held on October 31, 2014, our
shareholders decided to amend the following sections of the
by-laws: (i) Section First in order to comply with the Capital
Markets Law No. 26,831 and (ii) Section Twenty-Four in order to
incorporate the regulation of the shareholders’ meeting held
with shareholders present or communicated through teleconference
technologies.
On the
shareholder´s meeting held on October 29, 2018 our
shareholders decided to amend the following sections of the by-laws
in order to adapt them to certain new legal provisions: (i) Section
Eighth, establishing that if there is an Issuance of Shares, the
shareholders´ preemptive right will be exercised as
established in the prospect of the issuance; (ii) Section Eleventh,
establishing the issuance of Negotiable Obligations may be decided
by the Board of Directors; and (iii) Section Twenty-Second
describing the duties of the Audit Committee as well as authorizing
the Audit Committee to hold meeting via conference, teleconference
of any other electronic means. Such amendments are pending of
approval by the Public Registry of the City of Buenos
Aires.
C.
MATERIAL CONTRACTS
We do
not have any material contract entered into outside the ordinary
course of business other than some of the operations previously
described under the Related Party Transactions, the Recent
Developments and Our Indebtedness sections.
D.
EXCHANGE CONTROLS
Foreign Currency Regulation
Under
Decree No. 260/2002, the Argentine government had set up an
exchange market through which all foreign currency exchange
transactions are made. Such transactions were subject to the
regulations and requirements imposed by the Central Bank. Under
Communication “A” 3471, as amended, the Central Bank
established certain restrictions and requirements applicable to
foreign currency exchange transactions. If such restrictions and
requirements are not met, criminal penalties shall be
applied.
Under
Communication “A” 6037, dated August 8th, 2016, and
Communication “A” 6150, of the Central Bank, no further
authorization is required for residents and non-residents to have
access to local exchange market and there is no amount or matter
that limits the access thereto.
Outflow
and Inflow of Capital
Inflow of capital
Under
Argentine Foreign Investment Law No. 21,382, as amended, and the
wording restated under Executive Branch Decree No. 1853/1993, the
purchase of stock of an Argentine company by an individual or legal
entity domiciled abroad or by an Argentine “foreign
capital” company (as defined under the Foreign Investment
Law) represents a foreign investment.
277
Pursuant to
Resolution E 1/2017 of the Ministerio de Hacienda and the
Communication “A” 6150 of the Central Bank, it was
deleted the obligation that required non-residents to perform
portfolio investments in the country intended for the holding of
private sector financial assets to maintain for a period of 120
days of permanence the funds in the country.
As of
that resolution and the provisions of Communication “A”
6244 of the Argentine Central Bank, there are no restrictions on
entry and exit in the MULC.
Obligation for the settlement of funds through the
MULC
Financial Indebtedness
Pursuant to
Resolution E 1/2017 of the Ministerio de Hacienda and the
Communication “A” 6150 of the Argentine Central Bank,
it was deleted the obligation that required non-residents to
perform portfolio investments in the country intended for the
holding of private sector financial assets to maintain for a period
of 120 days of permanence the funds in the country.
As of
that resolution and the provisions of Communication “A”
6244 of the Argentine Central Bank, there are no restrictions on
entry and exit in the MULC.
Formation of off-shore assets by residents with and without
subsequent allocation to specific purposes
Under
Communication “A” 5850, 5899, 6037, 6058, 6137 and 6244
and its amended of the Central Bank, residents shall have access to
the local exchange market without prior authorization of the
Central Bank in order to purchase foreign currency for the
formation of off-shore assets.
Outflow of capital, including the availability of cash or cash
equivalents
Exchange Transactions Inquiry Program
Communication
“A” 5850, of December 2015, revoke Communication
“A” 5245 that regulated an Exchange Transaction Inquiry
Program established on October 28, 2011, by the Federal
Administration of Public Revenues (
Administración Federal de Ingresos
Públicos
, or “AFIP”) through which the
entities authorized by the Central Bank to deal in foreign exchange
were supposed to inquire and register through an IT system the
total Peso amount of each exchange transaction at the moment it is
closed.
Financial Indebtedness
Pursuant to
Resolution E 1/2017 of the Ministerio de Hacienda and the
Communication “A” 6150 of the Central Bank, it was
deleted the obligation that required non-residents to perform
portfolio investments in the country intended for the holding of
private sector financial assets to maintain for a period of 120
days of permanence the funds in the country.
As of
that resolution and the provisions of Communication “A”
6244 of the Central Bank, there are no restrictions on entry and
exit in the MULC.
Formation of off-shore assets by residents with and without
subsequent allocation to specific purposes
Under
Communication “A” 5850, 5899, 6037, 6058, 6137 and
6244, as amended, of the Central Bank, residents shall have access
to the local exchange market without prior authorization of the
Central Bank in order to purchase of foreign currency for the
formation of off-shore assets by residents.
Outflow of funds for payment to non-residents
According to
Communication “A” 5264, amended by Communication
“A” 5377 (issued on December 14, 2012) and
Communication “A” 6037, 6058, 6137 and 6244, as
amended, of the Central Bank there are no limits or restrictions
applicable for residents who access the foreign exchange market to
pay services, debts and profits to non-residents. The access to the
MULC requires the filing of certain documentation by residents
demonstrating the validity of transactions in which the funds are
purchased for its remittance abroad.
Payment of services
As it
was mentioned above, there is no restriction applicable for
payments to be made to non-residents for performed services. The
regulation covers all types of services without making any
specifications. The financial entity shall require the filing of
documentation supporting the authenticity of the transaction, the
service rendered by the non-resident to the resident and the amount
to be transferred abroad.
278
If
services performed are not related to the activities actually
developed by the resident, the financial entity shall require a
copy of the contract by which the payment obligation arises from
and an auditor report. Such requirements intend to demonstrate the
actual rendering of services to the non-resident and the existence
of the debt.
Payment of rents (interest, profits and dividends)
As of
January 8, 2003, Communication “A” 3859, item 3,
allowed Argentine companies to transfer abroad profits and
dividends related to closed financial statements certified by
independent accountants without being required to obtain the prior
authorization of the Central Bank. Such Communication was replaced
by Communication “A” 5264, amended by Communication
“A” 5377 and Communication “A” 6037, 6058,
6137 and 6244 as amended of the Central Bank.
The
payments of profits and dividends to non-residents or holders of
our ADRs are authorized, insofar as such payments are made
according to financial statements duly audited and approved at our
annual meeting of shareholders’.
Payment of foreign financial indebtedness
Access
to the exchange market is allowed for payments of principal amounts
due.
In
general terms, access to MULC for payment of principal, interest
and prepayment of financial indebtedness incurred by Argentine
residents in the private non-financial sector and financial sector
are allowed subject to regulations set forth by Communications
“A” 6037, of August 8, 2016.
Pursuant to
Resolution E 1/2017 of the Ministerio de Hacienda and the
Communication “A” 6150 of the Central Bank, it was
deleted the obligation that required non-residents to perform
portfolio investments in the country intended for the holding of
private sector financial assets to maintain for a period of 120
days of permanence the funds in the country.
As of
that resolution and the provisions of Communication “A”
6244 of the Central Bank, there are no restrictions on entry and
exit in the MULC.
Direct Investment Reporting System
Direct Investment
Communication A "6401" established a new reporting system of direct
investments, which replaced the reporting system established by
Communications "A" 3602 and "A" 4237, applicable since December 31,
2017. As of date, investors who are Argentine residents must comply
with the information regime if the value of their investments
abroad reaches or exceeds the equivalent of US $ 1,000,000
-measured in terms of 1) the sum of the flows of external assets
and liabilities during the previous calendar year; and 2) the
balance of holdings of external assets and liabilities at the end
of the previous calendar year. If the value of investments abroad
does not exceed the equivalent of US $ 50,000,000, the information
regime must be complied on an annual basis (in case it is less than
US $ 10,000,000, the information regime will be annual but with a
simplified form), instead of quarterly. If the value of the
investments is less than the equivalent of US $1,000,000,
compliance with said regime is optional.
For
further details of the totality of the exchange and controlling
restrictions applicable in Argentina, investors is suggested to
read the Communication “A” 6037, Communication
“A” 6058, Communication “A” 6137 and the
Communication “A” 6244 and its modifications of the
Argentina Central Bank, and Decree No. 616/2005 with its
regulations and complementary and / or modifying rules, to which
the interested parties may consult the same on the website of the
Ministerio de Hacienda (www.minhacienda.gob.ar) and the Ministerio
de Finanzas (www.minfinanzas.gob.ar), or the Central Bank
(http://www.bcra.gob.ar).
Money
Laundering
Argentine Law No. 25,246, as amended and/or
complemented by Law Nos. 26,087, 26,119, 26,268, 26,683, 26,831,
26,860 and 27,304 (the “Anti-Money Laundering
Law”),
categorizes money laundering as a crime, which
is defined as the exchange, transfer, management, sale or any other
use of money or other assets obtained through a crime, by a person
who did not take part in such original crime, with the potential
result that such original assets (or new assets resulting from such
original assets) have the appearance of having been obtained
through legitimate means. In spite of the fact that there is a
specific amount for the money laundering category (Ps.300,000), the
crimes committed for a lower amount are also punished, but the
prison sentence is reduced.
After
the enactment of Law No. 26,683, money laundering was included in
the Penal Code as an independent crime against economic and
financial order and it was split from the title
“Concealment” as originally disposed. Therefore, money
laundering is a crime which may be prosecuted
independently.
279
The Anti Money
Laundering Law created the Financial Information Unit (UIF). UIF is
in charge of the analysis, treatment and transmission of
information to prevent and impede the money laundering originating
from, among others:
a)
Crimes related to the traffic and illegal commercialization of
drugs (Law No. 23,737)
b)
Crimes related to arms traffic (Law No. 22,415)
c)
Crimes related to illegal association or terrorist
association
d)
Crimes committed by illegal associations organized to commit crimes
for political or racial purposes;
e)
Crimes against Public Administration
f)
Crimes of minor’s prostitution and child
pornography
g)
Crimes related to terrorism financing
The UIF
analyzes the information received by entities that have the
obligation to report suspicious activities or operations and, as
the case may be, inform the Public Ministry to carry out the
investigations that may be considered relevant or
necessary.
The
money laundering legal framework in Argentina also assigns
information and control duties to certain private sector entities,
such as banks, agents, non-profits organizations, stock exchanges,
insurance companies, according to the regulations of the Financial
Information Unit, and for financial entities, the Central Bank.
These regulations apply to many Argentine companies, including us.
These obligations
mainly seek that
all financial institutions, brokers and stockbrokers, mutual funds
management companies, those intermediaries in the purchase, lease
or loan of negotiable securities that operate under the orbit of
stock exchanges with or without attached markets, and other
subjects provided by article 20 of the Anti-Money Laundering Law
(the "Obligated Subjects") have a prevention system for money
laundering and financing of terrorism that covers risk management
and compliance elements. The component referred to "risk
management" is made up of the policies, procedures and controls for
the identification, evaluation, mitigation and monitoring of the
risks to which the Obligated Subject is exposed, identified within
the framework of a self-assessment. The "compliance
elements"
consist mainly of: (i) maintaining internal
policies and procedures aimed at money laundering prevention and
financing of terrorism, especially through the application of the
policy “know your client”; (ii) reporting any
suspicious activity or operation and (iii) acting according the
Money Laundering Law with respect to the confidentiality of the
information obtained from the clients. For that purpose, each
entity involved must appoint an officer responsible for the
monitoring and control under the Money Laundering Law.
On May
8, 2009, and in its capacity as obliged subject under the rules
enacted by UIF, the CNV issued Resolution No. 554 which
incorporated within the exchange market many provisions aimed at
comply with money laundering prevention pursuant to Law No. 25,246,
as amended. In that regard, such resolution established that any
entity subject to the supervision of CNV could only take part in
securities transactions if they were ordered by parties that were
registered or domiciled in jurisdictions not included in the list
of tax havens detailed in Decree No. 1344/98. Furthermore, the
Resolution provided that securities transactions made by parties
registered or domiciled in jurisdictions that are not included in
such list, but that act as intermediaries of securities’
markets under the supervision of an agency similar to the CNV, were
allowed only if such agency has signed a memorandum of mutual
understanding with the CNV.
On
February 2, 2012, Resolution No. 554 was replaced by Resolution No.
602 so as to adapt and complement the instructions issued by UIF
applying to the entities under the supervision of CNV, including
some payment modalities and control proceedings for the reception
and deliver of funds to the clients, fixing amounts and instruments
to be used. Moreover, such resolution updated the reference to the
Decree which referred to tax havens (No. 1,037).
As part
of a more comprehensive modification of the rules that govern the
scope of supervision of CNV, derive from the enactment of the
Capital Markets Law and the CNV Rules, which stablished a new
regime for the public offer of securities, CNV issued a new
re-arranged text of its rules. Through the CNV Rules, the CNV
incorporates a new chapter of Money Laundering and Terrorist
Financing including dispositions related to the fulfillment of
duties to be complied by “
Agentes de Negociación
,”
“
Agentes de Liquidación
y Compensación
,” “
Agentes de Distribución y
Colocación
” and “
Agentes de Administración de Productos de
Inversión Colectiva
,” considered as obliged
subject under the terms of sections 4, 5 and 22 of article 20 of
Law No. 25,246. Such agents are obliged to comply with any
provision arising from Law No. 25,246 and its amendments,
regulations enacted by UIF, including decrees of National Executive
Power with reference to the decisions adopted by the United Nations
Security Council, in the fight against terrorism and to comply with
the resolutions issued by the Ministry of Foreign Affairs,
International Trade and Religion. Furthermore, “
Agentes de Custodia de Productos de
Inversión Colectiva (Sociedades Depositarias de Fondos Comunes
de Inversión”); “Agentes de corretaje,”
“Agentes de depósito colectivo
” and listed
companies with respect to contribution, irrevocable contributions
or indebtedness made by a shareholder or a third person to become a
shareholder in the future, are also reached by the
resolution.
Those
subjects must send by internet (through the online application of
CNV) their tax identification number. Additionally, in case of
companies, it must be informed the personal data of the
“Compliance Officer” (both regular and
alternate).
The CNV
Rules provide that the subjects under their jurisdiction, may only
take action to transactions in the scope of public offering of
securities, stipulated, future or optional contracts of any nature
and other instruments and financial products when made or directed
by registered, domiciled or domestic subjects or those who reside
in dominions, jurisdictions, territories or associated states that
appear included in the list of cooperating countries provided in
article 2º, subsection b) of Decree No. 589/2013.
280
When
those subjects are not included in the referred list and, in their
origin jurisdictions, are only registered intermediates of an
entity subject to control and supervision of a body that fulfills
similar duties to those of the CNV, the transactions shall only
have effect provided that the body in their origin jurisdiction has
signed a memorandum of understanding, cooperation and exchange of
information with the CNV.
With
the purpose of strengthening the requirements in order to grant the
authorization to operate in the exchange market, some new
requisites were established in connection with: (i) competence and
capacity; (ii) moral integrity and honesty and (iii) solvency. Such
requisites are subject to the appraisal of CNV and must be
fulfilled by managers, directors, auditors and any other individual
who perform duties or activities within the company.
Pursuant to Decree
360/2016 dated February 16, 2016, the Argentine government created
the “National Coordination Program for Combating Money
Laundering and Terrorist Financing” within the purview of the
Ministry of Justice and Human Rights. Its purpose is to rearrange,
coordinate and strengthen the anti-money laundering and
anti-terrorist financing system at national level, in light of the
actual risks that could impact the Argentine territory and the
global requirements to be met under the scope of the obligations
and international recommendations of the United Nations and FATF
standards.
Moreover, Law No.
27,260, which introduced certain tax modifications and a new regime
for residents to disclose undeclared assets, established that the
UIF would now be within the purview of the Ministry of Economy and
Finances. Nowaydays, as a result of the reorganization of said
ministry, the UIF depends on the Ministry of Finance. For its part,
the UIF recently issued Resolution No. 4/2017, which requires
certain specific due diligence procedures (commonly called "know
your client") to be performed when a national or foreign depositor
opens a bank account for the purpose of investment.
In
addition, UIF Resolution No. 30-E/2017 dated June 16,
2017, completely modifies the regulatory framework under which
financial and exchange institutions must manage the risks of money
laundering and financing of terrorism, repealing UIF Resolution
No. 121/2011 and 94/2016. The new regulatory framework was
reformulated on the basis of the new FATF standards, which modified
the criteria for the prevention of money laundering and terrorist
financing, thus moving from a formalistic regulatory compliance
approach to a risk-based approach in which entities must implement
a system for preventing money laundering and financing of
terrorism, which must contain all the policies and procedures
established for the management of money laundering and financing of
terrorism to which they are exposed and the elements of compliance
required by current regulations, for which they must develop a risk
identification and assessment methodology in accordance with the
nature and size of their commercial activity, taking into account
the different risk factors in each of their business lines plus
guidelines for compliance and requirements to compliance officers
and processes for the preparation of suspicious transaction
reports, among others, established in the resolution
itself.
On
March 5, 2018, the UIF Resolution No. 21/2018 on
guidelines for the management of risks of money laundering and
financing of terrorism and on the minimum compliance to be adopted
for the prevention of laundering was published in the Official
Gazette. In line with UIF Resolution No. 30-E/2017 addressed
to the financial sector, UIF Resolution No. 21/2018 also moves
from a formalistic compliance approach to a risk-based approach, in
order to ensure that the measures implemented are commensurate with
the risks identified. In this way, the obligated subjects must
identify and evaluate their risks and, depending on this, adopt
management and mitigation measures. In this framework, they are
enabled to implement accredited technological platforms that allow
carrying out procedures at a distance, without personal display of
the documentation, without this conditioning the fulfillment of due
diligence duties.
UIF
Resolution No. 21/2018 provides that as of September 30,
2018, the obligors must have developed and documented the risk
identification and assessment methodology and, as of
December 31, 2018, they must have a technical report that
reflects the results of the implementation of the risk
identification and evaluation methodology. In this sense, as of
March 31, 2019, they must have adjusted their policies and
procedures and, in accordance with the results of the irrigation
self-assessment performed, they must be included in the money
laundering and terrorist financing prevention manual. Finally, as
of September 30, 2018, the compliance of the information
regimes will be deferred, starting from that date the obligation to
inform on the terms and conditions contemplated
therein.
Some
other measures are set forth related to listed companies or their
shareholders or beneficial owners who had been convicted or
condemned in connection with money laundering and/or terrorist
financing activities or appeared in the list published by the
United Nation Security Council.
281
E.
TAXATION
United
States Taxation
The
following summary describes the material United States federal
income tax consequences of the ownership of our common shares and
ADSs as of the date hereof. The discussion set forth below is
applicable to U.S. Holders (as defined below). Except where noted,
this discussion deals only with U.S. Holders that hold our common
shares or ADSs as capital assets. This summary does not represent a
detailed description of the United States federal income tax
consequences applicable to you if you are subject to special
treatment under the United States federal income tax laws,
including if you are:
● a
bank;
● a dealer in
securities or currencies;
● a financial
institution;
● a regulated
investment company;
● a real
estate investment trust;
● an
insurance company;
● a
tax-exempt organization;
● a person
holding our common shares or ADSs as part of a hedging, integrated
or conversion transaction, constructive sale or
straddle;
● a trader in
securities that has elected the mark-to-market method of accounting
for your securities;
● a person
liable for alternative minimum tax;
● a person
who owns or is deemed to own 10% or more of our stock (by vote or
value);
● a person
required to accelerate the recognition of any item of gross income
with respect to our common shares or ADSs as a result of such
income being recognized on an applicable financial
statement;
● a
partnership or other pass-through entity for United States federal
income tax purposes; or
● a person
whose “functional currency” is not the U.S.
Dollar.
Furthermore, the
discussion below is based upon the provisions of the Internal
Revenue Code of 1986, as amended (the “Code”), and
regulations, rulings and judicial decisions thereunder as of the
date hereof, and such authorities may be repealed, revoked or
modified so as to result in United States federal income tax
consequences different from those discussed below. This summary
does not contain a detailed description of all the United States
federal income tax consequences to you in light of your particular
circumstances and does not address the Medicare tax on net
investment income, or the effects of any state, local or non-United
States tax laws. In addition, this summary is based, in part, upon
representations made by the depositary (the
“Depositary”) to us and assumes that the deposit
agreement governing the ADSs, and all other related agreements,
will be performed in accordance with their terms.
As used
herein, the term “U.S. Holder” means a beneficial owner
of common shares or ADSs that is for United States federal income
tax purposes:
● an
individual citizen or resident of the United States;
● a
corporation created or organized in or under the laws of the United
States, any state there of or the District of
Columbia;
● an estate
the income of which is subject to United States Federal income
taxation regardless of its source; or
● a trust if
it (1) is subject to the primary supervision of a court within the
United States and one or more United States persons have the
authority to control all substantial decisions of the trust or (2)
has a valid election in effect under applicable United States
Treasury regulations to be treated as a United States
person.
If a
partnership holds our common shares or ADSs, the tax treatment of a
partner will generally depend on the status of the partner and the
activities of the partnership. If you are a partner of a
partnership holding our common shares or ADSs, you should consult
your tax advisors.
IF
YOU ARE CONSIDERING THE PURCHASE, OWNERSHIP OR DISPOSITION OF
COMMON SHARES OR ADSS YOU SHOULD CONSULT YOUR OWN TAX ADVISOR
CONCERNING THE UNITED STATES FEDERAL INCOME TAX CONSEQUENCES TO YOU
AS WELL AS ANY CONSEQUENCES ARISING UNDER THE LAWS OF ANY OTHER
TAXING JURISDICTION.
ADSs
In
general, for United States federal income tax purposes, U.S.
Holders of ADSs will be treated as the owners of the underlying
common shares that are represented by the ADSs. Accordingly,
deposits or withdrawals of our common shares by U.S. Holders for
ADSs will not be subject to United States federal income
tax.
282
Distributions on Common Shares or ADSs
Subject
to the discussion under “Passive Foreign Investment
Company” below, the gross amount of distributions on our
common shares or ADSs (including amounts withheld to reflect
Argentine withholding taxes, if any) will be taxable as dividends
to the extent paid out of our current or accumulated earnings and
profits (as determined under United States federal income tax
principles). Such income (including withheld taxes) will be
includable in your gross income as ordinary income on the day
actually or constructively received by you, in the case of common
shares, or by the Depositary, in the case of ADSs. Such dividends
will not be eligible for the dividends-received deduction allowed
to corporations under the Code.
With
respect to non-corporate United States investors, certain dividends
received from a qualified foreign corporation may be subject to
reduced rates of taxation. A foreign corporation is treated as a
qualified foreign corporation with respect to dividends received
from that corporation on common shares (or ADSs representing such
common shares) that are readily tradable on an established
securities market in the United States. United States Treasury
Department guidance indicates that our ADSs (which are listed on
the NASDAQ), but not our common shares, are readily tradable on an
established securities market in the United States. Thus, we do not
believe that dividends that we pay on our common shares that are
not represented by ADSs currently meet the conditions required for
these reduced tax rates. Non-corporate holders that do not meet a
minimum holding period requirement during which they are not
protected from the risk of loss or that elect to treat the dividend
income as “investment income” pursuant to Section
163(d)(4) of the Code will not be eligible for the reduced rates of
taxation regardless of our status as a qualified foreign
corporation. In addition, the rate reduction will not apply to
dividends if the recipient of a dividend is obligated to make
related payments with respect to positions in substantially similar
or related property. This disallowance applies even if the minimum
holding period has been met. Non-corporate U.S. Holders should
consult their own tax advisors regarding the application of these
rules given their particular circumstances.
The
amount of any dividend paid in Pesos will equal the U.S. Dollar
value of the Pesos received calculated by reference to the exchange
rate in effect on the date the dividend is actually or
constructively received by you, in the case of common shares, or by
the Depositary, in the case of ADSs, regardless of whether the
Pesos are converted into U.S. Dollars. If the Pesos received are
not converted into U.S. Dollars on the day of receipt, you will
have a basis in the Pesos equal to their U.S. Dollar value on the
date of receipt. Any gain or loss you realize on a subsequent
conversion or other disposition of the Pesos will be treated as
United States source ordinary income or loss.
Subject
to certain significant conditions and limitations, Argentine tax
withheld from dividends, if any, may be treated as foreign income
tax eligible for credit or deduction against your United States
federal income tax liability. For purposes of the foreign tax
credit, dividends paid on the common shares or ADSs will be treated
as income from sources outside the United States and will generally
constitute passive category income. Further, in certain
circumstances, if you have held ADSs or common shares for less than
a specified minimum period during which you are not protected from
risk of loss, or are obligated to make payments related to the
dividends, you will not be allowed a foreign tax credit for foreign
taxes imposed on dividends paid on ADSs or common shares. The rules
governing the foreign tax credit are complex. Investors are urged
to consult their tax advisors regarding the availability of the
foreign tax credit under their particular
circumstances.
To the
extent that the amount of any distribution (including amounts
withheld to reflect Argentine withholding taxes, if any) exceeds
our current and accumulated earnings and profits for a taxable
year, as determined under United States federal income tax
principles, the distribution will first be treated as a tax-free
return of capital, causing a reduction in the adjusted basis of the
ADSs or common shares, and the balance in excess of adjusted basis
will be taxed as capital gain recognized on a sale or exchange.
However, we do not expect to keep earnings and profits in
accordance with United States federal income tax principles.
Therefore, you should expect that a distribution will generally be
treated as a dividend (as discussed above).
Distributions of
our common shares that are received as part of a pro rata
distribution to all our shareholders generally will not be subject
to United States federal income taxes.
Taxation of Capital Gains
Subject
to the discussion under “Passive Foreign Investment
Company” below, upon the sale, exchange or other disposition
of common shares or ADSs, you generally will recognize capital gain
or loss equal to the difference between the U.S. Dollar value of
the amount realized upon the sale, exchange or other disposition
and the adjusted tax basis of the common shares or ADSs, determined
in U.S. Dollars. The capital gain or loss will be long-term capital
gain or loss if at the time of sale, exchange or other disposition
you have held the common shares or ADSs for more than one year.
Long-term capital gains of non-corporate U.S. Holders are eligible
for reduced rates of taxation. The deductibility of capital losses
is subject to limitations. Any gain or loss you recognize will
generally be treated as United States source gain or loss.
Consequently, you may not be able to use the foreign tax credit
arising from any Argentine tax imposed on the disposition of common
shares or ADSs unless such credit can be applied (subject to
applicable limitations) against tax due on other income treated as
derived from foreign sources.
283
Passive Foreign Investment Company
Based
on the past and projected composition of our income and assets and
the valuation of our assets, including goodwill, we do not believe
we were a PFIC for United States federal income tax purposes for
the taxable year ending June 30, 2018, and we do not currently
expect to become a PFIC, although there can be no assurance in this
regard. The determination of whether we are a PFIC is made
annually. Accordingly, it is possible that we may be a PFIC in the
current or any future taxable year due to changes in our asset or
income composition or if our projections are not accurate. The
volatility and instability of Argentina’s economic and
financial system may substantially affect the composition of our
income and assets and the accuracy of our projections. In addition,
this determination is based on the interpretation of certain U.S.
Treasury regulations relating to rental income, which regulations
are potentially subject to differing interpretation.
In
general, we will be a PFIC for any taxable year in which either (i)
at least 75% of the gross income of our company for the taxable
year is passive income or (ii) at least 50% of the value
(determined on the basis of a quarterly average) of our assets is
attributable to assets that produce or are held for the production
of passive income. For this purpose, passive income generally
includes dividends, interest, royalties and rents (other than
royalties and rents derived in the active conduct of a trade or
business and not derived from a related person), annuities and
gains from assets that produce passive income. If we own at least
25% by value of the stock of another corporation, we will be
treated for purposes of the PFIC tests as owning a proportionate
share of the assets of the other corporation, and as receiving
directly a proportionate share of the other corporation’s
income.
If we
are a PFIC for any taxable year during which you hold common shares
or ADSs in our company, unless you make the mark-to-market election
discussed below, you will be subject to special tax rules discussed
below.
If we
are a PFIC for any taxable year during which you hold our common
shares or ADSs, you will be subject to special tax rules with
respect to any “excess distribution” received and any
gain realized from a sale or other disposition, including a pledge,
of such common shares or ADSs. Distributions received in a taxable
year that are greater than 125% of the average annual distributions
received during the shorter of the three preceding taxable years or
your holding period for the common shares or ADSs will be treated
as excess distributions. Under these special tax rules (i) the
excess distribution or gain will be allocated ratably over your
holding period for the common shares or ADSs, (ii) the amount
allocated to the current taxable year, and any taxable year prior
to the first taxable year in which we were a PFIC, will be treated
as ordinary income, and (iii) the amount allocated to each other
year will be subject to tax at the highest tax rate in effect for
that year and the interest charge generally applicable to
underpayments of tax will be imposed on the resulting tax
attributable to each such year.
If we
are a PFIC for any taxable year during which you hold our common
shares or ADSs and any of our non-United States subsidiaries is
also a PFIC, you would be treated as owning a proportionate amount
(by value) of the common shares of the lower tier PFIC for purposes
of the application of these rules. You are urged to consult your
tax advisors about the application of the PFIC rules to any of our
subsidiaries.
In
addition, non-corporate U.S. Holders will not be eligible for
reduced rates of taxation on any dividends received from us if we
are a PFIC in the taxable year in which such dividends are paid or
in the preceding taxable year.
In
certain circumstances, in lieu of being subject to the excess
distribution rules discussed above, you may make an election to
include gain on the stock of a PFIC as ordinary income under a
mark-to-market method provided that such stock is regularly traded
on a qualified exchange. Under current law, the mark-to-market
election is only available for stock traded on certain designated
United States exchanges and foreign exchanges which meet certain
trading, listing, financial disclosure and other requirements to be
treated as a qualified exchange under applicable United States
Treasury regulations. Consequently, the mark-to-market election may
be available to you with respect to the ADSs because the ADSs are
listed on the NASDAQ, which constitutes a qualified exchange under
the regulations, although there can be no assurance that the ADSs
will be regularly traded. You should note that only the ADSs and
not the common shares are listed on the NASDAQ. The common shares
are listed on the ByMA. Consequently, the ByMA would need to meet
the trading, listing, financial disclosure and other requirements
of the United States Treasury regulations. The ADSs or common
shares would also need to be regularly traded on such exchanges in
order for the ADSs or common shares to be potentially eligible for
the mark-to-market election.
If we
are a PFIC in any taxable year in which you hold our common shares
or ADSs, but you do not make a mark-to-market election until a
subsequent taxable year, you will be subject to special rules in
the taxable year of the election. You should consult your own tax
advisors regarding the application of the mark-to-market election
in your particular situation.
If you
make an effective mark-to-market election, you will include in
income each year that we are a PFIC as ordinary income, rather than
capital gain, the excess, if any, of the fair market value of your
common shares or ADSs at the end of the taxable year over your
adjusted tax basis in the common shares or ADSs and will be
permitted an ordinary loss in respect of the excess, if any, of the
adjusted tax basis of such common shares or ADSs over their fair
market value at the end of each such taxable year, but only to the
extent of the net amount previously included in income as a result
of the mark-to-market election. Your basis in the common shares or
ADSs will be adjusted to reflect any such income or loss amounts.
Any gain or loss on the sale of the common shares or ADSs will be
ordinary income or loss, except that such loss will be ordinary
loss only to the extent of the previously included net
mark-to-market gain.
284
If you
make a mark-to-market election it will be effective for the taxable
year for which the election is made and all subsequent taxable
years unless the common shares or ADSs are no longer regularly
traded on a qualified exchange or the Internal Revenue Service
consents to the revocation of the election. Mark-to-market
inclusions and deductions will be suspended during taxable years in
which we are not a PFIC, but would resume if we subsequently become
a PFIC. You are urged to consult your own tax advisor about the
availability of making such a mark-to-market election, and whether
making the election would be advisable in your particular
circumstances.
Alternatively, a
United States investor that owns common shares or ADSs in a PFIC
can sometimes avoid the rules described above by electing to treat
the company as a “qualified electing fund” under
Section 1295 of the Code. This option is not available to you
because we do not intend to comply with the requirements necessary
to permit you to make this election.
A U.S.
Holder who owns common shares or ADSs during any year that we are a
PFIC must generally file IRS Form 8621.
You
should consult your own tax advisors concerning the United States
federal income tax consequences of holding the common shares or
ADSs if we are considered a PFIC in any taxable year.
Argentine Personal Assets Tax
Amounts
paid on account of the Argentine personal assets tax, if any, will
not be eligible as a credit against your United States federal
income tax liability, but may be deductible subject to applicable
limitations in the Code.
Information Reporting and Backup Withholding
In
general, information reporting requirements will apply to dividends
on common shares or ADSs and to the proceeds from the sale of
exchange or redemption common shares or ADSs that are paid to you
within the United States (and in certain cases, outside the United
States), unless you are an exempt recipient. Backup withholding may
apply to such payments if you fail to provide a correct taxpayer
identification number or certification of exempt status or fail to
report in full dividend and interest income.
Backup
withholding is not an additional tax. Any amounts withheld under
the backup withholding rules will be allowed as a refund or a
credit against your United States federal income tax liability
provided you timely furnish the required information to the
Internal Revenue Service.
Argentine
Taxation
The
following discussion is a summary of certain Argentine tax
considerations associated with an investment in, ownership or
disposition of, the common shares or the ADSs by (i) an individual
holder that is resident in Argentina, (ii) an individual holder
that is neither domiciled nor resident in Argentina, (iii) a legal
entity organized under the laws of Argentina, (iv) a permanent
establishment in Argentina of a foreign entity and (v) a legal
entity that is not organized under the laws of Argentina, that does
not have a permanent establishment in Argentina and is not
otherwise doing business in Argentina on a regular basis. The
discussion is for general information only and is based on current
Argentine tax laws. Moreover, while this summary is considered to
be a correct interpretation of existing laws in force as of the
date of this filing, no assurance can be given that the courts or
administrative authorities responsible for the administration of
such laws will agree with this interpretation or that changes in
such laws or interpretations will not occur.
PROSPECTIVE
INVESTORS ARE URGED TO CONSULT THEIR OWN TAX ADVISOR REGARDING THE
PARTICULAR TAX CONSEQUENCES ARISING UNDER ANY TAXING
JURISDICTION.
Income Tax
Law No.
26,893, enacted on September 12, 2013 and published in the Official
Gazette on September 23, 2013, introduced several amendments to
Income Tax Law No. 20,628 in connection with, among others, the
taxation of gains derived from transfers of shares and other
securities, including the derogation of Section 78 of Decree No.
2,284/1991, which provided that foreign holders with no permanent
establishment in Argentina were exempt from paying income tax on
the capital gains arising from the sale or other disposition of
shares or ADSs.
On
February 7, 2014, the Executive Branch issued Decree No. 2,334/13,
which regulates Law No. 26,893.
The
changes introduced by Law No. 26,893 are effective from the date of
publication of such law in the Official Gazette and are applicable
to taxable events consummated from such date onwards.
Law No.
27,430 enacted on December 27, 2017 and published in the Official
Gazette on December 29, 2017, introduced several amendments to
Income Tax Law No. 20,628, among others, a corporate tax rate
reduction in two phases. For fiscal years beginning on or after
January 1, 2018 until December 31, 2019, a reduction of the tax
rate from 35% to 30%. Beginning on or after January 1, 2020 the tax
rate will be further reduced to 25%.
285
Additionally, a
withholding of 7% or 13% is established for the fiscal years
mentioned above, on the dividends distributed by local entities in
favor of their shareholders provided they are resident individuals
or undivided estates, or are foreign beneficiaries.
Taxation of Dividends
Dividends
distributions which source are profits generated in fiscal years
beginning before January 1, 2018, whether in cash, in shares or in
kind, are not subject to income tax withholding except for the
application of the “Equalization Tax” described
below.
An
income tax withholding will be applied to the amount of dividends
distributed in excess of a company’s net taxable income
determined in accordance with general income tax regulations for
the fiscal years preceding the date of the distribution of such
dividends (the “Equalization Tax”). The legislation
requires that companies withhold 35% of the amount of distributed
dividends in excess of the net taxable income of such distribution,
as determined in accordance with the income tax law. Dividends
distributed by an Argentine company are not subject to this tax to
the extent that those dividends arise from dividend income or other
distributions received by such company from other Argentine
companies.
Dividend distributions made in kind (other than
cash) will be subject to the same tax rules as cash dividends.
Stock dividends on fully paid shares are not subject to
Equalization Tax.
Equalization Tax
will not be applicable on profits generated from fiscal years
beginning on or after January 1, 2018.
Dividends
distributions, other than stock dividends, which source are profits
generated on fiscal years beginning on or after January 1, 2018,
whether in cash, in shares or in kind, made by local entities to
resident individuals, resident undivided estates and foreign
beneficiaries are subject to a withholding tax at a rate of 7% and
at a rate of 13% from fiscal years beginning on or after January 1,
2020.
Certain
tax treaties contemplate the application of a ceiling tax rate on
dividends (i.e. 10% on gross dividends).
Taxation of Capital Gains
Resident individuals
Capital
gains obtained by resident individuals or undivided estates
situated in Argentina from the sale or disposition of common shares
and other securities are subject to income tax at a 15% rate on net
income, unless such securities were traded in stock exchange under
the supervision of the CNV, in which case an exemption
applies.
Losses
arising from the sale, exchange or other disposition of common
shares or ADSs can be applied only to offset such capital gains
arising from the sale, exchange or other disposition of these
securities, for a five-year carryover period.
Foreign beneficiaries
Capital gains obtained by non-Argentine
individuals or non-Argentine entities from the sale, exchange or
other disposition of shares are subject to income tax at a 15% rate
on the net capital gain or at a 13.5% rate on the gross price at
the seller´s election.
Notwithstanding, Law No. 27,430
established an exemption for foreign beneficiaries participating in
the sale of publicly traded shares traded in stock exchanges under
the supervision of the CNV. Said Law also established an exemption
for capital gains derived from the sale , exchange or other
disposition of share certificates issued abroad that represent
shares issued by Argentine companies (i.e. ADRs). The exemptions
will apply only if the foreign beneficiaries do not reside in, and
the funds do not arise from, “non-cooperating”
jurisdictions for tax transparency purposes
Indirect transfer
of Argentine assets (including shares) will be taxable, if (i) the
value of the Argentine assets exceed 30% of the transaction´s
overall value, and (ii) the equity interest sold (in the foreign
entity) exceeds 10%. The tax will also be due if any of these
thresholds were met during the twelve month period prior to the
sale. The indirect transfer of Argentine assets within the same
economic group would also not trigger taxation, provided the
requirements set by regulations have been met. However, no
withholding mechanism is currently available.
Argentine entities
Capital
gains obtained by Argentine entities (in general entities organized
or incorporated under Argentine law, certain traders and
intermediaries, local branches of non-Argentine entities, sole
proprietorships and individuals carrying on certain commercial
activities in Argentina) derived from the sale, exchange or other
disposition of shares or ADSs are subject to income tax at the rate
of 35%, 30% or 25% as have been mentioned above.
286
Losses
arising from the sale, exchange or other disposition of shares or
ADSs can be applied only to offset such capital gains arising from
the sale, exchange or other disposition of these securities, for a
five-year carryover period.
WE
RECOMMEND PROSPECTIVE INVESTORS TO CONSULT THEIR OWN TAX ADVISOR
REGARDING THE PARTICULAR TAX CONSEQUENCES CONCERNING THE SALE OR
OTHER DISPOSITIONS OF SHARES AND ADSs.
Value Added Tax
The
sale, exchange, disposition, or transfer of common shares or ADSs
is not subject to value added tax. Dividend distributions are not
levied with value added tax either.
Tax on Personal Assets
Argentine entities,
such as us, have to pay the personal assets tax corresponding to
Argentine and foreign domiciled individuals and foreign domiciled
entities for the holding of our shares. The applicable tax rate is
0.25% and is levied on the proportional net worth value (valor
patrimonial proporcional), or the book value, of the shares arising
from the last balance sheet of the Argentine entity calculated
under Argentine GAAP. Pursuant to the Personal Assets Tax Law, the
Argentine company is entitled to seek reimbursement of such paid
tax from the applicable Argentine domiciled individuals and/or
foreign domiciled shareholders.
Pursuant to Law No.
27,260, Argentine companies that have properly fullfiled their tax
obligations during the two prior fiscal years to the 2016 fiscal
year, and which comply with certain other requirements, may qualify
for an exemption from personal asset tax for the 2016, 2017 and
2018 fiscal years. The request for this tax exemption should be
filed before March 31, 2017. The Company filed this
request.
On
October 11, 2018, a project law to amend the Personal Assets Tax
has summited to the Chamber of Deputies. Its main purpose is to
raise the non-taxable minimum to Ps.2 million and modify the scale
of the tax rate according to the taxable amount. Likewise, it is
worth mentioning that the aforementioned project does not foresee
changes with respect to the aliquots of the tax for the foreigners.
Moreover, it intends to repeal the exemption existing in the tax
for rural properties that were reached by the IGMP (as defined
below). In case it is approved by the Argentine Congress, the
amendments would become effective as of fiscal year 2019 and
following.
Tax on Minimum Notional Income (Impuesto a la Ganancia Mínima
Presunta, “IGMP”)
Entities domiciled
in Argentina, partnerships, foundations, sole proprietorships,
trusts, certain mutual funds organized in Argentina, and permanent
business establishments owned by foreign persons, among other
taxpayers, shall apply a 1% rate to the total value of assets held
by such persons, above an aggregate nominal amount of Ps.200,000.
Nevertheless, common shares and ADSs issued by entities subject to
such tax are exempt from the IGMP.
Law No.
27,260 has repealed this tax for fiscal years commenced since
January 1, 2019.
Turnover Tax
The
gross turnover tax is a local tax; therefore, the rules of the
relevant provincial jurisdiction should be considered, which may
levy this tax on the purchase and sale, exchange or other
disposition of common shares or ADSs, and/or the collection of
dividends at an average rate of 6%, unless an exemption is
applicable. In the particular case of the City of Buenos Aires, any
transaction involving common shares and/or the collection of
dividends and revaluations is exempt from this tax.
There
is no gross income tax withholding system applicable to the
payments made to foreign beneficiaries.
Stamp Tax
Stamp
taxes may apply in the City of Buenos Aires and in certain
Argentine provinces in case transfer of common shares or ADSs is
performed or executed in such jurisdictions by means of written
agreements.
Foreign trade tax
On
September 4, 2018, the Argentine Government issued Decree No.
793/2018 that reimplements an export duty of 12% until December 31,
2020 on export of goods and services, with a cap of Ps.4 for each
U.S. dollar for primary goods and services and Ps.3 for the rest of
the manufactured goods.
287
Other Taxes
There
are no Argentine federal inheritance or succession taxes applicable
to the ownership, transfer or disposition of our common shares or
ADSs. The provinces of Buenos Aires and Entre Ríos established
a tax on free transmission of assets, including inheritance,
legacies, donations, etc. Free transmission of our shares could be
subject to this tax.
In the
case of litigation regarding the shares before a court of the City
of Buenos Aires, a 3% court fee would be charged, calculated on the
basis of the claim.
Treaties to Avoid Double Taxation
Argentina has
entered into tax treaties with several countries. There is
currently no tax treaty or convention in effect between Argentina
and the United States.
F.
DIVIDENDS AND PAYING AGENTS
This
section is not applicable
G.
STATEMENT BY EXPERTS
This
section is not applicable.
H.
DOCUMENTS ON DISPLAY
We file annual, quarterly and other information
with the SEC. You may read and copy any document that we file at
the public reference rooms of the SEC at 450 Fifth Street, N.W.,
Washington, D.C. 20549 and 500 West Madison Street, Suite 1400,
Chicago, Illinois 60661
and
www.sec.gov. You may obtain information on the operation of the
public reference rooms by calling the SEC at 1-800-SEC-0330. Our
Internet address is
http://www.cresud.com.ar
.
It should be noted that nothing on our website should be considered
part of this annual report on Form 20-F. You may request a copy of
these filings at no cost, by writing or calling the office at +54
(11)-4814-7800.
I.
SUBSIDIARY INFORMATION
This
section is not applicable.
In the
normal course of business, we are exposed to foreign exchange risk,
interest rate risks and other price risk, primarily related to
changes in exchange rates and interest rates. We manage our
exposure to these risks through the use of various financial
instruments, none of which are entered into for trading purposes.
We have established policies and procedures governing the use of
financial instruments, specifically as they relate to the type and
volume of such financial instruments. For further information on
our market risks, please see Note 5 to our Audited Consolidated
Financial Statements.
A.
Debt Securities
This
item is not applicable
B.
Warrants and Rights
This
item is not applicable
C.
Other Securities
This
item is not applicable
288
D.
American Depositary Shares
The
Bank of New York Mellon, as depositary for the ADSs (the
“Depositary”) collects its fees for delivery directly
from investors depositing shares or surrendering ADSs for the
purpose of withdrawal. The Depositary also collects taxes and
governmental charges from the holders of ADSs. The Depositary
collects these fees and charges by deducting those fees from the
amounts distributed or by selling a portion of distributable
property to pay the fees (after attempting by reasonable means to
notify the holder prior to such sale).
The
Depositary has agreed to reimburse or pay on our behalf, certain
reasonable expenses related to our ADS program and incurred by us
in connection with the program (such as NASDAQ listing fees, legal
and accounting fees incurred with preparation of Form 20-F and
ongoing SEC compliance and listing requirements, distribution of
proxy materials, investor relations expenses, etc).
The
amounts the Depositary reimbursed or paid are not perforce related
to the fees collected by the depositary from ADS
holders.
We
agree to pay the fees, reasonable expenses and out-of-pocket
charges of the Depositary and those of any registrar only in
accordance with agreements in writing entered into between the
Depositary and the Company from time to time. The Depositary shall
present its statement for such charges and expenses to the Company
once every three months. The charges and expenses of the custodian
are for the sole account of the Depositary.
The
following charges shall be incurred by any party depositing or
withdrawing shares or by any party surrendering receipts or to whom
receipts are issued (including, without limitation, issuance
pursuant to a stock dividend or stock split declared by us or an
exchange regarding the receipts or deposited securities or a
distribution of receipts), whichever applicable: (1) taxes and
other governmental charges, (2) such registration fees as may from
time to time be in effect for the registration of transfers of
shares generally on the share register of the Company or foreign
registrar and applicable to transfers of shares to the name of the
Depositary or its nominee or the custodian or its nominee on the
making of deposits or withdrawals hereunder, (3) such cable, telex
and fax transmission expenses as are expressly provided in the
deposit agreement, (4) such expenses as are incurred by the
Depositary in the conversion of foreign currency (5) a fee of
US$5.00 or less per 100 ADS (or portion), (6) a fee of US$0.02 or
less per ADS (or portion) for any cash distribution made pursuant
to the deposit agreement including, but not limited to, and (7) a
fee for the distribution of securities, such fee being in an amount
equal to the fee for the execution and delivery of ADS referred to
above which would have been charged as a result of the deposit of
such securities, but which securities are instead distributed by
the Depositary to owners.
289
This
section is not applicable.
A. This
section is not applicable.
B. This
section is not applicable.
C. This
section is not applicable.
D. This
section is not applicable.
E. This
section is not applicable.
A.
DISCLOSURE CONTROLS AND PROCEDURES
We
maintain disclosure controls and procedures that are designed to
ensure that information required to be disclosed in the reports we
file or submit under the Exchange Act is recorded, processed,
summarized and reported within the time periods specified in the
SEC’s rules and forms, and that such information is
accumulated and communicated to management, including our Chief
Executive Officer and Chief Financial and Administrative Officer,
to allow our management to make timely decisions regarding required
disclosure. Any controls and procedures, no matter how well
designed and operated, can provide only reasonable assurance of
achieving the desired control objective. In connection with the
preparation of this Annual Report on Form 20-F, we carried out an
evaluation under the supervision and with the participation of
members of our management team, including our Chief Executive
Officer and Chief Financial and Administrative Officer, of the
effectiveness of the design and operation of our disclosure
controls and procedures (as defined in Rules 13a-15(e) and
15d-15(e) under the Exchange Act) as of June 30, 2018. Based upon
this evaluation our Chief Executive Officer and Chief Financial and
Administrative Officer concluded that our disclosure controls and
procedures as of the end of the period covered by this Annual
Report on Form 20-F were effective at the reasonable assurance
level.
B.
MANAGEMENT´S ANNUAL REPORT ON INTERNAL CONTROL OVER FINANCIAL
REPORTING
Our
management is responsible for establishing and maintaining adequate
Internal Control over Financial Reporting (as defined in Rules
13a-15(f) and 15d-15(f) under the Exchange Act). Our Internal
Control over Financial Reporting includes a series of procedures
designed to provide reasonable assurance regarding the reliability
of financial reporting and the preparation of consolidated
financial statements for external purposes, in accordance with
International Financial Reporting Standards and includes those
policies and procedures that (1) pertain to the maintenance of
records that, in reasonable detail, accurately and fairly reflect
the transactions and dispositions of our assets, (2) provide
reasonable assurance that transactions are recorded as necessary to
permit preparation of consolidated financial statements in
accordance with International Financial Reporting Standards and
that a company’s receipts and expenditures are being made
only in accordance with authorizations of our management and
directors, and (3) provide reasonable assurance regarding
prevention or timely detection of unauthorized acquisition, use, or
disposition of our assets that could have a material effect on our
consolidated financial statements.
Because
of its inherent limitations, Internal Control over Financial
Reporting may not prevent or detect misstatements. Also,
projections of any evaluation of effectiveness to future periods
are subject to the risk that controls may become inadequate because
of changes in conditions, or that the degree of compliance with
policies and procedures may deteriorate.
Management assessed
the effectiveness of our Internal Control over Financial Reporting
as of June 30, 2018. In making this assessment, management used the
criteria set forth by the Committee of Sponsoring Organizations of
the Treadway Commission (COSO) in Internal Control–Integrated
Framework (2013). Based on this evaluation, management concluded
that our Internal Control over Financial Reporting was effective as
of June 30, 2018.
C.
ATTESTATION REPORT OF THE REGISTERED PUBLIC ACCOUNTING
FIRM
The
effectiveness of the Company’s internal control over
financial reporting as of June 30, 2018 has been audited by Price
Waterhouse & Co S.R.L, Buenos Aires Argentina- member firm of
PricewaterhouseCoopers International Limited-, an independent
registered public accounting firm, as stated in their report which
appears herein.
290
D.
CHANGES IN INTERNAL CONTROL OVER FINANCIAL REPORTING
During
the year ended June 30, 2018, we implemented the Real Estate module
for SAP and accordingly we have updated our internal controls over
financial reporting, as necessary, to accommodate modifications to
our business processes and to take advantage of enhanced automated
controls provided by this new system.
Other
than as expressly noted above, there have been no changes in our
internal control over financial reporting during the year ended
June 30, 2018 that have materially affected, or are reasonably
likely to materially affect, our internal control over financial
reporting.
In our
annual ordinary shareholders’ meeting held on October 31,
2003, the audit committee was unanimously approved. Pursuant to
this plan, the board of directors had to appoint the members of the
audit committee who hold expertise in corporate administration,
finance and accounting.
Our
board of directors established an audit committee which would
assist the Board in exercising its duty of care on disclosure
requirements, the enforcement of accounting policies, management of
our business risks, the management of our internal control systems,
ethical conduct of our businesses, monitoring the sufficiency of
our financial statements, our compliance with laws, independence
and capacity of independent auditors and performance of our
internal audit and our external auditors. Also, according to the
applicable regulations, we may request to our audit committee to
render its opinion in certain transactions, and its conditions, as
is the case of related party transactions, as may be reasonably
considered adequate according to normal market
conditions.
On
November 5, 2015, our board of directors appointed Jorge Oscar
Fernández, Pedro Damaso Labaqui Palacio, Daniel El’as
Mellicovsky and Gabriel Adolfo Gregorio Reznik, all of them
independent members, as members of the audit committee. The board
of directors named Jorge Oscar Fernández as the financial
expert in accordance with the relevant SEC rules. We have a fully
independent audit committee as per the standards provided in Rule
10(A)-3(b)(1).
We have
adopted a code of ethics that applies to our directors, officers
and employees. Our code of ethics is posted in our website
www.cresud.com.ar. On July 25, 2005, our Code of Ethics was amended
by our board of directors. The amendment was reported in a report
on Form 6K on August 1, 2005.
If we
make any substantive amendment to the code of ethics or if we grant
any waivers, including any implicit waiver, from a provision of the
code of ethics, we will disclose the nature of such amendment or
waiver in a Form 6-K or in our next Forms 20-F to be filed with the
SEC.
Audit Fees
During
the fiscal years ended June 30, 2018 and 2017, we were billed a
total amount of Ps.27.3 million and Ps.29.0 million respectively in
the Operation Center in Argentina and NIS 6 million and NIS 4
million for the fiscal years 2018 and 2017 respectively, in the
Operation Center in Israel, for professional services rendered by
our principal accountants for the audit of our annual Audited
Consolidated Financial Statements, performance of the audit of
internal controls over financial reporting of the company and other
services normally provided in connection with regulatory filings or
engagements.
Audit-Related Fees
During
the fiscal year ended June 30, 2018 and 2017 we were billed a total
amount of Ps.4.8 million and Ps.1.5 million in the Operation Center
in Argentina for professional services rendered by our principal
accountants mainly in connection with the review of equity offering
transactions forms and debt prospectus.
Tax Fees
During
the fiscal year ended June 30, 2018 and 2017 we were billed a total
amount of Ps.0.3 million and Ps.0.2 million in the Operation Center
in Argentina and during the fiscal year ended June 30, 2018 and
2017, we were billed a total amount of NIS 0.2 million and NIS 0.2
million, respectively in the Operation Center in Israel, for
professional services rendered by our principal accountants for tax
compliance, tax advice and tax planning.
All Other Fees
During
the fiscal year ended June 30, 2018 and June 30, 2017 we were
billed for professional services rendered by our principal
accountants, including fees mainly related to statutory
certifications and training seminaries, a total amount of Ps.5.2
million and Ps.3.3 million, respectively in the Operations Center
in Argentina and NIS 0.6 million and NIS 0.2 million for the fiscal
years 2018 and 2017 respectively, in the Operation Center in
Israel.
291
Audit Committee Pre-Approval Policies and Procedures
Our
audit committee approves, in advance, the engagement of auditors
and their fees for audit and non-audit services pursuant to
paragraph (c)(7)(i)(c) of Rule 2-01 of Regulation S-X.
Our
Audit Committee pre-approves all services, fees and services
provided by the external auditors to ensure auditors’
independence. One of the main tasks of the Audit Committee is to
give it opinion in relation to the appointment of the external
auditors, proposed by the Board of Directors to the General
Shareholder’s Meeting. In order to accomplish such task, the
Audit Committee shall:
●
Require any additional and complementary documentation related to
this analysis;
●
Verify the independence of the external auditors;
●
Analyze different kinds of services that the external auditor would
provide to the company. This description must also include an
estimate of the fees payable for such services, specifically in
order to maintain the principle of independence;
●
Inform the fees billed by the external auditor, separating the
services related to audit services and other special services that
could be not included in the audit services previously
mentioned.
●
Take notice of any strategy proposed by of the external auditors
and review it in accordance with the reality other business and the
risks involved;
●
Analyze and supervise the working plan of the external auditors
considering the business’ reality and the estimated
risks;
●
Propose adjustments (if necessary) to such working
plan;
●
Hold meetings with the external auditors in order to: (a) analyze
the difficulties, results and conclusions of the proposed working
plan; (b) analyze eventual possible conflicts of interests, related
party transactions, compliance with the legal framework and
information transparency;
●
Evaluate the performance of external auditors and their opinion
regarding the Financial Statements.
This
section is not applicable.
Issuer
Purchases of Equity Securities
On
April 11, 2014 our Board of Directors decided to initiate a new
shares repurchase plan (the “2014 Plan”), under the
terms of Article 64 of the Capital Markets Law and the rules of the
CNV. Such repurchases were made with our liquid and realized
profits and free reserves. As of November 14, 2014, we finalized
the 2014 Plan having repurchased a total of 8,633,316 shares,
equivalent to 1.72% of the share capital, by a total of Ps.87.1
million.
292
|
Period
|
Total Number of Common Shares Purchased(1)
|
Average Price Paid per Share
|
Total Number of ADR’s Purchased
|
Average Price Paid per Share
|
Total Number of Shares Purchased as Part of the Publicly Announced
Plan
(2)
|
Maximum Number of Shares that may yet be purchased under the
plan
|
|
|
|
(Ps.)
|
|
(US$)
|
|
|
|
04/17/2014
- 04/30/2014
|
14,700
|
6.74
|
59,162
|
11.18
|
606,320
|
18,506,949
|
|
05/01/2014
- 05/31/2014
|
33,537
|
10.23
|
171,500
|
12.11
|
1,748,537
|
16,758,412
|
|
06/01/2014
- 06/30/2014
|
100,512
|
12.81
|
313,011
|
12.33
|
3,230,622
|
13,527,790
|
|
07/01/2014
- 07/31/2014
|
4,000
|
13.40
|
115,111
|
13.62
|
1,155,110
|
12,372,680
|
|
08/01/2014
- 08/31/2014
|
13,657
|
13.23
|
142,989
|
12.28
|
1,443,547
|
10,929,133
|
|
09/01/2014
- 09/30/2014
|
-
|
-
|
44,918
|
11.86
|
449,180
|
10,479,953
|
|
Total
|
166,406
|
|
846,691
|
|
8,633,316
|
|
(1)
As of
the date of transaction.
(2)
C
orrespond to the
sum of common shares and ADR’s purchased. Each ADR represents
10 common shares
In
addition, during December 2014, our Board of Directors, in
accordance with the resolutions of the Shareholders’ Meeting
dated November 14, 2014, decided to initiate the process of
distribution among the shareholders, on a
pro rata
basis, of 5,565,479 common
shares, repurchased under the 2014 Plan. The allotment of shares
was calculated over the outstanding capital stock up to December
12, 2014 of Ps.487,928,660 (10 shares per ADR). As a result of the
calculation of the allotment, the fractions were settled in cash.
746 shares were not distributed.
On
February 22, 2018 our Board of Directors decided to initiate a new
shares repurchase plan (the “2018 Plan”), under the
terms of Article 64 of the Capital Markets Law and the rules of the
CNV, for a maximum amount of the investment up to Ps.500 million.
Such repurchases were made with our liquid and realized profits and
free reserves. On May 22, 2018 our Board of Directors resolved to
increase the amount of the program, totaling up to Ps.900
million.
As of
July 27, 2018, we finalized the 2018 Plan having repurchased a
total of 20,656,215 shares, representing approximately 99.9% of the
approved program and 4.1% of the share capital.
|
Period
|
Total Number of Common Shares Purchased(1)
|
Average Price Paid per Share
|
Total Number of ADR’s Purchased
|
Average Price Paid per Share
|
Total Number of Shares Purchased as Part of the Publicly Announced
Plan
(2)
|
Maximum amount that may yet be purchased under the
plan
|
|
|
|
(Ps.)
|
|
(US$)
|
|
(In million of Ps.)
|
|
02/27/2018
– 02/28/2018
|
116,664
|
44.36
|
—
|
—
|
116,664
|
894.8
|
|
03/01/2018
– 03/31/2018
|
1,449,101
|
42.56
|
270,884
|
20.83
|
4,157,941
|
718.9
|
|
04/01/2018
– 04/30/2018
|
428,641
|
42.91
|
449,610
|
21.19
|
4,924,741
|
507.9
|
|
05/01/2018
– 05/31/2018
|
210,000
|
41.60
|
89,811
|
16.86
|
1,108,110
|
461.4
|
|
06/01/2018
– 06/30/2018
|
1,007,380
|
44.20
|
623,569
|
16.81
|
7,243,070
|
139.0
|
|
07/01/2018
– 07/27/2018
|
712,909
|
43.90
|
239,278
|
16.16
|
3,105,689
|
1.1
|
|
Total
|
3,924,695
|
|
1,673,152
|
|
20,656,215
|
|
(1) As of the date
of transaction.
(2) Correspond to
the sum of common shares and ADR’s purchased. Each ADR
represents 10 common shares.
As of
June 30, 2018, we own our shares in an amount equal to
3.9% of our capital
stock, and after completion of the
2018 plan
we
owned our shares in an amount equal to 4.5% of our capital stock.
Subsequently, our 2018 annual meeting of shareholders was held on
October 29, 2018 and it was decided, among others, the
d
istribution
of own shares in portfolio to the shareholders in proportion to
their shareholdings for up to the amount of 20,656,215 ordinary
shares, for more information see "Recent
Developments."
This
section is not applicable.
Compliance
with NASDAQ listing standards on corporate governance
Significant
differences between our corporate governance practices and U.S.
companies’ practices under NASDAQ Rules:
Our
corporate governance practices are governed by the applicable
Argentine law; particularly, the Argentine Corporations Law, the
Capital Markets Law and the rules of the CNV, as well as by our
by-laws.
We have
securities that are registered with the Securities and Exchange
Commission and are listed on the NASDAQ, and are therefore subject
to corporate governance requirements applicable to NASDAQ-listed
non-US companies (a “NASDAQ-listed”
company).
293
Pursuant to NASDAQ
Rule 5615(a)(3), NASDAQ -listed non-U.S. companies that are
categorized as “Foreign Private Issuers” may follow
home country corporate governance practices in lieu of certain of
the corporate governance requirements provided in NASDAQ Rules,
provided that the foreign private issuer complies with certain
mandatory sections of NASDAQ Rules, discloses each requirement that
it does not follow and describes the home country practice followed
in lieu of such requirement. The requirements of the NASDAQ Rules
and the Argentine corporate governance practices that we follow in
lieu thereof are described below:
|
NASDAQ
Standards for U.S. companies
|
Cresud’S
CORPORATE PRACTICES
|
|
Rule
5250(d) - Distribution of Annual and Interim Reports.
|
In lieu
of the requirements of Rule 5250(d), we follow Argentine law, which
requires that companies issue publicly a Spanish language annual
report, including annual Audited Consolidated Financial Statements
prepared in accordance with generally accepted accounting
principles in Argentina, by filing such annual report with the CNV
and the stock exchange in which the securities are listed, within
70 calendar days following the close of our fiscal year. Interim
reports must be filed with the CNV and the stock exchange in which
the securities are listed within 42 calendar days following the
close of each fiscal quarter. We provide our shareholders a copy of
the annual and interim financial reports upon request. English
language translations of our annual reports and interim reports are
filed with the SEC on Form 20-F and Form 6-K, respectively. We also
send the English language translation of our annual report and
quarterly press releases on its website. Furthermore, under the
terms of the Deposit Agreement, dated as of March 18, 1997, among
us, The Bank of New York Mellon, as depositary, and owners of ADSs
issued thereunder, we are required to furnish The Bank of New York
Mellon with, among other things, English language translations of
their annual reports. Annual reports are available for inspection
by ADR holders at the offices of The Bank of New York located at,
101 Barclay Street, 22 Floor, New York, New York. Finally,
Argentine law requires that 20 calendar days before the date of a
shareholders’ meeting, the board of directors must provide to
our shareholders, at our executive office or through electronic
means, all information relevant to the shareholders’ meeting,
including copies of any documents to be considered by the
shareholders (which includes the annual report).
|
|
Rule
5605(b)(1) - Majority of Independent Directors.
|
In lieu
of the requirements of Rule 5605(b)(1), we follow Argentine law
which does not require that a majority of the board of directors be
comprised of independent directors. Argentine law instead requires
that public companies in Argentina, such as, us must have a
sufficient number of independent directors to be able to form an
audit committee of at least three members, the majority of which
must be independent pursuant to the criteria established by the
CNV.
|
|
Rule
5605(b)(2) - Executive Sessions of the Board of
Directors.
|
In lieu
of the requirements of Rule 5605(b)(2), we follow Argentine law
which does not require independent directors to hold regularly
scheduled meetings at which only such independent directors are
present (i.e., executive sessions). Our board of directors as a
whole is responsible for monitoring our affairs. In addition, under
Argentine law, the board of directors may approve the delegation of
specific responsibilities to designated directors or non-director
managers of the Company. Also, it is mandatory for public companies
to form a supervisory committee (composed of “syndics”)
which is responsible for monitoring our legal compliance under
Argentine law and compliance with our by-laws. Finally, our audit
committee has regularly scheduled meetings and, as such, such
meetings will serve a substantially similar purpose as executive
sessions.
|
|
Rule
5605(d)(B) - Compensation of Officers.
|
In lieu
of the requirements of Rule 5605(d)(B), we follow Argentine law
which does not require companies to form a compensation committee
comprised solely of independent directors. For the determination of
the compensation of the chief executive officer and all other
executive officers no decision of a majority of independent
directors or a compensation committee comprised solely of
independent directors is required under Argentine law. Under
Argentine law, the board of directors is the corporate body
responsible for determining the compensation of the chief executive
officer and all other executive officers, so long as they are not
directors. In addition, under Argentine law, the audit committee
shall give its opinion about the reasonableness of
management’s proposals on fees and option plans for our
directors or managers.
|
|
Rule
5605(e) - Nomination of Directors.
|
In lieu
of the requirements of Rule 5605(e), we follow Argentine law which
requires that directors be nominated directly by the shareholders
at the shareholders’ meeting and that they be selected and
recommended by the shareholders themselves. Under Argentine law, it
is the responsibility of the ordinary shareholders’ meeting
to appoint and remove directors and to set their
compensation.
|
|
Rule
5605(c)(1) - Audit Committee Charter.
|
In lieu
of the requirements of Rule 5605(c)(1), we follow Argentine law
which requires that audit committees have a charter but does not
require that companies certify as to the adoption of the charter
nor does it require an annual review and assessment thereof.
Argentine law instead requires that companies prepare a proposed
plan or course of action with respect to those matters which are
the responsibility of our audit committee. Such plan or course of
action could, at the discretion of our audit committee, include a
review and assessment of the audit committee charter. We believe
that we are in compliance with the requirements for audit committee
charters provided for in the Sarbanes Oxley Act.
|
|
Rule
5605(c)(2) - Audit Committee Composition.
|
Argentine law does
not require that companies have an audit committee comprised solely
of independent directors and it is equally not customary business
practice in Argentina to have such a committee. Argentine law
instead requires that companies establish an audit committee with
at least three members comprised of a majority of independent
directors as defined by Argentine law. Nonetheless, although not
required by Argentine law, we have a three member audit committee
comprised of entirely independent directors in accordance with Rule
10(A)-3(b)(1) of the General rules and regulations promulgated
under the Securities Exchange Act of 1934, as independence is
defined in Rule 10(A)-3(b)(1). Further, Argentinelaw does not
require companies to identify or designate a financial expert. As
such, Although all the members of the audit committee have large
corporate experience, as of the date of this annual report, the
Board of Directors have not named designated a financial expert in
accordance with the relevant SEC ruleson the audit committee.
Although it is noted that all members of the audit committee have
had significant corporate experience. In addition, we have a
supervisory committee (“comisión fiscalizadora”)
composed of three ‘syndics’ which are in charge of
monitoring the legality, under Argentine law, of the actions of our
board of directors and the conformity of such actions with our
by-laws.
|
|
Rule
5620(c) - Quorum.
|
In lieu
of the requirements of Rule 4350(f), we follow Argentine law and
our bylaws, which distinguish between ordinary meetings and
extraordinary meetings and both of them can be celebrated using
teleconference technology, as long as the regulations related to
accreditation, registration and quorum are complied with and the
simultaneity of the shareholders and immediately of the process of
verbal communication and issuance of votes is guaranteed. The
supervisory committee shall state the regularity of the resolutions
adopted. The board of directors shall establish the rules and
technical matters related to remote participation pursuant to the
current rules and in conformity with the National Exchange
Commission regulations. Shareholders physically present at the time
and those using teleconference technologies will be taken into
consideration for the quorum. In connection with ordinary meetings,
a quorum consists of a majority of stocks entitled to vote. If no
quorum is present at the first meeting, a second meeting may be
called, in which the shareholders present or communicated through
teleconference technologies, regardless of their number, constitute
a quorum. Resolutions may be adopted by an absolute majority of the
votes present or communicated through teleconference technologies.
Argentine law, and our bylaws, requires in connection with
extraordinary meetings, that a quorum consist of 60% of the stock
entitled to vote. However, if such quorum is not present at the
first meeting, our bylaws provide that a second meeting may be
called and maybe held with the number of shareholders present or
communicated through teleconference technologies. In both ordinary
and extraordinary meetings, decisions are adopted by an absolute
majority of votes present at the meeting or communicated through
teleconference technologies, except for certain fundamental matters
(such as mergers and spin-offs (when we are not the surviving
entity and the surviving entity is not listed on any stock
exchange), anticipated liquidation, change in its domicile outside
of Argentina, total or partial recapitalization of its statutory
capital following a loss, any transformation in our corporate legal
form or a substantial change in our corporate purpose, or the issue
of bonds) which require an approval by vote of the majority of all
the stock entitled to vote (all stock being entitled to only one
vote).
|
|
Rule
5620(b) -- Solicitation of Proxies.
|
In lieu
of the requirements of Rule 5620(b), we follow Argentine law which
requires that notices of shareholders’ meetings be published,
for five consecutive days, in the Official Gazette and in a widely
published newspaper in Argentina no earlier than 45 calendar days
prior to the meeting and at least 20 calendar days prior to such
meeting. In order to attend a meeting and be listed on themeeting
registry, shareholders are required to submit evidence of their
book-entry share account held at Caja de Valores S.A. up to three
business days prior to the scheduled meeting date. If entitled to
attend the meeting, a shareholder may be represented by proxy
(properly executed and delivered with a certified signature)
granted to any other person, with the exception of a director,
syndic, member of the Supervisory Committee, manager or employee of
the issuer, which are prohibited by Argentine law from acting as
proxies. In addition, our ADS holders receive, prior to the
shareholders’ meeting, a notice listing the matters on the
agenda, a copy of the annual report and a voting card.
|
|
Rule
5630(s) -- Conflicts of Interest
|
In lieu
of the requirements of Rule 5630(a), we follow Argentine law which
requires that related party transactions be approved by the audit
committee when the transaction exceeds one percent (1%) of the
corporation’s net worth, measured pursuant to the last
audited balance sheet. Directors can contract with the corporation
only on an arm’s length basis. If the contract is not in
accordance with prevailing market terms, such transaction must be
pre-approved by the board of directors (excluding the interested
director). In addition, under Argentine law, a shareholder is
required to abstain from voting on a business transaction in which
its interests may be in conflict with the interests of the company.
In the event such shareholder votes on such business transaction
and such business transaction would not have been approved without
such shareholder’s vote, such shareholder may be liable to
the company for damages and the resolution may be declared
void.
|
This
section is not applicable.
294
We have
responded to Item 18 in lieu of responding to this
Item.
Reference is made
to pages F-1 through F-224
Index
to Financial Statements (see page F-1).
|
Exhibit
No.
|
Description
of Exhibit
|
|
1.1(1)
|
By-laws
(Estatutos) of the registrant, which serve as the
registrant’s articles of incorporation and by-laws, and an
English translation thereof.
|
|
1.2(4)
|
English
translation of the amendment to the bylaws.
|
|
1.3(9)
|
Amended
and restated English translation of the bylaws.
|
|
1.4(10)
|
Amended
and restated English translation of the bylaws.
|
|
2.1(7)
|
Indenture dated
September 7, 2011, among us, as issuer, the Bank of New York
Mellon, as trustee, co-registrar, principal paying agent and
transfer agent, Banco Santander Rio, S.A., as registrar, paying
agent, transfer agent and representative of the trustee in
Argentina, and The Bank of New York Mellon (Luxembourg) S.A., as
Luxembourg Paying and Transfer Agent, for the issuance of the
US$60,000,000, 7.50% Fourth Series, Class VIII Senior Notes Due
2014.
|
|
2.2(11)
|
Indenture, dated
July 20, 2010, between IRSA Inversiones y Representaciones Sociedad
Anónima as Issuer, The Bank of New York Mellon as Trustee,
Co-Registrar, Principal Paying Agent and Transfer Agent, and Banco
Santander Río S.A. as Registrar, Paying Agent, Transfer Agent
and Representative of the Trustee in Argentina, with respect to
IRSA Inversiones y Representaciones S.A.’s US$400,000,000
Global Note Program, pursuant to which US$150,000,000 aggregate
principal amount of IRSA Inversiones y Representaciones Sociedad
Anónima’s 11.500% Notes due 2020, Series No. 2, were
issued.
|
|
2.3(11)
|
First
Supplemental Indenture, dated March 28, 2016, between IRSA
Inversiones y Representaciones Sociedad Anónima as Issuer and
The Bank of New York Mellon as Trustee, Co-Registrar, Principal
Paying Agent and Transfer Agent to the Indenture, dated July 20,
2010, between IRSA Inversiones y Representaciones Sociedad
Anónima as Issuer, The Bank of New York Mellon as Trustee,
Co-Registrar, Principal Paying Agent and Transfer Agent, and Banco
Santander Río S.A. as Registrar, Paying Agent, Transfer Agent
and Representative of the Trustee in Argentina, with respect to
IRSA Inversiones y Representaciones Sociedad Anónima’s
US$400,000,000 Global Note Program, pursuant to which
US$150,000,000 aggregate principal amount of IRSA Inversiones y
Representaciones Sociedad Anónima’s 11.500% Notes due
2020, Series No. 2, were issued.
|
|
2.4(11)
|
Indenture, dated
March 23, 2016, between IRSA Propiedades Comerciales S.A. as
Issuer, The Bank of New York Mellon as Trustee, Co-Registrar,
Principal Paying Agent and Transfer Agent, and Banco Santander
Río S.A. as Registrar, Paying Agent, Transfer Agent and
Representative of the Trustee in Argentina, with respect to IRSA
Propiedades Comerciales S.A.’s US$500,000,000 Global Note
Program, pursuant to which US$360,000,000 000 aggregate principal
amount of IRSA Propiedades Comerciales S.A.’s 8.750% Notes
due 2023, Series No. 2, were issued.
|
|
2.5(11)
|
First
Supplemental Indenture, dated March 23, 2016, between IRSA
Propiedades Comerciales S.A., as Issuer and The Bank of New York
Mellon, as Trustee, Co-Registrar, Principal Paying Agent and
Transfer Agent, The Bank of New York Mellon (Luxembourg) S.A., as
Luxembourg Paying Agent and Luxembourg Transfer Agent and Banco
Santander Río S.A., as Registrar, Paying Agent, Transfer Agent
and Representative of the Trustee in Argentina to the Indenture,
dated March 23, 2016, between IRSA Propiedades Comerciales S.A. as
Issuer, The Bank of New York Mellon as Trustee, Co-Registrar,
Principal Paying Agent and Transfer Agent, and Banco Santander
Río S.A. as Registrar, Paying Agent, Transfer Agent and
Representative of the Trustee in Argentina, with respect to IRSA
Propiedades Comerciales S.A.’s US$500,000,000 Global Note
Program, pursuant to which US$360,000,000 000 aggregate principal
amount of IRSA Propiedades Comerciales S.A.’s 8.750% Notes
due 2023, Series No. 2, were issued.
|
|
4.1(1)
|
Consulting
Agreement among Cresud S.A.C.I.F. y A. and Dolphin Fund Management
S.A. dated October 25, 1994.
|
|
4.1.1
|
(English Summary)
Amendment to the Consulting Agreement by and among Cresud and
Consultores Assets Management S.A., dated September 8,
2017.
|
|
4.2(2)
|
Agreement for the
exchange of Corporate Service between we, IRSA and IRSA CP, dated
June 30, 2004.
|
|
4.3(4)
|
English
translation of the Amendment to the Agreement for the exchange of
Corporate Service among, IRSA and IRSA CP and us, dated August 23,
2007.
|
|
4.4(5)
|
English
translation of the Third Agreement for the Implementation of the
Amendment to the Corporate Services Master Agreement, dated
November 27, 2009.
|
|
4.5(6)
|
Amendment to the
Agreement for the exchange of Corporate Service between we, IRSA
and IRSA CP, dated March 12, 2010.
|
|
4.6(7)
|
English
translation of the Forth Agreement for the Implementation of the
Amendment to the Corporate Services Master Agreement, dated July
11, 2011.
|
|
4.7(8)
|
English
translation of the Fifth Agreement for the Implementation of the
Amendment to the Corporate Services Master Agreement, dated October
15, 2012.
|
|
4.8(9)
|
English
translation of the Sixth Agreement for the Implementation of the
Amendment to the Corporate Services Master Agreement dated November
12, 2013.
|
|
4.9(9)
|
English
translation of the Second Amendment to the Exchange of Operating
Services Agreement between the Company, Cresud and IRSA CP dated
February 24, 2014.
|
|
4.10(10)
|
English
translation of the Seventh Agreement for the Implementation of the
Amendment to the Corporate Services Master Agreement dated February
18, 2015.
|
|
4.11(11)
|
English
translation of the Eighth Agreement for the Implementation of the
Amendment to the Corporate Services Master Agreement dated November
12, 2015.
|
|
4.12(12)
|
English
translation of the Ninth Agreement for the Implementation of the
Amendment to the Corporate Services Master Agreement dated May 5,
2017
|
|
4.13
|
English
translation of the Tenth Agreement for the Implementation of the
Amendment to the Corporate Services Master Agreement dated June 29,
2018.
|
|
8.1
|
List of
Subsidiaries.
|
|
11.1(3)
|
Code of
Ethics.
|
|
12.1
|
Certification
pursuant to Section 302 of the Sarbanes-Oxley Act of 2002 for Chief
Executive Officer.
|
|
12.2
|
Certification
pursuant to Section 302 of the Sarbanes-Oxley Act of 2002 for Chief
Financial Officer.
|
|
13.1
|
Certification
pursuant to 18 U.S.C. 1350, as adopted pursuant to Section 906 of
the Sarbanes-Oxley Act of 2002 for Chief Executive
Officer.
|
|
13.2
|
Certification
pursuant to 18 U.S.C. 1350, as adopted pursuant to Section 906 of
the Sarbanes-Oxley Act of 2002 for Chief Financial
Officer.
|
|
99.1
|
Summary
of investment properties by type as of June 30, 2018 (in accordance
with Regulation S-X 12-28 (1)).
|
(1)
Incorporated herein by reference to the exhibit to the
registrant’s registration statement on Form F-1 (File No.
333-06548) filed with the SEC on March 3, 1997.
(2)
Incorporated herein by reference to the report statement on Form
6-K (File No. 333-06548) filed with the SEC on July 1,
2004.
(3)
Incorporated herein by reference to the registrant’s report
on Form 6-K (File No. 333-06548) filed with the SEC on August 1,
2005.
(4)
Incorporated herein by reference to the annual report on Form 20-F
(File No. 333-06548) filed with the SEC on December 27,
2007.
(5)
Incorporated herein reference to the annual report on Form 20-F
(File No. 001-29190) filed with the SEC on December 30,
2009.
(6)
Incorporated herein reference to the annual report on Form 20-F
(File No. 001-29190) filed with the SEC on December 30,
2010.
(7)
Incorporated herein reference to the annual report on Form 20-F
(File No. 001-29190) filed with the SEC on December 28,
2011.
(8)
Incorporated herein reference to the annual report on Form 20-F
(File No. 001-29190) filed with the SEC on October 30,
2012.
(9)
Incorporated herein reference to the annual report on Form 20-F
(File No. 001-29190) filed with the SEC on October 31,
2014.
(10)
Incorporated herein reference to the annual report on Form 20-F
(File No. 001-29190) filed with the SEC on November 17,
2015.
(11) Incorporated herein by
reference to the annual report on Form 20-F (File No. 001-29190)
filed with the SEC on November 1, 2016
.
(12) Incorporated herein by
reference to the annual report on Form 20-F (File No. 001-29190)
filed with the SEC on October 31, 2017
.
SIGNATURES
The
registrant hereby certifies that it meets all of the requirements
for filing on Form 20-F and that it has duly caused and authorized
the undersigned to sign this annual report on its
behalf.
|
|
Cresud
SOCIEDAD ANÓNIMA COMERCIAL INMOBILIARIA FINANCIERA Y
AGROPECUARIA
|
|
|
|
|
|
|
|
|
Date
October 31, 2018
|
By:
|
/s/
Matías I. Gaivironsky
|
|
|
|
|
Name
Matías I. Gaivironsky
|
|
|
|
|
Title
Chief Financial and Administrative Officer
|
|
295
INDEX TO THE CONSOLIDATED FINANCIAL STATEMENTS
|
Report
of Independent
Registered Public
Accounting Firm
|
F-2
|
|
Glossary of
terms
|
F-3
|
|
Consolidated
Statements of Financial Position
|
F-4
|
|
Consolidated
Statements of Income and Other Comprehensive
Income
|
F-5
|
|
Consolidated
Statements of Changes in Shareholders’
Equity
|
F-6
|
|
Consolidated
Statements of Cash Flows
|
F-9
|
|
Notes
to Consolidated Financial Statements:
|
|
|
|
F-10
|
|
|
F-11
|
|
|
F-34
|
|
|
F-35
|
|
|
F-41
|
|
|
F-51
|
|
|
F-61
|
|
|
F-63
|
|
|
F-65
|
|
|
F-68
|
|
|
F-69
|
|
|
F-69
|
|
|
F-68
|
|
|
F-70
|
|
|
F-73
|
|
|
F-78
|
|
|
F-79
|
|
|
F-80
|
|
|
F-82
|
|
|
F-82
|
|
|
F-84
|
|
|
F-86
|
|
|
F-89
|
|
|
F-91
|
|
|
F-91
|
|
|
F-91
|
|
|
F-92
|
|
|
F-93
|
|
|
F-93
|
|
|
F-93
|
|
|
F-97
|
|
|
F-103
|
|
|
F-104
|
|
|
F-104
|
|
|
F-105
|
|
|
F-105
|
|
|
|
F-1
Report of Independent Registered Public Accounting
Firm
To the
Board of Directors and Shareholders of
Cresud
Sociedad Anónima, Comercial, Inmobiliaria, Financiera y
Agropecuaria
Opinions on the Financial Statements and Internal Control over
Financial Reporting
We have audited the ac
companying consolidated statements of
financial position of Cresud Sociedad Anónima, Comercial,
Inmobiliaria, Financiera y Agropecuaria and its
subsidiaries
as of
June 30, 2018 and
2017, and
the related
consolidated
statements of income and other comprehensive
income, changes in shareholders’ equity and cash flows for
each of the three years in the period ended
June 30, 2018, including the related
notes and the summary of investment properties by type as of June
30, 2018 listed in the index appearing under Item 19 (99.1)
(collectively referred to as the “consolidated financial
statements”). We also have audited the Company’s
internal control over financial reporting as of June 30, 2018,
based on criteria established in
Internal Control - Integrated
Framework
(2013)
issued by the Committee of Sponsoring
Organizations of the Treadway Commission (COSO).
In our
opinion, the consolidated
financial statements referred to
above
present fairly, in all material
respects, the financial position of the Company as of
June
30, 2018
and
2017
, and the results of
their
operations and
their
cash flows for each of the three years in the
period ended
June
30, 2018
in conformity with
International Financial
Reporting Standards as issued by the International Accounting
Standards Board
.
Also in our
opinion, the Company maintained, in all material respects,
effective internal control over financial reporting as of June 30,
2018, based on criteria established in
Internal Control - Integrated Framework
(2013)
issued by the
COSO.
Basis for Opinions
The Company's management is responsible for these
consolidated
financial statements, for
maintaining effective internal control over financial reporting,
and for its assessment of the effectiveness of internal control
over financial reporting
, included in Management’s
Annual Report on Internal Control Over Financial Reporting
appearing under Item 15
. Our
responsibility is to express opinions on the Company’s
consolidated
financial statements and
on the Company's internal control over financial reporting based on
our
audits. We are a public accounting firm registered with
the Public Company Accounting Oversight Board (United States)
("PCAOB") and are required to be independent with respect to the
Company in accordance with the U.S. federal securities laws and the
applicable rules and regulations of the Securities and Exchange
Commission and the PCAOB.
We conducted our
audits i
n
accordance with the standards of the PCAOB. Those standards require
that we plan and perform the audits to obtain reasonable assurance
about whether the
consolidated
financial statements are free of material
misstatement, whether due to error or fraud, and whether effective
internal control over financial reporting was maintained in all
material respects.
Our audits of the
consolidated
financial statements included performing
procedures to assess the risks of material misstatement of
the
consolidated
financial
statements, whether due to error or fraud, and performing
procedures that respond to those risks. Such procedures included
examining, on a test basis, evidence regarding the amounts and
disclosures in the
consolidated
financial statements. Our audits also included
evaluating the accounting principles used and significant estimates
made by management, as well as evaluating the overall presentation
of the
consolidated
financial
statements. Our audit of internal control over financial reporting
included obtaining an understanding of internal control over
financial reporting, assessing the risk that a material weakness
exists, and testing and evaluating the design and operating
effectiveness of internal control based on the assessed risk. Our
audits also included performing such other procedures as we
considered necessary in the circumstances. We believe that our
audits provide a reasonable basis for our
opinions.
Definition and Limitations of Internal Control over Financial
Reporting
A
company’s internal control over financial reporting is a
process designed to provide reasonable assurance regarding the
reliability of financial reporting and the preparation of financial
statements for external purposes in accordance with generally
accepted accounting principles. A company’s internal control
over financial reporting includes those policies and procedures
that (i) pertain to the maintenance of records that, in
reasonable detail, accurately and fairly reflect the transactions
and dispositions of the assets of the company; (ii) provide
reasonable assurance that transactions are recorded as necessary to
permit preparation of financial statements in accordance with
generally accepted accounting principles, and that receipts and
expenditures of the company are being made only in accordance with
authorizations of management and directors of the company; and
(iii) provide reasonable assurance regarding prevention or
timely detection of unauthorized acquisition, use, or disposition
of the company’s assets that could have a material effect on
the financial statements.
Because
of its inherent limitations, internal control over financial
reporting may not prevent or detect misstatements. Also,
projections of any evaluation of effectiveness to future periods
are subject to the risk that controls may become inadequate because
of changes in conditions, or that the degree of compliance with the
policies or procedures may deteriorate.
/s/
PRICE WATERHOUSE & Co. S.R.L
By:
/s/ Mariano Carlos Tomatis (Partner)
Mariano
Carlos Tomatis
Buenos
Aires, Argentina
October 31,
2018
We have served as the Company’s auditor since
1995.
F-2
Glossary of terms
The
followings are not technical definitions, but help the reader to
understand certain terms used in the wording of the notes to the
Group´s Consolidated Financial Statements.
|
Terms
|
|
Definitions
|
|
Acres
|
|
Agropecuaria
Acres del Sud S.A.
|
|
Adama
|
|
Adama
Agricultural Solutions Ltd.
|
|
Agropecuarias
SC
|
|
Agropecuarias
Santa Cruz de la Sierra S.A.
|
|
BACS
|
|
Banco
de Crédito y Securitización S.A.
|
|
Baicom
|
|
Baicom
Networks S.A.
|
|
Bartan
|
|
Bartan
Holdings and Investments Ltd.
|
|
BASE
|
|
Buenos
Aires Stock Exchange
|
|
BCRA
|
|
Central
Bank of the Argentine Republic
|
|
BHSA
|
|
Banco
Hipotecario S.A.
|
|
BMBY
|
|
Buy
Me Buy You
|
|
BNSA
|
|
Boulevard
Norte S.A.
|
|
Brasilagro
|
|
Brasilagro-Companhia
Brasileira de Propriedades Agrícolas
|
|
CAMSA
|
|
Consultores
Assets Management S.A.
|
|
Carnes
Pampeanas
|
|
Sociedad
Anónima Carnes Pampeanas S.A.
|
|
Cellcom
|
|
Cellcom
Israel Ltd.
|
|
IFRIC
|
|
International
Financial Reporting Standards Interpretation Committee
|
|
Clal
|
|
Clal
Holdings Insurance Enterprises Ltd.
|
|
CLN
Token
|
|
Colu
Token
|
|
CNV
|
|
National
Securities Commission
|
|
CODM
|
|
Chief
Operating Decision Maker
|
|
Condor
|
|
Condor
Hospitality Trust Inc.
|
|
Cresud,
“the Company”, “us”
|
|
Cresud
S.A.C.I.F. y A.
|
|
Cyrsa
|
|
Cyrsa
S.A.
|
|
DFL
|
|
Dolphin
Fund Ltd.
|
|
DIL
|
|
Dolphin
IL Investment Ltd.
|
|
DIC
|
|
Discount
Investment Corporation Ltd.
|
|
DN
B.V.
|
|
Dolphin
Netherlands B.V.
|
|
Dolphin
|
|
Dolphin
Fund Ltd. and Dolphin Netherlands B.V.
|
|
ECLSA
|
|
E-Commerce
Latina S.A.
|
|
Efanur
|
|
Efanur
S.A.
|
|
EHSA
|
|
Entertainment
Holdings S.A.
|
|
Electra
|
|
Electra
Consumer Products Ltd.
|
|
ENUSA
|
|
Entretenimiento
Universal S.A.
|
|
ERSA
|
|
Emprendimiento
Recoleta S.A.
|
|
Financial
Statements
|
|
Unaudited
Condensed Interim Consolidated Financial Statements
|
|
Annual
Financial Statements
|
|
Consolidated
Financial Statements as of June 30, 2017
|
|
ETH
|
|
C.A.A.
Extra Holdings Ltd.
|
|
CPF
|
|
Collective
Promotion Funds
|
|
GCBA
|
|
Autonomous
City of Buenos Aires Government
|
|
Golan
|
|
Golan
Telecom Ltd.
|
|
HASA
|
|
Hoteles
Argentinos S.A.
|
|
IASB
|
|
International
Accounting Standards Board
|
|
IDB
Tourism
|
|
IDB
Tourism (2009) Ltd.
|
|
IDBD
|
|
IDB
Development Corporation Ltd.
|
|
IDBG
|
|
IDB
Group Investment Inc.
|
|
IDBH
|
|
IDB
Holdings Corporation Ltd.
|
|
IFISA
|
|
Inversiones
Financieras del Sur S.A.
|
|
CPI
|
|
Consumer
Price Index
|
|
IRSA
|
|
IRSA
Inversiones y Representaciones S.A.
|
|
IRSA
CP
|
|
IRSA
Propiedades Comerciales S.A.
|
|
Israir
|
|
Israir
Airlines & Tourism Ltd.
|
|
Lipstick
|
|
Lipstick
Management LLC
|
|
LRSA
|
|
La
Rural S.A.
|
|
Metropolitan
|
|
Metropolitan
885 Third Avenue Leasehold LLC
|
|
New
Lipstick
|
|
New
Lipstick LLC
|
|
IAS
|
|
International
Accounting Standards
|
|
IFRS
|
|
International
Financial Reporting Standards
|
|
MPIT
|
|
Minimum
Presumed Income Tax
|
|
NCN
|
|
Non-convertible
notes
|
|
NIS
|
|
New
Israeli Shekel
|
|
NFSA
|
|
Nuevas
Fronteras S.A.
|
|
NPSF
|
|
Nuevo
Puerto Santa Fe S.A.
|
|
NYSE
|
|
New
York Stock Exchange
|
|
OASA
|
|
Ogden
Argentina S.A.
|
|
Ombú
|
|
Ombú
Agropecuaria S.A.
|
|
PAMSA
|
|
Panamerican
Mall S.A.
|
|
PBC
|
|
Property
& Building Corporation Ltd.
|
|
PBEL
|
|
PBEL
Real Estate Ltd.
|
|
Puerto
Retiro
|
|
Puerto
Retiro S.A.
|
|
Quality
|
|
Quality
Invest S.A.
|
|
Rigby
|
|
Rigby
183 LLC
|
|
Rock
Real
|
|
Rock
Real Estate Partners Limited
|
|
Shufersal
|
|
Shufersal
Ltd.
|
|
SRA
|
|
Sociedad
Rural Argentina
|
|
Tarshop
|
|
Tarshop
S.A.
|
|
TASE
|
|
Tel
Aviv Stock Exchange
|
|
Tender
offers
|
|
Share
repurchase commitment
|
|
TGLT
|
|
TGLT
S.A.
|
|
Tyrus
|
|
Tyrus
S.A.
|
|
Yuchan
|
|
Yuchán
Agropecuaria S.A.
|
|
Yatay
|
|
Yatay
Agropecuaria S.A.
|
F-3
Cresud Sociedad Anónima,
Comercial, Inmobiliaria, Financiera y Agropecuaria
Consolidated Statements of Financial Position
as of June 30, 2018 and 2017
(All
amounts in millions, except otherwise indicated)
|
|
Note
|
06.30.18
|
06.30.17
|
|
ASSETS
|
|
|
|
|
Non-current
assets
|
|
|
|
|
Investment
properties
|
9
|
163,510
|
100,189
|
|
Property, plant and
equipment
|
10
|
20,646
|
31,150
|
|
Trading
properties
|
11
|
6,020
|
4,534
|
|
Intangible
assets
|
12
|
12,363
|
12,443
|
|
Biological
assets
|
13
|
900
|
671
|
|
Other
assets
|
|
189
|
-
|
|
Investment in
associates and joint ventures
|
8
|
24,747
|
8,227
|
|
Deferred income tax
assets
|
22
|
1,679
|
1,631
|
|
Income tax and MPIT
credits
|
|
453
|
229
|
|
Restricted
assets
|
15
|
2,178
|
528
|
|
Trade and other
receivables
|
16
|
9,129
|
5,456
|
|
Investment in
financial assets
|
15
|
1,704
|
1,772
|
|
Financial assets
held for sale
|
15
|
7,788
|
6,225
|
|
Derivative
financial instruments
|
15
|
30
|
31
|
|
Total
non-current assets
|
|
251,336
|
173,086
|
|
Current
assets
|
|
|
|
|
Trading
properties
|
11
|
3,232
|
1,249
|
|
Biological
assets
|
13
|
913
|
559
|
|
Inventories
|
14
|
2,324
|
5,036
|
|
Restricted
assets
|
15
|
4,248
|
541
|
|
Income tax and
MPIT credits
|
|
400
|
340
|
|
Groups of assets
held for sale
|
34
|
5,192
|
2,681
|
|
Trade and other
receivables
|
16
|
17,208
|
18,336
|
|
Investment in
financial assets
|
15
|
25,646
|
11,853
|
|
Financial assets
held for sale
|
15
|
4,466
|
2,337
|
|
Derivative
financial instruments
|
15
|
155
|
65
|
|
Cash and cash
equivalents
|
15
|
38,650
|
25,363
|
|
Total
current assets
|
|
102,434
|
68,360
|
|
TOTAL
ASSETS
|
|
353,770
|
241,446
|
|
SHAREHOLDERS’
EQUITY
|
|
|
|
|
Shareholders'
equity (according to corresponding statement)
|
|
20,925
|
16,405
|
|
Non-controlling
interest
|
|
54,396
|
32,768
|
|
TOTAL
SHAREHOLDERS' EQUITY
|
|
75,321
|
49,173
|
|
LIABILITIES
|
|
|
|
|
Non-current
liabilities
|
|
|
|
|
Borrowings
|
21
|
187,462
|
112,025
|
|
Deferred income tax
liabilities
|
22
|
26,563
|
23,125
|
|
Trade and other
payables
|
19
|
3,577
|
3,988
|
|
Provisions
|
20
|
3,567
|
955
|
|
Employee
benefits
|
|
110
|
763
|
|
Derivative
financial instruments
|
15
|
40
|
86
|
|
Payroll and social
security
liabilities
|
|
76
|
140
|
|
Total
non-current liabilities
|
|
221,395
|
141,082
|
|
Current
liabilities
|
|
|
|
|
Trade and other
payables
|
19
|
17,892
|
21,970
|
|
Borrowings
|
21
|
32,083
|
23,287
|
|
Provisions
|
20
|
1,059
|
894
|
|
Group of
liabilities held for sale
|
34
|
3,243
|
1,855
|
|
Payroll and social
security
liabilities
|
|
1,868
|
2,254
|
|
Income tax and MPIT
liabilities
|
|
595
|
817
|
|
Derivative
financial instruments
|
15
|
314
|
114
|
|
Total
Current liabilities
|
|
57,054
|
51,191
|
|
TOTAL
LIABILITIES
|
|
278,449
|
192,273
|
|
TOTAL
SHAREHOLDERS' EQUITY AND LIABILITIES
|
|
353,770
|
241,446
|
The
accompanying notes are an integral part of these Consolidated
Financial Statements.
|
C.P.C.E.C.A.B.A. T° 1 F° 17
Dr. Mariano C. Tomatis
Contador Público (UBA)
C.P.C.E.C.A.B.A. T° 241 F° 118
|
|
José Daniel Abelovich
Síndico Titular
Por Comisión Fiscalizadora
|
|
Alejandro
G. Elsztain
Vicepresident
II acting
as
President
|
F-4
Cresud Sociedad Anónima,
Comercial, Inmobiliaria, Financiera y Agropecuaria
Consolidated
Statements of Income and Other Comprehensive Income
for the fiscal years ended June 30, 2018, 2017 and
2016
(All
amounts in millions, except otherwise indicated)
|
|
Note
|
06.30.18
|
06.30.17
|
06.30.16
|
|
Revenues
|
24
|
38,986
|
30,746
|
15,622
|
|
Costs
|
25
|
(24,780
)
|
(19,330
)
|
(9,380
)
|
|
Initial recognition
and changes in the fair value of biological assets and agricultural
products at the point of harvest
|
|
1,042
|
204
|
401
|
|
Changes in the net
realizable value of agricultural products after
harvest
|
|
303
|
(74
)
|
208
|
|
Gross
profit
|
|
15,551
|
11,546
|
6,851
|
|
Net gain from fair
value adjustment of investment properties
|
|
22,629
|
4,888
|
17,516
|
|
Gain from disposal
of farmlands
|
|
906
|
280
|
(2
)
|
|
General and
administrative expenses
|
26
|
(4,414
)
|
(3,628
)
|
(1,950
)
|
|
Selling
expenses
|
26
|
(5,306
)
|
(4,503
)
|
(2,173
)
|
|
Other operating
results, net
|
27
|
1,152
|
(128
)
|
(110
)
|
|
Management
fees
|
|
(554
)
|
(200
)
|
(534
)
|
|
Profit
from operations
|
|
29,964
|
8,255
|
19,598
|
|
Share of (loss) /
profit of associates
and joint
ventures
|
8
|
(603
)
|
96
|
534
|
|
Profit
from operations before financing and taxation
|
|
29,361
|
8,351
|
20,132
|
|
Finance
income
|
28
|
1,998
|
1,055
|
1,450
|
|
Finance
cost
|
28
|
(26,209
)
|
(8,936
)
|
(7,351
)
|
|
Other financial
results
|
28
|
384
|
3,178
|
(145
)
|
|
Financial results,
net
|
28
|
(23,827
)
|
(4,703
)
|
(6,046
)
|
|
Profit
before income tax
|
|
5,534
|
3,648
|
14,086
|
|
Income
tax
|
22
|
(233
)
|
(2,713
)
|
(5,785
)
|
|
Profit
for the year from continuing
operations
|
|
5,301
|
935
|
8,301
|
|
Profit from
discontinued operations
after income
tax
|
35
|
12,479
|
4,093
|
817
|
|
Profit
for the
year
|
|
17,780
|
5,028
|
9,118
|
|
|
|
|
|
|
|
|
|
|
|
|
|
Other comprehensive
income /
(loss):
|
|
|
|
|
|
Items that may be reclassified subsequently to profit or
loss:
|
|
|
|
|
|
Currency
translation adjustment
|
|
12,910
|
3,718
|
(1,715
)
|
|
Share of other
comprehensive income of associates and joint ventures
|
|
3,426
|
354
|
5,100
|
|
Revaluation
surplus
|
|
192
|
|
|
|
Change in the fair
value of hedging instruments net of income taxes
|
|
(19
)
|
124
|
3
|
|
Items that may not be reclassified subsequently to profit or
loss:
|
|
|
|
|
|
Actuarial loss from
defined benefit plans
|
|
(12
)
|
(10
)
|
(10
)
|
|
Other
comprehensive income for the year from continuing
operations
|
|
16,497
|
4,186
|
3,378
|
|
Other comprehensive
income for the year from discontinued operations
|
|
435
|
1,170
|
1,641
|
|
Total
other comprehensive income for the year
|
|
16,932
|
5,356
|
5,019
|
|
Total
comprehensive income for the year
|
|
34,712
|
10,384
|
14,137
|
|
Total comprehensive
income from continuing
operations
|
|
21,798
|
5,121
|
11,679
|
|
Total comprehensive
income from discontinued
operations
|
|
12,914
|
5,263
|
2,458
|
|
Total
comprehensive income for the year
|
|
34,712
|
10,384
|
14,137
|
|
Profit for the year attributable to
:
|
|
|
|
|
|
Equity holders of
the parent
|
|
5,392
|
1,511
|
5,167
|
|
Non-controlling
interest
|
|
12,388
|
3,517
|
3,951
|
|
Profit / (Loss) from continuing operations
attributable to:
|
|
|
|
|
|
Equity holders of
the parent
|
|
(772
)
|
461
|
4,951
|
|
Non-controlling
interest
|
|
6,073
|
474
|
3,350
|
|
Total comprehensive income attributable to:
|
|
|
|
|
|
Equity holders of
the parent
|
|
7,308
|
2,603
|
5,715
|
|
Non-controlling
interest
|
|
27,404
|
7,781
|
8,422
|
|
Total
comprehensive income / (loss)
from continuing operations attributable to:
|
|
|
|
|
|
Equity
holders of the parent
|
|
(926
)
|
(753
)
|
3,257
|
|
Non-controlling
interest
|
|
22,724
|
5,874
|
8,422
|
|
Profit per share attributable to equity holders of the
parent:
|
|
|
|
|
|
Basic
|
|
10.86
|
3.04
|
10.44
|
|
Diluted
|
|
10.44
|
3.02
|
10.30
|
|
Profit per share from continuing operations attributable to equity
holders of the parent
:
|
|
|
|
|
|
Basic
|
|
(1.55
)
|
0.93
|
10.00
|
|
Diluted
|
|
(1.50
)
|
0.92
|
9.87
|
The
accompanying notes are an integral part of these Consolidated
Financial Statements.
|
C.P.C.E.C.A.B.A. T° 1 F° 17
Dr. Mariano C. Tomatis
Contador Público (UBA)
C.P.C.E.C.A.B.A. T° 241 F° 118
|
|
José Daniel Abelovich
Síndico Titular
Por Comisión Fiscalizadora
|
|
Alejandro
G. Elsztain
Vicepresident
II acting
as
President
|
F-5
Cresud Sociedad Anónima,
Comercial, Inmobiliaria, Financiera y Agropecuaria
Consolidated Statements of Changes in Shareholders’
Equity
for the fiscal years ended June 30, 2018, 2017 and
2016
(All
amounts in millions, except otherwise indicated)
|
|
Attributable
to equity holders of the parent
|
|
|
|||||||||
|
|
Share
capital
|
Treasury
shares
|
Inflation
adjustment of share capital and treasury shares (i)
|
Share
premium
|
Additional
paid-in capital from treasury shares
|
Legal
reserve
|
CNV
609/12 Resolution special reserve (ii)
|
Other
reserves (iii)
|
Retained
earnings
|
Subtotal
|
Non-controlling
interest
|
Total
Shareholders' equity
|
|
Balance
as of June 30, 2017
|
499
|
3
|
65
|
659
|
20
|
83
|
1,516
|
2,496
|
11,064
|
16,405
|
32,768
|
49,173
|
|
Profit for the
year
|
-
|
-
|
-
|
-
|
-
|
-
|
-
|
-
|
5,392
|
5,392
|
12,388
|
17,780
|
|
Other comprehensive
income for the
year
|
-
|
-
|
-
|
-
|
-
|
-
|
-
|
1,916
|
-
|
1,916
|
15,016
|
16,932
|
|
Total
comprehensive income for the year
|
-
|
-
|
-
|
-
|
-
|
-
|
-
|
1,916
|
5,392
|
7,308
|
27,404
|
34,712
|
|
As
resolved by Ordinary and Extraordinary Shareholders' Meeting held
on October 31, 2017:
|
|
|
|
|
|
|
|
|
|
|
|
|
|
- Legal
reserve
|
-
|
-
|
-
|
-
|
-
|
30
|
-
|
-
|
(30
)
|
-
|
-
|
-
|
|
- Cash dividends
distribution
|
-
|
-
|
-
|
-
|
-
|
-
|
-
|
-
|
(395
)
|
(395
)
|
-
|
(395
)
|
|
- Reserve for new
projects
|
-
|
-
|
-
|
-
|
-
|
-
|
-
|
1,371
|
(1,371
)
|
-
|
-
|
-
|
|
Acquisition of
treasury shares
|
(17
)
|
17
|
-
|
-
|
-
|
-
|
-
|
(763
)
|
-
|
(763
)
|
1
|
(762
)
|
|
Changes of interest
in subsidiaries
|
-
|
-
|
-
|
-
|
-
|
-
|
-
|
(1,693
)
|
-
|
(1,693
)
|
9
|
(1,684
)
|
|
Share of changes in
subsidiaries’ equity
|
-
|
-
|
-
|
-
|
-
|
-
|
-
|
-
|
55
|
55
|
-
|
55
|
|
Reserve for
share-based payments
|
-
|
-
|
-
|
-
|
-
|
-
|
-
|
7
|
-
|
7
|
45
|
52
|
|
Equity incentive
plan granted
|
-
|
-
|
-
|
-
|
1
|
-
|
-
|
-
|
-
|
1
|
-
|
1
|
|
Loss of control in
subsidiary
|
-
|
-
|
-
|
-
|
-
|
-
|
-
|
-
|
-
|
-
|
(7,331
)
|
(7,331
)
|
|
Changes
in non-controlling
interest
|
-
|
-
|
-
|
-
|
-
|
-
|
-
|
-
|
-
|
-
|
3,623
|
3,623
|
|
Dividends
distribution to non-controlling interest
|
-
|
-
|
-
|
-
|
-
|
-
|
-
|
-
|
-
|
-
|
(2,135
)
|
(2,135
)
|
|
Capitalized
contributions
|
-
|
-
|
-
|
-
|
-
|
-
|
-
|
-
|
-
|
-
|
7
|
7
|
|
Issuance
of capital
|
-
|
-
|
-
|
-
|
-
|
-
|
-
|
-
|
-
|
-
|
4
|
4
|
|
Irrevocable
contributions
|
-
|
-
|
-
|
-
|
-
|
-
|
-
|
-
|
-
|
-
|
1
|
1
|
|
Balance
as of
June 30,
2018
|
482
|
20
|
65
|
659
|
21
|
113
|
1,516
|
3,334
|
14,715
|
20,925
|
54,396
|
75,321
|
(i) Includes Ps. 1
and Ps. 1 of inflation adjustment of Treasury shares as of June 30,
2018 and 2017, respectively.
(ii) Related to CNV
General Resolution N° 609/12. See Note 18.
(iii) Group’s
other reserves for the year ended June 30, 2018 were as
follows:
|
|
Cost
of treasury shares
|
Changes
in non-controlling interest
|
Currency
translation adjustment reserve
|
Reserve
for shared-based payments
|
Reserve
for new projects
|
Reserve
for defined benefit plans
|
Hedging
instruments
|
Reserve
for the acquisition of securities issued by the
Company
|
Revaluation
surplus
|
Other
reserves from subsidiaries
|
Total
other reserves
|
|
Balance
as of June 30, 2017
|
(24
)
|
243
|
2,123
|
103
|
-
|
(10
)
|
11
|
25
|
-
|
25
|
2,496
|
|
Other comprehensive
income / (loss
) for the
year
|
-
|
-
|
1,882
|
-
|
-
|
(38
)
|
(52
)
|
-
|
93
|
31
|
1,916
|
|
Total
comprehensive income / (loss)
for the
year
|
-
|
-
|
1,882
|
-
|
-
|
(38
)
|
(52
)
|
-
|
93
|
31
|
1,916
|
|
As
resolved by Ordinary and Extraordinary Shareholders' Meeting held
on October 31, 2017
|
|
|
|
|
|
|
|
|
|
|
|
|
- Reserve for new
projects
|
-
|
-
|
-
|
-
|
1,371
|
-
|
-
|
-
|
-
|
-
|
1,371
|
|
Acquisition of
treasury shares
|
(763
)
|
-
|
-
|
-
|
-
|
-
|
-
|
-
|
-
|
-
|
(763
)
|
|
Changes in interest
in subsidiaries
|
-
|
(1,693
)
|
-
|
-
|
-
|
-
|
-
|
-
|
-
|
-
|
(1,693
)
|
|
Reserve for
share-based payments
|
-
|
-
|
-
|
7
|
-
|
-
|
-
|
-
|
-
|
-
|
7
|
|
Equity incentive
plan granted
|
2
|
-
|
-
|
(2
)
|
-
|
-
|
-
|
-
|
-
|
-
|
-
|
|
Balance
as of June 30, 2018
|
(785
)
|
(1,450
)
|
4,005
|
108
|
1,371
|
(48
)
|
(41
)
|
25
|
93
|
56
|
3,334
|
The
accompanying notes are an integral part of these Consolidated
Financial Statements.
|
C.P.C.E.C.A.B.A. T° 1 F° 17
Dr. Mariano C. Tomatis
Contador Público (UBA)
C.P.C.E.C.A.B.A. T° 241 F° 118
|
|
José Daniel Abelovich
Síndico Titular
Por Comisión Fiscalizadora
|
|
Alejandro
G. Elsztain
Vicepresident
II acting
as
President
|
F-6
Cresud Sociedad Anónima,
Comercial, Inmobiliaria, Financiera y Agropecuaria
Consolidated
Statements of Changes in Shareholders’ Equity
for the fiscal years ended June 30, 2018, 2017 and
2016
(All
amounts in millions, except otherwise indicated)
|
|
Attributable to equity holders of the parent
|
|
|
|||||||||
|
|
Share capital
|
Treasury shares
|
Inflation adjustment of share capital and treasury shares
(i)
|
Share premium
|
Additional paid-in capital from treasury shares
|
Legal reserve
|
CNV 609/12 Resolution special
reserve
(ii)
|
Other reserves (iii)
|
Retained earnings
|
Subtotal
|
Non-controlling interest
|
Total Shareholders' equity
|
|
Balance as of June 30, 2016
|
495
|
7
|
65
|
659
|
16
|
83
|
1,516
|
1,299
|
9,521
|
13,661
|
23,539
|
37,200
|
|
Profit
for the year
|
-
|
-
|
-
|
-
|
-
|
-
|
-
|
-
|
1,511
|
1,511
|
3,517
|
5,028
|
|
Other
comprehensive income for the year
|
-
|
-
|
-
|
-
|
-
|
-
|
-
|
1,092
|
-
|
1,092
|
4,264
|
5,356
|
|
Total comprehensive income for the year
|
-
|
-
|
-
|
-
|
-
|
-
|
-
|
1,092
|
1,511
|
2,603
|
7,781
|
10,384
|
|
As resolved by Ordinary Shareholders' Meetings held on October 31
and November 26, 2016:
|
|
|
|
|
|
|
|
|
|
|
|
|
|
-
Share distribution
|
4
|
(4
)
|
-
|
-
|
3
|
-
|
-
|
-
|
(4
)
|
(1
)
|
-
|
(1
)
|
|
Incorporation
by business combination
|
-
|
-
|
-
|
-
|
-
|
-
|
-
|
-
|
-
|
-
|
40
|
40
|
|
Reserve
for share-based payments
|
-
|
-
|
-
|
-
|
-
|
-
|
-
|
13
|
-
|
13
|
99
|
112
|
|
Equity
incentive plan granted
|
-
|
-
|
-
|
-
|
1
|
-
|
-
|
(4
)
|
5
|
2
|
-
|
2
|
|
Changes
in non-controlling interest
|
-
|
-
|
-
|
-
|
-
|
-
|
-
|
127
|
-
|
127
|
1,454
|
1,581
|
|
Acquisition
of subsidiaries
|
-
|
-
|
-
|
-
|
-
|
-
|
-
|
-
|
-
|
-
|
60
|
60
|
|
Other
comprehensive income from subsidiaries
|
-
|
-
|
-
|
-
|
-
|
-
|
-
|
-
|
-
|
-
|
11
|
11
|
|
Reclassifications
of previous periods
|
-
|
-
|
-
|
-
|
-
|
-
|
-
|
-
|
-
|
-
|
(133
)
|
(133
)
|
|
Release
of reserve for future dividends
|
-
|
-
|
-
|
-
|
-
|
-
|
-
|
(31
)
|
31
|
-
|
-
|
-
|
|
Dividends
distribution to non-controlling interest
|
-
|
-
|
-
|
-
|
-
|
-
|
-
|
-
|
-
|
-
|
(2,345
)
|
(2,345
)
|
|
Issuance
of capital
|
-
|
-
|
-
|
-
|
-
|
-
|
-
|
-
|
-
|
-
|
2,267
|
2,267
|
|
Capital
reduction
|
-
|
-
|
-
|
-
|
-
|
-
|
-
|
-
|
-
|
-
|
(6
)
|
(6
)
|
|
Contributions
from non-controlling interest
|
-
|
-
|
-
|
-
|
-
|
-
|
-
|
-
|
-
|
-
|
2
|
2
|
|
Capitalization
of non-controlling interest
|
-
|
-
|
-
|
-
|
-
|
-
|
-
|
-
|
-
|
-
|
(1
)
|
(1
)
|
|
Balance as of June 30, 2017
|
499
|
3
|
65
|
659
|
20
|
83
|
1,516
|
2,496
|
11,064
|
16,405
|
32,768
|
49,173
|
(i) Includes Ps. 1
and Ps. 1 of inflation adjustment of Treasury shares as of June 30,
2017 and 2016, respectively.
(ii) Related to CNV
General Resolution N° 609/12. See Note 18.
(iii) Group’s
other reserves for the year ended June 30, 2017 were as
follows:
|
|
Cost of treasury shares
|
Changes in non-controlling interest
|
Currency translation adjustment reserve
|
Reserve for shared-based payments
|
Reserve for future dividends
|
Reserve for defined benefit plans
|
Hedging instruments
|
Reserve for the acquisition of securities issued by the
Company
|
Other reserves from subsidiaries
|
Total other reserves
|
|
Balance as of June 30, 2016
|
(32
)
|
118
|
1,040
|
95
|
31
|
(6
)
|
(24
)
|
32
|
45
|
1,299
|
|
Other
comprehensive income / (loss) for the year
|
-
|
-
|
1,083
|
-
|
-
|
(4
)
|
35
|
-
|
(22
)
|
1,092
|
|
Total comprehensive income / (loss) for the year
|
-
|
-
|
1,083
|
-
|
-
|
(4
)
|
35
|
-
|
(22
)
|
1,092
|
|
As resolved by Ordinary Shareholders' Meetings held on October 31
and November 26, 2016:
|
|
|
|
|
|
|
|
|
|
|
|
-
Share distribution
|
7
|
-
|
-
|
-
|
-
|
-
|
-
|
(7
)
|
-
|
-
|
|
Reserve
for share-based payments
|
-
|
-
|
-
|
13
|
-
|
-
|
-
|
-
|
-
|
13
|
|
Equity
incentive plan granted
|
1
|
-
|
-
|
(5
)
|
-
|
-
|
-
|
-
|
-
|
(4
)
|
|
Changes
in non-controlling interest
|
-
|
125
|
-
|
-
|
-
|
-
|
-
|
-
|
2
|
127
|
|
Release
of reserve for future dividends
|
-
|
-
|
-
|
-
|
(31
)
|
-
|
-
|
-
|
-
|
(31
)
|
|
Balance as of June 30, 2017
|
(24
)
|
243
|
2,123
|
103
|
-
|
(10
)
|
11
|
25
|
25
|
2,496
|
The
accompanying notes are an integral part of these Consolidated
Financial Statements.
|
C.P.C.E.C.A.B.A. T° 1 F° 17
Dr. Mariano C. Tomatis
Contador Público (UBA)
C.P.C.E.C.A.B.A. T° 241 F° 118
|
|
José Daniel Abelovich
Síndico Titular
Por Comisión Fiscalizadora
|
|
Alejandro
G. Elsztain
Vicepresident
II acting
as
President
|
F-7
Cresud Sociedad Anónima,
Comercial, Inmobiliaria, Financiera y Agropecuaria
Consolidated
Statements of Changes in Shareholders’ Equity
for the fiscal years ended June 30, 2018, 2017 and
2016
(All
amounts in millions, except otherwise indicated)
|
|
Attributable to equity holders of the
parent
|
|
|
|||||||||
|
|
Share capital
|
Treasury shares
|
Inflation adjustment of share capital and treasury shares
(i)
|
Share premium
|
Additional paid-in capital from treasury shares
|
Legal reserve
|
CNV 609/12 Resolution special reserve (ii)
|
Other reserves (iii)
|
Retained earnings
|
Subtotal
|
Non-controlling interest
|
Total Shareholders' equity
|
|
Balance as of June 30, 2015
|
495
|
7
|
65
|
659
|
13
|
-
|
1,516
|
812
|
4,461
|
8,028
|
6,528
|
14,556
|
|
Profit
for the year
|
-
|
-
|
-
|
-
|
-
|
-
|
-
|
-
|
5,167
|
5,167
|
3,951
|
9,118
|
|
Other
comprehensive income for the year
|
-
|
-
|
-
|
-
|
-
|
-
|
-
|
548
|
-
|
548
|
4,471
|
5,019
|
|
Total comprehensive income for the year
|
-
|
-
|
-
|
-
|
-
|
-
|
-
|
548
|
5,167
|
5,715
|
8,422
|
14,137
|
|
As resolved by Ordinary Shareholders' Meeting held on October 30
and November 26, 2015:
|
|
|
|
|
|
|
|
|
|
|
|
|
|
-
Legal Reserve
|
-
|
-
|
-
|
-
|
-
|
83
|
-
|
-
|
-83
|
-
|
-
|
-
|
|
-
Reserve for future dividends
|
-
|
-
|
-
|
-
|
-
|
-
|
-
|
31
|
-31
|
-
|
-
|
-
|
|
-
Special Reserve
|
-
|
-
|
-
|
-
|
-
|
-
|
-
|
-
|
-
|
-
|
28
|
28
|
|
-
Other reserves
|
-
|
-
|
-
|
-
|
-
|
-
|
-
|
-
|
-
|
-
|
25
|
25
|
|
-
Cash dividends
|
-
|
-
|
-
|
-
|
-
|
-
|
-
|
-
|
-
|
-
|
(75
)
|
(75
)
|
|
Incorporation
for business combination
|
-
|
-
|
-
|
-
|
-
|
-
|
-
|
-
|
-
|
-
|
8,630
|
8,630
|
|
Reserve
for share-based payments
|
-
|
-
|
-
|
-
|
-
|
-
|
-
|
17
|
-
|
17
|
39
|
56
|
|
Equity
incentive plan granted
|
-
|
-
|
-
|
-
|
3
|
-
|
-
|
(4
)
|
1
|
-
|
-
|
-
|
|
Changes
in non- controlling interest
|
-
|
-
|
-
|
-
|
-
|
-
|
-
|
(92
)
|
-
|
(92
)
|
513
|
421
|
|
Cumulative
translation adjustment of interest held before business
combination
|
-
|
-
|
-
|
-
|
-
|
-
|
-
|
(58
)
|
-
|
(58
)
|
(33
)
|
(91
)
|
|
Acquisition
of subsidiaries
|
-
|
-
|
-
|
-
|
-
|
-
|
-
|
-
|
-
|
-
|
36
|
36
|
|
Capital
reduction
|
-
|
-
|
-
|
-
|
-
|
-
|
-
|
-
|
-
|
-
|
(4
)
|
(4
)
|
|
Share
of changes in subsidiaries’ equity
|
-
|
-
|
-
|
-
|
-
|
-
|
-
|
45
|
-
|
45
|
51
|
|
|
Other
comprehensive income
|
-
|
-
|
-
|
-
|
-
|
-
|
-
|
-
|
-
|
-
|
(17
)
|
(17
)
|
|
Dividends
distribution to non-controlling interest
|
-
|
-
|
-
|
-
|
-
|
-
|
-
|
-
|
-
|
-
|
(615
)
|
(615
)
|
|
Reimbursement
of expired dividends
|
-
|
-
|
-
|
-
|
-
|
-
|
-
|
-
|
6
|
6
|
-
|
6
|
|
Contribution
from non-controlling interest
|
-
|
-
|
-
|
-
|
-
|
-
|
-
|
-
|
-
|
-
|
11
|
11
|
|
Balance as of June 30, 2016
|
495
|
7
|
65
|
659
|
16
|
83
|
1,516
|
1,299
|
9,521
|
13,661
|
23,539
|
37,200
|
(i) Includes Ps. 1
and Ps. 1 of inflation adjustment of Treasury shares as of June 30,
2016 and 2015, respectively.
(ii) Related to CNV
General Resolution N° 609/12. See Note 18.
(iii) Group’s
other reserves for the year ended June 30, 2016 were as
follows:
|
|
Cost of treasury shares
|
Changes in non-controlling interest
|
Currency translation adjustment reserve
|
Reserve for shared-based payments
|
Reserve for future dividends
|
Reserve for defined benefit plans
|
Hedging instruments
|
Reserve for the acquisition of securities issued by the
Company
|
Other reserves from subsidiaries
|
Total other reserves
|
|
Balance as of June 30, 2015
|
(32
)
|
210
|
520
|
82
|
-
|
-
|
-
|
32
|
-
|
812
|
|
Other
comprehensive income / (loss) for the year
|
-
|
-
|
578
|
-
|
-
|
(6
)
|
(24
)
|
-
|
-
|
548
|
|
Total comprehensive income / (loss) for the year
|
-
|
-
|
578
|
-
|
-
|
(6
)
|
(24
)
|
-
|
-
|
548
|
|
As resolved by Ordinary Shareholders' Meeting held on October 30
and November 26, 2015:
|
|
|
|
|
|
|
|
|
|
|
|
-
Reserve for future dividends
|
-
|
-
|
-
|
-
|
31
|
-
|
-
|
-
|
-
|
31
|
|
Reserve
for share-based payments
|
-
|
-
|
-
|
17
|
-
|
-
|
-
|
-
|
-
|
17
|
|
Equity
incentive plan granted
|
-
|
-
|
-
|
(4
)
|
-
|
-
|
-
|
-
|
-
|
(4
)
|
|
Changes
in non-controlling interest
|
-
|
(92
)
|
-
|
-
|
-
|
-
|
-
|
-
|
-
|
(92
)
|
|
Currency
translation adjustment for interest held before business
combination
|
-
|
-
|
(58
)
|
-
|
-
|
-
|
-
|
-
|
-
|
(58
)
|
|
Share
of changes in subsidiaries' equity
|
-
|
-
|
-
|
-
|
-
|
-
|
-
|
-
|
45
|
45
|
|
Balance as of June 30, 2016
|
(32
)
|
118
|
1,040
|
95
|
31
|
(6
)
|
(24
)
|
32
|
45
|
1,299
|
The
accompanying notes are an integral part of these Consolidated
Financial Statements.
|
C.P.C.E.C.A.B.A. T° 1 F° 17
Dr. Mariano C. Tomatis
Contador Público (UBA)
C.P.C.E.C.A.B.A. T° 241 F° 118
|
|
José Daniel Abelovich
Síndico Titular
Por Comisión Fiscalizadora
|
|
Alejandro
G. Elsztain
Vicepresident
II acting
as
President
|
F-8
Cresud Sociedad Anónima,
Comercial, Inmobiliaria, Financiera y Agropecuaria
for the fiscal years ended June 30, 2018, 2017 and
2016
(All
amounts in millions, except otherwise indicated)
|
|
Note
|
06.30.18
|
06.30.17
|
06.30.16
|
|
Operating
activities:
|
|
|
|
|
|
Cash generated from
continuing operating activities before income tax
|
17
|
10,613
|
6,930
|
4,115
|
|
Income tax
paid
|
|
(982
)
|
(958
)
|
(785
)
|
|
Net
cash generated from continuing operating activities
|
|
9,631
|
5,972
|
3,330
|
|
Net
cash generated from discontinued operating activities
|
|
4,144
|
3,280
|
889
|
|
Net
cash generated from operating activities
|
|
13,775
|
9,252
|
4,219
|
|
Investing
activities:
|
|
|
|
|
|
Increase of
interest in associates and joint ventures
|
|
(234
)
|
(538
)
|
(207
)
|
|
Payment for
acquisition of subsidiary, net of
cash
acquired
|
|
(46
)
|
(46
)
|
9,193
|
|
Proceeds from sales
of interest in associates and joint ventures
|
|
305
|
-
|
9
|
|
Acquisition,
improvements and advanced payments for developments of investment
properties
|
|
(3,200
)
|
(2,752
)
|
(882
)
|
|
Proceeds from sales
of investment properties
|
|
674
|
291
|
1,326
|
|
Acquisitions and
improvements of property, plant and equipment
|
|
(2,436
)
|
(2,315
)
|
(591
)
|
|
Advanced
payments
|
|
(4
)
|
(6
)
|
(7
)
|
|
Advanced proceeds
from
sales of
farmlands
|
|
76
|
-
|
-
|
|
Proceeds from sales
of property, plant and equipment
|
|
18
|
9
|
3
|
|
Proceeds from sales
of farmlands
|
|
129
|
209
|
-
|
|
Proceeds from
liquidation of associate
|
|
7
|
-
|
-
|
|
Acquisition of
intangible assets
|
|
(634
)
|
(376
)
|
(89
)
|
|
Acquisition of
investments in financial instruments
|
|
(27,128
)
|
(6,287
)
|
(13,507
)
|
|
Proceeds from
disposal of investments in financial
assets
|
|
26,057
|
6,785
|
14,113
|
|
Increase in
restricted assets, net
|
|
(3,032
)
|
(396
)
|
-
|
|
Loans granted to
related
parties
|
|
(397
)
|
(7
)
|
(862
)
|
|
Loans
granted
|
|
(102
)
|
-
|
-
|
|
Loans repayments
received
|
|
612
|
-
|
-
|
|
Loans repayments
received from related parties
|
|
-
|
-
|
80
|
|
Payment for the
acquisition of
other
assets
|
|
(120
)
|
-
|
-
|
|
Dividends received
from associates and joint ventures
|
|
313
|
230
|
16
|
|
Dividends received
from financial assets
|
|
289
|
35
|
72
|
|
Net
cash (used in) / generated from continuing investing
activities
|
|
(8,853
)
|
(5,164
)
|
8,667
|
|
Net
cash (used in) / generated from discontinued investing
activities
|
|
(3,119
)
|
2,749
|
(27
)
|
|
Net
cash (used in) / generated from investing activities
|
|
(11,972
)
|
(2,415
)
|
8,640
|
|
Financing
activities:
|
|
|
|
|
|
Repurchase of
non-convertible notes
|
|
(379
)
|
(546
)
|
(209
)
|
|
Repurchase of
treasury shares
|
|
(763
)
|
-
|
-
|
|
Issuance of capital
from subsidiaries
|
|
-
|
857
|
-
|
|
Proceeds from
borrowings
|
|
25,027
|
29,353
|
147,427
|
|
Repayment of
borrowings
|
|
(22,912
)
|
(19,098
)
|
(145,854
)
|
|
Obtention /
(payment) of short term loans, net
|
|
732
|
(1,019
)
|
209
|
|
Payment of
borrowings to related parties
|
|
-
|
(14
)
|
(6
)
|
|
Obtention of loans
from related parties
|
|
62
|
-
|
4
|
|
Proceeds from
exercise of options granted
|
|
-
|
-
|
6
|
|
Payment of seller
financing
|
|
(89
)
|
-
|
(72
)
|
|
Capital
contributions of non-controlling
interest in subsidiaries
|
|
1,347
|
202
|
1
|
|
Acquisition of
non-controlling interest in subsidiaries
|
|
(615
)
|
(196
)
|
(947
)
|
|
Capital
distribution to non-controlling interest in
subsidiaries
|
|
(31
)
|
73
|
(184
)
|
|
Dividends
paid
|
|
(940
)
|
(2,135
)
|
(239
)
|
|
Proceeds from
derivative financial instruments,
net
|
|
(10
)
|
150
|
1,323
|
|
Payment of
derivative financial instruments
|
|
-
|
(131
)
|
-
|
|
Dividends paid to
non-controlling interest in subsidiaries
|
|
(1,259
)
|
-
|
-
|
|
Proceeds from sales
of non-controlling interest in subsidiaries
|
|
2,507
|
2,528
|
86
|
|
Receipts from
claims
|
|
-
|
-
|
90
|
|
Interest
paid
|
|
(7,234
)
|
(5,522
)
|
(3,173
)
|
|
Net
cash (used in) / generated from continuing financing
activities
|
|
(4,557
)
|
4,502
|
(1,538
)
|
|
Net
cash generated from / (used in) discontinued financing
activities
|
|
2,258
|
(2,603
)
|
(3,109
)
|
|
Net
cash (used in) / generated from financing
activities
|
|
(2,299
)
|
1,899
|
(4,647
)
|
|
Net
(decrease) / increase in cash and cash
equivalents from continuing
activities
|
|
(3,779
)
|
5,310
|
10,459
|
|
Net
increase / (decrease) in cash and cash
equivalents from discontinued
activities
|
|
3,283
|
3,426
|
(2,247
)
|
|
Net
(decrease) / increase in cash and
cash
equivalents
|
|
(496
)
|
8,736
|
8,212
|
|
Cash and cash
equivalents at beginning of the period
|
15
|
25,363
|
14,096
|
634
|
|
Cash and cash
equivalents reclassified to held for sale
|
|
(347
)
|
(157
)
|
-
|
|
Foreign exchange
gain on cash and changes in fair value of cash
equivalents
|
|
14,130
|
2,688
|
5,250
|
|
Cash
and cash equivalents at the end of the
period
|
|
38,650
|
25,363
|
14,096
|
The
accompanying notes are an integral part of these Consolidated
Financial Statements.
|
C.P.C.E.C.A.B.A. T° 1 F° 17
Dr. Mariano C. Tomatis
Contador Público (UBA)
C.P.C.E.C.A.B.A. T° 241 F° 118
|
|
José Daniel Abelovich
Síndico Titular
Por Comisión Fiscalizadora
|
|
Alejandro
G. Elsztain
Vicepresident
II acting
as
President
|
F-9
Cresud Sociedad Anónima,
Comercial, Inmobiliaria, Financiera y Agropecuaria
Notes to Consolidated Financial Statements
(Amounts in
millions, except otherwise indicated)
1.
The
Group’s business and general information
Cresud
was founded in 1936 as a subsidiary of Credit Foncier, a Belgian
company primarily engaged in providing rural and urban loans in
Argentina and administering real estate holdings foreclosed by
Credit Foncier. Credit Foncier was liquidated in 1959, and as part
of such liquidation, the shares of Cresud were distributed to
Credit Foncier’s shareholders. From the 1960s through the end
of the 1970s, the business of Cresud shifted exclusively to
agricultural activities.
In
2002, Cresud acquired a 19.85% interest in IRSA, a real estate
company related to certain shareholders of Cresud. In 2009, Cresud
increased its ownership percentage in IRSA to 55.64% and IRSA
became Cresud’s direct principal subsidiary.
Cresud
and its subsidiaries are collectively referred to hereinafter as
the Group.
Main
shareholders of the Company are jointly Inversiones Financieras del
Sur S.A. and Agroinvestment S.A. Both entities are companies
incorporated in Uruguay and belong to the same controlling group
and ultimate beneficiary.
The
Board of Directors has approved these Financial Statements for
issuance on September 6, 2018.
As of
June 30, 2018, the Group operates in two major lines of business:
(i) agricultural business and (ii) urban properties and investments
business, which is divided into two operations centers: (a)
Operations Center in Argentina and (b) Operations Center in Israel.
They are developed through several operating companies and the main
ones are listed below (Note 7):
(i)
Corresponds to
Group’s associates, which are hence excluded from
consolidation.
(ii)
The results are
included in discontinued operations, due to the loss of control in
June 2018 (see Note 4.(l)).
(iii)
Disclosed as
financial assets held for sale.
(iv)
Assets and
liabilities are disclosed as held for sale and the results as
discontinued operations.
(v)
See Note 4 for more
information about the change within the Operations Center in
Israel.
F-10
Cresud Sociedad Anónima,
Comercial, Inmobiliaria, Financiera y Agropecuaria
Agricultural Business
Within
the agricultural business, the Group, through Cresud, engaged in
the operation of crop production, cattle feeding, raising,
fattening and slaughtering, milk production, sugarcane production,
brokerage activities and sale of supplies. The Group currently has
agricultural operations and investments in Argentina, Brazil,
Uruguay, Paraguay and Bolivia.
Cresud's shares are
listed on the Buenos Aires Stock Exchange ("BCBA", as per its
Spanish acronym) (Merval: CRES) and in NASDAQ (National Association
of Securities Dealers Automated Quotation) (NASDAQ: CRESY). The
shares of our subsidiary Brasilagro are listed and traded on both
the Novo Mercado del BOVESPA (BOVESPA: AGRO3) and the NYSE (NYSE:
LND).
Urban Properties and Investments Business
Operations
Center in Argentina
The
activities of the Operations Center in Argentina are mainly
developed through IRSA and its principal subsidiary, IRSA CP.
Through IRSA and IRSA CP, the Group owns, manages and develops 16
shopping malls across Argentina, a portfolio of offices and other
rental properties in the Autonomous City of Buenos Aires, and it
entered the United States of America (“USA”) real
estate market in 2009, mainly through the acquisition of
non-controlling interests in office buildings and hotels. Through
IRSA or IRSA CP, the Group also develops residential properties for
sale. The Group, through IRSA, is also involved in the operation of
branded hotels. The Group uses the term “real estate”
indistinctively in these Consolidated Financial Statements to
denote investment, development and/or trading properties
activities. IRSA CP's shares are listed and traded on both the BASE
(BYMA: IRCP) and the NASDAQ (NASDAQ: IRCP). IRSA's shares are
listed on the BASE (Merval: IRSA) and the NYSE (NYSE:
IRSA).
The
activities of the Group’s “Others” segment is
carried out mainly through BHSA, where IRSA holds, directly or
indirectly, a 29.91% interest (considering treasury shares). BHSA
is a commercial bank offering a wide variety of banking activities
and related financial services to individuals, small and
medium-sized companies and large corporations, including the
provision of mortgaged loans. BHSA's shares are listed on the BASE
(BYMA: BHIP). Besides that, the Group has a 43.93% indirect
interest in Tarshop, whose main activities are credit card and loan
origination transactions.
Operations
Center in Israel
The
activities of the Operations Center in Israel are mainly developed
through the subsidiaries, IDBD and DIC, whose activities correspond
to one of the Israeli largest and most diversified conglomerates,
which are involved, through its subsidiaries and other investments,
in several markets and industries, including real estate,
supermarkets, insurance, telecommunications, etc.; controlling or
holding an equity interest in companies such as Clal (Insurance),
Cellcom (Telecommunications), Shufersal (Supermarkets), PBC (Real
Estate), among others. IDBD is listed in the TASE as a
“Debentures Company” in accordance with Israeli law,
since some series of bonds are traded in that
Exchange.
It
should be noted that the financial position of IDBD, DIC and its
subsidiaries at the Operations Center in Israel does not affect the
financial position of IRSA and subsidiaries at the Operations
Center in Argentina.
In
addition, the commitments and other covenants resulting from IDBD
and DIC’s financial debt do not have impact on IRSA since
such indebtedness has no recourse against IRSA and it is not
guaranteed by IRSA’s assets.
2.
Summary of significant accounting
policies
2.1.
Basis of preparation of the Consolidated Financial
Statement
(a)
Basis
of preparation
These
Consolidated Financial Statements have been prepared in accordance
with IFRS issued by IASB and interpretations issued by the IFRIC.
All IFRS applicable as of the date of these Consolidated Financial
Statements have been applied.
F-11
Cresud Sociedad Anónima,
Comercial, Inmobiliaria, Financiera y Agropecuaria
IAS 29
"Financial Reporting in Hyperinflationary Economies" requires that
the financial statements of an entity whose functional currency is
one of a hyperinflationary economy be expressed in terms of the
current unit of measurement at the closing date of the reporting
period, regardless of whether they are based on the historical cost
method or the current cost method. To do so, in general terms, the
inflation produced from the date of acquisition or from the
revaluation date, as applicable, must be calculated in the
non-monetary items. This requirement also compromises the
comparative information of the financial statements.
In
order to conclude on whether an economy is categorized as
hyperinflationary in the terms of IAS 29, the standard details a
series of factors to be considered, including the existence of a
cumulative inflation rate in three years that approximates or
exceed 100%. Bearing in mind that the downward trend in inflation
observed in the previous year has reversed, noticing a significant
increase in inflation during 2018, that it is also expected that
the accumulated inflation rate of the last three years will exceed
100% and that the rest of the indicators do not contradict the
conclusion that Argentina should be considered a hyperinflationary
economy for accounting purposes, the Management understands that
there is sufficient evidence to conclude that Argentina is a
hyperinflationary economy in the terms of IAS 29, starting with the
year initiated on July 1, 2018. Consequently, the Company should
restate its next financial statements to be presented after the
aforementioned date. However, it must be taken into account that,
as of the date of issuance of these financial statements, PEN
664/03 Decree is in force, which does not allow the presentation of
restated for inflation financial statements before the National
Securities Commission (CNV) and other bodies of corporate
control.
In an
inflationary period, any entity that maintains an excess of
monetary assets over monetary liabilities, will lose purchasing
power, and any entity that maintains an excess of monetary
liabilities over monetary assets, will gain purchasing power,
provided that such items are not subject to an adjustment
mechanism.
Briefly, the
restatement method of IAS 29 establishes that monetary assets and
liabilities must not be restated since they are already expressed
in the current unit of measurement at the end of the reporting
period. Assets and liabilities subject to adjustments based on
specific agreements must be adjusted in accordance with such
agreements. The non-monetary items measured at their current values
at the end of the reporting period, such as the net realization
value or others, do not need to be restated. The remaining
non-monetary assets and liabilities must be restated by a general
price index. The loss or gain from the net monetary position will
be included in the net result of the reporting year / period,
revealing this information in a separate line item.
As of
June 30, 2018, the restatement criteria of financial information
established in IAS 29 have not been applied. However, in recent
years’ certain macroeconomic variables that affect the
Company's businesses, such as wages and prices of inputs, have
undergone annual variations of certain importance. This
circumstance must be considered in the evaluation and
interpretation of the financial situation and the results presented
by the Company in these financial statements.
IDBD
and DIC, Group’s subsidiaries, report their quarterly and
annual results following the Israeli regulations, whose legal
deadlines are after the deadlines in Argentina and since IDBD and
DIC fiscal years end differently from IRSA, the results of
operations from IDBD and DIC are consolidated with a lag of three
months adjusted for the effects of significant transactions taking
place in such period. For these reasons, it is possible to obtain
the quarterly results of IDBD and DIC in time so that they can be
consolidated by IRSA and reported to the CNV in its consolidated
financial statements within the legal deadlines set in Argentina.
This way, the Group's consolidated comprehensive income for the
year ended June 30, 2018 includes the results of IDBD and DIC for
the 12-month period from April 1, 2017 to March 31, 2018, adjusted
for the significant transactions that occurred between April 1,
2018 and June 30, 2018.
Moreover, the
consolidated comprehensive income of the Group for the year ended
June 30, 2016 includes the results of IDBD and DIC operations for
the period from October 11, 2015 (the acquisition of control)
through March 31, 2016, adjusted for those significant transactions
that occurred between April 1, 2016 and June 30, 2016.
(b)
Current
and non-current classification
The
Group presents current and non-current assets, and current and
non-current liabilities, as separate classifications in its
Statement of Financial Position according to the operating cycle of
each activity. Current assets and current liabilities include the
assets and liabilities that are either realized or settled within
12 months from the end of the fiscal year.
F-12
Cresud Sociedad Anónima,
Comercial, Inmobiliaria, Financiera y Agropecuaria
All other assets
and liabilities are classified as non-current. Current and deferred
tax assets and liabilities (income tax liabilities) are presented
separately from each other and from other assets and liabilities.
Deferred tax assets and liabilities are in all cases presented as
non-current while the rest is classified as current or
non-current.
(c)
Presentation
currency
The
Consolidated Financial Statements are presented in millions of
Argentine Pesos. Unless otherwise stated or the context otherwise
requires, references to ‘Peso amounts’ or
‘Ps.’, are millions of Argentine Pesos, references to
‘US$’ or ‘US Dollars’ are millions of US
Dollars, references to ‘Rs.’ are millions of Brazilian
Reais and references to "NIS" are millions of New Israeli
Shekel.
(d)
Fiscal
year-end
The
fiscal year begins on July 1 and ends on June 30 of the following
year.
(e)
Accounting
criteria
The
Consolidated Financial Statements have been prepared under
historical cost criteria, except for investment properties,
financial assets and financial liabilities (including derivative
instruments) measured at fair value through profit or loss,
financial assets held for sale and share-based compensation, which
are measured at fair value, biological assets and agricultural
produce at the point of harvest measured at fair value less costs
to sell, and agricultural produce after harvest measured at net
realizable value.
(f)
Reporting
cash flows
The
Group reports operating activities cash flows using the indirect
method. Interest paid is presented within financing activities.
Interest received is presented within investing activities. The
acquisitions and disposals of investment properties are disclosed
within investing activities as this most appropriately reflects the
Group’s business activities. Cash flows in respect to trading
properties are disclosed within operating activities because these
items are sold in the ordinary course of business.
(g)
Use
of estimates
The
preparation of Financial Statements at a certain date requires the
Management to make estimations and evaluations affecting the amount
of assets and liabilities recorded and contingent assets and
liabilities disclosed at such date, as well as income and expenses
recorded during the year. Actual results might differ from the
estimates and evaluations made at the date of preparation of these
Consolidated Financial Statements. The most significant judgments
made by Management in applying the Group’s accounting
policies and the major estimations and significant judgments are
described in Note 3
2.2
New
accounting standards and amendments
The
following standards and amendments have been issued by the IASB.
Below we outline the standards and amendments that may potentially
have an impact on the Group at the time of
application.
Standards and amendments adopted by the Group
|
Standards
and amendments
|
Description
|
Date
of mandatory adoption for the Group in the year ended
on
|
|
Cycle of annual
improvements 2014-2016. IFRS 12 “Disclosure of Interests in
other entities”.
|
Clarifies the
standard scope.
|
06-30-2018
|
|
Amendments to IAS 7
"Disclosure initiative".
|
Establishes that
the entity shall disclose information so that users of the
Financial Statements may assess the changes in liabilities
resulting from financing activities, including both cash and
non-cash changes.
|
06-30-2018
|
|
Amendments to IAS
12 "Recognition of deferred tax assets for unrealized
losses".
|
Clarifies the
accounting of deferred income tax assets in the case of unrealized
losses from debt instruments measured at fair value.
|
06-30-2018
|
The
adoption of these standards and amendments has not had a material
impact for the Group. See details of IAS 7 modifications in Note
21.
F-13
Cresud Sociedad Anónima,
Comercial, Inmobiliaria, Financiera y Agropecuaria
Standards and amendments not yet adopted by the
Group
|
Standards
and amendments
|
Description
|
Date
of mandatory adoption for the Group in the year ended
on
|
|
Amendments to IAS
40 "Transfers of Investment Properties"
|
Clarifies the
conditions that should be met for an entity to transfer a property
to, or from, investment properties.
|
06-30-2019
|
|
Cycle of annual
improvements 2014-2016. IAS 28 “Investments in Associates and
Joint ventures”.
|
Clarifies that the
option to measure an associate or a joint venture at fair value for
a qualifying entity is available upon initial
recognition.
|
06-30-2019
|
|
IFRS 9
“Financial Instruments”.
|
Adds a new
impairment model based on expected losses and introduces some minor
amendments to the classification and measurement of financial
assets.
|
06-30-2019
|
|
IFRS 15
“Revenues from contracts with customers”
|
Provides the new
revenue recognition model derived from contracts with customers.
The core principle underlying the model is satisfaction of
performance obligations assumed with customers. Applies to all
contracts with customers, except those covered by other IFRSs, such
as leases, insurance and financial instruments contracts. The
standard does not address recognition of interest or dividend
income.
|
06-30-2019
|
|
Amendments to IFRS
2 "Share-based Payment".
|
The amendments
clarify the scope of the standard in relation to (i) accounting of
the effects that the concession consolidation conditions have on
cash settled share-based payments, (ii) the Classification of the
share-based payment transactions subject to net settlement, and
(iii) accounting for the amendment of terms and conditions of the
share-based payment transaction that reclassifies the transaction
from cash settled to equity settled.
|
06-30-2019
|
|
IFRS 16
"Leases".
|
Will supersede IAS
17 currently in force (and associated interpretations) and its
scope includes all leases, with two specific exceptions (low cost
assets, leases and short-term leases). Under the new standard,
lessees are required to account for leases under one single model
in the balance sheet that is similar to the one used to account for
financial leases under IAS 17. The accounting of the lessor has no
significant changes.
|
06-30-2020
|
The
future adoption of these standards and amendments will not have a
significant impact to the Group, except for the
following:
●
IFRS
15: Revenues from contracts with customers
The
standard introduces a new five-step model for recognizing revenue
from contracts with customers:
1)
Identifying the
contract with the customer.
2)
Identifying
separate performance obligations in the contract.
3)
Determining the
transaction price.
4)
Allocating the
transaction price to separate performance obligations.
5)
Recognizing revenue
when the performance obligations are satisfied.
The
Group will apply the cumulative effect approach; therefore,
accumulated impact will be recognized in Retained earnings as of
July 1, 2018. Comparative figures will not be
restated.
Main effects that affect the Group
Costs of obtaining a contract with a client
Customer
acquisition costs are capitalized when it is expected that the
Group will recover these costs, instead of recognizing these costs
in profit or loss as incurred. Accordingly, incremental incentives
and commissions paid to Group employees and resellers for securing
contracts with customers, are recognized as an asset and are
amortized to profit or loss, in accordance with the expected
service period from these contracts (over a period of 2-4
years).
In the
statements of cash flows, customer acquisition costs paid will be
presented as part of cash flows used in investing activities while
the amortization of capitalized customer acquisition costs, will be
presented under depreciation and amortization as part of cash flows
from operating activities.
The
Group applies the practical exemption specified in the standard and
recognizes customer acquisition costs in profit or loss when the
expected amortization period of these costs is one year or
less.
F-14
Cresud Sociedad Anónima,
Comercial, Inmobiliaria, Financiera y Agropecuaria
Satisfaction of performance obligation in real estate
contracts
Revenues from the
sale of offices and apartments will be recognized during the period
of construction, in accordance with the work in progress, instead
of upon the delivery or signing of the property’s deed, if
one of the following conditions are met:
1.
The customer
simultaneously receives and consumes the benefits provided by the
Group’s performance when the Group provides such
services.
2.
The Group’s
performance creates or enhances an asset that is controlled by the
customer at the time it is being created or enhanced.
3.
The Group’s
performance does not create an asset with an alternative use for
the Group and the Group has the enforceable right to payment for
performance completed to date.
The
Group will recognize revenue over time on sales contracts with
customers for the development of real estate in which no
alternative use exists but the sale to the client and it has the
right to enforce the performance of the contract. When these
conditions are not met, revenue will be recognized at the time of
the deed or upon delivery of the asset.
The
Group determines the amount of revenue from each contract according
to the transaction price and work in progress of the asset of each
customer separately.
●
IFRS
9: Financial instruments
The new
standard includes a new model of "expected credit loss" for
receivables or other assets not measured at fair value. The new
model presents a dual measurement approach for impairment: if the
credit risk of a financial asset has not increased significantly
since its initial recognition, an allowance for impairment will be
recorded in the amount of expected credit losses resulting from the
possible non- compliance events within a certain period. If the
credit risk has increased significantly, in most cases the
allowance will increase and the amount of the expected losses
should be recorded.
In
accordance with the new standard, in cases where a change in terms
or exchange of financial liabilities is immaterial and does not
lead, at the time of analysis, to the reduction of the previous
liability and recognition of the new liability, the new cash flows
must be discounted at the original effective interest rate,
recording the impact of the difference between the present value of
the financial liability that has the new terms and the present
value of the original financial liability in net income. As a
result of the application of the new standard, the amount of the
liabilities, whose terms were modified and for which a new
effective interest rate was calculated at the time of the change in
accordance with IAS 39, will be recalculated from the date of the
change using the original effective interest rate.
●
IFRS
16: Leases
The
Group is currently assessing the impact of the amendments on its
Financial Statements. IFRS 16 will be effective for fiscal year
beginning July 1, 2019.
On the
issue date of these Consolidated Financial Statements, there are no
other standards or amendments, issued by the IASB that are yet to
become effective and that are expected to have a material effect on
the Group.
F-15
Cresud Sociedad Anónima,
Comercial, Inmobiliaria, Financiera y Agropecuaria
Breakdown of the
expected changes to the financial position of the Group due to the
application of IFRS 9 and 15 are described below:
|
|
Current statement of financial position
|
IFRS 15 impact
|
IFRS 9 impact
|
Adjusted statement of financial position
|
|
ASSETS
|
|
|
|
|
|
Non-current assets
|
|
|
|
|
|
Trading
properties
|
6,020
|
(3,338
)
|
-
|
2,682
|
|
Investments
in associates and joint ventures
|
24,747
|
24
|
(19
)
|
24,752
|
|
Deferred
income tax assets
|
1,679
|
(95
)
|
-
|
1,584
|
|
Trade
and other receivables
|
9,129
|
497
|
(63
)
|
9,563
|
|
Total non-current assets
|
251,336
|
(2,912
)
|
(82
)
|
248,342
|
|
Current assets
|
|
|
|
|
|
Trading
properties
|
3,232
|
(734
)
|
-
|
2,498
|
|
Trade
and other receivables
|
17,208
|
292
|
(32
)
|
17,468
|
|
Total current assets
|
102,434
|
(442
)
|
(32
)
|
101,960
|
|
TOTAL ASSETS
|
353,770
|
(3,354
)
|
(114
)
|
350,302
|
|
SHAREHOLDERS’ EQUITY
|
|
|
|
|
|
Shareholders' equity attributable to equity holders of the
parent
|
|
|
|
|
|
Retained
earnings
|
20,925
|
127
|
(453
)
|
20,599
|
|
Non-controlling
interest
|
54,396
|
126
|
(473
)
|
54,049
|
|
TOTAL SHAREHOLDERS’ EQUITY
|
75,321
|
253
|
(926
)
|
74,648
|
|
LIABILITIES
|
|
|
|
|
|
Non-current liabilities
|
|
|
|
|
|
Trade
and other payables
|
3,577
|
(1,647
)
|
-
|
1,930
|
|
Borrowings
|
187,462
|
-
|
1,025
|
188,487
|
|
Deferred
income tax liabilities
|
26,563
|
(43
)
|
(268
)
|
26,252
|
|
Total non-current liabilities
|
221,395
|
(1,690
)
|
757
|
220,462
|
|
Current liabilities
|
|
|
|
|
|
Trade
and other payables
|
17,892
|
(1,925
)
|
-
|
15,967
|
|
Borrowings
|
32,083
|
-
|
55
|
32,138
|
|
Income
tax and MPIT liabilities
|
595
|
8
|
-
|
603
|
|
Total current liabilities
|
57,054
|
(1,917
)
|
55
|
55,192
|
|
TOTAL LIABILITIES
|
278,449
|
(3,607
)
|
812
|
275,654
|
|
TOTAL SHAREHOLDERS’ EQUITY AND LIABILITIES
|
353,770
|
(3,354
)
|
(114
)
|
350,302
|
At the
date of presentation of these financial statements, the analysis of
IFRS 9 in some of the Group's associates is still being performed,
which could modify the preceding information at the time of
effective adoption.
2.3
Changes in presentation of financial statements previously issued
due to change in accounting policies
Expenses relating
to the agricultural activity include items such as planting,
harvesting, irrigation, agrochemicals, fertilizers, veterinary
services and others. The Group chose not to continue to charge
these costs of production directly in the Statements of Income and
Other Comprehensive Income as they are incurred; instead, it
capitalized them as part of the cost of biological assets. Both
options are acceptable under IAS 41. The Group believes this change
will help to better understand the performance of the agribusiness
activity and therefore provides more information that is relevant
to Management, users of the Financial Statements and
others.
The
Group has therefore retroactively modified the comparative amounts
of the Consolidated Financial Statements as required by IAS 8,
reflecting the aforementioned change, reducing “Cost”
line and increasing “Initial recognition and changes in the
fair value of biological assets and agricultural products at the
point of harvest” line in the Statements of Income and Other
Comprehensive Income in Ps. 1,995 and Ps. 1,236 as of June 30, 2017
and 2016, respectively. There is no impact in any of the total and
subtotal amounts of the Financial Statements.
2.4
Scope of consolidation
(a)
Subsidiaries
Subsidiaries are
all entities (including structured entities) over which the Group
has control. The Group controls an entity when the Group is exposed
to, or has rights to variable returns from its involvement with the
entity and has the ability to affect those returns through its
power over the entity. The Group also analyzes whether there is
control when it does not hold more than 50% of the voting rights of
an entity, but does have capacity to define its relevant activities
because of de-facto control.
The
Group uses the acquisition method of accounting to account for
business combinations. The consideration transferred for the
acquisition of a subsidiary is the fair value of the assets
transferred, the liabilities incurred and the equity interests
issued by the Group. Acquisition-related costs are expensed as
incurred. Identifiable assets acquired and liabilities and
contingent liabilities assumed in a business combination are
measured initially at their fair values at the acquisition
date.
F-16
Cresud Sociedad Anónima,
Comercial, Inmobiliaria, Financiera y Agropecuaria
The
Group recognizes any non-controlling interest in the acquiree on an
acquisition-by-acquisition basis either at fair value or at the
non-controlling interest’s proportionate share of the
acquirer’s net assets. The Group chooses the method to be
used on a case-by-case base.
The
excess of the sum of the consideration transferred the amount of
any non-controlling interest in the acquiree and the
acquisition-date fair value of any previous equity interest in the
acquiree over the fair value of the identifiable net assets
acquired is recorded as goodwill. If the total of consideration
transferred, non-controlling interest recognized and previously
held interest measured is less than the fair value of the net
assets of the subsidiary acquired in the case of a bargain
purchase, the difference is recognized directly in the Statement of
Income as “Bargain purchase gains”.
The
Group conducts its business through several operating and
investment companies, the principal are listed below:
Agricultural
Business
|
|
|
|
% of
ownership interest held by
the
Group
|
||
|
Name
of the entity
|
Country
|
Principal
activity
|
06.30.18
|
06.30.17
|
06.30.16
|
|
Cresud's
direct equity interest in
:
|
|
|
|
|
|
|
Brasilagro-CompanhIa
Brasileira de Propriedades Agrícolas (1)
|
Brazil
|
Agricultural
|
43.29
%
|
43.43
%
|
42.18
%
|
|
Sociedad
Anónima Carnes Pampeanas S.A. (2)
|
Argentina
|
Agro-industrial
|
100.00
%
|
100.00
%
|
100.00
%
|
|
Futuros y
Opciones.Com S.A.
|
Argentina
|
Brokerage
|
50.10
%
|
59.59
%
|
59.59
%
|
|
Helmir
S.A.
|
Uruguay
|
Investment
|
100.00
%
|
100.00
%
|
100.00
%
|
|
IRSA Inversiones y
Representaciones Sociedad Anónima (2)
|
Argentina
|
Real
estate
|
63.74
%
|
63.76
%
|
63.77
%
|
|
Agropecuaria Santa
Cruz S.A.
|
Uruguay
|
Investment
|
100.00
%
|
100.00
%
|
100.00
%
|
|
Brasilagro's direct equity interest in:
|
|
|
|
|
|
|
Araucária
Ltda.
|
Brazil
|
Agricultural
|
99.99
%
|
99.99
%
|
99.99
%
|
|
Cajueiro
Ltda.
|
Brazil
|
Agricultural
|
99.99
%
|
99.99
%
|
99.99
%
|
|
Ceibo
Ltda.
|
Brazil
|
Agricultural
|
99.99
%
|
99.99
%
|
99.99
%
|
|
Cremaq
Ltda.
|
Brazil
|
Agricultural
|
99.99
%
|
99.99
%
|
99.99
%
|
|
Engenho
de Maracajú Ltda.
|
Brazil
|
Agricultural
|
99.99
%
|
99.99
%
|
99.99
%
|
|
Flamboyant
Ltda.
|
Brazil
|
Agricultural
|
99.99
%
|
99.99
%
|
99.99
%
|
|
Jaborandi
Agr’cola Ltda.
|
Brazil
|
Agricultural
|
99.99
%
|
99.99
%
|
99.99
%
|
|
Jaborandi
Propriedades Agr’colas S.A.
|
Brazil
|
Agricultural
|
99.99
%
|
99.99
%
|
99.99
%
|
|
Mogno
Ltda.
|
Brazil
|
Agricultural
|
99.99
%
|
99.99
%
|
99.99
%
|
|
Palmeiras
S.A.
|
Brazil
|
Agricultural
|
99.99
%
|
-
|
-
|
|
Agropecuaria
Morot’ S.A.
|
Brazil
|
Agricultural
|
99.99
%
|
-
|
-
|
|
Futuros y Opciones.Com. S.A.'s direct equity interest
in:
|
|
|
|
|
|
|
Amauta
Agro S.A. (3)
|
Argentina
|
Brokerage
|
98.57
%
|
98.57
%
|
98.57
%
|
|
FyO
Acopio S.A. (3)
|
Argentina
|
Warehousing
and brokerage
|
98.57
%
|
98.57
%
|
98.57
%
|
|
FyO
Chile SPA
|
Chile
|
Brokerage
|
100.00
%
|
100.00
%
|
-
|
|
Agropecuaria Santa Cruz S.A.'s direct equity interest
in:
|
|
|
|
|
|
|
Agropecuaria
Acres del Sud S.A. (2)
|
Bolivia
|
Agricultural
|
100.00
%
|
100.00
%
|
100.00
%
|
|
Ombú
Agropecuaria S.A.
|
Bolivia
|
Agricultural
|
100.00
%
|
100.00
%
|
100.00
%
|
|
Yatay
Agropecuaria S.A.
|
Bolivia
|
Agricultural
|
100.00
%
|
100.00
%
|
100.00
%
|
|
Yuchán
Agropecuaria S.A. (2)
|
Bolivia
|
Agricultural
|
100.00
%
|
100.00
%
|
100.00
%
|
|
Sedelor
S.A.
|
Uruguay
|
Investment
|
100.00
%
|
100.00
%
|
100.00
%
|
|
Codalis
S.A.
|
Uruguay
|
Investment
|
100.00
%
|
100.00
%
|
100.00
%
|
|
Alafox
S.A.
|
Uruguay
|
Investment
|
100.00
%
|
100.00
%
|
100.00
%
|
(1)
The Group exercises
“de facto control” over Brasilagro as a result of (i)
the percentage and concentration of voting rights of the Group and
the absence of other shareholders with significant voting rights,
(ii) the absence of a voting agreement among the other shareholders
to vote together as a group, (iii) the record of attendance to
Shareholders’ Meetings and the record of votes casted by the
other shareholders; and (iv) the effective control exercised by the
Group to direct Brasilagro’s relevant activities through its
seat in the Board of Directors. See Note 7 for further information
regarding to Brasilagro.
(2)
Includes interest
indirectly held through Helmir.
(3)
Includes interest
directly held through Cresud.
Urban
Properties and Investments Business
|
|
|
|
% of ownership interest held by the Group
|
||
|
Name of the entity
|
Country
|
Principal activity
|
06.30.18
|
06.30.17
|
06.30.16
|
|
IRSA's direct equity interest:
|
|
|
|
|
|
|
IRSA
CP (1)
|
Argentina
|
Real
estate
|
86.34
%
|
94.61
%
|
94.61
%
|
|
E-Commerce
Latina S.A.
|
Argentina
|
Investment
|
100.00
%
|
100.00
%
|
100.00
%
|
|
Efanur
S.A.
|
Uruguay
|
Investment
|
100.00
%
|
100.00
%
|
100.00
%
|
|
Hoteles
Argentinos S.A.
|
Argentina
|
Hotel
|
80.00
%
|
80.00
%
|
80.00
%
|
|
Inversora
Bolívar S.A.
|
Argentina
|
Investment
|
100.00
%
|
100.00
%
|
100.00
%
|
|
Llao
Llao Resorts S.A. (2)
|
Argentina
|
Hotel
|
50.00
%
|
50.00
%
|
50.00
%
|
|
Nuevas
Fronteras S.A.
|
Argentina
|
Hotel
|
76.34
%
|
76.34
%
|
76.34
%
|
|
Palermo
Invest S.A.
|
Argentina
|
Investment
|
100.00
%
|
100.00
%
|
100.00
%
|
|
Ritelco
S.A.
|
Uruguay
|
Investment
|
100.00
%
|
100.00
%
|
100.00
%
|
|
Tyrus
S.A.
|
Uruguay
|
Investment
|
100.00
%
|
100.00
%
|
100.00
%
|
|
UT
IRSA y Galerías Pacífico S.A. (2) (6)
|
Argentina
|
Investment
|
50.00
%
|
50.00
%
|
-
|
F-17
Cresud Sociedad Anónima,
Comercial, Inmobiliaria, Financiera y Agropecuaria
|
|
|
|
% of ownership interest held by the Group
|
||
|
Name of the entity
|
Country
|
Principal activity
|
06.30.18
|
06.30.17
|
06.30.16
|
|
IRSA CP's direct equity interest in:
|
|
|
|
|
|
|
Arcos
del Gourmet S.A.
|
Argentina
|
Real
estate
|
90.00
%
|
90.00
%
|
90.00
%
|
|
Emprendimiento
Recoleta S.A.
|
Argentina
|
Real
estate
|
53.68
%
|
53.68
%
|
53.68
%
|
|
Fibesa
S.A. (3)
|
Argentina
|
Real
estate
|
100.00
%
|
100.00
%
|
100.00
%
|
|
Panamerican
Mall S.A.
|
Argentina
|
Real
estate
|
80.00
%
|
80.00
%
|
80.00
%
|
|
Shopping
Neuquén S.A.
|
Argentina
|
Real
estate
|
99.92
%
|
99.92
%
|
99.14
%
|
|
Torodur
S.A.
|
Uruguay
|
Investment
|
100.00
%
|
100.00
%
|
100.00
%
|
|
EHSA
|
Argentina
|
Investment
|
70.00
%
|
70.00
%
|
-
|
|
Centro
de Entretenimiento La Plata (6)
|
Argentina
|
Real
estate
|
100.00
%
|
-
|
-
|
|
Tyrus S.A.'s direct equity interest in:
|
|
|
|
|
|
|
DFL
(4)
|
Bermudas
|
Investment
|
91.57
%
|
91.57
%
|
91.57
%
|
|
I
Madison LLC
|
United
States
|
Investment
|
-
|
100.00
%
|
100.00
%
|
|
IRSA
Development LP
|
United
States
|
Investment
|
-
|
100.00
%
|
100.00
%
|
|
IRSA
International LLC
|
United
States
|
Investment
|
100.00
%
|
100.00
%
|
100.00
%
|
|
Jiwin
S.A.
|
Uruguay
|
Investment
|
100.00
%
|
100.00
%
|
100.00
%
|
|
Liveck
S.A.
|
Uruguay
|
Investment
|
100.00
%
|
100.00
%
|
100.00
%
|
|
Real
Estate Investment Group IV LP (REIG IV)
|
Bermudas
|
Investment
|
-
|
100.00
%
|
100.00
%
|
|
Real
Estate Investment Group V LP (REIG V)
|
Bermudas
|
Investment
|
100.00
%
|
100.00
%
|
100.00
%
|
|
Real
Estate Strategies LLC
|
United
States
|
Investment
|
100.00
%
|
100.00
%
|
100.00
%
|
|
Efanur S.A.'s direct equity interest in:
|
|
|
|
|
|
|
Real
Estate Investment Group VII LP (REIG VII)
|
Bermudas
|
Investment
|
100.00
%
|
-
|
-
|
|
DFL's direct equity interest in:
|
|
|
|
|
|
|
IDB
Development Corporation Ltd.
|
Israel
|
Investment
|
100.00
%
|
68.28
%
|
68.28
%
|
|
Dolphin
IL Investment Ltd.
|
Israel
|
Investment
|
100.00
%
|
-
|
-
|
|
DIL's direct equity interest in:
|
|
|
|
|
|
|
Discount
Investment Corporation Ltd. (4)
|
Israel
|
Investment
|
76.57
%
|
77.25
%
|
76.43
%
|
|
IDBD's direct equity interest in:
|
|
Investment
|
|
|
|
|
IDB
Tourism (2009) Ltd.
|
Israel
|
Tourism
services
|
100.00
%
|
100.00
%
|
100.00
%
|
|
IDB
Group Investment Inc
|
Israel
|
Investment
|
100.00
%
|
100.00
%
|
100.00
%
|
|
DIC's direct equity interest in:
|
|
|
|
|
|
|
Property
& Building Corporation Ltd.
|
Israel
|
Real
estate
|
64.40
%
|
64.40
%
|
76.45
%
|
|
Shufersal
Ltd. (7)
|
Israel
|
Retail
|
-
|
54.19
%
|
52.95
%
|
|
Cellcom
Israel Ltd. (5)
|
Israel
|
Telecommunications
|
43.14
%
|
42.26
%
|
41.77
%
|
|
Elron
Electronic Industries Ltd.
|
Israel
|
Investment
|
50.30
%
|
50.30
%
|
50.30
%
|
|
Bartan
Holdings and Investments Ltd.
|
Israel
|
Investment
|
55.68
%
|
55.68
%
|
55.68
%
|
|
Epsilon
Investment House Ltd.
|
Israel
|
Investment
|
68.75
%
|
68.75
%
|
68.75
%
|
(1)
Includes interest
held through E-Commerce Latina S.A. and Tyrus S.A.
(2)
The Group has
consolidated the investment in Llao Llao Resorts S.A. and UT IRSA
and Galerías Pacífico considering its equity interest and
a shareholder agreement that confers it majority of votes in the
decision making process.
(3)
Includes interest
held through Ritelco S.A. and Torodur S.A.
(4)
Includes Tyrus'
equity interest. Until the present financial year, the
participation was through Tyrus S.A. and IDBD.
(5)
DIC considers it
exercises effective control over Cellcom because DIC is the group
with the higher percentage of votes vis-à-vis other
shareholders, with a stake of 46.16%, also taking into account the
historic voting performance in the Shareholders’ Meetings, as
well as the evaluation of the holdings of the remaining
shareholders, which are highly atomized.
(6)
Corresponds to
acquisitions and constitutions of new entities considered not
material as a whole.
(7)
Control was lost in
June 30, 2018 (see Note 4.(l)).
Except
for the aforementioned items, the percentage of votes does not
differ from the stake.
The
Group takes into account both quantitative and qualitative aspects
in order to determine which non-controlling interests in
subsidiaries are considered significant.
(b)
Changes
in ownership interests in subsidiaries without change of
control
Transactions with
non-controlling interests that do not result in loss of control are
accounted for as equity transactions – i.e., as transactions
with the owners in their capacity as owners. The recorded value
corresponds to the difference between the fair value of the
consideration paid and/or received and the relevant share acquired
and/or transferred of the carrying value of the net assets of the
subsidiary.
(c)
Disposal
of subsidiaries with loss of control
When
the Group ceases to have control over a subsidiary, any retained
interest in the entity is re-measured at its fair value at the date
when control is lost, with changes in carrying amount recognized in
profit or loss. The fair value is the initial carrying amount for
the purposes of subsequently accounting for the retained interest
as an associate, joint venture or financial asset. In addition, any
amounts previously recognized in other comprehensive income in
respect of that entity are accounted for as if the Group had
directly disposed of the related assets or liabilities. This may
mean that amounts previously recognized in other comprehensive
income are reclassified to profit or loss.
F-18
Cresud Sociedad Anónima,
Comercial, Inmobiliaria, Financiera y Agropecuaria
(d)
Associates
Associates are all
entities over which the Group has significant influence but not
control, usually representing an interest between 20% and at least
50% of the voting rights. Investments in associates are accounted
for using the equity method of accounting, except as otherwise
indicated as explained below. Under the equity method, the
investment is initially recognized at cost, and the carrying amount
is increased or decreased to recognize the investor’s share
of the profit or loss of the investee after the date of
acquisition. The Group’s investment in associates includes
goodwill identified on acquisition.
As of
each year-end or upon the existence of evidence of impairment, a
determination is made, as to whether there is any objective
indication of impairment in the value of the investments in
associates. If this is the case, the Group calculates the amount of
impairment as the difference between the recoverable amount of the
Associates and its carrying value and recognizes the amount
adjacent to "Share of profit / (loss) of associates and joint
ventures " in the Statement of Income and Other Comprehensive
Income.
Profit
and losses resulting from transactions between the Group and the
associate are recognized in the Group's financial statements only
to the extent of the interests in the associates of the unrelated
investor. Unrealized losses are eliminated unless the transaction
reflects signs of impairment of the value of the asset transferred.
The accounting policies of associates are modified to ensure
uniformity within Group policies.
The
Group takes into account quantitative and qualitative aspects to
determine which investments in associates are considered
significant.
(e)
Joint
arrangements
Joint
arrangements are arrangements of which the Group and other party or
parties have joint control bound by a contractual arrangement.
Under IFRS 11, investments in joint arrangements are classified as
either joint ventures or joint operations depending on the
contractual rights and obligations each investor has rather than
the legal structure of the joint arrangement. A joint venture is a
joint arrangement whereby the parties that have joint control of
the arrangement have rights to the net assets of the arrangement. A
joint operation is a joint arrangement whereby the parties that
have joint control of the arrangement have rights to the assets,
and obligations for the liabilities, relating to the arrangement.
The Group has assessed the nature of its joint arrangements and
determined them to be joint ventures.
Investments in
joint ventures are accounted for under the equity method. Under the
equity method of accounting, interests in joint ventures are
initially recognized in the Consolidated Statements of Financial
Position at cost and adjusted thereafter to recognize the
Group’s share of post-acquisition profits or losses and other
comprehensive income in the Statements of Income and Other
Comprehensive Income.
The
Group determines at each reporting date whether there is any
objective evidence that the investment in joint ventures is
impaired. If this is the case, the Group calculates the amount of
impairment as the difference between the recoverable amount of the
joint venture and its carrying value and recognizes such difference
in "Share of profit / (loss) of associates and joint ventures" in
the Statements of Income.
2.5
Segment
information
Operating segments
are reported in a manner consistent with the internal reporting
provided to the Chief Operating Decision-Maker
(“CODM”), responsible for allocating resources and
assessing performance. The operating segments are described in Note
6.
2.6
Foreign
currency translation
(a)
Functional
and presentation currency
Items
included in the Financial Statements of each of the Group’s
entities are measured using the currency of the primary economic
environment in which the entity operates (‘the functional
currency’). The Consolidated Financial Statements are
presented in Argentine Pesos, which is the Group’s
presentation currency.
F-19
Cresud Sociedad Anónima,
Comercial, Inmobiliaria, Financiera y Agropecuaria
(b)
Transactions
and balances in foreign currency
Foreign
currency transactions are translated into the functional currency
using the exchange rates prevailing at the dates of the
transactions. Foreign exchange gains and losses resulting from the
settlement of such transactions and from the translation at
year-end exchange rates of monetary assets and liabilities
nominated in foreign currencies are recognized in the profit or
loss for the year.
Foreign
exchange gains and losses are presented in the Statement of Income
within finance income and finance costs, as appropriate, unless
they have been capitalized.
(c)
Group
companies
The
results and financial position of all the Group entities (none of
which has the currency of a hyperinflationary economy) that have a
functional currency different from the presentation currency are
translated into the presentation currency as follows:
(i)
assets, liabilities
and goodwill for each Statement of Financial Position presented are
translated at the closing rate at the date of that financial
position;
(ii)
income and expenses
for each Statement of Comprehensive Income are translated at
average exchange rates (unless this average is not a reasonable
approximation of the cumulative effect of the rates prevailing on
the transaction dates, in which case income and expenses are
translated at the rate on the dates of the transactions);
and
(iii)
all resulting
exchange differences are recognized in the Statement of
Comprehensive Income.
The
accounting policy of the Group consists in accounting the
translation difference of its subsidiaries by the
“step-by-step” method according to IAS 21.
2.7
Investment
properties
Investment
properties are those properties owned either by the Group that are
held to earn long-term rental income or for capital appreciation,
or both and that are not occupied by the Group for its own
operations. Investment property also includes property that is
being constructed or developed for future use as investment
property. The Group also classifies as investment properties land
whose future use has not been determined yet. The Group’s
investment properties primarily comprise the Group’s
portfolio of shopping malls and offices, certain property under
development and undeveloped land.
Where a
property is partially owner-occupied, with the rest being held for
rental income or capital appreciation, the Group accounts for the
portions separately. The portion that is owner-occupied is
accounted for as property, plant and equipment under IAS 16
“Property, Plant and Equipment” and the portion that is
held for rental income or capital appreciation, or both, is treated
as investment properties under IAS 40 “Investment
Properties”.
Investment
properties are measured initially at cost. Cost comprises the
purchase price and directly attributable expenditures, such as
legal fees, certain direct taxes, commissions and in the case of
properties under construction, the capitalization of financial
costs.
For
properties under development, capitalization of costs includes not
only financial costs, but also all costs directly attributable to
works in process, from commencement of construction until it is
completed and property is in conditions to start
operating.
Direct
expenses related to lease contract negotiation (such as payment to
third parties for services rendered and certain specific taxes
related to execution of such contracts) are capitalized as part of
the book value of the relevant investment properties and amortized
over the term of the lease.
F-20
Cresud Sociedad Anónima,
Comercial, Inmobiliaria, Financiera y Agropecuaria
Borrowing costs
associated with properties under development or undergoing major
refurbishment are capitalized. The finance cost capitalized is
calculated using the Group’s weighted average cost of
borrowings after adjusting for borrowings associated with specific
developments. Where borrowings are associated with specific
developments, the amount capitalized is the gross interest incurred
on those borrowings less any investment income arising on their
temporary investment. Finance cost is capitalized from the
commencement of the development work until the date of practical
completion. Capitalization of finance costs is suspended if there
are prolonged periods when development activity is interrupted.
Finance cost is also capitalized on the purchase cost of land or
property acquired specifically for redevelopment in the short term
but only where activities necessary to prepare the asset for
redevelopment are in progress.
After
initial recognition, investment property is carried at fair value.
Investment property that is being redeveloped for continuing use as
investment property or for which the market has become less active
continues to be measured at fair value. Investment properties under
construction are measured at fair value if the fair value is
considered reliably determinable. On the other hand, properties
under construction for which the fair value cannot be determined
reliably, but for which the Group expects it to be determinable
when construction is completed, are measured at cost less
impairment until the fair value becomes reliably determinable or
construction is completed, whichever is earlier.
Fair
values are determined differently depending on the type of property
being measured.
Generally, fair
value of owner occupied farmland, office buildings and land
reserves is based on active market prices, adjusted, if necessary,
for differences in the nature, location or condition of the
specific asset. If this information is not available, the Group
uses alternative valuation methods, such as recent prices on less
active markets or discounted cash flow projections.
The
fair value of the Group’s portfolio of Shopping Malls is
based on discounted cash flow projections. This method of valuation
is commonly used in the shopping mall industry in the region where
the Group conducts its operations.
Fair
value of office building for the Operations Center in Israel is
based on discounted cash flow projections.
As
required by CNV 576/10 Ruling, valuations are performed as of the
financial position date by accredited externals appraisers who have
recognized professional qualifications and have recent experience
in the location and category of the investment property being
valued. These valuations form the basis for the carrying amounts in
the Consolidated Financial Statements. The fair value of investment
property reflects, among other things, rental income from current
leases and other assumptions market participants would make when
pricing the property under current market conditions.
Subsequent
expenditures are capitalized to the asset’s carrying amount
only when it is probable that future economic benefits associated
with the expenditure will flow to the Group and the cost can be
measured reliably. All other repairs and maintenance costs are
expensed when incurred. When part of an investment property is
replaced, the carrying amount of the replaced part is
derecognized.
Changes
in fair values are recognized in the Statement of Income under the
line item “Net gain from fair value adjustment of investment
properties”.
Asset
transfers, including assets classified as investments properties
which are reclassified under other items or vice-versa, may only be
carried out when there is a change of use evidenced by: a)
commencement of occupation of real property by the Group, where
investment property is transferred to property, plant and
equipment; b) commencement of development activities for sale
purposes, where investment property is transferred to property for
sale; c) the end of Group occupation, where it is transferred from
property, plant and equipment to investment properties; or d)
commencement of an operating lease transaction with a third party,
where properties for sale are transferred to investment property.
The value of the transfer is the one that the property had at the
time of the transfer and subsequently is valued in accordance with
the accounting policy related to the item.
The
Group may sell its investment property when it considers that such
property no longer forms part of the lease business. The carrying
value immediately prior to the sale is adjusted to the transaction
price, and the adjustment is recorded in the Statement of Income in
the line “Net gain from fair value adjustments of investment
properties”.
F-21
Cresud Sociedad Anónima,
Comercial, Inmobiliaria, Financiera y Agropecuaria
Investment
properties are derecognized when they are disposed of or when they
are permanently withdrawn from use and no future economic benefits
are expected to arise from their disposals. The disposal of
properties is recognized when the significant risks and rewards
have been transferred to the buyer. As for unconditional
agreements, proceeds are accounted for when title to property
passes to the buyer and the buyer intends to make the respective
payment. In the case of conditional agreements, where such
conditions have been met. Where consideration receivable for the
sale of the properties is deferred, it is discounted to present
value. The difference between the discounted amount and the amount
receivable is treated as interest income and recognized over the
period using the effective interest method. Direct expenses related
to the sale are recognized in the line "Other operating results,
net" in the Statement of Income at the time they are
incurred.
2.8
Property, plant and equipment
This
category primarily comprises, buildings or portions of a building
used for administrative purposes, machines, computers, and other
equipment, motor vehicles, furniture, fixtures and fittings and
improvements to the Group’s corporate offices.
The
Group has also several hotel properties. Based on the respective
contractual arrangements with hotel managers and / or given their
direct operators nature, the Group considers it retains significant
exposure to the variations in the cash flows of the hotel
operations, and accordingly, hotels are treated as owner-occupied
properties and classified under "Property, plant and
equipment".
All
property, plant and equipment (“PPE”) is stated at
acquisition cost less depreciation and accumulated impairment, if
any. The acquisition cost includes expenditures, which are directly
attributable to the acquisition of the items. For properties under
development, capitalization of costs includes not only financial
costs, but also all costs directly attributable to works in
process, from commencement of construction until it is completed
and the property is in conditions to start operating.
Subsequent costs
are included in the asset’s carrying amount or recognized as
a separate asset, as appropriate, only when it is probable that
future economic benefits associated with the item will flow to the
Group and the cost of the item can be measured reliably. Such costs
may include the cost of improvements and replacement of parts as
they meet the conditions to be capitalized. The carrying amount of
those parts that are replaced is derecognized. Repairs and
maintenance are charged as incurred in the Statement of Income.
Depreciation, based on a component approach, is calculated using
the straight-line method to allocate the cost over the
assets’ estimated useful lives.
The
remaining useful life as of June 30, 2018 is as
follows:
|
Buildings
and facilities
|
Between
5 and 50 years
|
|
Machinery
and equipment
|
Between
3 and 24 years
|
|
Communication
networks
|
Between
4 and 20 years
|
|
Others
|
Between
3 and 25 years
|
As of
each fiscal year-end, an evaluation is performed to determine the
existence of indicators of any decrease in recoverable value or
useful life of assets. If there are any indicators, the recoverable
amount and/or residual useful life of impaired asset(s) is
estimated, and an impairment adjustment is made, if applicable. As
of each fiscal year-end, the residual useful life of assets is
estimated and adjusted, if necessary. The book amount of an asset
is reduced to its recoverable value if the book value is greater
than its estimated recoverable value.
Gains
from the sale of these assets are recognized when the significant
risks and rewards have transferred to the buyer. This will normally
take place on unconditional exchange, generally when legal title
passes to the buyer and it is probable that the buyer will pay. For
conditional exchanges, sales are recognized when these conditions
are satisfied.
Gains
and losses on disposals are determined by comparing the proceeds,
with the carrying amount. Gains and losses from the disposal of
farmlands are disclosed within “Gains from disposal of
farmlands” in the Statements of Income. All other gains and
losses from the disposal of property, plant and equipment items are
recognized within “Other operating results, net” in the
Statement of Comprehensive Income.
When
assets of property, plant and equipment are transferred to
investment property, the difference between the value at cost
transferred and the fair value of the investment property is
allocated to a reserve within equity.
F-22
Cresud Sociedad Anónima,
Comercial, Inmobiliaria, Financiera y Agropecuaria
Group's
sugarcane fields are recognized as bearer plants under the
definition included in IAS 41. For this reason, they are accounted
as property, plant and equipment and are valued at amortized
cost.
2.9
Leases
Leases
are classified at their inception as either operating or finance
leases based on the economic substance of the
agreement.
A Group company is the lessor
Properties leased
out to tenants under operating leases are included in
“Investment properties” in the Statement of Financial
Position. See Note 2.23 for the recognition of rental
income.
The
Group does not have any assets leased out under finance
leases.
A Group company is the lessee
The
Group has entered into some operating lease agreements, mainly
related to agribusiness activities. By virtue of these contracts,
the Group leases land open for agricultural exploitation during the
crop season. The lease price is generally set at a fixed amount in
dollars or at a certain number of quintals of soybeans (or
equivalent measurement unit) during the entire lease term. Lease
payments can be made in installments or in advance at the beginning
of the lease. The lease costs are recognized in the Statements of
Income in relation to the degree of ripeness of the harvest since
the Group considers that this systematic base is more
representative of the time pattern of the leases’
benefits.
Additionally, the
Group maintains other operating leases not related to agricultural
activity, mainly associated with the leasing of offices. Payments,
including prepayments, made under operating leases (net of any
incentives received from the lessor) are charged to the Statement
of Income on a straight-line basis over the period of the
lease.
The
Group acquires certain specific assets (especially machinery and
computer equipment) under finance leases. Finance leases are
capitalized at the commencement of the lease at the lower of the
fair value of the property and the present value of the minimum
lease payments. Capitalized lease assets are depreciated over the
shorter of the estimated useful life of the assets and the lease
term. The finance charges are charged over the lease period to
produce a constant periodic rate of interest on the remaining
balance of the liability for each period. Liabilities corresponding
to finance leases, measured at discounted value, are included in
current and non-current borrowings.
Operating leases
where the Group acts as lessee were charged to results at the time
they accrue. They mainly include offices and properties for
commercial uses.
2.10
Intangible assets
(a)
Goodwill
Goodwill represents
future economic benefits arising from assets that are not capable
of being individually identified and separately recognized by the
Group on an acquisition. Goodwill is initially measured as the
difference between the fair value of the consideration transferred,
plus the amount of non-controlling interest in the acquisition and,
in business combinations achieved in stages, the acquisition-date
fair value of the previously held equity interest in the
acquisition; and the net fair value of the identifiable assets and
liabilities assumed on the acquisition date.
Goodwill is not
amortized but tested for impairment at each fiscal year-end, or
more frequently if there is an indication of
impairment.
For the
purpose of impairment testing, assets are grouped at the lowest
levels for which there are separately identifiable cash flows,
referred to as cash-generating units (“CGU”). In order
to determine whether any impairment loss should be recognized, the
book value of CGU or CGU groups is compared against its recoverable
value. Net book value of CGU and CGU groups include goodwill and
assets with limited useful life (such as, investment properties,
property, plant and equipment, intangible assets and working
capital).
F-23
Cresud Sociedad Anónima,
Comercial, Inmobiliaria, Financiera y Agropecuaria
If the
recoverable amount of the CGU is less than the carrying amount of
the unit, the impairment loss is allocated first to reduce the
carrying amount of any goodwill allocated to the unit and then to
the other assets of the unit pro rata on the basis of the carrying
amount of each asset in the unit. Impairment losses recognized for
goodwill are not reversed in a subsequent period.
The
recoverable amount of a CGU is the higher of the fair value less
costs-to-sell and the value-in-use. The fair value is the amount at
which a CGU may be sold in a current transaction between unrelated,
willing and duly informed parties. Value-in-use is the present
value of all estimated future cash flows expected to be derived
from CGU or CGU groups.
Goodwill is
assigned to the Group's cash generating units based on operating
segments. The recoverable amount of a cash-generating unit is
determined based on fair value calculations. These calculations use
the price of the CGU assets, they are compared with the book
values, and the goodwill assigned to each cash-generating
unit.
No
impairment was recorded as a result of the analysis
performed.
(b)
Computer
software
Acquired computer
software licenses are capitalized based on the costs incurred to
acquire and bring to use the specific software. These costs are
amortized over their estimated useful lives of three years. Costs
associated with maintaining computer software programs are
recognized as an expense as incurred.
(c)
Branding
and client relationships
This
relates to the fair value of brands and client relationships
arising at the time of the business combination with IDBD. They are
subsequently valued at cost, less the accumulated amortization or
impairment. Client relationships have an average twelve-year useful
life, while one of the brands have an indefinite useful life and
the other ten-year useful life.
(d)
Right
to receive future units under barter agreements
The
Group also enters into barter transactions where it normally
exchanges undeveloped parcels of land with third-party developers
for future property to be constructed on the bartered land. The
Group generally receives monetary assets as part of the
transactions and/or a right to receive future units to be
constructed by developers. Such rights are initially recognized at
cost (which is the fair value of the land assigned) and are not
adjusted later, unless there is any sign of
impairment.
At each
year-end, the Group reviews the carrying amounts of its intangible
assets to determine whether there is any indication that those
assets have suffered an impairment loss. If any of such signs
exists, the recoverable amount of the asset is estimated in order
to determine the extent, if any, of the impairment loss. For
intangible assets with indefinite useful lives, the Group annually
reviews the existence of an impairment, or more frequently if signs
of impairment are identify.
2.11
Trading properties
Trading
properties comprises those properties intended either for sale or
in the process of construction for subsequent sale. Trading
properties are carried at the lower of cost and net realizable
value. Where there is a change in use of investment properties
evidenced by the commencement of development with a view to sale,
the properties are reclassified as trading properties at cost,
which is the carrying value at the date of change in use. They are
subsequently carried at the lower of cost and net realizable value.
Cost comprises all costs of purchase, costs of conversion and other
costs incurred in bringing the trading properties to their present
location and condition.
2.12
Inventories
Inventories include
assets held for sale in the ordinary course of the Group’s
business activities, assets in production or construction process
for sale purposes, and materials, supplies or other assets held for
consumption in the process of producing sales and/or
services.
F-24
Cresud Sociedad Anónima,
Comercial, Inmobiliaria, Financiera y Agropecuaria
Supplies used in
the Group's agricultural activities comprise fertilizers,
agrochemicals, vaccines, seeds, feed for livestock and other items.
Harvested agricultural produce comprise harvested crops, and raw
meat.
For the
Group’s operations in Argentina and Brazil, harvested crops
are perpetually measured at net realizable value until the point of
sale because there is an active market for such products, there is
a negligible risk that the produce will not be sold and there is a
well-established practice in the industry of measuring the
inventories at net realizable value. Changes in net realizable
value are recognized in the Statements of Income in the year in
which they arise under the line item “Changes in net
realizable value of agricultural produce after
harvest”.
Net
realizable value is the estimated selling price in the ordinary
course of business less selling expenses. It is determined on an
ongoing basis, taking into account the product type and aging,
based on the accumulated prior experience with the useful life of
the product. The Group periodically reviews the inventory and its
aging and books an allowance for impairment, as
necessary.
The
cost of consumable supplies, materials and other assets is
determined using the weighted average cost method, the cost of
inventories of mobile phones, related accessories and spare parts
is priced under the moving average method, and the cost of the
remaining inventories is priced under the first in, first out
(FIFO) method.
Cost
comprises all costs of purchase, costs of conversion and other
costs incurred in bringing the inventories to their present
location and condition. Inventories are recorded at the cash cost
and the difference between that and the actual amount paid is
treated as finance cost.
Inventories are
measured at the lower of cost or net realizable value.
2.13
Biological assets and agriculture produce at the point of
harvest
Biological assets
comprise unharvested crops (mainly corn, wheat, soybeans and
sunflower), sugarcane, livestock (breeding and dairy cattle and
cattle held for sale or meat production) and other less significant
biological assets such as sheep and tree plantations.
The
Group distinguishes between consumable and bearer biological
assets. Consumable biological assets are those assets that may be
harvested as agricultural produce or sold as biological assets, for
example livestock intended for the production of meat and/or
livestock held for sale. Bearer biological assets are those assets
capable of producing more than one harvest, for example sugarcane,
dairy cattle and breeding cattle. Consumable biological assets are
generally classified as current while bearer biological assets are
generally classified as non-current.
Expenses relating
to the agricultural activity include items as planting, harvesting,
irrigation, agrochemicals, fertilizers, veterinary services and
others. The Group elect to capitalize all costs as part of the
biological assets.
The
line item “Cost of sales of biological assets and
agricultural produce” within “Costs” in the
Statements of Income represents the recognition as an expense of
agricultural produce held in inventory, valued at either cost or
net realizable value, as applicable, or biological assets valued at
fair value less costs to sell.
Either
the fair value of a biological asset in its present location and
condition is determined based on the present value of expected net
cash flows from the biological asset discounted at a current
market-determined pre-tax rate or the current quoted market price
in the most relevant market.
Biological assets
are measured at fair value less costs to sell on initial
recognition and at each Statement of Financial Position date,
except where fair value cannot be reliably measured. Cost
approximates fair value when little or no biological transformation
has taken place since the costs were originally incurred or the
impact of biological transformation on price is not expected to be
material. Costs to sell include all incremental costs directly
attributable to the sale of the biological assets, excluding
finance costs and income taxes.
Additionally, the
Group’s costs of planting the sugarcane are accounted for as
property, plant and equipment and are valued at amortized cost. The
growing agricultural product of sugarcane is classified as a
biological asset and valued at fair value less costs to
sell.
F-25
Cresud Sociedad Anónima,
Comercial, Inmobiliaria, Financiera y Agropecuaria
The
gain or loss arising from initial recognition of a) agricultural
produce and b) biological assets at fair value less costs to sell
and from a change in fair value less costs to sell of a biological
asset is recognized in profit or loss in the year in which occur
within the line item “Initial recognition and changes in fair
value of biological assets and agricultural produce at the point of
harvest”.
2.14
Financial instruments
The
Group classifies financial assets in the following categories:
those to be measured subsequently at fair value, and those to be
measured at amortized cost. This classification depends on whether
the financial asset is an equity investment or a debt
investment.
Debt investments
A debt
investment is classified at amortized cost only if both of the
following criteria are met: (i) the objective of the Group’s
business model is to hold the asset to collect the contractual cash
flows; and (ii) the contractual terms give rise on specified dates
to cash derived solely from payments of principal and interest due
on the principal outstanding. The nature of any derivatives
embedded in the debt investment are considered in determining
whether the cash derives solely from payment of principal and
interest due on the principal outstanding and are not accounted for
separately.
If
either of the two criteria mentioned in the previous paragraph is
not met, the debt instrument is classified at fair value through
profit or loss. The Group has not designated any debt investment as
measured at fair value through profit or loss to eliminate or
significantly reduce an accounting mismatch. Changes in fair values
and gains from disposal of financial assets at fair value through
profit or loss are recorded within “Financial results,
net” in the Statement of Income.
Equity investments
All
equity investments, which are neither subsidiaries nor associate
companies nor joint venture of the Group, are measured at fair
value. Equity investments that are held for trading are measured at
fair value through profit or loss. For all other equity
investments, the Group can make an irrevocable election at initial
recognition to recognize changes in fair value through other
comprehensive income rather than profit or loss. The Group decided
to recognize changes in fair value of equity investments through
changes in profit or loss.
At
initial recognition, the Group measures a financial asset at its
fair value plus, in the case of a financial asset not at fair value
through profit or loss, transaction costs that are directly
attributable to the acquisition of the financial asset. Transaction
costs of financial assets carried at fair value though profit or
loss are expensed in the Statement of Income.
In
general, the Group uses the transaction price to ascertain the fair
value of a financial instrument on initial recognition. In the
other cases, the Group records a gain or loss on initial
recognition only if the fair value of the financial instrument can
be supported by other comparable transactions observable in the
market for the same type of instrument or if based on a technical
valuation that only inputs observable market data. Unrecognized
gains or losses on initial recognition of a financial asset are
recognized later on, only to the extent they arise from a change in
factors (including time) that market participants would consider
upon setting the price.
Gains/losses on
debt instruments measured at amortized cost and not identified for
hedging purposes are charged to income where the financial assets
are derecognized or an impairment loss is recognized, and during
the amortization process under the effective interest method. The
Group is required to reclassify all affected debt investments when
and only when its business model for managing those assets
changes.
The
Group assesses at the end of each reporting period whether there is
objective evidence that a financial asset or group of financial
assets measured at amortized cost is impaired. A financial asset or
a group of financial assets is impaired and impairment losses are
incurred only if there is objective evidence of impairment as a
result of one or more events that occurred after the initial
recognition of the asset (a ‘loss event’) and that loss
event (or events) can be reliably estimated. The amount of the loss
is measured as the difference between the asset’s carrying
amount and the present value of estimated future cash flows
(excluding future credit losses that have not been incurred)
discounted at the financial asset’s original effective
interest rate.
F-26
Cresud Sociedad Anónima,
Comercial, Inmobiliaria, Financiera y Agropecuaria
Financial assets
and liabilities are offset, and the net amount reported in the
statement of financial position, when there is a legally
enforceable right to offset the recognized amounts and there is an
intention to settle on a net basis, or realize the asset and settle
the liability simultaneously.
2.15
Derivative financial instruments and hedging activities and
options
Derivative
financial instruments are initially recognized at fair value. The
method of recognizing the resulting gain or loss depends on whether
the derivative is designated as a hedging instrument, and if so,
the nature of the item being hedged.
The
Group manages exposures to various risks using hedging instruments
that provide coverage. The Group does not use derivative financial
instruments for speculative purposes. To date, the Group has used
put and call options, foreign currency future and forward contracts
and interest rate swaps, as appropriate.
The
Group’s policy is to apply hedge accounting where it is
permissible under IFRS 9, practical to do so and its application
reduces volatility, but transactions that may be effective hedges
in economic terms may not always qualify for hedge accounting under
IFRS 9.
Trading
derivatives are classified as a current asset or liability on the
Statement of Financial Position. Gains and losses on derivatives
are classified according to their nature. Gains and losses on
commodity derivatives are classified within the line item
“Other operating income, net”. Gain and losses on all
other derivatives are classified in the Statements of Income where
the results of the items covered are recognized.
The
fair values of financial instruments that are traded in active
markets are computed by reference to market prices. The fair value
of financial instruments that are not traded in an active market is
determined by using valuation techniques. The Group uses its
judgment to select a variety of methods and make assumptions that
are mainly based on market conditions existing at the end as each
reporting period.
The
stock call options involving shares of subsidiaries agreed at a
fixed price are accounted for under shareholders’
equity.
2.16
Groups of assets and liabilities held for sale
Groups
of assets and liabilities are classified as held for sale when the
Group is expected to recover their value by means of a sale
transaction (rather than through use) and where such sale is highly
probable. Groups of assets and liabilities held for sale are valued
at the lower of their net book value and fair value less selling
costs.
2.17
Trade and other receivables
Trade
receivables are recognized initially at fair value and subsequently
measured at amortized cost using the effective interest
method.
An
allowance for doubtful accounts is recorded where there is
objective evidence that the Group may not be able to collect all
receivables within their original payment term. Indicators of
doubtful accounts include significant financial distress of the
debtor, the debtor potentially filing a petition for reorganization
or bankruptcy, or any event of default or past due
account.
In the
case of larger non-homogeneous receivables, the impairment
provision is calculated on an individual basis.
The
Group collectively evaluates smaller-balance homogeneous
receivables for impairment. For that purpose, they are grouped on
the basis of similar risk characteristics, and account asset type,
collateral type, past-due status and other relevant factors are
taken into account.
The
amount of the allowance is the difference between the asset’s
carrying amount and the present value of estimated future cash
flows, discounted at the original effective interest rate. The
carrying amount of the asset is reduced through the use of a
separate account, and the amount of the loss is recognized in the
Statements of Income within “Selling expenses”.
Subsequent recoveries of amounts previously written off are
credited against “Selling expenses” in the Statements
of Income.
F-27
Cresud Sociedad Anónima,
Comercial, Inmobiliaria, Financiera y Agropecuaria
2.18
Other
assets
Other
assets are recognized initially at cost and subsequently measured
at the acquisition cost or the net realizable value, the lower.
Within this item, the Group includes CLN tokens (digital
assets).
2.19
Trade
and other payables
Trade
payables are initially recognized at fair value and subsequently
measured at amortized cost using the effective interest
method.
2.20
Borrowings
Borrowings are
recognized initially at fair value, net of transaction costs
incurred. Borrowings are subsequently stated at amortized cost; any
difference between the proceeds (net of transaction costs) and the
redemption value is recognized as finance cost over the period of
the borrowings using the effective interest method.
2.21
Provisions
Provisions are
recognized when: (i) the Group has a present (legal or
constructive) obligation as a result of past events; (ii) it is
probable that an outflow of resources will be required to settle
the obligation; and (iii) a reliable estimate of the amount of the
obligation can be made. Provisions are not recognized for future
operating losses.
The
Group bases its accruals on up-to-date developments, estimates of
the outcomes of the matters and legal counsel´s experience in
contesting, litigating and settling matters. As the scope of the
liabilities becomes better defined or more information is
available, the Group may be required to change its estimates of
future costs, which could have a material adverse effect on its
results of operations and financial condition or
liquidity.
Provisions are
measured at the present value of the expenditures expected to be
required to settle the obligation using a pre-tax rate that
reflects current market assessments of the time value of money and
the risks specific to the obligation. The increase in the
provisions due to passage of time is recognized in the Statements
of Income.
2.22
Onerous
contracts
A
provision for onerous contracts is recognized when the expected
benefits are lower than the costs of complying with contractual
obligations. The provision is measured at the present value of the
lower of the expected cost of terminating the contract and the net
expected cost of continuing the contract. Before recognizing a
provision, the Group recognizes the impairment of the assets
related to the mentioned contract.
2.23
Irrevocable
right of use of the capacity of underwater communication
lines
Transactions
carried out to acquire an irrevocable right of use of the capacity
of underwater communication lines are accounted for as service
contracts. The amount paid for the rights of use of the
communication lines is recognized as “Prepaid expenses”
under trade and other receivables, and is amortized over a
straight-line basis during the period set forth in the contract
(including the option term), which is the estimated useful life of
such capacity.
2.24
Employee
benefits
(a)
Defined
contribution plans
The
Group operates a defined contribution plan, which is a pension plan
under which the Group pays fixed contributions into a separate
entity. The Group has no legal or constructive obligations to pay
further contributions if the fund does not hold sufficient assets
to pay all employees the benefits relating to employee service in
the current year or prior periods. The contributions are recognized
as employee benefit expense in the Statements of Income in the
fiscal year they are due.
F-28
Cresud Sociedad Anónima,
Comercial, Inmobiliaria, Financiera y Agropecuaria
(b)
Termination
benefits
Termination
benefits are payable when employment is terminated by the Group
before the normal retirement date, or whenever an employee accepts
voluntary redundancy in exchange for these benefits. The Group
recognizes termination benefits when it is demonstrably committed
to either terminating the employment of current employees according
to a detailed formal plan without possibility of withdrawal or as a
result of an offer made to encourage voluntary termination as a
result of redundancy.
(c)
Bonus
plans
The
Group recognizes a liability and an expense for bonuses based on a
formula that takes into consideration the profit attributable to
the Company’s shareholders after certain adjustments. The
Group recognizes a provision where contractually obliged or where
there is a past practice that has created a constructive
obligation.
(d)
Defined
benefit plans
The
Group’s net obligation concerning defined benefit plans are
calculated on an individual basis for each plan, estimating the
future benefits employees have gained in exchange for their
services in the current and prior periods. The benefit is disclosed
at its present value, net of the fair value of the plan assets.
Calculations are made on an annual basis by a qualified
actuary.
(e)
Share-based
payments
The
fair value of share-based payments is measured at the date of
grant. The Group measures the fair value using the valuation
technique that it considers to be the most appropriate to value
each class of award. Methods used may include Black-Scholes
calculations or other models as appropriate. The valuations take
into account factors such as non-transferability, exercise
restrictions and behavioral considerations.
The
fair value of the share-based payment is expensed and charged to
income under the straight-line method over the vesting period in
which the right to the equity instrument becomes irrevocable
(“vesting period”); such value is based on the best
available estimate of the number of equity instruments expected to
vest. Such estimate is revised if subsequent information available
indicates that the number of equity instruments expected to vest
differs from original estimates.
(f)
Other
long-term benefits
The net
obligations of IDBD, DIC and its subsidiaries concerning employee
long-term benefits, other than retirement plans, is the amount of
the minimum future benefits employees have gained in exchange for
their services in the current and prior periods. These benefits are
discounted at their present values.
2.25
Current
income tax, deferred income tax and minimum presumed income
tax
Tax
expense for the year comprises the charge for tax currently payable
and deferred income. Income tax is recognized in the statements of
income, except to the extent that it relates to items recognized in
other comprehensive income or directly in equity, in which case,
the tax is also recognized in other comprehensive income or
directly in equity, respectively.
Current
income tax charge is calculated on the basis of the tax laws
enacted or substantially enacted at the date of the Statements of
Financial Position in the countries where the Company and its
subsidiaries operate and generate taxable income. The Group
periodically evaluates positions taken in tax returns with respect
to situations in which applicable tax regulation is subject to
interpretation. The Group establishes provisions where appropriate
on the basis of amounts expected to be paid to the tax
authorities.
F-29
Cresud Sociedad Anónima,
Comercial, Inmobiliaria, Financiera y Agropecuaria
Income
tax is recognized, using the deferred tax liability method, on
temporary differences arising between the tax bases of assets and
liabilities and their carrying amounts in the Consolidated
Financial Statements. However, deferred tax liabilities are not
recognized if they arise from the initial recognition of goodwill;
deferred income tax is not accounted for if it arises from initial
recognition of an asset or liability in a transaction other than a
business combination that at the time of the transaction affects
neither accounting nor taxable profit or loss. Deferred income tax
is determined using tax rates (and laws) that have been enacted or
substantively enacted by the date of the Statements of Financial
Position and are expected to apply when the related deferred income
tax asset is realized or the deferred income tax liability is
settled.
Deferred income tax
assets are recognized only to the extent that it is probable that
future taxable profit will be available, against which the
temporary differences can be utilized. Deferred income tax is
provided on temporary differences arising on investments in
subsidiaries, joint ventures and associates, except for deferred
income tax liabilities where the timing of the reversal of the
temporary difference is controlled by the Group and it is probable
that the temporary difference will not reverse in the foreseeable
future.
Deferred income tax
assets and liabilities are offset when there is a legally
enforceable right to offset current tax assets against current tax
liabilities and when the deferred income taxes assets and
liabilities relate to income taxes levied by the same taxation
authority on either the same taxable entity or different taxable
entities where there is an intention to settle the balances on a
net basis.
The
Group is able to control the timing of dividends from its
subsidiaries and hence does not expect taxable profit. Hence,
deferred tax is recognized in respect of the retained earnings of
overseas subsidiaries only if at the date of the Statements of
Financial Position, dividends have been accrued as receivable a
binding agreement to distribute past earnings in future has been
entered into by the subsidiary or there are sale plans in the
foreseeable future.
Entities in
Argentina are subject to the Minimum Presumed Income Tax
(“MPIT”). Pursuant to this tax regime, an entity is
required to pay the greater of the income tax or the MPIT. The MPIT
provision is calculated on an individual entity basis at the
statutory asset tax rate of 1% and is based upon the taxable assets
of each company as of the end of the year, as defined by Argentine
law. Any excess of the MPIT over the income tax may be carried
forward and recognized as a tax credit against future income taxes
payable over a 10-year period. When the Group assesses that it is
probable that it will use the MPIT payment against future taxable
income tax charges within the applicable 10-year period, recognizes
the MPIT as a current or non-current receivable, as applicable,
within “Trade and other receivables” in the Statements
of Financial Position.
The
minimum presumed income tax was repelled by Law N ° 27,260 in
its article 76 for the periods that begin as of January 1,
2019.
Regarding the above
mentioned, considering the recent Instruction No. 2 of the Federal
Administration of Public Revenues (AFIP), it is not appropriate to
record the provision of the above mention tax, in the event that
accounting and tax losses occur.
2.26
Cash
and cash equivalents
Cash
and cash equivalents include cash on hand, deposits held with
banks, and other short-term liquid investments with original
maturities of three months or less. Bank overdrafts are not
included.
2.27
Revenue
recognition
Group's
revenue is measured at the fair value of the consideration received
or receivable.
Revenue
from the sale of property is recognized when: (a) material risks
and benefits derived from title to property have been transferred;
(b) the Company does not retain any management function on the
assets sold nor does it have any control whatsoever on such assets;
(c) the amount of revenues and costs associated to the transaction
may be measured on a reliable basis; and (d) the Company is
expected to accrue the economic benefits associated to the
transaction.
Revenue
derived from the provision of services is recognized when: (a) the
amount of revenue and costs associated to services may be measured
on a reliable basis; (b) the Company is expected to accrue the
economic benefits associated to the transaction, and (c) the level
of completion of services may be measured on a reliable
basis.
F-30
Cresud Sociedad Anónima,
Comercial, Inmobiliaria, Financiera y Agropecuaria
Agricultural activities
Revenue
from Group’s agricultural activities comes primarily from
sales of agricultural produce and biological assets, from provision
of services related to the activity and from leases of
farmlands.
The
Group recognizes revenue on product sales when the agricultural
produce or biological assets are delivered and the customers take
ownership and assume risk of loss, which is when the products are
received by the customer at its or a designated location or
collected directly by the customer from the cultivation bases,
collection is reasonably assured and the selling price is fixed or
determinable. Net sales of products represent the invoiced value of
goods, net of trade discounts and allowances, if any.
The
Group also provides agricultural-related (including but not limited
to watering and feedlot services) and brokerage services to third
parties. Revenue from services is recognized as services are
rendered.
The
Group also leases land to third parties under operating lease
agreements. Lease income is recognized on a straight-line basis
over the period of the lease.
Urban properties and investments activities
●
Rental and services
- Shopping malls portfolio
Revenues derived
from business activities developed in the Group’s shopping
malls mainly include rental income under operating leases,
admission rights, commissions and revenue from several
complementary services provided to the Group’s
lessees.
Rental
income from shopping mall, admission rights and commissions, are
recognized in the Statements of Income on a straight-line basis
over the term of the leases. When lease incentives are granted,
they are recognized as an integral part of the net consideration
for the use of the property and are therefore recognized on the
same straight-line basis.
Contingent rents,
i.e. lease payments that are not fixed at the inception of a lease,
are recorded as income in the periods in which they are known and
can be determined. Rent reviews are recognized when such reviews
have been agreed with tenants.
The
Group’s lease contracts also provide that common area
maintenance charges and collective promotion funds of the
Group’s shopping malls are borne by the corresponding
lessees, generally on a proportionally basis. These common area
maintenance charges include all expenses necessary for various
purposes including, but not limited to, the operation, maintenance,
management, safety, preservation, repair, supervision, insurance
and enhancement of the shopping malls. The lessor is responsible
for determining the need and suitability of incurring a common area
expense. The Group makes the original payment for such expenses,
which are then reimbursed by the lessees. The Group considers that
it acts as a principal in these cases. Service charge income is
presented separately from property operating expenses. Property
operating expenses are expensed as incurred.
●
Rental and services
- Offices and other rental properties
Rental
income from offices and other rental properties include rental
income from offices leased out under operating leases, income from
services and expenses recovery paid by tenants.
Rental
income from offices and other rental properties is recognized in
the Statements of Income on a straight-line basis over the term of
the leases. When lease incentives are granted, they are recognized
as an integral part of the net consideration for the use of the
property and are therefore recognized on the same straight-line
basis.
F-31
Cresud Sociedad Anónima,
Comercial, Inmobiliaria, Financiera y Agropecuaria
A
substantial portion of the Group’s leases requires the tenant
to reimburse the Group for a substantial portion of operating
expenses, usually a proportionate share of the allocable operating
expenses. Such property operating expenses include necessary
expenses such as property operating, repairs and maintenance,
security, janitorial, insurance, landscaping, leased properties and
other administrative expenses, among others. The Group manages its
own rental properties. The Group makes the original payment for
these expenses, which are then reimbursed by the lessees. The Group
considers that it acts as a principal in these cases. The Group
accrues reimbursements from tenants as service charge revenue in
the period the applicable expenditures are incurred and is
presented separately from property operating expenses. Property
operating expenses are expensed as incurred.
●
Revenue from
supermarkets
Revenue
from the sale of goods in the ordinary course of business is
recognized at the fair value of the consideration collected or
receivable, net of returns and discounts. When the credit term is
short and financing is that typical in the industry, consideration
is not discounted. When the credit term is longer than the
industry’s average, in accounting for the consideration, the
Group discounts it to its net present value by using the
client’s risk premium or the market rate. The difference
between the fair value and the nominal amount is accounted for
under financial income. If discounts are granted and their amount
can be measured reliably, the discount is recognized as a reduction
of revenue.
Revenues from
supermarkets have been recognized in discontinued operations (see
Note 4.(l)).
●
Revenue from
communication services and sale of communication
equipment
Revenue
derived from the use of the Group’s communication networks,
including mobile phones, Internet services, international calls,
fixed line calls, interconnection rates and roaming service rates,
are recognized when the service is provided, proportionally to the
extent the transaction has been realized, and provided all other
criteria have been met for revenue recognition.
Revenue
from the sale of mobile phone cards is initially recognized as
deferred revenue and then recognized as revenue as they are used or
upon expiration, whichever takes place earlier.
A
transaction involving the sale of equipment to a final user
normally also involves a service sale transaction. In general, this
type of sale is performed without a contractual obligation by the
client to consume telephone services for a minimum amount over a
predetermined period. As a result, the Group records the sale of
equipment separately and recognizes revenue pursuant to the
transaction value upon delivery of the equipment to the client.
Revenue from telephone services is recognized and accounted for as
they are provided. When the client is bound to make a minimum
consumption of services during a predefined period, the contract
formalizes a transaction of several elements and, therefore,
revenue from the sale of equipment is recorded at an amount that
should not exceed its fair value, and is recognized upon delivery
of the equipment to the client and provided the criteria for
recognition are met. The Group ascertains the fair value of
individual elements, based on the price at which it is normally
sold, after taking into account the relevant
discounts.
Revenue
derived from long-term contracts is recognized at the present value
of future cash flows, discounted at market rates prevailing on the
transaction date. Any difference between the original credit and
its net present value is accounted for as interest income over the
credit term.
2.28
Cost
of sales
The
cost of sales of supermarkets includes the acquisition costs for
the products less discounts granted by suppliers, as well as all
expenses associated with storing and handling inventories. It also
includes operational and management costs for shopping malls held
by the Group as part of its real estate investments. The
Group’s cost of sales in relation to the supply of
communication services mainly includes the costs to purchase
equipment, salaries and related expenses, service costs, royalties,
ongoing license dues, interconnection and roaming expenses, cell
tower lease costs, depreciation and amortization expenses and
maintenance expenses directly related to the services
provided.
F-32
Cresud Sociedad Anónima,
Comercial, Inmobiliaria, Financiera y Agropecuaria
2.29
Cost
of borrowings and capitalization
The
costs for general and specific loans that are directly attributable
to the acquisition, construction or production of suitable assets
for which a prolonged period is required to place them in the
conditions required for their use or sale, are capitalized as part
of the cost of those assets until the assets are substantially
ready for use or sale. The general loan costs are capitalized
according to the average debt rate of the Group. Foreign exchange
differences for loans in foreign currency are capitalized if they
are considered an adjustment to interest costs. The interest earned
on the temporary investments of a specific loan for the acquisition
of qualifying assets are deducted from the eligible costs to be
capitalized. The rest of the costs from loans are recognized as
expenses in the period in which they are incurred.
2.30
Share
capital
Ordinary shares are
classified as equity. Incremental costs directly attributable to
the issue of new ordinary shares or options are shown in equity as
a deduction, net of tax, from the proceeds.
When
any Group’s subsidiary purchases the Company’s equity
share capital (treasury shares), the consideration paid, including
any directly attributable incremental costs (net of income taxes)
is deducted from equity attributable to the Company’s equity
holders until the shares are cancelled or reissued. When such
ordinary shares are subsequently reissued, any consideration
received, net of any directly attributable incremental transaction
costs and related income tax effects, is included in
equity.
Instruments issued
by the Group that will be settled by the Company delivering a fixed
number of its own equity instruments in exchange for a fixed amount
of cash or another financial asset are classified as
equity.
2.31
Comparability
of information
As
required by IFRS 3, the information of IDBD is included in the
Consolidated Financial Statements of the Group from the date that
control was obtained, that is from October 11, 2015, and the prior
periods were not modified by this situation. Therefore, the
consolidated financial information for periods after the
acquisition is not comparable with prior periods. Additionally,
results for the fiscal year ended June 30, 2018 and 2017 includes
12 full months of results from IDBD, for the period beginning April
1st through March 31, while results for the fiscal year ended June
30, 2016 includes the results from IDBD for the period beginning
October 11, 2015 through March 31, 2016; both adjusted for
significant transactions that took place between April 1st. and
June 30. Hence, the result for the reported periods are not
comparable.
Furthermore, during
the fiscal year ended as of June 30, 2018 and 2016, the Argentine
Peso devalued against the US Dollar and other currencies by around
73% and 65%, respectively, which has an impact in comparative
information presented in the Financial Statements, due mainly to
the currency exposure of our assets and liabilities in foreign
currency. During the fiscal year ended as of June 30, 2017, the
devaluation of the Argentine Peso against the US Dollar was not
significant.
The
balances as of June 30, 2017 and 2016, which are disclosed for
comparative porpoises arise from the Consolidated Financial
Statements as of June 30, 2017. Certain items from prior fiscal
years have been reclassified for consistency purposes. See Note
4.(l) regarding the loss of control in Shufersal.
2.32
Out-of-period
adjustments
During
the fiscal year ended June 30, 2017, the Group reclassified Ps. 31
into intangible assets, Ps. 224 into investment property, Ps. 59
into deferred tax liabilities and Ps. 133 into non-controlling
interests, with modifications to such items by those amounts for
the previous fiscal year. These reclassifications were not material
to the Financial Statements previously issued, and are not material
to these Consolidated Financial Statements, either individually or
as a whole.
F-33
Cresud Sociedad Anónima,
Comercial, Inmobiliaria, Financiera y Agropecuaria
3.
Significant judgments, key assumptions and
estimates
Not all
of these significant accounting policies require management to make
subjective or complex judgments or estimates. The following is
intended to provide an understanding of the policies that
management considers critical because of the level of complexity,
judgment or estimations involved in their application and their
impact on the Consolidated Financial Statements. These judgments
involve assumptions or estimates in respect of future events.
Actual results may differ from these estimates.
|
Estimation
|
Main
assumptions
|
Potential
implications
|
Main
references
|
|
Business
combination - Allocation of acquisition prices
|
Assumptions
regarding timing, amount of future revenues and expenses, revenue
growth, expected rate of return, economic conditions, and discount
rate, among other.
|
Should
the assumptions made be inaccurate, the recognized combination may
not be correct.
|
|
|
Recoverable amounts
of cash-generating units (even those including goodwill),
associates and assets.
|
The
discount rate and the expected growth rate before taxes in
connection with cash-generating units.
The
discount rate and the expected growth rate after taxes in
connection with associates.
Cash
flows are determined based on past experiences with the asset or
with similar assets and in accordance with the Group’s best
factual assumption relative to the economic conditions expected to
prevail.
Business continuity
of cash-generating units.
Appraisals made by
external appraisers and valuators with relation to the
assets’ fair value, net of realization costs (including real
estate assets).
|
Should
any of the assumptions made be inaccurate; this could lead to
differences in the recoverable values of cash-generating
units.
|
Note 10
– Property, plant and equipment
Note 12
– Intangible assets
|
|
Control, joint
control or significant influence
|
Judgment relative
to the determination that the Group holds an interest in the shares
of investees (considering the existence and influence of
significant potential voting rights), its right to designate
members in the executive management of such companies (usually the
Board of directors) based on the investees’ bylaws; the
composition and the rights of other shareholders of such investees
and their capacity to establish operating and financial policies
for investees or to take part in the establishment
thereof.
|
Accounting
treatment of investments as subsidiaries (consolidation) or
associates (equity method)
|
Note
2.5
|
|
Estimated useful
life of intangible assets and property, plant and
equipment
|
Estimated useful
life of assets based on their conditions.
|
Recognition of
accelerated or decelerated depreciation by comparison against final
actual earnings (losses).
|
|
|
Fair
value valuation of investment properties
|
Fair
value valuation made by external appraisers and valuators. See Note
10.
|
Incorrect valuation
of investment property values
|
|
|
Income
tax
|
The
Group estimates the income tax amount payable for transactions
where the Treasury’s Claim cannot be clearly
determined.
Additionally, the
Group evaluates the recoverability of assets due to deferred taxes
considering whether some or all of the assets will not be
recoverable.
|
Upon
the improper determination of the provision for income tax, the
Group will be bound to pay additional taxes, including fines and
compensatory and punitive interest.
|
|
|
Allowance for
doubtful accounts
|
A
periodic review is conducted of receivables risks in the
Group’s clients’ portfolios. Bad debts based on the
expiration of account receivables and account receivables’
specific conditions.
|
Improper
recognition of charges / reimbursements of the allowance for bad
debt.
|
|
|
Level 2
and 3 financial instruments
|
Main
assumptions used by the Group are:
●
Discounted
projected income by interest rate
●
Values determined
in accordance with the shares in equity funds on the basis of its
Financial Statements, based on fair value or investment
assessments.
●
Comparable market
multiple (EV/GMV ratio).
●
Underlying
asset price (Market price); share price volatility (historical) and
market interest rate (Libor rate curve).
|
Incorrect
recognition of a charge to income / (loss).
|
Note 15
– Financial instruments by category
|
|
Probability
estimate of contingent liabilities.
|
Whether
more economic resources may be spent in relation to litigation
against the Group, such estimate is based on legal advisors’
opinions.
|
Charge
/ reversal of provision in relation to a claim.
|
|
|
Qualitative
considerations for determining whether or not the replacement of
the debt instrument involves significantly different
terms
|
The
entire set of characteristics of the exchanged debt instruments,
and the economic parameters represented therein:
Average
lifetime of the exchanged liabilities; Extent of effects of the
debt terms (linkage to index; foreign currency; variable interest)
on the cash flows from the instruments.
|
Classification of a
debt instrument in a manner whereby it will not reflect the change
in the debt terms, which will affect the method of accounting
recording.
|
(Financial
liabilities)
|
|
Biological
assets
|
Main
assumptions used in valuation are yields, production costs, selling
expenses, forwards of sales prices, discount rates.
|
Wrong
recognition/valuation of biological assets. See sensitivities
modeled on these parameters in Note 13.
|
|
F-34
Cresud Sociedad Anónima,
Comercial, Inmobiliaria, Financiera y Agropecuaria
4.
Acquisitions
and disposals
Agricultural
business
(a)
Sale
and purchase of Farmlands
La Suiza
On June
29, 2018, Cresud signed a deed with a non-related third party for
the sale of a fraction of 10,000 hectares of livestock activity of
"La Suiza". The total amount of the transaction was set at USD 10,
of which USD 3.0 have been already paid. The remaining balance of
USD 7.0, guaranteed by a mortgage on the property, will be
collected in 10 installments of the same amount ending on June
2023, which will accrue an annual interest of 4.5% on the remaining
balances. The gain of the transaction amounts approximately to Ps.
238.
La Esmeralda
On July
20, 2017, the Company executed a purchase-sale agreement for all of
“La Esmeralda” establishment consisting of 9,352
hectares devoted to agricultural and cattle raising activities in
the 9 de Julio district, Province of Santa Fe, Argentina. On June
25, 2018, the Company has made effective with the sign of the deed
and delivery of the property, the sale of "La Esmeralda" farm. The
amount of the transaction was set at USD 19, of which USD 7 have
been already paid. The balance, guaranteed with a mortgage on the
property, will be collected in four installments of the same amount
ending in April 2022, which will accrue an annual interest of 4% on
the remaining balances. The gain from the sale amounts
approximately to Ps. 410.
Araucária
On May
3, 2018, the Group though its subsidiary Braslagro, has entered
into a purchase-sale agreement for the partial sale 956 hectares
(660 arable hectares) of Araucaria Farm, located in Mineiros,
Brazil, for an amount of 1,208 soybean bags per arable hectare or
Rs. 66.2 (equal to Ps. 447.2) (Rs./ha. 93,356). The Group has
recognized gains of Ps. 258 as result of this
transaction.
In May
2017,
the Group, through
Brasilagro
sold part of the establishment Araucária, a
farmland located in the municipality of Mineiros. The agreement
sets forth the sale of 1,360 hectares of which 918 are developed
and productive hectares. The sale price was fixed at 280 bags of
soy per hectare or Rs. 17 (equal to Ps. 67). So far, 35% of the
transaction price has been paid during the year, with the remaining
balance being payable in five annual installments. The Group has
recognized gains of Ps. 37.4 as result of this
transaction.
In
March 2017,
the Group, through
Brasilagro
sold part of the establishment Araucária.
The agreement sets forth the sale of 274 hectares of which 196 are
developed and productive hectares. The sale price amounts to 1,000
bags of soybeans per hectare, or Rs. 13.2 (equivalents to Ps. 48),
of which so far, 39,254 bags of soybeans have been collected,
equivalent to Rs. 2.4; and the balance will be paid in four annual
installments. The Group has recognized gains of Ps. 29.9 as result
of this transaction.
Cuatro Vientos
On June
30, 2017, Yatay Agropecuaria S.A. sold to an unrelated third party
the establishment “Cuatro Vientos”, which includes
2,658 hectares devoted to sugarcane and agricultural activity,
located in the Department of Santa Cruz in Bolivia.
The
transaction totaled US$ 14.23 (US$/ha. 5,280) (equal to Ps. 222);
to date, US$ 7.42 have already been paid, with the remaining
balance of US$ 6.85 being secured by a first lien mortgage. The
outstanding balance becomes payable on December 28, 2017 together
with the discharge of mortgage.
During
the year 2017, the Group recognized a gain of US$ 4.5 (equivalents
to Ps. 76.2) as result of this transaction.
F-35
Cresud Sociedad Anónima,
Comercial, Inmobiliaria, Financiera y Agropecuaria
Finca Mendoza
On June
8, 2017, Cresud and Zander Express S.A. (co-owners with 40% and 60%
interests, respectively) executed a conveyance deed with Simplot
Argentina S.R.L. for the sale of 262 hectares of the plot of land
located on National Route 7 of the city of Luján de Cuyo,
Province of Mendoza. The total price is US$ 2.2, which were fully
paid upon execution of the deed. The Group has recognized gains of
Ps. 11.8 as result of this transaction.
Jatobá
In June
2017,
the Group, through
Brasilagro
sold 625 hectares of the property Jatobá
located in Jaborandi, Bahía. The transaction price was fixed
at 300 bags of soy per hectare or Rs. 10.1 (equal to Ps. 41); so
far, Rs. 877 have already been paid, with the outstanding balance
being payable in 5 annual installments starting in July 2017. The
Group has recognized gains of Ps. 32.1 as result of this
transaction.
El Invierno and La Esperanza
On July
5, 2016, Cresud has sold the field “El Invierno” and
“La Esperanza” of 2,615 hectares of agricultural
activity located in “Rancul”, province of La Pampa. The
total amount of the transaction was fixed at US$ 6, US$ 5 of which
have been paid while the remaining balance of US$ 1 – secured
by a mortgage on the property – will be paid in five equal,
consecutive, annual installments, with the last being due in August
2021. The Group has recognized gains of Ps. 71.6 as result of this
transaction.
São José
In
February 2017,
the Group, through
Brasilagro
entered into a sale and sharecropping agreement
for a farmland property located in the municipality of São
Raimundo das Mangabeiras, in the state of Maranhão. The sale
agreement consists in the acquisition of 17,566 hectares, of which
10,000 are developed and productive lands that will be devoted to
farming. The remaining 7,566 hectares consist of permanent
conservation and legal reservation areas. The purchase price is Rs.
100, which will be paid in full upon fulfillment of certain prior
conditions by sellers. The sharecropping consists of 15,000
hectares of cultivable and developed land, already planted mostly
with sugar cane. The agreement is valid for 15 years and renewable
for another 15 years.
Cremaq
On June
10, 2015,
the Group, through
Brasilagro
sold the remaining area of 27,745 hectares of
Cremaq field, an establishment, located in the municipality of
Baixa Grande do Ribeiro (Piaui). The transaction price was Rs. 270
(equivalents to Ps. 694), which has already been fully cashed.
During the year 2015, the Group recognized a profit of Ps. 525.9 as
result of this transaction.
Due to
a contractual condition not yet fulfilled on the transaction date,
related to obtaining a license for deforestation of an additional
area, part of such proceeds had not been accounted for yet. In
March 2017, the Company complied with such condition and recognized
a gain of Ps. 21.
(b)
Cresca disposal
In
December 2016, the shareholders of Cresca (a Paraguayan company),
Carlos Casado (a third party) and Brasilagro, started a corporate
reorganization and division of assets of this joint
venture.
On
June 8, 2017, the Shareholders’ Meeting approved the
reorganization plan and division of assets.
In
February 2018, the disposal of assets of Cresca was completed. As a
result, the Group, through Brasilagro, disposed their interest in
the joint venture and subsequently acquired a group of assets,
which meets the definition of business in accordance with paragraph
42 of IFRS 3.
F-36
Cresud Sociedad Anónima,
Comercial, Inmobiliaria, Financiera y Agropecuaria
Therefore,
the Group, through Brasilagro holds 100% of the capital and votes
of Palmeiras and Morotí (successor companies), both Paraguayan
companies, which continued the exploitation previously carried out
by Cresca. Likewise, Cresca will continue to exist with the
remaining assets consisting of cash and a receivable to cover the
expenses related to the disosal. The Group, through Brasilagro
continues to hold a 50% interest in the aforementioned residual
entity.
The
consideration for the acquisition of the business is the investment
previously held in Cresca.
The
Group has recognized a gain of Ps. 510 as result of this
transaction, that has been recognized in the line “Other
operating results, net" (Note 27).
The
following table summarizes the consideration, the fair values of
the assets acquired and the liabilities assumed at acquisition
date:
|
|
February 2018
|
|
Assets
|
941
|
|
Cash
and cash equivalents
|
1
|
|
Trade
and other receivables
|
27
|
|
Income
tax credit
|
12
|
|
Property,
plant and equipment
|
901
|
|
Liabilities
|
172
|
|
Trade
and other payables
|
11
|
|
Debts
with related parties
|
121
|
|
Taxes
payable
|
40
|
|
Equity
|
|
|
Currency
translation adjustment
|
9
|
|
Total fair value of identifiable assets and assumed
liabilities
|
778
|
(c)
Sale
of shares from FyO
On
November 9, 2017, Cresud sold to a non-related party 154,929 shares
of its subsidiary FyO, representing 9.49% of FyO’s capital
stock for an amount of US$ 3.04, which were collected in full. As a
result, Cresud reduced its equity interest in FyO from 59.59% to
50.10%.
This
transaction was accounted in equity, resulting in an increase in
non-controlling interest of Ps. 10.2 and an increase in the equity
holders of the parent of Ps. 43.
Urban
properties and investments business
Operations
Center in Argentina
(d)
Sale
of ADS and shares from IRSA CP
During
October 2017 and February 2018, IRSA and its subsidiaries completed
the sale in the secondary market of 10,420,075 ordinary shares of
IRSA CP, par value Ps. 1 per share, represented by American
Depositary Shares (“ADSs”), representing 4 ordinary
shares each, which represents nearly 8.27% of IRSA CP capital for a
total amount of Ps. 2,489 (US$ 140). After the transaction,
IRSA’s direct and indirect interest in IRSA CP amounts to
approximately 86.34%. This transaction was accounted in equity as
an increase in the equity attributable to the parent for an amount
of Ps. 172, net of taxes.
(e)
Acquisition
of Philips Building
On June
5, 2017, the Group, through IRSA CP, acquired the Philips Building
located in Saavedra, Autonomous City of Buenos Aires, next to the
DOT Shopping Mall. The building has a constructed area of 10,142
square meters and is intended for office development and lease. The
acquisition price was US$ 29 million, which was fully paid up as of
June 30, 2017. Furthermore, IRSA CP has signed a bailment contract
with the seller for a term of 7 months and 15 days, which has
expired automatically on January 19, 2018.
F-37
Cresud Sociedad Anónima,
Comercial, Inmobiliaria, Financiera y Agropecuaria
Operations
Center in Israel
(f)
Purchase
of DIC shares by Dolphin
As
mentioned in Note 7, in connection with the Promotion of
Competition and Reduction of Concentration Law in Israel, Dolphin
Netherlands B.V. made a non-binding tender offer for the
acquisition of all DIC shares held by IDBD. For purposes of the
transaction, a committee of independent directors has been set up
to assess the tender offer and negotiate the terms and conditions.
The Audit Committee has issued an opinion without reservations as
to the transaction in accordance with the terms of section 72 et
al. of the Capital Markets Law N° 26,831.
On
November 2017, Dolphin IL, a subsidiary of Dolphin Netherlands
B.V., has subscribed the final documents for the acquisition of the
total shares owned by IDBD in DIC.
The
transaction has been made for an amount of NIS 1,843 (equivalent to
NIS 17.20 per share of DIC). The consideration was paid NIS 70 in
cash (equivalent to Ps. 348 as of the date of the transaction) and
NIS 1,773 (equivalent to Ps. 8,814 as of the date of the
transaction) were financed by IDBD to Dolphin, maturing in five
years, with the possibility of an extension of three additional
years in tranches of one year each, that will accrue an initial
interest of 6.5% annually, which will increase by 1% annually in
case of extension for each annual tranche. Furthermore, guarantees
have been implemented for IDBD, for IDBD bondholders and their
creditors, through pledges of different degree of privilege over
DIC shares resulting from the purchase. Moreover, a pledge will be
granted in relation to 9,636,097 (equivalent to 6.38%) of the
shares of DIC that Dolphin currently holds in the first degree of
privilege in favor of IDBD and in second degree of privilege in
favor of IDBD's creditors. This transaction has no effect in the
Groups consolidation structure and has been accounted in equity as
a decrease in the equity attributable to the parent for an amount
of Ps. 72.
(g)
Purchase
of IDBD shares to IFISA
On
December 2017, Dolphin Netherlands BV has executed a stock purchase
agreement for all of the shares that IFISA held of IDBD, which
amounted to 31.7% of the capital stock. In this way, as of that
date, Dolphin holds the 100% of IDBD's shares.
The
transaction was made at a price of NIS 398 (equivalent to NIS 1.894
per share and approximately to Ps. 1,968 as of the date of the
transaction). As consideration of the transaction, all receivables
from IFISA to Dolphin have been canceled plus a payment of USD 33.7
(equivalents to Ps. 588 as of the date of the transaction). This
transaction was accounted in equity as a decrease in the equity
attributable to the parent for an amount of Ps. 1,853.
(h)
Partial
sale of Clal
On
May 1, 2017, August 30, 2017, January 1, 2018 and May 3, 2018
continuing with the instructions given by the Commissioner of
Capital Markets, Insurance and Savings of Israel, IDBD has sold in
each of the abovementioned dates a 5% of its stake in Clal through
a swap transaction. The consideration was set at an amount of
approximately NIS 644.5 (equivalent to approximately Ps. 3,228
considering exchange date at each date). After the completion of
the transaction, IDBD’s interest in Clal was reduced to 34.8%
of its share capital.
(i)
Agreement
for New Pharm acquisition
On
April 6, 2017, Shufersal entered into an agreement (the
"agreement") with Hamashbir 365 Holdings Ltd. ("the seller" or
"Hamashbir") for the purchase of the shares of New Pharm Drugstores
Ltd. ("New Pharm"), representative of 100% of that Company’s
share capital ("the shares sold"). On December 20, 2017, the
transaction was completed and Shufersal became the sole shareholder
of New Pharm prior to the sale of a Shufersal store and approval of
the transaction by the antitrust commission. The price paid, net of
the respective adjustments to the transaction price, was NIS 126
(equivalent to Ps. 630 at the date of the
transaction).
F-38
Cresud Sociedad Anónima,
Comercial, Inmobiliaria, Financiera y Agropecuaria
The
following table resumes consideration and fair value of the
acquired assets and the liabilities assumed:
|
|
December 2017
|
|
Fair value of identifiable assets and assumed
liabilities:
|
|
|
Properties,
plant and equipment
|
200
|
|
Inventories
|
380
|
|
Trade
and other receivables
|
335
|
|
Cash
and cash equivalents
|
25
|
|
Borrowings
|
(260
)
|
|
Trade
and other payables
|
(930
)
|
|
Employee
benefits
|
(25
)
|
|
Provisions
|
(15
)
|
|
Total net identifiable assets
|
(290
)
|
|
Goodwill
(pending allocation)
|
920
|
|
Total
|
630
|
If New
Pharm had been acquired since the beginning of the year, the
Group's consolidated statement of income for the year ended June
30, 2018 would show a net pro-forma discontinued operations result
of Ps. 12,189.
(j)
Increase
of interest in Cellcom
On June
27, 2018, Cellcom raised its share capital for a gross total of NIS
280 million (approximately Ps. 2,212 as of that date). DIC took
part in such raise by acquiring 6,314,200 shares for a total amount
of NIS 145.9 million (approximately Ps. 1,152). In addition, on
June 26, 2018, DIC engaged in a swap transaction with a bank for
1,150,000 shares of Cellcom from third parties. The following are
the main characteristics of the transaction:
●
DIC has the voting
rights but not the economic rights over the shares under the swap
transaction,
●
The maturity of the
swap is 90 day
●
The impact on
results of the swap transaction is the difference of the price per
share between the subscription date and the date of its
cancellation.
After
the abovementioned transactions, the equity interest that DIC has
on Cellcom rose from 42.07% to 43.14% and the percentage of voting
rights rose from 45.45% to 46.16% without considering the swap
transaction.
(k)
Negotiations
between Israir and Sun d’Or
On June
30, 2017, IDB Tourism was at an advanced stage of negotiations with
Sun d’Or International Airlines Ltd. (“Sun
d’Or”), a subsidiary of El Al Israel Airlines Ltd. ("El
Al”) and on July 2, 2017 an agreement was signed, which has
been rejected by the Antitrust Commission on January 10,
2018.
As a
consequence of this process, the Group’s Financial Statements
as of June 30, 2018 and 2017 present the investment in Israir as
assets and liabilities held for sale, and a loss of nearly NIS 56
(approximately equivalent to Ps. 231 as of December 31, 2016 when
it was reclassified to discontinued operation), as a result of
measuring these net assets at the estimated recoverable value. The
Group is evaluating the reasons for the objection and has appealed
this situation. The group evaluated that the criteria to continue
classifying the investment as discontinued operations as
established by IFRS 5 are maintained.
(l)
Changes
of interest in Shufersal
During
the fiscal year ended June 30, 2017, the Group – through DIC
and several transactions – increased its interest in
Shufersal capital stock by 7.7% upon payment of a net amount of NIS
235 (equivalent to approximately Ps. 935) and in March 2017, DIC
sold 1.38% of Shufersal in an amount of NIS 50 (equal to Ps. 210 as
of that date) Additionally, on December 24, 2017, DIC sold
Shufersal shares, decreasing its stake from 53.30% to 50.12%. The
consideration with respect to the sale of the shares amounted to
NIS 169.5 (equivalent to Ps. 847 on the day of the transaction).
Both transactions were accounted for as an equity transaction
generating an increase in the equity attributable to the
controlling shareholder in the amount of Ps. 182 and Ps. 244
respectively.
On
June 16, 2018, DIC announced the sale of a percentage of its stake
in Shufersal to institutional investors. The same was completed on
June 21, 2018. The percentage sold amounted to 16.56% and the net
amount charged was approximately NIS 848 (equivalent to Ps. 6,420
on the day of the transaction), consequently DIC lost control of
Shufersal, so the Group deconsolidated the subsidiary on that
date.
F-39
Cresud Sociedad Anónima,
Comercial, Inmobiliaria, Financiera y Agropecuaria
Below
are the details of the sale:
|
|
06.30.18
|
|
Cash
received
|
6,420
|
|
Remediation
of the fair value of the remaining interest
|
13,164
|
|
Total
|
19,584
|
|
Net
assets disposed including goodwill
|
(8,501
)
|
|
Gain from the sale of a subsidiary, net of taxes (*)
|
11,083
|
(*)
Includes Ps. 2,643 as a result of the sale and Ps. 8,440 as a
result of the remeasurement at fair value of the new
stake.
The
following table details the net assets disposed:
|
|
06.30.18
|
|
Investment
properties
|
4,489
|
|
Property,
plant and equipment
|
29,001
|
|
Intangible
assets
|
7,108
|
|
Investments
in associates and joint ventures
|
401
|
|
Restricted
assets
|
91
|
|
Trade
and other receivables
|
12,240
|
|
Investments
in financial assets
|
2,846
|
|
Derivative
financial instruments
|
23
|
|
Inventories
|
6,276
|
|
Cash
and cash equivalents
|
5,579
|
|
TOTAL ASSETS
|
68,054
|
|
Borrowings
|
21,310
|
|
Deferred
income tax liabilities
|
2,808
|
|
Trade
and other payables
|
23,974
|
|
Provisions
|
447
|
|
Employee
benefits
|
1,279
|
|
Salaries
and social security liabilities
|
2,392
|
|
Income
tax and MPIT liabilities
|
8
|
|
TOTAL LIABILITIES
|
52,218
|
|
Non-controlling
interest
|
7,335
|
|
Net assets disposed including goodwill
|
8,501
|
(m)
Interest increase in DIC
On
September 23, 2016 Tyrus acquired 8,888,888 of DIC’s shares
from IDBD for a total amount of NIS 100 (equivalent to Ps. 401 as
of that date), which represent 8.8% of the Company’s
outstanding shares at such date.
During
March 2017, IDBD exercised all of DIC’s Series 5 and 6
warrants for nearly NIS 210 (approximately equivalent to Ps. 882 as
of that date), thereby increasing its direct interest in DIC to
nearly 70% of such company’s share capital as of that date
and the Group's equity interest to 79.47%. Subsequently, third
parties not related to the Group, exercised their warrants, thus
diluting the Group’s interest in DIC to 77.25%. This
transaction was accounted for as an equity transaction generating a
decrease in equity attributable to the controlling shareholder in
the amount of Ps. 262.
(n)
Sale
of Adama
On
August 2016, Koor (a wholly owned company by DIC) and a subsidiary
of ChemChina executed an agreement to obtain the 40% of the shares
of Adama held by Koor. The price of the transaction included a
payment in cash of US$ 230 plus the total repayment of the
non-recourse loan and its interests, which had been granted to Koor
by a Chinese bank. On November 22, 2016, the sale transaction was
finalized and Koor received cash in the amount of US$ 230. As of
June 30, 2017, the Company recorded a gain of Ps. 4,216 pursuant to
the sale. Our share in the results of Adama was retrospectively
classified as discontinued operations in the Group’s
Consolidated Statements of Income as from July 17, 2016 (see Note
35).
(o)
Partial
sale of equity interest in PBC
DIC
sold 12% of its equity interest in PBC for a total consideration of
NIS 217 (equivalent to approximately
Ps.
810); as a result, DIC’s interest in PBC has declined to
64.4%. This transaction was accounted for as an equity transaction
generating an increase in equity attributable to the controlling
shareholder in the amount of Ps. 22.
F-40
Cresud Sociedad Anónima,
Comercial, Inmobiliaria, Financiera y Agropecuaria
(p)
Partial
sale of equity interest in Gav Yam
On
December 5, 2016, PBC sold 280,873 shares of its subsidiary Gav-Yam
Land Corporation Ltd. for an amount of NIS 391 (equivalent to Ps.
1,616 as of that date). As a result of this transaction, the equity
interest has decreased to 55.06%. This transaction was accounted
for as an equity transaction generating an increase in equity
attributable to the controlling shareholder in the amount of Ps.
117.
5.
Financial
risk management and fair value estimates
The
Group's activities expose it to a variety of financial risks:
market risk (including foreign currency risk, interest rate risk,
indexing risk due to specific clauses and other price risks),
credit risk, liquidity risk and capital risk. Within the Group,
risk management functions are conducted in relation to financial
risks associated to financial instruments to which the Group is
exposed during a certain period or as of a specific
date.
The
general risk management policies of the Group seek both to minimize
adverse potential effects on the financial performance of the Group
and to manage and control the financial risks effectively. The
Group uses financial instruments to hedge certain risk exposures
when deemed appropriate based on its internal management risk
policies, as explained below.
Given
the diversity of characteristics in the activities conducted under
its business and operations center, the Group has decentralized the
risk management policies based on two significant line of business:
(i) agricultural business and (ii) urban properties and investments
business, which is divided into two: (a) Argentina and (b) Israel,
in order to identify and properly analyze the various types of
risks to which each of the subsidiaries is exposed.
The
Group’s main financial instruments in the agricultural
business and urban properties and investments business of the
Operation Center in Argentina comprise cash and cash equivalents,
receivables, payables, interest bearing assets and liabilities,
other financial liabilities, other investments and derivative
financial instruments. The Group manages its exposure to key
financial risks in accordance with the Group’s risk
management policies.
The
Group’s management framework includes policies, procedures,
limits and allowed types of derivative financial instruments. The
Group has established a Risk Committee, comprising members of
senior management and a member of the Audit Committee, which
reviews and oversees management’s compliance with these
policies, procedures and limits and has overall accountability for
the identification and management of risk across the
Group.
Given
the diversity of the activities conducted by the Operations Center
in Israel of the urban properties and investments business (IDBD,
DIC and its subsidiaries), and the resulting risks, IDBD and DIC
manage the exposure to their own key financial risks and those of
its wholly-owned subsidiaries (except for IDB Tourism) in
conformity with a centralized risk management policy, with the
non-wholly owned IDBD and DIC subsidiaries being responsible for
establishing the risk policy, taking action to cover market risks
and managing their activities in a decentralized way. Both IDBD and
DIC as holding and each subsidiary are responsible for managing
their own financial risks in accordance with agreed global
guidelines. The Chief Financial Officers of each entity are
responsible for managing the risk management policies and systems,
the definition of hedging strategies, insofar as applicable and
based on any restriction that may be apply as a result of financial
debt, the supervision of its implementation and the answer to such
restrictions. The management framework includes policies,
procedures, limits and allowed types of derivative financial
instruments.
This
section provides a description of the principal risks that could
have a material adverse effect on the Group’s strategy,
performance, results of operations and financial condition. The
risks facing the businesses, set out below, do not appear in any
particular order of potential materiality or probability of
occurrence.
The
analysis of sensitivities to market risks included below are based
on a change in one factor while holding all other factors constant.
In practice, this is unlikely to occur, and changes in some of the
factors may be correlated – for example, changes in interest
rate and changes in foreign currency rates.
This
sensitivity analysis provides only a limited, point-in-time view.
The actual impact on the Group’s financial instruments may
differ significantly from the impact shown in the sensitivity
analysis.
F-41
Cresud Sociedad Anónima,
Comercial, Inmobiliaria, Financiera y Agropecuaria
(a)
Market
risk management
Market
risk is the risk that the market prices, the fair value or the
future cash flows of financial instrument instruments with which
the Group operates will fluctuate due to changes in market prices.
The Group’s market risks arise from open positions in foreign
currencies, interest-bearing assets and liabilities, commodity
price risks and equity securities of certain companies, to the
extent that these are exposed to market value movements. The Group
sets limits on the exposure to these risks that may be accepted,
which are monitored on a regular basis.
Foreign Exchange risk and associated derivative financial
instruments
The
Group publishes its Consolidated Financial Statements in Argentine
pesos but conducts operations and holds positions in other
currencies. As a result, the Group is exposed to foreign currency
exchange risk through exchange rate movements, which affect the
value of the Group’s foreign currency positions. Foreign
exchange risk arises when future commercial transactions or
recognized assets or liabilities are denominated in a currency that
is not the entity’s functional currency.
The
Group's activities are carried out as follows:
1)
Agricultural business
: The commercial
and/or agro-industrial activities of the Group's subsidiaries are
primarily developed in Argentina and have as functional currency
the Argentine Peso. The agricultural activities of the
Group’s subsidiaries are primarily developed in Argentina,
Brazil and Bolivia, where the functional currencies are the
respective local currencies.
2)
Urban properties
and investments business:
-
Operation Center in Argentina
: The real
estate, commercial and/or financial activities of the Group’s
subsidiaries from the operations center in Argentina have the
Argentine Peso as functional currency. An important part of the
business activities of these subsidiaries is conducted in that
currency, thus not exposing the Group to foreign exchange risk.
Other Group's subsidiaries have other functional currencies,
principally US Dollar. In the ordinary course of business, the
Group, through its subsidiaries, transacts in currencies other than
the respective functional currencies of the subsidiaries. These
transactions are primarily denominated in US Dollars and New
Israeli Shekel.
-
Operation Center in Israel:
Real
estate, business and/or financial activities of IDBD subsidiaries
in the operations center in Israel are developed mainly in Israeli
currency, although some operations, mostly borrowing, are expressed
in United States’ dollars, thereby exposing IDBD to a foreign
currency risk.
An
important part of the business activities of these subsidiaries is
conducted in above-mentioned local currencies, thus not exposing
the Group to foreign exchange risk. Net financial position exposure
to the functional currencies is managed on a case-by-case basis,
partly by entering into foreign currency derivative instruments
and/or by borrowings in foreign currencies, or other methods,
considered adequate by the Management, according to
circumstances.
Financial
instruments are considered sensitive to foreign exchange rates only
when they are not in the functional currency of the entity that
holds them. The following tables shows the net carrying amounts of
the Company’s financial instruments nominated in US$ and NIS,
broken down by the functional currencies in which the Company
operates for the years ended June 30, 2018 and 2017. The amounts
are presented in Argentine Pesos, the presentation currency of the
Group:
1)
Agricultural business
|
|
Net
monetary position (Liability)/Asset
|
|
|
|
06.30.18
|
06.30.17
|
|
Functional
currency
|
US$
|
US$
|
|
Argentine
Peso
|
(9,476
)
|
(5,240
)
|
|
Brazilian
Reais
|
60
|
198
|
|
Bolivian
Peso
|
(46
)
|
52
|
|
Total
|
(9,462
)
|
(4,990
)
|
F-42
Cresud Sociedad Anónima,
Comercial, Inmobiliaria, Financiera y Agropecuaria
The
Group estimates that, other factors being constant, a 10%
appreciation of the US dollar against the respective functional
currencies at year-end would result in a lower gain before income
tax for the years ended June 30, 2018 and 2017 for an amount of Ps.
946 and Ps. 499, respectively. A 10% depreciation of the US dollar
against the functional currencies would have an equal and opposite
effect on the Statements of Income.
On the
other hand, the Group also uses derivative instruments, such as
future foreign exchange contracts to manage its exposure to foreign
exchange risk. As of June 30, 2018 and 2017, the Group has future
exchange contracts pending for an amount of Ps. 45 (liability) and
Ps. 9 (liability).
2)
Urban properties and investments business
Operation Center in Argentina
|
|
Net monetary position (Liability)/Asset
|
|||
|
|
06.30.18
|
06.30.17
|
||
|
Functional currency
|
US$
|
NIS
|
US$
|
NIS
|
|
Argentine
Peso
|
(13,324
)
|
-
|
(11,436
)
|
-
|
|
Uruguayan
Peso
|
(368
)
|
-
|
(131
)
|
-
|
|
US
Dollar
|
-
|
-
|
-
|
1
|
|
Total
|
(13,692
)
|
-
|
(11,567
)
|
1
|
The
Group estimates that, other factors being constant, a 10%
appreciation of the US Dollar against the respective functional
currencies at year-end for the Operations Center in Argentina would
result in a net additional loss before income tax for the years
ended June 30, 2018 and 2017 for an amount of Ps. 1,369 and Ps.
1,157, respectively. A 10% depreciation of the US Dollar against
the functional currencies would have an equal and opposite effect
on the statements of income.
On the
other hand, the Group in its operations center Argentina, also uses
derivatives, such as future exchange contracts, to manage its
exposure to foreign currency risk. As of June 30, 2018 and 2017,
the Group has future exchange contracts pending for an amount of
US$ 47.3 and US$ 12.9, respectively.
Operation Center in Israel
As of
June 30, 2018 and 2017, the net position of financial instruments
in US Dollars, which exposes the Group to the foreign currency risk
amounts to Ps. (7,180) and Ps. (4,376), respectively. The Group
estimates that, other factors being constant, a 10% appreciation of
the US Dollar against the Israeli currency would increase loss
before income tax for the year ended June 30, 2018 for an amount of
Ps. 718 (Ps. 438 loss in 2017)
Interest rate risk
The
Group is exposed to interest rate risk on its investments in debt
instruments, short-term and long-term borrowings and derivative
financial instruments.
The
primary objective of the Group’s investment activities is to
preserve principal while at the same time maximizing yields without
significantly increasing risk. To achieve this objective, the Group
diversifies its portfolio in accordance with the limits set by the
Group. The Group maintains a portfolio of cash equivalents and
short-term investments in a variety of securities, including both
government and corporate obligations and money market
funds.
The
Group’s interest rate risk principally arises from long-term
borrowings (Note 21). Borrowings issued at variable rates expose
the Group to cash flow interest rate risk. Borrowings issued at
fixed rates expose the Group to fair value interest rate
risk.
The
Group manages this risk by maintaining an appropriate mix between
fixed and floating rate interest bearing liabilities. These
activities are evaluated regularly to determine that the Group is
not exposed to interest rate fluctuations that could adversely
affect its ability to meet its financial obligations and to comply
with its borrowing covenants.
The
Group occasionally manages its cash flow interest rate risk
exposure by different hedging instruments, including but not
limited to interest rate swap, depending on each particular case.
For example, interest rate swaps have the economic effect of
converting borrowings from floating rates to fixed rates or vice
versa.
F-43
Cresud Sociedad Anónima,
Comercial, Inmobiliaria, Financiera y Agropecuaria
The
interest rate risk policy is approved by the Board of Directors.
Management analyses the Group’s interest rate exposure on a
dynamic basis. Various scenarios are simulated, taking into
consideration refinancing, renewal of existing positions and
alternative financing sources. Based on these scenarios, the Group
calculates the impact on profit and loss of a defined interest rate
shift. The scenarios are run only for liabilities that represent
the major interest-bearing positions. Trade payables are normally
interest-free and have settlement dates within one year. The
simulation is done on a regular basis to verify that the maximum
potential loss is within the limits set by management.
Note 21
shows a breakdown of the Group’s fixed-rate and floating-rate
borrowings per currency denomination and functional currency of the
subsidiary that holds the loans for the fiscal years ended June 30,
2018 and 2017.
1)
Agricultural business
The
Group estimates that, other factors being constant, a 1% increase
in floating rates at year-end would increase net loss before income
tax for the years ended June 30, 2018 and 2017 in the amount of Ps.
18.45 and Ps. 6.94, respectively. A 1% decrease in floating rates
would have an equal and opposite effect on the Statement of
Income.
2)
Urban properties and investments business
Operation Center in Argentina
The
Group estimates that, other factors being constant, a 1% increase
in floating rates at year-end would increase net loss before income
tax for the years ended June 30, 2018 and 2017 in the amount of Ps.
15.1 and Ps. 6.6, respectively. A 1% decrease in floating rates
would have an equal and opposite effect on the Statement of
Income.
Operation Center in Israel
IDBD
manages the exposure to the interest rate risk in a decentralized
way and it is monitored regularly by different management offices
in order to confirm that there are no adverse effects over its
ability to meet its financial obligations and to comply with its
borrowings covenants.
As of
June 30, 2018 and 2017, the 96.1% and 96.6%, respectively, of the
Group’s long-term financial borrowings in this operations
center are at fixed interest rate; therefore, IDBD is not
significantly exposed to the interest rate fluctuation
risk.
IDBD
estimates that, other factors being constant, a 1% increase in
floating rates at year-end would increase net loss before income
tax for the year ended June 30, 2018, in Ps. 68, approximately (Ps.
21 approximately in 2017). A 1% decrease in floating rates would
have an equal and opposite effect on the Statement of
Income.
Commodity price risk and associated derivative financial
instruments
The
Group’s agricultural activities expose it to specific
financial risks related to commodity prices. Prices for commodities
have historically been cyclical, reflecting overall economic
conditions and changes in capacity within the industry, which
affect the profitability of entities engaged in the agricultural
industry.
Generally, the
Group uses derivative instruments to hedge risks arising out of its
agricultural business operations. The Group uses a variety of
commodity-based derivative instruments to manage exposure to price
volatility stemming from its integrated crop production activities.
These instruments consist mainly of crop forwards, future contracts
and put and call option contracts. Contract positions are designed
to ensure that the Group will receive a defined minimum price for
certain quantities of its production. The Group combines option
contracts with future contracts only as a means of reducing the
exposure towards the decrease in commodity prices, as being a
producer means that the price is uncertain until the time the
products are harvested and sold. The Group manages maximum and
minimum prices for each commodity and the idea is to choose the
best spot price at which to sell.
The
Group generally covers up to 50% of its crop production in order to
finance its operating costs. The hedge consists of taking positions
on purchased puts or sold futures and calls that assure a fixed
exit price. In the past, the Group has never kept a short position
greater than its crop inventories and does not intend to. On the
other hand, it is not the Group’s current intention to be
exposed in a long derivative position in excess of its actual
production.
F-44
Cresud Sociedad Anónima,
Comercial, Inmobiliaria, Financiera y Agropecuaria
The
following tables show the outstanding positions for each type of
derivative contract for the years ended June 30, 2018 and
2017:
|
|
06.30.18
|
||||
|
Type
of derivative contract
|
Tons
|
Margin
|
Premium
paid or (collected)
|
Derivatives
at fair value
|
Gain
/ (Loss) for valuation at fair value at year-end
|
|
Forward:
|
|
|
|
|
|
|
Sales
|
|
|
|
|
|
|
Corn
|
17,323
|
1
|
-
|
(5
)
|
(5
)
|
|
Soybeans
|
73,274
|
14
|
(1
)
|
19
|
55
|
|
Ethanol
|
2,100
|
-
|
-
|
2
|
3
|
|
Options:
|
|
|
|
|
|
|
Sale
put
|
|
|
|
|
|
|
Corn
|
82,323
|
-
|
-
|
(9
)
|
38
|
|
Purchase
put
|
|
|
|
|
|
|
Soybeans
|
(25,330
)
|
2
|
1
|
(5
)
|
(5
)
|
|
Sale
call
|
|
|
|
|
|
|
Corn
|
2,000
|
1
|
1
|
-
|
(1
)
|
|
Total
|
151,690
|
18
|
1
|
2
|
85
|
|
|
06.30.17
|
||||
|
Type of derivative contract
|
Tons
|
Margin
|
Premium paid or (collected)
|
Derivatives at fair value
|
Gain / (Loss) for valuation at fair value at year-end
|
|
Forward:
|
|
|
|
|
|
|
Sales
|
|
|
|
|
|
|
Corn
|
52,468
|
7
|
-
|
2
|
4
|
|
Soybeans
|
81,729
|
16
|
-
|
(3
)
|
35
|
|
Wheat
|
2,000
|
-
|
-
|
-
|
-
|
|
Livestock
|
660
|
-
|
-
|
-
|
-
|
|
Purchase
|
|
|
|
|
|
|
Corn
|
7,234
|
-
|
-
|
-
|
-
|
|
Soybeans
|
2,619
|
-
|
-
|
-
|
2
|
|
Wheat
|
8,101
|
1
|
-
|
-
|
1
|
|
Options:
|
|
|
|
|
|
|
Sale put
|
|
|
|
|
|
|
Corn
|
25,405
|
-
|
(2
)
|
(1
)
|
1
|
|
Soybeans
|
35,362
|
-
|
(1
)
|
(7
)
|
-
|
|
Purchase put
|
|
|
|
|
|
|
Corn
|
(25,402
)
|
-
|
8
|
4
|
(3
)
|
|
Soybeans
|
(30,004
)
|
-
|
4
|
9
|
3
|
|
Sale call
|
|
|
|
|
|
|
Corn
|
48,102
|
1
|
(5
)
|
(3
)
|
1
|
|
Soybeans
|
31,208
|
1
|
(3
)
|
(5
)
|
(2
)
|
|
Purchase call
|
|
|
|
|
|
|
Soybeans
|
(1,005
)
|
-
|
-
|
-
|
-
|
|
Total
|
238,477
|
26
|
1
|
(4
)
|
42
|
Gains
and losses on commodity-based derivative instruments were Ps. 28
(gain) and Ps. 93 (gain) for the years ended June 30, 2018 and
2017, respectively. These gains and losses are included in
“Other operating results, net” in the Statements of
Income.
Crops
future contracts fair values are computed with reference to quoted
market prices on future exchanges.
Risk of fluctuations of the Consumer Price Index ("CPI") of
Israel
The
Operations Center in Israel has financial liabilities indexed by
the Israeli CPI. As of the date of this Consolidated Financial
Statements, more than half of financial liabilities arising from
the Operations Center in Israel were adjusted by the Israeli
CPI.
Net
financial position exposure to the Israeli CPI fluctuations is
managed in a decentralized way on a case-by-case basis, by entering
into different derivative financial instruments, as the case may
be, or by other methods, considered adequate by the Management,
based on the circumstances.
As of
June 30, 2018, 44.8% of the loans are affected by the evolution of
the CPI. A 1% increase in the CPI would generate a loss of Ps. 721
(Ps. 427 for 2017) and a decrease of 1% generates a profit of Ps.
706 (Ps. 427 for 2017)
F-45
Cresud Sociedad Anónima,
Comercial, Inmobiliaria, Financiera y Agropecuaria
Other price risks
The
Group is exposed to equity securities price risk or derivative
financial instruments because of investments held in entities that
are publicly traded, which were classified on the Consolidated
Statements of Financial Position at “fair value through
profit or loss”. The Group regularly reviews the prices
evolution of these equity securities in order to identify
significant movements.
As of
June 30, 2018 and 2017, the total value of Group’s
investments in shares and derivative financial instruments of
public companies amounts to Ps. 391 and Ps. 300,
respectively.
In the
Operations Center in Israel, the investment in Clal is classified
on the Statements of Financial Position at “fair value
through profit or loss” and represents the most significant
IDBD’s exposure to price risk. IDBD has not used hedging
against these risks (Note 15). IDBD regularly reviews the prices
evolution of these equity securities in order to identify
significant movements.
The
Group estimates that, other factors being constant, a 10% decrease
in quoted prices of equity securities and in derivative financial
instruments portfolio at year-end would generate a loss before
income tax for the year ended June 30, 2018 of Ps. 31 (Ps. 24 in
2017) for the Operations Center in Argentina and a loss before
income tax for the year ended June 30, 2018 of Ps. 1,225 (Ps. 856
in 2017) for the Operations Center in Israel. An increase of 10% on
these prices would have an equal and opposite effect in the
Statement of Income.
(b)
Credit
risk management
The
credit risk arises from the potential non-performance of
contractual obligations by the parties, with a resulting financial
loss for the Group. Credit limits have been established to ensure
that the Group deals only with approved counterparties and that
counterparty concentration risk is addressed and the risk of loss
is mitigated. Counterparty exposure is measured as the aggregate of
all obligations of any single legal entity or economic entity to
the Group.
The
Group is subject to credit risk arising from deposits with banks
and financial institutions, investments of surplus cash balances,
the use of derivative financial instruments and from outstanding
receivables. The credit risk is managed on a country-by-country
basis. Each local entity is responsible for managing and analyzing
the credit risk.
The
Group’s policy in each operations center is to manage credit
exposure from deposits, short-term investments and other financial
instruments by maintaining diversified funding sources in various
financial institutions. All the institutions that operate with the
Group are well known because of their experience in the market and
high credit quality. The Group places its cash and cash
equivalents, investments, and other financial instruments with
various high credit quality financial institutions, thus mitigating
the amount of credit exposure to any one institution. The maximum
exposure to credit risk is represented by the carrying amount of
cash and cash equivalents and short-term investments in the
Statements of Financial Position.
1)
Agricultural business
The
Group’s primary objective for holding derivative financial
instruments is to manage currency exchange rate risk and interest
rate risk and commodities prices. The Group generally enters into
derivative transactions with high-credit-quality counterparties
and, by policy, limits the amount of credit exposure to each
counter party. The amounts subject to credit risk related to
derivative instruments are generally limited to the amounts, if
any, by which counterparty’s obligations exceed the
obligations that the Group has with that counterparty. The credit
risk associated with derivative financial instruments is
representing by the carrying value of the assets positions of these
instruments.
The
Group’s policy is to manage credit risks associated with
trade and other receivables within defined trading limits. All
Group’s significant counterparties have internal trading
limits. The Group’s customers are distinguished between those
customers arising out of the investment and development properties
activities of the Group from those arising out of its agricultural
and agro-industrial operations. These two groups of customers are
monitored separately due to their distinct
characteristics.
F-46
Cresud Sociedad Anónima,
Comercial, Inmobiliaria, Financiera y Agropecuaria
Trade
receivables from agriculture and agro-industrial activities are
primarily derived from the sale of commodities, raw milk, cattle,
and sugarcane; receivables from feedlot operations and raw meat
products; receivables from the lease of farmland properties;
receivables from the sale of farmland properties; and, other
receivables from ancillary activities. Trade receivables from
agriculture and agro-industrial activities represent 5% and 19% of
the Group’s total trade receivables as of June 30, 2018 and
2017, respectively. In contrast with the investment and development
properties activities of the Group, the Group’s agribusiness
is conducted through several international subsidiaries. The Group
has subsidiaries in Argentina, Brazil and Bolivia. However,
Argentina and Brazil together concentrate more than 96% and 93% of
the Group’s grain production for the years ended June 30,
2018 and 2017, respectively. For the years ended June 30, 2018 and
2017, the grain production in Bolivia has not been significant
representing only 4% and 7% of the total Group’s crop sales,
respectively. Each country has its own established market for the
respective grain production. Generally, the entire country’s
grain production is sold in the domestic market to well-known
multinational exporters such as Molinos, Cargill or Bunge, and/or
local exporters. Prices for grains are also generally based on the
market prices quoted in the domestic markets, which normally take
as reference the prices in international grain exchanges such as
the Chicago Board of Trade.
For the
years ended June 30, 2018 and 2017, 33% and 39% of sales of crops
in Argentina and Brazil were sold to well-known exporters. The
Group performs credit evaluations of its customers and generally
does not require collateral. Although sales are highly
concentrated, the Group does not believe that significant credit
risk exists at the reporting period due to the high credit rating
of these customers.
The
Group concentrates its cattle production in Argentina where it is
entirely sold in the domestic market. The main buyers are
slaughterhouses and supermarkets and are well dispersed. Prices in
the cattle market in Argentina are basically fixed by local supply
and demand. The principal market is the Liniers Market in Buenos
Aires, which provides a standard in price formation for the rest of
the domestic markets. Live animals are sold by auction on a daily
basis in the market, whereas prices are negotiated by kilogram of
live weight and are mainly determined by local supply and demand.
Some supermarkets and meat packers establish their prices by
kilogram of processed meat. In these cases, processing yields
influences the final price.
The
Group’s sugarcane production is based in Brazil and to a
lesser extent in Bolivia. Brazil concentrates more than 99% and 98%
of the Group's total sugarcane production as of June 30, 2018 and
2017, respectively. Currently, the group has two supply agreements
of sugarcane. One of them is with Brenco Companhia Brasileira de
Energía Renovable (ETH) and the other one Aparecería IV
with Agroserra - Agro Pecuária e Industria, in the
municipality of São Raimundo das Mangabeiras. Sales to ETH
amounted to Ps. 455 and Ps. 198 and from Agroserra amounted to Ps.
310 and Ps. 138 during fiscal years ended June 30, 2018 and 2017,
respectively. Thus, total sales amounted to Ps.755 and Ps. 336 in
fiscal year ended June 30, 2018 and 2017, representing 13% and 9%
of consolidated agricultural business revenues of the Group of each
fiscal year. Although sales are agreed, the Group do not believe
that there is a significant collection risk as of the date of year
fiscal year, considering the rating of ETH and
Agroserra.
The
Company does not expect any significant losses resulting from the
non-performance of the counterparties in any of the business
lines.
The
maximum exposure to Group’s credit risk is represented by the
carrying amount of each financial asset in the Statement of
Financial Position after deducting any impairment allowance. The
Group’s overall exposure of credit risk arising from trade
receivables is set out in Note 16.
2)
Urban properties and investments business
Operation Center in Argentina
Trade
receivables related to leases and services provided by the Group
represent a diversified tenant base and account for 91.3% and 89.9%
of the Group’s total trade receivables of the operations
center as of June 30, 2018 and 2017, respectively. The Group has
specific policies to ensure that rental contracts are transacted
with counterparties with appropriate credit quality. The majority
of the Group’s shopping mall, offices and other rental
properties’ tenants are well recognized retailers,
diversified companies, professional organizations, and others.
Owing to the long-term nature and diversity of its tenancy
arrangements, the credit risk of this type of trade receivables is
considered to be low. Generally, the Group has not experienced any
significant losses resulting from the non-performance of any
counterpart to the lease contracts and, as a result, the allowance
for doubtful accounts balance is low. Individual risk limits are
set based on internal or external ratings in accordance with limits
set by the Group. If there is no independent rating, risk control
assesses the credit quality of the customer, taking into account
its past experience, financial position, actual experience and
other factors.
F-47
Cresud Sociedad Anónima,
Comercial, Inmobiliaria, Financiera y Agropecuaria
Based
on the Group’s analysis, the Group determines the size of the
deposit that is required from the tenant at inception. Management
does not expect any material losses from non-performance by these
counterparties (see details on Note 16).
On the
other hand, property receivables related to the sale of trading
properties represent 3.0% and 2.6% of the Group’s total trade
receivables as of June 30, 2018 and 2017, respectively. Payments on
these receivables have generally been received when due. These
receivables are generally secured by mortgages on the properties.
Therefore, the credit risk on outstanding amounts is considered
very low.
Operation Center in Israel
IDBD’s
primary objective for holding derivative financial instruments is
to manage currency exchange rate risk and interest rate risk. IDBD
generally enters into derivative transactions with
high-credit-quality counterparties and, by policy, limits the
amount of credit exposure to each counterparty. The amounts subject
to credit risk related to derivative instruments are generally
limited to the amounts, if any, by which counterparty’s
obligations exceed the obligations that IDBD has with that
counterparty. The credit risk associated with derivative financial
instruments is representing by the carrying value of the assets
positions of these instruments.
The
IDBD’s policy is to manage credit exposure to trade and other
receivables within defined trading limits. All IDBD’s
significant counterparties have internal trading
limits.
Trade
receivables from investment and development property activities are
primarily derived from leases and services from shopping malls,
offices and other rental properties; receivables from the sale of
trading properties and investment properties (primarily undeveloped
land and non-retail rental properties). IDBD has a large customer
base and is not dependent on any single customer. The credits for
sales from the activities of telecommunications and supermarkets do
not present large concentrations of credit risk, not depending on a
few customers and with most of their transactions in cash or with
credit cards (see Note 16 for details).
(c)
Liquidity
risk management
The
Group is exposed to liquidity risks, including risks associated
with refinancing borrowings as they mature the risk that borrowing
facilities are not available to meet cash requirements, and the
risk that financial assets cannot readily be converted to cash
without loss of value. Failure to manage liquidity risks could have
a material impact on the Group’s cash flow and Statements of
Financial Position. Prudent liquidity risk management implies
maintaining sufficient cash, the availability of funding through an
adequate amount of committed credit facilities and the ability to
close out market positions. Due to the dynamic nature of the
underlying businesses, the Group aims to maintain flexibility in
funding its existing and prospective debt requirements by
maintaining diversified funding sources.
Each
business (or operation center, as appropriate) monitors its current
and projected financial position using several key internally
generated reports: cash flow; debt maturity; and interest rate
exposure. The Group also undertakes sensitivity analysis to assess
the impact of proposed transactions, movements in interest rates
and changes in property values on the key profitability, liquidity
and balance sheet ratios.
The
debt of each operation center and the derivative positions are
continually reviewed to meet current and expected debt
requirements. Each operation center maintains a balance between
longer-term and shorter-term financings. Short-term financing is
principally raised through bank facilities and overdraft positions.
Medium- to longer-term financing comprises public and private bond
issues, including private placements. Financing risk is spread by
using a variety of types of debt. The maturity profile is managed
in accordance with each operation center needs, by spreading the
repayment dates and extending facilities, as
appropriate.
The
tables below show financial liabilities, including each operation
center derivative financial liabilities groupings based on the
remaining period at the Statements of Financial Position to the
contractual maturity date. The amounts disclosed in the tables are
the contractual undiscounted cash flows and as a result, they do
not reconcile to the amounts disclosed on the Statements of
Financial Position. However, undiscounted cash flows in respect of
balances due within 12 months generally equal their carrying
amounts in the Statements of Financial Position, as the impact of
discounting is not significant. The tables include both interest
and principal flows.
F-48
Cresud Sociedad Anónima,
Comercial, Inmobiliaria, Financiera y Agropecuaria
Where
the interest payable is not fixed, the amount disclosed has been
determined by reference to the existing conditions at the reporting
date.
1)
Agricultural business
|
|
06.30.18
|
|||||
|
|
Less
than 1 year
|
Between
1 and 2 years
|
Between
2 and 3 years
|
Between
3 and 4 years
|
More
than 4 years
|
Total
|
|
Trade and other
payables
|
3,151
|
-
|
-
|
-
|
-
|
3,151
|
|
Borrowings
(excluding finance lease liabilities)
|
3,884
|
1,577
|
933
|
776
|
3,895
|
11,065
|
|
Finance lease
obligations
|
15
|
1
|
1
|
-
|
137
|
154
|
|
Derivative
financial instruments
|
114
|
16
|
-
|
-
|
-
|
130
|
|
Total
|
7,164
|
1,594
|
934
|
776
|
4,032
|
14,500
|
|
|
06.30.17
|
|||||
|
|
Less than 1 year
|
Between 1 and 2 years
|
Between 2 and 3 years
|
Between 3 and 4 years
|
More than 4 years
|
Total
|
|
Trade
and other payables
|
1,154
|
935
|
-
|
-
|
-
|
2,089
|
|
Borrowings
(excluding finance lease liabilities)
|
3,823
|
1,718
|
778
|
204
|
134
|
6,657
|
|
Finance
lease obligations
|
9
|
8
|
-
|
-
|
98
|
115
|
|
Derivative
financial instruments
|
28
|
-
|
-
|
-
|
-
|
28
|
|
Total
|
5,014
|
2,661
|
778
|
204
|
232
|
8,889
|
2)
Urban properties and investments business
Operation Center in Argentina
|
|
06.30.18
|
|||||
|
|
Less
than 1 year
|
Between
1 and 2 years
|
Between
2 and 3 years
|
Between
3 and 4 years
|
More
than 4 years
|
Total
|
|
Trade and other
payables
|
1,173
|
127
|
12
|
10
|
3
|
1,325
|
|
Borrowings
(excluding finance lease liabilities)
|
3,837
|
7,787
|
7,807
|
1,236
|
11,450
|
32,117
|
|
Finance lease
obligations
|
7
|
6
|
2
|
-
|
-
|
15
|
|
Derivative
financial instruments
|
-
|
-
|
-
|
-
|
46
|
46
|
|
Total
|
5,017
|
7,920
|
7,821
|
1,246
|
11,499
|
33,503
|
|
|
06.30.17
|
|||||
|
|
Less than 1 year
|
Between 1 and 2 years
|
Between 2 and 3 years
|
Between 3 and 4 years
|
More than 4 years
|
Total
|
|
Trade
and other payables
|
752
|
8
|
6
|
2
|
5
|
773
|
|
Borrowings
(excluding finance lease liabilities)
|
1,656
|
529
|
528
|
525
|
6,749
|
9,987
|
|
Finance
lease obligations
|
2
|
1
|
1
|
-
|
-
|
4
|
|
Derivative
financial instruments
|
5
|
-
|
-
|
-
|
-
|
5
|
|
Total
|
2,415
|
538
|
535
|
527
|
6,754
|
10,769
|
Operation Center in Israel
|
|
06.30.18
|
|||||
|
|
Less
than 1 year
|
Between
1 and 2 years
|
Between
2 and 3 years
|
Between
3 and 4 years
|
More
than 4 years
|
Total
|
|
Trade and other
payables
|
12,080
|
1,191
|
1,326
|
-
|
-
|
14,597
|
|
Borrowings
(excluding finance lease liabilities)
|
29,733
|
26,639
|
22,256
|
23,734
|
114,113
|
216,475
|
|
Finance lease
obligations
|
16
|
-
|
-
|
-
|
-
|
16
|
|
Purchase
obligations
|
3,921
|
1,823
|
639
|
347
|
229
|
6,959
|
|
Derivative
financial
instruments
|
8
|
-
|
-
|
-
|
-
|
8
|
|
Total
|
45,758
|
29,653
|
24,221
|
24,081
|
114,342
|
238,055
|
|
|
06.30.17
|
|||||
|
|
Less than 1 year
|
Between 1 and 2 years
|
Between 2 and 3 years
|
Between 3 and 4 years
|
More than 4 years
|
Total
|
|
Trade
and other payables
|
16,850
|
1,584
|
692
|
-
|
-
|
19,126
|
|
Borrowings
(excluding finance lease liabilities)
|
23,733
|
18,084
|
20,837
|
13,353
|
67,537
|
143,544
|
|
Finance
lease obligations
|
10
|
5
|
5
|
5
|
|
25
|
|
Purchase
obligations
|
1,135
|
1,140
|
873
|
5
|
-
|
3,153
|
|
Derivative
financial instruments
|
62
|
76
|
-
|
-
|
-
|
138
|
|
Total
|
41,790
|
20,889
|
22,407
|
13,363
|
67,537
|
165,986
|
See
Note 21 for a description of the commitments and restrictions
related to loans and the ongoing renegotiations.
F-49
Cresud Sociedad Anónima,
Comercial, Inmobiliaria, Financiera y Agropecuaria
(d)
Capital
risk management
The
capital structure of the Group consists of shareholders’
equity and net borrowings. The type and maturity of the
Group’s borrowings are analyzed further in Note 21. The
Group’s equity is analyzed into its various components in the
Statement of Changes in Equity.
Capital
is managed so as to promote the long-term success of the business
and to maintain sustainable returns for shareholders.
The
Group seeks to manage its capital requirements to maximize value
through the mix of debt and equity funding, while ensuring that
Group entities continue to operate as going concerns, comply with
applicable capital requirements and maintain strong credit
ratings.
The
Group assesses the adequacy of its capital requirements, cost of
capital and gearing (i.e., debt/equity mix) as part of its broader
strategic plan. The Group continuously reviews its capital
structure to ensure that (i) sufficient funds and financing
facilities are available to implement the Group’s property
development and business acquisition strategies, (ii) adequate
financing facilities for unforeseen contingencies are maintained,
and (iii) distributions to shareholders are maintained within the
Group’s dividend distribution policy. The Group also protects
its equity in assets by obtaining appropriate
insurance.
The
Group’s strategy is to maintain key financing metrics (net
debt to total equity ratio or gearing and debt ratio) in order to
ensure that asset level performance is translated into enhanced
returns for shareholders whilst maintaining an appropriate risk
reward balance to accommodate changing financial and operating
market cycles.
The
following tables details the Group’s key metrics in relation
to managing its capital structure. The ratios are within the ranges
previously established by the Group’s strategy.
1)
Agricultural business
|
|
06.30.18
|
06.30.17
|
06.30.16
|
|
Gearing ratio
(i)
|
60.08
%
|
23.31
%
|
21.41
%
|
|
Debt ratio
(ii)
|
112.64
%
|
74.08
%
|
72.64
%
|
(i)
Calculated as total debt over total capital (including equity plus
total debt).
(ii)
Calculated as total debt over total properties at fair value
(including trading properties, properties, plant and equipment,
investment properties, farmland rights to receive units under
barter agreements).
2)
Urban properties and investments business
Operation Center in Argentina
|
|
06.30.18
|
06.30.17
|
06.30.16
|
|
Gearing ratio
(iii)
|
40.83
%
|
31.66
%
|
29.91
%
|
|
Debt ratio
(iv)
|
40.58
%
|
29.13
%
|
25.27
%
|
Operation Center in Israel
|
|
06.30.18
|
06.30.17
|
06.30.16
|
|
Gearing
ratio (iii)
|
82.85
%
|
81.95
%
|
82.74
%
|
|
Debt
ratio (iv)
|
148.46
%
|
128.04
%
|
137.75
%
|
(iii)
Calculated as total
of borrowings over total borrowings plus equity attributable equity
holders of the parent company.
(iv)
Calculated as total
borrowings over total properties (including trading properties,
property, plant and equipment, investment properties and rights to
receive units under barter agreements).
F-50
Cresud Sociedad Anónima,
Comercial, Inmobiliaria, Financiera y Agropecuaria
(e)
Other
non-financial risks
Nature risks
The
Group’s revenue arising from agricultural activities depends
significantly on the ability to manage biological assets and
agricultural produce. The ability to manage biological assets and
agricultural produce may be affected by unfavorable local weather
conditions and natural disasters. Weather conditions such as
floods, droughts, hail, windstorms and natural disasters such as
fire, disease, insect infestation and pests are examples of such
unpredictable events. The Group manages this risk by locating its
farmlands in different geographical areas. The Group has not taken
out insurance for this kind of risks. The occurrence of severe
weather conditions or natural disasters may affect the growth of
our biological assets, which in turn may have a material adverse
effect on the Group’s ability to harvest agricultural produce
in sufficient quantities and in a timely way.
6.
Segment
information
IFRS
8 requires an entity to report financial and descriptive
information about its reportable segments, which are operating
segments or aggregations of operating segments that meet specified
criteria. Operating segments are components of an entity about
which separate financial information is available that is evaluated
regularly by the CODM. According to IFRS 8, the CODM represents a
function whereby strategic decisions are made and resources are
assigned. The CODM function is carried out by the President of the
Group, Mr. Eduardo S. Elsztain. In addition, two responsibility
levels have been established for resource allocation and assessment
of results of the two operations centers, through executive
committees in Argentina and Israel.
Segment
information is reported from the perspective of products and
services: (i) agricultural business and (ii) urban properties and
investment business. In addition, this last segment is reported
divided from the geographic point of view in two Operations Centers
to manage its global interests: Argentina and Israel. Within each
operations center, the Group considers separately the various
activities being developed, which represent reporting operating
segments given the nature of its products, services, operations and
risks. Management believes the operating segment clustering in each
operations center reflects similar economic characteristics in each
region, as well as similar products and services offered, types of
clients and regulatory environments.
As
from fiscal year 2018 the CODM reviews the operating income/loss of
each business excluding the amounts related to management fees,
being such amount reviewed at an aggregate level outside each
business. Additionally, the CODM reviews certain corporate expenses
associated with each business in an aggregate manner and separately
from each of the segments, such expenses have been disclosed in the
"Corporate" segment of each operation center. Segment information
for the years 2017 and 2016 has been recast for the purposes of
comparability with the present year.
Below
is the segment information prepared as follows:
Agricultural business
●
Land transformation and
sales
: comprises gains from the
disposal and development of farmlands
activities.
●
Agricultural
production
: segment consists of
planting, harvesting and sale of crops as wheat, corn, soybeans,
cotton and sunflowers; the sale of grain derivatives, such as flour
and oil, breeding, purchasing and/or fattening of free-range cattle
for sale to meat processors and local livestock auction markets.;
agricultural services; leasing of the Group's farms to third
parties; and planting, harvesting and sale of
sugarcane
●
Other
segments
: includes,
principally, slaughtering and processing in the meat refrigeration
plant; and brokerage activities, among others.
●
Corporate
: includes corporate expenses related to
agricultural business.
F-51
Cresud Sociedad Anónima,
Comercial, Inmobiliaria, Financiera y Agropecuaria
Urban properties and investments business
●
Operation Center in
Argentina
includes the assets
and operating results of the following
segments:
o
Shopping Malls
:
includes results principally comprised of
lease and service revenues related to rental of commercial space
and other spaces in the shopping malls of the Group.
o
Offices
:
includes the operating results from lease
revenues of offices, other rental spaces and other service revenues
related to the office activities.
o
Sales and developments
: includes the
operating results of the development, maintenance and sales of
undeveloped parcels of land and/or trading properties. Real estate
sales results are also included.
o
Hotels
: includes the operating results
mainly comprised of room, catering and restaurant
revenues.
o
International
: includes assets and
operating profit or loss from business related to associates Condor
(hotels) and Lipstick (offices).
o
Others
: primarily includes the
entertainment activities through La Arena and La Rural S.A. and the
financial activities carried out by BHSA and Tarshop.
o
Corporate
:
includes the expenses related to the corporate
activities of the Operations Center in
Argentina.
As
of fiscal year 2018, the CODM also reviews the office business as a
single segment and the entertainment business in an aggregate and
separate manner from offices, including that concept in the
"Others" segment. Segment information for years 2017 and 2016 has
been recast for the purposes of comparability with the present
year.
The
CODM periodically reviews the results and certain asset categories
and assesses performance of operating segments of this operations
center based on a measure of profit or loss of the segment composed
by the operating income plus the share of profit / (loss) of joint
ventures and associates. The valuation criteria used in preparing
this information are consistent with IFRS standards used for the
preparation of the Consolidated Financial Statements, except for
the following:
●
Operating
results from joint ventures are evaluated by the CODM applying
proportional consolidation method. Under this method, the
profit/loss generated and assets are reported in the Statement of
Income line-by-line based on the percentage held in joint ventures
rather than in a single item as required by IFRS. Management
believes that the proportional consolidation method provides more
useful information to understand the business return. On the other
hand, the investment in the joint venture La Rural S.A. is
accounted for under the equity method since this method is
considered to provide more accurate information in this
case.
●
Operating
results from Shopping Malls and Offices segments do not include the
amounts pertaining to building administration expenses and
collective promotion funds (“FPC”, as per its Spanish
acronym) as well as total recovered costs, whether by way of
expenses or other concepts included under financial results (for
example default interest and other concepts). The CODM examines the
net amount from these items (total surplus or deficit between
building administration expenses and FPC and recoverable
expenses).
Revenues
for each reporting segments derive from a large and diverse client
base and, therefore, there is no revenue concentration in any
particular segment.
●
Operation Center in
Israel
includes the assets and
operating results of the following segments:
o
Real Estate
: through PBC, the Group
operates rental properties and residential properties in Israel,
USA and other parts of the world and carries out commercial
projects in Las Vegas, USA.
o
Supermarkets
: through Shufersal,
reclassified to discontinued operations in the current year, the
Group mainly operates a supermarket chain in Israel.
o
Telecommunications
: includes Cellcom
whose main activities include the provision of mobile phone
services, fixed line phone services, data and Internet, among
others.
o
Insurance
: includes the investment in
Clal, insurance company which main activities includes pension and
social security insurance, among others. As stated in Note 18, the
Group does not have control over Clal; therefore, the business is
reported in a single line as a financial asset held for sale and
valued at fair value.
o
Others
: includes other diverse business
activities, such as technological developments, tourism, oil and
gas assets, electronics, and others.
o
Corporate
: includes the expenses related
with the activities of the holding companies.
F-52
Cresud Sociedad Anónima,
Comercial, Inmobiliaria, Financiera y Agropecuaria
The
CODM periodically reviews the results and certain asset categories
and assesses performance of operating segments of this operations
center based on a measure of profit or loss of the segment composed
by the operating income plus the share of profit / (loss) of
associates and joint ventures. The valuation criteria used in
preparing this information are consistent with IFRS standards used
for the preparation of the Consolidated Financial
Statements.
As
stated under Note 2, the Group consolidates results derived from
its operations center in Israel with a three-month lag, adjusted
for the effects of significant transactions. Hence, IDBD’s
results for the period extending from October 11, 2015 (acquisition
date) through March 31, 2016 are included under comprehensive
income of the Group for the fiscal year ended June 30, 2016. For
the fiscal years ended June 30, 2018 and 2017, a full twelve-month
period is consolidated, also with a three-month lag and adjusted
for the effects of significant transactions.
Goods
and services exchanged between segments are calculated on the basis
of established prices. Intercompany transactions between segments,
if any, are eliminated.
Within
the agricultural business, most revenue from its operating segments
are generated from, and their assets are located in Argentina and
Brazil, mainly
Within
the Operations Center in Argentina, most revenue from its operating
segments is derived from, and their assets are located in,
Argentina, except for the share of profit / (loss) of associates
included in the “International” segment located in
USA.
Within
the urban properties and investment business in the operations
center in Israel, most revenue from its operating segments are
derived from and their assets are located in Israel, except for
certain earnings from the Real Estate segment, which are generated
from activities outside Israel, mainly in USA.
Within
the agricultural business and the urban properties and investments
business from the operations center in Argentina, the assets
categories reviewed by the CODM are investment properties,
property, plant and equipment, trading properties, inventories,
biological assets, right to receive future units under barter
agreements, investment in joint ventures and associates and
goodwill. The aggregate of these assets, classified by business
segment, are disclosed as “segment assets”. Assets are
allocated to each segment based on the operations and/or their
physical location.
F-53
Cresud Sociedad Anónima,
Comercial, Inmobiliaria, Financiera y Agropecuaria
Below
is a summarized analysis of the lines of business of the Group for
the year ended June 30, 2018:
|
|
06.30.18
|
|||||||||
|
|
|
Urban
Properties and Investment business (II
)
|
|
|
|
|
|
|
||
|
|
Agricultural
business (I)
|
Operations
Center in Argentina
|
Operations
Center in Israel
|
Subtotal
|
Total
segment information
|
Joint
ventures (i)
|
Discontinued
operations (ii)
|
Adjustments
(iii)
|
Elimination
of inter-segment transactions and non-reportable assets /
liabilities (iv)
|
Total
Statement of Income / Financial Position
|
|
Revenues
|
6,081
|
5,308
|
86,580
|
91,888
|
97,969
|
(46
)
|
(60,470
)
|
1,726
|
(193
)
|
38,986
|
|
Costs
|
(5,210
)
|
(1,067
)
|
(61,395
)
|
(62,462
)
|
(67,672
)
|
29
|
44,563
|
(1,760
)
|
60
|
(24,780
)
|
|
Initial recognition
and changes in the fair value of biological assets and agricultural
products at the point of harvest
|
926
|
-
|
-
|
-
|
926
|
2
|
-
|
-
|
114
|
1,042
|
|
Changes in the net
realizable value of agricultural products after
harvest
|
303
|
-
|
-
|
-
|
303
|
-
|
-
|
-
|
-
|
303
|
|
Gross
profit / (loss)
|
2,100
|
4,241
|
25,185
|
29,426
|
31,526
|
(15
)
|
(15,907
)
|
(34
)
|
(19
)
|
15,551
|
|
Gain from disposal
of farmlands
|
906
|
-
|
-
|
-
|
906
|
-
|
-
|
-
|
-
|
906
|
|
Net gain from fair
value adjustment of investment properties
|
96
|
21,275
|
2,160
|
23,435
|
23,531
|
(738
)
|
(164
)
|
-
|
-
|
22,629
|
|
General and
administrative expenses
|
(546
)
|
(903
)
|
(3,870
)
|
(4,773
)
|
(5,319
)
|
14
|
878
|
-
|
13
|
(4,414
)
|
|
Selling
expenses
|
(649
)
|
(432
)
|
(16,986
)
|
(17,418
)
|
(18,067
)
|
6
|
12,749
|
-
|
6
|
(5,306
)
|
|
Other operating
results, net
|
567
|
(78
)
|
467
|
389
|
956
|
19
|
177
|
-
|
-
|
1,152
|
|
Management
fees
|
-
|
-
|
-
|
-
|
-
|
-
|
-
|
(554
)
|
-
|
(554
)
|
|
Profit
/ (loss) from operations
|
2,474
|
24,103
|
6,956
|
31,059
|
33,533
|
(714
)
|
(2,267
)
|
(588
)
|
-
|
29,964
|
|
Share of profit /
(loss) of associates and joint ventures
|
23
|
(1,269
)
|
(43
)
|
(1,312
)
|
(1,289
)
|
706
|
(20
)
|
-
|
-
|
(603
)
|
|
Segment
profit / (loss)
|
2,497
|
22,834
|
6,913
|
29,747
|
32,244
|
(8
)
|
(2,287
)
|
(588
)
|
-
|
29,361
|
|
|
|
|
|
|
|
|
|
|
|
|
|
Reportable
assets
|
11,762
|
66,472
|
266,802
|
333,274
|
345,036
|
(470
)
|
(13,303
)
|
-
|
22,507
|
353,770
|
|
Reportable
liabilities
|
-
|
-
|
(215,452
)
|
(215,452
)
|
(215,452
)
|
-
|
-
|
-
|
(62,997
)
|
(278,449
)
|
|
Net
reportable assets
|
11,762
|
66,472
|
51,350
|
117,822
|
129,584
|
(470
)
|
(13,303
)
|
-
|
(40,490
)
|
75,321
|
F-54
Cresud Sociedad Anónima,
Comercial, Inmobiliaria, Financiera y Agropecuaria
Below
is a summarized analysis of the lines of business of the Group for
the year ended June 30, 2017:
|
|
06.30.17
|
|||||||||
|
|
|
Urban Properties and Investment business (II)
|
|
|
|
|
|
|
||
|
|
Agricultural business (I)
|
Operations Center in Argentina
|
Operations Center in Israel
|
Subtotal
|
Total segment information
|
Joint ventures (i)
|
Discontinued operations (ii)
|
Adjustments (iii)
|
Elimination of inter-segment transactions and non-reportable
assets / liabilities (iv)
|
Total Statement of Income / Financial Position
|
|
Revenues
|
3,915
|
4,311
|
68,422
|
72,733
|
76,648
|
(72
)
|
(47,168
)
|
1,490
|
(152
)
|
30,746
|
|
Costs
|
(3,395
)
|
(910
)
|
(49,110
)
|
(50,020
)
|
(53,415
)
|
45
|
35,488
|
(1,517
)
|
69
|
(19,330
)
|
|
Initial
recognition and changes in the fair value of biological assets and
agricultural products at the point of harvest
|
127
|
-
|
-
|
-
|
127
|
8
|
-
|
-
|
69
|
204
|
|
Changes
in the net realizable value of agricultural products after
harvest
|
(74
)
|
-
|
-
|
-
|
(74
)
|
-
|
-
|
-
|
-
|
(74
)
|
|
Gross profit / (loss)
|
573
|
3,401
|
19,312
|
22,713
|
23,286
|
(19
)
|
(11,680
)
|
(27
)
|
(14
)
|
11,546
|
|
Net
gain from fair value adjustment of investment
properties
|
331
|
4,489
|
374
|
4,863
|
5,194
|
(193
)
|
(113
)
|
-
|
-
|
4,888
|
|
Gain
from disposal of farmlands
|
280
|
-
|
-
|
-
|
280
|
-
|
-
|
-
|
-
|
280
|
|
General
and administrative expenses
|
(411
)
|
(683
)
|
(3,173
)
|
(3,856
)
|
(4,267
)
|
7
|
624
|
-
|
8
|
(3,628
)
|
|
Selling
expenses
|
(500
)
|
(355
)
|
(13,093
)
|
(13,448
)
|
(13,948
)
|
7
|
9,434
|
-
|
4
|
(4,503
)
|
|
Other
operating results, net
|
75
|
(68
)
|
(196
)
|
(264
)
|
(189
)
|
(5
)
|
64
|
-
|
2
|
(128
)
|
|
Management
fees
|
-
|
-
|
-
|
-
|
-
|
-
|
-
|
(200
)
|
-
|
(200
)
|
|
Profit / (loss) from operations
|
348
|
6,784
|
3,224
|
10,008
|
10,356
|
(203
)
|
(1,671
)
|
(227
)
|
-
|
8,255
|
|
Share
of profit / (loss) of associates and joint ventures
|
8
|
(94
)
|
105
|
11
|
19
|
153
|
(76
)
|
-
|
-
|
96
|
|
Segment profit / (loss)
|
356
|
6,690
|
3,329
|
10,019
|
10,375
|
(50
)
|
(1,747
)
|
(227
)
|
-
|
8,351
|
|
|
|
|
|
|
|
|
|
|
|
|
|
Reportable
assets
|
7,013
|
44,914
|
178,964
|
223,878
|
230,891
|
(583
)
|
-
|
-
|
11,138
|
241,446
|
|
Reportable
liabilities
|
-
|
-
|
(155,235
)
|
(155,235
)
|
(155,235
)
|
-
|
-
|
-
|
(37,038
)
|
(192,273
)
|
|
Net reportable assets
|
7,013
|
44,914
|
23,729
|
68,643
|
75,656
|
(583
)
|
-
|
-
|
(25,900
)
|
49,173
|
F-55
Cresud Sociedad Anónima,
Comercial, Inmobiliaria, Financiera y Agropecuaria
Below
is a summarized analysis of the lines of business of the Group for
the year ended June 30, 2016:
|
|
06.30.16
|
|||||||||
|
|
|
Urban Properties and Investment business (II)
|
|
|
|
|
|
|
||
|
|
Agricultural business (I)
|
Operations Center in Argentina
|
Operations Center in Israel
|
Subtotal
|
Total segment information
|
Joint ventures (i)
|
Discontinued operations (ii)
|
Adjustments (iii)
|
Elimination of inter-segment transactions and non-reportable
assets / liabilities (iv)
|
Total Statement of Income / Financial Position
|
|
Revenues
|
2,909
|
3,284
|
27,077
|
30,361
|
33,270
|
(89
)
|
(18,607
)
|
1,194
|
(146
)
|
15,622
|
|
Costs
|
(2,493
)
|
(659
)
|
(19,252
)
|
(19,911
)
|
(22,404
)
|
74
|
14,063
|
(1,207
)
|
94
|
(9,380
)
|
|
Initial
recognition and changes in the fair value of biological assets and
agricultural products at the point of harvest
|
376
|
-
|
-
|
-
|
376
|
(26
)
|
-
|
-
|
51
|
401
|
|
Changes
in the net realizable value of agricultural products after
harvest
|
208
|
-
|
-
|
-
|
208
|
-
|
-
|
-
|
-
|
208
|
|
Gross profit / (loss)
|
1,000
|
2,625
|
7,825
|
10,450
|
11,450
|
(41
)
|
(4,544
)
|
(13
)
|
(1
)
|
6,851
|
|
Net
gain from fair value adjustment of investment
properties
|
22
|
18,167
|
(271
)
|
17,896
|
17,918
|
(379
)
|
(23
)
|
-
|
-
|
17,516
|
|
Loss
from disposal of farmlands
|
(2
)
|
-
|
-
|
-
|
(2
)
|
-
|
-
|
-
|
-
|
(2
)
|
|
General
and administrative expenses
|
(315
)
|
(487
)
|
(1,360
)
|
(1,847
)
|
(2,162
)
|
5
|
200
|
-
|
7
|
(1,950
)
|
|
Selling
expenses
|
(338
)
|
(264
)
|
(5,442
)
|
(5,706
)
|
(6,044
)
|
8
|
3,862
|
-
|
1
|
(2,173
)
|
|
Other
operating results, net
|
(80
)
|
(12
)
|
(32
)
|
(44
)
|
(124
)
|
(2
)
|
19
|
-
|
(3
)
|
(110
)
|
|
Management
fees
|
-
|
-
|
-
|
-
|
-
|
-
|
-
|
(534
)
|
-
|
(534
)
|
|
Profit / (loss) from operations
|
287
|
20,029
|
720
|
20,749
|
21,036
|
(409
)
|
(486
)
|
(547
)
|
4
|
19,598
|
|
Share
of (loss) / profit of associates and joint ventures
|
23
|
126
|
123
|
249
|
272
|
262
|
-
|
-
|
-
|
534
|
|
Segment profit / (loss)
|
310
|
20,155
|
843
|
20,998
|
21,308
|
(147
)
|
(486
)
|
(547
)
|
4
|
20,132
|
|
|
|
|
|
|
|
|
|
|
|
|
|
Reportable
assets
|
5,136
|
39,107
|
147,470
|
186,577
|
191,713
|
(510
)
|
-
|
-
|
8,448
|
199,651
|
|
Reportable
liabilities
|
-
|
-
|
(132,989
)
|
(132,989
)
|
(132,989
)
|
-
|
-
|
-
|
(29,462
)
|
(162,451
)
|
|
Net reportable assets
|
5,136
|
39,107
|
14,481
|
53,588
|
58,724
|
(510
)
|
-
|
-
|
(21,014
)
|
37,200
|
(i)
Represents the
equity value of joint ventures that were proportionately
consolidated for information by segment purposes.
(ii)
Corresponds to
Shufersal’s deconsolidation, the Group lost control in June
2018. See Note 4.(l).
(iii)
Includes Ps. (34),
Ps. (27) and Ps. (13) corresponding to Expenses and FPC and Ps.
(554), Ps. (200) and Ps. (534) to management fees, as of June 30,
2018, 2017 and 2016, respectively.
(iv)
Includes deferred
income tax assets, income tax and MPIT credits, trade and other
receivables, investment in financial assets, cash and cash
equivalents and intangible assets except for rights to receive
future units under barter agreements, net of investments in
associates with negative equity which are included in
provisions.
F-56
Cresud Sociedad Anónima,
Comercial, Inmobiliaria, Financiera y Agropecuaria
Agriculture line of business:
The
following tables present the reportable segments of the agriculture
line of business:
|
|
06.30.18
|
||||
|
|
Agricultural
production
|
Land
transformation and sales
|
Corporate
|
Others
|
Total
Agricultural business
|
|
Revenues
|
3,603
|
-
|
-
|
2,478
|
6,081
|
|
Costs
|
(2,930
)
|
(12
)
|
-
|
(2,268
)
|
(5,210
)
|
|
Initial recognition
and changes in the fair value of biological assets and agricultural
products at the point of harvest
|
926
|
-
|
-
|
-
|
926
|
|
Changes in the net
realizable value of agricultural products after
harvest
|
303
|
-
|
-
|
-
|
303
|
|
Gross
profit / (loss)
|
1,902
|
(12
)
|
-
|
210
|
2,100
|
|
Gain from disposal
of farmlands
|
-
|
906
|
-
|
-
|
906
|
|
Net gain from fair
value adjustment of investment properties
|
-
|
96
|
-
|
-
|
96
|
|
General and
administrative expenses
|
(348
)
|
(1
)
|
(89
)
|
(108
)
|
(546
)
|
|
Selling
expenses
|
(468
)
|
-
|
-
|
(181
)
|
(649
)
|
|
Other operating
results, net
|
18
|
511
|
-
|
38
|
567
|
|
Management
fees
|
-
|
-
|
-
|
-
|
-
|
|
Profit
/ (loss) from operations
|
1,104
|
1,500
|
(89
)
|
(41
)
|
2,474
|
|
Share of profit /
(loss) of associates
|
24
|
-
|
-
|
(1
)
|
23
|
|
Segment
profit / (loss)
|
1,128
|
1,500
|
(89
)
|
(42
)
|
2,497
|
|
|
|
|
|
|
|
|
Investment
properties
|
923
|
-
|
-
|
-
|
923
|
|
Property, plant and
equipment
|
7,093
|
18
|
-
|
117
|
7,228
|
|
Investments in
associates
|
39
|
-
|
-
|
44
|
83
|
|
Other reportable
assets
|
3,167
|
-
|
-
|
361
|
3,528
|
|
Reportable
assets
|
11,222
|
18
|
-
|
522
|
11,762
|
From
all of the Group’s revenues corresponding to Agricultural
Business, Ps. 4,451 are originated in Argentina and Ps. 1,630 in
other countries, principally in Brazil for Ps. 1,494.
From
all of the Group’s assets included in the segment
corresponding to Agricultural Business, Ps. 3,208 are located in
Argentina and Ps. 8,554 in other countries, principally in Brazil
for Ps. 7,703.
|
|
06.30.17
|
||||
|
|
Agricultural production
|
Land transformation and sales
|
Corporate
|
Others
|
Total Agricultural business
|
|
Revenues
|
2,197
|
-
|
-
|
1,718
|
3,915
|
|
Costs
|
(1,810
)
|
(11
)
|
-
|
(1,574
)
|
(3,395
)
|
|
Initial
recognition and changes in the fair value of biological assets and
agricultural products at the point of harvest
|
127
|
-
|
-
|
-
|
127
|
|
Changes
in the net realizable value of agricultural products after
harvest
|
(74
)
|
-
|
-
|
-
|
(74
)
|
|
Gross profit / (loss)
|
440
|
(11
)
|
-
|
144
|
573
|
|
Net
gain from fair value adjustment of investment
properties
|
-
|
331
|
-
|
-
|
331
|
|
Gain
from disposal of farmlands
|
-
|
280
|
-
|
-
|
280
|
|
General
and administrative expenses
|
(254
)
|
(1
)
|
(84
)
|
(72
)
|
(411
)
|
|
Selling
expenses
|
(370
)
|
-
|
-
|
(130
)
|
(500
)
|
|
Other
operating results, net
|
70
|
-
|
-
|
5
|
75
|
|
Management
fees
|
-
|
-
|
-
|
-
|
-
|
|
(Loss) / Profit from operations
|
(114
)
|
599
|
(84
)
|
(53
)
|
348
|
|
Share
of profit / (loss) of associates
|
12
|
-
|
-
|
(4
)
|
8
|
|
Segment (loss) / profit
|
(102
)
|
599
|
(84
)
|
(57
)
|
356
|
|
|
|
|
|
|
|
|
Investment
properties
|
304
|
-
|
-
|
-
|
304
|
|
Property,
plant and equipment
|
4,531
|
12
|
-
|
97
|
4,640
|
|
Investments
in associates
|
45
|
-
|
-
|
4
|
49
|
|
Other
reportable assets
|
1,780
|
-
|
-
|
240
|
2,020
|
|
Reportable assets
|
6,660
|
12
|
-
|
341
|
7,013
|
From
all of the Group’s revenues corresponding to Agricultural
Business, Ps. 3,035 are originated in Argentina and Ps. 880 in
other countries, principally in Brazil for Ps. 742.
From
all of the Group’s assets included in the segment
corresponding to Agricultural Business, Ps. 2,554 are located in
Argentina and Ps. 4,459 in other countries, principally in Brazil
for Ps. 3,351.
F-57
Cresud Sociedad Anónima,
Comercial, Inmobiliaria, Financiera y Agropecuaria
|
|
06.30.16
|
||||
|
|
Agricultural production
|
Land transformation and sales
|
Corporate
|
Others
|
Total Agricultural business
|
|
Revenues
|
1,765
|
-
|
-
|
1,144
|
2,909
|
|
Costs
|
(1,419
)
|
(9
)
|
-
|
(1,065
)
|
(2,493
)
|
|
Initial
recognition and changes in the fair value of biological assets and
agricultural products at the point of harvest
|
376
|
-
|
-
|
-
|
376
|
|
Changes
in the net realizable value of agricultural products after
harvest
|
208
|
-
|
-
|
-
|
208
|
|
Gross profit / (loss)
|
930
|
(9
)
|
-
|
79
|
1,000
|
|
Net
gain from fair value adjustment of investment
properties
|
-
|
22
|
-
|
-
|
22
|
|
Loss
from disposal of farmlands
|
-
|
(2
)
|
-
|
-
|
(2
)
|
|
General
and administrative expenses
|
(185
)
|
(1
)
|
(76
)
|
(53
)
|
(315
)
|
|
Selling
expenses
|
(248
)
|
-
|
-
|
(90
)
|
(338
)
|
|
Other
operating results, net
|
(82
)
|
-
|
-
|
2
|
(80
)
|
|
Management
fees
|
-
|
-
|
-
|
-
|
-
|
|
Profit / (Loss) from operations
|
415
|
10
|
(76
)
|
(62
)
|
287
|
|
Share
of profit / (loss) of associates
|
26
|
-
|
-
|
(3
)
|
23
|
|
Segment profit / (loss)
|
441
|
10
|
(76
)
|
(65
)
|
310
|
|
|
|
|
|
|
|
|
Investment
properties
|
103
|
-
|
-
|
-
|
103
|
|
Property,
plant and equipment
|
3,187
|
18
|
-
|
42
|
3,247
|
|
Investments
in associates
|
54
|
-
|
-
|
-
|
54
|
|
Other
reportable assets
|
1,570
|
-
|
-
|
162
|
1,732
|
|
Reportable assets
|
4,914
|
18
|
-
|
204
|
5,136
|
From
all of the Group’s revenues corresponding to Agricultural
Business, Ps. 2,209 are originated in Argentina and Ps. 700 in
other countries, principally in Brazil for Ps. 502.
From
all of the Group’s assets included in the segment
corresponding to Agricultural Business, Ps. 2,344 are located in
Argentina and Ps. 2,792 in other countries, principally in Brazil
for Ps. 1,716.
(I)
Urban properties and investments line of business
Below
is a summarized analysis of the lines of business of Group’s
operations center in Argentina for the fiscal years ended June 30,
2018, 2017 and 2016:
|
|
06.30.18
|
|||||||
|
|
Shopping
Malls
|
Offices
|
Sales
and developments
|
Hotels
|
International
|
Corporate
|
Others
|
Total
|
|
Revenues
|
3,665
|
532
|
120
|
973
|
-
|
-
|
18
|
5,308
|
|
Costs
|
(330
)
|
(46
)
|
(44
)
|
(624
)
|
-
|
-
|
(23
)
|
(1,067
)
|
|
Gross
profit / (loss)
|
3,335
|
486
|
76
|
349
|
-
|
-
|
(5
)
|
4,241
|
|
Net gain from fair
value adjustment of investment properties
|
11,340
|
4,932
|
4,771
|
-
|
-
|
-
|
232
|
21,275
|
|
General and
administrative expenses
|
(320
)
|
(87
)
|
(78
)
|
(193
)
|
(46
)
|
(151
)
|
(28
)
|
(903
)
|
|
Selling
expenses
|
(238
)
|
(57
)
|
(21
)
|
(114
)
|
-
|
-
|
(2
)
|
(432
)
|
|
Other operating
results, net
|
(57
)
|
(4
)
|
11
|
(17
)
|
(23
)
|
-
|
12
|
(78
)
|
|
Management
fees
|
-
|
-
|
-
|
-
|
-
|
-
|
-
|
-
|
|
Profit
/ (Loss) from
operations
|
14,060
|
5,270
|
4,759
|
25
|
(69
)
|
(151
)
|
209
|
24,103
|
|
Share of profit /
(loss) of associates and joint
ventures (**)
|
-
|
-
|
26
|
-
|
(1,923
)
|
-
|
628
|
(1,269
)
|
|
Segment
profit / (loss)
|
14,060
|
5,270
|
4,785
|
25
|
(1,992
)
|
(151
)
|
837
|
22,834
|
|
|
|
|
|
|
|
|
|
|
|
Investment and
trading properties
|
40,468
|
13,133
|
10,670
|
-
|
-
|
-
|
625
|
64,896
|
|
Property, plant and
equipment
|
56
|
33
|
-
|
171
|
89
|
-
|
-
|
349
|
|
Investment in
associates and joint ventures
(*)
|
-
|
-
|
163
|
-
|
(1,740
)
|
-
|
2,595
|
1,018
|
|
Other reportable
assets
|
33
|
13
|
51
|
12
|
-
|
-
|
100
|
209
|
|
Reportable
assets
|
40,557
|
13,179
|
10,884
|
183
|
(1,651
)
|
-
|
3,320
|
66,472
|
(*) Includes
the investments in Condor for Ps. 697 and New Lipstick for Ps.
(2,437). See Note 20.
(**)
Includes the results of New Lipstick for Ps. (2,380). See Note
20.
From
all the revenues corresponding to the Operations Center in
Argentina, the 100% are originated in Argentina. No external client
represents 10% or more of revenue of any of the reportable
segments.
From
all of the assets corresponding to the Operations Center in
Argentina segments, Ps. 68,123 are located in Argentina and Ps.
(1,651) in other countries, principally in USA for Ps. (1,653) and
Uruguay for Ps. 2.
F-58
Cresud Sociedad Anónima,
Comercial, Inmobiliaria, Financiera y Agropecuaria
|
|
06.30.17
|
|||||||
|
|
Shopping Malls
|
Offices
|
Sales and developments
|
Hotels
|
International
|
Corporate
|
Others
|
Total
|
|
Revenues
|
3,047
|
434
|
99
|
725
|
-
|
-
|
6
|
4,311
|
|
Costs
|
(350
)
|
(29
)
|
(43
)
|
(484
)
|
-
|
-
|
(4
)
|
(910
)
|
|
Gross profit
|
2,697
|
405
|
56
|
241
|
-
|
-
|
2
|
3,401
|
|
Net
gain from fair value adjustment of investment
properties
|
2,068
|
1,373
|
849
|
-
|
-
|
-
|
199
|
4,489
|
|
General
and administrative expenses
|
(261
)
|
(70
)
|
(40
)
|
(135
)
|
(43
)
|
(132
)
|
(2
)
|
(683
)
|
|
Selling
expenses
|
(188
)
|
(46
)
|
(21
)
|
(97
)
|
-
|
-
|
(3
)
|
(355
)
|
|
Other
operating results, net
|
(58
)
|
(12
)
|
(36
)
|
(1
)
|
27
|
-
|
12
|
(68
)
|
|
Management
fees
|
-
|
-
|
-
|
-
|
-
|
-
|
-
|
-
|
|
Profit / (Loss) from operations
|
4,258
|
1,650
|
808
|
8
|
(16
)
|
(132
)
|
208
|
6,784
|
|
Share
of profit / (loss) of associates and joint ventures
|
-
|
-
|
14
|
-
|
(196
)
|
-
|
88
|
(94
)
|
|
Segment profit / (loss)
|
4,258
|
1,650
|
822
|
8
|
(212
)
|
(132
)
|
296
|
6,690
|
|
|
|
|
|
|
|
|
|
|
|
Investment
and trading properties
|
28,799
|
7,422
|
5,328
|
-
|
-
|
-
|
247
|
41,796
|
|
Property,
plant and equipment
|
55
|
42
|
-
|
168
|
2
|
-
|
-
|
267
|
|
Investment
in associates and joint ventures
|
-
|
-
|
95
|
-
|
570
|
-
|
2,054
|
2,719
|
|
Other
reportable assets
|
31
|
44
|
47
|
10
|
-
|
-
|
-
|
132
|
|
Reportable assets
|
28,885
|
7,508
|
5,470
|
178
|
572
|
-
|
2,301
|
44,914
|
From
all the revenues corresponding to the Operations Center in
Argentina, the 100% are originated in Argentina. No external client
represents 10% or more of revenue of any of the reportable
segments.
From
all of the assets corresponding to the Operations Center in
Argentina segments, Ps. 44,152 are located in Argentina and Ps. 762
in other countries, principally in USA for Ps. 570 and Uruguay for
Ps. 192.
|
|
06.30.16
|
|||||||
|
|
Shopping Malls
|
Offices
|
Sales and developments
|
Hotels
|
International
|
Corporate
|
Others
|
Total
|
|
Revenues
|
2,409
|
332
|
8
|
534
|
-
|
-
|
1
|
3,284
|
|
Costs
|
(250
)
|
(25
)
|
(20
)
|
(362
)
|
-
|
-
|
(2
)
|
(659
)
|
|
Gross profit / (loss)
|
2,159
|
307
|
(12
)
|
172
|
-
|
-
|
(1
)
|
2,625
|
|
Net
gain from fair value adjustment of investment
properties
|
16,132
|
1,226
|
773
|
-
|
-
|
-
|
36
|
18,167
|
|
General
and administrative expenses
|
(179
)
|
(85
)
|
(24
)
|
(103
)
|
(24
)
|
(72
)
|
-
|
(487
)
|
|
Selling
expenses
|
(145
)
|
(24
)
|
(23
)
|
(69
)
|
-
|
-
|
(3
)
|
(264
)
|
|
Other
operating results, net
|
(63
)
|
(6
)
|
(34
)
|
(2
)
|
92
|
-
|
1
|
(12
)
|
|
Management
fees
|
-
|
-
|
-
|
-
|
-
|
-
|
-
|
-
|
|
Profit / (Loss) from operations
|
17,904
|
1,418
|
680
|
(2
)
|
68
|
(72
)
|
33
|
20,029
|
|
Share
of profit / (loss) of associates and joint ventures
|
-
|
-
|
5
|
-
|
(130
)
|
-
|
251
|
126
|
|
Segment profit / (loss)
|
17,904
|
1,418
|
685
|
(2
)
|
(62
)
|
(72
)
|
284
|
20,155
|
|
|
|
|
|
|
|
|
|
|
|
Investment
and trading properties
|
26,613
|
5,534
|
4,575
|
-
|
-
|
-
|
37
|
36,759
|
|
Property,
plant and equipment
|
49
|
19
|
2
|
166
|
2
|
-
|
-
|
238
|
|
Investment
in associates and joint ventures
|
-
|
-
|
62
|
-
|
143
|
-
|
1,762
|
1,967
|
|
Other
reportable assets
|
33
|
11
|
91
|
8
|
-
|
-
|
-
|
143
|
|
Reportable assets
|
26,695
|
5,564
|
4,730
|
174
|
145
|
-
|
1,799
|
39,107
|
From
all the revenues corresponding to the Operations Center in
Argentina, the 100% are originated in Argentina. No external client
represents 10% or more of revenue of any of the reportable
segments.
From
all of the assets corresponding to the Operations Center in
Argentina segments, Ps. 38,804 are located in Argentina and Ps. 303
in other countries, principally in USA for Ps. 145 and Uruguay for
Ps. 158.
F-59
Cresud Sociedad Anónima,
Comercial, Inmobiliaria, Financiera y Agropecuaria
Below
is a summarized analysis of the lines of business of Group’s
operations center in Israel for the years ended June 30, 2018, 2017
and 2016:
|
|
06.30.18
|
||||||
|
|
Real
Estate
|
Supermarkets
|
Telecommunications
|
Insurance
|
Corporate
|
Others
|
Total
|
|
Revenues
|
6,180
|
60,470
|
19,347
|
-
|
-
|
583
|
86,580
|
|
Costs
|
(2,619
)
|
(44,563
)
|
(13,899
)
|
-
|
-
|
(314
)
|
(61,395
)
|
|
Gross
profit
|
3,561
|
15,907
|
5,448
|
-
|
-
|
269
|
25,185
|
|
Net gain from fair
value adjustment of investment properties
|
1,996
|
164
|
-
|
-
|
-
|
-
|
2,160
|
|
General and
administrative expenses
|
(363
)
|
(878
)
|
(1,810
)
|
-
|
(374
)
|
(445
)
|
(3,870
)
|
|
Selling
expenses
|
(115
)
|
(12,749
)
|
(3,974
)
|
-
|
-
|
(148
)
|
(16,986
)
|
|
Other operating
results, net
|
98
|
(177
)
|
140
|
-
|
434
|
(28
)
|
467
|
|
Management
fees
|
-
|
-
|
-
|
-
|
-
|
-
|
-
|
|
Profit
/ (Loss) from operations
|
5,177
|
2,267
|
(196
)
|
-
|
60
|
(352
)
|
6,956
|
|
Share of profit/
(loss) of associates and joint ventures
|
167
|
20
|
-
|
-
|
-
|
(230
)
|
(43
)
|
|
Segment
profit / (loss)
|
5,344
|
2,287
|
(196
)
|
-
|
60
|
(582
)
|
6,913
|
|
|
|
|
|
|
|
|
|
|
Reportable
assets
|
134,038
|
13,304
|
49,797
|
12,254
|
21,231
|
36,178
|
266,802
|
|
Reportable
liabilities
|
(104,202
)
|
-
|
(38,804
)
|
(1,214
)
|
(68,574
)
|
(2,658
)
|
(215,452
)
|
|
Net
reportable assets
|
29,836
|
13,304
|
10,993
|
11,040
|
(47,343
)
|
33,520
|
51,350
|
From
all revenues corresponding to the Operations Center in Israel, Ps.
1,482 are originated in USA (Ps. 1,149 in 2017) and the remaining
in Israel. No external client represents 10% or more of the revenue
of any of the reportable segments. From all assets corresponding to
the Operations Center in Israel segments, Ps. 34,930 are located in
USA (Ps. 21,781 in 2017), Ps. 1,049 in India (Ps. 768 in 2017) and
the remaining are located in Israel.
|
|
06.30.17
|
||||||
|
|
Real Estate
|
Supermarkets
|
Telecommunications
|
Insurance
|
Corporate
|
Others
|
Total
|
|
Revenues
|
4,918
|
47,277
|
15,964
|
-
|
-
|
263
|
68,422
|
|
Costs
|
(2,333
)
|
(35,432
)
|
(11,183
)
|
-
|
-
|
(162
)
|
(49,110
)
|
|
Gross profit
|
2,585
|
11,845
|
4,781
|
-
|
-
|
101
|
19,312
|
|
Net
gain from fair value adjustment of investment
properties
|
261
|
113
|
-
|
-
|
-
|
-
|
374
|
|
General
and administrative expenses
|
(290
)
|
(627
)
|
(1,592
)
|
-
|
(384
)
|
(280
)
|
(3,173
)
|
|
Selling
expenses
|
(91
)
|
(9,517
)
|
(3,406
)
|
-
|
-
|
(79
)
|
(13,093
)
|
|
Other
operating results, net
|
46
|
(52
)
|
(36
)
|
-
|
(48
)
|
(106
)
|
(196
)
|
|
Management
fees
|
-
|
-
|
-
|
-
|
-
|
-
|
-
|
|
Profit / (Loss) from
operations
|
2,511
|
1,762
|
(253
)
|
-
|
(432
)
|
(364
)
|
3,224
|
|
Share of profit / (loss) of associates
and
joint ventures
|
46
|
75
|
-
|
-
|
-
|
(16
)
|
105
|
|
Segment profit / (loss)
|
2,557
|
1,837
|
(253
)
|
-
|
(432
)
|
(380
)
|
3,329
|
|
|
|
|
|
|
|
|
|
|
Reportable
assets
|
79,427
|
38,521
|
31,648
|
8,562
|
14,734
|
6,072
|
178,964
|
|
Reportable
liabilities
|
(64,100
)
|
(29,239
)
|
(25,032
)
|
-
|
(33,705
)
|
(3,159
)
|
(155,235
)
|
|
Net reportable assets
|
15,327
|
9,282
|
6,616
|
8,562
|
(18,971
)
|
2,913
|
23,729
|
|
|
06.30.16
|
||||||
|
|
Real Estate
|
Supermarkets
|
Telecommunications
|
Insurance
|
Corporate
|
Others
|
Total
|
|
Revenues
|
1,538
|
18,610
|
6,655
|
-
|
-
|
274
|
27,077
|
|
Costs
|
(467
)
|
(14,076
)
|
(4,525
)
|
-
|
-
|
(184
)
|
(19,252
)
|
|
Gross profit
|
1,071
|
4,534
|
2,130
|
-
|
-
|
90
|
7,825
|
|
Net
gain from fair value adjustment of investment
properties
|
(294
)
|
23
|
-
|
-
|
-
|
-
|
(271
)
|
|
General
and administrative expenses
|
(100
)
|
(203
)
|
(708
)
|
-
|
(321
)
|
(28
)
|
(1,360
)
|
|
Selling
expenses
|
(29
)
|
(3,907
)
|
(1,493
)
|
-
|
-
|
(13
)
|
(5,442
)
|
|
Other
operating results, net
|
(19
)
|
(13
)
|
-
|
-
|
-
|
-
|
(32
)
|
|
Management
fees
|
-
|
-
|
-
|
-
|
-
|
-
|
-
|
|
Profit / (Loss) from
operations
|
629
|
434
|
(71
)
|
-
|
(321
)
|
49
|
720
|
|
Share of profit / (loss) of associates
and
joint ventures
|
226
|
-
|
-
|
-
|
-
|
(103
)
|
123
|
|
Segment profit / (loss)
|
855
|
434
|
(71
)
|
-
|
(321
)
|
(54
)
|
843
|
|
|
|
|
|
|
|
|
|
|
Reportable
assets
|
60,678
|
29,440
|
27,345
|
4,602
|
1,753
|
23,652
|
147,470
|
|
Reportable
liabilities
|
(49,576
)
|
(23,614
)
|
(21,657
)
|
-
|
(10,441
)
|
(27,701
)
|
(132,989
)
|
|
Net reportable assets
|
11,102
|
5,826
|
5,688
|
4,602
|
(8,688
)
|
(4,049
)
|
14,481
|
F-60
Cresud Sociedad Anónima,
Comercial, Inmobiliaria, Financiera y Agropecuaria
7.
Information
about the main subsidiaries
The
Group conducts its business through several operating subsidiaries
and holdings. The Group considers that the subsidiaries below are
the ones with non-controlling interests material to the Group. As
of June 30, 2018, 2017 and 2016 correspond to urban properties and
investment business from the Operations Center in Argentina and
agricultural business.
|
|
Direct interest of non-controlling interest % (1)
|
Current assets
|
Non-current assets
|
Current liabilities
|
Non-current liabilities
|
Net assets
|
Book value of non-controlling interests
|
|
|
June 30, 2018
|
||||||
|
Subsidiaries with direct participation of Cresud
|
|
|
|
|
|
|
|
|
IRSA
|
36.26
%
|
96,018
|
239,755
|
46,756
|
214,476
|
74,541
|
37,120
|
|
Brasilagro
|
43.29
%
|
2,736
|
5,934
|
1,493
|
1,621
|
5,556
|
3,151
|
|
Subsidiaries with indirect participation of Cresud
|
|
|
|
|
|
|
|
|
Elron
|
49.70
%
|
1,933
|
1,610
|
252
|
24
|
3,267
|
2,351
|
|
PBC
|
35.60
%
|
23,655
|
108,704
|
16,033
|
90,620
|
25,706
|
21,730
|
|
Cellcom
(2)
|
57.90
%
|
21,185
|
27,648
|
12,601
|
26,109
|
10,123
|
6,391
|
|
IRSA
CP
|
13.66
%
|
10,670
|
57,074
|
2,497
|
27,284
|
37,963
|
4,995
|
|
|
June 30, 2017
|
||||||
|
Subsidiaries with direct participation of Cresud
|
|
|
|
|
|
|
|
|
IRSA
|
36.24
%
|
65,492
|
165,750
|
46,434
|
137,472
|
47,336
|
21,472
|
|
Brasilagro
|
43.43
%
|
804
|
3,347
|
739
|
276
|
3,136
|
1,774
|
|
Subsidiaries with indirect participation of Cresud
|
|
|
|
|
|
|
|
|
Elron
|
49.68
%
|
1,669
|
1,183
|
162
|
10
|
2,680
|
1,975
|
|
PBC
|
35.56
%
|
10,956
|
64,345
|
10,503
|
49,902
|
14,896
|
11,161
|
|
Cellcom
(2)
|
57.74
%
|
11,209
|
18,273
|
8,171
|
15,974
|
5,337
|
3,706
|
|
IRSA
CP
|
5.39
%
|
4,515
|
37,907
|
1,801
|
17,605
|
23,016
|
1,194
|
|
|
Revenues
|
Net income / (loss)
|
Total comprehensive income / (loss)
|
Total comprehensive income / (loss) attributable to non-controlling
interest
|
Cash of operating activities
|
Cash of investing activities
|
Cash of financial activities
|
Net Increase (decrease) in cash and cash equivalents
|
Dividends distribution to non-controlling shareholders
|
|
|
Year ended June 30, 2018
|
||||||||
|
Subsidiaries with direct participation of Cresud
|
|
|
|
|
|
|
|
|
|
|
IRSA
|
33,088
|
21,295
|
14,114
|
6,292
|
14,339
|
(11,573
)
|
(3,867
)
|
(1,101
)
|
(1,490
)
|
|
Brasilagro
|
1,430
|
781
|
1,858
|
1,054
|
43
|
(407
)
|
805
|
441
|
-
|
|
Subsidiaries with indirect participation of Cresud
|
|
|
|
|
|
|
|
|
|
|
Elron
|
-
|
(512
)
|
(80
)
|
(510
)
|
(327
)
|
343
|
(132
)
|
(116
)
|
(155
)
|
|
PBC
|
6,183
|
2,958
|
(181
)
|
1,060
|
3,073
|
27
|
(1,191
)
|
1,909
|
717
|
|
Cellcom
(2)
|
19,145
|
(509
)
|
5
|
(504
)
|
3,997
|
(2,574
)
|
382
|
1,805
|
-
|
|
IRSA
CP
|
5,949
|
15,656
|
15,656
|
556
|
3,624
|
(3,861
)
|
1,800
|
1,563
|
(716
)
|
|
|
Year ended June 30, 2017
|
||||||||
|
Subsidiaries with direct participation of Cresud
|
|
|
|
|
|
|
|
|
|
|
IRSA
|
27,004
|
5,220
|
4,513
|
2,190
|
9,059
|
(2,068
)
|
1,537
|
8,528
|
(2,232
)
|
|
Brasilagro
|
693
|
134
|
822
|
76
|
328
|
(81
)
|
(307
)
|
(60
)
|
-
|
|
Subsidiaries with indirect participation of Cresud
|
|
|
|
|
|
|
|
|
|
|
Elron
|
-
|
(427
)
|
(63
)
|
(342
)
|
(235
)
|
147
|
(200
)
|
(288
)
|
106
|
|
PBC
|
4,877
|
886
|
(353
)
|
1,254
|
2,470
|
(2,208
)
|
283
|
545
|
(975
)
|
|
Cellcom
(2)
|
15,739
|
(329
)
|
-
|
(224
)
|
2,348
|
(1,574
)
|
(1,348
)
|
(574
)
|
-
|
|
IRSA
CP
|
4,997
|
3,378
|
3,378
|
117
|
2,875
|
(148
)
|
(958
)
|
1,769
|
(831
)
|
(1)
Corresponds to the
direct interest from the Group.
(2)
DIC considers it
exercises effective control over Cellcom because DIC is the group
with the higher percentage of votes vis-à-vis other
shareholders, being 46.16%, also taking into account the historic
voting performance in the Shareholders’ Meetings
Restrictions, commitments and other relevant issues
Analysis of the impact of the Concentration Law
On
December 2013, was published in the Official Gazette of Israel the
Promotion of Competition and Reduction of Concentration Law
N°, 5774-13 (‘the Concentration Law’) which has
material implications for IDBD, DIC and its investors, including
the disposal of the controlling interest in Clal. In accordance
with the provisions of the law, the structures of companies that
make public offer of their securities are restricted to two layers
of public companies.
In
November 2017, Dophin IL, a subsidiary of Dolphin Netherlands B.V.
acquired all the shares owned by IDBD in DIC (see note 4). Thus,
the section required by the aforementioned law for the year 2017 is
completed.
Prior
to December 31, 2019, the Group should reduce its control structure
of companies that make public offer in Israel to two layers. It
currently has three layers of public companies (DIC, PBC and
Gav-Yam). The management is analyzing which are the steps to retain
control over the Group subsidiaries and meet the requirements of
the Law. These alternatives may include corporate reorganizations
of the Operations Center in Israel.
F-61
Cresud Sociedad Anónima,
Comercial, Inmobiliaria, Financiera y Agropecuaria
Dolphin arbitration process
There
is an arbitration process going on between Dolphin and ETH
(previous shareholder of IDBD) in relation to certain issues
connected to the control obtainment of IDBD. In the arbitration
process, the parties have agreed to designate Eyal Rosovshy and
Giora Erdinas to promote a mediation. On August 17, 2017, a
mediation hearing was held and the parties failed to reach an
agreement. On January 31, 2018, the parties agreed to follow the
process in court. As of the date of presentation of these
consolidated financial statements, there have been no other
developments in the process and it is still pending resolution.
Management, based on the opinion of its legal advisors, considers
that the resolution of the present litigation will not have an
adverse effect for Cresud’s consolidated
results.
IDBD: Acquisition of non-controlling interest
In
March 2016, after the amendments to the agreements for the
acquisition of the IDBD shares from its minority shareholders,
Dolphin acquired all the shares outstanding on March 29, 2016 from
non-controlling shareholders of IDBD (except for those held by
IFISA). The price paid for each IDBD share held by non-controlling
shareholders was NIS 1.25 per share in cash plus NIS 1.20 per share
in bonds of the IDBD Series 9 Bonds (the “IDBD Bonds”).
Additionally, Dolphin undertook to pay NIS 1.05 per share (subject
to adjustments) in cash if Dolphin, either directly or indirectly,
gained control of Clal (more than 30%), or else if IDBD sold a
controlling shareholding in Clal (more than 30% to a third party)
under certain parameters (the “payment for Clal”),
which refers mainly to Clal’s sale price at a price which
exceeds 75% of its book value upon execution of the sale agreement
(subject to adjustments) and, under certain circumstances, the
proportion of Clal shares sold by IDBD. It is worth noting that,
the obligation to make such contingent payment will only expire if
the sale of a controlling interest is completed (more than 30% to a
third party), or if Dolphin obtains the control permission from
Clal.
In
addition, Dolphin agreed to pay certain minority shareholders which
held warrants that were exercised until March 28, 2016 with IDBD
bonds (based on the adjusted nominal value, which was completed) in
an amount equal to the difference between NIS 2.45 per share and
the exercise price of the warrants and to be entitled to the Clal
payment.
As
guaranty of the payment, Dolphin pledged 28% of its IDBD shares, as
well as all its rights in relation to the subordinated loan granted
in the amount of NIS 210 on December 2015 to IDBD (see Note 27),
until the payment obligation to Clal has been completed or has
expired after which the pledge will be discharged. Should new
shares be issued by IDBD, Dolphin will have to pledge additional
shares until completing the 28% of all IDBD share capital. This
pledge replaces the pre-existing pledge. Additionally, Dolphin
agreed not to exercise its right to convert the subordinated loans
into shares of IDBD until the pledge described above has been
released.
As of
the date of issuance of these Consolidated Financial Statements,
the only outstanding payment is that owed to Clal, in the event
that the described conditions are fulfilled.
Capital issuance in subsidiaries without participation of the
Group
During
April 2017, Shufersal issued approximately 12 million shares for a
total net consideration of NIS 210 (equivalent to approximately Ps.
882 as of the date of the issuance). As a result of such issuance,
DIC’s interest in Shufersal went down to nearly 56.11%. In
June 2017, Shufersal issued 8 million shares as part of a private
offering for a total amount of NIS 139 (equivalent to approximately
Ps. 654 on the issue date), thus diluting DIC’s interest to
54.19%.
During
April 2017, Gav Yam increased its share capital by NIS 180
(equivalent to approximately Ps. 810 on the issue date); PBC did
not take part in the offering, thus reducing its interest to 51.70%
as of that date.
F-62
Cresud Sociedad Anónima,
Comercial, Inmobiliaria, Financiera y Agropecuaria
8.
Investments
in associates and joint ventures
Changes
in the Group’s investments in associates and joint ventures
for the fiscal years ended June 30, 2018 and 2017 were as
follows:
|
|
06.30.18
|
06.30.17
|
|
Beginning
of the
year
|
8,155
|
17,128
|
|
Share-holding
(decrease) / increase in associates and
joint ventures
|
(392
)
|
1,100
|
|
Capital
contribution
|
185
|
172
|
|
Share of (loss)
/ profit
|
(583
)
|
365
|
|
Decrease for
control obtainment (Note 4)
|
-
|
(59
)
|
|
Incorporation by
business combination (Note 4)
|
-
|
107
|
|
Currency
translation adjustment
|
3,426
|
305
|
|
Cash dividends
(ii
)
|
(349
)
|
(272
)
|
|
Sale of
associates
|
-
|
1
|
|
Liquidation
distribution (iii)
|
(72
)
|
-
|
|
Capital
reduction
|
(284
)
|
(32
)
|
|
Transfer to
borrowings to associates (iv)
|
(190
)
|
-
|
|
Hedging
instruments
|
-
|
56
|
|
Defined benefit
plans
|
-
|
(7
)
|
|
Reclassification to
held for sale
|
(44
)
|
(10,709
)
|
|
Issuance of
capital
|
2
|
-
|
|
Decrease of
interest in associate
|
(339
)
|
-
|
|
Others
|
12,780
|
-
|
|
End
of the year (iv
)
|
22,295
|
8,155
|
(i)
As of June 30,
2017, Ps. (108) are included in "Share of profit / (loss) of
associates and joint ventures"; and, Ps. 193 are included in "Gain
/ (loss) from discontinued operations".
(ii)
See Note
31.
(iii)
Corresponds to the
distribution of the income from Baicom’s
liquidation.
(iv)
Corresponds to a
reclassification made at the time of formalizing the loan repayment
terms with the associate in the Operations Center in
Israel.
(v)
Includes Ps.
(2,452) and Ps. (72) reflecting interests in companies with
negative equity as of June 30, 2018 and 2017, respectively, which
are disclosed in “Provisions” (see Note
20).
Below
is a detail of the investments and the values of the stake held by
the Group in associates and joint ventures for the years ended as
of June 30, 2018 and 2017, as well as the Group's share of the
comprehensive results of these companies for the years ended on
June 30, 2018, 2017 and 2016:
|
|
% of
ownership interest
held
|
Value
of Group's interest in equity
|
Group's
interest in comprehensive income
|
|||||
|
Name
of the entity
|
06.30.18
|
06.30.17
|
06.30.16
|
06.30.18
|
06.30.17
|
06.30.18
|
06.30.17
|
06.30.16
|
|
Associates
|
|
|
|
|
|
|
|
|
|
New Lipstick
(1)
|
49.90
%
|
49.90
%
|
49.90
%
|
(2,452
)
|
(72
)
|
(2,380
)
|
(201
)
|
(64
)
|
|
BHSA
(2)
|
29.91
%
|
30.66
%
|
30.66
%
|
2,250
|
1,693
|
618
|
83
|
259
|
|
Condor
(3)
|
18.90
%
|
28.72
%
|
25.53
%
|
696
|
634
|
450
|
53
|
(27
)
|
|
PBEL
|
45.40
%
|
45.40
%
|
45.40
%
|
1,049
|
768
|
389
|
262
|
194
|
|
Adama
(4)
|
N/A
|
N/A
|
40.00
%
|
N/A
|
N/A
|
N/A
|
N/A
|
4,141
|
|
Shufersal
(7)
|
33.56
%
|
N/A
|
N/A
|
12,763
|
N/A
|
N/A
|
N/A
|
N/A
|
|
Other
associates
|
N/A
|
N/A
|
N/A
|
2,706
|
1,597
|
1,011
|
(315
)
|
489
|
|
|
|
|
|
|
|
|
|
|
|
Joint
ventures
|
|
|
|
|
|
|
|
|
|
Quality
(5)
|
50.00
%
|
50.00
%
|
50.00
%
|
1,062
|
482
|
541
|
119
|
155
|
|
La Rural
S.A.
|
50.00
%
|
50.00
%
|
N/A
|
94
|
113
|
14
|
15
|
N/A
|
|
Cresca S.A.
(8)
|
50.00
%
|
50.00
%
|
0.00
%
|
1
|
279
|
455
|
49
|
54
|
|
Mehadrin
(6)
|
45.41
%
|
45.41
%
|
45.41
%
|
2,272
|
1,312
|
961
|
309
|
433
|
|
Other joint
ventures
|
N/A
|
N/A
|
N/A
|
1,854
|
1,349
|
804
|
296
|
447
|
|
Total
associates and joint ventures
|
|
|
|
22,295
|
8,155
|
2,863
|
670
|
6,081
|
The
following is additional information about the Group's investments
in associates and joint ventures:
|
|
|
|
|
Last
financial statement
issued
|
||
|
Name
of the entity
|
Place
of business / Country of incorporation
|
Main
activity
|
Common
shares 1 vote
|
Share
capital (nominal value)
|
Income
/ (loss
) for the
year
|
Shareholders'
equity
|
|
Associates
|
|
|
|
|
|
|
|
New Lipstick
(1)
|
United
States
|
Real
estate
|
N/A
|
N/A
|
(*) (11)
|
(*) (178)
|
|
BHSA
(2)
|
Argentina
|
Financing
|
448,689,072
|
(***) 1.500
|
(***) 2.238
|
(***) 8.719
|
|
Condor
(3)
|
United
States
|
Hotel
|
2,198,225
|
N/A
|
(*) 1
|
(*) 109
|
|
Adama
(4)
|
Israel
|
Agrochemical
|
N/A
|
N/A
|
N/A
|
N/A
|
|
Shufersal
(7)
|
India
|
Retail
|
450
|
(**) 1
|
(**) (76)
|
(**) (465)
|
|
PBEL
|
Israel
|
Real
estate
|
79,282,087
|
N/A
|
N/A
|
N/A
|
|
|
|
|
|
|
||
|
Joint
ventures
|
|
|
|
|
|
|
|
Quality
(5)
|
Argentina
|
Real
estate
|
120,827,022
|
242
|
1,079
|
2,113
|
|
La Rural
S.A.
|
Argentina
|
Organization of
events
|
714,498
|
1
|
78
|
157
|
|
Mehadrin
(6)
|
Israel
|
Real
estate
|
1,509,889
|
(**) 3
|
(**) 57
|
(**) 595
|
N/A:
Not applicable.
F-63
Cresud Sociedad Anónima,
Comercial, Inmobiliaria, Financiera y Agropecuaria
(1)
New Lipstick's
equity comprises a rental office building in New York City known as
the “Lipstick Building” with related debt.
Metropolitan, a subsidiary of New Lipstick, has renegotiated its
non-recourse debt with IRSA, which amounted to US$ 113.1, and
obtained a debt reduction of US$ 20 by the lending bank, an
extension to April 30, 2020 and an interest rate reduction from
LIBOR + 4 b.p. to 2 b.p. upon payment of US$ 40 in cash (US$ 20 in
September 2017 and US$ 20 in October 2017), of which IRSA has
contributed with US$ 20. Following the renegotiation,
Metropolitan’s debt amounts to US$ 53.1. Additionally,
Metropolitan has agreed to exercise on or before February 1, 2019
the purchase option on part of the land where the property is built
and, to deposit the sum of money corresponding to 1% of the
purchase price. Furthermore, Metropolitan has agreed to cause IRSA
and other shareholders to furnish the bank, on or before February
1, 2020, with a payment guarantee with acceptable financial ratios
for the Bank for the outstanding balance of the purchase price, or
a letter of credit in relation to the loan balance then
outstanding.
(2)
BHSA is a
full-service commercial bank offering a wide variety of banking
activities and related financial services to individuals, small-
and medium-sized companies and large corporations. Share market
value is Ps. 6.65 per share. The effect of Treasury shares was
considered.
(3)
Condor is a
hotel-focused real estate investment trust (REIT). Share market
value as of June 30, 2018 is Ps. 10.70 per share.
(4)
Adama
is specialized in the chemical industry, mainly, in the
agrochemical industry. See Note 4.(n).
(5)
Quality is engaged
in the operation of the San Martín premises (formerly owned by
Nobleza Piccardo S.A.I.C. y F.).
(6)
Mehadrin
is a company engaged in the production and exports of citrus,
fruits and vegetables. The Group has a joint venture agreement in
relation to this company. Share market value as of June 30, 2018 is
NIS 18.78 per share.
(7)
Share
market value as of June 30, 2018 is NIS 2.24 per
share.
(8)
Cresca is a joint
venture between the Company and Carlos Casado S.A. with
agricultural operations in Paraguay.
(*)
Amounts presented
in millions of US dollars under USGAAP. Condor’s year-end
falls on December 31, so the Group estimates their interest will a
three-month lag including any material adjustments, if
any.
(**)
Amounts in millions
of NIS.
(***)
Amounts as of June
30, 2018, prepared in accordance with BCRA’
regulations.
For
the purpose of the valuation of the investment in the Company, the
adjustments necessary to adequate the Financial Statements to IFRS
have been considered
Set out
below is summarized financial information of the associates and
joint ventures considered material to the Group:
|
|
Current assets
|
Non-current assets
|
Current liabilities
|
Non-current liabilities
|
Net assets
|
% of ownership interest held
|
Interest in associates / joint ventures
|
Goodwill and others
|
Book value
|
|
|
June 30, 2018
|
||||||||
|
Associates
|
|
|
|
|
|
|
|
|
|
|
BHSA
|
56,150
|
24,837
|
44,697
|
28,560
|
7,730
(iv)
|
29.91%
(iii)
|
2,312
|
(62
)
|
2,25
|
|
PBEL
|
1,965
|
418
|
584
|
5,468
|
(3,669
)
|
45.00
%
|
(1,651
)
|
2,700
|
1,049
|
|
Shufersal
|
21,982
|
38,606
|
24,072
|
22,100
|
14,416
|
33.56
%
|
4,838
|
7,925
|
12,763
|
|
|
|
|
|
|
|
|
|
|
|
|
Joint ventures
|
|
|
|
|
|
|
|
|
|
|
Quality
Invest (ii)
|
5
|
2,820
|
64
|
648
|
2,113
|
50.00
%
|
1,057
|
5
|
1,062
|
|
Mehadrin
|
6,367
|
5,665
|
4,860
|
2,478
|
4,694
|
45.41
%
|
2,132
|
140
|
2,272
|
|
|
June 30, 2017
|
||||||||
|
Associates
|
|
|
|
|
|
|
|
|
|
|
BHSA
|
36,762
|
18,228
|
33,675
|
15,548
|
5,767
|
30.66
%
|
1,768
|
(75
)
|
1,693
|
|
PBEL
|
1,469
|
272
|
181
|
4,302
|
(2,742
)
|
45.40
%
|
(1,245
)
|
2,013
|
768
|
|
Shufersal
|
12,764
|
23,482
|
16,556
|
12,983
|
6,707
|
39.33
%
|
2,638
|
1,202
|
3,84
|
|
|
|
|
|
|
|
|
|
|
|
|
Joint ventures
|
|
|
|
|
|
|
|
|
|
|
Quality
Invest (ii)
|
18
|
1,486
|
82
|
466
|
956
|
50.00
%
|
478
|
4
|
482
|
|
Mehadrin
|
3,439
|
3,520
|
2,900
|
1,502
|
2,557
|
45.41
%
|
1,161
|
1,462
|
1,312
|
|
|
Revenues
|
Net income / (loss)
|
Total comprehensive income / (loss)
|
Dividend distribution
|
Cash of operating activities
|
Cash of investment activities
|
Cash of financial activities
|
Changes in cash and cash equivalents
|
|
|
Year ended June 30, 2018 (i)
|
|||||||
|
Associates
|
|
|
|
|
|
|
|
|
|
BHSA
|
11,144
|
2,238
|
2,238
|
200
|
6,912
|
1,304
|
(2,832
)
|
6,180
|
|
PBEL
|
5
|
(355
)
|
(352
)
|
-
|
(49
)
|
255
|
(222
)
|
(16
)
|
|
Shufersal
|
60,486
|
1,187
|
(76
)
|
455
|
3,796
|
(4,877
)
|
2,937
|
1,856
|
|
|
|
|
|
|
|
|
|
|
|
Joint ventures
|
|
|
|
|
|
|
|
|
|
Quality
Invest (ii)
|
13
|
1,079
|
1,079
|
-
|
(80
)
|
-
|
80
|
-
|
|
Mehadrin
|
7,249
|
343
|
348
|
-
|
395
|
26
|
(71
)
|
350
|
|
|
Year ended June 30, 2017 (i)
|
|||||||
|
Associates
|
|
|
|
|
|
|
|
|
|
BHSA
|
6,821
|
625
|
625
|
-
|
(6,439
)
|
475
|
2,124
|
(3,840
)
|
|
PBEL
|
300
|
(292
)
|
(186
)
|
-
|
202
|
(37
|
(160
)
|
5
|
|
Shufersal
|
47,192
|
1
|
(7
)
|
(265
)
|
2,883
|
(1,59
|
(1,798
)
|
(505
)
|
|
|
|
|
|
|
|
|
|
|
|
Joint ventures
|
|
|
|
|
|
|
|
|
|
Quality
Invest (ii)
|
26
|
237
|
237
|
-
|
(11
)
|
-
|
11
|
-
|
|
Mehadrin
|
5,403
|
180
|
172
|
-
|
476
|
-76
|
(53
)
|
347
|
|
|
Year ended June 30, 2016 (i)
|
|||||||
|
Associates
|
|
|
|
|
|
|
|
|
|
BHSA
|
6,821
|
837
|
837
|
-
|
(9,462
)
|
2,606
|
4,1
|
(2,756
)
|
|
PBEL
|
-
|
(97
)
|
(90
)
|
-
|
145
|
(58
|
(90
)
|
(3
)
|
|
|
|
|
|
|
|
|
|
|
|
Joint ventures
|
|
|
|
|
|
|
|
|
|
Quality
Invest (ii)
|
4
|
(15
)
|
(15
)
|
-
|
(10
)
|
-
|
10
|
-
|
|
Mehadrin
|
2,636
|
219
|
219
|
-
|
309
|
-13
|
206
|
502
|
F-64
Cresud Sociedad Anónima,
Comercial, Inmobiliaria, Financiera y Agropecuaria
(i)
Information under
GAAP applicable in the associate and joint ventures´
jurisdiction.
(ii)
In March 2011,
Quality acquired an industrial plant located in San Martín,
Province of Buenos Aires. The facilities are suitable for multiple
uses. On January 20, 2015, Quality agreed with the Municipality of
San Martin on certain re zoning and other urban planning matters
(“the Agreement”) to surrender a non-significant
portion of the land and a monetary consideration of Ps. 40 million,
payable in two installments of Ps. 20 each, the first of which was
actually paid on June 30, 2015. In July 2017, the Agreement was
amended as follows: 1) a revised zoning plan must be submitted
within 120 days as from the amendment date, and 2) the second
installment of the monetary considerations was increased to Ps. 71
million payables in 18 equal monthly installments. On March 8,
2018, it was agreed with the well-known Gehl Study (Denmark) -
Urban Quality Consultant - the elaboration of a Master Plan,
generating a modern concept of New Urban District of Mixed
Uses.
(iii)
Considering the
effect of Treasury shares.
(iv)
Net of
non-controlling interest.
BHSA
BHSA is
subject to certain restrictions on the distribution of profits, as
required by BCRA regulations.
As of
June 30, 2018, BHSA has a remnant of 35.2 million Class C treasury
shares of a par value of Ps. 1 received in 2009 as a result of
certain financial transactions. The Annual Shareholders' Meeting
decided to allocate 35.1 million of such shares to an employee
compensation plan pursuant to Section 67 of Law 26,831. The
remaining shares belong to third party holders of Stock
Appreciation Rights, who have failed to produce the documentation
required for redemption purposes. As of June 30, 2018, considering
the effect of such treasury shares, the Group’s interest in
BHSA amounts to 29.91%.
The
Group estimated that the value in use of its investment in BHSA as
of June 30, 2018 and 2017 amounted to Ps. 2,673, Ps. 4,134,
respectively. The value in use was estimated based on the present
value of future business cash flows. The main assumptions used were
the following:
-
The Group
considered 7 years as the horizon for the projection of BHSA cash
flows.
-
The “Private
BADLAR” interest rate was projected based on internal data
and information gathered from external advisors.
-
The projected
exchange rate was estimated in accordance with internal data and
external information provided by independent
consultants.
-
The discount rate
used to discount actual dividend flows was 14.01% in 2018 and
12.99% in 2017.
-
The sensitivity to
a 1% increase in the discount rate would be a reduction in the
value in use of Ps. 237 for 2018 and of Ps. 506 for 2017. The
sensitivity to a 1% increase in the "Private BADLAR" interest rate
it would be an increase in the value in use of Ps. 292 for 2018 and
of Ps. 476 for 2017.
9.
Investment
properties
Changes
in the Group’s investment properties according to the fair
value hierarchy for the years ended June 30, 2018 and 2017 were as
follows:
|
|
06.30.18
|
06.30.17
|
||
|
|
Level 2
|
Level 3
|
Level 2
|
Level 3
|
|
Fair value at the beginning of the year
|
8,394
|
91,795
|
6,396
|
76,109
|
|
Reclassifications
of previous periods
|
-
|
-
|
-
|
(224
)
|
|
Currency
translation adjustment
|
265
|
40,041
|
18
|
10,494
|
|
Additions
|
1,335
|
1,954
|
591
|
2,059
|
|
Additions
of capitalized leasing costs
|
5
|
13
|
22
|
1
|
|
Depreciation
of capitalized leasing costs (i)
|
(3
)
|
(2
)
|
-
|
(1
)
|
|
Reclassification
to assets held for sale
|
-
|
(521
)
|
-
|
(71
)
|
|
Reclassification
to trading properties
|
353
|
-
|
-
|
(14
)
|
|
Transfers
|
2
|
(2
)
|
-
|
-
|
|
Reclassification
of property, plant and equipment (ii)
|
254
|
1,705
|
(149
)
|
173
|
|
Disposals
|
(179
)
|
(392
)
|
(179
)
|
(41
)
|
|
Balance
incorporated by business combination
|
107
|
-
|
-
|
-
|
|
Deconsolidation
(see Note 4.(l))
|
-
|
(4,489
)
|
-
|
-
|
|
Capitalized
finance costs
|
22
|
60
|
3
|
-
|
|
Net
gain from fair value adjustment
|
6,507
|
16,286
|
1,692
|
3,310
|
|
Fair value at the end of the year
|
17,062
|
146,448
|
8,394
|
91,795
|
(i)
Amortization
charges of capitalized leasing costs were included in
“Costs” in the Statements of Income (Note
26)
(ii)
As of June 30, 2018
includes Ps. 323 corresponding to the difference between valuation
at cost and fair value, which is allocated to a reserve within
equity
F-65
Cresud Sociedad Anónima,
Comercial, Inmobiliaria, Financiera y Agropecuaria
The
following is the balance by type of investment property of the
Group as of June 30, 2018 and 2017:
|
|
06.30.18
|
06.30.17
|
|
Leased
out farmland
|
923
|
304
|
|
Rental
properties
|
141,102
|
89,232
|
|
Undeveloped
parcels of land
|
12,608
|
7,647
|
|
Properties
under development
|
8,877
|
3,006
|
|
Total
|
163,510
|
100,189
|
Certain
investment property assets of the Group have been mortgaged or
restricted to secure some of the Group’s borrowings and other
payables. Book amount of those properties amounts to Ps. 26,378,
Ps. 40,719 as June 30, 2018 and 2017, respectively.
The
following amounts have been recognized in the Statements of
Income:
|
|
06.30.18
|
06.30.17
|
06.30.16
|
|
Rental
and services income
|
10,824
|
8,710
|
5,435
|
|
Direct
operating expenses
|
(3,053
)
|
(2,895
)
|
(2,396
)
|
|
Development
expenses
|
(1,748
)
|
(1,420
)
|
(151
)
|
|
Net
realized gain from fair value adjustment of investment
property
|
227
|
128
|
908
|
|
Net
unrealized gain from fair value adjustment of investment
property
|
22,402
|
4,873
|
16,631
|
Valuation processes
The
Group’s investment properties were valued at each reporting
date by independent professionally qualified appraisers who hold a
recognized relevant professional qualification and have experience
in the locations and segments of the investment properties
appraised. For all investment properties, their current use equates
to the highest and best use.
Each
business (or operations center, as appropriate) has a team, which
reviews the appraisals performed by the independent appraisers (the
“review team”). The review team: i) verifies all major
and important assumptions relevant to the appraisal in the
valuation report from the independent appraisers; ii) assesses
property valuation movements compared to the valuation report from
the prior period; and iii) holds discussions with the independent
appraisers.
Changes
in Level 2 and 3 fair values, if any, are analyzed at each
reporting date during the valuation discussions between the review
team and the independent appraisers. In the case of the Operations
Center in Argentina, the Board of Directors ultimately approves the
fair value calculation for recording into the Financial Statements.
In the case of the Operations Center in Israel, the appraisals are
examined by Israel Management and reported to the Financial
Statements Committee.
Valuation techniques used for the estimation of fair value of the
investment property
Agricultural business
For all
leases of agricultural land with a total valuation of Ps. 923 and
Ps. 304 for fiscal years ended on June 30, 2018 and 2017,
respectively, the valuation was determined using comparable values.
Sale prices of comparable properties are adjusted considering the
specific aspects of each property, the most relevant premise being
the price per hectare.
Urban properties and investments business
For
Shopping Malls in the Operations Center in Argentina and for rental
properties in the Operations Center in Israel, the valuation was
determined using discounted cash flow (“DCF”)
projections based on significant unobservable assumptions. The
following are the key assumptions
:
●
Future rental cash inflows based on the location, type and quality
of the properties and supported by the terms of the current lease
contract, and considering the estimations of the variation in the
Gross Domestic Product (GDP) and the estimated inflation rate given
by external advisors.
●
Given the prevailing inflationary context in Argentina and the
volatility of certain macroeconomic variables, it is not possible
to rely on a relevant long-term interest rate in pesos to discount
the projected cash flows for the shopping centers of the Argentine
Operations Center. As a result, we proceeded to dollarize the
projected cash flows through the future ARS / USD exchange rate
curve provided by an external consultant and discounted it with a
long-term interest rate in dollars, the weighted average cost of
capital ("WACC").
●
Cash flows from future investments, expansions, or improvements in
shopping malls were not considered.
F-66
Cresud Sociedad Anónima,
Comercial, Inmobiliaria, Financiera y Agropecuaria
●
Estimated vacancy rates taking into account current and future
market conditions once the current leases expire.
●
The projected cash flows in dollars were discounted using the
weighted average cost of capital (WACC) as the discount rate for
each valuation date in the Operation Center in Argentina and for
the Israel Operations Center, the discount rate used was one that
reflects the specific risks of each property.
●
Terminal value: it was determined on the basis of growth rate and
the discount rate.
●
The cash flows for the concessions were projected until the due
date of the concession determined in the current
agreement.
●
Real lease agreements, where payments differ from the proper rent,
if any, are subject to adjustments to reflect the actual payments
made during the term of the lease.
●
Type of lessees that occupy the property, the future lessees that
may occupy the property after leasing a vacant property, including
a general creditworthiness assessment.
●
The allocation of responsibilities between the Group and the lessee
as regards maintenance and insurance of the property.
●
The physical condition and remaining economic useful life of the
property.
For
offices and other rental properties in general in the Operations
Center in Argentina, and undeveloped land in general, the valuation
was determined using transactions of market comparables. These
values are adjusted for differences in key attributes such as
location, size of the property and quality of the interior design
and for some undeveloped lands, the valuation methodology
considered the lowest average incidence values in the area,
applying urbanistic indicators identical to those in the area of
influence. The most significant contribution to this market
comparables’ approach is the price per square
meter.
For
property under development the valuation is based on the estimated
fair value of the investment property after completing the
construction, less the present value of the estimated construction
costs expected to be incurred during completion of construction
works, considering a capitalization rate adjusted for risks and
relevant features of the property provided that it is considered
reliable. In case the valuation is not considered reliable, it is
based on costs incurred plus the fair value of the land at the end
of each year.
It can
sometimes be difficult to reliably determine the fair value of the
property under development. In order to assess whether the fair
value of the property under development can be determined reliably,
Management considers the following factors, among
others:
●
The provisions of
the construction contract.
●
The stage of
completion.
●
Whether the
project/property is standard (typical for the market) or
non-standard.
●
The level of
reliability of cash inflows after completion.
●
The development
risk specific to the property.
●
Past experience
with similar constructions.
●
Status of
construction permits.
There
were no changes to the valuation techniques during the fiscal years
ended June 30, 2018 and 2017.
The
following table presents information regarding the fair value
measurements of investment properties using significant
unobservable inputs (Level 3):
|
|
|
|
|
Sensitivity (i)
|
|||
|
|
06.30.18
|
06.30.17
|
|||||
|
Description
|
Valuation technique
|
Parameters
|
Range fiscal year 2018
|
Increase
|
Decrease
|
Increase
|
Decrease
|
|
Rental
properties in Israel - Offices (Level 3)
|
Discounted
cash flows
|
Discount
rate
|
7.00%
a 9.00%
|
(1,556
)
|
1,864
|
(1,040
)
|
1,193
|
|
|
|
Weighted
average rental value per square meter (m2) per month, in
NIS
|
NIS
63
|
3,037
|
(3,037
)
|
1,772
|
(1,772
)
|
|
Rental
properties in Israel - Commercial use (Level 3)
|
Discounted
cash flows
|
Discount
rate
|
7.00%
a 9.00%
|
(1,322
)
|
1,457
|
(759
)
|
853
|
|
|
|
Weighted
average rental value per square meter (m2) per month, in
NIS
|
NIS
87
|
1,640
|
(1,640
)
|
1,003
|
(1,003
)
|
F-67
Cresud Sociedad Anónima,
Comercial, Inmobiliaria, Financiera y Agropecuaria
|
|
|
|
|
Sensitivity (i)
|
|||
|
|
06.30.18
|
06.30.17
|
|||||
|
Description
|
Valuation technique
|
Parameters
|
Range fiscal year 2018
|
Increase
|
Decrease
|
Increase
|
Decrease
|
|
Rental
properties in Israel - Industrial use (Level 3)
|
Discounted
cash flows
|
Discount
rate
|
7.75%
a 9.00%
|
(477
)
|
538
|
(316
)
|
377
|
|
|
|
Weighted
average rental value per square meter (m2) per month, in
NIS
|
NIS
31
|
996
|
(996
)
|
599
|
(599
)
|
|
Rental
properties in USA - HSBC Building (Level 3)
|
Discounted
cash flows
|
Discount
rate
|
6.25%
|
(1,212
)
|
1,269
|
(715
)
|
765
|
|
|
|
Weighted
average rental value per square meter (m2) per month, in
USD
|
USD
73
|
2,654
|
(2,654
)
|
1,497
|
(1,497
)
|
|
Rental
properties in USA - Las Vegas project (Level 3)
|
Discounted
cash flows
|
Discount
rate
|
8.50%
|
(134
)
|
141
|
(86
)
|
91
|
|
|
|
Weighted
average rental value per square meter (m2) per month, in
USD
|
USD
33
|
301
|
(301
)
|
200
|
(200
)
|
|
Shopping
Malls in Argentina (Level 3)
|
Discounted
cash flows
|
Discount
rate
|
9.79%
|
(5,046
)
|
6,796
|
(3,948
)
|
5,445
|
|
|
|
Growth
rate
|
3.00%
|
3,104
|
(2,307
|
2,464
|
(1,794
)
|
|
|
|
Inflation
|
(*)
|
4,035
|
(3,643
)
|
2,684
|
(2,425
)
|
|
|
|
Devaluation
|
(*)
|
(6,554
)
|
9,831
|
(4,703
)
|
7,054
|
|
Plot
of land in Argentina (Level 3)
|
Comparable
properties with incidence adjustment
|
Value
per square meter (m2)
|
9,2
|
64
|
65
|
18
|
(52
)
|
|
|
|
%
of incidence
|
3.00%
|
2,165
|
(2,167
)
|
1,168
|
(1,202
)
|
|
Properties
under development in Israel (Level 3)
|
Estimated
fair value of the investment property after completing the
construction
|
Weighted
average construction cost per square meter (m2) in NIS
|
5,787
NIS/m2
|
-
|
-
|
-
|
-
|
|
|
|
Annual
weighted average discount rate
|
7.00%
a 9.00%
|
(377
)
|
377
|
(437
)
|
437
|
(*)
For the next 5
years, an average AR$ / US$ exchange rate with an upward trend was
considered, starting at Ps. 19.51 (corresponding to the year ended
June 30, 2018) and arriving at Ps. 49.05. In the long term, a
nominal devaluation rate of 5.6% calculated based on the quotient
between inflation in Argentina and the United States is assumed.
The considered inflation shows a downward trend, which starts at
25.0% (corresponding to the year ended June 30, 2018) and
stabilizes at 8% after 10 years. These premises were determined at
the closing date of the fiscal year.
(i)
Considering an
increase or decrease of: 100 points for the discount and growth
rate in Argentina, 10% for the incidence and inflation, 20% for the
devaluation, 50 points for the discount rate of Israel and USA, and
1% for the value of the m2.
10.
Property,
plant and equipment
Changes
in the Group’s property, plant and equipment for the years
ended June 30, 2018 and 2017 were as follows:
|
|
Owner
occupied farmland (i)
|
Bearer
plant (
v)
|
Buildings
and facilities
|
Machinery
and equipment
|
Communication
networks
|
Others
(ii)
|
Total
|
|
Balance
at June 30, 2016
|
2,555
|
92
|
13,326
|
2,813
|
5,410
|
2,605
|
26,801
|
|
Costs
|
2,865
|
195
|
13,929
|
3,153
|
5,877
|
2,871
|
28,890
|
|
Accumulated
depreciation
|
(310
)
|
(103
)
|
(603
)
|
(340
)
|
(467
)
|
(266
)
|
(2,089
)
|
|
Net
book amount at June 30, 2016
|
2,555
|
92
|
13,326
|
2,813
|
5,410
|
2,605
|
26,801
|
|
|
|
|
|
|
|
|
|
|
Currency
translation adjustment
|
444
|
(2
)
|
2,950
|
627
|
1,148
|
293
|
5,460
|
|
Additions
|
731
|
183
|
792
|
634
|
711
|
718
|
3,769
|
|
Reclassifications
of investment properties
|
194
|
-
|
(156
)
|
-
|
-
|
-
|
38
|
|
Reclassifications
to investment properties
|
(62
)
|
-
|
-
|
-
|
-
|
-
|
(62
)
|
|
Reclassification to
group of assets held for sale (Note 34)
|
-
|
-
|
(28
)
|
(16
)
|
-
|
(1,513
)
|
(1,557
)
|
|
Disposals
|
(161
)
|
(14
)
|
(4
)
|
(8
)
|
(23
)
|
(207
)
|
(417
)
|
|
Impairments /
Recoveries
|
-
|
-
|
12
|
-
|
-
|
-
|
12
|
|
Depreciation charge
(iii)
|
(72
)
|
(43
)
|
(630
)
|
(588
)
|
(1,084
)
|
(477
)
|
(2,894
)
|
|
Balance
at June 30, 2017
|
3,629
|
216
|
16,262
|
3,462
|
6,162
|
1,419
|
31,150
|
|
|
|
|
|
|
|
|
|
|
Costs
|
4,011
|
362
|
17,495
|
4,390
|
7,713
|
2,162
|
36,133
|
|
Accumulated
depreciation
|
(382
)
|
(146
)
|
(1,233
)
|
(928
)
|
(1,551
)
|
(743
)
|
(4,983
)
|
|
Net
book amount at June 30, 2017
|
3,629
|
216
|
16,262
|
3,462
|
6,162
|
1,419
|
31,150
|
|
|
|
|
|
|
|
|
|
|
Currency
translation adjustment
|
1,975
|
155
|
9,068
|
2,418
|
3,827
|
1,059
|
18,502
|
|
Additions
|
226
|
219
|
1,154
|
999
|
971
|
973
|
4,542
|
|
Reclassifications
of investment properties
|
5
|
-
|
3
|
-
|
-
|
-
|
8
|
|
Reclassifications
to investment
properties
|
(73
)
|
-
|
(1,571
)
|
-
|
-
|
-
|
(1,644
)
|
|
Disposals
|
(159
)
|
(1
)
|
(18
)
|
(24
)
|
(45
)
|
(12
)
|
(259
)
|
|
Impairments /
Recoveries
|
-
|
-
|
(69
)
|
-
|
-
|
-
|
(69
)
|
|
Depreciation charge
(i)
|
(95
)
|
(64
)
|
(911
)
|
(713
)
|
(1,297
)
|
(621
)
|
(3,701
)
|
|
Deconsolidation
|
-
|
-
|
(22,744
)
|
(5,941
)
|
-
|
(316
)
|
(29,001
)
|
|
Assets incorporated
by business combination
|
899
|
-
|
105
|
113
|
-
|
1
|
1,118
|
|
Balance
at June 30, 2018
|
6,407
|
525
|
1,279
|
314
|
9,618
|
2,503
|
20,646
|
|
|
|
|
|
|
|
|
|
|
Costs
|
6,898
|
645
|
2,030
|
489
|
14,975
|
4,354
|
29,391
|
|
Accumulated
depreciation
|
(491
)
|
(120
)
|
(751
)
|
(175
)
|
(5,357
)
|
(1,851
)
|
(8,745
)
|
|
Net
book amount at June 30, 2018
|
6,407
|
525
|
1,279
|
314
|
9,618
|
2,503
|
20,646
|
F-68
Cresud Sociedad Anónima,
Comercial, Inmobiliaria, Financiera y Agropecuaria
(i) On January 9,
2018, the INRA released a report declaring that Las Londras farm
(4565 ha.), with a book value of Ps. 371 as of June 30, 2018, is
within the area of the “Guarayos Forestry Reserve” and
establishes that the property of Agropecuaria Acres del Sud S.A.
should be reduced to 50 hectares, while the remaining acreage would
be reverted upon as a fiscal land once the process is concluded. It
should be noted that the report is preliminary and is subject to
appeal by the interested parties. The Company exercising its rights
presented an administrative filing
and
within the associations of producers that the company is part of.
Recently a census was ordered in the affected area, but no
definitive resolution was issued to delimit the reservation. At the
same time, a claim was made to our sellers to respond for eviction
by virtue of the declarations and guarantees granted at the time of
the sale of the property.
(ii) Includes
furniture and fixtures, vehicles and aircrafts, which have been
reclassified to held for sale (see Note 4).
(iii) Amortization
charge was recognized in the amount of Ps. 1,772 and Ps. 1,599
under "Costs", in the amount of Ps. 185 and Ps. 251 under "General
and administrative expenses" and Ps. 34 and Ps. 893 under "Selling
expenses" as of June 30, 2018 and 2017, respectively in the
Statements of Income (Note 26). In addition, a charge of Ps. 1,539
and Ps. 96 was recognized under "Discontinued operations" as of
June 30, 2018 and 2017, respectively.
(iv)
See Note 4. Includes other non-significant business
combinations.
(v) Corresponds to
the plantation of sugarcane with a useful life of more than one
year.
11.
Trading
properties
Changes
in the Group’s trading properties for the fiscal years ended
June 30, 2018 and 2017 were as follows:
|
|
Completed
properties
|
Properties
under development (i)
|
Undeveloped
properties
|
Total
|
|
At
June 30, 2016
|
236
|
3,534
|
1,204
|
4,974
|
|
Additions
|
2
|
1,188
|
39
|
1,229
|
|
Currency
translation adjustment
|
152
|
650
|
167
|
969
|
|
Transfers
|
1,101
|
(687
)
|
(414
)
|
-
|
|
Transfers from
intangible assets
|
13
|
-
|
-
|
13
|
|
Transfers from
investment properties
|
-
|
-
|
14
|
14
|
|
Capitalized finance
costs
|
-
|
1
|
-
|
1
|
|
Disposals
|
(703
)
|
(714
)
|
-
|
(1,417
)
|
|
At
June 30, 2017
|
801
|
3,972
|
1,010
|
5,783
|
|
Additions
|
14
|
1,683
|
173
|
1,870
|
|
Currency
translation adjustment
|
866
|
2,207
|
576
|
3,649
|
|
Transfers
|
1,435
|
(1,332
)
|
(103
)
|
-
|
|
Transfers of
intangible assets
|
9
|
-
|
-
|
9
|
|
Transfers from
investment properties
|
-
|
(353
)
|
-
|
(353
)
|
|
Capitalized finance
costs
|
-
|
11
|
-
|
11
|
|
Disposals
|
(516
)
|
(1,162
)
|
(39
)
|
(1,717
)
|
|
At
June 30, 2018
|
2,609
|
5,026
|
1,617
|
9,252
|
|
|
06.30.16
|
06.30.17
|
|
Non-current
|
6,020
|
4,534
|
|
Current
|
3,232
|
1,249
|
|
Total
|
9,252
|
5,783
|
(i) Includes
Zetol and Vista al Muelle plots of land, which have been mortgaged
to secure Group's borrowings. The net book value amounted to Ps.
306 and Ps. 190 as of June 30, 2018 and 2017, respectively.
Additionally, the Group has contractual obligations not provisioned
related to these plot of lands committed when certain properties
were acquired or real estate projects were approved, and amount to
Ps. 372 and Ps. 135, respectively. Both projects are expected to be
completed in 2029.
12.
Intangible
assets
Changes
in the Group’s intangible assets for the years ended June 30,
2018 and 2017 were as follows:
|
|
Goodwill business
|
Trademarks
|
Licenses
|
Customer relations
|
Information systems and software
|
Contracts and others (iii) (iv)
|
Total
|
|
Balance at June 30, 2016
|
2,238
|
3,355
|
759
|
3,219
|
957
|
1,286
|
11,814
|
|
Costs
|
2,238
|
3,378
|
817
|
3,923
|
1,202
|
1,478
|
13,036
|
|
Accumulated
depreciation
|
-
|
(23
)
|
(58
)
|
(704
)
|
(245
)
|
(192
)
|
(1,222
)
|
|
Net book amount at June 30, 2016
|
2,238
|
3,355
|
759
|
3,219
|
957
|
1,286
|
11,814
|
|
|
|
|
|
|
|
|
|
|
Assets
incorporated by business combination (i)
|
26
|
-
|
-
|
-
|
-
|
-
|
26
|
|
Currency
translation adjustment
|
511
|
732
|
148
|
494
|
235
|
170
|
2,290
|
|
Transfers
to assets held for sale
|
-
|
(81
)
|
-
|
(36
)
|
(21
)
|
(44
)
|
(182
)
|
|
Transfers
to trading properties
|
-
|
-
|
-
|
-
|
-
|
(13
)
|
(13
)
|
|
Reclassification
of previous periods
|
31
|
-
|
-
|
-
|
-
|
-
|
31
|
|
Additions
|
-
|
-
|
-
|
-
|
588
|
30
|
618
|
|
Disposals
|
-
|
-
|
-
|
-
|
-
|
(52
)
|
(52
)
|
|
Depreciation charge (ii
)
|
-
|
(52
)
|
(115
)
|
(1,115
)
|
(458
)
|
(349
)
|
(2,089
)
|
|
Balance at June 30, 2017
|
2,806
|
3,954
|
792
|
2,562
|
1,301
|
1,028
|
12,443
|
F-69
Cresud Sociedad Anónima,
Comercial, Inmobiliaria, Financiera y Agropecuaria
|
|
Goodwill
business
|
Trademarks
|
Licenses
|
Customer
relations
|
Information
systems and software
|
Contracts
and others (
iii)
(iv)
|
Total
|
|
Costs
|
2,806
|
4,029
|
1,002
|
4,746
|
2,122
|
1,679
|
16,384
|
|
Accumulated
depreciation
|
-
|
(75
)
|
(210
)
|
(2,184
)
|
(821
)
|
(651
)
|
(3,941
)
|
|
Net
book amount at June 30, 2017
|
2,806
|
3,954
|
792
|
2,562
|
1,301
|
1,028
|
12,443
|
|
|
|
|
|
|
|
|
|
|
Assets incorporated
by business combination (i)
|
994
|
-
|
-
|
-
|
-
|
15
|
1,009
|
|
Deconsolidation
(Note 4.(l))
|
(2,666
)
|
(3,393
)
|
-
|
(442
)
|
(497
)
|
(110
)
|
(7,108
)
|
|
Currency
translation adjustment
|
1,987
|
2,561
|
470
|
1,126
|
828
|
410
|
7,382
|
|
Transfers to
trading properties
|
-
|
-
|
-
|
-
|
-
|
(9
)
|
(9
)
|
|
Additions
|
-
|
-
|
-
|
-
|
572
|
80
|
652
|
|
Depreciation charge
(ii)
|
-
|
(45
)
|
(86
)
|
(945
)
|
(534
)
|
(396
)
|
(2,006
)
|
|
Balance
at June 30, 2018
|
3,121
|
3,077
|
1,176
|
2,301
|
1,670
|
1,018
|
12,363
|
|
|
|
|
|
|
|
|
|
|
Costs
|
3,121
|
3,274
|
1,657
|
6,933
|
3,304
|
2,715
|
21,004
|
|
Accumulated
depreciation
|
-
|
(197
)
|
(481
)
|
(4,632
)
|
(1,634
)
|
(1,697
)
|
(8,641
)
|
|
Net
book amount at June 30, 2018
|
3,121
|
3,077
|
1,176
|
2,301
|
1,670
|
1,018
|
12,363
|
(i)
See Note 4.
Includes other non-significant business combinations.
(ii)
Amortization charge
was recognized in the amount of Ps. 489 and Ps. 488 under "Costs",
in the amount of Ps. 399 and Ps. 339 under "General and
administrative expenses" and Ps. 880 and Ps. 1,231 under "Selling
expenses" as of June 30, 2018 and 2017, respectively in the
Statements of Income (Note 26). In addition, a charge of Ps. 238
and Ps. 31 was recognized under "Discontinued operations" as of
June 30, 2018 and 2017, respectively
(iii)
Includes "Rights of
use". Corresponds to Distrito Arcos.
(iv)
Includes "Rights to
receive future units under barter agreements". Corresponds to
receivables in kind representing the right to receive residential
apartments in the future under barter agreements. Caballito: On
June 29, 2011, the Group and TGLT entered into a barter agreement
in the amount of US$ 12.8. In 2013, a neighborhood association
secured a preliminary injunction, which suspended the works, to be
carried out by TGLT in the property and started a claim against
GCBA and TGLT. As a consequence of the unfavorable rulings rendered
by lower courts and appellate courts in the cited proceeding, the
Group and TGLT reached a settlement agreement dated December 30
2016, whereby they agreed to provide a deed for the revocation of
the barter agreement, after TGLT resolved certain issues.
Consequently, the Group has decided to deregister the intangible
asset related to this transaction, thus recognizing a loss of Ps.
27.7. Subsequently, on April 26, 2018, the deed for the revocation
was signed, which extinguished the obligations arising from the
“barter agreement” dated June 29, 2011, and its
amending agreements. Thus, the Group has received the property
located in Caballito again.
The
goodwill assigned to real estate in Israel amounts to NIS 155 (Ps.
907 at the exchange rate at the end of the financial year 2018),
that assigned to telecommunications amounts to NIS 268 (Ps. 2,114
at the exchange rate at the end of the financial year 2018) and the
one assigned to supermarkets amounted to NIS 192. The rest is
goodwill that is allocated to the real estate segment of
Argentina.
13.
Biological
assets
Changes
in the Group’s biological assets
and
their allocation to the fair value hierarchy for the years ended
June 30, 2018 and 2017 were as follows:
|
|
Agricultural business
|
|||||||
|
|
Sown land-crops
|
Sugarcane
fields
|
Breeding
cattle and cattle for sale
|
Dairy
cattle
|
Other
cattle
|
Others
|
Total
|
|
|
|
Level
1
|
Level
3
|
Level
3
|
Level
2
|
Level
2
|
Level
2
|
Level
1
|
|
|
As of June 30, 2016
|
23
|
355
|
97
|
507
|
49
|
11
|
7
|
1,049
|
|
|
|
|
|
|
|
|
|
|
|
Non-current
(Production)
|
-
|
-
|
-
|
432
|
49
|
9
|
7
|
497
|
|
Current
(Consumable)
|
23
|
355
|
97
|
75
|
-
|
2
|
-
|
552
|
|
As of June 30, 2016
|
23
|
355
|
97
|
507
|
49
|
11
|
7
|
1,049
|
|
|
|
|
|
|
|
|
|
|
|
Purchases
|
-
|
-
|
-
|
47
|
-
|
2
|
-
|
49
|
|
Changes
by transformation
|
(23
)
|
23
|
-
|
-
|
-
|
-
|
-
|
-
|
|
Initial
recognition and changes in the fair value of biological assets
(i)
|
(83
)
|
135
|
46
|
85
|
(80
)
|
1
|
-
|
104
|
|
Decrease
due to harvest
|
-
|
(1,529
)
|
(371
)
|
-
|
-
|
-
|
-
|
(1,900
)
|
|
Sales
|
-
|
-
|
-
|
(152
)
|
(23
)
|
-
|
-
|
(175
)
|
|
Consumptions
|
-
|
-
|
-
|
(1
)
|
-
|
(3
)
|
(1
)
|
(5
)
|
|
Costs
for the year
|
123
|
1,257
|
309
|
204
|
94
|
4
|
4
|
1,995
|
|
Additions
|
-
|
-
|
96
|
12
|
-
|
-
|
-
|
108
|
|
Foreign
exchange gain
|
2
|
2
|
(2
)
|
3
|
-
|
-
|
-
|
5
|
|
As of June 30, 2017
|
42
|
243
|
175
|
705
|
40
|
15
|
10
|
1,230
|
F-70
Cresud Sociedad Anónima,
Comercial, Inmobiliaria, Financiera y Agropecuaria
|
|
Agricultural business
|
|||||||
|
|
Sown land-crops
|
Sugarcane
fields
|
Breeding
cattle and cattle for sale
|
Dairy
cattle
|
Other
cattle
|
Others
|
Total
|
|
|
|
Level
1
|
Level
3
|
Level
3
|
Level
2
|
Level
2
|
Level
2
|
Level
1
|
|
|
Non-current
(Production)
|
-
|
-
|
-
|
607
|
40
|
14
|
10
|
671
|
|
Current
(Consumable)
|
42
|
243
|
175
|
98
|
-
|
1
|
-
|
559
|
|
As of June 30, 2017
|
42
|
243
|
175
|
705
|
40
|
15
|
10
|
1,230
|
|
|
|
|
|
|
|
|
|
|
|
Purchases
|
-
|
-
|
-
|
88
|
-
|
63
|
-
|
151
|
|
Changes
by transformation
|
(42
)
|
42
|
-
|
-
|
-
|
-
|
-
|
-
|
|
Initial
recognition and changes in the fair value of biological assets
(i)
|
(64
)
|
771
|
238
|
114
|
(39
)
|
(4
)
|
-
|
1,016
|
|
Decrease
due to harvest
|
-
|
(2,326
)
|
(855
)
|
-
|
-
|
-
|
-
|
(3,181
)
|
|
Sales
|
-
|
-
|
-
|
(287
)
|
(43
)
|
(24
)
|
(1
)
|
(355
)
|
|
Consumptions
|
-
|
-
|
-
|
(3
)
|
-
|
-
|
(2
)
|
(5
)
|
|
Costs
for the period / year
|
117
|
1,454
|
768
|
283
|
42
|
6
|
2
|
2,672
|
|
Additions
|
-
|
-
|
-
|
-
|
-
|
-
|
-
|
-
|
|
Foreign
exchange gain
|
6
|
80
|
125
|
74
|
-
|
-
|
-
|
285
|
|
As of June 30, 2018
|
59
|
264
|
451
|
974
|
-
|
56
|
9
|
1,813
|
|
|
|
|
|
|
|
|
|
|
|
Non-current
(Production)
|
-
|
-
|
-
|
875
|
-
|
16
|
9
|
900
|
|
Current
(Consumable)
|
59
|
264
|
451
|
99
|
-
|
40
|
-
|
913
|
|
As of June 30, 2018
|
59
|
264
|
451
|
974
|
-
|
56
|
9
|
1,813
|
(i)
Biological assets
with a production cycle of more than one year (that is, cattle)
generated “Initial recognition and changes in fair value of
biological assets” amounting to Ps. 71 and Ps. 6 for the
fiscal years ended June 30, 2018 and 2017, respectively. For the
fiscal years ended June 30, 2018 and 2017, amounts of Ps. 81 and
Ps. 93, was attributable to price changes, and amounts of Ps. (10)
and Ps. (87), was attributable to physical changes generated by
production result, respectively.
Crops and oilseeds
The
Group’s crops generally include crops and oilseeds (corn,
wheat, soybean and sunflower) as well as peanut. The Group measures
biological assets that have attained significant biological growth
at fair value less costs to sell. The Group measures biological
assets that have not attained significant biological growth or when
the impact of biological transformation on price is not expected to
be material, at cost less any impairment losses, which approximates
fair value.
Sugarcane
The
Group’s sugarcane production is based in Brazil and to a
lesser extent in Bolivia. This crop’s production requires
specific weather conditions (tropical and subtropical climates. The
Group recognizes these crops at a fair value net of costs of sales
from the moment of planting.
Fair value of biological assets
When an
active market exists for biological assets, the Group uses the
quoted market price in the principal market as a basis to determine
the fair value of its biological. Live cattle is measured at fair
value less cost to sell, based on market quoted at an auction
involving cattle of the same age, breed and genetic merit adjusted,
if applicable, to reflect any difference. When there is no active
market or market-determined prices are not available, (for example,
unharvested crops with significant growth or growing agricultural
produce of sugarcane), the Group determines the fair value of a
biological asset based on discounted cash flows
models.
These
models require the input of highly subjective assumptions including
observable and unobservable data. The not observable information is
determined based on the best information available for example, by
reference to historical information of past practices and results,
statistics and agricultural information and other analytical
techniques. Key assumptions utilized in this method include future
market prices, estimated yields at the point of harvest and
estimated future costs of harvesting and other costs.
Market
prices are generally determined by reference to observable data in
the principal market for the agricultural produce. Harvesting costs
and other costs are estimated based on historical and statistical
data. Yields are estimated based on several factors including the
location of the farmland and soil type, environmental conditions,
infrastructure and other restrictions and growth at the time of
measurement. Yields are subject to a high degree of uncertainty and
may be affected by several factors out of the Group’s control
including but not limited to extreme or unusual weather conditions,
plagues and other crop diseases.
F-71
Cresud Sociedad Anónima,
Comercial, Inmobiliaria, Financiera y Agropecuaria
The key
assumptions discussed above are highly sensitive. Reasonable shifts
in assumptions including but not limited to increases or decreases
in prices, costs and discount factors used may result in a
significant increase or decrease to the fair value of biological
assets recognized at any given time. Cash flows are projected based
on estimated production. Estimates of production in themselves are
dependent on various assumptions, in addition to those described
above, including but not limited to several factors such as
location, environmental conditions and other restrictions. Changes
in these estimates could materially impact on estimated production,
and could therefore affect estimates of future cash flows used in
the assessment of fair value. The valuation models and their
assumptions are reviewed periodically, and, if necessary,
adjusted.
As of
June 30 of each year, the Group’s biological assets that are
subject to a valuation model include unharvested crops and
sugarcane plantations.
During
years ended June 30, 2018 and 2017, there have been no transfers
between the several tiers used in estimating the fair value of the
Group’s biological assets, or reclassifications among their
respective categories.
The
fair value less estimated point of sale costs of agricultural
produce at the point of harvest amount to Ps. 3,207 and Ps. 1,975
for the years ended June 30, 2018 and 2017,
respectively.
When no
quoted prices are available in an active market, the Group uses a
range of valuation models. The following table presents main
parameters:
|
|
|
|
|
Sensitivity (i)
|
|||
|
|
06.30.18
|
06.30.17
|
|||||
|
Description
|
Valuation technique
|
Parameters
|
Range fiscal year 2018
|
Increase
|
Decrease
|
Increase
|
Decrease
|
|
Sown
land-crops (Level 3)
|
Discounted
cash flows
|
Yields
- Operating costs - Selling expenses - Future of sale
prices
|
Argentina
|
|
|
|
|
|
|
|
|
Yields:
0.89 - 15.69 tn./ha.
|
34
|
(34
)
|
37
|
(37
)
|
|
|
|
|
Future
of sale prices: 3,892 - 20,850 Ps./tn.
|
45
|
(45
)
|
62
|
(62
)
|
|
|
|
|
Operating
cost: 1,386 - 16,764 Ps./ha.
|
(20
)
|
20
|
(38
)
|
38
|
|
|
|
|
Brazil:
|
|
|
|
|
|
|
|
|
Yields:
3.57 - 6.55 tn./ha.
|
1
|
(1
)
|
1
|
(1
)
|
|
|
|
|
Future
of sale prices: 383 - 1,193 Rs./tn
|
1
|
(1
)
|
1
|
(1
)
|
|
Sugarcane
fields (Level 3)
|
Discounted
cash flows
|
Yields
- Operating costs - Selling expenses - Future of sale prices -
Discount rate
|
Brazil:
|
|
|
|
|
|
|
|
|
Yields:
73.69 tn./ha.
|
81
|
(81
|
45
|
(45
)
|
|
|
|
|
Future
of sale prices: 86.22 Rs./tn.
|
119
|
(119
)
|
72
|
(72
)
|
|
|
|
|
Operating
cost: 56.52 Rs./tn.
|
(92
)
|
92
|
(54
)
|
54
|
|
|
|
|
Bolivia:
|
|
|
|
|
|
|
|
|
Future
of sale prices: 24 US$/tn
|
1
|
(1
)
|
1
|
(1
)
|
|
|
|
|
Operating
cost: 275 - 465 US$/ha.
|
(1
)
|
1
|
-
|
-
|
(i)
Sensitivities for the biological assets measured at Level 3 have
been modeled considering a 10% change in the indicated variable,
all else being equal.
As of
June 30, 2018 and 2017, the better and maximum use of biological
assets shall not significantly differ from the current
use.
14.
Inventories
Breakdown of
Group’s inventories as of June 30, 2018 and 2017 are as
follows:
|
|
06.30.18
|
06.30.17
|
|
Crops
|
1,143
|
379
|
|
Materials and
supplies
|
341
|
221
|
|
Seeds and
fodders
|
145
|
135
|
|
Sugarcane
|
1
|
-
|
|
Beef
|
65
|
41
|
|
Agricultural
inventories
|
1,695
|
776
|
|
Good for resale and
supplies
|
-
|
3,873
|
|
Telephones and
others communication equipment
|
592
|
320
|
|
Others
|
37
|
67
|
|
Total
inventories
|
2,324
|
5,036
|
As of
June 30, 2018 and 2017 the cost of inventories recognized as
expense amounted to Ps. 52,996 and Ps. 41,559, respectively of
which Ps. 8,529 and Ps. 41,559, respectively, have been included in
“Costs” in the Statements of Income and as of June 30,
2016 Ps. 44,467 was recognized under "Discontinued
operations".
F-72
Cresud Sociedad Anónima,
Comercial, Inmobiliaria, Financiera y Agropecuaria
15.
Financial
instruments by category
The
note shows the financial assets and financial liabilities by
category and a reconciliation to the corresponding line in the
Consolidated Statements of Financial Position, as appropriate.
Since the line items “Trade and other receivables” and
“Trade and other payables” contain both financial
instruments and non-financial assets or liabilities (such as
prepayments, trade receivables, trade payables in-kind and tax
receivables and payables), the reconciliation is shown in the
columns headed “Non-financial assets” and
“Non-financial liabilities”. Financial assets and
liabilities measured at fair value are assigned based on their
different levels in the fair value hierarchy
IFRS 9
defines the fair value of a financial instrument as the amount for
which an asset could be exchanged, or a financial liability
settled, between knowledgeable, willing parties in an arm’s
length transaction. All financial instruments recognized at fair
value are allocated to one of the valuation hierarchy levels of
IFRS 7. This valuation hierarchy provides for three
levels.
In the
case of Level 1, valuation is based on quoted prices (unadjusted)
in active markets for identical assets and liabilities that the
Company can refer to at the date of valuation.
In the
case of Level 2, fair value is determined by using valuation
methods based on inputs directly or indirectly observable in the
market. If the financial instrument concerned has a fixed contract
period, the inputs used for valuation must be observable for the
whole of this period.
In the
case of Level 3, the Group uses valuation techniques not based on
inputs observable in the market. This is only permissible insofar
as no market data is available. The inputs used reflect the
Group’s assumptions regarding the factors which market
players would consider in their pricing.
The
Group’s Finance Division has a team in place in charge of
estimating the valuation of financial assets required to be
reported in the Consolidated Financial Statements, including the
fair value of Level-3 instruments. The team directly reports to the
Chief Financial Officer ("CFO"). The CFO and the valuation team
discuss the valuation methods and results upon the acquisition of
an asset and, as of the end of each reporting period.
According to the
Group’s policy, transfers among the several categories of
valuation are recognized when occurred, or when there are changes
in the prevailing circumstances requiring the
transfer.
Financial assets
and financial liabilities as of June 30, 2018 are as
follows:
|
|
|
Financial
assets at fair value through profit or loss
|
|
|
|
||
|
|
Financial
assets at amortized cost (i)
|
Level
1
|
Level
2
|
Level
3
|
Subtotal
financial assets
|
Non-financial
assets
|
Total
|
|
June
30, 2018
|
|
|
|
|
|
|
|
|
Assets
as per Statement of Financial Position
|
|
|
|
|
|
|
|
|
Trade and other
receivables (excluding the allowance for doubtful accounts and
other receivables) (Note 16)
|
21,096
|
-
|
-
|
-
|
21,096
|
6,078
|
27,174
|
|
Investment in
financial assets:
|
|
|
|
|
|
|
|
|
- Equity securities
in public companies
|
-
|
824
|
-
|
135
|
959
|
-
|
959
|
|
- Equity securities
in private companies
|
-
|
-
|
-
|
1,168
|
1,168
|
-
|
1,168
|
|
-
Deposits
|
1,397
|
32
|
-
|
-
|
1,429
|
-
|
1,429
|
|
-
Bonds
|
10
|
13,933
|
505
|
-
|
14,448
|
-
|
14,448
|
|
- Mutual
funds
|
-
|
6,911
|
-
|
-
|
6,911
|
-
|
6,911
|
|
-
Others
|
-
|
1,642
|
-
|
793
|
2,435
|
-
|
2,435
|
|
Derivative
financial instruments:
|
|
|
|
|
|
|
|
|
- Crops
futures contracts
|
-
|
57
|
-
|
-
|
57
|
-
|
57
|
|
-
Swaps
|
-
|
-
|
-
|
-
|
-
|
-
|
-
|
|
- Crops
options contracts
|
-
|
30
|
-
|
-
|
30
|
-
|
30
|
|
-
Foreign-currency options contracts
|
-
|
11
|
-
|
-
|
11
|
-
|
11
|
|
-
Foreign-currency future contracts
|
-
|
-
|
71
|
-
|
71
|
-
|
71
|
|
-
Others
|
-
|
-
|
16
|
-
|
16
|
-
|
16
|
|
Restricted assets
(ii)
|
6,426
|
-
|
-
|
-
|
6,426
|
-
|
6,426
|
|
Financial assets
held for sale
|
|
|
|
|
|
|
|
|
-
Clal
|
-
|
12,254
|
-
|
-
|
12,254
|
-
|
12,254
|
|
Cash and cash
equivalents (excluding bank overdrafts):
|
|
|
|
|
|
|
|
|
- Cash on
hand and at bank
|
6,834
|
-
|
-
|
-
|
6,834
|
-
|
6,834
|
|
- Short-term
bank in deposits
|
350
|
-
|
-
|
-
|
350
|
-
|
350
|
|
- Mutual
funds
|
-
|
353
|
-
|
-
|
353
|
-
|
353
|
|
- Short-term
investments
|
28,334
|
2,779
|
-
|
-
|
31,113
|
-
|
31,113
|
|
Total
assets
|
64,447
|
38,826
|
592
|
2,096
|
105,961
|
6,078
|
112,039
|
F-73
Cresud Sociedad Anónima,
Comercial, Inmobiliaria, Financiera y Agropecuaria
|
|
|
Financial
liabilities at fair value
|
|
|
|
||
|
|
Financial
liabilities at amortized cost (i)
|
Level
1
|
Level
2
|
Level
3
|
Subtotal
financial liabilities
|
Non-financial
liabilities
|
Total
|
|
June
30, 2018
|
|
|
|
|
|
|
|
|
Liabilities
as per Statement of Financial Position
|
|
|
|
|
|
|
|
|
Trade and other
payables (Note 19)
|
16,678
|
-
|
-
|
-
|
16,678
|
4,791
|
21,469
|
|
Borrowings
(excluding finance lease liabilities) (Note 21)
|
219,375
|
-
|
-
|
-
|
219,375
|
-
|
219,375
|
|
Finance lease
obligations (Note
21
)
|
170
|
-
|
-
|
-
|
170
|
-
|
170
|
|
Derivative
financial instruments:
|
|
|
|
|
|
|
|
|
- Crops
futures contracts
|
-
|
58
|
-
|
-
|
58
|
-
|
58
|
|
- Forward
contracts
|
-
|
-
|
118
|
-
|
118
|
-
|
118
|
|
-
Foreign-currency future contracts
|
-
|
45
|
8
|
-
|
53
|
-
|
53
|
|
- Crops
options contracts
|
-
|
27
|
-
|
-
|
27
|
-
|
27
|
|
-
Foreign-currency options contracts
|
-
|
18
|
-
|
-
|
18
|
-
|
18
|
|
-
Swaps
|
-
|
1
|
47
|
-
|
48
|
-
|
48
|
|
-
Others
|
-
|
8
|
-
|
24
|
32
|
-
|
32
|
|
Total
liabilities
|
236,223
|
157
|
173
|
24
|
236,577
|
4,791
|
241,368
|
Financial assets
and financial liabilities as of June 30, 2017 were as
follows
|
|
|
Financial assets at fair value through profit or
loss
|
|
|
|
||
|
|
Financial assets at amortized cost (i)
|
Level 1
|
Level 2
|
Level 3
|
Subtotal financial assets
|
Non-financial assets
|
Total
|
|
June 30, 2017
|
|
|
|
|
|
|
|
|
Assets as per Statement of Financial Position
|
|
|
|
|
|
|
|
|
Trade
and other receivables (excluding the allowance for doubtful
accounts and other receivables) (Note 16)
|
19,975
|
-
|
-
|
-
|
19,975
|
4,153
|
24,128
|
|
Investment
in financial assets:
|
|
|
|
|
|
|
|
|
-
Equity securities in public companies
|
-
|
1,665
|
-
|
82
|
1,747
|
-
|
1,747
|
|
-
Equity securities in private companies
|
-
|
15
|
-
|
964
|
979
|
-
|
979
|
|
-
Deposits
|
1,235
|
14
|
-
|
-
|
1,249
|
-
|
1,249
|
|
-
Bonds
|
-
|
4,490
|
425
|
-
|
4,915
|
-
|
4,915
|
|
-
Mutual funds
|
-
|
3,986
|
-
|
-
|
3,986
|
-
|
3,986
|
|
-
Others
|
-
|
749
|
-
|
-
|
749
|
-
|
749
|
|
Derivative
financial instruments:
|
|
|
|
|
|
|
|
|
-
Crops options contracts
|
-
|
10
|
-
|
-
|
10
|
-
|
10
|
|
-
Swaps
|
-
|
-
|
29
|
-
|
29
|
-
|
29
|
|
-
Warrants
|
-
|
-
|
26
|
-
|
26
|
-
|
26
|
|
-
Foreign-currency options contracts
|
-
|
4
|
-
|
-
|
4
|
-
|
4
|
|
-
Foreign-currency future contracts
|
-
|
-
|
27
|
-
|
27
|
-
|
27
|
|
Financial
assets held for sale
|
-
|
8,562
|
-
|
-
|
8,562
|
-
|
8,562
|
|
Restricted
assets (ii)
|
1,069
|
-
|
-
|
-
|
1,069
|
-
|
1,069
|
|
Cash
and cash equivalents (excluding bank overdrafts):
|
|
|
|
|
|
|
|
|
-
Cash on hand and at bank
|
8,731
|
-
|
-
|
-
|
8,731
|
-
|
8,731
|
|
-
Short-term bank in deposits
|
5
|
-
|
-
|
-
|
5
|
-
|
5
|
|
-
Mutual funds
|
-
|
302
|
-
|
-
|
302
|
-
|
302
|
|
-
Short-term investments
|
14,510
|
1,815
|
-
|
-
|
16,325
|
-
|
16,325
|
|
Total assets
|
45,525
|
21,612
|
507
|
1,046
|
68,690
|
4,153
|
72,843
|
|
|
|
Financial liabilities at fair value
|
|
|
|
||
|
|
Financial liabilities at amortized cost
(i)
|
Level 1
|
Level 2
|
Level 3
|
Subtotal financial liabilities
|
Non-financial liabilities
|
Total
|
|
June 30, 2017
|
|
|
|
|
|
|
|
|
Liabilities as per Statement of Financial Position
|
|
|
|
|
|
|
|
|
Trade
and other payables (Note 19)
|
20,557
|
-
|
-
|
-
|
20,557
|
5,401
|
25,958
|
|
Borrowings
(excluding finance lease liabilities) (Note 21)
|
135,180
|
-
|
-
|
-
|
135,180
|
-
|
135,180
|
|
Finance
lease obligations (Note 21)
|
132
|
-
|
-
|
-
|
132
|
-
|
132
|
|
Derivative
financial instruments:
|
|
|
|
|
|
|
|
|
-
Crops futures contracts
|
-
|
11
|
-
|
-
|
11
|
-
|
11
|
|
-
Forward contracts
|
-
|
5
|
152
|
10
|
167
|
-
|
167
|
|
-
Foreign-currency future contracts
|
-
|
9
|
5
|
-
|
14
|
-
|
14
|
|
-
Crops options contracts
|
-
|
4
|
-
|
-
|
4
|
-
|
4
|
|
-
Foreign-currency options contracts
|
-
|
4
|
-
|
-
|
4
|
-
|
4
|
|
Total liabilities
|
155,869
|
33
|
157
|
10
|
156,069
|
5,401
|
161,470
|
(i) The fair
value of financial assets and liabilities at their amortized cost
does not differ significantly from their book value, except for
borrowings (Note 21).
(ii) Corresponds
to deposits in guarantee and escrows.
Liabilities carried
at amortized cost also include liabilities under finance leases
where the Group is the lessee and which therefore have to be
measured in accordance with IAS 17 “Leases”. The
categories disclosed are determined by reference to IFRS 9. Finance
leases are excluded from the scope of IFRS 7 “Financial
Instruments Disclosures”. Therefore, finance leases have been
shown separately
F-74
Cresud Sociedad Anónima,
Comercial, Inmobiliaria, Financiera y Agropecuaria
The
following are details of the book value of financial instruments
recognized, which were offset in the statements of financial
position:
|
|
06.30.18
|
06.30.17
|
||||
|
|
Gross
amounts recognized
|
Gross
amounts offset
|
Net
amount presented
|
Gross
amounts recognized
|
Gross
amounts offset
|
Net
amount presented
|
|
Financial
assets
|
|
|
|
|
|
|
|
Trade and other
receivables (excluding the allowance for doubtful accounts and
other receivables)
|
22,086
|
(990
)
|
21,096
|
20,879
|
(904
)
|
19,975
|
|
Financial
liabilities
|
|
|
|
|
|
|
|
Trade and other
payables
|
17,668
|
(990
)
|
16,678
|
21,461
|
(904
)
|
20,557
|
Income,
expense, gains and losses on financial instruments can be assigned
to the following categories:
|
|
Financial
assets and liabilities at amortized cost
|
Financial
assets and liabilities at fair value through profit or
loss
|
Total
|
|
June
30, 2018
|
|
|
|
|
Interest
income
|
814
|
-
|
814
|
|
Interest
expenses
|
(8,259
)
|
-
|
(8,259
)
|
|
Foreign exchange
loss
|
(14,263
)
|
-
|
(14,263
)
|
|
Dividends
income
|
82
|
-
|
82
|
|
Fair value gains
financial assets at fair value through profit or loss
|
-
|
623
|
623
|
|
Loss on debt
swap
|
(2,228
)
|
-
|
(2,228
)
|
|
Capitalized finance
costs
|
74
|
-
|
74
|
|
Loss from
derivative financial instruments (except commodities
)
|
-
|
(324
)
|
(324
)
|
|
Gain on the
revaluation of receivables arising from the sale of
farmland
|
-
|
85
|
85
|
|
Other financial
results
|
(431
)
|
-
|
(431
)
|
|
Net
result (i)
|
(24,211
)
|
384
|
(23,827
)
|
|
|
Financial assets and liabilities at amortized
cost
|
Financial assets and liabilities at fair value through profit
or loss
|
Total
|
|
June 30, 2017
|
|
|
|
|
Interest
income
|
755
|
-
|
755
|
|
Interest
expenses
|
(6,351
)
|
-
|
(6,351
)
|
|
Foreign
exchange loss
|
(1,548
)
|
-
|
(1,548
)
|
|
Dividends
income
|
68
|
-
|
68
|
|
Fair
value gains financial assets at fair value through profit or
loss
|
-
|
3,026
|
3,026
|
|
Loss
from repurchase of Non-convertible Notes
|
(31
)
|
-
|
(31
)
|
|
Gain
from derivative financial instruments (except
commodities)
|
-
|
146
|
146
|
|
Gain
on the revaluation of receivables arising from the sale of
farmland
|
-
|
37
|
37
|
|
Other
financial results
|
(805
)
|
-
|
(805
)
|
|
Net result (i)
|
(7,912
)
|
3,209
|
(4,703
)
|
|
|
Financial assets and liabilities at amortized
cost
|
Financial assets and liabilities at fair value through profit
or loss
|
Total
|
|
June 30, 2016
|
|
|
|
|
Interest
income
|
657
|
-
|
657
|
|
Interest
expenses
|
(2,688
)
|
-
|
(2,688
)
|
|
Foreign
exchange loss
|
(3,265
)
|
-
|
(3,265
)
|
|
Dividends
income
|
72
|
-
|
72
|
|
Capitalized
finance costs
|
-
|
-
|
-
|
|
Fair
value loss in financial assets at fair value through profit or
loss
|
-
|
(1,247
)
|
(1,247
)
|
|
Loss
from repurchase of Non-convertible Notes
|
(39
)
|
-
|
(39
)
|
|
Gain
from derivative financial instruments (except
commodities)
|
-
|
1,108
|
1,108
|
|
Gain
on the revaluation of receivables arising from the sale of
farmland
|
-
|
33
|
33
|
|
Impairment
of property, plant and equipment
|
-
|
-
|
-
|
|
Other
financial results
|
(677
)
|
-
|
(677
)
|
|
Net result (i)
|
(5,940
)
|
(106
)
|
(6,046
)
|
(i) Included
within “Financial results, net“ in the Statements of
Income.
F-75
Cresud Sociedad Anónima,
Comercial, Inmobiliaria, Financiera y Agropecuaria
Clal
Clal is
a holding company that mainly operates in the insurance and pension
markets and in segments of pension funds. The company holds assets
and other businesses (such as insurance agencies) and is one of the
largest insurance groups in Israel. Clal mainly develops its
activities in three operating segments: long-term savings, general
insurance and health insurance.
Given
that IDBD failed to meet the requirements set forth to have control
over an insurance company, on August 21, 2013, the Commissioner
required that IDBD granted an irrevocable power of attorney to Mr.
Moshe Tery ("the Trustee") for the 51% of the shareholding capital
and vote interests in Clal, thus transferring control over that
investee. From such date, IDBD recognized its equity interest in
Clal as a financial asset held for sale, at fair value through
profit or loss.
On
December 30, 2014, the Commissioner sent an additional letter
setting a term by which IDBD’s control over and equity
interests in Clal were to be sold and giving directions as to the
Trustee’s continuity in office, among other
aspects.
The
sale arrangement outlined in the letter involves IDBD’s and
the Trustee’s interests in the sale process under different
options and timeframes. The current sale arrangement involved the
sale of the interest in the stock exchange or by over-the-counter
trades, as per the following detail and by the following
dates:
a.
Sell at least 5% of
its equity interest in Clal, since May 7, 2016.
b.
Sell at least an
additional 5% of its equity interest in Clal, during each of the
subsequent four-month periods.
c.
If IDBD sells more
than 5% of its equity interest in Clal in any given four-month
period, the percentage in excess of the required 5% would be offset
against the percentage required in the following
period.
In case
IDBD does not fulfill its obligation in the manner described in the
above paragraph the Trustee is entitled to act upon the specified
arrangement in lieu of IDBD, pursuant to all powers that have been
vested under the representations of the trust letter. The
consideration for the sale would be transferred to IDBD, with the
expenses incurred in the sale process to be solely borne by
IDBD.
On May
1, 2017, IDBD agreed to sell the 5% of Clal’s shares jointly
with a swap transaction. Hence, the shares were sold on May 4
without any type of encumbrances, at a price of NIS 59.86 each
(i.e., for a total of roughly NIS 166, equivalent to nearly Ps. 697
at the exchange rate prevailing on that date). Such request had the
consent of the Trustee and a statement from the Commissioner
stating that such body does not object to the swap
transaction.
Concurrently with
the sale, IDBD entered into a swap transaction with a banking
institution whereby the former will charge or pay for the
difference between the sale value of the shares above described and
the value such shares will have at the time they are sold to the
third-party buyer upon the lapse of a 24-month period. IDBD cannot
repurchase such shares, in addition, other sales transactions were
made under this modality on August 30, 2017, January 1, 2018 and
May 3, 2018 (see Note 4.(h).). IDBD continues to evaluate courses
of action with regard to the District Court’s pronouncement,
including the possibility to file a motion for appeal.
Based
on the terms and conditions of the swap contract, IDBD maintains
the major risks and benefits of all of Clal shares; as a result, as
of June 30, 2018, all of Clal shares were reported as a financial
asset held for sale and a liability associated to the swap in the
amount of Ps. 4,465. Valuation of mentioned shares as of June 30,
2018 amounts to Ps. 7,787, and a loss of Ps. 1,826 has been
recorded, reflecting the increase/decrease in the market price and
the swap costs in financial results, net.
F-76
Cresud Sociedad Anónima,
Comercial, Inmobiliaria, Financiera y Agropecuaria
The
following table presents the changes in Level 3 financial
instruments as of June 30, 2018 and 2017:
|
|
Investments in financial assets - Public companies'
securities
|
Derivative financial instruments - Forwards
|
Investments in financial assets - Private companies'
securities
|
Investments in financial assets - Others
|
Loans - non-recourse loan
|
Total
|
|
Balances at June 30, 2016
|
499
|
-
|
1,324
|
140
|
(10,999
)
|
(9,036
)
|
|
Additions
and acquisitions
|
65
|
(8
)
|
44
|
-
|
-
|
101
|
|
Currency
translation adjustment
|
21
|
(2
)
|
169
|
6
|
242
|
436
|
|
Reclassification
to liabilities held for sale (Note 4)
|
-
|
-
|
-
|
-
|
11,272
|
11,272
|
|
Write
off
|
(702
)
|
66
|
-
|
(146
)
|
-
|
(782
)
|
|
Gains
and losses recognized in the year (i)
|
199
|
(66
)
|
(573
)
|
-
|
(515
)
|
(955
)
|
|
Balances at June 30, 2017
|
82
|
(10
)
|
964
|
-
|
-
|
1,036
|
|
Additions
and acquisitions
|
-
|
-
|
34
|
526
|
-
|
560
|
|
Transfer
to level 1 (ii)
|
-
|
-
|
(100
)
|
-
|
-
|
(100
)
|
|
Currency
translation adjustment
|
-
|
(14
)
|
489
|
78
|
-
|
553
|
|
Deconsolidation
(Note 4.(l))
|
-
|
-
|
(126
)
|
-
|
-
|
(126
)
|
|
Write
off
|
(67
)
|
-
|
-
|
-
|
-
|
(67
)
|
|
Gains
and losses recognized in the year (i)
|
120
|
-
|
(93
)
|
189
|
-
|
216
|
|
Balances at June 30, 2018
|
135
|
(24
)
|
1,168
|
793
|
-
|
2,072
|
(i)
Included within
“Financial results, net” in the Statements of
income.
(ii)
The Group
transferred a financial asset measured at fair value from level 3
to level 1, because it began trading in the stock
exchange.
During
the fiscal year, ended June 30, 2018, shares of private companies
were transferred from level 3 to level 1 when they began trading.
During the year ended June 30, 2017 and 2016, there were no
transfers between levels of the fair value hierarchy. When there
are no quoted prices available in an active market, fair values
(especially derivative instruments) are based on recognized
valuation methods. The Group uses a range of valuation models for
the measurement of Level 2 and Level 3 instruments, details of
which may be obtained from the following table.
|
Description
|
Pricing model / method
|
Parameters
|
Fair value hierarchy
|
Range
|
|
Trade
and other receivables -. Cellcom
|
Discounted
cash flows
|
Discount
interest rate.
|
Level
3
|
3.3
|
|
Interest
rate swaps
|
Cash
flows - Theoretical price
|
Interest
rate futures contracts and cash flows
|
Level
2
|
-
|
|
Preferred
shares of Condor
|
Binomial
tree – Theoretical price I
|
Underlying
asset price (Market price); share price volatility (historical) and
market interest rate (Libor rate curve).
|
Level
3
|
Underlying
asset price 1.8 to 2.2
Share
price volatility 58% to 78%
Market
interest-rate 1.7% to 2.1%
|
|
Promissory
note
|
Discounted
cash flows - Theoretical price
|
Market
interest-rate (Libor rate curve)
|
Level
3
|
Market
interest-rate 1.8% to 2.2%
|
|
Warrants
of Condor
|
Black-Scholes
– Theoretical price
|
Underlying
asset price (Market price); share price volatility (historical) and
market interest rate (Libor rate curve).
|
Level
2
|
Underlying
asset price 1.8 to 1.7
Share
price volatility 58% to 78%
Market
interest-rate 1.7% to 2.1%
|
|
TGLT
Non-convertible Notes
|
Black-Scholes
– Theoretical price
|
Underlying
asset price (Market price); share price volatility (historical) and
market interest rate.
|
Level
3
|
Underlying
asset price 8 to 12
Share
price volatility 50% to 70%
Market
interest-rate 8% to 9%
|
|
Call
option of Arcos
|
Discounted
cash flows
|
Projected
revenues and discounting rate.
|
Level
3
|
-
|
|
Investments
in financial assets - Other private companies’ securities
(*)
|
Cash
flow / NAV - Theoretical price
|
Projected revenue
discounted at the discount rate
The value is
calculated in accordance with shares in the equity funds on the
basis of their Financial Statements, based on fair value or
investments assessments.
|
Level
3
|
1 - 3.5
|
|
Investments
in financial assets - Others
|
Discounted
cash flows - Theoretical price
|
Projected revenue
discounted at the discount rate
The value is
calculated in accordance with shares in the equity funds on the
basis of their Financial Statements, based on fair value or
investment assessments.
|
Level
3
|
1 - 3.5
|
|
Derivative
financial instruments - Forwards
|
Theoretical
price
|
Underlying
asset price and volatility
|
Level 2 and
3
|
-
|
(*) An
increase in the discount rate would decrease the value of
investments in private companies, while an increase in projected
revenues would increase their value.
As of
June 30, 2018, there have been no changes to the economic or
business circumstances affecting the fair value of the financial
assets and liabilities of the group.
F-77
Cresud Sociedad Anónima,
Comercial, Inmobiliaria, Financiera y Agropecuaria
16.
Trade
and other receivables
Group’s trade
and other receivables as of June 30, 2018 and 2017 were as
follows:
|
|
06.30.18
|
06.30.17
|
|
Trade, leases and
services receivable
|
16,935
|
16,461
|
|
Less: allowance for
doubtful accounts
|
(837
)
|
(336
)
|
|
Total
trade receivables
|
16,098
|
16,125
|
|
Prepaid
expenses
|
4,821
|
3,614
|
|
Guarantee
deposits
|
164
|
17
|
|
Tax
credits
|
834
|
539
|
|
Borrowings granted,
deposits, and other balances
|
3,254
|
2,965
|
|
Others
|
1,166
|
532
|
|
Total
other receivables
|
10,239
|
7,667
|
|
Total
trade and other receivables
|
26,337
|
23,792
|
|
|
|
|
|
Non-current
|
9,129
|
5,456
|
|
Current
|
17,208
|
18,336
|
|
Total
|
26,337
|
23,792
|
Book
amounts of Group's trade and other receivables in foreign
currencies are detailed in Note 33.
The
fair value of current receivables approximates their respective
carrying amounts because, due to their short-term nature, the
effect of discounting is not considered significant. The present
value of receivables related to installment sales of communication
devices, made by Cellcom, was calculated using a discount rate of
3.3%. The book value of other non-current receivables is, or
approximates, its fair value on the balance sheet date. Fair values
are based on discounted cash flows (Level 3). The amount of these
non-current receivables is Ps. 3,188 as of June 30,
2018.
Trade
accounts receivables are generally presented in the Statements of
Financial Position net of allowances for doubtful accounts.
Impairment policies and procedures by type of receivables are
discussed in detail in Note 2. Movements on the Group’s
allowance for doubtful accounts were as follows
|
|
06.30.18
|
06.30.17
|
|
Beginning
of the year
|
336
|
191
|
|
Recoveries
(i)
|
(33
)
|
(13
)
|
|
Used during the
year
|
(274
)
|
(265
)
|
|
Additions
(i)
|
324
|
241
|
|
Currency
translation adjustment
|
626
|
182
|
|
Deconsolidation
|
(142
)
|
-
|
|
End
of the year
|
837
|
336
|
(i)
The creation and
release of the provision for impaired receivables have been
included in “Selling expenses” in the Statements of
Income (Note
.
26).
The
Group’s trade receivables comprise several classes. The
maximum exposure to credit risk at the reporting date is the
carrying amount of each class of receivables (see Note 5). The
Group also has receivables from related parties neither of them is
due nor impaired.
Due to
the distinct characteristics of each type of receivables, an aging
analysis of past due unimpaired and impaired receivables is shown
by type and class, as of June 30, 2018 and 2017 (a column of
non-past due receivables is also included so that the totals can be
reconciled with the amounts appearing on the Statement of Financial
Position):
|
|
Expired
|
|
|
|
|
||
|
|
Up
to 3
months
|
From
3 to 6 months
|
Over
6 months
|
Not
past
due
|
Allowance
|
Total
|
% of
representation
|
|
Agricultural
products
|
163
|
9
|
19
|
7
|
32
|
230
|
1.4
%
|
|
Office leases and
services
|
280
|
42
|
92
|
1,094
|
200
|
1,708
|
10.1
%
|
|
Hotel leases and
services
|
17
|
-
|
-
|
-
|
-
|
17
|
0.1
%
|
|
Consumer
financing
|
-
|
-
|
-
|
-
|
16
|
16
|
0.1
%
|
|
Hotel
operations
|
-
|
-
|
-
|
67
|
1
|
68
|
0.4
%
|
|
Disposal
of properties
|
10
|
1
|
25
|
984
|
-
|
1,020
|
6.0
%
|
|
Telecommunication
services
|
-
|
-
|
-
|
7,102
|
87
|
7,189
|
42.5
%
|
|
Tourism
activities
|
765
|
-
|
237
|
5,184
|
501
|
6,687
|
39.5
%
|
|
Total
at June 30, 2018
|
1,235
|
52
|
373
|
14,438
|
837
|
16,935
|
100
%
|
|
|
Expired
|
|
|
|
|
||
|
|
Up to 3 months
|
From 3 to 6 months
|
Over 6 months
|
Not past due
|
Allowance
|
Total
|
% of representation
|
|
Agricultural
products
|
75
|
4
|
10
|
338
|
24
|
451
|
2.7
%
|
|
Office
leases and services
|
103
|
26
|
65
|
604
|
101
|
899
|
5.5
%
|
|
Consumer
financing
|
-
|
-
|
-
|
-
|
16
|
16
|
0.1
%
|
|
Hotel
operations
|
1
|
-
|
-
|
61
|
1
|
63
|
0.4
%
|
|
Disposal
of properties
|
17
|
2
|
2
|
278
|
32
|
331
|
2.0
%
|
|
Sale
of communication equipment
|
-
|
-
|
2,156
|
2,719
|
-
|
4,875
|
29.6
%
|
|
Telecommunication
services
|
482
|
-
|
110
|
2,805
|
86
|
3,483
|
21.2
%
|
|
Sale
of products (supermarkets)
|
38
|
-
|
-
|
6,229
|
76
|
6,343
|
38.5
%
|
|
Total at June 30, 2017
|
716
|
32
|
2,343
|
13,034
|
336
|
16,461
|
100
%
|
F-78
Cresud Sociedad Anónima,
Comercial, Inmobiliaria, Financiera y Agropecuaria
17.
Cash
flow information
Following is a
detailed description of cash flows generated by the Group’s
operations for the years ended June 30, 2018, 2017 and
2016.
|
|
Note
|
06.30.18
|
06.30.17
|
06.30.16
|
|
Profit
for the
period
|
|
17,780
|
5,028
|
9,118
|
|
Profit
for the year
from discontinued
operations
|
|
(12,479
)
|
(4,093
)
|
(817
)
|
|
Adjustments
for
:
|
|
|
|
|
|
Income tax
expense
|
22
|
233
|
2,713
|
5,785
|
|
Depreciation and
amortization
|
26
|
3,764
|
3,463
|
1,545
|
|
(Gain) / Loss from
disposal
of
farmlands
|
|
(906
)
|
(280
)
|
2
|
|
(Gain) / Loss from
disposal of property, plant
and
equipment
|
|
(4
)
|
35
|
(2
)
|
|
Gain from
revaluation of receivables arising from the sale of
farmland
|
28
|
(85
)
|
(37
)
|
(33
)
|
|
(Recovery) / Charge
for impairment of property, plant and equipment
|
|
-
|
(12
)
|
26
|
|
Dividends
income
|
|
-
|
-
|
(72
)
|
|
Share-based
payments
|
|
32
|
84
|
46
|
|
Unrealized gain
from derivative financial instruments
|
28
|
111
|
(10
)
|
(914
)
|
|
Release of
intangible assets due to TGLT
agreement
|
|
-
|
27
|
-
|
|
Result from
business combinations
|
27
|
(510
)
|
(8
)
|
-
|
|
Unrealized initial
recognition and changes in fair value of biological assets and
agricultural products at the point
of
harvest
|
|
(703
)
|
(1,149
)
|
4
|
|
Changes in net
realizable value of agricultural products after
harvest
|
|
(303
)
|
74
|
(208
)
|
|
Net gain from fair
value adjustment of investment properties
|
|
(22,629
)
|
(4,900
)
|
(17,529
)
|
|
Provisions and
allowances
|
|
937
|
233
|
789
|
|
Other financial
results,
net
|
28
|
23,696
|
4,732
|
7,595
|
|
Share of loss /
(profit) of associates
and joint
ventures
|
8
|
603
|
(93
)
|
(534
)
|
|
Reversal of
currency translation
adjustment
|
27
|
-
|
(41
)
|
(100
)
|
|
Gain from disposal
of associates
|
27
|
(311
)
|
(1
)
|
(4
)
|
|
Loss from
repurchase of Non-convertible Notes
|
28
|
-
|
31
|
39
|
|
Share-based plan
granted
|
|
1
|
2
|
-
|
|
|
|
|
|
|
|
Changes
in operating assets and liabilities:
|
|
|
|
|
|
Decrease /
(Increase) in
biological
assets
|
|
650
|
1,085
|
(408
)
|
|
(Increase) /
Decrease in
inventories
|
|
(602
)
|
(122
)
|
92
|
|
Decrease in trading
properties
|
|
499
|
510
|
189
|
|
Increase in trade
and other receivables
|
|
50
|
(1,107
)
|
(715
)
|
|
Net variation in
derivative financial instruments
|
|
(98
)
|
91
|
(46
)
|
|
Increase in trade
and other payables
|
|
960
|
660
|
357
|
|
Increase in
salaries and social security
liabilities
|
|
133
|
102
|
49
|
|
Decrease in
provisions and previsions
|
|
(206
)
|
(87
)
|
(139
)
|
|
Net
cash generated by continuing operating activities before income tax
paid
|
|
10,613
|
6,930
|
4,115
|
|
Net
cash generated by discontinued operating activities before income
tax paid
|
|
4,144
|
3,280
|
892
|
|
Net
cash generated by operating activities before income tax
paid
|
|
14,757
|
10,210
|
5,007
|
The
following table shows balances incorporated as result of business
combination / deconsolidation or reclassification of assets and
liabilities to held for sale of subsidiaries:
|
|
06.30.18
|
06.30.17
|
06.30.16
|
|
Investment
properties
|
(4,382
)
|
-
|
29,586
|
|
Property, plant and
equipment
|
(27,900
)
|
1,712
|
15,104
|
|
Trading
properties
|
-
|
-
|
2,656
|
|
Intangible
assets
|
(6,188
)
|
19
|
6,603
|
|
Investments in
associates and joint ventures
|
(365
)
|
(74
)
|
9,268
|
|
Deferred income
tax
|
(121
)
|
53
|
(4,681
)
|
|
Trade and other
receivables
|
(11,875
)
|
591
|
9,713
|
|
Investment in
financial assets
|
(2,846
)
|
-
|
5,824
|
|
Derivative
financial instruments
|
(23
)
|
-
|
(54
)
|
|
Inventories
|
(5,896
)
|
-
|
1,919
|
|
Restricted
assets
|
(91
)
|
-
|
91
|
|
Financial assets
held for sale
|
22,891
|
-
|
5,129
|
|
Trade and other
payables
|
2,389
|
(917
)
|
(19,749
)
|
|
Salaries and social
security liabilities
|
21,050
|
(148
)
|
-
|
|
Borrowings
|
432
|
(660
)
|
(60,306
)
|
|
Provisions
|
7
|
2
|
(969
)
|
|
Deferred income tax
liabilities
|
2,796
|
1
|
(267
)
|
|
Employee
benefits
|
1,254
|
(47
)
|
(405
)
|
|
Net
amount of non-cash assets incorporated / held for sale
|
(8,868
)
|
532
|
(538
)
|
|
Cash and cash
equivalents
|
(5,554
)
|
150
|
-
|
|
Non-controlling
interest
|
7,329
|
40
|
(8,630
)
|
|
Goodwill
|
74
|
(26
)
|
1,391
|
|
Net
amount of assets incorporated / held for sale
|
(7,019
)
|
696
|
(7,777
)
|
|
Interest held
before acquisition
|
(472
)
|
67
|
-
|
|
Seller
financing
|
214
|
-
|
-
|
|
Foreign
exchange losses
|
(38
)
|
-
|
-
|
|
Fair value of
interest held
before business
combination
|
(510
)
|
-
|
-
|
|
Cash and cash
equivalents incorporated / held for sale
|
-
|
(150
)
|
9,193
|
|
Net
(outflow) inflow of cash and cash equivalents / assets and
liabilities
held for
sale
|
(7,825
)
|
613
|
1,416
|
F-79
Cresud Sociedad Anónima,
Comercial, Inmobiliaria, Financiera y Agropecuaria
The
following table shows a detail of significant non-cash transactions
occurred in the years ended June 30, 2018, 2017 and
2016:
|
|
06.30.18
|
06.30.17
|
06.30.16
|
|
|
|
|
|
|
Increase in
intangible assets through an increase in trade and other
payables
|
-
|
(111
)
|
-
|
|
Increase in trade
and other receivables through a decrease in property, plant and
equipment
|
-
|
(118
)
|
-
|
|
Increase in
derivative financial instruments through a decrease in investments
in financial assets
|
-
|
34
|
-
|
|
Increase in
financial assets through an increase in trade and other
payables
|
-
|
-
|
180
|
|
Increase of
investments in financial assets through a decrease of trade and
other receivables
|
-
|
-
|
71
|
|
Increase in
participation in associates through a decrease in assets by
derivative financial instruments
|
-
|
-
|
128
|
|
Increase in
investment properties through an increase in trading
properties
|
-
|
-
|
302
|
|
Increase in
investment properties through a decrease in property, plant and
equipment
|
-
|
-
|
57
|
|
Increase in trading
properties through an increase in trade and other
payables
|
10
|
-
|
317
|
|
Increase in
property, plant and equipment through an increase of trade and
other payables
|
793
|
(123
)
|
-
|
|
Increase in
property, plant and equipment through an increase of
borrowings
|
9
|
-
|
116
|
|
Cancellation of
Non-convertible Notes through an increase in other
payables
|
-
|
-
|
22
|
|
Decrease (increase)
of interest in subsidiaries, associates and joint ventures due
currency translation adjustment
|
(1,882
)
|
(1,083
)
|
-
|
|
Decrease in trade
and other payables through an increase in borrowings
|
-
|
-
|
-
|
|
Decrease in
borrowings through a decrease of interest in associates and joint
ventures
|
-
|
-
|
9
|
|
Distribution of
treasury shares
|
-
|
(7
)
|
-
|
|
Dividends
distribution to non-controlling shareholders not
yet paid
|
1,529
|
64
|
64
|
|
Uncollected
dividends
|
(113
)
|
(21
)
|
4
|
|
Share-based plan
granted
|
-
|
-
|
(4
)
|
|
Reimbursement of
prescribed dividends
|
-
|
-
|
6
|
|
Increase in
property, plant and equipment through a business
combination
|
(901
)
|
-
|
-
|
|
Decrease in
investments in associates and joint ventures through a decrease in
borrowings
|
201
|
-
|
-
|
|
Increase in
investments in associates and joint ventures through a decrease in
investments in financial assets
|
4
|
-
|
-
|
|
Payment of
dividends through an increase in trade and other
payables
|
8
|
-
|
-
|
|
Changes in
non-controlling interest through a decrease in trade and other
receivables
|
1,380
|
-
|
-
|
|
Increase of
investment properties through an increase in trade and other
payables
|
71
|
-
|
-
|
|
Increase of
investment properties through a decrease in trade and other
receivables
|
35
|
-
|
-
|
|
Increase in trade
and other receivables through an increase in
borrowings
|
109
|
-
|
-
|
|
Increase in trading
properties through capitalization of
finance costs
|
11
|
-
|
-
|
|
Increase of
investment properties through a capitalization of finance
costs
|
18
|
-
|
-
|
|
Decrease in
associates and joint ventures through uncollected
dividends
|
11
|
-
|
-
|
|
Decrease in
associates and joint ventures through an increase in assets held
for sale
|
44
|
-
|
-
|
|
Transfers of
property, plant and equipment to investment properties
|
(571
)
|
-
|
-
|
|
Share-based plan
granted
|
1
|
-
|
-
|
|
Increase in
investment properties through an increase in other reserves due to
the difference between cost and fair value
|
21
|
-
|
-
|
|
Increase
in financial operations through a
decrease in investments in associates and joint
ventures
|
65
|
-
|
-
|
|
Decrease
in associates and joint ventures
through an increase in trade and other
receivables
|
7
|
-
|
-
|
|
Increase
in trading properties through an
increase in trade and other payables
|
62
|
-
|
-
|
|
Increase
in trading properties through a
decrease in trade and other receivables
|
31
|
-
|
-
|
|
Increase in
investment properties through a decrease in trading
properties
|
353
|
-
|
-
|
18.
Shareholders’
Equity
Share capital and share premium
The
share capital of the Group is represented by common shares with a
nominal value of Ps. 1 per share and one vote each. . No activity
has been recorded for the fiscal years ended June 30, 2018. During
the fiscal year ended June 30, 2017, the Company's Board of
Directors decided on November 3, 2016 to carry out a pro rata
distribution among shareholders of 3,833,352 treasury shares. No
other activity has been recorded for the fiscal years ended June
30, 2016 in the capital accounts, other than those related to the
acquisition of treasury shares.
Inflation adjustment of share capital
The
Group’s Financial Statements were previously prepared on the
basis of general price-level accounting which reflected changes in
the purchase price of the Argentine Peso in the historical
Financial Statements through February 28, 2003. The inflation
adjustment related to share capital was appropriated to an
inflation adjustment reserve that formed part of shareholders'
equity. The balance of this reserve could be applied only towards
the issuance of common stock to shareholders of the Company.
Resolution 592/11 of the CNV requires that at the transition date
to IFRS certain equity accounts, such as the inflation adjustment
reserve, are not adjusted and are considered an integral part of
share capital.
F-80
Cresud Sociedad Anónima,
Comercial, Inmobiliaria, Financiera y Agropecuaria
Treasury shares
On May
22, 2018, the Board of Directors has resolved to increase the
amount of the program currently in force for the acquisition of the
common shares issued by the Company and to modify the maximum
amount of shares to be acquired, the payable price and the period
in which the acquisitions will take place, in order to contribute
to the reduction of the existing gap between the implicit value of
the Company, based on the value of the assets, and the value the
Company, based on the quoted price of its shares, with a view to
contribute to its strengthening in the market. Considering the
above, the Board of Cresud approve the repurchase of shares and
establish the terms and conditions for the acquisition of the
common shares issued by the Company under the provisions of Section
64 of Law Nº 26,831 and the Rules of the under the provisions
of Section 64 of Law Nº 26,831 and the Rules of CNV for an
amount up to Ps. 900 million and up to 10% of the capital stock of
the Company in the form of common shares or American Depositary
Shares or ADS representative of 10 shares each ADS, and with a up
to 25% of the average volume, of the daily transactions for the
Shares and ADS in the markets during the previous 90 days. The
payable price will be between Ps. 1 and up to Ps. 62.5 per shares
and between US$1 and up to US$25 per ADS. As of July 27, 2018, the
company finalized the share repurchase program.
During
the fiscal year ended June 30, 2018, the Company acquired in
various transactions 3,211,786 common shares (par value Ps. 1 per
share) for a total amount of Ps. 138.79 and 1,433,874 ADRs
(equivalent to 14,338,740 common shares) for a total amount of US$
27.19 (equivalents to Ps624.20), as provided by the terms and
conditions of the share repurchase plan. As of the date of these
financial statements, no due date has been set for the sale of the
acquired shares.
Legal reserve
According to Law
N° 19,550, 5% of the profit of the year is destinated to
constitute a legal reserve until it reaches the legal capped
amounts (20% of total capital). This legal reserve is not available
for dividend distribution and can only be released to absorb
losses. The Group has not reached the legal limit of this
reserve.
Special reserve
The
CNV, through General Ruling N° 562/9 and 576/10, has provided
for the application of Technical Resolutions N° 26 and 29 of
the FACPCE, which adopt the IFRS, IASB for companies subject to the
public offering regime ruled by Law 17,811, due to the listing of
their shares or corporate notes, and for entities that have applied
for authorization to be listed under the mentioned regime. The
Group has applied IFRS, as issued by the IASB, for the first time
in the year beginning July 1, 2012, with the transition date being
July 1, 2011. Pursuant to CNV General Ruling N° 609/12, the
Company set up a special reserve, to reflect the positive
difference between the balance at the beginning of retained
earnings disclosed in the first Financial Statements prepared
according to IFRS and the balance at closing of retained earnings
disclosed in the last Financial Statements prepared in accordance
with previously effective accounting standards. The reserve
recorded in due course amounted to Ps. 695, which as of June 30,
2017 were fully used to absorb the negative balances in the
retained earnings account.
During
fiscal year ended June 30, 2017, the Company’s Board of
Directors decided to change the accounting policy of investment
property from the cost method to the fair value method, as allowed
by IAS 40.
For
this reason, as of the transition date, figures have been modified
and, hence, the special reserve as set forth by General Ruling CNV
N° 609/12 has been increased to Ps. 1,516, which may only be
reversed to be capitalized or to absorb potential negative balances
under retained earnings.
Dividends
The
Shareholders Meeting held as of October 31, 2017 approved the
dividends distribution of Ps. 395, which were paid during the month
of November 2017. During the years ended June 30, 2017 and 2016,
there were no distributions of dividends.
Additional paid-in capital from treasury shares
Upon
sale of the treasury shares, the difference between the net
realizable value of the treasury shares sold and their acquisition
cost shall be recorded, whether it is a gain or a loss, as part of
owners’ contributions not yet capitalized to be called
“Additional Paid-in Capital from Treasury
Stock”.
F-81
Cresud Sociedad Anónima,
Comercial, Inmobiliaria, Financiera y Agropecuaria
19.
Trade
and other payables
Group’s trade
and other payables as of June 30, 2018 and 2017 were as
follows:
|
|
06.30.18
|
06.30.17
|
|
Trade
|
10,455
|
15,361
|
|
Construction
obligations
|
1,475
|
1,226
|
|
Accrued
invoices
|
1,353
|
849
|
|
Sales, rental and
services payments received in advance
|
3,752
|
4,377
|
|
Total
trade payables
|
17,035
|
21,813
|
|
Deferred
incomes
|
37
|
73
|
|
Construction
obligations
|
521
|
343
|
|
Dividends payable
to non-controlling shareholders
|
123
|
251
|
|
Taxes
payable
|
481
|
589
|
|
Management fees
(Note
31)
|
1,351
|
1,020
|
|
Others
|
1,921
|
1,869
|
|
Total
other payables
|
4,434
|
4,145
|
|
Total
trade and other payables
|
21,469
|
25,958
|
|
|
|
|
|
Non-current
|
3,577
|
3,988
|
|
Current
|
17,892
|
21,970
|
|
Total
|
21,469
|
25,958
|
The
fair value of payables approximates their respective carrying
amounts because, due to their short-term nature, the effect of
discounting is not considered significant. Fair values are based on
discounted cash flows (Level 3).
20.
Provisions
The
Group is subject to claims, lawsuits and other legal proceedings in
the ordinary course of business, including claims from clients
where a third party seeks reimbursement or damages. The
Group’s responsibility under such claims, lawsuits and legal
proceedings cannot be estimated with certainty. From time to time,
the status of each major issue is evaluated and its potential
financial exposure is assessed. If the potential loss involved in
the claim or proceeding is deemed probable and the amount may be
reasonably estimated, a liability is recorded. The Group estimates
the amount of such liability based on the available information and
in accordance with the provisions of the IFRS. If additional
information becomes available, the Group will make an evaluation of
claims, lawsuits and other outstanding proceeding, and will revise
its estimates.
The
following table shows the movements in the Group's provisions
categorized by type:
|
|
Legal
claims (i)
|
Investments
in associates and joint ventures (ii)
|
Site
dismantling and remediation (iii)
|
Onerous
contracts (iv)
|
Other
provisions (v)
|
Total
|
|
As
of June 30, 2016
|
704
|
47
|
114
|
296
|
427
|
1,588
|
|
Additions
|
259
|
105
|
-
|
20
|
131
|
515
|
|
Unused amounts
reversed
|
(269
)
|
(79
)
|
-
|
(135
)
|
(68
)
|
(551
)
|
|
Share of loss in
associates and joint ventures
|
-
|
(3
)
|
-
|
-
|
-
|
(3
)
|
|
Liabilities
incorporated by business combination (Note 4)
|
2
|
-
|
-
|
-
|
|
2
|
|
Currency
translation adjustment
|
141
|
2
|
26
|
39
|
90
|
298
|
|
As
of June 30, 2017
|
837
|
72
|
140
|
220
|
580
|
1,849
|
|
Additions
|
311
|
2,380
|
10
|
5
|
-
|
2,706
|
|
Recoveries
|
(299
)
|
-
|
(48
)
|
(123
)
|
48
|
(422
)
|
|
Deconsolidation
(see Note 4.(l))
|
(273
)
|
-
|
-
|
(174
)
|
-
|
(447
)
|
|
Liabilities
incorporated by business combination (Note 4)
|
10
|
-
|
-
|
-
|
-
|
10
|
|
Currency
translation adjustment
|
466
|
-
|
61
|
73
|
330
|
930
|
|
As
of June 30, 2018
|
1,052
|
2,452
|
163
|
1
|
958
|
4,626
|
|
|
06.30.18
|
06.30.17
|
|
Non-current
|
3,567
|
955
|
|
Current
|
1,059
|
894
|
|
Total
|
4,626
|
1,849
|
(i)
Additions and
recoveries are included in "Other operating results,
net"
(ii)
Corresponds to the
equity interest in New Lipstick with negative equity. Additions and
recoveries are included in "Share of profit / (loss) of associates
and joint ventures".
(iii)
The Group’s
companies are required to recognize certain costs related to the
dismantling of assets and remediation of sites from the places
where such assets are located. The calculation of such expenses is
based on the dismantling value for the current year, taking into
consideration the best estimate of future changes in prices,
inflation, etc. and such costs are capitalized at a risk-free
interest rate. Volume projections for retired or built assets are
recast based on expected changes from technological rulings and
requirements
F-82
Cresud Sociedad Anónima,
Comercial, Inmobiliaria, Financiera y Agropecuaria
(iv)
Provisions
for other contractual obligations include a series of obligations
resulting from a contractual liability or law, regarding which
there is a high degree of uncertainty as to the terms and the
necessary amounts to discharge such liability.
(v)
In November 2009,
PBC’s Audit Committee and Board of Directors approved the
agreement with Rock Real whereby the latter would look for and
propose to PBC the acquisition of commercial properties outside
Israel, in addition to assisting in the negotiations and management
of such properties. In return, Rock Real would receive 12% of the
net income generated by the acquired property. Pursuant to
amendment 16 of the Israel Commercial Act 5759-1999, the agreement
must be ratified by the Audit Committee before the third year after
the effective date; otherwise, it expires. The agreement has not
been ratified by the audit committee within such three-year term,
so in January 2017 PBC issued a statement that hinted at the
expiration of the agreement and informed that it would begin
negotiations to reduce the debt that currently amounts to NIS 106
(equivalent to Ps. 836 of these Consolidated Financial Statements).
The parties have appointed an arbitrator that should render a
decision on the dispute. The remaining corresponds to provisions
related to investment properties.
Dolphin
In
September 2016, a former non-controlling shareholder of IDBD (the
"Petitioner") filed a petition with the district court of Be'er
Sheva against Dolphin Netherlands, IFISA and Mr. Eduardo Elsztain
(jointly referred to as "Dolphin"), to initiate a claim under a
collective action (the “Petition”). The Petitioner
argues that in executing the modified tender offer of IDBH (a
former controlling company of IDBD), the non-controlling
shareholders of IDBD, which voted against the modification of the
tender offer, were forced to sell their shares at a value that
differed from the value initially agreed upon and that, therefore,
Dolphin should compensate them for an estimated amount of NIS 158
(equivalent to Ps. 754 as of the date of these Consolidated
Financial Statements). In July 2017, Dolphin filed a motion to
dismiss the Petition. Our legal advisors consider that the
collective petition will probably be dismissed by the Court. If not
dismissed, Dolphin will have to file an answer to the Petition
within the 60 days following the Court’s decision regarding
the motion to dismiss.
Cresud
On
February 23, 2016, a class action was filed against IRSA, the
Company, some first-line managers and directors with the District
Court of the USA for the Central District of California. The
complaint, on behalf of people holding American Depositary Receipts
of IRSA between November 3, 2014 and December 30, 2015, claims
presumed violations to the US federal securities laws. In addition,
it argues that defendants have made material misrepresentations and
made some omissions related to IRSA’s investment in
IDBD
Such
complaint was voluntarily waived on May 4, 2016 by the plaintiff
and filed again on May 9, 2016 with the US District Court by the
East District of Pennsylvania.
Furthermore,
the Companies and some of its first-line managers and directors are
defendants in a class action filed on April 29, 2016 with the US
District Court of the East District of Pennsylvania. The complaint,
on behalf of people holding American Depositary Receipts of the
Company between May 13, 2015 and December 30, 2015, claims
violations to the US federal securities laws. In addition, it
argues that defendants have made material misrepresentations and
made some omissions related to the IRSA’s investment in
IDBD.
Subsequently,
Cresud and IRSA requested that the complaint be moved to the
district of New York, which request was later granted.
On
December 8, 2016, the Court appointed the representatives of each
presumed class as primary plaintiffs and the lead legal advisor for
each of the classes. On February 13, 2017, the plaintiffs of both
classes filed a document containing certain amendments. The Company
and IRSA filed a petition requesting that the class action brought
by IRSA’s shareholders should be dismissed. On April 12,
2017, the court suspended the class action filed by the
Company’s shareholders until the Court decides on the
petition of dismissal of such class action. Filing information on
the motion to dismiss the collective remedy filed by shareholders
of IRSA was completed on July 7, 2017. The Court has yet to render
a decision on the motion to dismiss.
On
September 10, 2018, the Court issued an order granting IRSA and
Cresud’s motion to dismiss in its entirety. Plaintiffs have
appealed such order and the Court´s decision is
pending.
The
Companies hold that such allegations are meritless and will
continue making a strong defense in both actions.
Claims against Cellcom and its subsidiaries
In
the ordinary course of business, Cellcom receives various consumer
complaints, mainly through collective actions. They allege excess
collections, breach of agreements with customers and failure to
comply with established norms or licenses, which could cause harm
to consumers.
F-83
Cresud Sociedad Anónima,
Comercial, Inmobiliaria, Financiera y Agropecuaria
In
addition, the company receives other claims from employees,
subcontractors, suppliers and authorities, generally in relation to
non-compliance with the provisions of the law with respect to
payments upon termination of employment relationships, breach of
contracts, violation of copyright and patents or disputes for
payments demanded by the authorities.
Claims against PBC
On
July 4, 2017, PBC was served notice from the tax authority of
Israel of income tax official assessments based on a “better
assessment” of taxes for the years 2012-2015, and concluded
that PBC is required to pay approximately NIS 187 (including
interest) since compensation of losses is not
admitted.
In
the opinion of legal advisors to PBC, the company has sound
arguments against the Revenue Administration’s position and
will file its objection to it. As of the date of these Consolidated
Financial Statements, there is no provision in relation to this
claim.
21.
Borrowings
The
breakdown and the fair value of the Group borrowings as of June 30,
2018 and 2017 was as follows:
|
|
Book
value
|
Fair
value
|
||
|
|
06.30.18
|
06.30.17
|
06.30.18
|
06.30.17
|
|
Non-convertible
notes
|
177,980
|
111,059
|
189,949
|
113,552
|
|
Bank loans and
others
|
36,552
|
15,017
|
37,153
|
14,668
|
|
Non-recourse
loan
|
-
|
7,025
|
-
|
6,930
|
|
Bank
overdrafts
|
1,122
|
126
|
1,122
|
126
|
|
Other borrowings
(i)
|
3,891
|
2,085
|
5,076
|
2,051
|
|
Total
borrowings (ii)
|
219,545
|
135,312
|
233,300
|
137,327
|
|
|
|
|
|
|
|
Non-current
|
187,462
|
112,025
|
|
|
|
Current
|
32,083
|
23,287
|
|
|
|
Total
|
219,545
|
135,312
|
|
|
(i)
Includes financial leases for Ps. 170 and Ps. 132 as of June 30,
2018 and 2017.
(ii)
Includes Ps. 180,814 and Ps. 119,103 as of June 30, 2018 and 2017,
respectively, corresponding to the Operations Center in
Israel.
As of
June 30, 2018 and 2017, total borrowings include collateralized
liabilities (seller financing, leases and bank loans) of Ps. 34,201
and Ps. 11,546, respectively. These borrowings are mainly
collateralized by investment properties and property, plant and
equipment of the Group (Notes 9 and 10).
Borrowings also
include liabilities under finance leases where the Group is the
lessee and which therefore have to be measured in accordance with
IAS 17 “Leases”. Information regarding liabilities
under finance leases is disclosed in Note 23.
The
terms of the loans include standard covenants for this type of
financial operations. As of the date of these financial statements,
the Group has complied with the covenants contemplated in its
respective loan agreements.
The
maturity of the Group's borrowings (excluding obligations under
finance leases) is as follows:
|
|
06.30.18
|
06.30.17
|
|
|
|
|
|
Stock:
|
|
|
|
Less than one
year
|
30,099
|
21,845
|
|
Between 1 and 2
years
|
27,330
|
15,834
|
|
Between 2 and 3
years
|
23,442
|
15,474
|
|
Between 3 and 4
years
|
19,190
|
12,392
|
|
Between 4 and 5
years
|
51,113
|
10,856
|
|
More than 5
years
|
66,218
|
57,438
|
|
|
217,392
|
133,839
|
|
Do
not accrue
interest:
|
|
|
|
Less than one
year
|
1,841
|
1,298
|
|
Between 1 and 2
years
|
68
|
4
|
|
Between 2 and 3
years
|
33
|
7
|
|
Between 3 and 4
years
|
8
|
19
|
|
Between 4 and 5
years
|
-
|
5
|
|
More than 5
years
|
33
|
8
|
|
|
1,983
|
1,341
|
|
Finance
lease obligations
|
170
|
132
|
|
|
219,545
|
135,312
|
F-84
Cresud Sociedad Anónima,
Comercial, Inmobiliaria, Financiera y Agropecuaria
The
following tables shows a breakdown of Group’s borrowing by
type of fixed-rate and floating-rate, per currency denomination and
per functional currency of the subsidiary that holds the loans for
the fiscal years ended June 30, 2018 and 2017.
|
|
06.30.18
|
|||||
|
|
Argentine
Peso
|
Brazilian
Reais
|
Bolivian
Peso
|
Uruguayan
Peso
|
NIS
|
Total
|
|
Fixed
rate:
|
|
|
|
|
|
|
|
Argentine
Peso
|
1,519
|
-
|
-
|
-
|
-
|
1,519
|
|
Brazilian
Reais
|
-
|
318
|
-
|
-
|
-
|
318
|
|
US
Dollar
|
33,353
|
-
|
-
|
372
|
12,273
|
45,998
|
|
NIS
|
-
|
-
|
-
|
-
|
80,685
|
80,685
|
|
Subtotal
fixed-rate borrowings
|
34,872
|
318
|
-
|
372
|
92,958
|
128,520
|
|
Floating
rate:
|
|
|
|
|
|
|
|
Argentine
Peso
|
1,166
|
-
|
-
|
-
|
-
|
1,166
|
|
Brazilian
Reais
|
-
|
1,562
|
-
|
-
|
-
|
1,562
|
|
US
Dollar
|
271
|
-
|
-
|
-
|
1,642
|
1,913
|
|
NIS
|
-
|
-
|
-
|
-
|
86,214
|
86,214
|
|
Subtotal
floating rate borrowings
|
1,437
|
1,562
|
-
|
-
|
87,856
|
90,855
|
|
Total
borrowings as per
analysis
|
36,309
|
1,880
|
-
|
372
|
180,814
|
219,375
|
|
Finance lease
obligations
|
21
|
149
|
-
|
-
|
-
|
170
|
|
Total
borrowings as per Statement of Financial
Position
|
36,330
|
2,029
|
-
|
372
|
180,814
|
219,545
|
|
|
06.30.17
|
|||||
|
|
Argentine Peso
|
Brazilian Reais
|
Bolivian Peso
|
Uruguayan Peso
|
NIS
|
Total
|
|
Fixed rate:
|
|
|
|
|
|
|
|
Argentine
Peso
|
135
|
-
|
-
|
-
|
-
|
135
|
|
Brazilian
Reais
|
-
|
49
|
-
|
-
|
-
|
49
|
|
US
Dollar
|
16,193
|
-
|
-
|
134
|
7,741
|
24,068
|
|
NIS
|
-
|
-
|
-
|
-
|
35,867
|
35,867
|
|
Subtotal fixed-rate borrowings
|
16,328
|
49
|
-
|
134
|
43,608
|
60,119
|
|
Floating rate:
|
|
|
|
|
|
|
|
Argentine
Peso
|
557
|
-
|
-
|
-
|
-
|
557
|
|
Brazilian
Reais
|
-
|
468
|
-
|
-
|
-
|
468
|
|
US
Dollar
|
195
|
-
|
14
|
-
|
1,022
|
1,231
|
|
NIS
|
-
|
-
|
-
|
-
|
72,805
|
72,805
|
|
Subtotal floating rate borrowings
|
752
|
468
|
14
|
-
|
73,827
|
75,061
|
|
Total borrowings as per analysis
|
17,080
|
517
|
14
|
134
|
117,435
|
135,180
|
|
Finance
lease obligations
|
6
|
126
|
-
|
-
|
-
|
132
|
|
Total borrowings as per Statement of Financial
Position
|
17,086
|
643
|
14
|
134
|
117,435
|
135,312
|
The
following describes the debt issuances made by the Group for the
years ended June 30, 2018, and 2017:
|
Entity
|
Class
|
Issuance / expansion date
|
Amount in original currency
|
Maturity date
|
Interest
rate
|
Principal payment
|
Interest payment
|
|
|
Cresud
|
Class
XXIII
|
feb-18
|
US$
113
|
2/16/2023
|
6.50
%
|
At
expiration
|
biannual
|
|
|
Brasilagro
|
CRA
Serie I
|
may-18
|
$
R 85.2
|
8/1/2022
|
106.5%
from the DI rate
|
Annual
payments since 2020
|
annual
|
|
|
Brasilagro
|
CRA
Serie II
|
may-18
|
$
R 57
|
7/31/2023
|
110%
from the DI rate
|
Annual
payments since 2020
|
annual
|
|
|
IRSA
|
Class
VII
|
sep-16
|
384.2
|
9/9/2019
|
Badlar
+ 2.99% n.a
|
At
expiration
|
quarterly
|
|
|
IRSA
|
Class
VIII
|
sep-16
|
$
US 184.5
|
9/9/2019
|
7%
n.a.
|
At
expiration
|
quarterly
|
|
|
IRSA
CP
|
Class
IV
|
sep-17
|
US$
140
|
9/14/2020
|
5%
n.a.
|
At
expiration
|
quarterly
|
|
|
IDBD
|
SERIES
N
|
aug-16
|
NIS
325
|
12/29/2022
|
5.3%
e.a
|
At
expiration
|
quarterly
|
(1
)
|
|
IDBD
|
SERIES
M
|
feb-17
|
NIS
1,060
|
11/28/2019
|
5.40%
n.a.
|
At
expiration
|
quarterly
|
|
|
IDBD
|
SERIES
N
|
jul-17
|
NIS
642.1
|
12/30/2022
|
5.3%
e.a
|
At
expiration
|
quarterly
|
(1
)
|
|
IDBD
|
SERIES
N
|
nov-17
|
NIS
357
|
12/30/2022
|
5.3%
e.a
|
At
expiration
|
quarterly
|
(2
)
|
|
DIC
|
SERIES
F
|
aug-16
|
NIS
360
|
12/31/2025
|
4.95%
e.a.
|
Annual
payments since 2017
|
annual
|
|
|
DIC
|
SERIES
F
|
apr-17
|
NIS
444
|
12/31/2025
|
4.95%
e.a.
|
Annual
payments since 2017
|
annual
|
|
|
DIC
|
SERIES
J
|
dec-17
|
NIS
762
|
12/30/2026
|
4.8%
e.a.
|
Annual
payments since 2021
|
biannual
|
(2
)
|
|
PBC
|
SERIES
I
|
oct-16
|
NIS
102
|
6/29/2029
|
3.95%
e.a.
|
At
expiration
|
quarterly
|
|
|
PBC
|
SERIES
I
|
apr-17
|
NIS
431
|
6/29/2029
|
3.95%
e.a.
|
At
expiration
|
quarterly
|
|
|
PBC
|
SERIES
I
|
oct-17
|
NIS
497
|
6/29/2029
|
3.95%
e.a.
|
At
expiration
|
quarterly
|
|
|
PBC
|
SERIES
I
|
dec-17
|
NIS
496
|
6/29/2029
|
3.95%
e.a.
|
At
expiration
|
quarterly
|
(2
)
|
|
Gav
- Yam
|
SERIES
F
|
apr-17
|
NIS
303
|
3/31/2026
|
4.75%
e.a.
|
Annual
payments since 2021
|
biannual
|
|
|
Gav
- Yam
|
SERIES
H
|
sep-17
|
NIS
424
|
6/30/2034
|
2.55%
e.a.
|
Annual
payments since 2019
|
biannual
|
|
|
Cellcom
|
SERIES
L
|
jan-18
|
NIS
401
|
1/5/2028
|
2.5%
e.a.
|
Annual
payments since 2023
|
annual
|
|
|
Shufersal
|
SERIES
E
|
jan-18
|
NIS
544
|
10/8/2028
|
4.3%
e.a.
|
Annual
payments since 2018
|
annual
|
|
|
Shufersal
|
SERIES
E
|
jan-18
|
NIS
544
|
10/8/2028
|
4.3%
e.a.
|
Annual
payments since 2018
|
annual
|
(2
)
|
(1)
IDBD has the right
to make an early repayment, totally or partially. As a guarantee
for the full compliance of all the commitments IDBD has pledged
approximately 60.4 million shares of DIC under a single fixed
charge of first line and in guarantee of by means of the lien, in
an unlimited amount, in favor of the trustee for the holders of the
debentures.
(2)
Corresponds to an
expansion of the series.
F-85
Cresud Sociedad Anónima,
Comercial, Inmobiliaria, Financiera y Agropecuaria
CRESUD
: On February 16, 2018, the
Company issued its twelfth Series of Corporate Notes, for an amount
equivalent to its par value of US$ 113.16 million, in one class of
notes.
Corporate Notes
Class XXIII has a maturity of 60 months from issuance, which accrue
interest at annual fixed rate of 6.50% payable semiannually. The
principal is to be amortized in one installment due on February 16,
2023.
DIC
: On September 28, 2017, DIC offered
the holders of Series F NCN to swap their notes for Series J NCN.
Series J NCN terms and conditions differ substantially from those
of Series F. Therefore, DIC recorded the payment of Series F NCN
and recognized a new financial commitment at fair value for Series
J NCN. As a result of the swap, DIC recorded a loss resulting from
the difference between the Series F NCN cancellation value and the
new debt value in the amount of approximately NIS 461 (equal to
approximately Ps. 2,228 as of that date), which was accounted for
under “Finance costs” (Note 29).
IDBD
: On November 28, 2017, IDBD made an
early redemption of the Series L NCN for an amount of NIS 424
(equivalent to approximately Ps. 2,120 as of the transaction
date).
The
following table shows a detail of evolution of borrowing during the
years ended June 30, 2018 and 2017:
|
|
06.30.18
|
06.30.17
|
|
Balance at the beginning of the year
|
135,312
|
117,295
|
|
Borrowings
|
25,089
|
29,353
|
|
Payment
of borrowings
|
(22,912
)
|
(19,098
)
|
|
Obtention
/ (payment) of short term loans, net
|
732
|
(1,019
)
|
|
Interests
paid
|
(7,234
)
|
(5,522
)
|
|
Accrued
interests
|
8,639
|
6,437
|
|
Cumulative
translation adjustment and exchange differences, net
|
101,731
|
8,276
|
|
Deconsolidation
|
(21,310
)
|
-
|
|
Changes
in fair value of third-party loans
|
114
|
-
|
|
Repurchase
of non-convertible notes
|
(379
)
|
(546
)
|
|
Reclassifications
and other movements
|
(237
)
|
136
|
|
Balance at the end of the year
|
219,545
|
135,312
|
22.
Income
tax
Argentine tax reform
On
December 27, 2017, the Argentine Congress approved the Tax Reform,
through Law No. 27,430, which was enacted on December 29, 2017, and
has introduced many changes to the income tax treatment applicable
to financial income. The key components of the Tax Reform are as
follows:
Dividends: Tax on
dividends distributed by argentine companies would be as follows:
(i) dividends originated from profits obtained before fiscal year
ending June 30, 2018 will not be subject to withholding tax; (ii)
dividends derived from profits generated during fiscal years of the
Company ending June 30, 2019 and 2020 paid to argentine individuals
and/or foreign residents, will be subject to a 7% withholding tax;
and (iii) dividends originated from profits obtained during fiscal
year ending June 30, 2021 onward will be subject to withholding tax
at a rate of 13%.
Income
tax: Corporate income tax would be gradually reduced to 30% for
fiscal years commencing after January 1, 2018 through December 31,
2019, and to 25% for fiscal years beginning after January 1, 2020,
inclusive.
Presumptions of
dividends: Certain facts will be presumed to constitute dividend
payments, such as: i) withdrawals from shareholders, ii)
shareholders private use of property of the company, iii)
transactions with shareholders at values different from market
values, iv) personal expenses from shareholders or shareholder
remuneration without substance.
Revaluation of
assets: The regulation establishes that, at the option of the
companies, tax revaluation of assets is permitted for assets
located in Argentina and affected to the generation of taxable
profits. The special tax on the amount of the revaluation depends
on the asset, being (i) 8% for real estate not classified as
inventories, (ii) 15% for real estate classified as inventories,
(iii) 5% for shares, quotas and equity interests owned by
individuals and (iv) 10% for the rest of the assets. As of the date
of these Financial Statements, the Group has not exercised the
option. The gain generated by the revaluation is exempted according
to article 291 of Law 27,430 and, the additional tax generated by
the revaluation is not deductible.
In
addition, the argentine tax reform contemplates other amendments
regarding the following matters: social security contributions, tax
administrative procedures law, criminal tax law, tax on liquid
fuels, and excise taxes, among others. As of the date of
presentation of these Financial Statements, some aspects are
pending regulation by the National Executive Power.
F-86
Cresud Sociedad Anónima,
Comercial, Inmobiliaria, Financiera y Agropecuaria
US tax reform
In
December 2017, a bill was passed to reform the Federal Taxation Law
in the United States. The reform included a reduction of the
corporate tax rate from 35% to 21%, for the tax years 2018 and
thereafter. The reform has impact in certain subsidiaries of the
Group in the United States.
Israel tax reform
In
December 2016 the Israeli Government modified the income tax rate,
generating a reduction from 25% to 24% for the 2017 calendar year
and 23% for the 2018 calendar year onwards.
The
Group’s income tax has been calculated on the estimated
taxable profit for each year at the rates prevailing in the
respective tax jurisdictions. The subsidiaries of the Group in the
jurisdictions where the Group operates are required to calculate
their income taxes on a separate basis; thus, they are not
permitted to compensate subsidiaries’ losses against
subsidiaries income.
The
details of the provision for the Group’s income tax, is as
follows:
|
|
06.30.18
|
06.30.17
|
06.30.16
|
|
Current income
tax
|
(496
)
|
(793
)
|
(628
)
|
|
Deferred income
tax
|
357
|
(1,920
)
|
(5,173
)
|
|
MPIT
|
(94
)
|
-
|
16
|
|
Income
tax
|
(233
)
|
(2,713
)
|
(5,785
)
|
The
statutory taxes rates in the countries where the Group operates for
all of the years presented are:
|
Tax jurisdiction
|
Income tax rate
|
|
Argentina
|
25%
- 35%
|
|
Brazil
|
25%
- 34%
|
|
Uruguay
|
0%
- 25%
|
|
Bolivia
|
25%
|
|
U.S.
|
0%
- 45%
|
|
Bermudas
|
0%
|
|
Israel
|
23%
- 24%
|
Below
is a reconciliation between income tax expense and the tax
calculated applying the current tax rate, applicable in the
respective countries, to profit before taxes for years ended June
30, 2018, 2017 and 2016:
|
|
06.30.18
|
06.30.17
|
06.30.16
|
|
Tax calculated at the tax rates applicable to profits in the
respective countries
|
(2,491
)
|
(1,732
)
|
(5,851
)
|
|
Permanent differences:
|
|
|
|
|
Share
of profit / (loss) of associates and joint ventures
|
156
|
37
|
485
|
|
Unrecognized
tax loss carry-forwards (i)
|
(1,557
)
|
(1,253
)
|
(155
)
|
|
Expiration
of tax loss carry-forwards (iii)
|
(90
)
|
(31
)
|
-
|
|
Provision
for unrecoverability of tax loss carry-forwards
|
(842
)
|
-
|
-
|
|
MPIT
expense
|
(94
)
|
-
|
-
|
|
Changes
in fair value of financial instruments and sale of shares
(ii)
|
(346
)
|
434
|
-
|
|
Change
of tax rate (i)
|
4,947
|
396
|
(415
)
|
|
Non-taxable
profit
|
-
|
131
|
115
|
|
Non-deductible
expenses
|
(8
)
|
(670
)
|
(253
)
|
|
Others
|
92
|
(25
)
|
289
|
|
Income tax from continuing operations
|
(233
)
|
(2,713
)
|
(5,785
)
|
(i)
Corresponds mainly
to holding companies in the Operations Center in
Israel.
(ii)
As of June 30, 2018
corresponds to the effect of applying the changes in the tax rates
applicable in accordance with the tax reform explained above, being
Ps. 405 the effect of the rate change in US and Ps. 4,542 the
effect of the rate change in Argentina. As of June 30, 2017 and
2016, the rate change was in Israel.
(iii)
Corresponds mainly
to Cresud.
Deferred tax assets
and liabilities of the Group as of June 30, 2018 and 2017 will be
recovered as follows:
|
|
06.30.18
|
06.30.17
|
|
Deferred income tax
assets to be recovered after more than 12 months
|
7,373
|
7,249
|
|
Deferred income tax
assets to be recovered within 12 months
|
1,526
|
431
|
|
Deferred
income tax assets
|
8,899
|
7,680
|
|
|
|
|
|
|
06.30.18
|
06.30.17
|
|
Deferred income tax
liabilities to be recovered after more than 12 months
|
(33,463
)
|
(19,522
)
|
|
Deferred income tax
liabilities to be recovered within 12 months
|
(320
)
|
(9,652
)
|
|
Deferred
income tax liabilities
|
(33,783
)
|
(29,174
)
|
|
Total
deferred income tax (liabilities) assets, net
|
(24,884
)
|
(21,494
)
|
F-87
Cresud Sociedad Anónima,
Comercial, Inmobiliaria, Financiera y Agropecuaria
The
movement in the deferred income tax assets and liabilities during
the years ended June 30, 2018 and 2017, without taking into
consideration the offsetting of balances within the same tax
jurisdiction, is as follows:
|
|
At
the beginning
|
Business
combinations and reclassification to other assets held for sale
(i)
|
Foreign
exchange gain
|
Charged
to the Statement of Income (ii)
|
Reserve
for changes of non-controlling interest
|
Deconsolidation
(see Note 4 (l))
|
Use
of tax
loss
carry-forwards
|
At
the end
|
|
June
30, 2018
|
|
|
|
|
|
|
|
|
|
Assets
|
|
|
|
|
|
|
|
|
|
Trade and other
payables
|
2,031
|
-
|
534
|
(588
)
|
-
|
-
|
-
|
1,977
|
|
Tax loss
carry-forwards
|
4,380
|
1
|
887
|
604
|
(15
)
|
-
|
-
|
5,857
|
|
Others
|
1,269
|
-
|
599
|
(385
)
|
-
|
(418
)
|
-
|
1,065
|
|
Subtotal
assets
|
7,680
|
1
|
2,020
|
(369
)
|
(15
)
|
(418
)
|
-
|
8,899
|
|
Liabilities
|
|
|
|
|
|
|
|
|
|
Investment
properties and property, plant and equipment
|
(24,652
)
|
(14
)
|
(6,862
)
|
(232
)
|
-
|
2,445
|
(63
)
|
(29,378
)
|
|
Trading
properties
|
(99
)
|
-
|
(73
)
|
20
|
-
|
-
|
-
|
(152
)
|
|
Biological
assets
|
(150
)
|
-
|
7
|
(16
)
|
-
|
-
|
-
|
(159
)
|
|
Trade and other
receivables
|
(305
)
|
-
|
-
|
(81
)
|
-
|
-
|
-
|
(386
)
|
|
Investments
|
(9
)
|
-
|
(2
)
|
(26
)
|
-
|
-
|
-
|
(37
)
|
|
Intangible
assets
|
(2,682
)
|
-
|
125
|
430
|
-
|
781
|
-
|
(1,346
)
|
|
Inventories
|
(66
)
|
-
|
(35
)
|
11
|
-
|
-
|
-
|
(90
)
|
|
Others
|
(1,211
)
|
-
|
(1,354
)
|
330
|
-
|
-
|
-
|
(2,235
)
|
|
Subtotal
liabilities
|
(29,174
)
|
(14
)
|
(8,194
)
|
436
|
-
|
3,226
|
(63
)
|
(33,783
)
|
|
(Liabilities)
/ Assets, net
|
(21,494
)
|
(13
)
|
(6,174
)
|
67
|
(15
)
|
2,808
|
(63
)
|
(24,884
)
|
|
|
At the beginning
|
Business combinations and reclassification to other assets held for
sale (i)
|
Foreign exchange gain
|
Charged to the Statement of Income (ii)
|
Reclassification of opening amounts
|
Use of tax loss carry-forwards
|
At the end
|
|
June 30, 2017
|
|
|
|
|
|
|
|
|
Assets
|
|
|
|
|
|
|
|
|
Trade
and other payables
|
1,787
|
-
|
284
|
(40
)
|
-
|
-
|
2,031
|
|
Tax
loss carry-forwards
|
4,385
|
-
|
552
|
(386
)
|
-
|
(171
)
|
4,380
|
|
Others
|
1,245
|
(47
)
|
139
|
(68
)
|
-
|
-
|
1,269
|
|
Subtotal assets
|
7,417
|
(47
)
|
975
|
(494
)
|
-
|
(171
)
|
7,680
|
|
Liabilities
|
|
|
|
|
|
|
|
|
Investment
properties and property, plant and equipment
|
(21,060
)
|
-
|
(1,948
)
|
(1,703
)
|
59
|
-
|
(24,652
)
|
|
Trading
properties
|
(120
)
|
-
|
(24
)
|
45
|
-
|
-
|
(99
)
|
|
Biological
assets
|
(176
)
|
-
|
-
|
26
|
-
|
-
|
(150
)
|
|
Trade
and other receivables
|
(143
)
|
(7
)
|
-
|
(155
)
|
-
|
-
|
(305
)
|
|
Investments
|
(10
)
|
-
|
1
|
-
|
-
|
-
|
(9
)
|
|
Intangible
assets
|
(2,860
)
|
-
|
(312
)
|
490
|
-
|
-
|
(2,682
)
|
|
Inventories
|
(54
)
|
-
|
(10
)
|
(2
)
|
-
|
-
|
(66
)
|
|
Others
|
(949
)
|
36
|
(122
)
|
(176
)
|
-
|
-
|
(1,211
)
|
|
Subtotal liabilities
|
(25,372
)
|
29
|
(2,415
)
|
(1,475
)
|
59
|
-
|
(29,174
)
|
|
(Liabilities) / Assets, net
|
(17,955
)
|
(18
)
|
(1,440
)
|
(1,969
)
|
59
|
(171
)
|
(21,494
)
|
(i)
Includes Ps. 6 for business combination (Note 4) and Ps. 12 for
reclassification to assets held for sale (Note 34).
(ii)
Includes a rate change effect of Ps. 4,947 (profit).
Deferred income tax
assets are recognized for tax loss carry-forwards to the extent
that the realization of the related tax benefits through future
taxable profits is probable. Tax loss carry-forwards may have
expiration dates or may be permanently available for use by the
Group depending on the tax jurisdiction where the tax loss carry
forward is generated. Tax loss carry forwards in Argentina and
Uruguay generally expire within 5 years, while in Israel they do
not expire. Tax loss carry forward in Bolivia expire within 3
years. Tax loss carry forwards in Brazil do not expire. However, in
Brazil, the taxable profit for each year can only be reduced by tax
losses up to a maximum of 30%
As of
June 30, 2018, the Group's recognized tax loss carry forward
prescribed as follows:
|
Jurisdiction
|
06.30.18
|
Date of generation
|
Due date
|
|
Argentina
|
49
|
2014
|
2019
|
|
Argentina
|
77
|
2015
|
2020
|
|
Argentina
|
98
|
2016
|
2021
|
|
Argentina
|
141
|
2017
|
2022
|
|
Argentina
|
7,460
|
2018
|
2023
|
|
Bolivia
|
127
|
2017
|
2022
|
|
Bolivia
|
13
|
2017
|
2020
|
|
Bolivia
|
47
|
2018
|
2021
|
|
Brazil
|
973
|
2008-2018
|
Do not
expire
|
|
Do
not prescribe
|
1,404
|
|
|
|
Total cumulative tax loss carry-forwards
|
10,389
|
|
|
F-88
Cresud Sociedad Anónima,
Comercial, Inmobiliaria, Financiera y Agropecuaria
The
Group assesses the realizability of deferred income tax assets, by
considering whether it is probable that some portion or all of the
deferred income tax assets will not be realized. In order to make
this assessment, Management considers the scheduled reversal of
deferred income tax liabilities, projected business and tax
planning strategies.
Deferred tax assets
from the Cresud, Company's management strategy for the
recoverability of the recorded tax loss carryforward involves the
purchase and / or development of fields in marginal or
high-potential areas of appreciation and the periodic realization
of those properties that are estimated to have reached their
maximum appreciation potential. Additionally, a corporate
reorganization is estimated where Cresud contributes the total of
the remaining fields to a controlled company in the fiscal year
2023 through a taxable transaction. As of June 30, 2018, the
estimated year of that transaction coincides with the statute of
limitation of the tax loss carryforward Ps. (1,113).
On this
basis, it is estimated that as of June 30, 2018, all deferred tax
assets and tax credits will be realized.
The
Group did not recognize deferred income tax assets (tax loss carry
forwards) of Ps. 133,388 and Ps. 131,849 as of June 30, 2018 and
2017, respectively. Although management estimates that the business
will generate sufficient income, pursuant to IAS 12, management has
determined that, as a result of the recent loss history and the
lack of verifiable and objective evidence due to the
subsidiary’s results of operations history, there is
sufficient uncertainty as to the generation of sufficient income to
be able to offset losses within a reasonable timeframe, therefore,
no deferred tax asset is recognized in relation to these
losses.
The
Group did not recognize deferred income tax liabilities of Ps.
1,722 and Ps. 1,792 as of June 30, 2018 and 2017, respectively,
related to their investments in foreign subsidiaries, associates
and joint ventures. In addition, the withholdings and/or similar
taxes paid at source may be creditable against the Group’s
potential final tax liability.
On June
30, 2018 and 2017, the Group recognized a deferred liability in the
amount of Ps. 623 and Ps. 857, respectively, related to the
potential future sale of one of its subsidiaries
shares
IDBD
and DIC assess whether it is necessary to recognize deferred tax
liabilities for the temporary differences arising in relation to
its investments in subsidiaries; in this respect, IDBD, DIC and PBC
estimate that if each of them is required to dispose of its
respective holdings in subsidiaries, they would not be liable to
income tax on the sale and, for such reason, they did not recognize
the deferred tax liabilities related to this difference in these
Consolidated Financial Statements.
The
Group has assessed that the sale of Ispro is probable in the near
future, so the corresponding deferred liability has been recognized
in these Consolidated Financial statements. This investment does
not comply with the requirements of IFRS 5 for classification as
held for sale.
23.
Leases
The
Group as lessee
Operating leases
In the
ordinary course of business, the Group enters into several
operating lease agreements. Group conducts a portion of its
agricultural activities on land rented from third parties under
operating lease contracts averaging a harvest year. Rent expense
for the years ended as of June 30, 2018, 2017 and 2016 amounted to
Ps. 199.7, Ps. 126.5 and Ps. 79.7, respectively and is included in
the line item "Costs" in the Statement of Income
The
Group is also using land in the Province of Salta under rights of
use agreement (the "Anta Agreement") for which the Group is
currently paying a rent fee of 10% of the production. Rent expense
paid for the years ended as of June 30, 2018, 2017 and 2016
amounted to Ps. 41.1, Ps. 9.8 and Ps. 4.5, respectively and is
included in the line item "Costs" in the Statement of
Income.
The
Group leases property or spaces for administrative or commercial
use both in Argentina and in Israel, under operating leases. The
agreements entered into include several clauses, including but not
limited, to fixed, variable or adjustable payments. Some leases
were agreed upon with related parties (Note 31). The amounts
involved are not material for any of the periods
filed.
F-89
Cresud Sociedad Anónima,
Comercial, Inmobiliaria, Financiera y Agropecuaria
The
future aggregate minimum lease payments the Group will have to
cancel under non-cancellable operating leases were as
follows:
|
|
06.30.18
|
06.30.17
|
06.30.16
|
|
No later than 1
year
|
2,586
|
3,025
|
3,907
|
|
Later than 1 year
and not later than 5 years
|
5,000
|
8,309
|
6,859
|
|
More than 5
years
|
1,205
|
2,472
|
2,254
|
|
|
8,791
|
13,806
|
13,020
|
Finance leases
The
Group is party to several financial lease agreements, mainly of
equipment for administrative use in the ordinary course of
business. The amounts involved do not prove material to any of the
fiscal years under review.
The
Group as lessor
Operating leases (Shopping malls, offices and other
buildings)
In the
segments Shopping malls and Offices and Others in the Operations
Center in Argentina and in the segment Real Estate of the
Operations Center in Israel, the Group enters into operating lease
agreements typical in the business. Given the diversity of
properties and lessees, and the various economic and regulatory
jurisdictions where the Group operates, the agreements may adopt
different forms, such as fixed, variable, adjustable leases, etc.
For example, in the Operations Center in Argentina, operating lease
agreements with lessees of Shopping malls generally include
escalation clauses and contingent payments. In Israel, agreements
tend to be agreed upon for fixed amounts, although in some cases
they may include adjustment clauses. Income from leases are
recorded in the Statement of Income under rental and service income
in all of the filed periods.
Rental
properties are considered to be investment property. Book value is
included in Note 9. The future minimum proceeds generated from
non-cancellable operating leases from Group’s Shopping malls,
offices and other buildings are as follows:
|
|
06.30.18
|
06.30.17
|
06.30.16
|
|
No later than 1
year
|
5,097
|
4,437
|
3,137
|
|
Later than 1 year
and not later than 5 years
|
22,945
|
12,451
|
13,361
|
|
More than 5
years
|
8,377
|
4,632
|
4,247
|
|
|
36,419
|
21,520
|
20,745
|
Operating leases (Farmlands)
From
time to time, the Group leases certain farmlands. The leases have
an average term of one crop year. Rental income is generally based
on the market price of a particular crop multiplied by a fixed
amount of tons per hectare leased or based on a fixed amount in
dollars per hectare leased.
The
future aggregate minimum lease proceeds under non-cancellable
operating leases from the Group are as follows:
|
|
06.30.18
|
06.30.17
|
06.30.16
|
|
No later than 1
year
|
27
|
6
|
14
|
|
Later than 1 year
and not later than 5 years
|
72
|
-
|
-
|
|
More than 5
years
|
8
|
-
|
-
|
|
|
107
|
6
|
14
|
Finance leases:
The
Group does not act as a lessor in connection with finance
leases.
F-90
Cresud Sociedad Anónima,
Comercial, Inmobiliaria, Financiera y Agropecuaria
24.
Revenues
|
|
06.30.18
|
06.30.17
|
06.30.16
|
|
Beef
|
1,897
|
1,324
|
966
|
|
Crops
|
2,148
|
1,244
|
1,015
|
|
Sugarcane
|
757
|
355
|
294
|
|
Cattle
|
282
|
123
|
80
|
|
Supplies
|
166
|
112
|
63
|
|
Dairy
|
91
|
97
|
65
|
|
Consignment
|
98
|
250
|
116
|
|
Advertising and
brokerage fees
|
153
|
98
|
66
|
|
Agricultural rental
and other
services
|
306
|
139
|
45
|
|
Income
from agricultural sales and services
|
5,898
|
3,742
|
2,710
|
|
Trading properties
and developments
|
1,818
|
1,454
|
191
|
|
Communication
services
|
14,392
|
11,959
|
4,956
|
|
Sale of
communication equipment
|
4,955
|
4,006
|
1,844
|
|
Rental and
services
|
10,671
|
8,536
|
5,197
|
|
Hotel operations,
tourism services and others
|
1,252
|
1,049
|
724
|
|
Total
revenues
|
38,986
|
30,746
|
15,622
|
25.
Costs
|
|
06.30.18
|
06.30.17
|
06.30.16
|
|
Other operative
costs
|
12
|
10
|
9
|
|
Cost
of property operations
|
12
|
10
|
9
|
|
Beef
|
1,759
|
1,234
|
837
|
|
Crops
|
1,765
|
1,167
|
889
|
|
Sugarcane
|
754
|
352
|
263
|
|
Cattle
|
297
|
155
|
126
|
|
Supplies
|
148
|
105
|
58
|
|
Dairy
|
65
|
87
|
61
|
|
Consignment
|
25
|
11
|
6
|
|
Advertising and
brokerage fees
|
136
|
100
|
67
|
|
Agricultural rental
and other
services
|
188
|
78
|
28
|
|
Costs
of agricultural sales and services
|
5,137
|
3,289
|
2,335
|
|
Trading properties
and developments
|
1,748
|
1,451
|
166
|
|
Communication
services
|
10,540
|
8,471
|
3,304
|
|
Sale of
communication equipment
|
3,359
|
2,716
|
1,304
|
|
Rental and
services
|
3,046
|
2,744
|
1,843
|
|
Hotel operations,
tourism services and others
|
938
|
649
|
419
|
|
Total
costs
|
24,780
|
19,330
|
9,380
|
26.
Expenses
by nature
The
Group disclosed expenses in the statements of income by function as
part of the line items “Costs”, “General and
administrative expenses” and “Selling expenses”.
The following tables provide additional disclosure regarding
expenses by nature and their relationship to the function within
the Group as of June 30, 2018, 2017 and 2016.
|
|
Production
costs
|
Costs
(i)
|
General
and administrative expenses
|
Selling
expenses
|
Total
as of 06.30.18
|
|
Leases, services
charges and vacant property costs
|
2
|
59
|
18
|
136
|
215
|
|
Depreciation and
amortization
|
172
|
2,266
|
584
|
914
|
3,936
|
|
Doubtful
accounts
|
-
|
2
|
-
|
271
|
273
|
|
Advertising,
publicity and other selling expenses
|
-
|
270
|
6
|
1,307
|
1,583
|
|
Taxes, rates and
contributions
|
21
|
336
|
96
|
312
|
765
|
|
Maintenance and
repairs
|
47
|
1,733
|
173
|
99
|
2,052
|
|
Fees and payments
for services
|
6
|
2,121
|
924
|
76
|
3,127
|
|
Director's
fees
|
-
|
-
|
302
|
-
|
302
|
|
Food, beverage and
other lodging expenses
|
-
|
86
|
-
|
-
|
86
|
|
Payroll and social
security liabilities
|
241
|
2,754
|
1,934
|
1,525
|
6,454
|
|
Cost of sale of
goods and services
|
-
|
5,133
|
-
|
-
|
5,133
|
|
Cost of sale of
agricultural products and biological assets
|
(14
)
|
2,552
|
-
|
-
|
2,538
|
|
Supplies and
labors
|
1,809
|
1,884
|
1
|
11
|
3,705
|
|
Freights
|
21
|
1
|
-
|
330
|
352
|
|
Bank commissions
and expenses
|
-
|
38
|
12
|
9
|
59
|
|
Conditioning and
clearance
|
-
|
-
|
-
|
59
|
59
|
|
Travel, library
expenses and stationery
|
15
|
3
|
8
|
3
|
29
|
|
Interconnection and
roaming expenses
|
-
|
2,066
|
-
|
-
|
2,066
|
|
Fees to other
operators
|
-
|
2,576
|
-
|
-
|
2,576
|
|
Others
|
352
|
900
|
356
|
254
|
1,862
|
|
Total
expenses by nature as of 06.30.18
|
2,672
|
24,780
|
4,414
|
5,306
|
37,172
|
F-91
Cresud Sociedad Anónima,
Comercial, Inmobiliaria, Financiera y Agropecuaria
|
|
Production costs
|
Costs (i)
|
General and administrative expenses
|
Selling expenses
|
Total as of 06.30.17
|
|
Leases,
services charges and vacant property costs
|
2
|
142
|
27
|
8
|
179
|
|
Depreciation
and amortization
|
55
|
1,882
|
526
|
1,055
|
3,518
|
|
Doubtful
accounts
|
-
|
-
|
-
|
209
|
209
|
|
Advertising,
publicity and other selling expenses
|
-
|
284
|
-
|
1,085
|
1,369
|
|
Taxes,
rates and contributions
|
17
|
238
|
30
|
260
|
545
|
|
Maintenance
and repairs
|
36
|
1,471
|
107
|
5
|
1,619
|
|
Fees
and payments for services
|
8
|
3,642
|
714
|
50
|
4,414
|
|
Director's
fees
|
-
|
-
|
234
|
-
|
234
|
|
Food,
beverage and other lodging expenses
|
-
|
88
|
4
|
-
|
92
|
|
Payroll and social security
liabilities
|
122
|
2,229
|
1,491
|
1,177
|
5,019
|
|
Cost
of sale of goods and services
|
-
|
4,181
|
-
|
-
|
4,181
|
|
Cost
of sale of agricultural products and biological assets
|
-
|
1,301
|
-
|
-
|
1,301
|
|
Supplies
and labors
|
1,716
|
1,313
|
-
|
7
|
3,036
|
|
Freights
|
22
|
1
|
-
|
249
|
272
|
|
Bank
commissions and expenses
|
1
|
14
|
9
|
5
|
29
|
|
Conditioning
and clearance
|
-
|
-
|
-
|
48
|
48
|
|
Travel, library expenses and
stationery
|
16
|
20
|
9
|
1
|
46
|
|
Interconnection
and roaming expenses
|
-
|
-
|
-
|
-
|
-
|
|
Fees
to other operators
|
-
|
-
|
-
|
-
|
-
|
|
Others
|
-
|
2,524
|
477
|
344
|
3,345
|
|
Total expenses by nature as of 06.30.17
|
1,995
|
19,330
|
3,628
|
4,503
|
29,456
|
|
|
Production costs
|
Costs (i)
|
General and administrative expenses
|
Selling expenses
|
Total as of 06.30.16
|
|
Leases,
services charges and vacant property costs
|
1
|
54
|
9
|
1
|
65
|
|
Depreciation
and amortization
|
67
|
745
|
261
|
539
|
1,612
|
|
Doubtful
accounts
|
-
|
-
|
62
|
10
|
72
|
|
Advertising,
publicity and other selling expenses
|
-
|
282
|
-
|
489
|
771
|
|
Taxes,
rates and contributions
|
13
|
226
|
20
|
225
|
484
|
|
Maintenance
and repairs
|
24
|
681
|
76
|
4
|
785
|
|
Fees
and payments for services
|
5
|
880
|
437
|
39
|
1,361
|
|
Director's
fees
|
-
|
-
|
201
|
-
|
201
|
|
Food,
beverage and other lodging expenses
|
-
|
-
|
-
|
-
|
-
|
|
Payroll and social security
liabilities
|
90
|
1,586
|
718
|
516
|
2,910
|
|
Cost
of sale of goods and services
|
-
|
1,558
|
-
|
-
|
1,558
|
|
Cost
of sale of agricultural products and biological assets
|
-
|
1,674
|
-
|
2
|
1,676
|
|
Supplies
and labors
|
1,011
|
54
|
-
|
1
|
1,066
|
|
Freights
|
13
|
1
|
-
|
145
|
159
|
|
Bank
commissions and expenses
|
-
|
10
|
7
|
4
|
21
|
|
Conditioning
and clearance
|
-
|
-
|
-
|
30
|
30
|
|
Travel, library expenses and
stationery
|
12
|
4
|
6
|
1
|
23
|
|
Interconnection
and roaming expenses
|
-
|
-
|
-
|
-
|
-
|
|
Fees
to other operators
|
-
|
-
|
-
|
-
|
-
|
|
Others
|
-
|
1,625
|
153
|
167
|
1,945
|
|
Total expenses by nature as of 06.30.16
|
1,236
|
9,380
|
1,950
|
2,173
|
14,739
|
(i) Includes
Ps. 12, Ps. 10 and Ps. 9 of other agricultural operating costs as
of June 30 2018, 2017 and 2016, respectively.
27.
Other
operating results, net
|
|
06.30.18
|
06.30.17
|
06.30.16
|
|
Gain / (Loss) from
commodity derivative
financial
instruments
|
28
|
93
|
(87
)
|
|
Gain from disposal
of associates (i)
|
311
|
1
|
4
|
|
Fair value of
interest held before business combination (iv)
|
510
|
8
|
-
|
|
Currency
translation adjustment reversal (ii)
|
-
|
41
|
100
|
|
Gain / (Loss)
from agreement with
TGLT
|
32
|
(27
)
|
-
|
|
Contingencies
(iii)
|
399
|
(25
)
|
20
|
|
Donations
|
(67
)
|
(123
)
|
(58
)
|
|
Others
|
(61
)
|
(96
)
|
(89
)
|
|
Total
other operating results, net
|
1,152
|
(128
)
|
(110
)
|
(i) Includes the
gain from of the sale of the Group’s equity interest in
Cloudyn for Ps. 252.
As of June 30,
2017, it pertains to the reversal of the cumulative translation
adjustment generated by IMadison, a subsidiary liquidated during
that fiscal year. As of June 30, 2016, Ps. 143 correspond to the
reversal of the cumulative translation adjustment before the
business combination with IDBD and Ps. 9 to the reversal of the
reserve of the cumulative translation adjustment generated in Rigby
following the dissolution of the Company.
(ii) As of June 30,
2018, includes the favorable ruling of a trial in the Operations
Center in Israel for an amount of approximately Ps. 435. Includes
legal costs and expenses Includes legal costs and expenses related
to the investment in Ma’ariv.
(iii) See Note
4.(b).
F-92
Cresud Sociedad Anónima,
Comercial, Inmobiliaria, Financiera y Agropecuaria
28.
Financial
results, net
|
|
06.30.18
|
06.30.17
|
06.30.16
|
|
Financial
income
|
|
|
|
|
Interest
income
|
814
|
755
|
657
|
|
Foreign exchange
gains
|
1,102
|
232
|
721
|
|
Dividends
income
|
82
|
68
|
72
|
|
Other financial
income
|
-
|
-
|
-
|
|
Total
financial income
|
1,998
|
1,055
|
1,450
|
|
Financial
costs
|
|
|
|
|
Interest
expenses
|
(8,259
)
|
(6,351
)
|
(2,688
)
|
|
Loss on debt swap
(Note
21)
|
(2,228
)
|
-
|
-
|
|
Foreign exchange
losses
|
(15,365
)
|
(1,780
)
|
(3,986
)
|
|
Other financial
costs
|
(431
)
|
(808
)
|
(677
)
|
|
Less: capitalized
financial costs
|
74
|
3
|
-
|
|
Total
financial costs
|
(26,209
)
|
(8,936
)
|
(7,351
)
|
|
Other
financial results:
|
|
|
|
|
Fair value gains of
financial assets and liabilities at fair value through profit or
loss
|
623
|
3,026
|
(1,247
)
|
|
Loss from
repurchase of Non-convertible notes
|
-
|
(31
)
|
(39
)
|
|
(Loss) / Gain from
derivative financial instruments (
except commodities)
|
(324
)
|
146
|
1,108
|
|
Gain on the
revaluation of receivables arising from the sale of
farmland
|
85
|
37
|
33
|
|
Total
other financial results
|
384
|
3,178
|
(145
)
|
|
Total
financial results, net
|
(23,827
)
|
(4,703
)
|
(6,046
)
|
29.
Earnings
per share
(a)
Basic
Basic
earnings per share amounts are calculated in accordance with IAS
33, by dividing the profit attributable to equity holders of the
Group by the weighted average number of ordinary shares outstanding
during the year, excluding ordinary shares purchased by the Group
and held as treasury shares.
|
|
06.30.18
|
06.30.17
|
06.30.16
|
|
Profit for the year
from continuing operations attributable to equity
holders of the parent
|
(772
)
|
1,050
|
4,951
|
|
Profit for the year
from discontinued operations attributable to equity
holders of the parent
|
6,164
|
461
|
216
|
|
Profit for the year
attributable to equity holders
of the
parent
|
5,392
|
1,511
|
5,167
|
|
Weighted average
number of ordinary shares outstanding
|
497
|
498
|
495
|
|
Basic
earnings per share
|
10.86
|
3.04
|
10.44
|
(b)
Diluted
Diluted
earnings per share amounts are calculated by adjusting the weighted
average number of ordinary shares outstanding to assume conversion
of all dilutive potential shares. As of June 30, 2018, 2017 and
2016 the Group holds treasury shares associated with incentive
plans with potentially dilutive effect, therefore, diluted earnings
per share is as follows:
|
|
06.30.18
|
06.30.17
|
06.30.16
|
|
Profit for the year
from continuing operations attributable to equity
holders of the parent
|
(772
)
|
1,050
|
4,951
|
|
Profit for the year
from discontinued operations attributable to equity
holders of the parent
|
6,164
|
461
|
216
|
|
Profit for the year
per share attributable to
equity
holders of the parent
|
5,392
|
1,511
|
5,167
|
|
Weighted average
number of ordinary shares outstanding
|
516
|
500
|
502
|
|
Diluted
earnings per share
|
10.44
|
3.02
|
10.30
|
30.
Employee
benefits and share-based payments
Incentive Plan
The
Group has an equity incentive plan, created in September 30, 2011,
which aims at certain selected employees, directors and top
management of the Company, IRSA and IRSA CP (the
“Participants”). Participation in the plan is voluntary
and employees are invited to participate by the Board.
F-93
Cresud Sociedad Anónima,
Comercial, Inmobiliaria, Financiera y Agropecuaria
Under
the Incentive Plan, entitle the Participants to receive shares
("Contributions") of the Company and IRSA, based on a percentage of
their annual bonus for the years 2011, 2012 and 2013, providing
they remain as employees of the Company for at least five years,
among other conditions, required to qualify such Contributions
(except in case of disability or death, where there is no time
limit). Contributions shall be held by the Company and IRSA, and as
the conditions established by the Plan are verified, such
contributions shall be transferred to the Participants only when
the employees retire from the Company. In spite of this, the
economic rights of the shares in the portfolio assigned to said
participants will be received by them.
As of
June 30, 2018, 2017 and 2016, a reserve has been set up under
Shareholders’ equity as a result of this Incentive Plan for
Ps. 114, Ps. 113 and Ps. 102, respectively, based on the market
value of the shares to be granted pertaining to the Group’s
contributions, proportionately to the period already elapsed for
the vesting of shares in the Incentive Plan and adjusted for the
probability that any beneficiary leaves the Group before the term
and/or the conditions required to qualify for the benefits of said
plan are met at each fiscal year-end.
For the
fiscal years ended June 30, 2018, 2017 and 2016, the Group has
incurred a charge related to the Incentive Plan of Ps. 11.5, Ps.
18.4 and Ps. 25.1, respectively. As of June 30, 2018, total cost
was recorded considering that the vesting period has elapsed. The
total cost not recognized as of June 30, 2017 and 2016 was Ps. 8.1
and Ps. 27.3, respectively.
During
the fiscal years ended June 30, 2018, 2017 and 2016, the Group
granted 0.34, 0.4 and 1 million shares, respectively, corresponding
to the Participants’ Contributions.
Movements in the
number of matching shares outstanding under the incentive plan
corresponding to the Company´s contributions are as
follows
|
|
06.30.18
|
06.30.17
|
06.30.16
|
|
At the beginning
|
5,834,676
|
6,324,737
|
7,613,638
|
|
Granted
|
(349,482
)
|
(443,839
)
|
(1,028,766
)
|
|
Disposals
|
-
|
(46,222
)
|
(260,135
)
|
|
At the end
|
5,485,194
|
5,834,676
|
6,324,737
|
The
fair value determined at the time of granting the plan after
obtaining all the corresponding authorizations was Ps. 23.5 per
share of IRSA and Ps. 16.45 per share of Cresud. This fair value
was estimated by taking into account the market price of the shares
of the Company on said date.
Defined contribution plan
The
Group operates a defined contribution plan (the “Plan”)
which covers certain selected managers from Argentina. The Plan was
effective as from January 1, 2006. Participants can make pre-tax
contributions to the Plan of up to 2.5% of their monthly salary
(“Base Contributions”) and up to 15% of their annual
bonus (“Extraordinary Contributions”). Under the Plan,
the Group matches employee contributions to the plan at a rate of
200% for Base Contributions and 300% for Extraordinary
Contributions.
All
contributions are invested in funds administered outside of the
Group. Participants or their assignees, as the case may be, will
have access to the 100% of the Company contributions under the
following circumstances:
(i) ordinary
retirement in accordance with applicable labor
regulations;
(ii) total or
permanent incapacity or disability;
(iii) death.
In case
of resignation or termination without fair cause, the manager will
receive the Group’s contribution only if he or she has
participated in the Plan for at least 5 years.
Contributions made
by the Group under the Plan amount to Ps. 32 and Ps. 21 for the
fiscal years ended June 30, 2018 and 2017,
respectively.
F-94
Cresud Sociedad Anónima,
Comercial, Inmobiliaria, Financiera y Agropecuaria
Share base plans associated with certain key members of the
management - Israel
DIC and
Cellcom have granted an options benefit plans to key management
personnel. For the years ended June 30, 2018, 2017 and 2016, the
Group has incurred an expense in relation to said benefit plans of
Ps. 40.6, Ps. 15.9 and Ps. 21.3, respectively.
The
following table shows the detail of the options pending at
year-end:
|
|
DIC
|
Cellcom
|
|
Exercise price
range of outstanding options
|
NIS
2.92-8
|
NIS
25.65-51.48
|
|
Average price of
outstanding options
|
NIS
6.46
|
NIS
28.3
|
|
Amount of
outstanding options
|
4,745,090
|
918,665
|
|
Average remaining
useful life
|
4.75
years
|
1.61
years
|
The
fair value of the options was calculated according to the
Black-Scholes method, which included assumptions such as the value
of the share at the date of granting the plan, expected volatility,
expected life of the option or the risk-free rate.
Employee benefits - Israel
Benefits to hired
employees include post-employment benefits, retirement benefits,
share-based plans and other short and long-term benefits. The
Group’s liabilities in relation to severance pay and/or
retirement benefits of Israeli employees are calculated in
accordance with Israeli laws.
|
|
June 30, 2018
|
June 30, 2017
|
June 30, 2016
|
|
Present
value of unfunded obligations
|
316
|
673
|
572
|
|
Present
value of funded obligations
|
371
|
1,789
|
1,070
|
|
Total present value of defined benefits obligations
(post-employment)
|
687
|
2,462
|
1,642
|
|
Fair
value of plan assets
|
(592
)
|
(1,703
)
|
(1,101
)
|
|
Recognized liability for defined benefits obligations
|
95
|
759
|
541
|
|
Liability
for other long-term benefits
|
15
|
4
|
148
|
|
Total recognized liabilities
|
110
|
763
|
689
|
|
Assets
designed for payment of employee benefits
|
-
|
-
|
(4
)
|
|
Net position from employee benefits
|
110
|
763
|
685
|
Stock option plan – Brasilagro
On
August 11, 2010, the Board of Directors approved the creation of
the Stock Option Program, authorizing the Company’s Board to
grant stock options to the beneficiaries then elected. The Plan
established the beneficiaries, the number of shares that each one
may acquire upon exercise of the options, the exercise price per
share to be paid in cash by the beneficiaries and the conditions of
options.
The
stock options to be granted according to the Plan may grant rights
on the number of shares no greater, at any time, than the maximum
and cumulative amount of 2% of Company shares, respecting the
minimum price of the average quote of Brasilagro shares on the
São Paulo Stock Exchange (BOVESPA), weighted by the volume of
trading on the last thirty floors prior to the option
grant.
The
following table shows the changes in the stock option
plan:
|
|
Second
tranche
|
Third
tranche
|
Total
|
|
Valid
as of July 1, 2017
|
109,054
|
109,054
|
109,054
|
|
Exercised
|
(109,054
)
|
(109,054
)
|
(109,054
)
|
|
Exercises
as of June 30, 2018
|
-
|
-
|
-
|
On
September 27, 2017, the Company received notice of the exercise of
all the stock options under the Second and Third Program, totaling
109,054 stock options at the exercise price of Ps. 42.28 per share,
and 109,054 purchase options at the exercise price of Ps. 43.67 per
shares, corresponding to the total amount of Ps.
9,373.
F-95
Cresud Sociedad Anónima,
Comercial, Inmobiliaria, Financiera y Agropecuaria
Consequent to the
notice of exercise of stock options by the beneficiary, the Company
transferred to the beneficiary the number of shares equivalent to
the number of options informed, as applicable, and the shares to be
transferred by the Company are currently held in treasury. The
beneficiary, in turn, paid the exercise price in cash after the
transfer of shares.
Employee long-term incentive - Brasilagro
On
October 2, 2017, the Shareholders approved the creation of the Long
Term Incentive Plan based on Shares (or "ILPA Plan"). By the terms
of the ILPA Plan, participants will be entitled to receive a number
of shares if they remain in the Company during certain period of
time and comply with certain key performance indicators ("KPIs").
The terms of the ILPA Plan determine that the Board of Directors
will have broad powers to implement the ILPA Plan and take all
necessary measures for its implementation.
The
shares to be granted under the ILPA Plan may not exceed at any time
the maximum and cumulative amount of 2% of the shares issued by the
Company.
The
first award of incentives was approved by the Board of Directors on
June 18, 2018, the date on which the First ILPA Program was
approved and the beneficiaries, the number of shares to be
delivered, the vesting period and the KPIs to be reached were
defined.
The
vesting period for the first ILPA Program is between October 2,
2017 and October 2, 2019 and the participants were selected among
those who acted as company’s employees at the beginning of
the vesting period considering their position in the company and
its related remuneration as of that date.
Certain
KPIs must be achieved for shares to be delivered to participants,
in addition to remain in the Company until the end of the vesting
period. One of the KPIs is to reach a certain percentage of
valuation in the price of AGRO3 shares during the vesting period:
If this percentage is not reached, the participants will not be
entitled to receive any share. In the event that the KPI for the
valuation of the shares is fulfilled, the number of shares to be
delivered will vary in 3 ranges depending on the level of
achievement of another 3 KPI, in addition to being adjusted by the
dividends per share distributed during the vesting period, as well
as an increase in a fixed amount if the value of the share is above
the floor value.
The
fair value of the benefit was estimated at Ps. 65.87. In the
initial measurement of the fair value of the benefit, the price of
the AGRO3 per share was considered on the date of granting and the
probable quotation of the share price is projected at the end of
the vesting period based on the past performance of the price per
share in a period of 1 year and 4 months (compatible with the
period between the granting in June 2018 and the end of the vesting
period in October 2018). Considering the volatility of the AGRO3
share, the probability of the price per share at the end of the
vesting period was determined to reach the value necessary to
comply with the KPI.
The
maximum number of shares to be issued is 447,127 (granted on June
18, 2018 and available on June 30, 2018). During the period, there
were no cancellations or shares issued to the beneficiaries and the
amount of shares will be adjusted by the dividends per share
distributed during the vesting period.
To
determine the number of shares and the amount of the remuneration
expense, the Company determines for each year the estimated amount
of shares to be delivered based on its best estimate of the amount
of each of the 3 KPIs which do not depend on the price of the
shares and the dividends to be paid in the same vesting period. The
amount of the expense is adjusted based on said estimate and the
effects recognized prospectively. The estimated expense is
recognized as of the granting in June 2018 ratably during the
vesting period between October 2, 2017 and October 2, 2019. For the
year ended June 30, 2018 an amount of Ps. 6,203 was recorded as an
expense.
F-96
Cresud Sociedad Anónima,
Comercial, Inmobiliaria, Financiera y Agropecuaria
31.
Related
party transactions
In the
normal course of business, the Group conducts transactions with
different entities or parties related to it.
As
mentioned in Note 4, on October 11, 2015, the Group took over IDBD.
Before takeover, the Group had entered into certain transactions
with IDBD as associate, mainly related to the subscription of
warrants and/or capital contributions, but had not conducted
commercial transactions. See Note 4 for further information related
to investment in IDBD.
Remunerations
of the Board of Directors
The Act
N° 19,550 provides that the remuneration of the Board of
Directors, where it is not set forth in the Company’s
by-laws, shall be fixed by the Shareholders' Meetings. The maximum
amount of remuneration that the members of the Board are allowed to
receive, including salary and other performance-based remuneration
of permanent technical-administrative functions, may not exceed 25%
of the profits.
Such
maximum amount will be limited to 5% where no dividends are
distributed to the Shareholders, and will be increased
proportionately to the distribution, until reaching such cap where
the total of profits is distributed.
Some of
the Group's Directors are hired under the Employment Contract Act
N° 20,744. This Act rules on certain conditions of the work
relationship, including remuneration, salary protection, working
hours, vacations, paid leaves, minimum age requirements, workmen
protection and forms of suspension and contract termination. The
remuneration of directors for each fiscal year is based on the
provisions established by the Act N° 19,550, taking into
consideration whether such directors perform
technical-administrative functions and depending upon the results
recorded by the Company during the fiscal year. Once such amounts
are determined, they should be approved by the Shareholders’
Meeting.
Senior
Management remuneration
The
members of the Senior or Top Management are appointed and removed
by the Board of Directors, and perform functions in accordance with
the instructions delivered by the Board itself.
The
Society’s Senior Management is composed of as
follows:
|
Name
|
Date
of birth
|
Position
|
Actual
position since
|
|
Alejandro G.
Elsztain
|
03/31/1966
|
General
Manager
|
1994
|
|
Carlos
Blousson
|
09/21/1963
|
General
Manager of Operations in Argentina and Bolivia
|
2008
|
|
Matías I.
Gaivironsky
|
02/23/1976
|
Administrative and
Financial Manager
|
2011
|
|
Alejandro
Casaretto
|
10/15/1952
|
Regional
Agricultural Manager
|
2008
|
The
remuneration earned by Senior Management for their functions
consists of an amount that is fixed taking into account the
manager's backgrounds, capacity and experience, plus an annual
bonus based on their individual performance and the Group's
results. Members of the senior management participate in defined
contributions and share-based incentive plans that are described in
Note 30, respectively.
Corporate
Service Agreement with IRSA and IRSA CP
Given
that the operating areas of our Company, IRSA and IRSA CP share
certain characteristics of affinity, the Board considered it was
convenient to implement alternatives that allows to reduce certain
fixed costs, with the aim of reducing their incidence on the
operating results, building on and enhancing the individual
efficiencies of each of the companies in the different areas that
form part of operational management.
For
this purpose, on June 30, 2004, a Framework Agreement for the
Exchange of Corporate Services ("Framework Agreement") was signed
by IRSA, Cresud and IRSA CP, which was modified afterwards on the
following dates: August 23, 2007; August 14, 2008; November 27,
2009; March 12, 201; July 11, 2011; October 15, 2012; November 12,
2013; February 24, 2014; February 18, 2015; November 12, 2015; May
5, 2017 and June 29, 2018.
F-97
Cresud Sociedad Anónima,
Comercial, Inmobiliaria, Financiera y Agropecuaria
Under
this Framework Agreement, corporate services are provided in the
following areas: Corporate Human Resources, Administration and
Finance, Planning, Institutional Relations, Compliance, Shared
Services Center, Administration for the Real Estate Business, Board
of Directors, Human Resources for the Real Estate Business,
Security, Corporate Legal department, Corporate Environment and
Quality department, Technical Management, Infrastructure and
Purchasing, Investments, Government Affairs, Hotels, Fraud
Prevention, Bolívar, Attorneys, Audit Committee,
Security.
Pursuant to this
agreement, the companies hired an external consulting firm to
review and evaluate half-yearly the criteria used in the process of
determining the amount of corporate services, as well as the basis
for distribution and source documentation used in the process
indicated above, by means of a half-yearly report.
It
should be noted that the operations indicated above allows Cresud,
IRSA and IRSA CP to keep our strategic and commercial decisions
fully independent and confidential, with a cost and profit
allocation on the basis of operating efficiency and equity, without
pursuing individual economic benefits for any of the
companies.
Offices
and Shopping malls spaces leases
The
offices of our President are located at 108 Bolivar, in the
Autonomous City of Buenos Aires. The property has been rented to
Isaac Elsztain e Hijos S.A., a company controlled by some family
members of Eduardo Sergio Elsztain, our president, and to Hamonet
S.A., a company controlled by Fernando A. Elsztain, one of our
directors, and some of its family members.
In
addition, Tarshop, BACS, BHN Sociedad de Inversión S.A., BHN
Seguros Generales S.A. and BHN Visa S.A. rent offices owned by IRSA
CP in different buildings.
Furthermore, we
also let various spaces in our Shopping malls (stores, stands,
storage space or advertising space) to third parties and related
parties such us Tarshop S.A. and BHSA.
Lease
agreements entered into with associates included similar provisions
and amounts to those included in agreements with third
parties.
Donations
granted to Fundación IRSA and Fundación Museo de los
Niños
Fundación IRSA
is a non-profit charity institution that seeks to support and
generate initiatives concerning education, the promotion of
corporate social responsibility and the entrepreneurial spirit of
the youth. It carries out corporate volunteering programs and
fosters donations by the employees. The main members of
Fundación IRSA's Board of Directors are Eduardo S. Elsztain
(President), Saul Zang (Vice President I), Alejandro Elsztain (Vice
President II) and Mariana C. de Elsztain (secretary). It funds its
activities with the donations made by us, IRSA and IRSA CP.
Fundación Museo de los Niños is a non-profit association,
created by the same founders of Fundación IRSA and its
Management Board is formed by the same members as Fundación
IRSA.
Fundación
Museo de los Niños acts as special vehicle for the development
of "Museo de los Niños, Abasto" and "Museo de los Niños,
Rosario". On October 29, 1999, our shareholders approved the award
of the agreement “Museo de los Niños, Abasto” to
Fundación Museo de los Niños.
On
October 31, 1997, IRSA CP entered into an agreement with
Fundación IRSA whereby it loaned 3,800 square meters of the
area built in the Abasto Shopping Mall for a total term of 30
years, and on November 29, 2005, shareholders of IRSA CP approved
another agreement entered into with Fundación Museo de los
Niños whereby 2,670.11 square meters built in the Shopping
Mall Alto Rosario were loaned for a term of 30 years.
Fundación IRSA has used the available area to house the museum
called “Museo de los Niños, Abasto” an interactive
learning center for kids and adults, which was opened to the public
in April 1999.
Legal
services
The
Group hires legal services from Estudio Zang, Bergel &
Viñes, at which Saúl Zang is a partner and sits at the
Board of Directors of the Group companies.
F-98
Cresud Sociedad Anónima,
Comercial, Inmobiliaria, Financiera y Agropecuaria
Hotel
services
Our
company and related parties sometimes rent from NFSA and Hoteles
Argentinos S.A. hotel services and conference rooms for
events.
Purchase-Sale
of goods and/or services hiring
In the
normal course of its business and with the aim of make resources
more efficient, in certain occasions purchase and/or hire services
which later sells and/or recover for companies or other related
parties, based upon their actual utilization.
Sale
of advertising space in media
Our
company and our related parties frequently enter into agreements
with third parties whereby we sell/acquire rights of use to
advertise in media (TV, radio stations, newspapers, etc.) that will
later be used in advertising campaigns. Normally, these spaces are
sold and/or recovered to/from other companies or other related
parties, based on their actual use.
Purchase-sale
of financial assets
Cash
surplus are usually invested in several instruments that may
include those issued by related companies acquired at issuance or
from unrelated third parties through transactions in the secondary
market.
Investment
in investment funds managed by BACS
The
Group invests its liquid funds in mutual funds managed by BACS
among other entities.
Borrowings
In the
normal course of its activities, the Group enters into diverse loan
agreements or credit facilities between the group’s companies
and/or other related parties. These borrowings accrue interests at
market rates.
Financial
and service operations with BHSA
The
Group works with several financial entities in the Argentine market
for operations including, but not limited to, credit, investment,
purchase and sale of securities and financial derivatives. Such
entities include BHSA and its subsidiaries. BHSA and BACS usually
act as underwriters in Capital Market transactions. In addition, we
have entered into agreements with BHSA, who provides collection
services for our shopping malls.
Loan
between Dolphin and IDBD
As
described in Note 7 to this Consolidated Financial Statements
Dolphin has granted a series of subordinated loans to IDBD
(“the debt”). This debt has the following
characteristics: i) it is subordinated, even in the case of
insolvency, to all current or future debts of IDBD; (ii) will be
reimbursed after payment of all the debts to their creditors; (iii)
accrues interest at a rate of 0.5%, which will be added to the
amount of the debt and will be payable only on the date the
subordinated debt is amortized; (iv) Dolphin will not have a right
to participate or vote in the meetings with IDBD creditors with
respect to the subordinated debt; (v) as from January 1, 2016,
Dolphin has the right, at its own discretion, to convert the debt
balance into IDBD shares, at that time, whether wholly or
partially, including the interest accrued over the debt until that
date; (vi) if Dolphin opts to exercise the conversion, the debt
balance will be converted so that Dolphin will receive IDBD shares
according to a share price that will be 10% less than the average
price of the last 30 days prior to the date the conversion option
is exercised. In the event there is no market price per share, it
will be determined in accordance with an average of three
valuations made by external or independent experts, who shall be
determined by mutual consent and, in the event of a lack of
consent, will be set by the President of the Institute of Certified
Public Accountants in Israel.
F-99
Cresud Sociedad Anónima,
Comercial, Inmobiliaria, Financiera y Agropecuaria
San
Bernardo lease
We
lease a rural establishment in the Province of Córdoba, which
is owned by San Bernardo de Córdoba S.A. (previously
denominated Isaac Elsztain e hijos S.C.A.) pursuant to a lease
agreement entered into in August 2015, for a fraction of 12,600
hectares.
The
consideration for the lease was agreed at an amount equal to 3.5 kg
of beef per hectare. For computation purposes the price per kilo of
beef reported in the webpage of the Mercado de Hacienda de Liniers
(Cattle Market) is considered. In addition, a productivity premium
was agreed equal to 15% of the excess over 240,000 kilograms of
cattle in the establishment.
Consulting
Agreement
In
accordance with the terms of the Consulting Agreement, in force as
from November 7, 1994, and its amendments, CAMSA provides us with
advisory services on matters related to activities and investments
included agricultural, real estate, financial and hotel operations,
among others. An 85% of the capital stock of CAMSA is held by one
of our shareholders and President of our Board of Directors, while
the remaining 15% of the capital stock is owned by our First Vice
President.
Based
on the terms and conditions of the Consulting Agreement, CAMSA
provides us with the following services:
● advise
in relation to investing in all aspects of the agricultural
business, real estate, financial, and hotel operations, among
others, and business proposals;
● acts
on behalf of our company in such transactions, negotiating prices,
terms and conditions and other terms of each transaction;
and
● provides
advisory services on investments in securities related to such
transactions.
As
regards the Consulting Agreement, in consideration for its services
we pay CAMSA an annual fee equal to 10% of our annual net income
after tax. During fiscal year 2018, income for Ps. 554 was
recognized in this respect, Ps. 80 of which has been paid as of
June 30, 2018.
The
Consulting Agreement can be revoked by any of the parties upon
prior written notice that should not exceed 60 days. If we revoke
the Consulting Agreement without cause, we will be liable to pay
CAMSA twice the average fee amounts paid for management services
during the two fiscal years preceding such revocation.
The
following is a summary presentation of the balances with related
parties as of June 30, 2018 and 2017:
|
Item
|
06.30.18
|
06.30.17
|
|
Trade and other
payables
|
(1,467
)
|
(1,134
)
|
|
Borrowings
|
(10
)
|
(11
)
|
|
Trade and other
receivables
|
768
|
1,621
|
|
Investments in
Financial Assets
|
135
|
-
|
|
Total
|
(574
)
|
476
|
F-100
Cresud Sociedad Anónima,
Comercial, Inmobiliaria, Financiera y Agropecuaria
|
Related party
|
06.30.18
|
06.30.17
|
Description of transaction
|
|
Agrofy
S.A.
|
1
|
13
|
Other
receivables
|
|
Agro
Uranga S.A.
|
-
|
8
|
Dividends
receivables
|
|
|
27
|
-
|
Sale
of goods and / or services receivable
|
|
|
(1
)
|
-
|
Futures
and options payable
|
|
New
Lipstick LLC
|
7
|
5
|
Reimbursement
of expenses receivable
|
|
|
585
|
-
|
Loans
granted
|
|
Condor
|
135
|
-
|
Public
companies securities
|
|
|
-
|
8
|
Dividends
receivables
|
|
Cresca
S.A.
|
-
|
168
|
Credits
granted
|
|
|
(11
)
|
-
|
Other
liabilities
|
|
Manibil
S.A.
|
72
|
84
|
Contributions
in advance
|
|
Other
associates and joint ventures (i)
|
3
|
4
|
Leases
and/or rights of use receivable
|
|
|
(1
)
|
(1
)
|
Leases
and/or rights of use payable
|
|
|
-
|
(5
)
|
Commissions
payable
|
|
|
-
|
(1
)
|
Advertising
spaces payable
|
|
|
-
|
1
|
Management
fees receivable
|
|
|
-
|
3
|
Other
credits
|
|
|
1
|
1
|
Shared-based
compensation receivable
|
|
|
(10
)
|
(11
)
|
Loans
payable
|
|
|
7
|
-
|
Loans
granted
|
|
|
(3
)
|
-
|
Sale
of goods and / or services payable
|
|
|
5
|
8
|
Reimbursement
of expenses
|
|
|
(1
)
|
(1
)
|
Reimbursement
of expenses payable
|
|
Total associates and joint ventures
|
816
|
284
|
|
|
CAMSA
and its subsidiaries
|
(1,351
)
|
(1,020
)
|
Fees
payable
|
|
|
2
|
5
|
Reimbursement
of expenses receivable
|
|
|
-
|
(3
)
|
Reimbursement
of expenses payable
|
|
LRSA
|
29
|
29
|
Leases
and/or rights of use receivable
|
|
|
(1
)
|
-
|
Reimbursement
of expenses payable
|
|
|
-
|
-
|
Canon
receivable
|
|
|
7
|
-
|
Dividends
receivables
|
|
Real
Estate Strategies LP
|
19
|
-
|
Dividends
receivables
|
|
|
2
|
-
|
Reimbursement
of expenses
|
|
Taaman
|
-
|
(24
)
|
Leases
and/or rights of use payable
|
|
Willifood
|
-
|
(29
)
|
Financial
operations payable
|
|
Other
related parties (ii)
|
(11
)
|
-
|
Other
liabilities
|
|
|
-
|
-
|
Other
receivables
|
|
|
(2
)
|
(4
)
|
Legal
services payable
|
|
|
1
|
1
|
Leases
and/or rights of use receivable
|
|
Total other related parties
|
(1,305
)
|
(1,045
)
|
|
|
IFISA
|
-
|
1,283
|
Financial
operations receivable
|
|
Total Parent Company
|
-
|
1,283
|
|
|
Directors
and Senior Management
|
(85
)
|
(46
)
|
Fees
payable
|
|
Total Directors and Senior Management
|
(85
)
|
(46
)
|
|
|
Total
|
(574
)
|
476
|
|
(i)
Includes
Agrofy Global, BHSA, Lipstick, Tarshop, Mehadrin, Austral Gold
Ltd., Cyrsa S.A., NPSF, Puerto Retiro, Shufersal and
Quality.
(ii)
Includes
Estudio Zang, Bergel & Viñes, Lartiyrigoyen, SAMSA and
Museo de los Niños.
The
following is a summary of the results with related parties for the
years ended June 30, 2018, 2017 and 2016:
|
Related party
|
06.30.18
|
06.30.17
|
06.30.16
|
Description of transaction
|
|
Adama
|
-
|
16
|
16
|
Sale
of goods and/or services
|
|
Agrofy
S.A.
|
-
|
3
|
-
|
Management
fees / Directory
|
|
|
6
|
3
|
-
|
Financial
operations
|
|
Agro-Uranga
S.A.
|
2
|
3
|
3
|
Sale
of goods and/or services
|
|
Banco
de Crédito y Securitización S.A.
|
17
|
1
|
6
|
Leases
and/or rights of use
|
|
|
-
|
39
|
21
|
Financial
operations
|
|
Condor
|
119
|
235
|
122
|
Financial
operations
|
|
Tarshop
S.A.
|
-
|
14
|
12
|
Leases
and/or rights of use
|
|
ISPRO-MEHADRIN
|
-
|
-
|
57
|
Sale
of goods and/or services
|
|
|
117
|
-
|
-
|
Corporate
services
|
|
Other
associates and joint ventures
|
27
|
15
|
3
|
Leases
and/or rights of use
|
|
|
4
|
4
|
3
|
Fees
and remunerations
|
|
|
37
|
-
|
-
|
Corporate
services
|
|
|
1
|
4
|
(9
)
|
Financial
operations
|
|
Total associates and joint ventures
|
330
|
337
|
234
|
|
|
CAMSA
and its subsidiaries
|
(554
)
|
(200
)
|
(534
)
|
Management
fee
|
|
|
-
|
1
|
-
|
Leases
and/or rights of use
|
|
Taaman
|
157
|
-
|
-
|
Corporate
services
|
|
Willi-Food
International Ltd.
|
134
|
-
|
-
|
Corporate
services
|
|
Other
related parties (i)
|
12
|
18
|
(3
)
|
Leases
and/or rights of use
|
|
|
(10
)
|
-
|
-
|
Fees
and remunerations
|
|
|
4
|
-
|
-
|
Corporate
services
|
|
|
(2
)
|
(6
)
|
(6
)
|
Legal
services
|
|
|
26
|
-
|
-
|
Financial
operations
|
|
|
(13
)
|
(9
)
|
(8
)
|
Donations
|
|
Total other related parties
|
(246
)
|
(196
)
|
(551
)
|
|
F-101
Cresud Sociedad Anónima,
Comercial, Inmobiliaria, Financiera y Agropecuaria
|
Related party
|
06.30.18
|
06.30.17
|
06.30.16'
|
Description of transaction
|
|
IFISA
|
56
|
13
|
39
|
Financial
operations
|
|
Total Parent Company
|
56
|
13
|
39
|
|
|
Directors
|
(10
)
|
(126
)
|
(156
)
|
Compensation
of Directors and senior management
|
|
|
(203
)
|
-
|
-
|
Fees
and remunerations
|
|
Senior
Management
|
(26
)
|
(7
)
|
(16
)
|
Compensation
of Directors and senior management
|
|
Total Directors and Senior Management
|
(239
)
|
(133
)
|
(172
)
|
|
|
Total
|
(99
)
|
21
|
(450
)
|
|
(i)
Includes
Estudio Zang, Bergel & Viñes, Isaac Elsztain e Hijos
S.C.A., San Bernando de Córdoba S.A., Fundación IRSA,
Hamonet, BHN Sociedad de Inversión, BACS Administradora de
Activos S.A., BHN Seguros Generales S.A. and BHN Vida
S.A.
The
following is a summary of the transactions with related parties for
the years ended June 30, 2018 and 2017:
|
Related party
|
06.30.18
|
06.30.17
|
Description of transaction
|
|
Agrofy
Global
|
31
|
10
|
Irrevocable
contributions
|
|
Avenida
Inc.
|
7
|
-
|
Irrevocable
contributions
|
|
Manibil
|
45
|
38
|
Irrevocable
contributions
|
|
Open
Legacy
|
17
|
-
|
Irrevocable
contributions
|
|
PBEL
|
-
|
8
|
Irrevocable
contributions
|
|
PBS-Romania
|
-
|
7
|
Irrevocable
contributions
|
|
Puerto
Retiro
|
-
|
2
|
Irrevocable
contributions
|
|
Quality
|
39
|
3
|
Irrevocable
contributions
|
|
Ramat
Hanassi
|
9
|
102
|
Irrevocable
contributions
|
|
Secdo
/ SixGill
|
34
|
-
|
Irrevocable
contributions
|
|
Secured
Touch
|
5
|
-
|
Irrevocable
contributions
|
|
Total contributions
|
187
|
170
|
|
|
Inversiones
Financieras del Sur S.A. (Note 4)
|
122
|
1
|
Dividends
paid
|
|
Total dividends paid
|
122
|
1
|
|
|
Agro-Uranga
S.A.
|
30
|
21
|
Dividends
received
|
|
Aviareps
|
-
|
36
|
Dividends
received
|
|
Baicom
|
-
|
1
|
Dividends
received
|
|
Banco
Hipotecario
|
60
|
-
|
Dividends
received
|
|
Condor
|
55
|
22
|
Dividends
received
|
|
Cyrsa
S.A.
|
-
|
7
|
Dividends
received
|
|
Emco
|
91
|
101
|
Dividends
received
|
|
La
Rural S.A.
|
34
|
9
|
Dividends
received
|
|
Manaman
|
25
|
36
|
Dividends
received
|
|
Manibil
|
-
|
19
|
Dividends
received
|
|
Nuevo
Puerto Santa Fe S.A.
|
9
|
12
|
Dividends
received
|
|
Ramat
Hanassi
|
20
|
-
|
Dividends
received
|
|
Tourism
& Recreation Holdings Ltd.
|
25
|
7
|
Dividends
received
|
|
Total dividends received
|
349
|
271
|
|
|
Inversiones
Financieras del Sur S.A.
|
1,968
|
-
|
Acquisition
of non-controlling interest
|
|
Total other transactions
|
1,968
|
-
|
|
F-102
Cresud Sociedad Anónima,
Comercial, Inmobiliaria, Financiera y Agropecuaria
32.
Cost
of goods sold and services provided
|
Description
|
Biological
assets
|
Agricultural
inventories
|
Rentals
and other agricultural services
|
Subtotal
agricultural sales and services
|
Trading
properties and developments
|
Communication
services
|
Telephones
and communication equipment
|
Rental
and services
|
Good
for resale
|
Hotel
operations, tourism services and others (i
)
|
Total
as of
06.30.18
|
Total
as of
06.30.17
|
Total
as of
06.30.16
|
|
Inventories
as of 06.30.17
|
760
|
776
|
-
|
1,536
|
5,783
|
-
|
320
|
-
|
3,873
|
67
|
11,579
|
9,441
|
1,064
|
|
Acquisition for
business combination
|
-
|
-
|
-
|
-
|
-
|
-
|
-
|
-
|
380
|
-
|
380
|
-
|
4,575
|
|
Initial recognition
and changes in the fair value of biological assets and agricultural
products at the point of harvest
|
56
|
483
|
-
|
539
|
-
|
-
|
-
|
-
|
-
|
-
|
539
|
(109
)
|
(30
)
|
|
Changes in net
realizable value of agricultural products after
harvest
|
-
|
243
|
-
|
243
|
-
|
-
|
-
|
-
|
-
|
-
|
243
|
(112
)
|
139
|
|
Capitalized finance
costs
|
-
|
-
|
-
|
-
|
11
|
-
|
-
|
-
|
-
|
-
|
11
|
-
|
-
|
|
Decrease
due to harvest
|
-
|
2,582
|
-
|
2,582
|
-
|
-
|
-
|
-
|
-
|
-
|
2,582
|
1,877
|
1,234
|
|
Purchases and
classifications
|
160
|
1,614
|
-
|
1,774
|
-
|
-
|
3,453
|
-
|
44,485
|
96
|
49,808
|
37,494
|
3,014
|
|
Consume
|
(47
)
|
64
|
-
|
17
|
-
|
-
|
-
|
-
|
-
|
-
|
17
|
(819
)
|
(622
)
|
|
Additions
|
-
|
-
|
-
|
-
|
1,870
|
-
|
-
|
-
|
-
|
227
|
2,097
|
1,236
|
13,659
|
|
Deconsolidation
(Note 4.(l))
|
-
|
-
|
-
|
-
|
-
|
-
|
-
|
-
|
(50,717
)
|
(25
)
|
(50,742
)
|
(35,433
)
|
(14,018
)
|
|
Transfers
|
-
|
-
|
-
|
-
|
(344
)
|
-
|
-
|
-
|
-
|
-
|
(344
)
|
27
|
317
|
|
Expenses
incurred
|
346
|
251
|
349
|
946
|
28
|
10,484
|
-
|
3,046
|
-
|
6,220
|
20,724
|
18,429
|
7,654
|
|
Cumulative
translation adjustment
|
92
|
133
|
-
|
225
|
3,652
|
56
|
178
|
-
|
1,979
|
11
|
6,101
|
2,718
|
2,881
|
|
Inventories
as of 06.30.18
|
(1,030
)
|
(1,695
)
|
-
|
(2,725
)
|
(9,252
)
|
-
|
(592
)
|
-
|
-
|
(37
)
|
(12,606
)
|
(11,579
)
|
(9,441
)
|
|
Costs
as of
06.30.18
|
337
|
4,451
|
349
|
5,137
|
1,748
|
10,540
|
3,359
|
3,046
|
-
|
6,559
|
30,389
|
-
|
-
|
|
Costs
as of
06.30.17
|
176
|
2,924
|
189
|
3,289
|
1,419
|
8,467
|
2,716
|
2,835
|
-
|
4,444
|
-
|
23,170
|
-
|
|
Costs
as of
06.30.16
|
137
|
2,097
|
101
|
2,335
|
166
|
3,304
|
1,304
|
1,888
|
-
|
1,429
|
-
|
-
|
10,426
|
(i)
Includes the cost of goods sold from IDBD Tourism which is
disclosed as discontinued operations for an amount of Ps. (5,621),
Ps. (3,850) and Ps. (1,055) as of June 30, 2018, 2017 and 2016,
respectively.
F-103
Cresud Sociedad Anónima,
Comercial, Inmobiliaria, Financiera y Agropecuaria
33.
Foreign
currency assets and liabilities
Book
amounts of foreign currency assets and liabilities are as
follows:
|
|
Amount
of foreign currency (2)
|
Prevailing
exchange rate (
1)
|
Total
as of
06.30.18
|
Amount
of foreign currency (2)
|
Prevailing
exchange rate (
1)
|
Total
as of
06.30.17
|
|
Assets
|
|
|
|
|
|
|
|
Restricted
assets
|
|
|
|
|
|
|
|
US
Dollar
|
-
|
-
|
-
|
2
|
16.53
|
41
|
|
Total
restricted assets
|
|
|
-
|
|
|
41
|
|
Trade
and other receivables
|
|
|
|
|
|
|
|
US
Dollar
|
74
|
28.75
|
2,115
|
60
|
16.53
|
995
|
|
Euros
|
5
|
33.54
|
178
|
9
|
18.85
|
172
|
|
Chilean
Pesos
|
91
|
0.04
|
4
|
-
|
-
|
-
|
|
Trade
and other receivables related parties
|
|
|
|
|
|
|
|
US
Dollar
|
48
|
28.75
|
1,366
|
45
|
16.53
|
747
|
|
Total
Trade and other receivables
|
|
|
3,663
|
|
|
1,914
|
|
Investment
in financial assets
|
|
|
|
|
|
|
|
US
Dollar
|
133
|
28.75
|
3,813
|
62
|
16.53
|
1,020
|
|
Pounds
|
1
|
37.90
|
39
|
1
|
21.49
|
18
|
|
Total
Investment in financial assets
|
|
|
3,852
|
|
|
1,038
|
|
Derivative
financial instruments
|
|
|
|
|
|
|
|
US
Dollar
|
1
|
28.75
|
43
|
2
|
16.53
|
31
|
|
Total
Derivative financial instruments
|
|
|
43
|
|
|
31
|
|
Cash
and cash equivalents
|
|
|
|
|
|
|
|
US
Dollar
|
280
|
28.75
|
8,057
|
326
|
16.53
|
5,387
|
|
Euros
|
2
|
33.54
|
66
|
3
|
18.85
|
49
|
|
Chilean
Pesos
|
23
|
0.04
|
1
|
-
|
-
|
-
|
|
Total
Cash and cash equivalents
|
|
|
8,124
|
|
|
5,436
|
|
Total
Assets
|
|
|
15,682
|
|
|
8,460
|
|
|
|
|
|
|
|
|
|
Liabilities
|
|
|
|
|
|
|
|
Trade
and other payables
|
|
|
|
|
|
|
|
US
Dollar
|
111
|
28.85
|
3,198
|
78
|
16.63
|
1,300
|
|
Euros
|
3
|
33.73
|
88
|
1
|
19.00
|
19
|
|
Chilean
Pesos
|
23
|
0.04
|
1
|
-
|
-
|
-
|
|
Total
Trade and other payables
|
|
|
3,287
|
|
|
1,319
|
|
Borrowings
|
|
|
|
|
|
|
|
US
Dollar
|
1,245
|
28.85
|
35,928
|
1,283
|
16.63
|
21,328
|
|
Total
Borrowings
|
|
|
35,928
|
|
|
21,328
|
|
Derivative
financial instruments
|
|
|
|
|
|
|
|
US
Dollar
|
(0
)
|
28.85
|
(11
)
|
-
|
-
|
-
|
|
Total
Derivative financial instruments
|
|
|
(11
)
|
|
|
-
|
|
Total
Liabilities
|
|
|
39,204
|
|
|
22,647
|
(1)
Exchange
rate as of June 30, of each year according to Banco Nación
Argentina records.
(2)
Considering
foreign currencies those that differ from each Group’s
functional currency at each year-end.
(3)
The
Group uses derivative instruments as complement in order to reduce
its exposure to exchange rate movements (see Note 15).
34.
Groups
of assets and liabilities held for sale
As
mentioned in Note 4.(k), the investment in Israir has been
reclassified to "Group of assets and liabilities held for sale".
Additionally, IDB Tourism is currently negotiating the sale of its
equity interests in Open Sky Ltd., but the terms and conditions of
such sale have not yet been finalized. The assets and liabilities
related to the Open Sky Ltd. transaction have been also
reclassified. Furthermore, the equity interest of the Group in
Adama and the related non-recourse loan, had been reclassified to
assets and liabilities held for sale before the disposal as of
November 22, 2016 (Note 4.(n)). Additionally, an area adjacent to
Tilvoli, valued at Ps. 521 is included.
Pursuant to IFRS 5,
assets and liabilities held for sale have been valued at the lower
between their carrying value and fair value less cost of sale.
Given some assets’ carrying value was higher; an impairment
loss of Ps. 231 has been recorded for the year ended June 30,
2017.
F-104
Cresud Sociedad Anónima,
Comercial, Inmobiliaria, Financiera y Agropecuaria
The
following table shows the main assets and liabilities classified as
held for sale:
|
|
06.30.18
|
06.30.17
|
|
Property, plant and
equipment
|
2,698
|
1,712
|
|
Intangible
assets
|
32
|
19
|
|
Investments in
associates
|
47
|
33
|
|
Deferred income tax
assets
|
103
|
57
|
|
Investment
properties
|
521
|
5
|
|
Income tax
credit
|
-
|
10
|
|
Trade and other
receivables
|
1,444
|
688
|
|
Cash and cash
equivalents
|
347
|
157
|
|
Total
group of assets held for sale
|
5,192
|
2,681
|
|
Trade and other
payables
|
1,957
|
930
|
|
Salaries and social
security liabilities
|
-
|
148
|
|
Employee
benefits
|
150
|
52
|
|
Deferred income tax
liability
|
16
|
10
|
|
Borrowings
|
1,120
|
715
|
|
Total
group of liabilities held for sale
|
3,243
|
1,855
|
|
Total
net financial assets held for sale
|
1,949
|
826
|
35.
Results
from discontinued operations
The
results of Shufersal, Israir and IDB Tourism operations, the share
of profit of Adama and the finance costs associated to its
non-recourse loan, until Adama’s sale, and the results from
sale of the investment in Adama and Shufersal have been
reclassified in the Statements of Income under discontinued
operations.
|
|
06.30.18
|
06.30.17
|
06.30.16
|
|
Revenues
|
66,740
|
51,578
|
19,759
|
|
Costs
|
(50,087
)
|
(39,282
)
|
(15,073
)
|
|
Gross
profit
|
16,653
|
12,296
|
4,686
|
|
Net gain from fair
value adjustment of investment properties
|
164
|
113
|
23
|
|
General and
administrative expenses
|
(1,162
)
|
(857
)
|
(294
)
|
|
Selling
expenses
|
(13,042
)
|
(9,655
)
|
(3,955
)
|
|
Other operating
results, net (i)
|
10,838
|
3,888
|
(6
)
|
|
Profit
from operations
|
13,451
|
5,785
|
454
|
|
Share of profit of
associates and joint ventures
|
54
|
373
|
344
|
|
Profit
before financial results and income tax
|
13,505
|
6,158
|
798
|
|
Financial
income
|
94
|
148
|
408
|
|
Finance
costs
|
(675
)
|
(1,962
)
|
(367
)
|
|
Other financial
results
|
(75
)
|
(111
)
|
-
|
|
Financial
results, net
|
(656
)
|
(1,925
)
|
41
|
|
Profit
before income tax
|
12,849
|
4,233
|
839
|
|
Income
tax
|
(370
)
|
(140
)
|
(22
)
|
|
Profit
for the period from discontinued operations (ii
)
|
12,479
|
4,093
|
817
|
|
|
|
|
|
|
Profit
for the period from discontinued operations
attributable to:
|
|
|
|
|
Equity holders of
the parent
|
9,725
|
1,647
|
338
|
|
Non-controlling
interest
|
2,754
|
2,446
|
479
|
|
|
|
|
|
|
Profit
per share from discontinued operations attributable to equity
holders of the parent:
|
|
|
|
|
Basic
|
16.91
|
2.86
|
0.59
|
|
Diluted
|
16.80
|
2.84
|
0.58
|
(i)
Includes the result
of the loss of control of Shufersal (see Note 4.(l)) as of June 30,
2018 and the sale of Adama, which generated a profit of Ps. 4,216
in the year ended June 30, 2017.
(ii)
As of June 30,
2018, 2017 and 2016, Ps. 60,470, Ps. 47,168 and Ps 18,607 of the
total revenues from discontinued operations and Ps 12,377, Ps.
1,075 and Ps. 373 of the total profit from discontinued operations
correspond to Shufersal.
36.
Subsequent
events
Partial prepayment of IDBD debentures
The
Board of Directors of IDBD resolved to perform a partial prepayment
of series M debentures of IDBD, which took place on August 28,
2018. The partial prepayment amounted to NIS 146 million
(approximately Ps 1,572 as of the date of issuance of these
financial statements) which represents a 14.02% of the remaining
amount of series M debentures.
F-105
Cresud Sociedad Anónima,
Comercial, Inmobiliaria, Financiera y Agropecuaria
Possible sale of a subsidiary of IDB Tourism
On
August 14, 2018, the Board of Directors of IDB Tourism approved its
engagement in a memorandum of understanding for the sale of 50% of
the issued share capital of a company which manages the incoming
tourism operation which is held by Israir for a total consideration
of NIS 26 million (approximately Ps. 265 as of the date of issuance
of these financial statements). The closing of the transaction is
expected by November 30, 2018. This transaction does not change the
intentions of selling the whole investment in IDBT, which the
management of the company expects to compete before June
2019.
Partial sale of Clal
On
August 30, 2018 continuing with the instructions given by the
Commissioner of Capital Markets, Insurance and Savings of Israel,
IDBD has sold 5% of its stake in Clal through a swap transaction in
the same conditions that applied to the swap transactions performed
in the preceding months of May and August 2017, January and May
2018. The consideration was set at an amount of approximately NIS
173 million (equivalent to approximately Ps. 1,766). After the
completion of the transaction, IDBD’s interest in Clal was
reduced to 29.8% of its share capital.
Agreement to sell plot of land in USA
In
August 2018, a subsidiary of IDBG signed an agreement to sell a
plot of land next to the Tivoli project in Las Vegas for a
consideration of US$ 18 (approximately Ps. 673 as of the date of
issuance of these financial statements). As of June 30, 2018, the
book value of the plot of land was classified as assets held for
sale according to IFRS 5 conditions.
Sale of Jatobá farm
On June
13, 2018, the Company signed a purchase/sale agreement for a total
of 9,784 hectares (7,485 of arable hectares) of the Jatobá
farm, rural property located in Municipality of Jaborandi-Brazil,
for the amount of 285 bags per useful hectare at Ps. 1,254 per
bag.
On July
31, 2018, the first installment was paid for 300,000 soybean bags,
for an amount of Ps. 142 as agreed in the contract. In addition,
possession was granted so revenue was recognized by the Company.
The remaining balance will be paid in six annual
installments.
Devaluation of the Argentine Peso
As of
the date of issuance of these financial statements, the argentine
peso has suffered a devaluation against the US dollar and other
currencies, close to 27.2%, which has an impact on the figures
presented on these financial statements, due mainly for the
exposure to the devaluation of our financial assets and liabilities
nominated in foreign currency.
Export withholdings
On
September 3, 2018, 793/2018 Decree was issued which modifies
withholding export taxes. Such decree determines until December 30,
2020 an additional withholding export tax of 12% to the exports of
all goods. The abovementioned tax should not exceed 4 pesos per
dollar of the good price in the case of primary goods and 3 pesos
per dollar of the goods price for the rest of the
products.
CRESUD Shareholders’ Meeting
CRESUD
Shareholders’ Meeting, held on October 29, 2018, approved
among others, Ps. 4,984 of net income for the fiscal year ended
June 30, 2018 to the constitution of a special reserve that may be
allocated to new projects according to the business development
plan of CRESUD, to the distribution of dividends, or to the
cancellation of commitments authorizing the Board of directors to
decide the application of the funds to any of said
destinations.
Furthermore,
the Shareholders’ Meeting decided to appropriate the
remaining undistributed earnings in the amount of Ps. 9,647 to a
special reserve that may be allocated to new projects according to
the business development plan of CRESUD, to the distribution of
dividends, or to the cancellation of commitments.
In
addition, it decided to distribute for up to the amount of
20,656,215 Treasury shares as follows: (i) 93,020 for the incentive
equity plan and (ii) 20,563,195 among shareholders in proportion to
their shareholdings
On
the other hand, it approved an Amendment to Articles Eighth (in
relation to the Issuance of Shares), Eleventh (as regards
Negotiable Obligations), and Twenty-Second (as regards the Audit
Committee) of the By Laws in order to adapt to the new legal
provisions.
F-106
NEW LIPSTICK, LLC AND SUBSIDIARY
C
ONSOLIDATED
F
INANCIAL
S
TATEMENTS
J
UNE
30, 2018
F-107
NEW LIPSTICK, LLC AND SUBSIDIARY
TABLE
OF CONTENTS
|
INDEPENDENT
AUDITOR’S REPORT
|
F-109
- F-110
|
|
CONSOLIDATED
FINANCIAL STATEMENTS
|
|
|
Consolidated
Balance Sheet
|
F-111
|
|
Consolidated
Statement of Operations
|
F-112
|
|
Consolidated
Statement of Changes in Members’ Deficit
|
F-113
|
|
Consolidated
Statement of Cash Flows
|
F-114
|
|
Notes
to Consolidated Financial Statements
|
F-115
- F-124
|
|
SUPPLEMENTAL
INFORMATION
|
F-125
|
|
Consolidating
Balance Sheet
|
F-126
|
|
Consolidating
Statement of Operations
|
F-127
|
F-108
INDEPENDENT AUDITOR’S REPORT
To
the Members’ of New Lipstick, LLC and
Subsidiary
Report on the Consolidated Financial Statements
We
have audited the accompanying consolidated financial statements of
New Lipstick, LLC and Subsidiary (a limited liability company) (the
“Company”), which comprise the consolidated balance
sheet as of June 30, 2018, and the related consolidated statements
of operations, changes in members’ deficit, and cash flows
for the year then ended, and the related notes to the consolidated
financial statements.
Management’s Responsibility for the Consolidated Financial
Statements
Management
is responsible for the preparation and fair presentation of these
consolidated financial statements in accordance with accounting
principles generally accepted in the United States of America; this
includes the design, implementation, and maintenance of internal
control relevant to the preparation and fair presentation of
consolidated financial statements that are free from material
misstatement, whether due to fraud or error.
Auditor’s Responsibility
Our
responsibility is to express an opinion on these consolidated
financial statements based on our audit. We conducted our audit in
accordance with auditing standards generally accepted in the United
States of America. Those standards require that we plan and perform
the audit to obtain reasonable assurance about whether the
consolidated financial statements are free from material
misstatement.
An
audit involves performing procedures to obtain audit evidence about
the amounts and disclosures in the consolidated financial
statements. The procedures selected depend on the auditor’s
judgment, including the assessment of the risks of material
misstatement of the consolidated financial statements, whether due
to fraud or error. In making those risk assessments, the auditor
considers internal control relevant to the entity’s
preparation and fair presentation of the consolidated financial
statements in order to design audit procedures that are appropriate
in the circumstances, but not for the purpose of expressing an
opinion on the effectiveness of the entity’s internal
control. Accordingly, we express no such opinion. An audit also
includes evaluating the appropriateness of accounting policies used
and the reasonableness of significant accounting estimates made by
management, as well as evaluating the overall presentation of the
consolidated financial statements.
We
believe that the audit evidence we have obtained is sufficient and
appropriate to provide a basis for our audit opinion.
Opinion
In
our opinion, the consolidated financial statements referred to
above present fairly, in all material respects, the financial
position of New Lipstick, LLC and Subsidiary as of June 30, 2018,
and the results of their operations and their cash flows for the
year then ended in accordance with accounting principles generally
accepted in the United States of America.
F-109
To
the Members’ of
New
Lipstick, LLC and Subsidiary
Emphasis of Matter – Members
’
Deficit
As
of June 30, 2018, the Company had a members
’
deficit of approximately $178,266,000. As discussed in Note 5, on
September 15, 2017, the Company amended its existing debt agreement
and paid down $40,000,000 through two prepayments. The first
prepayment of $20,000,000 occurred in September 2017, and the
second prepayment of $20,000,000 occurred on October 15, 2017. Also
in October 2017, the Lender forgave $20,000,000 of principal. As a
result of additional monthly principal payments the balance
outstanding on the note payable was approximately $50,744,000 as of
June 30, 2018.
Emphasis of Matter – Tenant Concentration
As
discussed in Note 1, the Company had one major tenant Latham and
Watkins LLP, during the year ended June 30, 2018, which represented
approximately 71% of the Company’s base rent before
amortization of above and below market leases. The leases with this
tenant expire on June 30, 2021. The approximate rental revenue from
the tenant amounted to $30,686,000 for the year ended June 30,
2018. The loss of this tenant could have a material negative impact
on the Company’s consolidated operations. Our opinion on
these consolidated financial statements is not modified with
respect to this matter.
Other Matter
Our
audit was conducted for the purpose of forming an opinion on the
basic financial statements as a whole. The supplemental information
presented on pages 18-19 is for additional analysis and is not a
required part of the basic financial statements. Such information
has not been subjected to the auditing procedures applied in the
audit of the basic financial statements, and accordingly, we do not
express an opinion or provide any assurance on it.
New
York, NY
September 4,
2018
F-110
NEW LIPSTICK, LLC AND SUBSIDIARY
C
ONSOLIDATED
B
ALANCE
S
HEET
J
UNE
30, 2018
|
ASSETS
|
|
|
|
|
|
Real estate,
net
|
$
128,065,721
|
|
Cash and cash
equivalents
|
1,734,520
|
|
Restricted
cash
|
3,976,627
|
|
Tenant receivables,
net
|
364,544
|
|
Prepaid expenses
and other assets
|
6,643,447
|
|
Due from related
party
|
120,274
|
|
Deferred rent
receivable
|
9,482,209
|
|
Goodwill
|
5,422,615
|
|
Lease intangibles,
net
|
15,121,182
|
|
|
|
|
TOTAL
ASSETS
|
$
170,931,139
|
|
|
|
|
LIABILITIES
AND MEMBERS' DEFICIT
|
|
|
|
|
|
LIABILITIES
|
|
|
Accounts payable
and accrued expenses
|
$
2,639,221
|
|
Notes payable to
members
|
41,132,971
|
|
Note
payable
|
50,774,482
|
|
Deferred ground
rent payable
|
219,421,593
|
|
Due to related
parties
|
240,874
|
|
Tenant security
deposits
|
924,856
|
|
Deferred
revenue
|
321,434
|
|
Lease intangibles,
net
|
33,741,364
|
|
|
|
|
TOTAL
LIABILITIES
|
349,196,795
|
|
|
|
|
MEMBERS'
DEFICIT
|
(178,265,656
)
|
|
|
|
|
TOTAL
LIABILITIES AND MEMBERS' DEFICIT
|
$
170,931,139
|
|
|
|
The
accompanying notes are an integral part of these consolidated
financial statements.
F-111
NEW LIPSTICK, LLC AND
SUBSIDIARY
C
ONSOLIDATED
S
TATEMENT OF
O
PERATIONS
F
OR
T
HE
Y
EAR
E
NDED
J
UNE
30, 2018
|
REVENUES:
|
|
|
Base
rents
|
$
42,640,302
|
|
Tenant
reimbursements
|
7,672,918
|
|
Other rental
revenue
|
50,029
|
|
|
|
|
TOTAL
REVENUES
|
50,363,249
|
|
|
|
|
EXPENSES:
|
|
|
Real estate
taxes
|
11,620,716
|
|
Utilities
|
2,381,489
|
|
Janitorial
|
1,776,052
|
|
Insurance
|
325,138
|
|
Repairs and
maintenance
|
1,712,889
|
|
Security
|
1,014,923
|
|
Bad
debt
|
30,593
|
|
General and
administrative
|
2,827,316
|
|
Management
fees
|
1,130,602
|
|
Elevator
|
302,620
|
|
HVAC
|
80,215
|
|
Ground
rent
|
45,457,736
|
|
Interest
expense
|
4,015,781
|
|
Depreciation and
amortization
|
5,745,481
|
|
Amortization of
lease intangibles
|
3,079,859
|
|
|
|
|
TOTAL
EXPENSES
|
81,501,410
|
|
|
|
|
OTHER
INCOME
|
|
|
Gain on debt
forgiveness
|
20,000,000
|
|
|
|
|
NET
LOSS
|
$
(11,138,161
)
|
The
accompanying notes are an integral part of these consolidated
financial statements.
F-112
NEW LIPSTICK, LLC AND
SUBSIDIARY
C
ONSOLIDATED
S
TATEMENT OF
C
HANGES IN
M
EMBERS
’ D
EFICIT
F
OR
T
HE
Y
EAR
E
NDED
J
UNE
30, 2018
|
Members' deficit -
July 1, 2017
|
$
(167,127,495
)
|
|
|
|
|
Net
loss
|
(11,138,161
)
|
|
|
|
|
Members' deficit -
June 30, 2018
|
$
(178,265,656
)
|
|
|
|
The
accompanying notes are an integral part of these consolidated
financial statements.
F-113
NEW LIPSTICK, LLC AND SUBSIDIARY
C
ONSOLIDATED
S
TATEMENT OF
C
ASH
F
LOWS
F
OR
T
HE
Y
EAR
E
NDED
J
UNE
30, 2018
|
CASH
FLOWS FROM OPERATING ACTIVITIES:
|
|
|
|
|
|
Net
loss
|
(11,138,161
)
|
|
Adjustments
to reconcile net loss to net
|
|
|
cash
provided by operating activities:
|
|
|
Depreciation
and amortization
|
5,745,481
|
|
Bad
debt
|
30,593
|
|
Gain
on debt forgiveness
|
(20,000,000
)
|
|
Deferred
rent
|
390,793
|
|
Amortization
of above market leases
|
1,407,364
|
|
Accretion
of below market leases
|
(2,387,552
)
|
|
Accretion
of above market ground lease
|
(437,809
)
|
|
Amortization
of lease intangible assets
|
3,079,859
|
|
Deferred
ground rent
|
27,129,005
|
|
(Increase)
Decrease in operating assets:
|
|
|
Tenant
receivables
|
18,195
|
|
Prepaid
expenses and other assets
|
(510,810
)
|
|
Lease
intangibles
|
(281,225
)
|
|
Increase
(decrease) in operating liabilities:
|
|
|
Accounts
payable and accrued expenses
|
290,404
|
|
Tenant
security deposits
|
(21,017
)
|
|
Deferred
revenue
|
(342,260
)
|
|
TOTAL
ADJUSTMENTS
|
14,111,021
|
|
|
|
|
NET
CASH PROVIDED BY OPERATING ACTIVITIES
|
2,972,860
|
|
|
|
|
CASH
FLOWS FROM INVESTING ACTIVITIES:
|
|
|
Capital
expenditures
|
(1,418,777
)
|
|
NET
CASH USED IN INVESTING ACTIVITIES
|
(1,418,777
)
|
|
|
|
|
CASH
FLOWS FROM FINANCING ACTIVITIES:
|
|
|
Repayments
to related parties
|
(39,979
)
|
|
Net
change in restricted cash
|
181,496
|
|
Repayments
on notes payable
|
(42,383,429
)
|
|
Borrowings
from shareholders
|
41,132,971
|
|
|
|
|
NET
CASH USED IN FINANCING ACTIVITIES
|
(1,108,941
)
|
|
NET
INCREASE IN CASH AND CASH EQUIVALENTS
|
445,142
|
|
CASH
AND CASH EQUIVALENTS AT BEGINNING OF YEAR
|
1289,378
|
|
CASH
AND CASH EQUIVALENTS AT END OF YEAR
|
$
1,734,520
|
|
|
|
|
SUPPLEMENTAL
DISCLOSURE OF CASH FLOW INFORMATION:
|
|
|
Cash
paid for interest
|
$
4,244,626
|
The
accompanying notes are an integral part of these consolidated
financial statements.
F-114
NEW LIPSTICK, LLC AND SUBSIDIARY
N
OTES
T
O
C
ONSOLIDATED
F
INANCIAL
S
TATEMENTS
J
UNE
30, 2018
1.
ORGANIZATION AND SUMMARY OF SIGNIFICANT ACCOUNTING
POLICIES
Organization
New
Lipstick, LLC (the “Company”) was organized as a
Delaware limited liability company and commenced operations on
November 3, 2010. The Company was formed among IRSA International,
LLC (“IRSA”), Marciano Investment Group, LLC
(“Marciano”), Avi Chicouri (“Avi”), Par
Holdings, LLC (“Par”), and Armenonville, collectively
(the “Members”). On December 15, 2010, Armenonville
assigned 100 percent of its membership interest to Lomas Urbanas
S.A. IRSA is a wholly-owned subsidiary of Tyrus S.A.
(“TYRUS”), a wholly-owned subsidiary of IRSA
Inversiones y Representaciones Sociedad Anonima, a company whose
shares are listed on the Buenos Aires and New York Stock exchanges.
The Company was formed in order to acquire 100% interest in
Metropolitan 885 Third Avenue Leasehold LLC (“Metro
885”), its wholly-owned subsidiary.
Metro
885 was organized for the purpose of acquiring and operating a 34
story class A office tower more commonly known as the Lipstick
Building, located at 885 Third Avenue in New York (the
“Property”). Metro 885 leased the land which contains
approximately 28,000 square feet. On July 9, 2007, the Property was
acquired. The Property contains approximately 635,800 square feet
of rentable space, consisting of rental and office
spaces.
The
Company operates under the guidelines of an Operating Agreement
(the “Agreement”) entered into by the Members on
November 15, 2010. The Company has adopted a fiscal year end of
June 30. The manager of the Company is Lipstick Management, LLC
(“LM”), a company affiliated with IRSA.
The
Agreement calls for Class A and Class B Members’, Class A
Members are IRSA, Marciano and Lomas Urbanas
S.A.
and Class B members are Avi and PAR.
Class
B Membership interests of any Class B Member shall be automatically
converted, in whole and not in part, into an equal number of Class
A Membership interests on the earlier to occur of the date on which
LM certifies that all unreturned additional Class A capital
contributions and all unreturned Class A capital contributions have
been reduced to zero.
Any
Class A Member, as defined in the Agreement, may transfer, directly
or indirectly, any or all of its percentage interest as a Member in
the Company to an unaffiliated third party, but the offering member
must first offer the right of first offer (“ROFO”) to
each of the Class A members by written notice specifying the cash
price and the other terms and conditions of the offer. Upon receipt
of the ROFO notice, each of the offeree members has the right,
exercisable in ten (10) days, to accept or decline the
offer.
The
Company shall continue perpetually until dissolution, liquidation
or termination. The liability of the members of the Company is
limited to the members’ total contribution, plus any amounts
guaranteed by the members.
The
terms of the Agreement provide for initial capital contributions
and percentage interests as follows:
|
|
Percentage of O
wnership
|
Initial Capital
C
ontributions
|
|
IRSA
International, LLC
|
49.0
%
|
15,417,925
|
|
Marciano
Investment Group, LLC
|
42.0
%
|
13,215,365
|
|
Lomas
Urbanes S.A.
|
2.27
%
|
714,259
|
|
Avi
Chicouri
|
3.07
%
|
-
|
|
Par
Holdings, LLC
|
3.66
%
|
-
|
|
Total
|
100.00
%
|
29,347,549
|
F-115
NEW LIPSTICK, LLC AND SUBSIDIARY
N
OTES
T
O
C
ONSOLIDATED
F
INANCIAL
S
TATEMENTS
J
UNE
30, 2018
1.
ORGANIZATION AND SUMMARY OF SIGNIFICANT ACCOUNTING POLICIES
(CONTINUED)
Organization (continued)
In
accordance with the Agreement, the members may be required to make
additional capital contributions which are reasonably related to
the operations and/or leasing of the Property and its activities.
For the year ended June 30, 2018, there were no contributions made
by any of the members.
Distributions
of capital will be made to the Members at the times, and in
aggregated amounts determined by the Board of Directors of the
Company. There were no distributions for the year ended June 30,
2018.
The
Company’s profits and losses are allocated to the
members.
Principles of Consolidation
The
consolidated financial statements include the accounts of New
Lipstick, LLC and its wholly owned subsidiary, Metro 885,
collectively referred to as the “Company”. All
significant intercompany balances and transactions have been
eliminated in consolidation.
Basis of Preparation
The
Company prepares its consolidated financial statements on the
accrual basis of accounting in accordance with accounting
principles generally accepted in the United States of America
(“U.S. GAAP”).
Use of Estimates
To
prepare consolidated financial statements in conformity with U.S.
GAAP, management makes estimates and assumptions that affect the
reported amounts of assets and liabilities and disclosure of
contingent assets and liabilities at the date of the consolidated
financial statements and the reported amounts of revenues and
expenses during the reporting period. Actual results could differ
significantly from those estimates.
Cash and Cash Equivalents
The
Company considers highly liquid investments purchased with
maturities of three months or less upon acquisition to be cash
equivalents
Restricted Cash
Restricted
cash represents amounts held in escrow, as required by the lender,
to be used for real estate taxes, insurance, other qualified
expenditures and amounts held for tenant security
deposits.
Concentration of Credit Risk
Financial
instruments which potentially subject the Company to concentrations
of credit risk consist principally of cash deposits in excess of
the Federal Deposit Insurance Corporation insured limit of
$250,000. At times, such balances exceed these insured
limits.
F-116
NEW LIPSTICK, LLC AND SUBSIDIARY
N
OTES
T
O
C
ONSOLIDATED
F
INANCIAL
S
TATEMENTS
J
UNE
30, 2018
1.
ORGANIZATION AND SUMMARY OF SIGNIFICANT ACCOUNTING POLICIES
(CONTINUED)
Risks and Uncertainties
The
Company had one major tenant, Latham and Watkins LLP, during the
year ended June 30, 2018, which represented approximately 71% of
the Company’s base rent before amortization of above and
below market leases (NOTE 9). Economic conditions and instability
in the financial markets could negatively impact this relationship.
The leases with this tenant expire on June 30, 2021. The rental
revenue from the tenant amounted to approximately $30,686,000 for
the year ended. Because of the concentration, any financial
concerns related to this tenant could have a material impact on the
Company’s consolidated operating results. The loss of this
tenant could have a material negative impact on the Company’s
consolidated operations.
Tenant Receivables, Net
The
Company carries its tenant receivables at the amount due pursuant
to lease agreements but uncollected, less an allowance for doubtful
accounts. The Company continuously monitors collections from
tenants and makes a provision for estimated losses based upon
historical experience and any specific tenant collection issues
that the Company has identified. As of June 30, 2018, the
Company’s allowance for doubtful accounts was
approximately
$125,000.
Account balances are charged off against the allowance after all
means of collection have been exhausted and the potential for
recovery is considered remote.
Deferred Rent Receivable
Deferred
rent receivable consists of the straight-line amortization of total
rents provided for in the tenant leases, net of rent collected and
reimbursements due from tenants.
Real Estate, Net
Real
estate, net consists of a building, building improvements and
tenant improvements that are stated at cost. Building and building
improvements are depreciated over 39 years. Tenant improvements are
depreciated over the shorter of the estimated useful life of the
asset or the terms of the respective leases. Assets over $5,000
that are expected to last over one year are capitalized.
Expenditures for major betterments and additions are capitalized to
the real estate accounts, while replacements, maintenance and
repairs, which do not improve or extend the lives of the respective
assets, are charged to expense.
Impairment of Long-Lived Assets and Identifiable
Intangibles
The
Company reviews long lived assets and certain identifiable
intangibles for impairment whenever events or changes in
circumstances indicate that the carrying amount of an asset may not
be recoverable. Recoverability of assets to be held and used is
determined by a comparison of the carrying amount of an asset to
future net undiscounted cash flows expected to be generated by the
assets. If the carrying value of the assets exceeds such cash
flows, the assets are considered impaired. The impairment charge to
be recognized is measured by the amount by which the carrying
amount of the assets exceeds their estimated fair value. There is
no impairment recorded for the year ended June 30,
2018.
Revenue Recognition
The
Company recognizes lease revenue on a straight–line basis
over the terms of the lease agreements. Capitalized below market
base values are accreted as an increase to base rents (NOTE 4).
Capitalized above market base values are amortized as a decrease to
base rents (NOTE 4).
The
Company also receives reimbursements from tenants for certain costs
as provided for in the lease agreements. These costs include real
estate taxes, utilities, insurance, common area maintenance and
other recoverable costs in excess of a base year amount. The
reimbursements are recognized when the tenants are
billed.
Deferred
revenue represents rent collected in advance of being
due.
F-117
NEW LIPSTICK, LLC AND SUBSIDIARY
N
OTES
T
O
C
ONSOLIDATED
F
INANCIAL
S
TATEMENTS
J
UNE
30, 2018
1.
ORGANIZATION AND SUMMARY OF SIGNIFICANT ACCOUNTING POLICIES
(CONTINUED)
Deferred Ground Rent Payable
Ground
rent expense is accounted for on a straight-line basis over the
non-cancelable terms of the ground leases. All future minimum
increases in the non-cancelable ground rents consist of either 2.5%
or 3% annual increases through May 1, 2068. This has resulted in a
deferred ground rent payable in the amount of approximately
$219,422,000
as of June 30, 2018 (NOTE 7).
Lease Intangibles
Leasing
costs and commissions incurred in connection with leasing
activities are capitalized and amortized on straight-line basis
over the lives of the respective leases. Unamortized deferred
leasing costs are charged to amortization expense upon early
termination of the lease.
Above
and below market lease and above market ground lease values were
recorded on the Property’s reorganization date based on the
present value (using an interest rate which reflected the risk
associated with the leases acquired) of the difference between (i)
the contractual amounts to be paid pursuant to the in-place leases
and ground lease, and (ii) management’s estimate of fair
market lease rates for the corresponding in-place leases and ground
leases, measured over a period equal to the remaining
non-cancelable term of the leases.
Above
market lease values are capitalized as an asset and amortized as a
decrease to rental income over the remaining terms of the
respective leases on a straight line basis. Below market leases are
capitalized as a liability and are amortized as in increase to
rental income over the remaining terms of the respective leases on
a straight- line basis.
The
above market ground lease value is capitalized as a liability and
amortized as a decrease in operating expenses over the remaining
terms of the respective leases.
The
aggregate value of in-place leases were measured based on the
differences between (i) the Property valued with existing in-place
leases adjusted to market rental rates, and (ii) the Property
valued as if vacant, based upon management’s estimates.
Factors considered by management in their analysis included an
estimate of carrying costs during the expected lease-up periods
considering current market conditions and costs to execute similar
leases. In estimating carrying costs, management included real
estate taxes, insurance and other operating expenses and estimates
oflost rentals at market rates during the expected lease-up
periods, which primarily were a year. Management also estimated
costs to execute similar leases including leasing commissions,
legal and other related expenses.
The
value of in-place leases are amortized to amortization expense over
the initial term of the respective leases. As of June 30, 2018, the
remaining terms were to be amortized up to seven
years.
Goodwill
Goodwill
represents the excess of the cost of the December 30, 2010
acquisition of Metro 885 over the net of the amounts assigned to
assets acquired, including identifiable intangible assets, and
liabilities assumed. Goodwill is evaluated at least annually, and
more often when events indicate that an impairment exists. The
Company makes a qualitative assessment of whether it is more likely
than not that a reporting unit’s fair value is less than its
carrying value. If it is determined through the qualitative
assessment that a reporting unit’s fair value is more likely
than not greater than its carrying value, the two-step impairment
test would be unnecessary.
In
the two-step approach, the first step identifies potential
impairments by comparing the fair value of a reporting unit with
its book value, including goodwill. If the fair value of the
reporting unit exceeds the carrying amount, goodwill is not
impaired and the second step is not necessary. If the carrying
value exceeds the fair value, the second step calculates the
possible impairment loss by comparing the implied fair value of
goodwill with the carrying amount. If the implied goodwill is less
than the carrying amount, a write-down is recorded. No impairment
of goodwill was recorded for the year ended June 30,
2018.
F-118
NEW LIPSTICK, LLC AND SUBSIDIARY
N
OTES
T
O
C
ONSOLIDATED
F
INANCIAL
S
TATEMENTS
J
UNE
30, 2018
1.
ORGANIZATION AND SUMMARY OF SIGNIFICANT ACCOUNTING POLICIES
(CONTINUED)
Goodwill (Continued)
The
Company has elected not to implement an accounting standards update
which allows entities except public business entities and
not-for-profit entities to apply an accounting alternative for the
subsequent measurement of goodwill. The update permits such
entities to amortize goodwill over 10 years or a shorter period if
appropriate, requires an accounting election in regards to
impairment testing, an also modifies impairment
testing.
Income Taxes
The
Company is treated as a partnership for federal income tax purposes
and, accordingly, generally would not incur income taxes or have
any unrecognized tax benefits. Instead, its earnings and losses are
included in the personal tax returns of the members and taxed
depending on the members’ personal tax situation. As a
result, the consolidated financial statements do not reflect a
provision for federal income taxes. The Company is no longer
subject to U.S. Federal examinations by tax authorities for years
before 2015.
The
Company recognizes and measures tax positions taken or expected to
be taken in its tax return based on their technical merit and
assesses the likelihood that the positions will be sustained upon
examination based on the facts, circumstances and information
available at the end of each period. Interest and penalties on tax
liabilities, if any, would be recorded in interest expense and
other non-interest expense, respectively.
Recent Accounting Pronouncements
Revenue from Contracts with Customers
In
May 2014, the Financial Accounting Standards Board
(“FASB”) issued an accounting standard update which
affects the revenue recognition of entities that enter into either
(1) certain contracts to transfer goods or services to customers or
(2) certain contracts for the transfer of nonfinancial assets. The
update indicates an entity should recognize revenue in an amount
that reflects the consideration the entity expects to be entitled
to in exchange for the goods or services transferred by the entity.
The update is to be applied to the beginning of the year of
implementation or retrospectively and is effective for annual
periods beginning after December 15, 2018 and in interim periods in
annual periods beginning after December 15, 2019. Early application
is permitted, but no earlier than annual reporting periods
beginning after December 15, 2016. The Company is currently
evaluating the effect the update will have on its consolidated
financial statements.
Lease Accounting
In
February 2016, the FASB issued an accounting standard update which
amends existing lease guidance. The update requires lessees to
recognize a right-of-use asset and related lease liability for many
operating leases now currently off-balance sheet under current U.S.
GAAP. The Company is currently evaluating the effect the update
will have on its consolidated financial statements but expects upon
adoption that the update will have a material effect on the
Company’s consolidated financial condition due to the
recognition of a right-of-use asset and related lease liability.
The update is effective using a modified retrospective approach for
fiscal years beginning after December 15, 2019, and for interim
periods within fiscal years beginning after December 15, 2020, with
early application permitted.
Restricted Cash
In
November 2016, the FASB issued an accounting standards update which
amends cash flow statement presentation of restricted cash. The
update requires amounts generally described as restricted cash and
restricted cash equivalents be included with cash and cash
equivalents when reconciling the beginning-of-period and end-
of-period total amounts shown on the statement of cash flows. The
update is effective retrospectively for fiscal years beginning
after December 15, 2018, and interim periods within fiscal years
beginning after December 15, 2019, with early adoption permitted.
The Company is currently evaluating the effect the update will have
on its consolidated financial statements.
F-119
NEW LIPSTICK, LLC AND SUBSIDIARY
N
OTES
T
O
C
ONSOLIDATED
F
INANCIAL
S
TATEMENTS
J
UNE
30, 2018
1. ORGANIZATION AND SUMMARY OF SIGNIFICANT ACCOUNTING POLICIES
(CONTINUED)
Recent Accounting Pronouncements (continued)
Simplifying the Test for Goodwill Impairment
In
January 2017, the FASB issued an accounting standards update to
simplify the accounting for goodwill impairment. The update removes
Step 2 of the goodwill impairment test, which requires a
hypothetical purchase price allocation. The update specifies that a
goodwill impairment charge will now be recognized for the amount by
which the carrying value of a reporting unit exceeds its fair
value, not to exceed the carrying amount of goodwill. The update is
effective for fiscal years beginning after December 15, 2019, and
interim periods within those fiscal years, with early adoption
permitted for any impairment tests performed after January 1, 2017.
The Company is currently evaluating the effect the update will have
on its consolidated financial statements.
Subsequent Events
The
Company has evaluated subsequent events through Septmeber 4, 2018,
which is the date the consolidated financial statements were
available to be issued.
2. RELATED PARTY TRANSACTIONS
Guaranty of Management Fee
On
April 20, 2011, LM entered into an agreement with the
Company’s lender which provides that the Company would be
directly responsible for certain fees that are payable to Herald
Square Properties, LLC (“HSP”). HSP is a 49% owner in
LM. The Company and LM are affiliated by a common 49% owner. These
fees are based on a consulting agreement between LM and HSP. On
December 1, 2015, the parties agreed to extend the agreement for an
additional year for a fee of $37,000 per month. The parties have
the right to terminate this agreement at any time upon (30 days
written notice served to the other party. The total management fees
in the accompanying consolidated statement of operations, amounted
to approximately $444,000, of which approximately $37,000 is unpaid
as of June 30, 2018.
Property Management Agreement
On
May 3, 2011, the Company entered into an asset management agreement
with LM. The Company is charged an asset management fee of 1.0% of
its gross revenues not to exceed $400,000 per year. Asset
management fees incurred by the Company to LM amounted to
approximately $413,000 for the year ended June 30, 2018, of which
approximately $203,000 is unpaid at June 30, 2018. Asset management
fees are included in management fees in the accompanying
consolidated statement of operations.
Operating Lease
Effective
August 1, 2011, LM leased office space from the Company. The term
of the agreement runs through November 30, 2026. The total amount
of rental income earned for the year ended June 30, 2018 amounted
to approximately $204,000.
At
June 30, 2018 the Company is owed the following balances from the
following related parties for expenses paid on their
behalf.
|
Due
from related party:
|
|
|
Lipstick
Management, LLC
|
$
120.274
|
|
|
|
Additionally,
at June 30,2018, the amounts listed below represent expenses paid
by the Company on behalf of related companies, which will be
reimbursed by related companies.
|
Due to
related parties:
|
|
|
IRSA
Inversiones y Representaciones
|
|
|
Sociedad
Anonima
|
$
240.874
|
F-120
NEW LIPSTICK, LLC AND SUBSIDIARY
N
OTES
T
O
C
ONSOLIDATED
F
INANCIAL
S
TATEMENTS
J
UNE
30, 2018
3. REAL ESTATE, NET
Real
estate, net consists of the following at June 30,
2018:
|
Building and
improvements
|
$
146,459,333
|
|
Tenant
improvements
|
20,020,223
|
|
|
166,479,556
|
|
|
|
|
Less: accumulated
depreciation and amortization
|
(38,413,835
)
|
|
|
|
|
|
$
128,065,721
|
Depreciation
and amortization expense for the year ended June 30, 2018 was
approximately $5,745,000.
4. LEASE INTANGIBLES, NET
Lease
intangibles, net and the value of assumed lease obligations at June
30, 2018 are as follows:
|
|
Leases
In-place
|
Leasing
Costs
|
Above
Market Leases
|
Total
|
Below
Market Leases
|
Above
Market Ground Leases
|
Total
|
|
Cost
|
$
26,496,905
|
$
5,780,984
|
$
14,777,318
|
$
47,055,207
|
$
26,361,027
|
$
29,041,332
|
$
55,402,359
|
|
|
|
|
|
|
|
|
|
|
Less: accumulated
amortization
|
(19,001,350
)
|
(2,377,384
)
|
(10,555,291
)
|
(31,934,025
)
|
(18,377,428
)
|
(3,283,567
)
|
$
(21,660,995
)
|
|
|
$
7,495,555
|
$
3,403,600
|
$
4,222,027
|
$
15,121,182
|
$
7,983,599
|
$
25,757,765
|
$
33,741,364
|
The
aggregated amortization of leases in-place included in amortization
expense for the year ended June 30, 2018 was approximately
$2,484,000.
The
aggregated amortization of leasing costs included in amortization
expense for the year ended June 30, 2018 was approximately
$596,000.
The
aggregated amortization of above market ground leases included as a
reduction of base rental income for the year ended June 30, 2018,
was $1,407,000.
The
aggregated amortization of above market ground leases included as a
reduction of base rental income for the year ended June 30, 2018
was approximately $438,000.
The
aggregate amortization of below market leases included in base
rental income for the year ended June 30, 2018 was approximately
$2,388,000.
The
amortization of lease intangibles for each of the five years
subsequent to June 30, 2018, and thereafter are as
follows:
|
|
Leases
In-place
|
Leasing
Costs
|
Above
Market Leases
|
Total
|
Below
Market Leases
|
Above
Market Ground Leases
|
Total
|
|
|
|
|
|
|
|
|
|
|
2019
|
$
2,464,461
|
$
624,219
|
$
1,407,364
|
$
4,496,044
|
$
2,363,408
|
$
437,809
|
$
2,801,217
|
|
2020
|
2,462,742
|
495,027
|
1,407,364
|
4,365,133
|
2,356,387
|
437,809
|
2,794,196
|
|
2021
|
2,454,143
|
453,528
|
1,407,299
|
4,314,970
|
2,321,281
|
437,809
|
2,759,090
|
|
2022
|
31,148
|
408,831
|
-
|
439,979
|
257,052
|
437,809
|
694,861
|
|
2023
|
31,148
|
404,924
|
-
|
436,072
|
257,052
|
437,809
|
694,861
|
|
Thereafter
|
51,913
|
1,017,071
|
-
|
1.068,984
|
428,419
|
23,568,720
|
23,997,139
|
|
Totals
|
$
7,495,555
|
$
3,403,600
|
$
4,222,027
|
$
15,121,182
|
$
7,983,599
|
$
25,757,765
|
$
33,741,364
|
F-121
NEW LIPSTICK, LLC AND SUBSIDIARY
N
OTES
T
O
C
ONSOLIDATED
F
INANCIAL
S
TATEMENTS
J
UNE
30, 2018
5. NOTE PAYABLE
On
December 30, 2010, the Metro 885’s existing note agreements
with Royal Bank of Canada (the “Lender”) were amended
and restated. The outstanding balance of the amended note was
$115,000,000. The amended note bore interest at (i) the London
Interbank Offers Rate (“LIBOR”) plus 400 basis points,
or (ii) Prime Rate plus Prime rate Margin, if converted into a
prime Rate Loan. The amended note provided for a maximum interest
rate of 5.25% through February 29, 2012, and 6.25% from March 1,
2012 through August 31, 2015, and matured on August 1,
2017.
On September 15, 2017, the Company amended its
existing note agreement with the Lender. Upon entering into the
amendment, the Company paid down $40,000,000 through two
prepayments. The first prepayment of $20,000,000 occurred in
September 2017, bringing the total principal down from
approximately $113,100,000 outstanding on the note to approximately
$93,100,000 as of September 30, 2017. The second prepayment of
$20,000,000 occurred on October 15, 2017 and the Lender forgave
$20,000,000 of principal bringing the total principal down to
$53,100,000. The note bears interest at LIBOR plus 200 basis points
(4.09% at June 30, 2018). The note matures on April 30, 2020. There
were total principal payments in the amount of approximately
$42,651,000 for the year ended June 30, 2018. The balance
outstanding on the note payable including accrued interest was
approximately $50,774
,
482 as of June 30, 2018.
.
Pursuant
to a cash management agreement with the Lender, all rents collected
are required to be deposited in a clearing account and all funds
are disbursed in accordance with the loan agreement, including the
funding of all reserve accounts. In addition, after payment of debt
service operating expenses and other expenses, $250,000 of the
remaining cash flow in the cash management account is applied to
the outstanding principal balance of the loan on a monthly basis.
The note is collateralized by the property including all related
facilities, amenities, fixtures, and personal property owned by the
Company. As a result of the new loan agreement the Company
covenants and agrees that on February 1, 2019 or sooner the Company
will exercise the purchase option on the ground lease.
6. NOTES PAYABLE TO MEMBERS´
On
August 15, 2017, the Company entered into a note payable with two
Members’, IRSA International, LLC and Marciano Investment
Group, LLC. The note payable is in the amount of $40,000,000,
matures on August 15, 2019 and bears interest rate al LIBOR plus
200 basis points (4.09% at June 30, 2018). Interest expense related
to these notes was approximately $1,133,000 for the year ended June
30,2018. There were no principal payments during the year ended
June 30, 2018.
As
of June 30, 2018, the balance of the note including accrued
interest amounted to approximately $41,133,000. Proceeds were
contributed to the Company’s wholly owned subsidiary. The
subsidiary recorded monies received as capital contribution and
used the money to paydown the note payable with the bank (NOTE
5).
7. GROUND LEASES
The
property was erected on a 26,135 square foot parcel of land (the
“Site Area”), of which 20,635 square feet is subject to
a ground lease (the “Ground Lease”), and an adjacent
lot containing approximately 5,500 square feet (“Lot
A”), subject to a separate ground sub-sublease (the
“Ground Sub-sublease”).
The
Ground Lease matures on the earlier of (i) April 30, 2077, (ii) the
date of termination of the Ground Sub- sublease term or (iii) a
date if sooner terminated. The Ground Lease provides for monthly
ground rent of approximately $925,000 through April 30, 2012,
$1,321,000 through April 30, 2013 and provides for annual increases
of 2.5% beginning on May 1, 2013 through April 30,
2020.
On
May 1, 2020, May 1, 2038, and every ten years thereafter through
May 1, 2068 (“Adjustment Years”), ground rent shall be
adjusted to be the greater of (a) 1.03 times the base rent payable
during the lease year immediately preceding the said Adjustment
Year or (b) 7%of the fair market value of the land. Monthly ground
rent shall increase 3% annually for each year subsequent to the
Adjustment year.
F-122
NEW LIPSTICK, LLC AND SUBSIDIARY
N
OTES
T
O
C
ONSOLIDATED
F
INANCIAL
S
TATEMENTS
J
UNE
30, 2018
7. GROUND LEASES (CONTINUED)
The
Ground Sub-sublease is subject to a ground sublease and a prime
lease. The ground sublease expires on April 30, 2077, (the Prime
lease). The Ground Sub-sublease matures on the earlier of (i) April
30, 2077, (ii) the expiration or earlier termination of the Prime
Lease or (iii) the expiration or earlier termination date of the
Ground Sublease or the sub landlord as subtenant under the Prime
Lease provided that the lessees are not in default under the Ground
Sub-sublease or the Ground Sublease.
The
Ground Sub-sublease provides for monthly ground rent of $58,000
through April 30, 2010, and approximately
$63,000
beginning on May 1, 2010 through April 30, 2020. On May 1, 2020,
May 1, 2040 and May 1, 2060, ground rent shall be adjusted to 8% of
the fair market value of Lot A, as defined.
For
the Year ended June 30, 2018, Ground Lease and Ground Sub-sublease
expense amounted to approximately
$45,137,000
and $759,000, respectively, after giving effect to straight-line
rent adjustments of approximately
$27,129,000
and $0, respectively.
The
Ground lease also provides the Company with an option to purchase
the land (the “Purchase Option”). The Purchase Option
is exercisable on April 30, 2020, April 30, 2037 and on the last
day of every tenth year thereafter (the “Purchase
Date”). Due to the amendment of the note with the Lender on
September 15, 2017 (NOTE 5), the Company covenants and agrees that
on February 1, 2009 or sooner the Company will exercise the
purchase option on the ground lease.
The
Purchase price as defined in the Ground Lease, shall be the amount
which together with all ground rent paid by the Company on or
before the applicable Purchase Date, yields an internal rate of
return (“IRR”) that equals the Target IRR in respect to
the applicable Purchase date as follows:
|
Purchase
Date
|
Target
IRR
|
|
April 30,
2020
|
7.47
%
|
|
April 30,
2037
|
7.67
%
|
|
April 30,
2047
|
7.92
%
|
|
April 30,
2057
|
8.17
%
|
|
April 30,
2067
|
8.42
%
|
|
April 30,
2077
|
8.67
%
|
In
the event the Purchase Option is exercised on April 30, 2020, the
Company shall pay a purchase price of approximately $521 million,
which is based upon anagreed land value of $317 million in July
2007, when applying a Target IRR of 7.47%. The Ground Lease also
provides for an option to demolish the property (“Demolition
Period”). The Ground Lease lessor has the option to cause the
Company to purchase the Property (“Put Option”) at a
then put price, as defined. The Put Option is exercisable during
the period subsequent to the Demolition Option and prior to April
30, 2072.
Approximate
future minimum annual ground rents due before giving effect to the
fair market value adjustments which are not determinable at the
present time are as follows for the five years subsequent to June
30, 2018 and thereafter:
|
|
Ground
Lease
|
Ground
Sublease
|
Total
|
|
|
|
|
|
|
2019
|
$
18,458,000
|
$
759,000
|
$
19,217,000
|
|
2020
|
18,935,000
|
759,000
|
19,694,000
|
|
2021
|
19,503,000
|
63,000
|
19,566,000
|
|
2022
|
20,088,000
|
-
|
20,088,000
|
|
2023
|
20,691,000
|
-
|
2,.691,000
|
|
Total
|
$
97,675,000
|
$
1,581,000
|
$
99,356,000
|
F-123
NEW LIPSTICK, LLC AND SUBSIDIARY
N
OTES
T
O
C
ONSOLIDATED
F
INANCIAL
S
TATEMENTS
J
UNE
30, 2018
8. TENANT LEASES
The
Company leases space in the Property to tenants under long-term
non-cancelable operating leases. The leases vary from small offices
to entire floors. The leases have terms that expire at various
dates through July 2029. Many of the leases entered into are for a
period between two to ten years. At June 30, 2018, the Property was
approximately 95% leased.
Approximate
future minimum annual base rents due from non-cancelable operating
leases in each of the five years subsequent to June 30, 2018 and
thereafter are as follows:
|
2019
|
$
43,648,891
|
|
2020
|
42,877,505
|
|
2021
|
41,078,448
|
|
2022
|
10,408,470
|
|
2023
|
10,521,693
|
|
Thereafter
|
21,173,616
|
|
|
|
|
Total
|
$
169,708,623
|
|
|
|
9.
CONCENTRATION OF TENANTS
The
Company had one major tenant, Latham and Watkins LLP, for the year
ended June 30 2018, which represented approximately 71% of the
Company’s base rent before amortization of above and below
market leases. The leases with Latham and Watkins LLP, expire on
June 30, 2021.
Approximate future minimum annual base rents due
from non-cancelable operating leases with this tenant in each of
the years subsequent to
June 30, 2018
and thereafter are as follows:
|
2019
|
$
30,952,000
|
|
2020
|
31,164,000
|
|
2021
|
31,164,000
|
|
Total
|
$
93,280,000
|
10.
COMMITMENTS AND CONTINGENCIES
Litigation
The
Company, from time to time, is involved in litigation arising
during the ordinary course of business. Based on currently
available information, management believes that the resolution of
any potential claims will not have a material adverse effect on the
Company’s consolidated operating results or financial
position.
F-124
SUPPLEMENTAL
INFORMATION
F-125
NEW LIPSTICK, LLC AND SUBSIDIARY
C
ONSOLIDATING
B
ALANCE
S
HEET
J
UNE
30, 2018
|
ASSETS
|
Metro
885
|
New
Lipstick
|
Consolidating
Entries
|
Totals
|
|
|
|
|
|
|
|
Real estate,
net
|
$
128,065,721
|
$
-
|
$
-
|
128,065,721
|
|
Cash and cash
equivalents
|
1,600,604
|
133,916
|
-
|
1,734,520
|
|
Restricted
cash
|
3,976,627
|
-
|
-
|
3,976,627
|
|
Investment in Metro
885
|
-
|
(142,553,616
)
|
142,553,616
|
0
|
|
Tenant receivables,
net
|
364,544
|
-
|
-
|
364,544
|
|
Prepaid expenses
and other assets
|
6,643,447
|
-
|
-
|
6,643,447
|
|
Due from related
party
|
-
|
120,274
|
-
|
120,274
|
|
Deferred rent
receivable
|
9,482,209
|
-
|
-
|
9,482,209
|
|
Goodwill
|
-
|
5,422,615
|
-
|
5,422,615
|
|
Lease intangibles,
net
|
15,121,182
|
-
|
-
|
15,121,182
|
|
|
|
|
|
|
|
TOTAL
ASSETS
|
$
165,254,334
|
$
(136,876,811
)
|
$
142,553,616
|
$
170,931,139
|
|
|
|
|
|
|
|
LIABILITIES
AND MEMBERS' DEFICIT
|
|
|
|
|
|
|
|
|
|
|
|
|
|
|
|
|
|
Accounts payable
and accrued expenses
|
$
2,624,221
|
$
15,000
|
$
-
|
2,639,221
|
|
Notes payable to
related parties
|
-
|
41,132,971
|
-
|
41,132,971
|
|
Note
payable
|
50,774,482
|
-
|
-
|
50,774,482
|
|
Deferred ground
rent payable
|
219,421,593
|
-
|
-
|
219,421,593
|
|
Due to related
parties
|
-
|
240,874
|
-
|
240,874
|
|
Tenant security
deposits
|
924,856
|
-
|
-
|
924,856
|
|
Deferred
revenue
|
321,434
|
-
|
-
|
321,434
|
|
Lease intangibles,
net
|
33,741,364
|
-
|
-
|
33,741,364
|
|
|
|
|
|
|
|
TOTAL
LIABILITIES
|
307,807,950
|
41,388,845
|
-
|
349,196,795
|
|
|
|
|
|
|
|
MEMBERS'
DEFICIT
|
(142,553,616
)
|
(178,265,656
)
|
142,553,616
|
(178,265,656
)
|
|
|
|
|
|
|
|
TOTAL
LIABILITIES AND MEMBERS' DEFICIT
|
$
165,254,334
|
$
(136,876,811
)
|
$
142,553,616
|
$
170,931,139
|
F-126
NEW LIPSTICK, LLC AND SUBSIDIARY
C
ONSOLIDATING
S
TATEMENT OF
O
PERATIONS
F
OR
T
HE
Y
EAR
E
NDED
J
UNE
30, 2018
|
|
Metro
885
|
New
Lipstick
|
Consolidating
Entries
|
Totals
|
|
|
|
|
|
|
|
REVENUES:
|
|
|
|
|
|
Base rents,
net
|
$
42,640,302
|
$
-
|
$
-
|
$
42,640,302
|
|
Tenant
reimbursements
|
$
7,672,918
|
|
|
$
7,672,918
|
|
Other rental
revenue
|
50,029
|
-
|
-
|
50,029
|
|
Investment
loss
|
-
|
(9,787603
)
|
(9,787,603
)
|
-
|
|
|
|
|
|
|
|
TOTAL
REVENUES
|
50,363,249
|
(9,787,603
)
|
(9,787,603
)
|
50,363,249
|
|
|
|
|
|
|
|
EXPENSES:
|
|
|
|
|
|
Real estate
taxes
|
11,620,716
|
-
|
-
|
11,620,716
|
|
Utilities
|
2,378,347
|
3,142
|
-
|
2,381,489
|
|
Janitorial
|
1,776,052
|
-
|
-
|
1,776,052
|
|
Insurance
|
325,138
|
-
|
-
|
325,138
|
|
Repairs and
maintenance
|
1,712,889
|
-
|
-
|
1,712,889
|
|
Security
|
1,014,923
|
-
|
-
|
1,014,923
|
|
Bad
debt
|
30,593
|
-
|
-
|
30,593
|
|
General and
administrative
|
2,612,871
|
214,445
|
-
|
2,827,316
|
|
Management
fees
|
1,130,602
|
-
|
-
|
1,130,602
|
|
Elevator
|
302,620
|
-
|
-
|
302,620
|
|
HVAC
|
80,215
|
-
|
-
|
80,215
|
|
Ground
rent
|
45,457,736
|
-
|
-
|
45,457,736
|
|
Interest
expense
|
2,882,810
|
1,132,971
|
-
|
4,015,781
|
|
Depreciation and
amortization
|
5,745,481
|
-
|
-
|
5,745,481
|
|
Amortization of
lease intangibles
|
3,079,859
|
-
|
-
|
3,079,859
|
|
|
|
|
|
|
|
TOTAL
EXPENSES
|
80,150,852
|
1,350,558
|
-
|
81,501,410
|
|
OTHER
INCOME
|
|
|
|
|
|
Gain on debt
forgiveness
|
20,000,000
|
|
|
20,000,000
|
|
|
|
|
|
|
|
NET
LOSS
|
$
(9,787,603
)
|
$
(11,138,161
)
|
$
(9,787,603
)
|
$
(11,138,161
)
|
F-127
INDEX TO THE FINANCIAL STATEMENTS
|
Consolidated Financial Statements as of December 31, 2017 and
2016 and for the years ended December 31, 2017, 2016 and
2015
|
|
|
Report
of the Independent Registered Public Accounting
Firm
|
F-129
|
|
Consolidated
balance sheet as of December 31, 2017 and
2016
|
F-130
|
|
Consolidated
statement of income for the years ended December 31, 2017,
2016 and 2015
|
F-130
|
|
Consolidated
statement of changes in shareholders’ equity for the years
ended December 31, 2017, 2016 and 2015
|
F-131
|
|
Consolidated
statement of cash flows for the years ended December 31, 2017,
2016 and 2015
|
F-132
|
|
Notes
to the Consolidated Financial Statements
|
F-133
|
F-128
Report of Independent Registered Public Accounting
Firm
To the
Board of Directors and Shareholders of
Banco
Hipotecario S.A.
Opinion on the Financial Statements
We have audited the accompanying consolidated balance sheets of
Banco Hipotecario S.A. and its subsidiaries ( the
“Bank”) as of December 31, 2017 and 2016, and the
related consolidated statements of income, shareholders´
equity and cash flows for each of the three years in the period
ended December 31, 2017, including the related notes (collectively
referred to as the “financial statements”). In our
opinion, the financial statements present fairly, in all material
respects, the financial position of the Bank as of December 31,
2017 and 2016, and the results of its operations and its cash flows
for each of the three years in the period ended December 31, 2017
in conformity with the accounting rules prescribed by the Banco
Central de la República Argentina (the "BCRA").
Basis for Opinion
These consolidated financial statements are the responsibility of
the Bank’s management. Our responsibility is to express an
opinion on the Bank´s consolidated financial statements based
on our audits. We are a public accounting firm registered with the
Public Company Accounting Oversight Board (United States)
(“PCAOB”) and are required to be independent with
respect to the Company in accordance with the U.S. federal
securities laws and the applicable rules and regulations of the
Securities and Exchange Commission and the PCAOB.
We conducted our audits of these consolidated financial statements
in accordance with the standards of the PCAOB. Those standards
require that we plan and perform the audit to obtain reasonable
assurance about whether the consolidated financial statements are
free of material misstatement, whether due to error or
fraud.
Our audits included performing procedures to assess the risks of
material misstatement of the consolidated financial statements,
whether due to error or fraud, and performing procedures that
respond to those risks. Such procedures included examining, on a
test basis, evidence regarding the amounts and disclosures in the
consolidated financial statements. Our audits also included
evaluating the accounting principles used and significant estimates
made by management, as well as evaluating the overall presentation
of the consolidated financial statements. We believe that our
audits provide a reasonable basis for our opinion.
Emphasis of Matter
Accounting rules prescribed by the BCRA vary in certain significant
respects from accounting principles generally accepted in the
United States of America. Information relating to the nature and
effect of such differences is presented in Note 32 to the
consolidated financial statements.
|
/s/
PRICE WATERHOUSE & Co. S.R.L.
|
|
|
|
|
|
/s/
Diego Luis Sisto
|
|
|
DIEGO
LUIS SISTO (Partner)
|
|
Buenos
Aires, Argentina
August 7,
2018
We have
served as the Bank’s auditor since 1992.
F-129
BANCO HIPOTECARIO S.A. AND SUBSIDIARIES
As of December 31, 2017 and 2016
(Expressed in thousands of Argentine pesos, except share data and
as otherwise indicated)
|
|
|
December 31,
|
||
|
|
|
2017
|
|
2016
|
|
ASSETS
|
|
|
|
|
|
|
|
|
|
|
|
Cash
and due from Banks
|
Ps.
|
|
Ps.
|
|
|
Cash
|
|
933,666
|
|
756,704
|
|
Due
from financial Institutions and Correspondent
|
|
|
|
|
|
Argentine
Central Bank (“BCRA”)
|
|
2,421,833
|
|
5,355,489
|
|
Other
Local Financial Institutions
|
|
34,822
|
|
15,181
|
|
Other
Foreign Institutions
|
|
256,215
|
|
1,060,905
|
|
|
3,646,536
|
|
7,188,279
|
|
|
|
|
|
|
|
|
Government
and corporate securities (Note 4)
|
|
|
|
|
|
Holdings
recorded at fair value
|
Ps.
|
2,635,210
|
|
2,522,425
|
|
Holdings
recorded at amortized cost
|
|
422,047
|
|
1,017,085
|
|
Investments
in listed corporate securities
|
|
613,43
|
|
352,854
|
|
Instruments
issued by the BCRA
|
|
11,155,076
|
|
1,116,910
|
|
Allowances
|
|
(11,662
)
|
|
(11,662
)
|
|
|
14,814,101
|
|
4,997,612
|
|
|
|
|
|
|
|
|
Loans
(Note 5)
|
|
|
|
|
|
To
the non-financial public sector
|
Ps.
|
89,573
|
|
153,032
|
|
To
the financial sector
|
|
|
|
|
|
Interfinancial
(granted calls)
|
|
-
|
|
50
|
|
Other
loans to local financial institution
|
|
423,428
|
|
555,726
|
|
Accrued
interest, adjustments and foreign exchange and quoted price
differences receivable
|
|
|
|
|
|
|
32,851
|
|
31,224
|
|
|
To
the non-financial private sector and foreign residents
|
|
|
|
|
|
Overdraft
|
|
1,221,539
|
|
290,153
|
|
Promissory
notes
|
|
846,372
|
|
687,965
|
|
Mortgage
loans
|
|
3,404,877
|
|
2,744,734
|
|
Pledge
loans
|
|
271,701
|
|
640,365
|
|
Personal
Loans
|
|
6,842,584
|
|
4,611,052
|
|
Credit
Cards
|
|
15,039,798
|
|
12,663,403
|
|
Unallocated
collections
|
|
(5,871
)
|
|
(1,166
)
|
|
Other
Loans
|
|
8,209,408
|
|
5,166,467
|
|
Accrued
interest and quotation differences receivable
|
|
350,968
|
|
293,006
|
|
Documented
interest or unearned discount
|
|
(68,621
)
|
|
(45,878
)
|
|
Allowance
for loan losses (Note 6)
|
|
(1,201,958
)
|
|
(676,141
)
|
|
|
35,456,649
|
|
27,163,942
|
|
|
|
|
|
|
|
|
Other
receivables from financial intermediation (Note 7)
|
|
|
|
|
|
BCRA
|
|
577,111
|
|
691,913
|
|
Amounts
receivables for spot and forward sales to be settled
|
|
448,439
|
|
1,368,657
|
|
Securities
receivable under spot and forward purchases to be
settled
|
|
|
|
|
|
|
1,909,585
|
|
2,503,986
|
|
|
Unlisted
corporate securities
|
|
286,298
|
|
322,118
|
|
Balances
from forward transactions without delivery of
principal
|
|
46,217
|
|
169,717
|
|
Others
not included in the debtor classification regulation
|
|
3,262,914
|
|
4,097,312
|
|
Others
included in the debtor classification regulation
|
|
53,793
|
|
115,509
|
|
Accrued
interest receivable included in the debtor classification
regulation
|
|
|
|
|
|
|
6,148
|
|
7,110
|
|
|
Allowances
|
|
(15,616
)
|
|
(14,190
)
|
|
|
6,574,889
|
|
9,262,132
|
|
|
|
|
|
|
|
|
Receivables
from financials leases
|
|
|
|
|
|
Receivables
for financials leases
|
|
159,904
|
|
155,775
|
|
Accrued
interest and adjustments receivable
|
|
2,974
|
|
3,087
|
|
Allowances
|
|
(1,559
)
|
|
(1,453
)
|
|
|
161,319
|
|
157,409
|
|
|
Unlisted
equity Investments
|
|
|
|
|
|
Other
(Note 2.7)
|
|
42,032
|
|
101,020
|
|
|
42,032
|
|
101,020
|
|
|
Miscellaneous
receivables
|
|
|
|
|
|
Minimum
notional income tax – fiscal credit
|
|
167,01
|
|
97,447
|
|
Other
(Note 8)
|
|
2,006,801
|
|
1,886,759
|
|
Other
accrued interest receivable
|
|
2,785
|
|
787
|
|
Allowances
|
|
(10,108
)
|
|
(10,811
)
|
|
|
2,166,488
|
|
1,974,182
|
|
|
|
|
|
|
|
|
Bank
premises and equipment (Note 9) )
|
|
415,22
|
|
390,228
|
|
|
|
|
|
|
|
Miscellaneous
assets (Note 10)
|
|
1,439,155
|
|
296,068
|
|
|
|
|
|
|
|
Intangible
assets (Note 11)
|
|
|
|
|
|
Goodwill
|
|
9,934
|
|
13,363
|
|
Organization
and development costs
|
|
529,235
|
|
554,001
|
|
|
539,169
|
|
567,364
|
|
|
|
|
|
|
|
|
Items
pending allocation
|
|
11,999
|
|
9,874
|
|
|
|
|
|
|
|
Total Assets
|
Ps.
|
65,267,557
|
Ps.
|
52,108,110
|
The accompanying notes are an integral part of these consolidated
financial statements.
BANCO HIPOTECARIO S.A. AND SUBSIDIARIES
CONSOLIDATED BALANCE SHEET – (Continued)
As of December 31, 2017 and 2016
(Expressed in thousands of Argentine pesos, except share data and
as otherwise indicated)
|
|
December 31
|
|
|
|
2017
|
2016
|
|
|
|
|
|
LIABILITIES AND SHAREHOLDERS' EQUITY
|
|
|
|
LIABILITIES
|
|
|
|
Deposits
|
|
|
|
Non-financial
public sector
|
Ps.
2,399,321
|
Ps.
2,536,836
|
|
Financial
sector
|
6,408
|
6,394
|
|
Non-financial
private sector
|
|
|
|
Current
accounts
|
2,180,789
|
881,421
|
|
Savings
accounts
|
4,996,115
|
3,329,855
|
|
Time
deposits
|
10,261,134
|
10,613,088
|
|
Investment
accounts
|
471,464
|
1,013,895
|
|
Other
|
291,384
|
318,055
|
|
Accrued
interest foreign exchange and quoted price difference
|
201,766
|
285,448
|
|
|
20,808,381
|
18,984,992
|
|
|
|
|
|
Other
liabilities from financial intermediation
|
|
|
|
BCRA-
Other
|
102
|
56
|
|
Non-subordinated
corporate bonds (Note 15)
|
25,668,775
|
16,018,680
|
|
Amounts
payable for spot and forward purchases to be settled
|
1,764,787
|
2,295,724
|
|
Securities
and foreign currency to be delivered under spot and forward sales
to be settled
|
|
|
|
|
449,823
|
1,422,674
|
|
Financing
received from local financial institutions (Note 14)
|
|
|
|
Interfinancing
loans (received calls)
|
160
|
265
|
|
Other
financing from local financial institutions
|
329,992
|
434,475
|
|
Accrued
interest payable
|
6,063
|
7,993
|
|
Balances
from forward transactions without delivery of underlying
asset
|
65,756
|
187,108
|
|
Other
(Note 13)
|
4,030,441
|
2,931,778
|
|
Accrued
interest adjustment, foreign exchange and quoted price differences
payable and quotation payable
|
925,241
|
623,85
|
|
|
33,400,980
|
24,187,338
|
|
|
|
|
|
Miscellaneous
liabilities
|
|
|
|
Directors’
and statutory auditors’ fees
|
110,684
|
55,27
|
|
Other
(Note 20)
|
2,517,673
|
2,154,603
|
|
Adjustments
and interest payable
|
9,315
|
10,32
|
|
|
2,637,672
|
2,220,193
|
|
|
|
|
|
Provisions
(Note 12)
|
434,53
|
325,847
|
|
|
|
|
|
Subordinated
corporate bonds (Note 16) )
|
-
|
136,838
|
|
|
|
|
|
Items
pending allocation
|
54,03
|
38,963
|
|
|
|
|
|
Non-controlling
interest
|
282,293
|
157,707
|
|
|
|
|
|
Total Liabilities
|
57,617,886
|
46,051,878
|
|
Total Shareholders' Equity
|
7,649,671
|
6,056,232
|
|
Total Liabilities and Shareholders' Equity Ps.
|
Ps.
65,267,557
|
Ps.
52,108,110
|
The accompanying notes are an integral part of these consolidated
financial statements.
BANCO HIPOTECARIO S.A. AND SUBSIDIARIES
CONSOLIDATED STATEMENT OF INCOME
For the years ended December 31, 2017, 2016 and 2015
(Expressed in thousands of Argentine pesos, except share data and
as otherwise indicated)
|
|
December 31,
|
||
|
|
2017
|
2016
|
2015
|
|
Financial
income
|
|
|
|
|
Interest
on cash and due from banks
|
Ps.
Ps. 412
|
Ps.
15,314
|
Ps.
3,675
|
|
Interest on loans to financial
sector
.
|
105,052
|
100,777
|
53,373
|
|
Interest
on overdraft
|
155,007
|
209,905
|
243,929
|
|
Interest
on promissory notes
|
186,510
|
129,614
|
95,721
|
|
Interest
on mortgage loans
|
515,204
|
490,490
|
433,639
|
|
Interest
on pledge loans
|
44,663
|
154,632
|
131,265
|
|
Interest
on credit card loans
|
4,194,612
|
3,477,649
|
2,153,739
|
|
Interest
on financial leases
|
38,336
|
33,379
|
27,991
|
|
Interest
on other loans (Note 21)
|
3,267,219
|
2,320,980
|
1,903,082
|
|
Interest
on other receivables from financial intermediation
|
17,778
|
20,463
|
22,775
|
|
Net
income from government and corporate securities
|
2,677,581
|
2,178,541
|
1,764,289
|
|
CER
and CVS adjustments (Note 2.2)
|
-
|
7,459
|
9,633
|
|
Other
(Note 21)
|
391,146
|
238,755
|
403,501
|
|
|
11,593,520
|
9,377,958
|
7,246,612
|
|
Financial
expenses
|
|
|
|
|
Interest
on current account
|
122,156
|
-
|
-
|
|
Interest
on savings account
|
4,953
|
3,250
|
2,981
|
|
Interest on time deposits
.
|
2,001,226
|
2,992,719
|
2,110,592
|
|
Interest
on interfinancing loans received
|
22,884
|
37,117
|
16,636
|
|
Interest
on other financing from financial institutions
|
93,377
|
138,380
|
76,807
|
|
Interest
on other liabilities from financial intermediation
|
3,406,855
|
1,873,798
|
942,859
|
|
Interest
on subordinated corporate bonds
|
4,321
|
26,216
|
10,622
|
|
Other
interest
|
111,990
|
337,545
|
188,906
|
|
Gold
and foreign currency quotation difference
|
95,557
|
276,830
|
198,116
|
|
CER
and CVS adjustments (Note 2.2)
|
60,949
|
-
|
-
|
|
Contribution
to the deposits guarantee fund
|
33,950
|
60,474
|
122,825
|
|
Other
(Note 21)
|
1,164,719
|
812,249
|
541,787
|
|
|
7,122,937
|
6,558,578
|
4,212,131
|
|
|
|
|
|
|
Gross
intermediation margin
|
Ps.
4,470,583
|
Ps.
2,819,380
|
Ps.
3,034,481
|
|
|
|
|
|
|
Provision
for loan losses (Note 6)
|
910,881
|
466,365
|
354,179
|
|
Income
from services
|
|
|
|
|
Lending
transactions
|
3,361,302
|
2,140,797
|
1,245,974
|
|
Deposits
liability
|
251,760
|
174,411
|
135,069
|
|
Other
commissions
|
32,215
|
19,851
|
17,157
|
|
Other (Note
21)……….
|
3,183,797
|
2,804,829
|
2,536,195
|
|
|
6,829,074
|
5,139,888
|
3,934,395
|
|
Expenses
for services
|
|
|
|
|
Commissions
|
529,126
|
412,070
|
173,739
|
|
Others
(Note 21)
|
1,414,390
|
839,383
|
735,081
|
|
|
1,943,516
|
1,251,453
|
908,820
|
|
Administrative
expenses
|
|||
|
Payroll
expenses
|
3,564,420
|
2,769,210
|
2,313,783
|
|
Directors and statutory auditors’
fees
|
149,706
|
52,501
|
90,773
|
|
Other fees
|
639,940
|
661,024
|
437,160
|
|
Advertising
and publicity
|
123,809
|
117,017
|
173,384
|
|
Taxes
|
331,547
|
253,555
|
213,188
|
|
Depreciation
of premises and equipment
|
100,534
|
80,577
|
45,560
|
|
Amortization of organization and
development
|
186,201
|
149,120
|
99,504
|
|
Other
operating expenses
|
761,812
|
735,161
|
482,967
|
|
Other
|
209,195
|
196,296
|
96,273
|
|
|
6,067,164
|
5,014,461
|
3,952,592
|
|
|
|
|
|
|
Net
income from financial intermediation
|
Ps.
2,378,096
|
Ps.
1,226,989
|
Ps.
1,753,285
|
|
Miscellaneous
income
|
|
|
|
|
Results
from investments in others companies
|
18,985
|
35,656
|
13,767
|
|
Penalty
interest
|
116,090
|
96,964
|
98,366
|
|
Loans
recovered and allowance reversed
|
199,144
|
219,592
|
265,493
|
|
Other
(Note 21)
|
259,980
|
160,314
|
117,358
|
|
|
594,199
|
512,526
|
494,984
|
|
Miscellaneous
losses
|
|
|
|
|
Penalty
interest and charges in favor of the BCRA
|
1,996
|
606
|
292
|
|
Loan
loss provision for miscellaneous receivables and other
provisions
|
248,589
|
164,896
|
171,951
|
|
Depreciation
and loss of miscellaneous assets
|
2,083
|
515
|
519
|
|
Amortization
of goodwill
|
3,430
|
3,430
|
3,430
|
|
Other
(Note 21)
|
561,416
|
423,904
|
370,441
|
|
|
817,514
|
593,351
|
546,633
|
|
Net
income before income tax and non-controlling interest
|
Ps.
2,154,781
|
Ps.
1,146,164
|
Ps.
1,701,636
|
|
|
|
|
|
|
Income
tax (Note 23)
|
532,658
|
516,179
|
618,899
|
|
Non-controlling
interest
|
(28,684
)
|
(14,657
)
|
3,077
|
|
Net
income for the year
|
Ps.
1,593,439
|
Ps.
615,328
|
Ps.
1,085,814
|
|
|
|
|
|
|
Basic
earnings per share
|
1.087
|
0.420
|
0.742
|
|
Diluted
earnings per share
|
1.087
|
0.420
|
0.742
|
|
|
|
|
|
The accompanying notes are an integral part of these consolidated
financial statements.
F-130
BANCO HIPOTECARIO S.A. AND SUBSIDIARIES
CONSOLIDATED STATEMENT OF CHANGES IN SHAREHOLDERS'
EQUITY
For the years ended December 31, 2017, 2016 and 2015
(Expressed in thousands of Argentine pesos, except share data and
as otherwise indicated)
|
|
|
|
|
|
Reserves
|
|
|
|
|
|
Capital
stock
(Note
25)
|
Paid in
capital (Note 25)
|
Treasury
stock (*)
(Note
25)
|
Inflation
adjustment of Capital stock
(Note
25)
|
Legal
(Note
25)
|
Other
(Note
25)
|
Retained
earnings
|
Total
shareholders’ equity
|
|
|
|
|
|
|
|
|
|
|
|
Balance as of December 31, 2014
|
Ps.
1,463,365
|
Ps.
834
|
Ps.
54,149
|
Ps.
699,601
|
Ps.
679,739
|
Ps.
612,491
|
Ps.
886,728
|
Ps.
4,396,907
|
|
|
|
|
|
|
|
|
|
|
|
Distribution of retained
earnings
approved by the
General Shareholders’ Meeting held on 04/24/14. Approval of
BCRA on 12/23/14
|
-
|
-
|
-
|
-
|
-
|
-
|
(41,817
)
|
(41,817
)
|
|
|
|
|
|
|
|
|
|
|
|
Distribution of retained
earnings
approved by the
General Shareholders’ Meeting held on
03/21/15.
|
-
|
-
|
-
|
-
|
109,994
|
439,978
|
(549,972
)
|
-
|
|
|
|
|
|
|
|
|
|
|
|
Net
income for the year
|
-
|
-
|
-
|
-
|
-
|
-
|
1,085,814
|
1,085,814
|
|
|
|
|
|
|
|
|
|
|
|
Balance as of December 31, 2015
|
Ps.
1,463,365
|
Ps.
834
|
Ps.
54,149
|
Ps.
699,601
|
Ps.
789,733
|
Ps.
1,052,469
|
Ps.
1,380,753
|
Ps.
5,440,904
|
|
|
|
|
|
|
|
|
|
|
|
Distribution of retained
earnings
approved by the
General Shareholders’ Meeting held on
04/13/16
|
-
|
-
|
-
|
-
|
217,163
|
-
|
(217,163
)
|
-
|
|
|
|
|
|
|
|
|
|
|
|
Net
income for the year
|
-
|
-
|
-
|
-
|
-
|
-
|
615,328
|
615,328
|
|
|
|
|
|
|
|
|
|
|
|
Balance as of December 31, 2016
|
Ps.
1,463,365
|
Ps.
834
|
Ps.
54,149
|
Ps.
699,601
|
Ps.
1,006,896
|
Ps.
1,052,469
|
Ps.
1,778,918
|
Ps.
6,056,232
|
|
|
|
|
|
|
|
|
|
|
|
Distribution of retained
earnings
approved by the
General Shareholders’ Meeting held on
04/04/17
|
-
|
-
|
-
|
-
|
123,066
|
1,655,852
|
(1,778,918
)
|
-
|
|
|
|
|
|
|
|
|
|
|
|
Net
income for the year
|
-
|
-
|
-
|
-
|
-
|
-
|
1,593,439
|
1,593,439
|
|
|
|
|
|
|
|
|
|
|
|
Balance as of December 31, 2017
|
Ps.
1,463,365
|
Ps.
834
|
Ps.
54,149
|
Ps.
699,601
|
Ps.
1,129,962
|
Ps.
2,708,321
|
Ps.
1,593,439
|
Ps.
7,649,671
|
(*)
Includes Ps.17,514 of inflation adjustment of treasury
stock
The
accompanying notes are an integral part of these consolidated
financial statements
F-131
BANCO HIPOTECARIO S.A. AND SUBSIDIARIES
CONSOLIDATED STATEMENT OF CASH FLOWS
For the years ended December 31, 2017, 2016 and 2015
(Expressed in thousands of Argentine pesos, except share data and
as otherwise indicated)
|
|
2017
|
2016
|
2015
|
|
|
|
|
|
|
Cash
and cash equivalents at the beginning of fiscal year
|
Ps.
7,188,279
|
Ps.
6,378,793
|
Ps.
5,368,514
|
|
Cash flows at the end of the fiscal
year
|
3,646,536
|
7,188,279
|
6,378,793
|
|
Net (decrease) / increase in cash and cash equivalents
|
Ps.
(3,541,743
)
|
Ps.
809,486
|
Ps.
1,010,279
|
|
|
|
|
|
|
Causes of changes in cash and cash equivalents
|
|
|
|
|
|
|
|
|
|
Cash flow from operating activities
|
|
|
|
|
(Payment)
/ Net collection on:
|
|
|
|
|
Government
and corporate securities
|
(9,816,489
)
|
448,650
|
(928,227
)
|
|
Loans
|
|
|
|
|
To
the financial sector
|
180,671
|
(106,033
)
|
141,060
|
|
To
the non-financial public sector
|
63, 459
|
(438,820
)
|
65,132
|
|
To
the non-financial private sector and foreign residents
|
(9,062,654
)
|
(6,473,546
)
|
(3,690,779
)
|
|
Other
receivables from financial intermediation
|
4,201,862
|
(7,334,056
)
|
(3,076,054
)
|
|
Deposits
|
|
|
|
|
To
the financial sector
|
(137,515
)
|
(4,283,121
)
|
(2,280,865
)
|
|
To
the non-financial public sector
|
-
|
-
|
945
|
|
To
the non-financial private sector and foreign residents
|
1,960,890
|
2,877,867
|
4,338,020
|
|
Other
(except for liabilities under financing activities)
|
(1,940,287
)
|
6,703,118
|
2,620,070
|
|
Collections
linked with income from services
|
6,829,074
|
5,139,888
|
3,934,395
|
|
Payments
linked with expenses for services
|
(1,943,516
)
|
(1,251,453
)
|
(908,820
)
|
|
Administrative
expenses paid
|
(6,353,899
)
|
(5,244,338
)
|
(4,097,656
)
|
|
Collection
net of penalty interest
|
116,090
|
96,964
|
98,366
|
|
Payment
of organization and development expenses
|
-
|
(89,145
)
|
(135,291
)
|
|
Other
(payments) linked to miscellaneous income and expenses
|
(371,873
)
|
(452,196
)
|
(493,298
)
|
|
(Payment)/
Net collection from other operating activities
|
(21,876
)
|
9,214
|
(71,364
)
|
|
Net cash flow (used in) operating activities
|
Ps.
(16,296,063
)
|
Ps.
(10,397,007
)
|
Ps.
(4,484,366
)
|
|
|
|
|
|
|
Cash flow from investment activities:
|
|
|
|
|
Net
payment on bank premises and equipment
|
(1,168,079
)
|
(378,366
)
|
(83,120
)
|
|
Payment
of dividends
|
-
|
-
|
(41,817
)
|
|
Net cash flow (used in) by investment activities
|
Ps.
(1,168,079
)
|
Ps.
(378,366
)
|
Ps.
(124,937
)
|
|
|
|
|
|
|
Cash flow from financing activities:
|
|
|
|
|
Issuance
of unsubordinated corporate bonds
|
9,650,095
|
9,008,634
|
2,662,962
|
|
Issue
of subordinated corporate bonds
|
-
|
26,216
|
110,622
|
|
Net cash flow provided by financing activities
|
Ps.
9,650,095
|
Ps.
9,034,850
|
Ps.
2,773,584
|
|
|
|
|
|
|
Financial
gain on holding of cash and cash equivalent (including interest and
monetary results)
|
4,272,304
|
2,550,009
|
2,845,998
|
|
|
|
|
|
|
Net (decrease) / increase in cash and cash equivalents
|
Ps.
(3,541,743
)
|
Ps.
809,486
|
Ps.
1,010,279
|
The
accompanying notes are an integral part of these consolidated
financial statements.
F-132
BANCO HIPOTECARIO S.A. AND SUBSIDIARIES
NOTES TO THE CONSOLIDATED FINANCIAL STATEMENTS
For the years ended December 31, 2017, 2016 and 2015
(Expressed in thousands of Argentine pesos, except share data and
as otherwise indicated)
1.
General
a. Description of business
Banco Hipotecario
S.A
. (herein
after referred to as the “Bank” or “BHSA”),
is a commercial bank organized under the laws of
Argentina.
The Bank historically has provided general banking services,
focused on individual residential mortgage loans and
construction-project loans directly to customers as well as
indirectly through selected banks and other financial
intermediaries throughout Argentina. In 2004, as part of its
business diversification strategy, the Bank
resumed the
mortgage lending and expanded its product offerings, beginning to
offer personal loans, credit card loans and
also engaging in mortgage loan securitizations,
mortgage loan servicing, other corporate loans and mortgage-related
insurance in connection with its lending
activities.
Additionally, the Bank conducts part of its business through its
subsidiaries, providing general banking services, proprietary brand
credit card services, personal loans, insurance and other
services.
Through BHN Sociedad de Inversión S.A., the Bank wholly owns
BHN Seguros Generales Sociedad Anónima and BHN Vida Sociedad
Anónima. Both companies have a similar business and operating
model. The first one, provides personal insurance whereas the
other, provides property insurance. Both are authorized to conduct
business by the Argentine Superintendence of Insurance
(“SSN”), the governmental agency responsible by law for
regulating the insurance business in Argentina.
Tarshop S.A. commercializes consumer finance products, namely
Tarshop-branded credit and debit cards under the trade name is
“Tarjeta Shopping” and personal loans. The line of cash
loans involves two distinct modalities: loans granted by branches
and loans granted by retailers that are members of the chain of
direct financing at retail stores.
BACS Banco de Crédito y Securitización S.A.
(“BACS”) is a wholesale bank specialized in providing
innovative financial solutions to Argentine companies. BACS focuses
on investment banking products, origination, purchase and
securitization of personal and pledge loans, and private
banking.
b. Basis of presentation
The consolidated financial statements of the Bank have been
prepared in accordance with the rules of Banco Central de la
República Argentina (“Argentine Central Bank” or
“BCRA”) which prescribe the accounting reporting and
disclosure requirements for banks and financial institutions in
Argentina (“Argentine Banking GAAP”). Argentine Banking
GAAP differ in certain significant respects from generally accepted
accounting principles in the United States of America (“U.S.
GAAP”).
Such differences involve methods of measuring
the amounts shown in the consolidated financial statements, as well
as additional disclosures required by U.S. GAAP and Regulation S-X
of the Securities and Exchange Commission (“SEC”). A
description of the significant differences between Argentine
Banking GAAP and U.S.GAAP as they relate to the Bank are set forth
in Note 32 to these consolidated financial statements.
Certain
disclosures required by the Argentine Banking GAAP have not been
presented herein since they are not required under U.S. GAAP or the
SEC and are not considered to be relevant to the accompanying
consolidated financial statements taken as a whole.
F-133
BANCO HIPOTECARIO S.A. AND SUBSIDIARIES
NOTES TO THE CONSOLIDATED FINANCIAL STATEMENTS
For the years ended December 31, 2017, 2016 and 2015
(Expressed in thousands of Argentine pesos, except share data and
as otherwise indicated)
c.
Basis of
consolidation
The consolidated financial statements include the accounts of the
Bank and its subsidiaries over which the Bank has effective
control.
The percentages directly or indirectly held in
those companies’ capital stock as of December 31, 2017, 2016
and 2015 are as follows:
|
|
December 31,
|
||
|
Issuing Company
|
2017
|
2016
|
2015
|
|
BHN
Sociedad de Inversión Sociedad Anónima
|
99.99
%
|
99.99
%
|
99.99
%
|
|
BHN
Seguros Generales Sociedad Anónima
|
99.99
%
|
99.99
%
|
99.99
%
|
|
BHN
Vida Sociedad Anónima
|
99.99
%
|
99.99
%
|
99.99
%
|
|
BACS
Banco de Crédito y Securitización Sociedad Anónima
(a)
|
62.28
%
|
87.50
%
|
87.50
%
|
|
BACS
Administradora de Activos S.A. S.G.F.C.I.
|
85.00
%
|
85.00
%
|
85.00
%
|
|
Tarshop
S.A.
|
80.00
%
|
80.00
%
|
80.00
%
|
|
BH
Valores SA
|
100.00
%
|
100.00
%
|
100.00
%
|
(a)
See Note 16.
All significant intercompany accounts and transactions have been
eliminated in consolidation.
d. Presentation of financial statements in constant argentine
pesos
Argentine
generally accepted accounting principles in effect in the
Autonomous City of Buenos Aires provides that financial statements
shall be stated in constant currency, pursuant to the provisions of
Technical Pronouncements Nos. 6 and 17 of the Argentine Federation
of Professional Councils in Economic Sciences
(“F.A.C.P.C.E.”), as amended by Technical Pronouncement
No. 39, approved by the Professional Council in Economic Sciences
of the Autonomous City of Buenos Aires on April 16, 2014, as well
as interpretation No. 8 of the F.A.C.P.C.E.
These
GAAP measures provide that the adjustment for inflation shall be
applied in an inflationary context, which is present when, among
other considerations, there exists an accumulated rate of inflation
reaching or exceeding 100% during three years, taking into
consideration, for such purpose, the domestic wholesale price index
published by the Argentine Institute of Statistics and Census.
Financial statements reflect the effects of the changes in the
purchasing power of the currency up to February 28, 2003 (the
adjustment for inflation having been discontinued of Decree from
such date) pursuant to the provisions of the Argentine GAAP in
force in the Autonomous City of Buenos Aires and the requirements
of the Decree No 664/03 of the National Executive Branch, Section
268 of General Resolution No. 7/2005 of the Corporation Control
Authority, Communiqué “A” 3.921 of The Argentine
Central Bank and General Resolution No. 441/03 of the Comisión
Nacional de Valores (the “National Securities
Commission” or the “CNV”). Resolution M.D. No.
41/03 of the Professional Council in Economic Sciences of the
Autonomous City of Buenos Aires established the discontinuation of
the recognition of the changes in the purchasing power of the
currency, effective October 1, 2003.
At
year-end the macro economy environment does not meet the conditions
established in the Argentine professional accounting standards to
qualify as highly hyperinflationary. Therefore, these financial
statements were not restated to constant currency.
However,
in recent years, certain macroeconomic variables affecting the
Bank’s business, including, without limitation, wage costs
and prices for supplies, have experienced significant annual
changes. This circumstance should be considered in assessing and
interpreting the Bank’s financial position and results
presented in these consolidated financial statements.
F-134
BANCO HIPOTECARIO S.A. AND SUBSIDIARIES
NOTES TO THE CONSOLIDATED FINANCIAL STATEMENTS
For the years ended December 31, 2017, 2016 and 2015
(Expressed in thousands of Argentine pesos, except share data and
as otherwise indicated)
2
. Significant Accounting
Policies
The
following is a summary of significant accounting policies used in
the preparation of the consolidated financial
statements.
2.1. Foreign Currency Assets and Liabilities
US
dollar assets and liabilities have been valued at the rate of
exchange between the peso and the US dollar published by the
Argentine Central Bank. Assets and liabilities valued in foreign
currencies other than the US dollar were converted into argentine
pesos using the swap rates communicated by the Argentine Central
Bank’s operations desk, in force at the close of operations
on the last business day of the year end.
Foreign
currency transactions net gains or losses are recorded within
“Financial income” or “Financial expenses”
in the accompanying consolidated statements of income.
2.2. Interest accruals and adjustments of principal amounts (UVA,
UVI, CER and CVS)
Interest
has been accrued using the compound interest formula in the periods
in which it was generated for all lending and certain borrowing
transactions in local and foreign currency. The Bank suspends the
accrual of interest generally when the related loan is
non-performing and the collection of interest and principal is in
doubt. Accrued interest remains on the Bank’s books and is
considered to be part of the loan balance when determining the
allowance for loan losses. Regarding impaired loans, interest is
recognized on a cash basis after reducing the balance of accrued
interest, if applicable.
Adjustments
of principal amounts from application of the UVA (Unit of
acquisitive value), UVI (Unit of housing), CER (Reference
Stabilization Index), and CVS (Average Variation Index) were
accrued as established by Argentine Central Bank regulations, and
interest accruals on loans overdue more than ninety days were
discontinued.
2.3. Government and Corporate Securities
Securities
classified as "Holdings recorded at fair value", "Investment in
listed corporate securities" and "Instruments issued by the BCRA"
with volatilities lists published by the BCRA, have been valued at
year-end quoted market prices.
Securities
classified as “Holdings recorded at amortized cost” and
“Securities issued by the BCRA” with no volatilities
lists published by the BCRA or securities with volatilities lists
published by the BCRA but which the Bank decides to value under the
first category, have been recorded at their acquisition cost plus
accrued interest.
Realized
gains and losses on sales and interest income on government and
corporate securities are included as “Net income from
government and corporate securities” in the accompanying
statement of income.
2.4. Loans
Loans
are valued at amortized cost, plus accrued interest at each balance
sheet date, net of allowances for loan losses, as described in Note
6.
The
Bank suspends the accrual of interest when the related loan is 90
days past due and the collection of interest and principal is in
doubt. The suspension of interest corresponds to the loans
classified as “with problems” and “medium
risk” or below, under Argentine Central
Bank´s
F-135
BANCO HIPOTECARIO S.A. AND SUBSIDIARIES
NOTES TO THE CONSOLIDATED FINANCIAL STATEMENTS
For the years ended December 31, 2017, 2016 and 2015
(Expressed in thousands of Argentine pesos, except share data and
as otherwise indicated)
classification
rules. Accrued interest remains on the Bank´s books and is
considered to be part of the loan balance when determining the
allowance for loan losses. Regarding impaired loans, interest is
recognized on a cash basis after reducing the balance of accrued
interest, if applicable.
2.5. Other receivables from financial intermediation
The
financial trust participation certificates have been valued
according to the equity method of accounting. Financial trust debt
securities have been stated at internal return cost, index-adjusted
by applying the CER to the appropriate instruments.
Futures
transactions have been valued in accordance with the balances
pending settlement. Changes in these values, for all derivative
instruments, are recognized as a gain or loss under the caption
“Financial Income – Others” and “Financial
Expenses – Others”, respectively.
Unlisted
corporate securities, which are comprised only of unlisted
negotiable obligations, have been valued at acquisition cost plus
internal rate of return.
The
Bank holds non subordinated corporate bond in its own portfolio,
measured at acquisition cost exponentially increased according to
the internal rate of return.
Securities
issued by the BCRA and government securities held as collateral for
future transactions are valued as explained in Note
2.3.
Repo
transactions are carried at the value originally agreed upon, plus
accrued premiums.
Reverse
repo transactions are carried at the book value of the underlying
assets, as explained in Note 2.3.
2.6. Receivables from financial leases
Receivables
from financial leases are carried at the present value of the
periodic installments and the residual value previously agreed
upon, calculated as per the conditions set forth in the respective
lease agreements, applying the internal rate of return and net of
allowances for loan losses.
2.7. Unlisted equity investments
Investments
in which the Bank does not have significant influence have been
accounted for at cost.
This
caption mainly includes the equity investments held in: Mercado
Abierto Electrónico Sociedad Anónima, ACH Sociedad
Anónima, Mercado de Valores de Buenos Aires Sociedad
Anónima, Bolsas y Mercados Argentinos S.A., Comparaencasa Ltd.
and SUPER–CARD S.A.
Additionally
the Bank has participations as protecting partner in mutual
guarantee companies and has made contributions to the
companies’ risk fund.
The
breakdown of unlisted equity investments in the accompanying
consolidated balance sheets is as follows:
F-136
BANCO HIPOTECARIO S.A. AND SUBSIDIARIES
NOTES TO THE CONSOLIDATED FINANCIAL STATEMENTS
For the years ended December 31, 2017, 2016 and 2015
(Expressed in thousands of Argentine pesos, except share data and
as otherwise indicated)
|
|
December
31,
|
|
|
|
2017
|
2016
|
|
|
|
|
|
Participations as
protecting partner in mutual guarantee companies
|
Ps.
26,310
|
Ps.
100,941
|
|
Comparaencasa
Ltd.
|
15,650
|
-
|
|
Others
|
72
|
79
|
|
Total
|
Ps.
42,032
|
Ps.
101,020
|
2.8. Miscellaneous receivables
Miscellaneous
receivables have been valued at the amounts actually transacted,
plus interest accrued and net of allowances for loan losses or
impairment, if applicable.
2.9.
Bank
Premises and Equipment and Miscellaneous Assets, net
Bank
premises and equipment are recorded at cost, adjusted for inflation
(as described in Note 1.d), less accumulated
depreciation.
Depreciation
is computed under the straight-line method over the estimated
useful lives of the related assets. The estimated useful lives for
bank premises and equipment are as follows:
|
Buildings
|
50
years
|
|
Furniture
and fixtures
|
10
years
|
|
Machinery
and equipment
|
5
years
|
|
Other
|
5
years
|
The
cost of maintenance and repairs
of
these properties is charged to expense
as incurred. The cost of significant renewals and improvements is
added to the carrying amount of the respective assets. When assets
are retired or otherwise disposed of, the cost and related
accumulated depreciation are removed from the accounts, and any
resulting gain or loss is reflected in the consolidated statement
of income.
The
Bank has recorded under “Miscellaneous assets” -
properties received in lieu of payment of loans. These assets are
initially recognized at the lower of market value or the value of
the loan, net of allowances and subsequently, adjusted for
inflation (as described in Note 1.d), and depreciation.
Depreciation of Miscellaneous assets is also computed under the
straight-line method over the estimated useful of the related
assets.
2.10.
Intangible
Assets, net
Software
expenses as well as start-up costs are carried at cost, adjusted
for inflation (as described in Note 1.d), less accumulated
amortization. These intangible assets are amortized under the
straight-line method over their estimated useful life.
Goodwill
is recorded by the difference between the purchase price and the
book value of the net assets acquired in accordance with Argentine
Banking GAAP, and subsequently amortized in a straight line basis
over the estimated useful life of 60 months.
F-137
BANCO HIPOTECARIO S.A. AND SUBSIDIARIES
NOTES TO THE CONSOLIDATED FINANCIAL STATEMENTS
For the years ended December 31, 2017, 2016 and 2015
(Expressed in thousands of Argentine pesos, except share data and
as otherwise indicated)
Given
BHSA’s role as Trustee of the PROCREAR Administrative and
Financial Trust, the Bank has capitalized increased direct expenses
incurred in the mortgage loan origination process, which
disbursements would not have been incurred by it had it not been
for the grant of the related loans in accordance with the
provisions of Communication “A” 5.392. Such origination
expenses are amortized on straight line basis in 60 monthly
installments.
2.11. Deposits
Deposits
have been valued at their placement value, plus adjustments (CER,
UVA and UVI) and accrued interest, where applicable. The fixed
return on each transaction is accrued on an exponential basis,
while the variable return on time deposits adjusted by applying the
CER and
UVA, included in
“Time Deposits” and "Investment Accounts" is accrued at
the pro rata agreed upon rate of return based on the positive
variation in the price of the financial asset or financial asset
index, between the time the transaction is arranged and the end of
the month.
2.12.
Other liabilities from financial
intermediation
Non
subordinated corporate bonds have been valued at their residual
value plus accrued interest.
Futures
transactions agreed upon that are mainly closed related to the
position in foreign currency have been valued in accordance with
the balances pending settlement. Changes in these values, for all
derivative instruments, are recognized as a gain or loss under the
caption “Financial Income – Others” or
“Financial Expenses – Others”,
respectively.
Repo
transactions are carried at the value originally agreed upon plus
any accrued premium amounts.
Reverse
repo transactions are carried at the book value of the underlying
securities in the manner discussed in Note 2.3.
2.13.
Miscellaneous liabilities
They
are valued at the amounts actually transacted, plus accrued
interest as of year end.
2.14. Provisions
The
Bank estimates contingencies and records them in Provisions, under
Liabilities, if applicable according to the estimated likelihood of
occurrence. These provisions cover various items, such as lawsuits,
taxes and other contingencies.
In
addition, the Bank has accounted for the allowance required under
Communication “A” 5,689 issued by the Argentine Central
Bank in order to provide for the total amount of administrative
and/or disciplinary sanctions and criminal penalties supported by
first instance rulings, applied or pursued by the Argentine Central
Bank, the Financial Information Unit, the Argentine Securities
Commission and the Argentine Superintendence of
Insurance.
Customers’ loyalty program provision has been recorded based
upon the points earned that are expected to be redeemed and the
average cost per point redeemed
.
2.15.
Dismissal indemnities
F-138
BANCO HIPOTECARIO S.A. AND SUBSIDIARIES
NOTES TO THE CONSOLIDATED FINANCIAL STATEMENTS
For the years ended December 31, 2017, 2016 and 2015
(Expressed in thousands of Argentine pesos, except share data and
as otherwise indicated)
The
Bank does not set up any provisions to cover the risk of dismissal
indemnities involving the staff. The disbursements in respect
thereof are charged to the results for the year in which they
occur.
2.16.
Personnel benefits
The
Bank has set up provisions for its employees' retirement
plans.
The
instrumented plan consists of agreements with certain employees
through monthly compensation until they reach the age and service
conditions to obtain their retirement. A provision is accounted for
the
current estimates of the future
cash flows.
2.17. Subordinated corporate bonds
As of
December 31, 2016, subordinated corporate bonds were recorded at
their residual value plus interests accrued.
2.18. Non-controlling interest
The
breakdown of Non-controlling interest at each balance sheets date
is as follows:
|
|
December
31,
|
|
|
|
2017
|
2016
|
|
|
|
|
|
BACS Banco de
Crédito y Securitización S.A.
|
Ps.
148,736
|
Ps.
43,441
|
|
Tarshop
S.A
|
133,557
|
114,266
|
|
Total
|
Ps.
282,293
|
Ps.
157,707
|
2.19. Income Tax
Pursuant
to Article 28 of Law 24,855, BHSA is subject to income tax, except
for all the housing loan transactions carried out prior to October
23, 1997, date of registration of its by-laws with the
Superintendence of Corporations.
The
Bank recognizes income tax charges and liabilities on the basis of
the tax returns corresponding to each fiscal year at the statutory
tax rates. For the year ended December 31, 2017
,
the corporate tax rate was 30%. For the
years ended December 31, 2016 and 2015
,
the corporate tax rate was 35%. Under
Argentine Banking GAAP the Bank does not recognize deferred income
tax.
2.20. Minimum presumed income tax
Minimum
presumed income tax (“MPIT”) was established as a
complementary component of income tax obligations. MPIT is a
minimum taxation, which assesses at the rate of 1% of computable
assets at fiscal year-end according to Law 25,063. Ultimately, the
tax obligation will be the higher of MPIT or income tax. However,
if in any fiscal year MPIT exceeds income tax, that amount in
excess will be available as a credit against future income tax to
be generated in any of the next ten fiscal years.
Entities
regulated by the Financial Institutions Law must consider 20% of
their computable assets as the taxable basis for calculation of the
MPIT.
In view
of the option granted by the BCRA by means of Communication "A"
4295, as of December 31, 2017 the Bank recognized the tax amount
paid in previous fiscal years as a minimum notional income tax
credit.
F-139
BANCO HIPOTECARIO S.A. AND SUBSIDIARIES
NOTES TO THE CONSOLIDATED FINANCIAL STATEMENTS
For the years ended December 31, 2017, 2016 and 2015
(Expressed in thousands of Argentine pesos, except share data and
as otherwise indicated)
2.21. Housing, life and unemployment insurance premiums in lending
transactions and other transactions originated in its capacity of
insurer
Insurance
premiums are established in accordance with the rules of the SSN.
Rates charged to clients are determined on the basis of actuarial
calculations, based on basic principles in terms of equity,
sufficiency, homogeneity and representativeness, which allow a
reasonable presumption of a positive technical result and that are
not abusive or discriminatory.
The SSN
also requires that companies which conduct insurance operations
maintain certain reserves depending on their lines of business and
policies issued. The reserves are determined primarily pursuant to
two criteria, claims and premiums.
Claim-related
reserves have two principal forms:
-
Occurrences and
claims reported but not registered (“IBENR”): relates
to claims filed but not yet paid, and it is based on a reasonable
estimation of future amounts to be paid based on the insurance
company’s knowledge of the claims reported by its
insured.
-
Liabilities
incurred but not reported (“IBNR”): estimates of
amounts expected to be paid for claims not yet filed, typically
based on historical information of the company or market
data.
There
are also three forms of premium-related reserves:
-
Ongoing risks
reserve: is maintained for those areas of activity in which
policies cover a short time period (usually less than a year), and
an up-front premium is paid for the entire coverage period. The
ongoing risks reserve essentially allows income to be distributed
over different fiscal periods, since the income generated by
premiums paid in the applicable fiscal year cannot cover risks
beyond such period.
-
Mathematical
reserve: reserve is created for long-term contracts in which the
risk increases over time. In order to avoid charging borrowers
premiums which increase incrementally, premiums are maintained
constant, but include a percentage intended to cover future risks,
which is deemed a reserve. The mathematical reserve also allows the
company to amortize a portion of the premium income
received.
-
Sufficiency of
premiums: calculated by the sum of all revenue generated minus all
expenses incurred during the immediately preceding 12
months.
2.22. Shareholders' Equity
a.
Capital stock,
treasury stock, reserves and capital adjustment:
The
Shareholders' Equity account activity and balances prior to
December 31, 1994 have been stated in the currency values
prevailing at that date, following the method mentioned in this
note. The transactions carried out subsequent to that date have
been recorded in currency values of the year to which they
correspond. The balances of the Shareholders’ Equity accounts
as of December, 2017 have been restated up to February 28, 2003 as
explained in the third paragraph. The adjustment derived from the
restatement of the balance of "Capital Stock" was allocated to
"Equity Adjustments". The issued treasury stock added due to the
termination of Total Return Swap transaction are carried at nominal
value.
b.
Results:
Income
and expenses have been recognized following the accrual method,
regardless of whether they have been collected or
paid.
F-140
BANCO HIPOTECARIO S.A. AND SUBSIDIARIES
NOTES TO THE CONSOLIDATED FINANCIAL STATEMENTS
For the years ended December 31, 2017, 2016 and 2015
(Expressed in thousands of Argentine pesos, except share data and
as otherwise indicated)
Certain
reclassifications of the prior year´s information have been
made to conform to the current year´s presentation. Such
reclassifications do not have a significant impact on the
Bank´s financial statements.
2.23.
Statements of Cash Flows
The
consolidated statements of cash flows were prepared using the
measurement methods prescribed by the BCRA.
For
purposes of reporting cash flows, “Cash and cash
equivalents” include “Cash and due from
banks”.
2.24.
Use of Estimates
The
preparation of the consolidated financial statements requires
management to make estimates and assumptions that affect the
reported amounts of assets and liabilities and disclosures of
contingent assets and liabilities as of the financial statement
dates and the reported amounts of revenues and expenses during the
reporting years. Significant estimates include those required in
the accounting of allowances for loan losses and the reserve for
contingencies. Since management’s judgment involves making
estimates concerning the likelihood of future events, the actual
results could differ from those estimates which would have a
positive or negative effect on future year results.
2.25. Earnings per share.
The
Bank is required to present earnings per share information for all
periods presented. Basic earnings per share (“basic
EPS”) is computed by dividing the net income for the year by
the weighted-average number of common shares outstanding during the
year. Weighted average number of shares outstanding (in thousands)
is 1,466,577, 1,463,365 and 1,463,365 for the fiscal years ended
December 31, 2017, 2016 and 2015, respectively.
During
2017, the Bank approved and put in place an employee compensation
plan allocating to them its treasury stock. As a result, such
shares were treated as outstanding shares in computing 2017 average
outstanding shares.
There
are no dilutive financial instruments outstanding for any of the
fiscal years presented.
3. Restricted Assets
Certain
of the Bank's assets are pledged or restricted from use under
various agreements. The following assets were restricted at each
balance sheet date:
F-141
BANCO HIPOTECARIO S.A. AND SUBSIDIARIES
NOTES TO THE CONSOLIDATED FINANCIAL STATEMENTS
For the years ended December 31, 2017, 2016 and 2015
(Expressed in thousands of Argentine pesos, except share data and
as otherwise indicated)
|
|
December
31,
|
|
|
|
2017
|
2016
|
|
Banco
Hipotecario S.A.
|
|
|
|
Securities issued
by the BCRA as collateral for OCT Rofex transactions
|
Ps.
117,520
|
Ps.
326,789
|
|
Securities issued
by the BCRA as collateral for OCT MAE transactions
|
247
|
3,989
|
|
Deposits in pesos
as collateral for visa credit card transactions
|
321,740
|
364,586
|
|
Deposits in pesos
as collateral for
leases
|
1,218
|
1,027
|
|
Other
collaterals
|
1,365
|
810
|
|
|
Ps.
442,090
|
Ps.
697,201
|
|
|
|
|
|
Tarshop
S.A.
|
|
|
|
Deposits in pesos
and in U$S as collateral for leases
|
Ps.
1,253
|
Ps.
715
|
|
Certificates of
participation in Financial Trusts granted as commercial pledge for
a loan received
|
32,213
|
32,205
|
|
Time deposits
pledged for tax obligations arising from Financial Trusts
(a)
|
7,800
|
6,531
|
|
Deposits in pesos
related to Financial Trusts transactions
|
149,004
|
131,209
|
|
Receivables in
trust to secure an overdraft facility received (b)
|
78,315
|
84,341
|
|
Loans to secure the
future issuance of Financial Trust (c)
|
84,476
|
96,125
|
|
Deposits in pesos
as collateral for visa credit card transactions
|
36,240
|
18,142
|
|
Government
securities as collateral for visa credit card
transactions
|
26,274
|
15,991
|
|
|
Ps.
415,575
|
Ps.
385,259
|
|
|
|
|
|
BACS
Banco de Crédito y Securitización S.A.
|
|
|
|
Receivables in
pledge loans to secure a loan received
|
Ps.
7,776
|
Ps.
26,572
|
|
Securities and
pesos as collateral for OTC transactions
|
153,257
|
32,214
|
|
|
Ps.
161,033
|
Ps.
58,786
|
|
|
|
|
|
BH
Valores S.A.
|
|
|
|
Mercado de Valores
de Buenos Aires S.A.’s share pledged on behalf of Chubb
Argentina de Seguros S.A.
|
Ps.
-
|
Ps.
33,200
|
|
|
|
|
|
Total
|
Ps.
1,018,698
|
Ps.
1,174,446
|
(a) The pledge will
remain in force up and until there is a resolution to the potential
tax contingencies arising from financial trusts.
(b) In October
2015, Industrial and Commercial Bank of China (Argentina) S.A.
granted Tarshop S.A. a checking account overdraft facility for up
to Ps. 40,000, which was extended to Ps. 60,000 in June 2016. As
security for the performance of its obligations, Tarshop S.A. has
assigned and transferred to Banco de Valores S.A., as collateral
trustee, fiduciary ownership of the trust receivables, consisting
of Ps. 78,315 in equity securities. Any taxes, duties, rates or
similar items that may be imposed under the different tax laws on
account of such holdings and results, will be considered and
included in the Company’s applicable taxable bases, as the
Company agreed to bear the costs and expenses arising from the
defense and any charges that could be imposed by the tax
authorities on the trust and/or the trustee.
(c) Tarshop holds
loan receivables in equity securities from Tarjeta Shopping
Financial Trust, whose availability is restricted until the moment
when a decision is adopted on whether to place such loan portfolios
and transfer them to the trust portfolio or to keep them as its own
freely available portfolio, as applicable.
F-142
BANCO HIPOTECARIO S.A. AND SUBSIDIARIES
NOTES TO THE CONSOLIDATED FINANCIAL STATEMENTS
For the years ended December 31, 2017, 2016 and 2015
(Expressed in thousands of Argentine pesos, except share data and
as otherwise indicated)
As of
December 31, 2017 and 2016, BHN Sociedad de Inversión S.A.
does not have any restricted assets.
4. Government and Corporate securities
Government and Corporate Securities held by the Bank consist of the
following balances:
|
|
December 31,
|
|
|
|
2017
|
2016
|
|
Holding
recorded at fair value
|
|
|
|
Government
securities in pesos
|
Ps.
492,427
|
Ps.
1,167,515
|
|
Government securities in
US$
.
|
1,900,860
|
1,059,756
|
|
Government
securities in Euros
|
36,920
|
22,460
|
|
Bills issued by Provincial Governments in
US$
.
|
148,509
|
251,409
|
|
Bills
issued by Provincial Governments in pesos
|
56,494
|
21,285
|
|
|
Ps.
2,635,210
|
Ps.
2,522,425
|
|
|
|
|
|
Holding
recorded at amortized cost
|
|
|
|
Government
securities in US$
|
Ps.
244,239
|
Ps.
807,100
|
|
Bills
issued by Provincial Governments in pesos
|
51,709
|
52,921
|
|
Bills
issued by Provincial Governments in US$
|
126,099
|
157,064
|
|
|
Ps.
422,047
|
Ps.
1,017,085
|
|
|
|
|
|
Investment
in listed corporate securities
|
|
|
|
Corporate
securities denominated in pesos
|
Ps.
613,430
|
Ps.
352,854
|
|
|
Ps.
613,430
|
Ps.
352,854
|
|
|
|
|
|
Securities
issued by the BCRA
|
|
|
|
Quoted
bills and notes issued by the BCRA
|
Ps.
10,863,583
|
Ps.
614,586
|
|
Unquoted
bills and notes issued by the BCRA
|
291,493
|
502,324
|
|
|
Ps.
11,155,076
|
Ps.
1,116,910
|
|
|
|
|
|
Allowances
|
Ps.
(11,662
)
|
Ps.
(11,662
)
|
|
|
|
|
|
Total
|
Ps.
14,814,101
|
Ps.
4,997,612
|
The
maturities as of December 31, 2017, of government and
corporate securities were as follows:
|
|
Maturing within
|
||||
|
|
Book value
|
1 year
|
1 to 5 years
|
5 to 10 years
|
After 10 years
|
|
|
|
|
|
|
|
|
Holding
booked at fair value
|
Ps.
2,635,210
|
Ps.
1,203,010
|
Ps.
283,328
|
Ps.
499,783
|
Ps.
649,089
|
|
Holding
booked at amortized cost
|
422,047
|
286,564
|
135,483
|
-
|
-
|
|
Investment
in listed corporate securities
|
613,430
|
613,430
|
-
|
-
|
-
|
|
Instruments
issued by the BCRA
|
11,155,076
|
11,155,076
|
-
|
-
|
-
|
|
Allowances
|
(11,662
)
|
(11,662
)
|
-
|
-
|
-
|
|
|
Ps.
14,814,101
|
Ps.
13,246,418
|
Ps.
418,811
|
Ps.
499,783
|
Ps.
649,089
|
The
Bank recorded in their financial statements income from government
and corporate securities for an amount of Ps. 2,677,581, Ps.
2,178,541 and Ps. 1,764,289 as of December 31, 2017, 2016 and 2015,
respectively.
5. Loans
Under
Argentine Central Bank regulations, the Bank must disclose the
composition of its loan portfolio by non-financial public,
financial and non-financial private sector.
F-143
BANCO HIPOTECARIO S.A. AND SUBSIDIARIES
NOTES TO THE CONSOLIDATED FINANCIAL STATEMENTS
For the years ended December 31, 2017, 2016 and 2015
(Expressed in thousands of Argentine pesos, except share data and
as otherwise indicated)
●
Loans to the
non-financial public sector: loans to the federal and provincial
governments of Argentina.
●
Loans to the
financial sector: loans to local banks and financial
entities.
●
Loans to the
non-financial private sector and foreign residents:
-
Overdrafts:
short-term obligations drawn on by customers through overdrafts of
current accounts.
-
Promissory Notes:
endorsed promissory notes, discounted and purchased bills and
factored loans.
-
Mortgage loans:
loans to purchase or improve real estate and collateralized by such
real estate or commercial loans secured by real
estate.
-
Pledge loans: loans
where collateral is pledged as an integral part of the loan
document.
-
Personal loans:
loans to individuals.
-
Credit card loans:
loans to credit card holders.
-
Other: includes
mainly short-term loans for export prefinancing and
financing.
As of
December 31, 2017 and 2016, the classification of the Bank’s
loan portfolio pursuant to BCRA regulations was as
follows:
|
|
December
31,
|
|
|
|
2017
|
2016
|
|
|
|
|
|
Non-financial
public
sector
|
Ps.
89,573
|
Ps.
153,032
|
|
Financial
sector
|
456,279
|
636,950
|
|
Non-financial
private sector
|
|
|
|
With preferred
guarantees
(a)
|
3,399,006
|
2,743,568
|
|
Without preferred
guarantees
|
|
|
|
Personal
loans
|
6,842,584
|
4,611,052
|
|
Credit
card
|
15,039,798
|
12,663,403
|
|
Overdraft
|
1,221,539
|
290,153
|
|
Other loans
(b)
|
9,327,482
|
6,494,798
|
|
Accrued interest
receivable
|
282,346
|
247,127
|
|
Allowance for loan
losses (see Note
6)
|
(1,201,958
)
|
(676,141
)
|
|
Total
|
Ps.
35,456,649
|
Ps.
27,163,942
|
______________
(a)
Preferred
guarantees include first priority mortgages or pledges, cash, gold
or public sector bond collateral, certain collateral held in trust,
or certain guarantees by the Argentine government.
(b)
Comprised
of:
|
|
December
31,
|
|
|
|
2017
|
2016
|
|
|
|
|
|
Short term loans in
pesos
|
Ps.
3,182,077
|
Ps.
2,439,375
|
|
Short term loans in
US dollars
|
4,550,519
|
1,934,946
|
|
Loans for the
financing of manufacturers
|
227,036
|
189,838
|
|
Export
prefinancing
|
119,216
|
602,308
|
|
Other
loans
|
1,248,634
|
1,328,331
|
|
Total
|
Ps.
9,327,482
|
Ps.
6,494,798
|
6. Allowance for loan losses
Allowances
for loan losses are recognized considering the evaluation of debt
repayment capacity, the degree of debtors compliance and guarantees
securing the respective transactions, following the regulations on
debtor classification and minimum loan loss risk allowances issued
by the BCRA.
F-144
BANCO HIPOTECARIO S.A. AND SUBSIDIARIES
NOTES TO THE CONSOLIDATED FINANCIAL STATEMENTS
For the years ended December 31, 2017, 2016 and 2015
(Expressed in thousands of Argentine pesos, except share data and
as otherwise indicated)
The
activity in the allowance for loan losses for the years presented
is as follows:
|
|
December
31,
|
|
|
|
2017
|
2016
|
|
|
|
|
|
Balance at
beginning of
year
|
Ps.
676,141
|
Ps.
451,751
|
|
Provision charged
to
income
|
910,881
|
466,365
|
|
Loans charged
off
|
(385,064
)
|
(241,975
)
|
|
Balance at end of
year
|
Ps.
1,201,958
|
Ps.
676,141
|
7. Other receivables from financial intermediation
The
breakdown of other receivables from financial intermediation, by
type of guarantee for the years ended, is as follows:
|
|
December
31,
|
|
|
|
2017
|
2016
|
|
Preferred
guarantees, including deposits with the
|
|
|
|
Argentine Central
Bank
|
Ps.
279,689
|
Ps.
1,282,427
|
|
Unsecured
guarantees
(a)
|
6,310,816
|
7,993,895
|
|
Subtotal
|
6,590,505
|
9,276,322
|
|
Allowance for
losses
|
(15,616
)
|
(14,190
)
|
|
Total
|
Ps.
6,574,889
|
Ps.
9,262,132
|
The
breakdown of the caption “Others not included in the debtor
classification regulation” included in the balance sheet is
as follows:
|
|
December
31,
|
|
|
|
2017
|
2016
|
|
|
|
|
|
Subordinated bonds
(a)
|
Ps.
2,049,948
|
Ps.
2,393,543
|
|
Certificates of
participation (see Note 19)
|
858,605
|
1,312,881
|
|
Bonds held in the
Bank’s portfolio (b)
|
353,576
|
388,858
|
|
Other
|
785
|
2,030
|
|
Total
|
Ps.
3,262,914
|
Ps.
4,097,312
|
(a)
Includes Ps. 1,799,509 and Ps. 2,041,936 of debt securities related
to securitizations made by the Bank and described in Note 19, as of
December 31, 2017 and 2016, respectively.
(b) The
Bank holds some of its non-subordinated corporate bonds as of
December 31, 2017 and 2016.
8. Miscellaneous receivables
The
breakdown of the caption “Other” included in the
balance sheet is as follows:
F-145
BANCO HIPOTECARIO S.A. AND SUBSIDIARIES
NOTES TO THE CONSOLIDATED FINANCIAL STATEMENTS
For the years ended December 31, 2017, 2016 and 2015
(Expressed in thousands of Argentine pesos, except share data and
as otherwise indicated)
|
|
December
31,
|
|
|
|
2017
|
2016
|
|
|
|
|
|
Withholdings,
credits and prepaid income tax
|
Ps.
57,821
|
Ps.
57,273
|
|
Recoverable
expenses, taxes, and advances to third parties
|
24,899
|
25,200
|
|
Attachments for
non-restructured ON
|
22,705
|
11,179
|
|
Receivables from
fiduciary activities
|
487,355
|
230,288
|
|
Guarantee
deposit
|
75,199
|
33,563
|
|
Guarantee deposit
for credit card transactions
|
321,740
|
364,583
|
|
Directors
fees
|
46,938
|
36,229
|
|
Loans to Bank
staff
|
208,164
|
188,313
|
|
Other
|
761,980
|
940,131
|
|
Total
|
Ps.
2,006,801
|
Ps.
1,886,759
|
9. Bank Premises and Equipment
The
book values of major categories of bank premises and equipment and
total accumulated depreciation as of the years indicated are as
follows:
|
|
December
31,
|
|||
|
|
2017
|
2016
|
||
|
|
|
|
|
|
|
Land and
buildings
|
Ps.
|
237,529
|
Ps.
|
191,759
|
|
Furniture and
fixtures
|
|
119,088
|
|
105,280
|
|
Machinery and
equipment
|
|
400,785
|
|
358,076
|
|
Other
|
|
65,889
|
|
56,883
|
|
Accumulated
depreciation
|
|
(408,071
)
|
|
(321,770
)
|
|
Total
|
Ps.
|
415,220
|
Ps.
|
390,228
|
Depreciation
expense was Ps. 100,534, Ps. 80,577 and Ps. 45,560 during the year
ended December 31, 2017, 2016 and 2015,
respectively.
10. Miscellaneous assets
Miscellaneous
assets consist of the following as of the end of each
year:
|
|
December
31,
|
|||
|
|
2017
|
2016
|
||
|
|
|
|
|
|
|
Construction in
process (*)
|
Ps.
|
1,418,308
|
Ps.
|
51,459
|
|
Assets leased to
others
|
|
37,267
|
|
30,125
|
|
Stationery and
supplies assets
|
|
604
|
|
32,554
|
|
Advances for
purchase of goods (*)
|
|
-
|
|
176,551
|
|
Other
|
|
13,562
|
|
30,007
|
|
Accumulated
depreciation
|
|
(30,586
)
|
|
(24,628
)
|
|
Total
|
Ps.
|
1,439,155
|
Ps.
|
296,068
|
(*)
On April 20, 2016, by means of a public auction
conducted by the government of the City of Buenos Aires, the Bank
acquired the building known as “Edificio del Plata”
with the purpose of setting up a branch and corporate offices, for
approximately US$68.1 million. On April 29, 2016, the Bank paid 15%
of the acquisition price and on April 20, 2017 the Bank paid the
outstanding balance. The title deed was executed on April 25,
2017.
Depreciation
expense was Ps. 393, Ps. 294 and Ps. 339 during the year ended
December 31, 2017, 2016 and 2015, respectively.
11. Intangible Assets
Intangible
assets, net of accumulated amortization, as of the end of years
indicated are as follows:
F-146
BANCO HIPOTECARIO S.A. AND SUBSIDIARIES
NOTES TO THE CONSOLIDATED FINANCIAL STATEMENTS
For the years ended December 31, 2017, 2016 and 2015
(Expressed in thousands of Argentine pesos, except share data and
as otherwise indicated)
|
|
December
31,
|
|
|
|
2017
|
2016
|
|
|
|
|
|
Third parties fees,
re-engineering, restructuring and capitalized software
costs
|
Ps.
225,047
|
Ps.
200,437
|
|
Goodwill
(*)
|
9,934
|
13,363
|
|
Mortgage loan
origination expenses related to Pro.Cre.Ar (see Note
29)
|
304,188
|
353,564
|
|
Total
|
Ps.
539,169
|
Ps.
567,364
|
(*)
Goodwill is mainly related to the acquisition of
Tarshop.
Amortization
expense was Ps. 189,631, Ps. 152,550 and Ps. 102,934 during the
year ended December 31, 2017, 2016 and 2015,
respectively.
12.
Provisions
Provision
as of the end of each year is as follows:
|
|
December
31,
|
|||
|
|
2017
|
2016
|
||
|
|
|
|
|
|
|
Legal contingencies
(a)
|
Ps.
|
177,567
|
Ps.
|
179,284
|
|
Contingency risks
(b)
|
|
173,923
|
|
84,706
|
|
Tax
provision
|
|
32,710
|
|
3,132
|
|
Customers’
loyalty program
|
|
49,730
|
|
58,125
|
|
Allowance for
administrative-disciplinary-criminal penalties
|
|
600
|
|
600
|
|
Total
|
Ps.
|
434,530
|
Ps.
|
325,847
|
(a)
Includes legal contingencies and expected legal fees.
(b)
Includes non-subordinated corporate bonds past due whose holders
did not enter to the comprehensive financial debt restructuring
which ended in January 2004.
13. Other liabilities from financial intermediation -
Other
The
amounts outstanding, as of the end of the years are as
follows:
|
|
December
31,
|
|||
|
|
2017
|
2016
|
||
|
|
|
|
|
|
|
Collections and
other transactions on behalf of third parties
|
Ps.
|
709,148
|
Ps.
|
479,225
|
|
Credit cards
consumptions payable
|
|
2,587,430
|
|
1,810,155
|
|
Retail Bank
Network
|
|
67,004
|
|
21,713
|
|
Financial hedge
contract
|
|
666,436
|
|
620,080
|
|
Others
|
|
423
|
|
605
|
|
Total
|
Ps.
|
4,030,441
|
Ps.
|
2,931,778
|
F-147
BANCO HIPOTECARIO S.A. AND SUBSIDIARIES
NOTES TO THE CONSOLIDATED FINANCIAL STATEMENTS
For the years ended December 31, 2017, 2016 and 2015
(Expressed in thousands of Argentine pesos, except share data and
as otherwise indicated)
14.
Other liabilities from financial intermediation
– Financing received from local financial
institutions
The
breakdown of the caption “Financing received from local
financial institutions” is as follows:
|
|
|
|
|
December
31,
|
||
|
Description
|
Average
Annual
interest
rate
|
Average
Maturity date
|
|
2017
|
|
2016
|
|
|
|
|
|
|
|
|
|
Financial loans in
pesos
|
29.97
%
|
February,
2018
|
Ps.
|
437,855
|
Ps.
|
707,468
|
|
Financial loans in
dollars
|
3.38
%
|
May,
2018
|
|
58,200
|
|
-
|
|
Total
|
|
|
Ps
|
496,055
|
Ps.
|
707,468
|
F-148
F-148
15. Other liabilities from financial intermediation –
Non-subordinated corporate bonds
The
balance of the non-subordinated corporate bonds has been included
in the “Other liabilities for financial intermediation”
caption. The residual face values of the different corporate bonds
series issued are as follows:
|
|
|
|
|
December
31,
|
|
|
|
Issue
date
|
Maturity
date
|
Annual interest rate
(a)
|
2017
|
2016
|
|
Banco
Hipotecario S.A.
|
|
|
|
|
|
|
Series XII (US$
44,508 thousand)
|
08/14/13
|
08/14/17
|
3.95%
|
-
|
467,341
|
|
Series XXIX (US$
200,000 thousand)
|
11/30/15
|
11/30/20
|
9.75%
|
3,706,216
|
3,153,644
|
|
Series XXIX (US$
150,000 thousand) Tranche II
|
05/23/16
|
11/30/20
|
9.75%
|
2,816,130
|
2,377,530
|
|
Series XXX (Ps.
314,611)
|
09/04/15
|
03/04/17
|
9 months 28.25% and
then Badlar +450bp
|
-
|
314,611
|
|
Series XXXI (US$
14,730 thousand)
|
09/04/15
|
09/04/18
|
2.00%
|
276,544
|
233,473
|
|
Series XXXII (Ps.
265,770)
|
11/30/15
|
05/30/17
|
3 months 27.0% and
then Badlar +475bp
|
-
|
260,648
|
|
Series XXXIV (Ps.
264,030)
|
02/10/16
|
08/10/17
|
Badlar
+400bp
|
-
|
264,030
|
|
Series XXXV (Ps.
235,970)
|
02/10/16
|
02/10/19
|
Badlar
+499bp
|
230,007
|
235,970
|
|
Series XXXVI (Ps.
469,750)
|
05/18/16
|
11/18/17
|
Badlar
+425bp
|
-
|
469,750
|
|
Series XXXVIII (Ps.
145,200)
|
08/18/16
|
02/18/18
|
Badlar
+300bp
|
145,200
|
145,200
|
|
Series XXXIX (Ps.
343,241)
|
08/18/16
|
08/18/19
|
Badlar
+349bp
|
341,573
|
343,241
|
|
Series XL
(Ps.6,078,320)
|
10/12/16
|
01/12/20
|
Badlar
+250bp
|
5,643,583
|
5,623,320
|
|
Series XLI
(Ps.354,362)
|
02/20/17
|
08/20/18
|
Badlar
+289bp
|
328,314
|
-
|
|
Series XLII
(Ps.645,638)
|
02/20/17
|
02/20/20
|
Badlar
+320bp
|
631,804
|
-
|
|
Series XLIII (UVA
54,606 thousand)
|
05/08/17
|
05/08/20
|
2.75%
|
1,133,581
|
-
|
|
Series XLIV
(Ps.256,644)
|
05/08/17
|
11/08/18
|
Badlar
+275bp
|
255,652
|
-
|
|
Series XLV
(Ps.102,436)
|
05/08/17
|
05/08/20
|
Badlar
+298bp
|
101,914
|
-
|
|
Series XLVI
(Ps.496,855)
|
08/09/17
|
02/09/19
|
Badlar
+425bp
|
494,420
|
-
|
|
Series XLVII (US$
7,233 thousand)
|
08/09/17
|
08/09/19
|
4.00%
|
135,081
|
-
|
|
Series XLVIII
(Ps.6,300,000)
|
11/07/17
|
11/07/22
|
Badlar
+400bp
|
6,240,733
|
-
|
|
|
|
|
|||
|
Tarshop
S.A.
|
|
|
|
|
|
|
Series XIX (Ps.
6,316)
|
11/26/14
|
11/26/17
|
Badlar+525bp
|
-
|
6,273
|
|
Series XXII (Ps.
126,667)
|
07/30/15
|
01/30/17
|
6 months 29.0% and
then Badlar+500bp
|
-
|
125,779
|
|
Series XXIII (Ps.
160,000)
|
11/16/15
|
05/16/17
|
Badlar+600bp
|
-
|
158,879
|
|
Series XXVI (Ps.
156,972)
|
01/26/16
|
07/26/17
|
Badlar+650bp
|
-
|
155,871
|
|
Series XXVII (Ps.
147,288)
|
05/04/16
|
11/04/17
|
Badlar+600bp
|
-
|
146,255
|
|
Clase I (Ps.
204,033)
|
09/07/16
|
03/07/18
|
Badlar+448bp
|
202,643
|
202,604
|
|
Clase II
(Ps.67,360)
|
09/07/16
|
03/07/19
|
Badlar+499bp
|
66,901
|
66,888
|
|
Class III (Ps.
213,031)
|
11/04/16
|
05/04/18
|
Badlar+400bp
|
-
|
211,539
|
|
Clase IV
(Ps.213,301)
|
11/04/16
|
05/04/18
|
Badlar+400bp
|
211,579
|
77,273
|
|
Clase V
(Ps.77,818)
|
11/04/16
|
05/04/19
|
Badlar+425bp
|
77,288
|
-
|
|
Clase VII
(Ps.229,000)
|
01/24/17
|
07/24/18
|
Badlar+400bp
|
227,440
|
-
|
|
Clase VIII
(Ps.53,237)
|
01/24/17
|
07/24/19
|
Badlar+469bp
|
52,875
|
-
|
|
Clase IX
(Ps.288,444)
|
04/20/17
|
10/20/18
|
Badlar+400bp
|
286,479
|
-
|
|
Clase X
(Ps.211,556)
|
04/20/17
|
10/20/19
|
Badlar+474bp
|
210,114
|
-
|
|
Clase XI
(Ps.346,996)
|
07/12/17
|
01/12/19
|
Badlar+500bp
|
344,632
|
-
|
|
Clase XIII
(Ps.250,000)
|
11/10/17
|
05/10/19
|
Badlar+650bp
|
248,297
|
-
|
|
|
|
|
|||
|
BACS
Banco de Crédito y Securitización S.A.
|
|
|
|
|
|
|
Series V (Ps.
150,000)
|
04/17/15
|
01/17/17
|
9 months 27.45% and
then Badlar +450bp
|
-
|
50,010
|
|
Series VI (Ps.
141,666)
|
07/23/15
|
04/24/17
|
27.5%
|
-
|
94,449
|
|
Series VII (Ps.
142,602)
|
02/18/16
|
11/18/17
|
Badlar
+475bp
|
-
|
142,602
|
|
Series VIII (Ps.
150,000)
|
05/24/16
|
11/24/17
|
Badlar
+439bp
|
-
|
150,000
|
|
Series IX (Ps.
249,500)
|
07/27/16
|
07/27/18
|
Badlar
+345bp
|
249,500
|
249,500
|
|
Series X (Ps.
91,000)
|
10/11/16
|
05/11/18
|
Badlar
+375bp
|
91,000
|
91,000
|
|
Series XI (Ps.
201,000)
|
10/11/16
|
10/11/19
|
Badlar
+400bp
|
201,000
|
201,000
|
|
Series XII (Ps.
98,461)
|
04/28/17
|
10/28/18
|
Badlar
+300bp
|
98,461
|
-
|
|
Series XIII (Ps.
201,539)
|
04/28/17
|
04/28/20
|
Badlar
+350bp
|
201,539
|
-
|
|
Series XIV (Ps.
227,886)
|
09/25/17
|
03/25/19
|
Badlar
+475bp
|
227,886
|
-
|
|
Series XV (US$
10,141 thousand)
|
09/25/17
|
09/25/19
|
4.74%
|
190,389
|
-
|
|
|
|
|
|||
|
|
25,668,775
|
16,018,680
|
|||
(a) As of December
31, 2017the Badlar rate was 23.25% per year.
F-149
BANCO HIPOTECARIO S.A. AND SUBSIDIARIES
NOTES TO THE CONSOLIDATED FINANCIAL STATEMENTS
For the years ended December 31, 2017, 2016 and 2015
(Expressed in thousands of Argentine pesos, except share data and
as otherwise indicated)
The
contractual maturities of the non-subordinated corporate bonds as
of December 31, 2017 are as follows:
|
December 31,
2018
|
Ps.
2,372,812
|
|
December 31,
2019
|
2,820,463
|
|
December 31,
2020
|
14,234,767
|
|
Thereafter
|
6,240,733
|
|
Total
|
Ps.
25,668,775
|
The
General Ordinary Shareholders held on April 13, 2016, approved the
extension of the Bank’s Global Program for the issuance of
notes for up to US dollars eight hundred million (US$ 800,000,000)
or its equivalent in pesos currently in force for a term of up to 5
years , or the longer year permitted by applicable
law.
On May
23, 2016, the Bank issued Series XXIX – Tranche II in the
international market for a total of US$ 150 million. The proceeds
from the issuance were used, in part, to fund the purchase of
“Edificio del Plata”.
On June
15, 2016 the Bank’s Board of Directors approved the increase
in the Program amount for up to US Dollars one billion (US$
1,000,000,000) or its equivalent in pesos.
16. Subordinated corporate bonds
On
December 12, 2013, BACS’ shareholders’ meeting,
approved the issuance of convertible subordinated corporate bonds
through private offering up to Ps.100,000.
On June
22, 2015, BACS issued corporate bonds that are convertible into its
ordinary and book-entry shares for a principal amount of
Ps.100,000. Such bonds were fully subscribed by IRSA Inversiones y
Representaciones Sociedad Anónima (“IRSA”), one of
the Bank’s shareholders.
On June
21, 2016, IRSA notified BACS its decision to exercise its
conversion rights, which was approved by the BCRA through
Resolution No. 63, dated February 7, 2017.
As a
result, the Banks’s interest in BACS decreased from 87.50% to
62.28%.
17. Level I American Depositary Receipts Program
On
March 27, 2006, the SEC declared the Level I American Depositary
Receipts “ADR” program.
This
program allows foreign investors to buy the Bank’s stock
through the secondary market where ADRs are traded freely within
the United States. The Bank of New York has been appointed as
depositary institution.
18. Derivative Financial Instruments
The
Bank has carried out its financial risk management through the
subscription of several derivative financial instruments.
Derivative financial instruments are recorded under the captions
“Other receivable from financial intermediation –
Amounts receivable under derivative financial instruments” or
Liabilities: “Other liabilities from financial intermediation
– Amounts payable under derivative financial
instruments” in the Consolidated Balance Sheet, and the
related gain or loss under the captions “Financial Income
– Others” or: “Financial Expenses –
Others”, respectively, in the Consolidated Statement of
Income.
F-150
BANCO HIPOTECARIO S.A. AND SUBSIDIARIES
NOTES TO THE CONSOLIDATED FINANCIAL STATEMENTS
For the years ended December 31, 2017, 2016 and 2015
(Expressed in thousands of Argentine pesos, except share data and
as otherwise indicated)
The
following are the derivative financial instruments outstanding as
of December 31, 2017 and 2016:
|
|
Notional
amount
|
Net
Book Value Asset/(Liabilities)
|
Fair
Value
|
|||
|
Type
of Contract
|
2017
|
2016
|
2017
|
2016
|
2017
|
2016
|
|
|
|
|
|
|
|
|
|
Futures
(a)
|
|
|
|
|
|
|
|
Purchase foreign
currency
|
1,960,221
|
24,496,972
|
(65,756
)
|
(187,108
)
|
(65,756
)
|
(187,108
)
|
|
Sales foreign
currency
|
(896,567
)
|
(23,015,869
)
|
46,217
|
169,717
|
46,217
|
169,717
|
(a)
Underlying: Foreign
currency.
Future
currency transactions have been carried out through which the
forward purchase and sale of foreign currencies (US dollar) was
agreed upon. Settlement is carried on a daily basis for the
difference.
For
these transactions, during the years ended December 31, 2017, 2016
and 2015, the Bank has recognized losses of Ps.(273,472), and gains
of Ps. 90,900, 322,950, respectively.
19. Securitization of mortgage loans, consumer loans and credit
card loans
The
Bank issued separate financial trusts under “Cédulas
Hipotecarias Argentina – program”; and a consumer loans
financial trust under BACS’s Global Trust Securities Program.
For each mortgage or consumer trust, the Bank transfers a portfolio
of mortgages or consumer loans in trust to the relevant trustee.
The trustee then issues Class A debt securities, Class B debt
securities and certificates of participation. The financial
trust’s payment obligations in respect of these instruments
are collateralized by, and recourse is limited to, the
trust’s assets consisting of the portfolio of mortgage or
consumer loans and any reserve fund established by the Bank or the
trustee for such purpose. The securitizations were recorded as
sales, and accordingly, the mortgage and consumer loans conveyed to
the financial trusts are no longer recorded as assets of the
Bank.
F-151
BANCO HIPOTECARIO S.A. AND SUBSIDIARIES
NOTES TO THE CONSOLIDATED FINANCIAL STATEMENTS
For the years ended December 31, 2017, 2016 and 2015
(Expressed in thousands of Argentine pesos, except share data and
as otherwise indicated)
|
|
Class A Debt
Securities
|
Class B Debt
Securities
|
Certificates
of
Participation
|
Total
|
|
|
|
|
|
|
|
BACS III –
Issued on 12.23.2005
|
|
|
|
|
|
Face value in
Ps.
|
77,600
|
1,200
|
1,200
|
80,000
|
|
Declared Maturity
Date
|
03.20.2013
|
09.20.2013
|
08.20.2015
|
|
|
|
|
|
|
|
|
BACS Funding I
Issued on 11.15.2001 (*)
|
|
|
|
|
|
Face value in
Ps.
|
-
|
-
|
29,907
|
29,907
|
|
Declared Maturity
Date
|
|
|
11.15.2031
|
|
|
|
|
|
|
|
|
CHA VI Issued on
04.07.2006
|
|
|
|
|
|
Face value in
Ps.
|
56,702
|
-
|
12,447
|
69,149
|
|
Declared Maturity
Date
|
12.31.2016
|
|
12.31.2026
|
|
|
|
|
|
|
|
|
CHA VII Issued on
09.27.2006
|
|
|
|
|
|
Face value in
Ps.
|
58,527
|
-
|
12,848
|
71,375
|
|
Declared Maturity
Date
|
08.31.2017
|
|
02.28.2028
|
|
|
|
|
|
|
|
|
CHA VIII Issued on
03.26.2007
|
|
|
|
|
|
Face value in
Ps.
|
61.088
|
-
|
13,409
|
74.497
|
|
Declared Maturity
Date
|
08.31.2024
|
|
08.31.2028
|
|
|
|
|
|
|
|
|
CHA IX Issued on
08.28.2009
|
|
|
|
|
|
Face value in
Ps.
|
192,509
|
-
|
10,132
|
202,641
|
|
Declared Maturity
Date
|
02.07.2027
|
|
07.07.2027
|
|
|
|
|
|
|
|
|
CHA X Issued on
08.28.2009
|
|
|
|
|
|
Face value in
Ps.
|
-
|
-
|
17,224
|
17,224
|
|
Face value in
US$
|
85,001
|
-
|
-
|
85,001
|
|
Declared Maturity
Date
|
01.07.2027
|
|
06.07.2028
|
|
|
|
|
|
|
|
|
CHA XI Issued on
12.21.2009
|
|
|
|
|
|
Face value in
Ps.
|
204,250
|
-
|
10,750
|
215,000
|
|
Declared Maturity
Date
|
03.10.2024
|
|
10.10.2024
|
|
|
|
|
|
|
|
|
CHA XII Issued on
07.21.2010
|
|
|
|
|
|
Face value in
Ps.
|
259,932
|
-
|
13,680
|
273,612
|
|
Declared Maturity
Date
|
11.10.2028
|
|
02.10.2029
|
|
|
|
|
|
|
|
|
CHA XIII Issued on
12.02.2010
|
|
|
|
|
|
Face value in
Ps.
|
110,299
|
-
|
5,805
|
116,104
|
|
Declared Maturity
Date
|
12.10.2029
|
|
04.10.2030
|
|
|
|
|
|
|
|
|
CHA XIV Issued on
03.18.2011
|
|
|
|
|
|
Face value in
Ps.
|
119,876
|
-
|
6,309
|
126,185
|
|
Declared Maturity
Date
|
05.10.2030
|
|
08.10.2030
|
|
|
|
|
|
|
|
Additionally,
as of December 31, 2016, the following financial trusts were also
outstanding:
|
|
Debt
Securities
Class
A1/AV
|
Debt
Securities
Class
A2/AF
|
Debt
Securities
Class B
|
Certificates
of
Participation
|
Total
|
|
|
|
|
|
|
|
|
BHN II –
Issued on 05.09.97 (*)
|
|
|
|
|
|
|
Face value in
Ps.
|
44,554
|
51,363
|
3,730
|
6,927
|
106,574
|
|
Declared Maturity
Date
|
03.25.2001
|
07.25.2009
|
03.25.2012
|
05.25.2013
|
|
|
|
|
|
|
|
|
|
BHN III –
Issued on 10.29.97 (*)
|
|
|
|
|
|
|
Face value in
Ps.
|
14,896
|
82,090
|
5,060
|
3,374
|
105,420
|
|
Declared Maturity
Date
|
05.31.2017
|
05.31.2017
|
05.31.2018
|
05.31.2018
|
|
|
|
|
|
|
|
|
|
BHN IV –
Issued on 03.15.00 (*)
|
|
|
|
|
|
|
Face value in
Ps.
|
36,500
|
119,500
|
24,375
|
14,625
|
195,000
|
|
Declared Maturity
Date
|
03.31.2011
|
03.31.2011
|
01.31.2020
|
01.31.2020
|
|
|
|
|
|
|
|
|
|
BACS I –
Issued on 02.15.2001 (*)
|
|
|
|
|
|
|
Face value in
Ps.
|
30,000
|
65,000
|
12,164
|
8,690
|
115,854
|
|
Declared Maturity
Date
|
05.31.2010
|
05.31.2010
|
06.30.2020
|
06.30.2020
|
|
|
|
|
|
|
|
|
|
BACS Funding II
Issued on 11.23.2001 (*)
|
|
|
|
|
|
|
Face value in
Ps.
|
-
|
-
|
-
|
12,104
|
12,104
|
|
Declared Maturity
Date
|
|
|
|
11.23.2031
|
|
|
|
|
|
|
|
|
|
BHSA I Issued on
02.01.2002
|
|
|
|
|
|
|
Face value in
Ps.
|
-
|
-
|
-
|
43,412
|
43,412
|
|
Declared Maturity
Date
|
|
|
|
02.01.2021
|
|
F-152
BANCO HIPOTECARIO S.A. AND SUBSIDIARIES
NOTES TO THE CONSOLIDATED FINANCIAL STATEMENTS
For the years ended December 31, 2017, 2016 and 2015
(Expressed in thousands of Argentine pesos, except share data and
as otherwise indicated)
(*)
Financial trusts
subject to the translation of foreign currency assets and
liabilities at the $1.00=US$1 rate established by Law 25,561 and
Decree 214, as they were created under Argentine legislation.
Certain holders of Class A debt securities have started declarative
actions against the trustee pursuant to the application of the
pesification measures set forth in Law 25,561 and Decree 214, in
order to maintain the currency of origin of said securities. In
these declarative actions, the Bank acted together with BACS as
third party. The trustee has duly answered to this claim, being the
final resolution to this situation still pending.
Tarshop
S.A. has created several financial trusts under its securitization
program (“Valores Fiduciarios Tarjeta Shopping – Global
program”) to assure its long-term financing accessing
directly to the capital market. The assets included in the
financial trusts relate to credit card coupons and advances in
cash.
The
table below presents the financial trusts issued and outstanding as
of December 31, 2017:
|
|
Debt
Securities
|
Certificates
of
Participation
|
Total
|
|
|
|
|
|
|
Series XCIV–
Issued on 09.30.16
|
177,248
|
102,324
|
279,572
|
|
Face value in
Ps.
|
|
|
|
|
|
|
|
|
|
Series
XCV–Issued on 11.17.16
|
186,506
|
99,985
|
286,491
|
|
Face value in
Ps.
|
|
|
|
|
|
|
|
|
|
Series
XCVI–Issued on 04.28.17
|
|
|
|
|
Face value in
Ps.
|
180,373
|
89,440
|
269,813
|
|
|
|
|
|
|
Series
XCVII–Issued on 06.21.17
|
|
|
|
|
Face value in
Ps.
|
222,391
|
99,448
|
321,839
|
|
|
|
|
|
|
Series
XCVIII–Issued on 05.02.17
|
|
|
|
|
Face value in
Ps.
|
233,133
|
104,252
|
337,385
|
|
|
|
|
|
|
Series
XCIX–Issued on 06.12.17
|
|
|
|
|
Face value in
Ps.
|
210,583
|
107,518
|
318,101
|
|
Series
C–Issued on 10.02.17
|
|
|
|
|
Face value in
Ps.
|
237,281
|
121,149
|
358,430
|
|
|
|
|
|
|
Series
CI–Privately issued on 10.15.17
|
|
|
|
|
Face value in
Ps.
|
155,411
|
122,533
|
277,944
|
|
|
|
|
|
|
Series
CII–Privately issued on 11.15.17
|
|
|
|
|
Face value in
Ps.
|
173,505
|
89,973
|
263,478
|
|
|
|
|
|
|
Tarshop Privado
Series III - Privately issued on 10.15.16
|
|
|
|
|
Face value in
Ps.
|
2,813,000
|
691,530
|
3,504,530
|
|
|
|
|
|
|
Tarshop Privado
Series IV - Privately issued on 12.15.17
|
|
|
|
|
Face value in
Ps.
|
227,000
|
73,982
|
300,982
|
|
|
|
|
|
F-153
BANCO HIPOTECARIO S.A. AND SUBSIDIARIES
NOTES TO THE CONSOLIDATED FINANCIAL STATEMENTS
For the years ended December 31, 2017, 2016 and 2015
(Expressed in thousands of Argentine pesos, except share data and
as otherwise indicated)
The
table below presents the financial trusts issued and outstanding as
of December 31, 2016:
|
|
Debt
Securities
|
Certificates
of
Participation
|
Total
|
|
|
|
|
|
|
Series
LXXXV–Issued on 11.24.15
|
|
|
|
|
Estimated Maturity
Date
|
|
|
|
|
Face value in
Ps.
|
128,500
|
47,800
|
176,300
|
|
|
|
|
|
|
Series
LXXXVI–Issued on 06.29.15
|
|
|
|
|
Face value in
Ps.
|
126,050
|
48,168
|
174,218
|
|
|
|
|
|
|
Series
LXXXVII–Issued on 10.01.15
|
|
|
|
|
Face value in
Ps.
|
141,066
|
57,091
|
198,157
|
|
Series
LXXXVIII– Issued on 12.28.15
|
|
|
|
|
Face value in
Ps.
|
148,488
|
65,472
|
213,960
|
|
|
|
|
|
|
Series
LXXXIX– Issued on 02.29.16
|
|
|
|
|
Face value in
Ps.
|
143,530
|
63,282
|
206,812
|
|
|
|
|
|
|
Series XC–
Issued on 03.28.16
|
|
|
|
|
Face value in
Ps.
|
150,025
|
66,163
|
216,188
|
|
|
|
|
|
|
Series XCI–
Issued on 05.11.16
|
|
|
|
|
Face value in
Ps.
|
148,300
|
68,189
|
216,489
|
|
|
|
|
|
|
Series XCII–
Issued on 06.07.16
|
|
|
|
|
Face value in
Ps.
|
155,700
|
71,598
|
227,298
|
|
|
|
|
|
|
Series XCIII–
Issued on 08.17.16
|
|
|
|
|
Face value in
Ps.
|
166,715
|
76,652
|
243,367
|
|
|
|
|
|
|
Series XCIV–
Issued on 09.30.16
|
177,248
|
102,324
|
279,572
|
|
Face value in
Ps.
|
|
|
|
|
|
|
|
|
|
Series
XCV–Issued on 11.17.16
|
186,506
|
99,985
|
286,491
|
|
Face value in
Ps.
|
|
|
|
|
|
|
|
|
|
Tarshop Privado
Series 1 - Privately issued on 08.25.15
|
|
|
|
|
Face value in
Ps.
|
964,595
|
223,962
|
1,187,962
|
|
|
|
|
|
|
Tarshop Privado
Series 1I - Privately issued on 12.23.15
|
|
|
|
|
Face value in
Ps.
|
1,980,800
|
761,029
|
2,741,829
|
|
|
|
|
|
|
Tarshop Privado
Series III - Privately issued on 10.24.16
|
|
|
|
|
Face value in
Ps.
|
386,000
|
171,090-
|
817,090
|
|
|
|
|
|
BACS
Banco de Crédito y Securitización S.A. (BACS) has issued
separate financial trusts which underlying assets are personal
loans, primary originated by cooperatives and later acquired by
BACS. The mentioned financial trusts have been issued under the
“Fideicomisos Financieros BACS – Global program”.
As of December 31, 2017 and 2016 there are no trusts
outstanding.
As of
December 31, 2017 and 2016, the Bank held in its portfolio the
following securities corresponding to the abovementioned financial
trusts:
F-154
BANCO HIPOTECARIO S.A. AND SUBSIDIARIES
NOTES TO THE CONSOLIDATED FINANCIAL STATEMENTS
For the years ended December 31, 2017, 2016 and 2015
(Expressed in thousands of Argentine pesos, except share data and
as otherwise indicated)
|
|
December
31,
|
|
|
|
2017
|
2016
|
|
|
|
|
|
Class A debt
securities – CHA VI to CHA XIV
|
Ps.
85,721
|
Ps.
101,961
|
|
Debt securities
– BACS III
|
12,452
|
13,517
|
|
Debt securities
– Tarshop Series LXXXVII
|
-
|
7,871
|
|
Debt securities
– Tarshop Series LXXXVIII
|
33,268
|
-
|
|
Debt securities
– Tarshop Series XCIV
|
1,851
|
38,096
|
|
Debt securities
– Tarshop Series XCV
|
-
|
34,422
|
|
Debt securities
– Tarshop Series C
|
29,241
|
-
|
|
Debt securities
– Tarshop Series CI
|
42,129
|
-
|
|
Debt securities
– Tarshop Series CII
|
40,869
|
-
|
|
Debt securities
– Tarshop Privado Series II
|
-
|
958,652
|
|
Debt securities
– Tarshop Privado Series III
|
1,325,098
|
610,826
|
|
Debt securities
– Tarshop Privado Series IV
|
228,880
|
-
|
|
Debt securities
– Tarshop Series I
|
-
|
276,591
|
|
Subtotal
|
Ps.
1,799,509
|
Ps.
2,041,936
|
|
|
December
31,
|
|
|
|
2017
|
2016
|
|
|
|
|
|
Certificates of
participation – CHA VI
|
Ps.
-
|
Ps.
13,095
|
|
Certificates of
participation – CHA IX
|
7,079
|
8,782
|
|
Certificates of
participation – CHA X
|
19,156
|
24,446
|
|
Certificates of
participation – CHA XI
|
10,013
|
11,173
|
|
Certificates of
participation – CHA XII
|
10,660
|
12,386
|
|
Certificates of
participation – CHA XIII
|
1,100
|
3,132
|
|
Certificates of
participation – CHA XIV
|
646
|
3,063
|
|
Certificates of
participation – BHSA I
|
9,446
|
8,949
|
|
Certificates of
participation – BACS III
|
1,003
|
1,003
|
|
Certificates of
Participation – Tarshop Series LXXXV
|
-
|
22,435
|
|
Certificates of
Participation – Tarshop Series LXXXVI
|
-
|
27,681
|
|
Certificates of
Participation – Tarshop Series LXXXVII
|
-
|
25,357
|
|
Certificates of
Participation – Tarshop Series LXXXVIII
|
-
|
36,843
|
|
Certificates of
Participation – Tarshop Series LXXXIX
|
-
|
32,902
|
|
Certificates of
Participation – Tarshop Series XC
|
-
|
35,058
|
|
Certificates of
Participation – Tarshop Series XCI
|
-
|
35,034
|
|
Certificates of
Participation – Tarshop Series XCII
|
-
|
49,677
|
|
Certificates of
Participation – Tarshop Series XCIII
|
-
|
56,947
|
|
Certificates of
Participation – Tarshop Series XCIV
|
36,184
|
34,662
|
|
Certificates of
Participation – Tarshop Series XCV
|
35,821
|
35,574
|
|
Certificates of
Participation – Tarshop Series XCVI
|
31,472
|
-
|
|
Certificates of
Participation – Tarshop Series XCVII
|
35,220
|
-
|
|
Certificates of
Participation – Tarshop Series XCVIII
|
38,846
|
-
|
|
Certificates of
Participation – Tarshop Series XCIX
|
44,080
|
-
|
|
Certificates of
Participation – Tarshop Series C
|
52,271
|
-
|
|
Certificates of
Participation – Tarshop Series CI
|
31,776
|
-
|
|
Certificates of
Participation – Tarshop Series CII
|
12,549
|
-
|
|
Certificates of
Participation – Tarshop Privado Series I
|
-
|
177,261
|
|
Certificates of
Participation – Tarshop Privado Series II
|
-
|
515,666
|
|
Certificates of
Participation – Tarshop Privado Series III
|
444,698
|
141,762
|
|
Certificates of
Participation – Tarshop Privado Series IV
|
36,589
|
-
|
|
Certificates of
Participation – Tarshop Series I
|
(4
)
|
(7
)
|
|
Subtotal
|
Ps.
858,605
|
Ps.
1,312,881
|
|
Total
|
Ps.
2,658,114
|
Ps.
3,354,817
|
20. Miscellaneous Liabilities
The
breakdown of the caption “Other” consist of the
following as of the end of each year:
|
|
December
31,
|
|||
|
|
2017
|
2016
|
||
|
Sundry
creditors .
|
Ps.
|
26,481
|
Ps.
|
27,860
|
|
Other expenses
payable .
|
|
871,751
|
|
971,098
|
|
Tax withholding to
be deposited
|
|
103,098
|
|
115,161
|
|
Taxes
payable
|
|
563,768
|
|
488,714
|
|
Payroll
withholdings and contributions
|
|
131,439
|
|
104,279
|
|
Salaries and social
security charges payable
|
|
821,136
|
|
447,491
|
|
Total
|
Ps.
|
2,517,673
|
Ps.
|
2,154,603
|
F-155
BANCO HIPOTECARIO S.A. AND SUBSIDIARIES
NOTES TO THE CONSOLIDATED FINANCIAL STATEMENTS
For the years ended December 31, 2017, 2016 and 2015
(Expressed in thousands of Argentine pesos, except share data and
as otherwise indicated)
21. Breakdown of captions included in the income
statement
|
|
December
31,
|
||
|
|
2017
|
2016
|
2015
|
|
Financial
Income
|
|
|
|
|
Interest
on other loans
|
|
|
|
|
Personal
loans
|
Ps.
2,275,263
|
Ps.
1,378,981
|
Ps.
1,029,361
|
|
Public
sector
|
30,232
|
7,077
|
10,255
|
|
Other short term
loans in pesos
|
735,770
|
831,440
|
807,818
|
|
Other short term
loans in US dollars, loans for the financing of manufacturers and
export prefinancing
|
225,954
|
103,482
|
55,648
|
|
Total
|
Ps.
3,267,219
|
Ps.
2,320,980
|
Ps.
1,903,082
|
|
|
December
31,
|
||
|
|
2017
|
2016
|
2015
|
|
Financial
Income
|
|
|
|
|
Other
|
|
|
|
|
Premiums on repo
transactions
|
Ps.
377,601
|
Ps.
145,873
|
Ps.
75,352
|
|
Forward
transactions
|
10,461
|
90,900
|
322,950
|
|
Other
|
3,084
|
1,982
|
5,199
|
|
Total
|
Ps.
391,146
|
Ps.
238,755
|
Ps.
403,501
|
|
|
December
31,
|
||
|
|
2017
|
2016
|
2015
|
|
Financial
Expenses
|
|
|
|
|
Other
|
|
|
|
|
Turnover tax on
financial income
|
Ps.
766,190
|
Ps.
640,334
|
Ps.
457,219
|
|
Premiums on forward
transactions
|
283,933
|
-
|
-
|
|
Premiums on swap
and repo transactions
|
71,579
|
90,717
|
26,666
|
|
Result from
interest rate swaps
|
43,017
|
81,198
|
57,902
|
|
Total
|
Ps.
1,164,719
|
Ps.
812,249
|
Ps.
541,787
|
|
|
December
31,
|
||
|
|
2017
|
2016
|
2015
|
|
Income
from services
|
|
|
|
|
Other
|
|
|
|
|
Insurance premiums
and services
|
Ps.
2,170,931
|
Ps.
2,001,188
|
Ps.
1,475,554
|
|
Services on
loans
|
153,343
|
92,880
|
65,820
|
|
Fees from
PROCREAR
|
345,189
|
253,992
|
196,614
|
|
Other
|
514,334
|
456,769
|
798,207
|
|
Total
|
Ps.
3,183,797
|
Ps.
2,804,829
|
Ps.
2,536,195
|
|
|
December
31,
|
||
|
|
2017
|
2016
|
2015
|
|
Expenses
for services
|
|
|
|
|
Other
|
|
|
|
|
Insurance
claims
|
Ps.
225,479
|
Ps.
190,287
|
Ps.
118,920
|
|
Services on
loans
|
844,050
|
398,661
|
419,078
|
|
Turnover
tax
|
195,421
|
119,754
|
106,913
|
|
Other
|
149,440
|
130,681
|
90,170
|
|
Total
|
Ps.
1,414,390
|
Ps.
839,383
|
Ps.
735,081
|
F-156
BANCO HIPOTECARIO S.A. AND SUBSIDIARIES
NOTES TO THE CONSOLIDATED FINANCIAL STATEMENTS
For the years ended December 31, 2017, 2016 and 2015
(Expressed in thousands of Argentine pesos, except share data and
as otherwise indicated)
|
|
December 31,
|
||
|
|
2017
|
2016
|
2015
|
|
Miscellaneous
income
|
|
|
|
|
Other
|
|
|
|
|
Gain on sales of
bank premises and equipment and miscellaneous assets
|
Ps.
61,215
|
Ps.
1,967
|
Ps.
2,363
|
|
Rental
income…..
|
5,582
|
3,236
|
2,742
|
|
Interest on loans
to employees
|
39,148
|
38,094
|
33,015
|
|
Income from equity
investments
|
88,277
|
30,260
|
394
|
|
Income from
collateral assets
|
48,122
|
76,413
|
74,360
|
|
Other
|
17,636
|
10,344
|
4,484
|
|
Total
|
Ps.
259,980
|
Ps.
160,314
|
Ps.
117,358
|
|
|
December
31,
|
||
|
|
2017
|
2016
|
2015
|
|
Miscellaneous
expenses
|
|
|
|
|
Other
|
|
|
|
|
Turnover
tax
|
Ps.
14,491
|
Ps.
9,919
|
Ps.
8,673
|
|
Other
taxes
|
276,515
|
191,652
|
138,780
|
|
Debit card and
credit card expenses
|
79,967
|
101,577
|
73,515
|
|
Benefits
prepayments
|
14,690
|
3,785
|
5,355
|
|
Donations
|
34,037
|
48,877
|
36,529
|
|
Payment Summary
proceedings in financial matters N° 1320 (*)
|
-
|
-
|
53,632
|
|
Other
|
141,716
|
68,094
|
53,957
|
|
Total
|
Ps.
561,416
|
Ps.
423,904
|
Ps.
370,441
|
(*)
During the fiscal year 2015, the Bank’s Board of Directors
granted its approval to the actions undertaken by the Executive
Committee concerning the deposit of the penalties imposed on
directors, former directors, managers, former managers and
statutory auditors and the fact that such amounts were charged
against the statement of income in the framework of the Financial
Summary Proceedings No. 1320 (Note 28).
22. Balances in Foreign Currency
The
balances of assets and liabilities denominated in foreign currency
(principally in US dollars and Euros) are as follows:
|
|
US$
|
Euro
|
Yen
|
Total
|
|
|
(in
Pesos)
|
|||
|
Assets:
|
|
|
|
|
|
Cash and due from
banks
|
1,350,602
|
35,134
|
-
|
1,385,736
|
|
Government and
corporate securities
|
2,415,592
|
36,920
|
-
|
2,452,512
|
|
Loans
|
5,141,963
|
-
|
-
|
5,141,963
|
|
Other receivables
from financial intermediation
|
867,835
|
-
|
-
|
867,835
|
|
Miscellaneous
receivables
|
158,392
|
-
|
-
|
158,392
|
|
Items pending
allocation
|
-
|
-
|
-
|
-
|
|
Total as of
December 31, 2017
|
9,934,384
|
72,054
|
-
|
10,006,438
|
|
Total as of
December 31, 2016
|
11,341,542
|
42,523
|
9
|
11,384,074
|
|
|
|
|
|
|
|
Liabilities:
|
|
|
|
|
|
Deposits
|
3,400,307
|
-
|
-
|
3,400,307
|
|
Other liabilities
from financial intermediation
|
7,785,601
|
53
|
-
|
7,785,654
|
|
Miscellaneous
liabilities
|
10,325
|
-
|
-
|
10,325
|
|
Items
pending allocation
|
1,067
|
-
|
-
|
1,067
|
|
Total as of
December 31, 2017
|
11,197,300
|
53
|
-
|
11,197,353
|
|
Total as of
December 31, 2016
|
10,988,592
|
38
|
-
|
10,988,630
|
F-157
BANCO HIPOTECARIO S.A. AND SUBSIDIARIES
NOTES TO THE CONSOLIDATED FINANCIAL STATEMENTS
For the years ended December 31, 2017, 2016 and 2015
(Expressed in thousands of Argentine pesos, except share data and
as otherwise indicated)
23. Income Tax
In
accordance with Section 28 of Law 24,855, Banco Hipotecario
Sociedad Anónima is subject to income tax, except for housing
loan transactions made before October 23, 1997, the registration
date of its bylaws with the Superintendency of
Corporations.
The
Bank and its subsidiaries charge to income, when applicable, their
income tax estimation and record a provision in their liabilities
for the same amount.
Income
tax for the fiscal years ended December 31, 2017, 2016 and 2015,
amounted to Ps.532,658, Ps.516,179 and Ps.618,899,
respectively.
24. Minimum Presumed Income Tax
Minimum
presumed income tax was created by Law No. 25,063 to be in effect
for 10 years as from fiscal year 1998, which term was extended by
Law No. 26,545 until December 30, 2019. In addition, Law No. 27,260
in its Section 76 set forth that the tax was to be repealed for the
fiscal years beginning on January 1, 2019.
This is
a complementary tax of income tax. Minimum presumed income tax
consists of minimum taxation, on certain productive assets at a 1%
tax rate. The ultimate tax obligation will be the higher between
minimum presumed income tax or income tax. For financial entities,
the taxable basis will be 20% of their computable assets. If in a
fiscal year, minimum presumed income tax exceeds income tax
presumed, the surplus will be computable as a down payment of any
income tax in excess of minimum presumed income tax through the
next ten years.
Given
the provisions of Communication “A” 4,295, the Bank
capitalized the tax credit based on the income for book and tax
purposes on the basis of the Business Plan submitted to the
Argentine Central Bank as well as estimates of the main
macroeconomic variables and the changes in the financial system for
the following ten fiscal years.
The
following are the Bank’s credit balances at the closing of
these financial statements:
|
|
Credit
balance as of December 31,
|
|
|
|
Year
of generation
|
2017
|
2016
|
Expiration
date
|
|
2008
|
-
|
3,100
|
2018
|
|
2009
|
-
|
3,535
|
2019
|
|
2010
|
-
|
4,328
|
2020
|
|
2011
|
-
|
11,869
|
2021
|
|
2012
|
10,143
|
10,592
|
2022
|
|
2013
|
10,200
|
10,200
|
2023
|
|
2014
|
13,487
|
13,487
|
2024
|
|
2015
|
18,141
|
18,141
|
2025
|
|
2016
|
81,796
|
22,195
|
2026
|
|
2017
|
33,243
|
-
|
2027
|
|
|
167,010
|
97,447
|
|
25. Shareholders' Equity
The
following information relates to the statements of changes in the
Bank’s shareholders' equity.
F-158
BANCO HIPOTECARIO S.A. AND SUBSIDIARIES
NOTES TO THE CONSOLIDATED FINANCIAL STATEMENTS
For the years ended December 31, 2017, 2016 and 2015
(Expressed in thousands of Argentine pesos, except share data and
as otherwise indicated)
(a)
Common Stock
Prior
to December 31, 1997, the Bank's capital stock consisted of
assigned capital with no par value owned 100% by the Argentine
government. In accordance with the by-laws approved as a result of
the conversion of the Bank to a
sociedad anónima
, the Bank's
capital stock was established at Ps.1,500,000 and divided into four
classes of ordinary common shares.
As of
December 31, 2017, the Bank's capital stock consists
of:
|
Shareholder
|
Class
of authorized
Shares
|
Number
of
Shares
|
Total
%
Ownership
|
Par
value per share
|
Voting
Rights
|
|
Argentine
government (through FFFRI) (b)
|
A
|
664,555,037
|
44.3
%
|
Ps. 1
|
1 vote
|
|
Banco Nación
, as trustee for the
Bank's
Programa de Propiedad
Participada
(a)
|
B
|
57,009,279
|
3.8
%
|
Ps. 1
|
1 vote
|
|
Argentine
government (through FFFRI)
|
C
|
75,000,000
|
5.0
%
|
Ps. 1
|
1 vote
|
|
Public investors
(c) (d)
|
D
|
703,435,684
|
46.9
%
|
Ps. 1
|
3
votes
|
|
|
|
1,500,000,000
|
100.0
%
|
|
|
The
number of authorized shares is 1,500,000,000 of which the Bank has
issued and outstanding 1,463,365,267 and 36,634,733 allocated in
treasury stock.
The
changes in each class of common shares for each year presented are
as follows:
|
Class
of shares
|
31/12/2014
|
PPP
(a)
|
31/12/2015
|
PPP
(a)
|
31/12/2016
|
PPP
(a)
|
31/12/2017
|
|
|
|
|
|
|
|
|
|
|
A
|
669,725,120
|
(3,649,402
)
|
666,075,718
|
(1,016,611
)
|
665,059,107
|
(504,070
)
|
664,555,037
|
|
B
|
57,009,279
|
-
|
57,009,279
|
-
|
57,009,279
|
-
|
57,009,279
|
|
C
|
75,000,000
|
-
|
75,000,000
|
-
|
75,000,000
|
-
|
75,000,000
|
|
D
|
698,265,601
|
3,649,402
|
701,915,003
|
1,016,611
|
702,931,614
|
504,070
|
703,435,684
|
|
|
1,500,000,000
|
-
|
1,500,000,000
|
-
|
1,500,000,000
|
-
|
1,500,000,000
|
_______
(a)
The Bank's
Programa de Propiedad
Participada
(“PPP”) is the Bank's employee
compensation plan”. Under Decree 2127/2012 and Resolution
264/2013 issued by the Ministry of Economy and Public Finance, the
PPP was implemented. Under this plan, in a first stage, out of a
total of 75,000,000, 17,990,721 Class B shares were converted into
Class A shares, to be allocated among the employees that have
withdrawn from the Bank in accordance with the implementation
guidelines. Upon delivery to the former employees, the 17,990,721
shares will become Class D shares. The shares allocated to the
Bank’s current employees are designated as Class B shares,
representing the PPP.
On
December 2, 2015, the Bank took notice of an observation raised by
the Superintendent of Financial Institutions reporting to the
Argentine Central Bank with regard to the insurance business
developed by Banco Hipotecario S.A. through BHN Vida S.A. and BHN
Seguros Generales S.A.
The
observation requires the enforcement of the credit scoring
regulations, which impose a 12.5% limit on interests in the capital
stock and voting rights of other companies.
In
reply, the Bank has claimed that such observation should be
revised, because the Bank is allowed to conduct the business in
question pursuant to the Privatization Law No. 24,855 and its
regulations, in particular Decree No. 1394/98, as continuing
company of Banco Hipotecario Nacional.
F-159
BANCO HIPOTECARIO S.A. AND SUBSIDIARIES
NOTES TO THE CONSOLIDATED FINANCIAL STATEMENTS
For the years ended December 31, 2017, 2016 and 2015
(Expressed in thousands of Argentine pesos, except share data and
as otherwise indicated)
(b)
Under the Bylaws,
the affirmative vote of the holders of Class A Shares is required
in order to carry out: (i) mergers or spin-offs; (ii) an
acquisition of shares (constituting a Control Acquisition or
resulting in the Bank being subject to a control situation); (iii)
the transfer to third parties of a substantial part of the loan
portfolio of the Bank; (iv) a change in the Bank’s corporate
purpose; (v) the transfer of the Bank’s corporate domicile
outside of Argentina; and (vi) the voluntary dissolution of the
Bank.
(c)
For so long as
Class A Shares represent more than 42% of the Bank’s capital,
the Class D Shares shall be entitled to three votes per share,
except that holders of Class D Shares will be entitled to one vote
per share in the case of a vote on: (i) a fundamental change in the
Bank’s corporate purpose; (ii) a change of the Bank’s
domicile to be outside of Argentina; (iii) dissolution prior to the
expiration of the Bank’s corporate existence; (iv) a merger
or spin-off in which the Bank is not the surviving corporation; and
(v) a total or partial recapitalization following a mandatory
reduction of capital.
(d)
Treasury stock
By
reason of the expiration on January 29, 2009 of the Total Return
Swap that had been executed and delivered on January 29, 2004,
Deutsche Bank AG transferred to the Bank 71,100,000 ordinary Class
“D” shares in Banco Hipotecario Sociedad Anónima
with face value $ 1 each, which are available for the term and in
the conditions prescribed by the Argentine Companies Law (Law
19,550), in its Section 221. The General Ordinary
Shareholders’ Meeting held on April 30, 2010 resolved to
extend for a year, counted as from January 31, 2010, the term for
realizing the treasury stock held by the Bank.
On
April 30, 2010, the General Extraordinary Shareholders’
Meeting resolved to delegate upon the Board of Directors the
decision to pay with the treasury stock in portfolio the Stock
Appreciation Rights (StAR) coupons resulting from the debt
restructuring as advisable based on the contractually agreed
valuation methods and their actual market value after allowing the
shareholders to exercise their preemptive rights on an equal
footing.
On June
16, 2010, the Board of Directors resolved to launch a preemptive
offer to sell a portion of the Bank’s treasury stock, for a
total of 36.0 million class D shares. The remaining shares would be
delivered in payment to the holders of Stock Appreciation Rights
(StAR) coupons arising from the debt restructuring, which fell due
on August 3, 2010. On July 26, 2010, within the framework of the
referred offer, the Bank sold approximately 26.9 million of the
shares mentioned above.
On
August 3, 2010, the proceeds of the offer and the balance of the
shares referred in the preceding paragraph were made available to
the holders of the Stock Appreciation Rights (StAR) coupons. With
the above-mentioned offering, 999,312 Class D shares were sold in
excess of those required to pay off the obligation previously
mentioned. In connection with such excess sale, Ps. 554 were
recorded as retained earnings to reflect the addition of the shares
to the entity’s equity, which took place on January 29, 2009
as detailed in this note, and a further Ps. 834 were booked as
Additional paid-in capital for the difference between the value as
added to the entity’s equity and the sales
value.
On
April 13, 2011, the General Extraordinary Shareholders’
Meeting authorized the Board of Directors to sell their own
treasury stock in the market reducing to ten days the term for
exercising the preemptive right, and suspending the exercise
thereof when the sale of shares does not exceed 1% of the Capital
Stock within any twelve-month fiscal year. The General Ordinary
Shareholders’ Meeting held on March 27, 2012 extended for one
year the term fixed for the disposition of those
shares.
F-160
The
General Ordinary Shareholders’ Meeting held on April 24, 2013
resolved to allocate 35,100,000 Class D shares held by the Bank to
a compensation program for the personnel under the terms of Section
67 of Law 26,831. This decision is pending approval of
CNV.
On
April 24, 2014 the General Ordinary Shareholders’ Meeting
acknowledged the incentive or compensation program described in the
preceding paragraph and its extension to the personnel employed by
the subsidiaries BACS Banco de Crédito y Securitización
S.A., BH Valores S.A., BHN Sociedad de Inversión S.A., BHN
Vida S.A. and BHN Seguros Generales S.A.
As of
December 31, 2016, the Bank held 36,634,733 treasury stock, out of
which 1,534,733 correspond to third-party holders of StARs who have
not filed the documentation required for their collection. The
Shareholders’ Meeting held on April 4, 2017 unanimously
resolved to include 1,534,733 common shares in the compensation
program for the personnel that had been approved at the
Shareholders’ Meetings held on April 24, 2013 and April 24,
2014.
On
November 30, 2017, the Board of Directors of the Argentine
Securities Commission considered that it would be advisable to
approve Banco Hipotecario S.A.’s Rules of the Compensation
Program for the personnel of the entity and its subsidiaries, BACS
Banco de Crédito y Securitización S.A. – BHN
Sociedad de Inversión S.A. – BHN Vida S.A. – BHN
Seguros Generales S.A. and BH Valores S.A.
The
Class B shares have been set aside for sale to the Bank's employees
in the future pursuant to the PPP on terms and conditions to be
established by the Argentine government. Any Class B shares not
acquired by the Bank's employees at the time the Bank implements
the PPP will automatically convert into Class A shares. The Class C
shares are eligible for sale only to companies engaging in housing
construction or real estate activities. Any Class B shares
transferred by an employee outside the PPP will automatically
convert to Class D shares or Class C shares transferred to persons
not engaged in construction or real estate activities will
automatically convert into Class D shares.
(b)
Distribution of profits
Banco Hipotecario S.A. and BACS Banco de Crédito y
Securitización S.A.
On May
6, 2010, pursuant to its Communication “A” 5,072, BCRA
established that no dividend distribution shall be admitted in so
far as: a) the amounts deposited as minimum cash requirements on
average – in Pesos, foreign currency or in Government
securities – were less than the requirements pertaining to
the most recently closed position or the position as projected
taking into account the effect of the distribution of dividends,
and/or b) the amounts deposited as minimum capital requirements
were less than the requirements recalculated as previously
mentioned plus a 30% increase, and/or c) the Entity has received
financial aid from the BCRA on grounds of illiquidity as set forth
in Section 17 of BCRA’s Charter.
On
January 27, 2012, the BCRA issued Communication “A”
5,272 whereby it established that for the calculation of the
minimum capital requirement, the minimum capital for operational
risk shall be included. On the same date, Communication
“A” 5,273 was also issued, whereby the BCRA resolved to
increase the percentage referred to in the preceding paragraph,
subsection b), from 30% to 75%.
Communication
“A” 5,369 provided that as from January 1, 2013, for
the purposes of calculating the position of minimum capitals, the
capital requirement for credit risk due to securitizations must be
computed over all the transactions outstanding as of the
computation date.
F-161
BANCO HIPOTECARIO S.A. AND SUBSIDIARIES
NOTES TO THE CONSOLIDATED FINANCIAL STATEMENTS
For the years ended December 31, 2017, 2016 and 2015
(Expressed in thousands of Argentine pesos, except share data and
as otherwise indicated)
On
September 23, 2013, the Argentine Congress enacted Law N°
26,983 which amends the Income Tax Law and sets forth that
dividends or earnings in money or in kind shall be levied with
Income Tax at a 10% tax rate payable in a final and lump
sum.
On July
12, 2016, by means of Communication "A" 6,013, the Argentine
Central Bank published the updated text on “Distribution of
profits” effective as from January 1, 2016 by means of
Communication “A” 5,827 and supplementary rules. The
provisions of this communication aim at converging towards
international principles and standards, among other changes, they
stablish additional capital margins.
The
Argentine Central Bank, through Communication “A”
6,327, approved of a broad set of changes to the current accounting
standards towards the International Financial Reporting Standards
(IFRS). Among other things, the Argentine Central Bank provided for
the manner in which retained earnings should be calculated and set
forth that financial institutions may not make distributions out of
the profits resulting from the first-time adoption of IFRS, and are
required to set up a special reserve which might only be released
for capitalization thereof or otherwise to offset negative balances
accounted for under “Unappropriated
Earnings.”
The
Ordinary General Shareholders' Meeting of BHSA held on April 9,
2018 approved the financial statements as of December 31, 2017 and
the treatment of the results for the year ended on that date. On
that date, the following destination of the unallocated results as
of December 31, 2017 was established, in accordance with current
regulations:
●
Legal reserve Ps.
318,688
●
Cash dividends Ps.
200,000
●
To facultative reserve for future
distributions of results Ps.1,074,751
On
April 23, 2018, said dividends were made available to
shareholders.
BHN Vida S.A. and BHN Seguros Generales S.A.
These
companies must comply with certain reserves established by the SSN.
The reserves are determined primarily pursuant to two criteria,
claims and premiums. If such reserves are not at or above the
levels established by the SSN, profits are not allowed to be cannot
be distributed.
BHN
Vida and BHN Seguros Generales currently maintain reserves at or
above the levels prescribed by the SSN.
26. Financial Instruments with Off-Balance Sheet Risk
In the
normal course of its business the Bank is party financial
instruments with off-balance sheet risk in order to meet the
financing needs of its customers. These instruments expose the Bank
to credit risk in addition to the amounts recognized in the balance
sheets. These financial instruments include commitments to grant
credit.
|
|
December
31,
|
|
|
|
2017
|
2016
|
|
Commitments to
grant credit
|
|
|
|
Mortgage loans and
other loans (a)Ps.
|
Ps.
118,236
|
Ps.
126,962
|
|
Credit card loans
(b)
|
37,145,759
|
31,120,639
|
|
Clearing items in
process (c)
|
642,559
|
521,662
|
|
Other guarantees
(d)
|
113,800
|
124,909
|
F-162
BANCO HIPOTECARIO S.A. AND SUBSIDIARIES
NOTES TO THE CONSOLIDATED FINANCIAL STATEMENTS
For the years ended December 31, 2017, 2016 and 2015
(Expressed in thousands of Argentine pesos, except share data and
as otherwise indicated)
(a)
Commitments to
grant credit are agreements to lend to a customer at a future date,
subject to such customers meeting of pre-defined contractual
milestones. Typically, the Bank will commit to extend financing for
construction project lending on the basis of the certified progress
of the work under construction. Most arrangements require the
borrower to pledge the land or buildings under construction as
collateral. In the opinion of management, the Bank’s
outstanding commitments do not represent unusual credit risk. The
Bank’s exposure to credit loss in the event of nonperformance
by the other party is represented by the contractual notional
amount of those commitments.
(b)
The Bank has a
unilateral and irrevocable right to reduce or change the credit
card limit, thus it considered there is no off-balance sheet risk.
In the opinion of management, the Bank’s outstanding
commitments do not represent unusual credit risk. The Bank’s
exposure to credit loss in the event of nonperformance by the other
party is represented by the contractual notional amount of those
commitments.
(c)
The Bank recorded
for items drawn on other banks as off-balance sheet accounts until
such time as the related item clears or is accepted. In the opinion
of management, the Bank’s risk of loss on these clearing
transactions is not significant as the transactions primarily
relate to collections on behalf of third parties.
Off-balance
sheet risks related to trust activities are included in Note
19.
In the
normal course of business, the Bank enters into a variety of
transactions principally in the foreign exchange stock markets. See
Note 18.
27. Reconciliation of balances to the applicable accounting
framework for convergence towards IFRS
On February 12, 2014, BCRA issued its Communication “A”
5,541, as amended, whereby it provides a roadmap to convergence
between the informational and accounting regime and International
Financial Reporting Standards (IFRS), pursuant to this
Communication, the entities and institutions must start to account
for their financial transactions and changes in accordance with the
rules issued by BCRA following the above-mentioned convergence
regime as from the fiscal years beginning on January 1, 2018 and
their interim periods.
On December 12, 2016, the BCRA issued Communication “A”
6,114, whereby it established the criteria that should be taken
into consideration by financial institutions in the framework of
convergence starting on January 1, 2018, highlighting: i)
application of IFRS issued by the International Accounting
Standards Board and adopted as of the date hereof by Technical
Resolution No. 26 issued by the Argentine Federation of
Professional Councils in Economic Sciences, as amended, and any
circulars for adoption already approved and scheduled to come into
force before December 31, 2018, ii) except, until the fiscal years
starting on January 1, 2020, as concerns Section 5.5 (impairment)
of IFRS 9 “Financial Instruments”, with the standards
on “Minimum allowances for loan losses” continuing in
effect (in order to know and validate the models, financial
institutions will be required to file quantitative information on
the numerical impact as of December 31, 2018 and qualitative
information on their expected loss estimates model, by October 1,
2018), and iii) for the calculation of the interest rate that
actually applies to the assets and liabilities that require the use
of an interest rate for measurement purposes, preparers should take
into consideration the principles, definitions and examples
included in IFRS 9; allowing temporarily -until December 31, 2019-
to use an overall estimate of the calculation of the interest rate
actually applied to a group of similar financial assets or
liabilities over which such interest rate should
apply.
F-163
BANCO HIPOTECARIO S.A. AND SUBSIDIARIES
NOTES TO THE CONSOLIDATED FINANCIAL STATEMENTS
For the years ended December 31, 2017, 2016 and 2015
(Expressed in thousands of Argentine pesos, except share data and
as otherwise indicated)
Accordingly, BHSA has prepared the following reconciliation of
asset, liabilities and shareholders’ equity balances as of
December 31, 2017 and comprehensive income for the year ended
December 31, 2017, as reported in accordance with Argentine Banking
GAAP to IFRS, as adopted by BCRA. As established in IFRS 1
“First-time Adoption of International Financial
Reporting Standards,” the transition date to IFRS for the
Bank is January 1, 2017.
This reconciliation might change as a result of improvements of the
Bank systems or the application of new standards.
Reconciliation of balances to the applicable accounting framework
for convergence towards IFRS
A.
Reconciliation of balance sheet and shareholders’ equity as
of December 31, 2017
|
|
|
Consolidated Financial Statements
|
||
|
|
Ref.
|
BCRA Balances
|
IFRS Adjustments
(b)
|
IFRS Balances
|
|
Assets
|
|
65,267,557
|
1,229,097
|
66,496,654
|
|
Cash
and due from banks
|
(i)
|
3,646,536
|
232,548
|
3,879,084
|
|
Government
and Corporate Securities
|
(a),
(h)
|
14,814,101
|
1,411,340
|
16,225,441
|
|
Loans
|
(a),
(h)
|
35,456,649
|
3,584,092
|
39,040,741
|
|
Other
receivables from financial intermediation
|
(a),
(h), (i)
|
6,574,889
|
(4,838,575
)
|
1,736,314
|
|
Receivables
under financial leases
|
|
161,319
|
-
|
161,319
|
|
Unlisted
equity investments
|
|
42,032
|
-
|
42,032
|
|
Miscellaneous
Receivables
|
(h)
|
2,166,488
|
134,285
|
2,300,773
|
|
Bank
Premises and Equipment
|
(c)
|
415,220
|
1,011,502
|
1,426,722
|
|
Miscellaneous
Assets
|
(c)
|
1,439,155
|
94,157
|
1,533,312
|
|
Intangible
Assets
|
(d)
|
539,169
|
(400,252
)
|
138,917
|
|
Items
pending allocation
|
|
11,999
|
-
|
11,999
|
|
|
|
|
|
|
|
Liabilities
|
|
57,617,886
|
683,007
|
58,300,893
|
|
Deposits
|
|
20,808,381
|
-
|
20,808,381
|
|
Other
liabilities from financial intermediation
|
(a),
(e), (h), (i)
|
33,400,980
|
933,178
|
34,334,158
|
|
Miscellaneous
liabilities
|
(g),
(i)
|
2,637,672
|
(167,702
)
|
2,469,970
|
|
Provisions
|
(f)
|
434,530
|
199,824
|
634,354
|
|
Items
pending allocation
|
|
54,030
|
-
|
54,030
|
|
Non-controlling
interest
|
|
282,293
|
(282,293
)
|
-
|
|
|
Consolidated
Financial Statements
|
|||
|
|
BCRA
Balances
|
First-time
IFRS Adjustments (k)
|
IFRS
Adjustments
|
IFRS
Balances
|
|
Shareholders'
equity attributable to controlling interest's owners
|
7,649,671
|
361,857
|
(105,910
)
|
7,905,618
|
|
Capital,
Contributions and Reserves
|
6,056,232
|
-
|
-
|
6,056,232
|
|
Accumulated
retained earnings
|
1,593,439
|
361,857
|
(105,910
)
|
1,849,386
|
|
Shareholders'
equity attributable to non-controlling interest
|
-
|
164,522
|
125,621
|
290,143
|
|
Total
Shareholders’ Equity
|
7,649,671
|
526,379
|
19,711
|
8,195,761
|
B. Reconciliation of the statement of comprehensive income for the
year ended December 31, 2017
|
|
|
Consolidated
Financial Statements
|
||
F-164
BANCO HIPOTECARIO S.A. AND SUBSIDIARIES
NOTES TO THE CONSOLIDATED FINANCIAL STATEMENTS
For the years ended December 31, 2017, 2016 and 2015
(Expressed in thousands of Argentine pesos, except share data and
as otherwise indicated)
|
|
Ref.
|
BCRA
Balances
|
IFRS Adjustments
(b)
|
IFRS
Balances
|
|
Net
Income for the year
|
|
1,593,439
|
(522,748
)
|
1,070,691
|
|
Financial
Income
|
|
11,593,520
|
1,014,332
|
12,607,852
|
|
Financial
Expenses
|
(a)
|
7,122,937
|
696,492
|
7,819,429
|
|
Provision for loan
losses
|
|
910,881
|
251,864
|
1,162,745
|
|
Income from
Services
|
(e)
|
6,829,074
|
(5,175
)
|
6,823,899
|
|
Expenses for
Services
|
(a)
|
1,943,516
|
73,350
|
2,016,866
|
|
Administrative
Expenses
|
(a), (c), (d), (f),
(j)
|
6,067,164
|
536,945
|
6,604,109
|
|
Other
|
|
(251,999
)
|
25,621
|
(226,378
)
|
|
Income
Tax
|
(k)
|
532,658
|
(1,125
)
|
531,533
|
|
Other
Comprehensive Income
|
|
|
|
-
|
|
Changes to surplus
from revaluation of Bank Premises, Equipment and Intangible
Assets
|
|
|
|
-
|
|
Gains (loss) from
financial instruments at fair value through Other comprehensive
income (IFRS 9, Sections 5.7.5 and 4.1.2A)
|
|
|
|
-
|
|
Total
Comprehensive Income for the year
|
|
|
|
1,070,691
|
|
|
|
|
|
|
|
Total
Comprehensive Income attributable to:
|
|
|
|
|
|
Controlling
interest
|
(a)
|
|
|
1,044,690
|
|
Non-controlling
interest
|
(c)
|
|
|
26,001
|
The items and figures contained in this reconciliation may only be
regarded as final when annual financial statements are prepared for
the year in which IFRS are adopted for the first time, within the
scope defined by the Argentine Central Bank in Communication
“A” 6,114, as amended.
C. Adjustments explanation
(a) Changes to financial asset classification and measurement
criteria
Under IFRS, financial assets are classified into three categories:
financial assets measured at amortized cost, financial assets at
fair value through other comprehensive income, and financial assets
at fair value through profit and loss, on the basis of the business
model and the specific features of the instruments.
The Bank’s accounting criteria pursuant to Argentine Banking
GAAP differ from the provisions of IFRS in certain aspects,
namely:
(i)
Government
securities with no volatility published by the BCRA have been
valued at their acquisition cost subject to an exponential increase
based on the internal rate of return;
(ii)
Loans
are stated at their acquisition cost, plus accrued interest on the
basis of the contractual rate;
(iii)
Debt
securities acquired at par value are stated at their current
redemption value;
(iv)
Participation
certificates in financial trusts have been valued taking into
account the share of liabilities in net assets, as per the
financial statements of the respective trusts, adjusted for the
effect the application of the BCRA’s rules may have had on
them, where applicable;
(v)
Unlisted
corporate bonds
and debt securities have been valued
at their acquisition cost plus the internal rate of
return.
On the basis of the provisions contained under IFRS, BHSA has
classified the following financial instruments as financial assets
measured at amortized cost:
F-165
BANCO HIPOTECARIO S.A. AND SUBSIDIARIES
NOTES TO THE CONSOLIDATED FINANCIAL STATEMENTS
For the years ended December 31, 2017, 2016 and 2015
(Expressed in thousands of Argentine pesos, except share data and
as otherwise indicated)
-
Loans
and receivables associated to financial leases
-
Financial
trust debt securities
-
Financial
liabilities
In addition, the following financial assets have been classified as
financial assets at fair value through profit and
loss:
-
Government
securities
-
Monetary
regulation instruments issued by the Argentine Central
Bank
-
Shares
-
Negotiable
obligations
These differences resulted in the following adjustments as of
December 31, 2017:
|
|
IFRS Adjustments in Consolidated Financial Statements
|
|
Government
Securities
|
1,535
|
|
Loans
|
(33,123
)
|
|
Other
receivables from financial intermediation
|
(16,442
)
|
|
Other
liabilities from financial intermediation
|
7,787
|
(b) Unlisted equity investments
According to Argentine Banking GAAP, the subsidiaries listed in
Note 1.c. to the consolidated financial statements were
consolidated. According to IFRS, in addition to such companies the
following trusts should be consolidated:
|
Entity’s name
|
Business
|
|
Fideicomiso Hipotecario BACS III
|
Financial trust
|
|
Fideicomisos Hipotecarios BACS Funding I
|
Financial trust
|
No IFRS adjustment was deemed necessary once the consolidation of
these trusts was made.
(c) Bank Premises, Equipment and Miscellaneous Assets
The Entity used the voluntary exemption set forth in IFRS 1 to
measure certain items in the Real Estate Property caption. This
entails measuring such items at their fair value and using such
fair value as the cost attributed at the date of
transition.
Additionally, the Entity capitalizes the costs associated to
stationery and office supplies. According to IFRS, these costs do
not fulfill the requirements to be capitalized. Therefore, the
balance of such item was reversed.
F-166
BANCO HIPOTECARIO S.A. AND SUBSIDIARIES
NOTES TO THE CONSOLIDATED FINANCIAL STATEMENTS
For the years ended December 31, 2017, 2016 and 2015
(Expressed in thousands of Argentine pesos, except share data and
as otherwise indicated)
|
|
Consolidated Financial Statements
|
||
|
|
BCRA Balances
|
IFRS Adjustments
|
IFRS Balances
|
|
Revaluation
of Real Estate Property pursuant to application of IFRS
1
|
121,060
|
1,011,502
|
1,132,562
|
|
Other
bank premises and equipment
|
294,160
|
-
|
294,160
|
|
Total bank premises and equipment caption
|
415,220
|
1,011,502
|
1,426,722
|
|
|
|
|
|
|
Revaluation
of Real Estate Property pursuant to application of IFRS
1
|
3,601
|
144,385
|
147,986
|
|
Other
miscellaneous assets
|
1,435,554
|
(50,228
)
|
1,385,326
|
|
Total Miscellaneous assets caption
|
1,439,155
|
94,157
|
1,533,312
|
(d) Intangible Assets
Under IFRS, an intangible asset is an identifiable non-monetary
asset without physical substance. In order to recognize
intangibles, the Bank is required to have control over the asset,
and future economic benefits are to be derived from that asset.
Under the Argentine Banking GAAP, the Bank has recognized
intangible assets that do not meet the recognition requirements of
IFRS. As of December 31, 2017, the adjustment represents a decrease
in shareholders’ equity of Ps. 396,978 and
Ps. 400,252 at separate and consolidated level,
respectively.
(e) Financial Collateral
Under IFRS, financial collateral given by an entity should be
initially recognized at fair value, which in most cases is equal to
the fees charged. Such amount is then amortized on a straight line
basis during the term of the contract. At each year end, financial
collateral is measured at the higher of: (i) the fees not yet
accrued as of the year-end, and (ii) the best estimate of the
amount payable to terminate the contract, discounted at its present
value as of the year-end.
Under Argentina Central Bank, fees earned on financial collateral
arrangements are charged to income when cashed.
The adjustment encompasses a decrease in shareholders’ equity
for Ps. 404.
(f) Accruals
Under IFRS, short-term employee benefits, such as, vacations,
salaries and wages, and social security contributions, are
recognized as a liability for the undiscounted amount the Bank
expects to pay for such benefits.
Under Argentine Banking GAAP, the Bank set up a vacation accrual
for an amount equal to the vacation bonus. The adjustment entails
recognizing the vacation accrual for the total amount of the
benefit the Bank expects to pay.
In addition, under IFRS, the Bank’s customer loyalty programs
must be valued at the fair value of the points that are expected to
be exchanged by customers.
As of December 31, 2017, the adjustments amounted to:
|
|
Consolidated Financial Statements
|
||
|
|
BCRA Balances
|
IFRS Adjustments
|
IFRS Balances
|
|
Vacation Bonus
Accruals
|
65,283
|
192,060
|
257,343
|
|
Customer loyalty
program provision
|
49,730
|
7,764
|
57,494
|
|
Other
allowances
|
319,517
|
-
|
319,517
|
|
Total
Allowances
|
434,530
|
199,824
|
634,354
|
F-167
BANCO HIPOTECARIO S.A. AND SUBSIDIARIES
NOTES TO THE CONSOLIDATED FINANCIAL STATEMENTS
For the years ended December 31, 2017, 2016 and 2015
(Expressed in thousands of Argentine pesos, except share data and
as otherwise indicated)
(g) Claims reserve
BHN Vida S.A. and BHN Seguros Generales S.A. are subsidiaries of
BHN Sociedad de Inversión S.A. and have evaluated whether
liabilities arising from insurance claims have been adequately
recognized on the basis of the current estimates of the future cash
flows stemming from their insurance contracts. Based on the
evaluation as of December 31, 2017, the shareholders’ equity
was reduced by Ps. 3,955.
(h) Reclassifications without impact on shareholders’
equity
Reverse repo transactions
Under IFRS, a bank will derecognize a financial asset that had been
assigned only to the extent the risks and benefits associated to
that asset had been substantially transferred. In a reverse repo
transaction, where the repurchase price is fixed, the Bank is not
deemed to have substantially transferred all risks and benefits
attached to the instrument and, hence, a liability should be
recognized for the consideration received, without derecognizing
the instrument involved in the repo transaction.
Under Argentine Banking GAAP, a financial asset is to be
derecognized when it is transferred. The adjustment involves
recognizing the instruments and then reversing the receivable from
financial intermediation and the haircut booked under miscellaneous
receivables.
Repo transactions
Under IFRS, a financial asset acquired through a repo transaction
with no transfer of the risks and benefits associated to that asset
should be recognized as a loan granted.
Under Argentine Banking GAAP, the acquired security is recognized
at the time of the transfer. The adjustment involves derecognizing
the listed government security, followed by the reversal of the
holding gains (losses) from such security that had been charged to
income, and by the reversal of the liability booked under
liabilities from financial intermediation.
Transactions to be settled
Under IFRS, a conventional purchase or sale of financial assets is
recognized using the “trade date” or the
“settlement date” accounting. The election between one
or the other is a matter of accounting criteria that will then have
to be consistently applied to all purchases and sales of financial
assets classified within the same category.
The Bank relies on the accounting criteria of recognizing spot and
forward transactions to be settled on the trade date. Accordingly,
the Bank will recognize all traded transactions that are pending as
if such transactions had been settled.
Under Argentine Banking GAAP, the Bank recognizes spot and forward
transactions to be settled on the trade date under Other
receivables from financial intermediation or under Other
liabilities from financial intermediation, as applicable, and
classifies them under the applicable item on the settlement
date.
F-168
BANCO HIPOTECARIO S.A. AND SUBSIDIARIES
NOTES TO THE CONSOLIDATED FINANCIAL STATEMENTS
For the years ended December 31, 2017, 2016 and 2015
(Expressed in thousands of Argentine pesos, except share data and
as otherwise indicated)
The amounts reclassified as of December 31, 2017 are as
follows:
|
|
IFRS Adjustments in Consolidated Financial Statements
|
||||
|
|
Repo Transactions
|
Reverse repo Transactions
|
Transactions to be settled
|
Guarantees
|
Total
|
|
Government
Securities
|
(114,707
)
|
-
|
1,406,745
|
117,767
|
1,409,805
|
|
Loans
|
114,715
|
-
|
-
|
-
|
114,715
|
|
Other
receivables from financial intermediation
|
(114,715
)
|
-
|
(1,578,682
)
|
(117,520
)
|
(1,810,917
)
|
|
Miscellaneous
receivables
|
|
-
|
-
|
(247
)
|
(247
)
|
|
Other
liabilities from financial intermediation
|
114,707
|
-
|
(171,937
)
|
-
|
(286,644
)
|
|
Total impact on shareholders’ equity
|
-
|
-
|
-
|
-
|
-
|
(i) Derecognition of financial assets
According to IFRS, entities must derecognize financial assets from
the accounts if and only if:
(a) Contractual rights over the financial assets’ cash flows
expire; or
(b) The financial asset is transferred and the transfer satisfies
all the requirements for derecognition from the
accounts.
Transfer of financial assets
Entities shall be considered to have transferred a financial asset
if and only if:
(a) the entities transfer the contractual rights to receive the
cash flows from a financial asset, or
(b) entities retain the contractual rights to receive the cash
flows from the financial asset but take the contractual obligation
to pay them to one or more receivers.
Derecognition from the accounts: requirements
When entities transfer a financial asset, the entities shall assess
the extent to which they retain the risks and the rewards inherent
in ownership. In this case:
(a) If an entity proceeds with a substantial transfer of the risks
and rewards inherent in the ownership of a financial asset, the
entity shall derecognize it from the accounts and shall recognize
separately, as either assets or liabilities, any rights and duties
created or retained upon transferring ownership.
(b) If the entity retains substantially all the risks and rewards
inherent in ownership of a financial asset, the entity will
continue to recognize this asset.
(c) If the entity proceeds with neither a substantial transfer nor
retention of all the risks and rewards inherent in ownership of a
financial asset, the entity shall determine whether it has retained
control over the financial asset. In this case:
(i) If the entity has not retained control,
the entity shall derecognize the financial asset and shall
separately recognize, as assets or liabilities, any rights or
obligations created or retained as a result of the
transfer.
(ii) If the entity has retained control,
the entity shall continue to recognize the financial asset to the
extent of its continued involvement in the financial
asset.
Transfers that do not satisfy the requirements for derecognition
from the accounts
If a transfer does not lead to a derecognition from the accounts
because the entity has substantially retained all the risks and
rewards inherent in ownership of the asset transferred, the entity
shall continue to recognize said transferred asset in its entirety
and shall recognize a financial liability in exchange for the
consideration received. In subsequent years, the entity shall
recognize all income from the asset transferred and all expenses
incurred by the financial liability.
F-169
BANCO HIPOTECARIO S.A. AND SUBSIDIARIES
NOTES TO THE CONSOLIDATED FINANCIAL STATEMENTS
For the years ended December 31, 2017, 2016 and 2015
(Expressed in thousands of Argentine pesos, except share data and
as otherwise indicated)
As of the date of transition, the Bank has adopted IFRS 1 exception
concerning financial asset derecognition. This exception provides
that an entity that is a first-time IFRS adopter shall apply IFRS
9’s requirements for derecognition from the accounts on a
prospective basis for the transactions that are conducted as from
the date of transition to IFRS.
This notwithstanding, IFRS 1 also sets forth that if an entity is a
first-time adopter of IFRS after a subsidiary, this entity shall
measure in its consolidated financial statements the
subsidiary’s assets and liabilities for the same book amounts
as those appearing in the subsidiary’s financial statements.
This is the case of Tarshop S.A. which adopted IFRS for the periods
starting as from January 1, 2012 and therefore, the subsidiary
applies IFRS 9 and applies the requirements for derecognition from
the accounts prescribed by IFRS 9 giving rise to an adjustment that
reduces shareholders’ equity as of December 31, 2017 for Ps.
175,504.
(j)
Employee compensation Plan
The Bank has established an employee compensation plan for its
employees. Under this plan an aggregate 36,634,733 Class D treasury
stock were allocated on a pro rata basis to the employees that
qualified as beneficiaries under the terms of the program.
Beneficiaries are entitled to economic benefits derived from such
shares. Shares will be transferred to beneficiaries under the terms
of the program. Shares will be transferred to beneficiaries upon
the fulfillment of certain conditions. Under IFRS, it was
recognized the compensation cost as the fair value of the shares
contributed to the employee compensation plan. As of November 30,
2017, the Bank recognized the fair value of the treasury stock set
aside for the plan under the line “payroll expenses”,
with its related contra-account in shareholders’ equity. The
plan will not result in subsequent charges to income.
(k)
Income tax
Under IFRS, the income tax liability for the year encompasses
current and deferred taxes. Current income tax is calculated on the
basis of legislation that was, or is about to be, enacted as of the
balance sheet date. Deferred tax is recognized pursuant to the
asset-liability method, that is, for the temporary differences
arising from the valuation of assets and liabilities for tax and
accounting reporting purposes. Deferred tax is assessed using tax
rates (and laws) that are, or about to be, enacted as of the
balance sheet date and that are expected to be applicable upon the
realization of the respective deferred tax asset, or upon the
settlement of the deferred tax liability.
Under the BCRA’s rules, the Bank recognizes the current tax
liability for the year.
As of December 31, 2017, the effect of recognizing income taxes
under the deferred tax method resulted in a decrease in
shareholders’ equity of Ps. 21,681.
(l)
Application
of IFRS 1
Below is a detail of the applicable exemptions and exceptions used
in this reconciliation.
Optional exemptions under IFRS:
Below is a detail of the applicable exemptions and exceptions under
IFRS 1 that were relied upon during the transition from Argentine
Banking GAAP to IFRS:
Under IFRS 1, entities adopting IFRS for the first time are allowed
to consider certain one-off waivers to the retroactive application
requirement of IFRS in force for financial statements
ending
F-170
BANCO HIPOTECARIO S.A. AND SUBSIDIARIES
NOTES TO THE CONSOLIDATED FINANCIAL STATEMENTS
For the years ended December 31, 2017, 2016 and 2015
(Expressed in thousands of Argentine pesos, except share data and
as otherwise indicated)
on December 31, 2018. The IASB has established such waivers in
order to streamline the first-time adoption of such
standards.
Below is a detail of the optional exemptions applicable to the Bank
under IFRS 1:
1.
Cost allocated to Bank Premises
& Equipment and Investment Property
: the fair value of certain property and
investment property has been adopted as allocated cost as of the
transition date to IFRS.
2.
Business combinations:
the Bank has decided not to apply IFRS
3 “Business combinations” retroactively to business
combinations consummated before the transition date to
IFRS.
3.
Assets and liabilities of
subsidiaries that have already adopted the IFRS:
the Bank has adopted the IFRS for the
first time after its subsidiary Tarshop S.A. Therefore, the
carrying values of this subsidiary’s assets and liabilities
have been measured in the Bank’s consolidated financial
statements for the same amounts disclosed in that
subsidiary’s separate financial statements, after adjusting
for consolidation and equity accounting adjustments and for the
effects of the business combination in which the entity acquired
the subsidiary.
4.
Designation of previously
recognized financial instruments:
the Bank has opted for designating certain
financial instruments, in the light of the facts and circumstances
prevailing on the transition date to IFRS.
5.
Loan costs:
BHSA has opted for applying the requirements of
IAS 23 as from the transition date to IFRS. Borrowing costs
incurred on or after January 1, 2017 are accounted in accordance
with IAS 23, including those borrowing costs incurred on or after
that date on qualifying assets already under
construction.
6.
The Bank has not relied on the other exemptions available under
IFRS 1.
Mandatory exceptions under IFRS
Below is a detail of the mandatory exceptions applicable to the
Bank under IFRS 1:
1.
Estimates: the Bank’s estimates to calculate balances as per
IFRS as of the transition date to IFRS are consistent with the
estimates made as of the same date following the BCRA’s
accounting rules (without applying the impairment chapter under
IFRS 9)
2.
Derecognition of financial assets and liabilities: IFRS 1. The Bank
has relied on the derecognition criteria for financial assets and
liabilities under IFRS 9 on a prospective basis for transactions
occurring as of the transition date to IFRS.
3.
Classification and measurement of financial assets: the Bank has
taken into consideration the facts and circumstances prevailing as
of the transition date to IFRS in assessing whether financial
assets are eligible for classification as assets measured at
amortized cost, or at fair value through other comprehensive
income.
4.
Below is a list of other mandatory exceptions established in IFRS 1
that were not applied considering that they are not relevant to the
Bank:
● Hedge accounting,
● Minority interests,
● Embedded derivatives,
F-171
BANCO HIPOTECARIO S.A. AND SUBSIDIARIES
NOTES TO THE CONSOLIDATED FINANCIAL STATEMENTS
For the years ended December 31, 2017, 2016 and 2015
(Expressed in thousands of Argentine pesos, except share data and
as otherwise indicated)
● Government loans
However,
in preparing this information, the Bank had to make estimates
affecting assets and liabilities and net income for the year which
may result in changes when preparing the financial statements as of
December 31, 2018.
28. Commencement of summary proceedings
I. Summary proceedings before administrative
authorities:
1.
On
February 19, 2014, the Bank was notified of Resolution No. 209/13
handed down by the Chairman of the Financial Information Unit
(UIF), whereby it ordered to commence summary proceedings against
the Bank, its directors; the Risk and Controlling Manager and the
Manager of the
Money Laundering
Prevention and Control Unit Manager. In these proceedings, an
investigation is made into the defendants’ liability for
alleged violation of the provisions of Section 21 of Law 25,246, as
amended, and Resolution UIF No. 228/2007 due to certain defaults
detected by the BCRA in the inspection of the organization and in
internal controls implemented for the prevention of
money-laundering derived from illegal activities. All the directors
summoned filed their respective defenses.
In the
legal counsel’s opinion, at the current stage of the
proceedings and based on the precedents existing at the UIF in
connection with similar cases, it is estimated that there are
chances of imposing an administrative penalty. For such reason, the
bank has estimated provisions for Ps. 20.
2.
On
August 11, 2015, the Bank was notified of Resolution No. 76/15,
whereby the President of the UIF had ordered the start of summary
proceedings against Banco Hipotecario S.A., its directors and its
Compliance Officer in connection with alleged failures to comply
with Section 21, a) of Law No. 25,246 and UIF Resolution No.
121/11. According to said resolution, the Bank and its directors
had
prima facie
failed to
comply with certain customer identification requirements,
monitoring standards, the risk matrix definition and the procedures
to update its customers’ background and profiles, among other
things.
Based
on the UIF’s background on similar cases, the Bank is likely
to be imposed an administrative fine. Therefore, it was deemed
reasonable to create a provision for this contingency amounting to
Ps. 20, which was booked on October 22, 2015.
3.
On
February 15, 2016, BHSA was notified of Resolution No. 1014 handed
down by the Superintendent of Financial and Foreign Exchange
Institutions in order to commence summary proceedings in the terms
of Section 41 of the Law of Financial Institutions (Summary
Proceedings’ File No. 1486) against Banco Hipotecario S.A.
and its chairman on grounds of an alleged breach of the rules under
Communication “A” 4,490 consisting in failure to report
-within the term established by the rules and regulations governing
the matter- the appointment of new directors resolved by the
General Shareholders’ Meetings held on March 27 and on April
24, 2013 and in a delay in filing the documentation associated to
those directors.
In
light of the likelihood that the Bank could be imposed an
administrative fine, it was deemed reasonable to create a provision
for this contingency amounting to Ps. 560, which was booked
last December 31, 2016.
4.
On
May 10, 2016, the Bank was notified of Resolution No. 219 dated
April 22, 2016, handed down by the Superintendent of Financial and
Foreign Exchange Institutions in order to commence summary
proceedings (Summary Proceedings’ File No. 6845) in the terms
of
F-172
BANCO HIPOTECARIO S.A. AND SUBSIDIARIES
NOTES TO THE CONSOLIDATED FINANCIAL STATEMENTS
For the years ended December 31, 2017, 2016 and 2015
(Expressed in thousands of Argentine pesos, except share data and
as otherwise indicated)
Section 8 of the
Foreign Exchange Criminal Regime Law No. 19,359 (as signed into law
pursuant to Decree No. 480/95) against Banco Hipotecario S.A. on
grounds of alleged breach of the rules contained in Communication
“A” 5,318 and 5,322, as supplemented, consisting in
allegedly selling foreign currency for the amount of
US$ 69,620 agreed upon under a residential mortgage
transaction without fulfilling the requirements set forth in the
regulations then in effect (Communications “A” 5,318
and 5,322, each as supplemented).
Given
the current status of the proceedings, and since there are legal
and factual arguments that generate reasonable expectations that
the physical persons named defendants and Banco Hipotecario S.A.
will be acquitted, no provisions have been created.
II. Summary Proceedings pending Court Decision
1.
On
October 31, 2014, BHSA was notified of Resolution No. 685 dated
October 29, 2014 handed down by the Superintendent of Financial and
Foreign Exchange Institutions in the summary proceedings in
financial matters No. 1320 whereby the Bank and its authorities had
been charged, on one hand, with the violation of the rules
governing financial aid to the Non-Financial Public Sector, with
excess over the limits of fractioned exposure to credit risk from
the non-financial public sector, with excess in the allocation of
assets to guarantee, with failure to satisfy minimum capital
requirements and with objections against the accounting treatment
afforded to the “Cer Swap Linked to PG08 and External
Debt” transaction and on the other hand, with delays in
communicating the appointment of new directors and tardiness in the
provision of documentation associated to the directors recently
elected by the shareholders’ meetings.
Resolution No. 685
then imposed a fine on the Bank of Ps. 4,040 and also fined
BHSA’s directors, former directors, statutory auditors, the
Area Manager and former managers for an aggregate amount of Ps.
51,582.
On
November 25, 2014, Banco Hipotecario and the other individuals
affected by the adverse decision, lodged an appeal under Section 42
of the Financial Institutions Law, that was sent by the BCRA to the
National Appellate Court with Federal Jurisdiction over Contentious
and Administrative Matters. Therefore, at present the case is being
heard by Panel I of such Appellate Court. Moreover, on December 30,
2014, the Bank and the individuals against whom sanctions were
imposed requested the levying of separate injunctions by such court
against the enforcements pursued by the BCRA for collection of the
fines.
Upon
being notified of the resolution handed down on June 30, 2016 by
the Appellate Court that denied the motion for injunction filed by
the Bank and by the directors, managers and some of the statutory
auditors and in order to prevent further conflicts and financial
damage that could result from the actions to compel payment of
fines, the Bank’s Executive Committee decided to apply the
indemnity rules regarding directors, high ranking officers and
statutory auditors, as an alternative for the amounts not covered
by the D&O insurance policy approved by the Bank’s Board
of Directors at its meetings held on August 2, 2002 and May 8,
2013, and resolved to deposit the amounts of the
fines.
Such
deposit, including the amount corresponding to the fine imposed on
the Bank and the respective legal costs, totaled Ps. 57,672. Out
this amount, Ps. 53,632 were computed as losses for the fiscal year
ended December 31, 2015 and Ps. 4,040 were computed as a
provision for the fiscal year ended December 31, 2014.
This
notwithstanding, in the brief filed with the court that is hearing
the proceedings to compel payment it was sustained that the amounts
deposited in the judicial accounts opened to such end were subject
to attachment, and a petition was filed for the respective amounts
to
F-173
BANCO HIPOTECARIO S.A. AND SUBSIDIARIES
NOTES TO THE CONSOLIDATED FINANCIAL STATEMENTS
For the years ended December 31, 2017, 2016 and 2015
(Expressed in thousands of Argentine pesos, except share data and
as otherwise indicated)
be
invested in automatically renewable term deposits for 180 days in
order to ensure the integrity of the funds until the Appellate
Court with Federal Jurisdiction over Contentious and Administrative
Matters hands down a decision on the appeal lodged against
Resolution No. 685/14 of the Argentine Central Bank.
The
requests for injunction were rejected and the court made progress
in the proceedings for enforcing the fines, against each of the
defendants. For such reason, the amounts subject to attachment were
applied to the payment of the relevant fines.
2.
On
September 13, 2013, the Bank was notified of Resolution No. 611
handed down by the Superintendent of Financial and Foreign Exchange
Institutions, ordering to commence summary proceedings against the
Bank, the Organization and Procedures Manager and the former
Systems Manager (Summary Proceedings No. 5469 on Foreign Exchange
Matters –
File 100,082/08))
charging them with alleged violation of the foreign exchange laws
in selling foreign currency to persons prohibited from trading
foreign currency by the Argentine Central Bank. The cumulative
amount derived from the alleged violation in the sale of foreign
currency is around US$ 39.9 thousand and Euro 1.1 thousand.
The relevant defenses and arguments have been filed and evidence
has been offered in support of all the defendants subject to the
summary proceedings. Due to its related subject matter, the record
of this case was joined with Summary Proceedings No. 5529 on
Foreign Exchange Matters (File 101,327/10). Therefore, its
procedural status is described below.
On
October 8, 2013, the Bank was notified of Resolution No. 720 handed
down by the Superintendent of Financial and Foreign Exchange
Institutions, ordering to commence summary proceedings against the
Bank and its Organization and Procedures Manager and the former
Systems Manager (Summary Proceedings No. 5529 on Foreign Exchange
Matters) in accordance with Section 8 of the Criminal Foreign
Exchange Regime Law (
Ley de
Régimen Penal Cambiario
) –as signed into law by
Decree 480/95- charging them with alleged violation of the foreign
exchange laws in selling foreign currency to persons prohibited
from trading foreign currency by the Argentine Central Bank. The
cumulative amount derived from the alleged violation in the sale of
foreign currency is around US$ 86 thousand.
In the
legal counsel’s opinion, at the current status of the
proceedings, there are legal and factual arguments that generate
reasonable expectations that the physical persons named defendants
and Banco Hipotecario S.A. will be acquitted and that therefore,
there are low chances that the Bank will be subject to the economic
sanctions set forth by the Criminal Foreign Exchange Regime Law
(
Ley de Régimen Penal
Cambiario
). For such reason, no allowances have been created
in this regard.
3.
On
August 26, 2014, the Bank was notified of the Resolution passed by
the Superintendent of Financial and Foreign Exchange Institutions
No. 416 dated August 7, 2014 ordering the start of Summary
Proceedings No. 5843 in the terms of Section 8 of the Foreign
Exchange Criminal Regime Law No. 19,359 (as signed into law
pursuant to Decree No. 480/95). In the above-mentioned summary
proceedings, Banco Hipotecario, its directors and former directors,
and two former managers, are charged with failure to comply with
the rules disclosed by Communication “A” 3,471
(paragraphs 2 and 3) and by Communication “A” 4805
(Paragraph 2.2.) due to certain transfers of currency made abroad
between August and October 2008 to guarantee the “CER Swap
Linked to PG08 and External Debt” swap transaction for a
total of US$ 46 thousand, without the authorization of the
Argentine Central Bank. Upon conclusion of the administrative stage
of the proceedings, the case file was sent to the Courts with
Jurisdiction over Criminal Economic Matters.
F-174
BANCO HIPOTECARIO S.A. AND SUBSIDIARIES
NOTES TO THE CONSOLIDATED FINANCIAL STATEMENTS
For the years ended December 31, 2017, 2016 and 2015
(Expressed in thousands of Argentine pesos, except share data and
as otherwise indicated)
The
case was heard by Judge Rafael F. Caputo with jurisdiction over
Criminal Economic Matters, who by means of judgment rendered on
September 27, 2017, acquitted Banco Hipotecario S.A. and its
directors and former managers involved in the summary proceedings.
As it was not appealed by the prosecutor, this judgment became
final.
4.
BACS
Banco de Crédito y Securitización S.A. has been notified
of Resolution No. 401 dated September 7, 2012 handed down by the
BCRA’s Superintendent of Financial and Exchange Institutions,
ordering to start summary proceedings against the Bank and its
Chairman, due to the late filing of documentation related to the
appointment of the Bank’s authorities
Pursuant to the
above-mentioned Resolution, a fine of Ps. 320 was imposed on
the Bank and individuals fines amounting to Ps. 393 were
imposed to its directors. Such amounts were booked as a loss of the
previous fiscal year.
BACS
and the Directors filed an appeal against Resolution No. 690 in due
course. The appeals are pending resolution by Panel IV of the
National Court of Appeals in Federal Administrative Contentious
Matters in the action styled “BACS BANCO DE CRÉDITO Y
SECURITIZACIÓN S.A. ET AL V. BANCO CENTRAL DE LA
REPÚBLICA ARGENTINA, in re. Financial Institutions Law No.
21,526, Section 42, Direct Appeal” (Case File No.
51,471/2015). On November 8, 2016, the National Court of Appeals
dismissed the appeals raised by defendants and awarded legal costs
against the losing parties.
5.
On
November 25, 2014, Tarshop S.A. was notified by the UIF that
summary proceedings had been filed, identified under Resolution No.
234/14, for potential formal violations derived from the alleged
non-compliance with Section 21, paragraph a) of Law 25,246 and UIF
Resolutions No. 27/11 and 2/12. Summonses were sent to the Company,
its Compliance Officer and the Directors then in office for them to
file their defenses. In the legal counsel’s opinion, at the
current stage of the proceedings and based on the precedents
existing at the UIF in similar cases, it is likely that a penalty
be imposed under the scope of the administrative proceedings. For
such reason, provisions have been recorded in this regard for
Ps. 360 during the previous fiscal year.
29. Programa Crédito Argentino del Bicentenario para la
Vivienda Única y Familiar (PROCREAR)
On June
12, 2012, the Argentine Executive Branch issued Decree No. 902
whereby it ordered the creation of a Public Fiduciary Fund referred
to as Programa Crédito Argentino del Bicentenario para la
Vivienda Única Familiar (Argentine Single Family Housing
Program for the Bicentennial) (PROCREAR).
On that
same date, the Bank’s Board of Directors approved the
Bank’s role as trustee of the referred fund.
On July
18, 2012, the Argentine State, as Trustor, and Banco Hipotecario
S.A. as Trustee, created the PROCREAR Administrative and Financial
Trust, and its underlying assets were transferred to it as trust
property.
The
Trust’s sole and irrevocable purpose is as follows: (i) to
manage the trust assets with the aim of facilitating the
population’s access to housing and the generation of job
opportunities as economic and social development policies, in
compliance with the principles and objectives set forth in Decree
No. 902; (ii) the use by the Trustee of the net proceeds of the
placement of the Trust Bonds (
Valores Representativos de Deuda
or
VRDs) and cash contributions by the Argentine State to originate
loans for the construction of houses in accordance with the
provisions of Decree No. 902
F-175
BANCO HIPOTECARIO S.A. AND SUBSIDIARIES
NOTES TO THE CONSOLIDATED FINANCIAL STATEMENTS
For the years ended December 31, 2017, 2016 and 2015
(Expressed in thousands of Argentine pesos, except share data and
as otherwise indicated)
and the
credit lines; and (iii) the repayment of the VRDs in accordance
with the terms of the agreement that creates the Trust and the
provisions of the Trust Law.
The
Trust shall be in effect for a term of thirty (30) years as from
the date of execution of the agreement (July 18,
2012).
In
addition to the obligations imposed on it under the Trust Law and
the Commercial Code, the Trustee is required to:
●
perform the obligations set forth
in the Trust Agreement and follow the instructions imparted on it
by the Executive Committee;
●
carry out its duties as Trustee
with the loyalty, diligence and prudence of a good businessman
acting on the basis of the trust placed on him;
●
exercise the powers granted to it
under the Agreement, and preserve the Trust Assets;
●
use the Trust Assets for lawful
purposes, in accordance with the provisions of the Agreement and
following the Executive Committee’s
instructions;
●
identify the Trust Property and
record it in a separate accounting system, segregated from its own
assets or the assets of other trusts held by it at present or in
the future in the course of its business;
●
prepare the Trust’s
financial statements, hire the relevant audit firms and comply with
the applicable disclosure regulations;
●
insure the Trust Assets against
risks that could affect their integrity;
●
invest or reinvest the
Trust’s funds in accordance with the provisions of the
Agreement and following the instructions imparted by the Executive
Committee.
As of
December 31, 2017, the PRO.CRE.AR Administrative and Financial
trust portfolio was composed of 115,665 mortgage loans for the
construction of permanent, single family houses and 157,613
consumer loans. The amount disbursed for construction as of such
date was Ps. 46,628,481 and Ps. 8,800,887, respectively. The
committed amounts pending disbursement total Ps.
199,376.
30. Resolutions issued by the Argentine Central Bank
Supplementary services to the financial business
Pursuant
to Communication “A” 5,700, the Argentine Central Bank
included changes in the rules on “Supplementary services to
the financial business and permitted activities”,
“Consolidated supervision” and “Minimum capital
requirements of financial institutions”.
The
activities that are in scope of this Communication include among
others, the issuance of credit, debit and similar cards. This
notwithstanding, provided that 25% of the total financing amount as
of the closing date of each month is not exceeded, loans not
subject to the credit card law may be extended to financial
services users as defined by Argentine Central Bank’s rules
and regulations, in which cases the provisions on “Interest
rates applicable to lending transactions” shall be complied
with.
As a
result of such Communication, on March 16, 2015, Tarshop
S.A.’s General Extraordinary Shareholders‘ Meeting
approved an amendment to its corporate purpose. According to such
amendment, the company may grant and originate personal loan and
consumer credits and financing to Users of Financial Services as
defined by Argentine Central Bank’s rules and regulations,
handle the collection of utility bills, credits and similar items,
render payroll and supplier payment and revenue collection
services.
In such
regard, on June 3, 2016, the Argentine Central Bank awarded the
Company a Provisional Authorization Code in the Register of Other
Non-Financial Credit Providers, and thus allowed it to start
granting consumer loans, in line with the amendment to the
corporate purpose recorded at the
F-176
BANCO HIPOTECARIO S.A. AND SUBSIDIARIES
NOTES TO THE CONSOLIDATED FINANCIAL STATEMENTS
For the years ended December 31, 2017, 2016 and 2015
(Expressed in thousands of Argentine pesos, except share data and
as otherwise indicated)
Superintendency
or Corporations on January 8, 2016 under number 437, book 77 of
Corporations, and authorized by the Argentine Securities Commission
under Resolution No. 17,930 dated December 21, 2015.
On July
14, 2017, the Argentine Central Bank, through Communication
“A” 6,277, eliminated the 25% cap on the origination of
consumer loans. Therefor Tarshop’s product portfolio may be
freely built.
31. Related parties transactions
The
following table sets forth transactions we have entered into with
related parties as of the dates indicated:
|
|
As
of December 31, 2017
|
|
Loans
|
|
|
BACS Banco de
Crédito y Securitización
|
16,098
|
|
|
|
|
Miscellaneous
receivables – Miscellaneous Debtors
|
|
|
BACS Banco de
Crédito y Securitización
|
1,480
|
|
BHN
Vida
|
20,469
|
|
BHN Seguros
Generales
|
16,302
|
|
Tarshop
|
242
|
|
|
|
|
Deposits
– Checking Accounts and Fixed-Term Deposits
|
|
|
BHN Sociedad de
Inversión
|
3,158
|
|
BHN
Vida
|
2,321
|
|
BHN Seguros
Generales
|
841
|
|
BH
Valores
|
2,014
|
|
BACS Banco de
Crédito y Securitización
|
156,866
|
|
Tarshop
|
32,755
|
|
|
|
|
Other
Liabilities from Financial Intermediation
|
|
|
BHN Seguros
Generales
|
12,251
|
|
BHN
Vida
|
41,296
|
|
BACS Banco de
Crédito y Securitización
|
8,304
|
|
|
|
|
Miscellaneous
Liabilities
|
|
|
BHN Seguros
Generales
|
12,472
|
|
BHN
Vida
|
23,732
|
|
BACS Banco de
Crédito y Securitización
|
3,280
|
32. Summary of Significant Differences between Argentine Banking
GAAP and U.S. GAAP
The
Bank’s consolidated financial statements have been prepared
in accordance with Argentine Banking GAAP, which differs in certain
significant respects from U.S. GAAP. Such differences involve
methods of measuring the amounts shown in the consolidated
financial statements, as well as additional disclosures required by
U.S. GAAP and regulations of the SEC.
BANCO HIPOTECARIO S.A. AND SUBSIDIARIES
NOTES TO THE CONSOLIDATED FINANCIAL STATEMENTS
For the years ended December 31, 2017, 2016 and 2015
(Expressed in thousands of Argentine pesos, except share data and
as otherwise indicated)
I.
Differences
in measurement methods
As from
March 1, 2003, inflation accounting was discontinued. The following
reconciliation does not include the reversal of the adjustments to
the consolidated financial statements for the effects of inflation,
because, as permitted by the SEC, it represents a comprehensive
measure of the effects of price-level changes in the Argentine
economy, and as such, is considered a more meaningful presentation
than historical cost-based financial reporting for both Argentine
Banking GAAP and U.S. GAAP.
The
main differences, other than inflation accounting, between
Argentine Banking GAAP and U.S. GAAP as they relate to the Bank and
its subsidiaries are described below, together with an explanation,
where appropriate, of the method used in the determination of the
necessary adjustments. References below to “ASC” are to
Accounting Standard Codification issued by the Financial Accounting
Standards Board in the United States of America.
The
following tables summarize the main reconciling items between
Argentine Banking GAAP and U.S. GAAP:
Reconciliation of net income:
|
|
|
December
31,
|
||
|
|
|
2017
|
2016
|
2015
|
|
Net
income as reported under Argentine Banking GAAP
|
Ps.
|
1,593,439
|
615,328
|
1,085,814
|
|
U.S.
GAAP adjustments:
|
|
|
|
|
|
-
Loan origination fees and costs
|
(a)
|
72,247
|
(98,754
)
|
18,058
|
|
-
Loan loss reserve
|
(b)
|
(119,741
)
|
(115,492
)
|
898
|
|
-
Derivative financial instruments
|
(c)
|
-
|
(9,746
)
|
10,153
|
|
-
Financial liabilities
|
(e)
|
(53,337
)
|
10,010
|
40,767
|
|
-
Securitizations
|
(f)
|
(108,205
)
|
(72,545
)
|
2,222
|
|
-
Intangible assets
|
|
|
|
|
|
Software
costs
|
(g)
|
2,665
|
(18,221
)
|
(28,988
)
|
|
Other
intangible assets
|
(g)
|
49,376
|
(48,992
)
|
(101,181
)
|
|
Business
combinations
|
(g)
|
23,771
|
990
|
990
|
|
-
Impairment of fixed and foreclosed assets
|
(h)
|
1,225
|
913
|
1,100
|
|
-
Miscellaneous assets
|
(n)
|
31,950
|
(5,377
)
|
(5,623
)
|
|
-
Vacation provision
|
(j)
|
(83,777
)
|
(33,449
)
|
(36,836
)
|
|
-
Insurance technical reserve
|
(k)
|
(529
)
|
42
|
(594
)
|
|
-
Financial guarantees issued
|
(m)
|
281
|
3,062
|
(3,665
)
|
|
-
Customer loyalty program
|
(o)
|
(7,764
)
|
-
|
-
|
|
-
Employee compensation plan
|
(l)
|
(439,617
)
|
-
|
-
|
|
-
Deferred income tax
|
(p)
|
(13,109
)
|
200,933
|
(32,871
)
|
|
-
Non-Controlling interest
|
(i)
|
28,684
|
14,657
|
(3,077
)
|
|
Net
income in accordance with U.S. GAAP
|
Ps.
|
977,559
|
443,359
|
947,167
|
|
-
Less Net (Gain) / Loss attributable to the
Non-Controlling interest
|
(i)
|
(21,274
)
|
4,568
|
4,500
|
|
Net
income attributable to Controlling interest in accordance with U.S.
GAAP
|
Ps.
|
956,285
|
447,927
|
951,667
|
|
Basic
and diluted net income per share in accordance with U.S.
GAAP
|
|
0.652
|
0.306
|
0.650
|
|
Average
number of shares outstanding (in thousands
|
|
1,466,577
|
1,463,365
|
1,463,365
|
F-177
BANCO HIPOTECARIO S.A. AND SUBSIDIARIES
NOTES TO THE CONSOLIDATED FINANCIAL STATEMENTS
For the years ended December 31, 2017, 2016 and 2015
(Expressed in thousands of Argentine pesos, except share data and
as otherwise indicated)
Reconciliation of shareholders’ equity
|
|
|
December
31,
|
|
|
|
|
2017
|
2016
|
|
Total
shareholders' equity under Argentine Banking GAAP
|
Ps.
|
7,649,671
|
6,056,232
|
|
U.S.
GAAP adjustments:
|
|
|
|
|
-
Loan origination fees and costs
|
(a)
|
(33,123
)
|
(105,370
)
|
|
-
Loan loss reserve
|
(b)
|
(447,853
)
|
(328,112
)
|
|
-
Government and corporate securities
|
(d)
|
1,535
|
(2,192
)
|
|
-
Financial liabilities
|
(e)
|
7,787
|
61,124
|
|
-
Securitizations
|
(f)
|
(175,504
)
|
(67,299
)
|
|
-
Intangible assets
|
|
|
|
|
Software
costs
|
(g)
|
(99,494
)
|
(102,159
)
|
|
Other
intangible assets
|
(g)
|
(304,188
)
|
(353,564
)
|
|
Business
combinations
|
(g)
|
9,432
|
2,748
|
|
-
Impairment of fixed and foreclosed assets
|
(h)
|
(34,583
)
|
(35,808
)
|
|
-
Miscellaneous assets
|
(n)
|
(604
)
|
(32,554
)
|
|
-
Vacation provision
|
(j)
|
(192,060
)
|
(108,283
)
|
|
-
Insurance technical reserve
|
(k)
|
(3,955
)
|
(3,426
)
|
|
-
Financial guarantees issued
|
(m)
|
(404
)
|
(685
)
|
|
-
Customer loyalty program
|
(o)
|
(7,764
)
|
-
|
|
-
Deferred income Tax
|
(p)
|
442,044
|
455,153
|
|
-
Non-Controlling interest
|
(i)
|
282,293
|
157,707
|
|
Total
Shareholders’ Equity under U.S. GAAP
|
Ps.
|
7,093,230
|
5,593,512
|
|
-
Non-Controlling Interest under U.S. GAAP
|
(i)
|
(250,419
)
|
(135,886
)
|
|
Consolidated
Controlling Interest Shareholders’ Equity under U.S.
GAAP
|
Ps.
|
6,842,811
|
5,457,626
|
Description of changes in shareholders’ equity under U.S.
GAAP attributable to controlling interest:
|
|
Total
Shareholders’ Equity
|
|
|
Balance as of
December 31, 2015
|
Ps.
|
5,000,738
|
|
Other Comprehensive
Income
|
|
8,961
|
|
Net income for the
year in accordance with U.S. GAAP
|
|
447,927
|
|
Balance as of
December 31, 2016
|
Ps.
|
5,457,626
|
|
Increase of
non-controlling interest over BACS (g)
|
|
(17,087
)
|
|
Employee
compensation plan (l)
|
|
439,617
|
|
Other Comprehensive
Income
|
|
6,370
|
|
Net income for the
year in accordance with U.S. GAAP
|
|
956,285
|
|
Balance as of
December 31, 2017
|
Ps.
|
6,842,811
|
a. Loan origination fees and costs
Under
Argentine Banking GAAP, the Bank and its subsidiaries does not
defer loan origination fees and costs on mortgage, personal and
credit card loans, other than those originated under the PROCREAR
program.
F-178
BANCO HIPOTECARIO S.A. AND SUBSIDIARIES
NOTES TO THE CONSOLIDATED FINANCIAL STATEMENTS
For the years ended December 31, 2017, 2016 and 2015
(Expressed in thousands of Argentine pesos, except share data and
as otherwise indicated)
Given
the Bank’s role as Trustee of the PROCREAR Administrative and
Financial Trust, (see Note 29), it has capitalized direct and
incremental expenses incurred in the mortgage loan origination
process, following the provisions of Communication “A”
5,392. Such origination expenses are amortized under the
straight-line method over 60 months.
Under
ASC 310 loan origination fees and certain direct loan origination
costs should be recognized over the life of the related loan as an
adjustment of yield using the interest method.
This
difference resulted in a shareholders’ equity adjustment
between Argentine Banking GAAP and U.S. GAAP of Ps. (33,123) and
(105,370), as of December 31, 2017 and 2016,
respectively.
b. Loan loss reserve
Under
Argentine Banking GAAP, the allowance for loan losses is calculated
according to specific criteria. This criterion is different for
commercial loans and consumer loans. Loan loss reserves for
commercial loans are principally based on the debtors’
payment capacity and cash-flows analysis. Loan loss reserves for
consumer loans are based on the client’s aging. Although the
Bank is required to follow the methodology and guidelines for
determining the minimum loan loss reserve, as set forth by the
BCRA, the Bank is allowed to establish additional loan loss
reserve. (See Note 32.II.a.)
Under
U.S. GAAP, the allowance for loan losses should be in amounts
adequate to cover inherent losses in the loan portfolio, incurred
at the respective balance sheet dates. Specifically:
a)
Loans considered
impaired, in accordance with ASC 310-10 “Accounting for
Creditors for Impairment of a Loan”, are recorded at the
present value of the expected future cash flows discounted at the
loan’s effective contractual interest rate or at the fair
value of the collateral if the loan is collateral dependent. Under
ASC 310-10, a loan is considered impaired when, based on current
information, it is probable that the borrower will be unable to pay
contractual interest or principal payments as scheduled in the loan
agreement. ASC 310-10 applies to all loans except smaller-balance
homogeneous consumer loans, loans carried at the lower of cost or
fair value, debt securities, and leases.
The
Bank applies ASC 310-10 to all commercial loans classified as
“With problems”, “Insolvency Risks” and
“Uncollectible” or commercial loans more than 90 days
past due. The Bank specifically calculates the present value of
estimated cash flows for commercial loans in excess of Ps.5,000 and
more than 90 days past due. For commercial and other loans in legal
proceedings, loans in excess of Ps.5,000 are specifically reviewed
either on a cash-flow or collateral-value basis, both considering
the estimated time to settle the proceedings.
b)
In addition, the
Bank has performed a migration analysis for mortgage, credit cards
and consumer loans following the ASC 450-20 and historical loss
ratios were determined by analyzing historical losses, in order to
calculate the allowance required for smaller-balance impaired loans
and unimpaired loans for U.S. GAAP purposes. Loss estimates are
analyzed by loan type and thus for homogeneous groups of clients.
Such historical ratios were updated to incorporate the most recent
data reflecting current economic conditions, industry performance
trends, geographic or obligor concentrations within each portfolio
segment, and any other pertinent information that may affect the
estimation of the allowance for loan losses.
Under
Argentine Banking GAAP, loans that were previously charged-off,
which are subsequently restructured and become performing loans,
are recognized again as Bank’s assets. Under U.S. GAAP
recoveries of loans previously charged off should be recorded when
collected.
F-179
BANCO HIPOTECARIO S.A. AND SUBSIDIARIES
NOTES TO THE CONSOLIDATED FINANCIAL STATEMENTS
For the years ended December 31, 2017, 2016 and 2015
(Expressed in thousands of Argentine pesos, except share data and
as otherwise indicated)
c)
Effective
July 1, 2010, the Bank and its subsidiaries implemented new
accounting guidance provided by SFAS 166 and 167 (ASC 810), which
amend the accounting for transfers of financial assets and
consolidation of variable interest entities (VIEs). As a result of
applying such guidance (ASC 810), the Bank, and its subsidiaries,
were deemed to be the primary beneficiary of the securitization
trusts because the Bank and its subsidiaries, have the power to
direct the activities of these VIEs through its servicing
responsibilities and duties. Additionally, the Bank and its
subsidiaries, through its retained interests held in these
securitizations have the obligation to absorb losses or the right
to receive benefits from the VIEs. As a result of the analysis
performed, the Bank should consolidate assets and liabilities of
those securitization trusts, eliminating the investment in the
retained interests and recording and adjustment in the allowance
for loan losses of such securitization trusts.
As a
result of analysis performed, the breakdown of the
shareholders’ equity adjustment between Argentine Banking
GAAP and U.S. GAAP between the Bank’s adjustment and the
reconsolidated securitization trusts as of December 31, 2017 and
2016 is as follows:
|
|
2017
|
2016
|
||||
|
|
Allowances under Arg.
Banking GAAP
|
Allowances under U.S.
GAAP
|
Adjustment to
shareholders’ equity
|
Allowances under Arg.
Banking GAAP
|
Allowances under U.S.
GAAP
|
Adjustment to
shareholders’ equity
|
|
|
|
|
|
|
|
|
|
Migration analysis
(*)
|
1,087,895
|
1,5666,511
|
(478,616
)
|
580,874
|
884,187
|
(303,313
)
|
|
ASC
310-10
|
119,387
|
6,605
|
112,782
|
99,706
|
19,370
|
80,336
|
|
Reinstated
loans
|
-
|
33,825
|
(33,825
)
|
-
|
40,577
|
(40,577
)
|
|
Subtotal
|
1,207,282
|
1,606,941
|
(399,659
)
|
680,580
|
944,134
|
(263,554
)
|
(*)
Migration analysis of Banco Hipotecario and its
subsidiaries.
|
|
2017
|
2016
|
||||
|
|
Allowances under Arg.
Banking GAAP
|
Allowances under U.S.
GAAP
|
Adjustment to
shareholders’ equity
|
Allowances under Arg.
Banking GAAP
|
Allowances under U.S.
GAAP
|
Adjustment to
shareholders’ equity
|
|
|
|
|
|
|
|
|
|
Reconsolidated
trusts
|
136,957
|
185,151
|
(48,194
)
|
129,109
|
193,667
|
(64,558
)
|
|
Subtotal
|
136,957
|
185,151
|
(48,194
)
|
129,109
|
193,667
|
(64,558
)
|
|
|
|
|
|
|
|
|
|
Total
|
1,344,239
|
1,792,092
|
(447,853
)
|
809,689 1,137,801
|
|
(328,112
)
|
c. Derivative Financial Instruments
As
mentioned in Notes 18 and 2.5. the Bank entered in several
derivative transactions, mainly, to hedge: i) the exchange rate
risk attached to liabilities denominated in foreign currency, and
ii) interest rate swaps to manage its interest rate
risk.
Gains
and losses are recorded in earnings in each year.
Under
U.S. GAAP, the Bank accounts for derivative financial instruments
in accordance with ASC 815 which establishes the standards of
accounting and reporting derivative instruments, including certain
derivative instruments embedded within contracts (collectively
referred to as derivatives) and hedging activities. This statement
requires institutions to recognize all derivatives in the balance
sheet, whether as assets or liabilities, and to measure
thoseinstruments at their fair value. If certain conditions are
met, a derivative may be specifically designated as (a) a hedge for
the exposure to changes in the fair value of a recorded asset or
liability or unrecorded firm commitment, (b) a hedge for the
exposure of future cash flows and (c) a hedge for the exposure of
foreign currency. If such a hedge designation is achieved then
special hedge accounting can be applied for the hedged transactions
that will reduce the volatility in the income statement to the
extent that the hedge is effective. In order for hedge accounting
to be applied the derivative and the hedged item must meet strict
designation and effectiveness tests.
The
Bank’s derivatives do not qualify for hedge accounting
treatment under U.S. GAAP. Therefore gains and losses are recorded
in earnings in each year.
Under
U.S. GAAP, the Bank’s estimates the fair value of the
receivable and payable on the derivative instrument using valuation
techniques with observable market parameters.
d. Government and corporate securities
The
following table summarizes the U.S. GAAP shareholders’ equity
adjustment related to other government and corporate securities as
of December 31, 2017 and 2016:
|
|
December 31,
|
|
|
|
2017
|
2016
|
|
|
|
|
|
Unlisted
instruments issued by the BCRA
|
Ps.
5,341
|
Ps.
1,522
|
|
Bills issued by
Provincial Governments
|
(903
)
|
(826
)
|
|
Other National
Government Bonds
|
(414
)
|
(6,033
)
|
|
Other corporate
securities
|
(2,489
)
|
3,145
|
|
Total
|
Ps.
1,535
|
Ps.
(2,192
)
|
Under
Argentine Banking GAAP, as of December 31, 2017 and 2016, some
National Government Bonds, unlisted instruments issued by the BCRA,
bills issued by Provincial Governments and some
F-180
BANCO HIPOTECARIO S.A. AND SUBSIDIARIES
NOTES TO THE CONSOLIDATED FINANCIAL STATEMENTS
For the years ended December 31, 2017, 2016 and 2015
(Expressed in thousands of Argentine pesos, except share data and
as otherwise indicated)
corporate
securities, which are comprised only of unlisted negotiable
obligations, have been recorded at cost. This value increases
monthly on the basis of the internal rate of return resulting from
the interest rate which, used as discount, matches the cash
flow’s present value with the initial value.
Under
U.S. GAAP these securities were considered available for sale
securities according with ASC 320 and recorded at fair value with
the unrealized gains and losses recognized as a charge or credit to
equity through other comprehensive income.
As of
December 31, 2017 and 2016 the following table shows the amortized
cost, book value and fair value of the mentioned
bonds:
|
|
2017
|
2016
|
||||||||
|
|
Amortized
Cost U.S. GAAP
|
Book
Value Argentine Banking GAAP
|
Fair
Value – Book value under U.S. GAAP
|
Unrealized
(Loss)/Gain
|
Shareholders’
equity Adjustment
|
Amortized
Cost U.S. GAAP
|
Book
Value Argentine Banking GAAP
|
Fair
Value – Book value under U.S. GAAP
|
Unrealized
(Loss)/Gain
|
Shareholders’
equity Adjustment
|
|
|
|
|
|
|
|
|
|
|
|
|
|
Unlisted
instruments issued by the BCRA
|
291,493
|
291,493
|
296,834
|
5,341
|
5,341
|
2,139,135
|
2,139,135
|
2,140,657
|
1,522
|
1,522
|
|
|
|
|
|
|
|
|
|
|
|
|
|
Bills
issued by Provincial Governments
|
312,675
|
312,675
|
311,772
|
(903
)
|
(903
)
|
444,966
|
444,966
|
444,140
|
(826
)
|
(826
)
|
|
|
|
|
|
|
|
|
|
|
|
|
|
Other
National Government Bonds
|
385,982
|
385,982
|
448,357
|
(414
)
|
(414
)
|
1,113,937
|
1,113,937
|
21,261
|
(6,033
)
|
(6,033
)
|
|
|
|
|
|
|
|
|
|
|
|
|
|
Other
corporate securities
|
448,357
|
448,357
|
445,868
|
(2,489
)
|
(2,489
)
|
21,261
|
21,261
|
24,406
|
3,145
|
3,145
|
e. Financial liabilities
As
described in Note 15, the Bank has issued several series of
corporate bonds in different terms and conditions. Under Argentine
Banking GAAP, the costs of originating such instruments have been
expensed as incurred.
In
addition as part of the securitization transactions that the Bank
and its subsidiaries have issued as described in Note 19, under
Argentine Banking GAAP, the cost of originating the debt securities
related to such financial trusts have been expensed as
incurred.
Under
U.S.GAAP, and according to ASC 835-30-45-3, issuance costs should
be reported in the balance sheet as deferred charges. In addition,
ASC 470-10-35-2 states that debt issuance costs should be amortized
over the same year used in the interest cost
determination.
As of
December 31, 2017 and 2016 the shareholders’ equity
adjustment, amounts to Ps. 7,787 and Ps. 61,124,
respectively.
f. Securitizations
For
Argentine Banking GAAP purposes, the debt securities and
certificates retained by the Bank and its subsidiaries are
accounted for at cost plus accrued interest for the debt
securities, and the equity method is used to account for the
residual interest in the financial trust.
F-181
BANCO HIPOTECARIO S.A. AND SUBSIDIARIES
NOTES TO THE CONSOLIDATED FINANCIAL STATEMENTS
For the years ended December 31, 2017, 2016 and 2015
(Expressed in thousands of Argentine pesos, except share data and
as otherwise indicated)
Under
U.S. GAAP the primary beneficiary of a variable interest entity
(VIE) is required to consolidate its assets and liabilities. An
entity is considered a VIE if it possesses one of the following
characteristics:
●
Insufficient
Equity Investment at Risk
●
Equity
lacks decision-making rights
●
Equity
with non-substantive voting rights
●
Lacking
the obligation to Absorb an Entity’s Expected
Losses
●
Lacking
the right to receive an Entity’s expected residual
returns
The
primary beneficiary is the party that has both (1) the power to
direct the activities of an entity that most significantly impact
the VIE’s economic performance; and (2) through its interests
in the VIE, the obligation to absorb losses or the right to receive
benefits from the VIE that could potentially be significant to the
VIE.
To
assess whether the Bank has the power to direct the activities of a
VIE that most significantly impact the VIE’s economic
performance, the Bank considers all facts and circumstances,
including its role in establishing the VIE and its ongoing rights
and responsibilities. This assessment includes, first, identifying
the activities that most significantly impact the VIE’s
economic performance; and second, identifying which party, if any,
has power over those activities.
As a
result of this assessment, the Bank was deemed to be the primary
beneficiary of financial trusts because the Bank has the power to
direct the activities of these VIEs through its servicing
responsibilities and duties. Additionally, the Bank through its
retained interests held in these securitizations has the obligation
to absorb losses or the right to receive benefits from the
VIEs.
For
U.S. GAAP purposes, as of December 31, 2017 and 2016, the Bank
consolidated VIE’s in which the Bank had a controlling
financial interest and for which it is the primary beneficiary.
Therefore, the Bank reconsolidated their net assets, eliminated the
gain or loss recognized on the sale of receivables when the
carrying value of transferred credit card receivables differs from
the amount of cash and certificates of participation received,
eliminated the servicing liabilities and re-established its loan
loss reserves under ASC 450-20. See Note 32.I.b.for allowance for
loan losses.
The
total shareholders’ equity adjustment between Argentine
Banking GAAP and U.S. GAAP as of December 31, 2017 and 2016
amounted to Ps. (175,504) and Ps. (67,299),
respectively.
Additional information required by U.S. GAAP
The
table below presents the assets and liabilities of the financial
trusts which have been consolidated for U.S. GAAP
purposes:
|
|
December
31,
|
|
|
|
2017
|
2016
|
|
|
|
|
|
Cash and due from
banks
|
Ps.
168,924
|
Ps.
165,191
|
|
Loans (net of
allowances)
|
4,278,512
|
4,485,944
|
|
Other
assets
|
1,266,842
|
2,550,250
|
|
Total
Assets
|
Ps.
5,714,278
|
Ps.
7,201,385
|
|
|
|
|
|
Debt
Securities
|
Ps.
4,146,677
|
Ps.
4,283,751
|
|
Certificates of
Participation
|
1,427,420
|
1,433,519
|
|
Other
liabilities
|
140,181
|
1,484,115
|
|
Total
Liabilities
|
Ps.
5,714,278
|
Ps.
7,201,385
|
F-182
BANCO HIPOTECARIO S.A. AND SUBSIDIARIES
NOTES TO THE CONSOLIDATED FINANCIAL STATEMENTS
For the years ended December 31, 2017, 2016 and 2015
(Expressed in thousands of Argentine pesos, except share data and
as otherwise indicated)
As of
December 31, 2017, the Bank’s maximum loss exposure, which
amounted to Ps. 5,714,278, is based on the unlikely event that all
of the assets in the VIE’s become worthless and incorporates
potential losses associated with assets recorded on the
Bank’s Balance Sheet. Nevertheless, under Argentine Law the
Debt securities will be paid exclusively with the securitized
assets.
g. Intangible Assets
Software costs and other intangible assets
Under
Argentine Banking GAAP fees paid for a re-engineering project and
for restructuring expenses incurred in relation to certain branches
are recognized as an intangible asset and amortized in a maximum of
five years under the straight-line method. Such cost should be
expensed as incurred under U.S. GAAP.
Under
Argentine Banking GAAP, the Bank capitalizes costs relating to all
three of the stages of software development. ASC 350-40 defines
three stages for the costs of computer software developed or
obtained for internal use: the preliminary project stage, the
application development stage and the post-implementation operation
stage. Only the second stage costs should be
capitalized.
Shareholders’
equity adjustment between Argentine Banking GAAP and U.S. GAAP as
of December 31, 2017 and 2016 amounted to Ps. (403,682) and Ps.
(455,723), respectively.
Business combinations
Under
Argentine Banking GAAP, net assets acquired are recorded at the
book value of the acquired company at the acquisition date and
goodwill is recognized based on the difference of the book value of
the net assets acquired and the acquisition cost. Such goodwill is
being amortized under the straight line method.
Under
U.S. GAAP, the Bank applies the purchase method of accounting to
its business combinations. The additional interest acquired was
accounted for as a step acquisition applying the purchase
method.
Accordingly,
the excess of the purchase price over the fair value of assets
acquired and liabilities assumed, if any, is considered as
goodwill.
Under
U.S. GAAP goodwill is not subject to amortization, but is subject
to at least an annual assessment for impairment. The Bank analyzes
qualitative factors to determine whether it is more likely than not
that the fair value of a reporting unit is less than its carrying
amount, including goodwill.
Goodwill
impairment exists when the fair value of the reporting unit to
which the goodwill is allocated is not enough to cover the book
value of its assets and liabilities and the goodwill. The fair
value of the reporting unit is estimated using discounted cash flow
techniques. The sustained value of the majority of the goodwill is
supported ultimately by revenue from credit-card business, included
in “Consumer and housing loans” reporting
unit.
The
evaluation methodology for potential impairment is inherently
complex and involves significant management judgment in the use of
estimates and assumptions. These estimates involve many
assumptions, including the expected results of the reporting unit,
an assumed discount rate and an assumed growth rate for the
reporting unit.
F-183
BANCO HIPOTECARIO S.A. AND SUBSIDIARIES
NOTES TO THE CONSOLIDATED FINANCIAL STATEMENTS
For the years ended December 31, 2017, 2016 and 2015
(Expressed in thousands of Argentine pesos, except share data and
as otherwise indicated)
The
Bank has reviewed Goodwill for impairment as of December 31,
2017 and 2016 and no impairment was recorded.
The
following table summarizes the acquisitions made by the Bank and
the calculation of goodwill under U.S. GAAP.
|
|
Tarshop S.A.
|
BACS Administradora de Activos S.A. S.G.F.C.I.
|
|
Acquisition date
|
August 31, 2010
|
April 26, 2012
|
|
|
|
|
|
Fair value of net
tangible assets acquired
|
Ps.
110,865
|
Ps.
1,712
|
|
Intangible assets
identified
|
24,394
|
-
|
|
Net
assets
|
Ps.
135,259
|
Ps.
1,712
|
|
|
|
|
|
%
acquired
|
80
%
|
85
%
|
|
Net assets
acquired
|
Ps.
108,208
|
Ps.
1,456
|
|
Consideration
paid
|
105,431
|
6,184
|
|
(Gain on acquisition) / Goodwill
|
Ps.
(2,777
)
|
Ps.
4,728
|
The
following table summarizes the shareholders’ equity
adjustment computed to conform the accounting of these acquisitions
to U.S. GAAP as of December 31, 2017 and 2016:
|
|
December 31,
|
|
|
|
2017
|
2016
|
|
|
|
|
|
Elimination of
Goodwill recognized under Argentine Banking GAAP
|
Ps.
(9,934
)
|
Ps.
(13,363
)
|
|
Recognition of
Goodwill under U.S. GAAP
|
4,728
|
4,728
|
|
Recognition of
Intangible Assets under U.S. GAAP
|
24,394
|
24,394
|
|
Amortization of
Intangible Assets under U.S. GAAP
|
(15,449
)
|
(13,011
)
|
|
Business combination
|
Ps.
3,739
|
Ps.
2,748
|
Acquisition of Tarshop S.A.
On
August 30, 2010, the Bank acquired 80% of Tarshop S.A. for a total
price of US$ 26.8 million, of which US$ 5.4 million were paid on
December 29, 2009 and the remaining balance was cancelled on
September 13, 2010.
Under
Argentine Banking GAAP, net assets acquired are recorded at the
book value of the acquired company at the acquisition date and
goodwill is recognized based on the difference of the book value of
the net assets acquired and the acquisition cost. Such goodwill is
being amortized under the straight-line method over ten years. As
of December 31, 2017 and 2016, net book value of goodwill
recognized amount to Ps.7,885 and Ps.10,842,
respectively.
Under U.S. GAAP, ASC 805 requires the acquisition of controlling
interest of
Tarshop S.A.
to be
accounted for as a business combination applying the purchase
method, recognizing all net assets acquired at their respective
fair value.
The
Banks had identified different intangible assets associated with
this acquisition, mainly customer relationships, trademark and
workforce amounting to Ps. 24,394 as of the acquisition date. Such
intangible assets are amortized based on their respective useful
lives.
F-184
BANCO HIPOTECARIO S.A. AND SUBSIDIARIES
NOTES TO THE CONSOLIDATED FINANCIAL STATEMENTS
For the years ended December 31, 2017, 2016 and 2015
(Expressed in thousands of Argentine pesos, except share data and
as otherwise indicated)
Acquisition of BACS Administradora de Activos S.A.
S.G.F.C.I.
On April 26, 2012 BACS Banco de Crédito y Securitización
S.A. acquired 85% of the shares of BACS Administradora de Activos
S.A. S.G.F.C.I. (formerly FCMI Argentina Financial Corporation S.A.
S.G.F.C.I.) for Ps. 6 million.
Under
Argentine Banking GAAP, net assets acquired are recorded at the
book value of the acquired company at the acquisition date and
goodwill is recognized based on the difference of the book value of
the net assets acquired and the acquisition cost. Such goodwill is
being amortized under the straight-line method over ten years. As
of December 31, 2017 and 2016, net book value of goodwill
recognized amount to Ps.2,049 and Ps.2,521,
respectively.
Under U.S. GAAP, ASC 805 requires the acquisition of controlling
interest of BACS Administradora de Activos S.A. S.G.F.C.I. (former
FCMI Argentina Financial Corporation S.A. S.G.F.C.I.) to be
accounted for as a business combination applying the purchase
method, recognizing all net assets acquired at their fair
value.
Goodwill
amortization recognized under Argentine Banking GAAP has been
reversed for U.S. GAAP purposes.
Increase of non-controlling interest over BACS
Under
Argentine Banking GAAP the dilution in the Bank ownership over BACS
as a result of its debt conversion resulted in a loss of Ps. 22,780
that was recognized in the statement of income. (See Note 16).
Under U.S. GAAP this transaction was treated as an equity
transaction for a total amount of Ps. 17,087 due to differences in
accounting basis.
APSA Media S.A.
On
January 13, 2011, Tarshop S.A. acquired from APSA Media S.A.,
previously Metroshop S.A., a portfolio of credit cards delinquent
by less than 60 days; a contractual position in contracts for the
issuance of credit cards; the accounts of customers, the lease
agreements and movable property at certain branches and the
contracts of employment with personnel under a labor
relationship.
Under
Argentine Banking GAAP, no intangible assets should be recognized
in accordance with this transaction.
Under
U.S. GAAP, ASC 350-30 defines that an intangible asset which is
acquired either individually or with a group of other assets shall
be recognized. Assets are recognized based on their cost to the
acquiring entity, which generally includes the transaction costs of
the assets acquisition, and no gain or loss is recognized unless
the fair value of noncash assets given as consideration differs the
assets’ carrying amount on the acquiring entity’s
books. The cost of a group of assets acquired shall be allocated to
the individual assets acquired or liabilities assumed based on
their relative fair values and shall not give rise to
goodwill.
h.
Impairment of fixed assets and
foreclosed assets
Under
Argentine Banking GAAP, fixed assets and foreclosed assets were
adjusted for inflation using the WPI index at February 28, 2003. As
such, the balances of fixed assets and foreclosed assets were
increased approximately 120%.
F-185
BANCO HIPOTECARIO S.A. AND SUBSIDIARIES
NOTES TO THE CONSOLIDATED FINANCIAL STATEMENTS
For the years ended December 31, 2017, 2016 and 2015
(Expressed in thousands of Argentine pesos, except share data and
as otherwise indicated)
In
accordance with ASC 360-10 such assets are subject to impairment
tests in certain circumstances. Because projected cash flows
associated with fixed assets and foreclosed assets are insufficient
to recover the restated carrying amounts of the assets, those
assets should be tested for impairment. In the absence of credible
market values for fixed and foreclosed assets, the Bank under U.S.
GAAP reversed the restatement of fixed and foreclosed
assets.
No
additional impairment was recorded over fixed assets and foreclosed
assets.
Shareholders’
equity adjustment between Argentine Banking GAAP and U.S. GAAP as
of December 31, 2017 and 2016 amounted to Ps. (34,583) and Ps.
(35,808), respectively. The differences between years are due to
depreciation recorded under Argentine Banking GAAP.
i. Non-controlling interest
Argentine
Banking GAAP rules require recording non-controlling interests as a
component of the liabilities. ASC 810 requires recording such
interests as shareholders’ equity. In addition, the U.S. GAAP
adjustment represents the allocation to the non-controlling
interest of certain U.S. GAAP adjustments related to
subsidiaries.
j. Vacation Provision
Under
Argentine Banking GAAP, the cost of vacations earned by employees
is recorded when paid. U.S. GAAP requires that this expense be
recorded on an accrual basis as the vacations are
earned.
Shareholders’
equity adjustment between Argentine Banking GAAP and U.S. GAAP as
of December 31, 2017 and 2016 amounted to Ps. (192,060) and Ps.
(108,283), respectively.
k. Insurance Technical Reserve
Under
Argentine Banking GAAP,
insurance
technical reserves are calculated according to the certain
regulations issued by the National Insurance Superintendency.
F
or U.S. GAAP purposes the Bank has accounted these
insurance technical reserves under ASC 944.
Therefore, the technical reserves for the year ended December 31,
2017 and 2016 were adjusted for U.S. GAAP purposes.
Shareholders’ equity adjustment
as of December 31,
2017 and 2016 amounted to Ps. (3,955) and Ps. (3,426),
respectively
.
l. Employee compensation plan
The Bank has established an employee compensation plan for its
employees, which was approved by the CNV on November 30, 2017.
Under this plan an aggregate 36,624,733 Class D treasury stock were
allocated on a pro rata basis to the employees that qualifiedas
beneficiaries under the terms of the program. Beneficiaries are
entitled to economic benefits derived from such shares. Shares will
be transferred to beneficiaries under the terms of the program.
Beneficiaries are entitled to economic benefits derived from such
shares. Shares will be transferred to beneficiaries upon the
fulfillment of certain conditions.
Under Argentine Banking GAAP, no compensation has been recognized
as a result of the implementation of this plan.
ASC 718 requires this plan to be accounted for as a nonleveraged
employee compensation plan, recognizing the compensation cost as
the fair value of the shares contributed to the employee
compensation plan. As of November 30, 2017, the Bank recognized the
fair value of the treasury
F-186
BANCO HIPOTECARIO S.A. AND SUBSIDIARIES
NOTES TO THE CONSOLIDATED FINANCIAL STATEMENTS
For the years ended December 31, 2017, 2016 and 2015
(Expressed in thousands of Argentine pesos, except share data and
as otherwise indicated)
stock set aside for the plan under the line “payroll
expenses”, with its related contra-account in
shareholders’ equity.
All
shares held as treasury stock and included in the employee
compensation plan are treated as outstanding in computing the
Bank's earnings per share (See note 2.25).
The net income reconciliation for the year ended December 31, 2017,
between Argentine Banking GAAP and U.S. GAAP includes Ps.
(439,617).
m. Financial guarantees issued
During the year ended December 31, 2017, the Bank entered into
different agreements to guarantee lines of credit of selected
customers. As of December 31, 2017, guarantees granted by the Bank
amounted to Ps
.86,897
.
Under Argentine Banking GAAP the guarantees are recorded in
memorandum accounts and are recognized as liabilities when it is
probable that the obligation undertaken by the guarantor will be
performed. As of December 31, 2017, for U.S. GAAP purposes the Bank
recognized a liability for the fair value of the obligations
assumed at its inception in accordance with the requirements of ASC
460. Such liabilities are being amortized over the expected term of
the guarantee. As of December 31, 2017 and 2016, the fair value of
the guarantees less the estimated proceeds from collateral amounted
to Ps.
(404) and Ps.(685), respectively
.
As of December 31, 2017, the Bank maintained the following
guarantees:
|
|
As of December 31, 2017
|
|||||
|
|
Maximum Potential Payments (*)
|
Estimated Proceeds from collateral resource
|
U.S. GAAP adjustment
|
|||
|
Financial
guarantees
|
Ps.
|
86,897
|
Ps.
|
1,536
|
Ps.
|
(404
)
|
|
Ps.
|
86,897
|
Ps.
|
1,536
|
Ps.
|
(404
)
|
|
|
|
As of December 31, 2016
|
|||||
|
|
Maximum Potential Payments (*)
|
Estimated Proceeds from collateral resource
|
U.S. GAAP adjustment
|
|||
|
Financial
guarantees
|
Ps.
|
103,040
|
Ps.
|
2,026
|
Ps.
|
(685
)
|
|
Ps.
|
103,040
|
Ps.
|
2,026
|
Ps.
|
(685
)
|
|
(*) The maximum potential payments represent a “worse-case
scenario”, and do not necessarily reflect expected results.
Estimated proceeds from collateral and recourse represent the
anticipated value of assets that could be liquidated or received
from other parties to offset the Company’s payments under
guarantees.
n. Miscellaneous assets
Under Argentine Banking GAAP, certain stationary items and others
of similar nature, are booked under the caption
“Miscellaneous assets”.
For U.S. GAAP purposes, these amounts should be expensed as
incurred.
F-187
BANCO HIPOTECARIO S.A. AND SUBSIDIARIES
NOTES TO THE CONSOLIDATED FINANCIAL STATEMENTS
For the years ended December 31, 2017, 2016 and 2015
(Expressed in thousands of Argentine pesos, except share data and
as otherwise indicated)
Shareholders’ equity adjustment between Argentine Banking
GAAP and U.S. GAAP as of December 31, 2017 and 2016 amounted to Ps.
(604) and Ps. (32,554), respectively.
o. Customer loyalty program
The Bank offers a reward program that allows its cardholders to
earn points that can be redeemed for a broad range of rewards,
including goods and travels among others.
Under U.S. GAAP the Bank establishes a reward liability based upon
the points earned that are expected to be redeemed and the average
fair value of the point. The points to be redeemed are estimated
based on past redemption behavior. The liability is reduced as the
points are redeemed.
Shareholders’ equity adjustment between Argentine Banking
GAAP and U.S. GAAP as of December 31, 2017 amounted to Ps.
(7,764).
p. Deferred Income Tax
Argentine Banking GAAP requires income tax to be recognized on the
basis of amounts due in accordance with Argentine tax basis
regulations. Temporary differences between the financial reporting
and income tax of accounting are therefore not considered in
recognizing income tax.
In
accordance with ASC 740-10 under U.S. GAAP income tax is recognized
on the liability method whereby deferred tax assets and liabilities
are established for temporary differences between the financial
reporting and tax of the assets and liabilities. Deferred tax
assets are also recognized for tax loss carryforwards. Deferred tax
basis assets and liabilities are measured using enacted tax rates
expected to apply to taxable income in the years in which those
temporary differences are expected to be recorded or settled. The
effect on deferred tax assets and liabilities of a change in tax
rates is recognized in income in the period that includes the
enactment date. A valuation allowance is recognized for that
component of net deferred tax assets which is “more likely
than not” that it will not be recoverable.
As of
December 31, 2017 and 2016, and based on the tax projections
performed, the Bank believes that is more likely than not that it
will recover the net operating tax loss carry forward and all the
temporary differences, with future taxable income.
ASC 740
prescribes a comprehensive model for the recognition, measurement,
financial statement presentation and disclosure of uncertain tax
positions taken or expected to be taken in a tax return.
Additionally, it provides guidance on derecognition,
classification, interest and penalties, accounting in interim
periods, disclosure and transition.
The
Bank classifies income tax-related interest and penalties as income
tax in the financial statements. The adoption of this pronouncement
had no effect on the Bank’s overall financial position or
results of operations.
In a
consolidated basis, the Bank has recognized a shareholders’
equity adjustment between Argentine Banking GAAP and U.S. GAAP that
amounted to Ps. 442,044 and Ps. 455,153, as of December 31, 2017
and 2016, respectively.
F-188
BANCO HIPOTECARIO S.A. AND SUBSIDIARIES
NOTES TO THE CONSOLIDATED FINANCIAL STATEMENTS
For the years ended December 31, 2017, 2016 and 2015
(Expressed in thousands of Argentine pesos, except share data and
as otherwise indicated)
Deferred
tax assets / (liabilities) are summarized as
follows:
|
|
As of December 31, 2017
|
|||||
|
|
ASC 740-10 applied to Argentine Banking GAAP balances
|
ASC 740-10 applied to U.S. GAAP adjustments
|
U.S. GAAP Deferred Tax total
|
|||
|
Deferred tax assets
|
|
|
|
|
|
|
|
Allowances
for loan losses
|
Ps.
|
56,172
|
Ps.
|
133,587
|
Ps.
|
189,759
|
|
Provisions
|
|
156,577
|
|
61,134
|
|
217,711
|
|
Transfer
of financial assets
|
|
92,737
|
|
52,651
|
|
145,388
|
|
Intangible
assets
|
|
-
|
|
27,908
|
|
27,908
|
|
Others
|
|
21,248
|
|
5,524
|
|
26,772
|
|
Loss
carry forward
|
|
39,085
|
|
-
|
|
39,085
|
|
Ps.
|
365,819
|
Ps.
|
280,804
|
Ps.
|
646,623
|
|
|
|
|
|
|
|
|
|
|
Deferred tax liabilities
|
|
|
|
|
|
|
|
Allowances
for loan losses
|
|
14,460
|
|
-
|
|
14,460
|
|
Investments
|
|
90,632
|
|
461
|
|
91,093
|
|
Fixed
assets
|
|
88,313
|
|
-
|
|
88,313
|
|
Exchange
rate differences
|
|
3,320
|
|
-
|
|
3,320
|
|
Others
|
|
1,504
|
|
5,889
|
|
7,393
|
|
Ps.
|
198,229
|
Ps.
|
6,350
|
Ps.
|
204,579
|
|
|
|
|
|
|
|
|
|
|
Ps.
|
167,590
|
Ps.
|
274,454
|
Ps.
|
442,044
|
|
|
|
As of December 31, 2016
|
|||||
|
|
ASC 740-10 applied to Argentine Banking GAAP balances
|
ASC 740-10 applied to U.S. GAAP adjustments
|
U.S. GAAP Deferred Tax total
|
|||
|
Deferred tax assets
|
|
|
|
|
|
|
|
Allowances
for loan losses
|
Ps.
|
2,054
|
Ps.
|
114,839
|
Ps.
|
116,893
|
|
Provisions
|
|
156,950
|
|
39,098
|
|
196,048
|
|
Transfer
of financial assets
|
|
55,798
|
|
17,575
|
|
73,373
|
|
Intangible
assets
|
|
-
|
|
35,184
|
|
35,184
|
|
Others
|
|
-
|
|
12,855
|
|
12,855
|
|
Loss
carry forward
|
|
137,007
|
|
-
|
|
137,007
|
|
Ps.
|
351,809
|
Ps.
|
219,551
|
Ps.
|
571,360
|
|
|
|
|
|
|
|
|
|
|
Deferred tax liabilities
|
|
|
|
|
|
|
|
Investments
|
|
59,930
|
|
-
|
|
59,930
|
|
Fixed
assets
|
|
11,467
|
|
-
|
|
11,467
|
|
Exchange
rate differences
|
|
21,628
|
|
-
|
|
21,628
|
|
Others
|
|
827
|
|
22,355
|
|
23,182
|
|
Ps.
|
93,852
|
Ps.
|
22,355
|
Ps.
|
116,207
|
|
|
|
|
|
|
|
|
|
|
Ps.
|
257,957
|
Ps.
|
197,196
|
Ps.
|
455,153
|
|
F-189
BANCO HIPOTECARIO S.A. AND SUBSIDIARIES
NOTES TO THE CONSOLIDATED FINANCIAL STATEMENTS
For the years ended December 31, 2017, 2016 and 2015
(Expressed in thousands of Argentine pesos, except share data and
as otherwise indicated)
The
following table reconciles the statutory income tax rate in
Argentina to the Bank’s effective rate calculated on the
basis of U.S. GAAP for the years ended December 31, 2017, 2016 and
2015:
|
|
As of December 31,
|
|||||
|
|
2017
|
2016
|
2015
|
|||
|
|
|
|
|
|
|
|
|
Pre-tax
income in accordance with U.S. GAAP
|
Ps.
|
1,523,326
|
Ps.
|
758,605
|
Ps.
|
1,598,937
|
|
Statutory
income tax rate
|
|
30
%
|
|
35
%
|
|
35
%
|
|
Tax on net income at statutory rate
|
Ps.
|
456,998
|
Ps.
|
265,512
|
Ps.
|
559,628
|
|
|
|
|
|
|
|
|
|
Permanent
tax differences
|
|
88,769
|
|
49,734
|
|
92,142
|
|
Income tax in accordance with U.S. GAAP
|
Ps.
|
545,769
|
Ps.
|
315,246
|
Ps.
|
651,770
|
The
following table shows the tax years open for examination as of
December 31, 2017, by major tax jurisdictions in which the Bank and
its subsidiaries operate:
|
Jurisdiction
|
Tax year
|
|
Argentina
|
2012 - 2017
|
q. Items in process of collection
The
Bank does not give accounting recognition to checks drawn on the
Bank or other banks, or other items to be collected until such time
as the related item clears or is accepted. Such items are recorded
by the Bank in memorandum accounts. U.S. banks, however, account
for such items through balance sheet clearing accounts at the time
the items are presented to the Bank.
The
Bank’s assets and liabilities would be increased by
approximately Ps.642,559 and Ps.521,662, had U.S. GAAP been applied
at December 31, 2017 and 2016, respectively.
r. Earnings per share
Argentine
Banking GAAP rules do not require the disclosure of earnings per
share or dividends per share.
Under
US GAAP, ASC 260 “Earning Per Share”, it is required to
present basic per-share amounts (basic EPS) which is computed by
dividing income available to common shareholders by the
weighted-average number of common shares outstanding during the
period.
Diluted
earnings per share (diluted EPS) measure the performance if the
potential common shares that were dilutive had been issued.
Potential common shares are securities that do not have a current
right to participate fully in earnings but could do so in the
future. No potential common shares exist, and therefore basic and
diluted EPS are the same.
F-190
BANCO HIPOTECARIO S.A. AND SUBSIDIARIES
NOTES TO THE CONSOLIDATED FINANCIAL STATEMENTS
For the years ended December 31, 2017, 2016 and 2015
(Expressed in thousands of Argentine pesos, except share data and
as otherwise indicated)
The
following table sets forth the computation of basic
EPS:
|
|
|
As of December 31,
|
|
|||||||
|
|
|
2017
|
|
2016
|
|
2015
|
|
|||
|
Earnings
per share under US GAAP
|
|
|
|
|
|
|
|
|
|
|
|
Numerator
|
|
|
|
|
|
|
|
|
|
|
|
Net
income for the year attributable to the Controlling
interest
|
|
Ps.
|
956,285
|
|
Ps.
|
447,927
|
|
Ps.
|
951,667
|
|
|
Denominator
|
|
|
|
|
|
|
|
|||
|
Average
number of shares outstanding (in thousands)
|
|
1,466,577
|
|
1,463,365
|
|
1,463,365
|
|
|||
|
Net
income per common share
|
|
|
|
|
|
|
|
|
|
|
|
Basic
and diluted
|
|
Ps.
|
0.652
|
|
Ps.
|
0.306
|
|
Ps.
|
0.650
|
|
The sum
of the shares determined on a daily basis divided by the number of
days in the period, as follows:
|
|
|
As of December 31,
|
|
|||||||
|
|
|
2017
|
|
2016
|
|
2015
|
|
|||
|
|
|
(in
thousands)
|
|
|||||||
|
Denominator
|
|
|
|
|
|
|
|
|
|
|
|
Shares
outstanding
|
|
1,463,365
|
365
days
|
|
1,463,365
|
365
days
|
|
1,463,365
|
365
days
|
|
|
Employee
compensation plan (See note Note 32.I.f)
common share
|
|
36,635
|
32
days
|
|
-
|
|
|
-
|
|
|
|
Average
number of shares outstanding
|
|
1,466,577
|
|
|
1,463,365
|
|
|
1,463,365
|
|
|
II.
Additional
disclosure requirements:
a. Credit Risk disclosures
Allowance for credit losses and recorded investments in financial
receivables
The
following table presents the allowance for account receivables
losses and the related carrying amount of Financing Receivables for
the years ended December 31, 2017 and 2016
respectively:
|
|
As of December 31, 2017
|
|||||
|
|
Consumer Loan Portfolio
|
Commercial Loan Portfolio
|
Total
|
|||
|
Allowance for credit losses:
|
|
|
|
|
|
|
|
Ending
balance: individually evaluated for impairment
|
Ps.
|
-
|
Ps.
|
6,605
|
Ps.
|
6,605
|
|
Ending
balance: collectively evaluated for impairment
|
|
1,780,801
(*)
|
|
4,686
|
|
1,785,487
|
|
Ending Balance
|
Ps.
|
1,780,801
|
Ps.
|
11,291
|
Ps.
|
1,792,092
|
|
Financing receivables:
|
|
|
|
|
|
|
|
Ending
balance: individually evaluated for impairment
|
Ps.
|
-
|
Ps.
|
10,254
|
Ps.
|
10,254
|
|
Ending
balance: collectively evaluated for impairment
|
|
29,020,791
|
|
12,540,402
|
|
41,561,193
|
|
Ending Balance
|
Ps.
|
29,020,791
|
Ps.
|
12,550,656
|
Ps.
|
41,571,447
|
F-191
BANCO HIPOTECARIO S.A. AND SUBSIDIARIES
NOTES TO THE CONSOLIDATED FINANCIAL STATEMENTS
For the years ended December 31, 2017, 2016 and 2015
(Expressed in thousands of Argentine pesos, except share data and
as otherwise indicated)
|
|
As of December 31, 2016
|
|||||
|
|
Consumer Loan Portfolio
|
Commercial Loan Portfolio
|
Total
|
|||
|
Allowance for credit losses:
|
|
|
|
|
|
|
|
Ending
balance: individually evaluated for impairment
|
Ps.
|
-
|
Ps.
|
19,370
|
Ps.
|
19,370
|
|
Ending
balance: collectively evaluated for impairment
|
|
1,114,370
(*)
|
|
4,061
|
|
1,118,431
|
|
Ending Balance
|
Ps.
|
1,114,370
|
Ps.
|
23,431
|
Ps.
|
1,137,801
|
|
Financing receivables:
|
|
|
|
|
|
|
|
Ending
balance: individually evaluated for impairment
|
Ps.
|
-
|
Ps.
|
23,005
|
Ps.
|
23,005
|
|
Ending
balance: collectively evaluated for impairment
|
|
23,921,996
|
|
9,055,673
|
|
32,977,669
|
|
Ending Balance
|
Ps.
|
23,921,996
|
Ps.
|
9,078,678
|
Ps.
|
33,000,674
|
(*)
Includes mortgage consumer loans 180 days or more overdue and other
consumer loans 90 days or more overdue, which mainly comprises
“Medium Risk”, “High Risk” and
“Uncollectible” categories.
The
activity in the allowance for loan losses for period is as
follows:
|
|
As of December 31,
|
|||||
|
|
2017
|
2016
|
2015
|
|||
|
Allowance for credit losses:
|
|
|
|
|
|
|
|
Beginning Balance
|
Ps.
|
1,137,801
|
Ps.
|
785,329
|
Ps.
|
785,329
|
|
Charge-offs
|
|
(558,356
)
|
|
(290,096
)
|
|
(306,155
)
|
|
Recoveries
|
|
182,025
|
|
60,711
|
|
51,711
|
|
Provision
for loan losses
|
|
1,030,622
|
|
581,857
|
|
353,281
|
|
Ending Balance
|
Ps.
|
1,792,092
|
Ps.
|
1,137,801
|
Ps.
|
785,329
|
Account receivable charge-off and recoveries
Under
Argentine GAAP, recoveries on previously charge-off account
receivable are recorded directly to income and the amount of
charge-off account receivable in excess of amounts specifically
allocated is recorded as a direct charge to the income statement.
The Bank does not partially charge off troubled account receivable
until final disposition of the credit, rather, the allowance is
maintained on a credit-by –credit basis for its estimated
settlement value. Under U.S. GAAP, all charge off and recovery
activity is recorded through the allowance for account receivable
losses account. Further, account receivables are generally charged
to the allowance account when all or part of the credit is
considered uncollectible.
Impaired loans
ASC
310, requires a creditor to measure impairment of a loan based on
the present value of expected future cash flows discounted at the
loan’s effective interest rate, or at the loan’s
observable market price or the fair value of the collateral if the
loan is collateral dependent. This Statement is applicable to all
loans (including those restructured in a troubled debt
restructuring involving amendment of terms), except large groups of
smaller-balance homogenous loans that are collectively evaluated
for impairment. Loans are considered impaired when, based on
Management’s evaluation, a borrower will not be able to
fulfill its obligation under the original loan terms.
F-192
BANCO HIPOTECARIO S.A. AND SUBSIDIARIES
NOTES TO THE CONSOLIDATED FINANCIAL STATEMENTS
For the years ended December 31, 2017, 2016 and 2015
(Expressed in thousands of Argentine pesos, except share data and
as otherwise indicated)
The
following table discloses the amounts of loans considered impaired
in accordance with ASC 310, as of December 31, 2017 and
2016:
|
|
As of December 31, 2017
|
|||||
|
|
Recorded Investment
|
Unpaid Principal Balance
|
Related Allowance
|
|||
|
With no related allowance recorded:
|
|
|
|
|
|
|
|
Commercial
|
|
|
|
|
|
|
|
Impaired
Loans
|
Ps.
|
-
|
Ps.
|
-
|
Ps.
|
-
|
|
|
|
|
|
|
|
|
|
With an allowance recorded:
|
|
|
|
|
|
|
|
Commercial
|
|
|
|
|
|
|
|
Impaired
Loans
|
Ps.
|
10,254
|
Ps.
|
7,447
|
Ps.
|
6,605
|
|
Total
|
Ps.
|
10,254
|
Ps.
|
7,447
|
Ps.
|
6,605
|
|
|
As of December 31, 2016
|
|||||
|
|
Recorded Investment
|
Unpaid Principal Balance
|
Related Allowance
|
|||
|
With no related allowance recorded:
|
|
|
|
|
|
|
|
Commercial
|
|
|
|
|
|
|
|
Impaired
Loans
|
Ps.
|
-
|
Ps.
|
-
|
Ps.
|
-
|
|
|
|
|
|
|
|
|
|
With an allowance recorded:
|
|
|
|
|
|
|
|
Commercial
|
|
|
|
|
|
|
|
Impaired
Loans
|
Ps.
|
23,005
|
Ps.
|
19,214
|
Ps.
|
19,370
|
|
Total
|
Ps.
|
23,005
|
Ps.
|
19,214
|
Ps.
|
19,370
|
The
average recorded investment in impaired loans amounted Ps. 11,114
and Ps. 29,997, as of December 31, 2017 and 2016, respectively.
There is no amount of interest income recognized during the time
within the period that the loans were impaired.
Non-accrual accounts receivables and Past due
The
method applied to recognize income on loans is described in Note
2.2.
Additionally,
the Bank has made use of the option granted by the BCRA authorizing
financial entities to interrupt the accrual of interest for clients
in the following categories: (a)“With
problems”;“With high risk of insolvency” and
“Irrecoverable” in the commercial portfolio; and (b)
“Medium risk”;“High risk” and
“Irrecoverable” in the consumer portfolio.
According
to the above, the threshold for suspending the accrual of interest
is as from 91 days of arrears. Resumption of interest accrual takes
place when the client improves its situation passing to situation:
(a) “Normal” or “With special tracking —
Under observation” in the commercial portfolio and (b)
“Normal” or “Low risk” in the consumer
portfolio.
The
Bank recognizes interest income on a cash basis for non-accrual
loans. Recognition of interest on loans is generally discontinued
when, in the opinion of management, there is an assessment that the
borrower will likely be unable to meet all contractual payments as
they become due.
F-193
BANCO HIPOTECARIO S.A. AND SUBSIDIARIES
NOTES TO THE CONSOLIDATED FINANCIAL STATEMENTS
For the years ended December 31, 2017, 2016 and 2015
(Expressed in thousands of Argentine pesos, except share data and
as otherwise indicated)
As a
general practice, this occurs when loans are 90 days or more
overdue. Any accrued but uncollected interest is reversed against
interest income at that time.
As
consequence, non-accrual loans are defined as those loans
classified under Argentine Central Bank rules in the following
categories of: (a) Consumer portfolio: “Medium Risk”,
“High Risk” and “Uncollectible” and (b)
Commercial portfolio: “With problems”, “High Risk
of Insolvency” and “Uncollectible”.
The
following table represents the amounts of non-accruals, as of
December 31, 2017 and 2016, respectively:
F-194
BANCO HIPOTECARIO S.A. AND SUBSIDIARIES
NOTES TO THE CONSOLIDATED FINANCIAL STATEMENTS
For the years ended December 31, 2017, 2016 and 2015
(Expressed in thousands of Argentine pesos, except share data and
as otherwise indicated)
|
|
As of December 31,
|
|||
|
|
2017
|
2016
|
||
|
Consumer
|
|
|
|
|
|
Advances
|
Ps.
|
559
|
Ps.
|
416
|
|
Mortgage
Loans
|
|
21,464
|
|
26,523
|
|
Personal Loans
– BHSA
|
|
325,250
|
|
179,214
|
|
Credit Card Loans
– BHSA
|
|
230,127
|
|
202,378
|
|
Credit card Loans
– Tarshop
|
|
932,752
|
|
473,025
|
|
Personal Loans
– Tarshop
|
|
100,064
|
|
33,392
|
|
Total
Consumer
|
Ps.
|
1,610,216
|
Ps.
|
914,948
|
|
Commercial
|
|
|
|
|
|
Performing
Loans
|
Ps.
|
-
|
Ps.
|
-
|
|
Impaired
Loans
|
|
10,254
|
|
23,005
|
|
Total
Commercial
|
Ps.
|
10,254
|
Ps.
|
23,005
|
|
|
|
|
|
|
|
Total
Non-accrual loans
|
Ps.
|
1,620,470
|
Ps.
|
937,953
|
An
aging analysis of past due account receivables, segregated by class
of account receivables, as of December 31, 2017 and 2016 was as
follows:
|
|
As of December 31, 2017
|
||||||
|
|
30-90
|
91-180
|
181-360
|
|
|
|
|
|
|
Days Past
|
Days
Past
|
Days
Past
|
Greater
|
Total
Past
|
Current
|
Total
|
|
|
Due
|
Due
|
Due
|
than
360
|
Due
|
|
Financing
|
|
Consumer
|
|
|
|
|
|
|
|
|
Advances
|
209
|
181
|
126
|
39
|
555
|
3,982
|
4,537
|
|
Mortgage
Loans
|
24,222
|
3,921
|
3,517
|
6,598
|
38,258
|
3,155,359
|
3,193,617
|
|
Personal Loans
– BHSA
|
288,667
|
109,137
|
104,154
|
816
|
502,774
|
5,943,837
|
6,446,611
|
|
Personal Loans
– Tarshop
|
35,242
|
25,200
|
43,659
|
31,205
|
135,306
|
423,185
|
558,491
|
|
Credit Card Loans
– BHSA
|
132,642
|
90,854
|
111,069
|
1,602
|
336,167
|
12,250,473
|
12,586,640
|
|
Credit card Loans
– Tarshop
|
328,087
|
229,710
|
413,799
|
288,035
|
1,259,631
|
4,971,264
|
6,230,895
|
|
Total
Consumer Loans
|
809,069
|
459,003
|
676,324
|
328,295
|
2,272,691
|
26,748,100
|
29,020,791
|
|
|
|
|
|
|
|
|
|
|
Commercial:
|
|
|
|
|
|
|
|
|
Performing
Loans
|
36,755
|
-
|
-
|
-
|
36,755
|
12,503,647
|
12,540,402
|
|
Impaired
loans
|
-
|
556
|
6,365
|
3,333
|
10,254
|
-
|
10,254
|
|
Total
Commercial Loans
|
36,755
|
556
|
6,365
|
3,333
|
47,009
|
12,503,647
|
12,550,656
|
|
Total
|
845,824
|
459,559
|
682,689
|
331,628
|
2,319,700
|
39,251,747
|
41,571,447
|
F-195
BANCO HIPOTECARIO S.A. AND SUBSIDIARIES
NOTES TO THE CONSOLIDATED FINANCIAL STATEMENTS
For the years ended December 31, 2017, 2016 and 2015
(Expressed in thousands of Argentine pesos, except share data and
as otherwise indicated)
|
|
As of December 31, 2016
|
||||||
|
|
30-90
|
91-180
|
181-360
|
|
|
|
|
|
|
Days Past
|
Days
Past
|
Days
Past
|
Greater
|
Total
Past
|
Current
|
Total
|
|
|
Due
|
Due
|
Due
|
than
360
|
Due
|
|
Financing
|
|
Consumer
|
|
|
|
|
|
|
|
|
Advances
|
348
|
60
|
88
|
51
|
547
|
11,689
|
12,236
|
|
Mortgage
Loans
|
31,299
|
5,073
|
3,508
|
9,373
|
49,253
|
2,555,513
|
2,604,766
|
|
Personal Loans
– BHSA
|
164,131
|
58,075
|
57,746
|
344
|
280,296
|
4,234,296
|
4,514,592
|
|
Personal Loans
– Tarshop
|
17,956
|
13,149
|
13,978
|
6,265
|
51,348
|
251,618
|
302,966
|
|
Credit Card Loans
– BHSA
|
125,596
|
84,114
|
93,210
|
145
|
303,065
|
11,161,313
|
11,464,378
|
|
Credit card Loans
– Tarshop
|
266,915
|
192,011
|
204,732
|
89,217
|
752,875
|
4,270,183
|
5,023,058
|
|
Total
Consumer Loans
|
606,245
|
352,482
|
373,262
|
105,395
|
1,437,384
|
22,484,612
|
23,921,996
|
|
|
|
|
|
|
|
|
|
|
Commercial:
|
|
|
|
|
|
|
|
|
Performing
Loans
|
950
|
-
|
-
|
-
|
950
|
9,054,723
|
9,055,673
|
|
Impaired
loans
|
-
|
985
|
5,089
|
16,931
|
23,005
|
-
|
23,005
|
|
Total
Commercial Loans
|
950
|
985
|
5,089
|
16,931
|
23,955
|
9,054,723
|
9,078,678
|
|
Total
|
607,195
|
353,467
|
378,351
|
122,326
|
1,461,339
|
31,539,335
|
33,000,674
|
Financial
receivables that are past due 90 days or more do not accrue
interests.
Credit Quality
The
following tables contain the loan portfolio classification by
credit quality indicator set forth by the Argentine Central
Bank.
Commercial Portfolio
:
|
Loan Classification
|
Description
|
|
1. Normal Situation
|
The debtor is widely able to meet its financial obligations,
demonstrating significant cash flows, a liquid financial situation,
an adequate financial structure, a timely payment record, competent
management, available information in a timely, accurate manner and
satisfactory internal controls. The debtor is in a sector of
activity that is operating properly and has good
prospects.
|
|
2. With Special Follow-up
|
Cash flow analysis reflects that the debt may be repaid even though
it is possible that the customer’s future payment ability may
deteriorate without a proper follow-up.
|
|
This category is divided into two subcategories:
|
|
|
(2.a). Under Observation;
|
|
|
(2.b). Under Negotiation or Refinancing Agreements.
|
|
|
3. With Problems
|
Cash flow analysis evidences problems to repay the debt, and
therefore, if these problems are not solved, there may be some
losses.
|
|
4. High Risk of Insolvency
|
Cash flow analysis evidences that repayment of the full debt is
highly unlikely.
|
|
5. Uncollectible and Uncollectible for Technical
Reasons
|
The amounts in this category are deemed total losses. Even though
these assets may be recovered under certain future circumstances,
inability to make payments is evident at the date of the analysis.
It includes loans to insolvent or bankrupt borrowers.
|
F-196
BANCO HIPOTECARIO S.A. AND SUBSIDIARIES
NOTES TO THE CONSOLIDATED FINANCIAL STATEMENTS
For the years ended December 31, 2017, 2016 and 2015
(Expressed in thousands of Argentine pesos, except share data and
as otherwise indicated)
Credit
quality indicators for the commercial portfolio are reviewed, at a
minimum, on an annual basis.
Consumer
Portfolio
:
Credit
quality indicators for the consumer portfolio are reviewed on a
monthly basis.
The
following table shows the account receivable balances categorized
by credit quality indicators for the periods ended December 31,
2017 and 2016:
F-197
BANCO HIPOTECARIO S.A. AND SUBSIDIARIES
NOTES TO THE CONSOLIDATED FINANCIAL STATEMENTS
For the years ended December 31, 2017, 2016 and 2015
(Expressed in thousands of Argentine pesos, except share data and
as otherwise indicated)
|
|
As
of December 31, 2017
|
|||||
|
|
"1"
|
"2"
|
"3"
|
"4"
|
"5"
|
|
|
|
Normal Situation
|
With special follow-up or Low Risk
|
With problems or Medium Risk
|
High risk of insolvency or High risk
|
Uncollectible
|
Total
|
|
Consumer
|
|
|
|
|
|
|
|
Advances
|
3,807
|
171
|
217
|
292
|
50
|
4,537
|
|
Mortgage
Loans
|
3,146,341
|
25,812
|
6,801
|
6,461
|
8,202
|
3,193,617
|
|
Personal Loans
– BHSA
|
5,811,389
|
309,972
|
171,145
|
152,069
|
2,036
|
6,446,611
|
|
Personal Loans
– Tarshop
|
423,185
|
35,242
|
25,200
|
43,659
|
31,205
|
558,491
|
|
Credit Card Loans
– BHSA
|
12,176,044
|
180,469
|
103,299
|
126,567
|
261
|
12,586,640
|
|
Credit card Loans
– Tarshop
|
4,940,806
|
357,337
|
321,582
|
390,016
|
221,154
|
6,230,895
|
|
Total
Consumer Loans
|
26,501,572
|
909,003
|
628,244
|
719,064
|
262,908
|
29,020,791
|
|
|
|
|
|
|
|
|
|
Commercial:
|
|
|
|
|
|
|
|
Performing
loans
|
12,503,647
|
36,755
|
-
|
-
|
-
|
12,540,402
|
|
Impaired
loans
|
-
|
-
|
556
|
6,365
|
3,333
|
10,254
|
|
Total
Commercial Loans
|
12,503,647
|
36,755
|
556
|
6,365
|
3,333
|
12,550,656
|
|
Total Financing Receivables
|
39,005,219
|
945,758
|
628,800
|
725,429
|
266,241
|
41,571,447
|
|
|
As
of December 31, 2016
|
|||||
|
|
"1"
|
"2"
|
"3"
|
"4"
|
"5"
|
|
|
|
Normal Situation
|
With special follow-up or Low Risk
|
With problems or Medium Risk
|
High risk of insolvency or High risk
|
Uncollectible
|
Total
|
|
Consumer
|
|
|
|
|
|
|
|
Advances
|
11,552
|
268
|
88
|
271
|
57
|
12,236
|
|
Mortgage
Loans
|
2,545,412
|
32,831
|
6,759
|
9,035
|
10,729
|
2,604,766
|
|
Personal Loans
– BHSA
|
4,154,663
|
180,715
|
91,209
|
85,843
|
2,162
|
4,514,592
|
|
Personal Loans
– Tarshop
|
251,618
|
17,956
|
13,149
|
13,978
|
6,265
|
302,966
|
|
Credit Card Loans
– BHSA
|
11,108,555
|
153,445
|
96,946
|
105,125
|
307
|
11,464,378
|
|
Credit card Loans
– Tarshop
|
4,268,706
|
281,327
|
193,768
|
224,149
|
55,108
|
5,023,058
|
|
Total
Consumer Loans
|
22,340,506
|
666,542
|
401,919
|
438,401
|
74,628
|
23,921,996
|
|
|
|
|
|
|
|
|
|
Commercial:
|
|
|
|
|
|
|
|
Performing
loans
|
9,054,723
|
950
|
-
|
-
|
-
|
9,055,673
|
|
Impaired
loans
|
-
|
-
|
985
|
5,089
|
16,931
|
23,005
|
|
Total
Commercial Loans
|
9,054,723
|
950
|
985
|
5,089
|
16,931
|
9,078,678
|
|
Total Financing Receivables
|
31,395,229
|
667,492
|
402,904
|
443,490
|
91,559
|
33,000,674
|
Troubled debt restructuring
According
to BCRA regulations, a refinancing is considered to exist whenever
any of the original contractually agreed conditions for a financing
transaction (term, capital, interest or rate) are
modified.
The
Bank concluded that all their refinanced loans comply with the
conditions for considering them as troubled debt restructuring
(“TDR”) as defined under U.S. GAAP. In accordance with
ASC 310-40 a restructured loan is considered a TDR if the debtor is
experiencing financial difficulties and the Bank grants a
concession to the debtor that would not otherwise be considered.
Concessions
F-198
BANCO HIPOTECARIO S.A. AND SUBSIDIARIES
NOTES TO THE CONSOLIDATED FINANCIAL STATEMENTS
For the years ended December 31, 2017, 2016 and 2015
(Expressed in thousands of Argentine pesos, except share data and
as otherwise indicated)
granted
could include: reduction in interest rate to rates that are
considered below market, extension of repayment schedules and
maturity dates beyond original contractual terms.
The
following table presents for the financing receivables modified as
troubled debt restructurings within during the last two
periods:
|
|
As of December 31, 2017
|
||||||||
|
|
Number of contracts
|
|
Pre-modification Outstanding recorded investment
|
Post-modification Outstanding recorded investment
|
|
Accruing TDR´S Loans
|
|
Non-Accruing TDR´S Loans
|
|
|
Consumer
|
|
|
|
|
|
|
|
|
|
|
Mortgage
Loans
|
65
|
Ps.
|
1,431
|
Ps.
|
1,477
|
Ps.
|
1,297
|
Ps.
|
180
|
|
Personal and Credit
Card Loans
|
87,286
|
|
2,039,836
|
|
1,977,901
|
|
1,539,917
|
|
437,984
|
|
-
Total
Consumer
|
87,351
|
Ps.
|
2,041,267
|
Ps.
|
1,979,378
|
Ps.
|
1,541,214
|
Ps.
|
438,164
|
|
|
|
|
|
|
|
|
|
||
|
Commercial
|
|
|
|
|
|
|
|
|
|
|
Performing
Loans
|
-
|
Ps.
|
-
|
Ps.
|
-
|
Ps.
|
-
|
Ps.
|
-
|
|
Impaired
Loans
|
-
|
|
-
|
|
-
|
|
-
|
|
-
|
|
-
Total
Commercial
|
-
|
Ps.
|
-
|
Ps.
|
-
|
Ps.
|
-
|
Ps.
|
-
|
|
|
|
|
|
|
|
|
|
||
|
-
Total
TDRs
|
87,351
|
Ps.
|
2,041,267
|
Ps.
|
1,979,378
|
Ps.
|
1,541,214
|
Ps.
|
438,164
|
|
|
As of December 31, 2016
|
||||||||
|
|
Number of contracts
|
|
Pre-modification Outstanding recorded investment
|
Post-modification Outstanding recorded investment
|
|
Accruing TDR´S Loans
|
|
Non-Accruing TDR´S Loans
|
|
|
Consumer
|
|
|
|
|
|
|
|
|
|
|
Mortgage
Loans
|
72
|
Ps.
|
1,582
|
Ps.
|
1,708
|
Ps.
|
1,448
|
Ps.
|
260
|
|
Personal and Credit
Card Loans
|
50,274
|
|
970,907
|
|
951,438
|
|
715,630
|
|
235,808
|
|
-
Total
Consumer
|
50,346
|
Ps.
|
972,489
|
Ps.
|
953,146
|
Ps.
|
717,078
|
Ps.
|
236,068
|
|
|
|
|
|
|
|
|
|
||
|
Commercial
|
|
|
|
|
|
|
|
|
|
|
Performing
Loans
|
-
|
Ps.
|
-
|
Ps.
|
-
|
Ps.
|
-
|
Ps.
|
-
|
|
Impaired
Loans
|
-
|
|
-
|
|
-
|
|
-
|
|
-
|
|
-
Total
Commercial
|
-
|
Ps.
|
-
|
Ps.
|
-
|
Ps.
|
-
|
Ps.
|
-
|
|
|
|
|
|
|
|
|
|
||
|
-
Total
TDRs
|
50,346
|
Ps.
|
972,489
|
Ps.
|
953,146
|
Ps.
|
717,078
|
Ps.
|
236,068
|
The
following table presents for, the financing receivables modified as
troubled debt restructurings within the previous 12 months and for
which there was a payment default during that period. The Bank
considers a TDR that have subsequently defaulted if the borrower
has failed to make payments of either principal, interest or both
for a period of 90 days or more from contractual due
date.
F-199
BANCO HIPOTECARIO S.A. AND SUBSIDIARIES
NOTES TO THE CONSOLIDATED FINANCIAL STATEMENTS
For the years ended December 31, 2017, 2016 and 2015
(Expressed in thousands of Argentine pesos, except share data and
as otherwise indicated)
|
|
As of December 31,
|
|||||
|
|
2017
|
2016
|
||||
|
|
Number of contracts
|
Recorded investment
|
Number of contracts
|
Recorded investment
|
||
|
Consumer
|
|
|
|
|
|
|
|
Mortgage
Loans
|
17
|
Ps.
|
402
|
32
|
Ps.
|
488
|
|
Personal and Credit
Card Loans
|
6,902
|
|
93,919
|
8,209
|
|
85,126
|
|
-
Total
Consumer
|
6,919
|
Ps.
|
94,321
|
8,241
|
Ps.
|
85,614
|
|
|
|
|
|
|
|
|
|
Commercial
|
|
|
|
|
|
|
|
Performing
Loans
|
-
|
Ps.
|
-
|
-
|
Ps.
|
-
|
|
Impaired
Loans
|
-
|
|
-
|
-
|
|
-
|
|
-
Total
Commercial
|
-
|
Ps.
|
-
|
-
|
Ps.
|
-
|
|
|
|
|
|
|
|
|
|
Total
TDRs that subsequently defaulted
|
6,919
|
Ps.
|
94,321
|
8,241
|
Ps.
|
85,614
|
Allowance for Credit Losses
The
activity in the allowance for accounts receivables losses under
U.S. GAAP for the fiscal periods ended December 31, 2017, 2016 and
2015 was as follows:
|
|
Argentine Banking
GAAP
|
U.S.
GAAP
|
Adjustment
|
|||
|
|
|
|
|
|
|
|
|
December 31,
2014
|
Ps.
|
472,974
|
Ps.
|
686,492
|
Ps.
|
(213,518
)
|
|
Variances
|
|
99,735
|
|
98,837
|
|
898
|
|
December 31,
2015
|
Ps.
|
572,709
|
Ps.
|
785,329
|
Ps.
|
(212,620
)
|
|
Variances
|
|
236,980
|
|
352,472
|
|
(115,492
)
|
|
December 31,
2016
|
Ps.
|
809,689
|
Ps.
|
1,137,801
|
Ps.
|
(328,112
)
|
|
Variances
|
|
534,550
|
|
654,291
|
|
(119,741
)
|
|
December 31,
2017
|
Ps.
|
1,344,239
|
Ps.
|
1,792,092
|
Ps.
|
(447,853
)
|
b. Comprehensive income
ASC 220
establishes standards for reporting and disclosure of comprehensive
income and its components (revenues, expenses, gains and losses) in
the financial statements. Comprehensive income is the total of net
income and other charges or credits to equity that are not the
result of transactions with owners.
The
following disclosure presented for the years ended December 31,
2017, 2016 and 2015, shows all periods in Argentine Banking GAAP
format reflecting U.S. GAAP income and comprehensive statement
adjustments.
F-200
BANCO HIPOTECARIO S.A. AND SUBSIDIARIES
NOTES TO THE CONSOLIDATED FINANCIAL STATEMENTS
For the years ended December 31, 2017, 2016 and 2015
(Expressed in thousands of Argentine pesos, except share data and
as otherwise indicated)
|
|
December
31,
|
|||||
|
|
2017
|
2016
|
2015
|
|||
|
Income
Statement
|
|
|
|
|
|
|
|
|
|
|
|
|
|
|
|
Financial
income
|
Ps.
|
11,485,596
|
Ps.
|
9,298,729
|
Ps.
|
7,255,322
|
|
Financial
expenses
|
|
(7,176,274
)
|
|
(6,548,568
)
|
|
(4,171,364
)
|
|
Net financial
income
|
Ps.
|
4,309,322
|
Ps.
|
2,750,161
|
Ps.
|
3,083,958
|
|
Provision for loan
losses
|
|
(1,030,622
)
|
|
(581,857
)
|
|
(353,281
)
|
|
Income from
services
|
|
6,901,321
|
|
5,041,134
|
|
3,952,453
|
|
Expenses for
services
|
|
(1,943,516
)
|
|
(1,251,453
)
|
|
(908,820
)
|
|
Administrative
expenses
|
|
(6,504,351
)
|
|
(5,118,597
)
|
|
(4,123,130
)
|
|
Net income from
financial intermediation
|
Ps.
|
1,732,154
|
Ps.
|
839,388
|
Ps.
|
1,651,180
|
|
Miscellaneous
income
|
|
609,215
|
|
512,526
|
|
494,984
|
|
Miscellaneous
expenses
|
|
(818,043
)
|
|
(593,309
)
|
|
(547,227
)
|
|
Income before
income tax and Non-controlling interest
|
Ps.
|
1,523,326
|
Ps.
|
758,605
|
Ps.
|
1,598,937
|
|
Income
tax
|
|
(545,767
)
|
|
(315,246
)
|
|
(651,770
)
|
|
Net
income under U.S. GAAP
|
Ps.
|
977,559
|
Ps.
|
443,359
|
Ps.
|
947,167
|
|
Less Net (Loss)
attributable to the Non-controlling interest ...
|
|
(21,274
)
|
|
4,568
|
|
4,500
|
|
Net
income attributable Controlling interest in accordance with U.S.
GAAP ..…
|
Ps.
|
956,285
|
Ps.
|
447,927
|
Ps.
|
951,667
|
|
|
|
|
|
|
|
|
|
Other comprehensive
income (loss):
|
|
|
|
|
|
|
|
|
|
|
|
|
|
|
|
Unrealized gains
(loss) on securities
|
|
6,370
|
|
8,957
|
|
(4,038
)
|
|
Other comprehensive income
(loss)
|
Ps.
|
6,370
|
Ps.
|
8,957
|
Ps.
|
(4,038
)
|
|
Comprehensive income
…..………..
|
Ps.
|
956,655
|
Ps.
|
456,884
|
Ps.
|
947,629
|
|
|
December
31,
|
||
|
|
2017
|
2016
|
2015
|
|
|
|
|
|
|
Unrealized net
(loss) / gains – Available for sale securities
|
Ps.
1,535
|
Ps.
(2,192
)
|
Ps.
(12,029
)
|
|
Less, accumulated
other comprehensive income attributable to Non-controlling
interest
|
-
|
(876
)
|
-
|
|
Accumulated
other comprehensive income
|
Ps.
1,535
|
Ps.
(3,068
)
|
Ps.
(12,029
)
|
c. Statements of Income and Balance sheets
The
presentation of financial statements according to the Argentine
Banking GAAP differs significantly from the format required by the
SEC under Regulation S-X 9-01 (Article 9). The income statements
presented below disclose the categories required by Article 9 using
Argentine Banking GAAP, including the assets and liabilities of
the
financial trust which
had been consolidated.
F-201
BANCO HIPOTECARIO S.A. AND SUBSIDIARIES
NOTES TO THE CONSOLIDATED FINANCIAL STATEMENTS
For the years ended December 31, 2017, 2016 and 2015
(Expressed in thousands of Argentine pesos, except share data and
as otherwise indicated)
|
|
December
31,
|
|||||
|
|
2017
|
2016
|
2015
|
|||
|
Interest
income
|
|
|
|
|
|
|
|
Interest and fees
on loans
|
Ps.
|
9,055,658
|
Ps.
|
7,701,868
|
Ps.
|
5,703,200
|
|
Trading account
interest and dividends on investments securities
taxable
|
|
2,677,581
|
|
2,178,541
|
|
1,764,289
|
|
Interest on other
receivables from financial intermediation
|
|
872,347
|
|
790,936
|
|
887,228
|
|
Ps.
|
12,605,586
|
Ps.
|
10,671,345
|
Ps.
|
8,354,717
|
|
|
Interest
expense
|
|
|
|
|
|
|
|
Interest on
deposits
|
|
2,301,274
|
|
3,333,514
|
|
2,302,479
|
|
Interest on
securities sold under agreements to repurchase
|
|
71,579
|
|
90,717
|
|
26,666
|
|
Interest on
short-term liabilities from financial
intermediation
|
|
872,179
|
|
1,226,657
|
|
605,399
|
|
Interest on
long-term liabilities from financial
intermediation
|
|
3,192,336
|
|
1,687,978
|
|
900,623
|
|
Ps.
|
6,437,368
|
Ps.
|
6,338,866
|
Ps.
|
3,835,167
|
|
|
|
|
|
|
|
|
|
|
Net
interest income
|
|
6,168,218
|
|
4,332,479
|
|
4,519,550
|
|
|
|
|
|
|
|
|
|
Provisions for loan
losses, net of reversal
|
Ps.
|
826,789
|
Ps.
|
331,545
|
Ps.
|
186,282
|
|
|
|
|
|
|
|
|
|
Net
interest income after provision for loan losses
|
Ps.
|
5,341,429
|
Ps.
|
4,000,934
|
Ps.
|
4,333,268
|
|
|
|
|
|
|
|
|
|
Non-Interest
income
|
|
|
|
|
|
|
|
Service charges on
deposits accounts
|
Ps.
|
251,760
|
Ps.
|
174,411
|
Ps.
|
135,069
|
|
Credit card service
charges and fees
|
|
3,282,950
|
|
2,083,024
|
|
1,200,299
|
|
Other
commissions
|
|
455,756
|
|
331,616
|
|
259,446
|
|
Insurance
commissions, fees and premiums
|
|
2,170,931
|
|
2,001,188
|
|
1,475,554
|
|
Loans related
commissions
|
|
153,343
|
|
92,880
|
|
65,820
|
|
Income from equity
in other companies
|
|
18,985
|
|
35,656
|
|
13,767
|
|
Other
|
|
774,314
|
|
617,083
|
|
916,353
|
|
Ps.
|
7,108,039
|
Ps.
|
5,335,858
|
Ps.
|
4,066,308
|
|
|
Non-Interest
expense
|
|
|
|
|
|
|
|
Commissions
|
Ps.
|
1,522,651
|
Ps.
|
941,488
|
Ps.
|
683,170
|
|
Foreign exchange,
net
|
|
233,982
|
|
438,024
|
|
462,351
|
|
Personal
expenses
|
|
3,430,546
|
|
2,664,757
|
|
2,252,630
|
|
Fees and external
administrative services
|
|
931,938
|
|
827,844
|
|
707,802
|
|
Depreciation of
premises and equipment
|
|
100,534
|
|
80,577
|
|
45,560
|
|
Renting
|
|
185,321
|
|
159,848
|
|
109,630
|
|
Electricity and
communications
|
|
219,452
|
|
194,750
|
|
157,186
|
|
Advertising and
publicity
|
|
123,809
|
|
117,017
|
|
173,384
|
|
Taxes
|
|
1,638,094
|
|
1,296,883
|
|
972,430
|
|
Amortization of
other intangibles
|
|
186,201
|
|
149,120
|
|
99,504
|
|
Repair, maintenance
and conservation
|
|
201,861
|
|
262,237
|
|
118,192
|
|
Insurance
|
|
19,582
|
|
15,718
|
|
13,276
|
|
Security
services
|
|
97,595
|
|
73,345
|
|
61,239
|
|
Commissions and
expenses on insurance business
|
|
225,479
|
|
190,287
|
|
118,920
|
|
Other provisions
and reserves
|
|
248,589
|
|
164,896
|
|
171,951
|
|
Stationary and
supplies
|
|
38,001
|
|
29,263
|
|
23,444
|
|
Other
|
|
891,052
|
|
571,257
|
|
537,765
|
|
Ps.
|
10,294,687
|
Ps.
|
8,177,311
|
Ps.
|
6,708,434
|
|
|
|
|
|
|
|
|
|
|
Income
before tax
|
Ps.
|
2,154,781
|
Ps.
|
1,159,481
|
Ps.
|
1,691,142
|
|
|
|
|
|
|
|
|
|
Income tax
expense
|
Ps.
|
532,658
|
Ps.
|
529,496
|
Ps.
|
608,405
|
|
|
|
|
|
|
|
|
|
Net
income
|
Ps.
|
1,622,123
|
Ps.
|
629,985
|
Ps.
|
1,082,737
|
|
Net
income attributable to non-controlling interest
|
Ps.
|
(28,684
)
|
Ps.
|
(14,657
)
|
Ps.
|
3,077
|
|
Net
Income attributable to controlling interest
|
Ps.
|
1,593,439
|
Ps.
|
615,328
|
Ps.
|
1,085,814
|
|
Basic
EPS
|
|
1.087
|
|
0.420
|
|
0.742
|
|
Diluted
EPS
|
|
1.087
|
|
0.420
|
|
0.742
|
Argentine Banking
GAAP also requires certain classifications of assets and
liabilities, which differ from those required by Article 9. The
following balance sheet presents Banco Hipotecario’s balance
sheet as of December 31, 2017 and 2016, as if they had followed
Article 9 balance sheet disclosure requirements using Argentine
Banking GAAP, including the assets and liabilities of
the
financial trust which
had been consolidated.
F-202
BANCO HIPOTECARIO S.A. AND SUBSIDIARIES
NOTES TO THE CONSOLIDATED FINANCIAL STATEMENTS
For the years ended December 31, 2017, 2016 and 2015
(Expressed in thousands of Argentine pesos, except share data and
as otherwise indicated)
|
|
December
31,
|
|
|
|
2017
|
2016
|
|
Assets
|
|
|
|
Cash and due from
banks
|
Ps.
3,524,430
|
Ps.
6,277,452
|
|
Interest bearing
deposits in other banks
|
381,921
|
1,175,167
|
|
Federal funds sold
and securities purchased under resale agreements or similar
agreements
|
1,184,506
|
1,954,578
|
|
Trading account
assets
|
14,403,293
|
2,944,503
|
|
Available for sale
securities
|
1,427,446
|
2,481,824
|
|
Loans
|
41,532,905
|
33,055,091
|
|
Allowances for loan
losses
|
(1,342,908
)
|
(807,078
)
|
|
Other receivable
from financial intermediation
|
2,714,490
|
5,010,126
|
|
Miscellaneous
receivables
|
3,170,988
|
4,242,231
|
|
Premises and
equipment
|
415,220
|
390,228
|
|
Intangible assets
– Goodwill
|
9,934
|
13,363
|
|
Intangible assets -
Other
|
529,235
|
554,001
|
|
Other
assets
|
1,493,185
|
406,961
|
|
Total
assets
|
Ps.
69,444,645
|
Ps.
57,698,447
|
|
|
|
|
|
Liabilities
|
|
|
|
Non-interest
bearing deposits
|
Ps.
3,072,003
|
Ps.
2,403,354
|
|
Interest bearing
deposits
|
17,736,378
|
16,581,638
|
|
Federal funds
purchased and securities sold under agreements to
repurchase
|
114,707
|
727,810
|
|
Short-term
borrowing
|
6,760,980
|
7,287,796
|
|
Other liabilities
resulting from financial intermediation
|
4,503,969
|
5,189,756
|
|
Amounts payable for
spot and forward purchases to be settled
|
1,764,787
|
2,295,724
|
|
Long-term
debt
|
24,475,870
|
14,435,881
|
|
Taxes
payable
|
563,768
|
488,714
|
|
Other
liabilities
|
2,073,904
|
1,731,475
|
|
Contingent
liabilities
|
446,315
|
342,360
|
|
Total
liabilities
|
Ps.
61,512,681
|
Ps.
51,484,508
|
|
|
|
|
|
Common
stock
|
Ps.
1,500,000
|
Ps.
1,500,000
|
|
Other reserves and
retained earnings
|
6,149,671
|
4,556,232
|
|
Non-controlling
interest
|
282,293
|
157,707
|
|
Total
shareholders’ equity
|
Ps.
7,931,964
|
Ps.
6,213,939
|
|
|
|
|
|
Total
liabilities and shareholders’ equity
|
Ps.
69,444,645
|
Ps.
57,698,447
|
d. Fair Value Measurements Disclosures
ASC
820-10 defines fair value as the price that would be received to
sell an asset or paid to transfer a liability in an orderly
transaction between market participants at the measurement date.
Effective January 2010, the Bank adopted new accounting guidance
under ASC 820 that requires additional disclosures including, among
other things, (i) the amounts and reasons for certain significant
transfers among the three hierarchy levels of inputs, (ii) the
gross, rather than net, basis for certain level 3 roll forward
information, (iii) use of a “class” rather than a
“major category” basis for assets and liabilities, and
(iv) valuation techniques and inputs used to estimate level 2 and
level 3 fair value measurements.
F-203
BANCO HIPOTECARIO S.A. AND SUBSIDIARIES
NOTES TO THE CONSOLIDATED FINANCIAL STATEMENTS
For the years ended December 31, 2017, 2016 and 2015
(Expressed in thousands of Argentine pesos, except share data and
as otherwise indicated)
In
addition, ASC 820-10 establishes a three-level valuation hierarchy
for disclosure of fair value measurements. The valuation hierarchy
is based upon the transparency of inputs to the valuation of an
asset or liability as of the measurement date. The three levels are
defined as follows.
●
Level
1 – inputs to the valuation methodology are quoted prices
(unadjusted) for identical assets or liabilities in active
markets.
●
Level
2 – inputs to the valuation methodology include quoted prices
for similar assets and liabilities in active markets, and inputs
that are observable for the asset or liability, either directly or
indirectly, for substantially the full term of the financial
instrument.
Those
instruments that do not meet the requirements to be valued on a
“fair market value” basis, either due to the lack of
availability of a closing price or due to the lack of
representation of the price (illiquidity of the position), must
have a fair value.
The
fair value will be obtained by discounting the expected future cash
flow at a representative market rate.
LEBACS:
The
instruments of the Central Bank are quoted at discount, the only
expected cash flow is the total capital at maturity. The discount
rate used will be the Lebacs bid rate in pesos that arises from the
public auction closest to the valuation, for the maturity closest
to the instrument to be valued. If necessary, the rate could be
interpolated according to the residual term.
In
the particular case of dollar denominated instruments, the discount
rate used will be the Lebacs bid rate in dollars that arises from
the public auction closest to the valuation, for the maturity
closest to the instrument to be valued. If there are no nearby
tenders, it should be verified if there are other USD instruments
with a quotation in the secondary market, from which a price can be
estimated by interpolation. Otherwise, the rate of a sovereign
instrument in USD with similar characteristics will be taken as
reference.
Other
instruments with public offer:
The
expected cash flow is made up of principal and interest
instalments.
In
case of instruments with uncertain cash flows:
-
Variable rate instruments: implicit future rates will be derived
from the rate curve of similar credit risk, or the last known rate
(by default), to project the current and future coupons. Likewise,
the existence of cap and floors will be taken into
account.
-
Capital adjustable instruments (CER / UVIS): no capital adjustment
will be projected for future coupons.
The
process of calculating the discount rate to be applied will consist
of:
-
Select
debt securities with similar characteristics - currency, type of
rate and capitalization, type of issuer and average
life.
-
Obtain
the internal rate of return and average life of them.
-
If
necessary, apply to the IRRs a spread that represents the
additional credit risk of the issuer of the instrument to be
valued, with respect to the issuer of the reference
securities.
-
Linearly
interpolate the corrected IRRs, if necessary, using the Average
Life of the instruments of reference and the instrument to be
valued.
F-204
BANCO HIPOTECARIO S.A. AND SUBSIDIARIES
NOTES TO THE CONSOLIDATED FINANCIAL STATEMENTS
For the years ended December 31, 2017, 2016 and 2015
(Expressed in thousands of Argentine pesos, except share data and
as otherwise indicated)
The fair value
is obtained by discounting the expected cash flow at the above
mentioned interest rate.
●
Level
3 – inputs to the valuation methodology are unobservable and
significant to the fair value measurement.
A
financial instrument’s categorization within the valuation
hierarchy is based upon the lowest level of input that is
significant to the fair value measurement.
Determination of fair value
Fair
value is based upon quoted market prices, where available. If
listed prices or quotes are not available, fair value is based upon
internally developed models that use primarily market-based or
independently-sourced market parameters, including interest rate
yield curves, option volatilities and currency rates. Valuation
adjustments may be made to ensure that financial instruments are
recorded at fair value. These adjustments include amounts to
reflect counterparty credit quality, the Bank’s
creditworthiness, liquidity and unobservable parameters that are
applied consistently over time.
The
Bank believes its valuation methods are appropriate and consistent
with other market participants, the use of different methodologies,
or assumptions, to determine the fair value of certain financial
instruments could result in a different estimate of fair value at
the reporting date.
The following section describes the valuation methodologies used by
the Bank to measure various financial instruments at fair value,
including an indication of the level in the fair-value hierarchy in
which each instrument is generally classified. Where appropriate,
the description includes details of the valuation models, the key
inputs to those models as well as any significant
assumptions.
Assets (by Class of asset)
a)
Government and corporate securities
As of
December 31, 2017 and 2016 the Bank’s securities are
classified within level 1 of the valuation hierarchy using quoted
prices available in the active market. Level 1 securities includes
government bonds and instruments issued by BCRA and corporate
securities which also have quoted prices available in active
markets. Furthermore the Bank’s instruments issued by BCRA
with no volatility published by the BCRA and bills issued by
Provincial Governments are classified within Level 2 using quoted
prices available of similar assets.
b)
Securities receivable under repurchase agreements
The
Bank’s securities receivable under repurchase agreements
which do not qualify for sale accounting for U.S. GAAP purposes,
are classified within level 1 of the valuation hierarchy. To
estimate the fair value of these securities, quoted prices are
available in an active market.
c)
Derivatives
Forward
transactions traded in auto regulated markets are made through
recognized exchange markets, such as MAE and ROFEX.
F-205
BANCO HIPOTECARIO S.A. AND SUBSIDIARIES
NOTES TO THE CONSOLIDATED FINANCIAL STATEMENTS
For the years ended December 31, 2017, 2016 and 2015
(Expressed in thousands of Argentine pesos, except share data and
as otherwise indicated)
The
general settlement method for these transactions does not require
delivery of the traded underlying asset. Rather, settlement is
carried on a daily basis for the difference, if any, between the
closing price of the underlying asset and the closing price or
value of the underlying asset corresponding to the previous day,
the difference in price being charged to income. Therefore, they
are classified in Level 2 of the fair-value hierarchy.
The
following table presents the financial instruments, by class of
asset and liabilities, carried at fair value as of December 31,
2017 and 2016, by ASC 820-10 valuation hierarchy (as described
above).
|
|
Balances
as of December 31, 2017
|
|||
|
|
Total
fair value
|
Quoted
market prices in active markets
(Level
1)
|
Internal
models with significant observable market parameters
(Level
2)
|
Internal
models with significant unobservable market parameters
(Level
3)
|
|
ASSETS
|
|
|
|
|
|
|
|
|
|
|
|
Government
and corporate securities
|
|
|
|
|
|
Trading
securities
|
2,357,999
|
2,357,999
|
-
|
-
|
|
Available for sale
securities
|
697,942
|
511,142
|
186,800
|
-
|
|
Instruments issued
by the BCRA
|
11,160,417
|
11,160,417
|
-
|
-
|
|
Corporate
securities
|
613,430
|
560,099
|
53,331
|
-
|
|
|
|
|
|
|
|
Other
receivables from financial intermediation
|
|
|
|
|
|
Trading
securities
|
1,696,987
|
1,696,987
|
-
|
-
|
|
Available for sale
securities
|
445,867
|
220,670
|
225,197
|
-
|
|
Futures
|
46,217
|
-
|
46,217
|
-
|
|
|
|
|
|
|
|
Miscellaneous
assets
|
|
|
|
|
|
Trading
securities
|
26,521
|
26,521
|
-
|
-
|
|
|
|
|
|
|
|
TOTAL
ASSETS AT FAIR VALUE
|
17,045,380
|
16,533,835
|
511,545
|
-
|
|
|
|
|
|
|
|
LIABILITIES
|
|
|
|
|
|
|
|
|
|
|
|
Other
obligations from financial intermediation
|
|
|
|
|
|
Trading
securities
|
(286,644
)
|
(286,644
)
|
-
|
-
|
|
Futures
|
(65,756
)
|
-
|
(65,756
)
|
-
|
|
|
|
|
|
|
|
TOTAL
LIABILITIES AT FAIR VALUE
|
(352,400
)
|
(286,644
)
|
(65.756
)
|
-
|
F-206
BANCO HIPOTECARIO S.A. AND SUBSIDIARIES
NOTES TO THE CONSOLIDATED FINANCIAL STATEMENTS
For the years ended December 31, 2017, 2016 and 2015
(Expressed in thousands of Argentine pesos, except share data and
as otherwise indicated)
|
|
Balances
as of December 31, 2016
|
|||
|
|
Total
fair value
|
Quoted
market prices in active markets
(Level
1)
|
Internal
models with significant observable market parameters
(Level
2)
|
Internal
models with significant unobservable market parameters
(Level
3)
|
|
ASSETS
|
|
|
|
|
|
|
|
|
|
|
|
Government
and corporate securities
|
|
|
|
|
|
Trading
securities
|
1,802,903
|
1,802,903
|
-
|
-
|
|
Available for sale
securities
|
1,731,476
|
1,109,850
|
621,626
|
-
|
|
Instruments issued
by the BCRA
|
1,117,338
|
1,030,397
|
86,941
|
-
|
|
Corporate
securities
|
352,854
|
313,315
|
39,539
|
-
|
|
|
|
|
|
|
|
Other
receivables from financial intermediation
|
|
|
|
|
|
Trading
securities
|
677,295
|
677,295
|
-
|
-
|
|
Available for sale
securities
|
1,659,075
|
1,543,266
|
115,809
|
-
|
|
Futures
|
169,717
|
|
169,717
|
-
|
|
|
|
|
|
|
|
Miscellaneous
assets
|
|
|
|
|
|
Trading
securities
|
15,991
|
15,991
|
-
|
-
|
|
Available for sale
securities
|
3,989
|
3,989
|
-
|
-
|
|
|
|
|
|
|
|
TOTAL
ASSETS AT FAIR VALUE
|
7,530,638
|
6,497,006
|
1,033,632
|
-
|
|
|
|
|
|
|
|
LIABILITIES
|
|
|
|
|
|
|
|
|
|
|
|
Other
obligations from financial intermediation
|
|
|
|
|
|
Trading
securities
|
(848,095
)
|
(848,095
)
|
-
|
-
|
|
Available for sale
securities
|
(179,408
)
|
(55,250
)
|
(124,158
)
|
-
|
|
Futures
|
(187,108
)
|
-
|
(187,108
)
|
-
|
|
|
|
|
|
|
|
Deposits
|
|
|
|
|
|
Trading
securities
|
(1,243,189
)
|
(1,243,189
)
|
-
|
-
|
|
|
|
|
|
|
|
TOTAL
LIABILITIES AT FAIR VALUE
|
(2,457,800
)
|
(2,146,534
)
|
(311,266
)
|
-
|
e. Disclosure about Fair Value of Financial
Instruments
ASC 825, “Disclosures about Fair Value of Financial
Instruments” requires disclosures of estimates of fair value
of financial instruments. These estimates were made as of
December 31, 2017 and 2016. Because many of the Bank’s
financial instruments do not have a ready trading market from which
to determine fair value, the disclosures are based upon estimates
regarding economic and current market conditions and risk
characteristics. Such estimates are subjective and involve matters
of judgment and, therefore, are not precise and may not be
reasonably comparable to estimates of fair value for similar
instruments made by other financial institutions.
The estimated fair values do not include the value of assets and
liabilities not considered financial instruments.
F-207
BANCO HIPOTECARIO S.A. AND SUBSIDIARIES
NOTES TO THE CONSOLIDATED FINANCIAL STATEMENTS
For the years ended December 31, 2017, 2016 and 2015
(Expressed in thousands of Argentine pesos, except share data and
as otherwise indicated)
|
|
December
31, 2017
|
|
|
|
|
|
|
Book
value
|
Fair
value
|
Level
1
|
Level
2
|
Level
3
|
|
Non
derivative activities
|
|
|
|
|
|
|
Assets
|
|
|
|
|
|
|
Cash and due from
banks
|
3,646,536
|
3,646,536
|
3,646,536
|
-
|
-
|
|
Government and
Corporate securities
|
14,814,101
|
14,829,788
|
14,589,657
|
240,131
|
-
|
|
Loans and
leases
|
35,617,968
|
34,779,856
|
-
|
-
|
34,779,856
|
|
Others
|
6,574,889
|
6,572,399
|
1,963,874
|
225,197
|
4,383,328
|
|
|
|
|
|
|
|
|
Liabilities
|
|
|
|
|
|
|
Deposits
|
20,808,381
|
20,808,381
|
-
|
-
|
20,808,381
|
|
Other liabilities
from financial intermediation
|
7,732,205
|
7,732,205
|
352,400
|
-
|
7,379,805
|
|
Non-subordinated
corporate bonds
|
25,668,775
|
25,668,775
|
14,537,026
|
9,195,058
|
1,936,690
|
|
Others
|
2,637,672
|
2,637,672
|
2,637,672
|
-
|
-
|
|
|
December
31, 2016
|
|
|
|
|
|
|
Book
value
|
Fair
value
|
Level
1
|
Level
2
|
Level
3
|
|
Non
derivative activities
|
|
|
|
|
|
|
Assets
|
|
|
|
|
|
|
Cash and due from
banks
|
7,188,279
|
7,188,279
|
7,188,279
|
-
|
-
|
|
Government and
Corporate securities
|
4,997,612
|
5,004,571
|
4,256,465
|
748,106
|
-
|
|
Loans and
leases
|
27,321,351
|
26,161,657
|
-
|
-
|
26,161,657
|
|
Others
|
9,262,132
|
9,266,375
|
2,414,998
|
115,809
|
6,735,568
|
|
|
|
|
|
|
|
|
Liabilities
|
|
|
|
|
|
|
Deposits
|
18,984,992
|
18,984,992
|
-
|
-
|
18,984,992
|
|
Other liabilities
from financial intermediation
|
8,168,658
|
8,166,927
|
1,090,453
|
124,158
|
6,952,316
|
|
Non-subordinated
corporate bonds
|
16,155,518
|
16,155,518
|
6,922,958
|
7,361,867
|
1,870,693
|
|
Others
|
2,220,193
|
2,220,193
|
2,220,193
|
-
|
-
|
The
following is a description of the estimating techniques
applied:
Cash and due from banks:
By definition, cash and due from
banks are short-term and do not possess credit risk. The carrying
values as of December 31, 2017 and 2016 are a reasonable
estimate of fair value.
Government and Corporate securities:
When available, the
Bank uses quoted market prices to determine the fair value. If
market prices are not available, quoted prices for similar assets
in active markets have been used to calculate the fair
value.
Loans:
The fair values of loans are estimated for groups
with similar characteristics, including type of loan, credit
quality incorporating the credit risk factor. For floating- or
adjustable-rate loans, which mature or are repriced within a short
period of time, the carrying values are considered to be a
reasonable estimate of fair values. For fixed-rate loans, market
prices are not generally available and the fair values are
estimated discounting the estimated future cash flows based on the
contracted maturity of the loans. The discount rates are based on
the current market rates corresponding to the applicable maturity.
For non-performing loans, the fair values are generally determined
on an individual basis by discounting the estimated future cash
flows and may be based on the appraisal value of underlying
collateral as appropriate. The fair value of “loans” is
classified as Level 3 of the valuation hierarchy where significant
unobservable inputs were used to calculate the fair value. The
valuation technique used to obtain the fair value was an income
approach using discounted cash flows. No changes in the valuation
technique took place during the year.
Other assets:
Includes other receivables from financial
intermediation and unlisted equity investments. This caption also
includes financial trusts certificates of participation the fair
value of which is estimated using valuation techniques to convert
the future amounts to a single present
F-208
BANCO HIPOTECARIO S.A. AND SUBSIDIARIES
NOTES TO THE CONSOLIDATED FINANCIAL STATEMENTS
For the years ended December 31, 2017, 2016 and 2015
(Expressed in thousands of Argentine pesos, except share data and
as otherwise indicated)
value amount. The
measurement is based on the value indicated by current market
expectations about those future amounts. The estimate of the cash
flows is based on the future cash flows from the securitized
assets, considering prepayments, historical loan
performance, etc. Equity investments in companies where
significant influence is exercised are not within the scope of ASC
825, Financial Instruments. Equity investments in other companies
are carried at market value less costs to
sell.
Deposits:
The fair value of deposit liabilities on demand
and savings account deposits is similar to its book value. The fair
value of time deposits was calculated by discounting contractual
cash flows using current market rates for instruments with similar
maturities.
Other liabilities from financial intermediation:
Includes
credit lines borrowed under different credit arrangements. As of
December 31, 2017 and 2016, when no quoted market prices were
available, the estimated fair value has been calculated by
discounting the contractual cash flows of these liabilities at
estimated market rates.
Non-subordinated corporate bonds:
As of December 31,
2017 and 2016, the fair value of the corporate bonds was determined
based on quoted market prices and when no quoted market prices were
available, the estimated fair value has been calculated by
discounting the contractual cash flows of these liabilities at
estimated market rates.
Other liabilities:
Includes other liabilities from financial
intermediation. Their fair value was estimated at the expected
future cash flows discounted at the estimated market rates at
year-end.
f. Segment reporting
The
Bank has disclosed its segment information in accordance with the
“Disclosures about Segments of an Enterprise and Related
Information” ASC 280-10. Operating segments are defined as
components of an enterprise about which separate financial
information is available and which is regularly reviewed by the
Chief Operating Decision Maker (CODM) in deciding how to allocate
resources and in assessing performance. The CODM is the Chief
Executive Officer of the Bank. Reportable segments consist of one
or more operating segments with similar economic characteristics,
distribution systems and regulatory environments. The information
provided for Segment Reporting is based on internal reports used by
management.
The
Bank measures the performance of each of its business segments
primarily in terms of net income (i.e., net revenues—or
financial income and service fee income, net of financial expenses
and service fee expenses—after deducting loan loss provisions
and administrative costs directly attributable to the
segment).
Income
from financial intermediation and other segment information are
based on Argentine Banking GAAP and are consistent with the
presentation of the Bank’s consolidated financial
statements.
The
Bank operates its business along the following
segments:
Finance
:
The Finance segment is primarily responsible for the allocation of
the Bank’s liquidity according to the needs and opportunities
of the Retail Banking segment, the Corporate Banking segment and
its own needs and opportunities. The Finance segment
implements the Bank’s financial risk management policies,
manages the Bank’s trading desks, distributes Finance
products such as debt securities, and develops businesses with
wholesale financial and non-financial clients.
F-209
BANCO HIPOTECARIO S.A. AND SUBSIDIARIES
NOTES TO THE CONSOLIDATED FINANCIAL STATEMENTS
For the years ended December 31, 2017, 2016 and 2015
(Expressed in thousands of Argentine pesos, except share data and
as otherwise indicated)
Retail
banking:
The Bank offers to its retail customers a full
range of financial products and services, including mortgage and
personal loans, deposit accounts, purchase and sale of foreign
exchange and precious metals and credit cards, among
others.
Insuran
ce: Through B.H.N
Inversión, the Bank offers insurance products, with a focus on
life insurance, to targeted customer segments.
Wholesale banking:
The Bank offers to large corporations, medium-sized companies and
small businesses a full range of products, services and financial
assessment including factoring, leasing, foreign trade finance and
cash management.
The column “Adjustments” includes consolidation
adjustments, eliminations corresponding to transactions conducted
between reportable segments.
The column "all
other" comprises the other business activities not identified as
operating segments.
Below is a table with the information for each segment identified
by the Bank as of and for the years ended December 31, 2017,
2016 and 2015.
F-210
BANCO HIPOTECARIO S.A. AND SUBSIDIARIES
NOTES TO THE CONSOLIDATED FINANCIAL STATEMENTS
For the years ended December 31, 2017, 2016 and 2015
(Expressed in thousands of Argentine pesos, except share data and
as otherwise indicated)
|
|
December
31, 2017
|
|||||||
|
|
|
|
|
Wholesale
Banking
|
|
|
|
|
|
|
Finance
|
Retail
Banking
|
Insurance
|
BH
Wholesale Unit
|
BACS
|
All
other
|
Adjustments
|
Consolidated
|
|
Assets
|
|
|
|
|
|
|
|
|
|
Cash and due from
banks
|
1,206,359
|
1,577,975
|
16,159
|
793,736
|
250,262
|
-
|
(197,955
)
|
3,646,536
|
|
Government and
corporate securities
|
13,292,122
|
7,470
|
1,069,980
|
-
|
444,529
|
-
|
-
|
14,814,101
|
|
Loans -
|
-
|
23,577,191
|
-
|
10,761,789
|
1,142,071
|
-
|
(24,402
)
|
35,456,649
|
|
Other receivables
from financial intermediation
|
4,278,343
|
1,181,534
|
300,597
|
295,181
|
572,781
|
-
|
(53,547
)
|
6,574,889
|
|
Receivables from
financial leasing
|
-
|
-
|
-
|
161,319
|
-
|
-
|
-
|
161,319
|
|
Other
assets
|
2,311
|
850,583
|
386,709
|
-
|
119,035
|
3,333,382
|
(77,957
)
|
4,614,063
|
|
Total
assets
|
18,779,135
|
27,194,753
|
1,773,445
|
12,012,025
|
2,528,678
|
3,333,382
|
(353,861
)
|
65,267,557
|
|
|
|
|
|
|
|
|
|
|
|
|
December
31, 2017
|
|||||||
|
|
|
|
|
Wholesale
Banking
|
|
|
|
|
|
|
Finance
|
Retail
Banking
|
Insurance
|
BH
Wholesale Unit
|
BACS
|
All
other
|
Adjustments
|
Consolidated
|
|
Financial
income
|
2,510,868
|
6,888,682
|
406,258
|
1,498,986
|
527,821
|
-
|
(78,622
)
|
11,753,993
|
|
Financial
expense
|
(2,201,320
)
|
(3,618,096
)
|
-
|
(1,244,121
)
|
(298,495
)
|
-
|
78,622
|
(7,283,410
)
|
|
Gross
financial margin
|
309,548
|
3,270,586
|
406,258
|
254,865
|
229,326
|
-
|
-
|
4,470,583
|
|
Income from
services, net
|
(25,646
)
|
2,509,016
|
1,691,810
|
120,761
|
187,005
|
406,102
|
(3,490
)
|
4,885,558
|
|
Net
revenue
|
283,902
|
5,779,602
|
2,098,068
|
375,626
|
416,331
|
406,102
|
(3,490
)
|
9,356,141
|
|
Loan loss
provisions
|
-
|
(852,038
)
|
-
|
(47,670
)
|
(11,173
)
|
-
|
-
|
(910,881
)
|
|
Administrative
expenses
|
(141,509
)
|
(4,621,233
)
|
(437,118
)
|
(169,107
)
|
(454,446
)
|
(247,241
)
|
3,490
|
(6,067,164
)
|
|
Income
from financial intermediation
|
142,393
|
306,331
|
1,660,950
|
158,849
|
(49,288
)
|
158,861
|
-
|
2,378,096
|
|
Income from Equity
Investments
|
-
|
-
|
2,740
|
- |
15,225
|
1,020
|
-
|
18,985
|
|
Non-controlling
interest
|
-
|
-
|
-
|
-
|
(3,075
)
|
-
|
(25,609
)
|
(28,684
)
|
|
Miscellaneous
income /(Expenses)
|
88,884
|
3,497
|
(180,831
)
|
(3,976
)
|
1,805
|
(151,679
)
|
-
|
(242,300
)
|
|
Income
before income tax
|
231,277
|
309,828
|
1,482,859
|
154,873
|
(35,333
)
|
8,202
|
(25,609
)
|
2,126,097
|
|
Income
tax
|
-
|
(12,661
)
|
(507,777
)
|
-
|
(12,220
)
|
-
|
-
|
(532,658
)
|
|
Net
income
|
231,277
|
297,167
|
975,082
|
154,873
|
(47,553
)
|
8,202
|
(25,609
)
|
1,593,439
|
F-211
BANCO HIPOTECARIO S.A. AND SUBSIDIARIES
NOTES TO THE CONSOLIDATED FINANCIAL STATEMENTS
For the years ended December 31, 2017, 2016 and 2015
(Expressed in thousands of Argentine pesos, except share data and
as otherwise indicated)
|
|
December
31, 2016
|
|||||||
|
|
|
|
|
Wholesale
Banking
|
|
|
|
|
|
|
Finance
|
Retail
Banking
|
Insurance
|
BH
Wholesale Unit
|
BACS
|
All
other
|
Adjustments
|
Consolidated
|
|
Financial
income
|
2,135,015
|
5,098,740
|
349,206
|
1,526,579
|
447,578
|
-
|
(39,386
)
|
9,517,732
|
|
Financial
expense
|
(1,751,474
)
|
(3,447,177
)
|
-
|
(1,264,578
)
|
(274,509
)
|
-
|
39,386
|
(6,698,352
)
|
|
Gross
financial margin
|
383,541
|
1,651,563
|
349,206
|
262,001
|
173,069
|
-
|
-
|
2,819,380
|
|
Income from
services, net
|
(70,258
)
|
1,886,373
|
1,575,642
|
74,191
|
127,776
|
297,132
|
(2,421
)
|
3,888,435
|
|
Net
revenue
|
313,283
|
3,537,936
|
1,924,848
|
336,192
|
300,845
|
297,132
|
(2,421
)
|
6,707,815
|
|
Loan loss
provisions
|
-
|
(427,380
)
|
-
|
(32,431
)
|
(6,554
)
|
-
|
-
|
(466,365
)
|
|
Administrative
expenses
|
(117,871
)
|
(3,917,799
)
|
(374,409
)
|
(140,724
)
|
(260,735
)
|
(207,452
)
|
4,529
|
(5,014,461
)
|
|
Income
from financial intermediation
|
195,412
|
(807,243
)
|
1,550,439
|
163,037
|
33,556
|
89,680
|
2,108
|
1,226,989
|
|
Income
from Equity Investments
|
-
|
-
|
965
|
-
|
31,465
|
3,226
|
-
|
35,656
|
|
Non-controlling
interest
|
-
|
-
|
-
|
-
|
-
|
-
|
(14,657
)
|
(14,657
)
|
|
Miscellaneous
income /(Expenses)
|
61,878
|
73,278
|
(157,149
)
|
22,011
|
771
|
(117,270
)
|
-
|
(116,481
)
|
|
Income
before income tax
|
257,290
|
(733,965
)
|
1,394,255
|
185,048
|
65,792
|
(24,364
)
|
(12,549
)
|
1,131,507
|
|
Income
tax
|
-
|
-
|
(480,179
)
|
-
|
(36,000
)
|
-
|
-
|
(516,179
)
|
|
Net
income
|
284,652
|
(666,817
)
|
914,076
|
185,050
|
29,792
|
(24,364
)
|
(107,061
)
|
615,328
|
F-212
BANCO HIPOTECARIO S.A. AND SUBSIDIARIES
NOTES TO THE CONSOLIDATED FINANCIAL STATEMENTS
For the years ended December 31, 2017, 2016 and 2015
(Expressed in thousands of Argentine pesos, except share data and
as otherwise indicated)
|
|
December
31, 2015
|
|||||||
|
|
|
|
|
Wholesale
Banking
|
|
|
|
|
|
|
Finance
|
Retail
Banking
|
Insurance
|
BH
Wholesale Unit
|
BACS
|
All
other
|
Adjustments
|
Consolidated
|
|
Financial
income
|
1,917,468
|
3,417,190
|
296,147
|
1,412,824
|
322,437
|
-
|
(40,380
)
|
7,325,686
|
|
Financial
expense
|
(1,534,620
)
|
(1,682,895
)
|
-
|
(930,886
)
|
(183,184
)
|
-
|
40,380
|
(4,291,205
)
|
|
Gross
financial margin
|
382,848
|
1,734,295
|
296,147
|
481,938
|
139,253
|
-
|
-
|
3,034,481
|
|
Income from
services, net
|
(51,041
)
|
1,538,980
|
1,202,900
|
53,464
|
99,622
|
228,899
|
(47,249
)
|
3,025,575
|
|
Net
revenue
|
331,807
|
3,273,275
|
1,499,047
|
535,402
|
238,875
|
228,899
|
(47,249
)
|
6,060,056
|
|
Loan loss
provisions
|
-
|
(325,109
)
|
-
|
(26,098
)
|
(2,972
)
|
-
|
-
|
(354,179
)
|
|
Administrative
expenses
|
(93,790
)
|
(3,156,698
)
|
(295,470
)
|
(111,975
)
|
(177,966
)
|
(163,942
)
|
47,249
|
(3,952,592
)
|
|
Income
from financial intermediation
|
238,017
|
(208,532
)
|
1,203,577
|
397,329
|
57,937
|
64,957
|
-
|
1,753,285
|
|
Income
from Equity Investments
|
-
|
-
|
-
|
-
|
13,767
|
-
|
-
|
13,767
|
|
Non-controlling
interest
|
-
|
-
|
-
|
-
|
(926
)
|
-
|
4,003
|
3,077
|
|
Miscellaneous
income /(Expenses)
|
54,584
|
159,004
|
(134,069
)
|
57,670
|
(900
)
|
(201,705
)
|
-
|
(65,416
)
|
|
Income
before income tax
|
292,601
|
(49,528
)
|
1,069,508
|
454,999
|
69,878
|
(136,748
)
|
4,003
|
1,704,713
|
|
Income
tax
|
(95,372
)
|
(983
)
|
(360,238
)
|
(148,056
)
|
(14,250
)
|
-
|
-
|
(618,899
)
|
|
Net
income
|
196,223
|
(50,511
)
|
709,270
|
306,949
|
55,628
|
(136,748
)
|
4,003
|
1,085,814
|
F-213
BANCO HIPOTECARIO S.A. AND SUBSIDIARIES
NOTES TO THE CONSOLIDATED FINANCIAL STATEMENTS
For the years ended December 31, 2017, 2016 and 2015
(Expressed in thousands of Argentine pesos, except share data and
as otherwise indicated)
g. Cash flow
The statement of cash flows under Argentine Banking GAAP differs
from the statement of cash flows under U.S. GAAP. According to ASC
230, the statement of cash flows for a period shall report net cash
provided or used by operating, investing and financing
activities.
The statement of cash flows under U.S. GAAP including cash and cash
equivalents corresponding to financial trusts consolidated in
accordance with Note 32.I.f. is shown below
|
|
December 31,
|
||
|
|
2017
|
2016
|
2015
|
|
|
|
|
|
|
Cash and cash
equivalents under Argentine Banking GAAP
|
Ps.
3,646,536
|
Ps.
7,188,279
|
Ps.
6,378,793
|
|
Cash and cash
equivalent from consolidated financial trusts
|
168,924
|
165,191
|
71,310
|
|
Cash
and cash equivalents under U.S. GAAP
|
Ps
3,815,460
|
Ps.
7,353,470
|
Ps.
6,450,103
|
|
|
|
|
|
|
Net cash (used in) / provided by operating activities under
Argentine Banking GAAP
|
Ps.
(16,296,063
)
|
Ps.
(10,397,007
)
|
Ps.
(4,484,366
)
|
|
Loans reclassified
to investing activities
|
8,818,524
|
Ps.
7,018,399
|
Ps.
3,484,587
|
|
Available for sale
securities reclassified to investing activities
|
(141,533
)
|
2,465,947
|
1,815,853
|
|
Organization and
development expenses reclassified to investing
activities
|
-
|
89,145
|
135,291
|
|
Deposits
reclassified to financing activities
|
(1,823,375
)
|
1,405,254
|
(2,058,100
)
|
|
Interest paid on
debt reclassified to financing activities
|
5,743,905
|
5,335,162
|
3,304,260
|
|
Debt issue cost
reclassified to financing activities
|
101,151
|
90,576
|
83,682
|
|
Financial trust
consolidated under U.S. GAAP
|
(66,625
)
|
4,313
|
116,461
|
|
Net cash (used in) / provided by operating activities under U.S.
GAAP
|
Ps.
(3,664,016
)
|
Ps.
6,011,789
|
Ps.
2,397,668
|
|
|
|
|
|
|
Net cash (used in) / provided by investing activities under
Argentine Banking GAAP
|
Ps.
(1,168,079
)
|
Ps.
(378,366
)
|
Ps.
(124,937
)
|
|
Increase in loans
and leases, net
|
(8,818,524
)
|
(7,018,399
)
|
(3,484,587
)
|
|
Purchases of
available for sale securities
|
(1,692,623
)
|
(10,219,794
)
|
(2,589,832
)
|
|
Proceeds from sales
of available for sale securities
|
1,834,156
|
7,753,847
|
773,979
|
|
Payments for
organization and development expenses
|
-
|
(89,145
)
|
(135,291
)
|
|
Payment of
dividends reclassified to financing activities
|
-
|
-
|
41,817
|
|
Financial trust
consolidated under U.S. GAAP—corresponding to loans and
securities
|
207,432
|
(2,425,370
)
|
(1,538,592
)
|
|
Net cash (used in) / provided by investing activities under U.S.
GAAP
|
Ps.
(9,637,638
)
|
Ps.
(12,377,227
)
|
Ps.
(7,057,443
)
|
|
|
|
|
|
|
Net cash (used in) / provided by financing activities under
Argentine Banking GAAP
|
Ps.
9,650,095
|
Ps.
9,034,850
|
Ps.
2,773,584
|
|
Increase in
deposits, net
|
Ps.
1,823,375
|
Ps.
(1,405,254
)
|
Ps.
2,058,100
|
|
Interest paid on
debt
|
(5,743,905
)
|
(5,335,162
)
|
(3,304,260
)
|
|
Payments for debt
issue cost
|
(101,151
)
|
(90,576
)
|
(83,682
)
|
|
Payment of
dividends
|
-
|
-
|
(41,817
)
|
|
Financial trusts
consolidated under U.S. GAAP – Corresponding to
debt
|
(137,074
)
|
2,514,938
|
1,427,285
|
|
Net cash (used in) / provided by financing activities under U.S.
GAAP
|
Ps.
5,491,340
|
Ps.
4,718,796
|
Ps.
2,829,210
|
|
|
|
|
|
|
Effect of exchange
rate changes on cash and cash equivalents
|
Ps.
4,272,304
|
Ps.
2,550,009
|
Ps.
2,845,998
|
|
Cash and cash
equivalents at the beginning of the year under U.S.
GAAP
|
Ps.
7,353,470
|
Ps.
6,450,103
|
Ps.
5,434,670
|
|
Cash and cash
equivalents at the end of the year under U.S. GAAP
|
Ps.
3,815,460
|
Ps.
7,353,470
|
Ps.
6,450,103
|
|
Net
increase in cash and cash equivalents under U.S. GAAP
|
Ps.
(3,538,010
)
|
Ps.
903,367
|
Ps.
1,015,433
|
Set forth below is the reconciliation of net income to net cash
flows from operating activities, as required by
ASC 230:
F-214
BANCO HIPOTECARIO S.A. AND SUBSIDIARIES
NOTES TO THE CONSOLIDATED FINANCIAL STATEMENTS
For the years ended December 31, 2017, 2016 and 2015
(Expressed in thousands of Argentine pesos, except share data and
as otherwise indicated)
|
|
December 31,
|
||
|
|
2017
|
2016
|
2015
|
|
|
|
|
|
|
Net
income for the fiscal
year
|
Ps.
972,946
|
Ps.
447,927
|
Ps.
951,667
|
|
|
|
|
|
|
Adjustments to
reconcile net income to net cash from operating
activities:
|
|
|
|
|
U.S. GAAP
Reconciliation Adjustments
|
Ps.
620,493
|
Ps.
167,401
|
Ps.
134,147
|
|
Income Tax for the
fiscal year
|
532,658
|
516,179
|
618,899
|
|
Amortizations and
depreciations
|
292,248
|
233,642
|
149,013
|
|
Results from equity
investments
|
(18,985
)
|
(35,656
)
|
(13,767
)
|
|
Provision for loan
losses, net of reversals
|
711,737
|
246,773
|
88,686
|
|
Non-controlling
interests
|
28,684
|
14,657
|
(3,077
)
|
|
Gain for sale of
premises and equipment
|
(61,215
)
|
(1,967
)
|
(2,363
)
|
|
(Decrease) /
Increase in government and private securities
|
(9,958,022
)
|
2,914,597
|
887,626
|
|
(Increase) /
Decrease in interest receivable from Loans
|
(185,920
)
|
(22,383
)
|
265,493
|
|
Decrease /
(Increase) in other receivable from financial
intermediation
|
2,810,743
|
(4,859,765
)
|
(2,185,402
)
|
|
(Increase) /
Decrease from miscellaneous assets
|
(418,512
)
|
(551,561
)
|
(755,999
)
|
|
(Increase) /
Decrease in balances from forward transactions without delivery of
underlying asset
|
(123,500
)
|
150,889
|
(1,629
)
|
|
Decrease /
(Increase) in interest payable from Deposits
|
(83,668
)
|
82,188
|
68,920
|
|
Decrease /
(Increase) in other liabilities from financial
intermediation
|
5,408,603
|
9,679,695
|
5,174,355
|
|
Increase of
miscellaneous liabilities
|
79,998
|
(420,818
)
|
(132,903
)
|
|
Financial income on
cash and cash equivalents
|
(4,272,304
)
|
(2,550,009
)
|
(2,845,998
)
|
|
Net cash (used in) / provided by operating activities under U.S.
GAAP
|
Ps.
(3,664,016
)
|
Ps.
6,011,789
|
Ps.
2,397,668
|
h. Repurchase Agreements and Reverse Repurchase Agreements
(“Repos and Reverse Repos”).
Under Argentine Banking GAAP, the Bank and its subsidiaries
derecognize the securities transferred under the repurchase
agreement and records an asset related to the future repurchase of
these securities. Contemporaneously, the Bank and its subsidiaries
records a liability related to the cash received in the
transaction.
As of December 31, 2017, the adjustment related to the
derecognition of the securities amounted to Ps.114,707, as well as
the reversal of the liability recorded in other liabilities from
financial intermediation amounted to Ps.114,707.
The asset related to securities to be repurchased is measured as
the same criteria as the transferred securities. Similar treatment
applies to reverse repo agreements.
For U.S. GAAP purposes these transactions have not qualified as
true sales and therefore these transactions were classified as
trading and recorded at fair value.
i. Deposits and Interest-Bearing Deposits with Other
Banks
Interest-bearing Deposits with Other Banks
Included in “Cash and Due from Banks” there are
interest-bearing deposits with the BCRA totaling 2,421,833 and
5,355,489 as of December 31, 2017 and 2016, respectively; and
interest-bearing deposits in local and foreign banks totaling
291,037 and 1,076,086 as of December 31, 2017 and 2016,
respectively.
Deposits
F-215
BANCO HIPOTECARIO S.A. AND SUBSIDIARIES
NOTES TO THE CONSOLIDATED FINANCIAL STATEMENTS
For the years ended December 31, 2017, 2016 and 2015
(Expressed in thousands of Argentine pesos, except share data and
as otherwise indicated)
The following tables set forth the maturities of the deposits at
the dates indicated.
|
|
As
of December 31, 2017
|
|||||
|
|
Within
1 month
|
Over
1 and up to 3 months
|
Over
3 and up to 6 months
|
Over
6 and up to 12 months
|
After
12 months
|
Total
|
|
|
|
|||||
|
Current
accounts
|
3,003,664
|
-
|
-
|
-
|
-
|
3,003,664
|
|
Savings
accounts
|
5,264,193
|
-
|
-
|
-
|
-
|
5,264,193
|
|
Time
deposits
|
6,741,695
|
3.923,124
|
874,377
|
173,672
|
12,778
|
11,725,646
|
|
Investment
accounts
|
496,423
|
-
|
-
|
-
|
-
|
496,423
|
|
Other
deposits
|
318,456
|
-
|
-
|
-
|
-
|
318,456
|
|
|
15,824,431
|
3,923,124
|
874,377
|
173,672
|
12,778
|
20,808,382
|
The following table sets forth information regarding the maturity
of time deposits exceeding Ps.100,000 at December 31,
2017:
|
|
As
of December 31, 2017
|
|||||
|
|
Within
1 month
|
Over
1 and up to 3 months
|
Over
3 and up to 6 months
|
Over
6 and up to 12 months
|
After
12 months
|
Total
|
|
|
|
|||||
|
Time deposits of
Ps.100,000 or more
|
5,004,375
|
4,355,609
|
972,853
|
161,374
|
13,641
|
10,507,852
|
|
|
5,004,375
|
4,355,609
|
972,853
|
161,374
|
13,641
|
10,507,852
|
j. Risks and Uncertainties
All transactions involving the purchase of foreign currency must be
settled through the single free exchange market
(
Mercado
Único Libre de Cambios
, or
“MULC”) where the Central Bank supervises the purchase
and sale of foreign currency. Under Executive Branch Decree No.
260/2002, the Argentine government set up an exchange market
through which all foreign currency exchange transactions are made.
Such transactions are subject to the regulations and requirements
imposed by the Central Bank. Under Communication “A”
3471, as amended, the Central Bank established certain restrictions
and requirements applicable to foreign currency exchange
transactions. If such restrictions and requirements are not met,
criminal penalties shall be applied.
On October 28, 2011, the Federal Administration of Public Revenues
(
Administración Federal de
Ingresos Públicos
,
“AFIP”) established an Exchange Transactions Inquiry
Program (“Inquiry Program”) through which the entities
authorized by the Central Bank to deal in foreign exchange must
inquire and register through an IT system the total peso amount of
each exchange transaction at the moment it is closed. All foreign
exchange sale transactions, whether involving foreign currency or
banknotes, irrespective of their purpose or allocation, are subject
to this inquiry and registration system, which determines whether
Transactions are “Validated” or
“Inconsistent”.
Pursuant to Communication “A” 5239, afterward replaced
by Communication “A” 5245, in the case of sales of
foreign exchange (foreign currency or banknotes) for the formation
of off-shore assets by residents without the obligation of
subsequently allocating it to specific purpose, entities authorized
to deal in foreign exchange may only allow transactions
through the MULC by those clients who have obtained the validation
and who comply with the rest of the requirements set forth in the
applicable foreign exchange regulations. Sales of foreign exchange
other than for the formation of off-shore assets by residents
without a specific purpose are also exempted from the Inquiry
Program, although, the financial entities must verify that the
other requirements established by the MULC are
accomplished.
According to Communication “A” 5,264, as amended, in
general terms the access to the foreign exchange market for
resident in order to pay services, debts and profits to
non-residents has no limits or restrictions. The access to the MULC
requires the filing of certain documentation by residents
evidencing the validity of transactions for which the funds are
purchase for its remittance abroad. Communication “A”
5,236, item 4.2. which regulated the outflow of fund
allowing
F-216
BANCO HIPOTECARIO S.A. AND SUBSIDIARIES
NOTES TO THE CONSOLIDATED FINANCIAL STATEMENTS
For the years ended December 31, 2017, 2016 and 2015
(Expressed in thousands of Argentine pesos, except share data and
as otherwise indicated)
residents
to access to the MULC for the formation of off-shore assets without
a specific allocation by residents has been suspended and, up to
now, the Central Bank has not issued any other measure or
provisions in this regard.
On August 6, 2012, Resolution #3210 was replaced by Resolution
#3356 enacted by AFIP. This resolution sets forth more restrictions
for the access to the foreign exchange market, in particular for
the outflow of funds made by residents. Both resolutions (3210 and
3356) are related with Communications “A” 5239
(currently abrogated) and 5245.
The Argentine government may, in the future, impose additional
controls on the foreign exchange market and on capital flows from
and into Argentina, in response to capital flight or depreciation
of the Peso. These restrictions may have a negative effect on the
economy and on the business if imposed in an economic environment
where access to local capital is constrained.
k. U.S. GAAP estimates
Valuation
reserves, impairment charges and estimates of market values on
assets and step up bonds discounting, as established by the Bank
for U.S. GAAP purposes are subject to significant assumptions of
future cash flows and interest rates for discounting such cash
flows. Losses on the exchange of government and provincial bonds
were significantly affected by higher discount rates. Should the
discount rates change in future years, the carrying amounts and
charges to income and shareholders’ equity deficit will also
change. In addition, as estimates of future cash flows change, so
too will the carrying amounts which are dependent on such cash
flows. It is possible that changes to the carrying amounts of
loans, investments and other assets will be adjusted in the near
term in amounts that are material to the Bank’s financial
position and results of income.
l. Allowance for loan losses
Management
believes that the current level of allowance for loan losses
recorded for U.S. GAAP purposes are sufficient to cover incurred
losses of the Bank’s loan portfolio as of December 31, 2017
and 2016. Many factors can affect the Bank’s estimates of
allowance for loan losses, including expected cash flows,
volatility of default probability, migrations and estimated loss
severity. The process of determining the level of the allowance for
credit losses requires a high degree of judgment. It is possible
that others, given the same information, may at any point in time
reach different reasonable conclusions. If market conditions and
economic uncertainties exist, it might result in higher credit
losses and provision for credit losses in future
periods.
F-217
BANCO HIPOTECARIO S.A. AND SUBSIDIARIES
NOTES TO THE CONSOLIDATED FINANCIAL STATEMENTS
For the years ended December 31, 2017, 2016 and 2015
(Expressed in thousands of Argentine pesos, except share data and
as otherwise indicated)
33. New authoritative pronouncements
The
last Accounting Standards Updates issued by the FASB applicable for
the Bank are mentioned below:
ASU No. 2014-09
In
May 2014, the FASB issued the Accounting Standard Update
No. 2014-09 “Revenue from Contracts with Customers
(Topic 606)”. The guidance in this update affects any entity
that either enters into contracts with customers to transfer goods
or services or enters into contracts for the transfer of
nonfinancial assets unless those contracts are within the scope of
other standards (for example, insurance contracts or lease
contracts).
The
core principle of the guidance is that an entity should recognize
revenue to depict the transfer of promised goods or services to
customers in an amount that reflects the consideration to which the
entity expects to be entitled in exchange for those goods or
services.
ASU
No. 2015-14 defer the effective date of ASU 2014-09 for all
entities by one year. Public business entities, certain
not-for-profit entities, and certain employee benefit plans should
apply the guidance in Update 2014-09 to annual reporting periods
beginning after December 15, 2017, including interim reporting
periods within that reporting period.
All
other entities should apply the guidance in Update 2014-09 to
annual reporting periods beginning after December 15, 2018,
and interim reporting periods within annual reporting periods
beginning after December 15, 2019.
The
Bank is still evaluating the impact of this Update in the U.S. GAAP
financial statements. However, the Bank considers this ASU will not
have any significant effect in the U.S. GAAP disclosures and
financial information
ASU No. 2016-01
On
January 2015, the FASB issued the Accounting Standard Update
No. 2016-01 “Recognition and Measurement of Financial
Assets and Financial Liabilities (Financial
Instruments—Overall Subtopic 825-10)”.
The
amendments in this Update make targeted improvements to generally
accepted accounting principles (GAAP) as follows:
1.
Require equity investments (except those accounted for under the
equity method of accounting or those that result in consolidation
of the investee) to be measured at fair value with changes in fair
value recognized in net income. However, an entity may choose to
measure equity investments that do not have readily determinable
fair values at cost minus impairment, if any, plus or minus changes
resulting from observable price changes in orderly transactions for
the identical or a similar investment of the same
issuer.
2.
Simplify the impairment assessment of equity investments without
readily determinable fair values by requiring a qualitative
assessment to identify impairment. When a qualitative assessment
indicates that impairment exists, an entity is required to measure
the investment at fair value.
3.
Eliminate the requirement to disclose the fair value of financial
instruments measured at amortized cost for entities that are not
public business entities.
4.
Eliminate the requirement for public business entities to disclose
the method(s) and significant assumptions used to estimate the
fair value that is required to be disclosed for financial
instruments measured at amortized cost on the balance
sheet.
F-218
BANCO HIPOTECARIO S.A. AND SUBSIDIARIES
NOTES TO THE CONSOLIDATED FINANCIAL STATEMENTS
For the years ended December 31, 2017, 2016 and 2015
(Expressed in thousands of Argentine pesos, except share data and
as otherwise indicated)
5.
Require public business entities to use the exit price notion when
measuring the fair value of financial instruments for disclosure
purposes.
6.
Require an entity to present separately in other comprehensive
income the portion of the total change in the fair value of a
liability resulting from a change in the instrument-specific credit
risk when the entity has elected to measure the liability at fair
value in accordance with the fair value option for financial
instruments.
7.
Require separate presentation of financial assets and financial
liabilities by measurement category and form of financial asset
(that is, securities or loans and receivables) on the balance sheet
or the accompanying notes to the financial statements.
8.
Clarify that an entity should evaluate the need for a valuation
allowance on a deferred tax asset related to available-for-sale
securities in combination with the entity’s other deferred
tax assets.
For
public business entities, the amendments in this Update are
effective for fiscal years beginning after December 15, 2017,
including interim periods within those fiscal years.
The
Bank is still evaluating the impact of this Update in the U.S. GAAP
financial statements.
ASU 2016-02
On
February 2016, the FASB issued the Accounting Standard Update
No. 2016-02 “Leases”. The amendments affects any
entity that enters into a leas, with some specified scope
exemptions. The main difference between previous U.S. GAAP and
Topic 842 is the recognition of lease assets and lease liabilities
by lessees for those leases classified as operating leases under
previous U.S. GAAP.
A
lessee should recognize in the statement of financial position a
liability to make lease payments (the lease liability) and a
right-of-use asset representing its right to use the underlying
asset for the lease term. When measuring assets and liabilities
arising from a lease, a lessee (and a lessor) should include
payments to be made in optional periods only if the lessee is
reasonably certain to exercise an option to extend the lease or not
to exercise an option to terminate the lease. Similarly, optional
payments to purchase the underlying asset should be included in the
measurement of lease assets and lease liabilities only if the
lessee is reasonably certain to exercise that purchase option.
Reasonably certain is a high threshold that is consistent with and
intended to be applied in the same way as the reasonably assured
threshold in the previous leasesguidance. In addition, also
consistent with the previous leases guidance, a lessee (and a
lessor) should exclude most variable lease payments in measuring
lease assets and lease liabilities, other than those that depend on
an index or a rate or are in substance fixed payments.
The
amendments in this Update are effective for fiscal years beginning
after December 15, 2018, including interim periods within
those fiscal years.
The
Bank is still evaluating the impact of this Update in the U.S. GAAP
financial statements.
ASU 2016-13
On
June 2016, the FASB issued the Accounting Standard Update
No. 2016-13 “Financial Instruments — Credit
Losses: Measurement of Credit Losses on Financial
Instruments”. The amendments affect entities holding
financial assets and net investment in leases that are not
accounted for at fair value through net income. The amendments
affect loans, debt securities, trade receivables, net investments
in leases, off-balance-sheet credit exposures, reinsurance
receivables, and any other financial assets not excluded from the
scope that have the contractual right to receive cash. The
amendments in this Update affect an entity to varying degrees
depending on the credit quality of the assets held by the entity,
their duration, and how the entity applies current
GAAP.
F-219
BANCO HIPOTECARIO S.A. AND SUBSIDIARIES
NOTES TO THE CONSOLIDATED FINANCIAL STATEMENTS
For the years ended December 31, 2017, 2016 and 2015
(Expressed in thousands of Argentine pesos, except share data and
as otherwise indicated)
The
amendments in this Update require a financial asset (or a group of
financial assets) measured at amortized cost basis to be presented
at the net amount expected to be collected. The allowance for
credit losses is a valuation account that is deducted from the
amortized cost basis of the financial asset(s) to present the
net carrying value at the amount expected to be collected on the
financial asset. The income statement reflects the measurement of
credit losses for newly recognized financial assets, as well as the
expected increases or decreases of expected credit losses that have
taken place during the period.
The
allowance for credit losses for purchased financial assets with a
more-than insignificant amount of credit deterioration since
origination (PCD assets) that are measured at amortized cost basis
is determined in a similar manner to other financial assets
measured at amortized cost basis; however, the initial allowance
for credit losses is added to the purchase price rather than being
reported as a credit loss expense. Only subsequent changes in the
allowance for credit losses are recorded as a credit loss expense
for these assets. Interest income for PCD assets should be
recognized based on the effective interest rate, excluding the
discount embedded in the purchase price that is attributable to the
acquirer’s assessment of credit losses at
acquisition
The
amendments in this Update are effective for all entities for fiscal
years, and interim periods within those fiscal years, beginning
after December 15, 2019. All entities may adopt the amendments
in this Update earlier as of the fiscal years beginning after
December 15, 2018, including interim periods within those
fiscal years.
The
Bank is still evaluating the impact of this Update in the U.S. GAAP
financial statements.
ASU 2016-15
On
August 2016, the FASB issued the Accounting Standard Update
No. 2016-15 “Statement of Cash Flow —
Classification of Certain Cash Receipt and Cash Prepayment”.
The amendments in this Update apply to all entities, including both
business entities and not-for-profit entities that are required to
present a statement of cash flows under Topic 230. The amendments
in this Update provide guidance on the following eight specific
cash flow issues: i) Debt prepayment or debt extinguishment costs,
ii) settlement of zero-coupon debt instruments or other debt
instruments with coupon interest rates that are insignificant in
relation to the effective interest rate of the borrowing, iii)
Contingent Consideration Payments Made after a Business
Combination, iv) Proceeds from the Settlement of Insurance Claims,
v) Proceeds from the Settlement of Corporate-Owned Life Insurance
Policies, including Bank-Owned Life Insurance Policies, vi)
Distributions Received from Equity Method Investees, vii)
Beneficial Interests in Securitization Transactions and viii)
Separately Identifiable Cash Flows and Application of the
Predominance Principle .
The
amendments in this Update are effective for all entities for fiscal
years, and interim periods within those fiscal years, beginning
after December 15, 2017.
The
Bank is still evaluating the impact of this Update in the U.S. GAAP
financial statements.
ASU 2016-18
On
November 2016, the FASB issued the Accounting Standard Update
No. 2016-18 “Statement of Cash Flow — Restricted
Cash”. The amendments in this Update apply to all entities,
including both business entities and not-for-profit entities that
are required to present a statement of cash flows under Topic 230.
The amendments in this Update require that a statement of cash
flows explain the change during the period in the total of cash,
cash equivalents, and amounts generally described as restricted
cash or restricted cash equivalents. Therefore, amounts generally
described as restricted cash and restricted cash equivalents should
be included with cash and cash equivalents when reconciling the
beginning-of-period and end-of-period total amounts shown on the
statement of cash flows. The amendments in this Update do not
provide a definition of restricted cash or restricted cash
equivalents.
F-220
BANCO HIPOTECARIO S.A. AND SUBSIDIARIES
NOTES TO THE CONSOLIDATED FINANCIAL STATEMENTS
For the years ended December 31, 2017, 2016 and 2015
(Expressed in thousands of Argentine pesos, except share data and
as otherwise indicated)
The
amendments in this Update are effective for all entities for fiscal
years, and interim periods within those fiscal years, beginning
after December 15, 2017.
The
Bank is still evaluating the impact of this Update in the U.S. GAAP
financial statements.
ASU 2017-01
On
January 2017, the FASB issued the Accounting Standard Update
No. 2017-01 “Business Combinations — Clarifying
the definition of a Business”. The amendments in this Update
affect all reporting entities that must determine whether they have
acquired or sold a business. The amendments in this Update provide
a screen to determine when a set is not a business. The screen
requires that when substantially all of the fair value of the gross
assets acquired (or disposed of) is concentrated in a single
identifiable asset or a group of similar identifiable assets, the
set is not a business. This screen reduces the number of
transactions that need to be further evaluated. If the screen is
not met, the amendments in this Update (1) require that to be
considered a business, a set must include, at a minimum, an input
and a substantive process that together significantly contribute to
the ability to create output and (2) remove the evaluation of
whether a market participant could replace missing elements. The
amendments provide a framework to assist entities in evaluating
whether both an input and a substantive process are present. The
framework includes two sets of criteria to consider that depend on
whether a set has outputs. Although outputs are not required for a
set to be a business, outputs generally are a key element of a
business; therefore, the Board has developed more stringent
criteria for sets without outputs.
The
amendments in this Update are effective for all entities for fiscal
years, and interim periods within those fiscal years, beginning
after December 15, 2017.
The
impact of this Update will not have any significant effect in the
present U.S. GAAP financial statements.
ASU 2017-04
In
January 2017, the FASB issued the Accounting Standards
Update No. 2017-04 “Simplifying the Test for
Goodwill Impairment”. The amendments in this Update simplify
how an entity is required to test goodwill for impairment by
eliminating Step 2 from the goodwill impairment test. Step 2
measures a goodwill impairment loss by comparing the implied fair
value of a reporting unit’s goodwill with the carrying amount
of that goodwill. Instead, under the amendments in this Update, an
entity should perform its annual, or interim, goodwill impairment
test by comparing the fair value of a reporting unit with its
carrying amount. An entity should recognize an impairment charge
for the amount by which the carrying amount exceeds the reporting
unit’s fair value; however, the loss recognized should not
exceed the total amount of goodwill allocated to that reporting
unit. The amendments in this Update are required for public
business entities and other entities that have goodwill reported in
their financial statements and have not elected the private company
alternative for the subsequent measurement of
goodwill.
An
entity should apply the amendments in this Update on a prospective
basis. A public business entity that is an SEC filer should adopt
the amendments in this Update for its annual or any interim
goodwill impairment tests in fiscal years beginning after
December 15, 2019. Early adoption is permitted for interim or
annual goodwill impairment tests performed on testing dates after
January 1, 2017.
The
Bank considers this ASU will not have any significant effect in the
U.S. GAAP disclosures and financial information.
ASU 2017-05
In
February 2017, the FASB issued the Accounting Standards
Update No. 2017-05 “Clarifying the Scope of
Asset Derecognition Guidance and Accounting for Partial Sales of
Nonfinancial Assets”. The amendments in this Update clarify
that a financial asset is within the scope of
Subtopic 610-20 if it meets the definition of an in
substance nonfinancial asset and add guidance for partial sales of
nonfinancial assets. An entity may elect to apply the amendments in
this Update
F-221
BANCO HIPOTECARIO S.A. AND SUBSIDIARIES
NOTES TO THE CONSOLIDATED FINANCIAL STATEMENTS
For the years ended December 31, 2017, 2016 and 2015
(Expressed in thousands of Argentine pesos, except share data and
as otherwise indicated)
either:
a) retrospectively to each period presented in the financial
statements in accordance with the guidance on accounting changes in
paragraphs 250-10-45-5 through 45-
10 (retrospective
approach); or b) retrospectively with a cumulative-effect
adjustment to retained earnings as of the beginning of the fiscal
year of adoption (modified retrospective approach).
The
amendments in this Update are effective at the same time as the
amendments in Update 2014-09. Therefore, for public
entities, the amendments are effective for annual reporting periods
beginning after December 15, 2017, including interim reporting
periods within that reporting period.
The
Bank considers this ASU will not have any significant effect in the
U.S. GAAP disclosures and financial information.
ASU 2017-11
On
July 2017, the FASB issued the Accounting Standard Update
No. 2017-11 “Earnings per share, Distinguishing
liabilities from equity, derivatives and hedging”. The
amendments in this Update change the classification analysis of
certain equity-linked financial instruments (or embedded features)
with down round features. When determining whether certain
financial instruments should be classified as liabilities or equity
instruments, a down round feature no longer precludes equity
classification when assessing whether the instrument is indexed to
an entity’s own stock. As a result, a freestanding
equity-linked financial instrument (or embedded conversion option)
no longer would be accounted for as a derivative liability at fair
value as a result of the existence of a down round feature. For
freestanding equity classified financial instruments, the
amendments require entities that present earnings per share (EPS)
in accordance with Topic 260 to recognize the effect of the down
round feature when it is triggered. That effect is treated as a
dividend and as a reduction of income available to common
shareholders in basic EPS. Convertible instruments with embedded
conversion options that have down round features are now subject to
the specialized guidance for contingent beneficial conversion
features (in Subtopic 470-20, Debt—Debt with Conversion and
Other Options), including related EPS guidance (in Topic
260).
The
amendments in this Update are effective for public business
entities for fiscal years, and interim periods within those fiscal
years, beginning after December 15, 2018. For all other
entities, the amendments in this Update are effective for fiscal
years, and interim periods within those fiscal years, beginning
after December 15, 2019.
The
Bank is still evaluating the impact of this Update in the U.S. GAAP
financial statements.
ASU 2017-12
In
August 2017, the FASB issued an ASU that will improve and
simplify accounting rules around hedge accounting. The
new standard refines and expands hedge accounting for both
financial (e.g., interest rate) and commodity risks. More hedging
strategies will be eligible for hedge accounting. These include
hedges of the benchmark rate component of the contractual coupon
cash flows of fixed-rate assets or liabilities, hedges of the
portion of a closed portfolio of prepayable assets not expected to
prepay, and partial-term hedges of fixed-rate assets or liabilities
(e.g., the first and second years of a five-year
bond).
Public
business entities, public not-for-profit entities, and
financial institutions will have until the end of the first quarter
in which a hedge is designated to perform an initial assessment of
a hedge’s effectiveness. All other companies will have until
their financial statements are available to be issued. After
initial qualification, the new guidance permits a qualitative
effectiveness assessment for certain hedges instead of a
quantitative test, such as a regression analysis, if the company
can reasonably support an expectation of high effectiveness
throughout the term of the hedge. An initial quantitative test to
establish that the hedge relationship is highly effective is still
required. For cash flow hedges, if the hedge is highly effective,
all changes in the fair value of the derivative hedging instrument
will be recorded in other comprehensive income. They will be
reclassified to earnings when the hedged item impacts earnings. On
the other hand, for fair value
F-222
BANCO HIPOTECARIO S.A. AND SUBSIDIARIES
NOTES TO THE CONSOLIDATED FINANCIAL STATEMENTS
For the years ended December 31, 2017, 2016 and 2015
(Expressed in thousands of Argentine pesos, except share data and
as otherwise indicated)
hedges,
because the change in fair value of the hedged item
and the derivative hedging instrument will still be recorded in
current earnings, if the hedge is not perfectly effective, there
will be an Income Statement impact.
The ASU
is effective for public companies in 2019 and private companies in
2020. Early adoption is permitted.
The
Bank considers this ASU will not have any significant effect in the
U.S. GAAP disclosures and financial information.
34. Subsequent events
Non-subordinated corporate bonds
The
following table shows the amount, interest rate and maturity date
of each series issued after December 31, 2017:
|
|
Issue date
|
Maturity date
|
Annual interest rate
|
|
Banco Hipotecario S.A.
|
|
|
|
|
Series
XLIX (Ps 596,373)
|
02/14/18
|
02/14/20
|
Badlar
+3,60%
|
|
Series
L (UVAS 23.239 miles)
|
02/14/18
|
02/14/22
|
4.90%
|
|
|
|
|
|
|
BACS
Banco de Crédito y Securitización S.A.
|
|
|
|
|
Series
XVI ($ 500.000)
|
02/08/18
|
08/08/19
|
Badlar
+3,68%
|
|
|
|
|
|
|
Tarshop
S.A.
|
|
|
|
|
Class
XV (Ps. 354,911)
|
03/28/18
|
09/28/19
|
Badlar
+4,75%
|
|
|
|
|
|
|
|
|
|
|
Dividends payment
The
Ordinary General Shareholders' Meeting held on April 9, 2018
approved the financial statements as of December 31, 2017 and the
treatment of the results for the year ended on that date. On that
date, the following destination of the unallocated results as of
December 31, 2017 was established, in accordance with current
regulations:
●
Legal reserve Ps.
318,688
●
Cash dividends Ps.
200,000
●
To facultative reserve for future
distributions of results Ps.1,074,751
On
April 23, 2018, said dividends were made available to
shareholders.
Capital increase
At the
ordinary shareholders’ meeting held on May 8, 2018, the
Bank’s shareholders approved a capital increase of up to an
aggregate amount of Ps.900 million to be represented by 900 million
Class A, Class B, Class C and Class D shares, par value Ps.1.00 per
share, issued in proportion to the existing capital structure,
which may be subscribed by the existing shareholders pursuant to
their preemptive and accretion rights. Any newly-issued shares that
remain unsubscribed after expiration of the period to exercise
preemptive and accretion rights will be offered as Class D shares
as part of the global offering.
The
Board of Directors will establish the issue premium and its method
of calculation and the limit to exceed the number of shares of
class D of the previous point, in the terms of article 62 of the
Capital Markets Law No. 26,831. Additionally, the Board of
Directors will set the time, amount and other terms and conditions
of the issuance of shares.
F-223
BANCO HIPOTECARIO S.A. AND SUBSIDIARIES
NOTES TO THE CONSOLIDATED FINANCIAL STATEMENTS
For the years ended December 31, 2017, 2016 and 2015
(Expressed in thousands of Argentine pesos, except share data and
as otherwise indicated)
Parcial cancellation of Un-subordinated corporate
bonds
On June
27, 2018, the bank acquired and has requested the cancellation of
the sum of Ps.800,000 in nominal value of the series XL negotiable
obligations, issued by the bank on October 12, 2016, within the
framework of its Global Program for the issuance of notes for up to
US dollars one billion (US$ 1,000,000,000) or its equivalent in
pesos.
After
the cancellation of VN 800,000,000, the outstanding amount of the
Series XL notes is set at Ps.4,878,320
Financial Trust “UVA I”
On
April 27, 2018 the Bank issued the trust “Fideicomiso
Hipotecario UVA I” with the following balances:
|
|
Class
A Debt Securities
|
Class
B Debt Securities
|
Certificates
of Participation
|
Total
|
|
Face value in
UVA
|
8,644,551
|
5,763,034
|
4,802,529
|
19,210,114
|
|
Declared Maturity
Date
|
10.30.2024
|
04.30.2028
|
05.30.2033
|
|
F-224
TABLE OF CONTENTS
Part IItem 1. Identity Of Directors, Senior Management and AdvisersItem 2. Offer Statistics and Expected TimetableItem 3. Key InformationItem 4. Information on The CompanyItem 4A. Unresolved Staff CommentsItem 5. Operating and Financial Review and ProspectsItem 3 Key Information D. Risk FactorsItem 6. Directors, Senior Management and EmployeesItem 7. Major Shareholders and Related Party TransactionsItem 8. Financial InformationItem 9. The Offer and ListingItem 10. Additional InformationItem 11. Quantitative and Qualitative Disclosures About Market RiskItem 12. Description Of Securities Other Than Equity SecuritiesPart IIItem 13. Defaults, Dividend Arrearages and DelinquenciesItem 14. Material Modifications To The Rights Of Security Holders and Use Of ProceedsItem 15. Controls and ProceduresItem 16. ReservedItem 16A. Audit Committee Financial ExpertItem 16B. Code Of EthicsItem 16C. Principal Accountant Fees and ServiceItem 16D. Exemption From The Listing Standards For Audit CommitteesItem 16E. Purchases Of Equity Securities By The Issuer and Affiliated PurchasersItem 16F. Change in Registrant S Certifying AccountantItem 16G. Corporate GovernanceItem 16H. Mine Safety DisclosuresPart IIIItem 17. Financial StatementsItem 18. Financial StatementsItem 19. ExhibitsNote 1 - The Group's Business and General Information F-10Note 1 - The Group's Business and General InformationNote 2 - Summary Of Significant Accounting Policies F-11Note 2 - Summary Of Significant Accounting PoliciesNote 3 - Significant Judgments, Key Assumptions and Estimates F-34Note 3 - Significant Judgments, Key Assumptions and EstimatesNote 4 - Acquisitions and Disposals F-35Note 4 - Acquisitions and DisposalsNote 5 - Financial Risk Management and Fair Value Estimates F-41Note 5 - Financial Risk Management and Fair Value EstimatesNote 6 - Segment Information F-51Note 6 - Segment InformationNote 7 - Information About The Main Subsidiaries F-61Note 7 - Information About The Main SubsidiariesNote 8 - Investments in Associates and Joint Ventures F-63Note 8 - Investments in Associates and Joint VenturesNote 9 - Investment Properties F-65Note 9 - Investment PropertiesNote 10 - Property, Plant and Equipment F-68Note 10 - Property, Plant and EquipmentNote 11 - Trading Properties F-69Note 11 - Trading PropertiesNote 12 - Intangible Assets F-69Note 12 - Intangible AssetsNote 13 - Biological Assets F-68Note 13 - Biological AssetsNote 14 - Inventories F-70Note 14 - InventoriesNote 15 - Financial Instruments By Category F-73Note 15 - Financial Instruments By CategoryNote 16 - Trade and Other Receivables F-78Note 16 - Trade and Other ReceivablesNote 17 - Cash Flow Information F-79Note 17 - Cash Flow InformationNote 18 - Shareholders Equity F-80Note 18 - Shareholders EquityNote 19 - Trade and Other Payables F-82Note 19 - Trade and Other PayablesNote 20 - Provisions F-82Note 20 - ProvisionsNote 21 - Borrowings F-84Note 21 - BorrowingsNote 22 - Income Tax F-86Note 22 - Income TaxNote 23 - Leases F-89Note 23 - LeasesNote 24 - Revenues F-91Note 24 - RevenuesNote 25 - Costs F-91Note 25 - CostsNote 26 - Expenses By Nature F-91Note 26 - Expenses By NatureNote 27 - Other Operating Results, Net F-92Note 27 - Other Operating Results, NetNote 28 - Financial Results, Net F-93Note 28 - Financial Results, NetNote 29 - Earnings Per Share F-93Note 29 - Earnings Per ShareNote 30 - Employee Benefits and Share-based Payments F-93Note 30 - Employee Benefits and Share-based PaymentsNote 31 - Related Party Transactions F-97Note 31 - Related Party TransactionsNote 32 - Cost Of Sales and Services Provided F-103Note 32 - Cost Of Sales and Services ProvidedNote 33 - Foreign Currency Assets and Liabilities F-104Note 33 - Foreign Currency Assets and LiabilitiesNote 34 - Groups Of Assets and Liabilities Held For Sale F-104Note 34 - Groups Of Assets and Liabilities Held For SaleNote 35 - Results From Discontinued Operations F-105Note 35 - Results From Discontinued OperationsNote 36 - Subsequent Events F-105Note 36 - Subsequent EventsNote 06. 30.18 06. 30.17Note 06. 30.18 06. 30.17 06. 30.16Note 8 Includes Summary Financial Information and Other Information Of The Group's AssociatesNote 4 Acquisitions and DispositionsNote 10 Property, Plant and EquipmentNote 12 Intangible AssetsNote 9 Investment PropertiesNote 22 TaxesNote 16 Trade and Other ReceivablesNote 15 Financial Instruments By CategoryNote 20 ProvisionsNote 13 Biological AssetsItem 06. 30.18 06. 30.17Item (3) / Currency