United
States
SECURITIES AND EXCHANGE COMMISSION
Washington, D.C. 20549
FORM 20-F
|
☐
|
|
REGISTRATION STATEMENT PURSUANT TO SECTION 12(b) OR (g) OF THE
SECURITIES EXCHANGE ACT OF 1934
|
OR
|
☒
|
|
ANNUAL REPORT PURSUANT TO SECTION 13 OR 15(d) OF THE SECURITIES
EXCHANGE ACT OF 1934
|
For the fiscal year ended: June 30, 2020
OR
|
☐
|
|
TRANSITION REPORT PURSUANT TO SECTION 13 OR 15(d) OF THE SECURITIES
EXCHANGE ACT OF 1934
|
OR
|
☐
|
|
SHELL COMPANY REPORT PURSUANT TO SECTION 13 OR 15(d) OF THE
SECURITIES EXCHANGE ACT OF 1934
Date of event requiring this shell company report ___
For the transition period from ___ to___
|
Commission file number: 001-29190
Cresud SOCIEDAD ANONIMA COMERCIAL INMOBILIARIA FINANCIERA Y
AGROPECUARIA
(Exact name of Registrant as specified in its charter)
Cresud Inc.
(Translation of Registrant’s name into English)
Republic of Argentina
(Jurisdiction of incorporation or organization)
Moreno 877, 23
rd
Floor,
(C1091AAQ) City of Buenos Aires, Argentina
(Address of principal executive offices)
Matías Iván Gaivironsky
Chief Financial and Administrative Officer
Tel +(5411) 4323-7449 – ir@cresud.com.ar
Moreno 877, 24
th
Floor,
(C1091AAQ) City of Buenos Aires, Argentina
(Name, Telephone, E-mail and/or Facsimile number and Address of
Company Contact Person)
Securities registered or to be registered pursuant to Section 12(b)
of the Act:
|
Title of each class
|
|
|
TradingSymbols
|
|
|
Name of each exchange on which registered
|
|
|
|
|
|
|
|
|
|
|
|
American Depositary Shares (ADSs), each representing
ten shares of Common Stock
|
|
|
CRESY
|
|
|
Nasdaq National Market of the
Nasdaq Stock Market
|
|
|
Common Stock, par value ARS 1.00 per share
|
|
|
CRESY
|
|
|
Nasdaq National Market of the
Nasdaq Stock Market*
|
|
|
*
|
Not for
trading, but only in connection with the registration of American
Depositary Shares, pursuant to the requirements of the Securities
and Exchange Commission.
|
Securities registered or to be registered pursuant to Section 12(g)
of the Act: None
Securities for which there is a reporting obligation pursuant to
Section 15(d) of the Act: None
Indicate
the number of outstanding shares of each of the issuer’s
classes of capital or common stock as of the period covered by the
annual report: 501,642,804.
Indicate
by check mark if the registrant is a well known seasoned issuer, as
defined in Rule 405 of the Securities Act:
☐
Yes
☒
No
If this
report is an annual or transition report, indicate by check mark if
the registrant is not required to file reports pursuant to Section
13 or 15 (d) of the Securities Exchange Act of 1934.
☒
Yes
☐
No
Note:
Checking the box above will not relieve any registrant required to
file reports pursuant to Section 13 or 15(a) of the Securities
Exchange Act of 1934 from their obligations under those
Sections
Indicate
by check mark whether the registrant (1) has filed all reports
required to be filed by Section 13 or 15(d) of the Securities
Exchange Act of 1934 during the preceding 12 months (or for such
shorter period that the registrant was required to file such
reports), and (2) has been subject to such filing requirements for
the past 90 days.
☒
Yes
☐
No
Indicate
by check mark whether the registrant has submitted electronically
every Interactive Data File required to be submitted and posted
pursuant to Rule 405 of Regulation S-T (§232.405 of this
chapter) during the preceding 12 months (or for such shorter period
that the registrant was required to submit such
files).
☒
Yes
☐
No
Indicate
by check mark whether the registrant is a large accelerated filer,
an accelerated filer, a non-accelerated filer or an emerging growth
company. See definition of “large accelerated filer,”
“accelerated filer” and “emerging growth
company” in Rule 12b-2 of the Exchange Act.:
Large
accelerated filer
☐
Accelerated filer
☒
Non-accelerated filer
☐
Emerging growth company
☐
If
an emerging growth company that prepares its financial statements
in accordance with U.S. GAAP, indicate by check mark if the
registrant has elected not to use the extended transition period
for complying with any new or revised financial accounting
standards† provided pursuant to Section 13(a) of the Exchange
Act.
☐
†The
term “new or revised financial accounting standard”
refers to any update issued by the Financial Accounting Standards
Board to its Accounting Standards Codification after April 5,
2012
Indicate
by check mark which basis of accounting the registrant has used to
prepare the financial statements included in this
filing:
|
U.S.
GAAP
|
☐
|
International
Financial Reporting Standards as issued by the International
Accounting Standards Board
|
☒
|
Other
☐
|
If
“Other” has been checked in response to the previous
question, indicate by check mark which financial statement item the
registrant has elected to follow.
☐
Item 17
☐
Item
18
If this
is an annual report, indicate by check mark whether the registrant
is a shell company (as defined in Rule 12b-2 of the Exchange
Act).
☐
Yes
☒
No
(APPLICABLE ONLY TO
ISSUERS INVOLVED IN BANKRUPTCY PROCEEDINGS DURING THE PAST FIVE
YEARS)
Indicate by check
mark whether the registrant has filed all documents and reports
required to be filed by Sections 12, 23 or 15(d) of the Securities
Exchange Act of 1934 subsequent to the distribution of securities
under a plan confirmed by the court. Yes
☐
No
☐
Please send copies of notices and communications from the
Securities and Exchange Commission to:
|
Carolina
Zang
|
|
David
L.Williams
|
|
|
|
Jaime
Mercado
|
|
Zang
Bergel & Viñes Abogados
|
|
Simpson
Thacher & Bartlett LLP
|
|
Florida
537 piso 18º
C1005AAK Ciudad
Autónoma de Buenos Aires, Argentina.
|
|
425
Lexington Avenue
New
York, NY 10019
|
TABLE OF CONTENTS
|
|
Page No.
|
|
Summary of Risk Factors
|
i
|
|
Disclaimer Regarding Forward-Looking Information
|
iii
|
|
Available information
|
iii
|
|
Presentation of Financial and Certain Other
Information
|
v
|
|
Market Data
|
x
|
|
Part I
|
1
|
|
Item 1. Identity of Directors, Senior Management and
Advisers
|
1
|
|
Item 2. Offer Statistics and Expected Timetable
|
1
|
|
Item 3. Key Information
|
1
|
|
A. Selected Consolidated Financial Data
|
1
|
|
A.1. Local exchange market and exchange rates
|
5
|
|
B. Capitalization and Indebtedness
|
6
|
|
C. Reasons for the Offer and Use of Proceeds
|
6
|
|
D. Risk Factors
|
6
|
|
Item 4. Information on the Company
|
66
|
|
A. History and Development of the Company
|
66
|
|
B. Business Overview
|
92
|
|
C. Organizational Structure
|
169
|
|
D. Property, Plants and Equipment
|
169
|
|
Item 4A. Unresolved Staff Comments
|
172
|
|
Item 5. Operating and Financial Review and Prospects
|
172
|
|
A. Consolidated Operating Results
|
172
|
|
B. Liquidity and Capital Resources
|
240
|
|
C. Research and Developments, Patents and Licenses
|
248
|
|
D. Trend Information
|
249
|
|
E. Off-Balance Sheet Arrangements
|
253
|
|
F. Tabular Disclosure of Contractual Obligations
|
253
|
|
G. Safe Harbor
|
253
|
|
Item 6. Directors, Senior Management and Employees
|
253
|
|
A. Directors and Senior Management
|
253
|
|
B. Compensation
|
258
|
|
C. Board Practices
|
260
|
|
D. Employees
|
261
|
|
E. Share Ownership
|
262
|
|
Item 7. Major shareholders and related party
transactions
|
264
|
|
A. Major Shareholders
|
264
|
|
B. Related Party Transactions
|
265
|
|
C. Interests of Experts and Counsel
|
269
|
|
Item 8. Financial Information
|
269
|
|
A. Audited Consolidated Statements and Other Financial
Information
|
269
|
|
B. Significant Changes
|
280
|
|
Item 9. The Offer and Listing
|
280
|
|
A. Offer and Listing Details
|
280
|
|
B. Plan of Distribution
|
281
|
|
C. Markets
|
281
|
|
D. Selling Shareholders
|
283
|
|
E. Dilution
|
283
|
|
F. Expenses of the Issue
|
283
|
|
Item 10. Additional Information
|
283
|
|
A. Share Capital
|
283
|
|
B. Memorandum and Articles of Association
|
283
|
|
C. Material Contracts
|
291
|
|
D. EXCHANGE CONTROLS
|
291
|
|
E. Money Laundering
|
293
|
|
F. Taxation
|
295
|
|
G. Dividends and Paying Agents
|
302
|
|
H. Statement by Experts
|
302
|
|
I. Documents on Display
|
303
|
|
J. Subsidiary Information
|
303
|
|
Item 11. Quantitative and Qualitative Disclosures about Market
Risk
|
303
|
|
Item 12. Description of Securities Other than Equity
Securities
|
303
|
|
Part II
|
305
|
|
Item 13. Defaults, Dividend Arrearages and
Delinquencies
|
305
|
|
Item 14. Material Modifications to the Rights of Security Holders
and Use of Proceeds
|
305
|
|
Item 15. Controls and Procedures
|
305
|
|
A. Disclosure Controls and Procedures
|
305
|
|
B. Management’s Annual Report on Internal Control Over
Financial Reporting
|
305
|
|
C. Attestation Report of the Registered Public Accounting
Firm
|
306
|
|
D. Changes in Internal Control Over Financial
Reporting
|
306
|
|
Item 16. Reserved
|
306
|
|
Item 16A. Audit Committee Financial Expert
|
306
|
|
Item 16B. Code of Ethics
|
306
|
|
Item 16C. Principal Accountant Fees and Services
|
306
|
|
Item 16D. Exemption from the Listing Standards for Audit
Committees
|
307
|
|
Item 16E. Purchases of Equity Securities by the Issuer and
Affiliated Purchasers
|
307
|
|
Item 16F. Change in Registrant’s Certifying
Accountant
|
308
|
|
Item 16G. Corporate Governance
|
308
|
|
Item 16H. Mine Safety Disclosures
|
310
|
|
Part III
|
311
|
|
Item 17. Financial Statements
|
311
|
|
Item 18. Financial Statements
|
311
|
|
Item 19. Exhibits
|
311
|
An
investment in our American Depositary Shares (“ADSs”)
and common shares is subject to a number of risks, including risks
relating to Argentina, Brazil, other countries where we operate,
our agricultural business, IRSA’s business in Argentina, our
investment in Banco Hipotecario, our business in the United States,
our Operations Center in Israel and our ADSs and common shares. The
following list summarizes some, but not all, of these risks. Please
read the information in the section entitled “Risk
Factors” for a more thorough description of these and other
risks.
Risks Relating to Argentina, Brazil and other Countries Where We
Operate
●
The ongoing
COVID-19 pandemic and government measures to contain the virus are
adversely affecting our business and results of
operations.
●
Governments in the
countries where we operate or intend to operate exercise
significant influence over their economies.
●
Continuing high
rates of inflation, uncertainty with regard to other economic
indicators and a depreciation of the currencies of the countries in
which we operate may have an adverse effect on the economy and our
business, financial condition and results of
operations.
●
Restrictions on
transfers of foreign currency and the repatriation of capital from
Argentina may impair our ability to pay dividends and distributions
and investors may face restrictions on their ability collect
capital and interest payments in connection with corporate bonds
issued by Argentine companies.
●
The imposition of
restrictions on acquisitions of agricultural properties by foreign
nationals may materially restrict the development of our business
and significant environmental regulation may significantly increase
our expenses.
Risks Relating to Our Agricultural Business
●
Fluctuation in
market prices for our agriculture products could adversely affect
our financial condition and results of operations.
●
Unpredictable
weather conditions, pest infestations and diseases may have an
adverse impact on our crop yields and cattle production. We may be
exposed to material losses due to volatile crop prices since a
significant portion of our production is not hedged, and exposed to
crop price risk.
●
Worldwide
competition in the markets for our products could adversely affect
our business and results of operations.
●
Our internal
processes and controls might not be sufficient to comply with the
extensive environmental regulation and current or future
environmental regulations could prevent us from fully developing
our land affect its operations and ability to pay its debt as it
becomes Our level of debt may adversely affect our operations and
our ability to pay our debt as it becomes due.
Risks Relating to IRSA’s Business in Argentina
●
Disease outbreaks
or other public health concerns could reduce traffic in
IRSA’s shopping malls.
●
IRSA is subject to
risks inherent to the operation of shopping malls that may affect
its profitability. The loss of tenants or the failure of tenants to
comply with the terms of their leases could adversely affect
IRSA’s operating revenues and value of our
properties.
●
The increasingly
competitive real estate sector in Argentina may adversely affect
IRSA’s ability to rent or sell office space and other real
estate.
●
IRSA’s level
of debt may adversely affect its operations and ability to pay its
debt as it becomes due.
i
Risks Relating to IRSA’s Investment in Banco
Hipotecario
●
COVID-19 may
negatively impact the operations and financial situation of Banco
Hipotecario.
●
The short-term
structure of Banco Hipotecario’s deposit base could lead to a
reduction in liquidity levels and limit the long-term expansion of
financial intermediation.
●
Banco Hipotecario
operates in a highly regulated environment and its operations are
subject to capital controls regulations adopted by several
regulatory agencies.
Risks Relating to IRSA’s Operations Center in
Israel
●
IDB Development
Corporation Ltd. (“IDBD”) was declared insolvent and is
in process of liquidation.
●
Capital
contributions to IDBD and
any such capital
contributions may be subject to claims by
creditors
.
Risks Relating to our ADSs and Common Shares
●
Common shares
eligible for sale could adversely affect the price of our common
shares and ADSs.
●
If we issue
additional equity securities in the future, you may suffer
dilution, and trading prices for our equity securities may
decline.
●
We are subject to
certain different corporate disclosure requirements and accounting
standards than domestic issuers of listed securities in the United
States.
●
Investors may not
be able to effect service of process within the U.S., limiting
their recovery of any foreign judgment.
●
If we are
considered to be a passive foreign investment company for United
States federal income tax purposes, U.S. holders of our common
shares or ADSs would suffer negative consequences.
●
Holders of the ADS
may be unable to exercise voting rights with respect to the common
shares underlying their ADSs.
●
Under Argentine
law, shareholder rights may be fewer or less well defined than in
other jurisdictions and our ability to pay dividends is limited by
law and our by-laws.
●
Restrictions on the
movement of capital out of Argentina may impair your ability to
receive dividends and distributions on, and the proceeds of any
sale of, the common shares underlying the ADSs.
●
You might be unable
to exercise preemptive or accretion rights with respect to the
common shares underlying your ADSs.
ii
DISCLAIMER REGARDING FORWARD-LOOKING STATEMENTS
This
annual report includes forward-looking statements, principally
under “Risk Factors,” “Information on the
Company” and “Operating and Financial Review and
Prospects.” We have based these forward-looking statements
largely on our current beliefs, expectations and projections about
future events and financial trends affecting our business. Many
important factors, in addition to those discussed elsewhere in this
annual report, could cause our actual results to differ
substantially from those anticipated in our forward-looking
statements, including, among other things:
Factors
that could cause actual results to differ materially and adversely
include but are not limited to:
●
changes in general
economic, financial, business, political, legal, social or other
conditions in Argentina, Brazil, Latin America or Israel or changes
in developed, emerging markets or either;
●
changes in capital
markets in general that may affect policies or attitudes toward
lending to or investing in Argentina or Argentine companies,
including volatility in domestic and international financial
markets;
●
inflation and
deflation;
●
ongoing economic
impacts of the COVID-19 pandemic on the Argentine
economy;
●
measures adopted by
the Argentina Government in response to the COVID-19
pandemic;
●
impact on our
business of the COVID-19 pandemic;
●
economic
consequences of the pandemic and the related impact on our buinsess
and financial condition;
●
fluctuations in the
exchanges rates of the peso and in the prevailing interest
rates;
●
increases in
financing costs or our inability to obtain additional financing on
attractive terms, which may limit our ability to fund existing
operations and to finance new activities;
●
current and future
government regulation and changes in law or in the interpretation
by Argentine courts;
●
price fluctuations
in the agricultural and real estate market;
●
political, civil
and armed conflicts;
●
adverse legal or
regulatory disputes or proceedings;
●
fluctuations and
declines in the aggregate principal amount of Argentine public debt
outstanding, default of sovereign debt;
●
government
intervention in the private sector and in the economy, including
through nationalization, expropriation, labor regulation or other
actions;
●
restrictions on
transfer of foreign currencies and other exchange
controls;
●
increased
competition in the shopping mall sector, office or other commercial
properties and related industries;
●
potential loss of
significant tenants at our shopping malls, offices or other
commercial properties;
●
our ability to take
advantage of opportunities in the real estate market of Argentina
or Israel on a timely basis;
●
restrictions on
energy supply or fluctuations in prices of utilities in the
Argentine market;
●
our ability to meet
our debt obligations;
iii
●
shifts in consumer
purchasing habits and trends;
●
technological
changes and our potential inability to implement new
technologies;
●
deterioration in
regional, national or global businesses and economic
conditions;
●
changes on the
applicable regulations to currency exchange or
transfers;
●
incidents of
government corruption that adversely impact the development of our
real estate projects;
●
fluctuations and
declines in the exchange rate of the peso, the U.S. dollar against
other currencies; and
●
risks related to
our investment in Israel; and
●
the risk factors
discussed under “Risk Factors.”
You can
identify forward-looking statements because they contain words such
as “believes,” “expects,”
“may,” “will,” “should,”
“seeks,” “intends,” “plans,”
“estimates,” “anticipates,”
“could,” “target,” “projects,”
“contemplates,” “potential,”
“continue” or similar expressions. Forward-looking
statements include information concerning our possible or assumed
future results of operations, business strategies, financing plans,
competitive position, industry environment, potential growth
opportunities, the effects of future regulation and the effects of
competition. Forward-looking statements speak only as of the date
they were made, and we undertake no obligation to update publicly
or to revise any forward-looking statements after we distribute
this annual report because of new information, future events or
other factors. In light of the risks and uncertainties described
above, the forward-looking events and circumstances discussed in
this annual report might not occur and are not guarantees of future
performance.
You
should not place undue reliance on such statements which speak only
as of the date that they were made. These cautionary statements
should be considered in connection with any written or oral
forward-looking statements that we might issue in the
future.
AVAILABLE INFORMATION
We file
annual and current reports and other information with the United
States Securities and Exchange Commission (“SEC”). You
may obtain any report, information or other document we file
electronically with the SEC at the SEC’s website
(
http://www.sec.gov
)
or at our website (
http://www.cresud.com.ar
).
The information contained in our website does not form part of this
annual report.
iv
PRESENTATION OF FINANCIAL AND CERTAIN OTHER
INFORMATION
In this
annual report
(the “Annual
Report”)
, references to “Cresud,” the
“Company,” “we,” “us” and
“our” means Cresud Sociedad Anónima Comercial,
Inmobiliaria, Financiera y Agropecuaria, and its consolidated
subsidiaries
,
unless the
context otherwise requires, or where we make clear that such term
refers only to Cresud and not to its
subsidiaries.
The
terms “Argentine government” and
“government” refer to the federal government of
Argentina, the terms “Central Bank” ans
“BCRA” refer to the
Banco Central de la República
Argentina
(the Argentine Central Bank), the terms
“CNV” and “CNV Rules” refer to the
Comisión Nacional de Valores (the Argentine National
Securities Commission) and the rules issued by the CNV,
respectively. In this annual report, when we refer to
“peso,” “pesos” or “ARS” we
mean Argentine pesos, the legal currency of Argentina; when we
refer to “U.S. dollar,” “U.S. dollars” or
“USD” we mean United States dollars, the legal currency
of the United States; when we refer to “Real,”
“Reals,” “Rs.” or “BRL” we mean
Brazilian Real, the legal currency Brazil; and when we refer to
“shekels” or “NIS” we mean Israeli new
shekels, the legal currency of Israel.
References to
“ADSs” are to the American Depositary Shares, each
representing 10 shares of our common stock, issued pursuant to the
deposit agreement, dated as of March 18, 1997 (the “deposit
agreement”), between us, The Bank of New York, as depositary
(the “ADS Depositary”), and the owners and holders of
the ADRs issued from time to time thereunder, and references to
“ADRs” are to the American Depositary Receipts, which
represent the ADSs.
Financial Statements
We
prepare and maintain our financial books and records in pesos and
in conformity with International Financial Reporting Standards
(“IFRS”), as issued by the International Accounting
Standards Board (“IASB”), and the CNV Rules. Our fiscal
year begins on July 1 and ends on June 30 of each
year.
O
ur audited consolidated financial statements as of
June 30, 2020 and 2019 and for the years ended June 30, 2020, 2019
and 2018, and the notes thereto (our “Audited Consolidated
Financial Statements”) are set forth on pages F-1 through F-
113 of this Annual Report.
Our
Audited Consolidated Financial Statements have been
approved by resolution of the Board
of Directors’ meeting held on September 25, 2020 and have
been audited by Price Waterhouse & Co S.R.L., Argentina, member
of PriceWaterhouseCoopers International Limited, an independent
registered public accounting firm whose report is included
herein.
Functional
and Presentation
Currency; Adjustment for Inflation
Our functional and presentation currency is the
peso, and our
Audited Consolidated
Financial Statements included in this Annual
Report are presented in pesos
.
IAS 29,
Financial Reporting in
Hyperinflationary Economies
(“IAS 29”) requires
that the financial statements of an entity whose functional
currency is one of a hyperinflationary economy be measured in terms
of the current unit of measurement at the closing date of the
financial statements, regardless of whether they are based on the
historical cost method or the current cost method. This requirement
also includes the comparative information of the financial
statements.
In
order to conclude that an economy is
“hyperinflationary,” IAS 29 outlines a series of
factors, including the existence of an accumulated inflation rate
in three years that is approximately or exceeds 100%. As of July 1,
2018, Argentina reported a cumulative three-year inflation rate
greater than 100% and therefore financial information published as
from that date should be adjusted for inflation in accordance with
IAS 29.
Therefore, our Audited
Consolidated Financial Statements and the financial information
included in this Annual Report have been stated in terms of the
measuring unit current at the end of the reporting year. For more
information, see section “Financial Statements” above
and Note 2.1 to our Audited Consolidated Financial
Statements.
v
Effective July 1,
2019, we adopted IFRS 16 “Leases” which establishes the
criteria for recognition and valuation of leases for lessees and
lessors. The changes incorporated mainly impact the tenant's
accounting. IFRS 16 provides that the lessee recognizes an asset
for the right of use and a liability at present value with respect
to those contracts that meet the definition of lease agreements
according to IFRS 16. In accordance with the standard, a lease
agreement is one that provides the right to control the use of an
identified asset for a specific period. In order for a company to
have control over the use of an identified asset: a) it must have
the right to obtain substantially all the economic benefits of the
identified asset and b) it must have the right to direct the use of
the identified asset. The standard allows excluding the short-term
contracts (under 12 months) and those in which the underlying asset
has low value, such option has been adopted by the Company.
Likewise, the Company has opted to recognize as consideration for
the right of use, the amount of ARS 16,797 million as lease
liabilities. The commitments under operating leases reported in
Audited Consolidated Financial Statements as of June 30, 2019,
amounted to ARS 18,395 million (such difference mainly corresponds
to the effect of the discount from future payments and the excluded
short-term contracts).
Additionally, in
accordance with the amendment to IAS 28, an entity shall implement
the provisions of IFRS 9 to Long-term Investments that are
essentially part of the entity's net investment in the associate or
in the joint venture according to the definitions of said standard.
The provisions of IFRS 9 shall apply to such investments with
respect to the participation in the losses of an associate or a
joint venture, as well as with respect to the recognition of the
impairment of an investment in an associate or joint venture. In
addition, when applying IFRS 9 to such long-term investments, the
entity will make it prior to the adjustments made to the carrying
amount of the investment in accordance with IAS 28. We opted for an
accounting policy where the currency translation adjustments
arising from these loans are recorded as part of other
comprehensive income.
See
Note 2.2 to our Audited Consolidated Financial Statements for a
more comprehensive discussion of the effects of the adoption of
these new standards.
Financial Information of our Subsidiaries in Israel
IDB
Development Corporation Ltd. (“IDBD”) and Discount
Investment Corporation (“DIC”), our principal
subsidiaries in the Operations Center in Israel, report their
quarterly and annual results following Israeli regulations, whose
filing deadlines fall after the filing deadlines in Argentina. In
addition, IDBD and DIC’s fiscal year-ends differ from our
fiscal year-end, consequently, we consolidate the results of
operations from IDBD and DIC on a three-month lag basis adjusted
for the effects of any significant transactions taking place within
such period. As such, our audited consolidated statement of
income
and other
comprehensive income for the fiscal year ended June 30, 2020
includes the results of IDBD and DIC for the twelve-month period
from April 1, 2019 to March 31, 2020, adjusted for the significant
transactions that occurred between April 1, 2020 and June 30,
2020.
IDBD
and DIC have certain restrictions and financial agreements in
relation to their financial debt, including their bonds and loans
with banks and financial institutions. Regarding IDBD's financial
position, its cash flow and its ability to meet its financial debt
commitments, the following should be considered:
As of June
30, 2020, IDBD had a deficit in shareholders’ equity, ongoing
negative cash flows from continuing operating activities and a low
credit rating, which circumstance may cast significant doubt about
IDBD’s ability to continue operating as a going concern.
IDBD’s cash flow required to meet its liabilities, including
short-term liabilities is based on the realization of assets which
the realization date is not under IDBD’s control. These
assets include the current price of Clal’s shares and the
impact thereof on swap transaction deposits and the fact that IDBD
shall receive, among others, the proceeds from the sale of private
investments which are directly owned by IDBD.
As of
June 30, 2020, the aggregate principal amount of the (i) IDBD
Series 9 Bonds was NIS 901 million (“Series 9”), (ii)
IDBD Series 14 Bonds was NIS 889 million collateralized by DIC
shares owned directly or indirectly by IDBD representing 70% of the
share capital of DIC (“Series 14”), (iii) IDBD Series
15 Bonds was NIS 238 million collateralized by shares of Clal
representing 5% of the share capital of Clal (“Series
15”).
In July 2019
and in June 2020, each of debenture holders (Series 9 and Series
14) and debenture holders (Series 15), respectively, decided to
appoint a representative and legal and economic advisor, inter
alia, in order to maintain contact with IDBD and / or third parties
and to examine proposals that will be presented to the bondholders
in connection with the repayment of IDBD's obligations towards the
bondholders and to evaluate IDBD’s financial position and the
remedies which may be available to the debenture
holders.
vi
In June
2020, general meetings of the holders of IDBD's debentures were
convened (all of the series, each series separately), where a
resolution on the agenda was not to convene a general meeting on
the agenda of which would be the making of the debentures repayable
immediately. The meetings of the debenture holders (Series 9 and
Series 15), each decided to pass the said resolution; The meeting
of the debenture holders (Series 14), decided not to pass the said
resolution, and a later stage to instruct the trustee for debenture
holders (Series 14) to postpone the date of the said meeting to
September 17, 2020;
In July 2020,
Dolphin Netherlands and the controlling interest therein, Mr.
Eduardo Elsztain committed vis-à-vis the generality of the
debenture holders in IDBD, that subject to defined terms and
conditions, during a certain period of time, some transactions will
not be executed and/or initiated and/or promoted, and that subject
to the provisions of the law, the power of control in corporations
that are controlled by the controlling interest in IDBD will not be
operated in order to promote any of those actions, unless
notification has been delivered in writing to the trustees for
debenture holders (Series 9, 14 and 15), at least 14 business days
in advance.
On
August 31, 2019, IDBD 's Audit Committee and the Board of Directors
approved the acceptance of an irrevocable commitment by Dolphin
Netherlands B.V. (“Dolphin Netherland”), the
controlling interest in IDBD, to make capital injections into IDBD
in an overall amount of NIS 210 million, in three equal annual
payments on September 2 in each of the years 2019 to 2021, which
would be made in consideration for shares in IDBD or as a
subordinated loan on similar terms to the subordinated loans that
had been provided by the controlling interest.
In
August 2020, IDBD received a letter from Dolphin Netherlands
stating, inter alia, that given the fact that some of IDBD's
bondholders are expected to include in their agenda for the
bondholder's meetings, a proposal to make the outstanding balances
of their bonds immediately due and payable, in preparation for the
additional inflow of NIS 70 million scheduled for September 2,
2020, Dolphin Netherlands would examine its undertaking towards
IDBD, taking into account the questions that arise from
IDBD’s bondholders conducts and intentions. To the said
Dolphin Netherlands' letter was attached a letter from IRSA to
Dolphin Netherlands, according to which, among other things, IRSA
will consider the validity of its undertaking to Dolphin
Netherlands to transfer to it (in accordance with Dolphin
Netherlands request) the amounts required for Dolphin Netherlands
to meet its commitment to carry out the capital injections into
IDBD on September 2, 2020, as aforementioned.
IDBD
responded to Dolphin Netherlands’ and IRSA’s letters,
noting that, among other things, Dolphin Netherlands' commitment
(dated August 29, 2019) towards IDBD is binding and irrevocable,
and that there is no basis for not making the capital injections
into IDBD, due to other events related to IDBD’s bondholders,
which do not fall within the scope of the events listed in the
wording of the commitment as expropriating the validity of Dolphin
Netherlands' commitment. In addition, it was also mentioned in
IDBD’s response letter, that failure to make the payments
into IDBD is not acceptable and will leave IDBD with no other
choice than to use all its power and rights according to the law to
enforce Dolphin Netherlands' commitment as well as IRSA’s
undertaking.
Following the above
mentioned, on September 13, 2020, IDBD submitted a statement of
claim against Dolphin Netherlands and against IRSA, in which it has
sought to require them to pay it an amount of NIS 70 million (with
the addition of linkage differentials and interest in accordance
with the law). In tandem with the submission of the lawsuit, as
aforesaid, IDBD submitted an urgent petition for placing temporary
attachments (in the presence of one party) on Dolphin Netherlands
and IRSA (which was not accepted by the Court in the presence of
one party and which has been passed on for the respondents to
respond to the petition).
On June
2, 2020, IDBD received a draft proposal from Dolphin IL for IDBD
and for the trustees for IDBD’s debentures (Series 9, 14 and
15) for the strengthening of IDBD 's capital structure, by way of
an arrangement between Dolphin, IDBD and the debenture holders,
based on an economic contribution to IDBD on Dolphin IL's part,
together with a full or partial (as the case may be) redemption of
the generality of IDBD's debentures; On June 21, 2020, IDBD
received an updated proposal in relation to the abovementioned
proposal and on June 28, 2020, Dolphin IL approached each of the
trustees for the debentures with a request to put said proposal,
with slight amendments, on the agenda of meetings of the debenture
holders.
On July
6, 2020, the Meeting of debenture holders (Series 9) decided to
order the trustee for debenture holders (Series 9) not to accept
Dolphin IL's offer; On July 7, 2020, the Meeting of the debenture
holders (Series 14) decided to negotiate for a fixed period of one
month in connection with Dolphin IL's proposal, and on July 8,
2020, the Meeting of debenture holders (Series 15) made a similar
decision.
On
September 2, 2020 IDBD received an updated offer from Dolphin IL
which was addressed to it and to IDBD’s debenture holders
(Series 9, 14 and 15); On September 9, 2020, Dolphin IL updated the
commercial terms of its proposal for debenture holders (Series 9),
and on September 16, 2020, IDBD received binding offers to
debenture holders (Series 14) and debenture holders (Series 15),
for the purchase of DIC shares pledged in favor of debenture
holders (Series 14) of IDBD, as part of an agreed realization
process.
As no
agreement has been reached, on September 17, 2020, the Series 9
trustee submitted to the District Court in Tel-Aviv-Jaffa (the
"Court") a petition to grant an order for the opening of
proceedings for IDBD pursuant to the Insolvency and Economic
Rehabilitation Law, 5778 – 2018 and to instruct the
appointment of a trustee for IDBD pursuant to Section 43 and to
grant the trustee any and all authority over the decision making of
IDBD.
vii
On
September 21, 2020, the Series 14 bond holders approved the
immediate fully payment of the remaining balances of such
serie.
On
September 22, 2020, IDBD and Dolphin Netherlands B.V. submitted an
initial response to the Petition, arguing that it is in the best
interest of IDBD and its creditors to exhaust the negotiations
among the controlling shareholder and its creditors during a short
period with the aim to maximize the value of its assets, avoid
costs and additional negative effects.
In
addition, responses by the Series 14 trustee and the Series 15
trustee were filed requesting the enforcement of liens and the
appointment of a receiver as well as an urgent hearing, which was
scheduled for September 24, 2020.
On
September 25, 2020, the Court resolved that IDBD is insolvent and
therefore it resolved to grant all three orders requested and
accordingly, issued an order for the initiation of proceedings and
liquidation of IDBD, and has appointed a liquidator to IDBD and
interim receivers over the Pledged DIC and Clal
Shares.
Under
IFRS 10 “Consolidated Financial Statements”
(“IFRS 10”), an investor controls an investee if and
only if the investor has all the following: a) power over the
investee; b) exposure, or rights, to variable returns from its
involvement with the investee; and c) the ability to use its power
over the investee to affect the amount of the investor’s
returns. Based on the facts and circumstances outlined above, our
management believe that, as from September 25, 2020, IRSA lost
control over IDBD and DIC (as this term is defined by IFRS 10).
Accordingly, our investment in IDBD and DIC will be deconsolidated
in our financial statements as of and for the three-month period
ended September 30, 2020.
viii
As of the
date of this Annual Report, we are analyzing together with our
local and international advisors the judicial decision,
alternatives and course of action. For more information see
“IRSA´s Recent Developments - Corporate Information:
IDBD”.
Organizational Structure
As of
June 30, 2020, the Company had two business lines to manage its
global business, which we refer to in this Annual Peport as
“Agricultural Business” and “Urban Properties and
Investments Business” derived from our subsidiary IRSA, which
is in turn subdivided into two operations centers which we refer as
the “Operations Center in Argentina” and the
“Operations Center in Israel.”
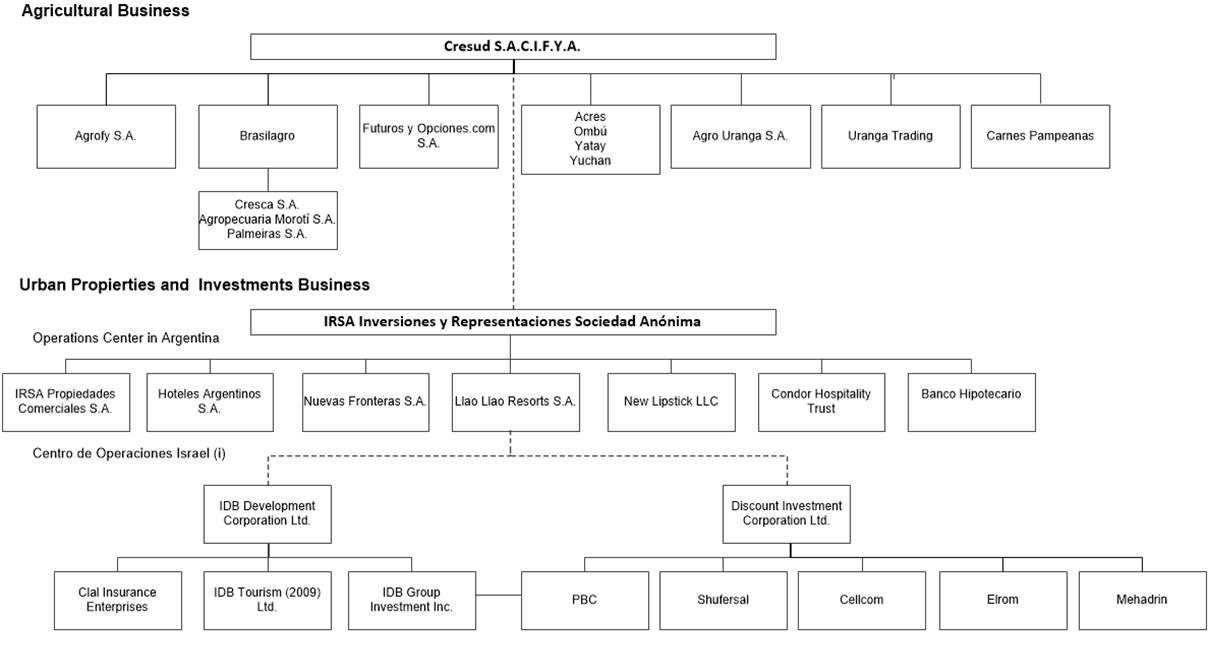
(i)
See
“—Financial Information of our Subsidiaries in
Operation Center in Israel.”
ix
Currency Translations
We have
translated some of the peso amounts contained in this annual report
into U.S. dollars for convenience purposes only. Unless otherwise
specified or the context otherwise requires, the rate used to
convert peso amounts to U.S. dollars is the seller exchange rate
quoted by Banco de la Nación Argentina of ARS 70.4600 per USD
1.00 for information provided as of June 30, 2020. The average
seller exchange rate for fiscal year 2020, quoted by Banco de la
Nación Argentina was ARS 59.5343. The U.S. dollar-equivalent
information presented in this annual report is provided solely for
the convenience of the reader and should not be construed as
implying that the peso amounts represent, or could have been or
could be converted into, U.S. dollars at such rates or at any other
rate. The seller exchange rate quoted by Banco de la Nación
Argentina was ARS 79.7500 per USD1.00 as of November 13, 2020. See
“Local Exchange Market and Exchange Rates” and
“Risk Factors—Risks relating to
Argentina—Continuing high rates of inflation may have an
adverse effect on the economy and our business, financial condition
and the results of our operations.”
We have
also translated certain NIS amounts into U.S. dollars at the offer
exchange rate for June 30, 2020 which was NIS 3.4619 per USD 1.00.
We make no representation that the peso, NIS or U.S. dollar amounts
actually represent or could have been or could be converted into
U.S. dollars at the rates indicated, at any particular rate or at
all. See “Local Exchange Market and Exchange
Rates.”
Market Share Data
Information
regarding market share in a specified region or area is based on
data compiled by us from internal sources and from publications
such as Bloomberg, the International Council of Shopping Centers,
the Argentine Chamber of Shopping Centers (
Cámara Argentina de Shopping
Centers
), and the INDEC.
x
Certain Measurements
In
Argentina the standard measure of area in the real estate market is
the square meter (m
2
), while in the
United States and certain other jurisdictions the standard measure
of area is the square foot (sq. ft.). All units of area shown in
this annual report (
e.g.
,
gross leasable area of buildings (“GLA” or “gross
leasable area”), and size of undeveloped land) are expressed
in terms of square meters (“sqm” and “m2”).
One square meter is equal to approximately 10.8 square feet. One
hectare is equal to approximately 10,000 square meters and to
approximately 2.47 acres.
In
Argentina the standard measure of weight are the tons (
“Tons,” “tons” or
“Tns”) and kilograms (“kg” or
“kgs”)
, while in the United States and certain
other jurisdictions the standard measure of weight are the pound or
the bushel.
A metric ton is equal to
1,000 kilograms. A kilogram is equal to approximately 2.2 pounds. A
metric ton of wheat is equal to approximately 36.74 bushels. A
metric ton of corn is equal to approximately 39.37 bushels. A
metric ton of soybean is equal to approximately 36.74 bushels. One
kilogram of live weight cattle is equal to approximately 0.5 to 0.6
kilogram of carcass (meat and bones).
As used
herein, GLA in the case of shopping malls refers to the total
leasable area of the property, regardless of our ownership interest
in such property (excluding common areas and parking and space
occupied by supermarkets, hypermarkets, gas stations and co-owners,
except where specifically stated).
Rounding Adjustments
Certain
numbers and percentages included in this annual report have been
subject to rounding adjustments. Accordingly, figures shown for the
same category presented in various tables or other sections of this
annual report may vary slightly, and figures shown as totals in
certain tables may not be the arithmetic aggregation of the figures
that precede them.
xi
This
item is not applicable.
This
item is not applicable.
A. SELECTED CONSOLIDATED FINANCIAL DATA
The following table presents our selected financial data as of June
30, 2020, 2019 and 2018 and for the fiscal years ended June 30,
2020, 2019, 2018 and 2017. The selected consolidated statement of
income and other comprehensive income data and the selected
consolidated statement of cash flow data for the fiscal years ended
June 30, 2020, 2019 and 2018 and the selected consolidated
statement of financial position data as of June 30, 2020 and 2019
have been prepared in accordance with IFRS, as issued by the IASB,
and CNV Rules, and have been derived from our Audited Consolidated
Financial Statements included in this Annual Report.
The summary consolidated statement of income and other
comprehensive income and cash flow data for the fiscal year ended
June 30, 2017 and the summary consolidated statement of financial
position data as of June 30, 2018 have been restated pursuant to
IAS 29 to reflect the effect of hyperinflation in Argentina. As a
result of such restatement, the selected financial information
included in this Annual Report differ from previously reported
financial information.
The summary financial data as of June 30, 2017 and 2016 and for the
fiscal year ended June 30, 2016 has not been presented as these
cannot be provided on a restated basis without unreasonable effort
or expense. See “Presentation of Financial and Other
Information—Functional and Presentation Currency,”
“Risk Factors—Risk Related to Argentina,”
“Operating and Financial Review and Prospects—Results
of Operations— Effects of Changes in Inflation” and
Note 2 to our Audited Consolidated Financial
Statements.
You should read the information below in conjunction with our
Audited Consolidated Financial Statements, including the notes
thereto.
In the following table, we have translated peso amounts into U.S.
dollars at the seller exchange rate as of June 30, 2020, quoted by
the Banco de la Nación Argentina, which was ARS 70.4600 per
USD 1.00. The average of the seller exchange rate for the fiscal
year 2020, quoted by Banco de la Nación Argentina was ARS
59.5343. We make no representation that these peso or U.S. dollar
amounts actually represent, could have been or could be converted
into U.S. dollars at the rates indicated, at any particular rate or
at all. See “Local Exchange Market and Exchange Rates”
and “Risk Factors—Risks Relating to
Argentina—Continuing high rates of inflation may have an
adverse effect on the economy and our business, financial condition
and the results of our operations.” For more information see
“Operating and Financial Review and Prospects—Factors
Affecting Comparability of our Results”
1
|
|
For the fiscal year ended June 30,
|
||||
|
|
2020
(i)(ii)
|
2020
|
2019
|
2018
|
2017
|
|
CONSOLIDATED STATEMENT OF INCOME AND OTHER COMPREHENSIVE INCOME
DATA
|
in millions of
|
in millions of ARS
|
|||
|
|
USD
|
(except per share data)
|
|||
|
|
|
|
|
|
|
|
Revenues
|
1,721
|
121,256
|
110,741
|
93,266
|
91,254
|
|
Costs
|
(1,192
)
|
(83,971
)
|
(75,384
)
|
(62,078
)
|
(60,302
)
|
|
Initial
recognition and changes in the fair value of biological assets and
agricultural products at the point of harvest
|
40
|
2,827
|
2,305
|
1,674
|
253
|
|
Changes
in the net realizable value of agricultural products after
harvest
|
9
|
657
|
(43
)
|
532
|
(360
)
|
|
Gross profit
|
578
|
40,769
|
37,619
|
33,394
|
30,845
|
|
Net
gain from fair value adjustment of investment
properties
|
440
|
30,992
|
(37,746
)
|
18,971
|
(5,259
)
|
|
Gain
from disposal of farmlands
|
12
|
838
|
665
|
1,656
|
630
|
|
General
and administrative expenses
|
(174
)
|
(12,267
)
|
(12,152
)
|
(10,876
)
|
(11,057
)
|
|
Selling
expenses
|
(232
)
|
(16,348
)
|
(13,976
)
|
(13,489
)
|
(14,089
)
|
|
Impairment
of associates
|
(35
)
|
(2,470
)
|
-
|
-
|
-
|
|
Other
operating results, net
|
39
|
2,77
|
1,101
|
3,657
|
(567
)
|
|
Management
fees
|
(3
)
|
(211
)
|
-
|
(1,456
)
|
(619
)
|
|
Profit / (loss) from operations
|
625
|
44,073
|
(24,489
)
|
31,857
|
(116
)
|
|
Share
of profit of associates and joint ventures
|
123
|
8,662
|
(7,328
)
|
(3,452
)
|
(1,366
)
|
|
Profit / (loss) before financial results and income
tax
|
748
|
52,735
|
(31,817
)
|
28,405
|
(1,482
)
|
|
Finance
income
|
21
|
1,463
|
1,775
|
1,476
|
1,630
|
|
Finance
cost
|
(365
)
|
(25,683
)
|
(22,571
)
|
(26,377
)
|
(20,173
)
|
|
Other
financial results
|
(265
)
|
(18,667
)
|
(5,981
)
|
(22,168
)
|
13,249
|
|
Inflation
adjustment
|
3
|
177
|
(457
)
|
(321
)
|
(3,445
)
|
|
Financial results, Net
|
(606
)
|
(42,710
)
|
(15,272
)
|
(47,390
)
|
(8,739
)
|
|
Profit / (loss) before income tax
|
142
|
10,025
|
(47,089
)
|
(18,985
)
|
(10,221
)
|
|
Income
tax
|
(115
)
|
(8,107
)
|
(780
)
|
9,964
|
(2,087
)
|
|
Profit / (loss) for the fiscal year from continuing
operations
|
27
|
1,918
|
(47,869
)
|
(9,021
)
|
(12,308
)
|
|
Profit
for the period from discontinued operations
|
257
|
18,085
|
7,140
|
36,441
|
17,485
|
|
Profit / (loss) for the fiscal year
|
284
|
20,003
|
(40,729
)
|
27,420
|
5,177
|
|
|
|
|
|
|
|
|
|
|
|
|
|
|
|
Other
comprehensive income / (loss):
|
|
|
|
|
|
|
Items that may be reclassified subsequently to profit or
loss:
|
|
|
|
|
|
|
Currency
translation adjustment
|
74
|
5,232
|
-3,113
|
6,417
|
8,093
|
|
|
-
|
-
|
-
|
-
|
-
|
|
Revaluation
surplus
|
9
|
614
|
1,111
|
316
|
-
|
|
Change
in the fair value of hedging instruments net of income
taxes
|
(1
)
|
(102
)
|
19
|
(40
)
|
412
|
|
Items that may not be reclassified subsequently to profit or
loss:
|
|
|
|
|
|
|
|
|
|
|
|
|
|
Actuarial
loss from defined benefit plans
|
(2
)
|
(137
)
|
(66
)
|
(60
)
|
(26
)
|
|
Other comprehensive income / (loss) for the year from continuing
operations
|
80
|
5,607
|
(2,049
)
|
6,633
|
8,479
|
|
Other
comprehensive income / (loss) for the year from discontinued
operations
|
82
|
5,810
|
1,245
|
10,059
|
(2,692
)
|
|
Total other comprehensive income for the year
|
162
|
11,417
|
(804
)
|
16,692
|
5,787
|
|
Total comprehensive income / (loss) for the year
|
446
|
31,420
|
(41,533
)
|
44,112
|
10,964
|
|
Total comprehensive income
/ (loss)
from continuing operations
|
107
|
7,525
|
(49,918
)
|
(2,389
)
|
(3,832
)
|
|
Total comprehensive income
from discontinued operations
|
339
|
23,895
|
8,385
|
46,501
|
14,796
|
|
Total comprehensive income / (loss) for the year
|
446
|
31,420
|
(41,533
)
|
44,112
|
10,964
|
|
Profit / (loss) of the year attributable to:
|
|
|
|
|
|
|
Equity
holders of the parent
|
56
|
3,929
|
(26,796
)
|
6,106
|
(892
)
|
|
Non-controlling
interest
|
228
|
16,074
|
(13,933
)
|
21,314
|
6,069
|
|
Loss from continuing operations attributable to:
|
|
|
|
|
|
|
Equity
holders of the parent
|
(34
)
|
(2,368
)
|
(28,334
)
|
(9,492
)
|
(3,096
)
|
|
Non-controlling
interest
|
61
|
4,286
|
(19,535
)
|
471
|
(9,212
)
|
|
Total comprehensive income attributable to:
|
|
|
|
|
|
|
Equity
holders of the parent
|
34
|
2,421
|
(27,078
)
|
5,775
|
1,436
|
|
Non-controlling
interest
|
412
|
28,999
|
(14,455
)
|
38,337
|
9,528
|
2
|
|
Fiscal year ended June 30, 2020
(i)(ii)
|
Fiscal year ended June 30, 2020
|
Fiscal year ended June 30, 2019
|
Fiscal year ended June 30, 2018
|
|
Consolidated Statements of Financial Position
|
in millions of
|
in millions of ARS
|
||
|
|
USD
|
(except per share data)
|
||
|
ASSETS
|
|
|
|
|
|
Non-current assets
|
|
|
|
|
|
Investment
properties
|
3,267
|
230,167
|
335,016
|
363,675
|
|
Property,
plant and equipment
|
851
|
59,956
|
54,106
|
52,073
|
|
Trading
properties
|
69
|
4,856
|
7,855
|
14,801
|
|
Intangible
assets
|
400
|
28,192
|
26,018
|
27,996
|
|
Right-of-use
assets
|
311
|
21,928
|
-
|
-
|
|
Biological
assets
|
25
|
1,759
|
1,805
|
2,012
|
|
Other
assets
|
-
|
-
|
31
|
417
|
|
Investments
in associates and joint ventures
|
1,066
|
75,128
|
44,870
|
58,192
|
|
Deferred
income tax assets
|
13
|
927
|
772
|
2,610
|
|
Income
tax and minimum presumed income tax (“MPIT”)
credits
|
1
|
63
|
273
|
1,006
|
|
Restricted
assets
|
27
|
1,936
|
4,547
|
4,842
|
|
Trade
and other receivables
|
388
|
27,326
|
21,730
|
20,298
|
|
Investment
in financial assets
|
50
|
3,515
|
4,129
|
3,815
|
|
Financial
assets held for sale
|
-
|
-
|
5,972
|
17,317
|
|
Derivative
financial instruments
|
2
|
164
|
153
|
67
|
|
Total non-current assets
|
6,470
|
455,917
|
507,277
|
569,121
|
|
Current assets
|
|
|
|
|
|
Trading
properties
|
33
|
2,316
|
523
|
7,285
|
|
Right-of-use
assets
|
-
|
-
|
-
|
-
|
|
Biological
assets
|
39
|
2,773
|
3,795
|
2,030
|
|
Inventories
|
129
|
9,070
|
6,403
|
5,250
|
|
Restricted
assets
|
88
|
6,209
|
6,261
|
9,446
|
|
Income
tax and minimum presumed income tax (“MPIT”)
credits
|
4
|
306
|
559
|
888
|
|
Groups
of assets held for sale
|
622
|
43,816
|
11,498
|
11,544
|
|
Trade
and other receivables
|
620
|
43,717
|
38,452
|
38,270
|
|
Investment
in financial assets
|
258
|
18,192
|
45,134
|
56,998
|
|
Financial
assets held for sale
|
48
|
3,377
|
16,666
|
9,930
|
|
Derivative
financial instruments
|
5
|
321
|
162
|
344
|
|
Cash
and cash equivalents
|
1,432
|
100,926
|
89,304
|
85,938
|
|
Total current assets
|
3,278
|
231,023
|
218,757
|
227,923
|
|
TOTAL ASSETS
|
9,748
|
686,940
|
726,034
|
797,044
|
|
SHAREHOLDERS’ EQUITY
|
|
|
|
|
|
Share
capital
|
7
|
499
|
486
|
482
|
|
Treasury
shares
|
-
|
3
|
16
|
20
|
|
Inflation
adjustment of share capital and treasury shares
|
139
|
9,786
|
9,786
|
9,786
|
|
Share
premium
|
150
|
10,592
|
10,592
|
10,592
|
|
Additional
paid-in capital from treasury shares
|
1
|
90
|
91
|
91
|
|
Legal
reserve
|
5
|
373
|
373
|
373
|
|
Special
reserve
|
11
|
770
|
5,179
|
5,179
|
|
Other
reserves
|
14
|
1,006
|
36,427
|
6,124
|
|
Retained
earnings
|
29
|
2,040
|
(38,908)
|
20,589
|
|
Equity
attributable to equity holders of the parent
|
356
|
25,159
|
24,042
|
53,236
|
|
Non-controlling
interest
|
1,377
|
96,994
|
103,159
|
123,218
|
|
TOTAL SHAREHOLDERS’ EQUITY
|
1,733
|
122,153
|
127,201
|
176,454
|
|
LIABILITIES
|
|
|
|
|
|
Non-current liabilities
|
|
|
|
|
|
Borrowings
|
4,548
|
320,418
|
397,414
|
416,820
|
|
Deferred
income tax liabilities
|
702
|
49,469
|
57,192
|
59,963
|
|
Trade
and other payables
|
41
|
2,986
|
2,830
|
8,241
|
|
Provisions
|
44
|
3,091
|
11,478
|
7,931
|
|
Employee
benefits
|
6
|
447
|
189
|
244
|
|
Income
tax and minimum presumed income tax ("MPIT")
liabilities
|
-
|
-
|
-
|
-
|
|
Derivative
financial instruments
|
216
|
15,194
|
-
|
-
|
|
Lease
liabilities
|
1
|
74
|
1,470
|
89
|
|
Payroll
and social security liabilities
|
4
|
247
|
197
|
169
|
|
Total non-current liabilities
|
5,562
|
391,926
|
470,770
|
493,457
|
|
Current liabilities
|
|
|
|
|
|
Trade
and other payables
|
508
|
35,823
|
32,299
|
40,057
|
|
Borrowings
|
1,396
|
98,389
|
80,384
|
71,336
|
|
Provisions
|
35
|
2,443
|
2,477
|
2,355
|
|
Group
of liabilities held for sale
|
336
|
23,649
|
8,137
|
7,210
|
|
Payroll
and social security liabilities
|
66
|
4,685
|
3,802
|
4,154
|
|
Income
tax and MPIT liabilities
|
12
|
824
|
699
|
1,324
|
|
Lease
liabilities
|
80
|
5,661
|
-
|
-
|
|
Derivative
financial instruments
|
20
|
1,387
|
265
|
697
|
|
Total Current liabilities
|
2,453
|
172,861
|
128,063
|
127,133
|
|
TOTAL LIABILITIES
|
8,015
|
564,787
|
598,833
|
620,590
|
|
TOTAL SHAREHOLDERS’ EQUITY AND LIABILITIES
|
9,748
|
686,940
|
726,034
|
797,044
|
3
|
|
For the fiscal year ended June 30,
|
||||
|
|
2020
|
2020
|
2019
|
2018
|
2017
|
|
|
in millions of
|
in millions of ARS
|
|||
|
|
USD
(i)(ii)
|
(except per share data)
|
|||
|
|
|
|
|
|
|
|
Net
cash generated from operating activities
|
507
|
35,734
|
25,546
|
24,150
|
23,649
|
|
Net
cash generated from / (used in) investing activities
|
572
|
40,311
|
10,552
|
(31,553)
|
(6,623)
|
|
Net
cash used in financing activities
|
(1,031)
|
(72,624)
|
(25,735)
|
(4,009)
|
6,066
|
|
Net
increase / (decrease) in cash and cash equivalents
|
49
|
3,421
|
10,363
|
(11,412)
|
23,092
|
|
Cash
and cash equivalents at beginning of the year
|
1,267
|
89,304
|
85,938
|
73,012
|
48,168
|
|
Cash
and cash equivalents at the end of the year
|
1,432
|
100,926
|
89,304
|
85,938
|
73,012
|
|
|
For the fiscal year ended June 30,
|
||||
|
|
2020
|
2020
|
2019
|
2018
|
|
|
|
USD
|
in millions of ARS (except per share
data)
|
|||
|
Basic net income per share
(1)
|
(0.112)
|
(7.867)
|
(54.790)
|
12.290
|
|
|
Diluted net income per share
(2)
|
(0.108)
|
(7.634)
|
(54.790)
|
11.820
|
|
|
Basic net income per ADS
(1)(3)
|
(1.117)
|
(78.670)
|
(547.900)
|
122.900
|
|
|
Diluted net income per ADS
(2)(3)
|
(1.083)
|
(76.340)
|
(547.900)
|
118.200
|
|
|
Capital
stock
|
7
|
502
|
502
|
502
|
|
|
Number
of common shares
|
501,642,804
|
501,642,804
|
501,642,804
|
501,642,804
|
|
|
Weighted
– average number of common shares outstanding
|
493,808,696
|
493,808,696
|
489,067,648
|
496,687,276
|
|
|
Diluted weighted – average number of common
shares
(5)
|
513,044,949
|
513,044,949
|
508,783,905
|
516,403,816
|
|
|
Dividends
paid
|
(28)
|
(1,997)
|
(2,138)
|
(4,363)
|
|
|
Dividends
per share
|
(0.06
)
|
(4.04
)
|
(4.37
)
|
(8.78)
|
|
|
Dividends per ADS
(3)
|
(0.57
)
|
(40.44
)
|
(43.72
)
|
(87.84)
|
|
|
Depreciation
and amortization
|
253
|
17,797
|
11,405
|
10,241
|
|
|
Capital
expenditure
|
174
|
12,28
|
20,642
|
22,741
|
|
|
Working
Capital
|
825
|
58,162
|
90,694
|
100,79
|
|
|
Gross
margin
|
0.33
|
0.33
|
0.33
|
0.35
|
|
|
Operating
margin
|
0.36
|
0.36
|
(0.22
)
|
0.34
|
|
|
Net
margin
|
0.16
|
0.16
|
(0.36
)
|
0.29
|
|
|
Ratio
of current assets to current liabilities
|
1.34
|
1.34
|
1.71
|
1.79
|
|
|
Ratio
of shareholders’ equity to total liabilities
|
0.22
|
0.22
|
0.21
|
0.28
|
|
|
Ratio
of non current assets to total assets
|
0.66
|
0.66
|
0.70
|
0.71
|
|
|
Ratio
of “Return on Equity” – ROE
|
0.16
|
0.16
|
(0.27
)
|
N/A.
|
|
(i)
Totals may not sum
due to rounding.
(ii)
Solely for the
convenience of the reader we have translated peso amounts into U.S.
dollars at the seller exchange rate quoted by Banco de la
Nación Argentina as of June 30, 2020, which was ARS 70.4600
per USD 1.00. The average seller exchange rate for the fiscal year
2020, quoted by Banco de la Nación Argentina was ARS 59.6343.
The seller exchange rate quoted by Banco de la Nación
Argentina was ARS 79.7500 per USD 1.00 as of November 13, 2020. We
make no representation that the peso or U.S. dollar amounts
actually represent, could have been or could be converted into U.S.
dollars at the rates indicated, at any particular rate or at all.
See “Local Exchange Market and Exchange Rates.” Totals
may not sum due to rounding.
|
(1)
|
Basic
net income per share is computed by dividing the net income
available to common shareholders for the period by the weighted
average common shares outstanding during the period,
|
|
(2)
|
Diluted
net income per share is computed by dividing the net income for the
period by the weighted average number of common shares assuming the
total conversion of outstanding notes and exercise of outstanding
options, Due to the loss for the year 2019, there is no diluted
effect on this result,
|
|
(3)
|
Determined
by multiplying per share amounts by ten (one ADS equals ten common
shares),
|
4
Local Exchange Market and Exchange Rates
Operations Center in Argentina
A.1. Local Exchange Market and Exchange Rates
The
Argentine government established a series of exchange control
measures that restricted the free disposition of funds and the
transfer of funds abroad. In 2011, these measures had significantly
curtailed access to the foreign exchange market
Mercado Único y Libre de Cambios
(“MULC”) by both individuals and private sector
entities. This made it necessary, among other things, to obtain
prior approval from the
Banco
Central de la República Argentina
(the “Central
Bank”) to enter into certain foreign exchange transactions
such as payments relating to royalties, services or fees payable to
related parties of Argentine companies outside
Argentina.
With the
change of government and political environment, in December 2015,
one of the first measures taken by the Argentine government was to
lift the main restrictions that limited access to individuals and
legal entities to the MULC. Despite this, as of September 1, 2019,
the Argentine government and the Central Bank implemented new
exchange controls and restrictions that limited access to
individuals and legal entities to the MULC. For more information
about exchange controls see, “
Item 10. Additional Information—D.
Exchange Controls
”.
The
following table shows the maximum, minimum, average and closing
exchange rates for each applicable period to purchases of U.S.
dollars.
|
|
Maximum
(1)(2)
|
Minimum
(1)(3)
|
Average
(1)(4)
|
At
closing
(1)
|
|
Fiscal
year ended:
|
|
|
|
|
|
June 30,
2018
|
28.8000
|
16.7500
|
19.4388
|
28.8000
|
|
June 30,
2019
|
45.8700
|
27.1600
|
37.8373
|
42.3630
|
|
June 30,
2020
|
70.3600
|
41.5000
|
59.5343
|
70.3600
|
|
Month
ended:
|
|
|
|
|
|
July 31,
2020
|
72.2200
|
70.4200
|
71.3795
|
72.2200
|
|
August 31,
2020
|
74.0800
|
72.4200
|
73.1980
|
74.0800
|
|
September 30,
2020
|
76.0800
|
74.1500
|
75.1036
|
76.0800
|
|
October 30,
2020
|
78.2200
|
76.1500
|
77.4843
|
78.2200
|
|
November (through
November 13, 2020)
|
79.6500
|
78.5900
|
79.1589
|
79.6500
|
Source
: Banco de la Nación Argentina
(1)
Average between the offer exchange rate and the bid exchange rate
according to Banco de la Nación Argentina’s foreign
currency exchange rate.
(2) The
maximum exchange rate appearing in the table was the highest
end-of-month exchange rate in the year or shorter period, as
indicated.
(3) The
minimum exchange rate appearing in the table was the lowest
end-of-month exchange rate in the year or shorter period, as
indicated.
(4)
Average exchange rates at the end of the month.
Operations Center in Israel
The
following table shows the maximum, minimum, average and closing
exchange rates for each period applicable to purchases of New
Israeli Shekels (NIS).
|
|
Maximum
(1)(2)
|
Minimum
(1)(3)
|
Average
(1)(4)
|
At
closing
(1)
|
|
Fiscal
year ended:
|
|
|
|
|
|
June 30,
2018
|
3.6573
|
3.3902
|
3.5275
|
3.6573
|
|
June 30,
2019
|
3.7767
|
3.5597
|
3.6443
|
3.5700
|
|
June 30,
2020
|
3.8224
|
3.4166
|
3.5072
|
3.4643
|
|
Month
ended:
|
|
|
|
|
|
July 31,
2020
|
3.4595
|
3.4030
|
3.4425
|
3.4038
|
|
August 31,
2020
|
3.4160
|
3.3528
|
3.3993
|
3.3528
|
|
September 30,
2020
|
3.4787
|
3.3617
|
3.4226
|
3.4258
|
|
October
2020
|
3.4322
|
3.3750
|
3.3948
|
3.4059
|
|
November 2020
(through November 13, 2020)
|
3.4118
|
3.3676
|
3.3835
|
3.3690
|
Source
: Bloomberg
(1)
Average between the offer exchange rate and the bid exchange rate
of the New Israeli Shekel against the U.S. dollar.
(2) The
maximum exchange rate appearing in the table was the highest
end-of-month exchange rate in the year or shorter period, as
indicated.
(3) The
minimum exchange rate appearing in the table was the lowest
end-of-month exchange rate in the year or shorter period, as
indicated.
(4)
Average exchange rates at the end of the month.
5
This
section is not applicable.
C. REASONS FOR THE OFFER AND USE OF PROCEEDS
This
section is not applicable.
D. RISK FACTORS
You
should carefully consider the risks described below, in addition to
the other information contained in this Annual Report, before
making an investment decision. We also may face additional risks
and uncertainties not currently known to us, or which as of the
date of this annual report we might not consider significant, which
may adversely affect our business. In general, you take more risk
when you invest in securities of issuers in emerging markets, such
as Argentina, than when you invest in securities of issuers in the
United States, and certain other markets. You should understand
that an investment in our common shares and American Depositary
Shares (“ADSs”) involves a high degree of risk,
including the possibility of loss of your entire
investment.
Risks
Relating to Argentina
The
ongoing COVID-19 pandemic and government measures to contain the
virus are adversely affecting our business and results of
operations, and, as conditions are evolving rapidly, we cannot
accurately predict the ultimate impact on our results of
operations.
As of
the date of this annual report, most of the operations and property
of our Operations Center in Argentina are located in Argentina. As
a result, the quality of our assets, our financial condition and
the results of our operations in the Operations Center in Argentina
are dependent upon the macroeconomic, regulatory, social and
political conditions prevailing in Argentina. These conditions
include changes to growth rates, inflation rates, exchange rates,
interest rates, taxes, foreign exchange controls, government
policies, social instability, and other political, economic or
international developments taking place in, or otherwise affecting,
Argentina.
In
December 2019, a novel strain of coronavirus (SARS-COV-2) causing a
severe acute respiratory syndrome (“COVID-19”) was
reported to have surfaced in Wuhan, China. COVID-19 has since
spread across the world, including Argentina, and on March 11,
2020, the World Health Organization declared COVID-19 a pandemic.
By early November approximately 1,284,519 cases of infections had
been confirmed in Argentina. In response, countries have adopted
extraordinary measures to contain the spread of the virus,
including imposing travel restrictions and closing borders,
requiring closures of non-essential businesses, instructing
residents to practice social distancing, issuing stay-at-home
orders, implementing quarantines and similar actions. The ongoing
pandemic and these extraordinary government measures are disrupting
global economic activity and resulting in significant volatility in
global financial markets. According to the International Monetary
Fund (“IMF”), the global economy has recently entered
into a recession.
The
Argentine government has adopted multiple measures in response to
the COVID-19 pandemic, including a nationwide mandatory lockdown
that began on March 19, 2020 that has been extended several times,
most recently through November 8, 2020. The government has also
required during the las months the mandatory shutdown of businesses
not considered essential. Finally, on November 6, 2020, the
government announced the end of the mandatory lockdown for the AMBA
(the “Área Metropolitana de Buenos Aires or
“AMBA”) and the beginning of the new phase of social
distancing. However, Coronavirus cases have risen over the last few
months in several regions of the world and the rate of infections
is still increasing. Lockdowns return to Europe as cases rise
again. Spain, France and the UK have all recorded more than one
million cases, and several others are seeing their highest number
of new infections since the start of the pandemic.
6
In
order to mitigate the economic impact of the COVID-19 pandemic and
mandatory lockdown and shutdown of non-essential businesses, the
Argentine government has adopted social aid, monetary and fiscal
measures. We cannot assure you whether these measures will be
sufficient to prevent a severe economic downturn in Argentina,
particularly if current conditions are prolonged and if
Argentina’s main trading partners are concurrently facing an
economic recession. However, the Argentine government may have more
limited resources at this time to support the country’s
economy; the pandemic has struck at a time when Argentina is
simultaneously struggling to emerge from a two-year recession. On
August 31, 2020, the Argentine government announced the results of
its bond restructuring offer, announcing that holders owning 93.5%
in principal amount of bonds outstanding and that this
participation percentage was subsequently increased to 99% by
virtue of the application of collective action clauses of the
restructured bonds. The Argentine government faces the challenge of
restructuring its debt in foreign currency issued under Argentine
law, as well as its debt with the IMF. We cannot predict the
outcome of these negotiations.
Some of
the measures adopted by the Argentine government may adversely
affect the business and financial condition of companies operating
in the real estate sector, such as our Company. These temporary
measures include the issuance of stay-at-home orders, closures of
non-essential businesses such as shopping malls, prohibition of
layoffs without cause and suspension of workers, among others.
These measures have necessitated, among other things, that we shut
down our shopping mall properties from March 20 until October 14,
2020, resulting in lower rental revenue from our shopping mall
clients whose rent is based in part on sales revenue. For more
information in connection with the COVID-19 pandemic and their
impact on our Company, see “Item 5.A. Operating Results
– The Ongoing COVID-19 Pandemic.” Although these
measures may help attenuate the economic impact on the Argentine
economy overall, they may have a negative impact on our business
and results of operations.
The
ongoing COVID-19 pandemic and government measures taken to contain
the spread of the virus are adversely affecting our business and
results of operations. Shopping malls have been required to remain
closed since March 20, 2020, leaving exclusively those premises
dedicated to items considered essential such as pharmacies,
supermarkets and banks. In the months of May and June, these
measures were relaxed and certain activities were reopened in some
provinces, such as Salta, Mendoza, Santa Fe and Córdoba,
opening the Alto Noa, Mendoza Plaza, Alto Rosario, La Ribera and
Córdoba shopping malls. Shopping under a strict safety and
hygiene protocol that includes reduced hours, social distancing,
and access control. In July 2020, IRCP proceeds with the opened
Shopping Neuquén and at the beginning of August 2020, Arcos
District, an open-air premium outlet in the city of Buenos Aires,
opened as well. On October 14, 2020, IRCP announced the opening of
Alto Palermo, Paseo Alcorta, Patio Bullrich, Abasto Shopping and
Dot Baires shopping malls, located in the City of Buenos Aires.
However, the uncertainty of the situation could cause setbacks in
the openings. The shopping malls mentioned above are resuming their
operations under a strict safety and hygiene protocol that includes
social distancing, reduced hours, access controls, among other
measures. Likewise, it should be clarified that the activity in the
food courts is limited to the commercialization of products through
home delivery or take-away and the entertainment business remains
closed.
Also,
the DirecTV Arena stadium has been closed since March 20, the date
on which social, preventive and all the planned congresses are
suspended, a large part of the fairs and conventions were
postponed, while the shows scheduled at the DirecTV Arena were
mostly canceled. The reopening date of these establishments is
uncertain, as well as the future agenda of fairs, conventions and
shows.
Additionally,
we face various risks arising from the economic impact of the
pandemic and government measures which are difficult to predict
accurately at this time, such as:
●
Our tenants may
terminate their leases, and as a result of the loss of key or
anchor tenants our shopping malls and office spaces may become less
attractive;
●
Our hotels,
including the Libertador and Intercontinental hotels in Buenos
Aires and the Llao Llao hotel in Bariloche, are temporarily closed
or operating under emergency contingency plans, and we do not know
with certainty when they may reopen or be able to operate normally
again;
●
Consumer spending
has sharply dropped and its persistence may generate a change in
consumer habits and a trend in favor of e-commerce, which would
translate into lower attendance at shopping malls or public places,
thus adversely affecting our tenants’ ability to generate
income and default on or terminate our leases;
7
●
The situation
generated by COVID-19 could cause an increase in our operating
costs and the operating costs of our tenants, who may be unable to
meet their payment obligations under the leases entered into with
the Company. This situation could cause a reduction in our rental
income and negatively affect our financial situation;
●
As a result of
financial turmoil in Argentina caused by disruptions in supply
chains and public debt restructuring, we may experience
difficulties in our ability to pay off our debts and other
financial obligations. We could also face difficulties in accessing
debt and capital markets and may be forced to refinance our
indebtedness;
●
An extended period
of remote work by our employees could deplete our technological
resources and result in or exacerbate certain operational risks,
including an increased risk of cybersecurity. Remote work
environments may be less secure and more susceptible to hacking
attacks, including phishing and social engineering attempts to
exploit the COVID-19 pandemic; and
●
COVID-19 poses a
threat to the well-being and morale of our employees. While we have
implemented a business continuity plan to protect the health of our
employees and we have contingency plans for key employees or
executive officers who may become ill or unable to perform their
duties for an extended period of time, such plans cannot anticipate
all scenarios, and we may experience a possible loss of
productivity or a delay in the deployment of certain strategic
plans.
We are
continuously monitoring the impact of the ongoing COVID-19 pandemic
on our Company. The ultimate impact of the pandemic on our
business, results of operations and financial condition remains
highly uncertain and will depend on future developments outside of
our control, including the intensity and duration of the pandemic
and the government measures taken in order to contain the virus or
mitigate the economic impact. To the extent the COVID-19 pandemic
adversely affects our business, it may also have the effect of
heightening many of the other risks described in this “Risk
Factors” section.
We depend on macroeconomic and political conditions in
Argentina.
The
Argentine economy has experienced significant volatility in recent
decades, characterized by periods of low or negative growth, high
levels of inflation and depreciation of the currency. As a
consequence, our business and operations have been, and could in
the future be, affected to varying degrees by economic and
political developments and other material events affecting the
Argentine economy, such as: inflation; price controls; foreign
exchange controls; fluctuations in foreign currency exchange rates
and interest rates; governmental policies regarding spending and
investment, national, provincial or municipal tax increases and
other initiatives increasing government involvement with economic
activity; civil unrest and local security concerns. You should make
your own investigation into Argentina’s economy and its
prevailing conditions before making an investment in
us.
Historically,
Argentina went through periods of severe political, economic and
social crisis. Among other consequences, these crises resulted in
Argentina defaulting on its foreign debt obligations, introducing
emergency measures and numerous changes in economic policies that
affected utilities, financial institutions, and many other sectors
of the economy. Argentina also suffered a significant real
depreciation of the Peso, which in turn caused numerous Argentine
private sector debtors with foreign currency exposure to default on
their outstanding debt. In the past three years, GDP grew 2.7% in
2017, but it contracted 2.5% in 2018 and 2.2% in 2019. On September
22, 2020, the Argentine Treasury announced that it expected GDP to
shrink 19.1% in 2020 and fiscal deficit to reach 4.7%, both figures
higher than previously forecast.
A
decline in international demand for Argentine products, a lack of
stability and competitiveness of the Peso against other currencies,
a decline in confidence among consumers and foreign and domestic
investors, a high rate of inflation and future political
uncertainties, among other factors, may affect the development of
the Argentine economy, which could lead to reduced aggregate demand
and adversely affect our business, financial condition and results
of operations.
8
The
primary elections (Elecciones Primarias, Abiertas y
Simultáneas y Obligatorias or “PASO”, per its
acronym in Spanish), which define which political parties and which
candidates of the different political parties may run in the
general elections, took place in August 11, 2019. In these
elections, the Frente de Todos coalition (which included former
president Fernandez de Kirchner as a candidate to the
vice-presidency) obtained 47.78% of the votes, while the Juntos por
el Cambio coalition (then-president Mauricio Macri’s
coalition), obtained 31.79% of the votes.
After
the results of the primary elections, the Peso depreciated
approximately 30% and the share price of Argentine listed companies
dropped approximately 38% on average. In turn, the emerging market
bond index (EMBI) peaked to one of the highest levels in Argentine
history, above 2,000 points on August 28, 2019. As a consequence of
the aforementioned effects, the Central Bank re-implemented
exchange controls in order to reduce currency outflows and restrict
exchange rate fluctuations, strengthen the normal functioning of
the economy, foster prudent administration of the exchange market,
reduce the volatility of financial variables and contain the impact
of the variations of financial outflows on the real
economy.
Presidential
and Congressional elections in Argentina took place on October 27,
2019, which resulted in Alberto Fernández being elected
President of Argentina, having earned 48.1% of the votes. The
Fernández administration assumed office on December 10, 2019.
As of such date, the Argentine Congress was composed as follows:
Frente de Todos commanded a majority in the senate with 41 seats,
followed by Juntos por el Cambio with 28 seats. In the house of
representatives Juntos por el Cambio held a slight majority with
119 seats and Frente de Todos held 116 seats.
The
political uncertainty in Argentina about the impact of the measures
that the Fernández administration took and could take with
respect to the economy, including with respect to the crisis
resulting from the ongoing COVID-19 pandemic, could generate
volatility in the price of securities issued by Argentine
companies’ or result in a decrease in their prices, in
particular companies like ours with operations in the real estate
sector.
We can
offer no assurances as to the policies that may be implemented by
the Fernández administration, or that political developments
in Argentina will not adversely affect the Argentine economy and
our business, financial condition and results of operations. In
addition, we cannot assure you that future economic, regulatory,
social and political developments in Argentina will not impair our
business, financial condition or results of operations, or cause
the market value of our shares to decline.
We cannot predict the effect that changes in economic policies,
laws and regulations adopted in recent years by the Argentine
government may have on the economy.
The
Macri administration took office in December 2015 and immediately
implemented significant economic and policy measures, ranging from
(i) lifting foreign exchange restrictions, (ii) eliminating certain
energy subsidies and ordering a substantial increase in electricity
tariffs, (iii) restoring the credibility of the Argentine National
Institute of Statistics and Census (the “INDEC”), (iv)
reducing foreign trade controls, (v) settling claims by
bondholders, (vi) reforming the framework applicable to the
transport and distribution of natural gas, among others described
in more detail below.
On June
29, 2016, the Argentine Congress enacted the Historical Reparation
Program for Retirees and Pensioners (Programa de Reparación
Histórica para Jubilados y Pensionados). This Program included
(i) payments to more than two million retirees and retroactive
compensation for more than 300,000 retirees and (ii) creation of a
universal pension for senior citizens, at a total cost of
approximately ARS 122,000 million.
In
December 2017, the Argentine Congress approved the tax reform law.
The reform was intended to eliminate certain inefficiencies in the
Argentine tax regime, curb tax evasion, expand the tax base and
encourage investment, with the long-term goal of restoring fiscal
balance by creating new taxes or increasing the then existing
contribution rates.
9
In
November 2017, the Argentine Congress approved Law No. 27,401,
which establishes a system of criminal liability of corporate
entities for criminal offenses against the public administration
and national and cross-border bribery committed by, among others,
its shareholders, attorneys-in-fact, directors, managers,
employees, or representatives. Convicted legal entities are subject
to various sanctions including a fine of between 1% and 20% of
their annual gross revenue and the partial or total suspension of
their activities for up to ten years. In addition, the law expands
the national criminal jurisdiction to all cases of bribery
including those committed outside the Argentine territory by
citizens or companies domiciled or headquartered in
Argentina.
At the
beginning of September 2018, the Argentine government announced a
series of measures in connection with the previously approved IMF
loan agreement (“Stand-By Agreement”) and implemented
changes in monetary policy, reducing the amount of Pesos to be
issued, thus easing pressure on the foreign currency market and on
inflation. In terms of fiscal policy, the government also
reinstated wheat and corn export duties, and a duty for all other
exports.
Following
the results of the primary elections held in August 2019, the
Argentine government adopted certain exceptional measures to
relieve tension in the financial and foreign exchange markets,
including:
●
increase of 20% in
the federal minimum wage and implementation of special deductions
for retirees and formal employees, together with an increase in the
income requirements for federal income taxes;
●
exemption from
employee contributions and from tax contributions for simplified
filers;
●
temporary increases
in welfare benefits;
●
adopting a 10-year
tax moratorium for small- and medium-sized companies, as well as
for self-employed workers and simplified filers;
●
implementing a
90-day freeze on gas prices
,
●
exchange controls
and restrictions to access to foreing exchange
markets.
The
fiscal cost of all of the above measures was estimated to be in
excess of ARS 40,000 million.
Likewise,
in order to mitigate the economic impact of the Covid-19 pandemic,
the government has imposed temporary measures that include, among
others:
●
the closure of
businesses considered non-essential such as shopping
centers,
●
the prohibition of
dismissals without cause
●
suspension of
workers,
●
rate
freezing.
We have
no control over the implementation of the reforms proposed by the
Argentine government nor can we assure you that these reforms will
be implemented at all or in a manner that will benefit our
business. The failure of these measures to achieve their intended
goals could adversely affect the Argentine economy and our
business, financial condition and results of
operations.
Continuing high rates of inflation may have an adverse effect on
the economy and our business, financial condition and results of
operations.
Historically,
high rates of inflation have undermined the Argentine economy and
the Argentine government’s ability to foster conditions for
stable growth. High rates of inflation may also undermine
Argentina’s competitiveness in international markets and
adversely affect economic activity and employment, as well as our
business, financial condition and results of
operations.
The
INDEC reported cumulative variation of the CPI of 24.8% for 2017,
47.6% for 2018, 53.8% for 2019 and 2.3%, 2.0%,3.3%, 1.5%, 1.5%,
2.2%,1.9%, 2.7%, 2.8% and 3.8% for January, February,March, April,
May, June, July, August, September and October 2020,
respectively.
10
In
recent years, the Argentine government has taken certain measures
to curb inflation, such as implementing price controls and limiting
wage increases. We cannot assure you that inflation rates will not
continue to escalate in the future or that the measures adopted or
that may be adopted by the Fernández administration to control
inflation will be effective or successful. High rates of inflation
remain a challenge for Argentina. Significant increases in the
rates of inflation could have a material adverse effect on
Argentina’s economy and in turn could increase our costs of
operation, in particular labor costs, and may negatively affect our
business, financial condition and results of
operations.
A high level of uncertainty with regard to these economic
variables, and a general lack of stability in terms of inflation,
could have a negative impact on economic activity and adversely
affect our financial condition.
As of
July 1, 2018, the Argentine Peso qualified as a currency of a
hyperinflationary economy and we were required to restate our
historical financial statements in terms of the measuring unit
current at the end of the reporting year, which could adversely
affect our results of operations and financial
condition.
Pursuant
to IAS 29 “Financial Reporting in Hyperinflationary
Economies”, the financial statements of entities whose
functional currency is that of a hyperinflationary economy must be
restated for the effects of changes in a suitable general price
index. IAS 29 does not prescribe when hyperinflation arises, but
includes several characteristics of hyperinflation. The IASB does
not identify specific hyperinflationary jurisdictions. However, in
June 2018, the International Practices Task Force of the Centre for
Quality, which monitors “highly inflationary
countries”, categorized Argentina as a country with projected
three-year cumulative inflation rate greater than 100%.
Additionally, some of the other qualitative factors of IAS 29 were
present, providing prima facie evidence that the Argentine economy
is hyperinflationary for the purposes of IAS 29. Therefore,
Argentine companies that prepare financial statements pursuant to
IFRS and use the Peso as their functional currency were required to
apply IAS 29 to their financial statements for periods ending on
and after July 1, 2018.
Adjustments
to reflect inflation, including tax indexation, such as those
required by IAS 29, are in principle prohibited in Argentina.
However, on December 4, 2018, the Argentine government enacted Law
No. 27,468, which lifted the ban on indexation of financial
statements. Some regulatory authorities, such as the CNV and the
IGJ, have required that financial statements for periods ended on
and after December 31, 2018 be restated for inflation in accordance
IAS 29.
During
the first three fiscal years starting after January 1, 2018, tax
indexation will be applicable if the variation of the CPI exceeds
55% in 2019, 30% in 2020 and 15% in 2021. The tax indexation
determined as of June 2019 was allocated as follows: One-third in
that same year, and the remaining two-thirds in equal parts in the
following two years. The tax indexation determined for fiscal years
beginning on July 1, 2019 and July 1 2020 will be allocated as
follows: One-sixth in that same year, and the remaining five-sixth
in equal parts in the following five years. For fiscal years
starting after January 1, 2021, the tax indexation procedure will
be triggered under similar standards as those set forth by IAS
29.
We
cannot predict the future impact that the eventual application of
tax indexation and related inflation adjustments described above
will have on our financial statements or their effects on our
business, results of operations and financial
condition.
High levels of public spending in Argentina could generate
long-lasting adverse consequences for the Argentine
economy.
During
recent years, the Argentine government has substantially increased
public spending. Argentina recorded a primary deficit of 3.9%, 2.4%
and 0.4% of GDP in 2017, 2018 and 2019, respectively. However, the
new Fernández administration has indicated that will seek to
foster economic growth, which may require additional public
spending. If government spending continues to outpace fiscal
revenue, the fiscal deficit is likely to increase. Additionally,
the economic impact of the COVID-19 pandemic and the nationwide
lockdown may also require the Argentine government to increase
public spending.
The
Argentine government’s ability to access the long-term
financial markets to finance such increased spending is limited
given the high levels of public sector indebtedness. The inability
to access the capital markets to fund its deficit or the use of
other sources of financing may have a negative impact on the
economy and, in addition, could limit the access to such capital
markets for Argentine companies, which could adversely affect our
business, financial condition and results of
operations.
11
Argentina’s ability to obtain financing in the international
capital markets is limited, which may impair our ability to access
international credit markets to finance our operations in
Argentina.
Argentina’s
2001 sovereign default and its failure to fully restructure its
sovereign debt and negotiate with the holdout creditors has limited
Argentina’s ability to access international capital markets
to obtain financing. In 2005, Argentina completed the restructuring
of a substantial portion of its defaulted sovereign indebtedness
and settled all of its debt with the IMF. Additionally, in June
2010, Argentina completed the renegotiation of approximately 67% of
the principal amount of the defaulted bonds outstanding that were
not swapped in the 2005 restructuring. As a result of the 2005 and
2010 debt swaps, Argentina restructured approximately 92.1% of its
defaulted debt that was eligible for restructuring. Holdout
creditors that had declined to participate in the exchanges
commenced numerous lawsuits against Argentina in several countries,
including the United States, Italy, Germany, and
Japan.
As a
result of the litigation filed by holdout bondholders and their
related efforts to attach Argentina’s sovereign property
located in the United States and other jurisdictions,
Argentina’s ability to access the international capital
markets was severely limited. In April 2016, the Argentine
government settled USD4.2 billion outstanding principal amount of
untendered debt.
In
2018, due to Argentina’s limited access to the international
capital and lending markets, the Argentine government and the IMF
entered into a “stand-by” arrengment forUSD57.1 billion
principal amount with a 36-month maturity. As of the date of this
annual report, Argentina has received disbursements under the
agreement totaling USD 44.8 billion. Notwithstanding the foregoing,
the Fernández administration has publicly announced that it
will refrain from requesting additional disbursements under this
agreement, and instead vowed to renegotiate its terms and
conditions in good faith.
Shortly
after taking office, the Fernández administration also
initiated negotiations with creditors in order to restructure the
country’s current Peso- and U.S. dollar-denominated public
debt. In this context, on February 5, 2020, the Argentine Congress
passed Law No. 27,544, pursuant to which the sustainability of the
sovereign debt was declared a national priority, authorizing the
Ministry of Economy to renegotiate new terms and conditions with
Argentina’s creditors within certain parameters.
Additionally,
in the midst of debt restructuring negotiations, on April 5, 2020
the Argentine government issued Decree No. 346/2020, through which
the repayment of Argentine law-governed dollar-denominated notes
was postponed.
On
April 21, 2020, the Argentine government launched an exchange offer
with the aim of refinancing its external indebtedness in a manner
which does not compromise the development and potential growth of
Argentina over the next years. On August 17, 2020, the Argentine
government submitted its modified bond restructuring offer to the
SEC. On August 31, 2020, the Argentine government announced the
results of its bond restructuring offer, announcing that holders
owning 93.5% in principal amount of bonds outstanding and that this
participation percentage was subsequently increased to 99% by
virtue of the application of collective action clauses of the
restructured bonds. However, the Argentine government faces the
challenge of restructuring its debt in foreign currency issued
under Argentine law, as well as its debt with the IMF. We cannot
predict the outcome of these negotiations.
Moreover,
difficulties in accessing Argentina’s international credit
may have an impact on our company as the Argentine government
postponed the maturity dates of its bonds, and cut interest
rates.
Foreign shareholders of companies operating in Argentina have
initiated proceedings against Argentina that have resulted and
could result in arbitral awards and/or injunctions against
Argentina and its assets and, in turn, limit its financial
resources.
In
response to the emergency measures implemented by the Argentine
government during the 2001-2002 economic crisis, a number of claims
were filed before the International Centre for Settlement of
Investment Disputes (“ICSID”) against Argentina.
Claimants allege that the emergency measures were inconsistent with
the fair and equitable treatment standards set forth in various
bilateral investment treaties by which Argentina was bound at the
time.
Claimants have also filed claims before arbitral tribunals under
the rules of the United Nations Commission on International Trade
Law (“UNCITRAL”) and under the rules of the
International Chamber of Commerce (“ICC”). As of the
date of this annual report, it is not certain that Argentina will
prevail in having any or all of these cases dismissed, or that if
awards in favor of the plaintiffs are granted, that it will succeed
in having those awards annulled. Ongoing claims before the ICSID
tribunal and other arbitral tribunals could lead to new awards
against Argentina, which could have an adverse effect on our
capacity to access to financing or the international capital
markets.
12
Significant fluctuation in the exchange rate of the Peso against
foreign currencies may adversely affect the Argentine economy as
well as our financial condition and results of
operations.
Fluctuations
in the rates of exchange of the Peso against foreign currencies,
particularly the U.S. dollar, may adversely affect the Argentine
economy, our financial condition and results of operations. In
2017, 2018, 2019 and the first nine months of the year 2020, the
Peso depreciated by approximately 16%, 105%, 59% and 27% against
the U.S. dollar, respectively. Depreciation of the Peso in real
terms can have a negative impact on the ability of Argentine
businesses to honor their foreign currency-denominated debt, and
also lead to very high inflation and significant reduced real
wages. The depreciation of the Peso can also negatively impact
businesses whose success is dependent on domestic market demand,
and adversely affect the Argentine government’s ability to
honor its foreign debt obligations. A substantial increase in the
exchange rate of the Peso against foregin currencies of the Peso
against the U.S. dollar also represents risks for the Argentine
economy since it may lead to a deterioration of the country’s
current account balance and the balance of payments which may have
a negative effect on GDP growth and employment, and reduce the
revenue of the Argentine public sector by reducing tax revenue in
real terms, due to its current heavy dependence on export
taxes.
As a
result of the greater volatility of the Peso, the former
administration announced several measures to restore market
confidence and stabilize the value of the Argentine Peso. Among
them, during 2018, the Argentine government negotiated two
agreements with the IMF, increased interest rates and the Central
Bank decided to intervene in the exchange market in order to
stabilize the value of the Peso. During 2019, based on a new
understanding with the IMF, the Government established new
guidelines for stricter control of the monetary base, which would
remain in place until December 2019, in an attempt to reduce the
amount of Pesos available in the market and reduce the demand for
foreign currency. Complementing these measures, in September 2019
foreign currency controls were reinstated in Argentina. As a
consequence of the re-imposition of exchange controls, the spread
between the official exchange rate and other exchange rates
resulting implicitly from certain common capital markets operations
(“dólar MEP” or “contado con
liquidación”), also known as blue chip swap rate, has
broadened significantly, reaching a value of approximately 90%
above the official exchange rate. As of November 13, 2020, the
official exchange rate was ARS 79.7500 per USD 1.00.
The
success of any measures taken by the Argentine government to
restore market confidence and stabilize the value of the Argentine
Peso is uncertain and the continued depreciation of the Peso could
have a significant adverse effect on our financial condition and
results of operations.
13
Certain measures that may be taken by the Argentine government may
adversely affect the Argentine economy and, as a result, our
business, financial condition and results of
operations.
The Argentine government exercises substantial control over the
economy and may increase its level of intervention in certain areas
of the economy, including through the regulation of market
conditions and prices.
By way
of example, in 2008 the Fernández de Kirchner administration
nationalized and replaced the former private pension system with a
public “pay as you go” pension system. As a result, all
resources administered by the private pension funds, including
significant equity interests in a wide range of listed companies,
were transferred to a separate fund (Fondo de Garantía de
Sustentabilidad, or “FGS”) to be administered by the
National Social Security Administration (Administración
Nacional de la Seguridad Social, or “ANSES”, per its
acronym in Spanish). The dissolution of the private pension funds
and the transfer of their financial assets to the FGS have had
important repercussions on the financing of private sector
companies. Debt and equity instruments which previously could be
placed with pension fund administrators are now entirely subject to
the discretion of the ANSES. Since it acquired equity interests in
privately owned companies through the process of replacing the
pension system, the ANSES is entitled to designate government
representatives to the boards of directors of those entities.
Pursuant to Decree No. 1,278/12, issued by the Executive Branch on
July 25, 2012, the ANSES’s representatives must report
directly to the Ministry of Public Finance are subject to a
mandatory information-sharing regime, under which, among other
obligations, they must immediately inform the Ministry of Public
Finance of the agenda for each meeting of the board of director and
provide related documentation.
Also,
in April 2012, the Fernández de Kirchner administration
decreed the removal of directors and senior officers of YPF S.A.
(“YPF”), the country’s largest oil and gas
company, that at the time was controlled by the Spanish group
Repsol, and submitted a bill to the Argentine Congress to
expropriate shares held by Repsol representing 51% of the total
outstanding equity of YPF. The Argentine Congress approved the bill
in May 2012 through the passage of Law No. 26,741, which declared
the production, industrialization, transportation and marketing of
hydrocarbons to be activities of public interest and fundamental
policies of Argentina, and empowered the Argentine government to
adopt any measures necessary to achieve self-sufficiency in
hydrocarbon supply. In February 2014, the Argentine government and
Repsol announced that they had reached an agreement on the terms of
the compensation payable to Repsol for the expropriation of the YPF
shares. Such compensation totaled USD5 billion payable by delivery
of Argentine sovereign bonds with various maturities. The
agreement, which was ratified by Law No. 26,932, settled the claim
filed by Repsol before the International Centre for Settlement of
Investment Disputes (“ICSID”).
Additionally,
in June 2020, President Alberto Fernández announced a project
to intervene and expropriate the cereal exporting company Vicentin
SAIC (“Vicentin”) under which the national public
administration would take control of, 51% of Vicentin, which is in
creditor competition as a result of the company’s ARS 350
million debt with state-owned Banco Nación, on a total
increase of USD 1.35 billion. However, on June 19, 2020, the holder
of the civil and commercial court, responsible for carrying out
Vicentin’s call for creditors, decided to restore the
company’s original board of directors in office for 60 days
and to give the status of mere oversighters to the interveners
appointed by the administration of Alberto
Fernández.
Historically,
actions of the Argentine government concerning the economy,
including decisions regarding interest rates, taxes, price
controls, wage increases, increased benefits for workers, exchange
controls and potential changes in the market of foreign currency,
have had a substantial adverse effect on Argentina’s economic
growth.
It is
widely reported by private economists that expropriations, price
controls, exchange controls and other direct involvement by the
Argentine government in the economy have had an adverse impact on
the level of investment in Argentina, the access of Argentine
companies to international capital markets and Argentina’s
commercial and diplomatic relations with other countries. If the
level of government intervention in the economy continues or
increases, the Argentine economy and, in turn, our business,
results of operations and financial condition could be adversely
affected.
The Argentine government may mandate salary increases for private
sector employees, which would increase our operating
costs
.
In the
past, the Argentine government has passed laws, regulations and
decrees requiring companies in the private sector to maintain
minimum wage levels and provide specified benefits to employees.
Argentine employers, both in the public and private sectors, have
experienced significant pressure from their employees and labor
organizations to increase wages and to provide additional employee
benefits. Due to high levels of inflation, employees and labor
organizations regularly demand significant wage
increases.
14
Through
Decree No. 610/2019, a staggered increase of the minimum salary was
approved as follows: (i) ARS 14,125 as of August 1, 2019; (ii) ARS
15,625 as of September 1, 2019; and (iii) ARS 16,875 as of October
1, 2019. In addition, the Argentine government has arranged various
measures to mitigate the impact of inflation and exchange rate
fluctuation in wages. In December 2019, Decree No. 34/2019, doubled
legally-mandated severance pay for termination of employment. The
Government went a step further amid the COVID-19 pandemic, and
issued Decree No. 329/2020, restricting the ability to terminate
employment with or without cause for 60 business days, prorogued it
for 60 additional business days by Decree No.624/2020. Also, in
January 2020, the Argentine government issued Decree No. 14/2020
which established a general increase for all employees of ARS 3,000
in January 2020, and an additional amount of ARS 1,000 in February
2020 (total ARS 4,000 effective as of February 2020).
It is
possible that the Argentine government could adopt measures
mandating further salary increases or the provision of additional
employee benefits in the future. Any such measures could have a
material and adverse effect on our business, results of operations
and financial condition.
Property values in U.S. dollars in Argentina could decline
significantly.
Property
values in U.S. dollars are influenced by multiple factors that are
beyond our control, such as a decreased demand for real estate
properties due to a deterioration of macroeconomic conditions or an
increase in supply of real estate properties that could adversely
affect the value in U.S. dollars of real estate properties. We
cannot assure you that property values in U.S. dollars will
increase or that they will not be reduced. Most of the properties
we own are located in Argentina. As a result, a reduction in the
value in U.S. dollars of properties in Argentina could materially
affect our business and our financial statements due to the
valuation of our investment properties at fair market value in U.S.
dollars.
Restrictions on transfers of foreign currency and the repatriation
of capital from Argentina may impair our ability to pay dividends
and distributions and investors may face restrictions on their
ability collect capital and interest payments in connection with
corporate bonds issued by Argentine companies.
On
September 1, 2019, the BCRA issued Communication “A”
6,770, which established various rules for exports of goods and
services, imports of goods and services, foreign assets,
non-resident operations, financial debt, debts between residents,
profits and dividends, and information systems. The Communication
was issued in response to the publication of Decree 609/2019,
pursuant to which the Argentine government implemented foreign
exchange regulations until December 31, 2019. Decree 609/2019 sets
forth the obligation to convert the value of goods and services
exported into Pesos in the local financial system, in accordance
with terms and conditions established by the BCRA.
Additionally,
on December 5, 2019 the BCRA issued Communication “A”
6,844, setting forth the consolidated set of rules governing
foreign trade and exchange (“Exterior y Cambios” in
Spanish).
Among
other restrictions, Communication “A” 6,844 requires
prior authorization from the BCRA for the pre-cancelation of debts
corresponding to imports of goods and services. For overdue or
on-demand debts for the import of goods with related parties abroad
outstanding as of August 31, 2019, the importer must request
authorization from the BCRA if the debts exceed USD2 million per
month. BCRA authorization is also required for payments of services
with related parties abroad. Prior authorization from the BCRA is
required for the “constitution of foreign assets”
(e.g., purchase of foreign currency, among others) by legal
entities, local governments, mutual funds, trusts and other
vehicles. Additionally, individuals must request authorization from
the BCRA for the “formation of foreign assets,” family
aid and the granting of guarantees in derivative transactions, when
those items exceed USD200 in the calendar month, among other
circumstances.
With
respect to financial debt, borrowers must enter and settle in the
foreign exchange market new financial debts from abroad that are
disbursed from September 1, 2019. Compliance with this requirement
must be proved to access the foreign exchange market and cancel the
principal and interest. Communication “A” 6,844 also
requires companies to obtain prior authorization from the BCRA
before transferring profits and dividends abroad, as a general
rule.
Likewise,
Communication “A” 6,854, issued on December 27, 2019
established that rules incorporated into the consolidated text of
the regulations on foreign trade and exchange other than those
applicable for export of goods and services, as set forth in
Communication “A” 6,844, shall remain in full force and
effect as from December 31, 2019.
15
Subsequently,
the BCRA issued Communication “A” 7,030, through which
it established that for the purpose of accessing the exchange
market for the realization of certain transactions such as (i)
payment of imports and other purchases of goods abroad, (ii)
purchase of foreign currency by residents with specific
application, (iii) payment of profits and dividends, (iv) payment
of capital and interest on financial indebtedness, among others,
the entity shall have the prior consent of the BCRA unless it has
an affidavit from the client stating that at the time of access to
the exchange market: (i) all of its foreign currency holdings in
the country are deposited in accounts in financial institutions and
that it does not have liquid external assets available; and (ii)
undertakes to liquidate on the exchange market, within five working
days of its making available, those funds that it receives abroad
arising from the collection of loans granted to third parties, the
collection of a term deposit or the sale of any type of asset,
where those funds have been acquired after May 28
2020.
On the
other hand, the Communication provides that until June 30, 2020 (a
period subsequently extended until July 31, 2020, by Communication
“A” 7052) when accessing the market for payment of
imports of goods or for the cancellation of debts arising from the
import of goods, the BCRA must pre-approve the transaction unless
the entity has: (i) a customer's affidavit stating that the total
amount of payments associated with its imports of goods during 2020
does not exceed the amount by which the importer would have access
to the exchange market that was officialized between January 1,
2020 and the day leading up to accessing the exchange market; and
(ii) documentation that allows the company in question to verify
compliance with the remaining requirements established for the
operation by the exchange regulations.
At the
same time, the Communication provides that until June 30, 2020 (a
period subsequently extended until July 31, 2020, by Communication
“A” 7,052) - prior approval of the BCRA will be
required for access to the foreign market for the cancellation of
financial indebtedness principal services with the foreign sector
where the creditor is a counterparty linked to the
debtor.
As for
transactions corresponding to foreign market outflows, the
Communication amends from 30 to 90 days the period within which (i)
no sales of securities with liquidation in foreign currency or
transfers thereof to foreign entities can be performed, and (ii) no
local sales of securities with liquidation in foreign currency or
transfers thereof to entities abroad can be performed, in this
case, counted from the moment the foreign market was
accessed.
Finally,
on September 15, 2020, Communication “A” 7,106
established that companies must refinance maturities of financial
debt principal in the period from October 15, 2020 to March 31,
2021. In this sense, the Central Bank will give access to companies
for up to 40% of maturities and companies must refinance the rest
within at least two years or should be cancelled using currency
already in possession of the Company. Furthermore, Resolution No.
862/2020 of the CNV established a three-day “parking”
requirement for both transfers of securities from local accounts
abroad. As a result of all the exchange restrictions mentioned and
all those that may be issued in the future by the BCRA in the
context of the exercise of its powers, it is clarified that there
may be potential “holdouts” in the context of the
restructurings that Argentine companies are obliged to carry out
with the consequent possible claims. The Central Bank measure,
would, in many cases, result in non-compliance or a default on
corporate debt denominated in U.S. dollars. It will be a challenge
for issuers of corporate debt denominated in U.S. dollars to fully
quantify the implications of Communication “A” 7,106.
In order to fulfill the requirements of this regulation, a
refinancing plan for financial debt due for registration until
December 31, 2020 must be submitted to the Argentine Central Bank
before September 30, 2020. For maturities to be registered between
January 1, 2021 and March 31, 2021, the plan must be submitted at
least 30 calendar days prior to the maturity of the principal to be
refinanced, which implies a risk to obtain financing for new
productive projects. As a consequence, there could be an increase
in the spreads of corporate bonds. In addition, since June 2020,
through Communication “A” 7,030, companies could no
longer access to the MULC to cancel financial debt between
companies in advance. It is also noted that such possible proposals
for restructurings will fully comply with the requirements
established by the applicable and current regulations, as long as
the non-compliance brings the application of the foreign exchange
criminal law to the members of our board of directors.
16
As of
the date of this annual report, the restrictions outlined above
remain in place. Such measures may negatively affect
Argentina’s international competitiveness, discouraging
foreign investments and lending by foreign investors or increasing
foreign capital outflow which could have an adverse effect on
economic activity in Argentina, and which in turn could adversely
affect our business and results of operations. Any restrictions on
transferring funds abroad imposed by the government could undermine
our ability to pay dividends on our ADSs in U.S. dollars.
Furthermore, these measures may cause delays or impose restrictions
on the ability to collect payments of capital and interest on bonds
issued by us. The challenge will be to achieve acceptance by
creditors, in accordance with the BCRA regulations mentioned above,
especially when it has highly diversified and retail
creditors.
The Argentine economy could be adversely affected by economic
developments in other global markets.
Argentina’s
economy is vulnerable to external shocks that could be caused by
adverse developments affecting its principal trading partners. A
significant decline in the economic growth of any of
Argentina’s major trading partners (including Brazil, the
European Union, China and the United States), including as a result
of the ongoing COVID-19 pandemic, could have a material adverse
impact on Argentina’s balance of trade and adversely affect
Argentina’s economic growth. In addition, Argentina may be
affected by economic and market conditions in other markets
worldwide, as was the case in 2008-2009, when the global financial
crisis led to a significant economic contraction in Argentina in
2009.
Since
2015, the Brazilian economy, Argentina’s largest export
market and the principal source of imports, has experienced
heightened negative pressure due to the uncertainties stemming from
the ongoing political crisis, including the impeachment of
Brazil’s president, which resulted in the Senate of Brazil
removing Dilma Rousseff from office for the rest of her term on
August 31, 2016. Michel Temer, who previously held office as vice
president of Brazil, subsequently took office until the end of the
presidential period and in October 2018, Jair Bolsonaro was elected
president. Mr. Bolsonaro has libertarian, conservative and
nationalist tendenciesand assumed office on January 1, 2019. Given
that Brazil is the largest economy in Latin America, the economic
measures it implements can have great impact in the region. A
further deterioration in economic conditions in Brazil may reduce
the demand for Argentine exports to the neighboring country and, if
this occurs, it could have a negative effect on the Argentine
economy and potentially on our operations.
In
addition, financial and securities markets in Argentina have been
influenced by economic and market conditions in other markets
worldwide. Although economic conditions vary from country to
country, investors’ perceptions of events occurring in other
countries have in the past substantially affected, and may continue
to substantially affect, capital flows into, and investments in
securities from issuers in, other countries, including Argentina.
International investors’ reactions to events occurring in one
market sometimes demonstrate a “contagion” effect in
which an entire region or class of investment is disfavored by
international investors.
The
Argentine financial system and securities markets could be also
adversely affected by events in developed countries’
economies, such as the United States and Europe. On June 23, 2016,
the United Kingdom voted in favor of the United Kingdom exiting the
European Union (“Brexit”). The United Kingdom formally
left the European Union on January 31, 2020. Even when the United
Kingdom agreed its departure from the European Union, negotiations
on the terms and conditions are expected to continue during the
transition period, which is due to expire on December 31, 2020. The
effects of the Brexit vote and the perceptions as to the impact of
the withdrawal of the United Kingdom from the European Union may
adversely affect business activity and economic and market
conditions in the United Kingdom, the Eurozone and globally, and
could contribute to instability in global financial and foreign
exchange markets. In addition, Brexit could lead to additional
political, legal and economic instability in the European Union and
have a negative impact on the commercial exchange of Argentina with
that region.
17
On
November 8, 2016, Donald Trump was elected president of the United
States. His presidency has created significant uncertainty about
the future relationships between the United States and other
countries, including with respect to the trade policies, treaties,
government regulations and tariffs that could apply to trade
between the United States and other nations. On November 3, 2020,
presidential elections took place in the United States. Former Vice
President Joseph R. Biden Jr. is the Democratic nominee to
challenge President Trump. Finally, on November 7, 2020, Democrat
Joe Biden has been declared president-elect, but President Donald
Trump is still planning legal challenges to the results in some key
states.President-elect Biden now has 279 electoral college votes,
taking him past the 270 needed to win. Donald Trump has 214. Mr
Biden will become the 46th president in January 2021, pending the
outcome of any legal challenges. We cannot predict how Mr.
Biden’s measures will evolve or how they may affect
Argentina, nor will the effect that the same or any other measure
taken by the Biden administration could cause on global economic
conditions and the stability of global financial
markets.
In July
2019, the Common Market of the South (“MERCOSUR”)
signed a strategic partnership agreement with the European Union
(the “EU”), which is expected to enter into force in
2021, once approved by the relevant legislatures of each member
country. The objective of this agreement is to promote investments,
regional integration, increase the competitiveness of the economy
and achieve an increase in GDP. However, the effect that this
agreement could have on the Argentine economy and the policies
implemented by the Argentine government is uncertain. Recently, in
October 2020, The European Parliament passed a non-binding
resolution opposing the ratification of the trade agreement between
the European Union and Mercosur due to concerns over the
environmental policy of the Jair Bolsonaro government.
Changes
in social, political, regulatory and economic conditions in other
countries or regions, or in the laws and policies governing foreign
trade, could create uncertainty in the international markets and
could have a negative impact on emerging market economies,
including the Argentine economy. Also, if these countries fall into
a recession, the Argentine economy would be impacted by a decline
in its exports, particularly of its main agricultural commodities.
All of these factors could have a negative impact on
Argentina’s economy and, in turn, our business, financial
condition and results of operations.
Furthermore,
the financial markets have also been affected by the oil production
crisis in March 2020 arising from the OPEC’s failure to
reduce production. Any of these factors could depress economic
activity and restrict our access to suppliers and could have a
material adverse effect on our business, financial condition and
results of operations.
A
decline in the international prices for Argentina’s main
commodity exports could have an adverse effect on Argentina’s
economic growth, which could adversely affect our business,
financial condition and results of operations.
High
commodity prices contributed to the increase in Argentine exports
and to high government tax revenue from export withholdings.
Consequently, the Argentine economy has remained relatively
dependent on the price of its main agricultural products, primarily
soy. This dependence has rendered the Argentine economy more
vulnerable to commodity prices fluctuations.
A
continuous decline in international prices of Argentina’s
main commodity exports could have a negative impact on the levels
of government revenue and the government’s ability to service
its sovereign debt, and could either generate recessionary or
inflationary pressures, depending on the government’s
reaction. Either of these results would adversely impact
Argentina’s economy and, therefore, our business, results of
operations and financial condition.
Failure
to adequately address actual and perceived risks of institutional
deterioration and corruption may adversely affect the Argentine
economy and financial condition, which in turn could adversely
affect our business, financial condition and results of
operations.
The
lack of a solid institutional framework and the notorious incidents
of corruption that have been identified as a significant problem
for Argentina present meaningful challenges to a robust economic
recovery. The Argentine economy is sensitive to local political
events. Such political events could generate uncertainty and be
adverse for the development of a stable market for business in the
country, which could affect the Argentine economy and, indirectly,
the business, results of operations and financial situation of the
Company.
18
Likewise,
institutional deterioration and corruption may adversely affect
Argentina’s economy and financial situation, which in turn
could adversely affect the business, equity and financial situation
and results of the Company’s operations.
The
absence of a solid institutional framework and corruption have been
pointed out as an important problem for Argentina and continue to
be. Recognizing that the failure to address these issues could
increase the risk of political instability, distort decision-making
processes and adversely affect Argentina’s international
reputation and ability to attract foreign investment, the former
Macri administration adopted several measures aimed at
strengthening Argentina’s institutions and curbing
corruption. These measures include the reduction of criminal
sentences in exchange for cooperation with the government in
corruption investigations, increased access to public information,
the seizing of assets from corrupt officials, increasing the powers
of the Anticorruption Office (Oficina Anticorrupción) and the
passing of a new public ethics law, among others. The
Fernández administration’s ability and determination to
implement these initiatives taken by the former administration is
uncertain, as it would require, among other things, the involvement
of the judicial branch, which is independent, as well as
legislative support.
We
cannot guarantee that the implementation of these measures will be
successful or if implemented that such measures will have the
intended outcomes.
A decline in the international prices for Argentina’s main
commodity exports could have an adverse effect on Argentina’s
economic growth, which could adversely affect our business,
financial condition and results of operations.
Argentina’s
financial recovery from the 2001-2002 crisis occurred in a context
of price increases for Argentina’s commodity exports. High
commodity prices contributed to the increase in Argentine exports
since the third quarter of 2002 and to high government tax revenue
from export withholdings. Consequently, the Argentine economy has
remained relatively dependent on the price of its main agricultural
products, primarily soy. This dependence has rendered the Argentine
economy more vulnerable to commodity prices
fluctuations.
A
continuous decline in international prices of Argentina’s
main commodity exports could have a negative impact on the levels
of government revenues and the government’s ability to
service its sovereign debt, and could either generate recessionary
or inflationary pressures, depending on the government’s
reaction. Either of these results would adversely impact
Argentina’s economy and, therefore, our business, results of
operations and financial condition.
Failure to adequately address actual and perceived risks of
institutional deterioration and corruption may adversely affect the
Argentine economy and financial condition, which in turn could
adversely affect our business, financial condition and results of
operations
.
The
lack of a solid institutional framework and the notorious incidents
of corruption that have been identified as a significant problem
for Argentina present meaningful challenges to a robust economic
recovery. The Argentine economy is sensitive to local political
events. Such political events could generate uncertainty and be
adverse for the development of a stable market for business in the
country, which could affect the Argentine economy and, indirectly,
the business, results of operations and financial situation of the
Company.
Likewise,
institutional deterioration and corruption may adversely affect
Argentina’s economy and financial situation, which in turn
could adversely affect the business, equity and financial situation
and results of the Company’s operations.
19
The
absence of a solid institutional framework and corruption have been
pointed out as an important problem for Argentina and continue to
be. Recognizing that the failure to address these issues could
increase the risk of political instability, distort decision-making
processes and adversely affect Argentina’s international
reputation and ability to attract foreign investment, the former
Macri administration adopted several measures aimed at
strengthening Argentina’s institutions and curbing
corruption. These measures include the reduction of criminal
sentences in exchange for cooperation with the government in
corruption investigations, increased access to public information,
the seizing of assets from corrupt officials, increasing the powers
of the Anticorruption Office (Oficina Anticorrupción) and the
passing of a new public ethics law, among others. The
Fernández administration’s ability and determination to
implement these initiatives taken by the former administration is
uncertain, as it would require, among other things, the involvement
of the judicial branch, which is independent, as well as
legislative support.
We
cannot guarantee that the implementation of these measures will be
successful or if implemented that such measures will have the
intended outcomes.
Our internal policies and procedures might not be sufficient to
guarantee compliance with anti-corruption and anti-bribery laws and
regulations.
Our
operations are subject to various anti-corruption and anti-bribery
laws and regulations, including the Corporate Criminal Liability
Law and the U.S. Foreign Corrupt Practices Act of 1977 (the
“FCPA”). Both the Corporate Criminal Liability Law and
the FCPA impose liability against companies who engage in bribery
of government officials, either directly or through intermediaries.
The anti-corruption laws generally prohibit providing anything of
value to government officials for the purposes of obtaining or
retaining business or securing any improper business advantage. As
part of our business, we may deal with entities in which the
employees are considered government officials. We have a compliance
program that is designed to manage the risks of doing business in
light of these new and existing legal and regulatory
requirements.
Although
we have internal policies and procedures designed to ensure
compliance with applicable anti-corruption and anti-bribery laws
and regulations, there can be no assurance that such policies and
procedures will be sufficient. Violations of anti-corruption laws
and sanctions regulations could lead to financial penalties being
imposed on us, limits being placed on our activities, our
authorizations and licenses being revoked, damage to our reputation
and other consequences that could have a material adverse effect on
our business, results of operations and financial condition.
Further, litigations or investigations relating to alleged or
suspected violations of anti-corruption laws and sanctions
regulations could be costly.
On July
30, 2020, the Executive Branch introduced a bill to the Senate
related to a proposed reform of the Judiciary. The project provides
for, among other issues: (i) the merger of 12 federal criminal
courts with 11 courts with jurisdiction over economic criminal
matters, doubling to reach 46 courts in the Federal Criminal
judicial system, which will be located in the City of Buenos Aires,
(ii) a system of surrogacy to fill in the new courts with the
intervention of the National Chamber of Appeal in Criminal and
Correctional matters, the Council of the Magistracy and the Senate,
(iii) the unification of the appeals chambers and the expansion of
the justice system with the creation of new oral courts,
prosecutor’s offices and defense offices, and (v) the merger
of the Federal Civil and Commercial jurisdiction with the
Administrative Litigation.
Risks Relating to Brazil
The Brazilian government has exercised, and continues to exercise,
significant influence over the Brazilian economy, which, together
with Brazilian political and economic conditions, may adversely
affect us.
We may
be adversely affected by the following factors, as well as the
Brazilian federal government’s response to these
factors:
●
the ongoing
COVID-19 pandemic and any future epidemics, pandemics or disease
outbreaks;
●
economic and social
instability;
●
increase in
interest rates;
●
exchange controls
and restrictions on remittances abroad;
●
restrictions and
taxes on agricultural exports;
20
●
exchange rate
fluctuations;
●
inflation;
●
volatility and
liquidity in domestic capital and credit markets;
●
expansion or
contraction of the Brazilian economy, as measured by GDP growth
rates;
●
allegations of
corruption against political parties, elected officials or other
public officials, including allegations made in relation to the
Lava Jato investigation;
●
government policies
related to our sector; and
●
fiscal or monetary
policy and amendments to tax legislation; and other political,
diplomatic, social or economic developments in or affecting
Brazil
.
Historically, the
Brazilian government has frequently intervened in the Brazilian
economy and has occasionally made significant changes in economic
policies and regulations, including, among others, the imposition
of new, changes in monetary, fiscal and tax policies, currency
devaluations, capital controls and limits on imports.
The
Brazilian economy has been experiencing a slowdown – GDP
growth rates were 3.9%, 1.8%, 2.7% and 0.1%, in 2011, 2012, 2013
and 2014, respectively, and GDP decreased 3.8% in 2015 and 3.6% in
2016 and increased 1.0% in 2017, 1.1% in 2018 and 1.1% in
2019.
As a
result of investigations carried out in connection with the
Lava Jato
(Car Wash)
operation into corruption in Brazil, a number of senior
politicians, including congressmen, and executive officers of some
of the major state-owned companies in Brazil have resigned or been
arrested, while others are being investigated for allegations of
unethical and illegal conduct. The matters that have come, and may
continue to come, to light as a result of, or in connection with,
the
Lava Jato
operation and
other similar operations have adversely affected, and we expect
that they will continue to adversely affect, the Brazilian economy,
markets and trading prices of securities issued by Brazilian
issuers in the near future.
Furthermore, the
Brazilian economy continues to be subject to the effects of the
outcome of the impeachment proceedings against former President
Dilma Rousseff. On August 31, 2016, after a trial by the Senate,
the former President was formally charged. Vice President Michel
Temer was sworn in as the new President of Brazil until the next
presidential elections, which were held in 2018 and from which Jair
Bolsonaro emerged as the new President.
The
ultimate outcome of these investigations is uncertain, but they
have already had an adverse effect on the image and reputation of
the implicated companies, and on the general market perception of
the Brazilian economy, the political environment and the Brazilian
capital markets. The development of these investigations has
affected and may continue to adversely affect us. We cannot predict
if these investigations will bring further political or economic
instability to Brazil, or if new allegations will be raised against
high-level members of the Brazilian federal government. In
addition, we cannot predict the results of these investigations,
nor their effects on the Brazilian economy.
Since
assuming office, the government of President Jair Bolsonaro has
implemented a series of right-wing policies. Measures include the
the approval of the sale of 700,000 state-owned properties,
increases in the minimum wage, transfer of the agrarian reform
duties from the National Indigenous Foundation (FUNAI) to the
Ministry of Agriculture, easing of restrictions for possession of
firearms in Brazil and reduction of the educational budget for
universities and federal institutes. The President of Brazil has
the power to determine government policies and actions related to
the Brazilian economy and, consequently, the operations and
financial performance of companies, including ours, may be
affected.
21
Inflation, coupled with the Brazilian government’s measures
to fight inflation, may hinder Brazilian economic growth and
increase interest rates, which could have a material adverse effect
on us.
Brazil
has in the past experienced significantly high rates of inflation.
As a result, the Brazilian government adopted monetary policies
that have often resulted in high interest rates. The Central
Bank’s Monetary Policy Committee (
Comitê de Política Monetária do
Banco Central
, or COPOM), establishes an official interest
rate target for the Brazilian financial system based on the level
of economic growth, inflation rate and other economic indicators in
Brazil. As of June 30, 2020, the SELIC rate was 2.25% per year. The
inflation rates, as measured by the General Market Price Index
(
Índice Geral de
Preços–Mercado
, or IGP-M), and calculated by
Fundação Getúlio
Vargas
, or FGV, were 10.54% in 2015, 7.18% in 2016, (0.52)%
in 2017, 7.54% in 2018 and 7.30% in 2019. Cumulative inflation for
the first nine months of 2020, calculated by the same index, was
1.34%.
Inflation and the
government measures to fight inflation have had and may continue to
have significant effects on the Brazilian economy and our business.
In addition, the Brazilian government’s measures to control
inflation have often included maintaining a tight monetary policy
with high interest rates, thereby restricting the availability of
credit and slowing economic growth. On the other hand, an easing of
monetary policies of the Brazilian government may trigger increases
in inflation. In the event of an increase in inflation, we may not
be able to adjust our daily rates to offset the effects of
inflation on our cost structure, which may materially and adversely
affect us.
An
increase in interest rates may have a significant adverse effect on
us. In addition, as of June 30, 2020, certain of our loans were
subject to interest rate fluctuations, such as the Brazilian
long-term interest rate (
Taxa de
Juros de Longo Prazo
, or TJLP), and the interbank deposit
rate (
Certificados de
Depósitos Interbancários
, or CDI). In the event of
an abrupt increase in interest rates, our ability to comply with
our financial obligations may be materially and adversely
affected.
A deterioration in general economic and market conditions or the
perception of risk in other countries, principally in emerging
countries or the United States, may have a negative impact on the
Brazilian economy and us.
Economic and market
conditions in other countries, including United States and Latin
American and other emerging market countries, may affect the
Brazilian economy and the market for securities issued by Brazilian
companies. Although economic conditions in these countries may
differ significantly from those in Brazil, investors’
reactions to developments in these other countries may have an
adverse effect on the market value of securities of Brazilian
issuers. Crises in other emerging market countries could dampen
investor enthusiasm for securities of Brazilian issuers, including
ours, which could adversely affect the market price of our common
shares. In the past, the adverse development of economic conditions
in emerging markets resulted in a significant flow of funds out of
the country and a decrease in the quantity of foreign capital
invested in Brazil. Changes in the prices of securities of public
companies, lack of available credit, reductions in spending,
general slowdown of the global economy, exchange rate instability
and inflationary pressure may adversely affect, directlyor
indirectly, the Brazilian economy and securities market. Global
economic downturns and related instability in the international
financial system have had, and may continue to have, a negative
effect on economic growth in Brazil. Global economic downturns
reduce the availability of liquidity and credit to fund the
continuation and expansion of business operations
worldwide.
In
addition, the Brazilian economy is affected by international
economic and market conditions generally, especially economic
conditions in the United States. Share prices on B3 S.A. –
Brasil, Bolsa, Balcão, or B3, for example, have historically
been sensitive to fluctuations in U.S. interest rates and the
behavior of the major U.S. stock indexes. An increase in interest
rates in other countries, especially the United States, may reduce
global liquidity and investors’ interest in the Brazilian
capital markets, adversely affecting the price of our common
shares.
22
The imposition of restrictions on acquisitions of agricultural
properties by foreign nationals may materially restrict the
development of our business.
In
August 2010, the then-president of Brazil approved the opinion of
the Federal Attorney General affirming the constitutionality of
Brazilian Law No. 5,709/71, which imposes important limitations on
the acquisition and lease of land in Brazil by foreigners and by
Brazilian companies controlled by foreigners. Pursuant to this
legislation, companies that are majority-owned by foreigners are
not permitted to acquire agricultural properties in excess of 100
indefinite exploration modules, or MEI (which are measurement units
adopted by the National Institute of Agrarian Development
(
Instituto Nacional de
Colonização e Reforma Agrária
, or INCRA),
within different Brazilian regions, and which range from five to
100 hectares) absent the prior approval of the Brazilian Congress,
while the acquisition of areas measuring less than 100 MEIs by such
companies requires the prior approval of INCRA. In addition,
agricultural areas that are owned by foreigners or companies
controlled by foreigners shall not exceed 25% of the surface area
of the relevant municipality, of which area up to 40% shall not
belong to foreigners or companies controlled by foreigners of the
same nationality, meaning that the sum of agricultural areas that
belong to foreigners or companies controlled by foreigners of the
same nationality shall not exceed 10% of the surface area of the
relevant municipality. In addition, INCRA is also required to
verify if the agricultural, cattle-raising, industrial or
colonization projects to be developed in such areas were previously
approved by the relevant authorities. After that analysis, INCRA
will issue a certificate allowing the acquisition or rural lease of
the property. The purchase and/or rural lease of agricultural
properties that do not comply with the aforementioned requirements
need to be authorized by the Brazilian Congress. In both cases, it
is not possible to determine an estimated time frame for the
approval procedure, since at the date of this annual report, there
are no known cases on the grating of such
certificates.
On June
30, 2020, approximately 58.4% of Brasilagro’s common shares
were held by foreigners. Bearing that in mind, the implementation
of Law No. 5,709/71 may impose on us additional procedures and
approvals in connection with future acquisitions of land, which may
result in material delays and/or our inability to obtain required
approvals. There is also a case pending on the Supreme Court
(
Supremo Tribunal Federal
,
or STF) on the Opinion No. 461/2012-E, issued by São
Paulo’s General Controller of Justice (
Corregedoria Geral de Justiça do Estado
de São Paulo
), which has established that entities
providing notary and registrar services located in the State of
São Paulo are exempt from observing certain restrictions and
requirements imposed by Law No. 5,709/71 and Decree No. 74,965/74.
Moreover, on April 16, 2015, the Brazilian Rural Society filed a
claim for the acknowledgment of non-compliance with basic
principles (ADPF) under certain provisions of the Brazilian
Constitution with the Supreme Court in order to (i) rule that
paragraph 1, article 1, of Law No. 5,709/71 was repealed by the
1988 Federal Constitution and (ii) reverse the opinion issued by
the Federal Attorney General (AGU) of 2010. As of the date hereof,
we are not able to provide an estimate of the timeframe for a final
judgment to be issued by the STF in both cases.
Depending on the
final decisions of these pending lawsuits, we may need to modify
our business strategy and intended practices in order to be able to
acquire agricultural properties. This might have the effect of
increasing the number of transactions we must complete, which would
increase our transaction costs. It might also require the execution
of joint ventures or shareholder agreements, which increases the
complexity and risks associated with such
transactions.
Any
regulatory limitations and restrictions could materially limit our
ability to acquire agricultural properties, increase the
investments, transaction costs or complexity of such transactions,
or complicate the regulatory procedures required, any of which
could materially and adversely affect us and our ability to
successfully implement our business strategy. For more information,
see“Item 4—Information on the Company—Business
Overview—Ownership of Agricultural Land in Brazil by
Foreigners.”
23
We are subject to extensive environmental regulation that may
significantly increase the company’s
expenses.
Our
business activities in Brazil are subject to extensive federal,
state and municipal laws and regulations concerning environmental
protection, which impose on us various environmental obligations,
such as environmental licensing requirements, minimum standards for
the release of effluents, use of agrochemicals, management of solid
waste, protection of certain areas (legal reserve and permanent
preservation areas), and the need for a special authorization to
use water, among others. The failure to comply with such laws and
regulations may subject the violator to administrative fines,
mandatory interruption of activities and criminal sanctions, in
addition to the obligation to rectify damages and pay environmental
and third-party damage compensation, without any caps. In addition,
Brazilian environmental law adopts a joint and several and strict
liability system for environmental damages, which makes the
polluter liable even in cases where it is not negligent and would
render us jointly and severally liable for the obligations of our
contractors or off-takers. If we become subject to environmental
liabilities, any costs we may incur to rectify possible
environmental damage would lead to a reduction in our financial
resources, which would otherwise remain at our disposal for current
or future strategic investment, thus causing an adverse impact on
our business, financial condition and results of
operations.
As
environmental laws and their enforcement become increasingly
stricter, our expenses for complying with environmental
requirements are likely to increase in the future. Furthermore, the
possible implementation of new regulations, changes in existing
regulations or the adoption of other measures could cause the
amount and frequency of our expenditures on environmental
preservation to vary significantly compared to present estimates or
historical costs. Any unplanned future expenses could force us to
reduce or forego strategic investments and as a result could
materially and adversely affect our business, financial condition
and results of operations.
Risks Relating to other Countries Where We Operate
Our business is dependent on economic conditions in the countries
where we operate or intend to operate.
We have
made investments in farmland in Argentina, Brazil, Paraguay and
Bolivia and we may possibly make investments in other countries in
and outside Latin America, as Israel and United States, among
others. Owing that demand for livestock and agricultural products
is usually correlated to economic conditions prevailing in the
local market, whichin turn is dependent on the macroeconomic
condition of the country in which the market is located, our
financial condition and results of operations are, to a
considerable extent, dependent upon political and economic
conditions prevailing from time to time in the countries where we
operate. Latin American countries have historically experienced
uneven periods of economic growth, as well as recession, periods of
high inflation and economic instability. Certain countries have
experienced severe economic crises, which may still have future
effects. As a result, governments may not have the necessary
financial resources to implement reforms and foster growth. Any of
these adverse economic conditions could have a material adverse
effect on our business.
We face the risk of political and economic crises, instability,
terrorism, civil strife, expropriation and other risks of doing
business in emerging markets.
In
addition to Argentina and Brazil, we conduct or intend to conduct
our operations in other Latin American countries such as Paraguay
and Bolivia, and other countries such as Israel, among others.
Economic and political developments in the countries in which we
operate, including future economic changes or crisis (such as
inflation or recession), government deadlock, political
instability, terrorism, civil strife, changes in laws and
regulations, expropriation or nationalization of property, and
exchange controls could adversely affect our business, financial
condition and results of operations.
In
particular, fluctuations in the economies of Argentina and Brazil
and actions adopted by the governments of those countries have had
and may continue to have a significant impact on companies
operating in those countries, including us. Specifically, we have
been affected and may continue to be affected by inflation,
increased interest rates, fluctuations in the value of the
Argentine Peso and Brazilian Real against foreign currencies, price
and foreign exchange controls, regulatory policies, business and
tax regulations and in general by the political, social and
economic scenarios in Argentina and Brazil and in other countries
that may affect Argentina and Brazil.
Although
economic conditions in one country may differ significantly from
another country, we cannot assure that events in one only country
will not adversely affect our business or the market value of, or
market for, our common shares and/or ADSs.
24
Governments in the countries where we operate or intend to operate
exercise significant influence over their economies.
Emerging
market governments, including governments in the countries where we
operate, frequently intervene in the economies of their respective
countries and occasionally make significant changes in monetary,
credit, industry and other policies and regulations. Governmental
actions to control inflation and other policies and regulations
have often involved, among other measures, price controls, currency
devaluations, capital controls and limits on imports. Our business,
financial condition, results of operations and prospects may be
adversely affected by changes in government policies or
regulations, including factors, such as:
●
exchange rates and
exchange control policies;
●
inflation
rates;
●
labor
laws;
●
economic
growth;
●
currency
fluctuations;
●
monetary
policy;
●
liquidity and
solvency of the financial system;
●
limitations on
ownership of rural land by foreigners;
●
developments in
trade negotiations through the World Trade Organization or other
international organizations;
●
environmental
regulations;
●
restrictions on
repatriation of investments and on the transfer of funds
abroad;
●
expropriation or
nationalization;
●
import/export
restrictions or other laws and policies affecting foreign trade and
investment;
●
price controls or
price fixing regulations;
●
restrictions on
land acquisition or use or agricultural commodity
production
●
interest
rates;
●
tariff and
inflation control policies;
●
import duties on
information technology equipment;
●
liquidity of
domestic capital and lending markets;
●
electricity
rationing;
●
tax
policies;
●
armed conflict or
war declaration; and
●
other political,
social and economic developments, including political, social or
economic instability, in or affecting the country where each
business is based.
Uncertainty
on whether governments will implement changes in policy or
regulation affecting these or other factors in the future may
contribute to economic uncertainty and heightened volatility in the
securities markets, which may have a material and adverse effect on
our business, results of operations and financial condition. In
addition, an eventual reduction of foreign investment in any of the
countries where we operate may have a negative impact on such
country’s economy, affecting interest rates and the ability
of companies to access financial markets.
25
Local currencies used in the conduct of our business are subject to
exchange rate volatility and exchange controls.
The
currencies of many Latin American countries have experienced
substantial volatility in recent years. Currency movements, as well
as higher interest rates, have materially and adversely affected
the economies of many Latin American countries, including countries
in which account for or are expected to account for a significant
portion of our revenues. The depreciation of local currencies
creates inflationary pressures that may have an adverse effect on
us generally, and may restrict access to international capital
markets. On the other hand, the appreciation of local currencies
against the U.S. Dollar may lead to deterioration in the balance of
payments of the countries where we operate, as well as to a lower
economic growth.
In
2015, the U.S. dollar to the peso exchange rate increased 53% as
compared to 2014. In 2016, the U.S. dollar to peso exchange rate
increased 22% as compared to 2015. In 2017, the U.S. dollar to peso
exchange rate increased 18% as compared to 2016. In 2018, the U.S.
dollar to peso exchange rate increased 100% as compared to 2017.
Since In 2019, the U.S. dollar to the peso exchange rate increased
59% compared to 2018 and so far in 2020 it increased by 31%.We
cannot predict future fluctuations in the exchange rate of the
Argentine Peso or whether the Argentine government will change its
currency policy.
Historically,
the Brazilian currency has historically suffered frequent
fluctuations. As a consequence of inflationary pressures, in the
past, the Brazilian government has implemented several economic
plans and adopted a series of exchange rate policies, including
sudden devaluations, periodic mini-devaluations during whichthe
frequency of adjustments has ranged from daily to monthly, floating
exchange rate systems, exchange controls and dual exchange rate
markets. Formally the value of the Real against foreign currencies
is determined under a free-floating exchange rate regime, but in
fact the Brazilian government is currently intervening in the
market, through currency swaps and trading in the spot market,
among other measures, every time the currency exchange rate is
above or below the levels that the Brazilian governmentconsiders
appropriate, taking into account, inflation, growth, the
performance of the Real against the U.S dollar in comparison with
other currencies and other economic factors. Periodically, there
are significant fluctuations in the value of the Real against the
U.S. dollar. During 2019, the Real depreciated 3.6% against the
U.S. dollar and so far in 2020, the Real depreciated 28% against
the U.S.dollar
The
Israeli currency did not suffer important fluctuations during the
last years. During 2019, NIS apreciated 5.3% against the U.S.
dollar. During 2020, it remained the same without significant
fluctuations.
Future
fluctuations in the value of the local currencies relative to the
U.S. dollar in the countries in which we operate may occur, and if
such fluctuations were to occur in one or a combination of the
countries in which we operate, our results of operations or
financial condition could be adversely affected.
Inflation and certain government measures to curb inflation may
have adverse effects on the economies of the countries where we
operate or intend to operate our business and our
operations.
In the
past, high levels of inflation have adversely affected the
economies and financial markets of some of the countries in which
we operate, particularly Argentina and Brazil, and the ability of
their governments to create conditions that stimulate or maintain
economic growth. Moreover, governmental measures to curb inflation
and speculation about possible future governmental measures have
contributed to the negative economic impact of inflation and have
created general economic uncertainty. As part of these measures,
governments have at times maintained a restrictive monetary policy
and high interest rates that has limited the availability of credit
and economic growth.
A
portion of our operating costs in Argentina are denominated in
Argentine Pesos, most of our operating costs in Brazil are
denominated in Brazilian Reais and most of our operating costs in
Israel are nominated in NIS. Inflation in Argentina, Brazil or
Israel without a corresponding Peso, Real or NIS devaluation, could
result in an increase in our operating costs without a commensurate
increase in our revenues, which could adversely affect our
financial condition and our ability to pay our foreign currency
denominated obligations.
26
After
several years of price stability in Argentina, the devaluation of
the Peso in January 2002 imposed pressures on the domestic price
system that generated high inflation throughout 2002. In 2003,
inflation decreased significantly and stabilized. However, in
recent years, encouraged by the pace of economic growth, according
to the Instituto Nacional de Estadisticas y Censos, or
“INDEC” (Argentine Statistics and Census Agency), the
consumer price index increased by 9.5% in 2011, 10.8% in 2012, and
10.9% in 2013; while the wholesale price index increased 10.3% in
2009, 14.6% in 2010, 12.7% in 2011, 13.1% in 2012, 14.7% in 2013
and 28.3% in 2014. The accuracy of the measurements of the INDEC
has been questioned in the past, and the actual consumer price
index and wholesale price index could be substantially higher than
those indicated by the INDEC.
In
February 2014 the INDEC modified the methodology for the
calculation of the consumer price index (“CPI”) and the
gross domestic product. Under the new calculation methodology, the
CPI increased by 23.9% in 2014 and 11.9% as of October 2015 (for
the first nine months of 2015). However, opposition lawmakers
reported an inflation rate of 38.5% and 27.5%, respectively. In
December 2015, the Macri administration appointed a former director
of a private consulting firm to manage the INDEC. The new director
initially suspended the publication of any official data prepared
by INDEC and implemented certain methodological reforms and
adjusted certain indices based on those reforms. In January 25,
2016, INDEC published two alternative measures of the CPI for the
year 2015, 29.6% and 31.6%, which were based on data from the City
of Buenos Aires and the Province of San Luis.
After implementing these methodological reforms in June 2016,
the INDEC resumed its publication of the consumer price
index.
Brazil
has historically experienced high rates of inflation. Inflation, as
well as government efforts to curb inflation, has had significant
negative effects on the Brazilian economy, particularly prior to
1995. Inflation rates were 7.8% in 2007 and 9.8% in 2008, compared
to deflation of 1.7% in 2009, inflation of 11.3% in 2010, inflation
of 5.1% in 2011, inflation of 7.8% in 2012, inflation of 5.5% in
2013, inflation of 3.7% in 2014, inflation of 10.5% in 2015, 7.2%
in 2016, (0.53)% in 2017 and 5.39% for the first six months of
2018, as measured by the General Market Price Index (Indice Geral
de Preços — Mercado), compiled by the Getúlio
Vargas Foundation (Fundação Getúlio Vargas). A
significant proportion of our cash costs and our operating expenses
are denominated in Brazilian Reais and tend to increase with
Brazilian inflation. The Brazilian government’s measures to
control inflation have in the past included maintaining a tight
monetary policy with high interest rates, thereby restricting the
availability of credit and reducing economic growth. This policy
has changed in the last two years, when the Brazilian government
decreased the interest rate by 525 basis points. Subsequently, the
high inflation, arising from the lower interest rate, and the
intention to maintain this rate at low levels, led the Brazilian
government to adopt other measures to control inflation, such as
tax relief for several sectors of the economy and tax cuts for the
products included in the basic food basket. These measures were not
sufficient to control the inflation, which led the Brazilian
government to reinstate a tighter monetary policy. As a result,
interest rates have fluctuated significantly. The Special System
for Settlement and Custody (Sistema Especial de
Liquidação e Custódia, or “SELIC”)
interest rate in Brazil at year-end was 10.0% in 2013, 11.75% in
2014, 14.25% in 2015, 13.75% in 2016, 7% in 2017 and 6.75% in 2018
as determined by the Comitê de Política Monetária,
or COPOM. As of June 30, 2020, the SELIC was 6.00%.
Supply
problems at our farms and processing facilities and impair our
ability to deliver our products to our customers in a timely manner
Argentina and/or Brazil may experience high levels of inflation in
the future, which may impact domestic demand for our products.
Inflationary pressures may also weaken investor confidence in
Argentina and/or Brazil, curtail our ability to access foreign
financial markets and lead to further government intervention in
the economy, including interest rate increases, restrictions on
tariff adjustments to offset inflation, intervention in foreign
exchange markets and actions to adjust or fix currency values,
which may trigger or exacerbate increases in inflation, and
consequently have an adverse impact on us. In an inflationary
environment, the value of uncollected accounts receivable, as well
as of unpaid accounts payable, declines rapidly. If the countries
in which we operate experience high levels of inflation in the
future and price controls are imposed, we may not be able to adjust
the rates we charge our customers to fully offset the impact of
inflation on our cost structures, which could adversely affect our
results of operations or financial condition.
27
Depreciation
of the Peso or the Real relative to the U.S. Dollar or the Euro may
also create additional inflationary pressures in Argentina or
Brazil that may negatively affect us. Depreciation generally
curtails access to foreign financial markets and may prompt
government intervention, including recessionary governmental
policies. Depreciation also reduces the U.S. Dollar or Euro value
of dividends and other distributions on our common shares and the
U.S. Dollar or Euro equivalent of the market price of our common
shares. Any of the foregoing might adversely affect our business,
operating results, and cash flow, as well as the market price of
our common shares.
Conversely,
in the short term, a significant increase in the value of the Peso
or the Real against the U.S. Dollar would adversely affect the
respective Argentine and/or Brazilian government’s income
from exports. This could have a negative effect on GDP growth and
employment and could also reduce the public sector’s revenues
in those countries by reducing tax collection in real terms, as a
portion of public sector revenues are derived from the collection
of export taxes.
Developments in other markets may affect the Latin American
countries where we operate or intend to operate, and as a result
our financial condition and results of operations may be adversely
affected.
The
market value of securities of companies such as us may be, to
varying degrees, affected by economic and market conditions in
other global markets. Although economic conditions vary from
country to country, investors’ perception of the events
occurring in one country may substantially affect capital flows
into and securities from issuers in other countries, including
latin american countries. Various Latin American economies have
been adversely impacted by the political and economic events that
occurred in several emerging economies in recent times.
Furthermore, Latin American economies may be affected by events in
developed economies which are trading partners or that impact the
global economy and adversely affect our activities and the results
of our operations.
Land in Latin American countries may be subject to expropriation or
occupation.
Our
land may be subject to expropriation by the governments of the
countries where we operate and intend to operate. An expropriation
could materially impair the normal use of our lands or have a
material adverse effect on our results of operations. In addition,
social movements, such as
Movimento dos Trabalhadores Rurais Sem Terra
and Comissão Pastoral da Terra in Brazil
, are active in
certain countries where we operate or intend to operate. Such
movements advocate land reform and mandatory property
redistribution by governments. Invasions and occupations of rural
areas by a large number of individuals is common practice for these
movements, and, in certain areas, including some of those in which
we are likely to invest, police protection and effective eviction
proceedings are not available to land owners. As a result, we
cannot assure you that our properties will not be subject to
invasion or occupation. A land invasion or occupation could
materially affect the normal use of our properties or have a
material adverse effect on us or the value of our common shares and
our ADSs.
We may invest in countries other than Argentina and Brazil and
cannot give you any assurance as to the countries in which we will
ultimately invest, and we could fail to list all risk factors for
each possible country.
We have
a broad and opportunistic business strategy therefore we may invest
in countries other than Argentina, Brazil and Israel including
countries in other emerging markets outside Latin America (e.g.,
Africa). As a result, it is not possible at this time to identify
all risk factors that may affect our future operations and the
value of our common shares and ADSs.
Disruption of transportation and logistics services or insufficient
investment in public infrastructure could adversely affect our
operating results.
One of
the principal disadvantages of the agricultural sector in the
countries in which we operate is that key growing regions lie far
from major ports. As a result, efficient access to transportation
infrastructure and ports is critical to the growth of agriculture
as a whole in the countries in which we operate and of our
operations in particular. Improvements in transportation
infrastructure are likely to be required to make more agricultural
production accessible to export terminals at competitive prices. A
substantialportion of agricultural production in the countries in
which we operate is currently transported by truck, a means of
transportation significantly more expensive than the rail
transportation available to U.S. and other international producers.
Our dependence on truck transportation may affect our position as a
low-cost producer so that our ability to compete in the world
markets may be impaired.
28
Even
though road and rail improvement projects have been considered for
some areas of Brazil, and in some cases implemented, substantial
investments are required for road and rail improvement projects,
which may not be completed on a timely basis, if at all. Any delay
or failure in developing infrastructure systems could reduce the
demand for our products, impede our products’ delivery or
impose additional costs on us. We currently outsource the
transportation and logistics services necessary to operate our
business. Any disruption in these services could result in supply
problems at our farms and processing facilities and impair our
ability to deliver our products to our customers in a timely
manner.
The result of our operations are dependent upon economic conditions
in Paraguay, in which we operate, and any decline in economic
conditions could harm our results of operations or financial
condition.
As of
June 30, 2020, 6.7% of our assets were located in Paraguay.
Paraguay has a history of economic and political instability,
exchange controls, frequent changes in regulatory policies,
corruption, and weak judicial security. However, in 2013, Paraguay
had the highest GDP growth rate in Latin America and the third
highest in the world with 14%. Since then, GDP has grown by 4% in
2014, 3% in 2015, 3.8% in 2016, 4.3% in 2017,3.6% in 2018 and 0.2%
in 2019. The Paraguay’s GDP is closely related to the
performance of the Paraguayan agricultural sector, which can be
volatile and could adversely affect our business, financial
condition and results of operations.
The
exchange rate of Paraguay is free and floating and the Central Bank
of Paraguay participates actively in the exchange market in order
to reduce volatility. In 2018, the Paraguayan currency appreciated
against the dollar by 6.7%, while in 2019 the appreciation was
8.26%. A significant depreciation of the local currency could
adversely affect our business, financial condition and results of
operations. However, since most of our costs of raw materials and
supplies are denominated in U.S. dollars, a significant
depreciation of the local currency could adversely affect our
business, financial condition and results of operations, as well as
impact other expenses, such as as professional fees and maintenance
costs.
In
addition, a significant deterioration in the economic growth of
Paraguay or any of its main trading partners, such as Brazil or
Argentina, could have a material impact on the trade balance of
Paraguay and could adversely affect their economic growth, which
could adversely affect our business, financial condition and
results of operations.
The result of our operations are dependent upon economic conditions
in Bolivia, in which we operate, and any decline in economic
conditions could harm our results of operations or financial
condition.
As of
June 30, 2020, 5.8% of our assets were located in Bolivia. Bolivia
is exposed to frequent has a history of economic, social and
political instability, exchange controls, frequent changes in
regulatory frameworks policies, civic and labour strikes, high tax
rates and corruption among state officials, the judiciary and also
the private sector.
Bolivia
is exposed to high risk of social unrest, causing marches and
roadblocks deployed by protesters to pressure the government,
increasing disruption risks. Furthermore, protests over
environmental issues often overlap significantly with labour
disputes, which can escalate into disruptive forms of protest,
including site occupations.
In
turn, the Bolivian economy is the 14th largest in Latin America and
is heavily dependent on export commodities such as natural gas and
minerals. Bolivia’s GDP growth over the last decade has been
among the highest in Latin America, growing by 4.9% in 2015, 4.3%
in 2016,4.2% in 2017, 4.2% in 2018 and 2.2% in 2019, also. Within
this context, inflation has been relatively low and under control
for the last 30 years. The inflation rate for 2019 was around 1.47%
with a slightly higher figure expected for 2020. In addition,
Bolivia it is in the process of becoming an active partner of
MERCOSUR, a common market aiming to gradually integrate economic
activity among Brazil, Argentina, Uruguay, Paraguay and
Bolivia.
A
significant deterioration in the global and internal
macroeconomics, political stability or social unrest of Bolivia,
could have a material impact on their economic growth, which could
adversely affect our business, financial condition and results of
operations. On October 18, 2020, Bolivia’s general elections
were held, with the aim of electing e President, Vice-President and
deputies of the country. Luis Arce, belonging to the Movement to
Socialism (MAS) was elected in the first round, with 54.41% of the
votes. The elections were announced by Bolivia’s former
president, Evo Morales, on November 10, 2019, hours before his
resignation. They were scheduled to be held on May 3, 2020, but due
to the outbreak of the COVID-19 pandemic elections had to be
postponed to the aforementioned date.
29
Risks Relating to Our Agricultural Business
Fluctuation in market prices for our agriculture products could
adversely affect our financial condition and results of
operations.
Prices
for crops, oilseeds and by-products, like those of other
commodities, have historically been cyclical and sensitive to
domestic and international changes in supply and demand and can be
expected to fluctuate significantly. In addition, the agricultural
products and by-products we produce are traded on commodities and
futures exchanges and thus are subject to speculative trading,
which may adversely affect us. The prices that we are able to
obtain for our agriculture products depend on many factors beyond
our control, including:
●
prevailing world
prices, which historically have been subject to significant
fluctuations over relatively short periods of time, depending on
worldwide demand and supply;
●
changes in the
agricultural subsidy levels in certain important countries (mainly
the United States and countries in the European Union) and the
adoption of other government policies affecting industry market
conditions and prices;
●
changes to trade
barriers of certain important consumer markets (including China,
India, the U.S. and the E.U.) and the adoption of other
governmental policies affecting industry market conditions and
prices;
●
changes in
government policies for biofuels;
●
world inventory
levels, i.e., the supply of commodities carried over from year to
year;
●
climatic conditions
and natural disasters in areas where agricultural products are
cultivated;
●
the production
capacity of our competitors; and
●
demand for and
supply of competing commodities and substitutes.
Unpredictable weather conditions, pest infestations and diseases
may have an adverse impact on our crop yields and cattle
production.
The
occurrence of severe adverse weather conditions, especially
droughts, hail, or floods, is unpredictable and may have a
potentially devastating impact upon our crop production and, to a
lesser extent, our cattle and wool production, and may otherwise
adversely affect the supply and price of the agricultural
commodities that we sell and use in our business. The occurrence of
severe adverse weather conditions may reduce yields on our
farmlands or require us to increase our level of investment to
maintain yields. Additionally, higher than average temperatures and
rainfall can contribute to an increased presence of pest and
insects that may adversely impact our agricultural
production.
According
to the United States Department of Agriculture (“USDA”)
estimates, Argentina’s crops output (wheat, corn and soybean)
for the 2017/2018 season is expected to decrease by 23%, reaching a
production of 87.8 million tons, as compared to the previous cycle.
The forecast shows mainly an increase in the planted area, with a
focus on wheat and corn, which is additionally enhanced by a
slightly better expected yield in comparison with the 2016/2017
campaign. The estimated production of soybean is supposed to reach
37.8 million tons, the wheat production 18 million tons and the
corn production 32 million tons.
The
occurrence and effects of disease and plagues can be unpredictable
and devastating to agricultural products, potentially rendering all
or a substantial portion of the affected harvests unsuitable for
sale. Our agricultural products are also susceptible to fungus and
bacteria that are associated with excessively moist conditions.
Even when only a portion of the production is damaged, our results
of operations could be adversely affected because all or a
substantial portion of the production costs have been incurred.
Although some diseases are treatable, the cost of treatment is
high, and we cannot assure you that such events in the future will
not adversely affect our operating results and financial condition.
Furthermore, if we fail to control a given plague or disease and
our production is threatened, we may be unable to supply our main
customers, which could affect our results of operations and
financial condition.
As a
result, we cannot assure you that the current and future severe
adverse weather conditions or pest infestations will not adversely
affect our operating results and financial condition.
30
Our cattle are subject to diseases.
Diseases
among our cattle herds, such as mastitis, tuberculosis, brucellosis
and foot-and-mouth disease, can have an adverse effect on fattening
production, rendering cows unable to produce meat for human
consumption. Outbreaks of cattle diseases may also result in the
closure of certain important markets, such as the United States, to
our cattle products. Although we abide by national veterinary
health guidelines, which include laboratory analyses and
vaccination, to control diseases among the herds, especially
foot-and-mouth disease, we cannot assure that future outbreaks of
cattle diseases will not occur. A future outbreak of diseases among
our cattle herds may adversely affect our cattle sales which could
adversely affect our operating results and financial
condition.
In
addition, outbreaks, or fears of outbreaks, of any of these or
other animal diseases can lead to the cancellation of our
customers’ orders and, particularly if the disease can affect
humans, or create adverse publicity that can have adverse material
effect in the consumer demand of our products. In addition, animal
disease outbreaks may result in foreign government actions to close
the export markets of some or all of our products, which may result
in the destruction of some or all of these animals.
We may be exposed to material losses due to volatile crop prices
since a significant portion of our production is not hedged, and
exposed to crop price risk.
Due to
the fact that we do not have all of our crops hedged, we are unable
to have minimum price guarantees for all of our production and are
therefore exposed to significant risks associated with the level
and volatility of crop prices. We are subject to fluctuations in
crop prices which could result in receiving a lower price for our
crops than our production cost. We are also subject to exchange
rate risks related to our crops that are hedged, because our
futures and options positions are valued in U.S. Dollars, and thus
are subject to exchange rate risk.
In
addition, if severe weather or any other disaster generates a lower
crop production than the position already sold in the market, we
may suffer material losses in the repurchase of the sold
contracts.
The creation of new export taxes may have an adverse impact on our
sales and results of operations.
In
order to prevent inflation and variations in the exchange rate from
adversely affecting prices of primary and manufactured products
(including agricultural products), and to increase tax collections
and reduce Argentina’s fiscal deficit, the Argentine
government has imposed new taxes on exports. Pursuant to Resolution
No. 11/02 of the Ministry of Economy and Production, as amended by
Resolution No. 35/02, No. 160/2002, No. 307/2002 and No. 530/2002,
effective as of March 5, 2002, the Argentine government imposed a
20%, 10% and 5% export tax on primary and manufactured products. On
November 12, 2005, pursuant to Resolution No. 653/2005, the
Ministry of Economy and Production increased the tax on cattle
exports from 5% to 10%, and on January 2007 increased the tax on
soybean exports from 23.5% to 27.5%. Pursuant to Resolutions No.
368/07 and No. 369/07 both dated November 12, 2007, the Ministry of
Economy and Production further increased the tax on soybean exports
from 27.5% to 35.0% and also the tax on wheat and corn exports from
20.0% to 28.0% and from 20.0% to 25.0%, respectively. In early
March 2008, the Argentine government introduced a regime of sliding
–scale export tariffs for oilseed, grains and by-products,
where the withholding rate (in percentage) would increase to the
same extent as the crops’ price. Therefore, it imposed an
average tax for soybean exports of 46%, compared to the previous
fixed rate of 35%. In addition, the tax on exports of wheat was
increased, from a fixed rate of 28% to an average variable rate of
38%, and the tax on exports of corn changed from a fixed rate of
25% to an average variable rate of 36%. This tariff regime, which
according to farmers effectively sets a maximum price for their
crops, sparked widespread strikes and protests by farmers whose
exports have been one of the principal driving forces behind
Argentina’s recent growth. In April 2008, as a result of the
export tariff regime, farmers staged a 21-day strike in which,
among other things, roadblocks were set up throughout the country,
triggering Argentina’s most significant political crisis in
five years. These protests disrupted transport and economic
activity, which led to food shortages, a surge in inflation and a
drop in export registrations. Finally, the federal executive branch
decided to send the new regime of sliding-scale export tariffs to
the federal congress for its approval. The project was approved in
the lower chamber of the national congress but rejected by the
Senate. Subsequently, the federal government abrogated the regime
of sliding-scale export tariffs and reinstated the previous scheme
of fixed withholdings.
31
In
December 2015, the government of Mauricio Macri announced the
reduction of 35 to 30% of export duties on soybean and the removing
of all of the export duties for the rest of the products. To the
date, the Argentine government is analyzing the possibility of
reducing again the tax for soybean exports. In addition, Decree
1343/17 implemented a monthly reduction of 0.5% of the export duty
in force on soybean, wheat and soybean oil from January 2018 to
December 2019 inclusive.
On
September 4, 2018, pursuant to Decree 793/2018, the Argentine
Government restablished, until December 31, 2020, a 12% export tax
on goods and services included in the MERCOSUR Common Nomenclature
with a cap of ARS 3 for each dollar of taxable value or the
official FOB price, as appropriate, for the goods and services set
forth in Annex I of the aforementioned decree and of ARS 4 for all
other manufactured products.
On
December 28, 2018, the Argentine government issued Decree No.
1201/2018, which establishes, until December 31, 2020, an export
tax of 12% to the export of services rendered in the country, whose
effective use or exploitation is carried out abroad and establishes
that said export duty may not exceed ARS 4 for each U.S. dollar of
the taxable value. If applicable, that limit will remain in pesos
until the obligation is canceled. The measure took effect on
January 1, 2019 and will take effect for operations that are lent
and billed as of that date. We cannot assure that in case of
assuming a new government, retention rates could be increased,
mainly for exports of primary products and that such taxes could
have an adverse impact on our financial condition and results of
operations.
Export
taxes may have a material adverse effect on our sales and results
of operations. We produce exportable goods and, therefore, an
increase in export taxes is likely to result in a decrease in our
products’ price, and, therefore, may result in a decrease of
our sales. We cannot guarantee the impact of those or any other
future measures that might be adopted by the Argentine government
on our financial condition and result of operations.
We may face risks associated with land-takings in
Argentina.
Land-taking
is a long-standing problem in Argentina that has escalated
throughout the years with every economic crisis, especially now in
the context of the COVID-19 economic crisis.
The
most serious problem arises in the province of Buenos Aires, the
most densely populated in the country, where there were already
more than 1,800 land usurpations so far this year, according to
estimates by the local Ministry of Security. The most notorious
case being the usurpation of Guernica’s lands, the largest
land take, which began on July 2020, in the department of
Presidente Perón, in the outskirts of the city of Buenos
Aires. It is estimated that around 3,000 people, especially young
people and some families, occupied this private area in the absence
of intervention by the authorities. Land neighbors reported
increased insecurity and theft of electricity by occupants. On
October 29, more than 4,000 troops under the direction of Sergio
Berni, Security Minister of the Province of Buenos Aires, carried
out the eviction from Guernica’s lands, property usurped
since the beginning of July. After almost 100 days, negotiations
between provincial authorities and usurpers failed and as a
consequence, the Security Minister carried out the above mentioned
eviction, resulting in several injuries and detainees. After two
hours of operation, the lands were completely
liberated.
Another
relevant land usurpation problem, which has been going on for three
years, in southern Argentina, near the city of San Carlos de
Bariloche, in the Patagonian province of Rio Negro, relates to
groups identified with the Mapuche indigenous people who have
occupied what they consider ancestral lands and have broken into
properties in the area.
The
spread of land takes has revived in Argentina an old debate in
Argentina. There is a conflict between two groups that claim, on
the one hand, a right to decent housing, and on the other hand a
group that claims that the right to private property should be
respectedArgentina's constant and cyclical economic crises over the
past 50 years have also caused poverty to rise sharply, so less
people can access a roof, resulting in a housing
deficit
As a
consequence, we cannot provide assurance that government responses
to such disruptions will restore investor confidence in Argentine
lands, which could have an adverse impact on our financial
condition and results of operations.
32
A global economic recession could decrease the demand for our
products or lower prices.
The
demand for the products we sell may be affected by international,
national and local economic conditions that are beyond our control.
Adverse changes in the real or perceived economic climate, such as
rising fuel prices, higher interest rates, falls and / or
volatility of realestate and real estate markets, more restrictive
credit markets, taxes higher and changes in government policies
could reduce the level of demand or prices of the products we
produce. We cannot predict the time or duration, magnitude or
strength of this slowdown or economic recovery. If a recession
continues for a prolonged period of time or worsens, we may
experience a prolonged period of declining demand and prices. In
addition, economic recessions have and can negatively affect our
suppliers, which can lead to interruptions in goods and services
and financial losses.
An international credit crisis could have a negative impact on our
major customers which in turn could materially adversely affect our
results of operations and liquidity.
The
most recent international credit crisis that started in 2008 had a
significant negative impact on businesses around the world.
Although we believe that available borrowing capacity under the
current conditions and proceeds resulting from potential farmland
sales will provide us with sufficient liquidity through the current
economic environment, the impact of the crisis on our major
customers cannot be predicted and may be quite severe. A disruption
in the ability of our significant customers to access liquidity
could cause serious disruptions or an overall deterioration of
their businesses which could lead to a reduction in their future
orders of our products and the inability or failure on their part
to meet their payment obligations to us, any of which could have a
material adverse effect on our results of operations and
liquidity.
Government intervention in the markets may have a direct impact on
our prices.
The
Argentine government has set certain industry market conditions and
prices in the past. In order to prevent a substantial increase in
the price of basic products as a result of inflation, the Argentine
government is adopting an interventionist policy. In March 2002,
the Argentine government fixed the price for milk after a conflict
among producers and the government. Since 2005, the Argentine
government, in order to increase the domestic availability of beef
and reduce domestic prices, adopted several measures: it increased
turnover tax and established a minimum average number of animals to
be slaughtered. In March 2006, the registries for beef exports were
temporarily suspended. This last measure was softened once prices
decreased. There can be no assurance that the Argentine government
will not interfere in other areas by setting prices or regulating
other market conditions. Accordingly, we cannot assure you that we
will be able to freely negotiate all our products’ prices in
the future or that the prices or other market conditions that the
Argentine government could impose will allow us to freely negotiate
the price of our products.
We do not maintain insurance over all our crop storage facilities;
therefore, if a fire or other disaster damages some or all of our
harvest, we will not be completely covered.
Our
production is, in general, subject to different risks and hazards,
including adverse weather conditions, fires, diseases, pest
infestations and other natural phenomena. We store a significant
portion of our grain production during harvest due to the seasonal
drop in prices that normally occurs at that time. Currently, we
store a significant portion of our grain production in plastic
silos. We do not maintain insurance on our plastic silos. Although
our plastic silos are placed in several different locations, and it
is unlikely that a natural disaster affects all of them
simultaneously, a fire or other natural disaster which damages the
stored grain, particularly if such event occurs shortly after
harvesting, could have an adverse effect on our operating results
and financial condition.
33
Worldwide competition in the markets for our products could
adversely affect our business and results of
operations.
We
experience substantial worldwide competition in each of our markets
in which we operate, and in many of our product lines. The market
for cereals, oil seeds and by-products is highly competitive and
also sensitive to changes in industry capacity, producer
inventories and cyclical changes in the world’s economies,
any of which may significantly affect the selling prices of our
products and thereby our profitability. Argentina is more
competitive in the oilseed market than in the market for cereals.
Due to the fact that many of our products are agricultural
commodities, they compete in the international markets almost
exclusively on the basis of price. The market forcommodities is
highly fragmented. Small producers can also be important
competitors, some of which operate in the informal economy and are
able to offer lower prices by meeting lower quality standards.
Competition from other producers is a barrier to expanding our
sales in the domestic/foreign market. Many other producers of these
products are larger than us, and have greater financial and other
resources. Moreover, many other producers receive subsidies from
their respective countries while we do not receive any such
subsidies from the Argentine government. These subsidies may allow
producers from other countries to produce at lower costs than us
and/or endure periods of low prices and operating losses for longer
periods than we can. Any increased competitive pressure with
respect to our products could materially and adversely affect our
financial condition and results of operations.
Social movements may affect the use of our agricultural properties
or cause damage to them.
Social
movements, such as the Landless Rural Workers’ Movement
(
Movimento dos Trabalhadores
Rurais Sem Terra
) and the Pastoral Land Commission
(
Comissão Pastoral da
Terra
) are active in Brazil and advocate land reform and
property redistribution by the Brazilian government. Invasion and
occupation of agricultural land by large numbers of people is a
common practice among the members of such movements and, in certain
regions, including those where we currently invest, remedies such
as police protection or eviction procedures are inadequate or
non-existent. As a result, we cannot assure you that our
agricultural properties will not be subject to invasion or
occupation by any social movement. Any invasion or occupation may
materially impair the use of our lands and adversely affect our
business, financial condition, and results of
operations.
If we are unable to maintain our relationships with our customers,
our business may be adversely affected.
Our
cattle sales are diversified but we are and will continue to be
significantly dependent on a number of third party relationships,
mainly with our customers for crop sales. For the fiscal year 2020,
our sales from the agribusiness segment (excluding sales of farms)
were made to approximately 300 customers. Sales to our ten largest
customers represented approximately 45% to 50% of our net sales.
Some of these customers included Cargill, FASA, Bunge Alimentos
S.A. and GLENCORE. We have signed non-binding letters of intent
with some of our largest customers that allow us to estimate the
volume of the demand for certain products and to plan production
accordingly. We generally enter into short-term agreements with a
term of less than a year.
We sell
our crop production mainly to exporters and manufacturers that
process the raw materials to produce meal and oil, products that
are sent to the export markets. The Argentine crop market is
characterized by a few purchasers and a great number of sellers.
Although most of the purchasers are international companies with
strong financial conditions, we cannot assure you that this
situation will remain the same in the future or this market will
not get more concentrated in the future.
We may
not be able to maintain or form new relationships with customers or
others who provide products and services that are important to our
business. Accordingly, we cannot assure you that our existing or
prospective relationships will result in sustained business or the
generation of significant revenues.
Our business is seasonal, and our revenues may fluctuate
significantly depending on the growing cycle.
Our
agricultural business is highly seasonal due to its nature and
cycle. The harvest and sale of crops (corn, soybean and sunflower)
generally occurs from February to June. Wheat is harvested from
December to January. Our operations and sales are affected by the
growing cycle of the crops we process and by decreases during the
summer in the price of the cattle we fatten. As a result, our
results of operations have varied significantly from period to
period, and are likely to continue to vary, due to seasonal
factors.
34
A substantial portion of our assets is farmland that is highly
illiquid.
We have
been successful in partially rotating and monetizing a portion of
our investments in farmland. Ownership of a significant portion of
the land we operate is a key part of our business model. However,
agricultural real estate is generally an illiquid asset. Moreover,
the adoption of laws and regulations that impose limitations on
ownership of rural land by foreigners in the jurisdictions in which
we operate may also limit the liquidity of our farmland holdings.
See “—
Risks Related to
Argentina— The Rural Land Law and its
application
.” As a result, it is unlikely that we will
be able to adjust our owned agricultural real estate portfolio
promptly in response to changes in economic, business or regulatory
conditions. Illiquidity in local market conditions may adversely
affect our ability to complete dispositions, to receive proceeds
generated from any such sales or to repatriate any such
proceeds.
The restrictions imposed on our subsidiaries’ dividend
payments may adversely affect us.
We have
subsidiaries, and therefore, dividends in cash and other permitted
payments of our subsidiaries constitute a major source of our
income. The debt agreements of our subsidiaries contain covenants
that may restrict their ability to pay dividends or proceed with
other types of distributions. If our subsidiaries are prevented
from making payments to us or if they are only allowed to pay
limited amounts, we may be unable to pay dividends or to repay our
indebtedness.
We could be materially and adversely affected by our investment in
Brasilagro.
We
consolidated our financial statements with our subsidiary
Brasilagro. Brasilagro was formed on September 23, 2005 to exploit
opportunities in the Brazilian agricultural sector. Brasilagro
seeks to acquire and develop future properties to produce a
diversified range of agricultural products (which may include
sugarcane, grains, cotton, forestry products and livestock).
Brasilagro is a startup company that has been operating since 2006.
As a result, it has a developing business strategy and limited
track record. Brasilagro’s business strategy may not be
successful, and if not successful, Brasilagro may be unable to
successfully modify its strategy. Brasilagro’s ability to
implement its proposed business strategy may be materially and
adversely affected by many known and unknown factors. If we were to
write-off our investments in Brasilagro, this would likely
materially and adversely affect our business. As of June 30, 2020,
we owned 33.55% of the outstanding common shares of
Brasilagro.
Labor relations could negatively impact us.
As of
June 30, 2020, 62% of our employees were represented by unions
under collective agreements. While we currently enjoy good
relations with our employees and unions, we cannot assure that such
good labor relations will continue in the future positively or that
their eventual deterioration does not affect us materially or
negatively.
35
Our internal processes and controls might not be sufficient to
comply with the extensive environmental regulation and current or
future environmental regulations could prevent us from fully
developing our land reserves.
Our
activities are subject to a wide set of federal, state and local
laws and regulations relating to the protection of the environment,
which impose various environmental obligations. Obligations include
compulsory maintenance of certain preserved areas in our
properties, management of pesticides and associatedhazardous waste
and the acquisition of permits for water use. Our proposed business
is likely to involve the handling and use of hazardous materials
that may cause the emission of certain regulated substances. In
addition, the storage and processing of our products may create
hazardous conditions. We could be exposed to criminal and
administrative penalties, in addition to the obligation to remedy
the adverse effects of our operations on the environment and to
indemnify third parties for damages, includingthe payment of
penalties for non-compliance with these laws and regulations. Since
environmental laws and their enforcement are becoming more
stringent in Argentina, our capital expenditures and expenses for
environmental compliance may substantially increase in the future.
In addition, due to the possibility of future regulatory or other
developments, the amount and timing of environmental-related
capital expenditures and expenses may vary substantially from those
currently anticipated. The cost of compliance with environmental
regulation may result in reductions of other strategic investments
which may consequently decrease our profits. Any material
unforeseen environmental costs may have a material adverse effect
on our business, results of operations, financial condition or
prospects. We cannot ensure that our internal processes and
controls may be sufficient to comply with the extensive
environmental regulation.
As of
June 30, 2020, we owned land reserves extending over more than
359,965 hectares that were purchased at very attractive prices. In
addition, we have a concession over 102,598 hectares reserved for
future development. We believe that there are technological tools
available to improve productivity in these farmlands and,
therefore, achieve appreciation in the long term. However, current
or future environmental regulations could prevent us from fully
developing our land reserves by requiring that we maintain part of
this land as natural woodlands not to be used for production
purposes.
New restrictions on agricultural and food products we produce that
contain genetically modified organisms could be established which
could have an adverse effect on our business.
Our
agricultural products contain genetically modified organisms in
varying proportions according to the year and the country of
production. The use of genetically modified organisms in food has
been achieved with varying degrees of acceptance in the markets in
which we operate. Argentina and Brazil, for example, have approved
the use of genetically modified organisms in food products, and
genetically modified organisms and non-genetically modified
organisms grains in those countries are produced and mixed
frequently during the process of grain origination. Elsewhere,
adverse publicity aboutgenetically modified foods has led to
government regulation that limits sales of genetically modified
organisms products. It is possible that new restrictions may be
imposed on genetically modified organisms products in the main
markets for some of our products, which could have an adverse
effect on our business, equity and the result of our
operations.
If our products become contaminated, we may be subject to product
liability claims, product withdrawals and export restrictions that
could adversely affect our business.
While
we are subject to strict production protocols, the sale of products
implies the risk of injury to consumers. These injuries may result
from manipulation by third parties, bioterrorism, product
contamination or deterioration, including the presence of bacteria,
pathogens, foreign objects, substances, chemicals, other agents or
waste introduced during the growth phases, storage, handling or
transport.
We
cannot be sure that the consumption of our products will not cause
a health-related illness in the future or that we will not be
subject to claims or judgments related to such matters. Even if a
product liability claim is unsuccessful or not fully realized, the
negative publicity surrounding any claim that our products caused a
disease or injury could negatively affect our reputation with
current and potential customers and our image as a Company, and we
could also incur significant incidents. In addition, claims or
liabilities of this nature may not be covered by any compensation
or contribution rights we may have against others, which could have
a material adverse effect on our business, equity status and the
result of our operations.
36
Increased energy prices and fuel shortages could adversely affect
our operations.
We
require substantial amounts of fuel oil and other resources for our
harvest activities and transport of our agricultural products. We
rely upon third parties for our supply of the energy resources
consumed in our operations. The prices for and availability of
energy resources may be subject to change or curtailment,
respectively, due to, among other things, new laws or regulations,
imposition of new taxes or tariffs, interruptions in production by
suppliers, worldwide price levels and market conditions. The prices
of various sources of energy may increase significantly from
current levels. An increase in energy prices could materially
adversely affect our results of operations and financial
condition.
Over
the last few years, the Argentine government has taken certain
measures in order to reduce the use of energy during peak months of
the year by frequently cutting energy supply to industrial
facilities and large consumers to ensure adequate supply for
residential buildings. If energy supply is cut for an extended
period of time or energy tariffs continue increasing and we are
unable to find replacement sources at comparable prices, or at all,
our business and results of operations could be adversely
affected.
Our level of debt may adversely affect our operations and our
ability to pay our debt as it becomes due.
We had,
and expect to have, substantial liquidity and capital resource
requirements to finance our business. As of June 30, 2020, our
consolidated financial debt amounted to ARS 418,807 million
(including IDBD’s debt outstanding as of that date plus
accrued and unpaid interest on such indebtedness and deferred
financing costs). We cannot assure you that we will have sufficient
cash flows and adequate financial capacity in the future. While the
commitments and other covenants applicable to IDBD’s debt
obligations do not apply to IRSA since there is no recourse to IRSA
and it is not guaranteed by IRSA’s assets, these covenants
and restrictions may impair or restrict our ability to operate IDBD
and implement our business strategy. Although we are generating
sufficient funds from our operating cash flows to meet our debt
service obligations and our ability to obtain new financing is
adequate, considering the current availability of loan financing in
Argentina, we cannot assure you that we will have sufficient cash
flows and adequate financial structure in the future. For more
information see “Recent Events – Recent IRSA Events -
Corporate Information: IDBD”.On September 15, 2020,
Communication “A” 7,106 established that companies must
refinance maturities of financial debt capital in the period from
October 15, 2020 to March 31, 2021. In this sense, the Central Bank
will give access to companies for up to 40% of maturities and
companies must refinance the rest within at least two years. For
more information see: “Item 10. Additional
Information—D. Exchange Controls.”
As a
consequence of the new restrictions on access to the Foreign
Exchange Market, on October 23, 2020, we launched an exchange offer
on our Series XXIV Notes due on November 14, 2020. The exchange
offer consisted on two options for the bondholders: i) a cash
consideration of USD 0.95741755 for each USD 1 of existing notes
presented to the Exchange and the remaining amount until completing
USD 1 for each USD 1 of existing notes presented to the Exchange,
in notes Series XXXI, and ii) a par for par exchange of notes
Series XXXII for each Existing Notes presented to the Exchange.
Also on October 22, 2020, IRSA launched an exchange offer and
consent solicitation on its Series I Notes due on November 15,
2020. The exchange offer consisted on two options for the
bondholders: i) a cash consideration of USD 0.69622593 for each USD
1 of existing notes presented to the Exchange and the remaining
amount until completing 1 USD for each 1 USD of existing notes
presented to the Exchange, in notes Series VIII, and ii) a par for
par exchange of notes Series IX for each Existing Notes presented
to the Exchange.
Our
exchange offer consisted on the following, exchange consideration
of Series XXIV Notes and Issuance of Series XXXI Notes and Series
XXXII Notes. The Exchange Offer expired on November 10, 2020 and
the Nominal Value of Existing Notes presented and accepted for the
Exchange (for both Series) was USD 65,075,746, which represents
88.41% acceptance.
IRSA’s
Exchange Offer expired on November 10, 2020 and the Nominal Value
of Existing Notes presented and accepted for the Exchange (for both
Series) was USD 178,458,188, which represents 98.31%
acceptance.
Considering
that consent has been obtained for an amount greater than 90% of
the capital of the existing notes, the Company made the
Non-Essential Proposed Modifications and / or the Essential
Proposed Modifications, by means of which the terms and conditions
of the existing notes will be modified and replaced.
For
more information see: “Recent Developments - Exchange Offer -
Issuance of Series XXXI and XXXII Notes” and
“IRSA’s Recent Developments - Exchange Offer- Issuance
of Series VIII and IX Notes.”
Our
leverage may affect our ability to refinance existing debt or
borrow additional funds to finance working capital requirements,
acquisitions and capital expenditures. In addition, the recent
disruptions in the local capital and the macroeconomic conditions
of Argentine markets, may adversely impact our ability to refinance
existing debt and the availability and cost of credit in the
future. In such conditions, access to equity and debt financing
options may be restricted and it may be uncertain how long these
economic circumstances may last. This would require us to allocate
a substantial portion of cash flow to repay principal and interest,
thereby reducing the amount of money available to invest in
operations, including acquisitions and capital expenditures. Our
leverage could also affect our competitiveness and limit our
ability to changes in market conditions, changes in the real estate
industry and economic downturns.
The
success of our businesses and the feasibility of our transactions
depend on the continuity of investments in the real estate markets
and our ability to access capital and debt financing. In the long
term, lack of confidence in real estate investment and lack of
access to credit for acquisitions could restrict growth. As part of
our business strategy, we will strive to increase our real estate
portfolio through strategic acquisitions of properties at favorable
prices and properties with added value which we believe meet the
requirements to increase the value of our properties.
We may
not be able to generate sufficient cash flows from operations to
satisfy our debt service requirements or to obtain future
financing. If we cannot satisfy our debt service requirements or if
we default on any financial or other covenants in our debt
arrangements, the lenders and/or holders of our debt will be able
to accelerate the maturity of such debt or cause defaults under the
other debt arrangements. Our ability to service debt obligations or
to refinance them will depend upon our future financial and
operating performance, which will, in part, be subject to factors
beyond our control such as macroeconomic conditions and regulatory
changes in Argentina. If we cannot obtain future financing, we may
have to delay or abandon some or all of our planned capital
expenditures, which could adversely affect our ability to generate
cash flows and repay our obligations as they become
due.
37
We depend on our chairman and senior management.
Our
success depends, to a significant extent, on the continued
employment of Mr. Eduardo S. Elsztain, our chairman, and Alejandro
G. Elsztain, our chief executive officer, and second vice-chairman.
The loss of their services for any reason could have a material
adverse effect on our business. If our current principal
shareholders were to lose their influence on the management of our
business, our principal executive officers could resign or be
removed from office.
Our
future success also depends in part upon our ability to attract and
retain other highly qualified personnel. We cannot assure you that
we will be successful in hiring or retaining qualified personnel,
or that any of our personnel will remain employed by
us.
The Investment Company Act may limit our future
activities.
Under
Section 3(a)(3) of the Investment Company Act of 1940, as amended
(“Investment Company Act”), an investment company is
defined in relevant part to include any company that owns or
proposes to acquire investment securities that have a value
exceeding 40% of such company’s unconsolidated total assets
(exclusive of U.S. government securities and cash items).
Investments in minority interests of related entities as well as
majority interests in consolidated subsidiaries which themselves
are investment companies are included within the definition of
“investment securities” for purposes of the 40% limit
under the Investment Company Act.
Companies
that are investment companies within the meaning of the Investment
Company Act, and that do not qualify for an exemption from the
provisions, are required to register with the SEC and are subject
to substantial regulations with respect to capital structure,
operations, transactions with affiliates and other matters. In the
event such companies do not register under the Investment Company
Act, they may not, among other things, conduct public offerings of
their securities in the United States or engage in interstate
commerce in the United States. Moreover, even if we desired to
register with the SEC as an investment company, we could not do so
without an order of the Commission because we are a non-U.S.
corporation, and it is unlikely that the SEC would issue such an
order.
As of
June 30, 2020, we owned approximately 61.95% of IRSA’s
outstanding shares. Although we believe we are not an
“investment company” for purposes of the Investment
Company Act, our belief is subject to substantial uncertainty, and
we cannot give you any assurance that we would not be determined to
be an “investment company” under the Investment Company
Act. As a result, the uncertainty regarding our status under the
Investment Company Act may adversely affect our ability to offer
and sell securities in the United States or to U.S. persons. The
U.S. capital markets have historically been an important source of
funding for us, and our ability to obtain financing in the future
may be adversely affected by a lack of access to the U.S. markets.
If an exemption under the Investment Company Act is unavailable to
us in the future and we desire to access the U.S. capital markets,
our only recourse would be to file an application to the SEC for an
exemption from the provisions of the Investment Company Act which
is a lengthy and highly uncertain process.
Moreover,
if we offer and sell securities in the United States or to U.S.
persons and we were deemed to be an investment company under the
investment company act and not exempted from the application of the
Investment Company Act, contracts we enter into in violation of, or
whose performance entails a violation of, the Investment Company
Act, including any such securities, may not be enforceable against
us.
38
We hold Argentine securities which might be more volatile than U.S.
securities and carry a greater risk of default.
We
currently have and in the past have had certain investments in
Argentine government debt securities, corporate debt securities,
and equity securities. In particular, we hold a significant
interest in IRSA, an Argentine company that has suffered material
losses, particularly during the fiscal years 2001 and 2002.
Although our holding of these investments, excluding IRSA, tends to
be short term, investments in such securities involve certain
risks, including:
●
market volatility,
higher than those typically associated with U.S. government and
corporate securities; and
●
loss of
principal.
Some of
the issuers in which we have invested and may invest, including the
Argentine government, have in the past experienced substantial
difficulties in servicing their debt obligations, which have led to
the restructuring of certain indebtedness. We cannot assure that
the issuers in which we have invested or may invest will not be
subject to similar or other difficulties in the future which may
adversely affect the value of our investments in such issuers. In
addition, such issuers and, therefore, such investments, are
generally subject to many of the risks that are described in this
section with respect to us, and, thus, could have little or no
value.
Risks relating to IRSA’s business in
Argentina
Disease outbreaks or other public health concerns could reduce
traffic in our shopping malls.
IRSA is subject to risks inherent to the operation of shopping
malls that may affect our profitability.
IRSA’s
shopping malls are subject to various factors that affect their
development, administration and profitability,
including:
●
declines in lease
prices or increases in levels of default by our tenants due to
economic conditions;
●
increases in
interest rates and other factors outside our control;
●
the accessibility
and attractiveness of the areas where our shopping malls are
located;
●
the intrinsic
attractiveness of the shopping mall;
●
the flow of people
and the level of sales of rental units in our shopping
malls;
●
the increasing
competition from internet sales;
●
the amount of rent
collected from tenants at our shopping malls;
●
changes in consumer
demand and availability of consumer credit, both of which are
highly sensitive to general macroeconomic conditions;
and
●
fluctuations in
occupancy levels in our shopping malls.
39
IRSA could be adversely affected by decreases in the value of our
investments.
IRSA issue debt in the local and international capital markets as
one of its main sources of funding and our capacity to successfully
access the local and international markets on favorable terms
affects IRSA’s cost of funding.
IRSA’s assets are highly concentrated in certain geographic
areas and an economic downturn in such areas could have a material
adverse effect on our results of operations and financial
condition.
40
IRSA’s performance is subject to the risks associated with
our properties and with the real estate industry.
IRSA’s
operating performance and the value of our real estate assets, and
as a result, the value of its securities, are subject to the risk
that its properties may not be able to generate sufficient revenue
to meet its operating expenses, including debt service and capital
expenditures, its cash flow needs and its ability to service our
debt obligations. Events or conditions beyond its control that may
adversely affect its operations or the value of its properties
include:
●
downturns in
national, regional and local economies;
●
declines in
consumer spending and consumption;
●
competition from
other shopping malls and sales outlets;
●
local real estate
market conditions, such as oversupply or lower demand for retail
space;
●
changes in interest
rates and availability of financing;
●
the exercise by our
tenants of their right to early termination of their
leases;
●
vacancies, changes
in market rental rates and the need to periodically repair,
renovate and re-lease space;
●
increased operating
costs, including insurance expenses, salary increases, utilities,
real estate taxes, federal and local taxes and higher security
costs;
●
the impact of
losses resulting from civil disturbances, strikes, natural
disasters, terrorist acts or acts of war;
●
significant fixed
expenditures associated with each investment property, such as debt
service payments, real estate taxes, insurance and maintenance
costs;
●
declines in the
financial condition of our tenants and our ability to collect rents
when due;
●
changes in our or
our tenants’ ability to provide for adequate maintenance and
insurance that result in a reduction in the useful life of a
property; and
●
changes in law or
governmental regulations (such as those governing usage, zoning and
real property taxes) or changes in the exchange controls or
government action (such as expropriation).
If any
one or more of the foregoing conditions were to affect IRSA’s
activities, this could have a material adverse effect on our
financial condition and results of operations, and as a result, on
the Company’s results.
An adverse economic environment for real estate companies and the
credit crisis may adversely affect IRSA’s results of
operations.
41
IRSA’s revenue and profit may be materially and adversely
affected by continuing inflation and economic activity in
Argentina.
The loss of tenants or the failure of IRSA’s tenants to
comply with the terms of their leases could adversely affect our
operating revenues and value of our properties.
IRSA may face risks associated with acquisitions of
properties.
●
IRSA may not be
able to obtain financing for acquisitions on favorable
terms;
●
acquired properties
may fail to perform as expected;
●
the actual costs of
repositioning or redeveloping acquired properties may be higher
than IRSA’s estimates;
●
acquired properties
may be located in new markets where IRSA may have limited knowledge
and understanding of the local economy, absence of business
relationships in the area or are unfamiliar with local governmental
and permitting procedures; and
●
IRSA may not be
able to efficiently integrate acquired properties, particularly
portfolios of properties, into IRSA’s organization and to
manage new properties in a way that allows it to realize cost
savings and synergies.
42
IRSA’s future acquisitions may not be
profitable.
IRSA seeks to
acquire additional shopping malls to the extent IRSA manages to
acquire them on favorable terms and conditions and they meet our
investment criteria. Acquisitions of commercial properties entail
general investment risks associated with any real estate
investment, including:
●
IRSA’s
estimates of the cost of improvements needed to bring the property
up to established standards for the market may prove to be
inaccurate;
●
properties IRSA
acquires may fail to achieve, within the time frames we project,
the occupancy or rental rates we expect to achieve at the time we
make the decision to acquire, which may result in the
properties’ failure to achieve the returns we
projected;
●
IRSA’s
pre-acquisitions evaluation and the physical condition of each new
investment may not detect certain defects or identify necessary
repairs, which could significantly increase our total acquisition
costs; and
●
IRSA’s
investigations of a property or building prior to its acquisition,
and any representations IRSA may receive from the seller of such
building or property, may fail to reveal various liabilities, which
could reduce the cash flow from the property or increase our
acquisition cost.
The properties IRSA acquires may be subject to unknown
liabilities.
●
liabilities for
clean-up of undisclosed environmental contamination;
●
the costs of
changes in laws or in governmental regulations (such as those
governing usage, zoning and real property taxes); and
●
liabilities
incurred in the ordinary course of business.
IRSA’s dependence on rental income may adversely affect
IRSA’s ability to meet IRSA’s debt
obligations.
●
delay lease
commencements;
●
decline to extend
or renew leases upon expiration;
●
fail to make rental
payments when due; or
●
close stores or
declare bankruptcy.
43
It may be difficult to buy and sell real estate quickly and
transfer restrictions may apply to part of IRSA’s portfolio
of properties.
Some of the land IRSA has purchased is not zoned for development
purposes, and IRSA may be unable to obtain, or may face delays in
obtaining, the necessary zoning permits and other
authorizations.
IRSA’s ability to grow will be limited if IRSA cannot obtain
additional financing.
44
Given that
IRSA’s shopping malls are open to the public, with ample
circulation of people, accidents, theft, robbery, public protest
and other incidents may occur in our facilities, regardless of the
preventative measures we adopt. In the event such an incident or
series of incidents occurs, shopping mall customers and visitors
may choose to visit other shopping venues that they believe are
safer, which may cause a reduction in the sales volume and
operating income of our shopping malls.
Argentine laws governing leases impose restrictions that limit
IRSA’s flexibility.
●
a prohibition on
including automatic price adjustment clauses based on inflation
increases in leases; and
●
the imposition of a
two-year minimum lease term for all purposes, except in particular
cases such as embassy, consulate or international organization
venues, room with furniture for touristic purposes for less than
three months, custody and bailment of goods, exhibition or offering
of goods in fairs or in cases where due to the circumstances, the
subject matter of the lease requires a shorter term.
As a
result, IRSA is exposed to the risk of higher rates of inflation
under IRSA’s leases, and any exercise of rescission rights by
our tenants could materially and adversely affect IRSA’s
business and results of operations. IRSA cannot assure you that
IRSA’s tenants will not exercise such right, especially if
rental rates stabilize or decline in the future or if economic
conditions continue to deteriorate.
On
October 1, 2014, the Argentine Congress adopted the amended Civil
and Commercial Code which is in force since August 1, 2015 (the
“Argentine Civil and Commercial Code”) which provides
that leases must have a minimum term of two years and a maximum
term of 20 years for residential properties and of 50 years for
non-residential. The Argentine Civil and Commercial Code modifies
the regime applicable to contractual provisions relating to foreign
currency payment obligations by establishing that such obligations
may be discharged in Pesos.
The
prior legal framework required that debtors could only discharge
their foreign currency payment obligations by paying in that
currency. Although judicial decisions have held that this feature
of the regulation can be set aside by the parties to an agreement,
it is too early to determine if this is legally enforceable.
Moreover, there are not enough judicial decisions on the scope of
this amendment and, in particular, its impact on the ability of
landlords and tenants to set aside the new provision and enforce
such agreements before an Argentine court. In recent years certain
rulings have been rendered affirming the obligation of a tenant to
pay in foreign currency if the obligation was freely
assumed.
IRSA may be liable for certain defects in IRSA’s
buildings.
IRSA could have losses if we have to resort to eviction proceedings
in Argentina to collect unpaid rent because such proceedings are
complex and time-consuming.
45
The recurrence of a credit crisis could have a negative impact on
IRSA’s major customers, which in turn could materially
adversely affect IRSA’s results of operations and
liquidity.
IRSA is subject to risks inherent to the operation of office
buildings that may affect IRSA’s profitability.
●
lower demand for
office space;
●
a deterioration in
the financial condition of our tenants that causes defaults under
leases due to lack of liquidity, access to capital or for other
reasons;
●
difficulties or
delays renewing leases or re-leasing space;
●
decreases in rents
as a result of oversupply, particularly offerings at newer or
re-developed properties;
●
competition from
developers, owners and operators of office properties and other
commercial real estate, including sublease space available from our
tenants;
●
maintenance, repair
and renovation costs incurred to maintain the competitiveness of
our office buildings;
●
exchange controls
that may interfere with their ability to pay rents that generally
are pegged to the U.S. dollar;
●
the
consequences of a
pandemic, epidemic or disease outbreak that would produce lower
demand for offices spaces; and
●
an increase in our
operating costs, caused by inflation or by other factors could have
a material adverse effect on us if our tenants are unable to pay
higher rent as a result of increased expenses.
IRSA’s investment in property development and management
activities may be less profitable than IRSA
anticipate.
●
abandonment of
development opportunities and renovation proposals;
●
construction costs
may exceed our estimates for reasons including higher interest
rates or increases in the cost of materials and labor, making a
project unprofitable;
●
occupancy rates and
rents at newly completed properties may fluctuate depending on a
number of factors, including market and economic conditions,
resulting in lower than projected rental revenue and a
corresponding lower return on our investment;
46
●
pre-construction
buyers may default on their purchase contracts or units in new
buildings may remain unsold upon completion of
construction;
●
lack of affordable
financing alternatives in the private and public debt
markets;
●
sale prices of
residential units may be insufficient to cover development
costs;
●
construction and
lease commencements may not be completed on schedule, resulting in
increased debt service expense and construction costs;
●
failure or delays
in obtaining necessary zoning, land-use, building, occupancy and
other required governmental permits and authorizations, or building
moratoria and anti-growth legislation;
●
significant time
lags between the commencement and completion of projects subjects
us to greater risks due to fluctuation in the general
economy;
●
construction may be
delayed because of a number of factors, including weather, strikes
or delays in receipt of zoning or other regulatory approvals, or
man-made or natural disasters, resulting in increased debt service
expense and construction costs;
●
changes in our
tenants’ demand for rental properties outside of Buenos
Aires; and
●
IRSA may incur
capital expenditures that require considerable time and effort and
which may never be completed due to government restrictions or
overall market conditions.
Greater than expected increases in construction costs could
adversely affect the profitability of IRSA’s new
developments.
47
IRSA’s real estate activities are highly concentrated in the Buenos Aires metropolitan area, where the real estate market is highly competitive due to a scarcity of properties in sought-after locations and the increasing number of local and international competitors. Furthermore, the Argentine real estate industryis generally highly competitive and fragmented and does not have high barriers to entry restricting new competitors from entering the market. The main competitive factors in the real estate development business include availability and location of land, price, funding, design, quality, reputation and partnerships with developers. A number of residential and commercial developers and real estate services companies compete with us in seeking land for acquisition, financial resources for development and prospective purchasers and tenants. Other companies, including joint ventures of foreign and local companies, have become increasingly active in the real estate business and shopping mall business in Argentina, further increasing this competition. To the extentthat one or more of our competitors are able to acquire and develop desirable properties, as a result of greater financial resources or otherwise, our business could be materially and adversely affected. If we are not able to respond to such pressures as promptly as our competitors, or the level of competition increases, our financial condition and results of our operations could be adversely affected.
Some potential losses are not covered by insurance and certain
kinds of insurance coverage may become prohibitively
expensive.
48
Demand for IRSA’s premium properties, aimed at high-income
consumers, may not be sufficient.
IRSA’s level of debt may adversely affect our operations and
our ability to pay IRSA’s debt as it becomes
due.
49
IRSA is subject to risks affecting the hotel industry.
●
our ability to form
successful relationships with international and local operators to
run our hotels;
●
changes in tourism
and travel trends, including seasonal changes and changes due to
pandemic outbreaks, such as the Influenza A Subtype H1N1 and Zika
viruses, a potential Ebola outbreak, among others, or weather
phenomena’s or other natural events, such as the eruption of
the Puyehué and the Calbuco volcano in June 2011 and April
2015, respectively;
●
affluence of
tourists, which can be affected by a slowdown in global economy;
and
●
taxes and
governmental regulations affecting wages, prices, interest rates,
construction procedures and costs.
The shift by consumers to purchasing goods over the Internet, where
barriers to entry are low, may negatively affect sales at
IRSA’s shopping malls.
50
Labor relations may negatively impact to IRSA.
IRSA’s results of operations include unrealized revaluation
adjustments on investment properties, which may fluctuate
significantly over financial periods and may materially and
adversely affect IRSA’s business, results of operations and
financial condition.
51
Due to the currency mismatches between IRSA’s assets and
liabilities, IRSA has high currency exposure.
As of
June 30, 2020 the majority of our liabilities in our Operations
Center in Argentina, such as our Series 1 and 2 Notes, the Series 2
and 4 Notes issued by IRSA’s subsidiary IRSA Commercial
Properties (“IRSA CP”) (which were fully canceled on
September 14, 2020),
and IRSA’s Series 8 and 9
Notes issued on November 12, 2020, were denominated in U.S. dollars
while IRSA’s revenues are mainly denominated in Pesos. This
currency gap and restrictions to access to foreingn exchange
markets to acquire the required U.S. dollars to pay our U.S. dollar
denominated debt exposes us to a risk of volatility, which
circumstances may adversely affect our financial results if the
U.S. dollar appreciates against the Peso and may affected our
ability to our U.S. dollar denominated debt. Any depreciation of
the Peso against the U.S. dollar increases the nominal amount of
our debt in Pesos, which further adversely affects IRSA’s
results of operation and financial condition and may increase the
collection risk of IRSA’s leases and other receivables from
IRSA’s tenants and mortgagees, most of which generate Peso
denominated revenues.
52
Property ownership through joint ventures or investees may limit
our ability to act exclusively in our interest.
Dividend restrictions in our subsidiaries may have an adverse
effect on us.
53
IRSA is dependent on our Board of Directors senior management and
other key personnel.
IRSA may face potential conflicts of interest relating to our
principal shareholders.
Risks Related to IRSA’s Investment in Banco
Hipotecario
As of
June 30, 2020, IRSA owned approximately 29.91% of the outstanding
capital stock of Banco Hipotecario S.A. (“Banco
Hipotecario”), which represented 1.7% of its consolidated
assets from its operations center in Argentina as of such date. All
of Banco Hipotecario’s operations, properties and customers
are located in Argentina. Accordingly, the quality of Banco
Hipotecario’s loan portfolio, financial condition and results
of operations depend on economic, regulatory and political
conditions prevailing in Argentina. These conditions include growth
rates, inflation rates, exchange rates, changes to interest rates,
changes to government policies, social instability and other
political, economic or international developments either taking
place in, or otherwise affecting, Argentina.
The short-term structure of the deposit base of the Argentine
financial system, including Banco Hipotecario, could lead to a
reduction in liquidity levels and limit the long-term expansion of
financial intermediation.
Given
the short-term structure of the deposit base of the Argentine
financial system, credit lines are also predominantly short-term,
with the exception of mortgages, which represent a low proportion
of the existing credit base. Although liquidity levels are
currently reasonable, no assurance can be given that these levels
will not be reduced due to a future negative economic scenario.
Therefore, there is still a risk of low liquidity levels that could
increase funding cost in the event of a withdrawal of a significant
amount of the deposit base of the financial system, and limit the
long-term expansion of financial intermediation including Banco
Hipotecario.
The
growth and profitability of Argentina’s financial system
partially depend on the development of long-term funding. During
the last year, Central Bank reserves registered an abrupt fall
mainly due to U.S. Dollars sales by the Central Bank and the
National Treasury to the private sector; cancellation of public
debt; and outflow of dollar deposits from the private sector. As a
consequence, there is a reduction of loans denominated in U.S.
Dollars and there is low liquidity of U.S. Dollars in the market.
If this trend continues, the financial banking system could result
affected. Since most deposits in the Argentine financial system are
short-term, a substantial portion of the loans have the same or
similar maturities, and there is a small portion of long-term
credit lines. The uncertainty with respect to the level of
inflation in future years is a principal obstacle to a faster
recovery of Argentina’s private sector long-term lending.
This uncertainty has had, and may continue to have a significant
impact on both the supply of and demand for long-term loans as
borrowers try to hedge against inflation risk by borrowing at fixed
rates while lenders hedge against inflation risk by offering loans
at floating rates. If longer-term financial intermediation activity
does not grow, the ability of financial institutions, including
Banco Hipotecario, to generate profits will be negatively
affected.
54
Banco Hipotecario issues debt in the local and international
capital markets as one of its main sources of funding and its
capacity to successfully access the local and international markets
on favorable terms affects its cost of funding.
In
recent years, Banco Hipotecario has diversified its financing
sources based on its greater presence in the local and
international capital markets. As of June 30, 2020, Banco
Hipotecario’s financial indebtedness accounted for 37.8% of
its financing. Likewise, as of June 30, 2020, the issuance of notes
represented 29.7% of its total liabilities. The ability of Banco
Hipotecario to successfully access the local and international
capital markets and on acceptable terms depends largely on capital
markets conditions prevailing in Argentina and internationally.
Banco Hipotecario has no control over capital markets conditions,
which can be volatile and unpredictable. If Banco Hipotecario is
unable to issue debt in the local and/or international capital
markets and on terms acceptable, whether as a result of
regulations, a deterioration in capital markets conditions or
otherwise, Banco Hipotecario would likely be compelled to seek
alternatives for funding, which may include short-term or more
expensive funding sources. If this were to happen, Banco
Hipotecario may be unable to fund our liquidity needs at
competitive costs and Banco Hipotecario business results of
operations and financial condition may be materially and adversely
affected. On October 9, 2020, the Banco Hipotecario successfully
completed the placement and issuance of its Series No.4 Notes in an
aggregate amount of USD78,336,000. This Exchange Offer was carried
out as a consequence of the new restrictions on access to the
Foreign Exchange Market to obtain United States dollars since
additional conditions have been established under Communication
“A” 7106 for the purchase of foreign currency intended
for repayment of principal maturing between October 15, 2020 and
March 31, 2021 in respect of the issuance of foreign
currency-denominated debt securities registered with official
registries in Argentina by private sector clients or the entities
themselves.The Series No.4 Notes due 2025, which will bear an
interest at a fixed rate of 9.750% per annum and are, payable on a
semiannual basis, were issued at a price of 100% of face value in
the context of the exchange of Banco Hipotecario’s USD
130,560,000 face value of its Outstanding 9.750% Series 29 Notes
due 2020.
In accordance
with the provisions of the Offer Documents, the nominal value of
existing Notes submitted for in kind represented approximately
46.66% of the total amount of the Notes, the remainder will be
cancelled by the bank.
The stability of the financial system depends upon the ability of
financial institutions, including Banco Hipotecario, to maintain
and increase the confidence of depositors.
The
measures implemented by the Argentine government in late 2001 and
early 2002, in particular the restrictions imposed on depositors to
withdraw money freely from banks and the “pesification”
and restructuring of their deposits, were strongly opposed by
depositors due to the losses on their savings and undermined their
confidence in the Argentine financial system and in all financial
institutions operating in Argentina.
If
depositors once again withdraw their money from banks in the
future, there may be a substantial negative impact on the manner in
which financial institutions, including Banco Hipotecario, conduct
their business, and on their ability to operate as financial
intermediaries. Loss of confidence in the international financial
markets may also adversely affect the confidence of Argentine
depositors in local banks.
In the
future, an adverse economic situation, even if it is not related to
the financial system, could trigger a massive withdrawal of capital
from local banks by depositors, as an alternative to protect their
assets from potential crises. Any massive withdrawal of deposits
could cause liquidity issues in the financial sector and,
consequently, a contraction in credit supply.
The
occurrence of any of the above could have a material and adverse
effect on Banco Hipotecario’s expenses and business, results
of operations and financial condition.
55
The asset quality of financial institutions is exposed to the
non-financial public sector’s and Central Bank’s
indebtedness.
Financial
institutions carry significant portfolios of bonds issued by the
Argentine government and by provincial governments as well as loans
granted to these governments. The exposure of the financial system
to the non-financial public sector’s indebtedness had been
shrinking steadily, from 49.0% of total assets in 2002 to 10.0% as
of June 30, 2020. To an extent, the value of the assets held by
Argentine banks, as well as their capacity to generate income, is
dependent on the creditworthiness of the non-financial public
sector, which is in turn tied to the government’s ability to
foster sustainable long-term growth, generate fiscal revenues and
reduce public expenditure.
In
addition, financial institutions currently carry securities issued
by the Central Bank in their portfolios, which generally are
short-term. As of June 30, 2020 such securities issued by the
Central Bank represented approximately 27.0% of the total assets of
the Argentine financial system. As of June 30, 2020, Banco
Hipotecario’s total exposure to the public sector was ARS
2,669.5 million, which represented 2.2% of its assets as of that
date, and the total exposure to securities issued by the Central
Bank was ARS 13,581.5 million, which represented 11.2% of its total
assets as of June 30, 2020,
The quality of Banco Hipotecario’s assets and that of other
financial institutions may deteriorate if the Argentine private
sector is affected by economic events in Argentina or international
macroeconomic conditions.
The
capacity of many Argentine private sector debtors to repay their
loans has in the past deteriorated as a result of certain economic
events in Argentina or macroeconomic conditions, materially
affecting the asset quality of financial institutions, including
us. The ratio of non-performing private sector loans has increased
in recent years, as Argentina’s economic outlook
deteriorated. Banco Hipotecario recorded non-performing loan ratios
of 3.8%, 6.0%, 12.3% and 12.7% for 2017, 2018, 2019 and 2020
respectively. The quality of its loan portfolio is highly sensitive
to economic conditions prevailing from time to time in Argentina,
and as a result if Argentina were to experience adverse
macroeconomic conditions, the quality of Banco Hipotecario’s
loan portfolio and the recoverability of our loans would likely be
adversely affected. This might affect the creditworthiness of Banco
Hipotecario’s loan portfolio and the results of
operations.
The Consumer Protection Law may limit some of the rights afforded
to Banco Hipotecario.
Argentine
Law No. 24,240 (the “Consumer Protection Law”) sets
forth a series of rules and principles designed to protect
consumers, which include Banco Hipotecario’s customers. The
Consumer Protection Law was amended by Law No. 26,361 on March 12,
2008 to expand its applicability and the penalties associated with
violations thereof. Additionally, Law No. 25,065 (as amended by Law
N° 26,010 and Law N° 26,361, the “Credit Card
Law”) also sets forth public policy regulations designed to
protect credit card holders. Recent Central Bank regulations, such
as Communication “A” 5388, also protect consumers of
financial services.
In
addition, the Civil and Commercial Code has a chapter on consumer
protection, stressing that the rules governing consumer relations
should be applied and interpreted in accordance with the principle
of consumer protection and that a consumer contract should be
interpreted in the sense most favorable to it. The applicationof
both the Consumer Protection Law and the Credit Card Law by
administrative authorities and courts at the federal, provincial
and municipal levels has increased. This trend has increased
general consumer protection levels. If Banco Hipotecario is found
to be liable for violations of any of the provisions of these laws,
the potential penalties could limit some of Banco
Hipotecario’s rights, for example, with respect to its
ability to collect payments due from services and financing
provided by us, and adversely affect Banco Hipotecario’s
financial results of operations.
We
cannot assure you that court and administrative rulings based on
the newly-enacted regulation or measures adopted by the enforcement
authorities will not increase the degree of protection given to
Banco Hipotecario’s debtors and other customers in the
future, or that they will not favor the claims brought by consumer
groups or associations. This may prevent or hinder the collection
of payments resulting from services rendered and financing granted
by us, which may have an adverse effect on Banco
Hipotecario’s business and results of
operations.
56
Class actions against financial institutions for unliquidated
amounts may adversely affect the financial system’s
profitability.
Certain
public and private organizations have initiated class actions
against financial institutions in Argentina. The National
Constitution and the Consumer Protection Law contain certain
provisions regarding class actions. However, their guidance with
respect to procedural rules for instituting and trying class action
cases is limited. Nonetheless, through an ad hoc doctrine,
Argentine courts have admitted class actions in some cases,
including various lawsuits against financial entities related to
“collective interests” such as alleged overcharging on
products, interest rates and advice in the sale of public
securities, etc. If class action plaintiffs were to prevail against
financial institutions, their success could have an adverse effect
on the financial industry in general and indirectly on Banco
Hipotecario’s business.
Banco Hipotecario operates in a highly regulated environment and
its operations are subject to capital controls regulations adopted
by several regulatory agencies.
Financial
institutions are subject to a major number of regulations
concerning functions historically determined by the Central Bank
and other regulatory authorities. The Central Bank may penalize
Banco Hipotecario and its directors, members of the Executive
Committee and members of its Supervisory Committee, in the event of
any breach of the applicable regulation. Potential sanctions, for
any breach on the applicable regulations may vary from
administrative and/or disciplinary penalties to criminal sanctions.
Similarly, the CNV, which authorizes securities offerings and
regulates the capital markets in Argentina, has the authority to
impose sanctions on us and Banco Hipotecario’s Board of
Directors for breaches of corporate governance established in the
capital markets laws and the CNV Rules. The Financial Information
Unit (Unidad de Información Financiera, or “UIF”
as per its acronym in Spanish) regulates matters relating to the
prevention of asset laundering and has the ability to monitor
compliance with any such regulations by financial institutions and,
eventually, impose sanctions.
We
cannot assure you whether such regulatory authorities will commence
proceedings against Banco Hipotecario, its shareholders, directors
or its Supervisory Committee, or penalize Banco Hipotecario. Banco
Hipotecario has adopted “Know Your Customer” and other
policies and procedures to comply with its duties under currently
applicable rules and regulations.
In
addition to regulations specific to the banking industry, Banco
Hipotecario is subject to a wide range of federal, provincial and
municipal regulations and supervision generally applicable to
businesses operating in Argentina, including laws and regulations
pertaining to labor, social security, public health, consumer
protection, the environment, competition and price controls. We
cannot assure you that existing or future legislation and
regulation will not require material expenditures by Banco
Hipotecario or otherwise have a material adverse effect on Banco
Hipotecario’s consolidated operations.
The effects of legislation that restricts our ability to pursue
mortgage foreclosure proceedings could adversely affect
us.
The
ability to pursue foreclosure proceedings through completion, in
order to recover on defaulted mortgage loans, has an impact on
financial institutions activities. On December 13, 2006, pursuant
to Law No. 26,177, the “Restructuring Unit Law” was
created to allow all mortgage loans to be restructured between
debtors and the former Banco Hipotecario Nacional, insofar as such
mortgages had been granted prior to the effectiveness of the
Convertibility Law. Law No. 26,313, the “Pre-convertibility
Mortgage Loans Restructuring Law,” was enacted by the
Argentine Congress on November 21, 2007 and partially signed into
law on December 6, 2007 to establish the procedure to be followed
in the restructuring of mortgage loans within the scope of Section
23 of the Mortgage Refinancing System Law in accordance with the
guidelines established by the Restructuring Unit Law. To this end,
a recalculation was established for certain mortgage loans
originated by the former Banco Hipotecario Nacional before April 1,
1991.
Executive
Branch Decree No. 2,107/08 issued on December 19, 2008 regulated
the Pre-convertibility Mortgage Loans Restructuring Law and
established that the recalculation of the debt applies to the
individual mortgage loans from global operations in effect on
December 31, 2008 and agreed upon prior to April 1, 1991, and in
arrears at least since November 2007 and remaining in arrears on
December 31, 2008. In turn, the Executive Branch Decree No.
1,366/10, published on September 21, 2010, expanded the universe of
Pre-convertibility loans subject to restructuring to include the
individual mortgage loans not originating in global operations
insofar as they met the other requirements imposed by Executive
Branch Decree No. 2,107/08. In addition, Law No. 26,313 and its
regulatory decrees also condoned the debts on mortgage loans
granted before the Convertibility Law in so far as they had been
granted to deal with emergency situations and in so far as they met
the arrears requirement imposed on the loans subject to
recalculation.
57
Subject
to the Central Bank’s supervision, Banco Hipotecario
implemented the recalculation of mortgage loans within the scope of
the aforementioned rules by adjusting the value of the new
installments to a maximum amount not in excess of 20% of household
income. In this respect, we estimate that Banco Hipotecario has
sufficient loan loss provisions to face any adverse economic impact
on the portfolio involved. We cannot assure that the Argentine
government will not enact additional laws restricting our ability
to enforce our rights as a creditor and/or imposing a condition or
a reduction of principal on the amounts unpaid in our mortgage loan
portfolio. Any such circumstance could have a significant adverse
effect on our financial condition and the results of our
operations.
Increased competition and M&A activities in the banking
industry may adversely affect Banco Hipotecario.
Banco
Hipotecario foresees increased competition in the banking sector.
If the trend towards decreasing spreads is not offset by an
increase in lending volumes, the ensuing losses could lead to
mergers in the industry. These mergers could lead to the
establishment of larger, stronger banks with more resources than
us. Therefore, although the demand for financial products and
services in the market continues to grow, competition may adversely
affect Banco Hipotecario’s results of operations, resulting
in shrinking spreads and commissions.
Future governmental measures may adversely affect the economy and
the operations of financial institutions.
The
Argentine government has historically exercised significant
influence over the economy, and financial institutions, in
particular, have operated in a highly regulated environment. We
cannot assure you that the laws and regulations currently governing
the economy or the banking sector will remain unaltered in the
future or that any such changes will not adversely affect Banco
Hipotecario’s business, financial condition or results of
operations and Banco Hipotecario’s ability to honor its debt
obligations in foreign currency.
Several
legislative bills to amend the Financial Institutions Law have been
sent to the Argentine Congress. If the law currently in force were
to be comprehensively modified, the financial system as a whole
could be substantially and adversely affected. If any of these
legislative bills were to be enacted or if the Financial
Institutions Law were amended in any other way, the impact of the
subsequent amendments to the regulations on the financial
institutions in general, Banco Hipotecario’s business, its
financial condition and the results of operations is
uncertain.
Law No.
26,739 was enacted to amend the Central Bank’s charter, the
principal aspects of which are: (i) to broaden the scope of the
Central Bank’s mission (by establishing that such institution
shall be responsible for financial stability and economic
development while pursuing social equity); (ii) to change the
obligation to maintain an equivalent ratio between the monetary
base and the amount of international reserves; (iii) to establish
that the board of directors of the institution will be the
authority responsible for determining the level of reserves
required to guarantee normal operation of the foreign exchange
market based on changes in external accounts; and (iv) to empower
the monetary authority to regulate and provide guidance on credit
through the financial system institutions, so as to “promote
long-term production investment.”
In
addition, the Civil and Commercial Code, among other things,
modifies the applicable regime for contractual provisions relating
to foreign currency payment obligations by establishing that
foreign currency payment obligations may be discharged in Pesos.
This amends the legal framework, pursuant to which debtors may only
discharge their foreign currency payment obligations by making
payment in the specific foreign currency agreed upon in their
agreements; provided however that the option to discharge in Pesos
a foreign currency obligation may be waived by the debtor is still
under discussion. However, in recent years some court decisions
have established the obligation to pay the in foreign currency when
it was so freely agreed by the parties. We are not able to ensure
that any current or future laws and regulations (including, in
particular, the amendment to the Financial Institutions Law and the
amendment to the Central Bank’s charter) will not result in
significant costs to Banco Hipotecario, or will otherwise have an
adverse effect on Banco Hipotecario’s
operations.
58
The Covid-19 pandemic may negatively impact the operations and
financial situation of Banco
Hipotecario
In
order to mitigate the impact of the COVID-19 pandemic and mandatory
confinement across Argentina, the Central Bank took certain
measures to provide financial support to households. In particular,
the new regulations include: (i) limitations on bank holdings of
Central Bank notes in order to make funds available to borrowers
and encourage the provision of credit lines to SMEs and loans
granted in part by a state agency (the Argentine Guarantee Fund
(FoGAr)), (ii) temporary easing of bank loan classification rules
(providing an additional 60-day default period before a loan should
be classified as delinquent), (iii) financial institutions cannot
distribute dividends until, at least 30 June 2020 (term extended
until 31 December 2020 by Central Bank Communication
“A” 7,035), (iv) a capital requirement of 1.250% on
exposure to credit card loans for tourism-related purchases made
abroad, (v) a temporary prohibition on charging fees related to ATM
services, (vi) mortgage relief, freezing until September 30, 2020,
the interest and principal amount of mortgage payments based on the
amounts payable as of March 2020, and postponing any foreclosure
through September 30, 2020, (vii) the deferment of payments of
unpaid credit card balances from April to September 2020 for a
period of one year with a three-month interest-free grace period
(according to Central Bank Communications “A” 6,964 and
7,095) (viii) reduction in the maximum credit card interest rate
from 49% to 43%, and (ix) the postponement of all loan payments due
during the second and third quarters of 2020 without punitive
interest.As a result of the economic effects of the COVID-19
pandemic, Banco Hipotecario’s non-financial private sector
loan portfolio (which accounted for 35.8% of Banco
Hipotecario’s total assets as of June 30, 2020) may
experience an increase in delinquencies. In addition, the
application of IFRS 9 and the expected credit loss-based impairment
model could accelerate the recognition of loss forecasts.
Provisions for insolvencies for the six-month period ended June 30,
2020 were of ARS 710.1 million.
These
and other measures taken by the Central Bank or other government
authorities in response to the COVID-19 pandemic, as well as the
effect of the COVID-19 pandemic on the Banco Hipotecario’s
borrowers, may affect Banco Hipotecario’s business, financial
condition and results of operations, including its ability to
refinance its indebtedness as it comes due.
Banco Hipotecario’s obligations as trustee of the Programa de
Crédito Argentino del Bicentenario para la Vivienda Única
Familiar (“PROCREAR”) trust are limited.
Banco
Hipotecario currently acts as trustee of the PROCREAR Trust, which
aims to facilitate access to housing solutions by providing
mortgage loans for construction and developing housing complexes
across Argentina. Under the terms and conditions of the PROCREAR
Trust, all the duties and obligations under the trust have to be
settled with the trust estate. Notwithstanding, if the
aforementioned is not met, Banco Hipotecario could have its
reputation affected. In addition, if the Argentine government
decides to terminate the PROCREAR Trust and/or terminate Banco
Hipotecario’s role as trustee of the PROCREAR Trust, this may
adversely affect Banco Hipotecario’s results of
operations.
The exposure of Banco Hipotecario to individual borrowers could
lead to higher levels of past due loans, allowances for loan losses
and charge-offs.
A
substantial portion of Banco Hipotecario’s loan portfolio
consists of loans to individual customers in the lower-middle to
middle income segments of the Argentine population. The quality of
Banco Hipotecario’s portfolio of loans to individuals is
dependent to a significant extent on economic conditions prevailing
from time to time in Argentina. Lower-middle to middle income
individuals are more likely to be exposed to and adversely affected
by adverse developments in the Argentine economy than corporations
and high-income individuals. As a result, lending to these segments
represents higher risk than lending to such other market segments.
Consequently, Banco Hipotecario may experience higher levels of
past due amounts, which could result in higher provisions for loan
losses. Therefore, there can be no assurance that the levels of
past due amounts and subsequent charge-offs will not be materially
higher in the future.
59
An increase in fraud or transaction errors may adversely affect
Banco Hipotecario.
As with
other financial institutions, Banco Hipotecario is susceptible to,
among other things, fraud by employees or outsiders, unauthorized
transactions by employees and other operational errors (including
clerical or record keeping errors and errors resulting from faulty
computer or telecommunications systems). Given the high volume of
transactions that may occur at a financial institution, errors
could be repeated or compounded before they are discovered and
remedied. In addition, some of our transactions are not fully
automated, which may further increase the risk that human error or
employee tampering will result in losses that may be difficult to
detect quickly or at all. Losses from fraud by employees or
outsiders, unauthorized transactions by employees and other
operational errors might adversely affect Banco Hipotecario’s
reputation, business, the results of operations and financial
condition.
Risks Relating to IRSA’s Operations Center in
Israel
On
September 25, 2020, the District Court in Tel Aviv-Jaffa (the
“Court”), in response to a petition from IDBD’s
creditors, declared the insolvency of IDBD and initiated
liquidation proceedings (the “Liquidation
Proceedings”). The Court appointed a trustee for IDBD’s
shares and receivers for DIC’s and Clal’s shares. We
are analyzing together with our local and international advisors
the decision, including alternatives and courses of action.
Insolvency proceedings will be governed by Israeli law, which are
different from the corporate insolvency or bankruptcy laws of the
United States. We cannot assure that we will be successful in
avoiding liquidation by converting such liquidation proceedings to
a reorganization, which would permit us to develop and propose, for
creditor and court approval, a reorganization plan that would
enable us to continue having a controlling stake in and managing
IDBD. Even if we were to propose a reorganization plan, any
reorganization plan would likely require that we obtain new
post-petition funding, which may be unavailable. Further, in the
event of bankruptcy, IDBD’s secured creditors that have
encumbrances on all of its assets would likely execute and take all
of its assets, which may leave nothing for its other creditors or
its stockholders.
Our
investment in IDBD is without recourse to IRSA. IDBD’s debt
is not guaranteed by IRSA’s assets. Therefore, IRSA’s
financial risk with respect to its investment in Israel is limited
to the value of such investment However, we cannot guarantee that
the liquidation of IDBD will not result in legal claims against our
directors or that it may adversely affect our reputation and,
consequently, our business, the outcome of our operations and our
financial situation.
Capital contributions to IDBD, and any such capital contributions
may be subject to claims by creditors.
On
September 7, 2020, IRSA reported that with respect to the
commitment to make capital contributions in the sum of NIS
70,000,000 on September 2, 2020 and other NIS 70,000,000 on
September 2, 2021 the Company has considered that there are doubts
as to the fulfilment of the conditions established for making such
contributions and has therefore resolved not to make the 2020 NIS
70 million capital contribution.
60
61
Risks Related to the ADSs and the Common Shares.
Common shares eligible for sale could adversely affect the price of
our common shares and ADSs.
The
market prices of our common shares and ADS could decline as a
result of sales by our existing shareholders of common shares or
ADSs, or the perception that these sales could occur. These sales
also might make it difficult for us to raise capital by selling
equity securities at a time and at the conditions that we may
deemed appropriate. Eduardo Elsztain, which as of June 30,
2020, was the beneficial owner of approximately 36.9% of our common
shares (or approximately 185,229,897 common shares which may be
exchanged for an aggregate of 18,522,989 ADSs, for more information
see “Item 6. Directors, Senior Management and Employees - E.
Share Ownership”), may sell or otherwise dispose of any or
all of its common shares or ADSs at any time. Sales of a large
number of our common shares and/or ADSs may have an adverse effect
on the market price of our common shares and the ADSs.
If we issue additional equity securities in the future, you may
suffer dilution, and trading prices for our equity securities may
decline.
We may
issue additional shares of our common stock for financing future
acquisitions or new projects or for other general corporate
purposes. Any such issuance could result in a dilution of your
ownership stake and/or the perception of any such issuances could
have an adverse impact on the market price of the
ADSs.
We are subject to certain different corporate disclosure
requirements and accounting standards than domestic issuers of
listed securities in the United States
There
is less publicly available information about the issuers of
securities listed on the Argentine stock exchanges than information
publicly available about domestic issuers of listed securities in
the United States and certain other countries.
Although
the ADSs are listed on the NASDAQ Global Market, as a foreign
private issuer we are able to rely on home country governance
requirements rather than relying on the NASDAQ corporate governance
requirements. See “Item 16G. Corporate
Governance—Compliance with NASDAQ listing Standards on
Corporate Governance.” Additionally, as a foreign private
issuer, we are exempt from certain rules under the Exchange Act
including (i) the sections of the Exchange Act regulating the
solicitation of proxies, consents or authorizations in respect of a
security registered under the Exchange Act; (ii) the sections
of the Exchange Act requiring insiders to file public reports of
their stock ownership and trading activities and liability for
insiders who profit from trades made in a short period of time; and
(iii) the rules under the Exchange Act requiring the filing
with the SEC of quarterly reports on Form 10-Q containing
unaudited financial and other specified information, or current
reports on Form 8-K, upon the occurrence of specified
significant events. In addition, foreign private issuers are not
required to file their annual report on Form 20-F until four
months after the end of each fiscal year, while U.S. domestic
issuers that are accelerated filers are required to file their
annual report on Form 10-K within 75 days after the end
of each fiscal year. Foreign private issuers are also exempt from
the Regulation Fair Disclosure, aimed at preventing issuers from
making selective disclosures of material information. As a result
of the above, you may not have the same protections afforded to
shareholders companies that are not foreign private
issuers.
Investors may not be able to effect service of process within the
U.S., limiting their recovery of any foreign judgment.
We are a publicly held corporation (sociedad anónima)
organized under the laws of Argentina. Most of our directors and
our senior managers, are located in Argentina. As a result, it may
not be possible for investors to effect service of process within
the United States upon us or such persons or to enforce against us
or them in United States courts judgments obtained in such courts
predicated upon the civil liability provisions of the United States
federal securities laws. We have been advised by our Argentine
counsel, Zang, Bergel & Viñes, that there is doubt
whether the Argentine courts will enforce, to the same extent and
in as timely a manner as a U.S. or foreign court, an action
predicated solely upon the civil liability provisions of the United
States federal securities laws or other foreign regulations brought
against such persons or against us.
62
If we are considered to be a passive foreign investment company for
United States federal income tax purposes, U.S. holders of our
common shares or ADSs would suffer negative
consequences.
Based
on the past and projected composition of our income and assets and
the valuation of our assets, including goodwill, we do not believe
we were a passive foreign investment company, or
“PFIC,” for United States federal income tax purposes
for the taxable year ending June 30, 2020, and do not currently
expect to become a PFIC, although there can be no assurance in this
regard. The determination of whether we are a PFIC is made
annually. Accordingly, it is possible that we may be a PFIC in the
current or any future taxable year due to changes in our asset or
income composition or if our projections are not accurate. The
volatility and instability of Argentina’s economic and
financial system may substantially affect the composition of our
income and assets and the accuracy of our projections. In addition,
this determination is based on the interpretation of certain U.S.
Treasury regulations relating to rental income, which regulations
are potentially subject to differing interpretation. If we become a
PFIC, U.S. Holders (as defined in “Item 10. Additional
Information—Taxation—United States Taxation”) of
our common shares or ADSs will be subject to certain United States
federal income tax rules that have negative consequences for U.S.
Holders such as additional tax and an interest charge upon certain
distributions by us or upon a sale or other disposition of our
common shares or ADSs at a gain, as well as reporting requirements.
See “Item 10. F—Taxation—United States
Taxation—Passive Foreign Investment Company” for a more
detailed discussion of the consequences if we are deemed a PFIC.
You should consult your own tax advisors regarding the application
of the PFIC rules to your particular circumstances.
Changes in Argentine tax laws may affect the tax treatment of our
common shares or ADSs.
On
September 12, 2013, Law No. 26,893, which amended Law
No. 20,628 (the “Income Tax Law”), was enacted and
published in the Official Gazette on September 23, 2013.
According to the amendments, the distribution of dividends by an
Argentine corporation was subject to income tax at a rate of 10.0%,
unless such dividends were distributed to Argentine corporate
entities (the “Dividend Tax”)
The
Dividend Tax was repealed by Law No. 27,260, published in the
Official Gazette on July 22, 2016, and consequently no income
tax withholding was applicable on the distribution of dividends in
respect of both Argentine and non-Argentine resident shareholders,
except when dividends distributed were greater than the income
determined according to the application of the Income Tax Law,
accumulated at the fiscal year immediately preceding the year in
which the distribution is made. In such case, the excess was
subject to a rate of 35%, for both Argentine and non-Argentine
resident shareholders. This treatment still applies to dividends to
be distributed at any time out of retained earnings accumulated
until the end of the last fiscal year starting before
January 1, 2018.
However,
pursuant to Law No. 27,430, as amended by Law No. 27,541, dividends
to be distributed out of earnings accrued in fiscal years starting
on or after January 1, 2018, and other profits paid in cash or
in kind —except for stock dividends or quota dividends—
by companies and other entities incorporated in Argentina referred
to in the Income Tax Law, to Argentine resident individuals,
resident undivided estates and foreign beneficiaries will be
subject to income tax at a 7% rate on profits accrued during fiscal
years starting on January 1, 2018 to December 31, 2019, and at a
13% rate on profits accrued in fiscal years starting on January
1, 2020 and onwards. If dividends are distributed to Argentine
corporate taxpayers (in general, entities organized or incorporated
under Argentine law, certain traders and intermediaries, local
branches of foreign entities, sole proprietorships and individuals
carrying on certain commercial activities in Argentina), no
dividend tax should apply.
Nevertheless,
the initial date for the application of the tax rates mentioned
above was modified by Law No. 27,541, published in the Official
Gazette on December 23, 2019. According to said law and recent
interpretations made by the Federal Tax Department, the 7% tax rate
is currently applicable for fiscal years starting on, or prior to
December 31, 2020 and the 13% tax rate is applicable for fiscal
years starting as from January 1, 2021.
In
addition, capital gains originated from the disposal of shares and
other securities, including securities representing shares and
deposit certificates, are subject to capital gains tax. Law
No. 27,430 effective as of January 1, 2018, provides that
capital gains obtained by Argentine resident individuals from the
disposal of shares and ADSs are exempt from capital gains tax in
the following cases: (i) when the shares are placed through a
public offering authorized by the CNV, (ii) when the shares
are traded in stock markets authorized by the CNV, under segments
that ensure priority of price-time and interference of offers,
and/or (iii) when the sale, exchange or other disposition of
shares is made through an initial public offering and/or exchange
of shares authorized by the CNV.
63
Such
law also provides that the capital gains tax applicable to
non-residents for transactions entered into until December 30,
2017 is still due, although no taxes will be claimed to
non-residents with respect to past sales of Argentine shares or
other securities traded in the CNV’s authorized markets (such
as ADSs) as long as the cause of the non-payment was the absence of
regulations stating the mechanism of tax collection at the time the
transaction was closed. General Resolution (AFIP) No. 4,227,
which came into effect on April 26, 2018, stipulates the
procedures through which the income tax should be paid to the AFIP.
The payment of capital gains tax applicable for transactions
entered into before December 30, 2017 was due on June 11,
2018.
In
addition, Decree No. 824/2019, published in the Official Gazette on
December 6, 2019 and which introduced the new consolidated text of
the Income Tax Law- maintains the 15% capital gains tax (calculated
on the actual net gain or a presumed net gain equal to 90% of the
sale price) on the disposal of shares or securities by
non-residents. However, non-residents are exempt from the capital
gains tax on gains obtained from the sale of (a) Argentine shares
in the following cases: (i) when the shares are placed through a
public offering authorized by the CNV, (ii) when the shares were
traded in stock markets authorized by the CNV, under segments that
ensure priority of price-time and interference of offers, and/or
(iii) when the sale, exchange or other disposition of shares is
made through an initial public offering and/or exchange of shares
authorized by the CNV; and (b) depositary shares or depositary
receipts issuedabroad, when the underlying securities are shares
(i) issued by Argentine companies, and (ii) with authorization of
public offering. The exemptions will only apply to the extent the
foreign beneficiaries reside in, and the funds used for the
investment proceed from, jurisdictions not considered as not
cooperating for purposes of fiscal transparency.
In case
the exemption is not applicable and, to the extent foreign
beneficiaries neither reside in, nor the funds arise from,
jurisdictions considered as not cooperating for purposes of fiscal
transparency, the gain realized from the disposition of shares
would be subject to Argentine income tax at a 13.5% effective rate
on the gross price. In case such foreign beneficiaries reside in,
or the funds arise from, jurisdictions considered as not
cooperating for purposes of fiscal transparency, a 31.5% effective
rate on the gross price should apply.
Therefore,
holders of our common shares, including in the form of ADSs, are
encouraged to consult their tax advisors as to the particular
Argentine income tax consequences under their specific
facts.
Holders of our ADSs may be unable to exercise voting rights with
respect to the common shares underlying their ADSs.
As a
holder of ADS, we will not treat you as one of our shareholders and
you will not have shareholder rights. The depositary will be the
holder of the common shares underlying your ADSs and holders may
exercise voting rights with respect to the common shares
represented by the ADSs only in accordance with the deposit
agreement relating to the ADSs. There are no provisions under
Argentine law or under our bylaws that limit the exercise by ADS
holders of their voting rights through the depositary with respect
to the underlying common shares. However, there are practical
limitations on the ability of ADS holders to exercise their voting
rights due to the additional procedural steps involved in
communicating with these holders. For example, holders of our
common shares will receive notice of shareholders’ meetings
through publication of a notice in the CNV’s website, an
Official Gazette in Argentina, an Argentine newspaper of general
circulation and the bulletin of the Buenos Aires Stock Exchange,
and will be able to exercise their voting rights by either
attending the meeting in person or voting by proxy. ADS holders, by
comparison, will not receive notice directly from us. Instead, in
accordance with the deposit agreement, we will provide the notice
to the ADS Depositary. If we ask the ADS Depositary to do so, the
ADS Depositary will mail to holders of ADSs the notice of the
meeting and a statement as to the manner in which instructions may
be given by holders. To exercise their voting rights, ADS holders
must then instruct the ADS Depositary as to voting the common
shares represented by their ADSs. Under the deposit agreement, the
ADS Depositary is not required to carry out any voting instructions
unless it receives a legal opinion from us that the matters to be
voted would not violate our by-laws or Argentine law. We are not
required to instruct our legal counsel to give that opinion. Due to
these procedural steps involving the ADS Depositary, the process
for exercising voting rights may take longer for ADS holders than
for holders of common shares and common shares represented by ADSs
may not be voted as you desire.
64
Under Argentine law, shareholder rights may be fewer or less well
defined than in other
jurisdictions.
Our
corporate affairs are governed by our by-laws and by Argentine
corporate law, which differ from the legal principles that would
apply if we were incorporated in a jurisdiction in the United
States, such as the States of Delaware or New York, or in other
jurisdictions outside Argentina. In addition, your rights or the
rights of holders of our common shares to protect your or their
interests in connection with actions by our board of directors may
be fewer and less well defined under Argentine corporate law than
under the laws of those other jurisdictions. Although insider
trading and price manipulation areillegal under Argentine law, the
Argentine securities markets are not as highly regulated or
supervised as the U.S. securities markets or markets in some other
jurisdictions. In addition, rules and policies against self dealing
and regarding the preservation of shareholder interests may be less
well defined and enforced in Argentina than in the United States,
putting holders of our common shares and ADSs at a potential
disadvantage.
Restrictions on the movement of capital out of Argentina may impair
your ability to receive dividends and distributions on, and the
proceeds of any sale of, the common shares underlying the
ADSs.
The
Argentine government imposed restrictions on the conversion of
Argentine currency into foreign currencies and on the remittance to
foreign investors of proceeds from their investments in Argentina.
Argentine law currently permits the government to impose these kind
of restrictions temporarily in circumstances where a serious
imbalance develops in Argentina’s balance of payments or
where there are reasons to foresee such an imbalance. We cannot
assure you that ADS Depositary for the ADSs may hold the Pesos it
cannot convert for the account of the ADS holders who have not been
paid. No assurance can be given that payments to non-resident
investors will not suffered delays or be subject to any additional
restrictions, under the current foreign exchange market regulations
or future regulations that may be enacted. In this regard, we
suggest consulting with the corresponding custodian banks about the
exchange regulations applicable. See “Item 10. Additional
Information—D.
Exchange
Controls.”
The protections afforded to minority shareholders in Argentina are
different from and more limited than those in the United States and
may be more difficult to enforce.
Under
Argentine law, the protections afforded to minority shareholders
are different from, and much more limited than, those in the United
States and some other Latin American countries. For example, the
legal framework with respect to shareholder disputes, such as
derivative lawsuits and class actions, is less developed under
Argentine law than under U.S. law as a result of Argentina’s
short history with these types of claims and few successful cases.
In addition, there are different procedural requirements for
bringing these types of shareholder lawsuits. As a result, it may
be more difficult for our minority shareholders to enforce their
rights against us or our directors or controlling shareholder than
it would be for shareholders of a U.S. company.
We may not pay any dividends.
In
accordance with Argentine corporate law, we may pay dividends to
shareholders out of net and realized profits, if any, as set forth
in our Audited Financial Statements prepared in accordance with
IFRS. The approval, amount and payment of dividends are subject to
the approval by our shareholders at our annual ordinary
shareholders meeting. The approval of dividends requires the
affirmative vote of a majority of the shareholders entitled to vote
present at the meeting. As a result, we cannot assure you that we
will be able to generate enough net and realized profits so as to
pay dividends or that our shareholders will decide that dividends
will be paid.
65
Our ability to pay dividends is limited by law and our
by-laws.
In
accordance with Argentine corporate law, we may pay dividends in
Pesos out of retained earnings, if any, to the extent set forth in
our Audited Financial Statements prepared in accordance with IFRS.
Our shareholders’ ability to receive cash dividends may be
limited by the ability of the ADS Depositary to convert cash
dividends paid in Pesos into U.S. dollars. Under the terms of our
deposit agreement with the depositary for the ADSs, to the extent
that the depositary can in its judgment convert Pesos (or any other
foreign currency) into U.S. dollars on a reasonable basis and
transfer the resulting U.S. dollars to the United States, the
depositary will promptly as practicable convert or cause to be
converted all cash dividends received by it on the deposited
securities into U.S. dollars. If in the judgment of the depositary
this conversion is not possible on a reasonable basis (including as
a result of applicable Argentine laws, regulations and approval
requirements), the depositary may distribute the foreign currency
received by it or in its discretion hold such currency uninvested
for the respective accounts of the owners entitled to receive the
same. As a result, if the exchange rate fluctuates significantly
during a time when the depositary cannot convert the foreign
currency, you may lose some or all of the value of the dividend
distribution.
You might be unable to exercise preemptive or accretion rights with
respect to the common shares underlying your ADSs.
Under
Argentine corporate law, if we issue new common shares as part of a
capital increase, our shareholders will generally have the right to
subscribe for a proportional number of common shares of the class
held by them to maintain their existing ownership percentage, which
is known as preemptive rights. In addition, shareholders are
entitled to the right to subscribe for the unsubscribed common
shares of either the class held by them or other classes which
remain unsubscribed at the end of a preemptive rights offering, on
a pro rata basis, which is known as accretion rights. Under the
deposit agreement, the ADS Depositary will not exercise rights on
your behalf or make rights available to you unless we instruct it
to do so, and we are not required to give that instruction. In
addition, you may not be able to exercise the preemptive or
accretion rights relating to the common shares underlying your ADSs
unless a registration statement under the US Securities Act of
1933, as amended is effective with respect to those rights or an
exemption from the registration requirements of the Securities Act
is available. We are not obligated to file a registration statement
with respect to the common shares relating to these preemptive
rights, and we cannot assure you that we will file any such
registration statement. Unless we file a registration statement or
an exemption from registration is available, you may receive only
the net proceeds from the sale of your preemptive rights by the ADS
Depositary or, if the preemptive rights cannot be sold, they will
be allowed to lapse. As a result, US holders of common shares or
ADSs may suffer dilution of their interest in our company upon
future capital increases.
Our shareholders may be subject to liability for certain votes of
their securities.
Our
shareholders are not liable for our obligations. Instead,
shareholders are generally liable only for the payment of the
shares they subscribe. However, shareholders who have a conflict of
interest with us and do not abstain from voting may be held liable
for damages to us, but only if the transaction would not have been
approved without such shareholders’ votes. Furthermore,
shareholders who willfully or negligently vote in favor of a
resolution that is subsequently declared void by a court as
contrary to Argentine Companies Law or our bylaws may be held
jointly and severally liable for damages to us or to other third
parties, including other shareholders.
A. HISTORY AND DEVELOPMENT OF THE COMPANY
General Information
Our
legal name is Cresud Sociedad Anónima Comercial, Inmobiliaria,
Financiera y Agropecuaria, and our commercial name is
“Cresud.” We were incorporated and organized on
December 31, 1936 under Argentine law as a stock corporation
(
sociedad anónima
) and
were registered with the Public Registry of Commerce of the City of
Buenos Aires (
Inspección
General de Justicia
), on February 19, 1937 under number 26,
on page 2, book 45 of National By-laws Volume. Pursuant to our
bylaws, our term of duration expires on July 6, 2082. Our
headquarters are located at Moreno 877, 23rd Floor (C1091AAQ),
Ciudad Autónoma de Buenos Aires, Argentina. Our telephone is
+54 (11) 4814-7800, and our website is
www.cresud.com.ar.
66
All
references in this annual report to this or other internet sites
are inactive textual references to these URLs, or “uniform
resource locators” and are for your information reference
only. We assume no responsibility for the information contained on
these sites. Our depositary agent for the ADSs in the United States
is The Bank of New York Mellon whose address is 240 Greenwich
Street, New York, NY 10286, and whose telephone numbers are
+1-888-BNY-ADRS (+1-888-269-2377) for U. S. calls and
+1-201-680-6825 for calls outside U.S.
History
We were
incorporated in 1936 as a subsidiary of
Credit Foncier
, a Belgian company
engaged in the business of providing rural and urban loans in
Argentina. We were incorporated to manage real estate holdings
foreclosed by
Credit Foncier.
Credit Foncier
was liquidated in 1959, and as part of such
liquidation, our shares were distributed to
Credit Foncier’s
shareholders and
in 1960 were listed on the Buenos Aires Stock Exchange
(“BASE”). During the 1960s and 1970s, our business
shifted to exclusively agricultural activities.
In 1993
and 1994, Consultores Asset Management acquired, on behalf of
certain investors, approximately 22% of our shares on the BASE. In
late 1994, an investor group led by Consultores Asset Management
(including Dolphin Fund plc.) acquired additional shares increasing
their aggregate shareholding to approximately 51.4% of our
outstanding shares. In 1997, we increased our capital through a
rights offering and global public offering of ADRs representing our
common shares and listed such ADRs on the NASDAQ. We started our
agricultural activities with seven farmlands and 20,000 hectares
under management.
In
2002, we acquired a 19.85% interest in IRSA, a real estate company
related to certain shareholders of Cresud, and 2009, we increased
its ownership percentage in IRSA to 55.64% and IRSA became
Cresud’s directly principal subsidiary. As of June 30, 2020,
we had a 61.95% equity interest in IRSA (without considering
treasury shares) and a majority of our directors are also directors
of IRSA. IRSA is one of Argentina’s largest real estate
companies and is engaged in a range of diversified real estate
activities including residential properties, office buildings,
shopping malls and luxury hotels, as well as the sales and
development residential properties, it has a 29.9% interest in
Banco Hipotecario, one of the main financial institutions in the
country, and selected investments outside of Argentina. Also, IRSA
has international investments, both in the United States in
relation to the lease of office buildings (Lipstick Building) and
hotels, through “Condor” a hotel REIT in that country,
and in Israel, through IDBD and DIC, one of the largest and most
diversified investment groups of Israel, which, participates in
numerous markets and industry sectors, including real estate,
retail, agroindustry, insurance, telecommunications, among
others.
In
March 2008 we launched and offered to sell up to which 180 million
shares. In the local and international markets
, which were fully subscribed.
In
addition, each shareholder received, without additional cost, one
warrant for each share subscribed. The proceeds allowed us to
expand our international operations to Paraguay and
Bolivia.
As of
June 30, 2020, we owned, directly and though our subsidiaries, 26
farms, with a total area of 629,794 hectares distributed in
Argentina, Brazil, Bolivia and Paraguay. In addition, we have the
rights to hold approximately 132,000 hectares of land under
concession for a 35-year period that can be extended for another 29
years.
In line
with our international expansion strategy, in September of 2005 we
participated in the creation of Brasilagro with the purpose of
replicating our business model in Brazil. We created BrasilAgro
together with our partners, Cape Town Llc, Tarpon Investimentos
S.A., Tarpon Agro LLC, Agro Investments S.A. and Agro Managers S.A.
On May 2, 2006, BrasilAgro’s shares were listed on the Novo
Mercado of the Brazilian Stock Exchange (“BOVESPA”)
with the symbol AGRO3 and on November 8, 2012, Brasilagro’s
ADRs became listed on the NYSE, under the ticker LND. As of June
30, 2020, we held a 33.55% interest in Brasilagro’s stock
capital, which, as of June 30, 2020 has 10 farmland properties and
215,330 hectares under management Brazil and Paraguay. On July 15,
2020, the Company, through its subsidiary Brasilagro, entered into
an agreement for the sale of of 1,875 hectares (1,500 are
production hectares) of the Jatobá Establishment. For more
information see:
“Cresud’s Recent Developments -
Jatobá sale”
67
Significant acquisitions, dispositions and development of
business
Agricultural business
Sale and purchase of Farmlands
Acquisition of Serra Grande Farmland
On May
18, 2020, the Group through its subsidiary BrasilAgro purchased a
farm in Baixa Grande do Ribeiro, Piauí of 4,500 hectares (of
which 2,900 can be developed for crop production). The amount of
the acquisition was set at BRL 25 million (equivalent ARS 316
million), with an initial payment of BRL 8 million (equivalent ARS
101 million). The balance will be cancelled in three annual
installments.
Sale of Alto Taquari Farmland
On May
29, 2020, the Group through its subsidiary BrasilAgro has entered
into a purchase-sale agreement for an area of 105 hectares of Alto
Taquari farm. The total amount of the sale was 115,478 soybean bags
per arable hectare equivalent BRL 11 million (equivalent ARS 139
million). The buyer made the initial payment of BRL 1,8 million
(equivalent ARS 22 million). The remaining balance will be paid in
five annual installments. The Company has recognized gains of BRL 8
million (equivalent ARS 100 million) as result of this
transaction.
On
October 29, 2019, the Group through its subsidiary BrasilAgro has
entered into a purchase-sale agreement for an area of 85 hectares
(65 are production hectares) of Alto Taquari farm, a rural property
located in the municipality of Alto Taquari, for a total amount of
BRL 5.5 (equivalent ARS 94 million). The same date, the buyer made
the initial payment of 14,300 soybean bags per arable hectare
equivalent BRL 1 million (equivalent ARS 18 million). The remaining
balance will be paid in four annual installments. The Company has
recognized gains of BRL 4 million (equivalent ARS 68 million) as
result of this transaction.
On
November 21, 2018, the Group through its subsidiary BrasilAgro has
entered into a purchase-sale agreement for an area of 103 hectares
of Alto Taquari farm. The total amount of the sale was 1,100
soybean bags per arable hectare equivalent to BRL 7 million
(equivalent to ARS 114 million). The buyer made the initial payment
of 22,656 soybeans bags equivalent to equivalent to BRL 1.5 million
(equivalent to ARS 17 million); and the remaining balance will be
paid in eight biannual installments. The Company has recognized
gains of BRL 5 (equivalent to ARS 91) as result of this
transaction.
Jatobá
On June
30, 2020, the Group through its subsidiary BrasilAgro has entered
into a purchase-sale agreement for an area of 1,875 hectares (1,500
are production hectares) of Jatobá farm. The total amount of
BRL 45 million (equivalent ARS 567 million), of which BRL 5 million
(equivalent ARS 63 million) were already collected. The remaining
balance will be paid in six annual installments. The Company has
recognized gains of BRL 32.8 million (equivalent ARS 413 million)
as result of this transaction. On July 15, 2020 BrasilAgro entered
into an agreement fore the sale of 1,875 hectacres (1,500 are
production acres) of the Jatobá Establishment. For more
information see: “Cresud’s Recent Developments –
Jatobá sale”
On July
11, 2019, the Group through its subsidiary BrasilAgro has entered
into a purchase-sale agreement for an area of 1,134 hectares (893
are production hectares) of Jatobá Farmland, a rural property
located in the municipality of Jaborandi – BA. The total
amount of sale was 302 soybean bags per arable hectare equivalent
or BRL 23 million (equivalent ARS 394 million). The buyer, on
September 2, 2019 made the initial payment of 38,000 soybean bags
per arable hectare equivalent BRL 3 million (equivalent ARS 45
million). The remaining balance will be paid in six annual
installments. Handover of possession and gains as result of this
transaction has recognized on September 30, 2019, approximately,
BRL 17 million (equivalent ARS 272 million).
On June
2019, the Group through its subsidiary BrasilAgro has entered into
a purchase-sale agreement for an area of 3,124 hectares of
Jatobá Farm. The total amount of the sale was 285 soybean bags
per arable hectare or BRL 47 (equivalent to ARS 776). The buyer
already made an initial payment of BRL 5 (equivalent to ARS 83) and
on July 31, 2019 had pay BRL 5 (equivalent to ARS 83) more; and the
remaining balance, equivalent to 563,844 soybeans bags, will be
paid in six equal annual installments. This sale was accounted on
June 30, 2019, the gain of this transaction amount BRL 36.5 million
(equivalent to ARS 573 million).
68
On June
13, 2018, the Group, through its subsidiary BrasilAgro, entered
into a sales agreement for a total area of 9,784 hectares (7,485
are production hectares) of the Jatobá Establishment, a rural
property located in the Municipality of Jaborandi. On July 31,
2018, the buyer made the payment of the first installment of
300,000 bags of soybeans, equivalent to an amount of BRL 21 million
(equivalent to ARS 223 million) according to the conditions set in
the agreement, obtaining the transfer of the possession and thus
recognizing the disposal of the farmland, for the value of 285 bags
per useful hectare, equivalent BRL 123 million (equivalent to ARS
1,309 million). The remaining balance will be paid in six annual
installments. The group did not recognize the result of this
operation since almost all of the hectares sold corresponded to the
Investment Property, and therefore were valued at fair
value.
La Suiza
On June
29, 2018 Cresud signed a deed with a non-related third party for
the sale of a fraction of 10,000 hectares of livestock activity of
“La Suiza”. The total amount of the transaction was set
at USD 10 million, of which USD 3 have been already paid. The
remaining balance of USD 7 million, guaranteed by a mortgage on the
property, will be collected in 10 installments of the same amount
ending on June 2023, which will accrue an annual interest of 4.5%
on the remaining balances. The gain of the transaction amounts
approximately to ARS 380 million.
La Esmeralda
On July
20, 2017, we executed a purchase-sale agreement for all of
“La Esmeralda” establishment consisting of 9,352
hectares devoted to agricultural and cattle raising activities in
the 9 de Julio district, Province of Santa Fe, Argentina. On June
25, 2018, the Company has made effective with the sign of the deed
and delivery of the property, the sale of “La
Esmeralda” farm. The amount of the transaction was set at USD
19, of which USD 7 have been already paid. The balance, guaranteed
with a mortgage on the property, will be collected in 4
installments of the same amount ending in April 2022, which will
accrue an annual interest of 4% on the remaining balances. The gain
from the sale amounts approximately to ARS 686
million.
Araucária
On May
3, 2018, the Company through its subsidiary Brasilagro, has entered
into a purchase-sale agreement for the partial sale 956 hectares
(660 arable hectares) of Araucaria Farm, located in Mineiros,
Brazil, for an amount of 1,208 soybean bags per arable hectare or
BRL 66.2 million (equal to ARS 639.2 million) (BRL/ha. 93,356). The
company has recognized gains of ARS 590 million as result of this
transaction.
Merger of BrasilAgro-Agrifirma, Purchase and Sale of BrasilAgro
Shares
Sale of BrasilAgro’s shares
On
January 20, 2020, the Company sold in the market 3,400,000 shares
of its subsidiary BrasilAgro representatives of 6.30% of the share
capital for an amount of USD 15.6 million (equivalent ARS 962
million).
Agrifirma
On
January 27, 2020, and in accordance with the terms and conditions
established in the Merger Agreement signed on November 22, 2019,
Agrifirma Holding was merged by BrasilAgro and extinguished for all
legal purposes, becoming BrasilAgro the controlling shareholder of
Agrifirma Agropecuária owning 100% of the total voting share
capital. The capital of BrasilAgro increased by BRL 115,586,580
from BRL 584,224,000 to BRL 699,810,577, through the issuance of
5,215,385 new common, registered, book-entry shares with no par
value, which were subscribed and paid-up by the shareholders of
Agrifirma Holding, in such manner that the share capital of
BrasilAgro increased to 62,104,201 shares.
A
subscription warrant was also issued in favor of AB Holdings, a
shareholder of Agrifirma Holding, which will entitle AB Holding (or
its permitted successors and assigns) to subscribe up to 654,487
new ordinary shares, registered with no par value of BrasilAgro,
subject to the terms and conditions established in the Merger
Agreement.
69
The
merger was made upon exchange of shares and the initial exchange
rate was BRL 31.50 per share of BrasilAgro based on the net worth
of BrasilAgro and Agrifirma Holding, as of June 30, 2019 (taken
into consideration, especially, the properties owned by BrasilAgro
and Agrifirma Holding) as per the appraisal made by Deloitte Touche
Tohmatsu Consultores Ltda., adjusted in view of the negotiations
between the parties, in accordance with the Merger
Agreement.
Below
is a breakdown of the fair value of the assets acquired,
liabilities assumed and minority interest of the
acquisiton:
|
|
03.31 20
|
|
Fair
value of identifiable assets and assumed liabilities:
|
|
|
(In
million of ARS)
|
|
|
Cash and cash
equivalents
|
16
|
|
Trade and other
receivables
|
387
|
|
Inventories
|
22
|
|
Biological
assets
|
74
|
|
Taxes and
contributions to recover
|
45
|
|
Group of assets
held for sale
|
362
|
|
Property, plant and
equipment
|
3,365
|
|
Trade and other
payables
|
(297
)
|
|
Borrowings
|
(1,884
)
|
|
Taxes to
pay
|
(9
)
|
|
Payroll and social
security liabilities
|
(43
)
|
|
Provisions
|
(1
)
|
|
Deferred income tax
liabilities
|
(423
)
|
|
Total
identifiable net assets
|
1,614
|
|
Non-controlling
interest
|
-
|
|
Key pending
allocation
|
63
|
|
Total consideration
|
1,677
|
70
Acquisition of Brasilagro’s shares
On March 30, 2020, Cresud purchased in the market 19,100 ordinary
shares of its subsidiary BrasilAgro, representing 0.03% of its
issued capital, for an amount of ARS 6
million.
As a
result of the above-mentioned sale and purchase of shares and the
merger with Agrifirma, the Company reduced its equity interest in
BrasilAgro from 43.17% to 33.55% of its issued
capital.
On June
29, 2020, Cresud made a contribution in kind to the 100% its
controlled subsidiary Helmir S.A. It corresponds to 18,576,400 ADRs
of BrasilAgro Comphania de Propriedades Agrícolas, in which
the Company currently participates as a shareholder. The total
value was USD 69.7 million (equivalent to ARS 4,892 million). At
the end of the fiscal year, the Cresud percentage, the percentage
of direct ownership is 2.25% and the percentage of indirect
ownership through Helmir is 31.30%. In this way, Cresud will
continue to control BrasilAgro indirectly through its control of
Helmir S.A.
Althoght
Cresud maintains less than 50% of the voting rights, in accordance
with IFRS, control may exist without a majority of voting
rights.
Cresud
exercises “de facto control” over BrasilAgro as a
result of:
i)
the percentage and
concentration of voting rights of the Group and the absence of
other shareholders with significant voting rights,
ii)
the absence of a
voting agreement among the other shareholders to vote together as a
group,
iii)
the record of
attendance to Shareholders’ Meetings and the record of votes
casted by the other shareholders; and
iv)
the effective
control exercised by the Group to direct Brasilagro’s
relevant activities through its seat in the Board of
Directors.
Urban properties and investments business
Operation Center in
Argentina
Distribution of dividends in kind
On
October 30, 2019, the General Ordinary Shareholders’ Meeting
approved the distribution of a dividend in kind for an equivalent
of ARS 480 million (representing ARS 0.83 per share and equivalent
of ARS 589 million at current currency as of June 30, 2020) payable
in IRSA CP shares. For distribution, the quoted price of the IRSA
CP share was taken as of October 29, 2019, which was ARS 205 per
share. The number of shares distributed amounts to 2,341,463. This
transaction was accounted for in equity as a decrease in the net
equity attributable to the parent company for an amount of ARS 504
million, restated as of the date of these financial statements. The
stake of the Group in IRSA CP as at year-end is
80.65%.
On
October 29, 2018 a General Ordinary and Extraordinary
Shareholder’s meeting was held, whereby the distribution of a
dividend in kind for an equivalent of ARS 1,827 million payable in
shares of IRSA CP was resolved (representing ARS 2.44 per share and
equivalent of ARS 2,610 million at current currency as of June 30,
2020). For the distribution, the value of IRSA CP share was taken
as of October 26, 2018, which was ARS 220 per share. The number of
shares distributed amounted to 6,418,182. This transaction was
accounted for as an equity transaction generating a decrease in the
net equity attributable to the parent for ARS 1,534 million,
restated as of the date of these financial statements.
Sale of IRSA CP floors
On June
9, 2020, IRSA CP executed the assignment and transfer the right to
sign a title deed, with delivery of possession, with respect to two
medium-height floors in the tower under construction known as
“200 Della Paolera”, located in the Catalinas district
of the Autonomous City of Buenos Aires, covering a total area of
approximately 2,430 sq. meters and 16 parking lots, located in the
building.
The
transaction price was set at approximately ARS 1,165 million (USD
16.9 million), which has already been fully paid.
Fore
more information about dispositions please see the “Recent
Developments” section.
71
Condor Merger Agreement
On July
19, 2019, Condor executed a merger agreement. As per the
contractual terms, each common share of Condor, with a par value of
USD 0.01 per share, shall be cancelled prior to the merger and
converted into the right to receive an amount in cash equivalent of
USD 11.10 per common share. Additionally, pursuant to the terms and
conditions of the merger agreement, each convertible Class E share
shall be automatically cancelled and shall be converted into the
right to receive an amount in cash equivalent of USD 10.00 per
share.
The
closing of the transaction, scheduled for March 23, 2020, has been
canceled.
On October 12, 2020, Condor executed an
agreement
with Nextponint Hospitality Trust
and some of its affiliates (“NHT Parties”)
to resolve and
settle any and all claims between them
related to the merger
agreement mentioned hereinabove.
According to the agreement with NHT Parties shall make three
payments to Condor in three instalments ending the last payment on
December 30, 2020
and
totalling
USD 7,0 million.
As of
the date of presentation of these financial statements, the Company
has 2,197,023 common shares and 325,752 Series E
shares.
TGLT – Recapitalization Agreement
On
August 8, 2019, IRSA entered into certain arrangements with TGLT
S.A. (“TGLT”) providing for collaboration in
TGLT’s financial restructuring and recapitalization. We
participated in the recapitalization agreement whereby TGLT
committed: (i) to make a public offer to subscribe Class A
preferred shares at a subscription price of USD 1.00 per TGLT
share; (ii) to make a public offering of new Class B preferred
shares which may be subscribed by (a)the exchange for ordinary
shares of TGLT, at an exchange ratio of one Class B preferred share
for every 6.94 ordinary shares of the Company and / or (b) the
exchange for convertible notes, at an exchange ratio of a Class B
preferred share for each USD 1.00 of convertible notes (including
accumulated and unpaid interests under the existing convertible
notes); and (iii) to grant an option to subscribe new Class C
preferred shares in a public offer for cash to be carried out if:
(a) the public offer of Class A and Class B preferred shares are
consummated and (b) a minimum number of option holders have
exercised that option at a subscription price per Class C preferred
share of USD 1.00 (or its equivalent in pesos).
Likewise,
IRSA CP signed as a holder of convertible notes of TGLT an
agreement for deferment of payment of interest payable as of
February 15, 2019 and August 15, 2019 until November 8, 2019 and an
option agreement which may be subscribed Class C preferred
shares.
Finally,
supporting the recapitalization plan, IRSA CP signed with TGLT a
subscription commitment for Class A preferred shares under Class A
Public Offer to make a contribution in kind of shares of the
company La Maltería SA, 100% of its ownership, for an amount
up to USD 24 million and promised to exchange its convertible
negotiable obligations into preferred Class B shares.
In
turn, on November 22, 2019, TGLT held a bondholders of convertible
negotiable obligations meeting in order to consider the
modification of different clauses of the indenture in force at that
date, and in line with what was agreed in the recapitalization
agreement, IRSA CP voted in favor of the
modifications.
Under
the agreements described above, the successful consummation of the
offer by TGLT, and having reached the thresholds of consent of the
holders of convertible notes of TGLT, on December 11, 2019, the
Company concluded the envisaged process in the recapitalization
agreement and related documents through the subscription of
preferred Class A shares, integrating them in kind through the
contribution of the shares of the company La Maltería SA, 100%
of their ownership and, likewise, proceeded to the exchange of the
convertible note - including deferred interest and accrued interest
from August 15, 2019 to December 11, 2019 - in preferred Class B
shares.
During
the year ended June 30, 2020, preferred shares were converted into
ordinary shares, giving IRSA CP significant influence over TGLT,
which became an associate as from that date.
Sale of Tarshop
On
February 14, 2019, IRSA CP sold its entire stake in Tarshop to
BHSA. Following this acquisition, BHSA became the holder of 100% of
the capital stock of said company.
The loss recognized for this transaction was approximately ARS 177
million, restated as of the date of these financial
statements.
72
Purchase of equity interest in HASAU (owner of Libertador
Hotel)
On
February 28, 2019, IRSA reported the acquisition, from an unrelated
third party, of the twenty percent (20%) of HASAU for an amount of
USD 1.2 million. As a result of this acquisition, IRSA holds 100%
of HASAU’ s share capital. This transaction was accounted for
as an equity transaction generating a decrease in the net equity
attributable to the controlling shareholders by ARS 3 restated at
the date of these financial statements.
Operations Center in Israel
On
September 25, 2020, the Court resolved that IDBD is insolvent and
therefore it resolved to grant all three orders requested and
accordingly, issued an order for the initiation of proceedings and
liquidation of IDBD, and has appointed a liquidator to IDBD and
interim receivers over the Pledged DIC and Clal
Shares.
As of
the date of this Annual Report, we are analyzing together with our
local and international advisors the judicial decision,
alternatives and course of action. For more information see
“IRSA’s Recent Developments - Corporate Information:
IDBD”.
Sales and Swap transactions
On May
1, 2017, August 30, 2017, January 1, 2018, May 3, 2018, August 30,
2018, and January 2, 2019, continuing with the instructions given
by the Israel Capital Market, Insurance and Savings Commission,
IDBD sold 5% of its stake in Clal on each occasion and 4.5% on the
last one respectively, with a subsequent swap transaction with a 2-
year expiration term for each transaction. The consideration for
the transactions amounted to approximately NIS 944.5 million, which
is partially restricted according to these agreements until the
swap expires. These transactions did not meet the de-recognition
criteria so the Company maintains the asset as “Financial
assets available for sale” and accounted for the loans as a
financial liability.
On
December 16, 2019, Clal made a public capital increase for
12,066,000 shares at a price of NIS 53.87 per share. IDBD did not
take part in such transaction.
Additionally,
on that date, IDBD sold 200,000 Clal shares at a price of NIS 53.95
per share, representing 0.3% of the new capital stock.
On
December 18, 2019, IDBD sold 617,017 Clal shares at an average
price of NIS 53.77 per share, representing 0.9% of the issued
capital stock.
Furthermore,
a swap transaction carried out by IDBD involving 2,771,309 shares
expired in December 2019. The closing price was NIS 52.25 per
share.
A swap
transaction involving 751,000 shares expired within the
January-March 2020 period. The closing price was NIS 45.09 per
share.
On May
2, 2019, continuing with the instructions given by the Israel
Capital Market, Insurance and Savings Commission, IDBD entered into
sales agreements with two unrelated parties (the
“Buyers”), according to which each of the Buyers will
acquire Clal shares representing 4.99% of its share capital at a
cash price of NIS 47.7 per share (approximately ARS 602 per share).
In addition, they were granted an option to acquire additional Clal
shares for approximately 3% of the issued capital, for a period of
120 days (subject to obtaining a holding permit) at a price of NIS
50 per share.
Additionally
on the same day, IDBD also entered into an agreement with a third
unrelated buyer (the “Additional Buyer”), according to
which the Additional Buyer will receive an option from IDBD, valid
for a period of 50 days, to acquire approximately 4.99% of Clal
shares (and not less than 3%), at a price of NIS 47.7 per share
(approximately ARS 602 per share). Subject to the exercise of the
option by the Additional Buyer, the price will be paid 10% in cash
and the rest through a loan that will be provided to the Additional
Buyer by IDBD and/or by a related entity and/or by a banking
corporation and/or financial institution, under the agreed
conditions.
The
aforementioned agreements include, among others, a commitment by
the Buyers and the Additional Buyer to not sell the shares acquired
during an agreed period of 24 months. It is clarified that each of
the Buyers and the Additional Buyer have declared and committed to
IDBD that there are no agreements or understandings between them
regarding the joint ownership of Clal shares that are subject to
the aforementioned agreements.
The
total amount of Clal shares that can be acquired by the three
buyers mentioned above, to the extent that the three agreements are
completed and the options are exercised, represents approximately
18% of Clal’s share capital.
As of
June 30, 2020, all previously agreed sales transactions have been
consummated.
73
On June
28 and July 6, 2020, IDBD sold 4,791,618 Clal shares held by it
through swap transactions, at an average price of approximately NIS
30 per share, representing 7.1% of the capital stock.
Additionally,
on September 3, 2020, IDBD sold 2,376,527 Clal shares at an average
price of NIS 32.475 per share, for a total amount of NIS 77.2
million, representing 3.5% of Clal’s capital
stock.
As a
result of the aforementioned transactions, as of September 3,
2020ç, IDBD
held
4.99% of Clal’s issued share capital (which are were pledged
in favor of the debenture holders (Series 15)). It no longer has
swap transactions and, accordingly, it is no longer considered a
Clal interested party within the context of Israel’s
Securities Regulations.
On
February 4, 2020, Dolphin furnished to the financial entities
through which IDB carried out the swap transactions of Clal shares
in August and November 2018, guarantees of approximately NIS 11
million, which shall be part of the committed deposits that IDB
undertook as part of the terms of such transactions. Furthermore,
on February 18, it deposited further guarantees in the amount of
NIS 9 million. Following the last sale described above, the
guarantees were released.
Distribution of dividends in kind by PBC. Purchase of Mehadrin
shares and acquisition of control
On
December 10, 2019, PBC distributed its entire holding in Mehadrin
as a dividend in kind and, as a result, DIC holds, directly, a
31.4% interest in Mehadrin. As a consequence of such transaction,
Mehadrin became an associate.
In
January and February 2020, DIC purchased approximately 8.8% of
Mehadrin’s capital stock, for a total cost of NIS 39 million
(approximately ARS 712 million); therefore, the interest in
Mehadrin has increased from 31.4% to approximately 40.2%. Such
acquisitions resulted in DIC obtaining control over Mehadrin, by
the end of February, as it has the majority votes while the
remaining equity interests are distributed among several
shareholders.
Additionally,
from April to June 2020, DIC purchased an additional 3.5% interest
in Mehadrin for NIS 14 million (approximately ARS 277 million),
increasing its interest to 43.7%.
Following
the taking of control, as mentioned above, since March 9, 2020, the
Group has consolidated the operations of this company.
Below
is a detail of incorporated net assets and income from such
transaction. The process for the determining of the fair value of
incorporated net assets has been significantly completed as of June
30, 2020 and it is expected to conclude in the first months of the
fiscal year ending June 30, 2021. However, Management does not
foresee any material adjustments to the incorporated net assets
detailed below:
|
|
03.31.2020
|
|
Million of ARS
|
|
|
Fair
value of identifiable assets and liabilities assumed
|
|
|
Investment
properties
|
244
|
|
Property,
plant and equipment
|
6,108
|
|
Intangible
assets
|
57
|
|
Investments
in associates and joint ventures
|
1,879
|
|
Restricted
assets
|
164
|
|
Income
tax receivables
|
146
|
|
Trade
and other receivables
|
10,211
|
|
Rights
of use
|
4,019
|
|
Derivative
financial instruments
|
37
|
|
Inventories
|
2,503
|
|
Borrowings
|
(7,363
)
|
|
Deferred
income tax liabilities
|
(945
)
|
|
Trade
and other payables
|
(4,711
)
|
|
Lease
liabilities
|
(2,119
)
|
|
Provisions
|
(56
)
|
|
Employee
benefits
|
(128
)
|
|
Salaries
and social security liabilities
|
(201
)
|
|
Income
Tax
|
(18
)
|
|
Cash
and cash equivalents
|
2,612
|
|
TOTAL IDENTIFIABLE NET ASSETS
|
12,439
|
|
Non-controlling
interest
|
(7,443
)
|
|
Negative
goodwill (*)
|
(376
)
|
|
Decrease
Investments in associates
|
3,908
|
|
Cash
and cash equivalents
|
712
|
|
TOTAL CONSIDERATION
|
4,620
|
(*)
Included in “Other operating income, net”
74
Partial sale of equity interests in Gav-Yam
On July
1, 2019, PBC sold approximately 11.7% of Gav-Yam’s capital
stock by private agreements. Following this transaction,
PBC’s interest in Gav-Yam decreased from 51.7% to 40%. The
consideration received for such sale was NIS 46 million
(approximately ARS 6,949 million, restated as of the date of these
financial statements).
Furthermore,
on September 1, 2019, PBC sold an additional 5.14%, approximately,
of Gav-Yam shares and, as a result, PBC’s interest in Gav-Yam
decreased from 40% to 34.9%. As a consequence of such sales, PBC
forfeited its right to nominate the majority members to the Board
of Directors and to appoint or remove key management members.
Accordingly, PBC has lost its control over Gav-Yam and has
de-consolidated such investment since such date.
Below
are the details of the sale:
|
|
09.30.2019
|
|
Million of ARS
|
|
|
Cash
received
|
14,261
|
|
Remesuarement
of the fair value of the remaining interest
|
32,165
|
|
Total
|
46,426
|
|
Net
assets disposed including goodwill
|
(28,128
)
|
|
Gain
from the sale of a subsidiary, net of taxes (*)
|
18,298
|
(*)
Said results are disclosed within discontinued operations, under
the caption "other operating results, net"
The
following table details the net assets disposed:
|
|
09.30.2019
|
|
Million of ARS
|
|
|
Investment
properties
|
155,846
|
|
Property,
plant and equipment
|
1,061
|
|
Intangible
assets
|
3,281
|
|
Right-of-use
assets
|
42
|
|
Investments
in associates and joint ventures
|
4,396
|
|
Restricted
assets
|
378
|
|
Trade
and other receivables
|
1,157
|
|
Investments
in financial assets
|
13,544
|
|
Trading
properties
|
155
|
|
Income
tax credit
|
190
|
|
Cash
and cash equivalents
|
10,623
|
|
TOTAL ASSETS
|
190,673
|
|
Borrowings
|
95,443
|
|
Lease
liabilities
|
42
|
|
Deferred
income tax liabilities
|
21,151
|
|
Trade
and other payables
|
2,398
|
|
Employee
benefits
|
21
|
|
Salaries
and social security liabilities
|
63
|
|
Income
tax and MPIT liabilities
|
125
|
|
TOTAL LIABILITIES
|
119,243
|
|
Non-controlling
interest
|
43,302
|
|
Net assets written off including Goodwill
|
28,128
|
On
January 12, 2020, PBC received a communication from the Ministry of
Justice of Israel questioning the loss of control of Gav-Yam in
September 2019 and, accordingly, raising its objections to
observance by PBC of the concentration law in
Israel.
In May
2020, PBC agreed to sell approximately 4.96% of Gav-Yam’s
capital stock to an unrelated third party. Therefore, its interest
in Gav-Yam decreased from 34.9% to 29.9% after the consummation of
the sale transaction and it was thus able to overcome the
questioning from the Ministry of Justice of Israel.
Changes in equity interest in Shufersal and loss of
control
On
December 24, 2017, DIC sold Shufersal shares, decreasing its stake
from 53.30% to 50.12%. The consideration with respect to the sale
of the shares amounted to NIS 169.5 million (equivalent to ARS
2,148 million). Both transactions were accounted for as an equity
transaction generating an increase in equity attributable to the
controlling company for ARS 727 million and ARS 976 million,
respectively.
75
On June
16, 2018, DIC announced the sale of a percentage of its stake in
Shufersal to institutional investors which was completed on June
21, 2018. The percentage sold amounted to 16.56% and the net amount
of the consideration was approximately NIS 848 million (equivalent
to ARS 13,845 million), consequently DIC lost control of Shufersal,
so the Group deconsolidated the subsidiary at that
date.
Below
are the details of the sale:
|
|
06.30.2018
|
|
Million of ARS
|
|
|
Cash
received
|
14,275
|
|
Remesuarement
of the fair value of the remaining interest
|
29,271
|
|
Total
|
43,546
|
|
Net
assets disposed including goodwill
|
(18,902
)
|
|
Gain
from the sale of a subsidiary, net of taxes (*)
|
24,644
|
(*) Includes
ARS 5,856 million as a result of the sale and ARS 18,789 million as
a result of the re-measurement at the fair value of the new stake,
both included in discontinued operations.
The
following table details the net assets disposed:
|
|
06.30.2018
|
|
Million of ARS
|
|
|
Investment
properties
|
10,332
|
|
Property,
plant and equipment
|
64,484
|
|
Intangible
assets
|
16,203
|
|
Investments
in associates and joint ventures
|
892
|
|
Restricted
assets
|
203
|
|
Trade
and other receivables
|
32,516
|
|
Investments
in financial assets
|
280
|
|
Derivative
financial instruments
|
51
|
|
Inventories
|
13,955
|
|
Cash
and cash equivalents
|
12,404
|
|
TOTAL ASSETS
|
151,320
|
|
Borrowings
|
47,383
|
|
Deferred
income tax liabilities
|
6,244
|
|
Trade
and other payables
|
53,306
|
|
Provisions
|
1,025
|
|
Employee
benefits
|
2,812
|
|
Salaries
and social security liabilities
|
5,322
|
|
Income
tax and MPIT liabilities
|
17
|
|
TOTAL LIABILITIES
|
116,109
|
|
Non-controlling
interest
|
16,309
|
|
Net assets disposed including goodwill
|
18,902
|
Additionally
, on November 27, 2018, DIC sold 7.5% of the
total shares of Shufersal to institutional investors for a
consideration of NIS 416 million (approximately ARS 7,266 million).
After this transaction, the group holding went down to 26.02%
approximately. The profit for this sale was NIS 27 million
(approximately ARS 430 million). See Note 35
to our Audited Consolidated
Financial Statements regarding the sale of the entire equity
interest.
Interest increase in Cellcom
On June
27, 2018, Cellcom increased its capital stock in consideration for
a gross amount of NIS 280 million (approximately ARS 4,918
million). DIC participated in such increase and disbursed NIS 145.9
million (approximately ARS 2,561 million) for 6,314,200
shares.
Furthermore,
in December 2018, DIC exercised 1.5 million options (Series 1) held
by it in Cellcom, for an amount of NIS 31 million (approximately
ARS 527 million). In December 2019 and February 2020, DIC purchased
Cellcom shares for NIS 19 million (approximately ARS 357 million).
As a consequence of the exercise of the options and the
acquisition, DIC interest in Cellcom increased by 0.9%. These
transactions were accounted for as equity transactions generating a
decrease in the net equity attributable to the controlling company
by ARS 226 million, restated as of the date of these financial
statements.
76
Additionally,
on December 5, 2019, Cellcom increased its capital stock with the
participation of DIC that purchased almost 50% of the shares
issued. The consideration paid amounted to NIS 307 million
(approximately ARS 6,011 million as of such date). Cellcom issued
an aggregate number of 30,600,000 common shares, 7,038,000 Serie ms
3 Options and 6,426,000 Series 4 Options at a price of NIS 1.021
per unit (each unit will represent 100 common shares, 23 Series 3
Options and 21 Series 4 Options).
Following
the participation of DIC in such issue, the interest percentage was
46.2% of the issued capital stock and approximately 48.5% of the
Company’s voting rights (directly and by means of agreements
executed with other shareholders of the Company).
Sale of IDBT subsidiary
On
August 14, 2018, IDBT’s Board of Directors approved an
agreement to sell 50% of a subsidiary of IDBT, entrusted with
tourism operations for Israir, for a total price of NIS 26 million
(approximately ARS 506 million), which was consummated on December
31, 2018. Such transaction does not affect the intention to sell
IDBT in its entirety. The Group evaluated maintaining the criteria
to classify the investment as a discontinued operation pursuant to
IFRS 5.
Agreement to sell plot of land in USA
In July
2019, a subsidiary of IDBG signed an agreement to sell a plot of
land next to the Tivoli project in Las Vegas for a consideration of
USD 18 million. At this stage, no assurances may be given that the
sales transaction will be completed.
Sale of Real Estate
In
October 2018, a subsidiary of Ispro signed an agreement for the
sale of all of its rights in a real estate area of approximately 29
dunams (equivalent to 1 hectare), in which there are 12,700 square
meters in the northern industrial zone in Yavneh for NIS 86
million, (equivalent to ARS 6,439 million). Such agreement has
already been executed.
Interest increase in PBC
In
December 2018 and February 2019, DIC acquired an additional 4.40%
of PBC in the market for NIS 81 million (equivalent to ARS 1,435
million). The present transactions were accounted for as equity
transactions, generating an increase in net equity attributable to
the controlling company for ARS 101 million, restated as of June
30, 2020. See Note 38 to the Audited Consolidated Financial
Statements.
Repurchase of own shares by DIC
In
December 2018, DIC’s Board of Directors approved a plan to
buy back DIC shares, for a period of one year, until December 2020
amounting up to NIS 120 million (approximately ARS 2,498 million).
Acquisition of securities shall be carried out in accordance with
market opportunities, dates, prices and quantities, as determined
by the management of DIC, in such a way that in any event, the
public holdings shall be, at any time, at least 10.1% of the total
issued share capital of DIC.
Since
December 2018 as of the fiscal year-end date, DIC acquired 12.2
million shares for a total amount of NIS 119 million (approximately
ARS 2,040 million). Additionally, in December 2018, minority
shareholders of DIC exercised DIC Series 6 options for an amount of
NIS 9 million (approximately ARS 174 million).
As a
result of the operations described above, the participation of
Dolphin IL in DIC increased approximately by 5.4%. The present
transactions were accounted for as equity transactions generating a
decrease in the equity attributable to the controlling company for
ARS 133 million, restated as of the date of these financial
statements.
Repurchase of own debenures by DIC
In
August 2020, DIC’s Board of Directors approved a
self-purchase plan of its debentures (Series 6 and Series 10),
until December 31, 2021, at a total cost of up to NIS 300 million.
The purchase of the debentures will be made in accordance with
market opportunities, dates, prices and volumes, as determined by
the management of DIC.
77
Interest increase in Elron
In
November and December 2018, DIC acquired an additional 9.2% of
Elron in the market for NIS 31 million (equivalent to ARS 557
million). Additionally, in June 2020, Elron issued shares to the
market and third parties unrelated to the Group acquired an
interest in the Company in consideration for NIS 26 million. These
transactions were accounted for as an equity transaction generating
a decrease in the equity attributable to the controlling company
for ARS 64 million.
Interest increase in DIC
On July
5, 2018, Tyrus acquired 2,062,000 of DIC’s shares in the
market for a total amount of NIS 20 million (equivalent to ARS 490
million), which represent 1.35% of the Company’s outstanding
shares at such date. As a result of this transaction, the
Group’s equity interest has increased from 76.57% to 77.92%.
This transaction was accounted for as an equity transaction
generating an increase in the net equity attributable to the
controlling company by ARS 46 million, restated as of the date of
these financial statements.
The
stake of the Group in DIC is approximately 83.77% considering the
repurchase of treasury shares.
Early payment of Ispro bonds
In
August 2019, the Audit Committee and the Board of Directors of
Ispro approved the full advance payment of (Tranche B) corporate
bonds, traded on the TASE. The aggregate amount was NIS 131 million
(approximately ARS 2,465 million restated as of the date of these
financial statements). The prepayment of these corporate bonds
caused Ispro to become a reporting company for TASE and not a
listed company.
Agreement for the sale of Ispro
On
January 26, 2020, PBC executed an agreement for the sale of all
Ispro shares and the rights over the loans granted by the
shareholders to ISPRO in consideration for NIS 885 million. The
consummation of the transaction was subject to approval by the
Commissioner of Competition pursuant to the Law on Economic
Competition, which should have been given within a term of 150 days
following the execution of the agreement. For this reason, the
Group eclassified the assets and liabilities as available for
sale.
At the
time of the execution of the agreement, the buyer made a deposit of
NIS 15 million into an account and undertook to deposit an
additional amount of NIS 40 million, following completion of the
due diligence process.
On
March 23, 2020, the buyer contacted PBC and requested a
postponement of the dates specified in the sales agreement. PBC
informed the buyer that its request would be considered without
detrimentally affecting PBC’s rights and obligations pursuant
to the agreement. On March 26, 2020, that is, the date of
completion of the due diligence process, the buyer defaulted on its
obligation to deposit the second payment installment in an amount
of NIS 40 million, into a trust account.
PBC
demanded the buyer to cure its default and immediately deposit the
second payment installment and proceed with the closing of the
transaction in accordance with its terms, without this entailing a
limitation on its rights and obligations and any consideration
available for the buyer pursuant to the agreement and under the
law, until April 20, 2020. Since the buyer did not comply until
April 20, 2020, the agreement was terminated.
In
April 2020, PBC executed an agreement with another buyer for NIS
800 million involving all ISPRO shares and the rights over the
loans granted by PBC to ISPRO. As a consequence of this new
agreement for the sale of ISPRO’s shares, the Group has
reclassified net assets totaling ARS 15,473 million as “Group
of Assets available for Sale”. The profit to be recognized at
the time of the consummation of the transaction shall be NIS 47
million (equivalent of ARS 842 million as of the current fiscal
year-end).
Cellcom- Golan Telecom Agreement
In
February 2020, Cellcom, the shareholders of Golan Telecom and Golan
Telecom executed a binding memorandum of understanding for the
acquisition of Golan Telecom entire capital stock, for a total
amount of NIS 590 million, payable in 2 installments (NIS 413
million at the closing date of the transaction and NIS 177 million
within a term of 3 years following such closing date). Cellcom
shall issue and deposit the Company’s shares for 8.2 million,
with a trustee into a trust account (“Shares held in
Trust”), as collateral.
78
The
transaction provides for standard conditions and representations
and is subject to a due diligence process to be performed by
Cellcom and the relevant regulatory authorizations and approvals
from material third parties. The parties shall carry out
negotiations regarding a detailed agreement; however, they are
bound to the memorandum of understanding, regardless of whether the
agreement may be executed or not. In the event the conditions for
the closing of the transaction were not satisfied before December
31, 2020, the memorandum of understanding or the detailed
agreement, as applicable, shall be terminated.
For
more information on the conclusion of the agreement and its
respective approvals, see note 38 of the financial statements as of
June 30, 2020.
Capital Expenditures
Our
capital expenditures were ARS 12,280 million, ARS 20,642 and ARS
22,742 million for the fiscal year ended June 30, 2020, 2019 and
2018, respectively, including other goods and equipment acquired in
business combinations.
Our
capital expenditures consisted of the purchase of real estate and
farms, acquisition and improvement of productive agricultural
assets, communication networks, completion of the construction of a
shopping center, construction of real estate and acquisition of
land reserves.
Fiscal year ended June 30, 2020
During
the fiscal year ended June 30, 2020, in our Urban Properties and
Investments Business we incurred capital expenditures of ARS 11,050
million as follows: (a) acquisition and improvements of property,
plant and equipment for ARS 5,672 million, mainly related to: i)
ARS 332 million in buildings and facilities, ii) ARS 3,417 million
in communication networks, iii) ARS 1,749 million in machinery,
equipment and others, and iv) improvements in our Sheraton
Libertador, Llao Llao and Intercontinental hotels (ARS 14 million,
ARS 61 million and ARS 44 million, respectively); (b) improvements
in our rental properties for ARS 2,700 million, of which ARS 1,906
million correspond to our Argentina Operations Center and ARS 794
to the Israel Operations Center; (c) the development of properties
for ARS 2,678 million.
During
the fiscal year ended June 30, 2020, we invested in the
Agricultural Business ARS 1,230 million mainly as follows (a)
acquisition and development of owner occupied farmland for ARS 725
million (ARS 593 million of subsidiary Brasilagro); (b) ARS 312
million in bearer plant; (c) ARS 56 million in other building and
facilities; (d) ARS 58 million machinery and equipment; (e) ARS 27
million in vehicles; (f) ARS 5 million in furniture and supplies;
and (g) ARS 47 million destined to suppliers advances for
proprieties acquisitions.
Fiscal year ended June 30, 2019
During
the fiscal year ended June 30, 2019, in our Urban Properties and
Investments Business we incurred capital expenditures of ARS 18,755
million as follows: (a) acquisition and improvements of property,
plant and equipment for ARS 7,144 million, mainly related to: i)
ARS 110 million in buildings and facilities, ii) ARS 4,599 million
in communication networks, iii) ARS 2,371 million in machinery,
equipment and others, and iv) improvements in our Sheraton
Libertador, Llao Llao and Intercontinental hotels (ARS 29 million,
ARS 14 million and ARS 21 million, respectively); (b) improvements
in our rental properties for ARS 1,954 million, mainly in our
Israel Operations Center; (c) the development of properties for ARS
9,065 million, mainly in our Israel Operations Center; (d) Land
reserves for ARS 592 million.
During
the fiscal year ended June 30, 2019, we invested ARS 1,887 million
in our Agriculture Business as follows due (a) acquisition and
development of owner occupied farmland for ARS 793 million (ARS 596
million of subsidiary Brasilagro); (b) ARS 582 million in bearer
plant; (c) ARS 80 million machinery and equipment; (d) ARS 40
million in vehicles; (e) ARS 9 million in furniture and supplies;
(f) ARS 374 million in other building and facilities and (g) ARS 9
million destined to suppliers advances for proprieties
acquisitions.
79
Fiscal year ended June 30, 2018
During
the fiscal year ended June 30, 2018, in our Urban Properties and
Investments Business we incurred capital expenditures of ARS 19,064
million (including ARS 4,729 million from Shufersal, whose assets
were deconsolidated due to the loss of control and ARS 748 million
from business combination), as follows: (a) acquisitions and
improvements of property, plant and equipment of ARS 10,562
million, primarily i) ARS 2,957 million in buildings and
facilities, mainly in supermarkets in Israel through Shufersal, ii)
ARS 2,500 million in communication networks, iii) ARS 5,065 million
in machinery and equipment and others, iv) improvements in our
hotels Sheraton Libertador, Llao Llao and Intercontinental (ARS 10
million, ARS 19 million and ARS 11 million, respectively), and v)
ARS 484 million related with business combinations (mainly from the
acquisition of New Pharm); (b) improvements inour rental properties
of ARS 1,917 million, primarily in our Operations Center in Israel;
(c) the development of properties for ARS 3,489 million, mainly in
our Operations Center in Israel; (d) ARS 2,834 million related to
the acquisition of land reserves, and (e) ARS 264 million related
to business combination.
During
the fiscal year ended June 30, 2018, we invested ARS 3,678 million
in our Agricultural Business mainly as follows (a) acquisition and
development of owner occupied farmland for ARS 2,931 million (ARS
2,662 million of subsidiary Brasilagro); (b) ARS 583 million in
bearer plant; (c) ARS 113 million in other building and facilities;
(d) ARS 31 million in vehicles; (e) ARS 9 million in furniture and
supplies; and (f) ARS 11 million destined to suppliers advances for
proprieties acquisitions.
Recent Developments
Operations Center in Argentina
Cresud’s Recent Developments
Shareholders’ Meeting
On October 26, 2020, the Company informs that the
Shareholders’ Meeting has resolved the
following:
1) Appointment of two shareholders to sign the meetings’
minutes.
The
meeting approved by majority the appointment of the representative
of shareholder Bank of New York Mellon (BONY) and the
representative of ANSES FGS Law 26425 (ANSES) to approve and sign
the minutes of the Shareholders’ Meeting, jointly with the
Chairman.
2) Consideration of documents contemplated in paragraph 1, Section
234, Law No. 19,550 for the fiscal year ended June 30, 2020. The
documentation was approved by a majority of votes.
3) Allocation of net gain for the fiscal year ended June 30, 2020
for ARS 1,900,624,275. Distribution of dividends in kind. The
meeting approved by majority of votes:
1.- to allocate the net income for the fiscal year for ARS
1,900,624,275.32 to (i) the legal reserve for ARS 95,031,214 and
(ii) the remaining balance amounting to ARS 1,805,593,061.32 to the
absorption of unappropriated retained earnings, comprised by (a)
the aggregate of prior fiscal year adjustments amounting to ARS
814,138,722.68, (b) the aggregate of the negative effect from other
changes in the subsidiaries shareholders’ equity amounting to
ARS 60,919,391.76; and (c) partially, the effect of the
distribution of shares approved by the meeting held on October 30,
2019 of ARS 1,511,974,676.17 on the unappropriated retained
earnings;
2. not to distribute dividends as a result of the absorption of
losses.
4) Consideration of Board of Directors’ performance for the
Fiscal Year ended June 30, 2020.
The
management of the Board was approved by a majority of
votes.
5) Consideration of Supervisory Committee’s performance for
the Fiscal Year ended June 30, 2020.
The
management of the Supervisory Committee was approved by a majority
of votes.
6) Consideration of compensation payable to the Board of Directors
(ARS 93,792,715, allocated sum) for the Fiscal Year ended June 30,
2020.
Finally, The meeting approved by majority of votes
the sum of ARS 62,180,000 as total compensation payable to the
Board of Directors for the fiscal year ended June 30, 2020 and (i)
to allocate and distribute such compensation in due course in
accordance with the specific duties discharged by its members; (ii)
to make monthly advance payments of fees contingent upon the
resolution to be adopted at the next ordinary shareholders’
meeting.
80
7) Consideration of compensation payable to the Supervisory
Committee (ARS 1,575,000, allocated sum) for the Fiscal Year ended
June 30, 2020. It was approved by a majority of
votes
8) Determination of number and appointment of regular directors and
alternate directors for a term of three fiscal years. It was
approved by a majority of votes: i) to determine in 12 (twelve) the
number of regular directors and maintain in 5 (five) the number of
alternate directors (ii) to renew the appointment of Messrs.
Eduardo Sergio Elsztain, Saúl Zang and Alejandro Gustavo
Casaretto as non-independent Regular Directors;
(iii)
to appoint Mrs. Mariana Renata Carmona as
non-independent Regular Director; (iv) to renew the appointment of
Mr. Gastón Armando Lernoud as non-independent Alternate
Director.
9) Appointment of regular and alternate members of the Supervisory
Committee for a term of one fiscal year.
The
meeting approved by majority of votes to appoint Messrs. José
Daniel Abelovich, Marcelo Héctor Fuxman and Noemí Ivonne
Cohn as Regular Statutory Auditors and Messrs. Roberto Daniel
Murmis, Cynthia Deokmelian and Paula Sotelo as Alternate Statutory
Auditors for a term of one fiscal year.
10) Appointment of certifying accountant for the next fiscal
year.
The meeting
approved by majority of votes to appoint as certifying accountants
for the 2020/2021 fiscal year, the firm Price Waterhouse & Co.
S.R.L. member of PriceWaterhouseCoopers, with Walter Rafael
Zablocky acting as Regular Independent Auditor, and Javier Brondo
as Alternate Independent Auditor.
11) Consideration of the approval of compensation for ARS
15,300,333 payable to certifying accountant for the fiscal year
ended June 30, 2020. The meeting approved by majority of votes a
compensation of ARS 15,300,333 for the tasks developed by the
certifying accountant for the fiscal year ended June 30,
2020.
12) Consideration of annual budget for implementation of the audit
committee’s annual plan.
The meeting approved by majority of
votes a budget of ARS 503,000, taking into account the effect of
inflation considering the eventual hiring of advisors / consultants
and trainings.
13) Consideration of incentive plan for employees, management, and
directors, approved on the Shareholders Meeting held on October 30,
2019. Guidelines for the implementation of the plan that will be
bonused to its beneficiaries, paying up the corresponding capital
increase with reserves of the company according to Art. 68 of Law
26,831 of Capital Market. The meeting approved by majority of votes
to ratify the resolutions adopted by the meeting held on October
30, 2019 as regards the implementation of the incentive plan for
employees, management and directors of the Company and to provide
that 1% (one per cent) allocated to such plan to be calculated
based on the capital outstanding as of the time of implementation
and/or execution of the plan, be paid in with reserves – thus
allocating such shares as bonus to the beneficiaries of the plan-
and/or paid in with contributions made by the beneficiaries, all in
accordance with the provisions set forth in Section 68 of the
Capital Market Law No. 26,831.
14) Authorization to carry out registration proceedings relating to
this shareholders’ meeting before the argentine securities
commission and the general superintendence of corporations.The
meeting approved by majority of votes to authorize attorneys-at-law
María Laura Barbosa, Lucila Huidobro, Paula Pereyra Iraola,
María Florencia Vega and/or María Inés Higa and Mrs.
Andrea Muñoz to carry out all the relevant registrations of
the preceding resolutions.
Exchange Offer -
Issuance of Series XXXI and XXXII
Notes
As a
consequence of the new restrictions on access to the Foreign
Exchange Market, we launched an exchange offer on our Series XXIV
Notes due on November 14, 2020 (the “Existing Notes”).
The abovementioned restrictions to obtain United States dollars
established under Communication “A” 7,106 apply for the
purchase of foreign currency intended for repayment of principal
maturing between October 15, 2020 and March 31, 2021 in respect of
the issuance of foreign currency-denominated debt securities
registered with official registries in Argentina by private sector
clients or the entities themselves. For such purposes, all Eligible
Holders (the “Eligible Holders”) were invited by us to
Exchange the Existing Notes, Series XXIV Notes.
On
October 23, 2020, we announced Notes to be issued in exchange for
the Existing Notes, Series XXIV Notes, as applicable, pursuant to
the terms and methods for the exchange of the Existing Notes. The
exchange offer consisted on the following two options for the
bondholders terms:
(i)
A repayment of
principal amount of Existing Notes tendered for Exchange, in cash
in United States Dollars, in an amount resulting from dividing USD
29,442,160,00 by the total number of Existing Notes tendered in
Exchange for the Series XXXI, always provided such quotient is less
than or equal to USD 1 whereas if such quotient is higher than USD
1 the consideration shall be equal to USD 1 (“
Principal Repayment
”);
which would represent at least 40% of the amount of the Existing
Notes tendered and the remaining amount until reaching USD 1 of
each USD 1 of the Existing Notes tendered for Exchange, in Series
XXXI Notes. Series XXXI Notes to be issued at a fixed nominal
interest rate of 9.00% per annum and maturing 3 (three) years after
the Date of Issue and Settlement, with annual repayments,
denominated and payable in United States Dollars, in a principal
amount up to USD 44,163,240 to be paid in kind by tendering for
exchange of the Existing Notes. In all cases, the sum of (i) and
(ii) shall be the equivalent to USD 1 per each USD 1 of Existing
Notes tendered for Exchange.; and
(ii)
A par for par
exchange of notes Series XXXII for each Existing Notes presented to
the Exchange. Series XXXII Notes to be issued at a nominal fixed
interest rate of 9% per annum, maturing 24 (twenty-four) months
after the Date of Issue and Settlement, denominated and payable in
a principal amount up to USD 44,163,240, to be paid in kind by
tendering for exchange the Existing Notes.
For both options
interest accrued on the Existing Notes
until the Date of Settlement of the Exchange Offer will be paid in
cash:
Moreover,
the Company offers an early exchange consideration equivalent to
USD 0.02 per each USD 1 of Existing Notes tendered and accepted in
exchange for Series XXXII Notes prior to the deadline to receive
the consideration for early acceptance (the “Early Exchange
Consideration”). Such consideration shall be paid in Pesos on
the Date of Issue and Settlement as per the exchange rate reported
by Communication “A” 3,500 of the Central Bank of
Argentina on the business day next preceding the Exchange
Expiration Date. For the purposes of receiving the Early Exchange
Consideration, the Eligible Holders shall tender the Existing Notes
in their possession on or before the Deadline to Receive the Early
Exchange Consideration.
On November 2, 2020, the Company announced the results of the Early
Bird of Series XXXII Notes. As of October 30, 2020, deadline for
accessing the Early Bird, exchange orders have been submitted for a
total amount equivalent to USD 31,820,655 for Series XXXII
Notes.
All existing notes presented on or before the above mentioned
deadline have been accepted by the Company and will be eligible to
receive the consideration on the Issue and Settlement
Date.
As timely announced, the Exchange Offer would expire on November 5,
2020, unless it is extended by the Company. Finally, on November 6,
2020, the Company decided to extend the Exchange Offer, to November
10, 2020. This extension does not imply a modification to the
economic terms of the Exchange Offer.
On November 11, 2020, the Company reported the results of the
Exchange Offer. Eligible holders have been presented for a total
amount equivalent (for both Classes) to USD 65.075.746,
representing 88.41% of the face value of the Existing Notes in
Circulation, through the participation of 1,098
orders.
81
SERIES XXXI Notes issuance:
The
Face Value of Existing Notes presented and accepted for the
Exchange totaled USD 30,751,640 and the Nominal Value of Series
XXXI Notes to be issued was USD 1,309,480. The maturity date will
be November 12, 2023.
According
to the terms and subject to the conditions established in the
Prospectus Supplement, Eligible Holders whose Existing Notes have
been accepted for the Exchange by the Company, will receive for
every USD 1 of Existing Notes submitted to the Exchange, the
accrued interest of the Existing Notes until the settlement and
issue date and the following:
a. USD
0.95741755 in cash for each USD 1 of Existing Notes presented to
the Exchange; and
b. The
remaining amount until completing USD 1 for each USD 1 of Existing
Notes presented to the Exchange, in Series XXXI Notes.
SERIES XXXII Notes Issuance:
Face
Value of Existing Notes presented and accepted for the Exchange
totaled USD 34,324,106 and the Nominal Value of Series XXXII Notes
to be issued is USD 34,324,106. The maturity date will be November
12, 2022.
Series XXIV Cancellation:
In
relation to the Exchange Offer ended on November 10, 2020, and as a
result of the settlement of said Exchange, on November 16, 2020,
the Company made a partial cancelation for a Nominal Value of USD
65,075,746 of Series XXIV Notes, after the cancellation the Nominal
Value under circulation was USD 8,529,654, which was fully
cancelled on November 16, 2020.
82
Payment of dividends by Brasilagro
At Brasilagro’s shareholders’ meeting held on October
16, 2020, the shareholders of Brasilagro approved dividends in the
amount of BRL 42.0 million, or BRL 0.71 per share. Such dividends
shall be paid to shareholders on November 12, 2020, to holders of
record of Brasilagro’s shares as of October 19,
2020.
Notes Series
XXX
On
August 27, 2020, we issued USD 25.0 million aggregate principal
amount of Series XXX Notes, bearing a fixed interest rate of 2.0%
payable semiannually, and maturing on August 31, 2023.
Communication “A” 7106 from the Central Bank of the
Argentine Republic.
On
September 17, 2020, CRESUD reported that under Communication "A"
7,106, issued by the Central Bank, which established, among other
issues,
the requirement, for those who
register scheduled capital maturities between October 15, 2020 and
March 31, 2021 with creditors that are not related counterparties,
to submit to the Central Bank a detail of a refinancing plan
complying with certain criteria established in the said
Communication. Specifically, the Central Bank will grant access to
companies for an amount up to 40% of maturities and companies must
refinance the rest for a term of at least 2 years.
The
Company is analyzing the impact of this provision in order to meet
in a timely and in-time compliance with the requirements of the
Central Bank, if applicable. Likewise, as reported in a timely
manner, on November 14, 2020, the maturity of the Notes Series XXIV
for a face value of USD 73,605,400, as well as another bank debt,
operates.
Jatobá sale
On July
15, 2020, the Company, through its subsidiary Brasilagro, entered
into an agreement for the sale of of 1,875 hectares (1,500 of which
are production hectares) of the Jatobá Establishment, a rural
property located in the Municipality of Jaborandi, for a purchase
price of 300 bags of soybeans, equivalent to BRL 45 million. At the
time of sale, the buyer made an initial payment, equivalent to BRL
5 million. In August 2020, the buyer made a second payment,
equivalent to an additional BRL 3.5 million. The remaining balance
of the purchase price will be paid by the purchaser in six annual
installments
IRSA’s Recent Developments
Shareholders’Meeting
On October 26, 2020, the Company informs that the
Shareholders’ Meeting has resolved the
following:
1) Appointment of two shareholders to sign the meetings’
minutes. The meeting approved by majority of votes the appointment
of the representatives of shareholders ANSES FGS and Cresud SACIF y
A to approve and sign the minutes of the Shareholders’
Meeting, jointly with the Chairman.
2) Consideration of documents contemplated in paragraph 1, Section
234, Law No. 19,550 for the fiscal year ended June 30, 2020. It was
approved by the majority of the votes.
3) Allocation of net gain for the fiscal year ended June 30, 2020
for ARS 11,649,829,387.15. Distribution of dividends in kind. It
was approved by a majority of votes (i) to allocate 5% of the
income for the fiscal year, amounting to ARS 582,491,469.36, to the
legal reserve; (ii) to distribute the amount of ARS 484,000,000,
(four hundred and eighty four million Argentine pesos), as
dividends payable in shares of IRSA Propiedades Comerciales S.A., a
Company’s subsidiary, to the shareholders ratably according
to their shareholding interests; (iii) to allocate the balance to
the special reserve, which may be used to pay future dividends, to
carry out new projects or for any other purpose in the interests of
the Company within the next fiscal years; and (iv) to delegate to
the Board of Directors the power to implement the payment to the
shareholders within the terms set forth in the applicable laws, and
to apply for and implement the payment of such dividends to the ADR
holders.
83
4) Consideration of Board of Directors’ performance for the
Fiscal Year ended June 30, 2020. It was approved by the majority of
the votes.
5) Consideration of Supervisory Committee’s performance for
the Fiscal Year ended June 30, 2020. It was approved by the
majority of the votes.
6) Consideration of compensation payable to the Board of Directors
(ARS 71,450,320, allocated sum) for the Fiscal Year ended June 30,
2020. The meeting approved by majority of votes the sum of ARS
71,450,320 as total compensation payable to the Board of Directors
for the fiscal year ended June 30, 2020 and (i) to allocate and
distribute such compensation in due course in accordance with the
specific duties discharged by its members; (ii) to make monthly
advance payments of fees contingent upon the resolution to be
adopted at the next ordinary shareholders’
meeting.
7) Consideration of compensation payable to the Supervisory
Committee (ARS 1,575,000, allocated sum) for the Fiscal Year ended
June 30, 2020. The meeting approved by majority of votes to pay ARS
1,575,000 to the Supervisory Committee as aggregate fees for the
tasks discharged during the fiscal year ended June 30,
2020.
8) Determination of number and appointment of regular directors and
alternate directors for a term of three fiscal years.
It was approved by a majority of
votes: i) to determine in 12 (twelve) the number of regular
directors and maintain in 6 (six) the number of alternate
directors; ii) to renew the appointment of Messrs. Fernando
Adrián Elsztain and Daniel Ricardo Elsztain as non-independent
Regular Directors; iii) to renew the appointment of Mr. Gastón
Armando Lernoud as non-independent Alternate Director; and iv) 4)to
appoint Messrs. Ben Iosef Elsztain and Iair Elsztain as
non-independent Alternate Directors.
9) Appointment of regular and alternate members of the Supervisory
Committee for a term of one fiscal year.
The meeting
approved by majority of votes to appoint José Daniel
Abelovich, Marcelo Héctor Fuxman and Noemí Ivonne Cohn as
Regular Statutory Auditors and Messrs. Roberto Daniel Murmis,
Ariela Levy and Paula Sotelo as Alternate Statutory Auditors for a
term of one fiscal year.
10)
Appointment of certifying accountant for the next fiscal year. The
meeting approved by majority of votes to appoint the following
firms as certifying accountants for the 2020/2021 fiscal year: (a)
Price Waterhouse & Co. S.R.L. member of PriceWaterhouseCoopers,
with Walter Rafael Zablocky acting as Regular Independent Auditor,
and Javier Brondo as Alternate Independent Auditor; and (b)
Abelovich Polano & Asociados, with José Daniel Abelovich
acting as Regular Independent Auditor and Roberto Daniel Murmis and
Noemi Ivonne Cohn as Alternate Independent Auditors
.
11) Consideration of the approval of compensation for ARS
23,498,908 payable to certifying accountant for the fiscal year
ended June 30, 2020. It was approved by the majority of the
votes.
12) Consideration of annual budget for implementation of the audit
committee’s annual plan.
The meeting approved by
majority of votes a budget of ARS 549,000 for the eventual hiring
of advisors / consultants and trainings.
13) Consideration of incentive plan for employees, management, and
directors, approved on the Shareholders Meeting held on October 30,
2019. Guidelines for the implementation of the plan that will be
bonused to its beneficiaries, paying up the corresponding capital
increase with reserves of the company according to Art. 68 of Law
26,831 of Capital Market. The meeting approved by majority of votes
to ratify the resolutions adopted by the meeting held on October
30, 2019 as regards the implementation of the incentive plan for
employees, management and directors of the Company and to provide
that 1% (one per cent) allocated to such plan to be calculated
based on the capital outstanding as of the time of implementation
and/or execution of the plan, be paid in with reserves – thus
allocating such shares as bonus to the beneficiaries of the plan-
and/or paid in with contributions made by the beneficiaries, all in
accordance with the provisions set forth in Section 68 of the
Capital Market Law No. 26,831.
14) Authorization to carry out registration proceedings relating to
this shareholders’ meeting before the argentine securities
commission and the general superintendence of corporations. The
meeting approved by majority of votes to authorize attorneys-at-law
María Laura Barbosa, Lucila Huidobro, Paula Pereyra Iraola,
María Florencia Vega and/or María Inés Higa and Mrs.
Andrea Muñoz to carry out all the relevant registrations of
the preceding resolutions.
84
Exchange Offer- Issuance of Series VIII and IX Notes
As a
consequence of the new restrictions on access to the Foreign
Exchange Market, IRSA launched an exchange offer on its Series I
Notes due on November 15, 2020 (the “Existing Notes”).
The abovementioned restrictions to obtain United States dollars
established under Communication “A” 7,106 apply for the
purchase of foreign currency intended for repayment of principal
maturing between October 15, 2020 and March 31, 2021 in respect of
the issuance of foreign currency-denominated debt securities
registered with official registries in Argentina by private sector
clients or the entities themselves. For such purposes, all Eligible
Holders (the “Eligible Holders”) were invited by IRSA
to Exchange the Existing Notes, Series I Notes.
On
October 22, 2020, IRSA announced Notes to be issued in exchange for
the Existing Notes, Series I Notes, or through the Cash
Subscription (the “Cash Subscription”), as applicable,
pursuant to the terms and methods for the exchange of the Existing
Notes. The exchange offer consisted on the following two options
for the bondholders terms:
(i)
A repayment of
principal amount of Existing Notes tendered for Exchange, in cash
in United States Dollars, in an amount resulting from dividing USD
72,607,482.80 by the total number of Existing Notes tendered in
Exchange for the Series VIII, always provided such quotient is less
than or equal to USD 1 whereas if such quotient is higher than USD
1 the consideration shall be equal to USD 1 (“
Principal Repayment
”);
which would represent at least 40% of the amount of the Existing
Notes tendered and the remaining amount until reaching USD 1 of
each USD1 of the Existing Notes tendered for Exchange, in Series
VIII Notes. Series VIII Notes to be issued at a fixed nominal
interest rate of 10.00% per annum and maturing 3 (three) years
after the Date of Issue and Settlement, with annual repayments,
denominated and payable in United States Dollars, in a principal
amount up to USD 108,911224 to be paid in kind by tendering for
exchange of the Existing Notes . In all cases, the sum of (i) and
(ii) shall be the equivalent to USD1 per each USD1 of Existing
Notes tendered for Exchange.; and
(ii)
A par for par
exchange of notes Series IX for each Existing Notes presented to
the Exchange. Series IX Notes to be issued at a nominal fixed
interest rate of 10% per annum, maturing on March 1, 2023,
denominated and payable in a principal amount up to USD
108,911,224, that may be increased up to the Maximum Aggregate
Principal Amount (the “Maximum Aggregate Principal
Amount”), to be paid in kind by tendering for exchange the
Existing Notes, or by Subscription in Cash.
For both options
interest accrued on the Existing Notes
until the Date of Settlement of the Exchange Offer will be paid in
cash:
Moreover,
the Company offers an early exchange consideration equivalent to
USD 0.02 per each USD 1 of Existing Notes tendered and accepted in
exchange for Series IX Notes prior to the deadline to receive the
consideration for early acceptance (the “Early Exchange
Consideration”). Such consideration shall be paid in Pesos on
the Date of Issue and Settlement as per the exchange rate reported
by Communication “A” 3500 of the Central Bank of
Argentina on the business day next preceding the Exchange
Expiration Date. For the purposes of receiving the Early Exchange
Consideration, the Eligible Holders shall tender the Existing Notes
in their possession on or before the Deadline to Receive the Early
Exchange Consideration.
On November 2, 2020, the Company, announced the results of the
Early Bird of Series IX Notes. As of October 30, 2020, deadline for
accessing the Early Bird, exchange orders have been submitted for a
total amount equivalent to USD 70,971,181 for Series IX
Notes.
All existing notes presented on or before the above mentioned
deadline have been accepted by the Company and will be eligible to
receive the consideration on the Issue and Settlement
Date.
As timely announced, the Exchange Offer would expire on November 5,
2020, unless it is extended by the Company. Finally, on November 6,
2020, the Company decided to extend the Exchange Offer, to November
10, 2020. This extension does not imply a modification to the
economic terms of the Exchange Offer.
On November 11, 2020, IRSA reported the results of the Exchange
Offer. Eligible holders have been presented for a total amount
equivalent (for both Classes) to USD 178,458,188, representing
98.31% of the face value of the Existing Notes in Circulation,
through the participation of 6,571 orders.
SERIES VIII Notes issuance:
The
Face Value of Existing Notes presented and accepted for the
Exchange totaled USD 104,287,243 and the Nominal Value of Series
VIII Notes to be issued was USD 31,679,760. The maturity date will
be November 12, 2023.
According
to the terms and subject to the conditions established in the
Prospectus Supplement, Eligible Holders whose existing notes have
been accepted for the Exchange by the Company, will receive for
every USD 1 of Existing Notes submitted to the Exchange, the
accrued interest of the existing notes until the settlement and
issue date and the following:
a. USD
0.69622593 in cash for each USD 1 of Existing Notes presented to
the Exchange; and
b. The
remaining amount until completing 1 USD for each 1 USD of Existing
Notes presented to the Exchange, in Notes Series VIII.
SERIES IX Notes Issuance:
Face
Value of Existing Notes presented and accepted for the Exchange
totaled USD 74,170,945 and the Nominal Value of Series IX Notes to
be issued (together with the Face Value to be issued as a result of
the cash subscription) is USD 80,676,505. The maturity date will be
March 1, 2023.
Modifications to the Terms of the Existing Notes:
Pursuant
to the terms and conditions specified on the pricing supplement of
the Existing Notes, and considering that consent has been obtained
for an amount greater than 90% of the principal of the Existing
Notes, the Company made the Non-Essential Proposed Modifications
and / or the Essential Proposed Modifications, by means of which
the terms and conditions of the existing notes will be modified and
replaced.
Consequently,
by virtue of the implementation of the Proposed Non-Essential
Modifications, the entire section of "Certain Commitments" and
"Events of Default" was eliminated from the terms and conditions
set forth in the prospectus supplements dated May 2, 2019 and dated
July 25, 2019 corresponding to the Existing Notes.
Additionally,
pursuant to the implementation of the Proposed Essential
Modifications, the following terms and conditions of the Existing
Notes were modified and replaced:
-
Expiration Date: It will be March 1, 2023.
-
Interest Payment Dates: will be the same dates reported for Class
IX in the Notice of Results.
The
terms and conditions of the Series I Notes are not modified by the
Proposed Essential Modifications and the Proposed Non-Essential
Modifications will maintain their full validity.
The
implementation of the Proposed Essential Modifications and the
Proposed Non-Essential Modifications have been approved by the
Company's Board of Directors, dated November 11, 2020.
For
more information, see "Proposed Modifications to Existing Notes" of
the Prospectus and Exchange Supplement.
Series I Cancellation:
In
relation to the Exchange Offer ended on November 10, 2020, and as a
result of the settlement of said Exchange, on November 12, 2020,
the Company made a partial cancelation for a Nominal Value of USD
178,458,188 of Series I Notes, after the cancellation the Nominal
Value under circulation will be USD 3,060,519.
85
Corporate Information: IDBD
IDBD
has been maintaining negotiations with creditors in order to
restructure its financial debt in favorable terms. As of June 30,
2020, the total balance of (i) IDBD’s Series 9 Bonds was NIS
901 million (the "Series 9"), (ii) IDBD's Series 14 Bonds were NIS
889 million guaranteed by IDBD’s 70% of DIC's shares (the
“Series 14”), (iii) IDBD’s Series 15 Bonds were
NIS 238 million guaranteed by 5% of Clal’s shares (the
"Series 15"). Due to lack of agreement, on September 17, 2020, a
petition was submitted in the District Court in Tel-Aviv-Jaffa
(“The Court”) on the subject of granting of an order
for the opening of proceedings by the Trustee for the holders of
the Company's Bonds (Series 9) (“The petition”). Within
the framework of the petition, the Court was requested to grant an
order for the opening of proceedings for the Company pursuant to
Section 18 of the Insolvency and Economic Rehabilitation Law, 5778
– 2018 (“The Law”); to instruct the appointment
of a trustee for the Company according to law. On September 21,
2020, the holders of the bonds (Series 14) of IDB Development
approved making the entire uncleared balance of IDB Development's
bonds (Series 14) repayable immediately. On September 22, 2020, the
Company submitted its initial response to the Petition in the
Court, in which it argues that it is in the best interest of the
company and all its creditors to exhaust the negotiations with the
controlling shareholder and its creditors during a short period in
order to try and maximize the value of its assets, for the benefit
of the creditors and the company, and avoid costs and additional
harmful consequences. In addition, the response of Dolphin
Netherlands B.V. (the controlling shareholder of the Company) was
also submitted, as were responses by the Trustees for the
bondholders (Series 15 and Series 14) of the Company to the
Petition. It should be mentioned that in tandem to his response,
the Trustee of bondholders (Series 14) of the company submitted
petitions for the enforcement of a lien and for the appointment of
a receiver as well as an urgent petition for the setting of a
hearing on the said petitions for a receivership, together with the
hearing on the petition, which was set for September 24, 2020. On
September 25, 2020, declared the insolvency and liquidation of IDBD
and initiated liquidation proceedings. The Court appointed a
trustee for the shares of IDBD and a custodian for the shares of
DIC and Clal. We are analyzing together with our local and
international advisors the decision, including alternatives and
courses of action.
86
Corporate Information-
On
September
23, 2020, it was reported that Mr. Jorge Cruces by majority vote of
the board members of IRSA was appointed as the new Investment
Manager and Mr. Arnaldo Jawerbaum as the new Operations Manager of
Shopping Malls and Offices. Mr. Daniel Ricardo Elsztain's position
was changed to General Manager of Real Estate Operations and
Investments.
Communication “A” 7,106 from the Central Bank of the
Argentine Republic.
On
September 15, 2020, the Central Bank issued Communication
“A” 7,106, further restricting access to U.S. dollars
by imposing new conditions for the purchase of foreign currency in
the FX Market. The Central Bank tightened controls on buying U.S.
dollars in the FX Market, transactions involving U.S. dollar-
denominated securities and credit card purchases made in foreign
currency. The Central Bank also required Argentine companies facing
maturities of principal exceeding USD 1 million in U.S.
dollar-denominated debt per month from October 15, 2020 through
March 31, 2021 to submit a restructuring plan to the Central Bank.
Such restructuring plan must meet the following criteria: (i) the
net amount for which companies may access the FX Market may not
exceed 40% of the principal amount subject to maturity and (ii) the
remaining principal amount of U.S. dollar-denominated debt shall be
replaced with newly-issued obligations with an average duration of
no less than two years. We are currently analyzing the impact of
these regulations on our ability to timely repay our Notes Series I
for an aggregate amount of USD 181,518,707, which mature on
November 15, 2020, as well as certain other financial
indebtedness.
Finally, On
November 11, 2020, IRSA reported the results of the Exchange Offer.
Eligible holders have been presented for a total amount equivalent
(for both Classes) to USD 178,458,188, representing 98.31% of the
face value of the Existing Notes in Circulation, through the
participation of 6,571 orders.
Capital contribution in IDBD and Clal Sale.
On
September 7, 2020, IRSA reported that with respect to the
commitment to make capital contributions in the sum of NIS
70,000,000 (seventy million Israeli shekels) on September 2, 2020
and other NIS 7 000,000 (seventy million Israeli shekels) on 2
September 2021 the Company has considered that there are doubts as
to the fulfilment of the preconditions established for making such
contributions and has therefore resolved not to make the
contribution for this year. In this regard, it is clarified that
Dolphin continues to hold talks with IDBD creditors in order to
dispel the doubts that have arisen. In addition, IRSA reported that
IDBD reported the sale of 2,376,527 Clal shares at an average
NIS/Share price of 32.48 representatives of 3.5% of the share
capital issued. For more information see “Recent Events
– Recent IRSA Events - Corporate Information:
IDBD”.
As a
result of this transaction, as of the date, IDBD's holding in Clal
amounts to 5.0% of its share capital.
Lipstick Building
On
August 7, 2020, IRSA reported that it has decided to stop facing
the cost of renting land (Ground Lease) where the Lipstick Building
is located in New York City, handing over the management of the
property. This will generate an accounting gain of approximately
ARS 2.5 billion following the reversal of net liabilities recorded
in connection with this investment.
Investment in DIC: sale of stake in Shufersal
On July
27, 2020, IRSA reported that as of July 22, 2020, DIC has accepted
the purchase offer by private investors of its total stake in
Shufersal representative of 26% of its share capital for total
consideration of NIS 1,456 million (NIS/share 23.5). In this way,
DIC completes the process of selling this company. As a result of
this transaction, DIC does not hold anymore a stake in Shufersal
and participation in the supermarkets industry.
The
accounting result transaction totaling ARS 1.480 million, will be
recognized in the Company’s financial statements in the first
quarter of fiscal year 2021.
87
Issuance of Series VI and VII Notes
On July
16, 2020, IRSA reported the placement of Series VI and VII Notes.
Series VI Notes are denominated and payable in Pesos, at variable
interest rate equivalent to the reference rate plus the Cutting
Margin of 4.00% (four per cent), due July 21, 2021 by a face value
of ARS 335,200,431 equivalent to USD 4,697,645 calculated at an
exchange rate of ARS 71,355/USD1.00, with an issuance price of 100%
of face value; and Series VII Notes are denominated in U.S. Dollars
and payable in Pesos at theofficial exchange rate, at a fixed
interest rate equivalent to the 4.00% nominal annually, due January
21, 2022 at a face value of USD 33,717,500, with an issuance price
of 100.00% of face value. The total amount awarded by the two
series of Notes reached the sum of USD 38,415,145, implying an
oversubscription of 2.6 times the total amount initially offered.
The Issuance and Settlement Date was July 21, 2020.
IDBD investment in CLAL
In the
period January-July 2020, IDBD closed all the open swap
transactions that it performed on Clal shares, with a cumulative
rate of 8.2% of Clal shares, as detailed below: in January 2020 in
relation to shares representing to 1.1% of Clal shares; in June
2020 in relation to sharesrepresenting 4.99% of Clal shares and in
July 2020 in relation to shares representing 2.1% of Clal
shares.
Additionally, on September 3, 2020, IDBD sold 2,376,527 Clal
shares at an average price of NIS 32.475 per share, for a total
amount of NIS 77.2 million, representing 3.5% of Clal’s
capital share.
As a
result of the aforementioned transactions, as of September 3, 2020,
IDBD held 4.99% of Clal’s issued share capital, while these
shares were pledged in favor of the debenture holders (Series 15);
The outline for the sale of Clal shares was completed, IDBD no
longer has swap transactions and accordingly, it is no longer
considered a Clal interested party within the context of
Israel’s Securities Regulations.ate
IRSA CP Dividend
announcement
On
November 13, 2020, IRSA CP informed that in accordance with the
resolution of the Ordinary and Extraordinary General Shareholders
Meeting dated October 26, 2020 and the Board of Directors meeting
dated November 13, 2020, a cash dividend of ARS 9,700,000,000
charged to the year ended on June 30, 2020 equivalent to
7697.55436001% of the stock capital will be made available to the
shareholders on November 25, 2020 (“Date of
Provision”). It is clarified that based on the powers
delegated to the Company's Board of Directors, the dividend will be
paid in a single installment, leaving the payment schedule without
effect.
The
amount per share will be (V$N 1) ARS 76.9755436001 and the amount
per ADR's (Arg. Pesos per ADR) of ARS 307.9021744004, payable to
all shareholders that have such quality as of November 24, 2020
according to the registry led by Caja de Valores S.A.
In
accordance with the resolutions of the aforementioned Shareholders
Meeting and the Board of Directors, the shareholders will receive
payment in United States dollars in the Argentine Republic (CVSA
Code 10,000) at a conversion rate to that currency that will be set
according to the selling currency exchange rate reported by the
National Bank of Argentina at the close of the business day
immediately prior to the day of payment. Likewise, shareholders may
choose to receive payment in US dollars New York Plaza (CVSA Code
7000), complying with the requirements and presentations
established for this purpose by Caja de Valores SA, until 5:00 p.m.
on November 20, 2020 inclusive.
Shareholders
who wish to exercise the option should contact their depositary or
Caja de Valores SA, as the case may be, to obtain advice on the
mechanisms enabled by the following means: Telephone: 0810-888-7323
and email: reclamosysugerencias@cajadevalores.com.ar.
It is
reported that in the case that the beneficiary of the dividend is a
human person and / or an undivided succession and / or a
beneficiary from abroad, on the amounts to be paid, a withholding
of 7% will be made in accordance with the provisions of the Income
Tax Law, since these are results originated in years beginning
after January 1, 2018.
Board
Meeting– IRSA CP
On
October 26, 2020, IRSA CP’s informs that the
Shareholders’ Meeting has resolved the
following:
1)
Appointment of two shareholders to sign the meetings’
minutes. The meeting approved by majority of votes the appointment
of the representatives of shareholders ANSES FGS and IRSA to
approve and sign the minutes of the Shareholders’
Meeting.
2)
Consideration of documents contemplated in paragraph 1, Section
234, Law No. 19,550 for the fiscal year ended June 30, 2020. The
meeting approved by majority of votes the documents required under
Section 234, paragraph 1, of General Companies Law No. 19,550 for
the fiscal year ended June 30, 2020
3)
Consideration of the capital increase from the sum of ARS
126,014,050 to the sum of ARS 54,123,001,970 through the
capitalization of reserves and the consequential issue of shares
for the amount of ARS 53,996,987,920 to distribute among the
shareholders in proportion of their ownership. The meeting
unanimously approved to increase the Company’s capital from
ARS 126,014,050 to ARS 54,123,001,970 (Argentine pesos fifty-four
thousand one hundred twenty-three million one thousand nine hundred
seventy), through the capitalization of the following reserves (i)
comprehensive capital stock adjustment amounting to ARS
3,390,555,113 (Argentine pesos three thousand three hundred and
ninety million five hundred fifty five thousand one hundred and
thirteen); (ii) share premium amounting to de ARS 9,660,048,796
(Argentine pesos nine thousand six hundred sixty million forty
eight thousand seven hundred and ninety six); (iii) special reserve
in accordance with General Resolution CNV 609/2012 amounting to ARS
9,164,223,299 (Argentine pesos nine thousand one hundred sixty four
million two hundred twenty three thousand two hundred ninety nine),
(iv) reserve for future dividends amounting to ARS 31,631,809,393
(Argentine pesos thirty one thousand six hundred and thirty one
million eight hundred and nine thousand three hundred and ninety
three), and Special Reserve amounting to ARS 150,351,319 (Argentine
pesos one hundred and fifty million three hundred and fifty one
thousand three hundred nineteen), thereby issuing 53,996,987,920
fully paid-up shares in favor of the shareholders in proportion to
their shareholding interests.
4)
Allocation of net gain for the fiscal year ended June 30, 2020 for
ARS 17,089,535,712. Distribution of cash dividends in periodical
fees for up to ARS 9,700,000,000. The meeting approved by majority
of votes:
88
i) to
allocate 5% of the income for the fiscal year, amounting to ARS
854476,785.59, to the legal reserve; ii) to distribute cash
dividends for the amount of ARS 9,700,000,000, in proportion to the
shareholding interests of the shareholders, to be paid in cash, in
period installments in accordance with the following payment
schedule: the first installment amounting to ARS 2,425,000,000
shall be paid within 30 calendar days as from the meeting approval,
the second installment amounting to ARS 2,425,000,000 shall be paid
on January 25, 2021, the third installment amounting to ARS
2,425,000,000 shall be paid on March 25, 2021, and the fourth and
last installment amounting to ARS 2,425,000,000 shall be paid on
May 24, 2021; and iii) to allocate the balance, i.e. the amount of
ARS 6,535,058,926, to the special reserve, which may be used to pay
future dividends, to carry out new projects or for any other
purpose in the interests of the Company; and iv) to delegate to the
Board of Directors the power to implement the payment of dividends
to the shareholders within the terms set forth in the payment
schedule and/or any amendment thereto, and to apply for and
implement the payment of such dividends to the ADR
holders.
5)
Consideration of Board of Directors’ performance for the
Fiscal Year ended June 30, 2020. It was approved by the majority of
the votes.
6)
Consideration of Supervisory Committee’s performance for the
Fiscal Year ended June 30, 2020. It was approved by the majority of
the votes.
7)
Consideration of compensation payable to the Board of Directors
(ARS 320,769,717, allocated sum) for the Fiscal Year ended June 30,
2020. The meeting approved by majority of votes the sum of ARS
320,769,717 as total compensation payable to the Board of Directors
for the fiscal year ended June 30, 2020, without exceeding the
limits set forth in section 261 of General Companies Law No.
19,550, taking into account the directors duties, the time
allocated to professional roles, the income/loss recorded during
their management, the special technical works carried out for
subsidiary companies as well as the professional experience in
addition to the market value of the services rendered; and to
empower the Board of Directors to (i) allocate and distribute such
compensation sum in due course in accordance with the specific
duties discharged by its members; (ii) to make monthly advance
payments of fees contingent upon the resolution to be adopted at
the next ordinary shareholders’ meeting.
8)
Consideration of compensation payable to the Supervisory Committee
(ARS 1,575,000, allocated sum) for the Fiscal Year ended June 30,
2020. It was approved by the majority of the votes.
9)
Determination of number and appointment of regular directors and
alternate directors for a term of three fiscal years. The meeting
approved by majority of votes: i) to maintain in 9 (nine) the
number of regular directors and to determine in 9 (nine) the number
of alternate directors; ii) to renew the appointment of Mr. Eduardo
Sergio Elsztain as non-independent Regular Director, Mr. Marcos
Barylka as independent Regular Director and appoint Mrs. Mariana
Renata Carmona as non-independent Regular Director; iii) to renew
the appointment of Messrs. Gastón Armando Lernoud and Juan
Manuel Quintana as non-independent Alternate Directors; and iv) to
appoint Messrs. Ilan Ariel Elsztain and Ben Iosef Elsztain as
non-independent Alternate Directors.
10)
Appointment of regular and alternate members of the Supervisory
Committee for a term of one fiscal year. The meeting approved by
majority of votes to appoint José Daniel Abelovich, Marcelo
Héctor Fuxman and Noemí Ivonne Cohn as Regular Statutory
Auditors and Messrs. Roberto Daniel Murmis, Ariela Levy and Paula
Sotelo as Alternate Statutory Auditors for a term of one fiscal
year.
11)
Appointment of certifying accountant for the next fiscal year. The
meeting approved by majority of votes i) to appoint the following
firms as certifying accountants for the 2020/2021 fiscal year
(a)Price Waterhouse & Co. S.R.L. member of
PriceWaterhouseCoopers with Walter Rafael Zablocky acting as
Regular Independent Auditor; and (b) Abelovich Polano &
Asociados with José Daniel Abelovich acting as Regular
Independent Auditor, and ii) not to appoint alternate members this
time.
12)
Approval of compensation for ARS 28,770,129 payable to certifying
accountant for the fiscal year ended June 30, 2020. It was approved
by the majority of the votes.
13)
Consideration of annual budget for implementation of the audit
committee’s annual plan and compliance and corporate
governance program. The meeting approved by majority of votes a
budget of ARS 605,000, for the eventual hiring of advisors /
consultants and trainings.
89
14)
Implementation of incentive plan for employees, management and
directors, approved on the Shareholders Meeting held on October 30,
2019, for up to 1% of the stock capital for released shares
provided in Item 3 of this Agenda for the incentive plan according
to Art. 68 of Law 26,831 of Capital Market. The meeting approved by
majority of votes to ratify the resolutions adopted by the meeting
held on October 30, 2019, as regards the implementation of the
incentive plan for employees, management and directors of the
Company and to provide the allocation of up to 1% of the capital
derived from the capital increase approved in item three of this
agenda, i.e., upon the sum of ARS 54,123,001,970 (fifty four
thousand one hundred and twenty three million one thousand nine
hundred and seventy), to the integration and implementation of such
plan, thus allocating such shares as bonus to the beneficiaries of
the plan, all in accordance with the provisions set forth in
Section 68 of the Capital Market Law No. 26.831.
15)
Consideration of the amendment of Article 6 of the bylaws due to a
change in the nominal value of the shares from the sum of ARS 1 to
the sum of ARS 100. The meeting approved by majority of votes to
amend article six of the corporate by-laws, which shall read as
follows: Section six: The movements in the capital stock shall be
reflected in the company’s balance sheets, indicating the
authorized amount, class and category of shares, par value and
number of votes per share. The Company’s shares are
designated as common, book-entry shares of pesos one hundred (ARS
100) par value each, entitled to one vote per share. The Company
may issue preferred shares, either with or without voting rights,
which shall be issued in book-entry form. Preferred shares shall be
entitled to a preferred dividend, either cumulative or not,
pursuant to their terms of issue. Preferred shares may also be
entitled to an additional share in the net income.
16)
Authorization to carry out registration proceedings relating to
this shareholders’ meeting before the argentine securities
commission and the general superintendence of corporations. The
meeting approved by majority of votes to authorize attorneys-at-law
María Laura Barbosa, Lucila Huidobro, Paula Pereyra Iraola,
María Florencia Vega and/or María Inés Higa and Mrs.
Andrea Muñoz to carry out all the relevant registrations of
the preceding resolutions.
Reopening Shopping malls- IRSA CP
On
October 14, 2020, IRSA CP announced the opening of Alto Palermo,
Paseo Alcorta, Patio Bullrich, Abasto Shopping and DOT Baires
shopping malls, located in the City of Buenos Aires since today
which are added to the Distrito Arcos open space Premium Outlet
which has already been operational since August.
The
shopping malls mentioned above are restarting their operations
under a strict safety and hygiene protocol that includes social
distancing, reduced hours and access controls, among other
measures. Activity in food courts is limited to the
commercialization of products through home delivery or take-away
and entertainment businesses remains closed.
As of
the date of this Annual Report, IRSA CP is operating all its
shopping malls.
IRSA CP
keeps its commitment to safeguard the health and well-being of its
clients, employees, tenants, and the entire population, constantly
reassessing its decisions according to the evolving events, issued
rules and guidelines of the competent authorities.
Corporate Information- IRSA CP
On
September
22, 2020, it was reported that Mr. Jorge Cruces by majority vote of
the board members of IRSA CP was appointed as the new Investment
Manager and Mr. Arnaldo Jawerbaum as the new Operations Manager of
Shopping Malls and Offices. Mr. Daniel Ricardo Elsztain's position
was changed to General Manager of Real Estate Operations and
Investments.
90
Boston Tower floor’s sale by IRSA CP
On
August 26, 2020, IRSA CP reported that on that date it has sold and
transferred 5 floors of the Boston tower located at 265 Della
Paolera Street, in the Catalinas district of the Autonomous City of
Buenos Aires for a gross leasable area of approximately 6,235 sqm
and 25 garage units located in the building. The transaction price
was approximately USD 34.7 million (USD/sqm 5,570), which was paid
in full. After this transaction, IRSA CP owns 7 floors with an
approximate leasablearea of 7,383 sqmin addition to garage units
and other complementary spaces.
On
November 5, 2020, IRSA CP reported that on that date it has sold
and transferred 4 floors of the Boston tower located at 265 Della
Paolera Street, in the Catalinas district of the Autonomous City of
Buenos Aires for a gross leasable area of approximately 3,892 sqm
and 15 garage units located in the building. The transaction price
was approximately USD 22.9 million (USD/sqm 5,570), which was paid
in full. After this transaction, IRSA CP owns 3 floors with an
approximate leasable area of 3,266 sqmin addition to garage units
and other complementary spaces.
On
November 12, 2020, IRSA CP reported that on that date it has sold
and transferred three floors of the Boston tower located at 265
Della Paolera Street, in the Catalinas district of the Autonomous
City of Buenos Aires for a gross leasable area of approximately
3,266 sqm, a retail store of approximately 225 sqm and 15 garage
units located in the building. The transaction price was
approximately USD 19.1 million (USD/sqm 5,490), which was paid in
full. After this transaction, IRSA CP has no remaining leasable
area in the building, only keeping a space of the first
basement.
Impact of COVID-19 to IRSA CP’s Shopping Malls.
On
August 4, 2020, IRSA CP informed its shareholders and the market in
general that in compliance with the provisions of Articles 2 and 10
of Decree 641/2020 promulgated by the National Executive Branch,
whose objective is to continue mitigating the risk of spread of the
virus and protecting public health, the shopping centers located in
the Autonomous City of Buenos Aires and Greater Buenos Aires will
continue to operate only in the areas considered essential as
pharmacies, supermarkets and banks until August 16, 2020 with the
exception of Distrito Arcos, commercial center of the Company that,
for its open-air characteristics, reopened its doors on August 3,
2020 as did the commercial premises of large avenues and main
commercial corridors of the city. In the interior of the country,
most provinces move forward with the easing and opening of their
commercial and recreational activities. Distrito Arcos joins the
already operational Alto Noa, Mendoza Plaza, Córdoba Shopping,
Alto Rosario, La Ribera Shopping and Alto Comahue that IRSA CP owns
in the interior of the country. The total of the shopping in
operation reaches approximately 148,000 m2, representative of 44%
of the gross leasable area of its portfolio, except for the food
and entertainment venues of the shopping centers in Neuquén,
Córdoba and Santa Fe that have not yet resumed operations.
IRSA CP remains committed to preserving the health and well-being
of its customers, employees, localities and the entire population,
constantly re-evaluating its decisions according to the evolution
of events, the rules that are dictated and the guidelines of the
competent authorities.
91
Bouchard 710 Building Sale
On July
30, 2020, IRSA CP reported that on that date it has sold to an
unrelated third party the entire building "Bouchard 710", located
in the Plaza Roma district of the Autonomous City of Buenos Aires.
The tower consists of 15,014 m2 of gross leasable area in 12 floors
of offices and 116 units of garages.
The
transaction price was approximately USD 87.2 (USD / sqm 5,800) and
has been paid in full. Bouchard 710 is a AAA category office
building, with LEED Gold rating, located in one of the premium
corporate areas of the Autonomous City from Buenos
Aires.
Signature of a Purchase ticket regarding Boston Tower floor with
possession
On July
15, 2020 IRSA CP reported that on that date it has signed with an
unrelated third party a purchase ticket with possession of a
medium-height Boston Tower floor located at 265 Della Paolera
Street, in the Catalinas district of Buenos Aires for a total area
of approximately 1,063 sqm and 5 garage units located in the
building. The transaction price was approximately USD 6.7 million
(USD/sqm 6,300), which was paid in full. After this operation, IRSA
CP has 12 floors with an approximate location area of 13,800 sqm.
In addition to garage units and other complementary spaces. The
Boston Tower is a modern office building located in one of the most
premium corporate areas of the Autonomous City of Buenos Aires. It
was designed by renowned architect Cesar Pelli and has 27 floors
and 60 garages in 31,670 square meters of gross leasable
area.
B. BUSINESS OVERVIEW
General
We are a leading Latin American agricultural company engaged in the
production of basic agricultural commodities with a growing
presence in the agricultural sector of Brazil, through our
investment in Brasilagro, as well as in other Latin American
countries. We are currently involved in several farming activities
including grains and sugarcane production and cattle raising. Our
business model focuses on the acquisition, development and
exploitation of agricultural properties having attractive prospects
for agricultural production and/or value appreciation and the
selective sale of such properties where appreciation has been
realized. In addition, we lease land to third parties and perform
agency and agro-industrial services, including a meat packing
plant. Our shares are listed on ByMA and the NASDAQ.
We are also directly and indirectly engaged in the real estate
business through our subsidiary IRSA and its subsidiaries and joint
ventures, one of Argentina’s leading real estate companies.
IRSA is engaged in the development, acquisition and operation of
shopping malls, premium offices, and luxury hotels in Argentina,
and owns selective investments outside Argentina, mainly through
IDBD and DIC, two of the largest and most diversified investment
groups of Israel. IRSA’s shares are listed on the ByMA and
the NYSE. We own 62.35% of the outstanding common shares of
IRSA.
During the fiscal year ended June 30, 2020 and 2019, we had
consolidated revenues of ARS 121,256 million, and ARS 110,741
million, and consolidated gain / (loss) from operation, before
financing and taxation, of ARS 52,735 million and ARS (31,817)
million, respectively. During the fiscal year ended June 30, 2020
and 2019, our total consolidated assets decreased 5.69% from ARS
726,034 million to ARS 686,940 million, and our consolidated
shareholders’ equity decreased 4.13% from ARS 127,201 million
to ARS 122,153 million.
Segment information is analyzed based on products and services: (i)
agricultural business and (ii) urban properties and investment
business. In addition, within this last segment, operating segments
are analyzed by geography: Operations Center Argentina and
Operations Center Israel. Within each operations center, the Group
considers separately the variousactivities being developed, which
represent reporting operating segments given the nature of its
products, services, operations and risks. Management believes the
operating segment clustering in each operations center reflects
similar economic characteristics in each region, as well as similar
products and services offered, types of clients and regulatory
environments.
As from fiscal year 2018 the Chief Operating Decision Maker
(“CODM”) reviews the operating income/loss of each
operating segment excluding the amounts related to management fees,
being such amount reviewed at an aggregate level outside each
business. Additionally, the CODM reviews certain corporate expenses
associated with each business in an aggregate manner and separately
from each of the segments, such expenses have been disclosed in the
"Corporate" segment of each operation center.
92
Agricultural Business
Our Agricultural business is further comprised of four reportable
segments:
● The “Agricultural production” segment
consists of planting, harvesting and sale of crops as wheat, corn,
soybeans, cotton and sunflowers; breeding, purchasing and/or
fattening of free-range cattle for sale to slaughterhouses and
local livestock auction markets; leasing of the Company’s
farms to third parties; and planting, harvesting and sale of
sugarcane. Our Agricultural production segment had assets of ARS
37,070 million and ARS 34,597 million as of June 30, 2020 and 2019,
respectively, representing 88.26% and 91.67% respectively of our
agricultural business assets at both dates. Our Agricultural
production segment generated income from operations of ARS 3,521
million and ARS 2,120 million for fiscal years ended June 30, 2020,
and 2019, respectively, representing 53.08% and 67.49%, of our
consolidated profit from operations, from Agricultural Business for
such years, respectively.
The segment “agricultural production” aggregate the
crops, cattle, sugarcane and agricultural rental and services
activities:
●
Our
“Crops” activity consists of planting,
harvesting and sale of crops as wheat, corn, soybeans, cotton, and
sunflowers. The Company is focused on the long-term performance of
the land and seeks to maximize the use of the land through crop
rotation, the use of technology and techniques. In this way, the
type and quantity of harvested crops change in each agricultural
campaign. Our Crops activity had assets of ARS 15,825
million and ARS 14,778 million as of June 30, 2020 and 2019,
respectively, representing 42.69% and 42.71% of our Agricultural
Business assets at such dates, respectively.
Our Crops activity generated profit from operations
of ARS 1,908 million and ARS 1,434 million for fiscal years
ended June 30, 2020 and 2019, respectively, representing 28.76% and
45.65%, of our consolidated profit from operations from
Agricultural Business for such years, respectively.
●
Our
“Cattle” activity consists of breeding, purchasing
and/or fattening of free-range cattle for sale to meat processors
and local livestock auction markets. Our Cattle
activity had assets of ARS 5,071 million and ARS 5,341 million
as of June 30, 2020 and 2019, respectively, representing 13.53% and
15.44% of our agricultural business assets at such dates,
respectively. Our Cattle activity generated income
from operations of ARS 233 million for fiscal year ended June 30,
2020 and losses from operations ARS 101 million for fiscal year
ended June 30, 2019, representing 3.51% and (3.22%), of our
consolidated profit from operations from Agricultural Business for
such years, respectively.
●
Our
“Sugarcane” activity consists of planting, harvesting
and sale of sugarcane. Our Sugarcane activity had assets
of ARS 7,487 million and ARS 8,704 million as of June 30, 2020 and
2019, respectively, representing 20.20% and 25.16% of our
agricultural business assets at such dates, respectively.
Our Sugarcane activity generated profit from
operations of ARS 1,069 million and ARS 519 million for fiscal
years ended June 30, 2020, and 2019, representing 16.11% and
16.52%, of our consolidated profit from operations from
Agricultural Business for such years, respectively.
●
Our
“Agricultural Rentals and Services” activity consists
of agricultural services (for example: irrigation) and leasing of
the Company’s farms to third parties. Our Agricultural
Rentals and Services activity had assets of ARS 4,388 million and
ARS 2,893 million as of June 30, 2020 and 2019, respectively,
representing 11.84% and 8.36% of our agricultural business assets
at such dates, respectively. Our Agricultural Rentals and Services
activity generated profit from operations of ARS 311 million and
ARS 268 million for fiscal years ended June 30, 2020, and 2019,
respectively, representing 4.69% and 8.53% of our profit from
operations from Agricultural Business for such years.
93
●
Our
“Land Transformation and Sales” segment comprises
gains from the disposal and development of farmlands
activities. Our Land Transformation and Sales segment had
assets of ARS 510 million and ARS 149 million as of June 30, 2020
and 2019, respectively, representing 1.38% and 0.43% of our
agricultural business assets at such dates, respectively.
Our Land Transformation and Sales segment generated
profit from operations of ARS 2,551 million and ARS 881 million for
fiscal years ended June 30, 2020, and 2019, respectively,
representing 38.45% and 28.05% of our profit from operations from
Agricultural Business for such years.
●
Our
“Other segments” includes, principally, feedlot
farming, slaughtering and processing in the meat refrigeration
plant, among others. Our Others segment had assets of ARS
3,843 million and ARS 2,732 million as of June 30, 2020 and 2019,
respectively, representing 10.37% and 7.90% of our agricultural
business assets at such dates, respectively. Our Others activity
generated profit from operations of ARS 739 million and ARS 434
million for fiscal years ended June 30, 2020, and 2019,
representing 11.14% and 13.18% of our consolidated operating income
from Agricultural Business for such years, respectively. The
segment “Other segments” aggregate the
activities Agro-industrial and Others:
●
Our
“Agro-industrial” activity consists of
feedlot farming and the slaughtering and processing in the meat
refrigerating plant. Feedlot farming is distinctive and requires
specific care and diets which differ from those provided to
free-range cattle. This activity represents a separate operating
activity due to the distinctive characteristics of the cattle
feedlot system and the industrialized meat processing in the
packing plant. Our Agro-industrial activity had assets of ARS 1,807
million and ARS 1,058 million as of June 30, 2020 and 2019,
respectively, representing 4.87% and 3.06% of our agricultural
business assets at such dates, respectively. Our Agro-Industrial
activity generated losses from operations of ARS 53 million and ARS
193 million for fiscal years ended June 30, 2020 and 2019,
representing (0.80%) and (6.14%) of our consolidated operating
income from Agricultural Business for such years
respectively.
●
Our
“Others” activity consists of the aggregation of the
remaining operating segments, which do not meet the quantitative
thresholds for disclosure. This activity includes the
brokerage and sale of inputs activities. Our Others activity had
assets of ARS 2,036 million and ARS 1,674 million as of June 30,
2020 and 2019, respectively, representing 5.49% and 4.84% of our
agricultural business assets at such dates, respectively. Our
Others activity generated profit from operations of ARS 792 million
and ARS 607 million for fiscal years ended June 30, 2020, and 2019,
representing 11.94% and 19.33% of our consolidated operating income
from Agricultural Business for such years,
respectively.
●
The
“Corporate” segment includes, principally, the
corporative expenses related to the agricultural business. Our
Corporate segment and corporate activity generated operating losses
of ARS (177) million and ARS (274) million for fiscal years ended
June 30, 2020, and 2019, representing (2.67%) and (8.72%) of our
consolidated profit from operations from Agricultural Business for
such years, respectively.
Operation Center in Argentina
We operate our business in Argentina through seven reportable
segments, namely “Shopping Malls,”
“Offices,” “Sales and Developments,”
“Hotels,” “International,”
“Corporate” and “Others” as further
described below:
●
Our
“Shopping Malls” segment includes the operating results
from our portfolio of shopping malls principally comprised of lease
and service revenue from tenants. Our Shopping Malls segment had
assets of ARS 49,445 million and ARS 50,477 million as of June 30,
2020 and 2019, respectively, representing 31.30% and 45.18% of our
operating assets for the Operations Center in Argentina at such
dates, respectively. Our Shopping Malls segment generated operating
profit of ARS 1,687 for the fiscal year ended June 30, 2020 and
operating loss of ARS 34,401 for the fiscal year ended June 30,
2019.
94
●
Our
“Offices” segment includes the operating results from
lease revenues of offices, other rental spaces and other service
revenues related to the office activities. Our Offices segment had
assets of ARS 62,536 million and ARS 31,691 million as of June 30,
2020 and 2019, respectively, representing 39.58% and 28.37% of our
operating assets for the Operations Center in Argentina at such
dates, respectively. Our Offices segment generated an operating
income of ARS 24,635 million and operating income of ARS 2,488
million for the fiscal year ended June 30, 2020 and 2019,
respectively.
●
Our
“Sales and Developments” segment includes the operating
results of the development, maintenance and sales of undeveloped
parcels of land and/or trading properties. Real estate sales
results are also included. Our Sales and Developments segment had
assets of ARS 33,456 million and ARS 28,404 million as of June
30,2020 and 2019, respectively, representing 21.18% and 25.42% of
our operating assets for the Operations Center in Argentina for
both years. Our Sales and Developments segment generated an
operating income of ARS 11,772 million and ARS 630 million for the
fiscal years ended June 30, 2020 and 2019,
respectively.
●
Our
“Hotels” segment includes the operating results of our
hotels mainly comprised of room, catering and restaurant revenues.
Our Hotels segment had assets of ARS 1,969 million and ARS 2,050
million as of June 30, 2020 and 2019, respectively, representing
1.25% and 1.83% of our operating assets for the Operations Center
in Argentina, respectively. Our Hotels segment generated an
operating income of ARS 162 million and ARS 671 million for the
fiscal year ended June 30, 2020 and 2019,
respectively,
●
Our
“International” segment includes investments that
mainly operate in the United States in relation to the lease of
office buildings and hotels in that country. We intend to continue
evaluating investment opportunities outside Argentina as long as
they are attractive investment and development options. Our
International segment had net liabilities of ARS 6,740 million and
ARS 4,229 million as of March 31, 2020 and 2019, respectively. Our
International segment generated operating losses of ARS 89 million
and operating losses of ARS 85 million for the periods ended March
31, 2020 and 2019, respectively.
●
“Corporate”.
Since fiscal year 2018, we have decided to disclose certain
corporate expenses related to the holding structure in a separate
“Corporate” segment. This segment generated a loss of
ARS 282 million and ARS 519 million for the fiscal years ended June
30, 2020 and 2019, respectively.
●
Our
“Others” primarily includes the entertainment
activities through La Arena and La Rural S.A., and the financial
activities carried out by Banco Hipotecario for both years. Our
Others segment had assets of ARS 8,270 million and ARS 6,047
million as of June 30, 2020 and 2019, respectively, representing
5.23% and 5.41% of our operating assets for the Operations Center
in Argentina, respectively. Our Others segment generated a profit
of ARS 554 million for the fiscal year ended June 30, 2020 and an
operating loss of ARS 783 million for the fiscal year ended June
30, 2019.
95
Operation Center in Israel
On
September 25, 2020, the Court resolved that IDBD is insolvent and
therefore it resolved to grant all three orders requested and
accordingly, issued an order for the initiation of proceedings and
liquidation of IDBD, and has appointed a liquidator to IDBD and
interim receivers over the Pledged DIC and Clal
Shares.
As of
the date of this Annual Report, we are analyzing together with our
local and international advisors the judicial decision,
alternatives and course of action. For more information see
“IRSA’s Recent Developments - Corporate Information:
IDBD”.
We operate our business in Israel through six reportable segments,
namely “Real Estate,” “Supermarkets,”
“Telecommunications,” “Insurances,”
“Corporate” and “Others” as further
described below:
●
Our
“Real Estate” segment mainly includes assets and
operating income derived from business related to the subsidiary
PBC. PBC is engaged, independently and through its subsidiaries and
associate companies, some of which are public companies, in various
areas of the real estate industry in Israeland abroad. The main
operating segments of PBC include the revenue-generating properties
segment - its core activity - and the residential construction
segment. PBC is also engaged in the agriculture segment, through
its investment in an associate (Mehadrim). Our Real Estate segment
had net operating assets of ARS 152,941 million and ARS 303,425
million as of June 30, 2020 and 2019, representing 34% and 57% of
our net operating assets for the Operations Center in Israel at
such years, respectively. Our Real Estate segment generated
operating loss of ARS 623 million for the fiscal year ended June
30, 2020 and operating income of ARS 5,259 million for the fiscal
year ended June 30, 2019, representing 208% and 149% of our
consolidated operating income for the Operations Center in Israel
for such years, respectively.
●
Our
“Supermarkets” segment includes assets and results
derived from the business related to the former subsidiary
(deconsolidated due to the loss of control in June 2018. See Note 4
to the consolidated financial statements) Shufersal, reclassified
to discontinued operations in the prior year. Shufersal operates
both directly and through its investee corporations, and owns the
largest supermarket chain in Israel in terms of sales volume. Our
Supermarkets segment had operating assets of ARS 28,090 million and
ARS 23,013 million (corresponds to the value of the associate) for
the fiscal period ended June 30, 2020 and 2019, representing 58.4%
and 30.9% of our operating assets for the Operations Center in
Israel at such years, respectively. On July 27, 2020, IRSA reported
that on July 22, 2020, DIC has accepted the purchase offer by
private investors of its total stake in Shufersal, representing 26%
of its share capital. For more information see: “Recent
developments - Investment in DIC: sale of stake in
Shufersal”
●
Our
“Telecommunications” segment includes assets and
operating income derived from the business related to our
subsidiary Cellcom. Cellcom is a provider of communication
services, which offers to its customers primarily mobile
communication services, landline telephone services, international
telephone services, internet connectivity services and associated
services, and beginning in December 2014, also television over
internet services. Our Telecommunications segment had net operating
assets of ARS 33,949 million and 24,580 million for the fiscal
period ended June 30, 2020 and 2019, representing 70.6% and 33.0% %
of our net operating assets for the Operations Center in Israel at
such dates, respectively. Our Telecommunications segment generated
operating income of ARS 702 million and of ARS 138 million for the
fiscal period ended June 30, 2020 and 2019,
respectively.
●
Our
“Insurance” segment includes the investment in Clal.
Clal is holding company which is primarily engaged in the
insurance, pension and provident funds segments, and in the holding
of assets and real and other related businesses (such as insurance
agencies), and which constitutes one of the largest insurance
groups in Israel. Our Insurance segment had operating assets of ARS
3,377 million and ARS 22,638 million for the fiscal period ended
June 30, 2020 and 2019, representing 7.0% and 30.4% of our
operating assets for the Operations Center in Israel at such years,
respectively. The decrease is derived from the partial sale of our
equity interest in Clal during fiscal year 2020, as required by the
Israeli regulator and the decrease in the quoted market price of
Clal’s shares.
●
Our
“Corporate” segment includes the assets and operating
results providing from the activities related to the holding
companies of the Operating Center in Israel, IDBD and DIC. Our
Corporate segment had net operating liabilities of Ps 93,738
million and 85,049 million as of June 30, 2020 and 2019,
respectively. Our Corporate segment generated an operating loss of
ARS 1,119 million and of ARS 1,058 million for the fiscal years
ended June 30, 2020 and 2019, respectively. The increase is derived
mainly from the revaluation of the NIS against the
peso.
96
●
Our
“Others” segment includes the assets and income derived
from other diverse business activities, such as technological
developments, oil and gas assets, electronics, and others. Our
Others segment had net operating assets of ARS 69,795 million and
ARS 21,496 million for the fiscal period ended June 30,2020 and
2019, respectively. Our Others segment generated operating income
of ARS 741 million and operating losses of ARS 817 million for the
fiscal period ended June 30, 2020 and 2019, respectively, without
share of loss of associates and joint ventures.
97
Agricultural Business
As of
June 30, 2020, we owned 26 farms with approximately 629,794
hectares distributed in Argentina, Brazil, Bolivia and Paraguay.
During the fiscal year 2020 we used 91,575 hectares of the land we
own for crop production, approximately 72,160 hectares are for
cattle production, 85,000 hectares are for sheep production and
approximately 23,205 hectares are leased to third parties for crop
and cattle production. The remaining 359,965 hectares of land
reserves are primarily natural woodlands. In addition, we have the
rights to hold approximately 132,000 hectares of land under
concession for a 35-year period that can be extended for another 29
years. Out of this total, we have assigned 26,409 hectares for crop
production and 2,993 hectares for cattle production. Also, during
fiscal year 2020 ended on June 30, 2020, we leased 111,086 hectares
to third parties for crop production and 12,365 hectares for cattle
production.
98
The
following table sets forth, at the dates indicated, the amount of
land used for each production activity (including owned and leased
land, and land under concession):
|
|
2020
(1)
|
2019
(1)
|
2018
(1)
(5)
|
2017
(1)
|
2016
(1)
|
|
Crops
(2)
|
229,070
|
220,170
|
194,281
|
193,106
|
178,617
|
|
Cattle
(3)
|
87,788
|
95,247
|
102,113
|
102,516
|
85,392
|
|
Milk/Dairy
|
-
|
-
|
-
|
1,036
|
2,231
|
|
Sheep
|
85,000
|
85,000
|
85,000
|
85,000
|
85,000
|
|
Land Reserves
(4)
|
463,372
|
450,882
|
461,795
|
471,437
|
473,290
|
|
Own farmlands
leased to third parties
|
23,655
|
16,100
|
9,603
|
7,733
|
2,435
|
|
Total
|
888,885
|
867,399
|
852,792
|
860,828
|
826,965
|
(1)
Includes 35.72% of approximately 8,299 hectares owned by
Agro-Uranga S.A., an affiliated Argentine company in which we own a
non-controlling 35.72% interest.
(2)
Includes wheat, corn, sunflower, soybean, sorghum and
others.
(3)
Breeding and fattening.
(4) We
use part of our land reserves to produce charcoal, rods and fence
posts.
(5)
Includes farms owned by Brasilagro and Cresud sold in 2014, 2015
and 2018.
99
Our Principal Business Activities
During
the fiscal year ended June 30, 2020, we conducted our operations on
26 owned farms and 88 leased farms.
The following
charts show, for fiscal year 2020, the surface area in operation
for each line of business, as well as the hectares held as land
reserves:
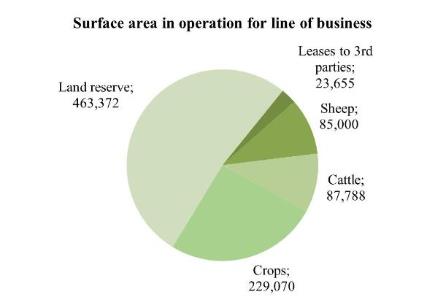
100
The
following chart illustrates, for the fiscal year ended on June 30,
2020, the surface area in operation and the hectares held as land
reserves, classified into own, under lease or under
concession:
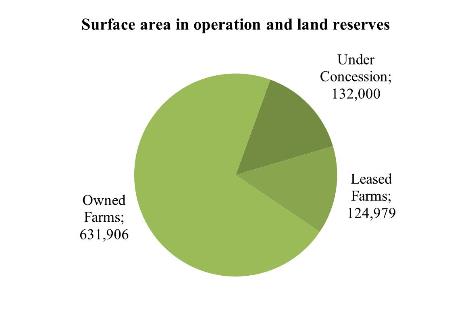
Agricultural Business
Land Transformation and Sales
Land Acquisitions
We seek
to increase our lands portfolio, through the acquisition of large
areas of land with high potential for appreciation. We also aim to
increase the productivity of the land by applying state-of-the-art
technology to improve agricultural yields.
Several
important intermediaries, with whom we usually work, bring
farmlands available for sale to our attention. The decision to
acquire farmlands is based on the assessment of a large number of
factors. In addition to the land’s location, we normally
carry out an analysis of soil and water, including the quality of
the soil and its suitability for our intended use (crops, cattle,
or milk production), classify the various sectors of the lot and
the prior use of the farmland; analyze the improvements in the
property, any easements, rights of way or other variables in
relation to the property title; examine satellite photographs of
the property (useful in the survey of soil drainage characteristics
during the different rain cycles) and detailed comparative data
regarding neighboring farms (generally covering a 50-km area).
Based on the foregoing factors, we assess the farmland in terms of
the sales price compared against the production potential of the
land and capital appreciation potential. We consider that
competition for the acquisition of farmlands is, in general,
limited to small farmers for the acquisition of smaller lots, and
that there is scarce competition for the acquisition of bigger
lots.
During
fiscal year 2020, our subsidiary BrasilAgro acquired the Serra
Grande field of 4,500 hectares (2,900 hectacres of productive
potential) in Piauí, Brazil. The purchase price is BRL 25
million, of which BRL 11 million was paid at closing. The balance
of the purchase price will be paid in three equal annual
installments.
Land Sales
We
periodically sell properties that have reached a considerable
appraisal to reinvest in new farms with higher appreciation
potential. We analyze the possibility of selling based on a number
of factors, including the expected future yield of the farmland for
continued agricultural and livestock exploitation, the availability
of other investment opportunities and cyclical factors that have a
bearing on the global values of farmlands.
101
Our
subsidiary BrasilAgro sold 3 fractions of farms during fiscal year
2020 for an aggregate amount of BRL 84.2 million (approximately USD
20 million). In the first quarter it sold a fraction of 1,134
hectares of the “Jatobá” farm located in
Jaborandi, State of Bahia, for an amount of BRL 22.7 million (BRL /
ha 20,018). The farm was valued at BRL 1.7 million and the internal
rate of return in dollars reached 7.0%. In the second quarter of
the year, it completed the sale of a fraction of 85 hectares of the
“Alto Taquarí” farm located in the state of Mato
Grosso for BRL 5.5 million. The farm was valued in the books at BRL
1.2 million and the internal rate of return in dollars reached
13.0%. During the fourth quarter, BrasilAgro made an additional
partial sale of 105 hectares of “Alto Taquarí” for
the sum of BRL 11.0 million which had a book value of BRL 1.7
million and the internal rate of return in dollars reached 14.4%
and another fraction of 1,875 hectarse of “Jatobá”
farm was sold for BRL 45 million, which had a book value of BRL 3.5
million and the internal rate of return in dollars reached 5.0%.
For more information see “Cresud’s Recent Developments
- Jatobá sale”
Land productivity potential
We
believe that our agricultural lands have significant productivity
potential and, through the implementation of best agricultural
practices and application of our accumualted knowledge and
experience, we are able to enhance the value of our agricultural
lands.
As of
June 30, 2020, we owned land reserves in the region extending over
more than 359,965 hectares of own farmlands that were purchased at
very attractive prices. In addition, we have a concession 102,598
hectares reserved for future development. Of the total of this
area, we maintain 286,388 hectares undeveloped. We believe that
there are technological tools available to improve productivity in
these farms and, therefore, achieve appreciation in the long term.
However, current or future environmental regulations could prevent
us from fully developing our land reserves by requiring that we
maintain part of this land as natural woodlands not to be used for
production purposes.
During
fiscal year 2020, we developed 12,705 hectares in the region: 5,774
hectares in Argentina; 2,354 hectares in Paraguay and 4,577
hectares in Brasil.
|
Newly
Developed Area
|
2019/2020
|
2018/2019
|
|
(hectares)
|
||
|
Argentina
|
5,774
|
2,486
|
|
Brazil
|
4,577
|
6,190
|
|
Paraguay
|
2,354
|
2,008
|
|
Total
|
12,705
(1)
|
10,684
|
(1)
9,829 completed and
2,876 pending completion.
Results
The
following table shows this segment’s results for fiscal year
2020, compared to the preceding fiscal year:
|
|
|
|
|
YoY var
|
|
|
FY2020
|
FY2019
|
FY2018
|
2020 vs. 2019
|
|
|
(in
millions of ARS)
|
%
|
||
|
Revenues
|
-
|
-
|
-
|
-
|
|
Costs
|
(25
)
|
(24
)
|
(36
)
|
(4.2
)
|
|
Gross Loss
|
(25
)
|
(24
)
|
(36
)
|
(4.2
)
|
|
Net
result for changes in fair value of investment
properties
|
780
|
-
|
216
|
100.0
|
|
Gain
from disposition of farmlands
|
838
|
665
|
1,656
|
26.0
|
|
General
and administrative expenses
|
(3
)
|
(3
)
|
(2
)
|
(0.0
)
|
|
Selling
expenses
|
(1
)
|
(1
)
|
-
|
(0.0
)
|
|
Other
operating results, net
|
962
|
244
|
|
(294.3
)
|
|
Profit from operations
|
2,551
|
881
|
1,457
|
(189.6
)
|
|
Segment profit
|
2,551
|
881
|
3,291
|
(189.6
)
|
102
Agricultural Production
Production
The
following table shows, for the fiscal years indicated, our
production volumes measured in tons:
|
Production
Volume
(1)
|
FY2020
|
FY2019
|
FY2018
|
FY2017
|
|
Corn
|
433,910
|
194,352
|
381,443
|
302,513
|
|
Soybean
|
359,055
|
355,670
|
225,916
|
203,526
|
|
Wheat
|
43,862
|
37,378
|
32,297
|
29,905
|
|
Sorghum
|
4,371
|
1,721
|
4,131
|
4,922
|
|
Sunflower
|
5,895
|
6,428
|
6,221
|
3,853
|
|
Cotton
|
2,573
|
1,586
|
-
|
-
|
|
Other
|
3,519
|
2,103
|
2,103
|
3,690
|
|
Total
Crops (tons)
|
857,490
|
599,238
|
652,111
|
548,409
|
|
Sugarcane
(tons)
|
2,360,965
|
1,999,335
|
924,776
|
1,062,860
|
|
Cattle
herd
|
11,783
|
11,173
|
10,566
|
7,626
|
|
Milking
cows
|
-
|
-
|
185
|
435
|
|
Cattle
(tons)
|
11,783
|
11,173
|
10,751
|
8,061
|
|
Milk
(liters)
|
-
|
-
|
3,891
|
13,968
|
(1) Includes Brasilagro, 50% of CRESCA, Acres del Sud, Ombú,
Yatay and Yuchán. Agro-Uranga S.A. is not
included.
The segment “agricultural production” aggregate the
crops, cattle, dairy, sugarcane and agricultural rental and
services activities.
Crops and Sugarcane
Our
crop production is mainly based on crops and oilseeds and
sugarcane. Our main crops include soybean, wheat, corn, and
sunflower. Other crops, such as sorghum and peanut, are sown
occasionally and represent only a small percentage of total sown
land.
Below
is the geographical distribution of our agricultural production for
the last four fiscal years:
|
2020
Season
|
Argentina
|
Brazil
|
Bolivia
|
Paraguay
|
Total
|
|
(in
tons)
|
|
|
|
|
|
|
Corn
|
334,821
|
89,900
|
4,264
|
4,925
|
433,910
|
|
Soybean
|
179,023
|
157,949
|
19,608
|
2,475
|
359,055
|
|
Wheat
|
43,862
|
-
|
-
|
-
|
43,862
|
|
Sorghum
|
-
|
4,371
|
-
|
-
|
4,371
|
|
Sunflower
|
5,895
|
-
|
-
|
-
|
5,895
|
|
Cotton
|
2,573
|
-
|
-
|
-
|
2,573
|
|
Other
|
-
|
3,519
|
-
|
-
|
3,519
|
|
Total Crops and Other
|
570,307
|
255,911
|
23,872
|
7,400
|
857,490
|
|
Sugarcane
|
-
|
2,217,714
|
143,251
|
-
|
2,360,965
|
|
2019
Season
|
Argentina
|
Brazil
|
Bolivia
|
Paraguay
|
Total
|
|
(in
tons)
|
|||||
|
Corn
|
157,079
|
29,903
|
6,143
|
1,227
|
194,352
|
|
Soybean
|
177,503
|
138,506
|
21,174
|
18,486
|
355,670
|
|
Wheat
|
37,378
|
-
|
-
|
-
|
37,378
|
|
Sorghum
|
1,364
|
-
|
357
|
-
|
1,721
|
|
Sunflower
|
6,428
|
-
|
-
|
-
|
6,428
|
|
Cotton
|
-
|
1,586
|
-
|
-
|
1,586
|
|
Other
|
2,103
|
-
|
-
|
-
|
2,103
|
|
Total Crops and Other
|
381,855
|
169,995
|
27,675
|
19,713
|
599,238
|
|
Sugarcane
|
-
|
1,932,235
|
67,100
|
-
|
1,999,335
|
103
|
2018
Season
|
Argentina
|
Brazil
|
Bolivia
|
Paraguay
|
Total
|
|
|
(in
tons)
|
||||
|
Corn
|
344,713
|
18,913
|
6,690
|
11,127
|
381,443
|
|
Soybean
|
99,840
|
94,031
|
14,953
|
17,092
|
225,916
|
|
Wheat
|
32,297
|
-
|
-
|
-
|
32,297
|
|
Sorghum
|
2,836
|
-
|
1,295
|
-
|
4,131
|
|
Sunflower
|
6,221
|
-
|
-
|
-
|
6,221
|
|
Other
|
2,103
|
-
|
-
|
-
|
2,103
|
|
Total Crops and Other
|
488,010
|
112,944
|
22,938
|
28,219
|
652,111
|
|
Sugarcane
|
-
|
901,274
|
23,502
|
-
|
924,776
|
|
2017
Season
|
Argentina
|
Brazil
|
Bolivia
|
Paraguay
|
Total
|
|
(in
tons)
|
|||||
|
Corn
|
253,164
|
31,969
|
9,410
|
7,970
|
302,513
|
|
Soybean
|
127,532
|
53,837
|
13,178
|
8,979
|
203,526
|
|
Wheat
|
29,905
|
-
|
-
|
-
|
29,905
|
|
Sorghum
|
44
|
-
|
4,879
|
-
|
4,923
|
|
Sunflower
|
3,853
|
-
|
-
|
-
|
3,853
|
|
Other
|
3,690
|
-
|
-
|
-
|
3,690
|
|
Total Crops and Other
|
418,188
|
85,806
|
27,467
|
16,949
|
548,410
|
|
Sugarcane
|
-
|
1,015,303
|
47,557
|
-
|
1,062,860
|
Sales
Below
is the total volume sold broken down into geographical areas,
measured in tons:
|
|
FY2020
|
FY2019
|
FY2018
|
FY2017
|
||||||||
|
Volume
of Sales
(3)
|
D.M.(1)
|
F.M.(2)
|
Total
|
D.M.
(1)
|
F.M.
(2)
|
Total
|
D.M.
(1)
|
F.M.
(2)
|
Total
|
D.M.
(1)
|
F.M.
(2)
|
Total
|
|
Corn
|
325.4
|
64.1
|
389.5
|
191.4
|
0.2
|
191.6
|
290.7
|
6.0
|
296.7
|
266.5
|
-
|
266.5
|
|
Soybean
|
308.8
|
110.2
|
419.0
|
166.4
|
101.9
|
268.3
|
172.0
|
23.4
|
195.4
|
137.8
|
28.8
|
166.6
|
|
Wheat
|
43.8
|
-
|
43.8
|
40.5
|
-
|
40.5
|
44.6
|
-
|
44.6
|
11.9
|
1.5
|
13.4
|
|
Sorghum
|
1.4
|
-
|
1.4
|
0.4
|
-
|
0.4
|
1.1
|
-
|
1.1
|
5.3
|
-
|
5.3
|
|
Sunflower
|
0.8
|
-
|
0.8
|
2.4
|
-
|
2.4
|
4.6
|
-
|
4.6
|
4.1
|
-
|
4.1
|
|
Other
|
9.3
|
-
|
9.3
|
1.2
|
-
|
1.2
|
1.6
|
-
|
1.6
|
3.6
|
-
|
3.6
|
|
Total
Grains
(tons)
|
696.9
|
176.4
|
873.3
|
402.3
|
102.1
|
504.4
|
514.6
|
29.4
|
544.0
|
429.2
|
30.3
|
459.5
|
|
Sugarcane
(tons)
|
2,226.2
|
-
|
2,226.2
|
1.965,4
|
-
|
1.965,4
|
1,723.0
|
-
|
1,723.0
|
906.8
|
-
|
906.8
|
|
Cattle
herd
|
19.3
|
-
|
19.3
|
9.4
|
-
|
9.4
|
13.3
|
-
|
13.3
|
6.9
|
-
|
6.9
|
|
Milking
cows
|
-
|
-
|
-
|
-
|
-
|
-
|
1.5
|
-
|
1.5
|
1.1
|
-
|
1.1
|
|
Cattle
(tons)
|
19.3
|
-
|
19.3
|
9.4
|
-
|
9.4
|
14.8
|
-
|
14.8
|
8.0
|
-
|
8.0
|
|
Milk
(in th of liters)
|
-
|
-
|
-
|
-
|
-
|
-
|
3.9
|
-
|
3.9
|
13.3
|
-
|
13.3
|
(1)
Domestic Market.
(2)
Foreign Market.
(3)
Includes Brasilagro, 50% of CRESCA, Acres del Sud, Ombú, Yatay
and Yuchán. Excludes Agro-Uranga.
The
following table shows the sown surface area assigned to crop
production, classified into own, under lease, under concession and
leased to third parties for the fiscal years indicated below,
measured in hectares:
|
|
2020
(1)0(1)
|
2019
(1)
|
2018
(1)
|
2017
(1)
|
|
Own
|
105,799
|
94,062
|
102,448
|
102,683
|
|
Under
lease
|
138,867
|
135,955
|
72,688
|
71,481
|
|
Under
concession
|
26,409
|
18,638
|
24,244
|
22,454
|
|
Leased
to third parties
|
13,837
|
14,325
|
9,533
|
7,663
|
|
Total
|
284,912
|
262,980
|
208,913
|
204,281
|
(1)
Includes double crops, all farms in Argentina, Bolivia, Paraguay
and Brazil, and Agro-Uranga (Associated –
35.72%).
104
|
|
Season
|
|
|
|
Stock
|
2020
|
2019
|
Variation
|
|
|
(in
tons)
|
%
|
|
|
Corn
|
60,294
|
77,216
|
(21.9
)
|
|
Soybean
|
108,171
|
174,575
|
(38.0
)
|
|
Sunflower
|
87
|
6,187
|
(98.6
)
|
|
Sorghum
|
527
|
443
|
19.0
|
|
Bean
|
2,535
|
-
|
-
|
|
Wheat
|
1,076
|
2,516
|
(57.2
)
|
|
Sugarcane
|
5,865
|
485
|
1.109.3
|
|
Cotton
|
1,130
|
1,586
|
(28.8
)
|
|
Other
|
1,230
|
3,704
|
(66.8
)
|
|
Total
|
180,915
|
266,712
|
(32.2
)
|
We seek
to diversify our mix of products and the geographic location of our
farmlands to achieve an adequate balance between the two principal
risks associated with our activities: weather conditions and the
fluctuations in the prices of commodities. In order to reduce such
risks, we own and lease land in several areas of Argentina with
different climate conditions that allow us to sow a diversified
range of products. Our leased land for crops is mostly located in
the Pampas region, a favorable area for crop production. The leased
farms are previously studied by technicians who analyze future
production expectations based on the historic use of the land. The
initial duration of lease agreements is typically one or three
seasons. Leases of farms for production of crops generally consist
of lease agreements with payments based on a fixed amount of Pesos
per hectare or sharecropping agreements with payments in kind
basedon a percentage of the crops obtained or a fixed amount of
tons of crops obtained or their equivalent value in Pesos. The
principal advantage of leasing farms is that leases do not require
us to commit large amounts of capital to the acquisition of lands
but allow us to increase our scale in the short term and reduce the
risk of inclement weather. The disadvantage of this strategy is
that the cost of leasing can increase over time, in part, because
increased demand for leased land increases the price of leased
land.
In
order to increase our production yields, we use, besides
state-of-the-art technology, labor control methods which imply the
supervision of the seeding’s quality (density, fertilization,
distribution, and depth), crop monitoring (determination of natural
losses and losses caused by harvester) and verification of bagged
crop quality. In this way, we work jointly with our suppliers to
achieve the best management of inputs, water and soil.
Wheat
seeding takes place from June to August, and harvesting takes place
from December to January. Corn, soybean and sunflower are sown from
September to December and are harvested from February to August.
Crops are available to be sold as commodities after the harvest
from December to June and we usually storepart of our production
until prices recover after the drop that normally takes place
during the harvesting season. A major part of production,
especially soybean, wheat, corn and sorghum, is sold and delivered
to buyers pursuant to agreements in which price conditions are
fixed by reference to the market price at a specific time in the
future that we determine. The rest of the production is either sold
at current market prices or delivered to cover any futures contract
that we may have entered into.
Agro-Uranga S.A.
We have
a 35.72% interest in AgroUranga S.A.. This company optimizes
production processes with special emphasis in soil conservation,
the application of rational techniques and care of the
environment.
At
present, with the assistance of its foreign trade team it is
seeking to develop new products so as to significantly increase
export volumes, encouraged by the world’s growing
demand.
Lease of Farmlands
We
conduct our business on owned and leased land. Rental payments
increase our production costs, as the amounts paid as rent are
accounted for as operating expenses. As a result, production costs
per hectare of leased land are higher than for the land owned by
us.
Our
land leasing policy is designed to supplement our expansion
strategy, using our liquidity to make production investments in our
principal agricultural activities. On the other hand, our leasing
strategy provides us with an added level of flexibility in the
share of each of our products in total production, providing for
greater diversification.
105
The
initial duration of lease agreements is typically one crop season
and sugarcane. Leases of farms for production of crops consist in
lease agreements with payments based on a fixed amount of Pesos per
hectare or sharecropping agreements with payments in kind based on
a percentage of the crops obtained or a fixed amount of tons of
crops obtained or their equivalent value in Pesos. Leases of
farmlands for cattle breeding consist in lease agreements with
fixed payments based on a fixed amount of Pesos per hectare or
steer kilograms or capitalization agreements with payments in kind
or in cash based on the weight gain in kilograms. Leases of farms
for production of sugarcane consist in a percentage lease
agreements and have a term of 15 years.
During
fiscal year 2020, we leased to third parties a total of 88 fields,
covering 124,894 hectares, including 52,387 hectares in Brazil. Out
of the total leased area 138,713 hectares were assigned to
agricultural production including double crops, and 12,635 hectares
to cattle raising. The properties for agricultural production were
leased, primarily, for a fixed price prior to harvest and only a
small percentage consisted of sharecropping
agreements.
The
following table shows a breakdown of the number of hectares of
leased land used for each of our principal production
activities:
|
|
2020
|
2019
|
2018
|
2017
|
|
Crops
(1)
|
111,001
|
117,397
|
66,333
|
71,481
|
|
Cattle
|
12,635
|
14,135
|
12,635
|
12,635
|
(1) Includes BrasilAgro.
Due to
the rise in the price of land, we adopted a policy of not
validating excessive prices and applying strict criteria upon
adopting the decision to lease, selecting those lands with values
that would ensure appropriate margins.
Results
The
following table shows the Company’s results for fiscal year
2020 for Crops and Sugarcane activities, compared to the preceding
fiscal year:
Crops
|
|
FY 2020
|
FY 2019
|
FY 2018
|
YoY var
2020 vs. 2019
|
|
|
(in
millions of ARS )
|
%
|
||
|
Revenues
|
11,464
|
6,977
|
5,541
|
64.3
|
|
Costs
|
(9,788
)
|
(6,160
)
|
(4,409
)
|
58.9
|
|
Initial
recognition and changes in the fair value of biological assets and
agricultural produce
|
1,176
|
1,500
|
1,259
|
(21.6
)
|
|
Changes
in the net realizable value of agricultural produce
|
657
|
(43
)
|
532
|
-
|
|
Gross profit
|
3,509
|
2,274
|
2,923
|
54.3
|
|
General
and administrative expenses
|
(547
)
|
(475
)
|
(456
)
|
15.2
|
|
Selling
expenses
|
(1,553
)
|
(859
)
|
(1,086
)
|
80.8
|
|
Other
operating results, net
|
445
|
438
|
-
|
1.6
|
|
Profit from operations
|
1,854
|
1,378
|
1,381
|
34.5
|
|
Share
of profit of associates and joint ventures
|
55
|
57
|
39
|
(3.5
)
|
|
Activity profit
|
1,909
|
1,435
|
1,420
|
33.0
|
106
Sugarcane
|
|
FY 2020
|
FY 2019
|
FY 2018
|
YoY var
2020 vs. 2019
|
|
|
(in
millions of ARS )
|
%
|
||
|
Revenues
|
3,177
|
2,651
|
2,048
|
19.8
|
|
Costs
|
(2,993
)
|
(2,311
)
|
(1,948
)
|
29.5
|
|
Initial
recognition and changes in the fair value of biological assets and
agricultural produce
|
1,243
|
552
|
625
|
125.2
|
|
Gross profit
|
1,427
|
892
|
725
|
60.0
|
|
General
and administrative expenses
|
(251
)
|
(296
)
|
(258
)
|
(15.2
)
|
|
Selling
expenses
|
(113
)
|
(71
)
|
(91
)
|
59.2
|
|
Other
operating results, net
|
6
|
(6
)
|
-
|
-
|
|
Profit from operations
|
1,069
|
519
|
376
|
106.0
|
|
Activity profit
|
1,069
|
519
|
376
|
106.0
|
Cattle
Our
cattle production involves the breeding and fattening of our own
animals. In some cases, if market conditions are favorable, we also
purchase and fatten cattle which we sell to slaughterhouses and
supermarkets. As of June 2020, our cattle aggregated 84,173 heads,
and we had a total surface area of 87,788 hectares of own and
leased lands devoted to this business activity. In addition, we
have leased to third parties 9,818 hectares assigned to these
activities.
During
the fiscal year ended June 30, 2020, our production was 11,783
tons, a 5.5% year-on-year increase. The following table sets forth,
for the fiscal years indicated below, the cattle production volumes
measured in tons:
|
|
2020
|
2019
|
2018
|
2017
|
2016
|
|
Cattle
production
(1)
|
11,783
|
11,173
|
10,751
|
8,061
|
8,205
|
(1)
Production measured in tons of live weight. Production is the sum
of the net increases (or decreases) during a given period in live
weight of each head of cattle owned by us.
Our cattle breeding activities are carried out with breeding cows
and bulls and our fattening activities apply to steer, heifers and
calves. Breeding cows calve approximately once a year and their
productive lifespan is from six to seven years. Six months after
birth, calves are weaned and transferred to fattening pastures.
Acquired cattle are directly submitted to the fattening process.
Upon starting this process, cattle have been grazing for
approximately one year to one and a half year in order to be
fattened for sale. Steer and heifers are sold when they have
achieved a weight of 380–430 kg and 280–295 kg,
respectively, depending on the breed.
Pregnancy
levels, which have been improving over the years, showed
satisfactory levels of efficiency notwithstanding the adverse
weather conditions. Genetics and herd management are expected to
further improve pregnancy levels in the coming years. Reproductive
indicators improved thanks to the implementation of technologies,
which have included handling techniques and females’
artificial insemination with cattle genetics especially selected
for the stock which is purchased from specialized companies in
quality semen elaboration for meat production. We use veterinarian
products manufactured by leading national and international
laboratories. It is important to emphasize the work of a
veterinarian advising committee, who is external to us and visits
each establishment monthly to control and agree tasks.
Currently,
the cattle raising farms are officially registered as export
farmlands pursuant to the identification and traceability rules in
force in Argentina. Animals are individually identified, thus
allowing for the development of special businesses in this
area.
107
Our cattle stock is
organized into breeding and fattening activities. The following
table shows, for the fiscal years indicated, the number of heads of
cattle for each activity:
|
|
2020
|
2019
|
2018
|
|
Breeding
stock
|
63,073
|
85,118
|
83,151
|
|
Winter
grazing stock
|
10,539
|
13,993
|
10,440
|
|
Total Stock (heads)
|
73,612
|
99,111
|
93,591
|
We seek
to improve cattle production and quality in order to obtain a
higher price through advanced breeding techniques. We cross breed
our stock of Indicus, British (Angus and Hereford) and Continental
breeds to obtain herds with characteristics better suited to the
pastures in which they graze. To enhance the quality of our herds
even further, we plan to continue improving our pastures through
permanent investment in seeds and fertilizers, an increase in the
watering troughs available in pastures, and the acquisition of
round bailers to cut and roll grass for storage
purposes.
Our
emphasis on improving the quality of our herd also includes the use
of animal health-related technologies. We comply with national
animal health standards that include laboratory analyses and
vaccination aimed at controlling and preventing disease in our
herd, particularly FMD.
Direct
costs of beef production consist primarily of crops for feeding and
dietary supplementation purposes, animal health and payroll costs,
among others.
Results
The
following table shows this activity’s results for fiscal year
2020, compared to the preceding fiscal years:
|
|
FY 2020
|
FY 2019
|
FY 2018
|
YoY var
2020 vs. 2019
|
|
|
|
|
|
|
|
|
(In
millions of ARS)
|
%
|
||
|
Revenues
|
1,866
|
819
|
858
|
127.8
|
|
Costs
|
(1,622
)
|
(725
)
|
(749
)
|
123.7
|
|
Initial
recognition and changes in the fair value of biological assets and
agricultural produce
|
194
|
(23
)
|
(287
)
|
-
|
|
Gross profit / (loss)
|
438
|
71
|
(178
)
|
516.9
|
|
General
and administrative expenses
|
(92
)
|
(104
)
|
(122
)
|
(11.5
)
|
|
Selling
expenses
|
(115
)
|
(67
)
|
(96
)
|
71.6
|
|
Other
operating results, net
|
2
|
(1
)
|
(20
)
|
-
|
|
Profit/(loss) from operations
|
233
|
(101
)
|
(416
)
|
-
|
|
Activity profit/(loss)
|
233
|
(101
)
|
(416
)
|
-
|
Leases and Agricultural Services
We
lease own farms to third parties for agriculture, cattle breeding
and seed production, mainly in two types of farms. On the one hand,
we lease our farms under irrigation in the Province of San Luis
(Santa Bárbara and La Gramilla) to seed producers or enter
into production agreements whereby we render production services to
seed companies. These farms are ideal for obtaining steady
production levels, given the quality of their soil and the weather
conditions of the area, along with the even humidity provided by
irrigation.
On the
other hand, when market conditions are favorable, we lease farms
recently put into production after agricultural development. In
this way, we manage to reduce our production risk, ensuring fixed
rental income until the new farms reach stable productivity
levels.
In
addition, in this segment we include the irrigation service we
provide to our own farms leased to third parties.
108
Results
The
following table shows this activity’s results for fiscal year
2020, compared to the preceding fiscal years:
|
|
FY 2020
|
FY 2019
|
FY 2018
|
YoY var
2020 vs. 2019
|
|
|
(in
millions of ARS )
|
%
|
||
|
Revenues
|
679
|
653
|
411
|
4.0
|
|
Costs
|
(273
)
|
(270
)
|
(111
)
|
1.1
|
|
Gross profit
|
406
|
383
|
300
|
6.0
|
|
General
and administrative expenses
|
(63
)
|
(84
)
|
(38
)
|
(25.0
)
|
|
Selling
expenses
|
(34
)
|
(29
)
|
(29
)
|
17.2
|
|
Other
operating results, net
|
1
|
(3
)
|
-
|
-
|
|
Profit
from operations
|
310
|
267
|
233
|
16.1
|
|
Activity profit
|
310
|
267
|
233
|
16.1
|
Other segments
This
segment includes, principally, feedlot farming, slaughtering and
processing in the meat refrigeration plant; among others. The
segment “Other segments” aggregate the activities
Agro-industrial and Others:
Agro-industrial Activities
This
activity consists in the slaughtering and processing of beef in
meat packing plants.
Through
our subsidiary Sociedad Anónima Carnes Pampeanas S.A.
(“Carnes Pampeanas”) we own a meat packing plant in
Santa Rosa, Province of La Pampa, with capacity to slaughter and
process approximately 12,500 cattle heads per month.
During
the last years, the smaller supply of cattle has adversely affected
the value chain by reducing cold-storage plant utilization. This
has left several plants struggling to remain operational in view of
the poor returns and shortage of raw materials. Our investment in
Carnes Pampeanas has not escaped unscathed of this
situation.
Results
The
following table shows this activity’s results for fiscal year
2020, compared to preceding fiscal year:
|
|
FY 2020
|
FY 2019
|
FY 2018
|
YoY var
2020 vs. 2019
|
|
|
(in
millions of ARS)
|
%
|
||
|
Revenues
|
6,228
|
5,764
|
4,821
|
8.0
|
|
Costs
|
(5,627
)
|
(5,354
)
|
(4,683
)
|
5.1
|
|
Initial
recognition and changes in the fair value of biological assets and
agricultural produce
|
10
|
6
|
(9
)
|
66.7
|
|
Gross profit
|
611
|
416
|
129
|
46.9
|
|
General
and administrative expenses
|
(168
)
|
(174
)
|
(149
)
|
(3.4
)
|
|
Selling
expenses
|
(575
)
|
(466
)
|
(182
)
|
23.4
|
|
Other
operating results, net
|
79
|
31
|
60
|
154.8
|
|
Loss from operations
|
(53
)
|
(193
)
|
(242
)
|
(72.5
)
|
|
Activity loss
|
(53
)
|
(193
)
|
(242
)
|
(72.5
)
|
109
Others
This activity includes part of our investment in Futuros y Opciones
(FyO), as crop trading is reflected in the Crops
activity.
Results
The
following table shows this activity’s results for fiscal year
2020, compared to preceding fiscal year:
|
|
FY 2020
|
FY 2019
|
FY 2018
|
YoY var
2020 vs. 2019
|
|
|
(in
millions of ARS )
|
%
|
||
|
Revenues
|
2,845
|
2,197
|
1,476
|
29.5
|
|
Costs
|
(1,955
)
|
(1,321
)
|
(989
)
|
48.0
|
|
Gross profit
|
890
|
876
|
487
|
1.6
|
|
General
and administrative expenses
|
(118
)
|
(115
)
|
(127
)
|
2.6
|
|
Selling
expenses
|
(219
)
|
(224
)
|
(149
)
|
(2.2
)
|
|
Other
operating results, net
|
167
|
116
|
44
|
44.0
|
|
Profit from operations
|
720
|
653
|
255
|
10.3
|
|
Share
of profit (loss) of associates and joint ventures
|
72
|
(46
)
|
(2
)
|
(39.0
)
|
|
Activity profit
|
792
|
607
|
253
|
30.5
|
Corporate
This
segment includes, principally, the corporative expenses related to
the agricultural business.
Results
The
following table shows the “Corporate” segment’s
results for fiscal year 2019, compared to preceding fiscal
years:
|
|
FY2019
|
FY2018
|
FY2017
|
YoY var 2019 vs. 2018
|
|
|
(in
millions of ARS )
|
%
|
||
|
Revenues
|
-
|
-
|
-
|
-
|
|
Costs
|
-
|
-
|
-
|
-
|
|
Gross profit
|
-
|
-
|
-
|
-
|
|
General
and administrative expenses
|
(177
)
|
(274
)
|
(225
)
|
(35.4
)
|
|
Loss from operations
|
(177
)
|
(274
)
|
(225
)
|
(35.4
)
|
|
Segment loss
|
(177
)
|
(274
)
|
(225
)
|
(35.4
)
|
Futuros y Opciones.Com S.A. (FyO)
Futuros
y Opciones.com’s main business is crop trading (crop
brokerage, futures and options, consulting and logistic and
financial services) and sale and distribution of own inputs and
third-party products.
As
concerns the Crops business, revenues grew thanks to the increase
in invoiced volumes and prices compared to the previous fiscal
year. As well as the inputs business grew by 50% compared to the
previous year, due to the consolidation of the nutritional
specialties business.
During
fiscal year 2020, increased efforts were made in the
company’s cash flow analysis, generating financial income
from the investments made. The financial services provided to our
clients were also increased, allowing them access to capital market
tools. Net financial income also increased favorably compared to
the previous year due to the effect of the
devaluation.
110
Concerning
the goals for next year, the Crops business is expected to keep
growing at the same pace as in the past years, aspiring to lead the
crop trading business and differentiating ourselves in the services
offered to clients. As concerns inputs, FyO’s goals include
consolidating its suite of products, increasing sales, improving
margins and focusing business on the sale of nutritional
specialties for the soil. Other objectives include becoming a
leading company in the knowledge of the crop’s markets, being
digital innovators and expanding the company’s reach into the
region.
AGROFY S.A.U.
Agrofy
S.A.U. continued to position itself in 2020 as the leading online
platform for agriculture in Argentina, Brazil, and Uruguay,
doubling the flow of annual visits and contacts per month when
compared to the previous year. During this fiscal year, Agrofy
raised USD 23 million of new equity capital, incorporating two new
strategic investors while Cresud reduced its shareholding to 22.2%
and BrasilAgro was incorporated as a shareholder with 1.9% of the
capital stock. During the next fiscal year we will seek to continue
and consolidate Agrody’s regional expansion
strategy.
111
Farmland Portfolio
As of June 30, 2020, we owned, together with our subsidiaries, 26
farms, with a total surface area of 629,794
hectares.
The
following table sets forth our farm portfolio as of June 30,
2020:
|
Use of farms owned and under concession as of June 30,
2020
|
|||||||||
|
|
Locality
|
Province
|
Date of
|
Surface
|
Main Business
|
Cattle
|
Sheep
|
Agriculture
|
Cattle
(2)
|
|
|
|
|
Acquisition
|
Area (has)
|
(has)
|
(has)
|
(has)
|
(Head)
|
|
|
El
Recreo
|
Recreo
|
Catamarca
|
May
‘95
|
12,395
|
Natural
woodlands
|
|
|
|
|
|
Los
Pozos
|
JV
González
|
Salta
|
May
‘95
|
239,639
|
Cattle/
Agriculture/ Natural woodlands
|
40,579
|
|
18,384
|
39,652
|
|
San Nicolás
(1)
|
Rosario
|
Santa
Fe
|
May
‘97
|
1,431
|
Agriculture
|
|
|
1,409
|
|
|
Las Playas
(1)
|
Idiazabal
|
Cordoba
|
May
‘97
|
1,534
|
Agriculture
|
|
|
1,534
|
|
|
La
Gramilla/ Santa Bárbara
|
Merlo
|
San
Luis
|
Nov
‘97
|
7,072
|
Agriculture
Under irrigation
|
|
|
5,000
|
|
|
La
Suiza
|
Villa
Angela
|
Chaco
|
Jun
‘98
|
26,371
|
Agriculture/
Cattle
|
17,419
|
|
3,215
|
12,732
|
|
El
Tigre
|
Trenel
|
La
Pampa
|
Apr
‘03
|
8,360
|
Agriculture
|
240
|
|
6,535
|
2,316
|
|
San
Pedro
|
Concepción
de Uruguay
|
Entre
Rios
|
Sep
‘05
|
6,022
|
Agriculture
|
|
|
3,965
|
|
|
8
De Julio/ Estancia Carmen
|
Puerto
Deseado
|
Santa
Cruz
|
May
‘07/ Sep ‘08
|
100,911
|
Sheep
|
|
85,000
|
|
|
|
Cactus
Argentina
|
Villa
Mercedes
|
San
Luis
|
Dec
‘97
|
171
|
Natural
woodlands
|
101
|
|
|
|
|
Las
Londras
|
Santa
Cruz
|
Bolivia
|
Nov
‘08
|
4,566
|
Agriculture
|
|
|
4,367
|
|
|
San
Rafael
|
Santa
Cruz
|
Bolivia
|
Nov
‘08
|
2,969
|
Agriculture
|
|
|
2,824
|
|
|
La
Primavera
|
Santa
Cruz
|
Bolivia
|
Jun
‘11
|
2,340
|
Agriculture
|
|
|
1,666
|
|
|
Marangatu/Udra
|
Mariscal
Estigarribia
|
Paraguay
|
Feb
‘09
|
59,585
|
Agriculture/
Natural woodlands
|
3,064
|
|
10,174
|
4,284
|
|
Finca
Mendoza
|
Lujan
de Cuyo
|
Mendoza
|
Mar
‘11
|
674
|
Natural
woodlands
|
|
|
|
|
|
Establecimiento
Mendoza
|
Finca
Lavalle
|
Mendoza
|
Nov’03
|
9
|
Natural
woodlands
|
|
|
|
|
|
|
|
|
|
|
|
|
|||
|
Jatoba
|
Jaborandi/BA
|
Brazil
|
|
14,930
|
Agriculture
|
2,813
|
|
0
|
1,664
|
|
Alto
Taquari
|
Alto
Taquari/MT
|
Brazil
|
|
5,103
|
Agriculture
|
|
|
3,206
|
|
|
Araucaria
|
Mineiros/GO
|
Brazil
|
|
5,534
|
Agriculture
|
|
|
3,831
|
|
|
Chaparral
|
Correntina/BA
|
Brazil
|
|
37,182
|
Agriculture
|
0
|
|
14,350
|
|
|
Nova
Buriti
|
Januária/MG
|
Brazil
|
|
24,212
|
Forestry
|
|
|
|
|
|
Preferência
|
Barreiras/BA
|
Brazil
|
|
17,799
|
Agriculture
/ Natural woodlands
|
6,344
|
|
134
|
9,116
|
|
São
José
|
São
Raimundo das Mangabeiras/MA
|
Brazil
|
|
17,566
|
Agriculture
|
|
|
9,101
|
|
|
Arrojadinho
|
Jaborandi/BA
|
Brazil
|
|
16,642
|
Agriculture
|
|
|
2,900
|
|
|
Rio
do Meio
|
Correntina/BA
|
Brazil
|
|
12,288
|
Agriculture
|
|
|
|
|
|
Serra
Grande
|
Baixa
Grande do Ribeiro/PI
|
Brazil
|
|
4,489
|
Agriculture
|
|
|
|
|
|
Subtotal Owned
|
|
|
|
629,794
|
|
70,560
|
85,000
|
92,595
|
69,764
|
|
Agropecuaria
Anta SA
|
Las
Lajitas
|
Salta
|
|
132,000
|
|
2,993
|
|
26,409
|
1,967
|
|
Subtotal Under Concession
|
|
|
|
132,000
|
|
2,993
|
|
26,409
|
1,967
|
|
Total
|
|
|
|
761,794
|
|
73,553
|
85,000
|
119,004
|
71,731
|
(1)
Hectares in
proportion to our 35.72% interest in Agro-Uranga S.A.
(2)
Does not include
sheep or cattle in sold or rented fields.
Additional information about our Farmlands
Argentina
El Recreo
“El
Recreo” farm, located 970 kilometers northwest of Buenos
Aires, in the Province of Catamarca, was acquired in May 1995. It
has semi-arid climate and annual rainfall not in excess of 400 mm.
This farm is maintained as a productive reserve.
112
Los Pozos
“Los
Pozos” farm located 1,600 kilometers northwest of Buenos
Aires, in the Province of Salta, was acquired in May 1995. This
property is located in a semi-arid area with average annual
rainfall of 500 mm. The area is naturally suited to cattle raising
and forestry activities (poles and fence posts), and it has
agricultural potential for summer crops such as soybean, sorghum
and corn, among others. For the fiscal year ended June 30, 2020, we
used 18,384 hectares in agricultural production. As of June 30,
2020, there were 39,652 heads of cattle in this farm.
San Nicolás
“San
Nicolás” is a 4,005 hectares farm owned by Agro-Uranga
S.A., and is located in the Province of Santa Fe, approximately 45
kilometers from the Port of Rosario. As of June 30, 2019, 5,831
hectares were planted for agricultural production, including double
crops. The farm has two plants of silos with a storage capacity of
14,950 tons.
Las Playas
“Las
Playas” farm has a surface area of 4,294 hectares and is
owned by Agro-Uranga S.A. It is located in the Province of
Córdoba, and it is used for agricultural purposes. As of June
30, 2020, the farm had a sown surface area, including double crops,
of 6,673 hectares for crop production.
La Gramilla and Santa Bárbara
These
farms have a surface area of 7,072 hectares in Valle de Conlara, in
the Province of San Luis. Unlike other areas in the Province of San
Luis, this valley has a high-quality underground aquifer which
makes these farms well suited for agricultural production after
investments were made in the development of lands, wells and
irrigation equipment. In the course of the 2019/2020 crop season, a
total of 5,983 hectares were sown. We leased, in turn, 8 hectares
to third parties. The remaining hectares are kept as land
reserves.
La Suiza
“La
Suiza” farm has, at the end of the fiscal year, a surface
area of 26,380 hectares and is located in Villa Ángela in the
Province of Chaco. It is used for raising cattle. As of June 30,
2020, “La Suiza” had a stock of approximately 12,732
heads of cattle. During the 2019/20 season, we used 3,215 hectares
for agricultural production.
On June
29, 2018, Cresud signed the title deed with an unrelated third
party of a fraction of 10,000 hectares of livestock activity of the
establishment “La Suiza”. The total amount of the
operation was set at USD 10 million, of which USD 3 million has
been charged to date. The remaining balance of USD 7 million,
guaranteed with a mortgage on the property, will be charged in 10
installments of the same amount ending in June 2023 and will accrue
interest of 4.5% per annum on the balances. The accounting profit
of the operation amounts to the approximate sum of ARS 238
million.
El Tigre
“El
Tigre” farm was acquired on April 30, 2003 and has a surface
area of 8,360 hectares. It is located in Trenel in the Province of
La Pampa. As of June 30, 2020, 7,844 hectares were assigned to crop
production, including double crops.
San Pedro
“San
Pedro” farm was purchased on September 1, 2005. It has a
surface area of 6,022 hectares and is located in Concepción
del Uruguay, Province of Entre Ríos, which is 305 kilometers
north of Buenos Aires. In the course of the 2019/2020 crop season,
4,985 hectares were used for agricultural production, including
double crops.
113
8 de Julio and Estancia Carmen
“8
de Julio” farm was acquired on May 15, 2007 and has a surface
area of 90,000 hectares. It is in the Department of Deseado in the
Province of Santa Cruz. Due to its large surface area, this farm
offers excellent potential for sheep production. In addition, we
believe the land has potential for future tourism and recreational
activities, as the southeast border of the farm stretches over 20
kilometers of coast. “Estancia Carmen” was acquired on
September 5, 2008 and has a surface area of 10,911 hectares. It is
in the Province of Santa Cruz, next to our “8 de Julio”
farm.
Cactus
The
feedlot has a surface area of 171 hectares. It is located in Villa
Mercedes, Province of San Luis. Given its degree of urban
development and closeness to the city, we decided to discontinue
fattening activities in this facility.
Finca Mendoza
On
March 2, 2011, the Company purchased, jointly with Zander Express
S.A., a rural property composed of thirteen plots of land located
in the District of Perdriel, Luján de Cuyo Department, in the
Province of Mendoza. As a result of this acquisition, Cresud has
become owner of a 40% undivided estate in all and each of the
properties, while Zander Express S.A. holds the remaining 60%. The
total agreed price for this transaction was USD 4.0 million;
therefore, the amount of USD 1.6 million was payable by
Cresud.
On June
8, 2017, a title deed for the sale of 262 ha was signed. The total
price was USD 2.2 million. The Company has recognized a gain of ARS
11.8 million as a result of this transaction.
On
April 17, 2019, we have purchased to Zander Express S.A. the 60% of
the property, and the total price was USD 1.25 million. As a result
of this acquisition, we have become owner of a 100% of the
property.
Establecimiento Mendoza
The
establishment is located north of the city of Mendoza, in the
department of Lavalle. It is composed of 9 Ha, which are currently
not in use and are considered land reserves.
Bolivia
Las Londras
On
January 22, 2009, the bill of purchase for “Las
Londras” farm was cast into public deed; it has a surface
area of 4,566 hectares, and is located in the Province of Guarayos,
Republic of Bolivia. During the 2019/2020 crop season, it was used
for crop production and sugarcane.
San Rafael
On
November 19, 2008, the bill of purchase for “San
Rafael” farm was cast into public deed. This farm is located
in the Province of Guarayos, Republic of Bolivia, and has a surface
area of 2,969 hectares, which were used for crop production during
the 2019/2020 crop season.
La Primavera
On June
7, 2011, we acquired “La Primavera” farm, with a
surface area of approximately 2,340 hectares. During the 2019/2020
season, this farm was used for crop production and
sugarcane.
Brazil (through our subsidiary Brasilagro)
Jatobá
Jatobá
is a farm in the northeastern region of Brazil, with a total
surface area of 14,930 hectares. Jatobá was acquired in March
2007 for BRL 33 million. We consider that this farm is in a very
advantageous location for the movement of crops, as it is close to
the Candeias Port, in the State of Bahia. During the 2019/2020
season, 2,813 hectares were used for cattle
production.
114
On June
13, 2018, the Company, through its subsidiary Brasilagro, signed a
purchase contract for a total area of 9,784 hectares (7,485 are
agricultural hectares) of the Establishment.
On July
31, 2018, the buyer made the payment of the first installment for
BRL 225 million in accordance with the conditions set forth in the
contract, obtaining the transfer of possession and enabling the
recognition of the income by the Company. The remaining balance
will be paid in six annual installments.
In June
2019, the Company entered into a commitment to sell 3,124 hectares
of the Jatobá field. The sale price is BRL 543 million. The
buyer made an initial payment of BRL 58 million and made on July
31, 2019 the cancellation of the first installment equivalent to
BRL 58 million; and the balance equivalent to 563,844 soybeans
bags, will be paid in six annual installments. The delivery of the
possession and the result of the operation will be recognized on
June 30, 2019, which represents a gain of BRL 422
million.
On July
15, 2020 BrasilAgro entered into an agreement fore the sale of
1,875 hectacres (1,500 are production acres) of the Jatobá
Establishment, a rural property located in the Municipality of
Jaborandi, for a purchase price of 300 bags of soybeans, equivalent
to BRL 45 million. At the time of slae, the buyer made an initial
payment, equivalent to BRL 5 million. In August 2020, the buyer
made a second payment, equivalent to an additional BRL 3.5 million.
The remaining balance of the purchase price will be paid by the
purchaser in six annual installments. The book value of the
Jatobá field parcel that was sold is BRL 3.7 million
(acquisition cost plus investments made).
Araucária
Araucária
is a farm located in the municipal district of Mineiros, in the
State of Goiás, and it has a total surface area of 5,534
hectares, 3,831 of which are used for agriculture. Araucaria was
acquired in 2007 for BRL 70.4 million. Before we purchased it,
Araucária had been used for crop planting. The farm was
transformed, and at present it is planted with
sugarcane.
In May
2013, an area of 394 hectares (310 of which are used for
agriculture) was sold. The sale price was BRL 10.3 million. In May
2014, the sale of 1,164 hectares was agreed for a total amount of
BRL 41.3 million.
In
March 2017, an area of 274 hectares was sold, of which 196 are
developed and productive hectares. The price of the sale is 1,000
bags of soybeans per hectare. The Company has recognized a gain of
ARS 29.9 million as a result of this transaction.
In May
2017, an area of 1,360 hectares was sold, of which 918 are
developed and productive hectares. The sale price is 280 bags of
soybeans per hectare. The Company has recognized a gain of ARS 37.4
million as a result of this transaction.On May 3, 2018, has been
subscribed a purchase-sale ticket for the sale of a fraction of 956
hectares (660 productive) at a price of 1,208 bags of soybeans per
hectare or BRL 61.6 million (BRL / ha 93,356).
Alto Taquarí
Alto
Taquarí is located in the municipal district of Alto
Taquarí, State of Mato Grosso, and it has a total surface area
of 5,103 hectares, 3,206 of which are used for agriculture. The
farm was acquired in August 2007 for BRL 33.2 million. Before we
purchased it, the farm had been used for agriculture and cattle
raising. Following its transformation, it is being used for
sugarcane production.
On
November 21, 2018, the Company, through its subsidiary Brasilagro,
entered into a commitment to sell 103 hectares of the Alto Taquari
field. The sale price is 1,100 bags of soybeans bags per hectare
equivalent to BRL 63.4 million. The buyer made the initial payment
of 22,656 soybean bags equivalent to BRL 17 million; and the
balance will be paid in eight semiannual installments. The result
of the operation recognized in this period was BRL 64
million.
On
October 29, 2019, the Company, through its subsidiary BrasilAgro,
entered into a commitment to sell 85 hectares (65 productive
hectares) of the Alto Taquari Establishment, a rural property
located in the municipality of Alto Taquari, for a purchase price
of equivalent to BRL 5.5 million. On the closing date, the buyer
made an initial payment of 14,300 bags of soybeans, equivalent to
BRL 1 million. The remaining balance will be paid in four annual
installments. The result of the operation recognized in this period
was BRL 4 million.
115
On May
29, 2020, the Company, through its subsidiary BrasilAgro, entered
into a commitment to sell 105 productive hectares of the Alto
Taquarí field. The purchase price was 115,478 bags of
soybeans, equivalent to BRL 11 million. On the closing date, the
buyer made an initial payment of equivalent to BRL 1.8 million. The
remaining balance will be paid in five annual installments. The
result of the operation recognized in this period was BRL 8
million.
Chaparral
Chaparral
is a 37,182-hectare farm, with 18,948 hectares used for
agriculture. It is located in the municipal district of Correntina,
State of Bahia. The farm was acquired in November 2007 for BRL 47.9
million.
Nova Buriti
Located
in the municipal district of Januária, State of Minas Gerais,
Nova Buriti has a surface area of 24,212 hectares. Nova Buriti was
acquired in December 2007 for BRL 21.6 million. It is located in
the southeastern region of Brazil and it is close to the large iron
industries. At present, it is undergoing proceedings for obtaining
the environmental licenses required for starting
operations.
Preferencia
Preferência
is located in the municipal district of Barreiras, in the State of
Bahia. It has a total surface area of 17,799 hectares, 6,344 of
which are used for agricultural activities. It was acquired for BRL
9.6 million in September 2008. The farm is being transformed into a
pasturing area and will be later developed for agricultural
purposes.
Sao José
Located
in São Raimundo das Mangabeiras, in the state of
Maranhão. With a total area of 17,566 hectares, of which
10,137 are destined to agricultural activity. It was acquired for a
value of BRL 100 million in February 2017.
Arrojadinho
Located
in Jaborandi, in the state of Bahia. With a total area of 16,642
hectares, of which 8,043 were rented for livestock activities. It
was acquired in January 2020.
Rio do Meio
Located
in Correntina, in the state of Bahia. With a total area of 12,288
hectares, of which 2,900 are used for agricultural activities. It
was acquired in January 2020.
Serra Grande
Located
in Baixa Grande do Ribeiro, in the state of Piauí. With a
total area of 4,489 hectares, of which 2,904 are agricultural
hectares. It was acquired in May 2020.
Paraguay (through our subsidiary Brasilagro)
Marangatú / Udra
We own,
through BrasilAgro, the “Marangatú/UDRA” farms,
located in Mariscal José Félix Estigarribia, Department
of Boquerón, Paraguayan Chaco, Republic of Paraguay, totaling
59,585 hectares, out of which 10,174 hectares have been allocated
to agricultural production, 3,064 hectares to cattle production and
1,612 hectares were leased to thir parties.
Land Management
In
contrast to traditional Argentine farms, run by families, we
centralize policy making in an Executive Committee that meets on a
weekly basis in Buenos Aires. Individual farm management is
delegated to farm managers who are responsible for farm operations.
The Executive Committee lays down commercial and production rules
based on sales, market expectations and risk
allocation.
We
rotate the use of our pasture lands between agricultural production
and cattle feeding and the frequency depends on the location and
characteristics of the farmland. The use of preservation techniques
(including exploitation by no till sowing) frequently allows us to
improve farm performance.
Subsequent to the acquisition of the properties, we make
investments in technology in order to improve productivity and
increase the value of the property. It may be the case that upon
acquisition, a given extension of the property is under-utilized or
the infrastructure may be in need of improvement. We have invested
in traditional fencing and in electrical fencing, watering troughs
for cattle herds, irrigation equipment and machinery, among other
things.
116
Principal Markets
Crops
Our
crop production is mostly sold in the domestic market. The prices
of our crops are based on the market prices quoted in Argentine
grains exchanges such as the Buenos Aires Grains Exchange (Bolsa de
Cereales de Buenos Aires) and the cereal exchanges in each country,
which take as reference the prices in international grains markets.
The largest part of this production is sold to exporters who offer
and ship this production to the international market. Prices are
quoted in relation to the month of delivery and the port in which
the product is to be delivered. Different conditions in price, such
as terms of storage and shipment, are negotiated between the end
buyer and ourselves.
Cattle
Our
cattle production is sold in the local market. The main buyers are
slaughterhouses and supermarkets.
Prices
in the cattle market in Argentina are basically fixed by local
supply and demand. The Liniers Market (on the outskirts of the
Province of Buenos Aires) provides a standard in price formation
for the rest of the domestic market. In this market live animals
are sold by auction on a daily basis. At Liniers Market, prices are
negotiated by kilogram of live weight and are mainly determined by
local supply and demand. Prices tend to be lower than in
industrialized countries. Some supermarkets and meat packers
establish their prices by kilogram of processed meat; in these
cases, the final price is influenced by processing
yields.
Customers
For the
fiscal year 2020, our sales from the agribusiness segment
(excluding sales of farms) were made to approximately 300
customers. Sales to our ten largest customers represented
approximately 45% to 50% of our net sales. Some of these customers
included Cargill, FASA, Bunge Alimentos S.A. and GLENCORE. We have
signed non-binding letters of intent with some of our largest
customers that allow us to estimate the volume of the demand for
certain products and to plan production accordingly. We generally
enter into short-term agreements with a term of less than a
year.
Marketing Channels and Sales Methods
Crops
We
normally work with grains brokers and other intermediaries to trade
in the exchanges. We sell part of our production in advance through
futures contracts and buy and sell options to hedge against a drop
in prices. Approximately 87% of the futures and options contracts
are closed through the Buenos Aires Grains Exchange and 13% in the
Chicago Board of Trade for hedging purposes.
Our
storage capabilities allow us to condition and store crops with no
third-party involvement and thus to capitalize the fluctuations in
the price of commodities. In addition, we store crops in silo bags.
On the other hand, in Brazil we have a total storage capacity of
10,279 tons.
Cattle
We have
several marketing channels. We sell directly to local meat
processors and supermarkets, as well as in markets and auctions.
Our customers include Carnes Pampeanas, Frigorífico Bermejo,
Arre Beef S.A., Sáenz Valiente Bullrich, and Colombo y
Magliano S.A. Prices are based on the price at Liniers
Market.
We are
usually responsible for the costs of the freight to the market and,
in general, we pay commissions on our transactions.
117
Inputs
The
current direct cost of our production of crops varies in relation
to each crop and normally includes the following costs: tillage,
seeds, agrochemicals and fertilizers. We buy in bulk and store
seeds, agrochemicals and fertilizers to benefit from discounts
offered during off-season sales.
Competition
The
agricultural and livestock sector is highly competitive, with a
huge number of producers. We are one of the leading producers in
Argentina and the region. However, if we compare the percentage of
our production to the country’s total figures, our production
would appear as extremely low, since the agricultural market is
highly atomized. Our leading position improves our bargaining power
with suppliers and customers. In general, we obtain discounts in
the region in the acquisition of raw materials and an excess price
in our sales.
Historically,
there have been few companies competing for the acquisition and
leases of farmlands for the purpose of benefiting from land
appreciation and optimization of yields in the different commercial
activities. However, we anticipate the possibility that new
companies, some of them international, may become active players in
the acquisition of farmlands and the leases of sown land, which
would add players to the market in coming years.
Seasonality
As is
the case with any company in the agro-industrial sector, our
business activities are inherently seasonal. Harvest and sales of
crops (corn, soybean and sunflower) in general take place from
February to June. Wheat is harvested from December to January. With
respect to our international market, in Bolivia climate conditions
allow a double season of soybean, corn and sorghum production and,
accordingly, these crops are harvested in April and October, while
wheat and sunflower are harvested during August and September,
respectively. Other segments of our activities, such as our sales
of cattle and our forestry activities tend to be more of a
successive character than of a seasonal character. However, the
production of beef is generally higher during the second quarter,
when pasture conditions are more favorable. In consequence, there
may be significant variations in results from one quarter to the
other.
Regulation and Governmental Supervision of our Agricultural
Business
Argentina
Farming and Animal Husbandry Agreements
According
to Law No. 13,246, as amended by Law No. 22,298, all lease
agreements related to rural properties and land are required to
have a minimum duration of 3 years, except in the case of those
designated as “accidental agreements” pursuant to
Section 39, subsection a), Law No. 13,246. Upon death of the tenant
farmer, the agreement may continue with his successors. Upon misuse
of the land by the tenant farmer or default in payment of the rent,
the land owner may initiate an eviction proceeding.
Law No.
13,246, amended by Law No. 22,298, also regulates sharecropping
agreements pursuant to which one of the parties furnishes the other
with animals or land for the purpose of sharing benefits between
the parties. These agreements are required to have a minimum term
of duration of 3 years, although the rule of Section 39 of Law No.
13,246 on accidental agreements for smaller terms also applies in
this case. The agreement is not assignable under any circumstance
whatsoever, unless expressly agreed by the parties. Upon death,
disability of the tenant farmer or other impossibility, the
agreement may be terminated.
Quality control of Crops and Cattle
The
quality of the crops and the health measures applied on the cattle
are regulated and controlled by the Servicio Nacional de Sanidad y
Calidad Agroalimentaria (“SENASA”), which is an entity
within the Agro-industry Ministry that oversees farming and animal
sanitary activities.
Argentine
law establishes that the brands should be registered with each
provincial registry and that there cannot be brands alike within
the same province.
Sale and Transportation of Cattle
Even
though the sale of cattle is not specifically regulated, general
contract provisions are applicable. Further, every province has its
own rural code regulating the sale of cattle.
Argentine law establishes that the transportation of cattle is
lawful only when it is done with the respective certificate that
specifies the relevant information about the cattle. The required
information for the certificate is established by the different
provincial regulations, the inter-provinces treaties and the
regulations issued by the SENASA.
118
Export Restriction of Beef
In
addition, the Secretary of Agriculture, Livestock, Fishing and Food
Products, within the orbit of the Ministry of Economy and Public
Finance, oversees the farming and animal sanitary
activities.
The
Secretary of Agriculture, Livestock, Fishing and Food Products is
in charge of distributing the annual regular quota of top quality
chilled beef without bones, the “Cuota Hilton.” The
destination of the Cuota Hilton is the European Union.
The
Secretary of Agriculture, Livestock, Fishing and Food Products
granted to our subsidiary Sociedad Anónima Carnes Pampeanas up
to 1,420 tons to export beef under the Cuota Hilton for the July
2019-June 2020 period.
Environment
The
development of our agribusiness activities depends on a number of
federal, provincial and municipal laws and regulations related to
environmental protection.
We may
be subject to criminal and administrative penalties, including
taking action to reverse the adverse impact of our activities on
the environment and to reimburse third parties for damages
resulting from contraventions of environmental laws and
regulations. Under the Argentine Criminal Code, persons (including
directors, officers and managers of corporations) who commit crimes
against public health, such as poisoning or dangerously altering
water, food or medicine used for public consumption and selling
products that are dangerous to health, without the necessary
warnings, may be subject to fines, imprisonment or both. Some
courts have enforced these provisions in the Argentine Criminal
Code to sanction the discharge of substances which are hazardous to
human health. At the administrative level, the penalties vary from
warnings and fines to the full or partial suspension of the
activities, which may include the revocation or annulment of tax
benefits, cancellation or interruption of credit lines granted by
state banks and a prohibition against entering into contracts with
public entities.
The
Forestry Legislation of Argentina prohibits the devastation of
forests and forested lands, as well as the irrational use of forest
products. Landowners, tenants and holders of natural forests
require an authorization from the Forestry Competent Authority for
the cultivation of forest land. The legislation also promotes the
formation and conservation of natural forests in properties used
for agriculture and farming purposes.
In
accordance with legislative requirements, we have applied for
approval to develop certain parts of our land reserves and were
authorized to develop them partially and to maintain other areas as
land reserves. We cannot assure you that current or future
development applications will be approved, and if so, to what
extent we will be allowed to develop our land reserves. We intend
to use genetically modified organisms in our agricultural
activities. In Argentina, the development of genetically modified
organisms is subject to special laws and regulations and special
permits.
On
November 28, 2007, the Argentine Congress passed a law known as the
Forest Law which sets minimum standards for the conservation of
native forests and incorporates minimum provincial expenditures to
promote the protection, restoration, conservation and sustainable
use of native forests. The Forest Law prevents landowners,
including owners of native forests, from deforesting or converting
forested areas into non-forested land for other commercial uses
without prior permission from each local government that gives the
permit and requires the preparation, assessment and approval of an
environmental impact report. The Forest Law also provides that each
province should adopt its own legislation and regional regulation
map within a term of one year. Until such provincial implementation
is carried into effect, no new areas may be deforested. In
addition, the Forest Law also establishes a national policy for
sustainableuse of native forests and includes the recognition of
native communities and aims to provide preferential use rights to
indigenous communities living and farming near the forest. In case
a project affects such communities, the relevant provincial
authority may not issue permits without formal public hearings and
written consent of the communities.
119
Besides,
the Rules issued by the CNV provide that publicly traded companies
whose corporate purpose includes environmentally hazardous
activities should report to their shareholders, investors and the
general public their compliance with the applicable environmental
laws and risks inherent to such activities, so as to be able to
reasonably assess such hazards.
Our
activities are subject to a number of national, provincial and
municipal environmental regulations. Section 41 of the Argentine
Constitution, as amended in 1994, provides that all Argentine
inhabitants have the right to a healthy and balanced environment
fit for human development and have the duty to preserve it.
Environmental damage shall bring about primarily the obligation to
redress it as provided by applicable law. The authorities shall
protect this right, the rational use of natural resources, the
preservation of the natural and cultural heritage andof
biodiversity, and shall also provide for environmental information
and education. The National Government shall establish minimum
standards for environmental protection and Provincial and Municipal
Governments shall determine specific standards and issue the
applicable regulations.
On
November 6, 2009, the Argentine Congress passed Law No. 25,675.
This law regulates the minimum standards for the achievement of a
sustainable environment and the preservation and protection of
biodiversity and sets environmental policy goals. Moreover, Law No.
25,675 establishes the activities that will be subject to an
environmental impact assessment procedure and certain requirements
applicable thereto. In addition, the Law sets forth the duties and
obligations that will be triggered by any damage to the environment
and imposes the obligation to restore it to its former condition
or, if that is not technically feasible, to pay a compensation in
lieu thereof. The Law also fosters environmental education and
provides for certain minimum obligations to be fulfilled by natural
and artificial persons.
Leases
Laws
and regulations governing the acquisition and transfer of real
estate, as well as municipal zoning ordinances, are applicable to
the development and operation of the Company’s
properties.
Currently, Argentine law does not specifically regulate shopping
mall lease agreements. Since our shopping mall leases generally
differ from ordinary commercial leases, we have created provisions
which govern the relationship with our shopping mall
tenants.
Argentine law imposes certain restrictions on property owners,
including:
●
a prohibition to
include price indexation clauses based on inflation increases in
lease agreements; and
●
a two-year minimum
lease term is established for all purposes, except in particular
cases such as embassy, consulate or international organization
venues, room with furniture for touristic purposes for less than
three months, custody and bailment of goods, exhibition or offering
of goods in fairs or in cases where they are entered into for a
specific purpose expressly stated in the agreement that is usually
fulfilled within an agreed shorter term.
Rent Increase
In
addition, there are at present contradictory court rulings with
respect to whether the rent price can or cannot be increased during
the term of the lease agreement. Most of our lease agreements have
incremental rent increase clauses that are not based on any
official index. As of the date of this document, no tenant has
filed any legal action against us challenging incremental rent
increases, but we cannot assure that such actions will not be filed
in the future and, if any such actions were successful, that they
will not have an adverse effect on our company.
Limits on lease terms
Under
the Argentine Civil and Commercial Code lease terms may not exceed
fifty years, irrespective of the intended use of the property (save
in case of residential use, where the maximum term is twenty
years). Generally, terms in its lease agreements go from 3 to 10
years.
Early termination rights
The
Argentine Civil and Commercial Code provides that tenants of
properties may declare the early termination of lease agreements
after the first six months of the effective date. Such termination
is subject to penalties which range from one to one and a half
months of rent. If the tenant terminates the agreement during the
first year of the lease, the penalty is one and a half
month’s rent and, if the termination occurs after the first
year of lease, the penalty is one month’s rent.
It
should be noted that the Argentine Civil and Commercial Code became
effective on August 1, 2015 and that, among other rules, it
repealed the Urban Lease Law (No. 23,091), which provided for a
rule similar to the one described above, but (i) it established the
obligation to give at least 60 days’ prior notice of exercise
of the early termination right by the tenant; and (ii) it set forth
in its Section 29 that its provisions were mandatory. There are no
court rulings yet with respect to the new regulations related to:
(i) unilateral right to termination by tenant; i.e. whether the
parties may waive the tenant’s right to terminate the
agreement unilaterally; or in relation to (ii) the possibility of
establishing a penalty different from the penalty described above
in the event of unilateral termination by the lessee.
Other
Most of
our leases provide that the tenants pay all costs and taxes related
to the property in proportion to their respective leasable areas.
In the event of a significant increase in the amount of such costs
and taxes, the Argentine government may respond to political
pressure to intervene by regulating this practice, thereby
adversely affecting our rental income. The Argentine Civil and
Commercial Procedural Code enables the lessor to pursue collection
of outstanding rental payments through an “executory
proceeding” upon lessee’s payment default. In executory
proceedings debtors have fewer defenses available to prevent
foreclosure, making these proceedings substantially shorter than
ordinary ones. In executory proceedings, the origin of the debt is
not under discussion; the trial focuses on the formalities of debt
instrument itself. The Procedural Code also permits special
eviction proceedings, which are carried out in the same wayas
ordinary proceedings. The Argentine Civil and Commercial Code
requires that a notice be given to the tenant demanding payment of
the amounts due in the event of breach prior to eviction, of no
less than ten days for leases for residential purposes,
andestablishes no limitation or minimum notice for leases for other
purposes. However, historically, large court dockets and numerous
procedural hurdles have resulted in significant delays to eviction
proceedings, which generally last from six months to two years from
the date of filing of the suit to the time of actual
eviction.
Development and Use of the Land
Buenos
Aires Urban Planning Code. Our real estate activities are subject
to several municipal zoning, building, occupation and environmental
regulations. In the City of Buenos Aires, where the vast majority
of the real estate properties are located, the Buenos Aires Urban
Planning Code (Código de Planeamiento Urbano de la Ciudad de
Buenos Aires) generally restricts the density and use of property
and controls physical features of improvements on property, such as
height, design, set-back and overhang, consistent with the
city’s urban landscape policy. The administrative agency in
charge of the Urban Planning Code is the Secretary of Urban
Planning of the City of Buenos Aires.
Buenos
Aires Building Code. The Buenos Aires Building Code (Código de
Edificación de la Ciudad de Buenos Aires) supplements the
Buenos Aires Urban Planning Code and regulates the structural use
and development of property in the City of Buenos Aires. The Buenos
Aires Building Code requires builders and developers to file
applications for building permits, including the submission to the
Secretary of Work and Public Services (Secretaría de Obras y
Servicios Públicos) of architectural plans for review, to
assure compliance therewith.
We
believe that all of our real estate properties are in material
compliance with all relevant laws, ordinances and
regulations.
120
Sales and Ownership
Buildings
Law. Buildings Law No. 19,724 (Ley de Pre horizontalidad) was
repealed by the new Argentine Civil and Commercial Code which
became effective on August 1, 2015. The new regulations provide
that for purposes of execution of agreements with respect to built
units or units to be built under this regime, theowner is required
to purchase insurance in favor of prospective purchasers against
the risk of frustration of the operation pursuant to the agreement
for any reason. A breach of this obligation prevents the owner from
exercising any right against the purchaser – such as
demanding payment of any outstanding installments due –
unless he/she fully complies with his/her obligations, but does not
prevent the purchaser from exercising its rights against
seller.
Protection
for the Disabled Law. The Protection for the Disabled Law No.
22,431, enacted on March 20, 1981, as amended, provides that in
connection with the construction and renovation of buildings,
obstructions to access must be eliminated in order to enable access
by handicapped individuals. In the construction of public
buildings, entrances, transit pathways and adequate facilities for
mobility-impaired individuals must be provided for.
Buildings
constructed before the enforcement of the Protection for the
Disabled Law must be adapted to provide accesses, transit pathways
and adequate facilities for mobility-impaired
individuals.
Those
pre-existing buildings, which due to their architectural design may
not be adapted to the use by mobility-impaired individuals, are
exempted from the fulfillment of these requirements.
The
Protection for the Disabled Law provides that residential buildings
must ensure access by mobility-impaired individuals to elevators
and aisles. Architectural requirements refer to pathways, stairs,
ramps and parking.
Real
Estate Installment Sales Law. The Real Estate Installment Sales Law
No. 14,005, as amended by Law No. 23,266 and Decree No. 2015/85,
imposes a series of requirements on contracts for the sale of
subdivided real estate property regarding, for example, the sale
price which is paid in installments and the deed, which is not
conveyed until final payment of such price. The provisions of this
law require, among other things:
The
registration of the intention to sell the property in subdivided
plots with the Real Estate Registry (Registro de la Propiedad
Inmueble) corresponding to the jurisdiction of the property.
Registration will only be possible with regard to unencumbered
property. Mortgaged property may only be registered where creditors
agree to divide the debt in accordance with the subdivided plots.
However, creditors may be judicially compelled to agree to the
division.
The
preliminary registration with the Real Estate Registry of the
purchase instrument within 30 days of execution of the
agreements.
Once
the property is registered, the installment sale may not occur in a
manner inconsistent with the Real Estate Installment Sales Law,
unless seller registers its decision to desist from the sale in
installments with the Real Estate Registry. In the event of a
dispute over the title between the purchaser and third-party
creditors of the seller, the installment purchaser who has duly
registered the purchase instrument with the Real Estate Registry
will obtain the deed to the plot. Further, the purchaser can demand
conveyance of title after at least 25% of the purchase price has
been paid, although the seller may demand a mortgage to secure
payment of the balance of the purchase price.
After
payment of 25% of the purchase price or the construction of
improvements on the property equal to at least 50% of the property
value, the Real Estate Installment Sales Law prohibits the
termination of the sales contract for failure by the purchaser to
pay the balance of the purchase price. However, in such event, the
seller may take action under any mortgage on the
property.
121
Other Regulations
Consumer
Relationship. Consumer or End User Protection. The Argentine
Constitution expressly establishes in Section 42 that consumers and
users of goods and services have a right to protection of health,
safety and economic interests in a consumer relationship. Consumer
Protection Law No. 24,240, as amended, regulates several issues
concerning the protection of consumers and end users in a consumer
relationship, in the arrangement and execution of
contracts.
The
Consumer Protection Law, and the applicable sections of the
Argentine Civil and Commercial Code are intended to regulate the
constitutional right conferred under the Constitution on the
weakest party of the consumer relationship and prevent potential
abuses deriving from the stronger bargaining position of vendors of
goods and services in a mass-market economy where standard form
contracts are widespread.
As a
result, the Consumer Protection Law and the Argentine Civil and
Commercial Code deem void and unenforceable certain contractual
provisions included in consumer contracts entered into with
consumers or end users, including those which:
●
deprive obligations
of their nature or limit liability for damages;
●
imply a waiver or
restriction of consumer rights and an extension of seller rights;
and
●
impose the shifting
of the burden of proof against consumers.
In
addition, the Consumer Protection Law imposes penalties ranging
from warnings to fines from ARS 100 to ARS 5,000,000, the seizure
of merchandise, closing down of establishments for a term of up to
thirty (30) days, suspension of up to 5 years in the State
suppliers register, the forfeiture of concession rights,
privileges, tax regimes or special credits to which the sanctioned
party was entitled. These penalties may be imposed separately or
jointly.
The
Consumer Protection Law and the Argentine Civil and Commercial Code
define consumers or end users as the individuals or legal entities
that acquire or use goods or services free of charge or for a price
for their own final use or benefit or that of their family or
social group. In addition, both laws provide that those who though
not being parties to a consumer relationship as a result thereof
acquire or use goods or services, for consideration or for
non-consideration, for their own final use or that of their family
or social group are entitled to such protection rights in a manner
comparable to those engaged in a consumer
relationship.
In
addition, the Consumer Protection Law defines the suppliers of
goods and services as the individuals or legal entities, either
public or private, that in a professional way, even occasionally,
produce, import, distribute or commercialize goods or supply
services to consumers or users.
The
Argentine Civil and Commercial Code defines a consumer agreement as
such agreement that is entered into between a consumer or end user
and an individual or legal entity that acts professionally or
occasionally or a private or public company that manufactures goods
or provides services, for the purpose of acquisition, use or
enjoyment of goods or services by consumers or users for private,
family or social use.
It is
important to point out that the protection under the laws afforded
to consumers and end users encompasses the entire consumer
relationship process (from the offering of the product or service)
and it is not only based on a contract, including the consequences
thereof.
In
addition, the Consumer Protection Law establishes a joint and
several liability system under which for any damages caused to
consumers, if resulting from a defect or risk inherent in the thing
or the provision of a service, the producer, manufacturer,
importer, distributor, supplier, seller and anyone who has placed
its trademark on the thing or service shall be liable.
The
Consumer Protection Law excludes the services supplied by
professionals that require a college degree and registration in
officially recognized professional organizations or by a
governmental authority. However, this law regulates the
advertisements that promote the services of such
professionals.
The
Consumer Protection Law determines that the information contained
in the offer addressed to undetermined prospective consumers, binds
the offeror during the period in which the offer takes place and
until its public revocation. Further, it determines that
specifications included in advertisements, announcements,
prospectuses, circulars or other media bind the offeror and are
considered part of the contract entered into by the
consumer.
122
Pursuant
to Resolution No. 104/05 issued by the Secretariat of Technical
Coordination reporting to the Argentine Ministry of Economy, the
Consumer Protection Law adopted Resolution No. 21/2004 issued by
the Mercosur’s Common Market Group which requires that those
who engage in commerce over the Internet (E-Business) shall
disclose in a precise and clear manner the characteristics of the
products and/or services offered and the sale terms. Failure to
comply with the terms of the offer is deemed an unjustified denial
to sell and gives rise to sanctions.
On
September 17, 2014, a new Consumer Protection Law was enacted by
the Argentine Congress –Law No. 26,993–. This law,
known as “System for Conflict Resolution in Consumer
Relationships,” provided for the creation of new
administrative and judicial procedures for this field of Law. It
created a two-instance administrative system: the Preliminary
Conciliation Service for Consumer Relationships (Servicio de
Conciliación Previa en las Relaciones de Consumo, COPREC) and
the Consumer Relationship Audit, and a number of courts assigned to
resolution of conflicts between consumers and producers of goods
and services (Fuero Judicial Nacional de Consumo). In order to file
a claim, the amount so claimed should not exceed a fixed amount
equivalent to 55 adjustable minimum living wages, which are
determined by the Ministry of Labor, Employment and Social
Security. The claim is required to be filed with the administrative
agency. If an agreement is not reached between the parties, the
claimant may file the claim in court. The administrative system
known as Preliminary Conciliation Service for Consumer
Relationships (COPREC) is currently in full force and effect.
However, the court system (fuero judicial nacional de consumo) is
not in force yet, therefore, any court claims should be currently
filed with the existing applicable courts. A considerable volume of
claims filed against us are expected to be settled pursuant to the
system referred to above, without disregarding the full force and
effect of different instances for administrative claims existing in
the provincial sphere and the City of Buenos Aires, which remain in
full force and effect, where potential claims related to this
matter could also be filed.
Antitrust Law
Law
No. 27,442, as amended, or the “Antitrust Law,”
prevents collusive practices by market participants and requires
administrative approval for transactions that according to the
Antitrust Law constitute an economic concentration. According to
this law, mergers, transfers of goodwill, acquisitions of property
or rights over shares, capital or other convertible securities, or
similar transactions by which the acquirer controls or
substantially influences a company, are considered as an economic
concentration. Whenever an economic concentration involves a
company or companies and the aggregate volume of business in
Argentina of the companies concerned exceeds 100 million
mobile units, the respective concentration must be submitted for
approval to the CNDC. The request for approval may be filed, either
prior to the transaction or the implementing of the control
take.
For the
purpose of determining the volume of the business mentioned on the
paragraph before, the CNDC will annually inform the amount in legal
currency that will apply during the corresponding year. For that
purpose, the CNDC will consider the mobile unit value current at
the last business day of the previous year. When a request for
approval is filed, the CNDC may (i) authorize the transaction,
(ii) subordinate the transaction
to
the
accomplishment of certain conditions or (iii) reject the
authorization.
The
Antitrust Law provides that economic concentrations in which the
transaction amount and the value of the assets subject to
acquisition or disposition do not exceed 20 million mobile
units each do not require approval. When the amount of the
transactions consummated in the preceding 12 months exceeds in
aggregate 20 million mobile units or 60 million mobile
units in the preceding 36 months, these transactions require
CNDC approval.
As our
consolidated annual sales volume and our parent’s
consolidated annual sales volume exceed ARS 812,000,000, we are
required to notice to the CNDC of any concentration provided for by
the Antitrust Law; provided that no exception to the notice
requirement under the Antitrust Law is applicable.
123
Taxes on the Transfer of Property and Sale of Meat and
Grains
Value Added Tax (VAT).
VAT is a federal tax that applies
mainly to the (i) sale of goods located in Argentina; (ii)
provision of services within Argentina; (iii) final import of goods
and services (services rendered outside Argentina to persons
registered as domestic VAT taxpayers that are economically used or
exploited inside the country); and (iv) digital services provided
by a foreign company or individuals that are economically used or
exploited inside the country. Services rendered inside Argentina
deemed to be used or exploited outside the country are not subject
to VAT (export of services) and exports are exempted to pay
VAT.
VAT is
paid at each stage of the chain of production or distribution of
goods or services. The general tax rate is 21%.
The
value added tax law imposes a reduced rate, equal to 10.5% on the
sale price of on the sale price of live animals (including cattle,
sheep, camels and goats, among others) as well as their meat and
edible remains, fruits and vegetables, all of which whether fresh,
chilled, or frozen, which have not undergone any cooking or
manufacturing process turning them into a manufactured product.
This 10.5% reduced rate is also applicable to the sale of grains
(cereals and oilseeds, excluding rice), and dry pulses (beans,
peas, and lentils). In the case of milk, the sale is subject to a
21% rate (except for sales to final consumers, the federal
government, the provinces, municipalities or the City of Buenos
Aires or any subordinate agencies, school or university kitchens,
health funds or entities under the scope of paragraphs e), f), g)
and m) of Section 20 of the Income Tax Law, which are
exempt).
The
sale of land and immovable property is not subject to this
tax.
Gross Income Tax
. This is a local tax (collected by the
provinces and the City of Buenos Aires) that levies onerous
activities (habitually activities) carried out within a province or
the City of Buenos Aires. The taxable base is the gross income
derived from said activities.
When
the same business is developed in more than one jurisdiction, the
tax is applicable pursuant to the regulations set forth in the
Multilateral Agreement, which distributes taxable base among the
different jurisdictions, in accordance with certain parameters
(usually, attribution of income or expenses to each jurisdiction),
which is relevant for taxpayers that carry out activities in
several jurisdictions, and is applicable in order to avoid double
taxation.
In the
City of Buenos Aires, gross income derived from livestock raising
and milk production are subject to this tax at a general rate of
0.75%. In certain provinces, the sale of primary goods is not
taxable.
Stamp Tax
. This is a local tax that 23 provinces and the
City of Buenos Aires collect based on similar rules regarding
subject matter, tax base and rates. In general, this tax is levied
on instrumented acts, i.e. executed and delivered by means of
documents (e.g. acts related to the constitution, transmission, or
expiration of rights, contracts, contracts for sales of stock and
company shares, public deeds relating to real property,
etc.).
In the
City of Buenos Aires (federal district) the stamp tax rate
applicable to the transfer by public deed of real property is 3.6%
and 2% in the Province of Buenos Aires. The purchase and sale of
real property through public deed, however, is not taxable in the
province and the City of Buenos Aires –up to a certain value
of the property- if the real estate is used for permanent dwelling
purposes, and provided that it is the only property owned by the
purchaser.
124
Urban Properties and Investments Business (through our subsidiary
IRSA)
As of
June 30, 2020, our investment in IRSA’s common shares amounts
to 62.1%.
The
following information corresponds to data of the segments extracted
from our subsidiary IRSA’s Annual Report and Financial
Statements as of June 30, 2020.
The
revenue figures for fiscal year 2018 described in the different
tables correspond to the twelve-month period reported in
IRSA’s Financial Statements.
Description of main operations
Operation Center in Argentina.
Shopping Malls
As of
June 30, 2020, IRSA owned, through its subsidiary IRSA CP, a
majority interest in and operated, a portfolio of 15 shopping malls
in Argentina, six of which are located in the City of Buenos Aires
(Abasto, Alcorta Shopping, Alto Palermo Shopping, Patio Bullrich,
Dot Baires Shopping and Distrito Arcos), two are located in the
greater Buenos Aires area (Alto Avellaneda and Soleil Premium
Outlet), and the rest are located in different provinces of
Argentina (Alto Noa in the City of Salta, Alto Rosario in the City
of Rosario, Mendoza Plaza in the City of Mendoza, Córdoba
Shopping Villa Cabrera and Patio Olmos (operated by a third party)
in the City of Córdoba, La Ribera Shopping in Santa Fe
(through a joint venture) and Alto Comahue in the City of
Neuquén).
The
shopping malls IRSA operates comprise a total of 333,062 square
meters of GLA (excluding certain spaces occupied by hypermarkets
which are not our tenants). Total tenant sales in our shopping
malls, as reported by retailers, were ARS 69,965 million for fiscal
year 2020 and ARS 94,436 million for fiscal year 2019, a decrease
of 25.9% in real terms (+6.7% in nominal terms). The greatest
impact of this drop was evidenced in the fourth quarter of the
yearbecause of the closure of operations due to the lockdown
decreed in Argentina on March 20, 2020 as a consequence of COVID19.
Tenant sales at our shopping malls are relevant to our revenues and
profitability because it is an important factor in determining rent
our tenants pay. Sales also affect tenant’s overall occupancy
costs as a percentage of that tenant’s sales.
125
The
following table shows certain information about IRSA, through its
subsidiary IRSA CP’s shopping malls as of June 30,
2020:
|
Shopping
malls
|
Date
ofacquisition/development
|
Location
|
GLA(sqm)
(1)
|
Numberof
stores
|
Occupancyrate
(2)
|
Ourownershipinterest
(3)
|
Rental
revenue
|
|
|
|
|
|
|
(%)
|
(%)
|
(in
million of ARS)
|
|
Alto
Palermo
|
Dec-97
|
City of Buenos
Aires
|
18,655
|
136
|
91.9
|
100.0
|
997
|
|
Abasto
Shopping
(4)
|
Nov-99
|
City of Buenos
Aires
|
36,760
|
164
|
94.9
|
100.0
|
854
|
|
Alto
Avellaneda
|
Dec-97
|
Buenos Aires
Province
|
38,330
|
125
|
97.4
|
100.0
|
600
|
|
Alcorta
Shopping
|
Jun-97
|
City of Buenos
Aires
|
15,725
|
114
|
97.3
|
100.0
|
532
|
|
Patio
Bullrich
|
Oct-98
|
City of Buenos
Aires
|
11,396
|
89
|
91.4
|
100.0
|
308
|
|
Dot Baires
Shopping
|
May-09
|
City of Buenos
Aires
|
48,805
|
167
|
74.6
|
80.0
|
653
|
|
Soleil Premium
Outlet
|
Jul-10
|
Buenos Aires
Province
|
15,156
|
79
|
97.1
|
100.0
|
248
|
|
Distrito
Arcos
|
Dec-14
|
City of Buenos
Aires
|
14,335
|
65
|
93.8
|
90,0
|
459
|
|
Alto Noa
Shopping
|
Mar-95
|
City of
Salta
|
19,313
|
85
|
99.0
|
100.0
|
185
|
|
Alto Rosario
Shopping
(4)
|
Nov-04
|
City of
Rosario
|
33,681
|
142
|
97.2
|
100.0
|
520
|
|
Mendoza Plaza
Shopping
|
Dec-94
|
City of
Mendoza
|
43,313
|
129
|
97.8
|
100.0
|
295
|
|
Córdoba
Shopping
|
Dec-06
|
City of
Córdoba
|
15,361
|
104
|
95.4
|
100.0
|
177
|
|
La Ribera
Shopping
|
Aug-11
|
City of Santa
Fé
|
10,530
|
68
|
99.0
|
50.0
|
59
|
|
Alto
Comahue
|
Mar-15
|
City of
Neuquén
|
11,702
|
95
|
96.2
|
99.9
|
377
|
|
Patio
Olmos
(5)
|
Sep-07
|
City of
Córdoba
|
—
|
—
|
—
|
—
|
—
|
|
Total
|
|
|
333,062
|
1,562
|
93.2
|
|
6,263
|
(1)
Corresponds to gross leasable area in each property. Excludes
common areas and parking spaces.
(2)
Calculated dividing occupied square meters by leasable area as of
the last day of the fiscal year.
(3)
Company’s effective interest in each of its business
units.
(4)
Excludes Museo de los Niños (which represents 3,732 square
meters in Abasto and 1,261 square meters in Alto
Rosario).
(6) IRSA CP owns the historic building of the Patio Olmos
shopping mall in the Province of Córdoba, operated by a third
party and does not include the rental revenues of Patio Olmos, for
more details see “Accumulated rental
income
”.
The
following table shows information about IRSA, through its
subsidiary IRSA CP’s expansions and future expansions on
current assets as of June 30, 2020:
|
Expansions
|
Ownership
interest
|
Surface
|
Locations
|
|
|
(%)
|
(sqm)
|
|
|
Alto
Palermo Adjoining Plot
|
100
|
3,900
|
City of Buenos
Aires
|
|
Subtotal
current expansions
|
|
3,900
|
|
|
Other future
expansions
(1)
|
|
98,055
|
|
|
Subtotal
future expansions
|
|
98,055
|
|
|
Total
Shopping Malls
|
|
101,955
|
|
|
Patio Bullrich -
Offices / Hotel
|
100
|
10,000
|
City of Buenos
Aires
|
|
Philips
Building
|
100
|
20,000
|
City of Buenos
Aires
|
|
Subtotal
future expansions
|
|
30,000
|
|
|
Total
offices
|
|
30,000
|
|
|
|
|
|
|
|
Total
expansions
|
|
131,955
|
|
(1)
Includes Alto
Palermo, Paseo Alcorta, Alto Avellaneda, Soleil, Alto Noa, Alto
Rosario, Mendoza, Córdoba y La Ribera Shopping
126
Rental income
The
following table sets forth total rental income for each of IRSA,
through its subsidiary IRSA CP’s shopping malls for the
fiscal years indicated:
|
|
For
the fiscal years ended June 30,
(1)
|
||
|
|
2020
|
2019
|
2018
|
|
|
(in
millions of ARS )
|
||
|
Alto
Palermo
|
997
|
1,408
|
1,515
|
|
Abasto
Shopping
|
854
|
1,312
|
2,040
|
|
Alto
Avellaneda
|
600
|
943
|
1,059
|
|
Alcorta
Shopping
|
532
|
693
|
735
|
|
Patio
Bullrich
|
308
|
403
|
425
|
|
Dot Baires
Shopping
|
653
|
1,111
|
1,087
|
|
Soleil Premium
Outlet
|
248
|
367
|
385
|
|
Distrito
Arcos
|
459
|
632
|
620
|
|
Alto Noa
Shopping
|
185
|
248
|
279
|
|
Alto Rosario
Shopping
|
520
|
683
|
732
|
|
Mendoza Plaza
Shopping
|
295
|
410
|
449
|
|
Córdoba
Shopping Villa Cabrera
|
177
|
246
|
272
|
|
La Ribera
Shopping
(2)
|
59
|
87
|
92
|
|
Alto
Comahue
|
377
|
419
|
361
|
|
Subtotal
|
6,263
|
8,960
|
10,053
|
|
Patio Olmos
(3)
|
7
|
10
|
10
|
|
Adjustments and
eliminations
(4)
|
(336
)
|
(430
)
|
(313
)
|
|
Total
|
5,935
|
8,541
|
9,750
|
(1)
Includes base rent,
percentage rent, admission rights, fees, parking, commissions,
revenue from non-traditional advertising and others. Does not
include Patio Olmos.
(2)
Through our joint
venture Nuevo Puerto Santa Fé S.A.
(3)
IRSA CP owns the
historic building where the Patio Olmos shopping mall is located in
the province of Cordoba. The property is managed by a third
party.
(4)
Includes indirect
incomes and eliminations between segments. In 2019 and 2018,
revenue from Buenos Aires Design are included. End of concession
December 5, 2018.
The
following table sets forth IRSA ’s revenue from cumulative
leases by revenue category for the fiscal years
presented:
127
|
|
For
the fiscal year ended June 30,
|
||
|
|
2020
|
2019
|
2018
|
|
|
(in
millions of ARS)
|
|
|
|
Base
rent
|
3,128
|
4,780
|
5,623
|
|
Percentage
rent
|
1,471
|
1,779
|
1,863
|
|
Total
rent
|
4,599
|
6,559
|
7,486
|
|
Non-traditional
advertising
|
184
|
222
|
245
|
|
Revenues from
admission rights
|
903
|
1,051
|
1,162
|
|
Fees
|
105
|
118
|
138
|
|
Parking
|
296
|
473
|
571
|
|
Commissions
|
155
|
321
|
429
|
|
Other
|
21
|
216
|
22
|
|
Subtotal
(1)
|
6,263
|
8,960
|
10,053
|
|
Patio
Olmos
|
7
|
10
|
10
|
|
Adjustments and
eliminations
(2)
|
(336
)
|
(430
)
|
(313
)
|
|
Total
|
5,935
|
8,541
|
9,750
|
(1)
Does not include
Patio Olmos
(2)
Includes indirect
incomes and eliminations between segments. In 2019 and 2018,
revenues from Buenos Aires Design are included. End of concession
December 5, 2018.
Tenant retail sales
For the
2020 fiscal year, IRSA, through its subsidiary IRSA CP’s
shopping mall tenants’ sales reached ARS 69,965 million, a
decrase of 25.9% in real terms compared to the previous fiscal year
(+6,7% in nominal terms).
Tenant
sales at the shopping malls located in the City of Buenos Aires and
Greater Buenos Aires recorded year-on-year decreases of 26.9% in
real terms (+5.0% in nominal terms), up from ARS 65,404 million to
ARS 47,805 million during fiscal year 2020, whereas shopping malls
in the interior of Argentina decreased approximately 23.7% in real
terms (+10.4% in nominal terms) in comparison with the previous
fiscal year, from ARS 29,032 million to ARS 22,160 million during
fiscal year 2020.
The
following table sets forth the total retail sales of IRSA, through
its subsidiary IRSA CP’s shopping mall tenants for the fiscal
years indicated:
|
|
For
the fiscal years ended June 30,
(1)
|
||
|
|
2020
|
2019
|
2018
|
|
|
(in
millions of ARS)
|
||
|
Alto
Palermo
|
8,537
|
11,585
|
12,803
|
|
Abasto
Shopping
|
8,681
|
12,287
|
14,441
|
|
Alto
Avellaneda
|
7,671
|
11,019
|
13,892
|
|
Alcorta
Shopping
|
5,090
|
6,535
|
6,999
|
|
Patio
Bullrich
|
3,463
|
4,293
|
3,880
|
|
Buenos Aires Design
(1)
|
-
|
562
|
1,785
|
|
Dot Baires
Shopping
|
6,819
|
9,416
|
11,948
|
|
Soleil Premium
Outlet
|
3,543
|
5,056
|
5,664
|
|
Distrito
Arcos
|
4,001
|
4,651
|
4,669
|
|
Alto Noa
Shopping
|
3,473
|
4,172
|
5,039
|
|
Alto Rosario
Shopping
|
7,230
|
9,286
|
10,359
|
|
Mendoza Plaza
Shopping
|
5,643
|
7,402
|
8,743
|
|
Córdoba
Shopping Villa Cabrera
|
2,226
|
3,029
|
3,582
|
|
La Ribera
Shopping(2)
|
1,476
|
2,167
|
2,623
|
|
Alto
Comahue
|
2,112
|
2,976
|
3,260
|
|
Total
|
69,965
|
94,436
|
109,687
|
(1)
Retail
sales based upon information provided to us by retailers and prior
owners. The amounts shown reflect 100% of the retail sales of each
shopping mall, although in certain cases we own less than 100% of
such shopping malls. Includes sales from stands and excludes spaces
used for special exhibitions.
(2) End
of concession term was December 5, 2018
(3)
Owned by Nuevo Puerto Santa Fé S.A., in which we are a
joint venture partner.
128
Total sales by type of business
The
following table sets forth the retail sales of IRSA, through its
subsidiary IRSA CP’s shopping mall tenants by type of
business for the fiscal years indicated:
|
|
For
the fiscal years ended June 30,
(1)
|
||
|
|
2020
|
2019
|
2018
|
|
|
(in
millions of ARS )
|
||
|
Department
Store
|
3,724
|
5,111
|
6,290
|
|
Clothes and
footwear
|
38,273
|
52,475
|
57,220
|
|
Entertainment
|
2,147
|
3,166
|
3,404
|
|
Home and
decoration
|
1,431
|
2,097
|
3,071
|
|
Home
Appliances
|
7,890
|
10,577
|
12,094
|
|
Restaurants
|
9,999
|
11,838
|
12,955
|
|
Miscellaneous
|
804
|
1,127
|
1,183
|
|
Services
|
5,697
|
8,045
|
13,470
|
|
Total
|
69,965
|
94,436
|
109, 687
|
(1)
Includes
sales from stands and excludes spaces used for special
exhibitions.
Occupancy rate
The
following table sets forth the occupancy rate of IRSA, through its
subsidiary IRSA CP’s shopping malls expressed as a percentage
of gross leasable area of each shopping mall for the fiscal years
indicated:
|
|
As
of June 30,
|
||
|
|
2020
|
2019
|
2018
|
|
|
(%)
|
||
|
|
|
|
|
|
Alto
Palermo
|
91.9
|
99.1
|
99.5
|
|
Abasto
Shopping
|
94.9
|
98.7
|
99.1
|
|
Alto
Avellaneda
|
97.4
|
98.6
|
98.9
|
|
Alcorta
Shopping
|
97.3
|
97.9
|
99.8
|
|
Patio
Bullrich
|
91.4
|
93.5
|
97.1
|
|
Dot Baires
Shopping
|
74.6
|
74.5
|
99.5
|
|
Soleil Premium
Outlet
|
97.1
|
99.0
|
97.7
|
|
Distrito
Arcos
|
93.8
|
99.4
|
99.7
|
|
Alto Noa
Shopping
|
99.0
|
99.5
|
96.8
|
|
Alto Rosario
Shopping
|
97.2
|
99.6
|
99.5
|
|
Mendoza Plaza
Shopping
|
97.8
|
97.3
|
98.3
|
|
Córdoba
Shopping Villa Cabrera
|
95.4
|
99.3
|
100.0
|
|
La Ribera
Shopping
|
99.0
|
94.6
|
94.9
|
|
Alto
Comahue
|
96.2
|
96.2
|
94.4
|
|
Total
(1)
|
93.2
|
94.7
|
98.5
|
(1)
As of June 30,
2020, the occupancy rate decreased mainly due to 12,600 square
meters vacancy generated by Walmart in Dot Baires Shopping.
Excluding this effect, the occupancy would have been
96.0%.
129
(2)
Rental
price
The
following table shows the annual average rental price per square
meter of our shopping malls for the fiscal years
indicated:
|
|
For
the fiscal years endedJune 30,
(1)
|
||
|
|
2020
|
2019
|
2018
|
|
|
(in
ARS)
|
||
|
Alto
Palermo
|
35,535
|
51,660
|
57,623
|
|
Abasto
Shopping
|
16,174
|
25,185
|
33,820
|
|
Alto
Avellaneda
|
11,578
|
19,337
|
22,859
|
|
Alcorta
Shopping
|
22,764
|
30,582
|
33,119
|
|
Patio
Bullrich
|
17,853
|
23,435
|
24,777
|
|
Dot Baires
Shopping
|
8,976
|
13,309
|
15,122
|
|
Soleil Premium
Outlet
|
12,702
|
19,764
|
21,717
|
|
Distrito
Arcos
|
25,057
|
36,348
|
36,592
|
|
Alto Noa
Shopping
|
8,143
|
10,871
|
12,805
|
|
Alto Rosario
Shopping
|
12,020
|
16,428
|
18,233
|
|
Mendoza Plaza
Shopping
|
5,530
|
7,883
|
9,116
|
|
Córdoba
Shopping Villa Cabrera
|
9,058
|
13,070
|
14,876
|
|
La Ribera
Shopping
|
4,523
|
6,814
|
7,616
|
|
Alto
Comahue
|
30,634
|
29,567
|
35,969
|
(1)
Corresponds to consolidated annual accumulated rental prices
according to the IFRS divided by gross leaseable square meters.
Does not include revenues from Patio Olmos.
Lease expirations
(1)(2)
The
following table sets forth the schedule of estimated lease
expirations for our shopping malls for leases in effect as of June
30, 2020, assuming that none of our tenants exercises its option to
renew or terminate its lease prior to expiration:
|
|
As
of June 30, 2020
|
||||
|
Agreements’
Expiration
|
Number
ofagreements
(1)
|
Square
meters to expire
|
Due
toexpire(%)
|
Total
leasepayments(in millions of ARS)
(3)
|
Agreements(%)
|
|
Vacant
Stores
|
113
|
22,684
|
6.8
|
|
|
|
Expired
in-force
|
246
|
53,600
|
16.1
|
486
|
18.4
|
|
As of June 30,
2021
|
424
|
68,355
|
20.5
|
763
|
28.9
|
|
As of June 30,
2022
|
383
|
48,719
|
14.6
|
589
|
22.3
|
|
As of June 30,
2023
|
278
|
38,916
|
11.7
|
418
|
15.8
|
|
As of June 30, 2024
and subsequent years
|
118
|
100,788
|
30.3
|
383
|
14.5
|
|
Total
|
1,562
|
333,062
|
100.0
|
2,639
|
100.0
|
(1)
Includes vacant stores as of June 30, 2020. A lease may be
associated with one or more stores.
(2)
Does not reflect our ownership interest in each
property.
(3) The
amount expresses the annual base rent as of June 30, 2020 of
agreements due to expire.
Five largest tenants of the portfolio
The
five largest tenants of the portfolio (in terms of sales) account
for approximately 16.6% of their gross leasable area as of June 30,
2020 and represent approximately 9.8% of the annual basic rent for
the fiscal year ending on that date.
130
The
following table describes our portfolio’s five largest
tenants:
|
Tenant
|
Type of Business
|
Sales
|
Gross Leaseable Area
|
Gross Leaseable Area
|
|
|
|
(%)
|
(sqm)
|
(%)
|
|
Zara
|
Clothes
and footwear
|
7.5
|
10,771
|
3.2
|
|
Falabella
|
Department
store
|
5.4
|
28,892
|
8.7
|
|
Nike
|
Clothes
and footwear
|
4.0
|
7,610
|
2.3
|
|
Fravega
|
Home
appliances
|
3.2
|
3,524
|
1.1
|
|
Mc
Donald’s
|
Restaurant
|
2.5
|
4,400
|
1.3
|
|
Total
|
|
22.5
|
55,197
|
16.6
|
New leases and renewals
The
following table shows certain information about IRSA, through its
subsidiary IRSA CP’s, leases agreement as of June 30,
2020:
|
|
Number
ofagreements renewed
|
Annualbase
rent(in millions of ARS)
|
Annualadmissionrights(in
millions of ARS)
|
Average
annual baserent per sqm (ARS)
|
Number
of non-renewedagreements
(1)
|
Non-renewedagreements
(1)
annualbase
rent amount (in millions of ARS )
|
|
|
Type
of business
|
|
|
|
New
andrenewed
|
Formeragreements
|
|
|
|
Clothing and
footwear
|
268
|
478
|
95
|
12,781
|
10,103
|
578
|
1,122
|
|
Restaurant
|
72
|
107
|
15
|
13,466
|
11,877
|
130
|
226
|
|
Miscellaneous
(2)
|
56
|
112
|
26
|
6,741
|
25,798
|
147
|
318
|
|
Home
|
32
|
61
|
8
|
8,484
|
9,762
|
54
|
128
|
|
Services
|
28
|
47
|
4
|
8,636
|
10,927
|
12
|
59
|
|
Entertainment
|
11
|
19
|
0
|
1,224
|
1,455
|
14
|
73
|
|
Supermarket
|
1
|
5
|
0
|
1,222
|
2,950
|
1
|
9
|
|
Total
|
468
|
829
|
148
|
7,057
|
8,123
|
936
|
1,935
|
(1)
Includes vacant stores as of June 30, 2020. Gross leasable area
with respect to such vacant stores is included under the type of
business of the last tenant to occupy such stores.
(2)
Miscellaneous includes anchor store.
Principal Terms of our Leases
Under
the Civil and Commercial Code of Argentina, the term of the
locations cannot exceed twenty years for the residential
destination and fifty years for the other
destinations.
Leasable
space in our shopping malls is marketed through an exclusive
arrangement with our wholly owned subsidiary and real estate broker
Fibesa S.A., or “Fibesa.” We use a standard lease
agreement for most tenants at our shopping malls, the terms and
conditions of which are described below. However, our largest or
“anchor” tenants generally negotiate better terms for
their respective leases. No assurance can be given that lease terms
will be as set forth in the standard lease agreement.
131
Rent
amount specified in our leases generally is the higher of
(i) a monthly Base Rent and (ii) a specified percentage
of the tenant’s monthly gross sales in the store, which
generally ranges between 3% and 12% of tenant’s gross sales.
In addition, pursuant to the rent escalation clause in most of our
leases, a tenant’s Base Rent generally increases between 18%
and 28% on a semi-annually and cumulative basis from the thirteenth
(13
th
)
month of effectiveness of the lease. Although many of our lease
agreements contain price adjustment provisions, these are not based
on an official index nor do they reflect the inflation index. In
the event of litigation, there can be no assurance that we will be
able to enforce such clauses contained in our lease agreements.
These terms and conditions have not been applied during a period
when the shopping malls remained closed due to the Social,
Preventive and Mandatory Isolation decreed by the government of
Argentina as a result of the novel COVID-19 virus since IRSA CP
decided to defer the billing and collection of the Base Rent until
September 30, 2020, with some exceptions and IRSA CP alsos
suspended collection of the collective promotion fund during the
same period, prioritizing the long-term relationship with its
tenants.
In
addition to rent, we charge most of our tenants an admission right,
which must be paid upon execution of the lease agreement and upon
its renewal. The admission right is normally paid as a lump sum or
in a small number of monthly installments. If the tenants pay this
fee in installments, the tenants are responsible for paying the
balance of any such unpaid amount if they terminate the lease prior
to its expiration. In the event of unilateral termination and/or
resolution for breach by the tenants, tenants will not be refunded
their admission payment without our consent. We lease our stores,
kiosks and spaces in our shopping malls through our wholly-owned
subsidiary Fibesa. We charge our tenants a fee for the brokerage
services, which usually amounts to approximately three months of
the Base Rent plus the admission right.
We are
responsible, except in the mall Distrito Arcos, for providing each
unit within our shopping malls with electricity, a main telephone
switchboard, central air conditioning and a connection to a general
fire detection system. We also provide the food court tenants with
sanitation and with gas systemsconnections. In Distrito Arcos, the
connections are managed by the tenants. Each tenant is responsible
for completing all necessary installations within its rental unit,
in addition to paying direct related expenses, including
electricity, water, gas, telephone and air conditioning. Tenants
must also pay for a percentage of total expenses and general taxes
related to common areas. We determine this percentage based on
different factors. The common area expenses include, among others,
administration, security, operations, maintenance, cleaning and
taxes.
We
carry out promotional and marketing activities to draw consumer
traffic to our shopping malls. These activities are paid for with
the tenants’ contributions to the Collective Promotion Fund,
or “CPF,” which is administered by us. Tenants are
required to contribute 15% of their rent (Base Rent plus Percentage
Rent) to the CPF. We may increase the percentage tenants must
contribute to the CPF with up to 25% of the original amount set
forth in the corresponding lease agreement for the contributions to
the CPF. We may also require tenants to make extraordinary
contributions to the CPF to fund special promotional and marketing
campaigns or to cover the costs of special promotional events that
benefit all tenants. We may require tenants to make these
extraordinary contributions up to four times a year provided that
each extraordinary contribution may not exceed 25% of the
tenant’s preceding monthly lease payment.
Each
tenant leases its rental unit as a shell without any fixtures and
is responsible for the interior design of its rental unit. Any
modifications and additions to the rental units must be
pre-approved by us. We have the option to charge the tenant for all
costs incurred in remodeling the rental units andfor removing any
additions made to the rental unit when the lease expires.
Furthermore, tenants are responsible for obtaining adequate
insurance for their rental units, which must cover, among other
things, damage caused by fire, glass breakage, theft, flood, civil
liability and workers’ compensation.
132
Insurance
IRSA
and our subsiadiary IRSA CP carry all-risk insurance for the
shopping malls and
other buildings
covering
property damage caused by fire,
terrorist acts,
explosion, gas leak, hail,
storms and wind, earthquakes, vandalism, theft and business
interruption. In addition, we carry liability insurance covering
any potential damage to third parties or property caused by the
conduct of our business throughout Argentina. IRSA and our
subsiadiary IRSA CP are in compliance with all legal requirements
related to mandatory insurance, including insurance required by the
Occupational Risk Law (
Ley de
Riesgos del Trabajo
), life insurance required under
collective bargaining agreements and other insurance required by
laws and executive orders. IRSA CP’s and our history of
damages is limited to one single claim resulting from a fire in
Alto Avellaneda Shopping in March 2006, which loss was
substantially recovered from our insurers. These insurance policies
contain specifications, limits and deductibles which we believe are
adequate to the risks to which we are exposed in our daily
operations. IRSA and our subsiadiary IRSA CP also maintain
liability insurance covering the liability of our directors and
corporate officers.
Control Systems
IRSA CP
has computer systems equipped to monitor tenants’ sales
(except stands) in all of its shopping malls. IRSA CP also conduct
regular audits of our tenants’ accounting sales records in
all of our shopping malls. Almost every store in its shopping malls
has a point of sale that is linked to our main server. IRSA CP uses
the information generated from the computer monitoring system to
prepare statistical data regarding, among other things, total
sales, average sales and peak sale hours for marketing purposes and
as a reference for the internal audit. Most of its shopping mall
lease agreements require the tenant to have its point of sale
system linked to our server. During this fiscal year, we signed an
agreement to renew our payment terminals with contactless
technology (Clover).
Competition
IRSA is
the largest owner and operator of shopping malls, offices and other
commercial properties in Argentina in terms of gross leaseable area
and number of rental properties. Given that most of our shopping
malls are located in highly populated areas, there are competing
shopping malls within, or in close proximity to, our targeted
areas, as well as stores located on avenues or streets. The number
of shopping malls in a particular area could have a material effect
on our ability to lease space in our shopping malls and on the
amount of rent that we are able to charge. We believe that due to
the limited availability of large plots of land and zoning
restrictions in the City of Buenos Aires, it is difficult for other
companies to compete with us in areas through the development of
new shopping malls. Our principal competitor is Cencosud S.A. which
owns and operates Unicenter Shopping and the Jumbo hypermarket
chain, among others.
133
The following table shows certain information concerning the most
significant owners and operators of shopping malls in Argentina, as
of June 30, 2020.
|
Entity
|
Shopping
malls
|
Location
|
GLA
|
Marketshare(1)
|
|
|
|
|
|
(%)
|
|
IRSA
CP
|
Alto Palermo
|
City of Buenos
Aires
|
18,655
|
1.44
|
|
Abasto
Shopping(2)
|
City of Buenos
Aires
|
36,760
|
2.83
|
|
|
Alto
Avellaneda
|
Province of Buenos
Aires
|
38,330
|
2.95
|
|
|
Alcorta
Shopping
|
City of Buenos
Aires
|
15,725
|
1.21
|
|
|
Patio
Bullrich
|
City of Buenos
Aires
|
11,396
|
0.88
|
|
|
Dot Baires
Shopping(4)
|
City of Buenos
Aires
|
48,805
|
3.75
|
|
|
Soleil
|
Province of Buenos
Aires
|
15,156
|
1.17
|
|
|
Distrito
Arcos
|
City of Buenos
Aires
|
14,335
|
1.10
|
|
|
Alto
Noa(2)
|
City of
Salta
|
19,313
|
1.49
|
|
|
Alto
Rosario(3)
|
City of
Rosario
|
33,681
|
2.59
|
|
|
Mendoza
Plaza
|
City of
Mendoza
|
43,313
|
3.33
|
|
|
Córdoba
Shopping
|
City of
Córdoba
|
15,361
|
1.18
|
|
|
La Ribera
Shopping
|
City of Santa
Fe
|
10,530
|
0.81
|
|
|
Alto
Comahue
|
City of
Neuquén
|
11,702
|
0.90
|
|
|
Subtotal
|
|
|
333,062
|
25.62
|
|
Cencosud S.A.
|
|
|
277,203
|
21.33
|
|
Other
operators
|
|
|
689,587
|
53.05
|
|
Total
|
|
|
1,299,852
|
100.00
|
(1)
Corresponding to gross leaseable area in respect of total gross
leaseable area. Market share is calculated dividing sqm over total
sqm.
(2)
Does not include Museo de los Niños (3,732 sqm).
(3)
Does not include Museo de los Niños (1,261 sqm).
(4) Our
interest in PAMSA is 80%:
Source:
Argentine Chamber of Shopping Centers.
Seasonality
IRSA
CP’s business is directly related with seasonality, affecting
the level of our tenants’ sales. During summer holidays
(January and February) our tenants’ sales reach their minimum
level, whereas during winter holidays (July) and in December
(Christmas) they reach their maximum level. Clothing stores
generally change their collections in spring and autumn, positively
affecting our shopping malls’ sales. Sales at discount prices
at the end of each season are also one of the main sources of
impact on our business.
Offices
According
to Colliers International, as of June 30, 2020, the A+ and A office
inventory decreased compared to 2019 to 1,827,742 sqm. The vacancy
rate was steady at approximately 11.2% during the second quarter of
2020. These values indicate that the market is healthy in terms of
its operations, allowing an optimum level of supply with robust
values.
Compared
to the previous quarter, the Premium Offices prices decreased in
the order of USD 24.3 per square meter compared to the previous
quarter, and showed the same period last year, which was USD 25.3
per square meter. Theprices for A+ properties were USD 27.39 per
square meter for the second quarter of 2020. In this context,
Catalinas presents as the zone with higher prices per square meter,
reaching an average of USD 33.0. Likewise, the industry reported a
3.0% decreased in rental prices for A properties compared to the
first quarter of 2020, reaching an average of USD 22.06 per square
meter, in which the North zone of Ciudad de Buenos Aires reach the
higher prices, reaching USD 30.7 per square meter.
Management of office buildings
IRSA
generally acts as the manager of the office properties in which we
own an interest. We typically own the entire building or a
substantial number of floors in the building. The buildings in
which we own floors are generally managed pursuant to the terms of
a condominium agreement that typically provides for control by a
simple majority of the interests based on owned area. As building
manager, we handle services such as security, maintenance and
housekeeping, which are generally outsourced. The cost of the
services is passed through to, and paid for by, the tenants, except
in the case of our units that have not been leased, if any, for
which we bear the cost. We market our leasable area through
commissioned brokers or directly by us.
134
Leases
IRSA
usually leases our offices by using contracts with an average term
between three to ten years. Contracts for the rental of office
buildings and other commercial properties are generally stated in
U.S. dollars. Rental rates for renewed periods are negotiated at
market value.
Properties
The following table sets forth certain information regarding IRSA,
through its subsidiary IRSA CP’s office buildings, as of June
30, 2020:
|
|
Date
ofacquisition/development
|
GLA
(sqm)
(1)
|
Occupancy
rate
(2)
|
Ownership
interest
|
Total
rental incomefor the fiscal yearendedJune 30, 2020
|
|
|
|
|
(%)
|
(%)
|
(in
thousands
of
ARS)
|
|
Offices
|
|
|
|
|
|
|
AAA
& A buildings
|
|
|
|
|
|
|
República
Building
|
Dec-14
|
19,885
|
86.9
|
100
|
433,254
|
|
Bankboston
Tower
(5)
|
Dec-14
|
14,865
|
96.4
|
100
|
324,165
|
|
Intercontinental
Plaza
(3)
|
Dec-14
|
2,979
|
100.0
|
100
|
40,421
|
|
Bouchard
710
(6)
|
Dec-14
|
15,014
|
92.5
|
100
|
371,835
|
|
Dot
Building
|
Nov-06
|
11,242
|
84.9
|
80
|
232,468
|
|
Zetta
|
Jun-19
|
32,173
|
97.5
|
80
|
760,908
|
|
Total
AAA & A buildings
|
|
96,158
|
93.0
|
|
2,163,051
|
|
B
buildings
|
|
|
|
|
|
|
Philips
|
Jun-17
|
8,017
|
82.7
|
100
|
74,172
|
|
Suipacha
652/64
|
Dec-14
|
11,465
|
31.2
|
100
|
39,010
|
|
Total
B buildings
|
|
19,482
|
52.4
|
|
113,182
|
|
Total
Offices
|
|
115,640
|
86.1
|
|
2,276,232
|
|
Other
rental properties
(4)
|
|
|
|
|
74,980
|
|
Total
Offices and Others
|
|
|
|
|
2,351,212
|
(1)
Corresponds to the gross leasable area of each property as of June
30, 2020. Excludes common areas and parking spaces.
(2)
Calculated by dividing occupied square meters by leasable area as
of June 30, 2020.
(3) We
own 13.2% of the building that has 22,535 square meters of gross
leasable area.
(4)
Includes rental income from all those properties that are not
buildings intended for rent, but that are partially or fully rented
(Philips Deposit, Anchorena 665 and San Martin Plot)
(5) On
July 15, 2020, our subsidiary IRSA CP sold one floor and five
parking spaces, on August 26, 2020, it sold five floors and twenty
five parking spaces, on November 5, 2020, it sold four floor and
fifteen parking spaces
and on November 12,
2020, it sold three floors and fifteen parking spaces
. For
more information, see “Recent Developments – Boston
Tower Floor’s sale - Signature of a Purchase ticket regarding
Boston Tower floor with possession”.
(6) On
July 30, 2020, IRSA CP sold the entire building. For more
information see: “Recent Developments – Bouchard 710
Building sale”
135
Occupancy
rate
The
following table shows our offices occupancy percentage
(1)
as of the end of
fiscal years ended June 30:
|
|
Occupancy
rate
(1)
|
||
|
|
As
of June 30,
|
||
|
|
2020
|
2019
|
2018
|
|
|
(%)
|
||
|
Offices:
|
|
|
|
|
República
Building
|
86.9
|
95.2
|
98.4
|
|
Bankboston Tower
(2)
|
96.4
|
93.5
|
85.6
|
|
Intercontinental
Plaza
|
100.0
|
100.0
|
100.0
|
|
Bouchard
710
(3)
|
92.5
|
100.0
|
100.0
|
|
Suipacha
652/64
|
31.2
|
44.6
|
86.2
|
|
DOT
Building
|
84.9
|
100.0
|
100.0
|
|
Philips
Building
|
82.7
|
45.7
|
69.8
|
|
Zetta
Building
|
97.5
|
97.5
|
-
|
|
Total
|
86.1
|
88.3
|
92.3
|
(1)
Leased square
meters pursuant to lease agreements in effect as of June 30,
2020, 2019 and 2018 over gross leasable area of offices for the
same fiscal years.
(2)
On July 15, 2020,
our subsidiary IRSA CP sold one floor and five parking spaces, on
August 26, 2020, our subsidiary IRSA CP sold five floors and twenty
five parking spaces, on November 5, 2020, it sold four floor and
fifteen parking spaces
and on November 12,
2020, it sold three floors and fifteen parking spaces
. For
more information, see “Recent Developments – Boston
Tower Floor’s sale - Signature of a Purchase ticket regarding
Boston Tower floor with possession”.
(3)
On July 30, 2020,
our subsidiary IRSA CP sold the entire building. For more
information see: “Recent Developments – Bouchard 710
Building sale”.
Annual
average income per surface area as of June 30, 2020, 2019 and
2018
(1)
:
|
|
Income
per square meter (1)
|
||
|
|
As
of June 30,
|
||
|
|
2020
|
2019
|
2018
|
|
|
(ARS/sqm)
|
||
|
República
Building
|
25,072
|
23,464
|
16,395
|
|
Bankboston
Tower
(2)
|
22,622
|
24,072
|
17,205
|
|
Intercontinental
Plaza
|
13,569
|
15,399
|
17,127
|
|
Bouchard
710
(3)
|
26,774
|
24,500
|
20,422
|
|
Suipacha
652/64
|
10,905
|
22,329
|
8,677
|
|
Dot
Building
|
24,356
|
19,992
|
14,437
|
|
Philips
Building
|
11,187
|
25,792
|
7,188
|
|
Zetta
Building
|
24,257
|
15,925
|
-
|
(1)
Calculated by
dividing annual rental income by the gross leasable area of offices
based on our interest in each building as of June 30 for each
fiscal period.
(2)
On July 15, 2020,
our subsidiary IRSA CP sold one floor, five parking spaces and on
August 26, 2020, our subsidiary IRSA CP sold five floors and twenty
five parking spaces, on November 5, 2020, it sold four floor and
fifteen parking spaces
and on November 12,
2020, it sold three floors and fifteen parking spaces
. For
more information, see “Recent Developments – Boston
Tower Floor’s sale - Signature of a Purchase ticket regarding
Boston Tower floor with possession”.
(3)
On July 30, 2020,
our subsidiary IRSA CP sold the entire building. For more
information see: "Recent Developments - Bouchard 710 Building
sale"
136
New agreements and renewals
The following table sets forth certain Information on lease
agreements as of June 30, 2020:
|
Building
|
Number of lease agreements
(1)(5)
|
Annual rental price(In million of Ars)
(2)
|
Rental price per new and renewed sqm
(3)
|
Rental price per previous sqm (ARS)
(3)
|
Number of lease agreements not renewed
|
Lease agreements not renewed Annual rental price (In million of
ARS)
(4)
|
|
Bouchard 710
(6)
|
-
|
-
|
-
|
-
|
1
|
14
|
|
Bankboston Tower
(7)
|
2
|
34
|
1,891
|
1,933
|
-
|
-
|
|
Republica
Building
|
3
|
133
|
1,703
|
1,777
|
2
|
25
|
|
DOT
Building
|
1
|
17
|
882
|
851
|
-
|
-
|
|
Philips
Building
|
3
|
35
|
896
|
-
|
-
|
-
|
|
Suipacha
664
|
1
|
25
|
1,046
|
1,046
|
-
|
-
|
|
Total Offices
|
10
|
244
|
1,369
|
1,206
|
3
|
39
|
(1)
Includes new and
renewed lease agreements executed in FY 2019.
(2)
Lease agreements in
U.S. dollars converted to Pesos at the exchange rate prevailing in
the first effective month of the agreement, multiplied by 12
months.
(3)
Monthly
value.
(4)
Lease agreements in
U.S. dollars converted to Pesos at the exchange rate prevailing in
the last effective month of the agreement, multiplied by 12
months.
(5)
It does not include
lease agreements over parking spaces, antennas or terrace
area.
(6)
On July 30, 2020,
our subsidiary IRSA CP sold the entire building. For more
information see: “Recent Developments – Bouchard 710
Building sale”
(7)
On July 15, 2020, our subsidiary IRSA CP sold one floor and five
parking spaces, on August 26, 2020, our subsidiary IRSA CP sold
five floors and twenty five parking spaces, on November 5, 2020, it
sold four floor and fifteen parking spaces
and on November 12,
2020, it sold three floors and fifteen parking spaces
. For
more information, see “Recent Developments – Boston
Tower Floor’s sale - Signature of a Purchase ticket regarding
Boston Tower floor with possession”.
The
following table sets forth the schedule of estimated lease
expirations for IRSA’s offices and other properties for
leases in effect as of June 30, 2020. This data is presented
assuming that none of our tenants exercises its option to renew or
terminate its lease prior to expiration (most leases have renewal
clauses):
|
Expiration
year
|
Number
ofleases dueto expire
(1)
|
Square
meters ofleases due toexpire (sqm)
(3)
|
Square
meter ofleases due toexpire(%)
|
Annual
rentalincome amountof leases due toexpire(in million
ofARS)
(2)
|
Annual
rentalincome amountof leases toexpire(%)
|
|
As of June 30,
2020
|
4
|
9,454
|
9
|
57
|
3
|
|
As of June 30,
2021
|
22
|
24,983
|
25
|
679
|
33
|
|
As of June 30, 2022
and thereafter
|
33
|
65,149
|
65
|
1,345
|
65
|
|
Total
|
59
|
99,586
|
100
|
2,081
|
100
|
(1)
Includes offices
with leases that have not been renewed as of June 30,
2020.
(2)
It does not include
square meters used by IRSA CP.
(3)
It does not include
square meters or revenues from parking spaces.
Hotels
According
to the Hotel Vacancy Survey (EOH) prepared by INDEC, at June 2020,
overnight stays at hotel and parahotel establishments were
estimated at 0.54 million, 98.2% shorter than the same month the
previous year. Overnight stays by resident and nonresident
travelers decreased by 97.9% and 99.2%, respectively. Total
travelers who stayed at hotels during June were 0.54 million, a
98.2% decrease compared to the same month the previous year. The
number of resident and nonresident travelers decreased by 97.9% and
99.2%, respectively. The Room Occupancy Rate in june was 89.0%,
showing a sharp decrease compared to the same month the previous
year. Moreover, the Bed Occupancy Rate for the same period was
98.2%, which represents a sharp decrease compared to June
2019.
Hotels
segment has also been affected by the social, preventive, and
mandatory isolation decreed by the Argentine government as of March
20, 2020, together with the closure of borders and the arrival of
tourism. The Libertador hotel in the city of Buenos Aires and Llao
Llao hotal in the province of Río Negro have been temporarily
closed since that date and there is no certainty about their
reopening and the reactivation of the sector; in turn, the
Intercontinental Hotel in the City of Buenos Aires is working only
under a contingency and emergency plan.
137
At the
moment, there are no certainties about the opening of the social,
preventive and mandatory isolation that motivates the reactivation
of the sector. The perspectives of slow normalization and reopening
place us at the end of the year or the beginning of next
year.
Future
confirmations on the relaxation of social isolation, the opening of
airports for national and international flights, land borders and
normal interprovincial traffic will contribute to the slow
normalization. With the reopening, an initial occupancy is
expected, oscillating between 5% and 15%, growing
gradually.
The
crisis in the sector has motivated palliative measures by national
and provincial authorities, necessary measures that partially
contribute to sustainability. In a complementary way, the
management of each one of the hotels makes its best efforts to
adapt operationally to the context.
During
fiscal year 2020, we kept our 76.34% interest in Intercontinental
hotel, 100% interest in Libertador hotel and 50.00% interest in
Llao Llao.
The
following chart shows certain information regarding IRSA’s
luxury hotels:
|
Hotels
|
Date of Acquisition
|
IRSA’s Interest
|
Number of rooms
|
Occupancy (%)
(1)
|
Average Price per Room ARS
(2)
|
Fiscal
Year Sales as of June 30
(in
millions of ARS)
|
||
|
|
|
|
|
|
|
2020
|
2019
|
2018
|
|
Intercontinental
(3)
|
11/01/1997
|
76.34
%
|
313
|
53.1
|
7,925
|
721
|
1,049
|
549
|
|
Libertador
(4)
|
03/01/1998
|
100
%
|
200
|
37.2
|
5,921
|
252
|
591
|
324
|
|
Llao Llao
(5)
|
06/01/1997
|
50.00
%
|
205
|
43.3
|
19,072
|
1,049
|
1,313
|
699
|
|
Total
|
|
|
718
|
45.9
|
10,254
|
2,022
|
2,953
|
1,572
|
(1)
Accumulated average
in the twelve-month period.
(2)
Accumulated average
in the twelve-month period.
(3)
Through Nuevas
Fronteras S.A.
(4)
Through Hoteles
Argentinos S.A.U.
(5)
Through Llao Llao
Resorts S.A.
Hotel Llao Llao, San Carlos de Bariloche, Province of Rio
Negro
In June
1997 IRSA acquired the Hotel Llao Llao from Llao Llao Holding S.A.
Fifty percent is currently owned by the Sutton Group. The Hotel
Llao Llao is located on the Llao Llao peninsula, 25 kilometers from
the City of San Carlos de Bariloche, and it is one of the most
important tourist hotels in Argentina. Surrounded by mountains and
lakes, this hotel was designed and built by the famous architect
Bustillo in a traditional alpine style and first opened in 1938.
The hotel was renovated between 1990 and 1993 and has a total
constructed surface area of 15,000 sqm and 158 original rooms. The
hotel-resort also includes an 18-hole golf course, tennis courts,
fitness facility, spa, game room and swimming pool. The hotel is a
member of The Leading Hotels of the World, Ltd., a prestigious
luxury hospitality organization representing 430 of the
world’s finest hotels, resorts and spas. The Hotel Llao Llao
is currently being managed by Compañía de Servicios
Hoteleros S.A., operator, among others, of the Alvear Palace Hotel,
a luxury hotel located in the Recoleta neighborhood of Buenos
Aires. During 2007, the hotel was subject to an expansion and the
number of suites in the hotel rose to 205 rooms.
Hotel Intercontinental, City of Buenos Aires
In
November 1997, IRSA acquired 76.34% of the Hotel Intercontinental.
The Hotel Intercontinental is located in the downtown City of
Buenos Aires neighborhood of Montserrat, near the Intercontinental
Plaza office building. Intercontinental Hotels Corporation, a
United States corporation, currently owns 23.66% of the Hotel
Intercontinental. The hotel’s meeting facilities include
eight meeting rooms, a convention center and a divisible 588 sqm
ballroom. Other amenities include a restaurant, a business center,
a sauna and a fitness facility with swimming pool. The hotel was
completed in December 1994 and has 313 rooms.
Hotel Libertador, City of Buenos
Aires
In
March 1998 IRSA acquired 100% of the Sheraton Libertador Hotel from
Citicorp Equity Investment for an aggregate purchase price of USD23
million. In March 1999, we sold a 20% interest in the Sheraton
Libertador Hotel for USD4.7 million to Hoteles Sheraton de
Argentina.
During
the fiscal year 2019, we acquired 20% of the shares of Hoteles
Argentinos S.A.U. (“HASAU”), reaching 100% of the
capital stock of HASAU and beginning to operate the hotel directly
under the name “Libertador”. The hotel is located in
downtown Buenos Aires. The hotel contains 193 rooms and 7 suites,
eight meeting rooms, a restaurant, a business center, a spa and
fitness facilities with a swimming pool.
138
Bariloche Plot, “El Rancho,” San Carlos de Bariloche,
Province of Río Negro
On
December 14, 2006, through our hotel operator subsidiary, Llao Llao
Resorts S.A., IRSA acquired a land covering 129,533 sqm of surface
area in the City of San Carlos de Bariloche in the Province of
Río Negro. The total price of the transaction was USD 7
million, of which USD 4.2 million were paid in cash and the balance
of USD 2.8 million was financed by means of a mortgage to be paid
in 36 monthly, equal and consecutive installments of USD 0.086
million each. The land is in the border of the Lago Gutiérrez,
close to the Llao Llao Hotel in an outstanding natural environment
and it has a large cottage covering 1,000 sqm of surface area
designed by the architect Ezequiel Bustillo.
Sale and Development of Properties and Land Reserves
Residential Development Properties
The
acquisition and development of residential apartment complexes and
residential communities for sale is one of our core activities. Our
development of residential apartment complexes consists of the new
construction of high-rise towers or the conversion and renovation
of existing structures such as factories or warehouses. In
connection with our development of residential communities, we
frequently acquire vacant land, develop infrastructure such as
roads, utilities and common areas, and sell plots of land for
construction of single-family homes. We may also develop or sell
portions of land for others to develop complementary facilities
such as shopping areas within residential
developments.
In
fiscal year ended June 30, 2020, revenues from the development and
sale of properties from the Operations Center in Argentina segment
amounted to ARS 783 million, compared to ARS 210 million posted in
the fiscal year ended June 30, 2019.
Construction
and renovation works on our residential development properties are
performed, under our supervision, by independent Argentine
construction companies that are selected through a bidding process.
We enter into turnkey contracts with the selected company for the
construction of residential development properties pursuant to
which the selected company agrees to build and deliver the
development for a fixed price and at a fixed date. We are generally
not responsible for any additional costs based upon the turnkey
contract. All other aspects of the construction, including
architectural design, are performed by third parties.
Another
modality for the development of residential undertakings is the
exchange of land for constructed square meters. In this way, we
deliver undeveloped pieces of land and another firm is in charge of
building the project. In this case, we receive finished square
meters for commercialization, without taking part in the
construction works.
139
The
following table shows information about IRSA, through its
subsidiary IRSACP’s land reserves as of June 30,
2020:
|
|
Ownership
Interest (%)
|
Date
of acquisition
|
Land
Surface (sqm)
|
Buildable
surface (sqm)
|
GLA
(sqm)
|
Salable
Surface (sqm)
|
Book
Value (in millions of ARS)
|
|
|
|
|
|
|
|
|
|
|
RESIDENTIAL
- BARTER AGREEMENTS
|
|
|
|
|
|
|
|
|
CONIL - Güemes
836 – Mz. 99 & Güemes 902 – Mz. 95 &
Commercial stores - Buenos Aires
(6)
|
100
|
Jul-96
|
—
|
—
|
—
|
1,461
|
65
|
|
Total
Intangibles (Residential)
|
|
|
—
|
—
|
—
|
1,461
|
65
|
|
|
|
|
|
|
|
|
|
|
LAND
RESERVES:
|
|
|
|
|
|
|
|
|
Catalinas - City of
Buenos Aires
(4)(5)
|
100
|
May-10
|
3,648
|
58,100
|
28,051
|
—
|
—
|
|
Subtotal
offices
|
|
|
3,648
|
58,100
|
28,051
|
—
|
—
|
|
Total
under Development
|
|
|
3,648
|
58,100
|
28,051
|
—
|
—
|
|
UOM Luján -
Buenos Aires
|
100
|
May-08
|
1,160,000
|
464,000
|
—
|
—
|
960
|
|
San Martin Plot (Ex
Nobleza Piccardo) - Buenos Aires
|
50
|
May-11
|
159,996
|
500,000
|
—
|
—
|
2,750
|
|
La Plata - Greater
Buenos Aires
|
100
|
Mar-18
|
78,614
|
116,552
|
—
|
—
|
936
|
|
Caballito
plot - City of Buenos Aires
|
100
|
Jan-99
|
23,791
|
86,387
|
10,518
|
75,869
|
3,153
|
|
Subtotal
Mixed-uses
|
|
|
1,422,401
|
1,166,940
|
10,518
|
75,869
|
7,799
|
|
Coto Abasto air
space - City of Buenos Aires
(2)
|
100
|
Sep-97
|
—
|
21,536
|
—
|
16,385
|
34
|
|
Córdoba
Shopping Adjoining plots - Córdoba
(2)
|
100
|
Jun-15
|
8,000
|
13,500
|
—
|
2,160
|
33
|
|
Neuquén -
Residential plot - Neuquén
(2)
|
100
|
Jun-99
|
13,000
|
18,000
|
—
|
18,000
|
80
|
|
Subtotal
residential
|
|
|
21,000
|
53,036
|
—
|
36,545
|
147
|
|
Polo Dot com
mercial expansion – City of Buenos
Aires
|
80
|
Nov-06
|
—
|
—
|
15,940
|
—
|
1,367
|
|
Paraná plot -
Entre Ríos
(3)
|
100
|
Aug-10
|
10,022
|
5,000
|
5,000
|
—
|
—
|
|
Subtotal
retail
|
|
|
10,022
|
5,000
|
20,940
|
—
|
1,367
|
|
Polo Dot - Offices
2 & 3 - City of Buenos Aires
|
80
|
Nov-06
|
12,800
|
—
|
38,400
|
—
|
2,627
|
|
Intercontinental
Plaza II - City of Buenos Aires
|
100
|
Feb-98
|
6,135
|
—
|
19,598
|
—
|
1,075
|
|
Córdoba
Shopping adjoining plots - Córdoba
(2)
|
100
|
Jun-15
|
2,800
|
5,000
|
5,000
|
—
|
25
|
|
Subtotal
offices
|
|
|
21,735
|
5,000
|
62,998
|
—
|
3,727
|
|
Total
future developments
|
|
|
1,475,158
|
1,229,976
|
94,456
|
112,414
|
13,040
|
|
Other
land reserves
(1)
|
|
|
1,899
|
—
|
7,297
|
262
|
1,363
|
|
Total
land reserves
|
|
|
1,477,057
|
1,229,976
|
101,753
|
112,676
|
14,403
|
(1)
Includes Zelaya
3102-3103, Chanta IV, Anchorena 665, Condominios del Alto II,
Ocampo parking spaces, DOT adjoining plot and Mendoza shopping
adjoining plot.
(2)
These land reserves
are classified as Trading Properties, therefore, their value is
maintained at historical cost. The rest of the land reserves are
classified as Investment Property, valued at market
value.
(3)
Sign of the deeds
pending subject to certain conditions.
(4)
The sale agreements
for 86.93% of the property under development have been signed
between IRSA and IRSA CP and the remaining units have been sold to
Globant, also through an agreement. The deed of sale with both
entities has not yet been signed. The aforementioned fair value
corresponds only to the land.
(5)
On June 10, 2020,
IRSA CP informed with an unrelated third party the assignment and
transfer of the right to deed with delivery of possession of two
floors of medium height of the tower under construction "200 Della
Paolera" located in the Catalinas district of the Autonomous City
of Buenos Aires for a total area of approximately 2,430 m2 and 16
parking units located in the building.
(6)
Classified as
Intangible Assets, therefore, their value is kept at historical
cost.
140
The
following table shows information about IRSA, through its
subsidiary IRSACP’s expansions on its current assets as of
June 30, 2020:
|
Expansions
|
Ownership
interest
|
Surface
|
Locations
|
|
|
(%)
|
(sqm)
|
|
|
Alto
Palermo Adjoining Plot
|
100
|
3,900
|
City of Buenos
Aires
|
|
Subtotal
current expansions
|
|
3,900
|
|
|
Other future
expansions
(1)
|
|
98,055
|
|
|
Subtotal
future expansions
|
|
98,055
|
|
|
Total
Shopping Malls
|
|
101,955
|
|
|
Patio Bullrich -
Offices / Hotel
|
100
|
10,000
|
City of Buenos
Aires
|
|
Philips
Building
|
100
|
20,000
|
City of Buenos
Aires
|
|
Subtotal
future expansions
|
|
30,000
|
|
|
Total
offices
|
|
30,000
|
|
|
|
|
|
|
|
Total
expansions
|
|
131,955
|
|
The
following chart shows information about IRSA’s land reserves
as of June 30, 2020:
|
|
IRSA's Interest
|
Date of acquisition
|
Land surface (sqm)
|
Buildable surface (sqm)
|
Saleable surface (sqm)
|
Book Value (ARS millions)
|
|
|
|
|
|
|
|
|
|
LAND RESERVES
|
|
|
|
|
|
|
|
La Adela - Buenos Aires
(3)
|
100
%
|
8/1/2014
|
9,868,500
|
3,951,227
|
-
|
1,367
|
|
Puerto Retiro - BA City
(1)
|
50
%
|
5/18/1997
|
82,051
|
246,153
|
-
|
-
|
|
Solares Santa María - BA
City
(3)
|
100
%
|
7/10/1997
|
716,058
|
716,058
|
-
|
19,977
|
|
Subtotal Mixed-uses
|
|
|
10,666,609
|
4,913,438
|
-
|
21,344
|
|
Caballito Block 35 -BA City
(4)
|
100
%
|
10/22/1998
|
9,879
|
57,192
|
30,064
|
394
|
|
Zetol – Uruguay
(4)
|
90
%
|
6/1/2009
|
-
|
-
|
64,080
|
310
|
|
Vista al Muelle – Uruguay
(4)
|
90
%
|
6/1/2009
|
-
|
-
|
60,360
|
266
|
|
Subtotal Residential
|
|
|
9,879
|
57,192
|
154,504
|
970
|
|
Total Future Developments
|
|
|
10,676,488
|
4,970,630
|
154,504
|
22,314
|
|
Another Land Reserves
(2)(3)(4)
|
|
|
5,249,941
|
-
|
4,713
|
454
|
|
Total Land Reserves
|
|
|
15,926,429
|
4,970,630
|
159,217
|
22,768
|
|
|
|
|
|
|
|
|
(1)
This landplot is
under judicial litigation and it is fully allowanced.
(2)
Includes Pilar R8
Km 53, Pontevedra, Mariano Acosta, Merlo and San Luis plot, and
Llao Llao plot.
(3)
These properties
(La Adela, Solares Santa María, Pilar R.8 Km 53, Pontevedra,
Mariano Acosta, Merlo and San Luis) are valuated as Fair
Value.
(4)
These properties
(Caballito Block 35, Zetol, Vista al Muelle and Llao Llao plot) are
valuated as Cost adjusted for inflation.
Residential Properties (available for sale)
In the
residential market, we acquire undeveloped properties strategically
located in densely populated areas of the City of Buenos Aires,
particularly properties located near shopping malls and
hypermarkets or those to be constructed. IRSA then develops
multi-building high-rise complexes targeting the middle- and high-
income market. These are equipped with modern comforts and
services, such as open “green areas,” swimming pools,
sports and recreation facilities and 24-hour security.
Condominios del Alto II – City of Rosario, Province of Santa
Fe (IRSA CP)
The
Condominios del Alto II project will be composed of two opposite
building blocks, commercially divided into 10 sub-blocks. The
project consists of a total of 189 apartments distributed in 6
stories and 195 parking spaces located in two basements. The
amenities include a swimming pool with solarium, a multiple use
room, sauna, a gym with dressrooms and a laundry. As of the date of
this Annual Report the works in parcel H have been completed and
all the units subject to the barter have been received, with six
parking spaces available for sale.
141
Horizons, Vicente López, Olivos, Province of Buenos
Aires.
The
IRSA-CYRELA Project, developed over two adjacent blocks, was
launched in March 2008 under the name Horizons. Horizons is one of
the most significant developments in Greater Buenos Aires,
featuring a new concept in residential complexes given its emphasis
on the use of common spaces. This project includes two complexes
with a total of six buildings: one complex faces the river and
consists of three 14-floor buildings, the “Río”
complex, and the other one, facing Libertador Avenue, consists of
three 17-floor buildings, it is known as the “Parque”
complex, thus totaling 59,000 square meters built of saleable area
distributed in 467 units (excluding the units to be delivered as
consideration for the purchase of the lands). Horizons is a unique
and style-innovating residential complex offering 32 amenities,
including a meeting room, work zone, heated swimming pools, mansion
with spa, sauna, gym, children room, teen room, thematically
landscaped areas, and aerobic trail. The showroom was opened to the
public in March 2008 with great success. As of June 30, 2020, all
the units were sold and the stock available for sale consisted of 1
parking space and 19 storage spaces.
Pereiraola (Greenville), Hudson – Province of Buenos
Aires
In
April de 2010 IRSA sold Pereiraola S.A., a company owner of certain
lands adjacent to Abril Club de Campo that comprised 130 hectares,
for USD11.7 million. The purchaser would develop a project that
includes the fractioning into lots, a condo-hotel, two polo fields,
and apartment buildings. The delivery to the Company of 39,634
square meters of lots amounting to approximately USD3 million was
included in the sale price. As of June 30, 2020, 10 lots had been
transferred and 46 remain to be traded.
Intangibles – Units to be received under barter
agreements
Conil – Avellaneda, Province of Buenos Aires (IRSA
CP)
These
plots of land IRSA owns, through IRSA CP, face Alto Avellaneda
shopping mall, totaling 2,398 square meters distributed in two
opposite corners and, according to urban planning standards, around
6,000 square meters may be built. Its intended use, either through
our own development or sale to a third party, is residential with
the possibility of a retail space as well. In November 2014, a
barter deed was executed to carry out a residential development, in
consideration of which IRSA CP will receive 1,389 square meters of
retail stores located on the ground floors of blocks 99 and 95 at
Güemes 836 and Güemes 902, respectively. The barter was
valued at USD0.7 million. Considerations for block 95 and 99 were
estipulated to be delivered in January 2018 and September 2018,
respectively. In June 2018 an extension to the barter agreement was
signed. In consideration for the delay and as compensation, IRSA CP
will receive an additional apartment (55.5 square meters) and one
parking lot (14 square meters).
Zetol S.A. and Vista al Muelle S.A. – District of Canelones
– Uruguay
In the
course of fiscal year 2009 we acquired a 100% ownership interest in
Liveck S.A., a company organized under the laws of Uruguay. In June
2009, Liveck had acquired a 90% stake in the capital stock of Vista
al Muelle S.A. and Zetol S.A., two companies incorporated under the
laws of Uruguay, for USD 7.8 million. The remaining 10% ownership
interest in both companies is in the hands of Banzey S.A. These
companies have undeveloped lands in Canelones, Uruguay, close to
the capital city of Uruguay, Montevideo.
We
intend to develop in these 13 plots, with a construction capacity
of 182,000 sqm, an urban project that consists of the development
and comercialization of 1,860 apartments. Such project has the
“urban feasibility” status for the construction of
approximately 200,000 sqm for a term of 10 years, which was granted
by the Mayor’s Office of the Canelones department and by its
Local Legislature. Zetol S.A. and Vista al Muelle S.A. agreed to
carry out the infrastructure works for USD 8 million as well as
minimum amount of sqm of properties. The satisfaction of this
commitment under the terms and conditions agreed upon will grant an
additional 10-year effective term to the urban feasibility
status.
The
total purchase price for Zetol S.A. was USD 7 million; of which USD
2 million were paid. Sellers may opt to receive the balance in cash
or through the delivery of units in the buildings to be constructed
in the land owned by Zetol S.A. equivalent to 12% of the total
marketable meters to be constructed.
142
Besides,
Vista al Muelle S.A. owned since September 2008 a plot of land
purchased for USD 0.83 million. Then, in February 2010, plots of
land were acquired for USD 1 million. In December 2010, Vista al
Muelle S.A. executed the title deed of other plots for a total
amount of USD 2.66 million, of which USD 0.3 million were paid. The
balance will be repaid by delivering 2,334 sqm of units and/or
retail stores to be constructed or in cash.
On June
30, 2009, the Company sold a 50% stake in Liveck S.A. to Cyrela
Brazil Realty S.A. for USD1.3 million. On December 17, 2010,
together with Cyrela Brazil Realty S.A. we executed a stock
purchase agreement pursuant to which we repurchased from Cyrela
Brazil Realty S.A. a 50% shareholding in Liveck S.A. for USD 2.7
million. Accordingly, as of June 30, 2016, our stake, through
Tyrus, in Liveck is 100%.
As a
result of the plot barter agreements executed in due time between
the IMC, Zetol S.A. and Vista al Muelle S.A. in March 2014, the
parcel redistribution dealing was concluded. This milestone, as set
forth in the amendment to the Master Agreement executed in 2013,
initiates the 10-year term for the investment in infrastructure and
construction of the buildings mentioned above. Construction
capacity of the 13 plots is 182,000 sqm.
On
November 15, 2018, the translation deed of sale of the first plot
where the first Tower of Departments, Villas and single and double
parking spaces is currently being built has been signed, the total
exchange price was USD 7,298,705 equivalent to 16% of all of the
marketable built meters in the first Tower. 12% of it has been used
to cancel part of the price balance maintained to date with the
sellers of the plots acquired by Zetol S.A in June 2009. The
estimated delivery date of the units is January 2022.
Canteras Natal Crespo, La Calera – Province of
Córdoba
On June
26, 2013, IRSA sold 100% of our interest in Canteras Natal Crespo
S.A. representing 50% of its capital stock, to Euromayor S.A. de
Inversiones for USD 4,215,000 according to the following payment
schedule: USD 3,815,000 in cash and USD 400,000 through the
transfer of almost 40,000 sqm for business purposes within the
project to be developed in the site known as Laguna Azul. Delivery
of the non-monetary consideration, which consist in 30,000 sqm, is
pending. In December 2019, an agreement was reached with the
counterpart that allowed the resale of the non-monetary
consideration to an unrelated third party for a total value of USD
450,000.
Projects under Development
Alto Palermo Expansion (IRSA CP)
IRSA,
through its subsidiary IRSA CP keeps working on the expansion of
Alto Palermo shopping mall, the shopping mall with the highest
sales per square meter in our portfolio, that will add a gross
leasable area of approximately 3,900 square meters and will consist
in moving the food court to a third level by using the area of an
adjacent building acquired in 2015. Work progress as of June 30
2020 was 64% and construction works are expected to be finished by
June 2021.
200 Della Paolera - Catalinas building (IRSA CP)
The
building under construction will have 35,000 sqm of GLA consisting
of 30 office floors and 316 parking spaces and will be located in
the “Catalinas” area in the City of Buenos Aires, one
of the most sought-after spots for Premium office development in
Argentina. The Company owns 30,832 square meters consisting of 26
floors and 272 parking spaces in the building. As of June 30, 2020,
work progress was 95%.
Mixed uses
Ex UOM – Luján, Province of Buenos Aires (IRSA
CP)
This
116-hectare plot of land is located in the 62 Km of the West
Highway, in the intersection with Route 5 and was originally
purchased by IRSA from Birafriends S.A. for USD 3 million on May
31, 2008. In May 2012, the Company acquired the property through a
purchase and sale agreement entered into between related parties,
thus becoming the current owner. Our intention is to carry out a
mixed-use project, taking advantage of the environment
consolidation and the strategic location of the plot. At present,
dealings are being carried out so as to change the zoning
parameters, thus enabling the consummation of the
project.
143
Ex Nobleza Piccardo Plant – San Martín, Province of
Buenos Aires (IRSA CP)
This
plot of land is owned by Quality Invest. On May 31, 2011, Quality
Invest S.A. and Nobleza Picardo S.A.I.C. y F. (Nobleza) executed
the title deed for the purchase of a plot of land extending over
160,000 square meters located in the District of San Martín,
Province of Buenos Aires, currently intended for industrial
purposes and suitable in terms of characteristics and scales for
mixed-use developments.
The
Master Plan, by which it is projected to develop a large-scale
integral urbanization (residential, commercial, etc.), which
includes the construction of approximately 540,000 m2, was endorsed
by the Municipality of San Martin through Decree 1589/19 and
registered before the General Directorate of Urbanism and
Directorate of Urban Planning of the Municipality. Likewise, the
subdivision plan in accordance with the urban indicators was
presented to the Directorate of Cadastre of the Province of Bs.
As.
Additionally,
during this fiscal year, the pre-feasibility requirements began to
be processed with public bodies. The one corresponding to the
Hydraulic Directorate of the Province is in the process of
approval, and in the next fiscal year, we will begin the rest of
the presentations before the service companies, to obtain the
pre-feasibilities of electric power, gas, water and overturning. of
effluents.
Córdoba Shopping Mall Project (IRSA CP)
The
Company owns a few plots adjacent to Córdoba Shopping Mall
with a construction capacity of approximately 17,300 square meters
in the center of the City of Córdoba.
In May
2016, a preliminary barter agreement was signed for 13,500 square
meters out of the total construction capacity, subject to certain
conditions, for a term of one year, at the end of which the deed
will be signed. It will be a mixed residential and office project
and, as part of the consideration, the Company will receive 2,160
square meters in apartments, parking spaces, shopping space,
plus IRSA CP will assume the management of permits, unifications
and subdivisions in 3 plots. The consideration will be delivered by
May 2022 for Torre I and by July 2024 for Torre II. The value of
the barter was USD 4 million.
La Plata Plot of land (IRSA CP)
On
March 22, 2018 the Company has acquired, directly and indirectly,
100% of a plot of land of 78,614 square meters located in the city
of La Plata, Province of Buenos Aires. The price of the transaction
was USD7.5 million, which have been fully paid.
The
price of the operation was set at the amount of USD 7,5 million
which have been fully paid. The purpose of this acquisition is the
future development of a mixed-use project, given that the property
has characteristics for a commercial development in a high
potential district.
On
January 21, 2019, Ordinance No. 11767, approved by the Honorable
Deliberative Council of La Plata on December 26, 2018, has been
promulgated. With said promulgation, the uses and indicators
requested to develop a project of 116,553 sqm are formally
confirmed by said Ordinance.
On
September 24, 2020, the agreement that validates Ordinance No.
11767 was signed between the Mayor Dr. Julio Garro and the Director
of the Real Estate Business, Dr. Daniel Elsztain, where the uses
within the property are fixed, they may be: Shopping and
entertainment center, Offices, Hotels, Housing, Medical Assistance
Center and any other use authorized by the Planning Code of the
City of La Plata.
The
Master plan was consolidated with 16 lots, which are already in
process to obtain the corresponding subdivision, by Geodesia in the
Province of Buenos Aires.
Caballito Plot – City of Buenos Aires
On
December 23, 2019, the Company transferred Parcel 1 of the land
reserve located at Av. Avellaneda and Olegario Andrade 367 in the
Caballito neighborhood of the City of Buenos Aires to an unrelated
third party.
Plot 1
has an estimated surface of 3,221 sqm where a 10 floors residential
building will be developed for a total area of 11,400 sqm, together
with a commercial ground floor of 1,216 sqm and a basement of 138
parking spaces (“Building 1”).
The
amount of the operation was set at USD 5.5 million to be paid in
future functional units of Building 1, which represent the
equivalent of 23.53% of the owned square meters, with a minimum
guaranteed of 2,735 sqm composed for 1,215.62 commercial sqm,
1,519.68 residential sqm and a certain number of parking spaces
that represent 22.50% of the own sqm with that destination and
never less than 31 units.
The
consideration is guaranteed by a mortgage on Plot 1 and Building 1
and the buyer has an Option to acquire Plot 2 of the same property
until August 31, 2020 and Plots 3 and 4 until March 31, 2021,
subject to certain suspensive conditions.
144
On July
20, 2020, IRSA CP was notified of the filing of a protection action
(amparo) that is processed before the Administrative and Tax
Litigation Jurisdiction of the City of Buenos Aires, where the
plaintiff has requested the nullity of: 1) Administrative act that
grants the certificate of environmental aptitude and 2)
Administrative act that registered the plans. On October 1, 2020,
the Chamber confirmed the precautionary measure. The Government of
the City of Buenos Aires appealed the measure by filing an Appeal
of Unconstitutionality. For more information, see “ITEM 8.
Financial Information—A. Consolidated Statements and Other
Financial Information—Legal or Arbitration
Proceedings—Caballito.”
La Adela – Buenos Aires
During
2015 the company acquired the “La Adela” land reserve
with an area of approximately 1,058 hectares, located in the
District of Luján, Province of Buenos Aires, that was
previously owned by Cresud for a total amount of ARS 210 million.
Given its degree of development and closeness to the City of Buenos
Aires, we intend to develop a new real estate project.
Puerto Retiro – City of Buenos Aires
At
present, this 8.3 hectare plot of land, which is located in one of
the most privileged areas of the city, near Catalinas, Puerto
Madero and Retiro and is the only privately owned waterfront
property facing directly to Río de la Plata, is affected by a
zoning regulation defined as
U.P.
which prevents the property from
being used for any purposes other than strictly port
activities.
During
fiscal year 1998, the Company initiated negotiations with the
authorities of the Government of the City of Buenos Aires in order
to obtain a rezoning permit for the property, allowing a change in
the use of the property and setting forth new regulations for its
development.
In
turn, Tandanor filed a civil action against Puerto Retiro S.A. and
the other defendants in the criminal case for violation of Section
174 (5) based on Section 173 (7) of the Criminal Code. Such action
seeks -on the basis of the nullity of the decree that approved the
bidding process involving the Dársena Norte property- the
restitution of the property and a reimbursement in favor of
Tandanor for all such amounts it has allegedly lost as a result of
a suspected fraudulent transaction involving the sale of the
property. Puerto Retiro has presented the allegation on the merit
of the evidence, highlighting that the current shareholders of
Puerto Retiro did not participate in any of the suspected acts in
the criminal case since they acquired the shares for consideration
and in good faith several years after the facts told in the
process. Likewise, it was emphasized that the company Puerto Retiro
is foreign - beyond its founders - to the bidding / privatization
carried out for the sale of Tandanor shares. The pronouncement of
the sentence is pending.
On
September 7, 2018, the Oral Federal Criminal Court No. 5 rendered a
decision. According to the sentence read by the President of the
Court, Puerto Retiro won the preliminary objection of limitation
filed in the civil action. However, in the criminal case, where
Puerto Retiro is not a party, it was ordered, among other issues,
the confiscation (
decomiso
)
of the property owned by Puerto Retiro known as Planta I. The
grounds of the Court`s judgement will be read on November 30, 2018.
From that moment, all the parties might file the
appeals.
On
December 27, 2018, an action for annulment was filed against the
judgment that ordered the confiscation of the property named
“Planta 1”. On March 1, 2019 we were notified of the
"in limine" rejection of the action for annulment filed.
Subsequently, on March 8, 2019, a motion for restitution was filed
against said resolution. On March 19, 2019, we were notified of the
Court's decision that rejected the replacement and declared the
appeal filed in a subsidiary inadmissible. On March 22, 2019, a
complaint was filed for appeal denied (before the Federal Criminal
Cassation Chamber), the caul was granted, which is why the appeal
filed is currently pending. In that sense, in April the appeal was
maintained and subsequently, its foundations were
expanded.
On 21
February 2020, an electronic document was received from the Federal
Court of Criminal notifying the decision rejecting the appeals
brought by Puerto Retiro against the verdict of the Federal Oral
Court 5 that provided for the confiscation of the property Plant I
and the distribution of costs in the order caused as regards the
exception for the limitation of civil action brought by Puerto
Retiro to which the Oral Court took place. Against that decision of
appeal, Puerto Retiro was brought in a timely and form of Federal
Extraordinary Appeal. In addition, Federal Criminal Cassation
Chamber upheld the above limitation period by rejecting, to that
effect, the appeal brought by the National State and
Tandanor.
In the
face of the evolution of the legal cases affecting it and based on
the reports of its legal advisors, the Management of Puerto Retiro
has decided to record a impairment equivalent to 100% of the book
value of its investment property, without prejudice to the reversal
of the same in the event that a favorable judgment is obtained in
the actions brought.
145
Solares de Santa María – City of Buenos
Aires
Solares
de Santa María is a 70-hectare property facing the Río de
la Plata in the south of Puerto Madero, 10 minutes from downtown
Buenos Aires. We are owners of this property in which we intend to
develop an entrepreneurship for mixed purposes, i.e. our
development project involves residential complexes as well as
offices, stores, hotels, sports and sailing clubs, services areas
with schools, supermarkets and parking lots, and we would need to
obtain all the necessary permits and authorizations.
On
October 30, 2012 a new agreement was executed with the Government
of the City of Buenos Aires, replacing all prior agreements, and
such has been submitted to the Legislature for its consideration.
The agreement provided that if by February 28, 2014 the agreement
was not approved would become invalidated.
During
2016, a new Agreement was executed with the Executive Branch of the
City of Buenos Aires, including a new Bill of Law. The new Bill of
Law was submitted to the Legislative Branch of the City of Buenos
Aires for consideration and was approved by the relevant
commissions; yet, during legislative year 2018 it was reserved and
remained without legislative treatment. As a consequence, at the
end of the 2018 legislative session, the lackof treatment triggered
the automatically invalidity of the above mentioned and executed
Agreement with the Executive Branch of the City of Buenos Aires,
which include such Bill of Law.
As of
the date of this Annual Report, efforts are still being made both
in the CABA with the Goverment as well as in the CABA Legislature
in order that the project Law may be treated on the premises, for
its treatment and subsequent legislative approval.
Residential
Coto Residential Project (IRSA CP)
IRSA,
through its subsidiary IRSA CP
owns
the right to construct above the
premises of the Coto hypermarket that is close to Abasto Shopping
in the heart of the City of Buenos Aires which we acquired in
September 24, 1997. We estimate it has a construction capacity
of 23,000 square feet (it also includes the right to receive
certain parking units). The premises are located within the area
between Agüero, Lavalle, Guardia Vieja and Gallo streets, in
the Abasto neighborhood.
On October 25, 2019, IRSA CP transferred to a non-related third
party the rights to develop a residential building (“Tower
1”) on Coto Supermarket airspace located in Abasto
neighborhood in the City of Buenos Aires. Tower 1 will have 22
floors of 1 to 3 rooms apartments, totaling an area of 8,400
sqm.
The amount of the operation was set at USD 4.5 million: USD 1
million in cash and the balance in at least 35 apartment units,
which represent the equivalent of 24.20% of the owned square
meters, with a minimum guaranteed of 1,982 sqm.
In a 30 month-period since the signature, when certain conditions
have been met, IRSA CP must transfer to the same unrelated third
party the rights to build a second apartment building.
Neuquén Residential Plot– Neuquén, Province of
Neuquén (IRSA CP)
Through
Shopping Neuquén S.A., IRSA owns a plot of 13,000 square
meters with construction capacity of 18,000 square meters of
residential properties in an area with significant growth
potential. This area is located close to the shopping mall Alto
Comahue, the hypermarket currently in operation and a hotel to be
constructed.
146
Caballito Plot – City of Buenos
Aires
On June
29, 2011, IRSA and TGLT, a residential developer, entered into an
agreement to barter for the development of a plot of land located
at Méndez de Andes street in the neighborhood of Caballito in
the City of Buenos AiresA neighborhood association named
Asociación Civil y Vecinal
SOS Caballito
secured a preliminary injunction which
suspended the works to be carried out by TGLT in the abovementioned
property. On April 2018 TGLT and us terminated the barter agreement
and we recovered the land. In July 2018, the Supreme Court of
Justice issued a favorable final decision allowing the construction
of 57,192 sqm of apartments on the plot.
Offices
Polo Dot 2
nd
and 3
rd
Stages – City
of Buenos Aires (IRSA CP)
These
two parcels of 6,400 square meters with a construction capacity of
33,485 square meters each, are located adjoining to where the
extension of Dot Baires Shopping is planned. In April 2018, both
plots were unified into a single one of 12,800 square
meters.
Intercontinental Plaza II Plot - City of Buenos Aires (IRSA
CP)
In the
heart of the neighborhood of Monserrat, just a few meters from the
most trafficked avenue in the city and the financial center, is the
Intercontinental Plaza complex consisting of an office tower and
the exclusive Intercontinental Hotel. In the current plot of 6,135
square meters a second office tower of 19,600 square meters and 25
stories could be built to supplement the tower currently located in
the intersection of Moreno and Tacuarí streets.
Other Land Reserves
Other Land Reserves – Pilar, Pontevedra, Mariano Acosta,
Merlo, San Luis Plot, Llao Llao Plot and Casona Abril remaining
surface
We grouped here those plots of land with a significant surface area
the development of which is not feasible in the short term either
due to their current urban and zoning parameters, their legal
status or the lack of consolidation of their immediate environment.
This group totals around 7 million sqm.
Isla Sirgadero
On
September 3, 2015, the entire property of 10,083,270 sqm was sold
to several companies for USD3.9 million, payable in 16 quarterly
installments, plus an installment in kind, land resulting from the
final blueprint, equivalent to 10% of the surface area. Delivery of
the non-monetary consideration, consisting in 1,083,327 sqm, is
pending.
International
Lipstick Building, New York, United States
The
Lipstick Building is a landmark building in the City of New York,
located at Third Avenue and 53th Street in Midtown Manhattan, New
York. It was designed by architects John Burgee and Philip Johnson
(Glass House and Seagram Building, among other renowned works) and
it is named after its elliptical shape and red façade. Its
gross leaseable area is approximately 58,000 sqm and consists of 34
floors.
As of
June 30, 2020, the building’s occupancy rate was 95.6%, thus
generating an average rent of USD75.70 per sqm.
|
Lipstick
|
Jun-20
|
Jun-19
|
YoY Var
|
|
Gross
Leaseable Area (sqm)
|
58,092
|
58,092
|
-
|
|
Occupancy
|
95.6
%
|
95.9
%
|
-0.3
p.p.
|
|
Rental
price (USD/sqm)
|
78.7
|
75.8
|
3.8
%
|
During the fiscal year
ended
June 30, 2019, Metropolitan 885 Third Avenue Leasehold LLC
("Metropolitan"), which owns the building, did not exercise the
option to purchase a part of the land (Ground Lease) where the
Lipstick was built, and whose term expired on April 30,
2019.
Latham & Watkins occupies 40,035 sqm of the office and storage
space on a lease expiring on June 30, 2021. In April 2018, Latham
& Watkins communicated its intention of not be renewing its
lease. For more information see “Risk Factors – Risks
relating to our business in the United States.”
147
On March 4, 2019, Metropolitan, a subsidiary of New Lipstick, has
renegotiated its debt without recourse to IRSA and has been
reconfigured with a balance of USD 11 million, which was canceled
on February 12, 2020.
In June 2019, an “Escrow Agreement” was signed for the
sum of USD 5.1 million, through which an option was bought to
purchase the controlling position of one of the lands where the
Lipstick was built. This option expired on August 30, so the seller
collected such deposit from the escrow account.
On August 7, 2020, as a consequence of negotiations conducted in
the context of an increased lease price effective as of May 2020,
Metropolitan signed an agreement with the owner of the Ground Lease
to terminate the commercial relationship, leaving the
administration of the building. For this reason, as of June 30,
2020, Metropolitan no longer recognizes the liability associated
with the ground lease, as well as all the assets and liabilities
associated with the building and the operation of the
administration. For more information see “Recent Developments
– Lipstick Building”.
Investment in Condor Hospitality Trust
IRSA
maintains its investment in the Condor Hospitality Trust Hotel REIT
(NYSE: CDOR) mainly through our subsidiary Real Estate Investment
Group VII (“REIG VII”), in which we hold a 100%
interest. Condor is a REIT listed in NYSE focused on medium-class
hotels located in various states of the United States of America,
managed by various operators and franchises.
Condor's
investment strategy is to build a branded premium, select service
hotels portfolio within the top 100 Metropolitan Statistical Areas
("MSA") with a particular focus on the range of MSA 20 to 60. Since
the beginning of the reconversion of the hotel portfolio in 2015,
Condor has acquired 14 high quality select service hotels in its
target markets for a total purchase price of approximately USD277
million. In addition, during this time, it has sold 53 legacy
assets for a total value of approximately USD161
million.
On July
19, 2019, Condor signed an agreement and merger plan with a company
not related to the group. As agreed, each Condor ordinary share,
whose nominal value is USD 0.01 per share will be canceled before
the merger and will become the right to receive a cash amount
equivalent to USD 11.10 per ordinary share. Additionally, in
accordance with the terms and conditions of the merger agreement,
each Series E convertible share will be automatically canceled and
its holders will become entitled to receive a cash amount equal to
USD 10.00 per share. The closing of the acquisition, scheduled for
March 23, 2020, did not occur.
On
October 12, 2020, Condor executed an
agreement
with Nextponint Hospitality Trust
and some of its affiliates (“NHT Parties”)
to resolve and
settle any and all claims between them
related to the merger
agreement mentioned hereinabove.
According to the agreement with NHT Parties shall make three
payments to Condor in three instalments ending the last payment on
December 30, 2020
and
totalling
USD 7,0 million.
As of
the date of presentation of these financial statements, the Company
has 2,197,023 common shares and 325,752 Series E
shares.
Others
IRSA’s interest in Banco Hipotecario
As of
June 30, 2020, we held a 29.91% interest in Banco Hipotecario.
Established in 1886 by the argentine government and privatized in
1999, Banco Hipotecario has historically been Argentina’s
leading mortgage lender, provider of mortgage-related insurance and
mortgage loan services. All of its operations are located in
Argentina where it operates a nationwide network of 63 branches in
the 23 Argentine provinces and the City of Buenos Aires, and 12
additional sales offices throughout Argentina.
148
Banco
Hipotecario is an inclusive commercial bank that provides universal
banking services, offering a wide variety of banking products and
activities, including a wide range of individual and corporate
loans, deposits, credit and debit cards and related financial
services to individuals, small-and medium-sized companies and large
corporations. As of March 31, 2020, Banco Hipotecario ranked
thirteenth in the Argentine financial system in terms of totals
assets and twelfth in terms of loans. As of June 30, 2020, Banco
Hipotecario’s shareholders’ equity was ARS 14,285.0
million, its consolidated assets were ARS 121,203.6 million, and
its net income for the six-month period ended June 30, 2020 was ARS
119.7 million. Since 1999, Banco Hipotecario’s shares have
been listed on the Buenos Aires Stock Exchange in Argentina, and
since 2006 it has had a Level I ADR program.
Banco
Hipotecario continues its business strategy of diversifying its
loan portfolio. As a result, non-mortgage loans were ARS 36,153.3
million as of June 30, 2020. Total non-mortgage loans granted by
the bank to the non-financial private sector were ARS 36,145,9
million as of June 30, 2020.Non-performing loans represented 12.7%
of its total portfolio as of June 30, 2020..
In
recent years, Banco Hipotecario has diversified its funding base
and has become one of the most frequent issuers of corporate debt
in Argentina based on the percentage of its total funding, by
developing presence in the domestic and international capital
markets, and it has also increased its deposit base. Its financial
indebtedness as a percentage of its total funding was 37.8% as of
June 30, 2020.
Its
subsidiaries include BACS Banco de Crédito y
Securitización S.A., a bank specialized in investment banking,
asset securitization and asset management; BACS Administradora de
Activos S.A.S.G.F.C.I., a mutual investment fund management
company; BHN Sociedad de Inversión S.A., which controls BHN
Vida S.A., a life insurance company; and BHN Seguros Generales
S.A., a property insurance company.
By
virtue of communications "A" 6939 and "7035" of the BCRA, the
distribution of dividends is suspended until December 31,
2020.
Others Assets
La Rural (Exhibition and Convention Center)
LRSA
holds usufruct rights for the commercial operation of the
emblematic Predio Ferial de Palermo (Palermo exhibition center) in
the City of Buenos Aires. We own 35% of the equity of
LRSA.
In July
2016, we acquired from FEG Entretenimientos S.A. 25% of the shares
of EHSA, in which we already held 50% of the share. We also
acquired a 1.25% interest in ENUSA from Mr. Marcelo Figoli. The
aggregate acquisition price for such acquisitions was ARS 66.5
million. Immediately after this acquisition, we sold 5% of the
shares of EHSA to Mr. Diego Finkelstein, who already owned a 25%
equity interest. The sale amount was agreed at ARS 13.5 million. As
a result, we now hold 70% of the shares of EHSA and Mr. Diego
Finkelstein holds the remaining 30%.
EHSA
holds, directly and indirectly, 100% of the shares of OASA and 95%
of the shares of ENUSA. OASA holds 50% of the voting stock of LRSA
and SRA holds the remaining 50%. In addition, OASA manages LRSA
pursuant to agreements entered into with SRA that include the right
to appoint the chairman of the board of LRSA—with deciding
vote on certain key governance matters—and the chief
executive of LRSA. ENUSA is mainly engaged in organizing
entertainment events for trade fairs.
On
August 4, 2017, a 15-year concession for the Exhibition and
Convention Center of the City of Buenos Aires was executed by the
joint venture La Rural S.A., OFC S.R.L., Ogden Argentina S.A. and
Entretenimiento Universal S.A. - Union Transitoria, which was
granted pursuant a public bidding process. The members of the joint
venture hold the following interests: (a) LRSA 5%; (b) OFC SRL 20%;
(c) OASA 55%; and (d) EUSA 20%.
The
shareholders of LRSA are Sociedad Rural Argentina and OASA, each of
which owns 50% equity interest. OASA and EUSA are controlled by
EHSA. Consequently, we indirectly hold a 50.00% interest in the
joint venture.
The
Exhibition and Convention Center has a surface area of
approximately 22,800 sqm and may accommodate approximately 5,000
attendees. It has a main exhibit hall and an ancillary hall,
offices and meetings rooms, arranged in three underground levels
that were designed to blend into the landscape extending from the
School of Law of the University of Buenos Aires to Parque
Thays.
149
Also,
La Rural S.A. continues to work on the consolidation of the
commercial development of the “Convention Center of Punta del
Este”, through its equity participation in the company that
holds the concession until 2041.
As a
result of the measures adopted by Argentina’s national
Government in response to the COVID-19 pandemic, La Rural, the
Buenos Aires and Punta del Este Convention Centers have been closed
since March 20, 2020, the date on which social, preventive, and
mandatory isolation was decreed by the government of Argentina to
combat the impact of the COVID-19. All the planned congresses are
suspended, a large part of the fairs and conventions were
postponed, while the shows scheduled at the DirecTV Arena were
mostly canceled. The reopening date of these establishments is
uncertain, as well as the future agenda of fairs, conventions and
shows.
TGLT (real estate)
TGLT is a real estate company listed on the BYMA which is mainly
engaged in residential development projects in Argentina and
Uruguay. We hold a 30.2% interest in TGLT.
On August 1, 2017, we exercised our preemptive subscription and
accretion rights and purchased 22,225,000 Subordinated Notes
Convertible into Newly Issued Shares of TGLT for an aggregate
amount of USD22,225,000 (USD 1.00 par value) due 2027.
On August 8, 2019 has executed with TGLT certain contracts tending
to collaborate in the process of financial restructuring of said
company through its recapitalization. On December 11, 2019, and in
compliance with the contracts signed with TGLT on August 8, 2019,
IRSA CP made the exchange of all the Convertible Notes it had of
TGLT. Likewise, it subscribed preferred shares making a
contribution in kind of the 100% of the shares of the company La
Maltería S.A., owner of the property known as Maltería
Hudson, for a value of USD 24 million.
As a result of the aforementioned exchange and capitalization, IRSA
Commercial Properties obtained 21,600,000 Class A preferred shares
and 24,948,798 Class B preferred shares that are added to its
holding of 3,003,990 ordinary shares.
On February 10, 2020, the TGLT Board of Directors determined the
mandatory conversion of its Convertible Negotiable Obligations and
preferred shares with immediate effect, this is how IRSA CP
converted its Class A and B preferred shares of TGLT into ordinary
shares of the company. As a consequence of this transaction, IRSA
CP owns as of March 31, the amount of 279,502,813 ordinary shares
of TGLT, representing 30.2% of its capital stock.
DirecTV
Arena
DirecTV Arena is an indoor stadium with unique features designed to
host top-level international events, including sporting events and
concerts. The price set for the transaction was USD4.2 million.
Through these types of investments, our equity stake in LRSA and
through the new Convention Center of the City of Buenos Aires, we
continue to expand our exposure to conventions, sporting events and
entertainment, which could generate synergies with our core
shopping mall business.
As is publicly known, the DirecTV Arena stadium has been closed
since March 20, the date on which social, preventive, and mandatory
isolation was decreed in Argentina due to COVID-19. All the planned
congresses are suspended, a large part of the fairs and conventions
were postponed, while the shows scheduled at the DirecTV Arena were
mostly canceled. The reopening date of these establishments is
uncertain, as well as the future agenda of fairs, conventions and
shows.
150
Pareto
On October 8, 2018, the company Pareto S.A. was incorporated, with
the social purpose of design, programming and development of
software, mobile and web applications.
As of June 30, 2020, IRSA CP's participation in PARETO S.A. It was
69.96% and after the closing it increased its stake to
91.96%.
Pareto is a 100% digital customer loyalty system that promotes
benefits and discounts in all our shopping mall.
Appa, Pareto’s app is a 100% digital customer loyalty system
that promotes benefits and discounts across all our shopping malls.
The app is also used to pay Parking lots giving customers the most
convenient and fast check out available. The plan is to extend this
frictionless payments method in gastronomic and apparel stores
too.
Operations Center in Israel
On
September 25, 2020, the Court resolved that IDBD is insolvent and
therefore it resolved to grant all three orders requested and
accordingly, issued an order for the initiation of proceedings and
liquidation of IDBD, and has appointed a liquidator to IDBD and
interim receivers over the Pledged DIC and Clal
Shares.
As of
the date of this Annual Report, we are analyzing together with our
local and international advisors the judicial decision,
alternatives and course of action. For more information see
“IRSA’s Recent Developments - Corporate Information:
IDBD”.
Overview
As of
June 30, 2020, IRSA indirectly owned 100% of IDBD’s capital
stock and 83.7% of DIC’s capital stock. The structure chart
below shows our equity interest in the various entities that
comprise our Operations Center in Israel:
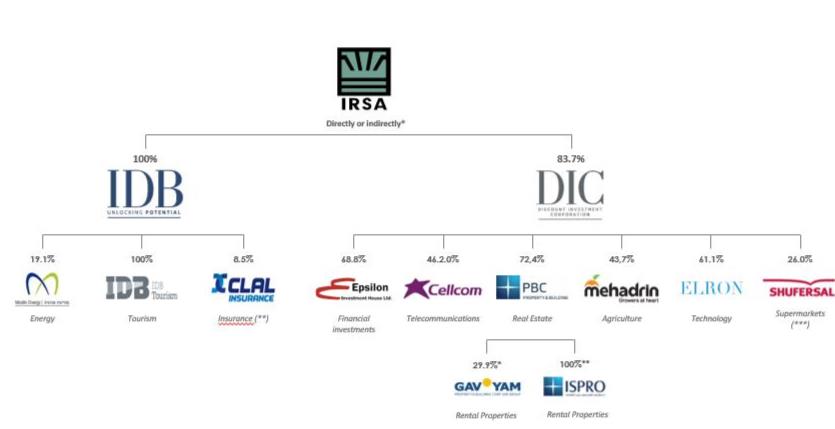
*
There is a
non-recourse intercompany loan between Dolphin (borrower) and IDBD
(lender) due to the transference of DIC shares. This loan is
guaranteed with DIC shares sold.
On 25 September
2020, the District Court in Tel-Aviv-Yafo decreed the insolvency
and liquidation of IDBD and appointed a trustee for its shares and
a custodian on the shares of DIC and Clal. For more information see
“Recent Events – Operation Center in Argentina-
Corporate Information: IDBD”
** As
of June 30, 2020, IDBD’s stake in Clal’s outstanding
share capital was
8.5
% directly and 2.1% through
swaps.After this date, IDBD’s holding in Clal amounts to 5.0%
of its share capital.
***
After June 30, 2020, DIC has accepted the offer to purchase offer
made by a private investor of its total stake in Shufersal. As a
result of this transaction, DIC completes Shufersal’s sale
process.
Real Estate
“Real
Estate” segment mainly includes assets and operating results
derived from DIC’s subsidiary PBC. As of June 30, 2020, we
owned a 72.4 % equity interest in PBC. PBC is a leading real estate
company that operates rental buildings and develops residential
properties and other construction projects. It has operations in
Israel, the United States and other countries.
151
PBC
operates in the field of income-producing properties in Israel and
the United States, within the areas of activity reported as three
business segments in the financial statements of PBC - the
income-producing properties sector in Israel, the income-producing
properties sector in the US and IDBG.
As of
December 31, 2019, PBC owns areas designated for rent in Israel,
amounting to approximately 42,000 square meters (compared to an
area of approximately 41,000 square meters on December 31, 2018).
Additionally, PBC owns income-producing properties in the United
States - HSBC Tower in New York, in an area of about 80,000 square
meters and half of the Tivoli project, a commercial and office
project, in Las Vegas in an area of about 62,000 thousand square
meters.
Following
an agreement in which PBC entered into in January 2020 for the sale
of its entire holdings in Ispro, Ispro's activitiy is classified in
the financial statements of PBC as of December 31, 2019, as
discontinued operations.
Geographical distribution
The
table below sets forth geographic distribution by market of our
rental properties as of December 31, 2019:
|
Region
|
Number of
Producing
Properties
|
Total GLA(sq. m.)
|
Percentage of Portfolio GLA
|
Occupancy Percentage(1)
|
|
Israel
|
|
|
|
|
|
Center (offices)
.
|
5
|
18,000
|
9.8
%
|
76
%
|
|
Center (commercial)
|
1
|
12,000
|
6.5
%
|
83
%
|
|
Subtotal
|
6
|
30,000
|
16.3
%
|
79.2
%
|
|
United States
|
|
|
|
|
|
Northeast
(offices)
|
1
|
80,000
|
43.5
%
|
98
%
|
|
West
(commercial)*
|
10
|
62,000
|
33.7
%
|
74
%
|
|
Subtotal
|
11
|
142,000
|
77.2
%
|
87
%
|
|
Other
(Parking)
|
-
|
12,000
|
6.5
%
|
____
|
|
Total
|
17
|
184,000
|
100
%
|
85.8
%
|
*Refers
to 100% of IDBG’s rights in Great Wash Park LLC. As of
December 31, 2019, IDBG’s entire share capital was held by
IDBD and PBC in equal parts (50%).
PBC’s
properties can be grouped by the country and region in which they
are located. PBC classifies its properties into two main regions:
(i) Israel, and (ii) United States; and in three sub-regions: (i)
Central (in Israel), and (ii) Northeast and (iii) West (both in the
United States). As of December 31, 2019, the average rent per
square meter in Israel – Central is NIS 65 for office use and
NIS 50 for commercial use; the average rent per square meter in
United States – Northeast is USD 78 (for office use) and in
United States -West USD 31 (for commercial use). The average
occupancy rate in Israel – Central is 76% for office use and
83% for commercial use; the average occupancy rate in United States
– Northeast is 98% (for office use) and in United States -
West is 74% (for commercial use). The distinction between the two
sub regions is due to the difference in the characteristics of the
two countries. Also, PBC distinguishes between different regions
within the US as detailed above, when in its opinion the difference
between the regions in the USA is mainly due to the fact that the
properties are located in different countries, with different
economic characteristics. The average rent in the Northeastern
United States is significantly higher than the average rent in the
western United States, the difference in rent is due, among other
things, to the location and the various uses - an office tower and
luxury commerce in the northeastern United States, compared to a
mixed use center (commerce and offices) in the western United
States, and the location of properties - in central New York in the
northeastern United States, compared to a location adjacent to a
residential neighborhood in the western United States.
152
However,
even within each region (both in Israel and in the United States),
there are differences among sites, as well as differences, in some
cases, among the various properties at each site, mainly due to the
characteristics of the property.
Relevant Subsidiaries
As of
June 30, 2020, the most significant subsidiaries of PBC are the
following:
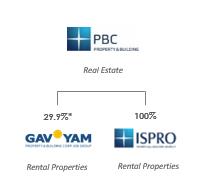
Gav-Yam
. Gav-Yam is a public company
whose securities are listed for trading on the TASE. In July 2019
and September 2019, in order to comply with the Concentration Law,
PBC sold 11.7% and 5.1% of Gav-Yam’s issued share capital,
respectively. Our stake in Gav-Yam decreased from 51.7% to 34.9%.
In May 2020, PBC sold approximately 5% of Gav-Yam’s issued
share capital, such that its stake in Gav-Yam decreased from
approximately 34.9% to approximately 29.9%.
Ispro
. Ispro is a wholly-owned company
of PBC, dedicated to the rental building segment, primarily
commercial centers and logistical areas. In order to comply with
the Concentration Law, on October 10, 2019, Ispro’s
debentures were fully redeemed and Ispro ceased being a reporting
corporation. In April 2020, an agreement was reached to sale 100%
of PBC’s holdings in Ispro. As a consequence of the agreement
for the sale of ISPRO’s shares, the Company has reclassified
net assets totaling ARS 15,473 as “Group of Assets available
for Sale”.
Type of Business
PBC (i)
operates rental buildings and (ii) develops residential properties
and other construction projects.
(i) Operation of Rental Properties
PBC
owns and manages different kinds of rental properties, which can be
grouped as follows:
Industrial and Logistics
. Characterized by areas with a
large single space, service yards and large operational areas.
Mainly located in peripheral areas, close to airports and seaports,
given low rent prices and that construction requires large areas of
land.
Commercial and Recreational Centers
. These include
commercial centers, which are located in central areas or areas
near major junctions at highways from major cities, conference
centers and recreational centers. These primarily include
PBC’s share in the Tivoli project in Las Vegas. The marketing
and distribution of the Tivoli project is carried out through a
local team engaged in marketing itself and through intermediaries,
through direct contact with potential tenants, as well as through
advertising and participation in conferences.
Business parks and office buildings for hi-tech industries
.
In the field of income-producing properties, Gav-Yam (as of June
30, 2020, held by PBC at a rate of 29.9%) engages in initiation,
planning, development, construction (through contractors),
marketing, rental, maintenance and management of high-tech parks,
business and industrial parks, office buildings, commercial areas,
logistics buildings and parking lots, nationwide in Israel,
focusing on areas Demand.
153
During
its years of activity in the field of income-producing properties,
Gav-Yam has developed two specializations in this field. One is the
establishment of business and industrial parks, and the other is
designated construction. In addition, Gav-Yam, itself and/or
through wholly owned subsidiaries, provides a variety of
maintenance and management services to its customers throughout the
lease term.
Gav-Yam's
activity in the field of income-producing properties is divided
into three stages - initiation and construction, marketing and
rental for customers and provision of management services
throughout the lease period.
Office buildings
. These office buildings are located in high
demand areas, and most are leased, at high occupancy rates,
generally for long lease periods. Areas for office use are
characterized by areas used as parking lots, which constitute an
inseparable part of the buildings. These include the HSBC Tower in
New York City.
Management of rental buildings.
The field of
income-producing assets is characterized by a wide range of
clients, including companies and large and small business clients
and private clients.
PBC
often contracts with its customers on medium- and long-term leases,
and the leases in Israel are usually for unprotected tenancy and
index-linked rents. PBC policy is to enter into, as far as
possible, long-term contracts with quality
tenants.
Ancillary services in the field of
income-producing properties in Israel
.
PBC
provides ancillary services to the areas of income-producing real
estate it owns that are leased in Israel, including management
services and maintenance, mainly for tenants in areas used for
office and commercial purposes.
.(ii)
Residential Construction
In
Israel, PBC is engaged in the initiation, planning, development,
construction and sale of quality residential neighborhoods and
unique projects that it establishes in areas of
demand.
PBC has
residential land reserves, in
Israel, US and India.
In the
field of residential construction, there are many bodies that
initiate, locate, plan and establish residential neighborhoods and
residential projects of various types. In Israel, there are
entrepreneurial companies, some of which have an executive arm and
some, such as PBC, contract with contractors to carry out
construction work.
The
products sold by PBC as part of its residential construction
business are the housing units offered for sale. The housing units
are being built both in the format of entire residential
neighborhoods, which include full environmental development and
ancillary community services, and in smaller residential
projects.
In some
of the projects, PBC works together with partners. Project
management and marketing is usually performed by PBC. The
construction financing of the projects is carried out both by PBC's
own means and through bank support for the project.
The
types of projects in which PBC operates in this field are diverse
and include construction on land purchased or leased long-term by
PBC (most projects) as well as combination transactions of various
types. PBC also has activities in the field of urban
renewal.
As of
December 31, 2019, the balance of approved construction rights for
the projects in which PBC was a partner amounted to approximately
685 residential units (of which 447 units belong to PBC), where
approximately 301 residential units are currently in construction
(of which 203 units belong to PBC), out of which approximately 268
residential units were sold). In 2019, construction and marketing
of 62 residential units began (as compared with construction and
marketing of 86 residential units in 2018). In2019In 2019, 139
residential units were sold (as compared with 205 residential units
in 2018). In 2019, PBC’s revenues from the sale of
residential units and lands imputed to the income statement
amounted to approximately NIS 336 million, as compared with
approximately NIS 517 million in 2018.
154
HSBC
The
HSBC Tower was closed beginning on March 15, 2020, in accordance
with directives issued by New York State and New York City. Access
to the tower and to its services is permitted to tenants defined as
“essential” in accordance with the city’s by laws
and regulations. As of August 20, 2020, the collection rate at the
tower during the months April - June 2020 amounted to approximately
98% of total rent charged. New York City, where the HSBC Tower is
located, is currently in phase 4 of New York State’s
reopening plan. The tower remains active and open for
“essential” businesses and for tenants who choose to
work from the offices, subject to restricted occupancy guidelines
of up to 50%.
IDBD
Tivoli Project -
IDBG is engaged,
through a real estate corporation, in the construction and
operation of a commercial and office project in Las Vegas, Nevada
(USA) ("The Tivoli project")
The
Tivoli project is a real estate project, located near the
prestigious Summerlin neighborhood in Las Vegas, intended for mixed
use, mainly of commerce and offices and as a unique center for
entertainment and shopping. Tivoli project includes three parts of
about 80 thousand square meters (the "commercial area"), out of
which approximately 62 thousand square meters have been built so
far.
The
first two parts of the Tivoli project are open to the public in a
total area of 670 thousand square feet (approximately
62 thousand square meters), which includes approximately 330
thousand square feet (approximately 31 thousand square meters) of
commercial space and approximately 340 thousand square meters
(approx. 31 thousand square meters) office
space.
As of
June 30, 2020 approximately 73% of the commercial and office space
has been leased. Around August 20, 2020, Great Wash Park LLC
“GW” is working to market the rest of the areas
designated for rent. The third part of the Tivoli project is
planned to include commercial and office space, with a total area
of about 196 thousand square feet (about 18 thousand
square meters). The third part is still in the planning stages and
an estimated construction date has not yet been set.
It
should also be noted that GW has rights to build 300 housing units
near the Tivoli project. As of December 31, 2019, IDBD and PBC held
the entire share capital of IDBG, in equal parts. In February 2020,
the loans that had been extended by PBC to IDBG were converted, in
a manner that IDBD's share in IDBG's share capital and in the right
to the repayment of the shareholder's loans to a rate of 25.82%
(the remaining 74.18% are held by PBC). In June 2020, IDBD and PBC
signed on an agreement for the sale of the IDBD's entire rights on
IDBG for consideration of USD 27.8 million. The approval of the
transaction was subject, inter alia, to the approval of PBC's
general meeting, which was convened on June 23, 2020 and which
decided not to approve the commitment. Following the
abovementioned, as of June 30, 2020, the holding rates of IDBD and
PBC in IDBG are 25.82% and 74.18%, respectively.
Following the
outbreak of the Corona virus, on March 24, 2020, the center in the
Tivoli project was closed, pursuant to the directives issues by the
Governor of the State of Nevada. During the course of the period in
which the center was closed, a number of restaurants worked in a
format of deliveries and take away. Furthermore, vital activities,
such as banks and clinics were allowed to operate. The center
management activity was reduced to the minimum necessary for
business that operated in the center in that period and some of the
activities were discontinued completely (such as parking, cleaning
and gardening services and etcetera). This reduction has led to a
saving of approximately 36% in the center's operating expenses in
the relevant period.
The
occupancy rate in the project stood at approximately 73% before the
outbreak of the Corona virus. During the course of the period of
the closure, a number of tenants encountered difficulties and gave
notice of the cessation of their activity in the project.
Furthermore, a number of tenants announced that they would not be
extending their rental agreements in the project, which are about
to expire. However, during this period of time a number of new
contracts were signed. The rental fees for March 2020 were
collected without any significant change as compared with previous
months. In April and May 2020 approximately 70% of the rental fees
for offices and approximately 25% of the rental fees for commercial
areas and restaurants have been collected up to now. For June 2020,
82% of the the rental fees have been collected so far. As of this
time, the project's management has not set a uniform policy in
connection with the granting of reliefs for tenants and a specific
discussion is held opposite each tenant. Tivoli’s management
continues working to complete the collection for the above
mentioned periods.
155
The
valuation of the Tivoli project in Las Vegas was updated in the
first quarter of 2020 to USD 233 million from USD 237 millionas of
31.3.2019. As a result, PBC recorded a loss in the amount of NIS 11
million, while DIC’s share in the aforementioned loss
amounted to a total of NIS 8 million; IDBD recorded its share in
the net loss in the amount of NIS 4 million, which was recorded
under discontinued operations
At
present, it is not possible to estimate the full effect of the
coronavirus pandemic on the Tivoli project’s results in 2020.
However, at this stage, PBC estimates that the damage will be
limited to a few millions of USD, where despite the expected
decline in NOI, the project’s current cash flows, along with
increased efficiency measures which have been implemented, will
allow the project to maintain a positive cash balance.
Gav-Yam
Gav Yam
- As of July 2020, the management of Gav Yam estimated that, in the
long term, in light of its financial strength, as reflected, inter
alia, in its high balances of available cash and cash equivalents,
its low leverage ratio, the average lifetime of its debt and the
comfortable distribution thereof, the fact that all of Gav
Yam’s properties are unpledged, and in light of the broad
geographical and sectoral distribution of Gav Yam’s
properties, as well as their status, locations and occupancy rates,
and the fact that the vast majority of properties are used for IT,
office, logistics and industrial purposes (and not for commerce or
retail), with an emphasis on the quality of lessees, and the
distribution of revenues from them, all reduce the exposure of Gav
Yam’s businesses to the crisis and/or to significant
instability, and it has tools at its disposal in order to
appropriately deal with the economic crisis described
above.
Residential construction segment in Israel
According to
the assessment of PBC, at this stage there are no indications of a
decline in the fair value of PBC’s inventory of apartments,
inter alia, in light of the average sale prices in the period after
the coronavirus outbreak, and in light of the fact that payments
from apartment buyers are continuing to be received in an orderly
fashion. In addition, PBC promotes and complements conditions in a
number of projects for obtaining building permits, but since the
outbreak of the corona virus there has been a difficulty in working
with the authorities which causes delays in granting the necessary
permits for the construction of projects.
PBC
believes that its financial strength and the status of its
properties, cash balances, and the current cash flows which it is
generating, will allow it to continue financing its activities and
service its liabilities.
Agriculture
Mehadrin
. Mehadrin is a public company
whose securities are listed for trading on the TASE. Most of
Mehadrin’s activities are in the agricultural segment. Until
September 2019, We and Phoenix Holdings Ltd.
(“Phoenix”), which held, through a wholly owned
subsidiary, 41.4% of Mehadrin, were considered to be joint
controllers of Mehadrin since, pursuant to the terms of a
shareholders agreement, PBC and Phoenix controlled approximately
86.8% of the voting rights and rights to appoint directors in
Mehadrin. On September 18, 2019, Phoenix distributed of all shares
of Mehadrin it owned as a dividend in kind to Phoenix’
shareholders, thereby terminating the joint control of the parties
of Mehadrin. On November 27, 2019, PBC approved the distribution of
all its shares in Mehadrin as a dividend in kind. As a result, DIC
received approximately 31.4% of the share capital of Mehadrin.
Additionally, in the first quarter of 2020, DIC acquired
approximately 8.8% of Mehadrin’s issued share capital, such
that its holding rate in Mehadrin increased to approximately 40.2%.
The aforementioned acquisitions of Mehadrin shares resulted in DIC
gaining control of Mehadrin. In the second quarter of 2020, DIC
purchased approximately 3.5% of the issued share capital of
Mehadrin, at a total cost of NIS 14 million, such that its holding
rate in Mehadrin increased to approximately 43.7%.
156
Telecommunications
Cellcom
is a public company which was incorporated in Israel, whose shares
are listed for trading on the TASE and on the New York Stock
Exchange, and whose debentures are listed for trading on the TASE.
As of June 30, 2020, we owned 46.2% of
the shares and had 48.4% of voting rights of
Cellcom.
Segments
Cellular Segment
. Cellcom is the
largest provider of cellular communications services in Israel
based upon number of subscribers and estimated market share as of
June 30, 2020. Cellcom offers a broad range of services including
cellular telephony, roaming services for tourists in Israel and for
its subscribers abroad, text and multimedia messaging, advanced
cellular content and data services and other value-added services
in the areas of music, video, mobile office etc., based on Cellcom
Israel's technologically advanced infrastructure . Cellcom operates
an LTE 4 generation network and an HSPA 3.5 Generation network
enabling advanced high speed broadband multimedia services, in
addition to GSM/GPRS/EDGE networks. Cellcom Israel offers Israel's
broadest and largest customer service infrastructure including
telephone, customer service centers, retail stores, and service and
sale centers, distributed nationwide. Cellcom Israel further
provides OTT TV services, internet infrastructure and connectivity
services and international calling services, as well as landline
telephone services in Israel. As of June 30, 2020, Cellcom provided
cellular communications services to approximately 2,734 million
subscribers in Israel, with an estimated market share as of
December 31, 2019 of approximately 26%.
Cellcom
offers cellular subscribers a variety of usage and sector pricing
plans and bundles combining cellular services with other
communications services its group offers, including
quatro
bundles (internet infrastructure
service and connectivity, landline telephony, cable television
service and cellular services). Cellcom offer two methods of
payment: post-paid and pre-paid. Post-paid services are offered to
subscribers who are willing to pay for its services through banking
and credit arrangements, such as credit cards and direct debits.
Pre-paid services are offered to cellular subscribers who pay for
its services prior to obtaining them. The majority of
Cellcom’s sales are post-paid.
Fixed line services
. Cellcom fixed line services include its
internet infrastructure (for private customers based mostly on the
landline wholesale market and increasingly on its independent
fiber-optic infrastructure and for business customers based on its
landline infrastructure) and connectivity services, OTT TV
services, ILD services, landline telephony services and
transmission services (for business customers). Cellcom also offer
bundles of these services, including a triple offering (internet
service including infrastructure and connectivity, landline
telephony, TV service) and
quatro
offering. Cellcom also offer
landline transmission and data services to selected business
customers and telecommunications operators (including transmission
revenues from Golan according to the network sharing agreement as
of April 2017), using its fiber-optic infrastructure and
complementary microwave links, IP switchboard services and
operation and management of business telecommunications systems.
Additional services include cloud services and data protection
products solutions based on products and services offered by
Cellcom and by third party vendors and IOT solutions such as
“smart city” end-to-end cellular and fixed line
solutions. For more information see “
Cellcom- Golan
Telecom Agreement”
Networks and Infrastructure
Cellular Segment
. Cellcom have built an
extensive, durable and advanced cellular network system, enabling
to offer high-quality services to substantially the entire Israeli
populated territory, while using a cost-effective design, utilizing
shared components for its networks, where applicable. Cellcom seek
to satisfy quality standards that are important to its subscribers,
such as high voice quality, high data throughput rate, low
“blocked call” rate (average rate of call attempts that
fail due to insufficient network resources), low “dropped
call” rate (average rate of calls that are terminated not in
the ordinary course) and deep indoor coverage. Therefore, Cellcom
have made substantial capital expenditures and expect to continue
to be required to make substantial capital expenditures on its
network system, though, pursuant to its Sharing Agreements, radio
capital expenditures for the shared networks will be divided among
the sharing parties.
157
Fixed line services
. Cellcom provides,
Internet services - connectivity and infrastructure, multichannel
TV services, international Call Services, Wireline communication
Services and other fixed-line services. Cellcom optical
transmission network is strategically deployed in order to cover
the major portion of Israel’s business parks from Nahariya in
the north to Beer Sheva in the south and Afula and Jerusalem in the
east, consisting of approximately 1,980 kilometers. The fiber-optic
network is monitored by a fault-management system that performs
real-time monitoring in order to provide high quality service. In
order to efficiently complete its transmission network’s
coverage to the majority of its cell sites and business landline
and transmission subscribers, Cellcom uses a microwave network as a
complementary solution in those areas that are not served by its
fiber-optic network. As of December 31, 2019, Cellcom had
approximately 2,808 microwave links to both its cell sites and its
landline and transmission subscribers. In February 2020, Cellcom,
the shareholders of Golan Telecom and Golan Telecom executed a
binding memorandum of understanding for the acquisition of Golan
Telecom entire capital stock. For more information see:
“Significant acquisitions,
dispositions and development of business – Operation Center
in Israel - Cellcom- Golan Telecom
Agreement.”
Others
Modiin Energy
Modiin is a
limited partnership engaged in the field of oil and natural gas
exploration and is traded on the Tel Aviv Stock Exchange. IDBD
operates in the field of oil and gas through Modiin. As of December
31,2019, Modiin has rights in onshore oil assets in the United
States and in one oil asset in Israel (marine oil
asset).
Elron
Elron
is a holding company which constitutes the technology investment
arm of the IDB Group. Elron has significant holdings in a select
number of start-up companies in the field of cybersecurity,
enterprise software, medical device, etc. IDB Tourism
IDB
Tourism is a wholly-owned subsidiary of IDBD, which was
incorporated in Israel and commenced it operations in 1934. In
2014, IDB Tourism’s management decided to focus its business
activity on the sale of tourism services, in the framework of
tourism packages that were adapted to the preferences of the
Israeli public, to the incoming tourists to Israel. Until 2015, IDB
Tourism held three major companies operating in the field of
tourism: Terminal 1 Holdings Ltd. (formerly - Diesenhaus Ltd.),
Open Sky Ltd, and Israir Airlines & Tourism Ltd.
(“Israir”), (Israir, Diesenhaus, Open Sky and related
parties will be referred to hereinafter as “the IDB Tourism
Group”).
In July
2020, Israir signed an agreement to have access, if needed, a loan
in an amount of NIS 75 million with a 75% guarantee from the State.
In addition, Israir received approval from another banking
corporation and from the Ministry of Finance to receive another
State-guaranteed loan at a rate of 75% and in the amount of
approximately NIS 61 million, while the Bank gave its agreement in
principle to increase the loan to NIS 100 million. The increase ot
the said loan is subject to the approval of the Ministry of
Finance, which has agreed to positively consider increasing the
volume of the state-guaranteed loan to a higher percentage in about
two months, depending on the situation at that time.
Supermarkets
Shufersal is the
owner of the largest supermarket chain in Israel. In December 2017
the Group completed the acquisition of the entire issued share
capital of Be Drugstores Ltd. (formerly New Pharm Drugstores Ltd.)
(“
Be
”).
Shufersal is a public company, which is included under the Tel Aviv
35 index, which was incorporated in Israel, whose shares and
debentures are listed for trading on the TASE.
As June
30, 2020, Shufersal operates 379 branches throughout Israel, of
which 298 are Shufersal stores and 81 are Be stores.
Shufersal’s total commercial space encompasses approximately
543,000 square meters, of which 513,000 square meters are Shufersal
stores and 30,000 square meters are Be stores, as well as 8
delivery centers encompassing 22,000 square meters, all located in
Israel. Shufersal employs about 17 thousand employees (about 14.8
thousand calculated positions) and has annual revenues of about NIS
14 billion.
158
In June
2018, DIC sold 16.6% of the issued share capital of Shufersal, for
a total net consideration of NIS 848 million, as a result of which
DIC’s holdings in Shufersal decreased to approximately 33.6%
and therefore ceased to be the controlling shareholder of
Shufersal. Following certain other divestments from DIC, as of June
30, 2020, our equity interest in Shufersal was reduced to 26.02%.
On July 26, 2020, DIC sold its entire stake in Shufersal, of
approximately 26%, for a total net consideration of NIS 1,450
million.
Segments
The
Company operates in four operating segments that are reported as
business segments in its financial statements:
Retail segment
. This segment includes
the retail marketing of food and other products in the
Shufersal’s stores and the manufacture of frozen and fresh
baked products that are sold mainly in the Shufersal’s
stores. As at June 30, 2020, the Shufersal’s retail segment
activity is carried out in 298 stores having a wide geographical
spread.
Real Estate.
In this segment we manage
various types of properties, including commercial centers and other
properties related to the operation of our stores. The real estate
activities of Shufersal were separated, beginning on April 1, 2013,
into Shufersal Real Estate Ltd., a wholly owned subsidiary. This
entity leases these properties both to Shufersal and to other third
parties. This segment’s revenues include rental revenues
based on actual amounts that the real estate segment charged the
retail segment, and the operating profit of the segment includes
also management fees that were charged to the subsidiaries of the
real estate segment. Presented below are details regarding the real
estate properties which are owned by Shufersal Real Estate as of
December 31, 2019:
|
|
Number
ofproperties
|
Approximatelytotal
area
|
Fair
value
|
Rent
and annualmanagement fees
|
|
|
|
(thousands
of sqm.)
|
(millions
of NIS)
|
(thousands
of NIS)
|
|
|
|
|
|
|
|
Stores
rented to Shufersal
|
71
|
134
|
1,818
|
131,348
|
|
Properties
under construction which will be rented to Shufersal
|
1
|
2
|
1
|
—
|
|
Rentable
real estate properties to third parties
|
20
|
54
|
586
|
50,949
|
|
Real
estate properties under construction which will be rented to
externals
|
2
|
50
|
134
|
—
|
|
Total
|
94
|
240
|
2,539
|
182,297
|
Credit card customers’ club management
segment.
This segment includes operating the credit card
business and providing credit to the holders of our credit cards.
From January 18, 2018, the operation of the credit card business is
made by means of Israel Credit Card Ltd. and Diners Club Israel
Ltd.
Be segment
. Following completion of the
transaction to acquire New Pharm Drugstores Ltd. on December 20,
2017, which was rebranded as “Be”. As of June 30,
2020this segment includes the operation of 81 drugstores in Israel
that sell mainly cosmetics, convenience and toiletry products,
medicine and food supplements. In December 2019, Shufersal's Board
of Directors passed a resolution that Shufersal would merge, by way
of a statutory merger with BE, under which Shufersal would absorb
all of BE's activities, liabilities and assets without
consideration, and BE would be liquidated without
liquidation.
Distribution
Most
merchandise is distributed to our stores through our network of
distribution centers. Common carriers ship general merchandise to
and from our distribution centers. Vendors or third party
distributors
ship certain food
items and other merchandise directly to our stores. Merchandise
sold through our digital channels is distributed to our online
guests via common carriers (from stores, distribution centers,
vendors and third party distributors) and through guest pick-up at
our stores. Using our stores as fulfillment points allows improved
product availability and delivery times and also reduces shipping
costs. We continue to expand other delivery options, including
store drive-up and delivery.
159
Seasonality
In
Israel, the retail segment business’s results are subject to
seasonal fluctuations as a result of the consumption
behavior
proximate to the Passover holidays
(March and/or April) and Rosh Hashanah and Sukkoth holidays
(September and/or October).
Competition
Shufersal competes
in this market primarily with the other supermarket chains,
specialty stores (such as grocers, butchers, delis and bakeries),
convenience stores in cities and gas stations, neighborhood grocery
stores, open and closed markets, and other retailers.
Insurance
Clal is
a public company which was incorporated under the laws of the State
of Israel. Clal is one of the leading insurance and long-term
savings groups in Israel. The shares of Clal have been listed for
trading on the stock exchange since 1988. As of December 31, 2019,
Clal employs over 4,500 people and markets its products through
1,897 insurance agents, all of whom provide quality service and
professional support to their customers. As of December 31, 2019,
Clal has NIS 220 billion in assets under management (out of which,
approximately NIS 188 billion are assets managed for others). Clal
divides its operations in three insurance segments: Non-Life
Insurance, Long-Term Savings and Health.
As of
June 30, 2020, IDBD’s stake in Clal’s outstanding share
capital was
8.5
%
directly and 2.1% through swaps.
Segments.
Non-Life Insurance
. The General
Insurance domain in Clal Group is among the largest in Israel. As
of December 31, 2019, Clal holds 10.3% market share of the premiums
in the in the Non-Life Insurance Division and offers coverage to
private and corporate customers. Clal markets its products through
1,450 non-life insurance agents, all of whom provide quality
service and professional support to their customers. The Non-Life
Insurance Segment offers a wide range of insurance plans:
automotive, property, liability, marine insurance, personal
accidents, guarantees and additional services. It`s vision is to
provide professional and high-level service to company`s agents and
customers, through constant improvements and new product
development.
Life Insurance and Long-Term Savings
.
As of December 31, 2019, the Long-Term Savings Division holds a
13.7% market share of the long-term savings market, as defined by
the Commissioner of Insurance and have assets in an approximate
amount of NIS 149,472 billion. As at December 31, 2019, Clal holds
17.3% market share of the premiums in the in the Life Insurance
Division. There is no single customer or a limited number of
customers of which Clal is dependent. Clal markets insurances
policies, from time to time and in the normal course of business,
to companies in the IDBD Group (both policyholders in collective
insurance, both as members of central provident funds and as
employers depositing for pension savings for long-term savings
products). This does not exceed 5% of the Clal’s total
revenues in this segment. The Long-Term Savings segment manages
long-term assets, including life insurance, pension and provident
funds. The segment also provides comprehensive solutions to private
and corporate customers in all sectors of the Israeli economy.
Among the division’s customers are large corporations and
many residents of the State of Israel. Its objectives are to
support the company’s distribution channels and become a
professional benchmark, helping to improve company business
results, profitability and value, while emphasizing quality of
service. The segment offers a variety of savings options, enabling
its customers to maintain a strong, solid economic foundation in
the event of death, accident or loss of earning capacity. It also
offers a variety of pension funds designed to guarantee a monthly
income for life in the event of retirement, disability, or death,
enabling economic stability for the future even in difficult
times.
On July
26, 2018, Clal’s Board of Directors resolved to change the
organizational structure of Clal Group, and from September 1, 2018,
the life insurance and pension and provident divisions merged into
the long-term savings division. In addition, a new a customer and
distribution division established.
160
Health Insurance.
The Health Insurance
segment offers a wide range of products for individuals, families
and groups, specializing in comprehensive solutions for specific
market segments such as women and children. As of December 31,
2019. Clal holds a 17.4% market share of the premiums in the health
insurance market in Israel and offers health insurance products
such as surgeries in Israel and overseas, transplants, medications,
critical illness, long-term care, personal accidents, travel and
more. Health Insurance segment vision is to establish Clal as a
leading, innovative and professional company in the field of health
and nursing care insurance, while providing a professional and
timely service to its agents and customers. The segment focuses on
technological innovation as well as on developing a range of
innovative health insurance products, enabling flexibility in
creating health insurance packages tailored for each client, based
on his needs and financial status. Each package is either derived
from existing packages, or custom-built for each customer. Clal
markets most of its products through 852 health agents, all of whom
provide quality service and professional support to their
customers. The Health Insurance segment is constantly growing, and
is proud to provide quality service to 400,000 members insured
under private insurance plans as well as an additional 2,000,000
members insured under group insurance plans.
Legal Framework
Operations Center in
Argentina
Regulation and Government Supervision
The
laws and regulations governing the acquisition and transfer of real
estate, as well as municipal zoning ordinances, apply to the
development and operation of our properties. Currently, Argentine
law does not specifically regulate shopping mall leases. Since our
shopping mall leases generally diverge from ordinary commercial
leases, we have developed contractual provisions which are tailored
to the commercial relationship with our shopping mall
tenants.
Leases
Argentine
law imposes certain restrictions on property owners,
including:
●
a minimum lease
term of three years for all purposes, except in particular cases
such as embassy, consulate or international organization venues,
room with furniture for touristic purposes for less than three
months, custody and bailment of goods, exhibition or offering of
goods in fairs or in cases where due to the circumstances, the
subject matter of the lease requires a shorter term.
Lease term limits
Under
the Argentine Civil and Commercial Code lease terms may not exceed
20 years (for residential
purpose
) or
fifty years (all other purposes). Generally, terms in our leases
range from 3 to 10 years.
Rescission rights
The
Argentine Civil and Commercial Code provides that tenants may
terminate leases other destiny than home destiny, early after the
first six months of the effective date. Such termination is subject
to penalties which range from one to one and a half months of rent.
If the tenant terminates the agreement during the first year of the
lease, the penalty is one and a half month’s rent and if
termination occurs after the first year of lease, the penalty is
one month’s rent.
Other
The
Argentine Civil and Commercial Code, among other rules, repealed
the Urban Lease Law No. 23,091, which set forth a rule similar
to the one described above, but established the obligation to give
at least 60 days’ prior notice of exercise of the
tenant’s unilateral termination right. There are no court
rulings to date with respect to the new regulations related to:
(i) the tenant’s unilateral termination right; or
(ii) the possibility of agreeing a penalty different from that
described above upon such termination.
161
While
current policy discourages government regulation of leases, there
can be no assurance that additional regulations will not be imposed
in the future by Congress, including regulations similar to those
previously in place. Furthermore, most of our leases provide that
the tenants pay all costs and taxes related to the property in
proportion to their respective leasable areas. In the event of a
significant increase in such costs and taxes, the government may
respond to political pressure to intervene by regulating this
practice, thereby adversely affecting our rental
income.
The
Argentine Civil and Commercial Code enables landlords to pursue
what is known as an “executory proceeding” if a tenant
fails to pay rent when due. In executory proceedings, debtors have
fewer defenses available to prevent foreclosure, making these
proceedings substantially shorter, as the origin of the debt is not
in question and the trial should focus on the formalities of the
contract. The Argentine Civil and Commercial Code also permits
special eviction proceedings, which are carried out in the same way
as ordinary proceedings. The Argentine Civil and Commercial Code
also requires that a residential tenant receive at least
10 days’ prior notice when a landlord demands payment of
rent due if a breach prior to eviction occurs but does not impose
any such requirement for other leases. However, court cases pending
resolution and numerous procedural hurdles have resulted in
significant delays to eviction proceedings in the commercial
context, which generally last from six months to two years from the
date of filing of the suit for eviction.
Development and use of the land
In the
City of Buenos Aires, where the vast majority of our properties are
located, we are subject to the following regulations:
Buenos Aires Urban Planning Code
The
Buenos Aires Urban Planning Code (
Código de Planeamiento Urbano de la
Ciudad de Buenos Aires
) generally restricts the density and
use of property and regulates physical features of improvements to
property, such as height, design, set back and overhang, consistent
with the city’s urban planning policy. The Secretary of Urban
Planning of the City of Buenos Aires (
Secretaría de Planeamiento Urbano
)
is responsible for implementing and enforcing the Buenos Aires
Urban Planning Code.
Buenos Aires Building Code
The
Buenos Aires Building Code (
Código de Edificación de la Ciudad
de Buenos Aires
) complements the Buenos Aires Urban Planning
Code regulating the use and development of property in the City of
Buenos Aires. The Building Code requires developers to obtain
building permits, including submitting architectural plans for
review of the Secretary of Work and Public Services, to monitor
regulatory compliance.
Buenos Aires Authorizations and Licenses Code
The
Authorizations and Licenses Code (
Código de Habilitaciones de la Ciudad de
Buenos Aires
) sets forth the conditions under which
authorizations or licenses to operate may be granted. The General
Bureau of Authorizations and Licenses is responsible for
implementing and enforcing the Authorizations and Licenses Code.
Outside Buenos Aires City, our real estate activities are subject
to similar municipal zoning, building, occupation and environmental
regulations, which must also comply with national standards. In
some jurisdictions we may also be subject to regulation of large
commercial areas, which require approval of the location of these
areas. We believe that all of our real estate properties are in
material compliance with relevant laws, ordinances and
regulations.
Sales and ownership
Real Estate Installment Sales Law
The
Real Estate Installment Sales Law No. 14,005, as amended by
Law No. 23,266 and Decree No. 2015/85, or “Real
Estate Installment Sales Act,” imposes a series of
requirements on contracts for the sale of subdivided real estate
property including, for example, that the purchase price for a
property is payable in installments. The law requires, among other
things:
Registration
of intent to sell the property in subdivided plots with the Real
Estate Registry in the jurisdiction where the property is located.
Registration is only permitted for unencumbered property. Mortgaged
property may only be registered if creditors agree to divide the
debt in accordance with subdivided plots. Creditors may be
judicially compelled to agree to the partition.
162
Preliminary
registration with the Real Estate Registry of the purchase
instrument within 30 days after its execution.
Once
the property is registered, the installment sale must be completed
in a manner consistent with the Real Estate Installment Sales Act.
If a dispute arises over the title between the purchaser and third
party creditors of the seller, the installment purchaser who has
duly registered the purchase instrument will have title to the
plot. The purchaser can demand conveyance of title after at least
25% of the purchase price has been paid, although the seller may
record a mortgage over the subject property to secure payment of
the balance of the purchase price.
After
payment of 25% of the purchase price or advancement of at least 50%
of construction, the Real Estate Installment Sales Act prohibits
termination of the sales contract for failure by the purchaser to
pay the balance of the purchase price but gives the seller the
right to enforce under any mortgage on the property.
Buildings Law
Buildings
Law No. 19,724 (
Ley de Pre
horizontalidad
) was repealed by the Argentine Civil and
Commercial Code which provides that for purposes of execution of
sales agreements for units under construction, the owner or
developer must purchase insurance in favor of prospective
purchasers against the risk of frustration of the development
pursuant to the agreement for any reason. A breach of this
obligation precludes the owner from exercising any right against
the purchaser—such as demanding payment of any outstanding
installments due—unless he/she fully complies with their
obligations, but does not prevent the purchaser from exercising its
rights against the seller.
Protection of the Disabled
The Law
for Protection of the Disabled No. 22,431, enacted on
March 16, 1981, as amended, provides that properties under
construction or that are being remodeled must provide access for
handicapped persons. Public spaces, entrances, hallways, elevators
and common use facilities must be designed to provide mobility for
impaired individuals. Buildings developed before enactment of the
Protection for the Disabled Law must be reformatted to provide
requisite access. Buildings that, because of their architectural
design, may not be adapted to the use by the physically impaired,
are exempted from these requirements.
Other
regulations
Consumer relations, consumer or end-user protection
Article
42 of the Argentine Constitution establishes that consumers and
users of goods and services have a right to protection of health,
safety and economic interests in a consumer relationship. Consumer
Protection Law No. 24,240, as amended, regulates several
issues concerning the protection of consumers and end users in a
consumer relationship, in the arrangement and execution of
contracts. The Consumer Protection Law, and the applicable sections
of the Argentine Civil and Commercial Code are intended to regulate
the constitutional right conferred under the Constitution on the
weakest party to the consumer relationship and prevent potential
abuses deriving from the stronger bargaining position of vendors of
goods and services in a market economy where standard form
contracts are widespread.
These
laws deem void and unenforceable contractual provisions included in
consumer contracts, that:
●
deprive obligations
of their nature or limit liability for damages;
●
imply a waiver or
restriction of consumer rights and an extension of seller rights;
and
●
impose the shifting
of the burden of proof from the consumer to the seller in order to
protect the consumers.
In
addition, the Consumer Protection Law imposes penalties ranging
from warnings to the forfeiture of concession rights, privileges,
tax regimes or special credits to which the sanctioned party may be
entitled, including closing down establishments for a term of up to
30 days.
163
The
Consumer Protection Law and the Argentine Civil and Commercial Code
define consumers or end users as the individuals or legal entities
that acquire or use goods or services, free of charge or for a
price for their own final use or benefit or that of their family or
social group. The protection under the laws afforded to consumers
and end users encompasses the entire consumer relationship, from
the offering of the product or service, to cover more than just
those relationships established by means of a contract. Providers
of goods and services include those who produce, import, distribute
or commercialize goods or supply services to consumers or users
(but excludes professionals whose services require a college degree
or higher who are required to register in officially recognized
professional organizations).
The
Argentine Civil and Commercial Code defines a consumer agreement as
one that is entered into between a consumer or end user and an
individual or entity that manufactures goods or provides services
to consumers for private, family or social use. The Consumer
Protection Law imposes a range of penalties for violation of its
provisions, from warnings to the forfeiture of concession rights,
and establishes joint and several liability of each participant in
the chain of distribution or whose trademark on the thing or
service for damages caused to consumers derived from a defect or
risk inherent in the thing or the provision of a
service.
The
Consumer Protection Law excludes the services supplied by
professionals that require a college degree and registration in
officially recognized professional organizations or by a
governmental authority. However, this law regulates the
advertisements that promote the services of such
professionals.
The
Consumer Protection Law determines that the information contained
in the offer addressed to undetermined prospective consumers binds
the offeror during the period when the offer is made until its
public revocation. Further, it determines that specifications
included in advertisements, announcements, prospectuses, circulars
or other media bind the offeror and are considered part of the
contract entered into by the consumer.
Pursuant
to Resolution No. 104/2005 issued by the Secretariat of
Technical Coordination reporting to the Argentine Ministry of
Treasury, Consumer Protection Law adopted Resolution
No. 21/2004 issued by the Mercosur’s Common Market
Group, persons engaged in internet commerce must disclose precisely
the characteristics of the products and/or services offered and the
sale terms. Failure to comply with the terms of the offer is deemed
an unjustified denial to sell and may give rise to
sanctions.
On
September 17, 2014, the Argentine Congress enacted Law No.
26,993 called “Conflict Resolution in Consumer Relationships
System” law that provides for creation of new administrative
and judicial procedures. The law created a bicameral administrative
system: the Preliminary Conciliation Service for Consumer Relations
(
Servicio de Conciliación
Previa en las Relaciones de Consumo
), or
“COPREC,” and the Consumer Relations Audit, and a
number of courts assigned to the resolution of conflicts between
consumers and providers (
Fuero
Judicial Nacional de Consumo
). The amount of any filed claim
may not exceed a fixed amount equivalent to 55 adjustable minimum
wages, as determined by the Ministry of Labor, Employment and
Social Security. The claim must be filed with the administrative
agency. If an agreement is not reached, the claimant may file the
claim in court. While COPREC is currently in full force and effect,
the court system (
Fuero Judicial
Nacional de Consumo
) is still pending. Therefore, any
current claim must be filed with existing courts. A considerable
number of claims pending against us are expected to be settled
within the framework of this system.
Antitrust Law
For
more information about Antitrust Law see,
“Item 4. Information on the
Company⸺Other regulations⸺Antitrust
Law”.
Money laundering
For
more information about money laundering see, “Item 10.
Additional Information—E. Money
Laundering”.
164
Environmental Law
Our
activities are subject to several national, provincial and
municipal environmental provisions.
Article
41 of the Argentine Constitution, as amended in 1994, provides that
all Argentine inhabitants have the right to a healthy and balanced
environment fit for human development and have the duty to preserve
it. Environmental damage shall bring about primarily the obligation
to restore it as provided by applicable law. The authorities shall
control the protection of this right, the rational use of natural
resources, the preservation of the natural and cultural heritage
and of biodiversity and shall also provide for environmental
information and education. The National Government shall establish
minimum standards for environmental protection whereas Provincial
and Municipal Governments shall fix specific standards and
regulatory provisions.
165
On
November 6, 2009, the Argentine Congress passed Law No. 25,675.
Such law regulates the minimum standards for the achievement of a
sustainable environment and the preservation and protection of
biodiversity and fixes environmental policy goals.
Law No.
25,675 establishes the activities that will be subject to an
environmental impact assessment procedure and certain requirements
applicable thereto. In addition, such Law sets forth the duties and
obligations that will be triggered by any damage to the environment
and mainly provides for restoration of the environment to its
former condition or, if that is not technically feasible, for
payment of compensation in lieu thereof. Such Law also fosters
environmental education and provides for certain minimum reporting
obligations to be fulfilled by natural and legal
entities.
In
addition, the CNV Rules require the obligation to report to the CNV
any events of any nature and fortuitous acts that seriously hinder
or could potentially hinder performance of our activities,
including any events that generate or may generate significant
impacts on the environment, providing details on the consequences
thereof.
The new
Argentine Civil and Commercial Code has introduced as a novel
feature the acknowledgement of collective rights, including the
right to a healthy and balanced environment. Accordingly, the
Argentine Civil and Commercial Code expressly sets forth that the
law does not protect an abusive exercise of individual rights if
such exercise could have an adverse impact on the environment and
the rights with a collective impact in general.
166
Environmental matters
We
consistently strive to act responsibly regarding protection of the
environment in the management of our operating activities by
preventing and minimizing the potential adverse environmental
impacts of our activities. We have adopted an environmental impact
policy, which is used as a reference for the realization of our
investments. We are subject to environmental legislation under a
series of laws, ordinances, norms, and national, provincial and
municipal regulations of Argentina. Environmental obligations vary
depending on the project site, the site’s environmental
conditions, current and prior uses, and the activity proposed to be
developed. Compliance with environmental laws may result in project
delays or impose additional requirements that may result in
substantial additional costs that may adversely affect our
commercial activities. Before purchasing land or carrying out an
investment on a plot of land, we carry out an environmental
assessment of the parcel to identify possible environmental
contingencies and analyze the possible environmental impact of the
investment or the development to be carried out. Historically, our
operations have not been negatively affected by the existence or
potential existence of pollutants, nor by the failure to obtain
environmental approvals or permits.
167
We
intend to continue implementing plans that enhance our monitoring
activities, in line with our commitment to and respect for the
environment, our compliance obligations and with existing
regulations, while seeking to optimize the use of
resources.
168
C. ORGANIZATIONAL STRUCTURE
Subsidiaries and associated companies
The
following table includes a description of our direct subsidiaries
and associated companies as of June 30, 2020:
|
Subsidiaries
|
Effective
Ownership and Voting Power Percentage
|
Property/Activity
|
|
Agro-Uranga
S.A
|
35.72
%
|
Agro-Uranga S.A. is
an agricultural company which owns 2 farmlands (Las Playas and San
Nicolás) that have 8.299 hectares on the state of Santa Fe and
Córdoba.
|
|
Uranga Trading
S.A
|
35.72
%
|
Uranga Trading S.A.
is committed to facilitate and optimally manage the trade of grains
of the highest quality, locally and internationally.
|
|
Brasilagro
Companhia Brasileira de Propiedades Agrícolas
|
33.55%
(1)(3)
|
Brasilagro is
mainly involved in four areas: sugar cane, crops and cotton,
forestry activities, and livestock.
|
|
Agropecuaria Santa
Cruz S.A. (formerly known as Doneldon S.A.)
|
100
%
|
Agropecuaria Santa
Cruz S.A. is involved in investments in entities organized in
Uruguay or abroad through the purchase and sale of bonds, shares,
debentures and any kind of securities and commercial paper under
any of the systems or forms created or to be created, and in the
management and administration of the capital stock it owns on
companies controlled by it.
|
|
Futuros y
Opciones.Com S.A.
|
50.10
%
|
A leading
agricultural web site which provides information about markets and
services of economic and financial consulting through the Internet.
The company has begun to expand the range of commercial services
offered to the agricultural sector by developing direct sales of
supplies, crops brokerage services and cattle
operations.
|
|
Amauta Agro S.A.
(formerly known as FyO Trading S.A.)
|
50.48%
(2)
|
Amauta Agro
S.A.’s purpose is to engage, in its own name or on behalf of
or associated with third parties, in activities related to the
production of agricultural products and raw materials, export and
import of agricultural products and national and international
purchases and sales of agricultural products and raw
materials.
|
|
FyO Acopio S.A.
(formerly known as Granos Olavarria S.A.)
|
50.48%
(2)
|
FyO Acopio S.A. is
principally engaged to the warehousing of cereals and brokering of
grains.
|
|
Helmir
S.A.
|
100
%
|
Helmir S.A. is
involved in investments in entities organized in Uruguay or abroad
through the purchase and sale of bonds, shares, debentures and any
kind of securities and commercial paper under any of the systems or
forms created or to be created, and to the management and
administration of the capital stock it owns on companies controlled
by it.
|
|
IRSA Inversiones y
Representaciones Sociedad Anónima
|
61.95%
(1)(3)
|
It is a leading
Argentine company devoted to the development and management of real
estate.
|
|
IRSA Propiedades
Comerciales S.A.
|
2.62
%
|
It is one of the
largest owners, developers and operators of shopping malls, offices
and other commercial properties in Argentina in terms of gross
leasable area and number of rental properties.
|
|
Sociedad
Anónima Carnes Pampeanas S.A.
|
100%
(3)
|
Sociedad
Anónima Carnes Pampeanas, a company that owns a cold storage
plant in Santa Rosa, Province of La Pampa, with capacity to
slaughter and process approximately 9,500 cattle head per
month.
|
(1)
Excludes effect of treasury stock.
(2)
Includes Futuros y Opciones.Com S.A.’s interest.
(3)
Includes Helmir’s interest.
D. PROPERTY, PLANTS AND EQUIPMENT
Overview of Agricultural Properties
As of
June 30, 2020, we owned, together with our subsidiaries, 26
farmlands, which have a total surface area of 629,794
hectares.
The
following table sets forth our properties’ size (in
hectares), primary current use and book value. The market value of
farmland is generally higher the closer a farmland is located to
Buenos Aires:
|
Owned
Farmlands as of June 30,2020
|
|||||||
|
|
Facility
|
Province
|
Country
|
Gross
Size
(in
hectares)
|
Date
of Acquisition
|
Primary
Current Use
|
Net
Book Value
(ARS
Millions)
(1)
|
|
1
|
El
Recreo
|
Catamarca
|
Argentina
|
12,395
|
May
‘95
|
Natural
woodlands
|
10
|
|
2
|
Los
Pozos
|
Salta
|
Argentina
|
239,639
|
May
‘95
|
Cattle/
Agriculture/ Natural woodlands
|
1,981
|
|
3
|
San
Nicolás/Las Playas
|
Santa
Fe/Córdoba
|
Argentina
|
2,965
|
May
‘97
|
Agriculture/
Dairy
|
253
|
|
4
|
La Gramilla/ Santa
Bárbara
|
San
Luis
|
Argentina
|
7,072
|
Nov
‘97
|
Agriculture Under
irrigation
|
902
|
|
5
|
La
Suiza
|
Chaco
|
Argentina
|
26,371
|
Jun
‘98
|
Agriculture/
Cattle
|
619
|
|
6
|
El
Tigre
|
La
Pampa
|
Argentina
|
8,360
|
Apr
‘03
|
Agriculture/
Dairy
|
602
|
|
7
|
San
Pedro
|
Entre
Rios
|
Argentina
|
6,022
|
Sep
‘05
|
Agriculture
|
874
|
|
8
|
8 De Julio/
Estancia Carmen
|
Santa
Cruz
|
Argentina
|
100,911
|
May
‘07/ Sep ‘08
|
Sheep
|
147
|
|
9
|
Administración
Cactus
|
San
Luis
|
Argentina
|
171
|
Dec
‘97
|
Natural
woodlands
|
7
|
|
10
|
Las
Vertientes
|
Cordoba
|
Argentina
|
-
|
-
|
Silo
|
2
|
|
11/12/13
|
Las Londras/San
Rafael/ La Primavera
|
Santa
Cruz
|
Bolivia
|
9,875
|
Nov-08/Jan-11
|
Agriculture
|
1,733
|
|
14
|
Finca
Mendoza
|
Mendoza
|
Argentina
|
674
|
Mar
‘11
|
Natural
woodlands
|
15
|
|
15
|
Establecimiento
Mendoza
|
Mendoza
|
Argentina
|
9
|
Nov’03
|
Natural
woodlands
|
72
|
|
16
|
Marangatú/Udra
(2)
(3)
|
Mariscal
Estigarribia
|
Paraguay
|
59,585
|
Feb-09
|
Agriculture
/Natural Woodlands
|
2,982
|
|
17/26
|
Brasilagro
(2)
(3)
|
|
Brazil
|
155,745
|
|
Agriculture/
Forestry/Cattle
|
7,441
|
|
Subtotal
|
|
|
629,794
|
|
|
17,640
|
|
(1)
Acquisition costs
plus improvements and furniture necessary for the production, less
depreciation.
(2)
Hectares and
carrying amount in proportion to our 35.72% interest in Agro-Uranga
S.A.
(3)
See the section
“Overview of Brasilagro’s
Properties”.
Overview of Brasilagro’s Properties
As of
June 30, 2020, we owned, together with our subsidiaries, 11
farmlands, which have a total surface area of 216,013 hectares,
acquired at a highly convenient value compared to the average of
the region, all of them with a great appreciation
potential.
|
|
|
Total
Area
|
|
Net
Book Value
|
|
Properties
|
Place
|
(ha)
|
Use
|
(ARS
Millions)
|
|
Jatobá
Farmland
|
Jaborandi/BA
|
14,930
|
Agriculture
|
363
|
|
Alto Taquari
Farmland
|
Alto
Taquari/MT
|
5,103
|
Agriculture
|
426
|
|
Araucária
Farmland
|
Mineiros/GO
|
5,534
|
Agriculture
|
582
|
|
Chaparral
Farmland
|
Correntina/BA
|
37,182
|
Agriculture
|
1,146
|
|
Nova Buriti
Farmland
|
Januária/MG
|
24,212
|
Forestry
|
300
|
|
Preferência
Farmland
|
Barreiras/BA
|
17,799
|
Cattle
|
346
|
|
São José
Farmland
|
Maranhão/MA
|
17,566
|
Agriculture
|
1,414
|
|
Marangatu/ Udra
Farmlands
|
Boqueron
Paraguai
|
59,585
|
Agriculture
|
2,982
|
|
Arrojadinho
|
Barreiras/BA
|
16,642
|
Agriculture
|
1,057
|
|
Rio do
Meio
|
Correntina/MA
|
12,288
|
Agriculture
|
1.473
|
|
Serra
Grande
|
Correntina/BA
|
4,489
|
Agriculture
|
334
|
|
Total
Brazil
|
216,013
|
|
10,423
|
|
169
In the
ordinary course of business, the leases property or spaces for
administrative or commercial use both in Argentina and Israel under
operating lease arrangements. The agreements entered into include
several clauses, including but not limited, to fixed, variable or
adjustable payments.
Overview of Urban Properties and investment business
In the
ordinary course of business, the leases property or spaces for
administrative or commercial use both in Argentina and Israel under
operating lease arrangements. The agreements entered into include
several clauses, including but not limited, to fixed, variable or
adjustable payments.
The
following table sets forth certain information about our properties
for the Operation Center in Argentina as of June 30,
2020:
|
Property
(6)
|
Date of Acquisition
|
Leasable/ Sale m2 / Rooms
|
Location
|
Net Book
Value ARS
(2)
|
Use
|
Occupancy rate
|
|
República Building
(3)
|
Apr-08
|
19,885
|
City
of Buenos Aires
|
8,969
|
Office
Rental
|
86.9
%
|
|
Bankboston Tower
(3)(13)
|
Aug-07
|
14,865
|
City
of Buenos Aires
|
6,642
|
Office
Rental
|
96.4
%
|
|
Bouchard
551
|
Mar-07
|
-
|
City
of Buenos Aires
|
310
|
Office
Rental
|
-
|
|
Intercontinental Plaza Building
(3)
|
Nov-97
|
2,979
|
City
of Buenos Aires
|
993
|
Office
Rental
|
100
%
|
|
Bouchard 710
(3)(14)
|
Jun-05
|
15,014
|
City
of Buenos Aires
|
6,318
|
Office
Rental
|
92.5
%
|
|
Dot Building
(3)
|
Nov-06
|
11,242
|
City
of Buenos Aires
|
4,226
|
Office
Rental
|
84.9
%
|
|
Zetta
Building
|
Jun-19
|
32,173
|
City
of Buenos Aires
|
12,334
|
Office
Rental
|
97.5
%
|
|
Suipacha
664
|
Nov-91
|
11,465
|
City
of Buenos Aires
|
1,497
|
Office
Rental
|
31.20
%
|
|
Phillips
Building
|
Jun-17
|
8,017
|
City
of Buenos Aires
|
2,668
|
Office
Rental
|
82.70
%
|
|
San
Martín plot (ex Nobleza Picardo)
|
May-11
|
109,610
|
Province
of Buenos Aires, Argentina
|
5,500
|
Other
Rentals
|
22.5
%
|
|
Other Properties
(5)
|
N/A
|
N/A
|
City
and Province of Buenos Aires / Detroit U.S
|
4,390
|
Other
Rentals
|
N/A
|
|
Abasto Shopping
(3)
|
Nov-99
|
36,760
|
City
of Buenos Aires, Argentina
|
6,810
|
Shopping
Mall
|
94.9
%
|
|
Alto Palermo Shopping
(3)
|
Dec-97
|
18,655
|
City
of Buenos Aires, Argentina
|
8,246
|
Shopping
Mall
|
91.9
%
|
|
Alto Avellaneda
(3)
|
Dec-97
|
38,330
|
Province
of Buenos Aires, Argentina
|
4,649
|
Shopping
Mall
|
97.4
%
|
|
Alcorta Shopping
(3)(12)
|
Jun-97
|
15,725
|
City
of Buenos Aires, Argentina
|
4,867
|
Shopping
Mall
|
97.3
%
|
|
Patio Bullrich
(3)
|
Oct-98
|
11,396
|
City
of Buenos Aires, Argentina
|
2,335
|
Shopping
Mall
|
91.4
%
|
|
Alto Noa
(3)
|
Nov-95
|
19,313
|
City
of Salta, Argentina
|
1,157
|
Shopping
Mall
|
99.0
%
|
|
Mendoza Plaza
(3)
|
Dec-94
|
43,313
|
Mendoza,
Argentina
|
1,937
|
Shopping
Mall
|
97.8
%
|
|
Alto Rosario
(3)
|
Dec-04
|
33,681
|
Santa
Fe, Argentina
|
4,108
|
Shopping
Mall
|
97.2
%
|
|
Córdoba Shopping –Villa
Cabrera
(3)(11)
|
Dec-06
|
15,361
|
City
of Córdoba, Argentina
|
1,266
|
Shopping
Mall
|
95.4
%
|
|
Dot Baires Shopping
(3)
|
May-09
|
48,805
|
City
of Buenos Aires, Argentina
|
5,239
|
Shopping
Mall
|
74.6
%
|
|
Soleil Premium Outlet
(3)
|
Jul-10
|
15,156
|
Province
of Buenos Aires, Argentina
|
1,855
|
Shopping
Mall
|
97.1
%
|
|
La Ribera Shopping
(3)
|
Aug-11
|
10,530
|
Santa
Fe, Argentina
|
584
|
Shopping
Mall
|
99.0
%
|
|
Distrito Arcos
(3)
|
Dec-14
|
14,335
|
City
of Buenos Aires, Argentina
|
1,891
|
Shopping
Mall
|
93.8
%
|
|
Alto Comahue
(3)
|
Mar-15
|
11,702
|
Neuquén,
Argentina
|
1,263
|
Shopping
Mall
|
96.2
%
|
|
Patio Olmos
(3)
|
Sep-97
|
-
|
City
of Córdoba, Argentina
|
899
|
Shopping
Mall
|
N/A
|
|
Caballito Plot of Land
(3)
|
Nov-97
|
-
|
City
of Buenos Aires
|
3,154
|
Land
Reserve
|
N/A
|
|
Santa
María del Plata
|
Oct-97
|
116,100
|
City
of Buenos Aires
|
19,977
|
Other
Rentals
|
17.3
%
|
|
Catalinas
Building
|
May-10
|
-
|
City
of Buenos Aires
|
13,544
|
Offices
and Other Rentals
|
N/A
|
|
Luján plot of land
(3)
|
May-08
|
1,160,000
|
Province
of Buenos Aires, Argentina
|
960
|
Mixed
uses
|
N/A
|
|
Other Land Reserves
(4)
|
N/A
|
N/A
|
City
and Province of Buenos Aires
|
6,585
|
Land
Reserve
|
N/A
|
|
Building
annexed to Alto Palermo Shopping
|
N/A
|
N/A
|
City
of Buenos Aires
|
1,763
|
Properties
under development
|
N/A
|
|
Other
Developments(15)
|
N/A
|
N/A
|
City
of Buenos Aires
|
227
|
Properties
under development
|
N/A
|
|
Intercontinental Hotel
(7)
(12)
|
Nov-97
|
313
|
City
of Buenos Aires
|
605
|
Hotel
|
53.1
%
|
|
Libertador Hotel
(8)
(12)
|
Mar-98
|
200
|
City
of Buenos Aires
|
301
|
Hotel
|
37.2
%
|
|
Llao Llao Hotel
(9)(10)
(12)
|
Jun-97
|
205
|
City
of Bariloche
|
907
|
Hotel
|
43.3
%
|
|
|
|
|
|
|
|
|
170
(1)
Total leasable area for each property. Excludes common areas and
parking spaces.
(2)
Cost of acquisition or development plus improvements, less
accumulated depreciation, less allowances for our Hotels
(considering inflation adjustment). The remaining properties are
valued at fair value.
(3)
Through IRSA CP.
(4)
Includes the following land reserves: Pontevedra plot; Mariano
Acosta Plot, San Luis Plot, Pilar plot and Merlo plot (through
IRSA) and Intercontinental Plot, the building and plot annexed to
Dot, Mendoza plot, Mendoza 2.992 East Av. Plot and La Plata plot
(through IRSA CP).
(5)
Includes the following properties: Anchorena 665, Anchorena 545
(Chanta IV), Zelaya 3102, 3103 y 3105, Madero 1020, La Adela, Paseo
del Sol, Libertador 498, Beruti Parking Space, Santa María del
Plata and Detroit properties.
(6)
Percentage of occupation of each property. Land reserves are assets
that the company keeps in the portfolio for future
developments.
(7)
Through Nuevas Fronteras S.A.
(8)
Through Hoteles Argentinos S.A.U.
(9)
Through Llao Llao Resorts S.A.
(10)
Includes “Terreno Bariloche.”
(11)
The cinema building located at Córdoba Shopping – Villa
Cabrera is included in Investment Properties, which is encumbered
by a right of antichresis as a result of loan due to Empalme by NAI
INTERNACIONAL II Inc. Includes “Ocampo parking
spaces”
(12)
Express in number of rooms.
(13) On
July 15, 2020, our subsidiary IRSA CP sold one floor and five
parking spaces, on August 26, 2020, it sold five floors and twenty
five parking spaces, on November 5, 2020, it sold four floor and
fifteen parking spaces
and on November 12,
2020, it sold three floors and fifteen parking spaces
. For
more information, see “Recent Developments – Boston
Tower Floor’s sale - Signature of a Purchase ticket regarding
Boston Tower floor with possession”.
(14) On
July 30, 2020, IRSA CP sold the entire building. For more
information see: “Recent Developments – Bouchard 710
Building sale”
(15)
Includes the following propertiesdevelopments: EH UT, PH Office
Park, Phillips Building and Alto Avellaneda.
The
following table sets forth certain information about our properties
for the Operations Center in Israel as of June 30,
2020:
|
Property
|
Date
of acquisition
|
Location
|
Net
Book
Value
|
Use
|
|
Tivoli
|
oct-15
|
United
States
|
14,503
|
Rental
properties
|
|
HSBC
Building
|
oct-15
|
United
States
|
63,829
|
Rental
properties
|
|
Others
|
N/A
|
Israel
|
5,939
|
Rental
properties
|
|
Tivoli
|
oct-15
|
United
States
|
875
|
Undeveloped
parcels of land
|
|
Tivoli
|
oct-15
|
United
States
|
1,322
|
Properties
under development
|
|
Total
|
|
|
86,468
|
|
Insurance
Agricultural Business
We
carry insurance policies with insurance companies that we consider
financially sound. We employ insurance for our farming facilities
and industrial properties, which covers property damage, negligence
liability, fire, falls, collapse, lightning and gas explosion,
electrical and water damages, theft, and business interruption.
Such insurance policies have specifications, limits and
deductibles, which we believe, are customary. Nevertheless, they do
not cover damages to our crops. We carry directors and
officer’s insurance covering management’s civil
liability, as well as legally mandated insurance, including
employee personal injury. We also provide life or disability
insurance for our employees as benefits.
We
believe our insurance policies are adequate to protect us against
the risks for which we are covered. Nevertheless, some potential
losses are not covered by insurance and certain kinds of insurance
coverage may become prohibitively expensive.
The
types of insurance used by us are the following:
|
Insured
Property
|
Risk
Covered
|
Amount
Insured
|
Book
Value
|
|
|
|
(in
millions of ARS )
|
|
|
Buildings,
machinery, silos, installation and furniture and
equipment
|
Theft, fire and
technical insurance
|
2,657
|
5,960
|
|
Vehicles
|
Theft, fire and
civil and third parties liability
|
130
|
52
|
171
Urban Properties and Investment Business
IRSA carries all-risk insurance for the shopping malls
and other buildings covering property damage caused by
fire, terrorist acts, explosion, gas leak, hail, storms
and wind, earthquakes, vandalism, theft and business interruption.
In addition, IRSA carries liability insurance covering any
potential damage to third parties or property caused by the conduct
of our business throughout Argentina. IRSA is in compliance with
all legal requirements related to mandatory insurance, including
insurance required by the Occupational Risk Law
(
Ley de
Riesgos del Trabajo
), life
insurance required under collective bargaining agreements and other
insurance required by laws and executive orders. IRSA’s
history of damages is limited to one single claim resulting from a
fire in Alto Avellaneda Shopping in March 2006, which loss was
substantiaxlly recovered from our insurers. These insurance
policies contain specifications, limits and deductibles which we
believe are adequate to the risks to which we are exposed in our
daily operations. IRSA also maintains liability insurance covering
the liability of our directors and corporate
officers.
Control Systems
IRCP
has computer systems equipped to monitor tenants’ sales
(except stands) in all of its shopping malls. IRCP also conduct
regular audits of our tenants’ accounting sales records in
all of our shopping malls. Almost every store in its shopping malls
has a point of sale that is linked to our main server. IRCP uses
the information generated from the computer monitoring system to
prepare statistical data regarding, among other things, total
sales, average sales and peak sale hours for marketing purposes and
as a reference for the internal audit. Most of its shopping mall
lease agreements require the tenant to have its point of sale
system linked to our server.
This
item is not applicable.
A. CONSOLIDATED OPERATING RESULTS
The
following management’s discussion and analysis of our
financial condition and results of operations should be read
together with “Selected Consolidated Financial Data”
and Our Audited Consolidated Financial Statements and related notes
appearing elsewhere in this annual report. This discussion and
analysis of our financial condition and results of operations
contains forward-looking statements that involve risks,
uncertainties and assumptions. These forward-looking statements
include such words as, “expects,”
“anticipates,” “intends,”
“believes” and similar language. Our actual results may
differ materially and adversely from those anticipated in these
forward-looking statements as a result of many factors, including
without limitation those set forth elsewhere in this annual report.
See
Item 3 “Key Information
– D. Risk Factors”
for a more complete
discussion of the economic and industry-wide factors relevant to
us.
General
We prepare our Audited
Consolidated
Financial Statements in
pesos
and in accordance with IFRS, as issued by the
IASB, and with CNV Rules.
Historically, we measured the value of our portfolio of investment
properties at cost. Our board of directors resolved to change our
accounting policy for measuring the value of our investment
properties
from the cost model to the
fair value model, as permitted under IAS 40. Accordingly, we
retroactively recast our previously issued
audited
consolidated financial statements as
of June 30, 2016 and 2015 and for the fiscal years ended June 30,
2016, 2015 and 2014 as required by IAS 40 and
IAS 8.
We have furnished to the SEC such consolidated
financial statements as recast in a report on Form 6-K filed on May
26, 2017.
172
Our Audited Consolidated Financial Statements and the financial
information included elsewhere in this annual report have been
prepared in accordance with IFRS. We have determined that, as of
July 1, 2018, the Argentine economy qualifies as a
hyperinflationary economy according to the guidelines of IAS 29
since the total cumulative inflation in Argentina in the 36 months
prior to July 1, 2018 exceeded 100%. IAS 29 requires that the
financial information recorded in a hyperinflationary currency be
adjusted by applying a general price index and expressed in the
measuring unit (the hyperinflationary currency) current at the end
of the reporting period. Therefore, our Audited Consolidated
Financial Statements included in this annual report have been
adjusted by applying a general price index and expressed in the
measuring unit (the hyperinflationary currency) current at the end
of the reporting period (June 30, 2020). See “Risk
Factors—Risks Relating to Argentina—A high level of
uncertainty with regard to these economic variables, and a general
lack of stability in terms of inflation, could have a negative
impact on economic activity and adversely affect our financial
condition
Revenue Recognition
We
identify contracts with customers and evaluates the goods and
services committed therein to determine performance obligations and
their classification between performance obligations that are
satisfied at a given time or over time.
Revenue
from satisfaction of performance obligations at a given time is
recognized when the client obtains control of the committed asset
or service considering whether there is a right to collection, if
the client has the physical possession, if the client has the legal
right and if they have the transferred the risks and
benefits.
Additionally
and in accordance with IFRS 15, we recognize revenues over time
from the sales of real estate developments in which there is no
alternative use for the asset and the Group has the right to demand
payment of the contract. When these conditions are not met, the
income is recognized at the time of delivery or deed (see detail in
Note 2.2).
Revenue
from satisfaction of performance obligations over time for real
estate developments is recognized by measuring progress towards
compliance with the obligation when it can be measured reliably.
For this measurement, the Group uses the cost method, that is, the
effort consumed by the entity and determines the percentage of
progress based on the estimate of the total development
costs.
Revenue
are recognized at the probable value of the consideration to which
it will be entitled in exchange for transferring the products or
services to the customer which is not expected to suffer
significant changes.
Agricultural and agricultural-related activities:
Revenue
from our agricultural activities comes primarily from sales of
agricultural produce and biological assets, from provision of
services related to the activity and from leases of
farmlands.
We
recognize revenue on product sales when the agricultural produce or
biological assets are delivered and the customers take ownership
and assume risk of loss, which is when the products are received by
the customer at its or a designated location or collected directly
by the customer, collection is reasonably assured and the selling
price is fixed or determinable. Net sales of products represent the
invoiced value of goods, net of trade discounts and allowances, if
any.
We also
provides agricultural-related (including but not limited to
watering and feedlot services) and brokerage services to third
parties. Revenue from services are recognized when services are
effective rendered.
We also
leases land to third parties under operating lease agreements.
Lease income is recognized on a straight-line basis over the period
of the lease.
Urban properties and investments activities:
·
Rental and services - Shopping malls
portfolio
Revenues
derived from business activities developed in the Company’s
shopping malls mainly include rental income under operating leases,
admission rights, commissions and revenue from several
complementary services provided to the Group’s
lessees.
173
Rental
income from shopping mall, admission rights and commissions, are
recognized in the Statements of Income on a straight-line basis
over the term of the leases. When lease incentives are granted,
they are recognized as an integral part of the net consideration
for the use of the property and are therefore recognized on the
same straight-line basis.
Contingent
rents, i.e. lease payments that are not fixed at the inception of a
lease, are recorded as income in the periods in which they are
known and can be determined. Rent reviews are recognized when such
reviews have been agreed with tenants.
The
Company’s lease contracts also provide that common area
maintenance charges and collective promotion funds of the
Group’s shopping malls are borne by the corresponding
lessees, generally on a proportionally basis. These common area
maintenance charges include all expenses necessary for various
purposes including, but not limited to, the operation, maintenance,
management, safety, preservation, repair, supervision, insurance
and enhancement of the shopping malls. The lessor is responsible
for determining the need and suitability of incurring a common area
expense. We make the original payment for such expenses, which are
then reimbursed by the lessees. We consider that it acts as a
principal in these cases. Service charge income is presented
separately from property operating expenses. Property operating
expenses are expensed as incurred.
·
Rental and services - Offices and other rental
properties
Rental
income from offices and other rental properties include rental
income from offices leased out under operating leases, income from
services and expenses recovery paid by tenants.
Rental
income from offices and other rental properties is recognized in
the Statements of Income on a straight-line basis over the term of
the leases. When lease incentives are granted, they are recognized
as an integral part of the net consideration for the use of the
property and are therefore recognized on the same straight-line
basis.
A
substantial portion of the Company’s leases requires the
tenant to reimburse the Company for a substantial portion of
operating expenses, usually a proportionate share of the allocable
operating expenses. Such property operating expenses include
necessary expenses such as property operating, repairs and
maintenance, security, janitorial, insurance, landscaping, leased
properties and other administrative expenses, among others. We
manage its own rental properties. We make the original payment for
these expenses, which are then reimbursed by the lessees. We
consider that it acts as a principal in these cases. We accrue
reimbursements from tenants as service charge revenue in the period
the applicable expenditures are incurred and is presented
separately from property operating expenses. Property operating
expenses are expensed as incurred.
·
Revenue from communication services and sale
of communication equipment
Revenue
derived from the use of the Company’s communication networks,
including mobile phones, Internet services, international calls,
fixed line calls, interconnection rates and roaming service rates
and television, are recognized when the service is provided,
proportionally to the extent the transaction has been realized, and
provided all other criteria have been met for revenue
recognition.
Revenue
from the sale of mobile phone cards is initially recognized as
deferred revenue and then recognized as revenue as they are used or
upon expiration, whichever takes place earlier.
A
transaction involving the sale of equipment to a final user
normally also involves a service sale transaction. In general, this
type of sale is performed without a contractual obligation by the
client to consume telephone services for a minimum amount over a
predetermined period. As a result, the Company records the sale of
equipment separately of the performance obligations and recognizes
revenue pursuant to the transaction value upon delivery of the
equipment to the client. Revenue from telephone services is
recognized and accounted for as they are provided over time. When
the client is bound to make a minimum consumption of services
during a predefined period, the contract formalizes a transaction
of several elements and, therefore, revenue from the sale of
equipment is recorded at an amount that should not exceed its fair
value, and is recognized upon delivery of the equipment to the
client and provided the criteria for recognition are met. The
Company ascertains the fair value of individual elements, based on
the price at which it is normally sold, after taking into account
the relevant discounts.
174
Revenue
derived from long-term contracts is recognized at the present value
of future cash flows, discounted at market rates prevailing on the
transaction date. Any difference between the original credit and
its net present value is accounted for as interest income over the
credit term.
·
Revenues from supermarkets
Revenue
from the sale of goods in the ordinary course of business is
recognized at the fair value of the consideration collected or
receivable, net of returns and discounts. When the credit term is
short and financing is that typical in the industry, consideration
is not discounted. When the credit term is longer than the
industry’s average, in accounting for the consideration, the
Company discounts it to its net present value by using the
client’s risk premium or the market rate. The difference
between the fair value and the nominal amount is accounted for
under financial income. If discounts are granted and their amount
can be measured reliably, the discount is recognized as a reduction
of revenue.
Revenues
from supermarkets have been recognized in discontinued
operations
Effects of the global macroeconomic factors
Most of
our assets are located in Argentina, where we conduct our
operations, and in Israel and Brazil. Therefore, our financial
condition and the results of our operations are significantly
dependent upon economic conditions prevailing in that
countries.
The
table below shows Argentina’s GDP, inflation rates, dollar
exchange rates, the appreciation (depreciation) of the Peso against
the U.S. dollar, and the appreciation (depreciation) of the NIS
against the U.S. dollar for the indicated periods (inter-annual
information—which is the 12 month period preceding the
dates presented—is presented to conform to our fiscal year
periods).
|
|
Fiscal
year ended June 30,
|
||
|
|
2020
|
2019
|
2018
|
|
|
(inter-annual
data)
|
||
|
GDP
(1)
|
(19.1
)%
|
(3.7
)%
|
2.0
%
|
|
Inflation
(IPIM)(2)
|
39.7
%
|
60.8
%
|
44.1
%
|
|
Inflation
(CPI)
|
42.8
%
|
55.8
%
|
29.5
%
|
|
Depreciation of the
Peso against the U.S. dollar
|
(66.1
)%
|
(47.1
)%
|
(73.7
)%
|
|
Average exchange
rate per USD1.00(3)
|
ARS
70.3600
|
ARS
42.3630
|
ARS
28.8000
|
|
Appreciation/
(depreciation) of the NIS against the U.S. Dollar
|
3.0
%
|
2.4
%
|
(4.8
)%
|
(1)
Represents inter annual growth of the last twelve months GDP
average at constant prices (2004).
(2)
IPIM (Índice
de Precios Internos al por Mayor) is the wholesale price index as
measured by the Argentine Ministry of Treasury.
(3)
Represents average
of the selling and buying exchange rate
quoted by Banco de la Nación
Argentina as of June 30, 2020. As of November 13, 2020, the
exchange rate was 79.7500 per U.S. Dollar.
Sources:
INDEC and Banco de la Nación Argentina.
Argentine
GDP contracted 19.1% during our 2020 fiscal year, compared to a
contraction of 3.7% in our fiscal year 2019. Nationally, shopping
mall sales decreased 82.2% in the fiscal 2020 compared to fiscal
2019. As of June 30, 2020, the unemployment rate was at 13.1% of
the country’s economically active population compared to
10.6% as of June 30, 2019. The monthly estimate of economic
activity (“EMAE”) as of June 30, 2020, contracted by
12.3% compared to the same month in 2019. In the second quarter of
2020, the activity rate was 38.4%, the employment rate was 33.4%
and the unemployment rate was 13.1%.
In the
context of the health emergency related to the COVID-19 pandemic,
the main impact on the labor market was verified in the dynamics of
the employment rate (TE), which measures the proportion of employed
persons in relation to the total population. The second quarter of
2020 showed a drop of 8.8 percentage points (p.p.) compared to the
first quarter of the year and of 9.2 p.p. compared to the second
quarter of 2019, driven by the lower proportion of people who were
able to report to work. Due to Covid-19, total sales at current
prices in the month of June 2020 relevant to the survey reached a
total of ARS 2,841.6 million, which represents a decrease of 82.2%
compared to the month of June 2019.
175
Changes
in short- and long-term interest rates, unemployment and inflation
rates may reduce the availability of consumer credit and the
purchasing power of individuals who frequent shopping malls. These
factors, combined with low GDP growth, may reduce general
consumption rates at our shopping malls. Since most of the lease
agreements in our shopping malls, our main source of revenue,
require tenants to pay a percentage of their total sales as rent, a
general reduction in consumption may reduce our revenue. A
reduction in the number of shoppers at our shopping malls and,
consequently, in the demand for parking, may also reduce our
revenues from services rendered.
Regarding
Israel’s economy, and based on information published by OECD,
despite a decline in residential investment, activity remained
solid at the beginning of 2018, with strong public consumption and
good export performance, particularly of services. After picking up
to 3.3% in 2017, growth is projected to be around 3.7% in 2018 and
3.6% in 2019. Rising wage pressures are projected to lead to a
steady increase in inflation. Changes in short- and long-term
interest rates, unemployment and inflation rates may reduce the
availability of consumer credit and the purchasing power of
individuals who frequent shopping malls. These factors, combined
with low GDP growth, may reduce general consumption rates at our
shopping malls. Since most of the lease agreements in our shopping
malls, our main source of revenue, require tenants to pay a
percentage of their total sales as rent, a general reduction in
consumption may reduce our revenue. A reduction in the number of
shoppers at our shopping malls and, consequently, in the demand for
parking, may also reduce our revenues from services
rendered.
Regarding
Israel’s economy, and based on information published by OECD,
despite a decline in residential investment, activity remained
solid at the beginning of 2018, with strong public consumption and
good export performance, particularly of services. After picking up
to 3.3% in 2017, growth is projected to be around 3.7% in 2018 and
3.6% in 2019. Rising wage pressures are projected to lead to a
steady increase in inflation.
Effects of inflation
The
following are annual inflation rates during the fiscal years
indicated, based on information published by the INDEC, an entity
dependent of the Argentine Ministry of Treasury.
|
|
Consumerprice
index
|
Wholesaleprice
index
|
|
|
(inter-annual
data)
|
|
|
Fiscal
year ended June 30,
|
|
|
|
2018
|
29.5
%
|
44.1
%
|
|
2019
|
55.8
%
|
60.8
%
|
|
2020
|
42.8
%
|
39.7
%
|
The
current structure of IRSA CP’s leases contracts for shopping
mall tenants generally includes provisions that provide for payment
of variable rent, which is a percentage of of the IRSA CP’s
shopping mall tenant’s sales. Therefore, the projected cash
flows for these shopping malls generally are highly correlated with
GDP growth and consumption power.
For the
leases of spaces at our shopping malls we use for most tenants a
standard lease agreement, the terms and conditions of which are
described elsewhere in this annual report However, our largest
tenants generally negotiate better terms for their respective
leases. No assurance can be given that lease terms will be as set
forth in the standard lease agreement.
The
rent specified in our leases generally is the higher of (i) a
monthly Base Rent and (ii) a specified percentage of the
store’s monthly gross sales, which generally ranges between
2% and 10% of such sales. In addition, pursuant to the rent
escalation clause in most of our leases, a tenant’s Base Rent
generally increases between 10% and 15% on a semi annual and
cumulative basis from the seventh (7th) month following
effectiveness of the lease. Although many of our lease agreements
contain price adjustment provisions, these are not based on an
official index nor do they reflect the inflation index. In the
event of litigation regarding these adjustment provisions, there
can be no assurance that we may be able to enforce such clauses
contained in our lease agreements. See “Information of the
Company—Business Overview—Our Shopping
Malls—Principal Terms of our Leases.”
176
Continuing
increases in the rate of inflation are likely to have an adverse
effect on our operations. Although higher inflation rates in
Argentina may increase minimum lease payments, given that tenants
tend to pass on any increases in their expenses to consumers,
higher inflation may lead to an increase in the prices our tenants
charge consumers for their products and services, which may
ultimately reduce their sales volumes and consequently the portion
of rent we receive based on our tenants’ gross sales.In
addition, we measure the fair market value of our shopping malls
based upon the estimated cash flows generated by such assets which,
as discussed in previous paragraphs, is directly related to
consumer spending since a significant component of the rent payment
received from our tenants is tied to the sales realized by such
tenants (i.e is a percentage of the sales of our tenants).
Therefore, macroeconomic conditions in Argentina have an impact in
the fair market value of our shopping malls as measured in
Argentine pesos. Specifically, since our tenant’s products
have been adjusted (increased) to account for inflation of the
Argentine peso, our expected cash flows from our shopping malls
have similarly increased in nominal terms since rent is largely
dependent on sales of our tenants in pesos.
Seasonality
IRSA’s
shopping malls business is directly affected by seasonality,
influencing the level of our tenants’ sales. During Argentine
summer holidays (January and February) our tenants’ sales
typically reach their lowest level, whereas during winter holidays
(July) and in Christmas (December) they reach their maximum level.
Clothing retailers generally change their collections in spring and
autumn, positively affecting our shopping malls’ sales.
Discount sales at the end of each season are also one of the main
seasonal factors affecting our business. See “Item 5.A.
Operating Results – The Ongoing COVID-19
Pandemic.”
In
Israel, the retail segment business’s results are subject to
seasonal fluctuations as a result of the consumption behavior of
the population proximate to the Passover holidays (March and/or
April) and Rosh Hashanah and Sukkoth holidays (September and/or
October). This also affects the balance sheet values of inventory,
customers and suppliers. Revenues from cellular services are
usually affected by seasonality with the third quarter of the year
characterized by higher roaming revenues due to increased incoming
and outgoing tourism. On July 23, 2020, DIC concluded a sales
agreement for a total amount of Shufersal’s shares, the
consideration received was of NIS 1,456 million. For more
information see: “IRSA’s Recent Developments - Sale of
DIC shares in Shufersal”
Effects of interest rate fluctuations
Most of
our U.S. dollar-denominated debt accrues interest at a fixed rate.
An increase in interest rates will result in a significant increase
in our financing costs and may materially affect our financial
condition or our results of operations.
In
addition, a significant increase of interest rates could
deteriorate the terms and conditions in which our tenants obtain
financing from banks and financial institutions in the market. As a
consequence of that, if they suffer liquidity problems the
collection of our lease contracts could be affected by an increase
in the level of delinquency
Effects of foreign currency fluctuations
A
significant portion of our financial debt is denominated in U.S.
dollars. Therefore, a devaluation or depreciation of the peso
against the U.S. dollar would increase our indebtedness measured in
pesos and materially affect our results of operations. Foreign
currency exchange restrictions imposed by the Argentine government
could prevent or restrict our access to U.S. dollars, affecting our
ability to service our U.S. dollar denominated
liabilities.
In
addition, contracts for the rental of office buildings are
generally stated in U.S. dollars, so a devaluation or depreciation
of the peso against the U.S. dollar would increase the risk of
delinquency on our lease receivables.
177
As
discussed above, we calculate the fair market value of our office
properties based on comparable sales transactions. Typically real
estate transactions in Argentina are transacted in U.S. dollars.
Therefore, a devaluation or depreciation of the peso against the
U.S. dollar would increase the value of our real estate properties
measured in pesos and an appreciation of the peso would have the
opposite effect. In addition, foreign currency exchange
restrictions imposed by Argentine government could prevent or
restrict the access to U.S. dollars for the acquisition of real
estate properties, which are denominated and transacted in U.S
dollars in Argentina, that could affect our ability to sell or
acquire real estate properties and could have an adverse impact in
real estate prices.
For
more information about the evolution of the U.S dollar / Peso
exchange rate, see “Exchange Rate and Exchange
Controls”.
Fluctuations in the market value of our investment properties as a
result of revaluations
Currently,
our interests in investment properties are revalued quarterly. Any
increase or decrease in the fair value of our investment
properties, based on appraisal reports prepared by appraisers, is
recorded in our consolidated statement of comprehensive income for
the fiscal year during which the revaluation occurs. The
revaluation of our properties may therefore result in significant
fluctuations in the results of our operations.
Property
values are affected by, among other factors, a) shopping malls,
which are mainly impacted by the discount rate used (WACC), the
projected GDP growth and the projected inflation and devaluation
for future periods and b) office buildings, which are mostly
impacted by the supply and demand of comparable properties and the
U.S. dollar / peso exchange rate at the reporting period, as office
buildings fair value is generally established in U.S. dollars For
example:
●
during the 2018
fiscal year there was a 73.5% depreciation of the peso from ARS
16.63 to USD1.00 as of June 30, 2017 to ARS 28.85 to USD1.00 as of
June 30, 2018; and
●
during the 2019
fiscal year, there was a 47.1% depreciation of the peso from ARS
28.85 to USD1.00 as of June 30, 2018 to ARS 42.363 to USD1.00 as of
June 30, 2019.
●
during the 2020
fiscal year, there was a 66.1% depreciation of the peso from ARS
42.363 to USD1.00 as of June 30, 2019 to ARS 70.36 to USD1.00 as of
June 30, 2020.
The
value of the Company investment properties is determined in U.S.
dollar pursuant to the methodologies further described in
“Critical Accounting Policies and estimates” and then
determined in pesos (the Company functional and presentation
currency).
In the
past, purchases and sales of office buildings were usually settled
in US dollars, However, as a consequence of the restrictions
imposed by the BCRA on foreign exchange transactions, purchase and
sales of office buildings are now usually settled in Argentine
pesos, using an implicit exchange rate that is higher than the
official one (as it was the case in the operations carried out by
IRSA CP in the past few months). Therefore, IRSA CP has valued its
office buildings and undeveloped parcels of land in Argentine pesos
at the end of the year, considering the situation described above,
which results in a gain with respect to the values
previously recorded.
Factors Affecting Comparability of our Results Factors Affecting
Comparability of our Results
Comparability of information
Operations Center in Argentina
Office buildings
On June
30, 2019, IRSA CP’s Office portfolio consisted of 115,378
square meters of GLA after incorporating the recently inaugurated
Zetta building. Additionally, IRSA CP acquired the Maltería
Hudson plot that has a surface area of 147,895 square meters and
approximately 40,000 GLA at the intersection of Route 2 and Buenos
Aires - La Plata highway.
On June 30, 2020, IRSA CP has acquired as an investment property
the building “200 Della Paolera” located in Catalinas
District in Buenos Aires. It consists of 35,208 square meters
of gross leasable area over 30 office floors and includes 316
parking lots in 4 basements.
178
Shopping malls
During
the fiscal years ended June 30, 2020 and 2019, we maintained
the same portfolio of operating shopping malls. During the fiscal
year ended June 30, 2019, the surface area of our Shopping Malls
segment was reduced by 11,875 square meter due to the return of
Buenos Aires Design, whose concession terminated in November
2018.
Operations Center in Israel
IDBD
and DIC, our principal subsidiaries in the Operations Center in
Israel, report their quarterly and annual results following Israeli
regulations, whose filing deadlines fall after the filing deadlines
in Argentina. In addition, IDBD and DIC fiscal year ends differ
from our fiscal year end, consequently, we consolidate the results
of operations from IDBD and DIC on a three-month lag basis adjusted
for the effects of any significant transactions taking place within
such period. As such, our consolidated statement of income for the
year ended June 30, 2020 includes the results of IDBD and DIC for
the 12-month period from April 1, 2019 to March 31, 2020, adjusted
for the significant transactions that occurred between April 1,
2020 and June 30, 2020.
Critical Accounting Policies and Estimates
Our
Audited Consolidated Financial Statements are prepared in
accordance with IFRSs as issued by the IASB, and the accounting
policies employed are set out in our Accounting Policies section in
the financial statements. In applying these policies, we make
estimates and assumptions that affect the reported amounts of
assets and liabilities and disclosure of contingent assets and
liabilities. The actual outcome could differ from those estimates.
Some of these policies require a high level of judgment because the
areas are especially subjective or complex.
The
discussion below should also be read in conjunction with our
disclosure of significant IFRS accounting policies, which is
provided in Note 2 to our Audited Consolidated Financial
Statements, “Summary of significant accounting
policies”.
The
following is intended to provide an understanding of the policies
that management considers critical because of the level of
complexity, judgment or estimations involved in their application
and their impact on the Audited Consolidated Financial Statements.
These judgments involve assumptions or estimates in respect of
future events. Actual results may differ from these
estimates.
179
|
Estimation
|
Main assumptions
|
Potential implications
|
|
Business
combination - Allocation of acquisition prices
|
Assumptions
regarding timing, amount of future revenues and expenses, revenue
growth, expected rate of return, economic conditions, and discount
rate, among other.
|
Should
the assumptions made be inaccurate, the recognized combination may
not be correct.
|
|
Recoverable
amounts of cash-generating units (even those including goodwill),
associates and assets.
|
The
discount rate and the expected growth rate before taxes in
connection with cash-generating units.
The
discount rate and the expected growth rate after taxes in
connection with associates.
Cash
flows are determined based on past experiences with the asset or
with similar assets and in accordance with the Group’s best
factual assumption relative to the economic conditions expected to
prevail.
Business
continuity of cash-generating units.
Appraisals
made by external appraisers and valuators with relation to the
assets’ fair value, net of realization costs (including real
estate assets).
|
Should
any of the assumptions made be inaccurate; this could lead to
differences in the recoverable values of cash-generating
units.
|
|
Control,
joint control or significant influence
|
Judgment
relative to the determination that the Group holds an interest in
the shares of investees (considering the existence and influence of
significant potential voting rights), its right to designate
members in the executive management of such companies (usually the
Board of directors) based on the investees’ bylaws; the
composition and the rights of other shareholders of such investees
and their capacity to establish operating and financial policies
for investees or to take part in the establishment
thereof.
|
Accounting
treatment of investments as subsidiaries (consolidation) or
associates (equity method)
|
|
Estimated
useful life of intangible assets and property, plant and
equipment
|
Estimated
useful life of assets based on their conditions.
|
Recognition
of accelerated or decelerated depreciation by comparison against
final actual earnings (losses).
|
|
Fair
value valuation of investment properties
|
Fair
value valuation made by external appraisers and valuators. See Note
9 to our Audited Consolidated Financial Statements.
|
Incorrect
valuation of investment property values
|
|
Income
tax
|
The
Group estimates the income tax amount payable for transactions
where the Treasury’s Claim cannot be clearly
determined.
Additionally,
the Group evaluates the recoverability of assets due to deferred
taxes considering whether some or all of the assets will not be
recoverable.
|
Upon
the improper determination of the provision for income tax, the
Group will be bound to pay additional taxes, including fines and
compensatory and punitive interest.
|
|
Allowance
for doubtful accounts
|
A
periodic review is conducted of receivables risks in the
Group’s clients’ portfolios. Bad debts based on the
expiration of account receivables and account receivables’
specific conditions.
|
Improper
recognition of charges / reimbursements of the allowance for bad
debt.
|
|
Level 2
and 3 financial instruments
|
Main
assumptions used by the Group are:
●
Discounted
projected income by interest rate
●
Values determined
in accordance with the shares in equity funds on the basis of its
Financial Statements, based on fair value or investment
assessments.
●
Comparable market
multiple (EV/GMV ratio).
●
Underlying
asset price (Market price); share price volatility (historical) and
market interest rate (Libor rate curve).
|
Incorrect
recognition of a charge to income / (loss).
|
|
Probability
estimate of contingent liabilities.
|
Whether
more economic resources may be spent in relation to litigation
against the Group, such estimate is based on legal advisors’
opinions.
|
Charge
/ reversal of provision in relation to a claim.
|
|
Qualitative
considerations for determining whether or not the replacement of
the debt instrument involves significantly different
terms
|
The
entire set of characteristics of the exchanged debt instruments,
and the economic parameters represented therein:
Average
lifetime of the exchanged liabilities; Extent of effects of the
debt terms (linkage to index; foreign currency; variable interest)
on the cash flows from the instruments.
|
Classification
of a debt instrument in a manner whereby it will not reflect the
change in the debt terms, which will affect the method of
accounting recording.
|
|
Biological
assets
|
Main
assumptions used in valuation are yields, production costs, selling
expenses, forwards of sales prices, discount rates.
|
Wrong
recognition/valuation of biological assets. See sensitivities
modeled on these parameters in Note 14 to our Audited Consolidated
Financial Statements
.
|
180
Business Segment Information
IFRS 8
requires an entity to report financial and descriptive information
about its reportable segments, which are operating segments or
aggregations of operating segments that meet specified criteria.
Operating segments are components of an entity about which separate
financial information is available that is evaluated regularly by
the CODM. According to IFRS 8, the CODM represents a function
whereby strategic decisions are made and resources are assigned.
The CODM function is carried out by our chief executive officer,
Mr. Eduardo S. Elsztain. In addition, and due to the acquisition of
IDBD, two responsibility levels have been established for resource
allocation and assessment of results of the two operations centers,
through executive committees in Argentina and Israel.
Segment
information is analyzed by the CODM from two perspectives: by
geography (Argentina and Israel) and by products and services. In
each operations center, the Company considers separately the
various activities being developed, which represent reporting
operating segments given the nature of its products, services,
operations and risks. Management believes the operating segment
clustering in each operations center reflects similar economic
characteristics in each region, as well as similar products and
services offered, types of clients and regulatory
environments.
As of
fiscal year 2018, the CODM reviews certain corporate expenses
associated with each operations center in an aggregate manner and
separately from each of the segments, and such expenses have been
disclosed in the “Corporate” segment of each operation
center. Additionally, as of fiscal year 2018, the
“Offices” business is being monitored as a separate
segment, while the entertainment business is now being monitored
within the “Others” segment. Segment information for
the year 2017 has been consequently recast for purposes of
comparability with the present year.
The
"Agricultural production"
segment consists of planting, harvesting and sale of crops as
wheat, corn, soybeans, cotton and sunflowers; the sale of grain
derivatives, such as flour and oil, breeding, purchasing and/or
fattening of free-range cattle for sale to meat processors and
local livestock auction markets; agricultural services; leasing of
the Group's farms to third parties; and planting, harvesting and
sale of sugarcane.
In the
third quarter of the fiscal year 2018, we have changed the
presentation of the agricultural business segment which is
monitored regularly by the CODM for a better alignment with the
current business structure. The former four operating segments
(crops, cattle, dairy and sugarcane) have been aggregated into a
single operating segment named “Agricultural
production”. Management considered for the aggregation the
nature of the production processes (growing of biological assets),
the methods used to distribute their products and the nature of the
regulatory environment (agricultural business). Therefore this
quarter four segments are considered:
Agricultural business:
In the
third quarter of the fiscal year 2018, we have changed the
presentation of the agricultural business segments which are
reviewed by the CODM for a better alignment with the current
business vision and the metrics used to such end. Four operating
segments (crops, cattle, dairy and sugarcane) have been aggregated
into a single operating segment named “Agricultural
production”. Management consider for the aggregation the
nature of the production processes (growing of biological assets),
the methods used to distribute their products and the nature of the
regulatory environment (agricultural business). Therefore this
quarter three segments are considered:
The
“Agricultural
production”
segment consists of planting, harvesting
and sale of crops as wheat, corn, soybeans, cotton and sunflowers;
the sale of grain derivatives, such as flour and oil, breeding,
purchasing and/or fattening of free-range cattle for sale to meat
processors and local livestock auction markets; agricultural
services; leasing of the Group's farms to third parties; and
planting, harvesting and sale of sugarcane.
The
“Land transformation and
sales”
segment comprises gains from the disposal and
development of farmlands activities
The
“Other”
segment
includes, principally, slaughtering and processing in the meat
refrigeration plant; and brokerage activities, among
others.
The
“Corporate”
segment includes corporate expenses related to agricultural
business.
181
Urban properties and investments business:
Operations Center in Argentina
Within
this center, IRSA operates in the following segments:
The
“Shopping Malls” segment includes results principally
comprised of lease and service revenues related to rental of
commercial space and other spaces in the shopping malls of the
Company.
●
The
“Offices” segment includes the operating results from
lease revenues of offices, other rental spaces and other service
revenues related to the office activities.
●
The “Sales
and Developments” segment includes the operating results of
the development, maintenance and sales of undeveloped parcels of
land and/or trading properties. Real estate sales results are also
included.
●
The
“Hotels” segment includes the operating results mainly
comprised of room, catering and restaurant revenues.
●
The
“International” segment includes assets and operating
profit or loss from business related to associates Condor (hotels)
and New Lipstick (offices).
●
The
“Others” s segment primarily includes the entertainment
activities through La Arena and La Rural S.A. and the financial
activities carried out by BHSA and Tarshop.
●
The
“Corporate” segment includes the expenses related to
the corporate activities of the Operations Center in
Argentina.
The
CODM periodically reviews the results and certain asset categories,
assesses performance of operating segments and allocates resources
within this operations center based on a measure of profit or loss
of the segment represented by the operating income (loss) plus the
share of profit / (loss) of joint ventures and associates. The
valuation criteria used in preparing this information are
consistent with IFRS standards used for the preparation of the
Audited Consolidated Financial Statements, except for the
following:
●
Operating results
from joint ventures are evaluated by the CODM applying proportional
consolidation method. Under this method the profit/loss generated
and assets are reported in the Statement of Income line-by-line
based on the percentage held in joint ventures rather than in a
single item as required by IFRS. Management believes that the
proportional consolidation method provides more useful information
to understand the business return. On the other hand, the
investment in the joint venture La Rural S.A. is accounted for
under the equity method since this method is considered to provide
more accurate information in this case.
●
Operating results
from Shopping Malls and Offices segments do not include the amounts
pertaining to building administration expenses and collective
promotion funds (“FPC”, as per its Spanish acronym) as
well as total recovered costs, whether by way of expenses or other
concepts included under financial results (for example default
interest and other concepts). The CODM examines the net amount from
these items (total surplus or deficit between building
administration expenses and FPC and recoverable
expenses).
The
assets’ categories examined by the CODM are: investment
properties, property, plant and equipment, trading properties,
inventories, right to receive future units under barter agreements,
investment in associates and goodwill. The sum of these assets,
classified by business segment, is reported under “assets by
segment”. Assets are allocated to each segment based on how
they are used in the operations and/or their physical
location.
Within
the Operations Center in Argentina, most revenue from its operating
segments is derived from, and their assets are located in,
Argentina, except for the share of profit / (loss) of associates
included in the “International” segment located in
USA.
Revenues
for each reporting segments derive from a large and diverse client
base and, therefore, there is no revenue concentration in any
particular segment.
182
Operations Center in Israel
Within
this center, as of June 30, 2020, IRSA operated in the
following segments:
The
“Real Estate”
segment through PBC, the Company operates rental properties and
residential properties in Israel, USA and other parts of the world
and carries out commercial projects in Las Vegas, USA.
The
“Telecommunications”
segment
includes Cellcom whose main activities include the provision of
mobile phone services, fixed line phone services, data and Internet
and television, among others.
The
“Others”
segment
includes other diverse business activities, such as technological
developments, tourism, oil and gas assets, electronics, and
others.
The
“Corporate”
segment includes the expenses related with the activities of the
holding companies.
The
Company consolidates results derived from its operations center in
Israel with a three month lag, adjusted for the effects of
significant transactions. For the fiscal year ended June 30, 2020,
a full twelve-month period is consolidated, also with a three-month
lag and adjusted for the effects of significant
transactions.
Goods
and services exchanged between segments are calculated on the basis
of established prices. Intercompany transactions between segments,
if any, are eliminated. Within the agricultural business, most
revenue from its operating segments are generated from, and their
assets are located in Argentina and Brazil. Within the urban
properties and investment business, the Operations Center in
Argentina, has most its revenue from its operating segments derived
from, and their assets are located in, Argentina, except for the
share of profit / (loss) of associates included in the
“International” segment located in USA. In the
operations center in Israel, also within the urban properties and
investment business, most revenue from its operating segments is
derived from and their assets are located in Israel, except for
certain earnings from the Real Estate segment which are
generatedfrom activities outside Israel, mainly in USA. For the
agricultural business and the urban properties and investments
business from the operations center in Argentina, the assets
categories reviewed by the CODM are investment properties,
property, plant and equipment, investment in joint ventures and
associates and other reportable assets (goodwill and trading
properties, inventories, biological assets and right to receive
future units under barter agreements). The aggregate of these
assets, classified by operating segment, are disclosed as
“segment assets”. Assets are allocated to each segment
based on the operations and/or their physical
location.
183
Below
is a summarized analysis of the operating segments of the Company
for the year ended June 30, 2020:
|
|
06.30.20
|
|||||||||
|
|
|
Urban Properties and Investment business (II)
|
|
|
|
|
|
|
||
|
|
|
Operations Center in Argentina
|
Operations Center in Israel
|
Subtotal
|
Total segment information
|
Joint ventures (i)
|
Discontinued operations (ii)
|
Adjustments (iii)
|
Elimination of inter-segment transactions and non-reportable
assets / liabilities (iv)
|
|
|
|
(In
million of ARS)
|
|||||||||
|
Revenues
|
26,259
|
11,138
|
81,637
|
92,775
|
119,034
|
(60
)
|
-
|
3,100
|
(818
)
|
121,256
|
|
Costs
|
(22,283
)
|
(2,755
)
|
(56,296
)
|
(59,051
)
|
(81,334
)
|
53
|
-
|
(3,230
)
|
540
|
(83,971
)
|
|
Initial
recognition and changes in the fair value of biological assets and
agricultural products at the point of harvest
|
2,623
|
-
|
-
|
-
|
2,623
|
-
|
-
|
-
|
204
|
2,827
|
|
Changes
in the net realizable value of agricultural products after
harvest
|
657
|
-
|
-
|
-
|
657
|
-
|
-
|
-
|
-
|
657
|
|
Gross profit / (loss)
|
7,256
|
8,383
|
25,341
|
33,724
|
40,980
|
(7
)
|
-
|
(130
)
|
(74
)
|
40,769
|
|
Gain
from disposal of farmlands
|
838
|
-
|
-
|
-
|
838
|
-
|
-
|
-
|
-
|
838
|
|
Net
gain from fair value adjustment of investment
properties
|
780
|
33,464
|
(2,989
)
|
30,475
|
31,255
|
(263
)
|
-
|
-
|
-
|
30,992
|
|
General
and administrative expenses
|
(1,419
)
|
(2,150
)
|
(8,764
)
|
(10,914
)
|
(12,333
)
|
15
|
-
|
-
|
51
|
(12,267
)
|
|
Selling
expenses
|
(2,61
)
|
(1,232
)
|
(12,544
)
|
(13,776
)
|
(16,386
)
|
19
|
-
|
-
|
19
|
(16,348
)
|
|
Impairment
of associates
|
-
|
-
|
(2,470
)
|
(2,470
)
|
(2,470
)
|
-
|
-
|
-
|
-
|
(2,470
)
|
|
Other
operating results, net
|
1,662
|
(48
)
|
1,127
|
1,079
|
2,741
|
18
|
-
|
17
|
(6
)
|
2,770
|
|
Management
fees
|
-
|
-
|
-
|
-
|
-
|
-
|
-
|
(211
)
|
-
|
(211
)
|
|
Profit / (loss) from operations
|
6,507
|
38,417
|
(299
)
|
38,118
|
44,625
|
(218
)
|
-
|
(324
)
|
(10
)
|
44,073
|
|
Share
of profit / (loss) of associates and joint ventures
|
127
|
7,047
|
1,299
|
8,346
|
8,473
|
169
|
-
|
-
|
20
|
8,662
|
|
Segment profit / (loss)
|
6,634
|
45,464
|
1
|
46,464
|
53,098
|
(49
)
|
-
|
(324
)
|
10
|
52,735
|
|
|
|
|
|
|
|
|
-
|
|
|
|
|
Reportable
assets
|
37,070
|
157,987
|
451,267
|
609,254
|
646,324
|
(671
)
|
-
|
-
|
41,287
|
686,94
|
|
Reportable
liabilities
|
-
|
-
|
(403,184
)
|
(403,184
)
|
(403,184
)
|
-
|
-
|
-
|
(161,603
)
|
(564,787
)
|
|
Net reportable assets
|
37,070
|
157,987
|
48,083
|
206,070
|
243,140
|
(671
)
|
-
|
-
|
(120,316
)
|
122,153
|
184
Below
is a summarized analysis of the operating segments of the Company
for the year ended June 30, 2019:
|
|
06.30.19
|
|||||||||
|
|
|
Urban Properties and Investment business
(II)
|
|
|
|
|
|
|
||
|
|
|
Operations Center in Argentina
|
Operations Center in Israel
|
Subtotal
|
Total segment information
|
Joint ventures (i)
|
Discontinued operations (ii)
|
Adjustments (iii)
|
Elimination of inter-segment transactions and non-reportable
assets / liabilities (iv)
|
Total Statement of Income / Financial Position
|
|
|
(In
million of ARS)
|
|||||||||
|
Revenues
|
19,061
|
15,056
|
73,537
|
88,593
|
107,654
|
(93
)
|
-
|
3,706
|
(526
)
|
110,741
|
|
Costs
|
(16,165
)
|
(3,201
)
|
(52,426
)
|
(55,627
)
|
(71,792
)
|
67
|
-
|
(3,855
)
|
196
|
(75,384
)
|
|
Initial
recognition and changes in the fair value of biological assets and
agricultural products at the point of harvest
|
2,035
|
-
|
-
|
-
|
2,035
|
-
|
-
|
-
|
270
|
2,305
|
|
Changes
in the net realizable value of agricultural products after
harvest
|
(43
)
|
-
|
-
|
-
|
(43
)
|
-
|
-
|
-
|
-
|
(43
)
|
|
Gross profit / (loss)
|
4,888
|
11,855
|
21,111
|
32,966
|
37,854
|
(26
)
|
-
|
(149
)
|
(60
)
|
37,619
|
|
Net
gain from fair value adjustment of investment
properties
|
665
|
-
|
-
|
-
|
665
|
-
|
-
|
-
|
-
|
665
|
|
Gain
/ (loss) from disposal of farmlands
|
-
|
(39,477
)
|
892
|
(38,585
)
|
(38,585
)
|
839
|
-
|
-
|
-
|
(37,746
)
|
|
General
and administrative expenses
|
(1,525
)
|
(2,668
)
|
(8,031
)
|
(10,699
)
|
(12,224
)
|
17
|
-
|
-
|
55
|
(12,152
)
|
|
Selling
expenses
|
(1,717
)
|
(1,085
)
|
(11,192
)
|
(12,277
)
|
(13,994
)
|
7
|
-
|
-
|
11
|
(13,976
)
|
|
Other
operating results, net
|
819
|
(659
)
|
742
|
83
|
902
|
193
|
-
|
17
|
(11
)
|
1,101
|
|
Management
fees
|
-
|
-
|
-
|
-
|
-
|
-
|
-
|
-
|
-
|
-
|
|
Profit / (loss) from operations
|
3,130
|
(32,034
)
|
3,522
|
(28,512
)
|
(25,382
)
|
1,030
|
-
|
(132
)
|
(5
)
|
(24,489
)
|
|
Share
of profit / (loss) of associates and joint ventures
|
11
|
(6,183
)
|
(150
)
|
(6,333
)
|
(6,322
)
|
(1,006
)
|
-
|
-
|
-
|
(7,328
)
|
|
Segment profit / (loss)
|
3,141
|
(38,217
)
|
3,372
|
(34,845
)
|
-31,704
|
24
|
-
|
(132
)
|
(5
)
|
(31,817
)
|
|
|
|
|
|
|
|
|
|
|
|
|
|
Reportable
assets
|
34,597
|
111,717
|
535,565
|
647,282
|
681,879
|
(592
)
|
-
|
-
|
44,747
|
726,034
|
|
Reportable
liabilities
|
-
|
-
|
(461,015
)
|
(461,015
)
|
(461,015
)
|
-
|
-
|
-
|
(137,818
)
|
(598,833
)
|
|
Net reportable assets
|
34,597
|
111,717
|
74,55
|
186,267
|
220,864
|
(592
)
|
-
|
-
|
(93,071
)
|
127,201
|
185
Below
is a summarized analysis of the operating segments of the Company
for the year ended June 30, 2018:
|
|
06.30.18
|
||||||||
|
|
|
Urban Properties and Investment business
(II)
|
|
|
|
|
|
||
|
|
Agricultural business (I)
|
Operations Center in Argentina
|
Operations Center in Israel
|
Subtotal
|
Total segment information
|
Joint ventures (i)
|
Adjustments (iii)
|
Elimination of inter-segment transactions and non-reportable
assets / liabilities (iv)
|
Total Statement of Income / Financial Position
|
|
|
(In
million of ARS)
|
||||||||
|
Revenues
|
15,393
|
13,872
|
60,057
|
73,929
|
89,322
|
(111
)
|
4,387
|
(332
)
|
93,266
|
|
Costs
|
(13,096
)
|
(2,822
)
|
(41,935
)
|
(44,757
)
|
(57,853
)
|
69
|
(4,445
)
|
151
|
(62,078
)
|
|
Initial
recognition and changes in the fair value of biological assets and
agricultural products at the point of harvest
|
1,53
|
-
|
-
|
-
|
1,530
|
4
|
-
|
140
|
1,674
|
|
Changes
in the net realizable value of agricultural products after
harvest
|
532
|
-
|
-
|
-
|
532
|
-
|
-
|
-
|
532
|
|
Gross profit / (loss)
|
4,359
|
11,05
|
18,122
|
29,172
|
33,531
|
(38
)
|
(58
)
|
(41
)
|
33,394
|
|
Net
gain from fair value adjustment of investment
properties
|
216
|
19,809
|
-
|
19,809
|
20,025
|
(1,054
)
|
-
|
-
|
18,971
|
|
Gain
from disposal of farmlands
|
1,656
|
-
|
-
|
-
|
1,656
|
-
|
-
|
-
|
1,656
|
|
General
and administrative expenses
|
(1,381
)
|
2,335
)
|
(7,233
)
|
(9,568
)
|
(10,949
)
|
40
|
-
|
33
|
(10,876
)
|
|
Selling
expenses
|
(1,753
)
|
(1,126
)
|
(10,639
)
|
(11,765
)
|
(13,518
)
|
16
|
-
|
13
|
(13,489
)
|
|
Other
operating results, net
|
1,541
|
(56
)
|
2,136
|
2,080
|
3,621
|
42
|
(2
)
|
(4
)
|
3,657
|
|
Management
fees
|
-
|
-
|
-
|
-
|
-
|
-
|
(1,456
)
|
-
|
(1,456
)
|
|
Profit / (loss) from operations
|
4,638
|
27,342
|
2,386
|
29,728
|
34,366
|
(994
)
|
(1,516
)
|
1
|
31,857
|
|
Share
of (loss) / profit of associates and joint ventures
|
37
|
(4,227
)
|
(422
)
|
(4,649
)
|
(4,612
)
|
1,16
|
-
|
-
|
(3,452
)
|
|
Segment profit / (loss)
|
4,675
|
23,115
|
1,964
|
25,079
|
29,754
|
166
|
(1,516
)
|
1
|
28,405
|
|
|
|
|
|
|
|
|
|
|
|
|
Reportable
assets
|
30,755
|
152,86
|
563,654
|
716,514
|
747,269
|
592
|
-
|
49,183
|
797,044
|
|
Reportable
liabilities
|
-
|
-
|
(479,056
)
|
(479,056
)
|
(479,056
)
|
-
|
-
|
(141,534
)
|
(620,590
)
|
|
Net reportable assets
|
30,755
|
152,86
|
84,598
|
237,458
|
268,213
|
592
|
-
|
(92,351
)
|
176,454
|
(i)
Represents the equity value of joint ventures that were
proportionately consolidated for information by segment
purposes.
(ii) Includes ARS
(130) million, ARS (149) million and ARS (58) million corresponding
to Expenses and FPC and ARS 0 million, ARS (336) million and ARS
(1,456) million to management fees, as of June 30, 2020 and 2018,
respectively.
(iii)
Includes deferred income tax assets,
income tax and MPIT credits, trade and other receivables,
investment in financial assets, cash and cash equivalents and
intangible assets except for rights to receive future units under
barter agreements, net of investments in associates with negative
equity which are included in provisions in the amount of ARS 17
million, ARS 8,658 and ARS 5,453 million, as of June 30, 2020, 2019
and 2018, respectively.
186
Agriculture line of business:
The
following tables present the operating segments by products and
services within the agriculture line of business:
|
|
06.30.20
|
||||
|
|
|
Land transformation and sales
|
Corporate
|
Others
|
Total Agricultural business
|
|
|
(in
million of ARS)
|
||||
|
Revenues
|
17,186
|
-
|
-
|
9,073
|
26,259
|
|
Costs
|
(14,676
)
|
(25
)
|
-
|
(7,582
)
|
(22,283
)
|
|
Initial
recognition and changes in the fair value of biological assets and
agricultural products at the point of harvest
|
2,613
|
-
|
-
|
10
|
2,623
|
|
Changes
in the net realizable value of agricultural products after
harvest
|
657
|
-
|
-
|
-
|
657
|
|
Gross profit / (loss)
|
5,78
|
(25
)
|
-
|
1,501
|
7,256
|
|
Gain
from disposal of farmlands
|
-
|
838
|
-
|
-
|
838
|
|
Net
gain from fair value adjustment of investment
properties
|
-
|
780
|
-
|
-
|
780
|
|
General
and administrative expenses
|
(953
)
|
(3
)
|
-177
|
(286
)
|
(1,419
)
|
|
Selling
expenses
|
(1,815
)
|
(1
)
|
-
|
(794
)
|
(2,610
)
|
|
Other
operating results, net
|
454
|
962
|
-
|
246
|
1,662
|
|
Management
fees
|
-
|
-
|
-
|
-
|
-
|
|
Profit / (loss) from operations
|
3,466
|
2,551
|
-177
|
667
|
6,507
|
|
Share
of profit / (loss) of associates
|
55
|
-
|
-
|
72
|
127
|
|
Segment profit / (loss)
|
3,521
|
2,551
|
-177
|
739
|
6,634
|
|
|
-
|
|
|
|
|
|
Investment
properties
|
4,129
|
-
|
-
|
-
|
4,129
|
|
Property,
plant and equipment
|
20,886
|
179
|
-
|
54
|
21,119
|
|
Investments
in associates
|
419
|
-
|
-
|
293
|
712
|
|
Other
reportable assets
|
7,283
|
331
|
-
|
3,496
|
11,11
|
|
Reportable assets
|
32,717
|
510
|
-
|
3,843
|
37,07
|
From
all of the Company’s revenues corresponding to Agricultural
Business, ARS 18,167 million are originated in Argentina and ARS
8,092 million in other countries, principally in Brazil for ARS
7,278 million.
From
all of the Company’s assets included in the segment
corresponding to Agricultural Business, ARS 13,269 million are
located in Argentina and ARS 23,801 million in other countries,
principally in Brazil for ARS 18.912 million.
|
|
06.30.19
|
||||
|
|
Agricultural production
|
Land transformation and sales
|
Corporate
|
Others
|
Total Agricultural business
|
|
|
(In
million of ARS)
|
||||
|
Revenues
|
11,1
|
-
|
-
|
7,961
|
19,061
|
|
Costs
|
(9,466
)
|
(24
)
|
-
|
(6,675
)
|
(16,165
)
|
|
Initial
recognition and changes in the fair value of biological assets and
agricultural products at the point of harvest
|
2,029
|
-
|
-
|
6
|
2,035
|
|
Changes
in the net realizable value of agricultural products after
harvest
|
(43
)
|
-
|
-
|
-
|
(43
)
|
|
Gross profit / (loss)
|
3,62
|
(24
)
|
-
|
1,292
|
4,888
|
|
Net
gain from fair value adjustment of investment
properties
|
-
|
665
|
-
|
-
|
665
|
|
Gain
from disposal of farmlands
|
-
|
-
|
-
|
-
|
-
|
|
General
and administrative expenses
|
(959
)
|
(3
)
|
(274
)
|
(289
)
|
(1,525
)
|
|
Selling
expenses
|
(1,026
)
|
(1
)
|
-
|
(690
)
|
(1,717
)
|
|
Other
operating results, net
|
428
|
244
|
-
|
147
|
819
|
|
Management
fees
|
-
|
-
|
-
|
-
|
-
|
|
(Loss) / Profit from operations
|
2,063
|
881
|
(274
)
|
460
|
3,130
|
|
Share
of profit / (loss) of associates
|
57
|
-
|
-
|
(46
)
|
11
|
|
Segment (loss) / profit
|
2,12
|
881
|
(274
)
|
414
|
3,141
|
|
|
|
|
|
|
|
|
Investment
properties
|
2,634
|
-
|
-
|
-
|
2,634
|
|
Property,
plant and equipment
|
20,219
|
149
|
-
|
767
|
21,135
|
|
Investments
in associates
|
391
|
-
|
-
|
23
|
414
|
|
Other
reportable assets
|
8,472
|
-
|
-
|
1,942
|
10,414
|
|
Reportable assets
|
31,716
|
149
|
-
|
2,732
|
34,597
|
From
all of the Company’s revenues corresponding to Agricultural
Business, ARS 12,680 million are originated in Argentina and ARS
6,381 million in other countries, principally in Brazil for ARS
5,923 million.
From
all of the Company’s assets included in the segment
corresponding to Agricultural Business, ARS 13,765 million are
located in Argentina and ARS 20,832 million in other countries,
principally in Brazil for ARS 18,974 million.
187
|
|
06.30.18
|
||||
|
|
Agricultural production
|
Land transformation and sales
|
Corporate
|
Others
|
Total Agricultural business
|
|
|
(In
million of ARS)
|
||||
|
Revenues
|
9,096
|
-
|
-
|
6,297
|
15,393
|
|
Costs
|
(7,388
)
|
(36
)
|
-
|
(5,672
)
|
(13,096
)
|
|
Initial
recognition and changes in the fair value of biological assets and
agricultural products at the point of harvest
|
1,539
|
-
|
-
|
(9
)
|
1,530
|
|
Changes
in the net realizable value of agricultural products after
harvest
|
532
|
-
|
-
|
-
|
532
|
|
Gross profit / (loss)
|
3,779
|
(36
)
|
-
|
616
|
4,359
|
|
Net
gain from fair value adjustment of investment
properties
|
-
|
216
|
-
|
-
|
216
|
|
Loss
from disposal of farmlands
|
-
|
1,656
|
-
|
-
|
1,656
|
|
General
and administrative expenses
|
(878
)
|
(2
)
|
(225
)
|
(276
)
|
(1,381
)
|
|
Selling
expenses
|
(1,322
)
|
-
|
-
|
(431
)
|
(1,753
)
|
|
Other
operating results, net
|
(20
)
|
1,457
|
-
|
104
|
1,541
|
|
Management
fees
|
-
|
-
|
-
|
-
|
-
|
|
Profit / (Loss) from operations
|
1,559
|
3,291
|
(225
)
|
13
|
4,638
|
|
Share
of profit / (loss) of associates
|
39
|
-
|
-
|
(2
)
|
37
|
|
Segment profit / (loss)
|
1,598
|
3,291
|
(225
)
|
11
|
4,675
|
|
|
|
|
|
|
|
|
Investment
properties
|
2,052
|
-
|
-
|
-
|
2,052
|
|
Property,
plant and equipment
|
19,620
|
131
|
-
|
605
|
20,356
|
|
Investments
in associates
|
316
|
-
|
-
|
91
|
407
|
|
Other
reportable assets
|
7,073
|
-
|
-
|
867
|
7,940
|
|
Reportable assets
|
29,061
|
131
|
-
|
1,563
|
30,755
|
|
|
|
|
|
|
|
From
all of the Company’s revenues corresponding to Agricultural
Business, ARS 11,296 million are originated in Argentina and ARS
4,097 million in other countries, principally in Brazil for ARS
3,743 million.
From
all of the Group’s assets included in the segment
corresponding to Agricultural Business, ARS 11,735 are located in
Argentina and ARS 19,020 in other countries, principally in Brazil
for ARS 17,128 million.
(I)
Urban properties and investments line of business
Below
is a summarized analysis of the lines of business of
Company’s operations center in Argentina for the fiscal years
ended June 30, 2020, 2019 and 2018:
|
|
06.30.20
|
|||||||
|
|
Shopping Malls
|
Offices
|
Sales and developments
|
Hotels
|
International
|
Corporate
|
Others
|
Total
|
|
|
(In
million of ARS)
|
|||||||
|
Revenues
|
5,976
|
1,566
|
783
|
2,066
|
10
|
-
|
133
|
10,534
|
|
Costs
|
(543
)
|
(107
)
|
(369
)
|
(1,111
)
|
(4
)
|
-
|
(106
)
|
(2,240
)
|
|
Gross profit / (loss)
|
5,433
|
1,459
|
414
|
955
|
6
|
-
|
27
|
8,294
|
|
Net
loss from fair value adjustment of investment
properties
|
(28,394
)
|
535
|
496
|
-
|
4
|
-
|
(262
)
|
(27,621
)
|
|
General
and administrative expenses
|
(661
)
|
(145
)
|
(182
)
|
(344
)
|
(93
)
|
(363
)
|
(79
)
|
(1,867
)
|
|
Selling
expenses
|
(371
)
|
(69
)
|
(83
)
|
(221
)
|
-
|
-
|
(15
)
|
(759
)
|
|
Other
operating results, net
|
(57
)
|
(23
)
|
(208
)
|
80
|
(9
)
|
-
|
(220
)
|
(437
)
|
|
Management
fees
|
-
|
-
|
-
|
-
|
-
|
-
|
-
|
-
|
|
Profit / (Loss) from operations
|
(24,050
)
|
1,757
|
437
|
470
|
(92
)
|
(363
)
|
(549
)
|
(22,390
)
|
|
Share
of profit / (loss) of associates and joint ventures
|
-
|
-
|
(26
)
|
-
|
(2,574
)
|
-
|
(1,726
)
|
(4,326
)
|
|
Segment profit / (loss)
|
(24,050
)
|
1,757
|
411
|
470
|
(2,666
)
|
(363
)
|
(2,275
)
|
(26,716
)
|
|
|
|
|
|
|
|
|
|
|
|
Investment
and trading properties
|
35,057
|
21,992
|
19,435
|
-
|
63
|
-
|
743
|
77,29
|
|
Property,
plant and equipment
|
182
|
95
|
-
|
1,416
|
126
|
-
|
-
|
1,819
|
|
Investment
in associates and joint ventures
|
-
|
-
|
310
|
-
|
(5,053
)
|
-
|
3,425
|
(1,318
)
|
|
Other
reportable assets
|
79
|
86
|
129
|
18
|
-
|
-
|
63
|
375
|
|
Reportable assets
|
35,318
|
22,173
|
19,874
|
1,434
|
(4,864
)
|
-
|
4,231
|
78,166
|
From
all the revenues corresponding to the Operations Center in
Argentina, ARS 11,127 million are originated in Argentina, and ARS
11 million in the U.S. No external client represents 10% or more of
revenue of any of the reportable segments.
From
all of the assets corresponding to the Operations Center in
Argentina segments, ARS 155,377 are located in Argentina and ARS
2,886 million in other countries, principally in USA for ARS 2,311
million and Uruguay for ARS 575 million.
188
|
|
|
|
|
|
|
|
|
|
|
|
06.30.19
|
|||||||
|
|
Shopping Malls
|
Offices
|
Sales and developments
|
Hotels
|
International
|
Corporate
|
Others
|
Total
|
|
|
(In
million of ARS)
|
|||||||
|
Revenues
|
8,541
|
2,239
|
1,119
|
2,953
|
14
|
-
|
190
|
15,056
|
|
Costs
|
(776
)
|
(153
)
|
(527
)
|
(1,588
)
|
(6
)
|
-
|
(151
)
|
(3,201
)
|
|
Gross profit
|
7,765
|
2,086
|
592
|
1,365
|
8
|
-
|
39
|
11,855
|
|
Net loss from fair value adjustment of investment
properties
|
(40,582
)
|
747
|
726
|
-
|
6
|
-
|
(374
)
|
(39,477
)
|
|
General and administrative expenses
|
(945
)
|
(206
)
|
(283
)
|
(492
)
|
(110
)
|
(519
)
|
(113
)
|
(2,668
)
|
|
Selling expenses
|
(530
)
|
(99
)
|
(119
)
|
(316
)
|
-
|
-
|
(21
)
|
(1,085
)
|
|
Other operating results, net
|
(109
)
|
(40
)
|
(286
)
|
114
|
(24
)
|
-
|
(314
)
|
(659
)
|
|
Management fees
|
-
|
-
|
-
|
-
|
-
|
-
|
-
|
-
|
|
Profit / (Loss) from operations
|
(34,401
)
|
2,488
|
630
|
671
|
(120
)
|
(519
)
|
(783
)
|
(32,034
)
|
|
Share of profit / (loss) of associates and joint
ventures
|
-
|
-
|
(37
)
|
-
|
(3,679
)
|
-
|
(2,467
)
|
(6,183
)
|
|
Segment profit / (loss)
|
(34,401
)
|
2,488
|
593
|
671
|
(3,799
)
|
(519
)
|
(3,250
)
|
(38,217
)
|
|
|
|
|
|
|
|
|
|
|
|
Investment and trading properties
|
50,104
|
31,432
|
27,777
|
-
|
90
|
-
|
1,062
|
110,465
|
|
Property, plant and equipment
|
260
|
136
|
-
|
2,024
|
180
|
-
|
-
|
2,600
|
|
Investment in associates and joint ventures
|
-
|
-
|
443
|
-
|
(7,222
)
|
-
|
4,895
|
(1,884
)
|
|
Other reportable assets
|
113
|
123
|
184
|
26
|
-
|
-
|
90
|
536
|
|
Reportable assets
|
50,477
|
31,691
|
28,404
|
2,050
|
(6,952
)
|
-
|
6,047
|
111,717
|
From
all the revenues corresponding to the Operations Center in
Argentina, included in the segments ARS 14,563 million are
originated in Argentina, ARS 478 million are originated in Uruguay
and ARS 14 million are originated in USA. No external client
represents 10% or more of revenue of any of the reportable
segments.
From
all of the assets corresponding to the Operations Center in
Argentina segments, ARS 117,932 million are located in Argentina
and ARS (6,370) million in other countries, principally in USA for
ARS (6,952) million and Uruguay for ARS 582 million.
|
|
|
|
|
|
|
|
|
|
|
|
06.30.18
|
|||||||
|
|
Shopping Malls
|
Offices
|
Sales and developments
|
Hotels
|
International
|
Corporate
|
Others
|
Total
|
|
|
(In
million of ARS)
|
|||||||
|
Revenues
|
9,750
|
1,332
|
300
|
2,446
|
-
|
-
|
44
|
13,872
|
|
Costs
|
(829
)
|
(124
)
|
(149
)
|
(1,672
)
|
-
|
-
|
(48
)
|
(2,822
)
|
|
Gross profit / (loss)
|
8,921
|
1,208
|
151
|
774
|
-
|
-
|
(4
)
|
11,050
|
|
Net loss from fair value adjustment of investment
properties
|
6,266
|
5,843
|
7,338
|
-
|
-
|
-
|
362
|
19,809
|
|
General and administrative expenses
|
(854
)
|
(216
)
|
(198
)
|
(487
)
|
(118
)
|
(385
)
|
(77
)
|
(2,335
)
|
|
Selling expenses
|
(607
)
|
(143
)
|
(58
)
|
(311
)
|
-
|
-
|
(7
)
|
(1,126
)
|
|
Other operating results, net
|
(105
)
|
(24
)
|
138
|
(40
)
|
(58
)
|
-
|
33
|
(56
)
|
|
Management fees
|
-
|
-
|
-
|
-
|
-
|
-
|
-
|
-
|
|
Profit / (Loss) from operations
|
13,621
|
6,668
|
7,371
|
(64
)
|
(176
)
|
(385
)
|
307
|
27,342
|
|
Share of profit / (loss) of associates and joint
ventures
|
-
|
-
|
4
|
-
|
(4,425
)
|
-
|
194
|
(4,227
)
|
|
Segment profit / (loss)
|
13,621
|
6,668
|
7,375
|
(64
)
|
(4,601
|
(385
)
|
501
|
23,115
|
|
|
|
|
|
|
|
|
|
|
|
Investment and trading properties
|
89,983
|
28,142
|
25,166
|
-
|
-
|
-
|
1,334
|
144,625
|
|
Property, plant and equipment
|
213
|
120
|
-
|
2,135
|
198
|
-
|
-
|
2,666
|
|
Investment in associates and joint ventures
|
-
|
-
|
447
|
-
|
(3,869
)
|
-
|
8,251
|
4,829
|
|
Other reportable assets
|
129
|
122
|
189
|
27
|
-
|
-
|
273
|
740
|
|
Reportable assets
|
90,325
|
28,384
|
25,802
|
2,162
|
(3,671
)
|
-
|
9,858
|
152,860
|
From
all the revenues corresponding to the Operations Center in
Argentina, the 100% are originated in Argentina. No external client
represents 10% or more of revenue of any of the reportable
segments.
From
all of the assets corresponding to the Operations Center in
Argentina segments, ARS 155,890 million are located in Argentina
and ARS (2,987) million in other countries, principally in USA for
ARS (3,672) million and Uruguay for ARS 685 million.
189
Below
is a summarized analysis of the lines of business of
Company’s Operations Center in Israel for the years ended
June 30, 2020, 2019 and 2018:
|
|
|
|
|
|
|
|
|
|
|
06.30.20
|
||||||
|
|
Real Estate
|
Supermarkets
|
Telecommunications
|
Insurance
|
Corporate
|
Others
|
Total
|
|
|
|
|
(In
million of ARS)
|
|
|
||
|
Revenues
|
12,954
|
-
|
64,838
|
-
|
-
|
3,845
|
81,637
|
|
Costs
|
(6,787
)
|
-
|
(47,231
)
|
-
|
-
|
(2,278
)
|
(56,296
)
|
|
Gross profit
|
6,167
|
-
|
17,607
|
-
|
-
|
1,567
|
25,341
|
|
Net gain from fair value adjustment of investment
properties
|
(2,989
)
|
-
|
-
|
-
|
-
|
-
|
(2,989
)
|
|
General and administrative expenses
|
(812
)
|
-
|
(5,519
)
|
-
|
(1,071
)
|
(1,362
)
|
(8,764
)
|
|
Selling expenses
|
(223
)
|
-
|
(11,887
)
|
-
|
-
|
(434
)
|
(12,544
)
|
|
Other operating results, net
|
(2,470
)
|
-
|
-
|
-
|
-
|
-
|
(2,470
)
|
|
Management fees
|
(296
)
|
-
|
501
|
-
|
(48
)
|
970
|
1,127
|
|
Profit / (Loss) from operations
|
(623
)
|
-
|
702
|
-
|
(1,119
)
|
741
|
(299
)
|
|
Share of profit/ (loss) of associates and joint
ventures
|
1,495
|
1,063
|
(265
)
|
-
|
-
|
(994
)
|
1,299
|
|
Segment profit / (loss)
|
872
|
1,063
|
437
|
-
|
(1,119
)
|
(253
)
|
1
|
|
|
|
|
|
|
|
|
|
|
Reportable assets
|
152,941
|
28,090
|
140,025
|
3,377
|
17,911
|
108,923
|
451,267
|
|
Reportable liabilities
|
(146,331
)
|
-
|
(106,076
)
|
-
|
(111,649
)
|
(39,128
)
|
(403,184
)
|
|
Net reportable assets
|
6,610
|
28,090
|
33,949
|
3,377
|
(93,738
)
|
69,795
|
48,083
|
No
external client represents 10% or more of the revenue of any of the
reportable segments. From all assets corresponding to the
Operations Center in Israel segments, ARS 82,707 million are
located in USA (ARS 74,170 million in 2019 and ARS 77,664 million
in 2018), ARS 0 million (ARS 1,979 million in 2019 and ARS 2,333
million in 2018) in India and the remaining are located in
Israel.
|
|
06.30.19
|
||||||
|
|
Real Estate
|
Supermarkets
|
Telecommunications
|
Insurance
|
Corporate
|
Others
|
Total
|
|
|
|
|
|
(In
million of ARS)
|
|
|
|
|
Revenues
|
14,392
|
-
|
57,506
|
-
|
-
|
1,639
|
73,537
|
|
Costs
|
(9,121
)
|
-
|
(42,424
)
|
-
|
-
|
(881
)
|
(52,426
)
|
|
Gross profit
|
5,271
|
-
|
15,082
|
-
|
-
|
758
|
21,111
|
|
Net gain from fair value adjustment of investment
properties
|
892
|
-
|
-
|
-
|
-
|
-
|
892
|
|
General and administrative expenses
|
(707
)
|
-
|
(4,779
)
|
-
|
(1,058
)
|
(1,487
)
|
(8,031
)
|
|
Selling expenses
|
(197
)
|
-
|
(10,562
)
|
-
|
-
|
(433
)
|
(11,192
)
|
|
Other operating results, net
|
-
|
-
|
397
|
-
|
-
|
345
|
742
|
|
Management fees
|
-
|
-
|
-
|
-
|
-
|
-
|
-
|
|
Profit / (Loss) from operations
|
5,259
|
-
|
138
|
-
|
(1,058
)
|
(817
)
|
3,522
|
|
Share of profit / (loss) of associates and joint
ventures
|
37
|
717
|
-
|
-
|
-
|
(904
)
|
(150
)
|
|
Segment profit / (loss)
|
5,296
|
717
|
138
|
-
|
(1,058
)
|
(1,721
)
|
3,372
|
|
|
|
|
|
|
|
|
|
|
Reportable assets
|
303,425
|
23,013
|
109,38
|
22,638
|
41,536
|
35,573
|
535,565
|
|
Reportable liabilities
|
(235,553
)
|
-
|
(84,800
)
|
-
|
(126,585
)
|
(14,077
)
|
(461,015
)
|
|
Net reportable assets
|
67,872
|
23,013
|
24,580
|
22,638
|
(85,049
)
|
21,496
|
74,550
|
|
|
06.30.18
|
||||||
|
|
Real Estate
|
Supermarkets
|
Telecommunications
|
Insurance
|
Corporate
|
Others
|
Total
|
|
|
|
|
|
(In
million of ARS)
|
|
|
|
|
Revenues
|
9,497
|
-
|
49,066
|
-
|
-
|
1,494
|
60,057
|
|
Costs
|
(5,957
)
|
-
|
(35,189
)
|
-
|
-
|
(789
)
|
(41,935
)
|
|
Gross profit
|
3,540
|
-
|
13,877
|
-
|
-
|
705
|
18,122
|
|
Net gain from fair value adjustment of investment
properties
|
-
|
-
|
-
|
-
|
-
|
-
|
-
|
|
General and administrative expenses
|
(578
)
|
-
|
(4,594
)
|
-
|
(854
)
|
(1,207
)
|
(7,233
)
|
|
Selling expenses
|
(200
)
|
-
|
(10,059
)
|
-
|
-
|
(380
)
|
(10,639
)
|
|
Other operating results, net
|
256
|
-
|
772
|
-
|
1,141
|
(33
)
|
2,136
|
|
Management fees
|
-
|
-
|
-
|
-
|
-
|
-
|
-
|
|
Profit / (Loss) from operations
|
3,018
|
-
|
(4
)
|
-
|
287
|
(915
)
|
2,386
|
|
Share of profit / (loss) of associates and joint
ventures
|
158
|
-
|
-
|
-
|
-
|
(580
)
|
(422
)
|
|
Segment profit / (loss)
|
3,176
|
-
|
(4
)
|
-
|
287
|
(1,495
)
|
1,964
|
|
|
|
|
|
|
|
|
|
|
Reportable assets
|
298,031
|
29,579
|
110,723
|
27,247
|
47,432
|
50,642
|
563,654
|
|
Reportable liabilities
|
(231,693
)
|
-
|
(86,280
)
|
-
|
(155,567
)
|
(5,516
)
|
(479,056
)
|
|
Net reportable assets
|
66,338
|
29,579
|
24,443
|
27,247
|
(108,135
)
|
45,126
|
84,598
|
190
Results of Operations for the fiscal years ended June 30, 2020 and
2019
Below
is a summary of the Company’s operating segments and a
reconciliation between the total of the operating result according
to the information by segments and the operating result according
to the income statement for the years ended June 30, 2020 and
2019.
|
|
Agricultural Business
|
Urban Properties and Investment Business
|
Total segment information
|
Joint Ventures
|
Adjustments
|
Elimination of inter-segment transactions and non-reportable
assets/ liabilities
|
Total income statement/ statement of
financial position
|
||||||||||||||||||||
|
|
|
Operations Center in Argentina
|
Operations Center in Israel
|
Subtotal
|
|
|
|
|
|
|
|
||||||||||||||||
|
|
06.30.20
|
06.30.19
|
Var.
|
06.30.20
|
06.30.19
|
Var.
|
06.30.20
|
06.30.19
|
Var.
|
06.30.20
|
06.30.19
|
Var.
|
06.30.20
|
06.30.19
|
Var.
|
06.30.20
|
06.30.19
|
Var.
|
06.30.20
|
06.30.19
|
Var.
|
06.30.20
|
06.30.19
|
Var.
|
06.30.20
|
06.30.19
|
Var.
|
|
|
(In million of
ARS)
|
||||||||||||||||||||||||||
|
Revenues
|
26,259
|
19,061
|
7,198
|
11,138
|
15,056
|
(3,918
)
|
81,637
|
73,537
|
8,100
|
92,775
|
88,593
|
4,182
|
119,034
|
107,654
|
11,38
|
(60
)
|
(93
)
|
33
|
3,100
|
3,706
|
(606
)
|
(818
)
|
(526
)
|
(292
)
|
121,256
|
110,741
|
10,515
|
|
Costs
|
(22,283
)
|
(16,165
)
|
(6,118
)
|
(2,755
)
|
(3,201
)
|
446
|
(56,296
)
|
(52,426
)
|
(3,870
)
|
(59,051
)
|
(55,627
)
|
(3,424
)
|
(81,334
)
|
(71,792
)
|
(9,542
)
|
53
|
67
|
(14
)
|
(3,230
)
|
(3,855
)
|
625
|
540
|
196
|
344
|
(83,971
)
|
(75,384
)
|
(8,587
)
|
|
Initial
recognition and changes in the fair value of biological assets and
agricultural produce at the
|
2,623
|
2,035
|
588
|
-
|
-
|
-
|
-
|
-
|
-
|
-
|
-
|
-
|
2,623
|
2,035
|
588
|
-
|
-
|
-
|
-
|
-
|
-
|
204
|
270
|
(66
)
|
2,827
|
2,305
|
522
|
|
point of
harvest
|
|
|
|
|
|
|
|
|
|
|
|
|
|
|
|
|
|
|
|
|
|
|
|
|
|
|
|
|
Changes in the
net realizable
|
657
|
(43
)
|
700
|
-
|
-
|
-
|
-
|
-
|
-
|
-
|
-
|
-
|
657
|
(43
)
|
700
|
-
|
-
|
-
|
-
|
-
|
-
|
-
|
-
|
-
|
657
|
(43
)
|
700
|
|
value of
agricultural produce
|
|
|
|
|
|
|
|
|
|
|
|
|
|
|
|
|
|
|
|
|
|
|
|
|
|
|
|
|
after
harvest
|
|
|
|
|
|
|
|
|
|
|
|
|
|
|
|
|
|
|
|
|
|
|
|
|
|
|
|
|
Gross profit
|
7,256
|
4,888
|
2,368
|
8,383
|
11,855
|
(3,472
)
|
25,341
|
21,111
|
4,23
|
33,724
|
32,966
|
758
|
40,98
|
37,854
|
3,126
|
(7
)
|
(26
)
|
19
|
(130
)
|
(149
)
|
19
|
(74
)
|
(60
)
|
(14
)
|
40,769
|
37,619
|
3,150
|
|
Net gain /
(loss) from changes in the fair value of investment
properties
|
780
|
-
|
780
|
33,464
|
(39,477
)
|
72,941
|
(2,989
)
|
892
|
(3,881
)
|
30,475
|
(38,585
)
|
69,060
|
31,255
|
(38,585
)
|
69,84
|
(263
)
|
839
|
-1,102
|
-
|
-
|
-
|
-
|
-
|
-
|
30,992
|
(37,746
)
|
68,738
|
|
Gain from
disposal of farmlands
|
838
|
665
|
173
|
-
|
-
|
-
|
-
|
-
|
-
|
-
|
-
|
-
|
838
|
665
|
173
|
-
|
-
|
-
|
-
|
-
|
-
|
-
|
-
|
-
|
838
|
665
|
173
|
|
General and
administrative expenses
|
(1,419
)
|
(1,525
)
|
106
|
(2,150
)
|
(2,668
)
|
518
|
(8,764
)
|
(8,031
)
|
(733
)
|
(10,914
)
|
(10,699
)
|
(215
)
|
(12,333
)
|
(12,224
)
|
(109
)
|
15
|
17
|
-2
|
-
|
-
|
-
|
51
|
55
|
(4
)
|
(12,267
)
|
(12,152
)
|
(115
)
|
|
Selling
expenses
|
(2,610
)
|
(1,717
)
|
(893
)
|
(1,232
)
|
(1,085
)
|
(147
)
|
(12,544
)
|
(11,192
)
|
(1,352
)
|
(13,776
)
|
(12,277
)
|
(1,499
)
|
(16,386
|
(13,994
|
(2,392
)
|
19
|
7
|
12
|
-
|
-
|
-
|
19
|
11
|
8
|
(16,348
)
|
(13,976
)
|
(2,372
)
|
|
Impairment of
associates
|
-
|
-
|
-
|
-
|
-
|
-
|
(2,470
)
|
-
|
(2,470
)
|
(2,470
)
|
-
|
(2,470
)
|
(2,470
)
|
-
|
(2,470
)
|
-
|
-
|
-
|
-
|
-
|
-
|
-
|
-
|
-
|
(2,47
)
|
-
|
(2,470
)
|
|
Other
operating results, net
|
1,662
|
819
|
843
|
(48
)
|
(659
)
|
611
|
1,127
|
742
|
385
|
1,079
|
83
|
996
|
2,741
|
902
|
1,839
|
18
|
193
|
-175
|
17
|
17
|
-
|
-6
|
(11
)
|
5
|
2,77
|
1,101
|
1,669
|
|
Management
fees
|
-
|
-
|
-
|
-
|
-
|
-
|
-
|
-
|
-
|
-
|
-
|
-
|
-
|
-
|
-
|
-
|
-
|
-
|
(211
)
|
-
|
(211
)
|
-
|
-
|
-
|
(211
)
|
-
|
(211
)
|
|
Profit/ (loss) from operations
|
6,507
|
3,130
|
3,377
|
38,417
|
(32,034
)
|
70,451
|
(299
)
|
3,522
|
(3,821
)
|
38,118
|
(28,512
)
|
66,630
|
44,625
|
(25,382
)
|
70,007
|
(218
)
|
1,03
|
(1,248
)
|
(324
)
|
(132
)
|
(192
)
|
(10
)
|
(5
)
|
(5
)
|
44,073
|
(24,489
)
|
68,562
|
|
Share of
profit / (loss) of
|
127
|
11
|
116
|
7,047
|
(6,183
)
|
13,230
|
1,299
|
(150
)
|
1,449
|
8,346
|
(6,333
)
|
14,679
|
8,473
|
(6,322
)
|
14,795
|
169
|
(1,006
)
|
1,175
|
-
|
-
|
-
|
20
|
-
|
20
|
8,662
|
(7,328
)
|
15,990
|
|
associates and
joint ventures
|
|
|
|
|
|
|
|
|
|
|
|
|
|
|
|
|
|
|
|
|
|
|
|
|
|
|
|
|
Segment profit/ (loss)
|
6,634
|
3,141
|
3,493
|
45,464
|
(38,217
)
|
83,681
|
1
|
3,372
|
(2,372
)
|
46,464
|
(34,845
)
|
81,309
|
53,098
|
(31,704
)
|
84,802
|
(49
)
|
24
|
(73
)
|
(324
)
|
(132
)
|
(192
)
|
10
|
(5
)
|
15
|
52,735
|
(31,817
)
|
84,552
|
(I) Represents the
equity value of joint ventures that were proportionately
consolidates for information segment
purposes.
(II) Includes gross profit / (loss) of ARS (149)
million corresponding to Building Administration Expenses and
Collective Promotion Fund (FPC), as of June 30, 2020 and 2019,
respectively.
Agricultural Business
The
following table shows a summary of the Agricultural Business lines
for the fiscal years ended June 30, 2020 and 2019.
|
|
Agricultural Production
|
Land Transformation and Sales
|
Corporate
|
Others
|
Total
|
||||||||||
|
|
06.30.20
|
06.30.19
|
Var.
|
06.30.20
|
06.30.19
|
Var.
|
06.30.20
|
06.30.19
|
Var.
|
06.30.20
|
06.30.19
|
Var.
|
06.30.20
|
06.30.19
|
Var.
|
|
(In million of
ARS)
|
|||||||||||||||
|
Revenues
|
17,186
|
11,100
|
6,086
|
-
|
-
|
-
|
-
|
-
|
-
|
9,073
|
7,961
|
1,112
|
26,259
|
19,061
|
7,198
|
|
Costs
|
(14,676
)
|
(9,466
)
|
(5,210
)
|
(25
)
|
(24
)
|
(1
)
|
-
|
-
|
-
|
(7,582
)
|
(6,675
)
|
(907
)
|
(22,283
)
|
(16,165
)
|
(6,118
)
|
|
Initial
recognition and changes in the fair value of biological assets and
agricultural produce at the point of harvest
|
2,613
|
2,029
|
584
|
-
|
-
|
-
|
-
|
-
|
-
|
10
|
6
|
4
|
2,623
|
2,035
|
588
|
|
Changes in the
net realizable value of agricultural produce after
harvest
|
657
|
(43
)
|
700
|
-
|
-
|
-
|
-
|
-
|
-
|
-
|
-
|
-
|
657
|
(43
)
|
700
|
|
Gross profit / (loss)
|
5,780
|
3,620
|
2,160
|
(25
)
|
(24
)
|
(1
)
|
-
|
-
|
-
|
1,501
|
1,292
|
209
|
7,256
|
4,888
|
2,368
|
|
Net gain /
(loss) from changes in the fair value of investment
properties
|
-
|
-
|
-
|
780
|
-
|
780
|
-
|
-
|
-
|
-
|
-
|
-
|
780
|
-
|
780
|
|
Gain from
disposal of farmlands
|
-
|
-
|
-
|
838
|
665
|
173
|
-
|
-
|
-
|
-
|
-
|
-
|
838
|
665
|
173
|
|
General and
administrative expenses
|
(953
)
|
(959
)
|
6
|
(3
)
|
(3
)
|
-
|
(177
)
|
(274
)
|
97
|
(286
)
|
(289
)
|
3
|
(1,419
)
|
(1,525
)
|
106
|
|
Selling
expenses
|
(1,815
)
|
(1,026
)
|
(789
)
|
(1
)
|
(1
)
|
-
|
-
|
-
|
-
|
(794
)
|
(690
)
|
(104
)
|
(2,610
)
|
(1,717
)
|
(893
)
|
|
Other
operating results, net
|
454
|
428
|
26
|
962
|
244
|
718
|
-
|
-
|
-
|
246
|
147
|
99
|
1,662
|
819
|
843
|
|
Profit/ (loss) from operations
|
3,466
|
2,063
|
1,403
|
2,551
|
881
|
1,670
|
(177
)
|
(274
)
|
97
|
667
|
460
|
207
|
6,507
|
3,130
|
3,377
|
|
Share of
profit / (loss) of
associates
|
55
|
57
|
(2
)
|
-
|
-
|
-
|
-
|
-
|
-
|
72
|
(46
)
|
118
|
127
|
11
|
116
|
|
Segment profit/ (loss)
|
3,521
|
2,120
|
1,401
|
2,551
|
881
|
1,670
|
(177
)
|
(274
)
|
97
|
739
|
414
|
325
|
6,634
|
3,141
|
3,493
|
191
Urban Properties and Investment Business
Operations Center in Argentina
|
|
Shopping Malls
|
Offices
|
Sales and development
|
Hotels
|
International
|
Corporate
|
Others
|
Total
|
||||||||||||||||
|
|
06.30.20
|
06.30.19
|
Var.
|
06.30.20
|
06.30.19
|
Var.
|
06.30.20
|
06.30.19
|
Var.
|
06.30.20
|
06.30.19
|
Var.
|
06.30.20
|
06.30.19
|
Var.
|
06.30.20
|
06.30.19
|
Var.
|
06.30.20
|
06.30.19
|
Var.
|
06.30.20
|
06.30.19
|
Var.
|
|
|
(In
million of ARS)
|
|||||||||||||||||||||||
|
Revenues
|
5,935
|
8,541
|
(2,606
)
|
2,358
|
2,239
|
119
|
735
|
1,119
|
(384
)
|
2,021
|
2,953
|
(932
)
|
11
|
14
|
(3
)
|
-
|
-
|
-
|
78
|
190
|
(112
)
|
11,138
|
15,056
|
(3,918
)
|
|
Costs
|
(567
)
|
(776
)
|
209
|
(144
)
|
(153
)
|
9
|
(690
)
|
(527
)
|
(163
)
|
(1,244
)
|
(1,588
)
|
344
|
(12
)
|
(6
)
|
(6
)
|
-
|
-
|
-
|
(98
)
|
(151
)
|
53
|
(2,755
)
|
(3,201
)
|
446
|
|
Gross profit / (loss)
|
5,368
|
7,765
|
(2,397
)
|
2,214
|
2,086
|
128
|
45
|
592
|
(547
)
|
777
|
1,365
|
(588
)
|
(1
)
|
8
|
(9
)
|
-
|
-
|
-
|
(20
)
|
39
|
(59
)
|
8,383
|
11,855
|
(3,472
)
|
|
Net gain / (loss) from changes in the fair value of investment
properties
|
(2,105
)
|
(40,582
)
|
38,477
|
22,756
|
747
|
22,009
|
12,179
|
726
|
11,453
|
-
|
-
|
-
|
-
|
6
|
(6
)
|
-
|
-
|
-
|
634
|
(374
)
|
1,008
|
33,464
|
(39,477
|
72,941
|
|
General and administrative expenses
|
(829
)
|
(945
)
|
116
|
(220
)
|
(206
)
|
(14
)
|
(228
)
|
(283
)
|
55
|
(365
)
|
(492
)
|
127
|
(110
)
|
(110
)
|
-
|
(282
)
|
(519
)
|
237
|
(116
)
|
(113
)
|
(3
)
|
(2,150
)
|
(2,668
|
518
|
|
Selling expenses
|
(709
)
|
(530
)
|
(179
)
|
(85
)
|
(99
)
|
14
|
(197
)
|
(119
)
|
(78
)
|
(230
)
|
(316
)
|
86
|
-
|
-
|
-
|
-
|
-
|
-
|
(11
)
|
(21
)
|
10
|
(1,232
)
|
(1,085
|
(147
)
|
|
Other operating results, net
|
(38
)
|
(109
)
|
71
|
(30
)
|
(40
)
|
10
|
(27
)
|
(286
)
|
259
|
(20
)
|
114
|
(134
)
|
-
|
(24
)
|
24
|
-
|
-
|
-
|
67
|
(314
)
|
381
|
(48
)
|
(659
)
|
611
|
|
Profit / (loss) from operations
|
1,687
|
(34,401
)
|
36,088
|
24,635
|
2,488
|
22,147
|
11,772
|
630
|
11,142
|
162
|
671
|
(509
)
|
(111
)
|
(120
)
|
9
|
(282
)
|
(519
)
|
237
|
554
|
(783
)
|
1,337
|
38,417
|
(32,034
)
|
70,451
|
|
Share of profit / (loss) of associates and
|
-
|
-
|
-
|
-
|
-
|
-
|
-
|
(37
)
|
37
|
-
|
-
|
-
|
7,377
|
(3,679
)
|
11,056
|
-
|
-
|
-
|
(330
)
|
(2,467
)
|
2,137
|
7,047
|
(6,183
)
|
13,230
|
|
joint ventures
|
|
|
|
|
|
|
|
|
|
|
|
|
|
|
|
|
|
|
|
|
|
|
|
|
|
Segment profit / (loss)
|
1,687
|
(34,401
)
|
36,088
|
24,635
|
2,488
|
22,147
|
11,772
|
593
|
11,179
|
162
|
671
|
(509
)
|
7,266
|
(3,799
)
|
11,065
|
(282
)
|
(519
)
|
237
|
224
|
(3,250
)
|
3,474
|
45,464
|
(38,217
)
|
83,681
|
Operations Center in Israel
The
following table shows a summary of the Urban Properties and
Investment Business lines of the Operations Center in Israel for
the fiscal years ended June 30, 2020 and 2019.
|
|
Real Estate
|
Supermarkets
|
Telecommunications
|
Corporate
|
Others
|
Total
|
||||||||||||
|
|
06.30.20
|
06.30.19
|
Var.
|
06.30.20
|
06.30.19
|
Var.
|
06.30.20
|
06.30.19
|
Var.
|
06.30.20
|
06.30.19
|
Var.
|
06.30.20
|
06.30.19
|
Var.
|
06.30.20
|
06.30.19
|
Var.
|
|
(In million of
ARS)
|
||||||||||||||||||
|
Revenues
|
12,954
|
14,392
|
(1,438
)
|
-
|
-
|
-
|
64,838
|
57,506
|
7,332
|
-
|
-
|
-
|
3,845
|
1,639
|
2,206
|
81,637
|
73,537
|
8,100
|
|
Costs
|
(6,787
)
|
(9,121
)
|
2,334
|
-
|
-
|
-
|
(47,231
)
|
(42,424
)
|
(4,807
)
|
-
|
-
|
-
|
(2,278
)
|
(881
)
|
(1,397
)
|
(56,296
)
|
(52,426
)
|
(3,870
)
|
|
Gross profit / (loss)
|
6,167
|
5,271
|
896
|
-
|
-
|
-
|
17,607
|
15,082
|
2,525
|
-
|
-
|
-
|
1,567
|
758
|
809
|
25,341
|
21,111
|
4,230
|
|
Net gain /
(loss) from changes in the fair value of investment
properties
|
(2,989
)
|
892
|
(3,881
)
|
-
|
-
|
-
|
-
|
-
|
-
|
-
|
-
|
-
|
-
|
-
|
-
|
(2,989
)
|
892
|
(3,881
)
|
|
General and
administrative expenses
|
(812
)
|
(707
)
|
(105
)
|
-
|
-
|
-
|
(5,519
)
|
(4,779
)
|
(740
)
|
(1,071
)
|
(1,058
)
|
(13
)
|
(1,362
)
|
(1,487
)
|
125
|
(8,764
)
|
(8,031
)
|
(733
)
|
|
Selling
expenses
|
(223
)
|
(197
)
|
(26
)
|
-
|
-
|
-
|
(11,887
)
|
(10,562
)
|
(1,325
)
|
-
|
-
|
-
|
(434
)
|
(433
)
|
(1
)
|
(12,544
)
|
(11,192
)
|
(1,352
)
|
|
Impairment of
associates
|
(2,470
)
|
-
|
(2,470
)
|
-
|
-
|
-
|
-
|
-
|
-
|
-
|
-
|
-
|
-
|
-
|
-
|
(2,470
)
|
-
|
(2,470
)
|
|
Other
operating results, net
|
(296
)
|
-
|
(296
)
|
-
|
-
|
-
|
501
|
397
|
104
|
(48
)
|
-
|
(48
)
|
970
|
345
|
625
|
1,127
|
742
|
385
|
|
Profit / (loss) from operations
|
(623
)
|
5,259
|
(5,882
)
|
-
|
-
|
-
|
702
|
138
|
564
|
(1,119
)
|
(1,058
)
|
(61
)
|
741
|
(817
)
|
1,558
|
(299
)
|
3,522
|
(3,821
)
|
|
Share of
profit / (loss) of associates and joint
ventures
|
1,495
|
37
|
1,458
|
1,063
|
717
|
346
|
(265
)
|
-
|
(265
)
|
-
|
-
|
-
|
(994
)
|
(904
)
|
(90
)
|
1,299
|
(150
)
|
1,449
|
|
Segment profit / (loss)
|
872
|
5,296
|
(4,424
)
|
1,063
|
717
|
346
|
437
|
138
|
299
|
(1,119
)
|
(1,058
)
|
(61
)
|
(253
)
|
(1,721
)
|
1,468
|
1,000
|
3,372
|
(2,372
)
|
192
Revenues 2020 vs. 2019
Total revenues, according to the income statement, increased by ARS
10,515 million (9.5%), from ARS 110,741 million in the fiscal year
ended June 30, 2019 to ARS 121,256 million in the fiscal year ended
June 30, 2020. Such increase was mainly due to a ARS 6,918 million
increase in the Agricultural Business, which went from ARS 18,574
million in the fiscal year ended June 30, 2019 to ARS 25,492
million in the fiscal year ended June 30, 2020, and a ARS 3,597
million increase in the Urban Properties and Investment Business.
Within the Urban Properties and Investment Business, the variation
is attributable to ARS 8,100 million increase in the Operations
Center in Israel offset by ARS 4,503 million decrease in the
Operations Center in Argentina mainly explained by the closure of
operations of shopping malls since March 20, 2020 due to COVID-19
pandemic.
Revenues from our joint ventures increased by ARS 33 million
(35.5%), from a loss of ARS 93 million in the fiscal year ended
June 30, 2019 (out of which ARS 76 million are allocated to the
Shopping Malls segment;ARS 16 million to the Offices segment, and
ARS 1 million to the Sales and Developments segment of the
Operations Center in Argentina) to a loss of ARS 60 million in the
fiscal year ended June 30, 2020 (out of which ARS 52 million are
allocated to the Shopping Malls segment and ARS 8 million to the
Offices segment of the Operations Center in
Argentina).
In turn, total revenues on account of building administration
expenses and promotion fund decreased by ARS 606 million (16.4%),
from ARS 3,706 million in the fiscal year ended June 30, 2019 to
ARS 3,100 million in the fiscal year ended June 30,
2020.
Revenues from inter-segment transactions varied by ARS 292 million
(55.5%), from ARS 526 million in the fiscal year ended June 30,
2019 to ARS 818 million in the fiscal year ended June 30,
2020.
Therefore, according to information by segments (taking into
account the profit/ (loss) from operations from our joint ventures
and excluding those related to building administration expenses and
collective promotion fund and business inter-segment transactions),
total revenues increased by ARS 11,380 million (10.6%), from ARS
107,654 million in the fiscal year ended June 30, 2019 to ARS
119,034 million in the fiscal year ended June 30, 2020. This was
mainly due to a ARS 7,198 million increase in the Agricultural
Business and a ARS 4,182 million increase in the Urban Properties
and Investment Business. Within the Urban Properties and Investment
Business the variation is due to ARS 8,100 million increase in the
Operations Center in Israel, offset by ARS 3,918 million decrease
in the Operations Center in Argentina.
Agricultural Business
According to information by segments (taking into account all our
joint ventures and inter-segment eliminations), total revenues
increased by ARS 7,198 million (37.8%), from ARS 19,061 million in
the fiscal year ended June 30, 2019 to ARS 26,259 million in the
fiscal year ended June 30, 2020.
Agricultural Production.
Revenues from the Agricultural Production segment
rose by 54.8% from ARS 11,100 million during the fiscal year ended
June 30, 2019 to ARS 17,186 million during the fiscal year ended
June 30, 2020. Such increase is mainly attributable
to:
●
An
ARS 4,485 million increase in revenues from crop sales, resulting
from a 5.1% decrease in the average price of crops sold, from ARS
13,831 per ton in fiscal year ended June 30, 2019 to ARS 13,125 per
ton in fiscal year ended June 30, 2020, offset by an increase of
368,865 tons in the volume of crops sold in fiscal year ended June
30, 2020 as compared to the previous fiscal year.
●
An
ARS 526 million rise in revenues from sugarcane sales, resulting
from an increase of 260,753 tons (13%) in the volume of sugarcane
sold in the fiscal year ended June 30, 2020 compared to the
previous fiscal year, coupled with a 6% rise in the average price
of sugarcane sold, from ARS 1,349 per ton in fiscal year ended June
30, 2019 to ARS 1,427 per ton in fiscal year ended June 30, 2020,
as a result of an improvement in sugarcane quality (higher TRS,
i.e., total recoverable sugar);
●
An
ARS 1,047 million increase in revenues from cattle sales, primarily
attributable to a 45% rise in tons of cattle sold in the fiscal
year ended June 30, 2020 compared to the previous fiscal year,
coupled with a 57% rise in the average price of cattle;
and
193
●
An
ARS 28 million increase in revenues from leases and services
attributable to: (i) an increase of ARS 252 million (70%) in
revenues from seed production mainly caused by an increase in the
hectares leased to third parties in Brazil plus the collection of
an additional amount on account of productivity over the yields,
offset by a decrease in the sales price of the corn and soybean
seed service in Argentina; and (ii) a ARS 67 million decrease in
revenues from feedlot services and pastures.
Others.
Revenues from the
Others segment increased by 14.0% from ARS 7,961 million during the
fiscal year ended June 30, 2019 to ARS 9,073 million during the
fiscal year ended June 30, 2020. Such increase is mainly
attributable to:
●
An
ARS 464 million increase in revenues from agro-industrial
activities, due to the fact that, although the volume remained
stable, in this fiscal year the share of sales to the external
market increased over total sales, generating a double impact on
gain (loss) by the effect of the increase in the exchange rate. The
volume of domestic sales decreased, but prices remained in line
with the inflation for the fiscal year.
●
An
ARS 648 million increase in revenues from sales on consignment,
brokerage fees and others, due to a higher volume of crop trading
transactions and sales of supplies in the current year, boosted by
the effect of devaluation.
Urban Properties and Investment Business
According to information by segments (taking into account all our
joint ventures and inter-segment eliminations), total revenues
increased by ARS 4,182 million (4.7%), from ARS 88,593 million in
the fiscal year ended June 30, 2019 (out of which ARS 73,537
million derive from the Operations Center in Israel and ARS 15,056
million from the Operations Center in Argentina) to ARS 92,775
million in the fiscal year ended June 30, 2020 (out of which ARS
81,637 million derive from the Operations Center in Israel and ARS
11,138 million from the Operations Center in Argentina). Excluding
the revenues from the Operations Center in Israel, revenues,
according to information by segments, decreased by
26.0%.
Operations Center in Argentina
Shopping Malls.
Revenues from
the Shopping Malls segment decreased by 30.5% from ARS 8,541
million during the fiscal year ended June 30, 2019 to ARS 5,935
million during the fiscal year ended June 30, 2020. Such fall is
mainly attributable to: (i) a ARS 1,910 million decrease in
revenues from permanent and variable leases (total sales of our
lessees dropped from ARS 94,436 million during the fiscal year
ended June 30, 2019 to ARS 69,965 million during the fiscal year
ended June 30, 2020; (ii) an ARS 196 million decrease in Other
revenues mainly attributable to the termination of the Walmart
agreement; (iii) an ARS 186 million decrease in revenues from
parking fees; and (iv) an ARS 151 million decrease in revenues from
admission fees.
Offices.
Revenues from the
Offices segment increased by 5.3% from ARS 2,239 million during the
fiscal year ended June 30, 2019 to ARS 2,358 million during the
fiscal year ended June 30, 2020. The variation is mainly
attributable to a 6% increase in revenues from leases from ARS
2,199 million during the fiscal year ended June 30, 2020 to ARS
2,330 million during the fiscal year ended June 30, 2020, mainly as
a result of an increase in the rental of the PH Office Park and
Zeta Buildings and the effect of the exchange rate
variation.
Sales and Developments.
Revenues from the Sales and Developments segment
recorded a 34.3% decrease, from ARS 1,119 million during the fiscal
year ended June 30, 2019 to ARS 735 million during the fiscal year
ended June 30, 2020. This segment often varies significantly from
fiscal year to fiscal year due to the non-recurrence of different
sales transactions carried out by the Group over
time.
Hotels.
Revenues from our
Hotels segment decreased by 31.6% from ARS 2,953 million during the
fiscal year ended June 30, 2019 to ARS 2,021 million during the
fiscal year ended June 30, 2020, mainly due to a decrease in
revenues from Hoteles Argentino S.A.U. as a result of the
deflagging process and due to the fact that revenues were
significantly affected by a decline in the activity since March due
to the outbreak of the COVID-19 pandemic.
International.
Revenues from
our International segment decreased by 21.4% to ARS 11 million
during the fiscal year ended June 30, 2020 due to an ARS 3 million
decrease in revenues from leases.
194
Corporate.
Revenues associated
with our Corporate segment showed no variations for the reported
fiscal years.
Others.
Revenues from the
Others segment decreased by 58.9% from ARS 190 million during the
fiscal year ended June 30, 2019 to ARS 78 million during the fiscal
year ended June 30, 2020, mainly due to a decrease in revenues from
La Arena and La Rural S.A., OFC S.R.L., Ogden S.A. and
Entretenimiento Universal S.A. – Unión Transitoria
– (administrator of the
Centro de Convenciones y
Exposiciones de la Ciudad de Buenos
Aires).
Operations Center in Israel
Real Estate.
Revenues from the
Real Estate segment decreased from ARS 14,392 million during the
fiscal year ended June 30, 2019 to ARS 12,954 million during the
fiscal year ended June 30, 2020. Such variation was due to drop in
the sale of residential units partially offset by an actual
depreciation of the Argentine Peso of approximately
13%.
Telecommunications.
Revenues
from the Telecommunications segment increased from ARS 57,506
million during the fiscal year ended June 30, 2019 to ARS 64,838
million during the fiscal year ended June 30, 2020. Such variation
was due to an actual depreciation of the Argentine Peso of
approximately 13% because, in actual fact, there was no significant
variation since revenues from television and Internet services
increased to the same extent as revenues from mobile and roaming
services decreased.
Others.
Revenues from the
Others segment increased from ARS 1,639 million during the fiscal
year ended June 30, 2019 to ARS 3,845 million during the fiscal
year ended June 30, 2020. Such variation was due to a drop in
revenues from Epsilon offset by an actual depreciation of the
Argentine peso of approximately 13%.
Costs 2020 vs. 2019
Total costs, according to the income statement, increased by ARS
8,587 million (11.4%), from ARS 75,384 million in the fiscal year
ended June 30, 2019 to ARS 83,971 million in the fiscal year ended
June 30, 2020. This was mainly due to a ARS 5,774 million increase
in the Agricultural Business, from ARS 15,969 million in the fiscal
year ended June 30, 2019 to ARS 21,743 million in the fiscal year
ended June 30, 2020, and a ARS 2,813 million increase in the Urban
Properties and Investment Business. Within the Urban Properties and
Investment Business, the variation is due to an increase in the
Operations Center in Israel of ARS 3,870 million offset by an ARS
1,057 million decrease in the Operations Center in
Argentina.
Costs from our joint ventures decreased by ARS 14 million (20.9%),
from a profit of ARS 67 million in the fiscal year ended June 30,
2019 (out of which ARS 17 million are allocated to the Shopping
Malls segment; ARS 42 million to the Offices segment and ARS 8
million to the Sales and Developments segment of the Operations
Center in Argentina) to a profit of ARS 53 million in the fiscal
year ended June 30, 2020 (out of which ARS 7 million are allocated
to the Shopping Malls segment; ARS 40 million to the Offices
segment and ARS 6 million to the Sales and Developments segment of
the Operations Center in Argentina).
In turn, total costs on account of building administration expenses
and promotion fund decreased by ARS 625 million (16.2%), from ARS
3,855 million in the fiscal year ended June 30, 2019 to ARS 3,230
million in the fiscal year ended June 30, 2020.
Costs from inter-segment transactions varied by ARS 344 million
(175.5%), from ARS 196 million in the fiscal year ended June 30,
2019 to ARS 540 million in the fiscal year ended June 30,
2020.
Therefore, according to information by segments (taking into
account profit / (loss) from operations from our joint businesses
and excluding those related to building administration expenses and
collective promotion fund and business inter-segment transactions),
total costs increased by ARS 9,542 million (13.3%), from ARS 71,792
million in the fiscal year ended June 30, 2019 to ARS 81,334
million in the fiscal year ended June 30, 2020. This was mainly due
to an ARS 6,118 million increase in the Agricultural Business and a
ARS 3,424 million increase in the Urban Properties and Investment
Business. Within the Urban Properties and Investment Business, the
variation derives from a decrease in the Operations Center in
Israel of ARS 3,870 million and an increase in the Operations
Center in Argentina of ARS 446 million.
195
Agricultural Business
According to information by segments (taking into account all our
joint ventures and inter-segment eliminations), total costs
increased by ARS 6,118 million (37.8%), from ARS 16,165 million in
the fiscal year ended June 30, 2019 to ARS 22,283 million in the
fiscal year ended June 30, 2020. The costs of the Agricultural
Business, measured as a percentage of revenues from this segment,
increased from 84.8% during the fiscal year ended June 30, 2019 to
84.9% during the fiscal year ended June 30, 2020.
Agricultural Production.
The
costs of the Agricultural Production segment increased by 55.0%
from ARS 9,466 million during the fiscal year ended June 30, 2019
to ARS 14,676 million during the fiscal year ended June 30, 2020,
primarily as a consequence of:
●
An
ARS 3,626 million increase in costs of crop sales, mainly resulting
from an 8% decrease in the average cost per ton of crops sold in
the fiscal year ended June 30, 2020, from ARS 16,026 million in the
fiscal year ended June 30, 2019 to ARS 14,525 million in the fiscal
year ended June 30, 2020; offset by an increase of 368,865 tons in
the volume of crops sold in the fiscal year ended June 30, 2020 as
compared to the previous fiscal year.
●
An
ARS 682 million increase in the costs of sugarcane sales, mainly as
a result of an increase of 260,753 tons (13%) in the volume of
sugarcane sold in the fiscal year ended June 30, 2020 compared to
the previous fiscal year, coupled with a 14% rise in the average
cost of sugarcane per ton sold in the fiscal year, from ARS 1,176
per ton in the fiscal year ended June 30, 2019 to ARS 1,344 per ton
in the fiscal year ended June 30, 2020;
●
An
ARS 897 million increase in the costs of cattle and milk sales,
mainly as a result of the additional 4,220 tons of cattle sold in
the fiscal year ended June 30, 2020 compared to the previous fiscal
year, coupled with a 54% rise in the average cost of cattle sold;
and
●
An
ARS 5 million increase in costs of leases and services, mainly
attributable to an ARS 105 million increase in the Feedlot service
cost and an ARS 69 million drop in lease costs and seed
production.
Costs of the Agricultural Production segment, measured as a
percentage of revenues from this segment, increased from 85.3%
during the fiscal year ended June 30, 2019 to 85.4% during the
fiscal year ended June 30, 2020.
Land transformation and sales.
The costs of the Land transformation and sales
segment increased by 4.2% from ARS 24 million during the fiscal
year ended June 30, 2019 to ARS 25 million during the fiscal year
ended June 30, 2020.
Others.
The costs of the Others
segment increased by 13.6% from ARS 6,675 million during the fiscal
year ended June 30, 2019 to ARS 7,582 million during the fiscal
year ended June 30, 2020, mainly as a result
of:
●
An
ARS 273 million increase in agro-industrial costs, mostly driven by
a rise in acquisition costs of all of its components.
●
An
ARS 634 million increase in other segments, mainly triggered by the
sale of supplies.
The costs of the Others segment, measured as a percentage of
revenues from this segment, decreased from 83.8% during the fiscal
year ended June 30, 2019 to 83.6% during the fiscal year ended June
30, 2020.
196
Urban Properties and Investment
Business
According to information by segments (taking into account all our
joint ventures and inter-segment eliminations), total costs
increased by ARS 3,424 million (6.2%), from ARS 55,627 million in
the fiscal year ended June 30, 2019 (out of which ARS 52,426
million derive from the Operations Center in Israel and ARS 3,201
million from the Operations Center in Argentina) to ARS 59,051
million in the fiscal year ended June 30, 2020 (out of which ARS
56,296 million derive from the Operations Center in Israel and ARS
2,755 million from the Operations Center in Argentina). Excluding
the costs from the Operations Center in Israel, costs, according to
information by segments, increased by 13.9%. Likewise, total costs,
measured as a percentage of total revenues, according to
information by segments, increased from 62.8% during the fiscal
year ended June 30, 2019 to 63.6% during the fiscal year ended June
30, 2020, mainly derived from the Operations Center in Israel.
Excluding the effect from the Operations Center in Israel, total
costs, measured as a percentage of total revenues, increased from
21.3% during the fiscal year ended June 30, 2019 to 24.7% during
the fiscal year ended June 30, 2020.
Operations Center in Argentina
Shopping Malls.
Costs
associated with the Shopping Malls segment decreased by 26.9%, from
ARS 776 million during the fiscal year ended June 30, 2019 to ARS
567 million during the fiscal year ended June 30, 2020, mainly due
to: (i) a decrease in leases and building administration expenses
of ARS 130 million (mainly caused by the absorption of the building
administration expenses deficit during the previous fiscal year);
and (ii) a decrease in salaries, social security and other
personnel expenses of ARS 78 million. Costs associated with the
Shopping Malls segment, measured as a percentage of the revenues
from this segment, increased from 9.1% during the fiscal year ended
June 30, 2019 to 9.6% during the fiscal year ended June 30,
2020.
Offices
. Costs associated with
the Offices segment increased by 5.9%, from ARS 153 million during
the fiscal year ended June 30, 2019 to ARS 144 million during the
fiscal year ended June 30, 2020, mainly due to (i) an increase in
leases and building administration expenses of ARS 33 million,
offset by (ii) a decrease in maintenance expenses of ARS 12
million; and (iii) a decrease in amortization and depreciation of
ARS 11 million. Costs associated with the Offices segment, measured
as a percentage the revenues from this segment, decreased from 6.8%
during the fiscal year ended June 30, 2019 to 6.1% during the
fiscal year ended June 30, 2020.
Sales and Developments
. Costs
associated with our Sales and Developments segment recorded a 30.9%
increase from ARS 527 million during the fiscal year ended June 30,
2019 to ARS 690 million during the fiscal year ended June 30, 2020,
mainly due to (i) the barter of the Coto air space, thus triggering
costs in the nature of fees and compensation for services of ARS 53
million and an increase in the cost of goods and services sold of
ARS 18 million and (ii) higher costs of goods and services sold
related to Catalinas of ARS 48 million. Costs associated with the
Sales and Developments segment, measured as a percentage of
revenues from this segment, increased from 47.1% during the fiscal
year ended June 30, 2019 to 93.9% during the fiscal year ended June
30, 2020.
Hotels.
Costs associated with
the Hotels segment decreased by 21.7%, from ARS 1,588 million
during the fiscal year ended June 30, 2019 to ARS 1,244 million
during the fiscal year ended June 30, 2020, mainly as a result of
(i) a ARS 188 million decrease in the costs of salaries, social
security and other personnel expenses; and (ii) a ARS 67 million
decrease in maintenance, repairs and services; (iii) a ARS 38
million decrease in food, beverages and other hotel expenses, and
(iv) a ARS 34 million increase in fees and compensation for
services. Costs associated with the Hotels segment, measured as a
percentage of revenues from this segment, increased from 53.8%
during the fiscal year ended June 30, 2019 to 61.6% during the
fiscal year ended June 30, 2020.
International.
Costs associated
with the International segment increased 100%, amounting to ARS 12
million during the fiscal year ended June 30, 2020 and ARS 6
million during the fiscal year ended June 30, 2019, mainly due to
(i) an ARS 4 million increase in maintenance, repairs and services;
(ii) an ARS 1 million increase in fees and compensation for
services; and (iii) an ARS 1 million increase in taxes, fees and
contributions. Costs associated with the International segment,
measured as a percentage of revenues from this segment, increased
from 42.9% during the fiscal year ended June 30, 2019 to 109.1%
during the fiscal year ended June 30, 2020.
Corporate
. Costs associated
with the Corporate segment did not vary in the reported fiscal
years.
197
Others.
Costs associated with
the Others segment decreased by 35.1%, from ARS 151 million during
the fiscal year ended June 30, 2019 to ARS 98 million during the
fiscal year ended June 30, 2020, mainly as a result of: (i) an ARS
34 million decrease in leases and building administration expenses;
(ii) an ARS 29 million decrease in taxes, fees and contributions;
and (iii) an ARS 21 million decrease in fees and compensation for
services; partially offset by (iv) an ARS 36 million increase in
depreciation and amortization.
Operations Center in Israel
Real Estate.
Costs associated
with the Real Estate segment decreased from ARS 9,121 million
during the fiscal year ended June 30, 2019 to ARS 6,787 million
during the fiscal year ended June 30, 2020. This variation was due
to a decrease in costs as a result of the write-off of residential
units sold, offset by a 13% depreciation
approximately.
Telecommunications.
Costs
associated with the Telecommunications segment increased from ARS
42,424 million during the fiscal year ended June 30, 2019 to ARS
47,231 million during the fiscal year ended June 30, 2020. Such
variation was due to an actual depreciation of the NIS against the
Argentine Peso of approximately 13%.
Others.
Costs associated with
the Others segment increased from ARS 881 million during the fiscal
year ended June 30, 2019 to ARS 2,278 million during the fiscal
year ended June 30, 2020. This variation was due to a drop in the
costs of Bartan and Epsilon, offset by an actual depreciation of
the NIS against the Argentine Peso of approximately
13%.
Initial recognition and changes in the fair value of biological
assets and agricultural produce at the point of harvest 2020 vs.
2019
The profit from the total initial recognition and changes in the
fair value of biological assets and agricultural produce at the
point of harvest, according to the income statement, increased by
ARS 522 million (22.6%), from ARS 2,305 million in the fiscal year
ended June 30, 2019 to ARS 2,827 million in the fiscal year ended
June 30, 2020.
There is no profit / (loss) from our joint ventures in relation to
the initial recognition and changes in the fair value of biological
assets and agricultural produce at the point of
harvest.
There is no profit / (loss) on account of building administration
expenses and promotion fund in relation to the initial recognition
and changes in the fair value of biological assets and agricultural
produce at the point of harvest.
The profit/ (loss) related to the initial recognition and changes
in the fair value of biological assets and agricultural produce at
the point of harvest from inter-segment transactions varied by ARS
66 million (24.4%), from ARS 270 million in the fiscal year ended
June 30, 2019 to ARS 204 million in the fiscal year ended June 30,
2020.
Therefore, according to information by segments (taking into
account the profit / (loss) from operations from our joint ventures
and excluding those related to building administration expenses and
collective promotion fund and business inter-segment transactions),
the profit / (loss) from the total initial recognition and changes
in the fair value of biological assets and agricultural produce at
the point of harvest increased by ARS 588 million (28.9%), from ARS
2,035 million in the fiscal year ended June 30, 2019 to ARS 2,623
million in the fiscal year ended June 30, 2020.
Such variation was mainly as a result of:
●
Profits
from cattle production of ARS 171 million, mainly generated by
Argentina, due the fact that cattle prices during this fiscal year
had a better performance vis-à-vis inflation, thus generating
a positive variation both in holding profit / (loss) and in profit
/ (loss) from sales, also favored by an increase in head of cattle
sold compared to the previous fiscal year (170%);
●
A
decrease in profits from crop production of ARS 324 million, mainly
due to a decrease in profits from soybean production as a result of
a greater planted area;
198
●
An
increase in profits from sugarcane production of ARS 691 million,
mainly in Brazil, as a result of better yields, prices and an
increase in total recoverable sugar (TRS) during this fiscal year;
and
●
An
increase in profits from the agro-industrial activity of ARS 4
million
Changes in
the net realizable value of agricultural produce after
harvest
2020
vs. 2019
Profits /(losses) from total changes in the net realizable value of
agricultural produce after harvest, according to the income
statement, increased by ARS 700 million (1,627.9%), from a loss of
ARS 43 million in the fiscal year ended June 30, 2019 to a profit
of ARS 657 million in the fiscal year ended June 30,
2020.
Such variation is mainly generated by Argentina, due to the
increase in prices as a result of the Peso depreciation, boosted by
a bigger grain stock obtained during the 19-20 crop
year.
Gross profit 2020 vs. 2019
As a result of the above mentioned factors, total gross profit,
according to the income statement, increased by ARS 3,150 million
(8.4%), from ARS 37,619 million in the fiscal year ended June 30,
2019 to ARS 40,769 million in the fiscal year ended June 30, 2020.
This was mainly due to the ARS 2,366 million increase in the
Agricultural Business, from ARS 4,867 million in the fiscal year
ended June 30, 2019 to ARS 7,233 million in the fiscal year ended
June 30, 2020, and a ARS 784 million increase in the Urban
Properties and Investment Business. Within the Urban Properties and
Investment Business, the variation is due to an increase in the
Operations Center in Israel of ARS 4,230 million, offset by a
decrease in the Operations Center in Argentina of ARS 3,446
million.
Gross (profit) / loss from our joint ventures increased by ARS 19
million (73.1%), from a loss of ARS 26 million in the fiscal year
ended June 30, 2019 to a loss of ARS 7 million in the fiscal year
ended June 30, 2020.
In turn, total gross (profit) / loss on account of building
administration expenses and promotion fund increased by ARS 19
million (12.8%), from a loss of ARS 149 million in the fiscal year
ended June 30, 2019 (out of which a loss of ARS 144 million derives
from the Shopping Malls segment and a loss of ARS 5 million derives
from the Offices segment) to a loss of ARS 130 million in the
fiscal year ended June 30, 2020 (out of which a loss of ARS 116
million derives from the Shopping Malls segment and another loss of
ARS 14 million derives from the Offices segment).
Gross profit / (loss) generated by inter-segment transactions
varied by ARS 14 million (23.3%), from ARS 60 million in the fiscal
year ended June 30, 2019 to ARS 74 million in the fiscal year ended
June 30, 2020.
Therefore, according to information by segments (taking into
account the profit / (loss) from operations from our joint ventures
and excluding those related to building administration expenses and
collective promotion fund and business inter-segment transactions),
total gross profits increased by ARS 3,126 million (8.3%), from ARS
37,854 million in the fiscal year ended June 30, 2019 to ARS 40,980
million in the fiscal year ended June 30, 2020. This was mainly due
to an ARS 2,368 million increase in the Agricultural Business and a
ARS 758 million increase in the Urban Properties and Investment
Business. Within the Urban Properties and Investment Business, the
variation was generated by an increase in the Operations Center in
Israel of ARS 4,230 million, offset by a decrease in the Operations
Center in Argentina of ARS 3,472 million.
Agricultural Business
According to information by segments (taking into account all our
joint ventures and inter-segment eliminations), total gross profit
rose by ARS 2,368 million (48.4%), from ARS 4,888 million in the
fiscal year ended June 30, 2019 to ARS 7,256 million in the fiscal
year ended June 30, 2020. Gross profit from the Agricultural
Business, measured as a percentage of revenues from this segment,
increased from 25.6% during the fiscal year ended June 30, 2019 to
27.6% during the fiscal year ended June 30, 2020.
Agricultural Production.
Gross
profit from this segment increased by 59.7% from ARS 3,620 million
in the fiscal year ended June 30, 2019 to ARS 5,780 million in the
fiscal year ended June 30, 2020.
Land Transformation and Sales.
Gross profit from this segment decreased by 4.2%
from ARS 24 million in the fiscal year ended June 30, 2019 to ARS
25 million in the fiscal year ended June 30,
2020.
199
Others.
Gross profit from this
segment increased by 16.2% from ARS 1,292 million in the fiscal
year ended June 30, 2019 to ARS 1,501 million in the fiscal year
ended June 30, 2020.
Urban Properties and Investment Business
According to information by segments (taking into account all our
joint ventures and inter-segment eliminations), total gross profit
increased by ARS 758 million (2.3%), from ARS 32,966 million in the
fiscal year ended June 30, 2019 (out of which ARS 21,111 million
derive from the Operations Center in Israel and ARS 11,855 million
from the Operations Center in Argentina) to ARS 33,724 million in
the fiscal year ended June 30, 2020 (out of which ARS 25,341
million derive from the Operations Center in Israel and ARS 8,383
million from the Operations Center in Argentina). Excluding gross
profit from the Operations Center in Israel, gross profit,
according to information by segments, increased by 29.3%. In
addition, total gross profit, measured as a percentage of total
revenues, according to information by segments, decreased from
37.2% during the fiscal year ended June 30, 2019 to 36.4% during
the fiscal year ended June 30, 2020, mainly from the Operations
Center in Israel. Excluding the effect from the Operations Center
in Israel, total gross profit, measured as a percentage of total
revenues, decreased from 78.7% during the fiscal year ended June
30, 2019 to 75.3% during the fiscal year ended June 30,
2020.
Operations Center in Argentina
Shopping Malls.
Gross profit
from the Shopping Malls segment decreased by 30.9%, from ARS 7,765
million during the fiscal year ended June 30, 2019 to ARS 5,368
million during the fiscal year ended June 30, 2020, mainly as a
result of a decrease in total sales of our lessees in real terms,
thus resulting in lower percentage rentals under our lease
agreements.
Gross profit from the Shopping Malls segment,
measured as a percentage of revenues from this segment, decreased
slightly from 90.9% during the fiscal year ended June 30, 2019 to
90.4% during the fiscal year ended June 30,
2020.
Offices.
Gross profit from the
Offices segment increased by 6.1%, from ARS 2,086 million during
the fiscal year ended June 30, 2019 to ARS 2,214 million during the
fiscal year ended June 30, 2020. Gross profit from the Offices
segment, measured as a percentage of revenues from this segment,
increased from 93.2% during the fiscal year ended June 30, 2019 to
93.9% during the fiscal year ended June 30,
2020.
Sales and developments.
Gross
profit from the Sales and Developments segment decreased by 92.4%,
from ARS 592 million during the fiscal year ended June 30, 2019 to
ARS 45 million during the fiscal year ended June 30, 2020. Gross
profit from the Sales and Developments segment, measured as a
percentage of revenues from this segment, decreased from 52.9%
during the fiscal year ended June 30, 2019 to 6.1% during the
fiscal year ended June 30, 2020.
Hotels
. Gross profit from the
Hotels segment decreased by 43.1% from ARS 1,365 million during the
fiscal year ended June 30, 2019 to ARS 777 million during the
fiscal year ended June 30, 2020. Gross profit from the Hotels
segment, measured as a percentage of revenues from this segment,
decreased from 46.2% during the fiscal year ended June 30, 2019 to
38.4% during the fiscal year ended June 30,
2020.
International
. Gross profit
from the International segment decreased by 112.5%, recording a
gross profit of ARS 8 million during the fiscal year ended June 30,
2019 and a gross loss of ARS 1 million during the fiscal year ended
June 30, 2020. Gross (profit) / loss from the International
segment, measured as a percentage of revenues from this segment,
decreased from a 57.1% profit during the fiscal year ended June 30,
2019 to a 9.1% loss during the fiscal year ended June 30,
2020.
Corporate
. Gross profit from
the Corporate segment did not show any variations during the
reported fiscal years.
Others
. Gross profit from the
Others segment decreased by 151.3% from a profit of ARS 39 million
during the fiscal year ended June 30, 2019 to a loss of ARS 20
million during the fiscal year ended June 30, 2020. Gross profit
from the Others segment, measured as a percentage of revenues from
this segment, decreased from a 20.5% profit during the fiscal year
ended June 30, 2019 to a 25.6% loss during the fiscal year ended
June 30, 2020.
200
Operations
Center in Israel
Real Estate.
Gross profit from
the Real Estate segment increased from ARS 5,271 million during the
fiscal ended June 30, 2019 to ARS 6,167 million during the fiscal
year ended June 30, 2020. Such variation was mainly due to an
actual depreciation of approximately 13%. Gross profit from this
segment, as a percentage of revenues, increased from 36.6% during
the fiscal year ended 2019 to 47.6% during the fiscal year ended
2020.
Telecommunications.
Gross
profit from the Telecommunications segment increased from ARS
15,082 million during the fiscal year ended June 30, 2019 to ARS
17,607 million during the fiscal year ended June 30, 2020. Such
variation was mainly due to an actual depreciation of approximately
13%. Gross profit from this segment, as a percentage of revenues,
increased slightly from 26.2% during the fiscal year ended June 30,
2019 to 27.2% during the fiscal year ended June 30,
2020.
Others.
Gross profit from the
Others segment increased from ARS 758 million during the fiscal
year ended June 30, 2019 to ARS 1,567 million during the fiscal
year ended June 30, 2020. Such variation was mainly due to an
actual depreciation of approximately 13%. Gross profit from this
segment, as a percentage of revenues, decreased slightly from 46.2%
during the fiscal year ended June 30, 2019 to 40.8% during the
fiscal year ended June 30, 2020.
Net gain (loss) from changes in the fair value of investment
properties 2020 vs. 2019
Total gain (loss) from changes in the fair value of investment
properties, according to the income statement, increased by ARS
68,738 million (182.1%), from a loss of ARS 37,746 million in the
fiscal year ended June 30, 2019 to a gain of ARS 30,992 million in
the fiscal year ended June 30, 2020. This was mainly due to a ARS
780 million increase in the Agricultural Business, from a loss of
ARS 0 million in the fiscal year ended June 30, 2019 to a gain of
ARS 780 million in the fiscal year ended June 30, 2020, and a ARS
67,958 million increase in the Urban Properties and Investment
Business. Within the Urban Properties and Investment Business, the
variation relates to an ARS 3,881 million decrease in the
Operations Center in Israel and an ARS 71,839 million increase in
the Operations Center in Argentina.
The gain (loss) from changes in the fair value of investment
properties from our joint ventures decreased by ARS 1,102 million
(131.3%), from a gain of ARS 839 million in the fiscal year ended
June 30, 2019 to a loss of ARS 263 million in the fiscal year ended
June 30, 2020.
There is no gain / (loss) from building administration expenses and
promotion fund in relation to the changes in the fair value of
investment properties.
There is no gain / (loss) from inter-segment transactions in
relation to the changes in the fair value of investment
properties.
Therefore, according to information by segments (taking into
account the profit / (loss) from operations from our joint ventures
and excluding those related to building administration expenses and
collective promotion fund and business inter-segment transactions),
the total net gain/(loss) from changes in the fair value of
investment properties increased by ARS 69,840 million (181.0%),
from a loss of ARS 38,585 million in the fiscal year ended June 30,
2019 to a gain of ARS 31,255 million in the fiscal year ended June
30, 2020. Such variation was mainly due to an ARS 780 million
increase in the Agricultural Business and an ARS 69,060 million
increase in the Urban Properties and Investment Business. Within
the Urban Properties and Investment Business, the variation derives
from a decrease in the Operations Center in Israel of ARS 3,881
million and an increase in the Operations Center in Argentina of
ARS 72,941 million.
Agricultural Business
According to information by segments (taking into account all our
joint ventures and inter-segment eliminations), the total net gain
/(loss) from changes in the fair value of investment properties
increased by ARS 780 million (100.0%), from ARS 0 million in the
fiscal year ended June 30, 2019 to ARS 780 million in the fiscal
year ended June 30, 2020.
201
Urban Properties and Investment
Business
According to information by segments (taking into account all our
joint ventures and inter-segment eliminations), total net gain /
(loss) from changes in the fair value of investment properties
decreased by ARS 69,060 million (179.0%), from a loss of ARS 38,585
million in the fiscal year ended June 30, 2019 (out of which a gain
of ARS 892 million derive from the Operations Center in Israel and
a loss of ARS 39,477 million from the Operations Center in
Argentina) to a gain of ARS 30,475 million in the fiscal year ended
June 30, 2020 (out of which a loss of ARS 2,989 million derive from
the Operations Center in Israel and a gain of ARS 33,464 million
from the Operations Center in Argentina). Excluding the changes in
the fair value of investment properties from the Operations Center
in Israel, changes in the fair value of investment properties,
according to information by segments, decreased by
184.8%.
Operations Center in Argentina
The net impact of prices in pesos of our properties was primarily a
consequence of the changes in the macroeconomic conditions: (i) a
decrease in the estimated GDP growth rate in Argentina for 2020
from 2.2% to -11%, (ii) between June 2019 and June 2020, the
Argentine Peso depreciated 66% against the U.S. Dollar (from ARS
42.26 per USD 1 to ARS 70.26 per USD 1), which mainly generated a
reduction in the estimated cash flow in U.S. Dollars from our
Shopping Malls segment; and (iii) an increase of 8 basis points in
the discount rate in dollars used to discount the estimated cash
flow from the Shopping Malls segment.
The Argentine office market is a liquid market, in which a
significant number of counterparties participate and frequently
carry out purchase and sale transactions. This situation shows
sales prices that are relevant and representative in the market. In
addition, lease agreements are denominated in dollars for an
average 3-year term, thus generating a stable dollar-denominated
cash flow from this business. In this sense, the
“
market
approach
” method (value
of comparable assets in the market) is used to assess the fair
value of the Offices and Others segments, the value per square
meter being the most representative metrics.
Since September 2019, the real estate market started to show
certain changes in its operations as a result of the implementation
of regulations in the foreign exchange market. Consequently, the
most probable scenario is that any sale of office buildings / land
reserves be paid in pesos at an implied exchange rate higher than
the official rate, which is shown in the transactions carried out
by the Company before and after the end of these financial
statements. Therefore, the Company has valued its offices buildings
and land reservations in pesos at the end of the year on the basis
of the above-described situation, which derives in a gain compared
to previously booked values.
Operations Center in Israel
Real Estate
. Net gain/(loss)
from changes in the fair value of investment properties in this
segment decreased from
a gain
of ARS 892 during the fiscal year ended June 30, 2019 to a loss of
ARS 2,989 million during the fiscal year ended June 30, 2020.
Figures are not comparable because, as of June 2019, only the
changes in the fair value of investment properties sold were
recorded while, in this fiscal year, the loss was mainly related to
an impairment of the HSBS property. In addition, a new valuation of
the Tivoli property was made, which generated a drop in the fair
value, offset by an appreciation of the Kiriat Ono Mall during the
first quarter of the fiscal year. The Group’s policy is to
make the valuations in Israel in May, but a valuation of the Tivoli
was made in September since it was necessary to update the equity
value of IDBG due to the agreement for the sale of the shares held
by IDBD in IDBG to PBC.
Gain from disposal of farmlands 2020 vs. 2019
The total gain from disposal of farmlands, according to the income
statement, increased by ARS 173 million (26.0%), from ARS 665
million in the fiscal year ended June 30, 2019 to ARS 838 million
in the fiscal year ended June 30, 2020.
Based on the information by segment (taking into account all our
joint ventures and inter-segment eliminations), the total gain from
disposal of farmlands increased by ARS 173 million (26.0%), from
ARS 665 million in the fiscal year ended June 30, 2019 to ARS 838
million in the fiscal year ended June 30, 2020.
202
Fiscal year ended June 30, 2020
●
On
June 30, 2020, BrasilAgro entered into an agreement for the sale of
1,875 hectares (1,500 arable hectares) of the Jatobá land. The
sales value was ARS 567 million, out of which ARS 63 million have
already been collected. The balance will be paid in six annual
installments. The Group recognized a gain of ARS 413 million as a
result of this transaction.
●
On
May 29, 2020, BrasilAgro entered into an agreement for the sale of
105 arable hectares in the Alto Taquarí land. The sales value
was ARS 139 million. The buyer made a down payment of ARS 22
million. The balance will be paid in five annual installments. The
Group recognized a gain of ARS 100 million as a result of this
transaction.
●
On
October 29, 2019, the Company entered into an agreement for the
sale of a total area of 85 hectares (65 arable hectares) of the
Alto Taquarí establishment, a rural property located in the
Alto Taquarí municipality, in the aggregate amount of ARS 94
million. On that same date, the buyer paid the first installment of
14,300 soybean bags in the amount of ARS 18 million. The balance
will be paid in four annual installments. The Group recognized a
gain of ARS 68 million for this transaction.
●
On
July 2019, the Group, through its subsidiary BrasilAgro, entered
into a purchase-sale agreement for 1,134 hectares (893 arable
hectares) of the Jatobá Establishment, a rural property
located in the city of Jaborandi – BA. The sales price was
302 soybean bags per arable hectare or ARS 394 million. On
September 2, 2019, the buyer paid the first installment consisting
in 38,000 soybean bags in the amount of ARS 45 million. The balance
will be paid in six annual installments. Delivery of possession and
the gain of the transaction was recognized on September 30, 2019,
amounting to approximately ARS 272 million.
Fiscal year ended June 30, 2019
●
In
June 2019, the Group, through its subsidiary BrasilAgro, entered
into an agreement for the sale of 3,124 hectares of the Jatobá
land. The sales price was 285 soybean bags per hectare or ARS 776
million. The buyer made a down payment of ARS 83 million and will
complete payment of the first installment (ARS 83 million) by July
31, 2019. The balance, i.e. 563,844 soybean bags, will be paid in
six annual installments. Delivery of possession and the gain of the
transaction will be recognized on June 30, 2020, amounting to ARS
573 million.
●
On
November 21, 2018, the Group, through its subsidiary BrasilAgro,
entered into an agreement for the sale of 103 hectares of the Alto
Taquarí land. The sales price was 1,100 soybean bags per
arable hectare equivalent to ARS 114 million. The buyer made a down
payment of 22,656 soybean bags equivalent to ARS 17 million; the
balance will be paid in eight semi-annual installments. The Group
has recognized a gain of ARS 91 million as a result of this
transaction in this fiscal year.
General and administrative expenses 2020 vs. 2019
Total general and administrative expenses, according to the income
statement, increased by ARS 115 million (0.9%), from ARS 12,152
million in the fiscal year ended June 30, 2019 to ARS 12,267
million in the fiscal year ended June 30, 2020. This was mainly due
to a ARS 112 million decrease in the Agricultural Business, from
ARS 1,514 million in the fiscal year ended June 30, 2019 to ARS
1,402 million in the fiscal year ended June 30, 2020, and a ARS 227
million increase in the Urban Properties and Investment Business.
Within the Urban Properties and Investment Business, the variation
relates to an increase in the Operations Center in Israel of ARS
733 million, offset by a decrease in the Operations Center in
Argentina of ARS 506 million.
General and administrative expenses from our joint ventures
decreased by ARS 2 million (11.8%), from ARS 17 million in the
fiscal year ended June 30, 2019 to ARS 15 million in the fiscal
year ended June 30, 2020.
There are no profits / (losses) on account of building
administration expenses and promotion fund associated with general
and administrative expenses.
203
General and administrative expenses from inter-segment transactions
decreased by ARS 4 million (7.3%), from ARS 55 million in the
fiscal year ended June 30, 2019 to ARS 51 million in the fiscal
year ended June 30, 2020.
Therefore, according to information by segments (taking into
account the profit/ (loss) from operations from our joint ventures
and excluding those relating to building administration expenses
and collective promotion fund and business inter-segment
transactions), total general and administrative expenses increased
by ARS 109 million (0.9%), from ARS 12,224 million in the fiscal
year ended June 30, 2019 to ARS 12,333 million in the fiscal year
ended June 30, 2020. This was mainly due to an ARS 106 million
decrease in the Agricultural Business and an ARS 215 million
increase in the Urban Properties and Investment Business. Within
the Urban Properties and Investment Business, the variation relates
to a decrease in the Operations Center in Israel of ARS 733
million, offset by a decrease in the Operations Center in Argentina
of ARS 518 million.
Agricultural Business
According to information by segments (taking into account all our
joint ventures and inter-segment eliminations), total general and
administrative expenses decreased by ARS 106 million (7.0%), from
ARS 1,525 million in the fiscal year ended June 30, 2019 to ARS
1,419 million in the fiscal year ended June 30, 2020. General and
administrative expenses from the Agricultural Business, measured as
a percentage of revenues from this segment, decreased from 8.0%
during the fiscal year ended June 30, 2019 to 5.4% during the
fiscal year ended June 30, 2020.
Agricultural Production.
General and administrative expenses associated
with the Agricultural Production segment decreased by 0.6%, from
ARS 959 million in the fiscal year ended June 30, 2019 to ARS 953
million in the fiscal year ended June 30, 2020, mainly due to a ARS
72 million increase in expenses associated with crop operations; a
ARS 45 million decrease in expenses associated with sugarcane
operations: a ARS 12 million decrease in expenses associated with
cattle activities; a ARS 21 million decrease in expenses associated
with the agricultural lease and services business. General and
administrative expenses of the Agricultural Production segment,
measured as a percentage of revenues from this segment, decreased
from 8.6% during the fiscal year ended June 30, 2019 to 5.5% during
the fiscal year ended June 30, 2020.
Land Transformation and Sales.
General and administrative expenses associated
with the Land Transformation and Sales segment remained stable at
ARS 3 million in the fiscal years ended June 30, 2019 and
2020.
Corporate.
General and
administrative expenses associated with the Corporate segment
decreased by 35.4%, from ARS 274 million during the fiscal year
ended June 30, 2019 to ARS 177 million during the fiscal year ended
June 30, 2020.
Others.
General and
administrative expenses associated with the Others segment
decreased by 1.0%, from ARS 289 million during the fiscal year
ended June 30, 2019 to ARS 286 million during the fiscal year ended
June 30, 2020. General and administrative expenses of the Others
segment, measured as a percentage of revenues from this segment,
decreased from 3.6% during the fiscal year ended June 30, 2019 to
3.2% during the fiscal year ended June 30,
2020.
Urban Properties and Investment Business
According to information by segments (taking into account all our
joint ventures and inter-segment eliminations), total general and
administrative expenses increased by ARS 215 million (2.0%), from
ARS 10,699 million in the fiscal year ended June 30, 2019 (out of
which ARS 8,031 million derive from the Operations Center in Israel
and ARS 2,668 million from the Operations Center in Argentina) to
ARS 10,914 million in the fiscal year ended June 30, 2020 (out of
which ARS 8,764 million derive from the Operations Center in Israel
and ARS 2,150 million from the Operations Center in Argentina).
Excluding general and administrative expenses from the Operations
Center in Israel, general and administrative expenses, according to
information by segments, increased by 19.4%. In addition, total
general and administrative expenses, measured as a percentage of
total revenues, according to information by segments, decreased
from 12.1% during the fiscal year ended June 30, 2019 to 11.8%
during the fiscal year ended June 30, 2020, mainly deriving from
the Operations Center in Israel. Excluding the effect from the
Operations Center in Israel, total general and administrative
expenses, measured as a percentage of total revenues, increased
from 17.7% during the fiscal year ended June 30, 2019 to 19.3%
during the fiscal year ended June 30, 2020.
204
Operations Center in Argentina
Shopping Malls.
Administrative
expenses of Shopping Malls decreased by 12.3%, from ARS 945 million
during the fiscal year ended June 30, 2019 to ARS 829 million
during the fiscal year ended June 30, 2020, mainly as a result of:
(i) a decrease in salaries, social security and other personnel
expenses of ARS 85 million; (ii) a decrease in fees payable to
directors of ARS 54 million, partially offset by: (iii) an ARS 19
million increase in amortization and depreciation; and (iv) an ARS
10 million increase in fees and compensation for services.
Administrative expenses of the Shopping Malls segment, as a
percentage of revenues of this segment, increased from 11.1% during
the fiscal year ended June 30, 2019 to 14% during the fiscal year
ended June 30, 2020.
Offices.
General and
administrative expenses of our Offices segment increased 6.8%, from
ARS 206 million during the fiscal year ended June 30, 2019 to ARS
220 million during the fiscal year ended June 30, 2020, mainly as a
result of: (i) an ARS 7 million increase in fees and consideration
for services; and (ii) an ARS 2 million increase in taxes, fees and
contributions. General and administrative expenses of the Offices
segment, measured as a percentage of revenues from this segment,
increased from 9.2% during the fiscal year ended June 30, 2019 to
9.3% during the fiscal year ended June 30,
2020.
Sales and Developments
. General
and administrative expenses associated with our Sales and
Developments segment decreased by 19.4%, from ARS 283 million
during the fiscal year ended June 30, 2019 to ARS 228 million
during the fiscal year ended June 30, 2020, mainly as a result of
(i) an ARS 25 million decrease in salaries, social security and
other personnel expenses; (ii) an ARS 13 million decrease in
advertising and other commercial expenses; (iii) an ARS 6 million
decrease in leases and building administration expenses; and (iv)
an ARS 5 million decrease in fees and compensation for services.
General and administrative expenses of the Sales and Developments
segment, measured as a percentage of revenues from this segment,
increased slightly from 25.3% during the fiscal year ended June 30,
2019 to 31% during the fiscal year ended June 30,
2020.
Hotels
. General and
administrative expenses associated with our Hotels segment
decreased by 25.8% from ARS 492 million during the fiscal year
ended June 30, 2019 to ARS 365 million during the fiscal year ended
June 30, 2020, mainly as a result of: (i) an ARS 55 million
decrease in fees and compensation for services; (ii) an ARS 50
million decrease in salaries, social security and other personnel
expenses; (iii) an ARS 11 million decrease in maintenance,
security, cleaning, repairs and related expenses, and (iv) an ARS 7
million decrease in taxes, fees and contributions. General and
administrative expenses of the Hotels segment, measured as a
percentage of revenues from this segment, increased from 16.7%
during the fiscal year ended June 30, 2019 to 18.1% during the
fiscal year ended June 30, 2020.
International.
General and
administrative expenses associated with our International segment
showed no variations and remained stable at ARS 110 million during
the fiscal years ended June 30, 2019 and 2020.
Corporate.
General and
administrative expenses associated with our Corporate segment
decreased by 45.7%, from ARS 519 million during the fiscal year
ended June 30, 2019 to ARS 282 million during the fiscal year ended
June 30, 2020, mainly as a result of (i) an ARS 201 million
decrease in fees payable to directors; and (ii) an ARS 38 million
decrease in salaries, social security and other personnel
expenses.
Others
. General and
administrative expenses associated with our Others segment
increased by 2.7% from ARS 113 million during the fiscal year ended
June 30, 2019 to ARS 116 million during the fiscal year ended June
30, 2020, mainly due to: (i) an ARS 8 million increase in
maintenance, repairs and services; partially offset by (ii) an ARS
4 million decrease in taxes, fees and
contributions.
Operations Center in Israel
Real Estate.
General and
administrative expenses associated with the Real Estate segment
increased from ARS 707 million during the fiscal year ended June
30, 2019 to ARS 812 million during the fiscal year ended June 30,
2020. Such variation was mainly due to an actual depreciation of
approximately 13%. General and administrative expenses associated
with this segment, measured as a percentage of revenues, went from
4.9% during the fiscal year ended June 30, 2019 to 6.3% during the
fiscal year ended June 30, 2020.
205
Telecommunications.
General and
administrative expenses associated with the telecommunications
segment increased from ARS 4,779 million during the fiscal year
ended June 30, 2019 to ARS 5,519 million during the fiscal year
ended June 30, 2020. Such variation was due to a depreciation of
approximately 13%, partially offset by the expenses associated with
the voluntary retirement of employees that was accounted for in the
fiscal year ended June 30, 2019 but was not accounted for in the
fiscal year ended June 30, 2020. General and administrative
expenses associated with this segment, measured as a percentage of
revenues from this segment, increased from 8.3% in fiscal year 2019
to 8.5% in fiscal year 2020.
Corporate
. General and
administrative expenses associated with the Corporate segment
increased from ARS 1,058 million during the fiscal year ended June
30, 2019 to ARS 1,071 million during the fiscal year ended June 30,
2020. Such variation was due to an actual depreciation of
approximately 13%, offset by a decrease in legal advisors’
fees.
Others
. General and
administrative expenses associated with the Others segment
decreased from ARS 1,487 million during the fiscal year ended June
30, 2019 to ARS 1,362 million during the fiscal year ended June 30,
2020. Such variation was due to a decrease in expenses related to
Bartan and Epsilon, offset by an actual depreciation of
approximately 13%.
Selling expenses 2020 vs 2019
Total selling expenses, according to the income statement,
increased by ARS 2,372 million (17.0%), from ARS 13,976 million in
the fiscal year ended June 30, 2019 to ARS 16,348 million in the
fiscal year ended June 30, 2020. This was primarily due to an ARS
885 million increase in the Agricultural Business, from ARS 1,706
million in the fiscal year ended June 30, 2019 to ARS 2,591 million
in the fiscal year ended June 30, 2020, and an ARS 1,487 million
increase in the Urban Properties and Investment Business. Within
the Urban Properties and Investment Business, the variation relates
to an increase in the Operations Center in Israel of ARS 1,352
million and an increase in the Operations Center in Argentina of
ARS 135 million.
Selling expenses from our joint ventures increased by ARS 12
million (171.4%), from ARS 7 million in the fiscal year ended June
30, 2019 to ARS 19 million in the fiscal year ended June 30,
2020.
Selling expenses generated by inter-segment transactions increased
by ARS 8 million (72,7%), from ARS 11 million in the fiscal year
ended June 30, 2019 to ARS 19 million in the fiscal year ended June
30, 2020.
Therefore, according to information by segments (taking into
account the operating results from our joint ventures and without
considering those relating to building administration expenses and
collective promotion fund or business inter-segment transactions),
total selling expenses increased by ARS 2,392 million (17.1%), from
ARS 13,994 million in the fiscal year ended June 30, 2019 to ARS
16,386 million in the fiscal year ended June 30, 2020. This was
mainly due to an ARS 893 million increase in the Agricultural
Business and an ARS 1,499 million increase in theUrban Properties
and Investment Business. Within the Urban Properties and Investment
Business, the variation relates to a decrease in the Operations
Center in Israel of ARS 1,352 million, and an increase in the
Operations Center in Argentina of ARS 147 million.
Agricultural Business
According to information by segments (taking into account all our
joint ventures and inter-segment eliminations), total selling
expenses increased by ARS 893 million (52.0%), from ARS 1,717
million in the fiscal year ended June 30, 2019 to ARS 2,610 million
in the fiscal year ended June 30, 2020. Selling expenses of the
Agricultural Business, measured as a percentage of revenues from
this segment, decreased from 9.0% during the fiscal year ended June
30, 2019 to 9.9% during the fiscal year ended June 30,
2020.
206
Agricultural Production
.
Selling expenses from the Agricultural Production segment increased
by 76.9% from ARS 1,026 million in the fiscal year ended June 30,
2019 to ARS 1,815 million in the fiscal year ended June 30, 2020,
mainly as a result of an ARS 694 million increase in selling
expenses related to grain trading, an ARS 42 million increase in
expenses for sugarcane operations, an ARS 48 million increase in
selling expenses for cattle and an ARS 5 million increase in
selling expenses associated with leases and agricultural services.
Selling expenses of the Agricultural Production segment, measured
as a percentage of revenues from this segment, increased from 9.2%
during the fiscal year ended June 30, 2019 to 10.6% during the
fiscal year ended June 30, 2020.
Land Transformation and Sales
.
Selling expenses from the Land Transformation and Sales segment
remained stable at ARS 1 million in the fiscal year ended June 30,
2019 and at ARS 1 million in the fiscal year ended June 30,
2020.
Others
. Selling expenses from
the Others segment increased by 15.1% from ARS 690 million in the
fiscal year ended June 30, 2019 to ARS 794 million in the fiscal
year ended June 30, 2020, mainly as a consequence of an ARS 109
million increase in selling expenses associated with the
agro-industrial business and an ARS 5 million decrease in the
selling expenses related to other segments. Selling expenses from
the Others segment, measured as a percentage of revenues from this
segment, increased from 8.7% during the fiscal year ended June 30,
2019 to 8.8% during the fiscal year ended June 30,
2020.
Urban Properties and Investment Business
According to information by segments (taking into account all our
joint ventures and inter-segment eliminations), total selling
expenses increased by ARS 1,499 million (12.2%), from ARS 12,277
million in the fiscal year ended June 30, 2019 (out of which ARS
11,192 million derive from the Operations Center in Israel and ARS
1,085 million from the Operations Center in Argentina) to ARS
13,776 million in the fiscal year ended June 30, 2020 (out of which
ARS 12,544 million derive from the Operations Center in Israel and
ARS 1,232 million from the Operations Center in Argentina).
Excluding the selling expenses from the Operations Center in
Israel, selling expenses, according to information by segments,
increased by 13.5%. In addition, total selling expenses, measured
as a percentage of total revenues, according to information by
segments, increased from 13.9% during the period ended June 30,
2019 to 14.8% during the period ended June 30, 2020, mainly from
the Operations Center in Israel. Excluding the effect from the
Operations Center in Israel, total selling expenses, measured as a
percentage of total revenues, decreased from 7.2% during the fiscal
year ended June 30, 2019 to 11.1% during the period ended June 30,
2020.
Operations Center in Argentina
Shopping Malls
. Selling
expenses of the Shopping Malls segment increased by 33.8%, from ARS
530 million during the fiscal year ended June 30, 2019 to ARS 709
million during the fiscal year ended 2020, mainly as a result of:
(i) an increase of ARS 218 million in the charge for doubtful
accounts, partially offset by: (ii) a decrease in the charge for
taxes, rates and levies of ARS 22 million; (iii) a decrease in the
charge for publicity, advertising and other commercial expenses of
ARS 10 million; and (iv) a decrease in salaries, social security
and other personnel expenses of ARS 4 million. Selling expenses,
measured as a percentage of revenues from this Shopping Malls
segment, increased from 6.2% during fiscal year ended June 30, 2019
to 11.9% during fiscal year ended June 30,
2020.
Offices
. Selling expenses
associated with our Offices segment decreased by 14.1% from ARS 99
million during the fiscal year ended June 30, 2019 to ARS 85
million during the fiscal year ended June 30, 2020. Such variation
was mainly generated as a result of: (i) an ARS 9 million decrease
in publicity, advertising and other commercial expenses; and (ii)
anARS 8 million decrease in the charge for doubtful accounts.
Selling expenses associated with our Offices segment, measured as a
percentage of revenues from this segment, decreased from 4.4%
during the fiscal year ended June 30, 2019 to 3.6% during the
fiscal year ended June 30, 2020.
207
Sales and Developments
. Selling
expenses associated with our Sales and Developments segment
increased by 65.5% from ARS 119 million during fiscal year ended
June 30, 2019 to ARS 197 million during the fiscal year ended June
30, 2020. Such variation was mainly generated as a result of (i) an
ARS 79 million increase in taxes, rates and levies; (ii) an ARS 11
million increase in publicity, advertising and other commercial
expenses, offset by: (iii) an ARS 7 million decrease in thecharge
for doubtful accounts; (iv) an ARS 2 million decrease in salaries,
social security and other personnel expenses; and (v) an ARS 2
million decrease in fees and compensation for services. Selling
expenses associated with our Sales and Developments segment,
measured as a percentage of revenues from this segment, increased
from 10.6% during the fiscal year ended June 30, 2019 to 26.8%
during the fiscal year ended June 30, 2020.
Hotels
. Selling expenses
associated with our Hotels segment decreased by 27.2% from ARS 316
million during the fiscal year ended June 30, 2019 to ARS 230
million during the fiscal year ended June 30, 2020, mainly as a
result of: (i) an ARS 45 million decrease in the charge for taxes,
rates and levies; (ii) an ARS 19 million decrease in publicity,
advertising and other commercial expenses, (iii) an ARS 11 million
decrease in fees and compensation for services, and (iv) an ARS 9
million decrease in salaries, social security and other personnel
expenses. Selling expenses associated with our Hotels segment,
measured as a percentage of revenues from this segment, slightly
increased, from 10.7% during the fiscal year ended June 30, 2019 to
11.4% during the fiscal year ended June 30,
2020.
International
. Selling expenses
associated with the International segment remained unchanged in
both fiscal years.
Corporate
. Selling expenses
associated with the Corporate segment remained unchanged in both
fiscal years.
Others
. Selling expenses
associated with our Others segment decreased by 47.6%, from ARS 21
million during the fiscal year ended June 30, 2019 to ARS 11
million during the fiscal year ended June 30, 2020, mainly due to:
(i) an ARS 5 million decrease in the charge for doubtful accounts;
and (ii) an ARS 4 million decrease in taxes, rates and levies.
Selling expenses associated with our Others segment, measured as a
percentage of revenues from this segment, increased from 11.1%
during the fiscal year ended June 30, 2019 to 14.1% during the
fiscal year ended June 30, 2020.
Operations Center in Israel
Real estate.
Selling expenses
associated with the real estate segment increased from ARS 197
million during the period ended June 30, 2019 to ARS 223 million
during the period ended June 30, 2020. Such variation was due to an
actual depreciation of approximately 13%. Selling expenses
associated with this segment, measured as a percentage of revenues,
increased from 1.4% in the fiscal year ended June 30, 2019 to 1.7%
in the fiscal year ended June 30, 2020.
Telecommunications
. Selling
expenses associated with the telecommunications segment increased
from ARS 10,562 million during the fiscal year ended June 30, 2019
to ARS 11,887 million during the fiscal year ended June 30, 2020.
Such variation was due to an actual depreciation of approximately
13%, offset by a reduction in advertising expenses of the mobile
telephone business line. Selling expenses associated with this
segment, measured as a percentage of revenues, decreased from 18.4%
for the fiscal year 2019 to 18.3% for the fiscal year
2020.
Others
Selling expenses
associated with the Others segment increased from ARS 433 million
during the period ended June 30, 2019 to ARS 434 million during the
period ended June 30, 2020. Such variation was due to an actual
depreciation of approximately 13%, offset by a reduction in the
costs of Bartan and Epsilon.
Impairment of associates 2020 vs 2019
Profit/(loss) for impairment of associates and joint ventures,
according to the income statement, recorded a variation of ARS
2,470 million, since no depreciation had been recorded during the
fiscal year ended June 30, 2019 and an ARS 2,470 loss was recorded
in the fiscal year ended June 30, 2020, in connection with the
impairment of Mehadrin in the Operations Center in Israel within
the real estate segment. Such impairment derived from PBC’s
reclassification of the investment as available for sale and the
assessment of shares at market price in the first quarter of the
fiscal year, as the company intended to distribute shares as
dividend in kind, in the second quarterly period of the fiscal
year. Mehadrin is an agricultural company in Israel whose shares
are listed in the TASE.
208
Other operating results, net 2020 vs 2019
Total other operating results, net, according to the income
statement, increased by ARS 1,669 million (151.6%), from a gain of
ARS 1,101 million in the fiscal year ended June 30, 2019 to a gain
of ARS 2,770 million in the fiscal year ended June 30, 2020. This
is mainly due to an ARS 836 million decrease in the Agricultural
Business, from a gain of ARS 829 million in the fiscal year ended
June 30, 2019 to a gain of ARS 1,665 million in the fiscal year
ended December June 30, 2020, and an ARS 1,877 million decrease in
the Urban Properties and Investment Business. Within the Urban
Properties and Investment Business, the variation relates to a
decrease in the Operations Center in Israel of ARS 1,429 million
and an increase in the Operations Center in Argentina of ARS 448
million.
Other operating results, net, from our joint ventures decreased by
ARS 175 million (90.7%), from a gain of ARS 193 million in the
fiscal year ended June 30, 2019 to a gain of ARS 18 million in the
fiscal year ended June 30, 2020.
In turn, total other operating results, net, on account of building
administration expenses and promotion fund remained
unchanged.
Other operating results, net, generated by inter-segment
transactions recorded a variation of ARS 5 million (45.5%) from ARS
11 million in the fiscal year ended June 30, 2019 to ARS 6 million
in the fiscal year ended June 30, 2020.
Therefore, according to information by segments (taking into
account the operating results from our joint ventures and without
considering those relating to building administration expenses and
collective promotion fund or business inter-segment transactions),
total other operating results, net, increased by ARS 1,839 million
(203.9%), from ARS 902 million in the fiscal year ended June 30,
2019 to ARS 2,741 million in the fiscal year ended June 30, 2020.
This was mainly due to an ARS 843 million increase in the
Agricultural Business and an ARS 996 million increase in the Urban
Properties and Investment Business. Within the Urban Properties and
Investment Business, the variation relates to an increase in the
Operations Center in Israel of ARS 385 million, and an increase in
the Operations Center in Argentina of ARS 611 million.
Agricultural Business
According to information by segments (taking into account all our
joint ventures and inter-segment eliminations), total other
operating results, net, increased by ARS 843 million (102.9%), from
ARS 819 million in the fiscal year ended June 30, 2019 to ARS 1,662
million in the fiscal year ended June 30, 2020. Other operating
results, net, from the Agricultural Business, measured as a
percentage of revenues from this segment, increased from 4.3%
during the fiscal year ended June 30, 2019 to 6.3% during the
fiscal year ended June 30, 2020.
Agricultural Production
. Other
operating results, net, associated with our Agricultural Production
segment increased by ARS 26 million, from a gain of ARS 428 million
in the fiscal year ended June 30, 2019 to a gain of ARS 454 million
in the fiscal year ended 2020.
Land Transformation and Sales
.
Other operating results, net, from this segment increased by ARS
718 million from a gain of ARS 244 million in the fiscal year ended
June 30, 2019 to a gain of ARS 962 million in the fiscal year ended
June 30, 2020.
Others
. Other operating
results, net, associated with the Others segment increased by ARS
99 million, from a gain of ARS 147 million in the fiscal year ended
June 30, 2019 to a gain of ARS 246 million in the fiscal year ended
June 30, 2020, primarily in connection with the operations of our
subsidiary FYO.
209
Urban Properties and Investment
Business
According to the information by segments (taking into account all
our joint ventures and inter-segment eliminations), total other
operating results, net, increased by ARS 996 million (1200.0 %),
from ARS 83 million during the fiscal year ended June 30, 2019 (out
of which ARS 742 million derive from the Operations Center in
Israel and ARS 659 million from the Operations Center in Argentina)
to ARS 1,079 million in the fiscal year ended June 30, 2020 (out of
which ARS 1,127 million derive from the Operations Center in Israel
and ARS 48 million from the Operations Center in Argentina).
Excluding other operating results, net, from the Operations Center
in Israel, other operating results, net, according to information
by segments, increased by 92.7%. In addition, total other operating
results, net,measured as a percentage of total revenues, according
to information by segments, increased from 0.1% during the fiscal
year ended June 30, 2019 to 1.2% during the fiscal year June 30,
2020, mainly from the Operations Center in Israel. Excluding the
effect from the Operations Center in Israel, total other operating
results, net, measured as a percentage of total revenues, decreased
from 4.4% during the fiscal year ended June 30, 2019 to 0.4% during
the fiscal year ended June 30, 2020.
Operations Center in Argentina
Shopping Malls
.
Other operating results, net, from the
Shopping Malls segment decreased by 65.1%, from a net loss of ARS
109 million during the fiscal year ended June 30, 2019 to a net
loss of ARS 38 million during the fiscal year ended June 30, 2020,
mainly as a result of: (i) a lower charge for donations of ARS 54
million; and (ii) an increase in others of ARS 25 million, mainly
because a loss for indemnification payments was recognized in
fiscal year 2019, partially offset by; (iii) a decrease of ARS 12
million in interest earned on operating assets. The other operating
results, net, of this segment, measured as a percentage of revenues
from this segment, went from (1.3%) during the fiscal year ended
June 30, 2019 to (0.6%) during the fiscal year ended June 30,
2020.
Offices
. Other operating
results, net, associated with our Offices segment decreased by
25.0%, from a net loss of ARS 40 million during the fiscal year
ended June 30, 2019 to a net loss of ARS 30 million during the
fiscal year ended June 30, 2020, mainly as a result of an ARS 14
million decrease in the charge for donations, among other items.
Other operating results, net, from the Offices segment, measured as
a percentage of revenues from this segment, decreased from (1.8%)
during the fiscal year ended June 30, 2019 to (1.3%) during the
fiscal year ended June 30, 2020.
Sales and Developments
. Other
operating results, net associated with our Sales and Developments
segment decreased by 90.6%, from a net loss of ARS 286 million
during the fiscal year ended June 30, 2019 to a net loss of ARS 27
million during the fiscal year ended June 30, 2020, mainly due to a
lower provision charge for Puerto Retiro writeoff and a reduction
in donations, among other items. Other operating results, net, from
the Sales and Developments segment, measured as a percentage of
revenues from this segment, decreased from (25.6%) during the
fiscal year ended June 30, 2019 to (3.7%) during the fiscal year
ended June 30, 2020.
Hotels
. Other operating
results, net, associated with the Hotels segment decreased by
117.5%, from a net gain of ARS 114 million during the fiscal year
ended June 30, 2019 to a net loss of ARS 20 million during the
fiscal year ended June 30, 2020, mainly due to a recovery related
to a boiler claim during fiscal year 2019. Other operating results,
net, from the Hotels segment, measured as a percentage of revenues
from this segment, decreased from 3.9% during the fiscal year ended
June 30, 2019 to (1%) during the fiscal year ended June 30,
2020.
International
. Other operating
results, net, from this segment went from a net loss of ARS 24
million during the fiscal year ended June 30, 2019 to no charges to
the fiscal year ended June 30, 2020, mainly due to a decrease in
donations.
Corporate
. Other operating
results, net, associated with the Corporate segment showed no
variations in the reported fiscal years.
Others
. Other operating
results, net, from this segment increased by 121.3%, from a net
loss of ARS 314 million during the fiscal year ended June 30, 2019
to a net gain of ARS 67 million during the fiscal year ended June
30, 2020, mainly derived from a loss derived from the sale of
Tarshop S.A. and to the impairment of goodwill of La Arena for the
comparative fiscal year. Other operating results, net, from the
Others segment, measured as a percentage of revenues from this
segment, decreased from (165.3%) during the fiscal year ended June
30, 2019 to 85.9% during the fiscal year ended June 30,
2020.
210
Operations Center in Israel
Real estate
. Other operating
results, net, associated with the real estate segment recorded a
loss of ARS 296 million during the fiscal year ended June 30, 2020,
there being no charges to the fiscal year ended June 30,
2019.
Telecommunications
. Other
operating results, net, associated with the telecommunications
segment went from a profit of ARS 397 million during the fiscal
year ended June 30, 2019 to a net gain of ARS 501 million during
the fiscal year ended June 30, 2020.
Corporate
. Other operating
results, net, associated with the Corporate segment recorded a loss
of ARS 48 million during the fiscal year ended June 30, 2020, there
being no charges to the fiscal year ended June 30,
2019.
Others
. Other operating
results, net, associated with the Others segment increased from a
net profit of ARS 345 million during the fiscal year ended June 30,
2019 to a net profit of ARS 970 million during the fiscal year
ended June 30, 2020, as a result of the negative goodwill due to
business combination with Mehadrin.
Management fees 2020 vs 2019
The company entered into a management agreement with Consultores
Asset Management S.A., which provides for payment of fees
equivalent to 10% of our profits for advisory services in relation
to any matters related to business and investments, such as
farming, real estate, finance, hotel, etc. Management fees amounted
to ARS 211 million during fiscal year 2020. During fiscal year 2019
no results were recognized on this account.
Operating results 2020 vs 2019
As a result of the factors described above, total operating
results, according to the income statement, increased by ARS 68,562
million (280.0%), from a loss of ARS 24,489 million in the fiscal
year ended June 30, 2019 to a gain of ARS 44,073 million in the
fiscal year ended June 30, 2020. Such variation was mainly due to
an ARS 3,171 million increase in the Agricultural Business, from a
profit of ARS 3,141 million in the fiscal year ended June 30, 2019
to a profit of ARS 6,312 million in the fiscal year ended June 30,
2020, and an ARS 65,690 million increase in the Urban Properties
and Investment Business. Within the Urban Properties and Investment
Business, the variation relates to a decrease in the Operations
Center in Israel of ARS 3,522 million and an increase in the
Operations Center in Argentina of ARS 69,212 million.
Operating results from our joint ventures decreased by ARS 1,248
million (121.2%), from a profit of ARS 1,030 million in the fiscal
year ended June 30, 2019 to a loss of ARS 218 million in the fiscal
year ended June 30, 2020.
In turn, total operating results on account of building
administration expenses and collective promotion fund decreased by
ARS 192 million (145.5%), from ARS 132 million in the fiscal year
ended June 30, 2019 to ARS 324 million in the fiscal year ended
June 30, 2020.
Operating results from inter-segment transactions varied by ARS 5
million (100.0%), from ARS 5 million in the fiscal year ended June
30, 2019 to ARS 10 million in the fiscal year ended June 30,
2020.
Therefore, according to information by segments (taking into
account the operating results from our joint ventures and without
considering those relating to building administration expenses and
collective promotion fund or business inter-segment transactions),
total operating results increased by ARS 70,007 million (275.8%),
from ARS 25,382 million in the fiscal year ended June 30, 2019 to
ARS 44,625 million in the fiscal year ended June 30, 2020. This was
mainly due to an ARS 3,377 million increase in the Agricultural
Business and an ARS 66,630 million increase in the Urban Properties
and Investment Business. Within the Urban Properties and Investment
Business, the variation relates to a decrease in the Operations
Center in Israel of ARS 3,821 million, and an increase in the
Operations Center in Argentina of ARS 70,451 million.
211
Agricultural Business
According to information by segments (taking into account all our
joint ventures and inter-segment eliminations), total operating
results increased by ARS 3,377 million (107.9%), from ARS 3,130
million in the fiscal year ended June 30, 2019 to ARS 6,507 million
in the fiscal year ended June 30, 2020. Operating results of the
Agricultural Business, measured as a percentage of revenues from
this segment, increased from 16.4% during the period ended June 30,
2019 to 24.8% during the period ended June 30, 2020.
Agricultural Production
.
Operating results of the Agricultural Production segment increased
by ARS 1,403 million, from a profit of ARS 2,063 million in the
fiscal year ended June 30, 2019 to a profit of ARS 3,466 million in
the fiscal year ended June 30, 2020.
Land Transformation and Sales
.
Operating results of the Land Transformation and Sales segment
increased by ARS 1,670 million, from a profit of ARS 881 million in
the fiscal year ended June 30, 2019 to a profit of ARS 2,551
million in the fiscal year ended June 30, 2020.
Corporate
. Operating results of
this Corporate segment increased by ARS 97 million from a loss of
ARS 274 million in the fiscal year ended June 30, 2019 to a loss of
ARS 177 million in the fiscal year ended June 30,
2020.
Others.
Operating results of
the Others segment increased by ARS 207 million from a profit of
ARS 460 million in the fiscal year ended June 30, 2019 to ARS 667
million in the fiscal year ended June 30, 2020.
Urban Properties and Investment Business
According to information by segments (taking into account all our
joint ventures and inter-segment eliminations), total operating
results increased by ARS 66,630 million (233.7%), from a loss of
ARS 28,512 million in the fiscal year ended June 30, 2019 (out of
which ARS 3,522 million derive from the Operations Center in Israel
and ARS 32,034 million from the Operations Center in Argentina) to
a profit of ARS 38,118 million in the fiscal year ended June 30,
2020 (out of which ARS 299million derive from the Operations Center
in Israel and ARS 38,417 million from the Operations Center in
Argentina). Excluding the operating results from the Operations
Center in Israel, operating results, according to information by
segments, decreased by 219.9%. In addition, operating results,
measured as a percentage of total revenues, according to
information by segments, increased from 32.2% during the fiscal
year ended June 30, 2019 to 41.1% during the fiscal year ended June
30, 2020, mainly from theOperations Center in Israel. Excluding the
effect from the Operations Center in Israel, total operating
results, measured as a percentage of total revenues, increased from
212.8% during the fiscal year ended June 30, 2019 to 344.9% during
the fiscal year ended June 30, 2020.
Operations Center in Argentina
Shopping Malls
. Operating
results of the Shopping Malls segment increased from a loss of ARS
34,401 million during the fiscal year ended June 30, 2019 to a
profit of ARS 1,687 million during the fiscal year ended June 30,
2020.
Offices
. Operating results
associated with our Offices segment increased by 890.2%, from a net
profit of ARS 2,488 million during the fiscal year ended June 30,
2019 to a net profit of ARS 24,635 million during the fiscal year
ended June 30, 2020. Such variation was mainly due to an increase
of ARS 23,242 million in profit/(loss) from fair value adjustments
of investment properties. Operating results from the Offices
segment, measured as a percentage of revenues from this segment,
increased from 111.1% during the fiscal year ended June 30, 2019 to
1,044.7% during the fiscal year ended June 30,
2020.
Sales and Developments
.
Operating results associated with our Sales and Developments
segment increased by 1,768.6%, from a net profit of ARS 630 million
during the fiscal year ended June 30, 2019 to a net profit of ARS
11,772 million during the fiscal year ended June 30, 2020. Such
increase is mainly associated with the result of changes in the
fair value of investment properties. Operating results of the Sales
and Developments segment, measured as a percentage of revenues from
this segment, increased from 56.3% during the fiscal year ended
June 30, 2019 to 1,601.6% during the fiscal year ended June 30,
2020.
212
Hotels
. Operating results
associated with the Hotels segment decreased by 75.9%, from a net
profit of ARS 671 million during the fiscal year ended June 30,
2019 to a net profit of ARS 162 million during the fiscal year
ended June 30, 2020. Such decrease is mainly due to Hoteles
Argentinos S.A.U. deflag process and the impact generated by a drop
in the activities since March, attributable to the COVID-19
pandemic. Operating results associated with the Hotels segment,
measured as a percentage of revenues from this segment, decreased
from 22.7% during the fiscal year ended June 30, 2019 to 8% during
the fiscal year ended June 30, 2020.
International
. Operating
results associated with our International segment recorded a 7.5%
variation from a net loss of ARS 120 million during the fiscal year
ended June 30, 2019 to a net loss of ARS 111 million during the
fiscal year ended June 30, 2020. Such variation was due to a
decrease in donation charges.
Corporate
. Operating results
associated with our Corporate segment decreased by 45.7% from a
loss of ARS 519 million during the fiscal year ended June 3, 2019
to a loss of ARS 282 million during the fiscal year ended June 30,
2020 mainly affected by overhead and administrative
expenses.
Others
. Operating results
associated with our Others segment increased from a net profit of
ARS 783 million during the fiscal year ended June 30, 2019 to a net
profit of ARS 554 million during the fiscal year ended June 30,
2020. The variation is mainly due to a loss derived from the sale
of Tarshop, the impairment of goodwill of La Arena during the
fiscal year ended June 30, 2019 and a lower negative result
associated with interests in associates and joint ventures.
Operating results of the Others segment, measured as a percentage
of the revenues from this segment, increased from a loss of 412.1%
during the fiscal year ended June 30, 2019 to a profit of 710.3%
during the fiscal year ended June 30, 2020.
Operations Center in Israel
Real estate.
Operating results
of the Real estate segment decreased from ARS 5,259 million during
the fiscal year ended June 30, 2019 to ARS 623 million during the
fiscal year ended June 30, 2020. Such variation was mainly due to
the loss for impairment of associates and joint ventures in the
current fiscal year.
Telecommunications.
Operating
results of the Telecommunications segment went from a net profit of
ARS 138 million during the fiscal year ended June 30, 2019 to a net
profit of ARS 702 million during the fiscal year ended June 30,
2020. Such variation was mainly due to the fact that revenues
increased more than costs in the current fiscal year which
circumstance generated a larger gap between both operating
results.
Corporate.
Operating results of
the Corporate segment went from a net loss of ARS 1,058 million
during the fiscal year ended June 30, 2019 to a net loss of ARS
1,119 million during the fiscal year ended June 30, 2020, mainly
attributable to profits in the previous fiscal year generated by
the sale of an associate.
Others.
Operating results of
the Others segment went from a net loss of ARS 817 million during
the fiscal year ended June 30, 2019 to a net profit of ARS 741
million for the fiscal year ended June 30, 2020. Such variation was
mainly the result of the sale of Cyber Secdo by Elron and the
profits derived therefrom during the fiscal year ended June 30,
2019.
Share of profit/ (loss) of associates and joint ventures 2020 vs
2019
The total share of profit/(loss) of associates and joint ventures,
according to the income statement, increased by ARS 15,990 million
(218.2%), from a loss of ARS 7,328 million in the fiscal year ended
June 30, 2019 to a profit of ARS 8,662 million in the fiscal year
ended June 30, 2020. This was mainly due to an ARS 115 million
increase in the Agricultural Business, from a gain of ARS 30
million in the fiscal year ended June 30, 2019 to a profit of ARS
145 million in the fiscal year ended June 30, 2020, and an ARS
15,576 million increase in the Urban Properties and Investment
Business. Within the Urban Properties and Investment Business, the
variation relates to an increase in the Operations Center in Israel
of ARS 1,150 million and an increase in the Operations Center in
Argentina of ARS 14,426 million.
Our share of profit/(loss) of associates and joint ventures,
primarily from Cresca (Agricultural Business), Nuevo Puerto Santa
Fe S.A. (Shopping Malls segment), Quality Invest S.A. (Offices
segment), Cyrsa S.A., Puerto Retiro S.A. and Baicom Networks S.A.
(Sales and Developments segment), increased by ARS 1,175 million
(116.8%), from a loss of ARS 1,006 million in the fiscal year ended
June 30, 2019 to a profit of ARS 169 million in the fiscal year
ended June 30, 2020.
213
There are no results on account of building administration expenses
and promotion fund corresponding to share of profit/(loss) of
associates and joint ventures.
Share of profit/(loss) of associates and joint ventures resulting
from inter-segment transactions increased by ARS 20 million
(100.0%), from ARS 0 million in the fiscal year ended June 30, 2019
to ARS 20 million in the fiscal year ended June 30,
2020.
Therefore, according to information by segments (taking into
account the profit/ (loss) from operations from our joint ventures
and without considering those relating to building administration
expenses and collective promotion fund or business inter-segment
transactions), the total share of profit/(loss) of associates and
joint ventures increased by ARS 14,795 million (234.0%), from ARS
6,322 million in the fiscal year ended June 30, 2019 to ARS 8,473
million in the fiscal year ended June 30, 2020. This was mainly due
to an ARS 116 million increase in the Agricultural Business and an
ARS 14,679 million increase in the Urban Properties and Investment
Business. Within the Urban Properties and Investment Business, the
variation relates to an increase in the Operations Center in Israel
of ARS 1,449 million, and an increase in the Operations Center in
Argentina of ARS 13,230 million.
Agricultural Business
According to information by segments (taking into account all our
joint ventures and inter-segment eliminations), the total share of
profit/(loss) of associates and joint ventures increased by ARS 116
million (1,054.5%), from ARS 11 million in the fiscal year ended
June 30, 2019 to ARS 127 million in the fiscal year ended June 30,
2020.
Agricultural Production
. The
share of profit/(loss) of associates and joint ventures in the
Agricultural Production segment decreased by 3.5% from a profit of
ARS 57 million in the fiscal year ended June 30, 2019 to a profit
of ARS 55 million in the fiscal year ended June 30,
2020.
Others
. The operating results
in the Others segment rose by 256.5% from a loss of ARS 46 million
in the fiscal year ended June 30, 2019 to a profit of ARS 72
million in the fiscal year ended June 30, 2020.
Urban Properties and Investment Business
According to information by segments (taking into account all our
joint ventures and inter-segment eliminations), the total share of
profit/(loss) of associates and joint ventures increased by ARS
14,679 million (231.8%), from ARS 6,333 million in the fiscal year
ended June 30, 2019 (out of which ARS 150 million derive from the
Operations Center in Israel and ARS 6,183 million from the
Operations Center in Argentina) to ARS 8,346 million in the fiscal
year ended June 30, 2020 (out of which ARS 1,299 million derive
from the Operations Center in Israel and ARS 7,047 million from the
Operations Center in Argentina). Excluding the share of
profit/(loss) of associates and joint ventures from the Operations
Center in Israel, the share of profit/(loss) of associates and
joint ventures, according to information by segments, decreased by
214.0%.
Operations Center in Argentina
Shopping Malls
. In the
information by segments, the share of profit / (loss) of joint
venture Nuevo Puerto Santa Fe S.A. is exposed consolidated, line by
line in this segment.
Offices
. In the information by
segments, the share of profit / (loss) of joint venture Quality
S.A. is exposed consolidated, line by line in this
segment.
Sales and Developments
. The
share of profit / (loss) of joint ventures Cyrsa S.A. and Puerto
Retiro S.A. are exposed consolidated line by line. The share of
profit/(loss) of our associate Manibil S.A., which is disclosed in
this line, increased by ARS 37 million during the fiscal year ended
June 30, 2020.
Hotels
. This segment does not
show results from the share of profit / (loss) of associates and
joint ventures.
International
. The share of
profit / (loss) of associates of this segment increased by 245.99%,
from a net loss of ARS 3,679 million during the fiscal year ended
June 30, 2019 to a net profit of ARS 5,371 million during the
fiscal year ended June 30, 2020, mainly generated by a positive
result from our investment in New Lipstick LLC of ARS 7,472
million, offset by a negative result from our investment in Condor
Hospitality of ARS 102 million.
214
Others
. The share of profit /
(loss) of associates from the Others segment increased by 86.6%,
from a net loss of ARS 2,467 million during the fiscal year ended
June 30, 2019 to a net loss of ARS 330 million during the fiscal
year ended June 30, 2020, mainly as a result of a loss from our
investments in Banco Hipotecario S.A. in the amount of ARS 380
million.
Operations Center in Israel
Real estate
. The share of
profit / (loss) of associates from this segment went from a profit
of ARS 37 million during the fiscal year ended June 30, 2019 to ARS
1,495 million in the fiscal year ended June 30, 2020, mainly due to
the recognition of Gav Yam as associate in this fiscal
year.
Others
. The share of profit /
(loss) of associates from this segment went from a loss of ARS 904
million during the fiscal year ended June 30, 2019 to a loss of ARS
994 million in the fiscal year ended June 30, 2020, mainly due to
investments in Elron.
Financial results, net 2020 vs 2019
The Group financial results, net recorded a variation of ARS 27,438
million, from a loss of ARS 15,272 million in the fiscal year ended
June 30, 2019 to a loss of ARS 42,710 million in the fiscal year
ended June 30, 2020. This was mainly due to: (i) an increase in
interest expense in the Agricultural Business mainly attributable
to the Notes, which increased from 6.33% to 7.96%. Furthermore,
indebtedness in dollars increased by USD 348 million due to the
issuance of Notes XXV, XXVII, XXVII and XXIX. This was offset by
therepayment of the Notes XVIII and XXII in the amount of USD 54
million. In turn, Note XXVI was issued in Pesos in an amount of ARS
1,095 million at Badlar variable interest rate, currently set at
36%. Other impact on interest was due to an increase in ER, as well
as interest under IFRS 16 that are not recognized for comparative
purposes because same are charged on a prospective basis. As
concerns the Real Estate business segment, interest on Notes
increased by 61% from ARS 1,221 million to ARS 1,968 million.
Increase of overdraft interest mainly derives from an increase in
the range of interest rate, from 36% to 150% for fiscal year 2020,
whereas in fiscal year 2019 such increase was in the range of 39%
to 106%; (ii) Increased loss for exchange difference inthe
Agricultural Business and the Real Estate segment in the Operations
Center in Argentina of approximately ARS 12,841 million, because
the exchange difference of the 4th quarter in fiscal year 2020 was
the consequence of a Peso depreciation of approximately 66% whereas
the inflation of the fiscal year was lower, reaching 43% unlike 4th
quarter in 2019 where Peso depreciation and inflation rates were
more similar, as Peso depreciation reached 48% whereas the
inflation rate ultimately reached 56%. As a result of these
variables, the net exchange difference of the inflation effect was
considerably higher in this fiscal year; (iii) the main loss in
profit/(loss) for derivative financial instruments, in the
Agricultural Business segment, is mainly attributed to the
BrasilAgro transactions, where transactions in US dollars recorded
a significant loss due to the US dollar fluctuation, with an ER
that increased from 3.80 to 5.50, together with variations in
soybean prices; and (iv) a higher loss of approximately ARS 12,560
million in Profit/(loss) for assessment at fair value of financial
assets and liabilities, mainly from the Real Estate Business
segment of the Operations Center in Israel, due to changes in the
assessment at fair value of CLAL shares. The share price changed
from NIS 60.80 to NIS 28.86. As of June 30, 2020, 8.5% of shares
are directly held whereas 2.1% are held through swaps.
Income Tax 2020 vs 2019
The Company adopts the deferred tax method to calculate the income
tax for the reported periods, thus recognizing temporary
differences as tax assets and liabilities. The income tax charge
for the year went from a loss of ARS 780 million during the fiscal
year ended June 30, 2019, to a loss of ARS 8,107 million during the
fiscal year ended June 30, 2020, out of which a loss of ARS 1,390
million derives from the agricultural business, a loss of ARS 6,550
million derives from the Operations Center in Argentina and a loss
of ARS 167 million derives from the Operations Center in
Israel.
Net profit/(loss) 2020 vs 2019
As a result of the factors described above, our net profit/(loss)
for the year, including the effect of discontinued operations,
increased by ARS 60,521 million from a net profit of ARS 40,729
million in the fiscal year ended on June 30, 2019 to a net profit
of ARS 20,003 million in the fiscal year ended June 30, 2020, out
of which a loss of ARS 2,872 million derives from the agricultural
business, a profit of ARS 26,451 million derives from the
Operations Center in Argentina, a loss of ARS 3,365 million derives
from the Operations Center in Israel and a loss of ARS 211 million
derives from management fees.
215
Results of Operations for the fiscal years ended June 30, 2019 and
2018
|
|
Agricultural business
|
Urban Properties and Investment business
|
Total segment information
|
Joint ventures
|
Adjustments
|
Elimination of inter'(segment transactions and non'(reportable
assets / liabilities (iv)
|
Total Statement of Income / Financial Position
|
||||||||||||||||||||
|
|
|
|
|
Operations Center in Argentina
|
Operations Center in Israel
|
Subtotal
|
|
|
|
|
|
|
|
|
|
|
|
|
|
|
|
||||||
|
|
30.06.19
|
30.06.18
|
Var.
|
30.06.19
|
30.06.18
|
Var.
|
30.06.19
|
30.06.18
|
Var.
|
30.06.19
|
30.06.18
|
Var.
|
30.06.19
|
30.06.18
|
Var.
|
30.06.19
|
30.06.18
|
Var.
|
30.06.19
|
30.06.18
|
Var.
|
30.06.19
|
30.06.18
|
Var.
|
30.06.19
|
30.06.18
|
Var.
|
|
|
(In million of
ARS)
|
||||||||||||||||||||||||||
|
Revenues
|
19,061
|
15,393
|
3,668
|
15,056
|
13,872
|
1,184
|
73,537
|
60,057
|
13,480
|
88,593
|
73,929
|
14,664
|
107,654
|
89,322
|
18,332
|
(93
)
|
(111
)
|
18
|
3,706
|
4,387
|
(681
)
|
(526
)
|
(332
)
|
(194
)
|
110,741
|
93,266
|
17,475
|
|
Costs
|
(16,165
)
|
(13,096
)
|
(3,069
)
|
(3,201
)
|
(2,822
)
|
(379
)
|
(52,426
)
|
(41,935
)
|
(10,491
)
|
(55,627
)
|
(44,757
)
|
(10,870
)
|
(71,792
)
|
(57,853
)
|
(13,939
)
|
67
|
69
|
(2
)
|
(3,855
)
|
(4,445
)
|
590
|
196
|
151
|
45
|
(75,384
)
|
(62,078
)
|
(13,306
)
|
|
Initial
recognition and changes in the fair value of biological assets and
agricultural products at the point of harvest
|
2,035
|
1,530
|
505
|
-
|
-
|
-
|
-
|
-
|
-
|
-
|
-
|
-
|
2,035
|
1,530
|
505
|
-
|
4
|
(4
)
|
-
|
-
|
-
|
270
|
140
|
130
|
2,305
|
1,674
|
631
|
|
Changes in the
net realizable value of agricultural products after
harvest
|
(43
)
|
532
|
(575
)
|
-
|
-
|
-
|
-
|
-
|
-
|
-
|
-
|
-
|
(43
)
|
532
)
|
(575
)
|
-
|
-
|
-
|
-
|
-
|
-
|
-
|
-
|
-
|
(43
)
|
532
|
(575
)
|
|
Gross profit / (loss)
|
4,888
|
4,359
|
529
|
11,855
|
11,050
|
805
|
21,111
|
18,122
|
2,989
|
32,966
|
29,172
|
3,794
|
37,854
|
33,531
|
4,323
|
(26
)
|
(38
)
|
12
|
(149
)
|
(58
)
|
(91
)
|
(60
)
|
(41
)
|
(19
)
|
37,619
|
33,394
|
4,225
|
|
Net gain from
fair value adjustment of investment properties
|
-
|
216
|
(216
)
|
(39,477
)
|
19,809
|
(59,286
)
|
892
|
-
|
892
|
(38,585
)
|
19,809
|
(58,394
)
|
(38,585
)
|
20,025
|
(58,61
)
|
839
|
(1,054
)
|
1,893
|
-
|
-
|
-
|
-
|
-
|
-
|
(37,746
)
|
18,971
|
(56,717
)
|
|
Gain from
disposal of farmlands
|
665
|
1,656
|
(991
)
|
-
|
-
|
-
|
-
|
-
|
-
|
-
|
-
|
-
|
665
|
1,656
|
(991
)
|
-
|
-
|
-
|
-
|
-
|
-
|
-
|
-
|
-
|
665
|
1,656
|
(991
)
|
|
General and
administrative expenses
|
(1,525
)
|
(1,381
)
|
(144
)
|
(2,668
)
|
(2,335
)
|
(333
)
|
(8,031
)
|
(7,233
)
|
(798
)
|
(10,699
)
|
(9,568
)
|
(1,131
)
|
(12,224
)
|
(10,949
)
|
(1,275
)
|
17
|
40
|
(23
)
|
-
|
-
|
-
|
55
|
33
|
22
|
(12,152
)
|
(10,876
)
|
(1,276
)
|
|
Selling
expenses
|
(1,717
)
|
(1,753
)
|
36
|
(1,085
)
|
(1,126
)
|
41
|
(11,192
)
|
(10,639
)
|
(553
)
|
(12,277
)
|
(11,765
)
|
(512
)
|
(13,994
)
|
(13,518
)
|
(476
)
|
7
|
16
|
(9
)
|
-
|
-
|
-
|
11
|
13
|
(2
)
|
(13,976
)
|
(13,489
)
|
(487
)
|
|
Impairment of
associates
|
-
|
-
|
-
|
-
|
-
|
-
|
-
|
-
|
-
|
-
|
-
|
-
|
-
|
-
|
-
|
-
|
-
|
-
|
-
|
-
|
-
|
-
|
-
|
-
|
-
|
-
|
-
|
|
Other
operating results, net
|
819
|
1,541
|
(722
)
|
(659
)
|
(56
)
|
(603
)
|
742
|
2,136
|
(1,394
)
|
83
|
2,080
|
(1,997
)
|
902
|
3,621
|
(2,719
)
|
193
|
42
|
151
|
17
|
(2
)
|
19
|
(11
)
|
(4
)
|
(7
)
|
1,101
|
3,657
|
(2,556
)
|
|
Management
fees
|
-
|
-
|
-
|
-
|
-
|
-
|
-
|
-
|
-
|
-
|
-
|
-
|
-
|
-
|
-
|
-
|
-
|
-
|
-
|
(1,456
)
|
1,456
|
-
|
-
|
-
|
-
|
(1,456
)
|
1,456
|
|
Profit / (Loss) from operations
|
3,130
|
4,638
|
(1,508
)
|
(32,034
)
|
27,342
|
(59,376
)
|
3,522
|
2,386
|
1,136
|
(28,512
)
|
29,728
|
(58,240
)
|
(25,382
)
|
34,366
|
(59,748
)
|
1,030
|
(994
)
|
2,024
|
(132
)
|
(1,516
)
|
1,384
|
(5
)
|
1
|
(6
)
|
(24,489
)
|
31,857
|
(56,346
)
|
|
Share of
(loss) / profit of associates and joint
ventures
|
11
|
37
|
(26
)
|
(6,183
)
|
(4,227
)
|
(1,956
)
|
(150
)
|
(422
)
|
272
|
(6,333
)
|
(4,649
)
|
(1,684
)
|
(6,322
)
|
(4,612
)
|
(1,710
)
|
(1,006
)
|
1,160
|
(2,166
)
|
-
|
-
|
-
|
-
|
-
|
-
|
(7,328
)
|
(3,452
)
|
(3,876
)
|
|
Segment profit / (loss)
|
3,141
|
4,675
|
(1,534
)
|
(38,217
)
|
23,115
|
(61,332
)
|
3,372
|
1,964
|
1,408
|
(34,845
)
|
25,079
|
(59,924
)
|
(31,704
)
|
29,754
|
(61,458
)
|
24
|
166
|
(142
)
|
(132
)
|
(1,516
)
|
1,384
|
(5
)
|
1
|
(6
)
|
(31,817
)
|
28,405
|
(60,222
)
|
(I)
Represents the
equity value of joint ventures that were proportionately
consolidated for information by segment purposes.
(II)
Includes gross
profit/ (loss) of ARS (130) million and ARS(51) million
corresponding to Expenses and Collective Promotion Fund (FPC), as
of June 30, 2019 and 2018, respectively.
Agricultural Business
|
|
Agricultural production
|
Land transformation and sales
|
Corporate
|
Others
|
Total
|
||||||||||
|
|
30.06.19
|
30.06.18
|
Var.
|
30.06.18
|
30.06.18
|
Var.
|
30.06.19
|
30.06.18
|
Var.
|
30.06.19
|
30.06.18
|
Var.
|
30.06.19
|
30.06.18
|
Var.
|
|
(In
million of ARS)
|
|||||||||||||||
|
Revenues
|
11,1
|
9,096
|
2,004
|
-
|
-
|
-
|
-
|
-
|
-
|
7,961
|
6,297
|
1,664
|
19,061
|
15,393
|
3,668
|
|
Costs
|
(9,466)
|
(7,388)
|
(2,078)
|
(24)
|
(36)
|
12
|
-
|
-
|
-
|
(6,675)
|
(5,672)
|
(1,003)
|
(16,165)
|
(13,096)
|
(3,069)
|
|
Initial
recognition and changes in the fair value of biological assets and
agricultural products at the point of harvest
|
2,029
|
1,539
|
490
|
-
|
-
|
-
|
-
|
-
|
-
|
6
|
(9)
|
15
|
2,035
|
1,530
|
505
|
|
Changes
in the net realizable value of agricultural products after
harvest
|
(43)
|
532
|
(575)
|
-
|
-
|
-
|
-
|
-
|
-
|
-
|
-
|
-
|
(43)
|
532
|
(575)
|
|
Gross profit / (loss)
|
3,620
|
3,779
|
(159)
|
(24)
|
(36)
|
12
|
-
|
-
|
-
|
1,292
|
616
|
676
|
4,888
|
4,359
|
529
|
|
Net
gain from fair value adjustment of investment
properties
|
-
|
-
|
-
|
-
|
216
|
(216)
|
-
|
-
|
-
|
-
|
-
|
-
|
-
|
216
|
(216)
|
|
Gain
from disposal of farmlands
|
-
|
-
|
-
|
665
|
1,656
|
-991
|
-
|
-
|
-
|
-
|
-
|
-
|
665
|
1,656
|
(991)
|
|
General
and administrative expenses
|
(959)
|
(878)
|
(81)
|
(3)
|
(2)
|
(1)
|
(274)
|
(225)
|
(49)
|
(289)
|
(276)
|
(13)
|
(1,525)
|
(1,381)
|
(144)
|
|
Selling
expenses
|
(1,026)
|
(1,322)
|
296
|
(1)
|
-
|
(1)
|
-
|
-
|
-
|
(690)
|
(431)
|
(259)
|
(1,717)
|
(1,753)
|
36
|
|
Other
operating results, net
|
428
|
(20)
|
448
|
244
|
1,457
|
(1,213)
|
-
|
-
|
-
|
147
|
104
|
43
|
819
|
1,541
|
(722)
|
|
Profit / (Loss) from operations
|
2,063
|
1,559
|
504
|
881
|
3,291
|
(2,410)
|
(274)
|
(225)
|
(49)
|
460
|
13
|
447
|
(3,130)
|
4,638
|
(1,508)
|
|
Share
of profit of associates and joint ventures
|
57
|
39
|
18
|
-
|
-
|
-
|
-
|
-
|
-
|
-46
|
-2
|
-44
|
11
|
37
|
-26
|
|
Segment profit / (loss)
|
2,12
|
1,598
|
522
|
881
|
3,291
|
-2,41
|
-274
|
-225
|
-49
|
414
|
11
|
403
|
3,141
|
4,675
|
-1,534
|
216
Urban Properties and Investment Business
Operations Center in Argentina
|
|
Shopping Malls
|
Offices
|
Sales and development
|
Hotels
|
Internacional
|
Corporate
|
Others
|
Total
|
||||||||||||||||
|
|
30.06.19
|
30.06.18
|
Var.
|
30.06.19
|
30.06.18
|
Var.
|
30.06.19
|
30.06.18
|
Var.
|
30.06.19
|
30.06.18
|
Var.
|
30.06.19
|
30.06.18
|
Var.
|
30.06.19
|
30.06.18
|
Var.
|
30.06.19
|
30.06.18
|
Var.
|
30.06.19
|
30.06.18
|
Var.
|
|
|
(In
million of ARS)
|
|||||||||||||||||||||||
|
Revenues
|
8,541
|
9,75
|
(1,209
)
|
2,239
|
1,332
|
907
|
1,119
|
300
|
819
|
2,953
|
2,446
|
507
|
14
|
-
|
14
|
-
|
-
|
-
|
190
|
44
|
146
|
15,056
|
13,872
|
1,184
|
|
Costs
|
(776
)
|
(829
)
|
53
|
(153
)
|
(124
)
|
(29
)
|
(527
)
|
(149
)
|
(378
)
|
(1,588
)
|
(1,672
)
|
84
|
(6
)
|
-
|
(6
)
|
-
|
-
|
-
|
(151
)
|
(48
)
|
(103
)
|
(3,201
)
|
(2,822
)
|
(379
)
|
|
Gross profit / (loss)
|
7,765
|
8,921
|
(1,156
)
|
2,086
|
1,208
|
878
|
592
|
151
|
441
|
1,365
|
774
|
591
|
8
|
-
|
8
|
-
|
-
|
-
|
39
|
(4
)
|
43
|
11,855
|
11,050
|
805
|
|
Net gain from fair value adjustment of investment
properties
|
(40,582
)
|
6,266
|
(46,848
)
|
747
|
5,843
|
(5,096
)
|
726
|
7,338
|
(6,612
)
|
-
|
-
|
-
|
6
|
-
|
6
|
-
|
-
|
-
|
(374
)
|
362
|
(736
)
|
(39,477
)
|
19,809
|
(59,286
)
|
|
General and administrative expenses
|
(945
)
|
(854
)
|
(91
)
|
(206
)
|
(216
)
|
10
|
(283
)
|
(198
)
|
(85
)
|
(492
)
|
(487
)
|
(5
)
|
(110
)
|
(118
)
|
8
|
(519
)
|
(385
)
|
(134
)
|
(113
)
|
(77
)
|
(36
)
|
(2,668
)
|
(2,335
)
|
(333
)
|
|
Selling expenses
|
(530
)
|
(607
)
|
77
|
(99
)
|
(143
)
|
44
|
(119
)
|
(58
)
|
(61
)
|
(316
)
|
(311
)
|
(5
)
|
-
|
-
|
-
|
-
|
-
|
-
|
(21
)
|
(7
)
|
(14
)
|
(1,085
)
|
(1,126
)
|
41
|
|
Other operating results, net
|
(109
)
|
(105
)
|
(4
)
|
(40
)
|
(24
)
|
(16
)
|
(286
)
|
138
|
(424
)
|
114
|
(40
)
|
154
|
(24
)
|
(58
)
|
34
|
-
|
-
|
-
|
(314
)
|
33
|
(347
)
|
(659
)
|
(56
)
|
(603
)
|
|
Profit / (Loss) from operations
|
(34,401
)
|
13,621
|
(48,022
)
|
2,488
|
6,668
|
(4,180
)
|
630
|
7,371
|
(6,741
)
|
671
|
(64
)
|
735
|
(120
)
|
(176
)
|
56
|
(519
)
|
(385
)
|
(134
)
|
(783
)
|
307
|
(1,090
)
|
(32,034
)
|
27,342
|
(59,376
)
|
|
Share of profit of associates and joint ventures
|
-
|
-
|
-
|
-
|
-
|
-
|
(37
)
|
4
|
(41
)
|
-
|
-
|
-
|
(3,679
)
|
(4,425
)
|
746
|
-
|
-
|
-
|
(2,467
)
|
194
|
(2,661
)
|
(6,183
)
|
(4,227
)
|
(1,956
)
|
|
Segment profit / (loss)
|
(34,401
)
|
13,621
|
(48,022
)
|
2,488
|
6,668
|
(4,180
)
|
593
|
7,375
|
(6,782
)
|
671
|
(64
)
|
735
|
(3,799
)
|
(4,601
)
|
802
|
(519
)
|
(385
)
|
(134
)
|
(3,250
)
|
501
|
(3,751
)
|
(38,217
)
|
23,115
|
(61,332
)
|
Operations Center in Israel
|
|
Real Estate
|
Supermarkets
|
Telecommunications
|
Corporate
|
Others
|
Total
|
||||||||||||
|
|
30.06.19
|
30.06.18
|
Var.
|
30.06.19
|
30.06.18
|
Var.
|
30.06.19
|
30.06.18
|
Var.
|
30.06.19
|
30.06.18
|
Var.
|
30.06.19
|
30.06.18
|
Var.
|
30.06.19
|
30.06.18
|
Var.
|
|
|
(In
million of ARS)
|
|||||||||||||||||
|
Revenues
|
14,392
|
9,497
|
4,895
|
-
|
-
|
-
|
57,506
|
49,066
|
8,440
|
-
|
1,494
|
(1,494
)
|
1,639
|
-
|
1,639
|
73,537
|
60,057
|
13,480
|
|
Costs
|
(9,121
)
|
(5,957
)
|
(3,164
)
|
-
|
-
|
-
|
(42,424
)
|
(35,189
)
|
(7,235
|
-
|
(789
|
789
|
(881
|
-
|
(881
)
|
(52,426
)
|
(41,935
)
|
(10,491
)
|
|
Gross profit / (loss)
|
5,271
|
3,540
|
1,731
|
-
|
-
|
-
|
15,082
|
13,877
|
1,205
|
-
|
705
|
(705
)
|
758
|
-
|
758
|
21,111
|
18,122
|
2,989
|
|
Net gain from fair value adjustment of investment
properties
|
892
|
-
|
892
|
-
|
-
|
-
|
-
|
-
|
-
|
-
|
-
|
-
|
-
|
-
|
-
|
892
|
-
|
892
|
|
General and administrative expenses
|
(707
)
|
(578
)
|
(129
)
|
-
|
-
|
-
|
(4,779
)
|
(4,594
)
|
(185
)
|
(1,058
)
|
(1,207
)
|
149
|
(1,487
)
|
(854
)
|
(633
)
|
(8,031
)
|
(7,233
)
|
(798
)
|
|
Selling expenses
|
(197
)
|
(200
)
|
3
|
-
|
-
|
-
|
(10,562
)
|
(10,059
)
|
(503
)
|
-
|
(380
)
|
380
)
|
(433
)
|
-
|
(433
)
|
(11,192
)
|
(10,639
)
|
(553
)
|
|
Impairment of associates
|
-
|
-
|
-
|
-
|
-
|
-
|
-
|
-
|
-
|
-
|
-
|
-
|
-
|
-
|
-
|
-
|
-
|
-
|
|
Other operating results, net
|
-
|
256
|
(256
)
|
-
|
-
|
-
|
397
|
772
|
(375
)
|
-
|
(33
)
|
33
|
345
|
1,141
|
(796
)
|
742
|
2,136
|
(1,394
)
|
|
Profit / (Loss) from operations
|
5,259
|
3,018
|
2,241
|
-
|
-
|
-
|
138
|
(4
)
|
142
|
(1,058
)
|
(915
)
|
(143
)
|
(817
)
|
287
|
(1,104
)
|
3,522
|
2,386
|
1,136
|
|
Share of profit of associates and joint ventures
|
37
|
158
|
(121
)
|
717
|
-
|
717
|
-
|
-
|
-
|
-
|
(580
)
|
580
|
(904
)
|
-
|
(904
)
|
(150
)
|
(422
)
|
272
|
|
Segment profit / (loss)
|
5,296
|
3,176
|
2,120
|
717
|
-
|
717
|
138
|
(4
)
|
142
|
(1,058
)
|
(1,495
)
|
437
|
(1,721
)
|
287
|
(2,008
)
|
3,372
|
1,964
|
1,408
|
217
Results of operations for the fiscal years ended June 30, 2019 and
2018.
Revenues 2019 vs 2018
Total
revenues, according to the income statement, increased by ARS
17,475 million (18.7%), from ARS 93,266 million in the fiscal year
ended June 30, 2018 to ARS 110,741 million in the fiscal year ended
June 30, 2019. Such increase was mainly due to a ARS 3,495 million
increase in the Agricultural Business, which went from ARS 15,079
million in the fiscal year ended June 30, 2018 to ARS 18,574
million in the fiscal year ended June 30, 2019, and a ARS 13,980
million increase in the Urban Properties and Investment Business.
Within the Urban Properties and Investment Business, the variation
is attributable to a ARS 13,480 million increase in the Operations
Center in Israel and a ARS 500 million increase in the Operations
Center in Argentina.
In
turn, total revenues on account of expenses and promotion fund
decreased by ARS 681 million (15.5%), from ARS 4,387 million in the
fiscal year ended June 30, 2018 to ARS 3,706 million in the fiscal
year ended June 30, 2019.
Revenues
from inter-segment transactions varied by ARS 194 million (58.4%),
from a loss of ARS 332 million in the fiscal year ended June 30,
2018 to a loss of ARS 526 million in the fiscal year ended June 30,
2019.
Therefore,
according to information by segments (taking into account the
profit/ (loss) from operations from our joint ventures and without
considering those from expenses and collective promotion fund or
inter-segment transactions), total revenues increased by ARS 18,332
million (20.5%), from ARS 89,322 million in the fiscal year ended
June 30, 2018 to ARS 107,654 million in the fiscal year ended June
30, 2019. Such increase was mainly due to a ARS 3,668 million
increase in the Agricultural Business and a ARS 14,664 million
increase in the Urban Properties and Investment Business. Within
the Urban Properties and Investment Business the variation is due
to a ARS 13,480 million increase in the Operations Center in
Israel, and a ARS 1,184 million increase in the Operations Center
in Argentina.
Agricultural Business
According
to information by segments (taking into account all our joint
ventures, and inter-segment eliminations), total revenues increased
by ARS 3,668 million (23.8%), from ARS 15,393 million in the fiscal
year ended June 30, 2018 to ARS 19,061 million in the fiscal year
ended June 30, 2019.
Agricultural Production.
Total revenues from the
Agricultural Production segment rose by 22.0% from ARS 9,096
million during the fiscal year ended June 30, 2018 to ARS 11,100
million during the fiscal year ended June 30, 2019. Such increase
is mainly attributable to:
●
A ARS 1,436 million
increase in revenues from crop sales, resulting from a 36% increase
in the average price of crops sold, from ARS 10,090 per ton in
fiscal year 2018 to ARS 13,721 per ton in fiscal year 2019, offset
by a decrease of 39,676 tons in the volume of crops sold in fiscal
year 2019 as compared to the previous fiscal year.
●
A ARS 603 million
rise in revenues from sugarcane sales, resulting from an increase
of 242,460 tons (14%) in the volume of sugarcane sold fiscal year
2019 compared to the previous fiscal year, coupled with a 15% rise
in the average price of sugarcane sold, from ARS 1,158 per ton in
fiscal year 2018 to ARS 1,329 per ton in fiscal year 2019, as a
result of an improvement in sugarcane quality (higher TRS, i.e.,
total recoverable sugar);
●
A ARS 39 million
decrease in revenues from cattle sales, primarily attributable to a
decrease of 5,557 tons in the volume of cattle sold in fiscal year
2019 compared to the previous fiscal year, partially offset by a
25% rise in the average price of cattle, as well as a decrease in
the sale of milk caused by the discontinuation of the activity in
the previous fiscal year; and
●
A ARS 242 million
increase in revenues from rentals and services attributable to: (i)
an increase of ARS 149 million (42%) in revenues from seed
production mainly caused by an increase in the sale price of the
corn and soybean seed service in Argentina; and an increase in the
hectares leased to third parties in Brazil added to the collection
of an additional amount for productivity on the yields; and (ii) a
ARS 99 million increase in revenues from Feed Lot services and
pastures.
218
Others.
Revenues from the Others segment increased by 26.4%
from ARS 6,297 million during fiscal year 2018 to ARS 7,961 million
during fiscal year 2019. Such increase is attributable
to:
●
A ARS 943 million
increase in revenues from agro-industrial activities, due to the
fact that, although the volume remained stable, in this fiscal year
the share of sales to the external market increase over total
sales, from 31% in fiscal year 2018 to 43% in fiscal year 2019,
generating a double impact on gain (loss) by the effect of the
increase in the exchange rate. The volume of domestic sales
decreased, but prices remained in line with the inflation for the
year;
●
A ARS 721 million
increase in revenues from sales on consignment, brokerage fees and
others, due to a higher volume of crop Trading transactions and
sales of supplies in the current year, boosted by the effect of
devaluation.
Urban Properties and Investment
Business
According to information by segments (taking into account all our
joint ventures and inter-segment eliminations), total revenues
increased by ARS 14,664 million (19.8%), from ARS 73,929 million in
the fiscal year ended June 30, 2018 (out of which ARS 60,057
million derive from the Operations Center in Israel and ARS 13,872
million from the Operations Center in Argentina) to ARS 88,593
million in the fiscal year ended June 30, 2019 (out of which ARS
73,537 million derive from the Operations Center in Israel and ARS
15,056 million from the Operations Center in Argentina). Excluding
the revenues from the Operations Center in Israel, revenues,
according to information by segments, increased by
8.5%.
Operations Center in
Argentina
Shopping Malls.
Revenues from
the Shopping Malls segment decreased by 12.4% from ARS 9,750
million during fiscal year 2018 to ARS 8,541 million during fiscal
year 2019. Such fall is mainly attributable to: (i) a ARS 976
million decrease in revenues from permanent and variable leases as
a result of a 13.9% decrease in total sales of our lessees, which
went from ARS 109,687 million during fiscal year 2018 to ARS 94,436
million during fiscal year 2019; (ii) a ARS 140 million decrease in
commissions;(iii) a ARS 122 million decrease in revenues from
admission rights; (iv) a ARS 120 million decrease in revenues from
parking fees; (v) a ARS 17 million decrease in revenues from
flattening and administration and management services; (vi)
partially offset by an increase in leverage of graduated leases in
Other revenues of ARS 192 million, mainly attributable to the
termination of the Walmart agreement.
Offices.
Revenues from the
Offices segment increased by 68.1% from ARS 1,332 million during
the fiscal year ended June 30, 2018 to ARS 2,239 million during the
fiscal year ended June 30, 2019. The variation is mainly explained
by a significant increase in revenues from leases of different
buildings, mainly PH Office Park and Zeta Buildings, and by the
effect of the exchange rate variation.
Sales and Developments.
Revenues from the Sales and Developments segment
recorded a 273% increase, from ARS 300 million during the fiscal
year ended June 30, 2018 to ARS 1,119 million during the fiscal
year ended June 30, 2019. This segment often varies significantly
from fiscal year to fiscal year to the non-recurrence of different
sales transactions carried out by the Group over
time.
Hotels.
Revenues from our
Hotels segment increased by 20.7% from ARS 2,446 million during the
fiscal year ended June 30, 2018 to ARS 2,953 million during the
fiscal year ended June 30, 2019,
mainly due to an increase
in the average room rate of our hotel portfolio (measured in
Pesos).
International.
Revenues from
our International segment increased by 100%, to ARS 14 million
during the fiscal year ended June 30, 2019 due to the lease of
properties by our subsidiary Real Estate Strategies
LLC.
Corporate.
Revenues associated
with our Corporate segment showed no variations for the reported
fiscal years.
Others.
Revenues from the
Others segment increased by 331.8% from ARS 44 million during the
fiscal year ended June 30, 2018 to ARS 190 million during the
fiscal year ended June 30, 2019, mainly due to the increase in
revenues from La Arena S.A. y LA RURAL S.A. – OFC S.R.L.
– OGDEN S.A – ENTRETENIMIENTO UNIVERSAL S.A. –
Unión transitoria – (administradora del Centro de
Convenciones y Exposiciones de la Ciudad de Buenos
Aires).
219
Operations Center in
Israel
Real Estate.
Revenues from the real estate segment increased
from ARS 9,497 million during the period ended June 30, 2018 to ARS
14,392 million during the period ended June 30, 2019. This
variation was due to (i) an actual devaluation of the Argentine
peso of approximately 22%, (ii) an increase in the rentable square
meters, (iii) an increase in the price of leases, and (iv) the
application of IFRS 15.
Telecommunications.
Revenues from the telecommunications
segment increased from ARS 49,066 million during the period ended
June 30, 2018 to ARS 57,506 million during the period ended June
30, 2019. This variation was due to an actual devaluation of the
Argentine peso of approximately 22%, partially offset by the
constant erosion in the revenues of mobile services, which was
partially offset by an increase in revenues related to fixed lines,
television and internet.
Others.
Revenues from the Others segment increased from ARS
1,494 million during the period ended June 30, 2018 to ARS 1,639
million during the period ended June 30, 2019. This variation was
due to (i) an actual devaluation of the Argentine peso of
approximately 22%, (ii) offset by a drop in revenues from
Bartan.
Costs 2019 vs 2018
Total
costs, according to the income statement, increased by ARS 13,306
million (21.4%), from ARS 62,078 million in the fiscal year ended
June 30, 2018 to ARS 75,384 million in the fiscal year ended June
30, 2019. Such increase was mainly due to a ARS 3,024 million
increase in the Agricultural Business, from ARS 12,945 million in
the fiscal year ended June 30, 2018 to ARS 15,969 million in the
fiscal year ended June 30, 2019, and a ARS 10,282 million increase
in the Urban Properties and Investment Business. Within the Urban
Properties and Investment Business, the variation is due to an
increase in the Operations Center in Israel of ARS 10,491 million
and an increase in the Operations Center in Argentina of ARS 209
million.
Costs
from our joint ventures decreased by ARS 2 million (2.9%), from a
profit of ARS 69 million in the fiscal year ended June 30, 2018
(out of which ARS 8 million to the Shopping Mall segment; ARS 50
million to the Offices segment and ARS 11 million to the Sales and
Developments segment of the Operations Center in Argentina) to a
profit of ARS 67 million in the fiscal year ended June 30, 2019
(out of which ARS 17 million are allocated to the Shopping Malls
segment; ARS 42 million to the Offices segment and ARS 8 million to
the Sales and Developments segment of the Operations Center in
Argentina).
In
turn, total costs on account of expenses and promotion fund
decreased by ARS 590 million (13.3%), from ARS 4,445 million in the
fiscal year ended June 30, 2018 to ARS 3,855 million in the fiscal
year ended June 30, 2019.
Costs
from inter-segment transactions varied by ARS 45 million (29.8%),
from ARS 151 million in the fiscal year ended June 30, 2018 to ARS
196 million in the fiscal year ended June 30, 2019.
Therefore,
according to information by segments (taking into account profit /
(loss) from operations from our joint businesses and excluding
those corresponding to expenses and collective promotion fund or
business inter-segment transactions), total costs increased by ARS
13,939 million (24.1%), from ARS 57,853 million in the fiscal year
ended June 30, 2018 to ARS 71,792 million in the fiscal year ended
June 30, 2019. Such increase was mainly due to a ARS 3,069 million
decrease in the Agricultural Business and a ARS 10,870 million
decrease in the Urban Properties and Investment Business. Within
the Urban Properties and Investment Business the variation derives
from a decrease in the Operations Center in Israel of ARS 10,491
million, offset by a decrease in the Operations Center in Argentina
of ARS 379 million.
Agricultural
Business
According
to information by segments (taking into account all our joint
ventures and inter-segment eliminations), total costs increased by
ARS 3,069 million (23.4%), from ARS 13,096 million in the fiscal
year ended June 30, 2018 to ARS 16,165 million in the fiscal year
ended June 30, 2019. The costs of the Agricultural Business,
measured as a percentage of revenues from this segment, decreased
from 85.1% during the fiscal year ended June 30, 2018 to 84.8%
during the fiscal year ended June 30, 2019.
220
Agricultural Production.
The costs of the Agricultural
Production segment increased by 28.1% from ARS 7,388 million during
fiscal year 2018 to ARS 9,466 million during fiscal year 2019,
primarily as a consequence of:
●
A ARS 1,752 million
increase in costs of crop sales, mainly resulting from a 51%
increase in the average cost per ton of crops sold in fiscal year
2019, from 8,089 million in fiscal year 2018 to 12,206 million in
fiscal year 2019; offset by a decrease of 39,676 tons in the volume
of tons sold in fiscal year 2019 as compared to the previous fiscal
year.
●
A ARS 363 million
increase in the costs of sugarcane sales, mainly as a result of an
increase of 242,460 tons (14%) in the volume of sugarcane sold in
fiscal year 2019 compared to the previous fiscal year, coupled with
a 4% rise in the average cost of sugarcane per ton sold in fiscal
year 2019, from ARS 1,129 per ton in fiscal year 2018 to ARS 1,172
per ton in fiscal year 2019;
●
A ARS 24 million
decrease in the costs of cattle and milk sales, mainly as a result
of a decrease of 5,557 tons of cattle sold in fiscal year 2019
compared to the previous fiscal year, partially offset by a 34%
rise in the average cost of cattle sold, as well as by the decrease
in the sale of milk caused by the discontinuation of the activity
in the prior fiscal year; and
●
A ARS 158 million
increase in costs of rentals and services, mainly attributable to a
ARS 109 million increase in the Feedlot service cost and an
increase in ARS 49 million in lease costs and seed
production.
Costs
of the Agricultural Production segment, measured as a percentage of
revenues from this segment, increased from 81.2% during fiscal year
2018 to 85.3% during fiscal year 2019.
Land transformation and sales.
The costs of the Land
transformation and sales segment decreased by 33.3% from ARS 36
million during fiscal year 2018 to ARS 24 million during fiscal
year 2019.
Others.
The costs of the Others segment increased by 17.7%
from ARS 5,672 million during fiscal year 2018 to ARS 6,675 million
during fiscal year 2019, mainly as a result of:
●
A ARS 671 million
increase in agro-industrial costs, mostly driven by a rise in
acquisition costs of all of its components.
●
A ARS 332 million
increase in other segments, mainly triggered by the sale of
supplies.
The
costs of the Others segment, measured as a percentage of revenues
from this segment, decreased from 90.1% during fiscal year 2018 to
83.8% during fiscal year 2019.
Urban Properties and Investment
Business
According
to information by segments (taking into account all our joint
ventures and inter-segment eliminations), total costs increased by
ARS 10,870 million (24.3%), from ARS 44,757 million in the fiscal
year ended June 30, 2018 (out of which ARS 41,935 million derive
from the Operations Center in Israel and ARS 2,822 million from the
Operations Center in Argentina) to ARS 55,627 million in the fiscal
year ended June 30, 2019 (out of which ARS 52,426 million derive
from the Operations Center in Israel and ARS 3,201 million from the
Operations Center in Argentina). Excluding the costs from the
Operations Center in Israel, costs, according to information by
segments, decreased by 13.4%. Likewise, total costs, measured as a
percentage of total revenues, according to information by segments,
increased from 60.5% during fiscal year ended June 30, 2018 to
62.8% during the fiscal year ended June 30, 2019, mainly deriving
from the Operations Center in Israel. Excluding the effect from the
Operations Center in Israel, total costs, measured as a percentage
of total revenues, increased from 20.4% during the fiscal year
ended June 30, 2018 to 21.3% during the fiscal year ended June 30,
2019.
Operations Center in Argentina
Shopping Malls.
Costs associated with the Shopping Malls
segment decreased by 6.4%, from ARS 829 million during fiscal year
2018 to ARS 776 million during fiscal year 2019, mainly due to: (i)
a decrease in salaries, social security and other personnel
administrative expenses of ARS 44 million; (ii) a decrease in
amortization and depreciation of ARS 20 million; and (iii) a
decrease in maintenance, security, cleaning, repairs and related
expenses of ARS 9 million; partially offset by (iv) an increase in
leases and expenses of ARS 24 million (generated by leases
denominated in dollars). Costs associated with the Shopping Malls
segment, measured as a percentage of the revenues from this
segment, increased from 8.5% during the fiscal year ended June 30,
2018 to 9.1% during the fiscal year ended June 30,
2019.
221
Offices
. Costs associated with the Offices segment increased
by 23.4%, from ARS 124 million during the fiscal year ended June
30, 2018 to ARS 153 million during the fiscal year ended June 30,
2019, mainly due to (i) an increase in amortization and
depreciation of ARS 53 million; offset by: (i) a decrease in leases
and expenses of ARS 12 million; (ii) a decrease in maintenance,
repairs and services expenses of ARS 9 million; (iii) a decrease in
fees and compensation for services of ARS 5 million and (iv) a
decrease in taxes, fees and contributions of ARS 3 million. Costs
associated with the Offices segment, measured as a percentage the
revenues from this segment, decreased from 9.3% during the fiscal
year ended June 30, 2018 to 6.8% during the fiscal year ended June
30, 2019.
Sales and Developments
. Costs associated with our Sales and
Developments segment recorded a 253.7% increase from ARS 149
million during the fiscal year ended June 30, 2018 to ARS 527
million during the fiscal year ended June 30, 2019 mainly due to
the cost of the sale of Catalinas Norte. Costs in the Sales and
Developments segment, measured as a percentage of revenues from
this segment, decreased from 49.7% during the fiscal year ended
June 30, 2018 to 47.1% during the fiscal year ended June 30,
2019.
Hotels.
Costs in the Hotels segment decreased by 5%, from
ARS 1,672 million during the fiscal year ended June 30, 2018 to ARS
1,588 million during the fiscal year ended June 30, 2019, mainly as
a result of (i) a ARS 107 million decrease in the costs of
salaries, social security and other personnel expenses; and (ii) a
ARS 9 million decrease in food, beverages and other hotel expenses,
offset by (iii) an increase in fees and compensation services of
ARS 30 million. Costs in the Hotels segment, measured as a
percentage of revenues from this segment, decreased from 68.4%
during the fiscal year ended June 30, 2018 to 53.8% during the
fiscal year ended June 30, 2019.
International.
Costs in the International segment increased
100%, amounting to ARS 6 million during the fiscal year ended June
30, 2019, associated with the cost of lease of properties by our
subsidiary Real Estate Strategies LLC.
Corporate
. Costs in the Corporate segment did not vary in
the reported fiscal years.
Others.
Costs in the Others segment increased by 214.6%,
from ARS 48 million during the fiscal year ended June 30, 2018 to
ARS 151 million during the fiscal year ended June 30, 2019, mainly
as a result of: (i) a ARS 30 million increase in taxes, fees and
contributions; (ii) a ARS 19 million increase in leases and
expenses; (iii) a ARS 17 million increase in fees and compensation
for services; (iv) a ARS 14 million increase in depreciation and
amortization; (v) a ARS 12 million increase in maintenance, repairs
and services; and (vi) a ARS 9 million increase in salaries, social
security and other personnel expenses.
Operations Center in
Israel
Real Estate.
Real estate segment costs increased from ARS
5,957 million during the period ended June 30, 2018 to ARS 9,121
million during the period ended June 30, 2019. This variation was
due to (i) a real revaluation of the NIS against the Argentine peso
of approximately 22%. (ii) an increase in the cost due to the
increased sale of residential apartments and the implementation of
IFRS 15.
Telecommunications.
Costs in the Telecommunications segment
increased from ARS 35,189 million during the period ended June 30,
2018 to ARS 42,424 million during the period ended June 30, 2019.
This variation was due to a real revaluation of the NIS against the
Argentine peso of approximately 22%, offset by a decrease in costs
that accompanied the reduction in sales of mobile services and a
slight increase in costs related to television
content.
Others.
Costs in the Others segment increased from ARS 789
million during the period ended June 30, 2018 to ARS 881 million
during the period ended June 30, 2019. This variation was due to a
real revaluation of the NIS against the Argentine peso of
approximately 22%, offset by a drop in the costs of
Bartan.
Initial recognition and changes in the fair value of biological
assets and agricultural produce at the point of harvest 2019 vs
2018
The
profit from the total initial recognition and changes in the fair
value of biological assets and agricultural produce at the point of
harvest, according to the income statement, increased by ARS 631
million (37.7%), from ARS 1,674 million in the fiscal year ended
June 30, 2018 to ARS 2,305 million in the fiscal year ended June
30, 2019.
There
is no profit / (loss) from our joint ventures in relation to the
initial recognition and changes in the fair value of biological
assets and agricultural produce at the point of
harvest.
222
There
is no profit / (loss) on account of expenses and promotion fund in
relation to the initial recognition and changes in the fair value
of biological assets and agricultural produce at the point of
harvest.
The
profit/ (loss) related to the initial recognition and changes in
the fair value of biological assets and agricultural produce at the
point of harvest from inter-segment transactions varied by ARS 130
million (92.9%), from ARS 140 million in the fiscal year ended June
30, 2018 to ARS 270 million in the fiscal year ended June 30,
2019.
Therefore,
according to information by segments (taking into account the
profit / (loss) from operations from our joint ventures and
excluding those related to expenses and collective promotion fund
and business inter-segment transactions), the profit / (loss) from
the total initial recognition and changes in the fair value of
biological assets and agricultural produce at the point of harvest
increased by ARS 505 million (33.0%), from ARS 1,530 million in the
fiscal year ended June 30, 2018 to ARS 2,035 million in fiscal year
ended June 30, 2019.
Such
variation was mainly a result of:
●
A lesser loss in
profits from cattle production of ARS 323 million, mainly generated
by Argentina, derived, on the one hand, from beef cattle, since the
increase in prices in fiscal year 2019 was higher than in the prior
fiscal year; furthermore, during such fiscal year cattle was
lot-fed to mitigate the draught effects generating more kilograms
produced, but also higher feeding costs; and on the other hand,
from the income obtained during this fiscal year derived from the
wool production, due an increase in the prices; and
●
An increase in
profits from crop production of ARS 26 million, mainly generated in
Argentina as a result of a higher planted area and better corn and
soybean yields; and better wheat prices and yields during this
fiscal year; and in Bolivia as a result of a significant
improvement in soybean yields (64%) and a cost reduction; while
Brazil registered a negative variation originated by soybean due to
lower prices and yields as well as increased costs; offset
by;
●
A decrease in the
result of sugarcane production of ARS 73 million, mainly in Brazil
due to an increase in production costs derived from the fact that
during the current fiscal year cultural and irrigation works were
carried out in the San José farmland, as compared to the
previous fiscal year when this farmland had been incorporated with
the cane already planted; and, additionally, the cutting, hauling
and transportation costs also grew up as a result of the increase
in fuels. This was partially offset by the improvement in the
Bolivian production results, as a result of an increase in the
cultivated area during this fiscal year.
●
A decrease in the
result of agro-industrial activity of ARS 15 million
Changes in the net
realizable value of agricultural produce after
harvest
2019
vs 2018
Profits
/(loss) from total changes in the net realizable value of
agricultural produce after harvest, according to the income
statement, decreased by ARS 575 million (108.1%), from ARS 532
million in the fiscal year ended June 30, 2018 to ARS 43 million in
the fiscal year ended June 30, 2019. Such variation is mainly
generated by Argentina, particularly by the soybean, due to the
fact that in the previous fiscal year the prices had an upward
trend while during the current fiscal year the trend was downward
as a consequence of the trade war between China and USA; in
addition, although corn and wheat prices raised in both fiscal
years, they were not in line with inflation, particularly in the
current fiscal year.
Gross profit 2019 vs 2018
As a
result of the above mentioned factors, total gross profit,
according to the income statement, increased by ARS 4,225 million
(12.7%), from ARS 33,394 million in the fiscal year ended June 30,
2018 to ARS 37,619 million in the fiscal year ended June 30, 2019.
This was mainly due to the ARS 527 million increase in the
Agricultural Business, from ARS 4,340 million in the fiscal year
ended June 30, 2018 to ARS 4,867 million in the fiscal year ended
June 30, 2019, and a ARS 3,698 million increase in the Urban
Properties and Investment Business. Within the Urban Properties and
Investment Business, the variation is due to an increase in the
Operations Center in Israel of ARS 2,989 million, offset by an
increase in the Operations Center in Argentina of ARS 709
million.
Gross
profit / (loss) from our joint ventures increased by ARS 12 million
(31.6%), from a loss of ARS 38 million in the fiscal year ended
June 30, 2018 to a loss of ARS 26 million in the fiscal year ended
June 30, 2019.
223
In
turn, total gross profit on account of expenses and promotion fund
decreased by ARS 91 million (156.9%), from a loss of ARS 58 million
in the fiscal year ended June 30, 2018 (out of which a gain of ARS
88 million derives from the Shopping Malls segment and a loss of
ARS 30 million derives from the Offices segment) to a loss of ARS
149 million in the fiscal year ended June 30, 2019 (out of which a
gain of ARS 144 million derives from the Shopping Malls segment and
a gain of ARS 5 million derives from the Offices
segment).
Gross
profit generated by inter-segment transactions varied by ARS 19
million (46.3%), from ARS 41 million in the fiscal year ended June
30, 2018 to ARS 60 million in the fiscal year ended June 30,
2019.
Therefore,
according to information by segments (taking into account the
profit / (loss) from operations from our joint ventures and without
considering those related to expenses and collective promotion fund
and inter-segment business transactions), total gross profit
increased by ARS 4,323 million (12.9%), from ARS 33,531 million in
the fiscal year ended June 30, 2018 to ARS 37,854 million in the
fiscal year ended June 30, 2019. This was mainly due to an increase
of ARS 529 million in the Agricultural Business and an increase of
ARS 3,794 million in the Urban Properties and Investment Business.
Within the Urban Properties and Investment Business, the variation
was generated by an increase in the Operations Center in Israel of
Ps2,989 million, and an increase in the Operations Center in
Argentina of ARS 805 million.
Agricultural
Business
According
to information by segments (taking into account all our joint
ventures and inter-segment eliminations), total gross profit rose
by ARS 529 million (12.1%), from ARS 4,359 million in the fiscal
year ended June 30, 2018 to ARS 4,888 million in the fiscal year
ended June 30, 2019. Gross profit from the Agricultural Business,
measured as a percentage of revenues from this segment, decreased
from 28.3% during the fiscal year ended June 30, 2018 to 25.6%
during the fiscal year ended June 30, 2019.
Agricultural Production.
Gross profit from this segment
decreased by 4.2% from ARS 3,779 million in fiscal year 2018 to ARS
3,620 million in fiscal year 2019.
Land Transformation and Sales.
Gross profit from this
segment decreased by 33.3% from ARS 36 million in fiscal year 2018
to ARS 24 million in fiscal year 2019.
Others.
Gross profit from this segment increased by 109.7%
from ARS 616 million in fiscal year 2018 to ARS 1,292 million in
fiscal year 2019.
Urban Properties and Investment
Business
According
to information by segments (taking into account all our joint
ventures and inter-segment eliminations), total gross profit
increased by ARS 3,794 million (13.0%), from ARS 29,172 million in
the fiscal year ended June 30, 2018 (out of which ARS 18,122
million derive from the Operations Center in Israel and ARS 11,050
million from the Operations Center in Argentina) to ARS 32,966
million in the fiscal year ended June 30, 2019 (out of which ARS
21,111 million derive from the Operations Center in Israel and ARS
11,855 million from the Operations Center in Argentina). Excluding
gross profit from the Operations Center in Israel, gross profit,
according to information by segments, decreased by 7.3%. In
addition, total gross profit, measured as a percentage of total
revenues, according to information by segments, decreased from
39.5% during the fiscal year ended June 30, 2018 to 37.2% during
the fiscal year ended June 30, 2019, mainly from the Operations
Center in Israel. Excluding the effect from the Operations Center
in Israel, total gross profit, measured as a percentage of total
revenues, decreased from 79.7% during the fiscal year ended June
30, 2018 to 78.7% during the fiscal year ended June 30.
2019.
Operations Center in
Argentina
Shopping Malls.
Gross profit from the Shopping Malls segment
decreased 13%, from ARS 8,921 million during fiscal year 2018 to
ARS 7,765 million for fiscal year 2019, mainly as a result of a
decrease in total sales of our tenants, giving rise to lower rental
percentages under our lease agreements. Gross profit from our
Shopping Malls segment as a percentage of revenues for the segment
decreased from 91.5% during fiscal year 2018 to 90.9% during fiscal
year 2019.
Offices
. Gross profit of the Offices segment increased by
72.7%, from ARS 1,208 million for the year ended June 30, 2018 to
ARS 2,086 million during the year ended June 30, 2019. The gross
profit of the Offices segment, measured as a percentage of revenues
of this segment, increased from 90.7% during the year ended June
30, 2018 to 93.2% during the year ended June 30, 2019.
224
Sales and developments
. Gross profit of the Sales and
Developments segment increased by 292.1%, from ARS 151 million
during the year ended June 30, 2018 to ARS 592 million during the
year ended June 30, 2019, mainly as a result of higher sales
recorded during the year ended June 30, 2019. The gross profit of
the Sales and Developments segment, measured as a percentage of
this segment’s revenues, increased from 50.3 % during the
year ended June 30, 2018 to 52.9% during the year ended June 30,
2019.
Hotels
. Gross profit for the Hotels segment increased by
76.4% from ARS 774 million during the fiscal year ended June 30,
2018 to ARS 1,365 million during the year ended June 30, 2019. The
gross profit of the Hotels segment, measured as a percentage of
revenues of this segment, increased from 31.6% during the year
ended June 30, 2018 to 46.2% during the year ended June 30,
2019.
International
. Gross profit of the International segment
increased 100%, with a gross profit of ARS 8 million during the
year ended June 30, 2019.
Corporate.
Gross profit of the Corporate segment did not
present variations during the reported years.
Others
. Gross profit from the Others segment increased
1,075%, from a loss of ARS 4 million during the year ended June 30,
2018 to a profit of ARS 39 million during the year ended June 30,
2019. The gross profit of the Others segment, measured as a
percentage of revenues of this segment, increased from 9.1%
negative during the year ended June 30, 2018 to 20.5% during the
year ended June 30, 2019.
Operations Center in
Israel
Real Estate.
Gross profit of the real estate segment
increased from ARS 3,540 million during the period ended June 30,
2018 to ARS 5,271 million during the period ended June 30, 2019.
This variation was mainly due to a real revaluation of the NIS
against the Argentine peso of approximately 22%, the implementation
of IFRS 15 and an increase in square meters. The gross profit of
the segment as a percentage of revenues decreased from 37.3% during
period 2018 to 36.6% during the period 2019.
Telecommunications.
Gross profit of the telecommunications
segment increased from ARS 13,877 million during the year ended
June 30, 2018 to ARS 15,082 million during the period ended June
30, 2019. This variation was mainly due to a real revaluation of
the NIS against the Argentine peso of approximately 22%, partially
offset by the constant erosion in the revenues of mobile services,
which was partially offset by an increase in revenues related to
fixed lines, television and internet. The gross profit of the
segment as a percentage of revenues decreased slightly from 28.3%
during the year ended June 30, 2018 to 26.2% during the year ended
June 30, 2019.
Others.
Gross profit from the Others segment increased from
ARS 705 million during the period ended June 30, 2018 to ARS 758
million during the period ended June 30, 2019. This variation was
mainly due to a real revaluation of the NIS against the Argentine
peso of approximately 22%, offset by the drop of Bartan. The gross
profit of the segment as a percentage of revenues decreased
slightly from 47.2% during the period ended June 30, 2018 to 46.2%
during the period ended June 30, 2019.
Net gain (loss) from changes in the fair value of investment
properties 2019 vs 2018
Total
gain (loss) from changes in the fair value of investment
properties, according to the income statement, decreased by ARS
56,717 million (299.0%), from a gain of ARS 18,971 million in the
fiscal year ended June 30, 2018 to a loss of ARS 37,746 million in
the fiscal year ended June 30, 2019. This was mainly due to a ARS
216 million decrease in the Agricultural Business, from a gain of
ARS 216 million in the fiscal year ended June 30, 2018 to a loss of
ARS 0 million in the fiscal year ended June 30, 2019, and a ARS
56,501 million decrease in the Urban Properties and Investment
Business. Within the Urban Properties and Investment Business, the
variation corresponds to a ARS 892 million increase in the
Operations Center in Israel offset by a ARS 57,393 million decrease
in the Operations Center in Argentina.
The
gain (loss) from changes in the fair value of investment properties
from our joint ventures increased by ARS 1,893 million (179.6%),
from a loss of ARS 1,054 million in the fiscal year ended June 30,
2018 to a gain of ARS 839 million in the fiscal year ended June 30,
2019.
There
is no profit / (loss) on account of expenses and promotion fund in
relation to net gain (loss) from changes in the fair value of
investment properties.
There
is no profit / (loss) from our inter-segment transactions in
relation to the net gain (loss) from changes in the fair value of
investment properties.
225
Therefore,
according to information by segments (taking into account the
profit / (loss) from operations from our joint ventures and
excluding those related to expenses and collective promotion fund
or inter-segment transactions), the total net gain/(loss) from
changes in the fair value of investment properties decreased by ARS
58,610 million (292.7%), from a gain of ARS 20,025 million in the
fiscal year ended June 30, 2018 to a loss of ARS 38,585 million in
the fiscal year ended June 30, 2019. Such change was mainly due to
a ARS 216 million decrease in the Agricultural Business and a ARS
58,394 million decrease in the Urban Properties and Investment
Business. Within the Urban Properties and Investment Business, the
variation derives from an increase in the Operations Center in
Israel of ARS 892 million, offset by a decrease in the Operations
Center in Argentina of ARS 59,286 million.
Agricultural
Business
According
to information by segments (taking into account all our joint
ventures and inter-segment eliminations), the total net gain (loss)
from changes in the fair value of investment properties decreased
by ARS 216 million (100.0%), from ARS 216 million in the fiscal
year ended June 30, 2018 to ARS 0 million in the fiscal year ended
June 30, 2019.
The
decrease in net gain (loss) is mainly attributable to Brasilagro as
a result of a lower number of hectares leased to third parties in
Jatobá farmland.
Urban Properties and Investment
Business
According
to information by segments (taking into account all our joint
ventures and inter-segment eliminations), total net gain (loss)
from changes in the fair value of investment properties decreased
by ARS 58,394 million (294.8%), from ARS 19,809 million in the
fiscal year ended June 30, 2018 (out of which ARS 0 million derive
from the Operations Center in Israel and ARS 19,809 million from
the Operations Center in Argentina) to ARS 38,585million in the
fiscal year ended June 30, 2019 (out of which ARS 892 million
derive from the Operations Center in Israel and ARS 39,477 million
from the Operations Center in Argentina). Excluding the changes in
the fair value of investment properties from the Operations Center
in Israel, changes in the fair value of investment properties,
according to information by segments, increased by
299.3%.
Operations Center in
Argentina
Shopping Malls
The
shopping -Malls portfolio decreased between the fiscal year ended
June 30, 2019 and 2018, as the end of the concession we had for
Buenos Aires Design took place.
The net
impact in the peso values of our properties was primarily a
consequence of macroeconomic changes: (i) from june 2018 to june
2019, the Argentinian peso depreciated 47% against US Dolar (from
ARS 28.75 per dolar to ARS 42.26 per dolar), which had a direct
impact in a less projected cash flows in US Dolar from our Shopping
Malls segment; and (ii) an increase of 234 basis points on the
discount rate in US dolar, which it is used to discount the
projected cash flow from Shopping Malls segment.
Offices, Sales and Developments, International and
Others
Net
gain/(loss) from actual fair value adjustment of investment
properties included in these segments decreased by 92% during the
year ended June 30, 2019.
The
Argentine office market is a liquid market, in which a significant
volume of counterparties participates and frequently carries out
purchase and sale transactions. This allows to observe sale prices
that are relevant and representative in the market. Furthermore,
lease agreements are denominated in dollars for an average term of
3 years, with the current business thus generating a stable cash
flow in dollars, In this sense, the “Market approach”
technique is used (market comparable values) for the determination
of the fair value of these segments, with the value per square
meter being the most representative metric.
226
Changes
in fair value from our Shopping Malls segment differ from our
offices segment because the nature of each business is different
and prices depend on factors that may not have similarly over time.
As we mentioned before, the office property market is dominated by
investors and owners that seek medium- to long-term leases and
perceive real estate as a safe dollar-denominated investment
option. In contrast, the shopping mall segment is a relatively new
industry in Argentina where the first shopping mall opened in 1990,
compared to markets such as the United States and Brazil where the
industry began in the 1950’s and 1960’s, respectively.
Additionally, unlike the office properties segment, the financial
performance of shopping mall properties is highly correlated with
the volatile economic activity in Argentina since the cash flow
generated by shopping malls are closely related to the purchasing
power of customers.
Operations Center in
Israel
Real Estate
. Net gain from fair value adjustment of
investment properties of this segment increased from nil during the
period ended June 30, 2018 to ARS 892 million during the period
ended June 30, 2019. Though it was affected by a real revaluation
of the NIS against the Argentine peso of approximately 22%, the
variation was due to the stability of the real estate market in
Israel, which remained stable, with the changes in the fair value
mainly deriving from new projects.
Gain from disposal of farmlands 2019 vs 2018
The
total gain from disposal of farmlands, according to the income
statement, decreased by ARS 991 million (59.8%), from ARS 1,656
million in the fiscal year ended June 30, 2018 to ARS 665 million
in the fiscal year ended June 30, 2019.
Based
on the information by segment (taking into account all our joint
ventures and inter-segment eliminations), the total gain from
disposal of farmlands decreased by ARS 991 million (59.8%), from
ARS 1,656 million in the fiscal year ended June 30, 2018 to ARS 665
million in the fiscal year ended June 30, 2019.
Fiscal year ended June 30, 2019
●
In June 2019, the
Group, through its subsidiary BrasilAgro, entered into an agreement
for the sale of 3,124 hectares of the Jatobá land. The sales
price was 285 soybean bags per hectare or ARS 776 million. The
buyer made a down payment of ARS 83 million and will complete
payment of the first installment (ARS 83 million) by July 31, 2019.
The balance, i.e. 563,844 soybean bags, will be paid in six annual
installments. Delivery of possession and the gain of the
transaction will be recognized on June 30, 2020, amounting to ARS
573 million.
●
On November 21,
2018, the Group, through its subsidiary BrasilAgro, entered into an
agreement for the sale of 103 hectares of the Alto Taquarí
land. The sales price was 1,100 soybean bags per arable hectare
equivalent to ARS 114 million. The buyer made a down payment of
22,656 soybean bags equivalent to ARS 17 million; the balance will
be paid in eight semi-annual installments. The Group has recognized
a gain of ARS 91 million as a result of this transaction in this
fiscal year.
Fiscal year ended June 30, 2018
●
On June 29, 2018,
Cresud signed a deed with a non-related third party for the sale of
a fraction of 10,000 hectares of livestock activity of "La Suiza".
The total amount of the transaction was set at USD 10 million, of
which USD 3 million have been already paid. The remaining balance
of USD 7 million, guaranteed by a mortgage on the property, will be
collected in 10 installments of the same amount ending on June
2023, which will accrue an annual interest of 4.5% on the remaining
balances. The gain of the transaction amounts approximately to ARS
380 million.
●
On July 20, 2017,
the Company executed a purchase-sale agreement for all of “La
Esmeralda” establishment consisting of 9,352 hectares devoted
to agricultural and cattle raising activities in the 9 de Julio
district, Province of Santa Fe, Argentina. On June 25, 2018, the
Company has made effective with the sign of the deed and delivery
of the property, the sale of "La Esmeralda" farm. The amount of the
transaction was set at USD 19 million, of which USD 7 million have
been already paid. The balance, guaranteed with a mortgage on the
property, will be collected in 4 installments of the same amount
ending in April 2022, which will accrue an annual interest of 4% on
the remaining balances. The gain from the sale amounts
approximately to ARS 686 million.
227
●
On May 3, 2018, the
Company through its subsidiary BrasilAgro, has entered into a
purchase-sale agreement for the partial sale of 956 hectares (660
arable hectares) of Araucaria Farm, located in Mineiros, Brazil,
for an amount of 1,208 soybean bags per arable hectare or Rs.66.2
million (Rs./ha. 93,356). The Group has recognized gains of ARS 590
million as result of this transaction.
General and administrative expenses 2019 vs 2018
Total
general and administrative expenses, according to the income
statement, decreased by ARS 1,276 million (11.7%), from ARS 10,876
million in the fiscal year ended June 30, 2018 to ARS 12,152
million in the fiscal year ended June 30, 2019. This was mainly due
to a ARS 135 million increase in the Agricultural Business, from
ARS 1,379 million in the fiscal year ended June 30, 2018 to ARS
1,514 million in the fiscal year ended June 30, 2019, and a ARS
1,141 million increase in the Urban Properties and Investment
Business. Within the Urban Properties and Investment Business, the
variation relates to an increase in the Operations Center in Israel
of ARS 798 million offset by a decrease in the Operations Center in
Argentina of ARS 343 million.
General
and administrative expenses from our joint ventures decreased by
ARS 23 million (57.5%), from ARS 40 million in the fiscal year
ended June 30, 2018 to ARS 17 million in the fiscal year ended June
30, 2019.
There
are no results on account of expenses and promotion fund
corresponding to general and administrative expenses.
General
and administrative expenses from inter-segment transactions varied
by ARS 22 million (66.7%), from ARS 33 million in the fiscal year
ended June 30, 2018 to ARS 55 million in the fiscal year ended June
30, 2019.
Therefore,
according to information by segments (taking into account the
profit/ (loss) from operations from our joint ventures and
excluding those relating to expenses and collective promotion fund
or business inter-segment transactions), total general and
administrative expenses increased by ARS 1,275 million (11.6%),
from ARS 10,949 million in the fiscal year ended June 30, 2018 to
ARS 12,224 million in the fiscal year ended June 30, 2019. This was
mainly due to a ARS 144 million decrease in the Agricultural
Business and a ARS 1,131 million decrease in the Urban Properties
and Investment Business. Within the Urban Properties and Investment
Business, the variation relates to a decrease in the Operations
Center in Israel of ARS 798 million, offset by a decrease in the
Operations Center in Argentina of ARS 333 million.
Agricultural
Business
According
to information by segments (taking into account all our joint
ventures and inter-segment eliminations), total general and
administrative expenses increased by ARS 144 million (10.4%), from
ARS 1,381 million in the fiscal year ended June 30, 2018 to ARS
1,525 million in the fiscal year ended June 30, 2019. General and
administrative expenses from the Agricultural Business, measured as
a percentage of revenues from this segment, decreased from 9.0%
during the fiscal year ended June 30, 2018 to 8.0% during the
fiscal year ended June 30, 2019.
Agricultural Production.
General and administrative expenses
associated with our Agricultural Production segment increased by
9.2%, from ARS 878 million during fiscal year 2018 to ARS 959
million during fiscal year 2019, mainly due to: the ARS 18 million
increase in general and administrative expenses attributable to
crop operations; a ARS 38 million increase in expenses related to
sugarcane operations and a ARS 46 million increase in expenses
associated with the Agricultural Rental and Services business.
General and administrative expenses, measured as a percentage of
revenues from this segment, decreased from 9.7% during fiscal year
2018 to 8.6% during fiscal year 2019.
Land Transformation and Sales.
General and administrative
expenses associated with our Land Transformation and Sales segment
increased by 50.0%, from ARS 2 million during fiscal year 2018 to
ARS 3 million during fiscal year 2019.
Corporate.
General and administrative expenses associated
with our Corporate segment increased by 21.8%, from ARS 225 million
during fiscal year 2018 to ARS 274 million during fiscal year 2019,
mainly as a result of an increase in expenses due to inflation,
offset by extraordinary severance payments in fiscal year 2018 and
an increase in directors’ fees below the inflation
standard.
228
Others.
General and administrative expenses associated with
our Others segment increased by 4.7%, from ARS 276 million during
fiscal year 2018 to ARS 289 million during fiscal year 2019.
General and administrative expenses, measured as a percentage of
revenues from this segment, decreased slightly from 4.4% for fiscal
year 2018 to 3.6% for fiscal year 2019.
Urban Properties and Investment
Business
According
to information by segments (taking into account all our joint
ventures and inter-segment eliminations), total general and
administrative expenses increased by ARS 1,131 million (11.8%),
from ARS 9,586 million in the fiscal year ended June 30, 2018 (out
of which ARS 7,233 million derive from the Operations Center in
Israel and ARS 2,335 million from the Operations Center in
Argentina) to ARS 10,699 million in the fiscal year ended June 30,
2019 (out of which ARS 8,031 million derive from the Operations
Center in Israel and ARS 2,668 million from the Operations Center
in Argentina). Excluding general and administrative expenses from
the Operations Center in Israel, general and administrative
expenses, according to information by segments, decreased by 14.3%.
In addition, total general and administrative expenses, measured as
a percentage of total revenues, according to information by
segments, decreased from 12.9% during the period ended June 30,
2018 to 12.1% during the period ended June 30, 2019, mainly
deriving from the Operations Center in Israel. Excluding the effect
from the Operations Center in Israel, total general and
administrative expenses, measured as a percentage of total
revenues, increased from 16.8% during the period ended June 30,
2018 to 17.7% during the period ended June 30, 2019.
Operations Center in
Argentina
Shopping Malls.
Administrative expenses of Shopping Malls
increased by 10.7%, from ARS 854 million during fiscal year 2018 to
ARS 945 million during fiscal year 2019, mainly as a result of: (i)
an increase in salaries, social security and other personnel
administrative expenses of ARS 131 million;(ii) an increase in
maintenance, repairs and services, traveling and transportation
expenses of ARS 27 million; partially offset by (iii) a decrease in
fees payable to directors of ARS 34 million; (iv) a decrease in
banking expenses of ARS 19 million; and(v) a decrease in fees and
compensation for services of ARS 12 million. General and
administrative expenses of the Shopping Malls segment, measured as
a percentage of revenues of this segment, increased from 8.8%
during the fiscal year ended June 30, 2018 to 11.1% during the
fiscal year ended June 30, 2019.
Offices.
General and administrative expenses of our Offices
segment decreased 4.6%, from ARS 216 million during the fiscal year
ended June 30, 2018 to ARS 206 million during the fiscal year ended
June 30, 2019, mainly as a result of: (i) a decrease of ARS 12
million in salaries, social security and other personnel expenses;
(ii) a decrease of ARS 7 million in fees and compensation for
services and (iii) a decrease of ARS 8 million in advertising and
other commercial expenses, partially offset by: (i) an increase of
ARS 21 million in fees payable to directors. General and
administrative expenses of the Offices segment, measured as a
percentage of revenues from this segment, decreased from 16.2%
during the fiscal year ended June 30, 2018 to 9.2% during the
fiscal year ended June 30, 2019.
Sales and Developments
. General and administrative expenses
associated with our Sales and Developments segment increased by
42.9%, from ARS 198 million during the fiscal year ended June 30,
2018 to ARS 283 million during the fiscal year ended June 30, 2019,
mainly as a result of an increase in salaries, social security and
other personnel expenses of ARS 70 million, among other items.
General and administrative expenses of the Sales and Developments
segment, measured as a percentage of revenues from this segment,
decreased from 66% during the fiscal year ended June 30, 2018 to
25.3% during the fiscal year ended June 30, 2019.
Hotels
. General and administrative expenses associated with
our Hotels segment increased by 1% from ARS 487 million during the
fiscal year ended June 30, 2018 to ARS 492 million during the
fiscal year ended June 30, 2019, mainly as a result of: (i) a ARS
32 million increase in fees and compensation for services, offset
by (ii) a ARS 17 million decrease in salaries, social security and
other personnel expenses and (iii) a ARS 7 million decrease in
taxes, fees and contributions. General and administrative expenses
of the Hotels segment measured as a percentage of revenues from
this segment decreased from 19.9% during the fiscal year ended June
30, 2018 to 16.7% during the fiscal year ended June 30,
2019.
229
International.
General and administrative expenses
associated with our International segment decreased by 6.8%, from
ARS 118 million during the fiscal year ended June 30, 2018 to ARS
110 million during the fiscal year ended June 30, 2019, mainly as a
result of: (i) a ARS 25 million increase in fees and compensation
for services; (ii) a ARS 10 million increasein salaries, social
security and other personnel expenses; (iii) a ARS 3 million
increase in maintenance, repairs and services and (iv) a ARS 3
million increase in amortization and depreciation, partially offset
by: (v) a lower tax expense, since Imadison taxes were paid in the
previous fiscal year.
Corporate.
General and administrative expenses associated
with our Corporate segment increased by 34.8%, from ARS 385 million
during the fiscal year ended June 30, 2018 to ARS 519 million
during the fiscal year ended June 30, 2019, mainly as a result of
an increase in fees payable to directors of ARS 174 million; offset
by a ARS 37 million decrease in fees and compensation for services,
among other items.
Others
. General and administrative expenses associated with
our Others segment increased by 46.8% from ARS 77 million during
the fiscal year ended June 30, 2018 to ARS 113 million during the
fiscal year ended June 30, 2019, mainly due to: (i) a ARS 15
million increase in administrative expenses; (ii) a ARS 7 million
increase in maintenance, repairs and services; (iii) a ARS 6
million increase in fees and compensation for services; and (iv) a
ARS 3 million increase in salaries, social security and other
personnel expenses, among other items.
Operations Center in
Israel
Real Estate.
General and administrative expenses associated
with the Real Estate segment increased from ARS 578 million during
the period ended June 30, 2018 to ARS 707 million during the period
ended June 30, 2019. This variation was mainly due to a real
revaluation of the NIS against the Argentine peso of approximately
22%. The general and administrative expenses associated with this
segment measured as a percentage of revenues went from 6.1% during
the period ended June 30, 2018 to 4.9% during the period ended June
30, 2019.
Telecommunications.
General and administrative expenses
associated with the Telecommunications segment increased from ARS
4,594 million during the period ended June 30, 2018 to ARS 4,779
million during the period ended June 30, 2019. This variation was
due to a real revaluation of the NIS against the Argentine peso of
approximately 22% offset by a reduction in personnel expenses due
to a downsizing of the company, which accompanied the fall in
revenues in a search for efficiency improvements. General and
administrative expenses associated with this segment measured as a
percentage of this segment’s revenues decreased from 9.4% in
fiscal year 2018 to 8.3% in fiscal year 2019.
Others.
General and administrative expenses associated with
the Others segment increased from ARS 1,207 million during the
period ended June 30, 2018 to ARS 1,487 million during the period
ended June 30, 2019. This variation was due to: (i) a real
revaluation of the NIS against the Argentine peso of approximately
22%, and (ii) an increase in the structure of Bartan and
Epsilon.
Corporate.
General and administrative expenses associated
with the Corporate segment increased from ARS 854 million during
the period ended June 30, 2018 to ARS 1,058 million during the
period ended June 30, 2019. This variation was due to a real
revaluation of the NIS against the Argentine peso of approximately
22%, offset by a decrease in the personnel and the structure
expenses of DIC and IDBD, also accompanied by a reduction in
Dolphin's legal fees.
Selling expenses 2019 vs 2018
Total
selling expenses, according to the income statement, increased by
ARS 487 million (3.6%), from ARS 13,489 million in the fiscal year
ended June 30, 2018 to ARS 13,976 million in the fiscal year ended
June 30, 2019. This was primarily due to a ARS 34 million decrease
in the Agricultural Business, from ARS 1,740 million in the fiscal
year ended June 30, 2018 to ARS 1,706 million in the fiscal year
ended June 30, 2019, and a ARS 521 million increase in the Urban
Properties and Investment Business. Within the Urban Properties and
Investment Business, the variation relates to an increase in the
Operations Center in Israel of ARS 553 million and an increase in
the Operations Center in Argentina of ARS 32 million.
Selling
expenses from our joint ventures decreased by ARS 9 million
(56.3%), from ARS 16 million in the fiscal year ended June 30, 2018
to ARS 7 million in the fiscal year ended June 30,
2019.
Selling
expenses generated by inter-segment transactions decreased ARS 2
million (15.4%), from ARS 13 million in the fiscal year ended June
30, 2018 to ARS 11 million in the fiscal year ended June 30,
2019.
230
Therefore,
according to information by segments (taking into account the
profit/ (loss) from operations from our joint ventures and without
considering those relating to expenses and collective promotion
fund or business inter-segment transactions), total selling
expenses increased by ARS 476 million (3.5%), from ARS 13,518
million in the fiscal year ended June 30, 2018 to ARS 13,994
million in the fiscal year ended June 30, 2019. This was mainly due
to a ARS 36 million decreased in the Agricultural Business and a
ARS 512 million increase in the Urban Properties and Investment
Business. Within the Urban Properties and Investment Business, the
variation relates to an increase in the Operations Center in Israel
of ARS 553 million, and a decrease in the Operations Center in
Argentina of ARS 41 million.
Agricultural
Business
According
to information by segments (taking into account all our joint
ventures and inter-segment eliminations), total selling expenses
decreased by ARS 36 million (2.1%), from ARS 1,753 million in the
fiscal year ended June 30, 2018 to ARS 1,717 million in the fiscal
year ended June 30, 2019. Selling expenses of the Agricultural
Business, measured as a percentage of revenues from this segment,
increased from 11.4% during the period ended June 30, 2018 to 9.0%
during the fiscal year ended June 30, 2019.
Agricultural Production.
Selling expenses from the
Agricultural Production segment decreased 22.4%, from ARS 1,322
million during fiscal year 2018 to ARS 1,026 million in fiscal year
2019, mainly as a result of a ARS 227 million decrease in selling
expenses for crops and ARS 20 million in selling expenses for
cattle. Selling expenses, measured as a percentage of revenues from
the Agricultural Production segment, decreased from 14.5 % during
fiscal year 2018 to 9.2% during fiscal year 2019.
Land Transformation and Sales
. Selling expenses from the
Land Transformation and Sales segment increased by ARS 1 million,
and no expenses were recorded in fiscal year 2018.
Others.
Selling expenses from the Others segment increased
60.1%, from ARS 431 million during fiscal year 2018 to ARS 690
million in fiscal year, 2019, as a consequence of a ARS 184 million
increase in selling expenses related to the agro-industrial
business and the ARS 75 million increase in commercial expenses
related to other segments. Selling expenses, measured as a
percentage of revenues from the Others segment, increased from 6.8%
during fiscal year 2018 to 8.7% during fiscal year
2019.
Urban Properties and Investment
Business
According
to information by segments (taking into account all our joint
ventures and inter-segment eliminations), total selling expenses
increased by ARS 512 million (4.4%), from ARS 11,765 million in the
fiscal year ended June 30, 2018 (out of which ARS 10,639 million
derive from the Operations Center in Israel and ARS 1,126 million
from the Operations Center in Argentina) to ARS 12,277 million in
the fiscal year ended June 30, 2019 (out of which ARS 11,192
million derive from the Operations Center in Israel and ARS 1,085
million from the Operations Center in Argentina). Without
considering selling expenses from the Operations Center in Israel,
selling expenses, according to information by segments, decreased
by 3.6%. In addition, total selling expenses, measured as a
percentage of total revenues, according to information by segments,
decreased from 15.9% during the period ended June 30, 2018 to 13.9%
during the period ended June 30, 2019, mainly from the Operations
Center in Israel. Excluding the effect from the Operations Center
in Israel, total selling expenses, measured as a percentage of
total revenues, decreased from 8.1% during the period ended June
30, 2018 to 7.2% during the period ended June 30,
2019.
Operations Center in
Argentina
Shopping Malls.
Selling expenses of the Shopping Malls
segment decreased by 12.7%, from ARS 607 million during fiscal year
2018 to ARS 530 million during fiscal year 2019, mainly as a result
of: (i) a decrease in advertising and other commercial expenses of
ARS 33 million; (ii) a decrease in the charge of taxes, fees and
contributions of ARS 31 million; and (iii) a decrease of ARS 17
million in doubtful accounts; partially offset by (iv) an increase
in salaries, social security and other personnel selling expenses
of ARS 3 million. Selling expenses of the Shopping Malls segment,
measured as a percentage of revenues from this segment, remained
constant at 6.2% during the fiscal years ended June 30, 2018 and
2019.
231
Offices.
Selling expenses associated with our Offices
segment decreased by 30.8% from ARS 143 million during the fiscal
year ended June 30, 2018 to ARS 99 million during the fiscal year
ended June 30, 2019. Such variation was mainly generated as a
result of a ARS 69 million decrease in the charge of doubtful
accounts, offset by: (i) a ARS 13 million increase in taxes, fees
and contributions and (ii) a ARS 11 million increase in advertising
and other commercial expenses. Selling expenses associated with the
Offices segment, measured as a percentage of revenues from this
segment, decreased from 10.7% during the fiscal year ended June 30,
2018 to 4.4% during the fiscal year ended June 30,
2019.
Sales and Developments.
Selling expenses associated with our
Sales and Developments segment increased by 105.2% from ARS 58
million during fiscal year ended June 30, 2018 to ARS 119 million
during the fiscal year ended June 30, 2019. Such variation was
mainly generated by a ARS 65 million increase in taxes, fees and
contributions. Selling expenses associated with the Sales and
Developments segment, measured as a percentage of revenues from
this segment, decreased from 19.3% during the fiscal year ended
June 30, 2018 to 10.6% during the fiscal year ended June 30,
2019.
Hotels.
Selling expenses associated with our Hotels segment
increased by 1.6% from ARS 311 million during the fiscal year ended
June 30, 2018 to ARS 316 million during the fiscal year ended June
30, 2019, mainly as a result of a ARS 26 million increase in taxes,
fees and contributions offset by; (i) a ARS 13 million decrease in
fees and compensation for services, and (ii) a ARS 11 million
decrease in salaries, social security and other personnel expenses.
Selling expenses associated with the Hotels segment, measured as a
percentage of revenues from this segment, decreased from 12.7%
during the fiscal year ended June 30, 2018 to 10.7% during the
fiscal year ended June 30, 2019.
International.
Selling expenses associated with the
International segment remained unchanged in both fiscal
years.
Corporate
. Selling expenses associated with the Corporate
segment remained unchanged in both fiscal years.
Others.
Selling expenses associated with our Others segment
increased 200% from ARS 7 million during the fiscal year ended June
30, 2018 to ARS 21 million during the fiscal year ended June 30,
2019, mainly due to: (i) a ARS 6 million increase in taxes, fees
and contributions; (ii) a ARS 3 million increase in advertising and
other commercial expenses; and (iii) a ARS 4 million increase in
doubtful accounts. Selling expenses associated with the Others
segment, measured as a percentage of revenues from this segment,
significantly decreased from 15.9% during the fiscal year ended
June 30, 2018 to 11.1% during the fiscal year ended June 30,
2019.
Operations Center in
Israel
Real Estate.
Selling expenses associated with the real
estate segment decreased from ARS 200 million during the period
ended June 30, 2018 to ARS 197 million during the period ended June
30, 2019. This variation was due to (i) a real revaluation of the
NIS against the Argentine Peso of approximately 22%. Selling
expenses associated with this segment measured as a percentage of
revenues decreased 2.1% during the period ended June 30, 2018 to
1.4% during the period ended June 30, 2019.
Telecommunication.
Selling expenses associated with the
Telecommunications segment increased from ARS 10,059 million during
the period ended June 30, 2018 to ARS 10,562 million during the
period ended June 30, 2019. This variation was due to a real
revaluation of the NIS against the Argentine peso of approximately
22%, offset by a decrease in advertising expenses on the mobile
phone line. Selling expenses associated with this segment measured
as a percentage of revenues decreased from 20.5% during the period
2018 to 18.4% during the period 2019.
Others.
Selling expenses associated with the Others segment
increased from ARS 380 million during the period ended June 30,
2018 to ARS 433 million during the year ended June 30, 2019. This
variation was due to a real revaluation of the NIS against the
Argentine peso of approximately 22%, offset by a decrease in the
marketing expenses of Bartan's new services.
232
Other operating results, net 2019 vs 2018
Total
other operating results, net, according to the income statement,
decreased by ARS 2,556 million (69.9%), from a gain of ARS 3,657
million in the fiscal year ended June 30, 2018 to a gain of ARS
1,101 million in the fiscal year ended June 30, 2019. This is
mainly due to a ARS 719 million increase in the Agricultural
Business, from a gain of ARS 1,548 million in the fiscal year ended
June 30, 2018 to a gain of ARS 829 million in the fiscal year ended
December June 30, 2019, and a ARS 1,837 million increase in the
Urban Properties and Investment Business. Within the Urban
Properties and Investment Business, the variation relates to an
increase in the Operations Center in Israel of ARS 1,394 million
offset by a decrease in the Operations Center in Argentina of ARS
443 million.
Other
operating results, net from our joint ventures increased by ARS 151
million (359.5%), from a gain of ARS 42 million in the fiscal year
ended June 30, 2018 to a gain of ARS 193 million in the fiscal year
ended June 30, 2019.
In
turn, total other operating results, net on account of expenses and
promotion fund increased by ARS 19 million (950.%), from a gain of
ARS 2 million in the fiscal year ended June 30, 2018 to a gain of
ARS 17 million in the fiscal year ended June 30, 2019.
Other
operating results, net generated by inter-segment transactions
decrease by ARS 7 million (175.0%), from ARS 4 million in the
fiscal year ended June 30, 2018 to ARS 11 million in the fiscal
year ended June 30, 2019.
Therefore,
according to information by segments (taking into account the
profit/ (loss) from operations from our joint ventures and without
considering those relating to expenses and collective promotion
fund or business inter-segment transactions), total other operating
results, net decreased by ARS 2,719 million (75.1%), from ARS 3,621
million in the fiscal year ended June 30, 2018 to ARS 902 million
in the fiscal year ended June 30, 2019. This was mainly due to a
ARS 722 million decrease in the Agricultural Business and a ARS
1,997 million decrease in the Urban Properties and Investment
Business. Within the Urban Properties and Investment Business, the
variation relates to a decrease in the Operations Center in Israel
of ARS 1,394 million, offset by a decrease in the Operations Center
in Argentina of ARS 603 million.
Agricultural
Business
1.
According to
information by segments (taking into account all our joint ventures
and inter-segment eliminations), total other operating results, net
decreased by ARS 722 million (46.9%), from ARS 1,541 million in the
fiscal year ended June 30, 2018 to ARS 819 million in the fiscal
year ended June 30, 2019. Other operating results, net from the
Agricultural Business, measured as a percentage of revenues from
this segment, increased from 10.0% during the period ended June 30,
2018 to 4.3% during the period ended June 30, 2019.
Agricultural Production.
Other operating results, net
associated with our Agricultural Production segment increased by
ARS 448 million, from a gain of ARS 20 million during fiscal year
2018 to a gain of ARS 428 million during fiscal year 2019, mainly
as a result of Brasilagro’s and Cresud’s commodity
derivatives.
Land Transformation and Sales.
Other operating results, net
from this segment decreased by ARS 1,213 million from a gain of ARS
1,457 million during fiscal year 2018 to a gain of ARS 244 million
during fiscal year 2019.
Others.
Other Operating results, net associated with the
Others segment rose ARS 43 million, from a gain of ARS 104 million
during fiscal year 2018 to a gain of ARS 147 million during fiscal
year 2019, primarily in connection with the operations of our
subsidiary FYO.
233
Urban Properties and Investment
Business
According
to information by segments (taking into account all our joint
ventures and inter-segment eliminations), total other operating
results, net decreased by ARS 1,997 million (96.0%), from ARS 2,080
million in the fiscal year ended June 30, 2018 (out of which ARS
2,136 million derive from the Operations Center in Israel and ARS
56 million from the Operations Center in Argentina) to ARS 83
million in the fiscal year ended June 30, 2019 (out of which ARS
742 million derive from the Operations Center in Israel and ARS 659
million from the Operations Center in Argentina). Excluding Other
operating results, net from the Operations Center in Israel, Other
operating results, net, according to information by segments,
decreased by 1,076.8%. In addition, total other operating results,
net, measured as a percentage of total revenues, according to
information by segments, decreased from 2.8% during the period
ended June 30, 2018 to 0.1% during the period ended June 30, 2019,
mainly from the Operations Center in Israel. Excluding the effect
from the Operations Center in Israel, total other operating
results, net, measured as a percentage of total revenues, increased
from 0.4% during the period ended June 30, 2018 to 4.4% during the
period ended June 30, 2019.
Operations Center in
Argentina
Shopping Malls.
Other operating results, net from the
Shopping Malls segment decreased by 3.8%, from a net loss of ARS
105 million during fiscal year 2018 to a net loss of ARS 109
million during fiscal year 2019, mainly as a result of: (i) an
increase in charity charges of ARS 43 millions; partially offset
by: (ii) a recovery of litigation costs of ARS 23 million and (iii)
an increase in the interest for late payment that is charged to our
customers of ARS 32 million. Other operating results, net from this
segment as a percentage of the revenues from this segment slightly
increased from 1.1% negative during the year ended June 30, 2018 to
1.3% negative during the year ended June 30, 2019.
Offices.
Other operating results, net, associated with our
Offices segment increased by 66.7%, from a net loss of ARS 24
million during the year ended June 30, 2018 to a net loss of ARS 40
million during the year ended June 30, 2019, mainly as a
consequence of an increase in donations, among other items. Other
operating results, net, of this segment, as a percentage of this
segment’s revenues, maintained at 1.8% negative during the
year ended June 30, 2019 and 2018.
Sales and developments.
Other operating results, net,
associated with our Sales and Developments segment decreased by
307.2%, from a net profit of ARS 138 million during the year ended
June 30, 2018 to a net loss of ARS 286 million during the year
ended June 30, 2019, mainly as a result of a provision set up for
the plot of land owned by Puerto Retiro S.A., thus generating a
negative result of ARS 177 million, compared to the previous year
in which a positive result was obtained due to the sale of floors
of Intercontinental Building by IRSA Propiedades Comerciales. Other
operating results, net, of this segment, as a percentage of this
segment’s revenues, decreased from 46% positive during the
year ended June 30, 2018 to 25.6% negative during the year ended
June 30, 2019.
Hotels.
Other operating results, net, associated with the
Hotels segment increased 385%, from a net loss of ARS 40 million
during the year ended June 30, 2018 to a net profit of ARS 114
million during the year ended June 30, 2019, mainly due to an
insurance recovery associated with a boiler-related loss. Other
operating results, net, of this segment, as a percentage of this
segment’s revenues increased from 1.6% negative during the
year ended June 30, 2018 to 3.9% positive during the year ended
June 30, 2019.
International.
Other operating results, net, of this segment
increased by 58.6%, from a net loss of ARS 58 million during the
year ended June 30, 2018 to a net loss of ARS 24 million during the
year ended June 30, 2019, mainly due to lower donations and tax
charges.
Corporate.
Other operating results, net, associated with the
Corporate segment did not show variations during the reported
fiscal years.
Others.
Other operating results, net, associated with the
Others segment decreased by 1,051.5%, from a net profit of ARS 33
million during the year ended June 30, 2018 to a net loss of
PsS.314 million during the year ended June 30, 2019, mainly due to
a negative result generated by the sale of TARS hop S.A. and lower
results from Entertainment Holdings S.A. Other net operating
results, of this segment, as a percentage of this segment’s
revenues increased from 75% positive during the year ended June 30,
2018 to 165.3% negative during the year ended June 30,
2019.
234
Operations Center in
Israel
Real Estate.
Other operating results, net associated with
the Real Estate segment went from a profit of ARS 256 million
during the period ended June 30, 2018 to ARS 0 million during the
period ended June 30, 2019. This variation was due to the sale of
fixed assets during this period.
Telecommunications.
Other operating results, net associated
with the Telecommunications segment went from a profit of ARS 772
million during the period ended June 30, 2018 to a net profit of
ARS 397 million during the period ended June 30, 2019, due to the
sale of the subsidiary Rimon during the period ended June 30,
2018.
Others.
Other operating results, net associated with the
Others segment went from a loss of ARS 33 million during the period
ended June 30, 2018 to a net profit of ARS 345 million during the
period ended June 30, 2019. This variation was due to the result
from the sale of Elron’s subsidiaries, During the period
ended June 30, 2018, Cloudyn was sold, and during this fiscal year,
Cybersecdo was sold, accompanied by a decrease in Bartan’s
research and development expenses.
Corporate.
Other operating results, net associated with the
Corporate segment went from a profit of ARS 1,141 million during
the period ended June 30, 2018 to ARS 0 million during the period
ended June 30, 2019. This variation was due to the favorable
outcome of the trial won by Ma’ariv during the period ended
June 30, 2018.
Management fees 2019 vs 2018
We
entered into a management agreement with Consultores Asset
Management S.A., which provides for payment of fees equivalent to
10% of our profits for advisory services in relation to any matters
related to business and investments, such as farming, real estate,
finance, hotel, etc. Management fees amounted to ARS 1,456 million
during fiscal year 2018. During fiscal year 2019 no results were
recognized on this account.
Profit/ (loss) from operations 2019 vs 2018
As a
result of the factors described above, total profit / (loss) from
operations, according to the income statement, decreased by ARS
56,346 million (176.9%), from a profit of ARS 31,875 million in the
fiscal year ended June 30, 2018 to a loss of ARS 24,489 million in
the fiscal year ended June 30, 2019. Such variation was mainly due
to a ARS 44 million decrease in the Agricultural Business, from a
profit of ARS 3,185 million in the fiscal year ended June 30, 2018
to a profit of ARS 3,141 million in the fiscal year ended June 30,
2019, and a ARS 56,302 million decrease in the Urban Properties and
Investment Business. Within the Urban Properties and Investment
Business, the variation relates to an increase in the Operations
Center in Israel of ARS 1,136 million offset by a decrease in the
Operations Center in Argentina of ARS 57,438 million.
Profit
/ (loss) from operations from our joint ventures increased by ARS
2,024 million (203.6%), from a loss of ARS 994 million in the
fiscal year ended June 30, 2018 to a profit of ARS 1,030 million in
the fiscal year ended June 30, 2019.
In
turn, total profit / (loss) from operations on account of expenses
and promotion fund increased by ARS 1,384 million (91.3%), from a
loss of ARS 1,516 million in the fiscal year ended June 30, 2018 to
a gain of ARS 132 million in the fiscal year ended June 30,
2019.
Profit
/ (loss) from operations generated by inter-segment transactions
varied by ARS 6 million (600.0%), from ARS 1 million in the fiscal
year ended June 30, 2018 to ARS 5 million in the fiscal year ended
June 30, 2019.
Therefore,
according to information by segments (taking into account the
profit/ (loss) from operations from our joint ventures and without
considering those relating to expenses and collective promotion
fund or business inter-segment transactions), total profit/ (loss)
from operations decreased by ARS 59,748 million (173.9%), from ARS
34,366 million in the fiscal year ended June 30, 2018 to ARS 25,382
million in the fiscal year ended June 30, 2019. This was mainly due
to a ARS 1,508 million decrease in the Agricultural Business and a
ARS 58,240 million decrease in the Urban Properties and Investment
Business. Within the Urban Properties and Investment Business, the
variation relates to an increase in the Operations Center in Israel
of ARS 1,136 million, offset by a decrease in the Operations Center
in Argentina of ARS 59,376 million.
235
Agricultural
Business
According
to information by segments (taking into account all our joint
ventures and inter-segment eliminations), total profit / (loss)
from operations decreased by ARS 1,508 million (32.5%), from ARS
4,638 million in the fiscal year ended June 30, 2018 to ARS 3,130
million in the fiscal year ended June 30, 2019. The Profit / (loss)
from operations of the Agricultural Business, measured as a
percentage of revenues from this segment, decreased from 30.1%
during the period ended June 30, 2018 to 16.5% during the period
ended June 30, 2019.
Agricultural Production.
Profit / (loss) from operations of
this segment increased by ARS 504 million, from a profit of ARS
1,559 million in fiscal year 2018 to a profit of ARS 2,063 million
in fiscal year 2019.
Land Transformation and Sales.
Profit / (loss) from
operations of this segment decreased by ARS 2,410 million, from a
profit of ARS 3,291 million in fiscal year 2018 to a loss of ARS
881 million in fiscal year 2019.
Corporate.
Profit / (loss) from operations of this segment
decreased by ARS 49 million from a loss of ARS 225million in fiscal
year 2018 to a loss of ARS 274 million in fiscal year
2019.
Others.
Profit / (loss) from operations of this segment
increased by ARS 447 million from a profit of ARS 13 million in
fiscal year 2018 to a profit of ARS 460 million in fiscal year
2019.
Urban Properties and Investment
Business
According
to information by segments (taking into account all our joint
ventures and inter-segment eliminations), total profit / (loss)
from operations decreased by ARS 58,240 million (195.9%), from ARS
29,728 million in the fiscal year ended June 30, 2018 (out of which
ARS 2,386 million derive from the Operations Center in Israel and
ARS 27,342 million from the Operations Center in Argentina) to ARS
28,512 million in the fiscal year ended June 30, 2019 (out of which
ARS 3,522 million derive from the Operations Center in Israel and
ARS 32,034 million from the Operations Center in Argentina).
Excluding the profit / (loss) from operations of the Operations
Center in Israel, profit / (loss) from operations, according to
information by segments, decreased by 217.2%. In addition, total
profit / (loss) from operations, measured as a percentage of total
revenues, according to information by segments, decreased from
40.2% during the period ended June 30, 2018 to 32.2% during the
period ended June 30, 2019, mainly as a result of the Operations
Center in Israel. Excluding the effect from the Operations Center
in Israel, total profit / (loss) from operations, measured as a
percentage of total revenues, increased from 197.1% during the
period ended June 30, 2018 to 212.8% during the period ended June
30, 2019.
Operations Center in
Argentina
Shopping Malls.
Operating income from the Shopping Malls
segment decreased, from a profit of ARS 13,621 million during
fiscal year 2018, to a loss of ARS 34,401 million during fiscal
year 2019.
Offices.
Profit from operations associated with our Offices
segment, decreased by 62.7%, from a profit of ARS 6,668 million
during the year ended June 30, 2018 to a profit of ARS 2,488
million during the year ended June 30, 2019. The variation is
mainly due to a decrease of ARS 5,096 million from the net gain
from fair value adjustment of investment properties. Profit from
operations of the Offices segment as a percentage of this
segment’s revenues decreased from 500.6% during the year
ended June 30, 2018 to 111.1% during the year ended June 30,
2019.
Sales and developments.
Profit from operations associated
with our Sales and Developments segment decreased by 91.5%, from an
ARS 7,371 million profit during the year ended June 30, 2018 to an
ARS 630 million profit during the year ended June 30, 2019. This
decrease is mainly due to a decrease of ARS 6,612 million in the
net gain from fair value adjustment of investment properties.
Profit from operations of the Sales and Developments segment as a
percentage of this segment’s revenues decreased from 2,457%
during the year ended June 30, 2018 to 56.4% during the year ended
June 30, 2019.
236
Hotels.
Profit from operations associated with the Hotels
segment showed an increase of 1,148.4%, from a loss of ARS 64
million during the year ended June 30, 2018 to a profit of ARS 671
million during the year ended June 30, 2019. This increase is
mainly due to the increase in the average rate per room of our
hotel portfolio (measured in pesos), thus generating an increase in
revenues, and to the insurance recovery associated with the
boiler-related loss in Intercontinental Hotel. Profit from
operations of the Hotels segment as a percentage of this
segment’s revenues increased from 2.6% during the year ended
June 30, 2018 to 22.7% during the year ended June 30,
2019.
International.
Profit from operations associated with our
International segment changed by 31.8%, from a loss of ARS 176
million during the year ended June 30, 2018 to a loss of ARS 120
million during the year ended June 30, 2019. This variation is due
to lower donations and tax charges.
Corporate
. Profit from operations associated with our
Corporate segment decreased by 34.8%, from a loss of ARS 385
million during the year ended June 30, 2018 to a loss of ARS 519
million during the year ended June 30, 2019, mainly affected by
general and administrative expenses.
Others.
Profit from operations associated with our Others
segment decreased, from a net profit of ARS 307 million during the
year ended June 30, 2018 to a net loss of ARS 783 million during
the year ended June 30, 2019. This variation is mainly due to an
ARS 736 million decrease in the net gain from fair value adjustment
of investment properties. Profit from operations of the Others
segment as a percentage of this segment’s revenues decreased
from 697.7% profit during the year ended June 30, 2018 to 412.1%
loss during the year ended June 30, 2019.
Operations Center in
Israel
Real Estate.
Profit from operations of the Real Estate
segment increased from ARS 3,018 million during the year ended June
30, 2018 to ARS 5,259 million during the year ended June 30, 2019.
This variation was due to (i) a real revaluation of the NIS against
the Argentine peso of approximately 22% and (ii) an increase in
costs and a decrease in the net gain from fair value adjustment of
investment properties.
Telecommunications
. Profit from operations of the
Telecommunications segment went from a net loss of ARS 4 million
during the period ended June 30, 2018 to a net profit of ARS 138
million during the period ended June 30, 2019. This variation was
due to (i) a real revaluation of the NIS against to the Argentine
peso of approximately 22%, (ii) a decrease in operating expenses,
due to increased efficiency measures implemented by Cellcom, and
(iii) the growth in the fixed line and television
segment.
Others.
Profit from operations of the Others segment went
from a net loss of ARS 915 million during the period ended June 30,
2018 to a net loss of ARS 817 million during the period ended June
30, 2019. This variation was due to (i) a real revaluation of the
NIS against the Argentine peso of approximately 22%, offset by (ii)
an increase in the other operating income of Elron and
Bartan.
Corporate
. Profit from operations of the Corporate segment
went from a net profit of ARS 287 million during the period ended
June 30, 2018 to a net loss of ARS 1,058 million during the year
ended June 30, 2019. This variation was due to (i) a real
revaluation of the NIS against the Argentine peso of approximately
22%, and (ii) the positive outcome of Ma’ariv’s trial
during the previous period.
Share of profit/ (loss) of associates and joint ventures 2019 vs
2018
The
total share of profit/(loss) of associates and joints ventures,
according to the income statement, decreased by ARS 3,876 million
(112.3%), from a loss of ARS 3,452 million in the fiscal year ended
June 30, 2018 to a loss of ARS 7,328 million in the fiscal year
ended June 30, 2019. This was mainly due to a ARS 240 million
decrease in the Agricultural Business, from a gain of ARS 270
million in the fiscal year ended June 30, 2018 to a profit of ARS
30 million in the fiscal year ended June 30, 2019, and a ARS 3,636
million decrease in the Urban Properties and Investment Business.
Within the Urban Properties and Investment Business, the variation
relates to an increase in the Operations Center in Israel of ARS
272 million, offset by a decrease in the Operations Center in
Argentina of ARS 3,908 million.
Our
share of profit/(loss) of associates and joints ventures, primarily
from Cresca (Agricultural Business), Nuevo Puerto Santa Fe S.A.
(Shopping Malls segment), Quality Invest S.A. (Offices segment)
and; Cyrsa S.A., Puerto Retiro S.A. and Baicom Networks S.A. (Sales
and developments segment), decreased by ARS 2,166 million (186.7%),
from a profit of ARS 1,160 million in the fiscal year ended June
30, 2018 to a loss of ARS 1,006 million in the fiscal year ended
June 30, 2019.
237
There are no
results on account of expenses and promotion fund corresponding to
share of profit/(loss) of associates and joints
ventures.
Therefore,
according to information by segments (taking into account the
profit/ (loss) from operations from our joint ventures and without
considering those relating to expenses and collective promotion
fund or business inter-segment transactions), the total share of
profit/(loss) of associates and joints ventures decreased by ARS
1,710 million (37.1%), from ARS 4,612 million in the fiscal year
ended June 30, 2018 to ARS 6,322 million in the fiscal year ended
June 30, 2019. This was mainly due to a ARS 26 million decrease in
the Agricultural Business and a ARS 1,684 million decrease in the
Urban Properties and Investment Business. Within the Urban
Properties and Investment Business, the variation relates to an
increase in the Operations Center in Israel of ARS 272 million,
offset by a decrease in the Operations Center in Argentina of ARS
1,956 million.
Agricultural
Business
According
to information by segments (taking into account all our joint
ventures and inter-segment eliminations), the total share of
profit/(loss) of associates and joints ventures decreased by ARS 26
million (70.3%), from ARS 37 million in the fiscal year ended June
30, 2018 to ARS 11 million in the fiscal year ended June 30,
2019.
Agricultural Production.
The profit from our interests in
associates in this segment rose by 46.2% from a profit of ARS 39
million in fiscal year 2018 to a profit of ARS 57million in fiscal
year 2019, due to the profit from the investment in Agro-Uranga
S.A.
Others.
The loss from our interests in associates in this
segment rose by 2,200.0% from a loss of ARS 2 million in fiscal
year 2018 to a loss of ARS 46 million in fiscal year 2019, due to
the profit/(loss) from the investment in Agrofy
Global.
Urban
Properties and Investment Business
According
to information by segments (taking into account all our joint
ventures and inter-segment eliminations), the total share of
profit/(loss) of associates and joints ventures decreased by ARS
1,684 million (36.2%), from ARS 4,649 million in the fiscal year
ended June 30, 2018 (out of which ARS 422 million derive from the
Operations Center in Israel and ARS 4,227 million from the
Operations Center in Argentina) to ARS 6,333 million in the fiscal
year ended June 30, 2019 (out of which ARS 150 million derive from
the Operations Center in Israel and ARS 6,183 million from the
Operations Center in Argentina). Excluding the share of
profit/(loss) of associates and joints ventures from the Operations
Center in Israel, the share of profit/(loss) of associates and
joints ventures, according to information by segments, decreased by
46.3%.
Operations Center in
Argentina
Shopping Malls
. In the information by segments, the share of
profit / (loss) of associates and joint ventures Nuevo Puerto Santa
Fe S.A. is exposed consolidated, line by line in this
segment.
Offices.
In the information by segments, the share of profit
/ (loss) of associates and joint ventures Quality S.A. is exposed
consolidated, line by line in this segment.
Sales and Developments
. The share of profit / (loss) of
associates and joint ventures Cyrsa S.A., Puerto Retiro S.A. and
Baicom Networks S.A. are exposed consolidated line by line. The
result from our participation in our associate Manibil S.A., which
is disclosed in this line, decreased by ARS 41 million, from a
profit of ARS 4 million during the fiscal year ended June 30, 2018
to a loss of ARS 37 million during the fiscal year ended June 30,
2018.
Hotels
. This segment does not show results from the net
share of profit / (loss) of associates and joint
ventures.
International.
The net share of profit / (loss) of
associates of this segment increased by 16.9%, from a loss of ARS
4,425 million during the fiscal year ended June 30, 2018 to a loss
of ARS 3,679 million during the fiscal year ended June 30, 2019,
mainly generated by a negative result from our investment in New
Lipstick LLC of ARS 3,722 million.
238
Others.
The net share of profit / (loss) of associates from
the Others segment decreased by ARS 1,371.6%, from a profit of ARS
194 million during the fiscal year ended June 30, 2018 to a loss of
ARS 2,467 million during the fiscal year ended June 30, 2019,
mainly as a result of a loss from our investments in Banco
Hipotecario S.A. in the amount of ARS 2,416 million.
Operations Center in
Israel
Real Estate.
The share of profit / (loss) of associates of
this segment decreased from a profit of ARS 158 million during the
period ended June 30, 2018 to ARS 37 million during the period
ended June 30, 2019 due to (i) a real revaluation of the NIS
against the Argentine peso of approximately 22% and (ii) lower
results of Mehadrin and PBEL.
Others.
The share of profit / (loss) of associates of this
segment went from a loss of ARS 580 million during the period ended
June 30, 2018 to a loss of ARS 904 million during the period ended
June 30, 2019, due to (i) a real revaluation of the NIS against the
Argentine peso of approximately 22% and (ii) a lower result from
investments of Epsilon.
Financial results, net 2019 vs 2018
The
Group financial results, net increased by ARS 32,118 million, from
a loss of ARS 47,390 million for fiscal year 2018 to a loss of ARS
15,272 million for fiscal year 2019. This was mainly due to: (i) a
positive variation of the net exchange difference that went from a
loss of ARS 19,587 million during the fiscal year ended June 30,
2018 to a profit of ARS 2,633 million during the fiscal year ended
June 30, 2019. This variation lies in the fact that in fiscal year
2019 inflation was higher than devaluation (47% vs. 56%,
respectively); (ii) a loss of ARS 5,908 in Israel pertaining to the
debt exchange in fiscal year 2018; partially offset by an increase
in net interest expense that went from a loss of ARS 19,564 million
during the fiscal year ended June 30, 2018 to a loss of ARS 21,893
million during the fiscal year ended June 30, 2019.
Income tax 2019 vs 2018
The
Company applies the deferred tax method to calculate the income tax
for the reported periods, thus recognizing temporary differences as
tax assets and liabilities. The income tax charge for the year went
from a profit of ARS 9,964 million during fiscal year 2018, to a
loss of ARS 780 million during fiscal year 2019, out of which a
loss of ARS 5,001 million derives from the Agricultural Business, a
profit of ARS 4,471 million derives from the Operation Center in
Argentina and a loss of ARS 250 million derives from the Operation
Center in Israel.
Profit for the period ended December 31, 2019 vs 2018
As a
result of the factors described above, our net profit for the year,
including the effect of discontinued operations, decreased by ARS
69,605 million from a net profit of ARS 27,420 million in fiscal
year 2018 to a net loss of ARS 40,729 million in fiscal year 2019,
out of which a loss of ARS 2,212 million derives from the
Agricultural Business, a loss of ARS 36,824 million derives from
the Operation Center in Argentina and a loss of ARS 1,693 million
derives from the Operation Center in Israel.
239
B. LIQUIDITY AND CAPITAL RESOURCES
Liquidity
Our
main sources of liquidity have historically been:
●
cash generated by
operations;
●
cash generated by
our issuance of common shares and non-convertible
notes;
●
ash proceeds from
borrowings (including cash from bank loans and overdrafts) and
financing arrangements (including cash from the exercise of
warrants); and
●
cash proceeds from
sale of investment and trading properties and property, plant and
equipment (including cash proceeds from the sale of
farmlands).
Our
main cash requirements or uses (other than in connection with our
operating activities) have historically been:
●
acquisition of
subsidiaries and non-controlling interest in
subsidiaries;
●
acquisition of
interest in associates and joint ventures;
●
capital
contributions to associates and joint ventures;
●
capital
expenditures in property, plant and equipment (including
acquisitions of farmlands) and investment and trading
properties;
●
payments of
short-term and long-term debt and payment of the related interest
expense; and
●
payment of
dividends.
Our
liquidity and capital resources include our cash and cash
equivalents, proceeds from operating activities, sales of
investment properties, trading properties and farms, obtained bank
borrowings, long-term debts incurred and capital
funding.
Cash Flows
The
table below shows our cash flow for the fiscal years ended June 30,
2020, 2019 and 2018:
|
|
For the fiscal year ended June 30,
|
||
|
|
2020
|
2019
|
2018
|
|
|
(in
million of ARS)
|
||
|
Net
cash generated from operating activities
|
35,734
|
25,546
|
24,150
|
|
Net
cash generated from / (used in) investing activities
|
40,311
|
10,552
|
(31,553
)
|
|
Net
cash (used in) / generated from financing activities
|
(72,624
)
|
(25,735
)
|
(4,009
)
|
|
Net increase / (decrease) in cash and cash equivalents
|
3,421
|
10,363
|
(11,412
)
|
As of
June 30, 2020, we had positive working capital of ARS 58,162
million (calculated as current assets less current liabilities as
of such date).
As of
June 30, 2020, in our Agricultural Business, we had negative
working capital of ARS 4,170 million (calculated as current assets
less current liabilities as of such date).
As of
June 30, 2020, in our Urban Properties and Investments Business,
our Operation Center in Argentina had negative working capital of
ARS 24,360 million and our Operations Center in Israel had positive
working capital of ARS 86,692 million, resulting in a consolidated
positive working capital of ARS 58,162 million (calculated as
current assets less current liabilities as of such
date).
At the
same date, our Agricultural Business had cash and cash equivalents
of ARS 10,567 million while our Operations Center in Argentina had
cash and cash equivalents of ARS 7,227 million while our Operations
Center in Israel had cash and cash equivalents of ARS 83,132
million, totaling consolidated cash and cash equivalents for ARS
100,926 million.
240
IDBD and DIC have certain financial restrictions and agreements in
relation to their financial debt, including their debentures and
loans with banks and financial institutions. Regarding IDBD’s
financial position, its cash flow and its ability to meet its
financial debt commitments, the following should be
considered:
IDBD’s
financial condition as of June 30, 2020 reflects negative equity,
negative operating cash flows, and a credit rating downgrade.
IDBD’s cash flow to meet its obligations, including
short-term ones, depends on the financial support of its
controlling shareholder (Dolphin Netherlands BV) and on the sale of
assets, the dates of which are not under the control of IDBD. As a
result of the above, IDBD has been holding negotiations with its
creditors in order to restructure its financial debt on more
favorable terms.
As of
June 30, 2020, the total balance of (i) the IDBD Series 9 notes was
NIS 901 million (the “Series 9”), (ii) the IDBD Series
14 notes was NIS 889 million guaranteed. for 70% of the shares of
DIC (the “Series 14”), (iii) the Series 15 negotiable
obligations of IDBD were NIS 238 million guaranteed by 5% of the
shares of Clal (the “Series 15”).
In the
absence of agreement, on September 17, 2020, the Series 9 Trustee
filed a petition with the District Court in Tel-Aviv-Yafo (the
“Tribunal”) regarding the granting of an order to open
procedures (the “Petition”) pursuant to section 18 of
the Israel Insolvency and Economic Recovery Law, 5778-2018 (the
“Law”); In order for the appointment of a trustee for
IDBD to be instructed in accordance with said regulations, which
would affect the powers of the decision-making bodies of IDBD in
accordance with section 43 of the Law, all other powers that are
required are granted to the trustee for the performance of its
function in accordance with the provisions of the Law that include
without limitation the broadest powers in making directive and
managerial decisions.
On
September 21, 2020, Series 14 holders approved that the full
balance of Series 14 be paid immediately.
On
September 22, 2020, IDBD and Dolphin Netherlands B.V. They
presented their initial response to the Petition before the Court,
arguing that the best thing for IDBD and all its creditors is to
exhaust the negotiations with the controlling shareholder and its
creditors during a limited period in order to try to maximize the
value of their assets, in benefit from creditors and the company,
and avoid costs and other adverse effects.
In
addition, the response of the Series 15 Trustee and the Series 14
Trustee were presented, who requested the execution of liens and
the appointment of a custodian, as well as the urgent holding of a
hearing that was set for September 24, 2020.
On
September 25, 2020, the Court decreed the insolvency and
liquidation of IDBD and appointed a trustee for its shares and a
custodian over the shares of DIC and Clal.
To
date, we are jointly analyzing with our local and international
advisers the judicial decision of September 25 of this year and its
alternatives.
The
assets and liabilities from the Israel Operations Center have been
consolidated line by line in our Audited Consolidated Financial
Statements, totaling net assets of ARS 2,006 million (amount
attributable to the controlling shareholder) as of June 30, 2020.
In addition, our investment in the Israel Operations Center
includes a currency translation adjustment reserve totaling ARS
1,537 million at that date.
The
commitments and other restrictions resulting from the indebtedness
of IDBD and DIC have no effect on IRSA since said indebtedness has
no recourse against IRSA, nor has IRSA guaranteed it with its
assets. Therefore, IRSA’s financial risk with respect to the
Israeli operations center is limited to the values indicated in the
preceding paragraph.
On
September 13, 2020, IDBD filed a claim against Dolphin Netherlands
B.V.and against IRSA in which it sought to require them, together
and separately, to pay it a total of NIS 70 million plus linkage
differences and interest in accordance with the law. In addition,
in tandem with the submission of the lawsuit, IDBD submitted an
urgent petition for placing temporary attachments (in the presence
of one party) on Dolphin Netherlands B.V and IRSA, which was not
accepted by the Court in the presence of one party and which has
been passed on for the respondents to responed to the
petition.
241
Operating activities
Fiscal year ended June 30, 2020
Our
operating activities for the fiscal year ended June 30, 2020
generated net cash inflows of ARS 35,734 million, of which ARS
2,848 million are originated in discontinued operations and ARS
32,886 million are from continuing operations, mainly due to
operating income of ARS 25,964 million, a decrease in trading
properties of ARS 930 million, a decrease in inventory of ARS 722
million, a decrease in trades and other receivables of ARS 10,826
million and decrease in biological assets of ARS 5,188 million
partially offset by a decreased and a decrease in trades and other
payables charges of ARS 6,161 million, and ARS 650 million related
to income tax paid.
Fiscal year ended June 30, 2019
Our
operating activities for the fiscal year ended June 30, 2019
generated net cash inflows of ARS 26,276 million, of which ARS
6,354 million are originated in discontinued operations and ARS
19,922 million are from continuing operations, mainly due to
operating income of ARS 19,575 million, a decrease in trades and
other receivables of ARS 2,473 million, partially offset by a
decrease in trade and other payables charges of ARS 3,562 million
and ARS 730 million related to income tax paid.
Fiscal year ended June 30, 2018
Our
operating activities for the year ended June 30, 2018 generated net
cash flows of ARS 25,836 million, of which ARS 14,120 million
originated in discontinued operations and ARS 11,716 million in
continuing operations, mainly due to an operating result of ARS
9,048 million and an increase in commercial and other debts of ARS
1,212 million, partially offset by a decrease in inventories of ARS
1,025 million, and ARS 1,686 million related to income tax
paid.
Investment activities
Fiscal year ended June 30, 2020
Our
investing activities resulted in net cash inflows of ARS 40,311
million, of which ARS 2,455 million are originated in discontinued
operations and ARS 37,856 are from continuing operations for the
fiscal year ended June 30, 2020, mainly due to (i) ARS 36,619
million in investments in financial assets, (ii) ARS 13,402 million
derived from income from sales of investment properties, (iii) ARS
6,494 million generated by a decrease in restricted deposits, net,
and (iv) ARS 3,382 million derived from income from sales of
property, plant and equipment and (v) ARS 5,049 corresponding to
receipts from the sale of participations in associates and joint
ventures, partially offset by, (vi) ARS 12,837 million used in the
acquisition of investments in financial assets (vii) ARS 922
million corresponding to loans granted, (viii) ARS 6,116 million
used in the acquisition and improvement in property, plant and
equipment, (ix) ARS 4,043 used in the acquisition of intangible
assets, and (x) ARS 4,389 million used in the acquisition and
improvements of investment properties.
Fiscal year ended June 30, 2019
Our
investing activities resulted in net cash inflows of ARS 10,552
million, corresponding to an outflow of funds from discontinued
activities of ARS 6,082 million and an inflow of funds from
continued activities of ARS 16,634 million for the fiscal year
ended June 30, 2019, mainly due to (i) ARS 78,765 million derived
from the proceeds of making investments in financial assets, and
(ii) ARS 8,377 million corresponding to charges for the sale of
participation in associates and joint ventures; partially offset by
(iii) ARS 57,996 used in the acquisition of investments in
financial assets; (iv) ARS 6,940 million used in the acquisition
and improvement of property, plant and equipment; (v) ARS 6,430
million used in the acquisition and improvement of investment
properties; and (vi) ARS 4,022 million used in the acquisition of
intangible assets.
Fiscal year ended June 30, 2018
Our
investing activities resulted in net cash outflows of ARS 31,553
million, corresponding to an outflow of funds from discontinued
activities of ARS 9,065 million and an outflow of funds from
continued activities of ARS 22,488 million for the fiscal year
ended June 30, 2018, mainly due to (i) ARS 73,775 million derived
from the proceeds of making investments in financial assets, and
(ii) ARS 887 million derived from investment property sales income;
partially offset by (iii) ARS 78,493 used in the acquisition of
investments in financial assets; (iv) ARS 6,557 million used in the
acquisition and improvement of property, plant and equipment; (v)
ARS 4,729 million used in the acquisition and improvement of
investment properties; (vi) ARS 1,668 million used in the
acquisition of intangible assets, and (vii) ARS 7,226 for an
increase in restricted deposits.
242
Financing activities
Fiscal year ended June 30, 2020
Our
financing activities for the fiscal year ended June 30, 2020
resulted in net cash outflows of ARS 72,624 million, corresponding
ARS 5,548 million to discontinued activities, and ARS 67,076
million to continued activities, mainly due to (i) the payment of
loans and principal on notes of ARS 72,590 million, (ii) ARS 13,644
million due to repurchase of non-convertible notes, and (iii) the
payment of interest on short-term and long-term debt of ARS 21,909
million and (iv) ARS 2,459 corresponding to the net cancellation of
short-term loans, and partially offset by (v) borrowings and
issuance of non-convertible notes for ARS 47,777
million.
Fiscal year ended June 30, 2019
Our
financing activities for the fiscal year ended June 30, 2019
resulted in net cash outflows of ARS 25,735 million, corresponding
to an inflow of funds from discontinued activities of ARS 7,455
million, and an outflow of funds from continued activities of ARS
33,190, mainly due to (i) the payment of loans and principal on
notes of ARS 54,274 million, (ii) the payment of interest on
short-term and long-term debt of ARS 20,059 million, (iii) ARS
8,291 million due to repurchaseof non-convertible notes, (iv)
acquisition of third parties in non-controlling interest of
subsidiaries for ARS 7,200, partially offset by (v) borrowings and
issuance of non-convertible notes for ARS 55,708 million, and (vi)
ARS 2,248 million corresponding to the net obtaining of short-term
loans.
Fiscal year ended June 30, 2018
Our
financing activities for the fiscal year ended June 30, 2018
resulted in net cash outflows of ARS 4,009 million, corresponding
to an inflow of funds from discontinued activities of ARS 8,473
million, and an outflow of funds from continued activities of ARS
12,482, mainly due to (i) the payment of loans and principal on
notes of ARS 45,233 million, (ii) the payment of interest on
short-term and long-term debt of ARS 14,266 million, (iii) ARS
1,329 million due to repurchase of non-convertible notes, partially
offset by (iv) borrowings and issuance of non-convertible notes for
ARS 47,023 million, (v) ARS 1,661 million corresponding to the net
obtaining of short-term loans, and (vi) collection for the sale of
non-controlling interest in subsidiaries for ARS
6,933.
Indebtedness
As of
June 30, 2020, we had total loans in the amount of ARS 418,807
million. The following table sets forth the scheduled maturities of
our outstanding debt:
|
|
|
Urban properties and investments
|
|
|
|
|
Capital
|
Agricultural Business
|
Operation Center in Argentina
|
Operation Center in Israel
|
Subtotal
|
Total
|
|
|
(In
million of ARS)
|
|
|
|
|
|
Less
than 1 year
|
17,17
|
36,31
|
41,256
|
77,566
|
94,736
|
|
More
than 1 and up to 2 years
|
21,891
|
1,855
|
41,062
|
42,917
|
64,808
|
|
More
than 2 and up to 3 years
|
1,563
|
25,889
|
83,824
|
109,713
|
111,276
|
|
More
than 3 and up to 4 years
|
255
|
64
|
35,576
|
35,64
|
35,895
|
|
More
than 4 and up to 5 years
|
86
|
104
|
32,138
|
32,242
|
32,328
|
|
More
than 5 years
|
165
|
-
|
77,211
|
77,211
|
77,376
|
|
|
41,13
|
64,222
|
311,067
|
375,289
|
416,419
|
|
Interest
|
|
|
|
|
|
|
Less
than 1 year
|
1,218
|
168
|
607
|
775
|
1,993
|
|
More
than 1 and up to 2 years
|
170
|
-
|
-
|
-
|
170
|
|
More
than 2 and up to 3 years
|
42
|
47
|
-
|
47
|
89
|
|
More
than 3 and up to 4 years
|
28
|
-
|
-
|
-
|
28
|
|
More
than 4 and up to 5 years
|
20
|
25
|
-
|
25
|
45
|
|
More
than 5 years
|
40
|
22
|
-
|
22
|
62
|
|
|
1,518
|
262
|
607
|
869
|
2,387
|
|
Financial
Leases
|
-
|
1
|
-
|
1
|
1
|
|
|
42,648
|
64,485
|
311,674
|
376,159
|
418,807
|
243
|
|
|
Urban properties and investments
|
|
|
|
|
|
Agricultural Business
|
Operation Center in Argentina
|
Operation Center in Israel
|
Subtotal
|
Total
|
|
|
(In
million of ARS)
|
|
|
|
|
|
Non-convertible
Notes
|
27,17
|
57,099
|
258,749
|
315,848
|
343,018
|
|
Bank
loans and others
|
13,622
|
3,874
|
52,398
|
56,272
|
69,894
|
|
Bank
overdrafts
|
1,856
|
2,428
|
-
|
2,428
|
4,284
|
|
Others
|
-
|
1,084
|
527
|
1,611
|
1,611
|
|
|
42,648
|
64,485
|
311,674
|
376,159
|
418,807
|
|
Agricultural business
|
Currency
|
Annual Average Interest Rate
|
Nominal Value
|
Book value (in million ARS)
|
|
Cresud’s
Series XXIII Notes
|
USD
|
6.50
%
|
113
|
7,551
|
|
Cresud’s Series XXIV
Notes
(1)
|
USD
|
9.00
%
|
74
|
4,145
|
|
Cresud’s
Series XXV Notes
|
USD
|
9.00
%
|
60
|
4,358
|
|
Cresud’s
Series XXVI Notes
|
ARS
|
Badlar
+ 650 pb.
|
1,095
|
1,046
|
|
Cresud’s
Series XXVII Notes
|
USD
|
7.45
%
|
6
|
407
|
|
Cresud’s
Series XXVIII Notes
|
USD
|
9.00
%
|
27
|
1,949
|
|
Cresud’s
Series XXIX Notes
|
USD
|
3.50
%
|
83
|
5,828
|
|
Brasilagro’s
Notes
|
BRL
|
106.5%
e 110% do CDI
|
140
|
1,886
|
|
Bank
loans
|
USD
|
7.50
%
|
18
|
1,268
|
|
Bank
loans
|
USD
|
Libor
6M + 300 bps. O 6% (lthe high)
|
4
|
276
|
|
Bank
loans
|
USD
|
7.25
%
|
20
|
1,444
|
|
Bank
loans
|
USD
|
46.50
%
|
1,270
|
1,435
|
|
Bank
loans
|
BRL
|
Fixed
rate + CDI 2%
|
77
|
992
|
|
Bank
loans
|
BRL
|
Fixed
rate 3.50% to 8.25%
|
31
|
131
|
|
Bank
loans
|
BRL
|
Fixed
rate 7.22%
|
0
|
3
|
|
Bank
loans
|
BRL
|
Fixed
rate 6.76% to 6.34%
|
71
|
938
|
|
Bank
loans
|
USD
|
Fixed
rate 7.00% to 8.50%
|
12
|
461
|
|
Bank
loans
|
BRL
|
Fixed
rate 1.80% + CDI to 7.64%
|
165
|
2,169
|
|
Bank
loans
|
USD
|
5.75% +
Libor tight
|
20
|
1,424
|
|
Bank
loans
|
USD
|
5.60
%
|
14
|
1,008
|
|
Bank
loans
|
ARS
|
43.75
%
|
245
|
274
|
|
Bank
loans
|
ARS
|
45.75
%
|
300
|
344
|
|
Bank
loans
|
ARS
|
46.50
%
|
650
|
745
|
|
Bank
loans
|
ARS
|
41.05
%
|
660
|
710
|
|
Bank
overdrafts
|
ARS
|
From
17% to 150%
|
-
|
1,856
|
|
|
|
|
|
|
|
|
|
|
42,648
|
|
(1)
On October 23,
2020, we announced Notes to be issued by exchange for the Existing
Notes, Series XXIV Notes, for more information see “Recent
Developments – Exchange Offer- Isuance of Series XXXI and
XXXII Notes.”
|
Operation Center in Argentina
|
Currency
|
Annual Average Interest Rate
|
Nominal value
|
Book value (in million of ARS)
|
|
IRSA
Commercial Properties’ 2023 Notes
|
USD
|
8.75
%
|
360
|
25,529
|
|
IRSA Commercial Properties’ 2020
Notes
(1)
|
USD
|
5.00
%
|
140
|
9,489
|
|
IRSA’s 2020 Notes – Series
II
(2)
|
USD
|
11.50
%
|
71
|
5,289
|
|
IRSA’s 2020 Notes – Series
I
(3)
|
USD
|
10.00
%
|
181
|
9,078
|
|
IRSA’s 2020 Notes – Series
II
(4)
|
CLP
|
10.50
%
|
31,502
|
3,292
|
|
IRSA’s
2021 Notes – Series III
|
ARS
|
Badlar
+ 600 bps
|
353
|
366
|
|
IRSA’s
2021 Notes – Series IV
|
USD
|
7.00
%
|
51
|
3,561
|
|
IRSA’s
2022 Notes – Series V
|
USD
|
9.00
%
|
9
|
495
|
|
Related
Party
|
ARS
|
Badlar
/ 3.8%
|
6
|
27
|
|
Related
Party
|
USD
|
From
4.99% to 14.0%
|
65
|
337
|
|
Bank
loans
|
USD
|
5.95
%
|
21
|
1,440
|
|
Bank
loans
|
USD
|
Libor +
1.9%
|
30
|
2,324
|
|
AABE
Debt
|
ARS
|
Libor
|
120
|
182
|
|
Seller
financing
|
USD
|
N/A
|
2
|
165
|
|
Others
|
USD
|
Libor 1m+2% /
3.5%
|
7
|
499
|
|
Bank
loans
|
ARS
|
From
56.5% to 57.5%
|
97
|
98
|
|
Bank
overdrafts
|
ARS
|
from
39.00% to 109.00%
|
-
|
2,428
|
|
Total
|
|
|
|
64,485
|
244
|
|
|
|
|
|
(1)
On September 14,
2020, it was fully canceled.
(2)
On July 20, 2020,
it was fully canceled.
(3)
On October 22,
2020, IRSA announced Notes to be issued by exchange for the
Existing Notes, Series I Notes, or through the Cash Subscription,
for more information see “Recent Developments –
Exchange Offer- Issuance of Series VIII and IX
Notes.”
(4)
On August 6, 2020,
it was fully canceled.
The
credit line between IRSA CP and IRSA for an amount of USD 53.4
million is not shown due because it is eliminated in
consolidation
|
Operation Center in Israel (1)
|
Currency
|
Annual Average Interest Rate
|
Nominal value
|
Book value (in million of ARS)
|
|
Non-convertible
Notes IDBD Series I
|
NIS
|
12.24
%
|
676
|
13,921
|
|
Non-convertible
Notes IDBD Series N
|
NIS
|
5.93
%
|
851
|
17,290
|
|
Non-convertible
Notes IDBD Series O
|
NIS
|
4.70
%
|
237
|
4,780
|
|
Non-convertible
Notes DIC Series F
|
NIS
|
8.62
%
|
1,385
|
29,941
|
|
Non-convertible
Notes DIC Series J
|
NIS
|
4.52
%
|
1,960
|
40,844
|
|
Non-convertible
Notes Cellcom Series H-I-J-K-L
|
NIS
|
2.62
% - 4.46%
|
3,004
|
60,259
|
|
Non-convertible
Notes PBC Series D-F-G-H-I
|
NIS
|
2.99
% - 5.67%
|
4,052
|
91,714
|
|
Bank
loans and others
|
NIS
|
from
0.0% to 5.93%
|
1,868
|
52,925
|
|
Total
|
|
|
|
311,674
|
(1)
On September 25,
2020, the Court resolved that IDBD is insolvent and therefore it
resolved to grant all three orders requested and accordingly,
issued an order for the initiation of proceedings and liquidation
of IDBD, and has appointed a liquidator to IDBD and interim
receivers over the Pledged DIC and Clal Shares. As of the date of
this Annual Report, we are analyzing together with our local and
international advisors the judicial decision, alternatives and
course of action. For more information see “IRSA’s
Recent Developments - Corporate Information:
IDBD”.
Agricultural business
Series XXIII Notes
On
February 16, 2018, we issued the Series XXIII Notes, for USD 113.2,
bearing a fixed interest rate of 6.5% payable semiannually, which
matures on February 16, 2023.
Series XXIV Notes
On
November 8, 2018, we issued the Series XXIV Notes, for USD 73.6
million, bearing a fixed rate of 9.0% with an issuance price of
100%, which matures on November 14, 2020. On September 15, 2020,
Communication “A” 7,106 established that companies must
refinance maturities of financial debt capital in the period from
October 15, 2020 to March 31, 2021. In this sense, the Central Bank
will give access to companies for up to 40% of maturities and
companies must refinance the rest within at least two years. For
more information see. “Item 10. Additional
Information—D. Exchange Controls”, if Communication
“A” 7,106 is extended after March 31, 2021, the capital
outstanding maturity of this Note would be affected by such
measure.
As a
consequence of the new restrictions on access to the Foreign
Exchange Market, on October 23, 2020, CRESUD launched an exchange
offer on its Series XXIV Notes due on November 14,
2020.
The
exchange offer consisted on two options for the bondholders: i) a
cash consideration of USD 0.95741755 for each USD 1 of existing
notes presented to the Exchange and the remaining amount until
completing USD 1 for each USD 1 of existing notes presented to the
Exchange, in notes Series XXXI, and ii) a par for par exchange of
notes Series XXXII for each Existing Notes presented to the
Exchange.
The
Exchange Offer expired on November 10, 2020 and the Nominal Value
of Existing Notes presented and accepted for the Exchange (for both
Series) was USD 65,075,746, which represents 88.41%
acceptance.
In
relation to the Exchange Offer ended on November 10, 2020, and as a
result of the settlement of said Exchange, on November 16, 2020,
the Company made a partial cancelation for a Nominal Value of USD
65,075,746 of Series XXIV Notes, after the cancellation the Nominal
Value under circulation will be USD 8,529,654, which was fully
cancelled on November 16, 2020.
For
more information see: “Recent Developments - Exchange Offer -
Issuance of Series XXXI and XXXII Notes.”
Series XXV Notes
On July
3, 2019, we issued the Series XXV Notes, for USD 59.6, bearing a
fixed interest rate of 9.0% payable semiannually, which matures on
July 11, 2021.
Series XXVI, XXVII and XXVIII Notes
On
January 30, 2020, the Company issued notes an aggregate principal
amount of USD 51.4 million, as follows:
●
Series XXVI:
denominated and payable in ARS in an aggregate principal amount of
ARS 1,095 million (equivalent to USD 18.2 million) at a variable
rate (private BADLAR + 6.5%) with quarterly payments and principal
expiring on January 30, 2021.
●
Series XXVII:
denominated in USD and payable in ARS at the applicable exchange
rate in an aggregate principal amount of USD 5.7 million at a fixed
rate of 7.45%, with quarterly payments and principal expiring on
July 30, 2021
●
Series XXVIII:
denominated and payable in USD in an aggregate principal amount of
USD 27.5 million at a fixed rate of 9.0%, with quarterly payments
and principal expiring on April 30, 2021.
245
Series XXIX Notes
On June
9, 2020, the sixteenth Series of Notes public tender was carried
out, within the framework of the Program approved by the
Shareholders Meeting, for up to USD 500 million, being the
liquidation date on June 9, 2020. The main characteristics of the
issuance are detailed bellow:
●
Series XXIX:
denominated in USD and payable in ARS at the applicable exchange
rate, as defined in the issuance documents, with a nominal value of
USD 83.0 million at a fixed rate of 3.5%, maturing on December 9,
2021 with quarterly payments and principal expiring at maturity.
The issue price was 100%.
Series XXX Notes
As a
subsequent event, on August 31, 2020, we issued the:
Series
XXX Notes, denominated in dollars and payable in pesos at the
applicable exchange rate, as defined in the issuance documents,
with a nominal value of USD 25.0 million at a fixed rate of 2.0%,
maturing 36 months from the date of issuance with quarterly
payments and principal expiring at maturity. The issue price was
100.
Operations Center in Argentina
Series II (Issued by IRSA)
IRSA’s
Notes Serie II at 11.50% maturing in 2020 USD71.4 million, which
was fully canceled On July 20, 2020.
Series II Notes (Issued by IRSA CP)
On March 23, 2016, IRSA CP issued Notes in an aggregate principal
amount of USD360 million under its Global Notes Program. Series II
Notes accrue interest semi-annually, at an annual fixed rate of
8.75% and mature on March 23, 2023.
IRSA CP’s Notes due 2023 are subject to certain covenants,
events of default and limitations, such as the limitation on
incurrence of additional indebtedness, limitation on restricted
payments, limitation on transactions with affiliates, and
limitation on merger, consolidation and sale of all or
substantially all assets.
To incur additional indebtedness, IRSA CP is required to meet a
minimum 2.00 to 1.00 Consolidated Interest Coverage Ratio. The
Consolidated Interest Coverage Ratio is defined as Consolidated
EBITDA divided by consolidated net interest expense. Consolidated
EBITDA is defined as operating income plus depreciation and
amortization and other consolidated non-cash charges.
The Series II Notes contain financial covenants limiting IRSA
CP’s ability to declare or pay dividends in cash or in kind,
unless the following conditions are met at the time of
payment:
a)
no Event of Default shall have occurred and be
continuing;
b)
IRSA CP may incur at least USD1.00 worth of additional debt
pursuant to the “Restriction on Additional
Indebtedness”;
c)
and the aggregate amount of such dividend exceeds the sum
of:
i.
100% of cumulative EBITDA for the
period (treated as one accounting period) from July 1, 2015 through
the last day of the last fiscal quarter ended prior to the date of
such Restricted Payment
minus
an amount equal to 150% of
consolidated interest expense for such period;
and
ii.
any reductions of Indebtedness of IRSA on a consolidated basis
after the Issue Date any reductions of Indebtedness of after the
Issue Date exchanged for to Capital Stock of the IRSA or its
Subsidiaries.
For
more informarion see. “Item 10. Additional
Information—D. Exchange Controls”, if Communication
“A” 7,106 is extended after March 31, 2021, the capital
outstanding maturity of this Note would be affected by such
measure.
246
Series I and II Notes
On May
15, 2019, IRSA issued the Note Series I under Argentine law for an
amount of USD 96.3 million due on November 15, 2020, at a fixed
rate of 10%. The proceeds were mainly used to repay preexisting
debt.
On
August 6, 2019, IRSA reopened the Note Series I under Argentine law
for an amount of USD 85.2 million, at a price of 103.77%, which
resulted in an internal annual rate of return of 8.75% nominal.
Also, on the same date, the Notes Series II denominated in Chilean
pesos, under writable and payable in dollars, for an amount of CLP
31,502.6 million (equivalent to USD 45 million) at a fixed rate of
10.5% per within 12 months.
On
August 6, 2020, Class II denominated in Chilean pesos was fully
canceled.
On
September 15, 2020, Communication “A” 7,106 established
that companies must refinance maturities of financial debt capital
in the period from October 15, 2020 to March 31, 2021. In this
sense, the Central Bank will give access to companies for up to 40%
of maturities and companies must refinance the rest within at least
two years.
For more information
see. “Item 10. Additional Information—D. Exchange
Controls”, if Communication “A” 7,106 is extended
after March 31, 2021, the capital outstanding maturity of this Note
would be affected by such measure.
As a
consequence of the new restrictions on access to the Foreign
Exchange Market, on October 22, 2020, IRSA launched an exchange
offer on its Series I Notes due on November 15, 2020.
The
exchange offer consisted on two options for the bondholders: i) a
cash consideration of USD 0.69622593 for each USD 1 of existing
notes presented to the Exchange and the remaining amount until
completing USD 1 for each USD 1 of existing notes presented to the
Exchange, in notes Series VIII, and ii) a par for par exchange of
notes Series IX for each Existing Notes presented to the
Exchange.
The
Exchange Offer expired on November 10, 2020 and the Nominal Value
of Existing Notes presented and accepted for the Exchange (for both
Series) was USD 178,458,188, which represents 98.31% acceptance.
Considering that consent has been obtained for an amount greater
than 90% of the capital of the existing notes, IRSA made the
Non-Essential Proposed Modifications and / or the Essential
Proposed Modifications, by means of which the terms and conditions
of the existing notes will be modified and replaced.
In relation to the Exchange Offer ended on November 10, 2020, on
November 12, 2020, the IRSA will proceed to a partial cancelation
for a Nominal Value of USD 178,458,188 of Series I Notes, after the
cancellation the Nominal Value under circulation will be USD
3,060,519.
For
more information see: “Recent Developments - Exchange Offer-
Issuance of Series VIII and IX Notes.”
Series III, IV and V (issued by IRSA)
On May
21, 2020, IRSA issued in the local market a total amount of USD
65.8 million through the following Notes:
●
Series III:
denominated and payable in pesos for ARS 354 million (equivalent at
the time of issuance to USD 5.2 million) at a variable rate
(private BADLAR + 6.0%) with quarterly payments. The principal will
be paid in two installments: the first for an amount equivalent to
30% of the nominal value payable 6 (six) months from the Issue and
Settlement Date, and the second for an amount equivalent to 70% of
the nominal value payable on the due date, February 21, 2021. Price
of issuance was 100.0% of the nominal value.
●
Series IV:
denominated in USD and payable in ARS at the applicable exchange
rate for USD 51.4 million at a fixed rate of 7.0%, with quarterly
payments and principal expiring on May 21, 2021. Price of issuance
was 102.0% of the nominal value (IRR 5.03%).
●
Series V:
denominated in USD and payable in ARS at the applicable exchange
rate for USD 9.2 million at a fixed rate of 9.0%, with quarterly
payments and principal expiring on May 21, 2022. Price of issuance
was 103.0% of the nominal value (IRR 7.56%).
247
Series VI and VII (issued by IRSA)
As a subsequent event, on Jul 21, 2020, IRSA issued in the local
market a total amount of USD 38.4 million through the following
Notes:
●
Series VI:
denominated and payable in pesos for ARS 335.2 million (equivalent
at the time of issuance to USD 4.7 million) at a variable rate
(private BADLAR + 4.0%) with quarterly payments. The principal will
be paid in two installments: the first for an amount equivalent to
30% of the nominal value payable 9 (nine) months from the Issue and
Settlement Date, and the second for an amount equivalent to 70% of
the nominal value payable on the due date, July 21, 2021. Price of
issuance was 100.0% of the nominal value.
●
Series VII:
denominated in dollars and payable in pesos at the applicable
exchange rate for USD 33.7 million at a fixed rate of 4.0%, with
quarterly payments and principal expiring on January 21, 2022.
Price of issuance was 100.0% of the nominal value.
The
funds have been used to refinance short-term
liabilities.
Series
IV Notes (Issued by IRSA CP)
On
September 12, 2017, IRSA CP issued, under Argentine law, the Series
IV Notes, for USD140 million, bearing a fixed interest rate of
5.0%, which matures on September 14, 2020.
On
September 14, 2020, Class IV was fully canceled.
Communication “A” 7,106
On
September 15, 2020, Communication “A” 7,106 established
that companies must refinance maturities of financial debt capital
in the period from October 15, 2020 to March 31, 2021. In this
sense, the Central Bank will give access to companies for up to 40%
of maturities and companies must refinance the rest within at least
two years. Fore more informarion see. “Item 10. Additional
Information—D. Exchange Controls.”
Operations Center in Israel
It should be noted that the financial position of IDBD and DIC and
their subsidiaries in the operations center in Israel does not
adversely affect IRSA’s cash flows to satisfy the debts of
IRSA.
Moreover, the commitments and other restrictions resulting from
IDBD’s indebtedness have no effects on IRSA, as it qualifies
as non-recourse debt against IRSA, and IRSA has not given its
assets as collateral for such debt either.
C. RESEARCH AND DEVELOPMENTS, PATENTS AND LICENSES
Investments
in technology, in our agricultural business, amounted to ARS 85
million, ARS 120 million and ARS 144 million for fiscal years 2020,
2019 and 2018 respectively. Our total technology investments aimed
to increase the productivity of purchased land have amounted to ARS
2,342 million since fiscal year 1995.
We
reach our objectives within this area through the implementation of
domestic and international technological development projects
focusing mainly on:
●
Quality and
productivity improvement.
●
Increase in
appreciation value of land through the development of marginal
areas.
●
Increase in the
quality of food in order to achieve global food safety standards.
We aim to implement and perform according to official and private
quality protocols that allow us to comply with the requirements of
our present and future clients. Regarding official regulations, in
2003 we implemented the Servicio Nacional de Sanidad y Calidad
Agroalimentaria law on animal identification for livestock in six
farms. Simultaneously, in 2004 we implemented Global GAP Protocols
(formerly EurepGap) with the objective of complying with European
Union food safety standards and as a mean for continuous
improvement of the internal management and system production of our
farms. Our challenge is to achieve global quality
standards.
248
●
Certification of
suitable quality standards, since in recent years worldwide
agriculture has evolved towards more efficient and sustainable
schemes in terms of environmental and financial standpoints, where
the innocuousness and quality of the production systems is becoming
increasingly important. In this context, Good Agricultural
Practices (GAP) have emerged, as a set of practices seeking to
ensure the innocuousness of agricultural products, the protection
of the environment, the workers’ safety and well-being, and
agricultural health, with a view to improving conventional
production methods. Certification of such standards allows to
demonstrate the application of Good Agricultural Practices to
production systems and ensures product traceability, allowing to
impose stricter controls to verify the enforcement of the
applicable laws.
●
The implementation
of a system of control and assessment of agricultural tasks for
analyzing and improving efficiency in the use of agricultural
machinery hired. For each of the tasks, a minimum standard to be
fulfilled by contractors was set, which has led to do an
improvement in the plant stand upon sowing, a better use of
supplies and lower harvesting losses.
We have
several trademarks registered with the Instituto Nacional de la
Propiedad Industrial, the Argentine institute for industrial
property. We do not own any patents nor benefit from licenses from
third parties.
A
substantial part of Cellcom’s operations are subject to the
Communications Law, regulations enacted by the Ministry of
Communications, and the provisions of the licenses granted to
Cellcom by the Minister of Communications. Cellcom’s
activities which include providing cellular service, landline,
international telephone services and internet access, and
infrastructure services are subject to licensing. For more
information, please see “Legal framework – Operations
Center in Israel”
D. TREND INFORMATION
International Macroeconomic Outlook
As
reported in the IMF’s “World Economic Outlook,”
world GDP is expected to de reduced (4.9)% in 2020 and recover 5.4%
in 2021. As with the April 2020 WEO projections, there is a
higher-than-usual degree of uncertainty around this forecast. The
baseline projection rests on key assumptions about the fallout from
the pandemic. In economies with declining infection rates, the
slower recovery path in the updated forecast reflects persistent
social distancing into the second half of 2020; greater scarring
(damage to supply potential) from the larger-than-anticipated hit
to activity during the lockdown in the first and second quarters of
2020; and a hit to productivity as surviving businesses ramp up
necessary workplace safety and hygiene practices. For economies
struggling to control infection rates, a lengthier lockdown will
inflict an additional toll on activity. Moreover, the forecast
assumes that financial conditions—which have eased following
the release of the April 2020 WEO — will remain broadly at
current levels. Alternative outcomes to those in the baseline are
clearly possible, and not just because of how the pandemic is
evolving.
All
countries including those that have seemingly passed peaks in
infections—should ensure that their health care systems are
adequately resourced. The international community must vastly step
up its support of national initiatives, including through financial
assistance to countries with limited health care capacity and
channeling of funding for vaccine production as trials advance, so
that adequate, affordable doses are quickly available to all
countries. Where lockdowns are required, economic policy should
continue to cushion household income losses with sizable,
well-targeted measures as well as provide support to firms
suffering the consequences of mandated restrictions on activity.
Where economies are reopening, targeted support should be gradually
unwound as the recovery gets underway, and policies should provide
stimulus to lift demand and ease and incentivize the reallocation
of resources away from sectors likely to emerge persistently
smaller after the pandemic.
Strong
multilateral cooperation remains essential on multiple fronts.
Liquidity assistance is urgently needed for countries confronting
health crises and external funding shortfalls, including through
debt relief and financing through the global financial safety net.
Beyond the pandemic, policymakers must cooperate to resolve trade
and technology tensions that endanger an eventual recovery from the
COVID-19 crisis. Furthermore, building on the record drop in
greenhouse gas emissions during the pandemic, policymakers should
both implement their climate change mitigation commitments and work
together to scale up equitably designed carbon taxation or
equivalent schemes. The global community must act now to avoid a
repeat of this catastrophe by building global stockpiles of
essential supplies and protective equipment, funding research and
supporting public health systems, and putting in place effective
modalities for delivering relief to the neediest.
249
Argentine macroeconomic context
At the
end of 2019, the economy faced a severe balance of payments crisis
and public debt. Faced with this scenario, the National Government
adopted a set of measures designed to face the most immediate
manifestations of the crisis and to stabilize the macroeconomy.
Regarding monetary policy, the Central Bank of Argentina defined a
series of guidelines, highlighting the referring to interest rates
and exchange rate management. Foreign exchange regulations and the
moderation in prices linked to the limited volatility of the
exchange rate allowed a marked reduction of the LELIQ rate from 68%
to 38% nominal annually. The progress made the financial system
better prepared to face the emergency caused by
COVID-19.
Shopping
malls sales reached a total ARS 4,297.1 million in July 2020, which
represents a 73.0% decrease as compared to fiscal 2019. Accumulated
sales for the first seven months ARS 47,212.0, represent a 45.3%
decrease in current terms as compared to the same period last
year.
The
INDEC reported that, for the eight months ended August 31, 2020,
industrial activity in Argentina contracted by 12.5% compared to
the same period in 2019. The textile industry accumulated a 35.2%
contraction during the first eight months of 2020 as compared to
the same period last year. Moreover, the monthly estimation of
economic activity (“EMAE”) as of July 31, 2020,
contracted by 13.2% compared to the same month in
2019.
Regarding
the balance of payments, in the second quarter of 2020 the current
account superavit reached USD 2,824 million, with USD 4,971 million
allocated to the goods and services trade balance, and USD 2,484
million to the net primary deficit, and a surplus of USD 337
million to net secondary income.
During
the second quarter of 2020, the financial account showed net
outflow of USD 2,514 million, explained by the net acquisition of
financial assets for USD 893 million, and net cancellation of
liabilities of USD 1,621 million. The sectors that have explained
these outflows have been Other sectors for USD 2,433 million and
the Government for USD 1,324 million, partially offsetting by the
net income of the Central Bank for USD 1,293 million. The
international reserves decreased by USD 793 million during the
second quarter of 2020.
In
local financial markets, the Private Badlar rate in Pesos ranged
from 46.69% to 29.69% in the period from July 2019 to June 2020,
averaging 40.31% in June 2020 compared to 50.90% in June 2019. As
of June 30, 2020, the seller exchange rate quoted by Banco de la
Nación Argentina was ARS 70.4600 pesos per USD1.00. As of June
30, 2020, Argentina’s country risk increased by 1,660 basis
points in year-on-year terms. The debt premium paid by Argentina
was 2,495 basis points in June 2020, compared to 380 basis points
paid by Brazil and 312 basis points paid by Mexico.
As of
October 8, 2020, the Private Badlar rate in Pesos peaked at 29.69%.
As of October 8, 2020, the seller exchange rate quoted by Banco de
la Nación Argentina was of ARS 77.10 pesos per USD1.00. As of
September 8, 2020, Argentina’s country risk reduced by 683
basis points in year-on-year terms. The debt premium paid by
Argentina was at 1,366 basis points as of October 8, 2020, compared
to 315 basis points paid by Brazil and 259 basis points paid by
Mexico as of that same date.
Likewise,
in the national and international framework described above, the
Company periodically analyzes alternatives to appreciate its shares
value. In that sense, the Board of Directors of the Company will
continue in the evaluation of financial, economic and / or
corporate tools that allow the Company to improve its position in
the market in which it operates and have the necessary liquidity to
meet its obligations. Within the framework of this analysis, the
indicated tools may be linked to corporate reorganization processes
(merger, spin-off or a combination of both), disposal of assets in
public and / or private form that may include real estate as well
as negotiable securities owned by the Company, incorporation of
shareholders through capital increases through the public offering
of shares to attract new capital, repurchase of shares and
instruments similar to those described that are useful to the
proposed objectives.
Agriculture and Cattle Raising Sector in Argentina
Agriculture
Argentina has positioned itself over the years as one of the
world’s leading food producers and exporters. It is the
second largest country in South America after Brazil and has
particularly favorable natural conditions for diversified
agricultural production: vast extensions of fertile land and varied
soil and weather patterns.
250
During the decade of the nineties, the Argentine agriculture and
cattle raising industry experienced sweeping changes, such as a
significant increase in production and yield (thanks to a sustained
agricultural modernization process), relocation of production
(crops vs. livestock) and a significant restructuring process
within the industry, as well as increased land concentration.
Taking advantage of a favorable international context, the
agriculture and cattle raising sector has been one of the major
drivers of the Argentine recovery after the economic and financial
crisis of 2002.
According to the World Agricultural Supply and Demand Estimates
Repro published by the United States Department of Agriculture on
September 11, 2020, world soybean production for the season
2020/2021 is expected to be about 369,74 million tons, an increase
of 9.5% as compared to the season 2019/2020.
World corn production is expected to about 1,162.4 million tons for
season 2020/2021, 4.5% higher than in the previous
season.
The policies implemented by the new government ever since taking
office have led to better projections for the agricultural
industry. Mainly, the strong devaluation of the peso and tax
reductions on exports have improved the situation of agricultural
growers. Withholding taxes on corn and wheat have been reinstated
at 10%, whereas withholding taxes on soybean have been modified to
18% export tax over the FOB prices plus ARS 4 per
dollar.
In
addition, on October 2, 2020, a temporary reduction on certain
export duty rates was established for a series of soybean products
and by-products. This is a temporary reduction and will be applied
from October 2020 until January 2021, at which time export duties
will be gradually taxed again at the same rate they were before the
decree came in force.
Cattle
As
reported by SENASA, with an aggregate stock of 54,460,799 heads as
of March 31, 2020, the cattle stock has decreased slightly by 1.00%
as compared to the same period of the previous year. For the decade
in a row, the cattle stock surpassed 48 million heads.
As
reported by the Argentine Chamber of Beef Commerce and Industry
(Cámara de la Industria y
Comercio de Carnes y Derivados de la República
Argentina,
“Ciccra”), consumption of cattle beef
per capita was 50.5 kilograms per year on average for September
2020, accounting for a year-on-year decrease of 2.7%. Domestic
consumption accounts for 72.8% of production, representing a
year-on-year decrease of 2.1%.
Urban Properties and Investment Business
Operations Center in Argentina
Evolution of Shopping Malls in Argentina
In
September 2020, the Consumer Confidence Index (CCI) showed a 2.4%
decline compared to August 2020, and a 4.2% decrease compared to
September 2019. Shopping mall sales decrease 82.2% in the fiscal
2020 compared to fiscal 2019.
Evolution
of Office Properties in Argentina
According
to Colliers International, as of June 30, 2020, the A+ and A office
inventory decreased compared to 2019 to 1,827,742 sqm. The vacancy
rate was steady at approximately 11.2% during the second quarter of
2020. These values indicate that the market is healthy in terms of
its operations, allowing an optimum level of supply with robust
values.
Compared
to the previous quarter, the Premium Offices prices decreased in
the order of USD 24.3 per square meter compared to the previous
quarter, and showed the same period last year, which was USD 25.3
per square meter. Theprices for A+ properties were USD 27.39 per
square meter for the second quarter of 2020. In this context,
Catalinas presents as the zone with higher prices per square meter,
reaching an average of USD 33.0. Likewise, the industry reported a
3.0% decreased in rental prices for A properties compared to the
first quarter of 2020, reaching an average of USD 22.06 per square
meter, in which the North zone of Ciudad de Buenos Aires reach the
higher prices, reaching USD 30.7 per square meter.
251
Evolution of the Hotel industry in
Argentina
According
to the Hotel Vacancy Survey (EOH) prepared by INDEC, at June 2020,
overnight stays at hotel and parahotel establishments were
estimated at 0.54 million, 98.2% shorter than the same month the
previous year. Overnight stays by resident and nonresident
travelers decreased by 97.9% and 99.2%, respectively. Total
travelers who stayed at hotels during June were 0.54 million, a
98.2% decrease compared to the same month the previous year. The
number of resident and nonresident travelers decreased by 97.9% and
99.2%, respectively. The Room Occupancy Rate in June was 89.0%,
showing a sharp decrease compared to the same month the previous
year. Moreover, the Bed Occupancy Rate for the same period was
98.2%, which represents a sharp decrease compared to June
2019.
252
E. OFF-BALANCE SHEET ARRANGEMENTS
Agricultural Business
In the
ordinary course of business, FyO guarantees certain brokerage
transactions. Under the agreement, FyO guarantees the performance
of the producer in case it does not comply with the physical
delivery. We have recourse against the non-performing party. As of
June 30, 2020, the value of transacted merchandise for which
guarantees were granted amounted to ARS 156 million. As of the date
of this annual report, there were non-performing parties under the
agreements for which we had to respond as guarantor. As of the date
of this annual report, the value of transacted merchandise for
which guarantees were granted amounted to ARS 175
million.
Urban Properties and Investment Business
As of
June 30, 2020, IRSA did not have any off-balance sheet
transactions, arrangements or obligations with unconsolidated
entities or others that are reasonably likely to have a material
effect on our financial condition, results of operations or
liquidity.
F. TABULAR DISCLOSURE OF CONTRACTUAL OBLIGATIONS
The
followings tables show our contractual obligations, as of June 30,
2020.
|
As of June 30, 2020
|
Less than 1 year
|
Between 1 and 2 years
|
Between 2 and 3 years
|
Between 3 and 4 years
|
Later than 4 years
|
Total
|
|
|
(in
millions of ARS)
|
|||||
|
Trade
and other payables
|
33,366
|
625
|
318
|
293
|
122
|
34,724
|
|
Borrowings
(excluding finance lease liabilities)
|
113,319
|
72,628
|
130,365
|
43,412
|
123,521
|
483,245
|
|
Finance
leases obligation
|
6,081
|
4,590
|
3,240
|
2,130
|
8,953
|
24,994
|
|
Purchase
obligations
|
5,695
|
854
|
590
|
-
|
-
|
7,139
|
|
Derivative
Financial Instruments
|
346
|
47
|
6
|
-
|
-
|
399
|
|
Total
|
158,807
|
78,744
|
134,519
|
45,835
|
132,596
|
550,501
|
Where
the interest payable is not fixed, the amount disclosed has been
determined by reference to the existing conditions at the reporting
date.
G. SAFE HARBOR
See the
discussion at the beginning of this Item 5 and “Disclosure
regarding forward looking statements” in the introduction of
this annual report, for forward-looking statement safe harbor
provisions.
For
information about Production and Sales, please see “Item 5.A.
Consolidated Operating Results.”
A. DIRECTORS AND SENIOR MANAGEMENT
Board of Directors
We are
managed by a board of directors. Our bylaws provide that our Board
of Directors shall consist of a minimum of three and a maximum of
fifteen regular directors and the same or less numbers of alternate
directors. Currently, our board is composed by twelve regular
directors and five alternate directors. Each director and alternate
director is elected by our shareholders at an annual ordinary
meeting of shareholders usually for a three-year term, provided,
however, that of the board of directors is elected each year. The
directors and alternate directors may be re-elected
indefinitely.
Alternate
directors will be summoned to exercise their functions in case of
absence, vacancy or death of a regular director or until a new
director is appointed.
253
The
table below shows information about our regular directors and
alternate directors as of October 26, 2020:
|
Directors
(1)
|
Date of Birth
|
Position
in Cresud
|
Term Expires (2)
|
Date appointed
|
Current Position Held Since
|
|
Eduardo
S. Elsztain
|
01/26/1960
|
Chairman
|
06/30/20
|
10/31/17
|
1994
|
|
Saúl
Zang
|
12/30/1945
|
First
Vice-Chairman
|
06/30/20
|
10/31/17
|
1994
|
|
Alejandro
G. Elsztain
|
03/31/1966
|
Second
Vice-Chairman and CEO
|
06/30/22
|
10/31/16
|
1994
|
|
Gabriel
A.G. Reznik
|
11/18/1958
|
Regular
Director
|
06/30/21(2)
|
10/29/18
|
2003
|
|
Jorge
O. Fernández
|
01/08/1939
|
Regular
Director
|
06/30/21(2)
|
10/29/18
|
2003
|
|
Fernando
A. Elsztain
|
01/04/1961
|
Regular
Director
|
06/30/22
|
10/31/16
|
2004
|
|
Pedro
D. Labaqui Palacio
|
02/22/1943
|
Regular
Director
|
06/30/21(2)
|
10/29/18
|
2006
|
|
Alejandro
G. Casaretto
|
10/15/1952
|
Regular
Director
|
06/30/20
|
10/31/17
|
2008
|
|
Liliana
Glikin
|
29/03/1953
|
Regular
Director
|
06/30/22
|
10/30/19
|
2019
|
|
Alejandro
Bartolome
|
09/12/1954
|
Regular
Director
|
06/30/22
|
10/30/19
|
2019
|
|
Gabriela
Macagni
|
13/01/1964
|
Regular
Director
|
06/30/22
|
03/11/20
|
2020
|
|
Mariana
R. Carmona
|
02/11/1961
|
Regular
Director
|
06/30/23
|
10/26/20
|
2020
|
|
Gastón
A. Lernoud
|
06/04/1968
|
Alternate
Director
|
06/30/20
|
10/31/17
|
1999
|
|
Enrique
Antonini
|
03/16/1950
|
Alternate
Director
|
06/30/22
|
10/31/16
|
2007
|
|
Eduardo
Kalpakian
|
03/03/1964
|
Alternate
Director
|
06/30/22
|
10/31/16
|
2007
|
|
Iair
Elsztain
|
05/03/1995
|
Alternate
Director
|
06/30/22
|
03/11/20
|
2020
|
|
Ilan
Elsztain
|
01/08/1992
|
Alternate
Director
|
06/30/22
|
03/11/20
|
2020
|
(1)
The business
address of our management is Moreno 877, 23rd Floor, (C1091AAQ)
Buenos Aires, Argentina.
(2)
Term expires at the
annual ordinary shareholders’ meeting.
Liliana
Glikin,
Alejandro Bartolome,
Graciela Macagni, Enrique Antonini and Eduardo Kalpakian, qualify
as independent, in accordance with the CNV Rules.
The
following is a brief biographical description of each member of our
board of directors:
Eduardo Sergio Elsztain.
Mr. Elsztain has been engaged in
the real estate business for more than twenty-five years. He is the
chairman of the board of Directors of Cresud, IRSA Propiedades
Comerciales S.A. (IRSA CP), IRSA, IDB Development Corporation Ltd,
Discount Investment Corporation Ltd., Banco Hipotecario S.A.,
BrasilAgro Companhia Brasileira de Propriedades Agrícolas
Ltda., Austral Gold Ltd., Consultores Assets Management S.A., among
other companies. He also Chairs IRSA Foundation, is a member of the
World Economic Forum, the Council of the Americas, the Group of 50
and the Argentine Business Association (AEA), among others. He is
co-founder of Endeavor Argentina and serves as VicePresident of the
World Jewish Congress. Mr. Eduardo Sergio Elsztain is Fernando
Adrián Elsztain’s cousin and Alejandro Gustavo
Elsztain’s brother.
Saúl Zang.
Mr. Zang obtained a law degree from the
Universidad de Buenos Aires. He is a member of the International
Bar Association and of the Interamerican Federation of Lawyers. He
was a founding partner of Zang, Bergel & Viñes Law Firm.
Mr. Zang is Vice-chairman of Cresud, IRSA CP, Consultores Assets
Management S.A. and other companies such as Fibesa S.A. and
Chairman at Puerto Retiro S.A. He is also director of IDB
Development Corporation Ltd., Discount Investment Corporation Ltd.,
Banco Hipotecario S.A., BrasilAgro Companhia Brasileira de
Propriedades Agrícolas Ltda., BACS Banco de Crédito &
Securitización S.A., Nuevas Fronteras S.A., and Palermo Invest
S.A., among other companies.
Alejandro Gustavo Elsztain.
Mr. Elsztain graduated as
an Agricultural Engineer from the University of Buenos Aires. He
then completed the Advanced Management Program at Harvard Business
School in June 1999. He has been CEO of Cresud since 1994,
currently serving as II Vice President of IRSA and Executive Vice
President of IRSA CP. He is also director of BrasilAgro, a
Brazilian agricultural company. He also serves as director of IDBD,
President of Gav Yam and Mehadrin, and Vice President of PBC
(Companies dedicated to the Real Estate and Fruit business in
Israel Mr. Alejandro Gustavo Elsztain is brother of our Chairman,
Eduardo Sergio Elsztain, cousin of Fernando Adrián Elsztain
and father of Iair Elzstain and Ilan Elzstain.
254
Gabriel A. G. Reznik.
Mr. Reznik obtained a degree in Civil
Engineering from Universidad de Buenos Aires. He worked for IRSA
since 1992 until May 2005 at which time he resigned. He had
formerly worked for an independent construction company in
Argentina. He is director of Banco Hipotecario S.A.
Jorge Oscar Fernández.
Mr. Fernández obtained a
degree in Economic Sciences from Universidad de Buenos Aires. He
has performed professional activities at several banks, financial
corporations, insurance firms and other companies related to
financial services. He is also involved in many industrial and
commercial institutions and associations
.
Fernando Adrián Elsztain.
Mr. Elsztain earned an
architecture degree from Universidad de Buenos Aires. He has been
engaged in the real estate business as a consultant and as managing
officer of a real estate company. He is chairman of the Board of
Directors of Palermo Invest S.A. and Nuevas Fronteras S.A. He is
also a director of Hoteles Argentinos S.A. and Llao Llao Resorts
S.A., and an alternate director of Banco Hipotecario S.A. and
Puerto Retiro S.A. Mr. Fernando Adrián Elsztain is cousin of
our Chairman, Eduardo Sergio Elsztain, and our director Alejandro
Gustavo Elsztain.
Pedro Damaso Labaqui Palacio.
Mr. Labaqui obtained a law degree
from Universidad de Buenos Aires. He is also director of Bapro
Medios de Pago S.A., permanent statutory auditor of Bayfe S.A.
Fondos Comunes de Inversión, director and member of the
Supervisory Committee of J. Minetti S.A., and Director of REM
Sociedad de Bolsa S.A.
Alejandro Gustavo Casaretto.
Mr. Casaretto obtained a degree
in agricultural engineering from Universidad de Buenos Aires. He
has served as our technical manager, farm manager, and technical
coordinator since 1975.
Liliana Irene Glikin.
Ms.
Glikin has obtained a law degree from the Universidad de Buenos
Aires and a journalist degree from the Journalism School of the
“Circulo de la Prensa”. She is also law professor at
the Universidad de Buenos Aires. She is partner and legal advisor
in “Stolkiner y Asociados” firm.
Alejandro Mario Bartolome.
Mr. Bartolomé has a degree
in agronomy from the Universidad de Buenos Aires and also has a
Master of Science from the Reading University, England. He is an
entrepreneur and wine producer. He is co-founder and director of
Don Mario, a company focus on genetics. He has worked as production
manager and CEO of the Company.
Gabriela Macagni
.
Ms. Macagni has a degree in
checmical engineering from the Technological Institute of Buenos
Aires (ITBA) and postgraduate degrees in business from the Harvard
Business School and the Stanford Business School. She started her
career in 1987 as a consultant at Accenture. From 2015 to 2019 she
served as independent director of Grupo Supervielle where she was a
member of the Audit, Human Resources, Compliance and Corporate
Governance Committees. She is currently a board member of Sofital
S.A, a subsidiary of the Supervielle Group, and supervises the
Superville Corporate Venture Fund. She is also a member of the ITBA
board and trustee of the Asociación Civil Educativa San
Andrés.
Mariana R. Carmona.
Ms. Carmona has a degree on Psychology
from the Universidad de Buenos Aires. In 1999 she founded the
“Museo de los Niños” in the city of Buenos Aires,
of which she is currently a director, and in 2004 she founded the
“Museo de los Niños” in the city of Rosario. She
is married with our chairman Eduardo S. Elsztain and she is the
mother of Ilan, Iair and Ben Elsztain.
Gastón Armando Lernoud.
Mr. Lernoud obtained a law degree
in Universidad El Salvador in 1992. He obtained a Master in
Corporate Law in Universidad de Palermo in 1996. He has been senior
associate in Zang, Bergel & Viñes Law Firm until June
2002, when he joined Cresud as legal counsel.
Enrique Antonini.
Mr. Antonini holds a degree in law
from the School of Law of Universidad de Buenos Aires. He has been
director of Banco Mariva S.A. since 1992 until today, and alternate
director of Mariva Bursátil S.A. since 2015. He is a member of
the Argentine Banking Lawyers Committee and the International Bar
Association.
Eduardo Kalpakian.
Mr. Kalpakian holds a degree in business
from the Universidad de Belgrano. He has also an MBA from
Universidad del CEMA. He has been director for 25 years of
Kalpakian Hnos. S.A.C.I., a leading carpet manufacturer and
flooring distributor in Argentina. Currently he is vice-chairman of
such company’s board and CEO. He is also vice-chairman of the
board of La Dormida S.A.A.C.E I.
255
Iair Elsztain.
Mr. Elsztain is
currently studying for a degree in industrial engineering at the
UADE Faculty of Engineering. He previously served as general
manager at Iaacob House Hostel. He has also interned at Olive Tree
Venture Capital (Tel Aviv), an investment fund dedicated to
companies in the technology and healthcare industry.
Mr. Ilan Elsztain is
the son of our chairman, Eduardo Sergio Elsztain, nephew of
Alejandro Gustavo Elsztain and brother of Iair
Elsztain.
Ilan Elsztain
.
Mr. Elsztain holds a
degree in economics from the University of Buenos Aires. He has
previosuly worked in various of our group companies: Avenida,
Fibesa and IRSA Propiedades Comerciales. He is currently alternate
director of CAMSA, where he conducts research. Mr. Ilan Elsztain is
the son of our chairman, Eduardo Sergio Elsztain, nephew of
Alejandro Gustavo Elsztain and brother of Iair
Elsztain.
Employment contracts with
certain
members of our board of
directors
We do
not have written contracts with our directors. However, Eduardo S.
Elsztain, Saul Zang, Alejandro G. Elsztain, Fernando A. Elsztain
and Gaston Lernoud are employed by us under the Labor Contract Law
No. 20,744.
Law No.
20,744 governs certain conditions of the labor relationship,
including remuneration, protection of wages, hours of work,
holidays, paid leave, maternity protection, minimum age
requirements, protection of young workers and suspension and
termination of the contract.
Senior Management
Senior
management performs its duties in accordance with the instructions
of our board of directors. There are no arrangements by which a
person is selected as a member of our senior
management.
The
following table shows information about our current senior
management of the Operations Center in Argentina (designated by the
board of directors meeting):
|
Name
|
Date of Birth
|
Position
|
Current Position Held Since
|
|
Alejandro
G. Elsztain
|
03/31/1966
|
CEO
|
1994
|
|
Carlos
Blousson
|
09/21/1963
|
General
Manager for Argentina and Bolivia Operations
|
2008
|
|
Matías
I. Gaivironsky
|
02/23/1976
|
Chief
Financial and Administrative Officer
|
2011
|
|
Alejandro
Casaretto
|
10/15/1952
|
Chief
Regional Agricultural Officer
|
2008
|
The
following is a biographical description of each of our senior
managers who are not directors:
Matías Iván Gaivironsky
. Mr. Matías
Gaivironsky obtained a degree in business administration from
Universidad de Buenos Aires. He has a master’s degree in
Finance from Universidad del CEMA. Since 1997 he has served in
various positions at IRSA, IRSA CP and the Company, and was
appointed Chief Financial Officer in December 2011 and in early
2016 he was appointed as Chief Financial and Administrative
Officer. Previously, Mr. Gaivironsky acted as Chief Financial
Officer of Tarshop S.A. until 2008. He is also director at Condor
Hospitality REIT.
Carlos Blousson
.
Mr.
Blousson obtained a degree in agricultural engineering from
Universidad de Burnos Aires (
Universidad de Buenos Aires
). He has
been working as our Chief Sales Officer since 1996. Prior to
joining us, he worked as a futures and options operator at Vanexva
Bursátil –Sociedad de Bolsa. Previously, he worked as a
farmland manager and a technical advisor at Leucon
S.A.
Executive Committee
Pursuant
to our by-laws, our day-to-day business is managed by an executive
committee consisting of a minimum of four and a maximum of seven
directors and one alternate member, among which there should be the
chairman, first vice-chairman and second vice-chairman of the board
of directors. The current members of the Executive Committee are
Messrs. Eduardo S. Elsztain, Saúl Zang, Alejandro Elsztain and
Fernando A. Elsztain.
The
executive committee is responsible for the management of the
day-to-day business pursuant to authority delegated by our board of
directors in accordance with applicable law and our by-laws. Our
by-laws authorize the executive committee to:
●
designate the
managers and establish the duties and compensation of such
managers;
●
grant and revoke
powers of attorney to attorneys-at-law on behalf of
us;
256
●
hire, discipline
and fire personnel and determine wages, salaries and compensation
of personnel;
●
enter into
contracts related to our business;
●
manage our
assets;
●
enter into loan
agreements for our business and set up liens to secure our
obligations; and
●
perform any other
acts necessary to manage our day-to-day business.
Supervisory Committee
Our
Supervisory Committee is responsible for reviewing and supervising
our administration and affairs, and verifying compliance with the
bylaws and the decisions adopted at shareholders’ meetings
pursuant to the provision of the General Companies Law. The members
of the Supervisory Committee are appointed at the annual general
ordinary shareholders’ meeting for a term of one year. The
Supervisory Committee is composed of three members and three
alternate members.
The
following table shows information about the members of our
Supervisory Committee, who were elected in the annual general
ordinary shareholders’ meeting which was held on October
26
th
,
2020:
|
Member
|
Date of Birth
|
Position
|
|
José
Daniel Abelovich
|
07/20/1956
|
Member
|
|
Marcelo
Héctor Fuxman
|
11/30/1955
|
Member
|
|
Noemí
Ivonne Cohn
|
05/20/1959
|
Member
|
|
Roberto
Daniel Murmis
|
04/07/1959
|
Alternate
Member
|
|
Cynthia
Deokmelian
|
06/08/1976
|
Alternate
Member
|
|
Paula
Sotelo
|
08/10/1971
|
Alternate
Member
|
All
members of the supervisory committee qualify as independent, in
accordance with CNV Resolution No. 400/2002 Rules.
Set
forth below is a brief biographical description of each member of
our Supervisory Committee:
José Daniel Abelovich.
Mr. Abelovich obtained a degree
in accounting from the Universidad de Buenos Aires. He is a
founding member and partner of Abelovich, Polano & Asociados
S.R.L./firm member of Nexia International, a public accounting firm
in Argentina. Formerly, he had been a manager of Harteneck,
López y Cía/Coopers & Lybrand and has served as a
senior advisor in Argentina for the United Nations and the World
Bank. He is a member of the Supervisory Committees of IRSA, IRSA
CP, Hoteles Argentinos S.A., Inversora Bolívar S.A., and Banco
Hipotecario S.A, among other companies.
Marcelo Héctor Fuxman.
Mr. Fuxman obtained a degree in
accounting from the Universidad de Buenos Aires. He is a partner of
Abelovich, Polano & Asociados S.R.L./firm member of Nexia
International, a public accounting firm in Argentina. He is also a
member of the Supervisory Committees of IRSA, IRSA CP, Inversora
Bolívar S.A., and Banco Hipotecario S.A., among other
companies.
Noemí Ivonne Cohn.
Ms. Cohn obtained a degree in
accounting from the Universidad de Buenos Aires. Ms. Cohn is a
partner at Abelovich, Polano & Asociados S.R.L./firm member of
Nexia International, public accounting firm in Argentina, and works
in the audit area. Mrs. Cohn worked in the audit area in Harteneck,
Lopez and Company, Coopers & Lybrand in Argentina and in Los
Angeles, California. Mrs. Cohn is member of the Supervisory
Committees of IRSA and IRSA CP, among other companies.
Roberto Daniel Murmis.
Mr. Murmis holds a degree in
accounting from the Universidad de Buenos Aires. Mr. Murmis is a
partner at Abelovich, Polano & Asociados S.R.L/firm member of
Nexia International, a public accounting firm in Argentina. Mr.
Murmis worked as an advisor to the Public Revenue Secretariat,
Argentine Ministry of Economy. Furthermore, he is a member of the
Supervisory Committee of IRSA, IRSA CP, Futuros y Opciones S.A.,
and Llao Llao Resorts S.A., among other companies.
Cynthia Deokmelian.
Mrs Deokmellian obtained a degree in
accounting from Universidad de Buenos Aires. She is a Director of
the Audit department of Abelovich, Polano y Asociados S.R.L. /
Nexia International, an accounting firm in Argentina. Mrs.
Deokmellian worked in the Audit department of KPMG in Argentina for
more than 23 years.
Paula
Sotelo.
Ms. Sotelo obtained a degree in accounting from
Universidad de Buenos Aires. She is a Director of the Audit
department of Abelovich, Polano y Asociados S.R.L. / Nexia
International, an accounting firm in Argentina, Ms. Sotelo worked
for KPMG in Argentina and also New
York.
257
KEY EMPLOYEES
There
are no key employees.
B. COMPENSATION
Compensation of directors
Under
the Argentine Law, if the compensation of the members of the Board
of Directors is not established in the by-laws of the Company, it
should be determined by the shareholders’ meeting. The
maximum amount of total compensation to the members of the Board of
Directors, including compensation for technical or administrative
permanent activities, cannot exceed 25% of the earnings of the
Company. That amount should be limited to 5% when there is no
distribution of dividends to shareholders and will be increased
proportionally tothe distribution, in accordance with the formulas
and scales set forth under the CNV Rules. When one or more
directors perform special commissions or technical or
administrative activities, and there are no earnings to distribute
or they are reduced, the shareholding meeting shall approve
compensation in excess of the above metioned limits.
The
compensation of our directors for each fiscal year is determined
pursuant to Argentine law, and taking into consideration whether
the directors performed technical or administrative activities and
our fiscal year’s results. Once the amount is determined, it
is considered at the shareholders’ meeting.
At our
shareholders’ meeting held on October 26, 2020, a
compensation for an aggregate amount of ARS 62.2 millionwas
approved for all of our directors for the fiscal year ended June
30, 2020.
Compensation of Supervisory Committee
Our
shareholders’ meeting held on October 26, 2019 further
approved by majority vote a compensation for an aggregate amount of
ARS 1.6 millionto our Supervisory Committee for the fiscal year
ended June 30, 2020.
Compensation of Senior Management
Our
senior management is paid a fixed amount established by taking into
consideration their background, capacity and experience and an
annual bonus which varies according to their individual performance
and our results.
The
total and aggregate compensation paid to our senior management of
the Operations Center in Argentina and the Agricultural Business
for the fiscal year 2020, was ARS 26.1 million.
Compensation of the Audit Committee
The
members of our Audit Committee do not receive any additional
compensation other than that received for their services as members
of our board of directors.
Capitalization Program for our executive staff
We have
a defined contribution plan covering the members of our management
team. The Plan became effective on January 1, 2006. Employees
may begin participation voluntarily on monthly enrollment dates.
Participants may make pre-tax contributions to the Plan of up to
2.5% of their monthly salary, or the “Base
Contributions”, and pretax contributions of up to 15% of
their annual bonuses, or “Extraordinary Contributions”.
Under the Plan, we match employee contributions to the plan at a
rate of 200% for Base Contributions and 300% for Extraordinary
Contributions.
Contribution
expense was ARS 51 million and ARS 60 million for the fiscal years
ended June 30, 2020 and 2019, respectively. Employee
contributions are held in a mutual fund. Contributions we make on
behalf of our employees are held temporarily in a company account
until the trust is set up. Individual participants may direct the
trustee to invest their accounts in authorized investment
alternatives. Participants or their assignees, as the case may be,
may have access to 100% of our contributions under the following
circumstances:
1.
ordinary retirement in accordance with applicable labor
regulations;
2.
total or permanent incapacity or disability; or
3. death.
In case of
resignation or unjustified termination, the beneficiary may redeem
the amounts contributed by us only if he or she has participated in
the Plan for at least five years.
258
Long Term Incentive Program
The
Shareholders’ Meetings held on October 31, 2011, October 31,
2012, and October 31, 2013, ratified the resolutions approved
thereat as regards the incentive plan for the Company’s
executive officers, up to 1% of its shareholders’ equity by
allocating the same number of own treasury stock (the
“Plan”), and delegated on the Board of Directors the
broadest powers to fix the price, term, form, modality, opportunity
and other conditions to implement such plan. In this sense and in
accordance with the new Capital Markets Law, the Company has made
the relevant filing with the CNV and pursuant to the comments
received from such entity, it has made the relevant amendments to
the Plan which, after the CNV had stated to have no further
comments, were explained and approved at the Shareholders’
Meeting held on November 14, 2014, where the broadest powers were
also delegated to the Board of Directors to implement such
plan.
The
Company has developed a medium and long term incentive and
retention stock program for its management team and key employees
under which share-based contributions were calculated based on the
annual bonus for the years 2011, 2012, 2013 and 2014.
The
beneficiaries under the Plan are invited to participate by the
Board of Directors and their decision to access the Plan was
voluntary.
In the
future, the Participants or their successors in interest will have
access to 100% of the benefit (Cresud’s shares contributed by
the Company) in the following cases:
●
if an employee
resigns or is dismissed for no cause, he or she will be entitled to
the benefit only if 5 years have elapsed from the moment of each
contribution.
●
retirement.
●
total or permanent
disability.
●
death.
While
participants are part of the program and until the conditions
mentioned above are met to receive the shares corresponding to the
contributions based on the 2011 to 2013 bonus, participants will
receive the economic rights corresponding to the shares assigned to
them. As provided underthe plan, the shares of stock corresponding
to the 2014 bonus were delivered in April 2015; moreover, an amount
equivalent to one salary was delivered in the form of shares of
stock to those employees who did not participate in the plan and
who had discharged services for a term of two yeARS
The
shares allocated to the Plan by the Company are shares purchased in
2009, which the Shareholders’ Meeting held on October 31,
2011, has specifically decided to allocate to the
program.
On
October 30, 2019, the shareholders’ meeting approved the
implementation of a new incentive plan for directors, management
and employees based on the granting of shares for the long term
remuneration of its executives, directors and employees, which
accomplish certain requirements in terms of seniority and internal
category. In that sense, the shareholders approved a capital
increase for up to 1% of the capital stock at the time of the
execution of the plan intended. This increase will, consequently,
be subscribed and integrated to the extent that the new shares
issued to the beneficiaries of the plan are allocated.
DIC’s
current CEO of the Operations Center in Israel, has a stock option
plan which includes 5,310,000 options, that will be given in five
series, and which may be exercised for 5,310,000 ordinary shares,
par value NIS per share of DIC. DIC’s CEO has exercised the
first stage and as of June 2019 holds 4,248,000 options.
DIC’s CFO of the Operations Center in Israel, has a stock
option plan which includes 621,362 options, par value NIS per share
of DIC, which 372,816 of the said options were exercised by him and
as of June 2019 holds 248,546 options.
DIC’s
newly appointed CEO of the Operations Center in Israel, will get a
stock option plan which includes 2,500,000 options, that will be
given in five series
over
a period of 5 years from the beginning of his term, and which may
be exercised for 2,500,000 ordinary shares, par value NIS 1 per
share of DIC.
259
Long Term Incentive Plan based on Shares
On October 2, 2017, the Shareholders approved the creation of the
Long Term Incentive Plan based on Shares (or “ILPA
Plan”). By the terms of the ILPA Plan, participants will be
entitled to receive a number of shares if they remain in the
Company during certain period of time and comply with certain key
performance indicators (“KPIs”). The terms of the ILPA
Plan determine that the Board of Directors will have broad powers
to implement the ILPA Plan and take all necessary measures for its
implementation.
The shares to be granted under the ILPA Plan may not exceed at any
time the maximum and cumulative amount of 2% of the shares issued
by the Company.
The first award of incentives was approved by the Board of
Directors on June 18, 2018, the date on which the First ILPA
Program was approved and the beneficiaries, the number of shares to
be delivered, the vesting period and the KPIs to be reached were
defined.
The vesting period for the first ILPA Program is between October 2,
2017 and October 2, 2019 and the participants were selected among
those who acted as company’s employees at the beginning of
the vesting period considering their position in the company and
its related remuneration as of that date.
Certain KPIs must be achieved for shares to be delivered to
participants, in addition to remain in the Company until the end of
the vesting period. One of the KPIs is to reach a certain
percentage of valuation in the price of AGRO3 shares during the
vesting period: If this percentage is not reached, the participants
will not be entitled to receive any share. In the event that the
KPI for the valuation of the shares is fulfilled, the number of
shares to be delivered will vary in 3 ranges depending on the level
of achievement of another 3 KPI, in addition to being adjusted by
the dividends per share distributed during the vesting period, as
well as an increase in a fixed amount if the value of the share is
above the floor value.
The fair value of the benefit was estimated at ARS 0.10. In the
initial measurement of the fair value of the benefit, the price of
the AGRO3 per share was considered on the date of granting and the
probable quotation of the share price is projected at the end of
the vesting period based on the past performance of the price per
share in a period of 1 year and 4 months (compatiblewith the period
between the granting in June 2018 and the end of the vesting period
in October 2018). Considering the volatility of the AGRO3 share,
the probability of the price per share at the end of the vesting
period was determined to reach the value necessary to comply with
the KPI.
The maximum number of shares to be issued is 447,127 (granted on
June 18, 2018 and available on June 30, 2019). During the period,
there were no cancellations or shares issued to the beneficiaries
and the amount of shares will be adjusted by the dividends per
share distributed during the vesting period.
To determine the number of shares and the amount of the
remuneration expense, the Company determines for each year the
estimated amount of shares to be delivered based on its best
estimate of the amount of each of the 3 KPIs which do not depend on
the price of the shares and the dividends to be paid in the same
vesting period. The amount of the expense is adjusted based on said
estimate and the effects recognized prospectively. The estimated
expense is recognized as of the granting in June 2018 ratably
during the vesting period between October 2, 2017 and October 2,
2019.
In the year ended June 30, 2020, compensation expenses and
remuneration charges are ARS 45.2 million (ARS 19.7 million and ARS
53.7 million as of June 30, 2019 and 2018, respectively) and the
accumulated amount is ARS 77.1 million.
C. BOARD PRACTICES
For
information about the date of expiration of the current term of
office and the period during which each director has served in such
office see “Item 6. Directors, Senior Management and
employees – A. Directors and Senior
Management.”
Benefits upon Termination of Employment
There
are no contracts providing for benefits to directors upon
termination of employment, other than those described under the
following sections: (i) Item 6 “Directors, Senior Management
and Employees – B. Compensation – Capitalization Plan
and (ii) Item 6 “Directors, Senior Management and Employees
– B. Compensation – Mid and Long Term Incentive
Program.
260
Internal Control
Management
uses the Internal Control-Integrated Framework issued by the
Committee of Sponsoring Organizations of the Treadway Commission
(the “COSO Report”) to assess effectiveness of internal
control over financial reporting.
The
COSO Report sets forth that internal control is a process, effected
by an entity’s board of directors, management and other
personnel, designed to provide reasonable assurance regarding the
achievement of the entity’s objectives in the following
categories:
-
Effectiveness and
efficiency of operations
-
Reliability of
financial reporting
-
Compliance with
applicable laws and regulations
Based
on the above, the Company’s internal control system involves
all levels of the company actively involved in exercising
control:
-
the board of
directors, by establishing the objectives, principles and values,
setting the tone at the top and making the overall assessment of
results;
-
the management of
each area is responsible for internal control in relation to
objectives and activities of the relevant area, i.e. the
implementation of policies and procedures to achieve the results of
the area and, therefore, those of the entity as a
whole;
-
the other personnel
plays a role in exercising control, by generating information used
in the control system or taking action to ensure
control.
Audit Committee
In
accordance with the Capital Markets Law No. 26.831 and the Rules of
the CNV, our board of directors has established an audit committee
which focus on assisting the board in exercising its duty of care,
compliance with disclosure requirements, supervise the operation of
the internal control systems and the administrative-accounting
system, supervise the application of the policies regarding
information on the company's risk management, ethical conduct of
our businesses, monitoring the sufficiency of our financial
statements, our compliance with the laws, independence and capacity
of independent auditors and performance of audit duties both by our
internal audit and our external auditors
and issue a well-founded opinion
regarding transactions with related parties in the cases
established by this law. These responsibilities are meant to comply
with the duties assigned by Law 26.831, the Technical Rules of the
CNV, and other applicable laws.
On
October 26, 2020, out board of directors appointed Messrs.
José Daniel Abelovich, Marcelo Héctor Fuxman and
Noemí Ivonne Cohn as Regular Statutory Auditors and Messrs.
Roberto Daniel Murmis, Cynthia Deokmelian and Paula Sotelo as
Alternate Statutory Auditors for a term of one fiscal
year.
Remuneration Committee
The
meeting held on October 26, 2020, approved by majority of votes a
budget of ARS 503,000, taking into account the effect of inflation
considering the eventual hiring of advisors / consultants and
trainings.
D. EMPLOYEES
Operations Center in Argentina
As of
June 30, 2020, we had 3,185 employees.
As of
such date, we had 1,035 employees in our Agricultural Business in
Argentina, including our employees, FyO and SACPSA but not those of
Agro-Uranga S.A. Approximately 62% are under collective labor
agreements.
We
employ 362 people in our International Agricultural businesses,
composed of 314 employees of Brasilagro, 27 employees in the
companies located in Paraguay, 21 employees in the companies
located in Bolivia.
261
Our
Real Estate Business had 1,496 employees. Our Development and Sale
of Properties and Other Non-Shopping Mall Businesses segment had 11
employees, The Shopping Mall segment had 784 employees including
365 under collective labor agreements. Our Hotels segment had 701
employees with 560 represented by the Tourism, Hotels and
Gastronomy Union from the Argentine Republic (
Unión de Trabajadores del Turismo,
Hoteleros y Gastronómicos de la República
Argentina
) (UTHGRA).
The
following table shows the number of employees in the
Company’s various businesses as of the dates mentioned
below:
|
|
|
Urban
Business
|
|
|
|
||
|
|
Agricultural
Business
(1)
|
Sales
and Developments
(2)
|
Shopping
Mall
(3)
|
Hotels
(4)
|
Shared
Service Center
(3)
|
Corporate
Areas
|
Total
|
|
June 30,
2018
|
1,304
|
31
|
928
|
812
|
191
|
115
|
3,381
|
|
June 30,
2019
|
1,360
|
12
|
865
|
832
|
194
|
107
|
3,370
|
|
June 30,
2020
|
1,397
|
11
|
784
|
701
|
188
|
104
|
3,185
|
(1) Agricultural Business includes CRESUD, FyO, SACPSA, and from
this fiscal year we also include in this disclosure the employees
of BrasilAgro, Cresca and Palmeira S.A.
(2) As of March 2019, we were no longer administrators of Consorcio
Libertador S.A. and Consorcio Maipu 1300 S.A
(3) On December 2018, the concession of the Buenos Aires Design
shopping mall ended.
(4) Includes Hotel Intercontinental, Libertador Hotel and Llao
Llao.
Operation Center in Israel
The
following table shows the number of employees as of June 30, 2020
of our Israeli operating center divided by company:
|
|
As of June 30,
|
||
|
|
2020
|
2019
|
2018
|
|
IDBD
|
-
|
1
|
1
|
|
DIC
|
32
|
39
|
39
|
|
Shufersal
(1)
|
14,800
|
15,762
|
15,155
|
|
Cellcom
|
2,961
|
3,901
|
3,988
|
|
Elron
|
11
|
13
|
13
|
|
Epsilon
|
45
|
45
|
50
|
|
IDB
Tourism
|
637
|
615
|
855
|
|
Modiin
|
4
|
1
|
1
|
|
PBC
(2)
|
223
|
552
|
614
|
|
Mehadrin
(3)
|
457
|
-
|
-
|
(1)
Includes Gydrom’s and New Pharm’s
employees.
(2)
Includes Gav-Yam’s, Ispro’s, Nave’s, Hon’s
y Mehadrin’s employees.
(3) In
2019 and 2018 included in PBC.
262
E.
SHARE OWNERSHIP
The following table
sets forth the amount and percentage of our shares beneficially
owned by our directors, Supervisory Committee and senior management
as of June 30, 2020:
(2)
|
|
|
Share
ownership
|
|
|
Name
|
Position
|
Number
of Shares
|
Percentage
|
|
Directors
|
|
|
|
|
Eduardo Sergio
Elsztain
(1)
|
Chairman
|
185,229,897
|
36.93
%
|
|
Saúl
Zang
|
First
vice-chairman
|
5,513,462
|
1.10
%
|
|
Alejandro Gustavo
Elsztain
|
Second vice-
chairman / Chief Executive Officer
|
10,012,430
|
2.00
%
|
|
Gabriel A. G.
Reznik
|
Director
|
-
|
-
|
|
Jorge Oscar
Fernández
|
Director
|
273,883
|
0.05
%
|
|
Fernando
Adrián Elsztain
|
Director
|
-
|
-
|
|
Pedro Damaso
Labaqui Palacio
|
Director
|
3,840
|
0.00
%
|
|
Daniel Elias
Mellicovsky
|
Director
|
-
|
-
|
|
Alejandro Gustavo
Casaretto
|
Director/Regional
manager of Agricultural Real Estate
|
135,413
|
0.03
%
|
|
Alejandro Mario
Bartolome
|
Director
|
-
|
-
|
|
Gabriela
Macagni
|
Director
|
-
|
-
|
|
Liliana Rene
Glikin
|
Director
|
-
|
-
|
|
Gastón Armando
Lernoud
|
Alternate
Director
|
26,157
|
0.01
%
|
|
Enrique
Antonini
|
Alternate
Director
|
-
|
-
|
|
Eduardo
Kalpakian
|
Alternate
Director
|
-
|
-
|
|
Ilan
Elsztain
|
Alternate
Director
|
20,903
|
0.00
%
|
|
Iair
Elsztain
|
Alternate
Director
|
602
|
0.00
%
|
|
|
|
|
|
|
Senior
Management
|
|
|
|
|
Matias
Gaivironsky
|
Chief Financial and
Administrative Officer
|
83,723
|
0.02
%
|
|
Carlos
Blousson
|
Chief Executive
Officer of the International Operation
|
-
|
-
|
|
|
|
|
|
|
Supervisory
Committee
|
|
|
|
|
José Daniel
Abelovich
|
Member
|
-
|
-
|
|
Marcelo Héctor
Fuxman
|
Member
|
-
|
-
|
|
Noemí Ivonne
Cohn
|
Member
|
-
|
-
|
|
Roberto Daniel
Murmis
|
Alternate
member
|
-
|
-
|
|
Alicia Graciela
Rigueira
|
Alternate
member
|
-
|
-
|
|
Sergio Leonardo
Kolaczyk
|
Alternate
member
|
-
|
-
|
|
|
|
|
|
|
Executive
Committee
|
|
|
|
|
Eduardo Sergio
Elsztain
|
Member
|
176,560,007
|
35.20
%
|
|
Saúl
Zang
|
Member
|
5,513,462
|
1.10
%
|
|
Alejandro Gustavo
Elsztain
|
Member
|
10,012,430
|
2.00
%
|
(1)
Includes (i)
73,372,351 shares beneficially owned by IFISA, for which Mr.
Eduardo S. Elsztain may be deemed beneficial owner, (ii) 920 common
shares owned by Consultores Venture Capital Uruguay S.A. for which
Mr. Eduardo S. Elsztain may be deemed beneficial owner, iii)
103,087,210 common shares owned by Agroninvestment S.A. for which
Mr. Eduardo S. Elsztain may be deemed beneficial owner, iv) 100,352
common shares directly owned by Mr. Eduardo S. Elsztain, and v)
8,669,690 shares of which IFISA retains voting power and right of
first refusal until 02/18/2021.
(2)
On October 26,
2020, Cresud’s annual meeting of shareholders was held. For
more information see section “Directors and Senior
Management”.
Option Ownership
No
options to purchase shares have been granted to our Directors,
Senior Managers, members of the Supervisory Committee, or Audit
Committee.
Employees’ Participation in our share Capital
There
are no arrangements for involving our employees in our capital
stock or related to the issuance of options, common shares or
securities other than those described under the following sections:
(i) “Item 6 - Directors, Senior Management and Employees
– B. Compensation – Capitalization Program for our
executive staff” and (ii) “Item 6 - Directors, Senior
Management and Employees – B. Compensation – Long Term
Incentive Program”.
263
A. MAJOR SHAREHOLDERS
Information about Major Shareholders
Share Ownership
The
following table sets forth information regarding ownership of our
capital stock by each person known to us to own beneficially at
least 5% of our common shares, ANSES (The Argentine Social Security
National Agency) and all our directors and officers as a
group.
|
|
Share
Ownership as of June 30, 2020
|
|
|
Shareholder
|
Number
of Shares
|
Percentage
|
|
Eduardo Sergio
Elsztain
(1)(2)
|
185,229,897
|
36.93
%
|
|
Directors and
officers
(3)
|
16,070,413
|
3.20
%
|
|
ANSES
|
19,273,045
|
3.84
%
|
|
Total
|
220,573,355
|
43.97
%
|
(1)
Eduardo S. Elsztain
is the Chairman of the board of directors of IFIS Limited, a
corporation organized under the laws of Bermuda and Inversiones
Financieras del Sur S.A., a corporation organized under the laws of
Uruguay. Mr. Elsztain holds (through companies controlled by him
and proxies) most of the voting power in IFIS Ltd., which owns 100%
of IFISA.
(2)
As a result, Mr.
Elsztain may be deemed beneficial owner of 36.93% of our total
shares, which includes (i) 73,372,351 common shares beneficially
owned by IFISA, for which Mr. Eduardo S. Elsztain may be deemed
beneficial owner, (ii) 940 common shares owned by Consultores
Venture Capital Uruguay S.A. for which Mr. Eduardo S. Elsztain may
be deemed beneficial owner, iii) 103,087,210 common shares owned by
Agroninvestment S.A. for which Mr. Eduardo S. Elsztain may be
deemed beneficial owner, iv) 100,352 common shares directly owned
by Mr. Eduardo S. Elsztain and v) 8,669,890 shares of which IFISA
retains voting power and right of first refusal over until
02/18/2021.
(3)
Includes only
direct ownership of our Directors and Senior Management, other than
Mr. Eduardo S. Elsztain.
|
|
As
of June 30,
|
||||
|
|
2020
|
2019
|
2018
|
2017
|
2016
|
|
Eduardo S.
Elsztain
(1)(2)
|
36.93
%
|
36.38
%
|
34.74
%
|
30.8
%
|
30.9
%
|
|
Newfoundland
Capital Management
(3)
|
0.82
%
|
10.97
%
|
9.0
%
|
-
|
-
|
|
Macquarie
Investment Management
(3)
|
4.83
%
|
5.0
%
|
-
|
-
|
-
|
|
Senvest Management
LLC
(3)
|
0.00
%
|
0.0
%
|
0.7
%
|
3.3
%
|
4.8
%
|
|
Directors and
officers
(4)
|
3.20
%
|
3.0
%
|
2.8
%
|
2.8
%
|
2.9
%
|
|
ANSES
|
3.84
%
|
3.7
%
|
3.6
%
|
3.6
%
|
3.6
%
|
(1)
Eduardo S. Elsztain
is the Chairman of the board of directors of IFIS Limited, a
corporation organized under the laws of Bermuda and Inversiones
Financieras del Sur S.A., a corporation organized under the laws of
Uruguay. Mr. Elsztain holds (through companies controlled by him
and proxies) most of the voting power in IFIS Ltd., which owns 100%
of IFISA.
(2)
As a result, Mr.
Elsztain may be deemed beneficial owner of 36.93% of our total
shares, which includes (i) 73,372,351 common shares beneficially
owned by IFISA, for which Mr. Eduardo S. Elsztain may be deemed
beneficial owner, (ii) 940 common shares owned by Consultores
Venture Capital Uruguay S.A. for which Mr. Eduardo S. Elsztain may
be deemed beneficial owner, iii) 103,087,210 common shares owned by
Agroninvestment S.A. for which Mr. Eduardo S. Elsztain may be
deemed beneficial owner, iv) 100,352 common shares directly owned
by Mr. Eduardo S. Elsztain and v) 8,669,890 shares of which IFISA
retains voting power and right of first refusal over until
02/18/2021.
(3)
According to the
Form filed with the SEC.
(4)
Includes only
direct ownership of our Directors and Senior Management, other than
Mr. Eduardo S. Elsztain.
Difference in Voting Rights
Our
major shareholders do not have different voting
rights.
Arrangements for change in control
There
are no arrangements that may at a subsequent date in a change in
control.
Securities held in the host country
As of June 30, 2020, our total issued and outstanding capital stock
outstanding consisted of 501,642,804 common shares. As of June 30,
2020, there were approximately 40,431,202 Global Depositary Shares
(representing 404,312,020 of our common shares, or 80.60% of all of
our outstanding shares held) in the United States by approximately
37 registered holders of Global Depositary Shares.
As of June 30, 2020, our directors and senior officers controlled,
directly or indirectly, approximately 38.4% of our common shares.
As a result, these shareholders have, and will continue to have,
significant influence on the election of our directors and the
outcome of any action requiring shareholder approval.
264
B. RELATED PARTY TRANSACTIONS
A
related party transaction is any transaction entered into directly
or indirectly by us or any of our subsidiaries that is material
based on the value of the transaction to: (a) us or any director,
officer or member of our management or shareholders; (b) any entity
in which any person described in clause (a) is interested; or (c)
any person who is connected or related to any person described in
clause (a).
Offices and Shopping Mall Leases
We rent
office space for our executive offices located at the
Intercontinental Plaza tower at Moreno 877, floor 24, City of
Buenos Aires, Argentina which IRSA CP has owned since December
2014. We also rent an office space that IRSA CP owns at the Abasto
Shopping Mall.
The
offices of Eduardo S. Elsztain, the chairman of our board of
directors and our controlling shareholder, are located at Bolivar
108, City of Buenos Aires, Argentina. This property has been rented
to a company controlled by family members of Mr. Elsztain and
to a company controlled by Fernando A. Elsztain, one of our
directors and the cousin of Mr. Eduardo S. Elsztain, and members of
his family.
In
addition, we, IRSA, BACS Banco de Crédito y
Securitización S.A. (“BACS”), BHN Sociedad de
Inversión S.A., BHN Seguros Generales S.A. and BHN Visa S.A.
rent offices owned by IRSA CP in different buildings.
Furthermore,
we also lease various stores, stands, storage space or advertising
spaces in IRSA CP’s shopping malls to third parties and
related parties such as Banco Hipotecario S.A.
Lease
agreements entered into with affiliates have included similar
provisions and amounts to those included in agreements with
unaffiliated third parties.
On August 29, 2019, DIC’s Audit Committee approved entering
into an agreement with IDBD, PBC, Gav-Yam and Elron to divide the
uses and expenses at the joint offices to which the companies would
move their offices in the ToHa project on Totzeret Ha’aretz
Street in Tel Aviv, pursuant to a tenancy agreement that the
companies entered into with Gav-Yam and Amot Hashkaot Ltd. for the
tenancy of offices and parking spaces for the period beginning July
1, 2019, and ending upon the expiration of 15 years or upon the
expiration of the two option periods (of five years
each).
Agreement for the Exchange of Corporate Services with IRSA and IRSA
CP
Considering that each of IRSA, IRSA CP and us have operations that
overlap to a certain extent, our board of directors deemed it
advisable to implement alternatives designed to reduce certain
fixed costs of our combined activities and to mitigate their impact
on our operating results while seizing and optimizing the
individual efficiencies of each of them in the different areas
comprising the management of operations.
To such end, on June 30, 2004, IRSA, IRSA CP and we entered
into a Master Agreement for the Exchange of Corporate Services, or
the “Framework Agreement,” which has been amended
several times in line with evolving operating requirements. The
goal of the Framework Agreement is to increase efficiency in the
distribution and deployment of corporate resources and reduce
operating costs. The Framework Agreement had an initial term of
additional 24 months and is renewable automatically for
24-month term, unless terminated by any of the parties upon prior
notice.
The Framework Agreement currently provides for the exchange and
sharing of services among the following areas: Corporate Human
Resources; Administration and Finance; Planning; Institutional
Relations; Compliance; Shared Services Center; Safety; Legal
Affairs – Corporate; Technical; Infrastructure and Services;
Purchases and Hiring; Proceedings and Permits; Corporate
Environment and Quality; Investments; Rental Offices; Bolívar;
Real Estate Business Board of Directors to be Distributed;
Attorneys-in–Fact; General Management Department to be
Distributed; Board of Directors’ Safety; Real Estate Business
Management; and Real Estate Business Human Resources and Accounting
and Reporting.
Annually, a review of the criteria used in the determination of
pricing for corporate services, as well as the bases of cost
distribution and supporting documentation used in the
aforementioned process. The risk management and audit area
coordinate the review, which, in turn, periodically delegated the
review to an external consultant. The operations described above
allow IRSA, IRSA CP and us to keep our strategic and commercial
decisions fully independent and confidential, with cost and profit
apportionment allocated on the basis of operating
efficiency
and equity, without any one company
benefiting at the expense of the others.
265
Hospitality Services
We and
our related parties hire, on certain occasions, hotel services and
lease conference rooms for events to Nuevas Fronteras S.A., Hoteles
Argentinos S.A. and Llao Llao Resorts S,A., subsidiaries of IRSA,
all on arm’s-length terms and conditions.
Financial and Service Operations
We work
with several financial entities in Argentina for operations
including, but not limited to, credit, investment, purchase and
sale of securities and financial derivatives. Such entities include
Banco Hipotecario S.A. and its subsidiaries. Furthermore, Banco
Hipotecario and BACS usually act as underwriters in capital market
transactions
we undertake. In
addition, we invest from time to time our cash fund in mutual funds
managed by BACS Administradora de Activos S.A. S.G.F.C.I., which is
a subsidiary of Banco Hipotecario S.A., among other
entities
.
Donations to Fundación IRSA and Fundación Museo de los
Niños
Fundación
IRSA is a non-profit charity that seeks to support and generate
initiatives concerning education, the promotion of corporate social
responsibility and the entrepreneurial spirit of young adults. It
carries out corporate volunteer programs and fosters donations from
our employees. The main members of Fundación IRSA’s
board of directors are: Eduardo S. Elsztain (President); Saúl
Zang (Vice President I); Alejandro Elsztain (Vice President II);
Mariana C. de Elsztain (Secretary);
Oscar Marcos Barylka (Director) and Marcos
Slipakoff (Treasurer)
. It finances its activities with
donations from us, IRSA, IRSA CP and other related
companies.
On
October 31, 1997, IRSA CP entered into an agreement with
Fundación IRSA, whereby 3,800 square meters of the developed
area at Abasto Shopping Mall was granted under a gratuitous
bailment agreement for a term of 30 years. Subsequently, on October
29, 1999, Fundación IRSA assigned free of cost all the rights
of use over such space and its respective obligations to
Fundación Museo de los Niños.
On
November 29, 2005, IRSA CP signed another agreement with
Fundación Museo de los Niños granting under gratuitous
bailment 2,670 square meters of the developed area at Alto Rosario
shopping mall for a term of 30 yeARS
Fundación Museo de los Niños is a non-profit institution
created by the founders of Fundación IRSA and its members are
the same as those of Fundación IRSA.
Fundación Museo de los Niños has used these spaces to set
up Abasto Shopping Mall and Museo de los Niños and Rosario,
two interactive learning centers intended for children and adults.
The agreements described above establish that the payment of common
charges and direct expenses related to the services performed by
these spaces must
be
borne by
Fundación Museo de los Niños.
Borrowings
In the
ordinary course of our business, we enter into loan agreements or
credit facilities with related companies. The loans under these
loan agreements and credit facilities accrue interest at prevailing
market rates.
Credit line granted to IRSA by IRSA CP
On April 1, 2019, as amended on May 13, 2020, IRSA CP granted a
line of credit to IRSA and its subsidiaries that do not consolidate
with IRSA PC in a principal amount up to USD180,000,000 on the
following terms: (1) the credit line may be funded in U.S. dollars
or in Pesos; (2) up to three year term to maturity not extendable
without our consent; and (3) interest payable: (i) fo U.S. dollar
funded, at a rate equal to the yield on IRSA
’s
existing local bonds due 2020, or, if
IRSA’s 2020 bonds are early redeemed or otherwise cancelled,
at an interest rate equal to the yield on local bonds issued by us
plus 50 basis points, and (ii) for pesos funded, at Badlar
rate plus 9.625%. The interest rate is readjusted quarterly and
applied to the outstanding loan balances and to new disbursements
in such quarter.
Purchase of financial assets
We
usually invest excess cash in instruments that may include those
issued by related companies, acquired at issuance or from unrelated
third parties in secondary market transactions.
266
Legal Services
We
receive legal services from Estudio Zang, Bergel &
Viñes, of which Saúl Zang was a founding partner.
Mr. Zang is a member of our board of directors and those of
certain related companies.
See
“Directors, Senior Management and Employees—Directors
and Senior Management—Board of
Directors.”
Purchases and sales of properties
In the
ordinary course of our business, we may acquire from or sell to our
related parties certain real estate properties used for rental
purposes or otherwise, subject to our Audit Committee’s
approval. OurAudit Committee must render an opinion as to whether
the terms of these transactions can reasonably be expected to have
been obtained by us in a comparable transaction on
arm’s-length basis with a unrelated parties. In addition, if
our Audit Committee so requires, valuation reports by independent
specialist third parties must be obtained.
Investment Properties transferred to IRSA CP
On
November 1, 2018, IRSA sold to IRSA CP 14,213 square meters of
gross leasable area of the building “Catalinas” in the
City of Buenos Aires, Argentina.
The
Catalinas building will consist of a total of 35,208 square meters
of gross leasable area including 30 office floors and 316
underground parking spaces, and is currently under construction.
The purchase price of the sale was USD 60,305,674. In previous
transactions, IRSA has sold 16,194 square meters of gross leasable
area in the Catalinas building to IRSA CP. IRSA’s Audit
Committee approved the sale to IRSA CP.
Farmland Lease Agreement San Bernardo
We
lease a farmland located in the Province of Córdoba, from San
Bernardo de Córdoba S.A., pursuant to a lease agreement
effective as of January 2019, continuing the lease held in August
2015. The leased farmland has an extension of 12,590
hectares.
The
rent to be paid is the equivalent in Pesos of 2,5kg of beef per
hectare per year. The beef price will be set, taking into account
the price per kilo of beef determined by the
Indice de Novillo del Mercado de
Liniers
quoted on Mercado de Hacienda de Liniers, the
previous week of the payment date. In addition, the parties have
agreed a prize of 33% of the net margin of any category that is
terminated or rebreed in other establishments or destinations,
except the direct sales.
Consulting Agreement
Pursuant
to the terms of the Consulting Agreement with Consultores Asset
Management effective as of November 7, 1994, as amended from time
to time and by the last amendment dated in September, 2017 in which
certain adjustments were implemented to the purpose of the
agreement by virtue of the broadness of Cresud’s business,
Consultores Asset Management provides us advisory services on
matters related to capital investments in all aspects of the
agricultural, real estate, financing and hotels business, among
others. One of our shareholders and the Chairman of our board of
directors is the owner of 85% of the capital stock of Consultores
Asset Management and our First Vice Chairman of the board of
directors holds the remaining 15% of its capital
stock.
Pursuant
to the terms of the Consulting Agreement, Consultores Asset
Management provides us with the following services:
●
advises with
respect to the investment of our capital in all aspects of
operations in agricultural, real estate, financing, hotels, etc,
matters and business proposals;
●
acts on our behalf
in such transactions, negotiating the prices, conditions, and other
terms of each operation; and
●
gives advice
regarding securities investments with respect to such
operations.
Under
the Consulting Agreement, we pay Consultores Asset Management for
its services, an annual fee equal to 10% of our annual after-tax
net income. During fiscal year 2019, no results were recognized for
this concept. On January 10, 2019, the deferred fees for the
2012-2016 period and the accrued fees from 2017 to July 2018 were
canceled for the total amount of ARS 1,130. The payment was made
one third in cash, one third with IRSA shares and one third with
IRSA CP shares, both owned by the Company.
267
The
Consulting Agreement is subject to termination by either party upon
not less than 60 days prior written notice. If we terminate the
Consulting Agreement without cause, we will be liable to
Consultores Asset Management for twice the average of the amounts
of the management fee paid to Consultores Asset Management for the
two fiscal years prior to such termination.
Investment in Dolphin Netherlands B.V.
IRSA
has invested in Dolphin Netherlands B.V., through its subsidiaries.
Dolphin Fund Ltd
is an investment
fund
controlled indirectly by our Chairman, Eduardo S.
Elsztain. Dolphin Netherlands B.V.
is
incorporated in the Netherlands and
is a subsidiary of
Dolphin Fund Ltd. Such investment was made in order to carry out
IRSA’s investment in IDBD. IRSA agreed with Dolphin
Netherlands B.V.
not to pay any
fee to Dolphin
Fund Ltd
related
to this investment.
Loan between Dolphin
Netherlands
B.V.
and IDBD
Dolphin Netherlands B.V. has granted a series of subordinated loans
to IDBD, which have the following characteristics: (i) they are
subordinated, including in the case of insolvency, to all current
or future debts of IDBD; (ii) they will be reimbursed after payment
of all the debts to their creditors; (iii) they accrue interest at
a rate of 0.5%, which is added to the amount of the principal and
will be payable only on the date the subordinated debt is repaid;
(iv) Dolphin Netherlands B.V. will not have a right to participate
or vote in the meetings with IDBD creditors with respect to the
subordinated debt; (v) as from January 1, 2016, Dolphin Netherlands
B.V. has the right, at its own discretion, to convert the debt
balance into IDBD shares, in whole or in part, including the
accrued interest; and (vi) should Dolphin
Netherlands B.V. opt to exercise the conversion of
the debt into shares, the debt will be converted on a basis so that
Dolphin Netherlands B.V. will receive IDBD shares according to a
share price that will be 10% less than the average market price
over the 30 days prior to the date the conversion option is
exercised. In the event there is no market price per share, the
price will be determined in accordance with an average of three
valuations made by external or independent experts, who shall be
chosen by mutual consent and, in the event of a lack of mutual
consent, they will be chosen by the President of the Institute of
Certified Public Accountants in Israel.
On
August 30, 2019, IRSA’s Board of Directors approved the
subscription of a commitment with Dolphin Netherlands B.V. to make
capital contributions of up to NIS 210,000,000, according to a
schedule of commitments made by Dolphin Netherlands B.V. between
September 2019 and September 2021 with IDB Development Corporation
Ltd.
Dolphin
Netherlands B.V. has agreed to make contributions in IDBD (subject
to the occurrence of certain events) on the following terms: (i)
NIS 70,000,000 was contributed immediately; (ii) NIS 70,000,000 to
be contributed by September 2, 2020 and (iii) NIS 70,000,000 to be
contributed by September 2, 2021. According to the agreement
between Dolphin Netherlands B.V. and IDBD, those contributions may
be considered as capital contributions resulting in the issuance of
new IDBD shares in favor of Dolphin Netherlands B.V. or may be
granted in the form of a subordinated loan. As a subsequent event,
on September 7, 2020, the Company reported that, regarding the
capital contributions committed for September 2, 2020 and 2021, it
considers that there are doubts regarding the fulfilment of the
previous conditions established to make said contributions.
Therefore, it has resolved not to make the corresponding payment
for this year.
Loan between Dolphin Netherlands and Yad Leviim Ltd.
On
October 23, 2020, Dolphin Netherlands has granted a loan to Yad
Leviim Ltd. for a term of 60 days, in a principal amount of USD
16,250,000 at a rate interest of 5% per year. Yad Leviim Ltd. is a
company controlling by Eduardo Elsztain.
Acquisition of DIC Shares from IDBD
On September 23, 2016, we acquired from IDBD 8,888,888 shares of
DIC for NIS 100 million (approximately USD 26.6 million),
equivalent to the 6.3% of the outstanding shares of DIC. In March
2017, such shares were transferred to Dolphin Netherlands B.V., who
then transferred then to Dolphin IL Investment Ltd.
268
In August 2017, Dolphin Netherlands B.V. made a non-binding offer
to acquire all the remaining shares of DIC held by IDBD through a
subsidiary of ours. In September 2017, IDBD announced that, after
negotiations with the DIC Independent Committee, such non-binding
offer was accepted. On November 22, 2017, through Dolphin IL
Investment Ltd., we acquired all the remaining shares of DIC owned
by IDBD. The transaction price was approximately NIS 16.6 per
share, which includes the payment of NIS 70 million in cash by
Dolphin IL Investment Ltd. to IDBD. The consideration to be paid by
Dolphin IL Investment Ltd. was financed by IDBD, with guarantee of
the shares purchased, without any recourse to us, for five years,
with possibilities of extension for three additional years in
installments of one year each, which will accrue interest at an
initial rate of 6.5% per year, which will increase by 1% per year
in case of extension. Additionally, guarantees. IDBD, to holders of
IDBD bonds and their creditors through pledges of different
priorities over the DIC shares that were the subject of the
acquisition. In addition, a first priority pledge of 9,636,097
(equivalent to 6.8%) of the shares of DIC held by Dolphin IL
Investment Ltd. was granted in favor of IDBD and a second priority
pledge of such shares was granted in favor of IDBD’s
creditors.
This transaction had no effect on our consolidation structure and
was accounted for as an equity purchase generating a reduction in
the attributable equity to Dolphin Netherlands B.V. of ARS 114
million. The proposal was approved by the Committee of Independent
Directors formed for the purposes of this transaction and
IRSA’s Audit Committee. IRSA’s Audit Committee was
consulted pursuant to Section 72 of the Capital Markets Law, and
issued an no objection opinion objections regarding this
transaction.
In July 2018, Tyrus S.A. (a wholly-owned subsidiary of IRSA)
acquired 2,062,000 shares of DIC at a price of NIS 9.70 per
share.
Assignment of Shares of Cellcom
On
January 22, 2018 DIC assigned, pursuant to a loan agreement, 5% of
the shares of Cellcom (the “Assigned Shares”) to two of
its affiliates, in equal parts (the “Israeli
Shareholders”). The assignment was effective until December
31, 2018 and it is automatically extended for consecutive one-year
terms until the loan agreement is terminated. DIC has the right to
terminate the loan agreement at any time and receive all or part of
the Assigned Shares. The Israeli Shareholders cannot transfer the
Assigned Shares without the consent of DIC. Pursuant to the loan
agreement, the Israeli Shareholders have the right to appoint 10%
of Cellcom’s directors. The Israeli Shareholders and the
designated director(s) will vote with DIC on all resolutions and
the economic rights of such shares will remain in the possession of
DIC. The Assigned Shares are pledged in favor of DIC.
Transfer of Tax Credits
Sociedad
Anónima Carnes Pampeanas S.A. (a company controlled by Cresud)
and Cresud, assigned credits to IRSA CP and other related parties
corresponding to value added tax export refunds related to such
companies’ business activity.
For
further information regarding related party transactions see
Note 32 to our Audited Financial Statements.
C. INTERESTS OF EXPERTS AND COUNSEL
This
section is not applicable.
A. AUDITED CONSOLIDATED STATEMENTS AND OTHER FINANCIAL
INFORMATION
See
Item 18 for our Audited Consolidated Financial
Statements.
Legal or arbitration proceedings
We are
not engaged in any material litigation or arbitration and no
material litigation or claim is known to us to be pending or
threatened against us, other than those described
below.
Litigation with Exagrind S.A.
Exagrind S.A. filed a lawsuit against Inversiones Ganaderas S.A.
(IGSA) (a former subsidiary merged with the Company ) and Tali
Sumaj on claims for damages and losses produced by a fire in one of
the Company’s farms, “San Rafael” farm, which is
close to Exagrind’s property, Tali Sumaj, in the Province of
Catamarca, Argentina. The fire took place on September 6, 2000.
There is a lien on the property and Exagrind S.A. requested that
the measure be extended with an attachment of bank accounts. This
ruling has been challenged and to date the accounts have not been
attached. Moreover there is another judicial filed labeled
“Exagrind S.A. Estancia San Rafael c/ Inversiones Ganaderas
S.A. s/ Incidente de extension de responsabilidad” (147/11)
wherein Exagrid S.A. requested an injunction against Cresud, which
has not been implemented. Notwithstanding the forgoing, this
measure was appealed by Cresud and to date the accounts have not
been attached.
269
On
December 2017, the first instance judgment was rendered, pursuant
to which, Cresud was sentenced to pay damages to the plaintiff.
Notwithstanding, the amount of the damages will be determined at
the time of execution of such ruling. On April 4, 2018, court
granted us an appeal. On June 2020 the appeal filed by the company
was rejected and from which the following grounds arise 1. That the
damaging event was caused by the risk or vice of the thing in light
by virtue of the provisions of article 113 of the previous CC,
considering that the risky activity was proven as the creator of
the damage, understanding that the risk itself determines the
responsibility and with it the danger of generating fire in the
field that in his opinion was proven and originated in Tai Sumaj.
2. That the determination of the amount of damage requires an
evidentiary point of view, therefore, it is understood that it must
be determined at the execution stage, rejecting the appeal of the
opponent in this regard. 3. Granted de appeal of the plaintiff in
relation to the active rate for the use of justice from the date of
the harmful event to the effective payment, being that the judge of
1st instance had set from the date of the sentence to the effective
payment. This sentence was not appealed
In
addition, the Company is involved in several legal proceedings,
including tax, labor, civil, administrative and other matters for
which the Company has not established provisions based on the
information assessed to date. In the opinion of management, the
ultimate disposition of any threatened or pending matters, either
individually or collectively, will not have a material adverse
effect on the consolidated financial position, liquidity and
results of operations of the Company. For ease of presentation, the
Company has categorized these matters between those arising out of
our agricultural and agro-industrial activities and those arising
out of our investment and development properties business
activities.
IRSA’s and IRSA CP’ legal or arbitration
proceedings
Set-
forth below is a description of certain material legal proceedings
to which we are a party. The company is not a party to any
significant litigation or arbitration and we are not aware of any
significant litigation or claim that is pending or imminent against
the company outside of what is described below.
Operations Center in Argentina
Set
forth below is a description of certain material legal proceedings
to which we are a party. We are not engaged in any other material
litigation or arbitration and no other material litigation or claim
is known to us to be pending or threatened against us or our
subsidiaries. Nevertheless, we may be involved in other litigation
from time to time in the ordinary course of business.
Puerto Retiro
On
November 18, 1997, in connection with our acquisition of our
subsidiary Inversora Bolívar, we indirectly acquired 35.2% of
the capital stock of Puerto Retiro. Inversora Bolívar had
purchased such common shares of Puerto Retiro from Redona
Investments Ltd. N.V. in 1996. In 1999, we, through Inversora
Bolívar, increased our interest in Puerto Retiro to 50.0% of
its capital stock. On April 18, 2000, Puerto Retiro was served
notice of a filing made by the Argentine government, through the
Ministry of Defense, seeking to extend the bankruptcy of Indarsa to
the Company. Upon filing of the complaint, the bankruptcy court
issued an order restraining the ability of Puerto Retiro to dispose
of, in any manner, the real property it had purchased in 1993 from
Tandanor. Puerto Retiro appealed the restraining order which was
confirmed by the Court on December 14, 2000.
270
In
1991, Indarsa had purchased 90% of Tandanor, a former
government-owned company, which owned a piece of land near Puerto
Madero of approximately 8 hectares, divided into two parcels:
Planta 1 and 2. After the purchase of Tandanor by Indarsa, in June
1993, Tandanor sold “Planta 1” to Puerto Retiro, for a
sum of USD18 million pursuant to a valuation performed by J.L.
Ramos, a well-known real estate brokerage firm in Argentina.
Indarsa failed to pay to the Argentine government the price for its
purchase of the stock of Tandanor, and as a result the Ministry of
Defense requested the bankruptcy of Indarsa. Since the only asset
of Indarsa was its holding in Tandanor, the Argentine government is
seeking to extend Indarsa’s bankruptcy to other companies or
individuals which, according to its view, acted as a single
economic group. In particular, the Argentine government has
requested the extension of Indarsa’s bankruptcy to Puerto
Retiro which acquired Planta 1 from Tandanor.
The
deadline for producing evidence in relation to these legal
proceedings has expired. The parties have submitted their closing
arguments and are awaiting a final judgment. However, the judge has
delayed his decision until a final judgment in the criminal
proceedings against the former Defense Minister and former
directors of Indarsa has been delivered. It should be noticed,
regarding the abovementioned criminal procedure, that on February
23, 2011 it was resolved to declare its expiration, and to dismiss
certain defendants. However, this resolution is not final because
it was appealed. We cannot give you any assurance that we will
prevail in this proceeding, and if the plaintiff’s claim is
upheld by the courts, all of the assets of Puerto Retiro would
likely be used to pay Indarsa’s debts and our investment in
Puerto Retiro, would be lost. As of June 30, 2016, we had not
established any reserve with respect of this
contingency.
Currently
Puerto Retiro S.A., has a plot of 8.3 hectares, which is affected
by a zoning regulation defined as U.P. that prevents the property
from being used for any purpose other than strictly port
activities. The Company was involved in a bankruptcy extension
lawsuit initiated by the National Government, to which the Board is
totally alien. La Gerencia y los asesores legales del Grupo,
estiman que existen argumentos técnicos legales suficientes
para considerar que el pedido de extensión de quiebra
será rechazado por el tribunal. Sin embargo, dado el estado
actual de la causa, la resolución es incierta.
In the
context of the criminal case, the complaining party denounced
puerto Retiro S.A.’s failure to comply with the precautionary
measure decreed at criminal headquarters consisting in the
prohibition of innovating and contracting with respect to the
property subject to civil action. Following this complaint,
Tribunal Oral Federal No. 5 formed an incident and ordered and
executed the closure of the property where the location contracts
(a helipad and a mooring) were being fulfilled in order to enforce
the above measure. A raíz de dicha circunstancia, se tomó
conocimiento de que las actuaciones se giraron a la Cámara
Penal para la asignación de juzgado para que se investigue la
posible comisión de un delito de desobediencia. A la fecha de
emisión de los presentes estados financieros no ha habido
novedades sobre el avance de esta causa
In the
face of the evolution of the legal cases affecting it and based on
the reports of its legal advisors, the Directorate of Puerto Retiro
has decided to record in the 2019 financial year a forecast
equivalent to 100% of the book value of its investment property,
without prejudice that it will reverse in case of finally obtaining
a favorable judgment in the actions brought.
Tandanor
has filed a civil action against Puerto Retiro and the people
charged in the referred criminal case looking forward to be
reimbursed from all the losses which have arisen upon the fraud
committed. On March 7, 2015 Puerto Retiro responded filing certain
preliminary objections, such as limitation, lack of information to
respond the lawsuit, lack of legitimacy (active and passive). On
July 12, 2016 Puerto Retiro was legally notified of the decision
adopted by the Tribunal Oral Federal No. 5 related to the
preliminary objections above mentioned. Two of them were rejected
–lack of information and lack of legitimacy (passive). We
filed an appeal with regard to this decision, which was rejected.
The other two objections would be considered in the
verdict.
On
September 7, 2018, Court read its verdict, according to which the
preliminary objection of limitation filed by Puerto Retiro was
successful. Nevertheless, in the criminal procedure –where
Puerto Retiro is not a party- Court ordered the seizure
confiscation (“
decomiso
”) of the land known as
“Planta 1”. This Court’s verdict is not final, as
it is subject to further appeals Puerto Retiro filed an appeal with
regard to the confiscation of Planta I. This appeal has not yet
been decided.
271
On
December 27, 2018, an action for annulment was filed against the
judgment that ordered the confiscation of the property named
“Planta 1”. On March 1, 2019 we were notified of the
“in limine” rejection of the action for annulment
filed. Subsequently, on March 8, 2019, a motion for restitution was
filed against said resolution. On March 19, 2019, we were notified
of the Court’s decision that rejected the replacement and
declared the appeal filed in a subsidiary inadmissible. On March
22, 2019, a complaint was filed for appeal denied (before the
Federal Criminal Cassation Chamber), the caul was granted, which is
why the appeal filed is currently pending. In that sense, in April
the appeal was maintained and subsequently, its foundations were
expanded.
On 21
February 2020, an electronic document was received from the Federal
Court of Criminal notifying the decision rejecting the appeals
brought by Puerto Retiro against the verdict of the Federal Oral
Court 5 that provided for the confiscation of the property Plant I
and the distribution of costs in the order caused as regards the
exception for the limitation of civil action brought by Puerto
Retiro to which the Oral Court took place. Against that decision of
appeal, Puerto Retiro was brought in a timely and form of Federal
Extraordinary Appeal. In addition, Federal Criminal Cassation
Chamber upheld the above limitation period by rejecting, to that
effect, the appeal brought by the National State and
Tandanor.
In the
face of the evolution of the legal cases affecting it and based on
the reports of its legal advisors, the Management of Puerto Retiro
has decided to record a impairment equivalent to 100% of the book
value of its investment property, without prejudice to the reversal
of the same in the event that a favorable judgment is obtained in
the actions brought.
Arcos del gourmet
IRSA CP
has been named as a party in a case titled “
Federación de Comercio e Industria de la
Ciudad de Buenos Aires y Otros c/ Gobierno de la Ciudad
Autónoma de Buenos Aires s/ Amparo
.” The
plaintiff filed a petition for injunctive relief against the local
government claiming that the Arcos del Gourmet project lacked the
necessary environmental approvals and did not meet zoning
requirements. On August 29, 2014, the lower court rendered a
decision dismissing the case. This resolution was appealed but
affirmed in December 2014. Therefore, on December 18, 2014,
the “Arcos” Project was opened to the public, and
currently is operating normally. Notwithstanding, the plaintiff
appeared before the Superior Court of the City of Buenos Aires to
request the review of the case based on constitutional matters
allegedly at issue. On July 4, 2017, the Superior Court
ordered the Appeals Court to review the case on certain grounds.
The Appeals Court rendered a new sentence on February 14 th, 2019.
This new sentence rules that Arcos del Gourmet has to yield a
portion of land to build a green park. Arcos del Gourmet filed an
appeal before the Superior Court. This appeal has not yet been
decided.
On
May 18, 2015, we were notified that the AABE, revoked the
concession agreement granted to IRSA CP’s subsidiary Arcos
del Gourmet S.A., through Resolution No. 170/2014. On
June 2, 2015, IRSA CP filed before the AABE a request to
declare the notification void, as certain formal proceedings
required under Argentine law were not complied with by the AABE.
Furthermore, IRSA CP filed an administrative appeal requesting the
dismissal of the revocation of the concession agreement and a
lawsuit seeking to declare Resolution No. 170/2014 void. IRSA
CP also filed a lawsuit in order to judicially pay the monthly
rental fees of the property. As of the date of this annual report,
the “Distrito Arcos” shopping mall continues to operate
normally.
On
February 14, 2019, the Chamber decided to condemn the Government of
the City of Buenos Aires (“GCBA”) and Arcos, providing
for the partial annulment of resolution 157 / APRA / 14 at the
point that it did not consider appropriate for Arcos to transfer
65% of the land for use and public utility with unrestricted access
and destined "especially and preferably to the generation of new
landscaped green spaces". Consequently, it was resolved that the
GCBA must issue an administrative act that provides for this
assignment. If it does not do so, Arcos must also comply with said
assignment, either on the premises where the commercial center is
currently located, be it totally or partially on land adjacent to
the area. Failing to do this, Arcos del Gourmet S.A.
(“Arcos”) must pay, prior to the realization of an
expert report to be ordered in the execution stage, the sum of
money necessary in order for the Administration to proceed to the
search for a property with the objective of fulfilling the
aforementioned purpose. If none of the aforementioned forms of
compliance are specified, the power to order will be expedited -
prior intervention of the relevant experts and / or technical
departments of the corresponding GCBA - the demolition of the
necessary works in order to comply with the ordered
assignment.
272
Against
that judgment, an appeal for local unconstitutionality was filed on
March 11, 2019 and a federal extraordinary appeal on March 15,
2019. After the relevant transfers were made, the Chamber decided
to reject the appeal for unconstitutionality raised, which is why
on May 29, 2019, a complaint was lodged due to an appeal of
unconstitutionality denied. Said appeal is pending before the
Superior Court of Justice of the City of Buenos Aires. On June 10,
2019, said the Court urged Arcos to accompany additional
documentation. This documentation consists of provisions dictated
by different departments of the Government of the City of Buenos
Aires. Such intimation was fulfilled in a timely
manner.
Due to
all of the foregoing, the Company’s legal advisors consider
that, although the outcome of the complaint is still uncertain,
even if it is unfavorable, there is a low probability that the
demolition of the works carried out in the Property is definitively
ordered.
Caballito
On July
20, 2020 IRSA CP has been notified of the filing of a protection
action (amparo) that is processed before the Administrative and Tax
Litigation Jurisdiction of the City of Buenos Aires, Court 24,
Secretariat 47 where the plaintiff has requested the nullity of: 1)
Administrative act that grants the certificate of environmental
aptitude and 2) Administrative act that registered the plans of the
work called –Caballito Chico– located on Avellaneda
1400, City of Buenos Aires, because it is understood that they
contain defects in their essential elements, for being violative of
the provisions contained in the Urban Planning Code and of the
complementary regulations in force at the time of initiating the
process and for causing irreparable damage to the environment and
rights of collective incidence. The transfer was answered by the
precautionary measure and by the substantive action. The transfer
of said presentation was answered. On August 13, 2020, the
following precautionary measure was decreed that orders: a) the
suspension of the effects of the administrative acts granted by the
CCA (DI-2018-1865-DGEVA and that registered the plans and; b) the
stoppage of construction work carried out on the property located
at Avellaneda 1400, City of Buenos Aires. The issuance of said
precautionary measure was appealed. On October 1, 2020, the Chamber
confirmed the precautionary measure. The Government of the City of
Buenos Aires appealed the measure by filing a Constitutional
Challenge.
Other Litigation
As of
July 5, 2006, the Administración Federal de Ingresos
Públicos (“AFIP”) filed a preliminary injunction
with the Federal Court for Administrative Proceedings against IRSA
CP for an aggregate amount of ARS 3.7 million, plus an added
amount, provisionally estimated, of ARS 0.9 million for legal fees
and interest. The main dispute is about the income tax due for
admission rights. In thefirst instance, AFIP pleaded for a general
restraining order. On November 29, 2006, the Federal Court issued
an order substituting such restraining order for an attachment on
the parcel of land located in Caballito neighborhood, City of
Buenos Aires, where IRSA CP is planning to develop a shopping
center. As of June 30, 2011, under court proceedings, the building
was subject to a legal attachment for ARS 36.8 million. On December
12, 2012, the legal attachment was lifted and accredited in the
file concerned in February 2013.
After
we sold the Edificio Costeros, dique II, on November 20, 2009, we
requested an opinion to the Argentine Antitrust Authority as to
whether it was necessary to report this transaction. The Argentine
Antitrust Authority advise us that it was required to notify the
transaction. We challenged this decision, but it was confirmed. On
December 5, 2011, we notified the transaction and on April 30, 2013
the transaction was approved by the Argentine Antitrust Authority
by Resolution No 38, as a result of that this legal proceeding was
concluded.
On
January 15, 2007 we were notified of two claims filed against us
before the Argentine Antitrust Authority, one by a private
individual and the other one by the licensee of the shopping
center, both opposing the acquisition from the province of
Córdoba of a property known as Ex-Escuela Gobernador Vicente
de Olmos. On February 1, 2007 we responded the claims. On June 26,
2007, the Argentine Antitrust Authority notified us that it has
initiated a summary proceeding to determine whether the completion
of the transaction breaches the Antitrust Law. On November 3, 2015
the transaction was approved by the Argentine Antitrust Authority
by Resolution No 544, as a result of that this legal proceeding was
concluded.
On
December 3, 2009, IRSA CP filed a request for the Argentine
Antitrust Authority’s opinion regarding IRSA CP’s
acquisition of common shares of Arcos del Gourmet S.A. The
Argentine Antitrust Authority advised the parties that the
transaction had to be notified. On December, 2010 the transaction
was filed with the Argentine Antitrust Authority. On October 31,
2016 the transaction was approved by the Argentine Antitrust
Authority by Resolution No 322, as a result of that this legal
proceeding was concluded.
273
On
April 11, 2011, Quality Invest requested the Argentine Antitrust
Authority opinion regarding Quality Invest’s acquisition
Property of a warehouse owned by Nobleza Piccardo located in San
Martín, Province of Buenos Aires. The Argentine Antitrust
Authority stated that there was an obligation to notify the
situation, but Quality Invest filed an appeal against this
decision. Subsequently, the Court of Appeals confirmed the
Argentine Antitrust Authorities’ decision regarding the
obligation to notify and, therefore, on February 23, 2012, the
transaction was filed. On March 8, 2016 the transaction was
approved by the Argentine Antitrust Authority by Resolution No 27,
as a result of that this legal proceeding was
concluded.
On
August 23, 2011, IRSA CP notified the Argentine Antitrust Authority
the direct and indirect acquisition of common shares of NARSF, the
transaction involved the direct acquisition of 33.33% of NARSF and
16.66% through our controlled vehicle Torodur S.A. On November 18,
2014 the transaction was approved by the Argentine Antitrust
Authority by Resolution No 235, as a result of that this legal
proceeding was concluded.
On June
16, 2012, we sold to Cabaña Don Francisco S.A. certain
Costeros Dique IV’s functional units, to be used for office
space, and complementary units to be used for parking. In addition,
we assigned upon the purchaser all rights and interests arising
from lease agreements involving the conveyed units. As a result, an
advisory opinion was requested from the Argentine Antitrust
Authority as to the need to report such transaction. The Argentine
Antitrust Authority resolved that the transaction was exempt from
report on May 21, 2014, so this legal process was
finished.
On
December 7, 2012, we notified the Argentine Antitrust Authority of
the acquisition of 50% of the common shares of EHSA, which owns 50%
of the common shares of La Rural, which operates a convention mall
(
Predio Ferial de Palermo
);
on July 25, 2017 the transaction was approved by the Argentine
Antitrust Authority. See “Item 3. Key Information—Risk
Factors—Risk Relating to Our Business—Our business is
subject to extensive regulation and additional regulations may be
imposed in the future.”
On
February 28, 2018, Ogden Argentina S.A. notified the Argentine
Antitrust Authority the acquisition of common shares of ALG Golf
Center S.A., the transaction involved the direct acquisition of 60%
of ALG Golf Center S.A. Ogden Argentina S.A is indirectly
controlled by IRSA CP. As of the date of this annual report the
transaction is being analyzed by the Argentine Antitrust
Authority.
For
more information see “Item. 3(d) Risk Factors—Risk
related to our Business—Our business is subject to extensive
regulation and additional regulations may be imposed in the
future.”
Operations Center in Israel
As of the date of
this Annual Report, we are analyzing together with our local and
international advisors the judicial decision, alternatives and
course of action. For more information see “IRSA’s
Recent Developments - Corporate Information:
IDBD”.
Litigation against IDBD
In
recent years, there has been a tendency to initiate class actions
and social liability actions in the field of corporate and
securities law in Israel. Considering these issues and the
financial position of IDBD and its structure of corporate
participation, claims for significant amounts could be filed
against IDBD, including in relation to its financial position and
cash flow and the operations that were carried out or were not
completed, including in relation to the arguments and claims of the
majority shareholders that took place in IDBD.
274
IDBD
has been maintaining negotiations with creditors in order to
restructure its financial debt in favorable terms. Due to lack of
agreement, on September 17, 2020, a petition was submitted in the
District Court in Tel-Aviv-Jaffa (“The Court”) on the
subject of granting of an order for the opening of proceedings by
the Trustee for the holders of the Company’s Bonds (Series 9)
(“The petition”). Within the framework of the petition,
the Court was requested to grant an order for the opening of
proceedings for the Company pursuant to Section 18 of the
Insolvency and Economic Rehabilitation Law, 5778 – 2018
(“The Law”); to instruct the appointment of a trustee
for the Company according to law. On September 21, 2020, the
holders of the bonds (Series 14) of IDB Development (“IDB
Development’s bonds (Series 14)”) approved making the
entire uncleared balance of IDB Development's bonds (Series 14)
repayable immediately. On September 22, 2020, the Company submitted
its initial response to the Petition in the Court, in which it
argues that the good of the company and all its creditors is to
exhaust the negotiations with the controlling shareholder and its
creditors during a short interim period in order to try and
maximize the value of its assets, for the benefit of the creditors
and the company, and avoid costs and additional harmful
consequences. In addition, the response of Dolphin Netherlands B.V.
(the controlling shareholder of the Company) was also submitted, as
were responses by the Trustees for the bondholders (Series 15 and
Series 14) of the Company to the Petition. It should be mentioned
that in tandem to his response, the Trustee of bondholders (Series
14) of the company submitted petitions for the enforcement of a
lien and for the appointment of a receiver as well as an urgent
petition for the setting of a hearing on the said petitions for a
receivership, together with the hearing on the petition, which was
set for September 24, 2020. On September 25, 2020, the Court
enacted the insolvency and liquidation of IDBD and appointed a
trustee for its shares and the appointment of a custodian over the
shares of DIC and Clal. Regarding the individual financial
statements, the investment in IDBD and DIC as of June 30, 2020 is
valued at zero. For more information, refer to “IRSA´s
Recent Developments- Corporate Information: IDBD” Arbitration
proceedings relating to the acquisition of control in
IDBD.
275
Litigation against Clal Insurance and its subsidiaries
This
exposure is particularly increased in the areas of long-term
savings and long-term health insurance in which Clal Insurance is
engaged, due to the fact that in those areas some of the policies
were issued decades ago, whereas today, due to the significant
regulatory changes, and due to the development in case law and in
Israeli authorities’ position, the aforementioned policies
may be interpreted differently, on a retroactive basis, and may be
subject to different interpretations than those which were in
practice at the time when they were made. Moreover, the policies in
the aforementioned segments have been in effect for decades,
meaning that exposure exists to the possibility that in cases where
the customer’s claim is accepted and a new interpretation is
provided for the terms of the policy, the future profitability of
Clal Insurance with respect to its existing policy portfolio might
be affected. This is in addition to the possible compensation that
could be given to customers due to past activity.
Alongside
these aspects, during 2015 amendments were made to reflect a
significant reform in the field of approving an insurance program,
which allows Israeli authorities, under certain conditions, to
order the insurer to stop introducing an insurance policy or to
order an insurer to make a change to an insurance policy, even with
regard to policies that have already been marketed by the insurer.
It is not possible to foresee to what extent insurers are exposed
to claims in connection with the provisions of the policy, the
manner of implementing Israeli authorities’ powers pursuant
to the insurance policy reform and its implications, which may be
raised by means of a procedural mechanism provided in the Israeli
Class Actions Law.
There
are claims that have been recognized as class action suits, claims
for which there are pending motions to have them certified as class
action suits, and other claims. These claims include, mainly,
claims for improper actions, not in accordance with applicable laws
or licenses, or breaches of agreements with customers, or damages
(especially misleading a customer, or a negligent
misrepresentation), causing damage, either monetary or
non-monetary, to customers. A significant amount of these claims
also include claims for charging excessive premiums and payment of
lower than called for insurance compensation. In addition, there
are pending motions to have claims certified as derivative
actions.
Sale of shares of Clal
On
August 21, 2013, on the background of concerns about the ability of
the previous controlling shareholders of IDBD (Dankner Group) to
meet the requirements to have control over an insurance company,
the Commissioner required that IDBD transfer 51% of the shares in
Clal to Mr. Moshe Terry (“the Trustee”) and to grant
the Trustee an irrevocable power of attorney with regard to the
voting of such shares in Clal.
On
November 27, 2013, and as part of the debt arrangement in IDBH, the
Commissioner set forth an outline to enable the change of control
in IDBD (as part of the debt arrangement), whereby the Commissioner
would not view such change of control as being a breach of the
Supervision of Financial Services (Insurance) Law, 1981 (the
“Insurance Law”), subject to certain conditions,
including terms whereby if by December 31, 2014 a control permit
for Clal Insurance had not been obtained for the new controlling
shareholders in IDBD, or, an agreement for the sale of the
controlling stake in Clal Insurance had not been signed, then the
Trustee will be authorized to sell the Clal Insurance shares it
holds. Both groups that had submitted proposals in the debt
arrangement process (including the Dolphin Group) approved such
outline.
On
December 30, 2014, the Commissioner sent an additional letter
setting a term by which IDBD’s control over and equity
interests in Clal were to be sold and giving directions as to the
Trustee’s continuity in office, among other aspects. For more
information, please see “
Regulation and government
supervision–Legal Framework–Operations Center in
Israel–Concentration Law.
”
276
In
addition, in June 2015, an application for an Israeli court to
approve the commencement of a class action against IDBD,
IDBD’s directors (some of which are also our directors),
Dolphin Fund Ltd. and C.A.A Extra Holdings Ltd. was filed by
individuals who argue that IDBD’s shareholders and board of
directors acted in concert to frustrate the sale of shares of Clal
to JT Capital Fund. The applicants argue that this caused them
material damages as under the terms of the debt restructuring of
IDBD’s holding company, IDBH. with its creditors, they would
have been entitled to receive a larger payment had the above
mentioned sale been consummated. Furthermore, they alleged that the
2014 and 2015 subscription rights offerings of IDBD discriminated
against the minority shareholders. On March 21, 2016, the
respondents filed a motion to dismiss this class action
application. On June 2, 2016, the Court partially accepted this
motion, and ordered the applicants to file an amended class action
application that would include only the arguments and remedies with
respect to the said Clal transaction. On August 2, 2016, the
respondents filed a motion to appeal (regarding the decision not to
dismiss the arguments concerning the Clal transaction) and, on
August 14, 2016, the applicants filed an appeal (regarding the
decision to dismiss the arguments concerning the subscription
rights offering) both before the Israeli Supreme
Court.
Following
the dismissal of the appeal proceedings by the Supreme Court, the
applicants filed, in January 2018, a motion of appeal to summarily
dismiss the appeal filed by the respondents, in which the Court
ordered the striking out the motion to approve for causes of action
which fall under the exemption condition which was included in the
amendment to the Debt Arrangement, pertaining to damage which was
allegedly caused due to prejudice of rights, by virtue of the
undertaking of the controlling shareholder and the former
controlling shareholder to perform a tender offer for IDBD’s
shares in accordance with the Debt Arrangement, the applicants
filed an amended motion to approve the claim as a class
action.
Dolphin,
IDBD and IDBD’s directors filed a detailed joint answer on
May 7, 2018. The preliminary hearing is scheduled for November 28,
2019.
In July
2019, the Applicants filed a motion (in partial agreement) for
withdrawal from the proceeding against the Respondents. In light of
C.A.A and IDBD's former controlling shareholder refusal to the
Applicants withdrawal from the proceeding without an order for
expenses, the Court has set a time for filing arguments on the
expenses by September 10, 2019, insofar as no agreement will be
reached by that date.
For
more details regarding the sale of Clal shares, please see the
Insurance section above.
Litigation against Cellcom and its subsidiaries
In the
normal course of business, claims have been filed against Cellcom
by its customers. These are mostly motions for approval as class
actions, primarily concerning allegations of illegal collection of
funds, unlawful conduct or breach of license, or breach of
agreements with customers, causing monetary and non-monetary damage
to them. Others related to claims regarding non-ionizing radiation
from cellular handsets and claims in respect of sites belonging to
Cellcom.
Class action against IDBD regarding the sale of DIC
On
October 3, 2108, IDBD was served with an action and a motion to
approve that action as a class action filed with the District Court
in Tel Aviv Yafo (jointly – the “Motion”). The
Motion was initiated by an applicant alleging to hold shares in DIC
(the “Applicant”), against IDBD, against Dolphin IL,
against Mr. Eduardo Elsztain, the controlling shareholder of IDBD,
who serves as chairman of IDBD and DIC board of directors; against
directors serving in IDBD who have an interest in the Controlling
Person; and against the Official Receiver of the state of Israel.
Seeking an injunction to annul the sale of shares of DIC to Dolphin
and to appoint a trustee to hold those shares while the action is
pending. The applicant claims that the sale was not in compliance
with the provisions of the Concentration Law, in addition the
plaintiff is seeking an order for payment of monetary damages to
the shareholders of DIC of between NIS 58 and 73
million.
The
main allegation is that IDBD continues to be the controlling person
in DIC even after the completion of the sale of the shares of DIC
to Dolphin IL and that IDBD continues to be the controlling
shareholder of DIC and that is controlling shareholder Mr. Elsztain
(in his capacity as chairman of the board of directors and
controlling person of DIC as well), had a personal interest
separate from the interest of the minority shareholders in DIC, and
that he and IDBD breached the duty of good faith and the duty of
care toward DIC, this being, allegedly, due to the fact that the
decision regarding the preferred alternative for complying with the
Concentration Law’s provisions was not brought before
DIC’s shareholder’s meeting. The Applicant further
alleges deprivation of the minority shareholders in
DIC.
277
We plan
to vigorously defend this motion as we understand that the sale of
the holdings in the shares of DIC by IDBD to Dolphin IL, IDBD
complies with the provisions of the Concentration Law.
Class actions against DIC regarding exit of the DIC’s share
from indexes
On
October 2, 2018, DIC was served with an action and a motion to
approve that action as class action, which had been filed with the
District Court of Tel Aviv-Yafo (jointly – the
“Motion”) against the DIC, against Mr. Eduardo
Elsztain, against directors serving in DIC who have an interest in
the controlling person of DIC, and against additional directors and
officers serving in DIC, in connection with the exit of DIC’s
share on February 1, 2018 from thee TA90 and TA 125 indices of the
TASE, whereon it had been traded on the Tel Aviv Stock Exchange
Ltd. up to that date (the “Indexes”) by an applicant
alleging to have held DIC’s shares prior to February 1, 2018
and thereafter.
In the
Motion, allegations were made, inter alia, against the
respondents’ conduct, regarding the failure to actively act
to preserve DIC’s share on the Indexes once the
public’s holdings therein did not meet the threshold which
had been prescribed and had entered into force on that date, with
the alleged causes of action being deprivation of the minority and
breach of the Controlling Person’s duty of good faith and
decency, as well as the breach of the respondents’ duties of
trust and care toward DIC.
The
Court is requested, inter alia, to approve the action as a class
action and to charge the Respondents with compensating the members
of the group according to the damage caused estimated at
approximately NIS 17.6 million. DIC hold that such allegations are
meritless and will vigorously defend this motion.
Derivative claim against DIC regarding performance of a prohibited
distribution
In May
2019, DIC received a claim and a motion to approve it as a
derivative claim (jointly: the “Motion”), which had
been filed with the District Court of Tel Aviv-Yafo (the
“Court”), against Dolphin IL; against directors who
hold office in DIC (the “Respondents”); and against DIC
(as a formal respondent), by a petitioner claiming to hold
debentures of DIC (Series J), on the grounds of performance of a
prohibited distribution, with respect to a dividend distribution in
cash in the amount of approximately NIS 40 million, and a payment
in kind dividend (debentures (Series I) of IDB Development) in the
amount of approximately NIS 64 million, which was performed by DIC
in February 2019 (jointly: the “Distribution”), and
regarding self-purchases of shares which were performed by DIC
(from the date of the resolution regarding the distribution) in the
amount of approximately NIS 36 million, in accordance with a
purchase plan, which was approved by DIC’s board of directors
in January 2019 (the
“Self-Purchases”).
In the
motion, the Court was requested, inter alia, to declare and to
determine that the distribution and the self-purchases did not
fulfill the profit test (a test which constitutes a condition for a
distribution in accordance with section 302 of the Companies Law,
5759-1999), and that they constitute a prohibited distribution, and
to order the respondents to compensate DIC for the damages which it
has incurred due to the prohibited distribution, with the damages
allegedly caused by the respondents being estimated at a total of
NIS 140 million. The Court is also requested to order Dolphin IL to
repay to DIC the dividend amount which it received in the
distribution, in the amount of NIS 85 million (in accordance with
its rate of holding in DIC). DIC hold that such allegations are
meritless and will vigorously defend this motion.
Legal proceedings relating to IDBD liquidation and the receivership
over DIC shares
On
September 17, 2020, a petition was submitted in the District Court
in Tel-Aviv-Jaffa (the “Court”) on the subject of the
granting of an order for the opening of proceedings by the Trustee
for the holders of the IDBD's Debentures (Series 9). Within the
framework of the petition, the Court was requested to grant an
order for the opening of proceedings for IDBD pursuant to Section
18 of the Insolvency and Economic Rehabilitation Law, 5778 –
2018 (the “Law"); to instruct the appointment of a trustee
for IDBD pursuant to Section 33 of the Law and to afford him the
authorities that are determined in Sections 41 – 56 of the
Law, whilst expropriating the authorities that are held by the
IDBD’s bodies pursuant to Section 43 of the Law, and also to
give the trustee all of the other authorities that are required for
the purpose of the execution of his role pursuant to the provisions
of the Law;To give any appropriate and required remedy in the
circumstances of the case pursuant to the Court's
judgment.
278
On
September 25, 2020 the Court issued a judgement pursuant to which
an order was awarded for the opening of proceedings against IDBD as
well as an order for its liquidation. Pursuant to the judgment, a
trustee was appointed to IDBD, and the Court determined that the
trustee’s authorities will be as specified in sections 41 -
56 of the Law. The Court also appointed temporary receivers for the
DIC shares constituting approximately 70.2% of the issued share
capital of DIC, which are pledged in favor of the holders of
IDBD’s debentures (Series 14), and other temporary receivers
for the assets which are pledged in favor of the holders of
IDBD’s debentures (Series 15) (which are, approximately 5% of
the issued share capital of Clal and the consideration in respect
of additional 3.5% of Clal shares)
On
October 12, 2020, the Court ruled that the trustee appointed for
IDBD, shall be appointed as temporary receiver for DIC shares
constituting approximately 12% of the issued share capital of DIC,
which are pledged in favor of IDBD (the Court determined in its
decision that the trustee’s appointment is also subject to
the approval thereof by the Ministry of
Communications).
On
October 13, 2020, the Court accepted the appointment of the
temporary receivers for the assets which are pledged in favor of
the holders of IDBD’s debentures (Series 14), as permanent
receivers (the “Permanent Receivers”).
On
October 14, 2020, the Court approved the petition of the Permanent
Receivers to publish an invitation for the submission of offers for
the purchase of the Permanent Receivers' shares
(approx. 70% of DIC’s issued
share capital), which invited the offerors to also include an offer
for the purchase of the trustee's shares (i.e.- approx 12% of
DIC’s issued share capital), without this constituting a
condition for the submission of an offer for the purchase of the
receivers' shares.
Dividend policy
Pursuant
to Argentine law, the distribution and payment of dividends to
shareholders is valid only if they result from net and realized
earnings of the company pursuant to annual audited financial
statements approved by the shareholders. The approval, amount and
payment of dividends are subject to the approval by our
shareholders at our annual ordinary shareholders meeting. The
approval of dividends requires the affirmative vote of a majority
of the shares entitled to vote at the meeting.
In
accordance with Argentine law and our by-laws, net and realized
profits for each fiscal year are allocated as follows:
●
5% of such net
profits is allocated to our legal reserve, until such reserve
amounts to 20% of our capital stock;
●
a certain amount
determined at a shareholders’ meeting is allocated to
compensation of our directors and the members of our supervisory
committee; and
●
additional amounts
are allocated for the payment of dividends or to optional reserve
funds, or to establish reserves for whatever other purpose our
shareholders determine.
The
following table sets forth the total and per share amounts paid as
dividends on each fully paid-in share for the fiscal years
mentioned. The amounts stated in pesos correspond to nominal pesos
on their respective dates of payment and refers to our
unconsolidated dividends. See “Item 3. Key
Information—Local Exchange Market and Exchange
Rates.”
|
Fiscal
year
|
Dividend
Paid stated in terms of the measuring unit current as of June, 30,
2019
|
Dividend
per share paid stated in terms of the measuring unit current as of
June 30, 2019
|
Dividend
paid stated in terms of the measuring unit current as of the date
of the each corresponding Shareholders’ meeting
(1)
|
Dividend
per share paid stated in terms of the measuring unit current as of
the date of the each corresponding Shareholders’ meeting
(1)
|
|
|
(in
million of ARS )
|
(ARS
)
|
(in
million of ARS )
|
(ARS
)
|
|
2018
|
1,065,000
|
2.123
|
395,000
|
0.787
|
|
2019
|
—
|
—
|
—
|
—
|
|
2020
|
—
|
—
|
—
|
—
|
(1) The
decisions made on the basis of years’ results prior to the
application of IAS 29, are not subject to revision.
279
B. SIGNIFICANT CHANGES
Shareholders’ meeting:
Our 2020 annual meeting of
shareholders was held on October 26, 2020 and it was decided, among
oters: (1)
Distribution of share
dividends. The meeting approved by majority of
votes:
1. to allocate the net income for the fiscal year for ARS
1,900,624,275.32 to (i) the legal reserve for ARS 95,031,214 and
(ii) the remaining balance amounting to ARS 1,805,593,061.32 to the
absorption of unappropriated retained earnings, comprised by (a)
the aggregate of prior fiscal year adjustments amounting to ARS
814,138,722.68, (b) the aggregate of the negative effect from other
changes in the subsidiaries shareholders’ equity amounting to
ARS 60,919,391.76; and (c) partially, the effect of the
distribution of shares approved by the meeting held on October 30,
2019 of ARS 1,511,974,676.17 on the unappropriated retained
earnings;2.not to distribute dividends as a result of the
absorption of losses;
(2) Appointment of regular directors
and alternate directors for a term of three fiscal years. See
“
ITEM 6. Directors, Senior
Management and Employees”
;
(3)
The meeting approved by majority of
votes the sum of ARS 62,180,000 as total compensation payable to
the Board of Directors for the fiscal year ended June 30, 2020 and
(i) to allocate and distribute such compensation in due course in
accordance with the specific duties discharged by its members; (ii)
to make monthly advance payments of fees contingent upon the
resolution to be adopted at the next ordinary shareholders’
meeting.; (4) The meeting approved by majority of votes to ratify
the resolutions adopted by the meeting held on October 30, 2019 as
regards the implementation of the incentive plan for employees,
management and directors of the Company and to provide that 1% (one
per cent) allocated to such plan to be calculated based on the
capital outstanding as of the time of implementation and/or
execution of the plan, be paid in with reserves – thus
allocating such shares as bonus to the beneficiaries of the plan-
and/or paid in with contributions made by the beneficiaries, all in
accordance with the provisions set forth in Section 68 of the
Capital Market Law No. 26,831;
(5)
The meeting approved by majority of votes a compensation of ARS
15,300,333 for the tasks developed by the certifying accountant for
the fiscal year ended June 30, 2020; (6) The meeting approved by
majority of votes a budget of ARS 503,000, taking into account the
effect of inflation considering the eventual hiring of advisors /
consultants and trainings.
A. OFFER AND LISTING DETAILS
The
following summary provides information concerning our share capital
and briefly describes all material provisions of our bylaws and the
Argentine Corporation Law.
Stock Exchanges in which our securities are listed
Our
common shares are listed on the ByMA under the trading symbol
“CRES” and on NASDAQ under the trading symbol
“CRESY.” As of June 30, 2020 our outstanding capital
stock consisted of 501,642,804 common shares, ARS 1.00 par value
per share.
As of
that date of this annual report: (1) we had no other shares of any
class or series issued and outstanding; and (2) there are no
outstanding convertible notes to acquire our shares. Our common
shares have one vote per share. All outstanding shares are validly
issued, fully paid and non assessable. As of June 30, 2020, there
were approximately 9,728 holders of our common
shares.
Price history of our stock on the ByMA and NASDAQ
Our
common shares are listed and traded on ByMA under the ticker
“CRES.” Since March 1997, our ADRs, each presenting 10
common shares, have been listed on the NASDAQ under the trading
symbol “CRESY.” The Bank of New York is the depositary
with respect to the ADRs.
The
following chart shows, for the period indicated, the maximum and
minimum closing listed prices of our common shares on the ByMA and
of our ADS on the NASDAQ.
280
B. PLAN OF DISTRIBUTION
This
item is not applicable.
C. MARKETS
Argentine Securities Markets
In
December 2012, the Argentine government enacted Capital Markets Law
No 26,831, which sets out the rules governing capital markets, its
participants, and the rules by which securities traded therein are
subject to regulation and monitoring by the CNV. In
September 2013, the CNV issued General Resolution
No. 622/2013 (the “CNV Rules”) a new set of
rules further implementing and administering the requirements
of the Capital Markets Law. On May 9, 2018, the Argentine
Chamber of Deputies approved Law No. 27,440 called
“
Ley de Financiamiento
Productivo
”, which creates a new financing regime for
MiPyMEs and modifies Capital Markets Law
No. 26,831, Investment Funds Law No. 24,083 and Law
No. 23,576, among others, as well as certain related tax
provisions, and establishes regulations for derivative instruments,
all with the aim of achieving a modern and transparent financial
regulatory framework that contributes to the development of the
Argentine economy. On May 21, 2018, the Argentine Government
issued Decree No. 471/2018, which regulates certain aspects of
the Capital Markets Law as amended by Law
No. 27,440.
The
Capital Markets Law, as currently in effect, sets forth, the
following key goals and principles:
●
Promoting the
participation of small investors, employee unions, industry groups
and trade associations, professional associations and all public
savings entities in the capital markets, promoting mechanisms
designed to promote domestic savings and channel such funds toward
the development of production;
●
Strengthening
mechanisms to prevent abuses and protect small
investors;
●
Promoting access to
the capital market by small and medium-sized
companies;
●
Using
state-of-the-art technology to foster creation of an integrated
capital market through mechanisms designed to achieve
interconnection of computer systems among trading
markets;
●
Encouraging simpler
trading procedures available to users to increase liquidity and
competitiveness to develop favorable conditions for transaction
execution;
●
Reducing systemic
risk in the Argentine capital markets through actions and
resolutions aimed at implementing international best
practices;
●
Promoting the
integrity and transparency of the Argentine capital markets;
and
●
Promoting financial
inclusion.
The CNV
is a self-administered agency of the Argentine Government with
jurisdiction covering the territory of Argentina, governed by the
provisions of the Capital Markets Law, and the CNV Rules among
other related statutory regulations. The relationship of the CNV
and the Argentine Executive branch is maintained through the
Ministerio de Finanzas
(Ministry of Finance), which hears any appeals filed against
decisions made by the CNV, notwithstanding any other legal actions
and remedies contemplated in the Capital Markets Law.
The CNV
supervises and regulates the authorized markets in which the
securities and the collective investment products are traded, the
corporations authorized in the public offer regime, and all the
other players authorized to operate in the public offer regime, as
the registered agents, the trading agents, the financial advisors,
the underwriters and distributors, the brokers, the settlement and
clearing agents, the managers of collective investment products,
the custodians of collective investment products, the collective
depositories, and the risk rating agencies, among others. Argentine
institutional investors and insurance companies are regulated by
separate government agencies, whereas financial institutions are
regulated mainly by the Central Bank.
281
Before
offering securities to the public in Argentina, an issuer must meet
certain requirements established by the CNV with regard to its
assets, operating history and management. Only securities offerings
approved by the CNV may be listed on a stock exchange. However, CNV
approval does not imply certification as to the quality of the
securities or the solvency of the issuer issuers oflisted
securities are required to file unaudited quarterly financial
statements and audited annual financial statements prepared in
accordance with IFRS, as issued by the IASB (excluding financial
institutions under the supervision of the Central Bank, insurance
companies under the supervision of the Insurance Superintendence
and medium and small enterprises) and various other periodic
reports with the CNV and the stock exchange on which their
securities are listed. In addition, issuers must report to the CNV
and the relevant stock exchange any event related to the issuer and
its shareholders that may affect materially the value of the
securities traded.
In
Argentina, debt and equity securities traded on an exchange must,
unless otherwise instructed by their shareholders, be deposited
with a Central Securities Depository based in Argentina. Currently
the only depositary authorized to act in accordance with the
Capital Markets Law and CNV Rules is Caja de Valores S.A., a
corporation owned by ByMA which provides central depositary
facilities, as well as acting as a clearinghouse for securities
trading and as a transfer and paying agent for securities
transactions.
Law
No. 27,440 streamlines the regulation of mutual funds, public
offerings of securities, of negotiable obligations and regulation
of intermediaries and securities markets, while incorporating a
long-awaited regulation for derivative instruments and the margins
and guarantees that cover them. Below is a summary of the main
amendments to the Capital Markets Law introduced by Law
No. 27,440:
●
Eliminates the
CNV’s power to appoint supervisors with veto power over
resolutions adopted by an issuer’s board of directors without
a judicial order.
●
Grants the CNV the
power to issue regulations to mitigate situations of systemic risk,
set maximum fees to be received by securities exchanges, create or
modify categories of agents, encourage the simplification of the
negotiation of securities and promote the transparency and
integrity of the capital markets, while prohibiting the CNV from
denying an issuer’s public offer authorization request solely
because of opportunity, merit or convenience.
●
Empowers the CNV to
regulate private offerings of securities.
●
Grants federal
commercial courts jurisdiction to review resolutions or sanctions
issued by the CNV.
●
Strengthens due
process guarantees in favor of persons on entities sanctioned by
the CNV and increases the amount of the fines, between ARS 100,000
and ARS 100 million, which can be increased up to five times the
benefits perceived with the infraction.
●
Returns functions
such as supervision, inspection and control of agents and
operations, to the stock exchanges and clearing houses without this
implying delegation of the powers of the CNV.
●
Allows the CNV to
regulate and set ownership limits of authorized markets to restrict
control concentration.Preemptive rights may be exercised through
the placement procedure determined in a public offering prospectus,
instead of the procedure set forth in the Argentine General
Companies Law. Preemptive right holders have the right to subscribe
for newly issued shares in proportion to their shareholding prior
to the capital increase. The subscription price for the newly
issued shares may not be less than the public offering price. In
order to use the public offering regime for a preemptive rights
offering the issuer must (i) have an express provision in its
bylaws adopting this regime in lieu of the regime set forth in the
Argentine General Companies Law; and (ii) the issuer’s
shareholders must approve any issuance of equity securities or
convertible debt securities.
●
Eliminates share
accretion rights, unless expressly provided for in a listed
company’s bylaws.
●
Allows foreign
entities to participate in all shareholder meetings through
authorized agents.
●
Establishes
guidelines to set the offer price in a mandatory tender
offer.
●
Allows the offeror
to freely set the offer price in a voluntary tender
offer.
282
Information regarding the BYMA
(1)
|
|
As
of June 30,
|
|
|
|
2020
|
2019
|
|
Market
capitalization (in billions of ARS )
|
2,252
|
9,099
|
|
Average daily
trading volume
(2)
(in millions of
ARS )
|
1,528
|
1,252
|
|
Number of listed
companies
(3)
|
89
|
96
|
(1)
Reflects Merval historical data.
(2)
During the month of June.
(3)
Includes companies that received authorization for
listing.
Although
companies may list all of their capital stock on the ByMA, in many
cases a controlling block is retained by the listed company’s
shareholders, resulting in a relatively small percentage of many
companies’ stock being available for active trading by the
public.
As of
June 30, 2020, approximately 89 companies had equity
securities listed on, or being transitioned to the ByMA. The
Argentine securities markets generally have substantially more
volatility than securities markets in the United States and certain
developed countries. The S&P Merval index experienced a 44.9%
increase in calendar year 2016, a 77.7% increase in 2017, 0.8%
increase in 2018, 39.6% increase in 2019. In order to avoid large
fluctuations in securities prices of traded securities, the ByMA
operates a system pursuant to which the negotiation of a particular
security is suspended for 15 minutes when the price of the security
registers a variation between 10% and 15% and between 15% and 20%,
during any trading session. Any additional 5% variation in the
price of the security results in additional 10 minutes
successive suspension periods.
NASDAQ Stock Market
Our
ADRs are listed and traded in the NASDAQ Global Market under the
trading symbol “CRESY”.
D. SELLING SHAREHOLDERS
This
item is not applicable.
E. DILUTION
This
item is not applicable.
F. EXPENSES OF THE ISSUE
This
item is not applicable.
A. SHARE CAPITAL
This
item is not applicable.
B. MEMORANDUM AND ARTICLES OF ASSOCIATION
Our Corporate Purpose
Our
legal name is Cresud Sociedad Anónima Comercial, Inmobiliaria,
Financiera y Agropecuaria. We were incorporated under the laws of
Argentina on December 31, 1936 as a sociedad anónima (Stock
Corporation) and were registered with
Public Registry
on February 19, 1937
under number 26, on page 2, book 45 of National by-laws Volume.
Pursuant to our by-laws, our term of duration expires on June 6,
2082.
Pursuant
to article 4 of our by-laws our purpose is to perform the following
activities:
●
commercial
activities with respect to cattle and products pertaining to
farming and animal husbandry;
●
real estate
activities with respect to urban and rural properties;
●
financial
activities, except for those regulated by Law No. 21,526 of
financial entities;
●
farming and animal
husbandry activities, for properties owned by us or by third
parties; and
●
agency and advice
activities for which there is not required a specific qualifying
title.
283
Limited Liability
Shareholders’
liability for losses is limited to their equity interest in us.
Notwithstanding the foregoing, under the Argentine Corporation Law
No. 19,550, shareholders who voted in favor of a resolution that is
subsequently declared void by a court as contrary to Argentine law
or a company’s by-laws (or regulation, if any) may be held
jointly and severally liable for damages to such company, other
shareholders or third parties resulting from such resolution. In
addition, a shareholder who votes on a business transaction in
which the shareholder’s interest conflicts with that of the
company may be liable for damages under the Argentine Corporation
Law, but only if the transaction would not have been validly
approved without such shareholder’s vote.
Capitalization
We may
increase our share capital upon authorization by our shareholders
at an ordinary shareholders’ meeting. Capital increases must
be registered with the Public Registry, and published in the
Official Gazette (
Boletín
Oficial)
. Capital reductions may be voluntary or mandatory
and must be approved by the shareholders at an extraordinary
shareholders’ meeting (
asamblea extraordinaria
). Reductions in
capital are mandatory when losses have depleted reserves and
exceeded 50% of capital. As of June 30, 2020 our share capital
consisted of 501,642,804 common shares.
Our
bylaws provide that preferred stock may be issued when authorized
by the shareholders at an extraordinary shareholders’ meeting
(
asamblea extraordinaria
)
and in accordance with applicable regulations. Such preferred stock
may have a fixed cumulative dividend, with or without additional
participation in our profits, resolved by the shareholders’
meetings. We currently do not have outstanding preferred
stock.
Preemptive Rights and Increases of Share Capital
Pursuant
to our by-laws and Argentine Corporation Law No. 19,550, in the
event of an increase in our share capital, each of our existing
holders of our common shares has a preemptive right to subscribe
for new common shares in proportion to such holder’s share
ownership. For any shares of a class not preempted by any holder of
that class, the remaining holders of the class will be entitled to
accretion rights based on the number of shares they purchased when
they exercised their own preemptive rights. Rights and accretion
rights must be exercised simultaneously within 30 days following
the time in which notices to the shareholders of a capital increase
and of the rights to subscribe thereto are published for three days
in the Official Gazzette
(Boletín Oficial)
and a widely
circulated newspaper in Argentina. Pursuant to the Argentine
Corporation Law No. 19,550, such 30-day period may be reduced to 10
days by a decision of our shareholders adopted at an extraordinary
shareholders’ meeting (
asamblea extraordinaria
).
Additionally,
the Argentine Corporation Law No. 19,550 permits shareholders at an
extraordinary shareholders’ meeting (
asamblea extraordinaria
) to suspend or
limit the preemptive rights relating to the issuance of new shares
in specific and exceptional cases in which the interest of the
Company requires such action and, additionally, under the following
specific conditions:
●
the issuance is
expressly included in the list of matters to be addressed at the
shareholders’ meeting; and
●
the shares to be
issued are to be paid in-kind or in exchange for payment under
pre-existing obligations.
Furthermore,
Article 12 of the Negotiable Obligations Law No. 23,576 permits
shareholders at an extraordinary shareholders’ meeting
(
asamblea extraordinaria
)
to suspend preemptive subscription rights for the subscription of
convertible notes under the above-mentioned conditions. Preemptive
rights may also be eliminated, so long as a resolution providing so
has been approved by at least 50% of the outstanding capital stock
with a right to decide such matters and so long as the opposition
to such resolution does not surpass 5% of the share capital.
Accretion rights may be eliminated and reduce the term for the
exercise of the preemptive rights to no less than 10 days, when the
company executes a underwriting agreement with an intermediary
agent for its subsequent distribution to the public.
284
In
addition, Section 62 bis of the Capital Markets Law No. 26,831, as
amended, sets forth that in case of capital increase of shares or
convertible notes offer through public offering and subject to the
two conditions indicated as follow, the preemptive right as set out
in Section 194 of the Argentine Corporations Law No. 19,550 and
Section 11 of Negotiable Obligations Law No. 23,576 shall be
exercised exclusively through the placement’s proceeding
determined in the public offering prospect. The owners of the
shares and the convertible notes, beneficiaries of the preemptive
right, shall have priority in the adjudication up to the amount of
the shares that correspond to them according to their ownership.
The referred two conditions are: (i) the inclusion of the
disposition in the bylaws of the company and (ii) the approval of
the shareholders’ meeting that approves the issuance of the
shares and the convertible bonds. Unless the bylaws dispose
otherwise, the accretion right shall not be
applicable.
Shareholders’ Meetings and Voting Rights
Our
bylaws provide that shareholders’ meetings may be called by
our board of directors or by our Supervisory Committee or at the
request of the holders of shares representing no less than 5% of
the common shares. Any meetings called at the request of
shareholders must be held within 30 days after the request is made.
Any shareholder may appoint any person as its duly authorized
representative at a shareholders meeting, by granting a proxy.
Co-owners of shares must have single representation.
In
general, the following matters can be considered only at an
extraordinary shareholders’ meeting (
asamblea extraordinaria
):
●
matters that may
not be approved at an ordinary shareholders’
meeting;
●
the amendment of
our bylaws;
●
reductions in our
share capital;
●
redemption,
reimbursement and amortization of our shares;
●
mergers, and other
corporate changes, including dissolution and
winding-up;
●
limitations or
suspensions to preemptive rights to the subscription of the new
shares; and
●
issuance of
debentures, convertible negotiable obligations and bonds that do
not qualify as notes (obligaciones negociables).
In
accordance with our by-laws, ordinary and special
shareholders’ meetings (
asamblea extraordinaria
) are subject to
a first and second quorum call, the second to occur upon the
failure of the first. The first and second notice of ordinary
shareholders’ meetings may be made simultaneously. In the
event that both are made on the same day, the second must occur at
least one hour after the first. If simultaneous notice was not
given, the second notice must be given within 30 days after the
failure to reach quorum at the first. Such notices must be given in
compliance with applicable regulations. In the case of special
shareholders’ meetings the second call must be made within 30
days after the failure to reach the quorum of the first by giving
appropriate notice according to applicable
regulations.
A
quorum for an ordinary shareholders’ meeting on the first
call requires the presence of a number of shareholders holding a
majority of the shares entitled to vote and, on the second call,
the quorum consists of the number of shareholders present, whatever
that number. Decisions at ordinary shareholders’ meetings
must be approved by a majority of the votes validly exercised by
the shareholders.
A
quorum for an special shareholders’ meeting (
asamblea extraordinaria
) on the first
call requires the presence of persons holding 60% of the shares
entitled to vote and, on the second call, the quorum consists of
the number of shareholders present, whatever that number. Decisions
at special shareholders’ meeting (asamblea extraordinaria)
generally must be approved by a majority of the votes validly
exercised.
However,
pursuant to the Argentine Corporation Law No. 19,550, all
shareholders’ meetings, whether convened on a first or second
quorum call, require the affirmative vote of the majority of shares
with right to vote in order to approve the following
decisions:
●
advanced winding-up
of the company;
●
transfer of the
domicile of the company outside of Argentina;
●
fundamental change
to the purpose of the company;
●
total or partial
mandatory repayment by the shareholders of the paid-in capital;
and
285
●
a merger or a
spin-off, when our company will not be the surviving
company.
Holders
of common shares are entitled to one vote per share. Owners of
common shares represented by ADRs exercise their voting rights
through the ADR Depositary, who acts upon instructions received
from such shareholders and, in the absence of instructions, votes
in the same manner as our majority of the shareholders present in
the shareholders’ meeting.
The
holders of preferred stock may not be entitled to voting rights.
However, in the event that no dividends are paid to such holders
for their preferred stock, the holders of preferred stock are
entitled to voting rights. Holders of preferred stock are also
entitled to vote on certain special matters, such as a
transformation of the corporate type, early dissolution, change to
a foreign domicile, fundamental change in the corporate purposes,
total or partial replacement of capital losses, mergers in which
our company is not the surviving entity, and spin-offs. The same
exemption will apply in the event the preferred stock is traded on
any stock exchange and such trading is suspended or canceled. Note
that the Company has not outstanding preferred stock.
Dividends and Liquidation Rights
The
Argentine Corporation Law No. 19,550 establishes that the
distribution and payment of dividends to shareholders is valid only
if they result from realized and net earnings of the company
pursuant to an annual balance sheet approved by the shareholders.
Our board of directors submits our financial statements for the
previous fiscal year, together with the reports of our Supervisory
Committee, to the Annual Ordinary Shareholders’ Meeting. This
meeting must be held on or before October 31 of each year to
approve the financial statements and decide on the allocation of
our net income for the year under review. The distribution, amount
and payment of dividends, if any, must be approved by the
affirmative vote of the majority of the present votes with right to
vote at the meeting.
The
shareholders’ meeting may authorize payment of dividends on a
quarterly basis provided no applicable regulations are violated. In
that case, all and each of the members of the board of directors
and the supervisory committee will be jointly and severally
unlimitedly liable for the refund of those dividends if, as of the
end of the respective fiscal year, the realized and net earnings of
the company are not sufficient to allow the payment of
dividends.
When we
declare and pay dividends on the common shares, the holders of our
ADRs, each representing the right to receive ten ordinary shares,
outstanding on the corresponding registration date, are entitled to
receive the dividends due on the common shares underlying the ADRs,
subject to the terms of the Deposit Agreement dated March 18, 1997
executed by and between us, The Bank of New York, as depositary and
the eventual holders of ADRs. The cash dividends are to be paid in
Pesos and, except under certain circumstances, are to be converted
by the Depositary into U.S. Dollars at the exchange rate prevailing
at the conversion date and are to be paid to the holders of the
ADRs net of any applicable fee on the dividend distribution, costs
and conversion expenses, taxes and public charges.
Dividends
may be lawfully paid only out of our retained earnings determined
by reference to the financial statements prepared in accordance
with Argentine GAAP. In accordance with the Argentine Corporation
Law 19,550, net income is allocated in the following order: (i) 5%
is retained in a legal reserve until the amount of such reserve
equals 20% of the company’s outstanding capital; (ii)
dividends on preferred stock or common shares or other amounts may
be retained as a voluntary reserve, contingency reserve or new
account, or (iii) for any other purpose as determined by the
company’s shareholders at an ordinary shareholders’
meeting.
Our
legal reserve is not available for distribution. Under the
applicable regulations of the CNV Rules, dividends are distributed
pro rata
in accordance with
the number of shares held by each holder within 30 days of being
declared by the shareholders for cash dividends and within 90 days
of approval in the case of dividends distributed as shares. The
right to receive payment of dividends expires five years after the
date on which they were made available to shareholders. The
shareholders’ meeting may authorize payment of dividends on a
quarterly basis provided no applicable regulations are violated. In
such case, all and each of the members of the board of directors
and the supervisory committee will be jointly and severally liable
for the refund of those dividends if, atthe end of the respective
fiscal year, the realized and net earnings of the company are not
sufficient to allow for the payment of dividends.
286
When we
declare and pay dividends on the common shares, the holders of our
ADRs, each representing the right to receive ten ordinary shares,
outstanding on the corresponding registration date, are entitled to
receive the dividends due on the common shares underlying the ADRs,
subject tothe terms of the Deposit Agreement dated March 18, 1997
executed by and between us, The Bank of New York, as depositary and
the eventual holders of ADRs. The cash dividends are to be paid in
Pesos and, except under certain circumstances, are to be converted
by the Depositary into U.S. Dollars at the exchange rate prevailing
at the conversion date and are to be paid to the holders of the
ADRs net of any applicable fee on the dividend distribution, costs
and conversion expenses, taxes and public charges.
Regardless
the term for dividend’s payment established by CNV,
regulations enacted by the Buenos Aires Stock Exchange set forth
that cash dividends must be paid within 10 days after their
approval by a shareholders’ meeting.
Approval of Financial Statements
Our
fiscal year ends on June 30 of each year, after which we prepare an
annual report which is presented to our board of directors and
Supervisory Committee. The board of directors submits our financial
statements for the previous fiscal year, together with the reports
of our Supervisory Committee, to the annual ordinary
shareholders’ meeting, which must be held within 120 days of
the close of our fiscal year, in order to approve our financial
statements and determine our allocation of net income for such
year. At least 20 days before the ordinary shareholders’
meeting, our annual report must be available for inspection at our
principal office.
Right of Dissenting Shareholders to Exercise Their Appraisal
Right
Whenever
certain actions are approved at an extraordinary
shareholders’ meeting
(asamblea extraordinaria
) (such as the
approval of a merger, a spin-off (except when the shares of the
acquired company are publicly traded), a fundamental change of
corporate purpose, a transformation from one type of corporation to
another, a transfer of the domicile of our company outside of
Argentina or, as a result of the action approved, the shares cease
to be publicly traded) any shareholder dissenting from the adoption
of any such resolution may withdraw from our company and receive
the book value per share determined on the basis of our latest
financial statements, whether completed or to be completed,
provided that the shareholder exercises its appraisal rights within
ten days following the shareholders’ meeting at which the
resolution was adopted.
In
addition, to have appraisal rights, a shareholder must have voted
against such resolution or act within 15 days following the
shareholders’ meeting if the shareholder was absent and can
prove that he was a shareholder of record on the day of the
shareholders meeting. Appraisal rights are extinguished with
respect to a given resolution if such resolution is subsequently
overturned at another shareholders’ meeting held within 75
days of the previous meeting at which the original resolution was
adopted. Payment on the appraisal rights must be made within one
year of the date of the shareholders’ meeting at which the
resolution was adopted, except where the resolution involved a
decision that our stock ceases to be publicly traded, in which case
the payment period is reduced to 60 days from the date of the
resolution.
Ownership Restrictions
The CNV
Rules require that transactions that cause a person’s
holdings of capital stock of a registered Argentine company, to
hold 5% or more of the voting power, should be immediately notified
to the CNV. Thereafter, every change in the holdings that
represents a multiple of 5% of the voting power should also be
notified.
Directors,
senior managers, executive officers, members of the supervisory
committee, and controlling shareholders of an Argentine company
whose securities are publicly listed, should notify the CNV on a
monthly basis, of their beneficial ownership of shares, debt
securities, and call and put options related to securities of such
companies and their controlling, controlled or affiliated
companies.
Holders
of more than 50% of the common shares of a company or who otherwise
have voting control of a company, as well as directors, officers
and members of the supervisory committee, must provide the CNV with
annual reports setting forth their holdings in the capital stock of
such companies and monthly reports of any change in their
holdings.
287
Public acquisition offer
The
main characteristics of the public acquisition offer regime
established in the Capital Markets Law No. 26,831, as well as in
the CNV Rules and in the Company’s Bylaws are detailed below.
We recommend the investing public to read the Capital Markets Law
No. 26,831, the CNV Rules and the Company’s Bylaws, in order
to obtain an exhaustive knowledge of the regime and procedure of
public acquisition offer applicable to the Company in
particular.
According
to the Capital Markets Law No. 26,831, any public offer to acquire
shares with voting rights of a company whose shares are admitted to
the public offering regime, whether voluntary or mandatory, must be
carried out under the terms of the Capital Markets Law No. 26,831
and CNV Rules, with transparency rules and principles of protection
for the investing public in the public offering
regime.
In
accordance with the CNV Rules, it is considered a public offer for
the acquisition and/or exchange of securities for the market
operation by which a human or legal entity, acting individually or
in agreement with other person/s, offers acquire and/or exchange
shares with the right to vote of a company admitted to the regime
of public offering of shares, for a pre-fixed time, and subject to
a special procedure of control of the terms and conditions of the
offer.
Public
acquisition offers shall (i) also include the holders of
subscription rights or stock options, convertible debt securities
or other similar securities that, directly or indirectly, may
entitle the subscription, acquisition or conversion into shares
with the right to vote; and (ii) be made for all of the shares with
voting rights and other securities issued that give right to shares
with the right to vote, and may not be subject to any
condition.
Through
General Resolution 779/2018, CNV regulated the regime of
“public acquisition offers” introducing modifications
to the CNV Rules, with the objective, among others,
of:
-
Define the minimum
content of the explanatory prospectuses of the public acquisition
offer and/or exchange of securities.
-
Regulate the types
of reports related to the fair price to be presented for the cases
of public offers by takeovers and other mandatory public
offers.
-
Specify the
independence requirements that evaluators must meet and the minimum
contents of the reports they issue.
-
Introduce the
possibility of presenting guarantees on the offer by a foreign
financial entity, with a branch or permanent representation in the
Argentine Republic, and an insurance entity audited by the National
Insurance Superintendence, in the latter case, upon agreement of
the superintendence.
-
Establish the
applicable terms for the publication of the announcement, the
presentation of the authorization request to the CNV, the launching
and liquidation of the public acquisition offer and the publication
of the prospectus and information of results, in order to specify
and limit the terms in the different stages of the process, in
order to significantly reduce the time of its processing, for the
benefit of investors.
-
Regulate the
procedure to be followed in case of objection to the price, the
consequences of non-compliance with the obligation to make a public
offer of acquisition, and concerning the competing offers and
assumptions of unnecessary launching of public procurement
offers.
Voluntary public acquisition offer
CNV
Rules establish that voluntary public acquisition offers may be
made for the acquisition and/or exchange of shares of a company
admitted to the regime of public offering of shares, for a number
of securities equal to or less than the total, provided that the
offeror is not in a situation that fits into a case of mandatory
takeover bid. Voluntary public acquisition offer and/or exchange
will be subject to the provisions established for mandatory offers,
with the exception of the fair price. The price of the offer will
be freely determined by the offeror, and the guidelines and
criteria applied for its determination must be disseminated and, if
applicable, the valuation report that have been taken into account
must be published.
288
Mandatory takeover bid
Mandatory takeover bid according to the Capital Market Law No.
26,831
Capital
Markets Law No. 26,831 establishes that it will be obliged to lunch
a public offer of acquisition at an equitable price who,
individually or through concerted action, has effectively reached a
controlling stake in a company whose shares are admitted to the
regime of the public offer.
For the
Capital Markets Law No. 26,831, concerted action is the coordinated
action of two or more persons, according to a formal or informal
agreement or understanding, to actively cooperate in the
acquisition, holding or disposition of shares or other securities
or rights convertible into shares of stock. An entity whose
negotiable securities are admitted to the public offering, acting
through any of said persons, through any society or other
associative form in general, or through other persons related to
them, related to or under its control, or that they are holders of
voting rights on behalf of them.
According
to the Capital Markets Law No. 26,831, it is understood that a
person has, individually or in concert with other persons a
“control participation” when:
i.
reach, directly or
indirectly, a percentage of voting rights equal to or greater than
fifty percent (50%) of the company, excluding from the calculation
base the shares that, directly or indirectly, belong to the
affected company ; or
ii.
has reached an
interest of less than fifty percent (50%) of voting rights of a
company but acts as controlling party, in accordance with the term
defined in this law.
The
offer will be submitted to the CNV as soon as possible and at the
most within one month after the close of the control
participation.
Regime of residual shares
Public acquisition offer by “almost-total”
control
According
to the Capital Markets Law No. 26,831, when a limited company is
subject to “almost-total” control:
a)
Any minority
shareholder may, at any time, intimate the controlling party so
that the latter makes an offer to purchase all of the minority
shareholders at an equitable price;
b)
Within a period of
six (6) months from the date in which it has been under
“almost-total” control of another person, the latter
may issue a unilateral declaration of will to acquire all of the
remaining social capital held by third parties.
It is
understood that almost any company is under total control over
which another person or legal entity, either directly or through
another or other companies in turn controlled by it, is the owner
of ninety-five percent (95%) or more of the subscribed
capital.
Holders
of shares of any type or class, as well as holders of all other
securities convertible into shares that are not of the controlling
person or persons, are defined as minority
shareholders.
Thus
minority shareholders right only corresponds to those who prove
ownership of their shares or other securities at the date when the
company was subject to “almost-total” control; the
legitimation is only transmitted to the successors.
The
controlling company or person and the controlled company must
notify the CNV and the market in which the controlled company lists
its shares, the fact that it is in a situation of
“almost-total” control, within the timeframe and
conditions set out in the regulations. The existence of
“almost-total” control can be verified by the CNV at
the request of the minority shareholders. If this situation is
verified, the CNV will notify the minority shareholders by the
means it deems appropriate, and these will remain thereafter,
authorized to intimate the controlling party so that it makes a
purchase offer to all the minority shareholders.
These
mechanisms are also applicable to the exercise of
“almost-total” control shared or arranged between two
or more entities, or between an entity and other person or legal
entity, even though they are not part of the same group or are
related to each other, provided that the exercise of that common
control has characteristics of stability and so it is declared,
assuming joint responsibility among all of them.
289
Voluntary withdrawal of the public offer regime
When a
company, whose shares are admitted to the public offering regime,
agrees to voluntarily withdraw it, it must follow the procedure
established by the CNV and, likewise, must compulsorily lunch a
public offer to acquire its shares, subscription rights,
convertible notes or stock options.
The
acquisition of own shares must be made with realized and liquid
gains or with free reserves, when they are fully integrated, and
for their amortization or disposal within the term of article 221
of the Corporation Law, the company must accredit before the CNV
that it has the necessary liquidity and that the payment of the
shares does not affect its solvency. If these points are not
proved, and in the cases of corporate control, the obligation set
forth herein will be the responsibility of the controlling company,
which must prove the same points.
In
turn, it must be subject to the following conditions:
a)
It must be extended
to all convertible notes into shares and other negotiable
securities that give right to its subscription or
acquisition.
b)
It will not be
necessary to extend the offer to those who have voted in favor of
the retirement in the shareholder’ meeting, who must
immobilize their values until the acceptance period determined by
the regulations has elapsed.
c)
The explanatory
prospectus of the public takeover bid will clearly express this
circumstance and will identify the tradable securities that have
been immobilized, as well as the identity of their
holders.
d)
Comply with the
rules of determination, information and objection and other
provisions of the equitable price in accordance with the Capital
Markets Law No. 26,831.
Registrations and Transfers
Our
common shares are held in registered, book-entry form. The registry
for our shares is maintained by
Caja de Valores S.A.
at its executive
offices located at 25 de mayo 362, (C1002ABH) Buenos Aires,
Argentina. Only those persons whose names appear on such share
registry are recognized as owners of our common shares. Transfers,
encumbrances and liens on our shares must be registered in our
share registry and are only enforceable against us and third
parties from the moment registration takes place.
Amendment to the by-laws.
On the
shareholders’ meeting held on October 10, 2007, our
shareholders decided to amend the following sections of the
by-laws: (i) Section Thirteen in order to adapt the performance
bonds granted by directors to current rules and regulations, and
(ii) Section Sixteen in order to incorporate the possibility of
holding remote board meetings pursuant the provisions of section 65
of Executive Branch Decree 677/01.
On the
shareholders’ meeting held on October 31, 2012, our
shareholders decided to amend the Section XVII of the by-laws in
order to modify the quorum and majorities of the remote board
meetings.
On the
shareholder’s meeting held on October 31, 2014, our
shareholders decided to amend the following sections of the
by-laws: (i) Section First in order to comply with the Capital
Markets Law No. 26,831 and (ii) Section Twenty-Four in order to
incorporate the regulation of the shareholders’ meeting held
with shareholders present or communicated through teleconference
technologies.
On the shareholder’s meeting held on October 29, 2018 our
shareholders decided to amend the following sections of the by-laws
in order to adapt them to certain new legal provisions: (i) Section
Eighth, establishing that if there is an Issuance of Shares, the
shareholders’ preemptive right will be exercised as
established in the prospect of the issuance; (ii) Section Eleventh,
establishing the issuance of Negotiable Obligations may be decided
by the Board of Directors; and (iii) Section Twenty-Second
describing the duties of the Audit Committee as well as authorizing
the Audit Committee to hold meeting via conference, teleconference
of any other electronic means. Such amendments are pending of
approval by the Public Registry of the City of Buenos
Aires.
290
C. MATERIAL CONTRACTS
We do
not have any material contract entered into outside the ordinary
course of business other than some of the operations previously
described under the Related Party Transactions, the Recent
Developments and Our Indebtedness sections.
D. EXCHANGE CONTROLS
On
September 1, 2019, the Argentine government issued Decree No.
609/2019, pursuant to which foreign exchange controls were
temporarily imposed until December 31, 2019. On January 3, 2020,
the Argentine government issued Decree No. 91/2019, which
permanently extended the foreign exchange controls that expired on
December 31, 2019. A consolidated text of the currently applicable
exchange control regulations can be found in Communication
“A” 6,844/2019, as amended, issued by the Central Bank
on December 6, 2019. On December 27, 2019 and December 30, 2019,
the Central Bank issued Communications “A” 6,854/2019
and “A” 6,856/2019, respectively, pursuant to which the
exchange control regulations found in Communication “A”
6,844/2019 remain effective after December 31, 2019. A brief
summary of the exchange control regulations in force as of the date
of this Form Annual Report is set forth below.
Exports of Goods
Exporters of goods must repatriate, and settle in
pesos through the foreign exchange market, the proceeds from
exports cleared through customs after September 2, 2019. For
operations with related parties and exports of certain goods, the
regulations provide that exporters have 15 days from the time the
export cleared customs, to settle the proceeds from such exports
(
i.e.
, convert the proceeds from the exports from
foreign currently into Argentine pesos) in the foreign exchange
market. For all other transactions, exporters have 180 days from
the date the export cleared customs, to settle the proceeds from
such exports in the foreign exchange market.
Sale of Non-Financial Assets
Proceeds
in foreign currency from the sale of non-financial assets must be
repatriated and settled in pesos in the foreign exchange market
within five business days from the date of collection in Argentina
or abroad, or the date of deposit of such amounts in foreign bank
accounts.
Exports of Services
Exporters
of services must repatriate, and settle in pesos through the
foreign exchange market, the proceeds from their exports within
five business days from the date of collection in Argentina or
abroad, or the date of deposit of such amounts in foreign bank
accounts.
Imports of Goods and Services
Importers
of goods and/or services must obtain prior authorization from the
Central Bank for the settlement of foreign currency-denominated
debts in connection with the import of goods and services.
Importers are exempt from such requirement for due or overdue
payments in connection with the import of goods provided by
non-resident related companies when such payments do not exceed the
equivalent of USD 2 million per month per resident
importer.
Foreign Assets
Prior authorization from the Central Bank is
required for the acquisition of foreign assets (
e.g.
, purchase of foreign currency, among others) and
for derivative transactions by Argentine companies, Argentine local
governments, Argentine mutual funds, trusts and other Argentine
entities. Individuals must request authorization when the value of
such assets exceed USD 200 (in the case of withdrawals from
Argentine bank accounts) or USD 100 (in the case of cash purchases)
in any calendar month.
External Financial Indebtedness
Borrowers
must repatriate and settle in the foreign exchange market the
proceeds from financial indebtedness incurred after September 1,
2019, as a condition for accessing the foreign exchange market to
make debt service payments thereunder. Subject to compliance with
requirements set forth in the regulations, access to the foreign
exchange market will be granted for the repayment of principal or
interest up to three business days in advance of the due
date.
291
Communication
“A” 7,030, and its amendments, establishes the prior
agreement of the Central Bank, until October 31, 2020, for the
cancellation of capital services of financial debts with abroad,
provided that the creditor is a related counterparty.
Additionally,
Communication "A" 7,106 established the requirement, for those who
register scheduled capital maturities between October 15, 2020 and
March 31, 2021 with creditors that are not related counterparties,
to submit to the Central Bank a detail of a refinancing plan
complying with certain criteria established in the said
Communication. Specifically, the Central Bank will grant access to
companies for an amount up to 40% of maturities and companies must
refinance the rest for a term of at least 2 years. This, provided
that the amount for which the exchange market would be accessed for
the cancellation of principal exceeds the equivalent of USD
1,000,000 per calendar month, with some exceptions, expressly
provided for by the regulation.
Indebtedness Between Residents
Prior
authorization from the Central Bank is required for the payment of
foreign currency-denominated obligations between Argentine
residents after September 1, 2019. However, no prior authorization
is required for the payment of foreign currency-denominated
obligations to Argentine financial entities, including, among
others, payments made in respect of credit cards.
Profits and Dividends
Prior
authorization from the Central Bank is required for the transfer of
profits and/or dividends outside of Argentina.
Non-Residents
Non-residents
must obtain prior authorization from the Central Bank to access the
foreign exchange market to purchase foreign currency, with limited
exceptions.
Reporting Regime
In
all cases, access to the foreign exchange market for the payment of
financial or commercial debts will be granted to the extent that
such debts were disclosed in accordance with the Central
Bank’s reporting regime established through Communication
“A” 6,401.
Outgoings
Outflow of funds
Through
Communication “A” 7,001, as amended by Communication
“A” 7,030, the Central Bank established certain
restrictions to carry out sales of securities via the settlement of
foreign currency and its transfer to depository institutions
abroad. In this connection, in order to carry out any outflow of
funds, the entity must:
(i)
request the prior approval of the Central Bank; or
(ii)
rely on an affidavit stating that the client did not carry out
neither sales of securities via the settlement of foreign currency
nor its transfer to foreign depository entities on the day that
access to the foreign exchange market was requested and within 90
days prior to such request, as well as that the customer undertakes
not to carry out such transactions from the date access to the
foreign exchange market is requested and for the subsequent 90
calendar days.
The
Central Bank Communication “A” 7,030 also establishes
the prior approval of the Central Bank to carry out any outflow of
funds through the foreign exchange market from May 29, 2020
onwards, with some exceptions.
In
addition, Communication “A” 7,030, as amended,
established the prior approval of the Central Bank for certain
outflow of funds through the foreign exchange market, unless the
entity has an affidavit from the client stating that at the time of
access to the foreign exchange market:
(a)
All of its local foreign currency holdings are deposited in
accounts in financial institutions and that it did not have liquid
external assets available at the beginning of the day that access
to the foreign exchange market is requested for a higher amount
equivalent to USD 100,000 (with some exceptions, expressly provided
for by the regulation).
292
(b)
Undertakes to settle in pesos through the foreign exchange market,
within five working days of its availability, those funds received
abroad resulting from the collection of loans granted to third
parties, the collection of a term deposit or the sale of any type
of asset, when the asset has been acquired, the deposit constituted
or the loan granted after May 28, 2020.
Securities trading
Central
Bank Communication “A” 7,106 established that
non-residents will not be able to arrange sales of securities with
settlement in foreign currency, except for sales of securities that
have been acquired in Argentina with liquidation in foreign
currency from September 16, 2020 and have remained in the
non-resident's portfolio for a period not less than a
year.
Nevertheless, this would not prevent non-residents
from transferring abroad securities acquired in the country, and
perform their sales abroad, in which case they would take into
account the minimum holding term (or "
parking
") mentioned below.
In
addition, the above-mentioned Communication established that
transactions of securities arranged abroad and securities acquired
abroad may not be settled in pesos in the country.
Nevertheless,
we understand that the transactions of acquiring securities in
pesos in the country with funds from abroad would not be forbidden,
to the extent that the transaction is not documented
abroad.
|
|
Purchase
|
|
|||
|
|
|
ARS
|
Dólar “MEP”
|
Blue chip swap
|
Receiver transfer
|
|
|
ARS
|
No minimum tenure period (MTP)
|
No MTP
|
No MTP
|
15 days of MTP**
|
|
|
Dólar MEP
|
3 days of MTP
|
No MTP
|
No MTP
|
3 days of MTP
|
|
Sale
|
Blue chip swap
|
3 days of MTP
|
No MTP
|
No MTP
|
3 days of MTP
|
|
|
Issuer Transfer
|
3 days of MTP *
|
No MTP
|
No MTP
|
3 days of MTP
|
*Except
in cases where accreditation in the depositary agent is the product
of the primary placement of marketable securities issued by the
national treasury.
**Unless
they are shares and/or Cedears with negotiations in markets
regulated by the CNV.
E. Money Laundering
Argentine
Law No. 25,246, as amended and/or complemented by Laws Nos. 26,087,
26,119, 26,268, 26,683, 26,831, 26,860 and 27,304 (the
“Anti-Money Laundering Law”), categorizes money
laundering as a crime, which is defined as the exchange, transfer,
management, sale or any other use of money or other assets obtained
through a crime, by a person who did not take part in such original
crime, with the potential result that such original assets (or new
assets resulting from such original assets) have the appearance of
having been obtained through legitimate means. In spite of the fact
that there is a specific amount for the money laundering category
(ARS 300,000), the crimes committed for a lower amount are also
punished, but the prison sentence is reduced.
After
the enactment of Law No. 26,683, money laundering was included
in the Penal Code as an independent crime against economic and
financial order and it was split from the title
“Concealment” as originally disposed. Therefore, money
laundering is a crime which may be prosecuted independently. The
Anti-Money Laundering Law created the Financial Information Unit,
or “UIF,” is responsible for the
analysis
,
treatment and procurement of information to prevent money
laundering originating from, among others:
●
Crimes related to
the traffic and illegal commercialization of drugs (Law No.
23,737);
●
Crimes related to
arms traffic (Law No. 22,415);
●
Crimes related to
illegal association or terrorist association;
●
Crimes committed by
illegal associations organized to commit crimes for political or
racial purposes;
●
Crimes against
Public Administration;
●
Crimes of
minor’s prostitution and child pornography; and
●
Crimes related to
terrorism financing.
293
The UIF
analyzes the information received from entities that have the
obligation to report suspicious activities or operations and, as
the case may be, inform the Public Ministry to carry out the
investigations that may be considered relevant or
necessary.
The UIF
analyzes the information it receives and informs the Public
Prosecutor as to whether it should carry out any investigations.
Once the information is received, the UIF may request additional
information and any undertake any action it deems useful for the
fulfillment of its functions. In the context of the analysis,
respondents may not rely on bank, tax, stock or professional
secrecy, or contractual confidentiality commitments to oppose a
request for information from the UIF. Once the analysis is
completed, the UIF is empowered to (i) receive voluntary
declarations, which in no case may be anonymous, (ii) require the
collaboration of all State information services, which are required
to provide it in the terms of the current procedural regulations,
(iii) request the Public Prosecutor’s Office to require the
competent judge to resolve the suspension of execution of any
transaction, (iv) request the Public Prosecutor’s Office to
require search warrants it deems useful for the investigation, (v)
request the Public Ministry to manage all the legal means necessary
to obtain information from any source or origin, and (vi) apply
sanctions.
The
anti-money laundering framework in Argentina also assigns
information and control duties to certain private sector entities,
such as banks, non-profit organizations, stock exchanges, and
insurance companies, including the Central Bank. These regulations
apply to many Argentine companies, including us. These obligations
consist mainly of: (i) maintaining internal policies and
procedures for money laundering prevention and financing of
terrorism, including “know your client” procedures, as
appropriate; (ii) reporting suspicious activity; and
(iii) acting according to the Anti-Money Laundering Law with
respect to the confidentiality of the information obtained from the
clients. For that purpose, each entity involved must appoint an
officer responsible for the monitoring and control under the
Anti-Money Laundering Law.
As part
of a more comprehensive modification of the rules that govern the
scope of supervision of CNV, derived from the enactment of the
revised Capital Markets Law and the CNV Rules, which established a
new regime for the public offer of securities, CNV issued a
revision of its rules to incorporate a new chapter of Anti-Money
Laundering Laws including provisions related to the fulfillment of
duties to be complied by “
Agentes de Negociación
,”
“
Agentes de Liquidación
y Compensación
,” “
Agentes de Distribución y
Colocación
” and “
Agentes de Administración de Productos de
Inversión Colectiva
,” each of which is considered
mandatory under the terms of sections 4, 5 and 22 of
article 20 of Law No. 25,246. Such agents are required to
comply with Law No. 25,246 and its amendments, regulations
enacted by UIF, including executive orders with reference to the
decisions adopted by the United Nations Security Council in the
fight against terrorism and to comply with the resolutions issued
by the Ministry of Foreign Affairs, International Trade and
Religion. Furthermore, “
Agentes de Custodia de Productos de
Inversión Colectiva
(
Sociedades Depositarias de Fondos Comunes de
Inversión
),” “
Agentes de corretaje
,”
“
Agentes de depósito
colectivo
” and listed companies with respect to
contribution, irrevocable contributions or indebtedness made by a
shareholder or a third person to become a shareholder in the
future, are also reached by the resolution.
Each of
these entities must send by internet (through the online
application of CNV) their tax identification number. Additionally,
in case of companies, the personal data of the “Compliance
Officer” (both regular and alternate) must also be
disclosed.
The CNV
Rules provide that entities it regulates may only take action
relating to public offerings of securities, stipulated, future or
optional contracts of any nature and other instruments and
financial products with registered, domiciled or domestic
counterparties known to CNV or foreign counterparties in
jurisdictions included on the list of cooperating countries
provided in article 2º, subsection b) of Decree
No. 589/2013.
Where a
counterparty is not included in the referred list and is from a
jurisdiction where it is regulated by an entity similar to CNV,
validity of the transactions will be granted if the foreign
regulator has signed a memorandum of understanding, cooperation and
exchange of information with the CNV.
With
the purpose of strengthening the requirements applicable to the
grant of authorization to operate in the capital markets,
additional requirements were established in connection with:
(i) competence and capacity; (ii) moral integrity and
honesty and (iii) solvency. Such requirements are subject to
the appraisal of CNV and must be fulfilled by managers, directors,
auditors and any other individual who performs duties or activities
within the company.
294
Pursuant
to Decree 360/2016 dated February 16, 2016, the Argentine
government created the National Coordination Program for Combating
Money Laundering and Terrorist Financing within the purview of the
Ministry of Justice and Human Rights. Its purpose is to rearrange,
coordinate and strengthen the anti-money laundering and
anti-terrorist financing system at the national level, in light of
the actual risks that could impact Argentina territory and the
global requirements to be met under the scope of the obligations
and international recommendations of the United Nations and FATF
standards.
Moreover,
Law No. 27,260, which introduced certain tax modifications and a
new regime for residents to disclose undeclared assets, established
that the UIF would now be within the purview of the Ministry of
Economy and Finances. Nowadays, as a result of the reorganization
of said ministry, the UIF depends on the Ministry of Finance. For
its part, the UIF recently issued Resolution No. 4/2017, which
requires certain specific due diligence procedures (commonly called
“know your client”) to be performed when a national or
foreign depositor opens a bank account for the purpose of
investment.
On
March 5, 2018, the UIF Resolution No. 21/2018 on
guidelines for the management of risks of money laundering and
financing of terrorism and on the minimum compliance to be adopted
for the prevention of laundering was published in the Official
Gazette. In line with UIF Resolution No. 30-E/17 addressed to
the financial sector, UIF Resolution No. 21/2018 also moves
from a formalistic compliance approach to a risk-based approach, in
order to ensure that the measures implemented are commensurate with
the risks identified. In this way, the obligated subjects must
identify and evaluate their risks and, depending on this, adopt
management and mitigation measures. In this framework, they are
enabled to implement accredited technological platforms that allow
carrying out procedures at a distance, without personal display of
the documentation, without this conditioning the fulfillment of due
diligence duties.
Likewise,
it is reported that in August 2018, in accordance with Resolution
No. 97/2018 of the UIF, the regulation of the Central Bank’s
duty of cooperation with the UIF was approved to adapt said
regulation to Resolution No. 30-E/2017.
In
November 2018, the UIF published Resolution No. 134/2018, modified
by Resolution No. 15/2019, which updates the list of people who
should be considered “politically exposed”
(
PEP
) in Argentina,
considering the functions they perform or have performed, as well
as its closeness or affinity relationship with third parties that
perform or have performed in such functions.
On
December 26, 2018, the UIF published Resolution No. 154/2018, which
modified the current supervisory procedures through new adapted
designs and in accordance with the international standards promoted
by the FATF based on the risks. As a consequence, the UIF approved
the “Risk-based supervision procedures of the Financial
Information Unit”, which repeals the provisions of Annexes
II, III and IV of UIF Resolution No. 104/2010, Article 7 and
provisions of Annexes V and VI of UIF Resolution No. 165/2011 and
Annex III of UIF Resolution No. 229/2014.
F. TAXATION
United States Taxation
The
following summary describes the material United States Federal
income tax consequences of the ownership of our common shares and
ADSs as of the date hereof. The discussion set forth below is
applicable to U.S. Holders (as defined below). Except where noted,
this discussion deals only with U.S. Holders that hold our common
shares or ADSs as capital assets. This summary does not represent a
detailed description of the United States federal income tax
consequences applicable to you if you are subject to special
treatment under the United States federal income tax laws,
including if you are:
●
a
bank;
●
a dealer in
securities or currencies;
●
a financial
institution;
●
a regulated
investment company;
●
a real estate
investment trust;
●
an insurance
company;
●
a tax-exempt
organization;
295
●
a person holding
our common shares or ADSs as part of a hedging, integrated or
conversion transaction, constructive sale or straddle;
●
a trader in
securities that has elected the mark-to-market method of accounting
for your securities;
●
a person liable for
alternative minimum tax;
●
a person who owns
or is deemed to own 10% or more of our stock (by vote or
value);
●
a person required
to accelerate the recognition of any item of gross income with
respect to our common shares or ADSs as a result of such income
being recognized on an applicable financial statement;
●
a partnership or
other pass-through entity for United States federal income tax
purposes; or
●
a person whose
“functional currency” is not the U.S.
Dollar.
Furthermore,
the discussion below is based upon the provisions of the Internal
Revenue Code of 1986, as amended (the “Code”), and
regulations, rulings and judicial decisions thereunder as of the
date hereof, and such authorities may be repealed, revoked or
modified so as to result in United States federal income tax
consequences different from those discussed below. This summary
does not contain a detailed description of all the United States
federal income tax consequences to you in light of your particular
circumstances and does not address the Medicare tax on net
investment income, or the effects of any state, local or non-United
States tax laws. In addition, this summary is based, in part, upon
representations made by the depositary (the
“Depositary”) to us and assumes that the deposit
agreement governing the ADSs, and all other related agreements,
will be performed in accordance with their terms.
As used
herein, the term “U.S. Holder” means a beneficial owner
of common shares or ADSs that is for United States federal income
tax purposes:
●
an individual
citizen or resident of the United States;
●
a corporation
created or organized in or under the laws of the United States, any
state thereof or the District of Columbia;
●
an estate the
income of which is subject to United States Federal income taxation
regardless of its source; or
●
a trust if it (1)
is subject to the primary supervision of a court within the United
States and one or more United States persons have the authority to
control all substantial decisions of the trust or (2) has a valid
election in effect under applicable United States Treasury
regulations to be treated as a United States person.
If a
partnership holds our common shares or ADSs, the tax treatment of a
partner will generally depend on the status of the partner and the
activities of the partnership. If you are a partner of a
partnership holding our common shares or ADSs, you should consult
your tax advisors.
IF YOU ARE CONSIDERING THE PURCHASE, OWNERSHIP OR DISPOSITION OF
COMMON SHARES OR ADSS YOU SHOULD CONSULT YOUR OWN TAX ADVISOR
CONCERNING THE UNITED STATES FEDERAL INCOME TAX CONSEQUENCES TO YOU
AS WELL AS ANY CONSEQUENCES ARISING UNDER THE LAWS OF ANY OTHER
TAXING JURISDICTION.
ADSs
In
general, for United States federal income tax purposes, U.S.
Holders of ADSs will be treated as the owners of the underlying
common shares that are represented by the ADSs. Accordingly,
deposits or withdrawals of our common shares by U.S. Holders for
ADSs will not be subject to United States federal income
tax.
296
Distributions on Common Shares or
ADSs
Subject
to the discussion under “Passive Foreign Investment
Company” below, the gross amount of distributions on our
common shares or ADSs (including amounts withheld to reflect
Argentine withholding taxes, if any) will be taxable as dividends
to the extent paid out of our current or accumulated earnings and
profits (as determined under United States federal income tax
principles). Such income (including withheld taxes) will be
includable in your gross income as ordinary income on the day
actually or constructively received by you, in the case of common
shares, or by the Depositary, in the case of ADSs. Such dividends
will not be eligible for the dividends-received deduction allowed
to corporations under the Code.
With
respect to non-corporate United States investors, certain dividends
received from a qualified foreign corporation may be subject to
reduced rates of taxation. A foreign corporation is treated as a
qualified foreign corporation with respect to dividends received
from that corporation on common shares (or ADSs representing such
common shares) that are readily tradable on an established
securities market in the United States. United States Treasury
Department guidance indicates that ourADSs (which are listed on the
NASDAQ), but not our common shares, are readily tradable on an
established securities market in the United States. Thus, we do not
believe that dividends that we pay on our common shares that are
not represented by ADSs currently meet the conditions required for
these reduced tax rates. Non-corporate holders that do not meet a
minimum holding period requirement during which they are not
protected from the risk of loss or that elect to treat the dividend
income as “investment income” pursuant to Section
163(d)(4) of the Code will not be eligible for the reduced rates of
taxation regardless of our status as a qualified foreign
corporation. In addition, the rate reduction will not apply to
dividends if the recipient of a dividend is obligated to make
related payments with respect to positions in substantially similar
or related property. This disallowance applies even if the minimum
holding period has been met. Non-corporate U.S. Holders should
consult their own tax advisors regarding the application of these
rules given their particular circumstances.
The
amount of any dividend paid in Pesos will equal the U.S. Dollar
value of the Pesos received calculated by reference to the exchange
rate in effect on the date the dividend is actually or
constructively received by you, in the case of common shares, or by
the Depositary, in the case of ADSs, regardless of whether the
Pesos are converted into U.S. Dollars. If the Pesos received are
not converted into U.S. Dollars on the day of receipt, you will
have a basis in the Pesos equal to their U.S. Dollar value on the
date of receipt. Any gain or loss you realize on a subsequent
conversion or other disposition of the Pesos will be treated as
United States source ordinary income or loss.
Subject
to certain significant conditions and limitations, Argentine tax
withheld from dividends, if any, may be treated as foreign income
tax eligible for credit or deduction against your United States
federal income tax liability. For purposes of the foreign tax
credit, dividends paid on the common shares or ADSs will be treated
as income from sources outside the United States and will generally
constitute passive category income. Further, in certain
circumstances, if you have held ADSs or common shares for less than
a specified minimum period during which you are not protected from
risk of loss, or are obligated to make payments related to the
dividends, you will not be allowed a foreign tax credit for foreign
taxes imposed on dividends paid on ADSs or common shares. The rules
governing the foreign tax credit are complex. Investors are urged
to consult their tax advisors regarding the availability of the
foreign tax credit under their particular
circumstances.
To the
extent that the amount of any distribution (including amounts
withheld to reflect Argentine withholding taxes, if any) exceeds
our current and accumulated earnings and profits for a taxable
year, as determined under United States federal income tax
principles, the distribution will first be treated as a tax-free
return of capital, causing a reduction in the adjusted basis of the
ADSs or common shares, and the balance in excess of adjusted basis
will be taxed as capital gain recognized on a sale or exchange.
However, we do not expect to keep earnings and profits in
accordance with United States federal income tax principles.
Therefore, you should expect that a distribution will generally be
treated as a dividend (as discussed above).
Distributions
of our common shares that are received as part of a pro rata
distribution to all our shareholders generally will not be subject
to United States federal income taxes.
297
Taxation of Capital Gains
Subject
to the discussion under “Passive Foreign Investment
Company” below, upon the sale, exchange or other disposition
of common shares or ADSs, you generally will recognize capital gain
or loss equal to the difference between the U.S. Dollar value of
the amount realized upon the sale, exchange or other disposition
and the adjusted tax basis of the common shares or ADSs, determined
in U.S. Dollars. The capital gain or loss will be long-term capital
gain or loss if at the time of sale, exchange or other disposition
you have held the common shares or ADSs for more than one year.
Long-term capital gains of non-corporate U.S. Holders are eligible
for reduced rates of taxation. The deductibility of capital losses
is subject to limitations. Any gain or loss you recognize will
generally be treated as United States source gain or loss.
Consequently, you may not be able to use the foreign tax credit
arising from any Argentine tax imposed on the disposition of common
shares or ADSs unless such credit can be applied (subject to
applicable limitations) against tax due on other income treated as
derived from foreign sources.
Passive Foreign Investment Company
Based
on the past and projected composition of our income and assets and
the valuation of our assets, including goodwill, we do not believe
we were a PFIC for United States federal income tax purposes for
the taxable year ending June 30, 2020, and we do not currently
expect to become a PFIC, although there can be no assurance in this
regard. The determination of whether we are a PFIC is made
annually. Accordingly, it is possible that we may be a PFIC in the
current or any future taxable year due to changes in our asset or
income composition or if our projections are not accurate. The
volatility and instability of Argentina’s economic and
financial system may substantially affect the composition of our
income and assets and the accuracy of our projections. In addition,
this determination is based on the interpretation of certain U.S.
Treasury regulations relating to rental income, which regulations
are potentially subject to differing interpretation.
In
general, we will be a PFIC for any taxable year in which either (i)
at least 75% of the gross income of our company for the taxable
year is passive income or (ii) at least 50% of the value
(determined on the basis of a quarterly average) of our assets is
attributable to assets that produce or are held for the production
of passive income. For this purpose, passive income generally
includes dividends, interest, royalties and rents (other than
royalties and rents derived in the active conduct of a trade or
business and not derived from a related person), annuities and
gains from assets that produce passive income. If we own at least
25% by value of the stock of another corporation, we will be
treated for purposes of the PFIC tests as owning a proportionate
share of the assets of the other corporation, and as receiving
directly a proportionate share of the other corporation’s
income.
If we
are a PFIC for any taxable year during which you hold common shares
or ADSs in our company, unless you make the mark-to-market election
discussed below, you will be subject to special tax rules discussed
below.
If we
are a PFIC for any taxable year during which you hold our common
shares or ADSs, you will be subject to special tax rules with
respect to any “excess distribution” received and any
gain realized from a sale or other disposition, including a pledge,
of such common shares or ADSs. Distributions received in a taxable
year that are greater than 125% of the average annual distributions
received during the shorter of the three preceding taxable years
oryour holding period for the common shares or ADSs will be treated
as excess distributions. Under these special tax rules (i) the
excess distribution or gain will be allocated ratably over your
holding period for the common shares or ADSs, (ii) the amount
allocated to the current taxable year, and any taxable year prior
to the first taxable year in which we were a PFIC, will be treated
as ordinary income, and (iii) the amount allocated to each other
year will be subject to tax at the highest tax rate in effect for
that year and the interest charge generally applicable to
underpayments of tax will be imposed on the resulting tax
attributable to each such year.
If we
are a PFIC for any taxable year during which you hold our common
shares or ADSs and any of our non-United States subsidiaries is
also a PFIC, you would be treated as owning a proportionate amount
(by value) of the common shares of the lower tier PFIC for purposes
of the application of these rules. You are urged to consult your
tax advisors about the application of the PFIC rules to any of our
subsidiaries.
In
addition, non-corporate U.S. Holders will not be eligible for
reduced rates of taxation on any dividends received from us if we
are a PFIC in the taxable year in which such dividends are paid or
in the preceding taxable year.
298
In
certain circumstances, in lieu of being subject to the excess
distribution rules discussed above, you may make an election to
include gain on the stock of a PFIC as ordinary income under a
mark-to-market method provided that such stock is regularly traded
on a qualified exchange. Under current law, the mark-to-market
election is only available for stock traded on certain designated
United States exchanges and foreign exchanges which meet certain
trading, listing, financial disclosure and other requirements to be
treated as a qualified exchange under applicable United States
Treasury regulations. Consequently, the mark-to-market election may
be available to you with respect to the ADSs because the ADSs are
listed on the NASDAQ, which constitutes a qualified exchange under
the regulations, although there can be no assurance that the ADSs
will be regularly traded. You should note that only the ADSs and
not the common shares are listed on the NASDAQ. The common shares
are listed on the ByMA. Consequently, the ByMA would need to meet
the trading, listing, financial disclosure and other requirements
of the United States Treasury regulations. The ADSs or common
shares would also need to be regularly traded on such exchanges in
order for the ADSs or common shares to be potentially eligible for
the mark-to-market election.
If we
are a PFIC in any taxable year in which you hold our common shares
or ADSs, but you do not make a mark-to-market election until a
subsequent taxable year, you will be subject to special rules in
the taxable year of the election. You should consult your own tax
advisors regarding the application of the mark-to-market election
in your particular situation.
If you
make an effective mark-to-market election, you will include in
income each year that we are a PFIC as ordinary income, rather than
capital gain, the excess, if any, of the fair market value of your
common shares or ADSs at the end of the taxable year over your
adjusted tax basis in the common shares or ADSs and will be
permitted an ordinary loss in respect of the excess, if any, of the
adjusted tax basis of such common shares or ADSs over their fair
market value at the end of each such taxable year, but only to the
extent of the net amount previously included in income as a result
of the mark-to-market election. Your basis in the common shares or
ADSs will be adjusted to reflect any such income or loss amounts.
Any gain or loss on the sale of the common shares or ADSs will be
ordinary income or loss, except that such loss will be ordinary
loss only to the extent of the previously included net
mark-to-market gain.
If you
make a mark-to-market election it will be effective for the taxable
year for which the election is made and all subsequent taxable
years unless the common shares or ADSs are no longer regularly
traded on a qualified exchange or the Internal Revenue Service
consents to the revocation of the election. Mark-to-market
inclusions and deductions will be suspended during taxable years in
which we arenot a PFIC, but would resume if we subsequently become
a PFIC. You are urged to consult your own tax advisor about the
availability of making such a mark-to-market election, and whether
making the election would be advisable in your particular
circumstances.
Alternatively,
a United States investor that owns common shares or ADSs in a PFIC
can sometimes avoid the rules described above by electing to treat
the company as a “qualified electing fund” under
Section 1295 of the Code. This option is not available to you
because we do not intend to comply with the requirements necessary
to permit you to make this election.
A U.S.
Holder who owns common shares or ADSs during any year that we are a
PFIC must generally file IRS Form 8621.
You
should consult your own tax advisors concerning the United States
federal income tax consequences of holding the common shares or
ADSs if we are considered a PFIC in any taxable year.
Argentine Personal Assets Tax
Amounts
paid on account of the Argentine personal assets tax, if any, will
not be eligible as a credit against your United States federal
income tax liability, but may be deductible subject to applicable
limitations in the Code.
Information Reporting and Backup Withholding
In
general, information reporting requirements will apply to dividends
on common shares or ADSs and to the proceeds from the sale,
exchange or other disposition of common shares or ADSs that are
paid to you within the United States (and in certain cases, outside
the United States), unless you are an exempt recipient. Backup
withholding may apply to such payments if you fail to provide a
correct taxpayer identification number or certification of exempt
status or fail to report in full dividend and interest
income.
299
Backup
withholding is not an additional tax. Any amounts withheld under
the backup withholding rules will be allowed as a refund or a
credit against your United States federal income tax liability
provided you timely furnish the required information to the
Internal Revenue Service.
Argentine Taxation
The
following discussion is a summary of certain Argentine tax
considerations associated with an investment in, ownership or
disposition of, the common shares or the ADSs by (i) an individual
holder that is resident in Argentina, (ii) an individual holder
that is neither domiciled nor resident in Argentina, (iii) a legal
entity organized under the laws of Argentina, (iv) a permanent
establishment in Argentina of a foreign entity and (v) a legal
entity that is not organized under the laws of Argentina, that does
not have a permanent establishment in Argentina and is not
otherwise doing business in Argentina on a regular basis. The
discussion is for general information only and is based on current
Argentine tax laws. Moreover, while this summary is considered to
be a correct interpretation of existing laws in force as of the
date of this filing, no assurance can be given that the courts or
administrative authorities responsible for the administration of
such laws will agree with this interpretation or that changes in
such laws or interpretations will not occur.
PROSPECTIVE INVESTORS ARE URGED TO CONSULT THEIR OWN TAX ADVISOR
REGARDING THE PARTICULAR TAX CONSEQUENCES ARISING UNDER ANY TAXING
JURISDICTION.
Income Tax
Law No.
27,430, enacted on December 27, 2017 and published in the Official
Gazette on December 29, 2017, introduced several amendments to
Income Tax Law No. 20,628, among others, a corporate tax rate
reduction in two phases. For fiscal years beginning on or after
January 1, 2018 until December 31, 2019, there is a reduction of
the tax rate from 35% to 30%. Beginning on or after January 1, 2020
the tax rate will be further reduced to 25%.
Additionally,
a withholding of 7% or 13% is established for the fiscal years
mentioned above, on the dividends distributed by local entities in
favor of their shareholders provided they are resident individuals
or undivided estates, or are foreign beneficiaries.
Taxation of Dividends
Dividends
distributions which source are profits generated in fiscal years
beginning before January 1, 2018, whether in cash, in shares or in
kind, are not subject to income tax withholding except for the
application of the “Equalization Tax” described
below.
An
income tax withholding will be applied to the amount of dividends
distributed in excess of a company’s net taxable income
determined in accordance with general income tax regulations for
the fiscal years preceding the date of the distribution of such
dividends (the “Equalization Tax”). The legislation
requires that companies withhold 35% of the amount of distributed
dividends in excess of the net taxable income of such distribution,
as determined in accordance with the Income Tax Law No. 20,628.
Dividends distributed by an Argentine company are not subject to
this tax to the extent that those dividends arise from dividend
income or other distributions received by such company from other
Argentine companies.
Dividend
distributions made in kind (other than cash) will be subject to the
same tax rules as cash dividends. Stock dividends on fully paid
shares are not subject to Equalization Tax.
Equalization
Tax will not be applicable on profits generated from fiscal years
beginning on or after January 1, 2018.
Dividends
distributions, other than stock dividends, which source are profits
generated in fiscal years beginning on or after January 1, 2018,
whether in cash, in shares or in kind, made by local entities to
resident individuals, resident undivided estates and foreign
beneficiaries are subject to a withholding tax at a rate of 7% and
at a rate of 13% from fiscal years beginning on or after January 1,
2020.
On
December 23, 2019. Law No. 27,541 was published in the Official
Gazette which introduced modifications to the income tax, as well
as suspended the modification of the tax rate fron 7% to 13% until
the fiscal years starting on January 1, 2021,
inclusive.
Certain
tax treaties contemplate the application of a ceiling tax rate on
dividends (i.e. 10% on gross dividends).
300
Taxation of Capital Gains
Resident individuals
Capital
gains obtained by resident individuals or undivided estates
situated in Argentina from the sale or disposition of common shares
and other securities are subject to income tax at a 15% rate on net
income, unless such securities were traded in stock exchange under
the supervision of the CNV, in which case an exemption
applies.
Losses
arising from the sale, exchange or other disposition of common
shares or ADSs can be applied only to offset such capital gains
arising from the sale, exchange or other disposition of these
securities, for a five-year carryover period.
Foreign beneficiaries
Capital
gains of Argentine source (as it is the case of both Cresud’s
ADSs and shares) obtained by non-Argentine individuals or
non-Argentine entities from the sale, exchange or other disposition
of shares are subject to income tax at a 15% rate on the net
capital gain or at a 13.5% rate on the gross price at the
seller’s election. Notwithstanding, Law No. 27,430
established an exemption for foreign beneficiaries participating in
the sale of publicly traded shares traded in stock exchanges under
the supervision of the CNV. Said Law also established an exemption
for capital gains derived from the sale, exchange or other
disposition of share certificates issued abroad that represent
shares issued by Argentine companies (i.e. ADRs). The exemptions
will apply only if the foreign beneficiaries do not reside in, and
the funds do not arise from, “non-cooperating”
jurisdictions for tax transparency purposes.
The
sale of an equity interest in a foreign entity could represent a
taxable indirect transfer of Argentine assets (including shares),
if (i) the value of the Argentine assets exceed 30% of the
transaction’s overall value, and (ii) the equity interest
sold (in the foreign entity) exceeds 10%. The tax will also be due
if any of these thresholds were met during the twelve month period
prior to the sale.
The
applicable rate is generaly 15% on the net capital gain or at a
13.5% rate on the gross price at the seller’s election, of
the proportional value that corresponds to the Argentine
assets.
The
indirect transfer of Argentine assets within the same economic
group would also not trigger taxation, provided the requirements
set by regulations have been met.
Argentine entities
Capital
gains obtained by Argentine entities (in general entities organized
or incorporated under Argentine law, certain traders and
intermediaries, local branches of non-Argentine entities, sole
proprietorships and individuals carrying on certain commercial
activities in Argentina) derived from the sale, exchange or other
disposition of shares or ADSs are subject to income tax at the rate
of 35%, 30% or 25% as have been mentioned above.
Law No. 27,541, published in the
Official Gazette on December 23, 2019, suspended the modification
of the tax rate from 30% to 25% until fiscal years starting on
January 1, 2021 inclusive.
Losses
arising from the sale, exchange or other disposition of shares or
ADSs can be applied only to offset such capital gains arising from
the sale, exchange or other disposition of these securities, for a
five-year carryover period.
WE RECOMMEND PROSPECTIVE INVESTORS TO CONSULT THEIR OWN TAX ADVISOR
REGARDING THE PARTICULAR TAX CONSEQUENCES CONCERNING THE SALE OR
OTHER DISPOSITIONS OF SHARES AND ADSs.
Value Added Tax
The
sale, exchange, disposition, or transfer of common shares or ADSs
is not subject to value added tax. Dividend distributions are not
levied with value added tax either.
301
Tax on Personal Assets
Argentine
entities, such as us, have to pay the Tax on Personal Assets
(“TAP”) corresponding to Argentine and foreign
individuals and foreign entities for the holding of our shares at
December 31 of each year. The applicable tax rate is 0.50% for
fiscal years starting in 2019, inclusive. The tax is levied on the
proportional net worth value (“valor patrimonial
proporcional” in Spanish), or the book value, of the shares
arising from the last balance sheet of the Argentine entity
calculated under Argentine GAAP. Pursuant to the TAP Law, the
Argentine company is entitled to seek reimbursement of such paid
tax from the applicable Argentine domiciled individuals and/or
foreign domiciled shareholders.
Turnover Tax
The
gross turnover tax is a local tax; therefore, the rules of the
relevant provincial jurisdiction should be considered, which may
levy this tax on the purchase and sale, exchange or other
disposition of common shares or ADSs, and/or the collection of
dividends at an average rate between 6% and 10%, unless an
exemption is applicable. In the particular case of the City of
Buenos Aires, any transaction involving common shares and/or the
collection of dividends and revaluations is exempt from this
tax.
To
date, there is no withholding regime provided for foreign holders
of common shares and ADS.
Stamp Tax
Stamp
taxes may apply in the City of Buenos Aires and in certain
Argentine provinces in case transfer of common shares or ADSs is
performed or executed in such jurisdictions by means of written
agreements.
Other Taxes
There
are no Argentine federal inheritance or succession taxes applicable
to the ownership, transfer or disposition of our common shares or
ADSs. The province of Buenos Aires established a tax on free
transmission of assets, including inheritance, legacies, donations,
etc. Free transmission of our shares could be subject to this tax
at rates that vary from 1.6% to 8.8%, depending on the value of the
transferred assets and the relationship between the transferor and
the transferee.
In the
case of litigation regarding the shares before a court of the City
of Buenos Aires, a 3% court fee would be charged, calculated on the
basis of the claim.
Tax treaties
Argentina
has signed tax treaties for the avoidance of double taxation
currently in force with Australia, Belgium, Bolivia, Brazil,
Canada, Chile, Denmark, Finland, France, Germany, Italy, Mexico,
the Netherlands, Norway, Russia, Spain, Sweden, Switzerland, the
United Arab Emirates, the United Kingdom and Uruguay. Tax treaties
between Argentina and China, Japan, Luxemburg, Qatar and Turkey and
Austria havebeen signed, but the treaties have not yet been
ratified by their respective governments. There is currently no tax
treaty or convention in effect between Argentina and the United
States. It is not clear when, if ever, a treaty will be ratified or
enteredinto effect. As a result, the Argentine tax consequences
described in this section will apply, without modification, to a
holder of our common shares or ADSs that is a U.S. resident.
Foreign shareholders located in certain jurisdictions with a tax
treaty in force with Argentina may be (i) exempted from the payment
of the personal assets tax and (ii) entitled to apply for reduced
withholding tax rates on payments to be made by Argentine
parties.
G.
DIVIDENDS AND PAYING AGENTS
This
section is not applicable
H. STATEMENT BY EXPERTS
This
section is not applicable.
302
I. DOCUMENTS ON DISPLAY
We file
annual, quarterly and other information with the SEC. You may read
and copy any document that we file at the public reference rooms of
the SEC at 450 Fifth Street, N.W., Washington, D.C. 20549 and 500
West Madison Street, Suite 1400, Chicago, Illinois 60661 and
www.sec.gov. You may obtain information on the operation of the
public reference rooms by calling the SEC at 1-800-SEC-0330. Our
Internet address is
http://www.cresud.com.ar
. It
should be noted that nothing on our website should be considered
part of this annual report on Form 20-F. You may request a copy of
these filings at no cost, by writing or calling the office at +54
(11)-4814-7800.
J. SUBSIDIARY INFORMATION
This
section is not applicable.
In the
normal course of business, we are exposed to foreign exchange risk,
interest rate risks and other price risk, primarily related to
changes in exchange rates and interest rates. We manage our
exposure to these risks through the use of various financial
instruments, none of which are entered into for trading purposes.
We have established policies and procedures governing the use of
financial instruments, specifically as they relate to the type and
volume of such financial instruments. For further information on
our market risks, please see Note 5 to our Audited Consolidated
Financial Statements.
A. Debt Securities
This
item is not applicable
B. Warrants and Rights
This
item is not applicable
C. Other Securities
This
item is not applicable
D. American Depositary Shares
The
Bank of New York Mellon, as depositary for the ADSs (the
“Depositary”) collects its fees for delivery directly
from investors depositing shares or surrendering ADSs for the
purpose of withdrawal. The Depositary also collects taxes and
governmental charges from the holders of ADSs. The Depositary
collects these fees and charges by deducting those fees from the
amounts distributed or by selling a portion of distributable
property to pay the fees (after attempting by reasonable means to
notify the holder prior to such sale).
The
Depositary has agreed to reimburse or pay on our behalf, certain
reasonable expenses related to our ADS program and incurred by us
in connection with the program (such as NASDAQ listing fees, legal
and accounting fees incurred with preparation of Form 20-F and
ongoing SEC compliance and listing requirements, distribution of
proxy materials, investor relations expenses, etc).
The
amounts the Depositary reimbursed or paid are not perforce related
to the fees collected by the depositary from ADS
holders.
We
agree to pay the fees, reasonable expenses and out-of-pocket
charges of the Depositary and those of any registrar only in
accordance with agreements in writing entered into between the
Depositary and the Company from time to time. The Depositary shall
present its statement for such charges and expenses to the Company
once every three months. The charges and expenses of the custodian
are for the sole account of the Depositary.
303
The
following charges shall be incurred by any party depositing or
withdrawing shares or by any party surrendering receipts or to whom
receipts are issued (including, without limitation, issuance
pursuant to a stock dividend or stock split declared by us or an
exchange regarding the receipts or deposited securities or a
distribution of receipts), whichever applicable: (1) taxes and
othergovernmental charges, (2) such registration fees as may from
time to time be in effect for the registration of transfers of
shares generally on the share register of the Company or foreign
registrar and applicable to transfers of shares to the name of
theDepositary or its nominee or the custodian or its nominee on the
making of deposits or withdrawals hereunder, (3) such cable, telex
and fax transmission expenses as are expressly provided in the
deposit agreement, (4) such expenses as are incurred by the
Depositary in the conversion of foreign currency (5) a fee of
USD5.00 or less per 100 ADS (or portion there of), (6) a fee of
USD0.02 or less per ADS (or portion) for any cash distribution made
pursuant to the deposit agreement including, but not limited to,
and (7) a fee for the distribution of securities, such fee being in
an amount equal to the fee for the execution and delivery of ADS
referred to above which would have been charged as a result of the
deposit of such securities, but which securities are instead
distributed by the Depositary to owners.
304
This
section is not applicable.
A. This
section is not applicable.
B. This
section is not applicable.
C. This
section is not applicable.
D. This
section is not applicable.
E. This
section is not applicable.
A. Disclosure Controls and Procedures
We
maintain disclosure controls and procedures that are designed to
ensure that information required to be disclosed in the reports we
file or submit under the Exchange Act is recorded, processed,
summarized and reported within the time periods specified in the
SEC’s rules and forms, and that such information is
accumulated and communicated to management, including our Chief
Executive Officer and Chief Financial and Administrative Officer,
to allow our management to make timely decisions regarding required
disclosure. Any controls and procedures, no matter how well
designed and operated, can provide only reasonable assurance of
achieving the desired control objective. In connection with the
preparation of this Annual Report on Form 20-F, we carried out an
evaluation under the supervision and with the participation of
members of our management team, including our Chief Executive
Officer and Chief Financial and Administrative Officer, of the
effectiveness of the design and operation of our disclosure
controls and procedures (as defined in Rules 13a-15(e) and
15d-15(e) under the Exchange Act) as of June 30, 2020. Based upon
this evaluation our Chief Executive Officer and Chief Financial and
Administrative Officer concluded that our disclosure controls and
procedures as of the end of the period covered by this Annual
Report on Form 20-F were effective at the reasonable assurance
level.
B. Management’s Annual Report on Internal Control Over
Financial Reporting
Our
management is responsible for establishing and maintaining adequate
Internal Control over Financial Reporting (as defined in Rules
13a-15(f) and 15d-15(f) under the Exchange Act). Our Internal
Control over Financial Reporting includes a series of procedures
designed to provide reasonable assurance regarding the reliability
of financial reporting and the preparation of Consolidated
Financial Statements for external purposes, in accordance with
International Financial Reporting Standards and includes those
policies and procedures that (1) pertain to the maintenance of
records that, in reasonable detail, accurately and fairly reflect
the transactions and dispositions of our assets, (2) provide
reasonable assurance that transactions are recorded as necessary to
permit preparation of Consolidated Financial Statements in
accordance with International Financial Reporting Standards and
that a company’s receipts and expenditures are being made
only in accordance with authorizations of our management and
directors, and (3) provide reasonable assurance regarding
prevention or timely detection of unauthorized acquisition, use, or
disposition of our assets that could have a material effect on our
Consolidated Financial Statements.
Because
of its inherent limitations, Internal Control over Financial
Reporting may not prevent or detect misstatements. Also,
projections of any evaluation of effectiveness to future periods
are subject to the risk that controls may become inadequate because
of changes in conditions, or that the degree of compliance with
policies and procedures may deteriorate.
Management
assessed the effectiveness of our Internal Control over Financial
Reporting as of June 30, 2020. In making this assessment,
management used the criteria set forth by the Committee of
Sponsoring Organizations of the Treadway Commission (COSO) in
Internal Control–Integrated Framework (2013). Based on this
evaluation, management concluded that our Internal Control over
Financial Reporting was effective as of June 30, 2020.
305
C. Attestation Report of the Registered Public Accounting
Firm
The
effectiveness of the Company’s internal control over
financial reporting as of June 30, 2020 has been audited by Price
Waterhouse & Co S.R.L, Buenos Aires Argentina- member firm of
PricewaterhouseCoopers International Limited, an independent
registered public accounting firm, as stated in their report which
appears herein.
D. Changes in Internal Control Over Financial
Reporting
During
the fiscal year ended June 30, 2019, we implemented the
Consolidation module of the BPC (Business Planning and
Consolidation) application by SAP and accordingly we have updated
our internal controls over financial reporting, as necessary, to
accommodate modifications to our accounting and financial reporting
processes and to take advantage of enhanced automated controls
provided by this new system.
There
have been no changes in our internal control over financial
reporting during the fiscal year ended June 30, 2020 that have
materially affected, or are reasonably likely to materially affect,
our internal control over financial reporting.
In our
annual ordinary shareholders’ meeting held on October 31,
2003, the audit committee was unanimously approved. Pursuant to
this plan, the board of directors had to appoint the members of the
audit committee who hold expertise in corporate administration,
finance and accounting.
Our
board of directors established an audit committee which would
assist the Board in exercising its duty of care on disclosure
requirements, the enforcement of accounting policies, management of
our business risks, the management of our internal control systems,
ethical conduct of our businesses, monitoring the sufficiency of
our financial statements, our compliance with laws, independence
and capacity of independent auditors and performance of our
internal audit and our external auditors. Also, according to the
applicable regulations, we may request to our audit committee to
render its opinion in certain transactions, and its conditions, as
is the case of related party transactions, as may be reasonably
considered adequate according to normal market
conditions.
As of March 11, 2020 our board of directors appointed Liliana
Glikin, María Gabriela Macagni and Alejandro Mario Bartolome,
all of them independent members,
as members of the audit
committee. The board of directors named María Gabriela Macagni
as the financial expert in accordance with the relevant SEC rules.
We have a fully independent audit committee as per the standards
provided in Rule 10(A)-3(b)(1).
We have
adopted a code of ethics that applies to our directors, officers
and employees. Our code of ethics is posted in our website
www.cresud.com.ar. On July 25, 2005, our Code of Ethics was amended
by our Board of Directors. The amendment was reported in a report
on Form 6-K on August 1, 2005.
If we
make any substantive amendment to the code of ethics or grant any
waivers, including any implicit waiver to any of its provision, we
will disclose the nature of such amendment or waiver in a report on
Form 6-K or in our next annual report on Form 20-F and we will post
it in our website.
Audit Fees
During
the fiscal years ended June 30, 2020 and 2019, we were billed a
total amount of ARS 47.6 million and ARS 58.5 million respectively
in the Agricultural Business
and in the
Operation Center in Argentina of the Urban Properties and
Investment Business, and NIS 6.8 million and NIS 5.5 million for
the fiscal years 2020 and 2019 respectively, in the Operation
Center in Israel, for professional services rendered by our
principal accountants for the audit of our annual Audited
Consolidated Financial Statements, performance of the audit of
internal controls over financial reporting of the company and other
services normally provided in connection with regulatory filings or
engagements.
306
Audit-Related Fees
During
the fiscal year ended June 30, 2020 and 2019 we were billed a total
amount of ARS 8.2 million and ARS 2.3 million for professional
services rendered by our principal accountants mainly in connection
with the review of equity offering transactions forms and debt
prospectus.
Tax Fees
During
the fiscal year ended June 30, 2020 and 2019 we were billed a total
amount of ARS 0.3 million and ARS 2.0 million in the Agricultural
Business
and in the
Operation Center in Argentina of the Urban Properties and
Investment Business, and during the fiscal year ended June 30, 2020
and 2019, we were billed a total amount of NIS 0.3 million in both
years in the Operation Center in Israel, for professional services
rendered by our principal accountants for tax compliance, tax
advice and tax planning.
All Other Fees
During
the fiscal year ended June 30, 2020 and June 30, 2019 we were
billed for professional services rendered by our principal
accountants, including fees mainly related to statutory
certifications and training seminaries, a total amount of ARS 11.0
million and ARS 3.9 million, respectively in the Agricultural
Business
and in the
Operation Center in Argentina of the Urban Properties and
Investment Business, and NIS 0.5 million in both years, in the
Operation Center in Israel.
Audit Committee Pre-Approval Policies and Procedures
Our
audit committee approves, in advance, the engagement of auditors
and their fees for audit and non-audit services pursuant to
paragraph (c)(7)(i)(c) of Rule 2-01 of Regulation S-X.
Our
Audit Committee pre-approves all services, fees and services
provided by the external auditors to ensure auditors’
independence. One of the main tasks of the Audit Committee is to
give its opinion in relation to the appointment of the external
auditors, proposed by the Board of Directors to the General
Shareholder’s Meeting. In order to accomplish such task, the
Audit Committee shall:
●
Require any
additional and complementary documentation related to this
analysis;
●
Verify the
independence of the external auditors;
●
Analyze different
kinds of services that the external auditor would provide to the
company. This description must also include an estimate of the fees
payable for such services, specifically in order to maintain the
principle of independence;
●
Inform the fees
billed by the external auditor, separating the services related to
audit services and other special services that could be not
included in the audit services previously mentioned.
●
Analyze and
supervise the working plan of the external auditors considering the
business’ reality and the estimated risks;
●
Propose adjustments
(if necessary) to such working plan;
●
Hold meetings with
the external auditors in order to: (a) analyze the difficulties,
results and conclusions of the proposed working plan; (b) analyze
eventual possible conflicts of interests, related party
transactions, compliance with the legal framework and information
transparency; and
●
Evaluate the
performance of external auditors and their opinion regarding our
Financial Statements.
This
section is not applicable.
On
August 22, 2019 our Board of Directors decided to initiate a new
shares repurchase plan (the “2019 Plan”), under the
terms of Article 64 of the Capital Markets Law and the rules of the
CNV, for a maximum amount of the investment up to ARS300 million.
Such repurchases were made with our liquid and realized profits and
free reserves. As of the date of this annual report, we have not
repurchased shares through this plan.
307
Our
2019 annual meeting of shareholders was held on October 30, 2019
and it was decided, among others, the distribution of own shares in
portfolio to the shareholders in proportion to their shareholdings
for up to the amount of 13,000,000 ordinary shares of 1 vote per
share and NV ARS1 each, which constitutes 0.026 shares per common
share and 0.26 by ADR.
As of
June 30, 2020, we own our shares in an amount equal to 0.45% of our
capital stock.
This
section is not applicable.
Compliance with NASDAQ listing standards on corporate
governance
Significant
differences between our corporate governance practices and U.S.
companies’ practices under NASDAQ Rules:
Our
corporate governance practices are governed by the applicable
Argentine law; particularly, the Argentine Corporations Law, the
Capital Markets Law and the rules of the CNV, as well as by our
by-laws.
We have
securities that are registered with the Securities and Exchange
Commission and are listed on the NASDAQ, and are therefore subject
to corporate governance requirements applicable to NASDAQ-listed
non-US companies (a “NASDAQ-listed”
company).
Pursuant
to NASDAQ Rule 5615(a)(3), NASDAQ -listed non-U.S. companies that
are categorized as “Foreign Private Issuers” may follow
home country corporate governance practices in lieu of certain of
the corporate governance requirements provided in NASDAQ Rules,
provided that the foreign private issuer complies with certain
mandatory sections of NASDAQ Rules, discloses each requirement that
it does not follow and describes the home country practice followed
in lieu of such requirement. The requirements of the NASDAQ Rules
and the Argentine corporate governance practices that we follow in
lieu thereof are described below:
308
|
NASDAQ Standards for U.S. companies
|
Cresud’S Corporate Practices
|
|
Rule 5250(d) - Distribution of Annual and Interim
Reports.
|
In lieu
of the requirements of Rule 5250(d), we follow Argentine law, which
requires that companies issue publicly a Spanish language annual
report, including annual Audited Consolidated Financial Statements
prepared in accordance with generally accepted accounting
principles in Argentina, by filing such annual report with the CNV
and the stock exchange in which the securities are listed, within
70 calendar days following the close of our fiscal year. Interim
reports must be filed with the CNV and the stock exchange in which
the securities are listed within 42 calendar days following the
close of each fiscal quarter. We provide our shareholders a copy of
the annual and interim financial reports upon request. English
language translations of our annual reports and interim reports are
filed with the SEC on Form 20-F and Form 6-K, respectively. We also
send the English language translation of our annual report and
quarterly press releases on its website. Furthermore, under the
terms of the Deposit Agreement, dated as of March 18, 1997, among
us, The Bank of New York Mellon, as depositary, and owners of ADSs
issued thereunder, we are required to furnish The Bank of New York
Mellon with, among other things, English language translations of
their annual reports. Annual reports are available for inspection
by ADR holders at the offices of The Bank of New York located at,
240 Greenwich Street, New York, NY 10286, New York, New York.
Finally, Argentine law requires that 20 calendar days before the
date of a shareholders’ meeting, the board of directors must
provide to our shareholders, at our executive office or through
electronic means, all information relevant to the
shareholders’ meeting, including copies of any documents to
be considered by the shareholders (which includes the annual
report).
|
|
Rule 5605(b)(1) - Majority of Independent Directors.
|
In lieu
of the requirements of Rule 5605(b)(1), we follow Argentine law
which does not require that a majority of the board of directors be
comprised of independent directors. Argentine law instead requires
that public companies in Argentina, such as, us must have a
sufficient number of independent directors to be able to form an
audit committee of at least three members, the majority of which
must be independent pursuant to the criteria established by the
CNV.
|
|
Rule 5605(b)(2) - Executive Sessions of the Board of
Directors.
|
In lieu
of the requirements of Rule 5605(b)(2), we follow Argentine law
which does not require independent directors to hold regularly
scheduled meetings at which only such independent directors are
present (i.e., executive sessions). Our board of directors as a
whole is responsible for monitoring our affairs. In addition, under
Argentine law, the board of directors may approve the delegation of
specific responsibilities to designated directors or non-director
managers of the Company. Also, it is mandatory for public companies
to form a supervisory committee (composed of “syndics”)
which is responsible for monitoring our legal compliance under
Argentine law and compliance with our by-laws. Finally, our audit
committee has regularly scheduled meetings and, as such, such
meetings will serve a substantially similar purpose as executive
sessions.
|
|
Rule 5605(d)(B) - Compensation of Officers.
|
In lieu
of the requirements of Rule 5605(d)(B), we follow Argentine law
which does not require companies to form a compensation committee
comprised solely of independent directors. For the determination of
the compensation of the chief executive officer andall other
executive officers no decision of a majority of independent
directors or a compensation committee comprised solely of
independent directors is required under Argentine law. Under
Argentine law, the board of directors is the corporate body
responsible for determining the compensation of the chief executive
officer and all other executive officers, so long as they are not
directors. In addition, under Argentine law, the audit committee
shall give its opinion about the reasonableness of
management’s proposals on fees and option plans for our
directors or managers.
|
|
Rule 5605(e) - Nomination of Directors.
|
In lieu
of the requirements of Rule 5605(e), we follow Argentine law which
requires that directors be nominated directly by the shareholders
at the shareholders’ meeting and that they be selected and
recommended by the shareholders themselves. Under Argentine law, it
is the responsibility of the ordinary shareholders’ meeting
to appoint and remove directors and to set their
compensation.
|
|
Rule 5605(c)(1) - Audit Committee Charter.
|
In lieu
of the requirements of Rule 5605(c)(1), we follow Argentine law
which requires that audit committees have a charter but does not
require that companies certify as to the adoption of the charter
nor does it require an annual review and assessment thereof.
Argentine law instead requires that companies prepare a proposed
plan or course of action with respect to those matters which are
the responsibility of our audit committee. Such plan or course of
action could, at the discretion of our audit committee, include a
review and assessment of the audit committee charter. We believe
that we are in compliance with the requirements for audit committee
charters provided for in the Sarbanes Oxley Act.
|
|
Rule 5605(c)(2) - Audit Committee Composition.
|
Argentine
law does not require that companies have an audit committee
comprised solely of independent directors and it is equally not
customary business practice in Argentina to have such a committee.
Argentine law instead requires that companies establish an audit
committee with at least three members comprised of a majority of
independent directors as defined by Argentine law. Nonetheless,
although not required by Argentine law, we have a three member
audit committee comprised of entirely independent directors in
accordance with Rule 10(A)-3(b)(1) of the General rules and
regulations promulgated under the Securities Exchange Act of 1934,
as independence is defined in Rule 10(A)-3(b)(1). Further,
Argentinelaw does not require companies to identify or designate a
financial expert. As such, Although all the members of the audit
committee have large corporate experience, as of the date of this
annual report, the Board of Directors have not named designated a
financial expert in accordance with the relevant SEC ruleson the
audit committee. Although it is noted that all members of the audit
committee have had significant corporate experience. In addition,
we have a supervisory committee (“comisión
fiscalizadora”) composed of three ‘syndics’ which
are in charge of monitoring the legality, under Argentine law, of
the actions of our board of directors and the conformity of such
actions with our by-laws.
|
|
Rule 5620(c) - Quorum.
|
In lieu
of the requirements of Rule 4350(f), we follow Argentine law and
our bylaws, which distinguish between ordinary meetings and
extraordinary meetings and both of them can be celebrated using
teleconference technology, as long as the regulations related to
accreditation, registration and quorum are complied with and the
simultaneity of the shareholders and immediately of the process of
verbal communication and issuance of votes is guaranteed. The
supervisory committee shall state the regularity of the resolutions
adopted. The board of directors shall establish the rules and
technical matters related to remote participation pursuant to the
current rules and in conformity with the National Exchange
Commission regulations. Shareholders physically present at the time
and those using teleconference technologies will be taken into
consideration for the quorum. In connection with ordinary meetings,
a quorum consists of a majority of stocks entitled to vote. If no
quorum is present at the first meeting, a second meeting may be
called, in which the shareholders present or communicated through
teleconference technologies, regardless of their number, constitute
a quorum. Resolutions may be adopted by an absolute majority of the
votes present or communicated through teleconference technologies.
Argentine law, and our bylaws, requires in connection with
extraordinary meetings, that a quorum consist of 60% of the stock
entitled to vote. However, if such quorum is not present at the
first meeting, our bylaws provide that a second meeting may be
called and maybe held with the number of shareholders present or
communicated through teleconference technologies. In both ordinary
and extraordinary meetings, decisions are adopted by an absolute
majority of votes present at the meeting or communicated through
teleconference technologies, except for certain fundamental matters
(such as mergers and spin-offs (when we are not the surviving
entity and the surviving entity is not listed on any stock
exchange), anticipated liquidation, change in its domicile outside
of Argentina, total or partial recapitalization of its statutory
capital following a loss, any transformation in our corporate legal
form or a substantial change in our corporate purpose, or the issue
of bonds) which require an approval by vote of the majority of all
the stock entitled to vote (all stock being entitled to only one
vote).
|
|
Rule 5620(b) -- Solicitation of Proxies.
|
In lieu
of the requirements of Rule 5620(b), we follow Argentine law which
requires that notices of shareholders’ meetings be published,
for five consecutive days, in the Official Gazette and in a widely
published newspaper in Argentina no earlier than 45 calendar days
prior to the meeting and at least 20 calendar days prior to such
meeting. In order to attend a meeting and be listed on themeeting
registry, shareholders are required to submit evidence of their
book-entry share account held at Caja de Valores S.A. up to three
business days prior to the scheduled meeting date. If entitled to
attend the meeting, a shareholder may be represented by proxy
(properly executed and delivered with a certified signature)
granted to any other person, with the exception of a director,
syndic, member of the Supervisory Committee, manager or employee of
the issuer, which are prohibited by Argentine law from acting as
proxies. In addition, our ADS holders receive, prior to the
shareholders’ meeting, a notice listing the matters on the
agenda, a copy of the annual report and a voting card.
|
|
Rule 5630(s) -- Conflicts of Interest
|
In lieu
of the requirements of Rule 5630(a), we follow Argentine law which
requires that related party transactions be approved by the audit
committee when the transaction exceeds one percent (1%) of the
corporation’s net worth, measured pursuant to the last
audited balance sheet. Directors can contract with the corporation
only on an arm’s length basis. If the contract is not in
accordance with prevailing market terms, such transaction must be
pre-approved by the board of directors (excluding the interested
director). In addition, under Argentine law, a shareholder is
required to abstain from voting on a business transaction in which
its interests may be in conflict with the interests of the company.
In the event such shareholder votes on such business transaction
and such business transaction would not have been approved without
such shareholder’s vote, such shareholder may be liable to
the company for damages and the resolution may be declared
void.
|
309
This
section is not applicable.
310
We have
responded to Item 18 in lieu of responding to this
Item.
Reference
is made to pages F-1 through F-131
Index
to Financial Statements (see page F-1).
|
Exhibit No.
|
Description of Exhibit
|
|
1.1
(1)
|
By-laws
(Estatutos) of the registrant, which serve as the
registrant’s articles of incorporation and by-laws, and an
English translation thereof.
|
|
1.2
(4)
|
English
translation of the amendment to the bylaws.
|
|
1.3
(9)
|
Amended
and restated English translation of the bylaws.
|
|
1.4
(10)
|
Amended
and restated English translation of the bylaws.
|
|
1.5
(14)
|
Amended
and restated English translation of the bylaws.
|
|
2.1
(7)
|
Indenture
dated September 7, 2011, among us, as issuer, the Bank of New York
Mellon, as trustee, co-registrar, principal paying agent and
transfer agent, Banco Santander Rio, S.A., as registrar, paying
agent, transfer agent and representative of the trustee in
Argentina, and The Bank of New York Mellon (Luxembourg) S.A., as
Luxembourg Paying and Transfer Agent, for the issuance of the USD
60,000,000, 7.50% Fourth Series, Class VIII Senior Notes Due
2014.
|
|
2.2
(11)
|
Indenture,
dated July 20, 2010, between IRSA Inversiones y Representaciones
Sociedad Anónima as Issuer, The Bank of New York Mellon as
Trustee, Co-Registrar, Principal Paying Agent and Transfer Agent,
and Banco Santander Río S.A. as Registrar, Paying Agent,
Transfer Agent and Representative of the Trustee in Argentina, with
respect to IRSA Inversiones y Representaciones S.A.’s
USD400,000,000 Global Note Program, pursuant to which
USD150,000,000 aggregate principal amount of IRSA Inversiones y
Representaciones Sociedad Anónima’s 11.500% Notes due
2020, Series No. 2, were issued.
|
|
2.3
(11)
|
First
Supplemental Indenture, dated March 28, 2016, between IRSA
Inversiones y Representaciones Sociedad Anónima as Issuer and
The Bank of New York Mellon as Trustee, Co-Registrar, Principal
Paying Agent and Transfer Agent to the Indenture, dated July 20,
2010, between IRSA Inversiones y Representaciones Sociedad
Anónima as Issuer, The Bank of New York Mellon as Trustee,
Co-Registrar, Principal Paying Agent and Transfer Agent, and Banco
Santander Río S.A. as Registrar, Paying Agent, Transfer Agent
and Representative of the Trustee in Argentina, with respect to
IRSA Inversiones y Representaciones Sociedad Anónima’s
USD400,000,000 Global Note Program, pursuant to which
USD150,000,000 aggregate principal amount of IRSA Inversiones y
Representaciones Sociedad Anónima’s 11.500% Notes due
2020, Series No. 2, were issued.
|
|
2.4
(11)
|
Indenture,
dated March 23, 2016, between IRSA Propiedades Comerciales S.A. as
Issuer, The Bank of New York Mellon as Trustee, Co-Registrar,
Principal Paying Agent and Transfer Agent, and Banco Santander
Río S.A. as Registrar, Paying Agent, Transfer Agent and
Representative of the Trustee in Argentina, with respect to IRSA
Propiedades Comerciales S.A.’s USD500,000,000 Global Note
Program, pursuant to which USD360,000,000 aggregate principal
amount of IRSA Propiedades Comerciales S.A.’s 8.750% Notes
due 2023, Series No. 2, were issued.
|
|
2.5
(11)
|
First
Supplemental Indenture, dated March 23, 2016, between IRSA
Propiedades Comerciales S.A., as Issuer and The Bank of New York
Mellon, as Trustee, Co-Registrar, Principal Paying Agent and
Transfer Agent, The Bank of New York Mellon (Luxembourg) S.A., as
Luxembourg Paying Agent and Luxembourg Transfer Agent and Banco
Santander Río S.A., as Registrar, Paying Agent, Transfer Agent
and Representative of the Trustee in Argentina to the Indenture,
dated March 23, 2016, between IRSA Propiedades Comerciales S.A. as
Issuer, The Bank of New York Mellon as Trustee, Co-Registrar,
Principal Paying Agent and Transfer Agent, and Banco Santander
Río S.A. as Registrar, Paying Agent, Transfer Agent and
Representative of the Trustee in Argentina, with respect to IRSA
Propiedades Comerciales S.A.’s USD500,000,000 Global Note
Program, pursuant to which USD360,000,000 000 aggregate principal
amount of IRSA Propiedades Comerciales S.A.’s 8.750% Notes
due 2023, Series No. 2, were issued.
|
|
4.1
(1)
|
Consulting
Agreement among Cresud S.A.C.I.F. y A. and Dolphin Fund Management
S.A. dated October 25, 1994.
|
|
4.1.1
(12)
|
(English
Summary) Amendment to the Consulting Agreement by and among Cresud
and Consultores Assets Management S.A., dated September 8,
2017.
|
|
4.2
(2)
|
Agreement
for the exchange of Corporate Service between we, IRSA and IRSA CP,
dated June 30, 2004.
|
|
4.3
(4)
|
English
translation of the Amendment to the Agreement for the exchange of
Corporate Service among, IRSA and IRSA CP and us, dated August 23,
2007.
|
|
4.4
(5)
|
English
translation of the Third Agreement for the Implementation of the
Amendment to the Corporate Services Master Agreement, dated
November 27, 2009.
|
|
4.5
(6)
|
Amendment
to the Agreement for the exchange of Corporate Service between we,
IRSA and IRSA CP, dated March 12, 2010.
|
|
4.6
(7)
|
English
translation of the Forth Agreement for the Implementation of the
Amendment to the Corporate Services Master Agreement, dated July
11, 2011.
|
|
4.7
(8)
|
English
translation of the Fifth Agreement for the Implementation of the
Amendment to the Corporate Services Master Agreement, dated October
15, 2012.
|
|
4.8
(9)
|
English
translation of the Sixth Agreement for the Implementation of the
Amendment to the Corporate Services Master Agreement dated November
12, 2013.
|
|
4.9
(9)
|
English
translation of the Second Amendment to the Exchange of Operating
Services Agreement between the Company, Cresud and IRSA CP dated
February 24, 2014.
|
|
4.10
(10)
|
English
translation of the Seventh Agreement for the Implementation of the
Amendment to the Corporate Services Master Agreement dated February
18, 2015.
|
|
4.11
(11)
|
English
translation of the Eighth Agreement for the Implementation of the
Amendment to the Corporate Services Master Agreement dated November
12, 2015.
|
|
4.12
(12)
|
English
translation of the Ninth Agreement for the Implementation of the
Amendment to the Corporate Services Master Agreement dated May 5,
2017
|
|
4.13
(13)
|
English
translation of the Tenth Agreement for the Implementation of the
Amendment to the Corporate Services Master Agreement dated June 29,
2018.
|
|
4.14
|
English
translation of the Eleventh Agreement for the Implementation of the
Amendment to the Corporate Services Master Agreement dated June 28,
2019.
|
|
8.1
|
List of
Subsidiaries.
|
|
11.1
(3)
|
Code of
Ethics.
|
|
12.1
|
Certification
pursuant to Section 302 of the Sarbanes-Oxley Act of 2002 for Chief
Executive Officer.
|
|
12.2
|
Certification
pursuant to Section 302 of the Sarbanes-Oxley Act of 2002 for Chief
Financial Officer.
|
|
13.1
|
Certification
pursuant to 18 U.S.C. 1350, as adopted pursuant to Section 906 of
the Sarbanes-Oxley Act of 2002 for Chief Executive
Officer.
|
|
13.2
|
Certification
pursuant to 18 U.S.C. 1350, as adopted pursuant to Section 906 of
the Sarbanes-Oxley Act of 2002 for Chief Financial
Officer.
|
|
99.1
|
Summary
of investment properties by type as of June 30, 2020 (in accordance
with Regulation S-X 12-28 (1)).
|
(1) Incorporated herein by reference to the exhibit to the
registrant’s registration statement on Form F-1 (File No.
333-06548) filed with the SEC on March 3, 1997.
(2) Incorporated herein by reference to the report statement on
Form 6-K (File No. 333-06548) filed with the SEC on July 1,
2004.
(3) Incorporated herein by reference to the registrant’s
report on Form 6-K (File No. 333-06548) filed with the SEC on
August 1, 2005.
(4) Incorporated herein by reference to the annual report on Form
20-F (File No. 333-06548) filed with the SEC on December 27,
2007.
(5) Incorporated herein reference to the annual report on Form 20-F
(File No. 001-29190) filed with the SEC on December 30,
2009.
(6) Incorporated herein reference to the annual report on Form 20-F
(File No. 001-29190) filed with the SEC on December 30,
2010.
(7) Incorporated herein reference to the annual report on Form 20-F
(File No. 001-29190) filed with the SEC on December 28,
2011.
(8) Incorporated herein reference to the annual report on Form 20-F
(File No. 001-29190) filed with the SEC on October 30,
2012.
(9) Incorporated herein reference to the annual report on Form 20-F
(File No. 001-29190) filed with the SEC on October 31,
2014.
(10) Incorporated herein reference to the annual report on Form
20-F (File No. 001-29190) filed with the SEC on November 17,
2015.
(11) Incorporated herein by reference to the annual report on Form
20-F (File No. 001-29190) filed with the SEC on November 1,
2016.
(12) Incorporated herein by reference to the annual report on Form
20-F (File No. 001-29190) filed with the SEC on October 31,
2017.
(13) Incorporated herein by reference to the annual report on Form
20-F (File No. 001-29190) filed with the SEC on October 31,
2018.
(14)
Incorporated
herein by reference to the annual report on Form 20-F (File No.
001-29190) filed with the SEC on October 31,
2019.
SIGNATURES
The
registrant hereby certifies that it meets all of the requirements
for filing on Form 20-F and that it has duly caused and authorized
the undersigned to sign this annual report on its
behalf.
|
|
Cresud SOCIEDAD ANÓNIMA COMERCIAL INMOBILIARIA FINANCIERA Y
AGROPECUARIA
|
|
|
|
|
|
|
Date:
November 16, 2020
|
By:
|
/s/
Matías I. Gaivironsky
|
|
|
|
Name
Matías I. Gaivironsky
|
|
|
|
Title
Chief Financial and Administrative Officer
|
311
INDEX TO THE CONSOLIDATED FINANCIAL STATEMENTS
|
Report
of Independent
Registered Public
Accounting Firm
|
F-2
|
|
Glossary
of terms
|
F-4
|
|
Consolidated
Statements of Financial Position
|
F-5
|
|
Consolidated
Statements of Income and Other Comprehensive
Income
|
F-6
|
|
Consolidated
Statements of Changes in Shareholders’
Equity
|
F-7
|
|
Consolidated
Statements of Cash Flows
|
F-10
|
|
Notes
to Consolidated Financial Statements:
|
|
|
|
F-11
|
|
|
F-13
|
|
|
F-33
|
|
|
F-34
|
|
|
F-44
|
|
|
F-55
|
|
|
F-65
|
|
|
F-66
|
|
|
F-69
|
|
|
F-74
|
|
|
F-74
|
|
|
F-75
|
|
|
F-76
|
|
|
F-77
|
|
|
F-79
|
|
|
F-79
|
|
|
F-83
|
|
|
F-84
|
|
|
F-86
|
|
|
F-87
|
|
|
F-87
|
|
|
F-90
|
|
|
F-92
|
|
|
F-95
|
|
|
F-96
|
|
|
F-97
|
|
|
F-97
|
|
|
F-98
|
|
|
F-98
|
|
|
F-99
|
|
|
F-99
|
|
|
F-101
|
|
|
F-106
|
|
|
F-107
|
|
|
F-107
|
|
|
F-108
|
|
|
F-108
|
|
|
F-111
|
|
Schedule
I
|
|
F-1
Report of Independent Registered Public Accounting
Firm
To the
Board of Directors and Shareholders of
Cresud
Sociedad Anónima, Comercial, Inmobiliaria, Financiera y
Agropecuaria
Opinions on the Financial Statements and Internal Control over
Financial Reporting
We have audited the ac
companying consolidated statements of
financial position of Cresud Sociedad Anónima, Comercial,
Inmobiliaria, Financiera y Agropecuaria and its
subsidiaries
(the
“Company”)
as
of
June 30, 2020
and
2019, and
the related
consolidated
statements of income and other comprehensive
income, changes in shareholders’ equity and cash flows for
each of the three years in the period ended
June 30, 2020, including the related
notes
and
the summary of investment properties by type as of June 30, 2020
listed in the index appearing under Item 19 (99.1) (collectively
referred to as the “consolidated financial
statements”). We also have audited the Company’s
internal control over financial reporting as of June 30, 2020,
based on criteria established in
Internal Control - Integrated
Framework
(2013)
issued by the Committee of Sponsoring
Organizations of the Treadway Commission (COSO).
In our
opinion, the consolidated
financial statements referred to
above
present fairly, in all material
respects, the financial position of the Company as of
June
30, 2020
and
2019
, and the results of
its
operations and
its
cash flows for each of the three years in the
period ended
June
30, 2020
in conformity with
International Financial
Reporting Standards as issued by the International Accounting
Standards Board
.
Also in our
opinion, the Company maintained, in all material respects,
effective internal control over financial reporting as of June 30,
2020, based on criteria established in
Internal Control - Integrated Framework
(2013)
issued by the
COSO.
Basis for Opinions
The Company's management is responsible for these
consolidated
financial statements, for
maintaining effective internal control over financial reporting,
and for its assessment of the effectiveness of internal control
over financial reporting
, included in the accompanying
Management’s Annual Report on Internal Control over Financial
Reporting appearing under Item 15
. Our
responsibility is to express opinions on the Company’s
consolidated
financial statements and
on the Company's internal control over financial reporting based on
our
audits. We are a public accounting firm registered with
the Public Company Accounting Oversight Board (United States)
(PCAOB) and are required to be independent with respect to the
Company in accordance with the U.S. federal securities laws and the
applicable rules and regulations of the Securities and Exchange
Commission and the PCAOB.
We conducted our
audits i
n
accordance with the standards of the PCAOB. Those standards require
that we plan and perform the audits to obtain reasonable assurance
about whether the
consolidated
financial statements are free of material
misstatement, whether due to error or fraud, and whether effective
internal control over financial reporting was maintained in all
material respects.
Our audits of the
consolidated
financial statements included performing
procedures to assess the risks of material misstatement of
the
consolidated
financial
statements, whether due to error or fraud, and performing
procedures that respond to those risks. Such procedures included
examining, on a test basis, evidence regarding the amounts and
disclosures in the
consolidated
financial statements. Our audits also included
evaluating the accounting principles used and significant estimates
made by management, as well as evaluating the overall presentation
of the
consolidated
financial
statements. Our audit of internal control over financial reporting
included obtaining an understanding of internal control over
financial reporting, assessing the risk that a material weakness
exists, and testing and evaluating the design
and
F-2
operating effectiveness of internal control based on the assessed
risk. Our audits also included performing such other procedures as
we considered necessary in the circumstances. We believe that our
audits provide a reasonable basis for our opinions.
Emphasis of Matter
As discussed in Note 1 to the consolidated financial statements, in
September 2020, the Company’s subsidiary IDBD entered into a
liquidation process. These financial statements do not include any
adjustments related to the loss of control over IDBD and all other
entities in the Israel Operations Center.
As discussed in Note 37 to the consolidated financial statements,
there are significant uncertainties related to the impact of the
current economic context and COVID-19. Management’s
evaluation of the events and conditions and management’s
plans to mitigate these matters are also described in Note
37.
Definition and Limitations of Internal Control over Financial
Reporting
A
company’s internal control over financial reporting is a
process designed to provide reasonable assurance regarding the
reliability of financial reporting and the preparation of financial
statements for external purposes in accordance with generally
accepted accounting principles. A company’s internal control
over financial reporting includes those policies and procedures
that (i) pertain to the maintenance of records that, in
reasonable detail, accurately and fairly reflect the transactions
and dispositions of the assets of the company; (ii) provide
reasonable assurance that transactions are recorded as necessary to
permit preparation of financial statements in accordance with
generally accepted accounting principles, and that receipts and
expenditures of the company are being made only in accordance with
authorizations of management and directors of the company; and
(iii) provide reasonable assurance regarding prevention or
timely detection of unauthorized acquisition, use, or disposition
of the company’s assets that could have a material effect on
the financial statements.
Because
of its inherent limitations, internal control over financial
reporting may not prevent or detect misstatements. Also,
projections of any evaluation of effectiveness to future periods
are subject to the risk that controls may become inadequate because
of changes in conditions, or that the degree of compliance with the
policies or procedures may deteriorate.
/s/
PRICE WATERHOUSE & Co. S.R.L
(Partner)
/s/
Walter Rafael Zablocky
Buenos
Aires, Argentina
November
16, 2020
We have served as the Company’s auditor since
1995.
F-3
Glossary of terms
The
following are not technical definitions, but help the reader to
understand certain terms used in the wording of the notes to the
Group´s Consolidated Financial Statements.
|
Terms
|
|
Definitions
|
|
Acres
|
|
Agropecuaria Acres del Sud S.A.
|
|
Adama
|
|
Adama Agricultural Solutions Ltd.
|
|
Agropecuarias SC
|
|
Agropecuarias Santa Cruz de la Sierra S.A.
|
|
BACS
|
|
Banco de Crédito y Securitización S.A.
|
|
Baicom
|
|
Baicom Networks S.A.
|
|
Bartan
|
|
Bartan Holdings and Investments Ltd.
|
|
BYMA
|
|
Buenos Aires Stock Exchange
|
|
BASE
|
|
Buenos Aires Stock Exchange
|
|
BCRA
|
|
Central Bank of the Argentine Republic
|
|
BHSA
|
|
Banco Hipotecario S.A.
|
|
BMBY
|
|
Buy Me Buy You
|
|
BNSA
|
|
Boulevard Norte S.A.
|
|
Brasilagro
|
|
Brasilagro-Companhia Brasileira de Propriedades
Agrícolas
|
|
CAMSA
|
|
Consultores Assets Management S.A.
|
|
Carnes Pampeanas
|
|
Sociedad Anónima Carnes Pampeanas S.A.
|
|
Cellcom
|
|
Cellcom Israel Ltd.
|
|
IFRIC
|
|
International Financial Reporting Standards Interpretation
Committee
|
|
Clal
|
|
Clal Holdings Insurance Enterprises Ltd.
|
|
CNV
|
|
National Securities Commission
|
|
CODM
|
|
Chief Operating Decision Maker
|
|
Condor
|
|
Condor Hospitality Trust Inc.
|
|
Cresud, “the Company”, “us”
|
|
Cresud S.A.C.I.F. y A.
|
|
Cyrsa
|
|
Cyrsa S.A.
|
|
DFL
|
|
Dolphin Fund Ltd.
|
|
DIL
|
|
Dolphin IL Investment Ltd.
|
|
DIC
|
|
Discount Investment Corporation Ltd.
|
|
DN B.V.
|
|
Dolphin Netherlands B.V.
|
|
Dolphin
|
|
Dolphin Fund Ltd. and Dolphin Netherlands B.V.
|
|
ECLSA
|
|
E-Commerce Latina S.A.
|
|
USA
|
|
United States of America
|
|
Efanur
|
|
Efanur S.A.
|
|
EHSA
|
|
Entertainment Holdings S.A.
|
|
Electra
|
|
Electra Consumer Products Ltd.
|
|
ENUSA
|
|
Entretenimiento Universal S.A.
|
|
ERSA
|
|
Emprendimiento Recoleta S.A.
|
|
Financial Statements
|
|
Unaudited Condensed Interim Consolidated Financial
Statements
|
|
Annual Financial Statements
|
|
Consolidated Financial Statements as of June 30, 2019
|
|
ETH
|
|
C.A.A. Extra Holdings Ltd.
|
|
CPF
|
|
Collective Promotion Funds
|
|
Gav-Yam
|
|
Gav-Yam, Bayside Land Corporation Ltd
|
|
Gav-Yam
|
|
Gav-Yam Bayside Land Corporation Ltd.
|
|
GCBA
|
|
Autonomous City of Buenos Aires Government
|
|
Golan
|
|
Golan Telecom Ltd.
|
|
HASAU
|
|
Hoteles Argentinos S.A.U.
|
|
IASB
|
|
International Accounting Standards Board
|
|
IDBT
|
|
IDB Tourism (2009) Ltd.
|
|
IDBD
|
|
IDB Development Corporation Ltd.
|
|
IDBG
|
|
IDB Group Investment Inc.
|
|
IDBH
|
|
IDB Holdings Corporation Ltd.
|
|
IFISA
|
|
Inversiones Financieras del Sur S.A.
|
|
CPI
|
|
Consumer Price Index
|
|
IRSA
|
|
IRSA Inversiones y Representaciones S.A.
|
|
ISPRO
|
|
ISPRO the Israel properties rental Corp. Ltd.
|
|
IRSA CP
|
|
IRSA Propiedades Comerciales S.A.
|
|
ISPRO
|
|
Ispro The Israeli Properties Rental Corporation Ltd.
|
|
Israir
|
|
Israir Airlines & Tourism Ltd.
|
|
Lipstick
|
|
Lipstick Management LLC
|
|
LRSA
|
|
La Rural S.A.
|
|
Metropolitan
|
|
Metropolitan 885 Third Avenue Leasehold LLC
|
|
NASDAQ
|
|
National Association of Securities Dealers Automated
Quotation
|
|
New Lipstick
|
|
New Lipstick LLC
|
|
IAS
|
|
International Accounting Standards
|
|
IFRS
|
|
International Financial Reporting Standards
|
|
MPIT
|
|
Minimum Presumed Income Tax
|
|
NCN
|
|
Non-convertible notes
|
|
NIS
|
|
New Israeli Shekel
|
|
NFSA
|
|
Nuevas Fronteras S.A.
|
|
NPSF
|
|
Nuevo Puerto Santa Fe S.A.
|
|
NYSE
|
|
New York Stock Exchange
|
|
OASA
|
|
Ogden Argentina S.A.
|
|
Ombú
|
|
Ombú Agropecuaria S.A.
|
|
PAMSA
|
|
Panamerican Mall S.A.
|
|
PBC
|
|
Property & Building Corporation Ltd.
|
|
PBEL
|
|
PBEL Real Estate Ltd.
|
|
Puerto Retiro
|
|
Puerto Retiro S.A.
|
|
Quality
|
|
Quality Invest S.A.
|
|
Rock Real
|
|
Rock Real Estate Partners Limited
|
|
Shufersal
|
|
Shufersal Ltd.
|
|
SRA
|
|
Sociedad Rural Argentina
|
|
Tarshop
|
|
Tarshop S.A.
|
|
TASE
|
|
Tel Aviv Stock Exchange
|
|
Tender offers
|
|
Share repurchase commitment
|
|
TGLT
|
|
TGLT S.A.
|
|
Tyrus
|
|
Tyrus S.A.
|
F-4
Cresud Sociedad Anónima,
Comercial, Inmobiliaria, Financiera y Agropecuaria
as of June 30, 2020 and 2019
(All
amounts in millions of Argentine Pesos, except otherwise
indicated)
|
|
Note
|
06.30.20
|
06.30.19
|
|
ASSETS
|
|
|
|
|
Non-current
assets
|
|
|
|
|
Investment
properties
|
9
|
230,167
|
335,016
|
|
Property, plant and
equipment
|
10
|
59,956
|
54,106
|
|
Trading
properties
|
11
|
4,856
|
7,855
|
|
Intangible
assets
|
12
|
28,192
|
26,018
|
|
Right-of-use
assets
|
13
|
21,928
|
-
|
|
Biological
assets
|
14
|
1,759
|
1,805
|
|
Other
assets
|
|
-
|
31
|
|
Investments in
associates and joint
ventures
|
8
|
75,128
|
44,870
|
|
Deferred income tax
assets
|
23
|
927
|
772
|
|
Income tax and MPIT
credits
|
|
63
|
273
|
|
Restricted
assets
|
16
|
1,936
|
4,547
|
|
Trade and
other receivables
|
17
|
27,326
|
21,730
|
|
Investment in
financial assets
|
16
|
3,515
|
4,129
|
|
Financial assets at
fair value
through profit or
loss
|
16
|
-
|
5,972
|
|
Derivative
financial instruments
|
16
|
164
|
153
|
|
Total
non-current assets
|
|
455,917
|
507,277
|
|
Current
assets
|
|
|
|
|
Trading
properties
|
11
|
2,316
|
523
|
|
Biological
assets
|
14
|
2,773
|
3,795
|
|
Inventories
|
15
|
9,070
|
6,403
|
|
Restricted
assets
|
16
|
6,209
|
6,261
|
|
Income tax and
MPIT credits
|
|
306
|
559
|
|
Groups of assets
held for sale
|
35
|
43,816
|
11,498
|
|
Trade and other
receivables
|
17
|
43,717
|
38,452
|
|
Investment in
financial assets
|
16
|
18,192
|
45,134
|
|
Financial assets at
fair value
through profit or
loss
|
16
|
3,377
|
16,666
|
|
Derivative
financial instruments
|
16
|
321
|
162
|
|
Cash and cash
equivalents
|
16
|
100,926
|
89,304
|
|
Total
current assets
|
|
231,023
|
218,757
|
|
TOTAL
ASSETS
|
|
686,940
|
726,034
|
|
SHAREHOLDERS’
EQUITY
|
|
|
|
|
Shareholders'
equity (according to corresponding statement)
|
|
25,159
|
24,042
|
|
Non-controlling
interest
|
|
96,994
|
103,159
|
|
TOTAL
SHAREHOLDERS' EQUITY
|
|
122,153
|
127,201
|
|
LIABILITIES
|
|
|
|
|
Non-current
liabilities
|
|
|
|
|
Borrowings
|
22
|
320,418
|
397,414
|
|
Deferred income tax
liabilities
|
23
|
49,469
|
57,192
|
|
Trade and other
payables
|
20
|
2,986
|
2,830
|
|
Provisions
|
21
|
3,091
|
11,478
|
|
Employee
benefits
|
|
447
|
189
|
|
Lease
liabilities
|
|
15,194
|
-
|
|
Derivative
financial instruments
|
16
|
74
|
1,470
|
|
Payroll and social
security
liabilities
|
|
247
|
197
|
|
Total
non-current liabilities
|
|
391,926
|
470,770
|
|
Current
liabilities
|
|
|
|
|
Trade and other
payables
|
20
|
35,823
|
32,299
|
|
Borrowings
|
22
|
98,389
|
80,384
|
|
Provisions
|
21
|
2,443
|
2,477
|
|
Group
of liabilities held for sale
|
35
|
23,649
|
8,137
|
|
Payroll and social
security liabilities
|
|
4,685
|
3,802
|
|
Income tax and MPIT
liabilities
|
|
824
|
699
|
|
Lease
liabilities
|
|
5,661
|
-
|
|
Derivative
financial instruments
|
16
|
1,387
|
265
|
|
Total
Current liabilities
|
|
172,861
|
128,063
|
|
TOTAL
LIABILITIES
|
|
564,787
|
598,833
|
|
TOTAL
SHAREHOLDERS' EQUITY AND LIABILITIES
|
|
686,940
|
726,034
|
The
accompanying notes are an integral part of these Consolidated
Financial Statements.
|
PRICE WATERHOUSE & CO. S.R.L.
(Socio)
|
|
)
|
|
)
|
|
C.P.C.E.C.A.B.A. T° 1 F° 17
Dr. Mariano C. Tomatis
Contador Público (UBA)
C.P.C.E.C.A.B.A. T° 241 F° 118
|
|
José Daniel Abelovich
Síndico Titular
Por Comisión Fiscalizadora
|
|
|
F-5
Cresud Sociedad Anónima,
Comercial, Inmobiliaria, Financiera y Agropecuaria
Consolidated Statements of Income and Other Comprehensive
Income
for the fiscal years ended June 30, 2020, 2019 and
2018
(All
amounts in millions of Argentine Pesos, except otherwise
indicated)
|
|
Note
|
06.30.20
|
06.30.19
|
06.30.18
|
|
Revenues
|
25
|
121,256
|
110,741
|
93,266
|
|
Costs
|
26
|
(83,971
)
|
(75,384
)
|
(62,078
)
|
|
Initial
recognition and changes in the fair value of biological assets and
agricultural products at the point of harvest
|
|
2,827
|
2,305
|
1,674
|
|
Changes
in the net realizable value of agricultural products after
harvest
|
|
657
|
(43
)
|
532
|
|
Gross profit
|
|
40,769
|
37,619
|
33,394
|
|
Net
gain / (loss) from fair value adjustment of investment
properties
|
|
30,992
|
(37,746
)
|
18,971
|
|
Gain
from disposal of farmlands
|
|
838
|
665
|
1,656
|
|
General
and administrative expenses
|
27
|
(12,267
)
|
(12,152
)
|
(10,876
)
|
|
Selling
expenses
|
27
|
(16,348
)
|
(13,976
)
|
(13,489
)
|
|
Impairment
of associates
|
|
(2,470
)
|
-
|
-
|
|
Other
operating results, net
|
28
|
2,770
|
1,101
|
3,657
|
|
Management
fees
|
|
(211
)
|
-
|
(1,456
)
|
|
Profit / (Loss) from operations
|
|
44,073
|
(24,489
)
|
31,857
|
|
Share
of profit / (loss) of associates and joint ventures
|
8
|
8,662
|
(7,328
)
|
(3,452
)
|
|
Profit / (Loss) from operations before financing and
taxation
|
|
52,735
|
(31,817
)
|
28,405
|
|
Finance
income
|
29
|
1,463
|
1,775
|
1,476
|
|
Finance
cost
|
29
|
(25,683
)
|
(22,571
)
|
(26,377
)
|
|
Other
financial results
|
29
|
(18,667
)
|
5,981
|
(22,168
)
|
|
Inflation
adjustment
|
29
|
177
|
(457
)
|
(321
)
|
|
Financial results, net
|
29
|
(42,710
)
|
(15,272
)
|
(47,390
)
|
|
Profit / (Loss) before income tax
|
|
10,025
|
(47,089
)
|
(18,985
)
|
|
Income
tax
|
23
|
(8,107
)
|
(780
)
|
9,964
|
|
Profit / (Loss) for the year from continuing
operations
|
|
1,918
|
(47,869
)
|
(9,021
)
|
|
Profit
from discontinued operations after income tax
|
36
|
18,085
|
7,140
|
36,441
|
|
Profit / (Loss) for the year
|
|
20,003
|
(40,729
)
|
27,420
|
|
|
|
|
|
|
|
|
|
|
|
|
|
Other
comprehensive income / (loss):
|
|
|
|
|
|
Items that may be reclassified subsequently to profit or
loss:
|
|
|
|
|
|
Currency
translation adjustment
|
|
5,232
|
(3,113
)
|
6,417
|
|
Revaluation
surplus
|
|
614
|
1,111
|
316
|
|
Change
in the fair value of hedging instruments net of income
taxes
|
|
(102
)
|
19
|
(40
)
|
|
Items that may not be reclassified subsequently to profit or
loss:
|
|
|
|
|
|
Actuarial
loss from defined benefit plans
|
|
(137
)
|
(66
)
|
(60
)
|
|
Other comprehensive income / (loss) for the year from continuing
operations
|
|
5,607
|
(2,049
)
|
6,633
|
|
Other
comprehensive income for the year from discontinued
operations
|
|
5,810
|
1,245
|
10,059
|
|
Total other comprehensive income / (loss) for the year
|
|
11,417
|
(804
)
|
16,692
|
|
Total comprehensive income /
(loss)
for the
year
|
|
31,420
|
(41,533
)
|
44,112
|
|
Total
comprehensive income / (loss) from continuing
operations
|
|
7,525
|
(49,918
)
|
(2,389
)
|
|
Total
comprehensive income from discontinued operations
|
|
23,895
|
8,385
|
46,501
|
|
Total comprehensive income / (loss)
for the
year
|
|
31,420
|
(41,533
)
|
44,112
|
|
Profit / (Loss) for the year attributable to:
|
|
|
|
|
|
Equity
holders of the parent
|
|
3,929
|
(26,796
)
|
6,106
|
|
Non-controlling
interest
|
|
16,074
|
(13,933
)
|
21,314
|
|
Profit / (Loss) from continuing operations attributable
to:
|
|
|
|
|
|
Equity
holders of the parent
|
|
(2,368
)
|
(28,334
)
|
(9,492
)
|
|
Non-controlling
interest
|
|
4,286
|
(19,535
)
|
471
|
|
Total comprehensive income / (loss) attributable to:
|
|
|
|
|
|
Equity
holders of the parent
|
|
2,421
|
(27,078
)
|
5,775
|
|
Non-controlling
interest
|
|
28,999
|
(14,455
)
|
38,337
|
|
Profit / (Loss) per share attributable to equity holders of the
parent:
|
|
|
|
|
|
Basic
|
|
(7.87
)
|
(54.79
)
|
12.29
|
|
Diluted
|
|
(7.63
)
|
(54.79
)
|
11.82
|
|
Profit per share from continuing operations attributable to equity
holders of the parent:
|
|
|
|
|
|
Basic
|
|
(4.81
)
|
(57.94
)
|
(19.11
)
|
|
Diluted
|
|
(4.81
)
|
(57.94
)
|
(19.11
)
|
The
accompanying notes are an integral part of these Consolidated
Financial Statements.
|
PRICE WATERHOUSE & CO. S.R.L.
(Socio)
|
|
)
|
|
)
|
|
C.P.C.E.C.A.B.A. T° 1 F° 17
Dr. Mariano C. Tomatis
Contador Público (UBA)
C.P.C.E.C.A.B.A. T° 241 F° 118
|
|
José Daniel Abelovich
Síndico Titular
Por Comisión Fiscalizadora
|
|
|
F-6
Cresud Sociedad Anónima,
Comercial, Inmobiliaria, Financiera y Agropecuaria
Consolidated Statements of Changes in Shareholders’
Equity
for the fiscal years ended June 30, 2020, 2019 and
2018
(All
amounts in millions of Argentine Pesos, except otherwise
indicated)
|
|
Attributable to equity holders of the parent
|
|
|
|||||||||
|
|
Share capital
|
Treasury shares
|
Inflation adjustment of share capital and treasury shares
(i)
|
Share premium
|
Additional paid-in capital from treasury shares
|
Legal reserve
|
Special
reserve Resolution CNV 609/12 (ii)
|
Other reserves (iii)
|
Retained earnings
|
Subtotal
|
Non-controlling interest
|
Total Shareholders' equity
|
|
Balance as of June 30, 2019
|
486
|
16
|
9,786
|
10,592
|
91
|
373
|
5,179
|
36,427
|
(38,908
)
|
24,042
|
103,159
|
127,201
|
|
Adjustments
previous years (IFRS 9 and 15) (Note 2.2)
|
-
|
-
|
-
|
-
|
-
|
-
|
-
|
-
|
(814
)
|
(814
)
|
(1,352
)
|
(2,166
)
|
|
Restated balance as of June 30, 2019
|
486
|
16
|
9,786
|
10,592
|
91
|
373
|
5,179
|
36,427
|
(39,722
)
|
23,228
|
101,807
|
125,035
|
|
Profit
for the year
|
-
|
-
|
-
|
-
|
-
|
-
|
-
|
-
|
3,929
|
3,929
|
16,074
|
20,003
|
|
Other
comprehensive (loss) / income for the year
|
-
|
-
|
-
|
-
|
-
|
-
|
-
|
(1,508
)
|
-
|
(1,508
)
|
12,925
|
11,417
|
|
Total comprehensive income for the year
|
-
|
-
|
-
|
-
|
-
|
-
|
-
|
(1,508
)
|
3,929
|
2,421
|
28,999
|
31,420
|
|
As resolved by Ordinary and Extraordinary Shareholders' Meeting
held on October 30, 2019
|
|
|
|
|
|
|
|
|
|
|
|
|
|
- Treasury shares distribution
|
13
|
(13
)
|
-
|
-
|
-
|
-
|
-
|
1,512
|
(1,512
)
|
-
|
-
|
-
|
|
Reserve
for share-based payments
|
-
|
-
|
-
|
-
|
(1
)
|
-
|
-
|
(3
)
|
-
|
(4
)
|
(7
)
|
(11
)
|
|
Loss
absorption
|
-
|
-
|
-
|
-
|
-
|
-
|
(4,409
)
|
(34,997
)
|
39,406
|
-
|
-
|
-
|
|
Other
changes in equity
|
-
|
-
|
-
|
-
|
-
|
-
|
-
|
-
|
(61
)
|
(61
)
|
211
|
150
|
|
Changes
in non-controlling interest
|
-
|
-
|
-
|
-
|
-
|
-
|
-
|
(425
)
|
-
|
(425
)
|
4,815
|
4,390
|
|
Capitalization
of irrevocable contributions
|
-
|
-
|
-
|
-
|
-
|
-
|
-
|
-
|
-
|
-
|
31
|
31
|
|
Incorporation
by business combination
|
-
|
-
|
-
|
-
|
-
|
-
|
-
|
-
|
-
|
-
|
7,442
|
7,442
|
|
Decrease
due to loss of control (Note 4 (j))
|
-
|
-
|
-
|
-
|
-
|
-
|
-
|
-
|
-
|
-
|
(43,301
)
|
(43,301
)
|
|
Dividends
distribution to non-controlling interest
|
-
|
-
|
-
|
-
|
-
|
-
|
-
|
-
|
-
|
-
|
(3,003
)
|
(3,003
)
|
|
Balance as of June 30, 2020
|
499
|
3
|
9,786
|
10,592
|
90
|
373
|
770
|
1,006
|
2,040
|
25,159
|
96,994
|
122,153
|
(i) Includes Ps. 1
and Ps. 1 of inflation adjustment of Treasury shares as of June 30,
2020 and 2019, respectively.
(ii) Related to CNV
General Resolution N° 609/12. See Note 19.
(iii) Group’s
other reserves for the year ended June 30, 2020 were as
follows:
|
|
Cost of treasury shares
|
Changes in non-controlling interest
|
Reserve for currency translation adjustment
|
Reserve shared-based compensation
|
Revaluation surplus
|
Special reserve
|
Reserve for the acquisition of securities issued by the
Company
|
Other comprehensive income from subsidiaries
|
Other reserves from subsidiaries
|
Total other reserves
|
|
Balance as of June 30, 2019
|
(1,664
)
|
(2,776
)
|
960
|
4,549
|
483
|
34,997
|
(218
)
|
87
|
9
|
36,427
|
|
Other
comprehensive (loss) / income for the year
|
-
|
-
|
328
|
(1,565
)
|
-
|
-
|
(271
)
|
-
|
-
|
(1,508
)
|
|
Total comprehensive income for the year
|
-
|
-
|
328
|
(1,565
)
|
-
|
-
|
(271
)
|
-
|
-
|
(1,508
)
|
|
As resolved by Ordinary and Extraordinary Shareholders' Meeting
held on October 30, 2019
|
|
|
|
|
|
|
|
|
|
|
|
- Treasury shares distribution
|
1,512
|
-
|
-
|
-
|
-
|
-
|
-
|
-
|
-
|
1,512
|
|
Reserve
for share-based payments
|
2
|
-
|
-
|
-
|
(5
)
|
-
|
-
|
-
|
-
|
(3
)
|
|
Loss
absorption
|
-
|
-
|
-
|
-
|
-
|
(34,997
)
|
-
|
-
|
-
|
(34,997
)
|
|
Other
changes in equity
|
-
|
(93
)
|
-
|
-
|
16
|
-
|
19
|
-
|
58
|
-
|
|
Changes
in non-controlling interest
|
-
|
(425
)
|
-
|
-
|
-
|
-
|
-
|
-
|
-
|
(425
)
|
|
Balance as of June 30, 2020
|
(150
)
|
(3,294
)
|
1,288
|
2,984
|
494
|
-
|
(470
)
|
87
|
67
|
1,006
|
The accompanying notes are an
integral part of these Consolidated Financial
Statements.
|
PRICE WATERHOUSE & CO. S.R.L.
(Socio)
|
|
)
|
|
)
|
|
C.P.C.E.C.A.B.A. T° 1 F° 17
Dr. Mariano C. Tomatis
Contador Público (UBA)
C.P.C.E.C.A.B.A. T° 241 F° 118
|
|
José Daniel Abelovich
Síndico Titular
Por Comisión Fiscalizadora
|
|
|
F-7
Cresud Sociedad Anónima,
Comercial, Inmobiliaria, Financiera y Agropecuaria
Consolidated Statements of Changes in Shareholders’
Equity
for the fiscal years ended June 30, 2020, 2019 and
2018
(All
amounts in millions of Argentine Pesos, except otherwise
indicated)
|
|
Attributable to equity holders of the parent
|
|
|
|||||||||
|
|
Share capital
|
Treasury shares
|
Inflation adjustment of share capital and treasury shares
(i)
|
Share premium
|
Additional paid-in capital from treasury shares
|
Legal reserve
|
Special
reserve Resolution CNV 609/12 (ii)
|
Other reserves (iii)
|
Retained earnings
|
Subtotal
|
Non-controlling interest
|
Total Shareholders' equity
|
|
Balance as of June 30, 2018
|
482
|
20
|
9,786
|
10,592
|
91
|
373
|
5,179
|
6,124
|
20,589
|
53,236
|
123,218
|
176,454
|
|
Adjustments
previous years (IFRS 9 and 15) (Note 2,2)
|
-
|
-
|
-
|
-
|
-
|
-
|
-
|
-
|
(201
)
|
(201
)
|
(135
)
|
(336
)
|
|
Restated balance as of June 30, 2018
|
482
|
20
|
9,786
|
10,592
|
91
|
373
|
5,179
|
6,124
|
20,388
|
53,035
|
123,083
|
176,118
|
|
Loss
for the year
|
-
|
-
|
-
|
-
|
-
|
-
|
-
|
-
|
(26,796
)
|
(26,796
)
|
(13,933
)
|
(40,729
)
|
|
Other
comprehensive loss for the year
|
-
|
-
|
-
|
-
|
-
|
-
|
-
|
(282
)
|
-
|
(282
)
|
(522
)
|
(804
)
|
|
Total comprehensive income for the year
|
-
|
-
|
-
|
-
|
-
|
-
|
-
|
(282
)
|
(26,796
)
|
(27,078
)
|
(14,455
)
|
(41,533
)
|
|
As resolved by Ordinary and Extraordinary Shareholders' Meeting
held on October 29, 2018
|
|
|
|
|
|
|
|
|
|
|
|
|
|
- Results distribution
|
-
|
-
|
-
|
-
|
-
|
-
|
-
|
32,531
|
(32,531
)
|
-
|
-
|
-
|
|
Purchase
own shares in portfolio
|
(17
)
|
17
|
-
|
-
|
-
|
-
|
-
|
(1,228
)
|
-
|
(1,228
)
|
-
|
(1,228
)
|
|
Distribution
of dividends in shares
|
21
|
(21
)
|
-
|
-
|
-
|
-
|
-
|
-
|
-
|
-
|
(535
)
|
(535
)
|
|
Reserve
for share-based payments
|
-
|
-
|
-
|
-
|
-
|
-
|
-
|
16
|
-
|
16
|
80
|
96
|
|
Changes
in non-controlling interest
|
-
|
-
|
-
|
-
|
-
|
-
|
-
|
(703
)
|
-
|
(703
)
|
(775
)
|
(1,478
)
|
|
Reversal
by sale of investment properties
|
-
|
-
|
-
|
-
|
-
|
-
|
-
|
(31
)
|
31
|
-
|
-
|
-
|
|
Dividends
distribution to non-controlling interest
|
-
|
-
|
-
|
-
|
-
|
-
|
-
|
-
|
-
|
-
|
(4,246
)
|
(4,246
)
|
|
Irrevocable
contributions
|
-
|
-
|
-
|
-
|
-
|
-
|
-
|
-
|
-
|
-
|
7
|
7
|
|
Balance as of June 30, 2019
|
486
|
16
|
9,786
|
10,592
|
91
|
373
|
5,179
|
36,427
|
(38,908
)
|
24,042
|
103,159
|
127,201
|
(i) Includes Ps. 1
and Ps. 1 of inflation adjustment of Treasury shares as of June 30,
2019 and 2018, respectively.
(ii) Related to CNV
General Resolution N° 609/12. See Note 19.
(iii) Group’s
other reserves for the year ended June 30, 2019 were as
follows:
|
|
Cost of treasury shares
|
Changes in non-controlling interest
|
Reserve for currency translation adjustment
|
Reserve shared-based compensation
|
Revaluation surplus
|
Special reserve
|
Reserve for the acquisition of securities issued by the
Company
|
Other comprehensive loss from subsidiaries
|
Other reserves from subsidiaries
|
Total other reserves
|
|
Balance as of June 30, 2018
|
(1,917
)
|
(2,073
)
|
5,459
|
467
|
196
|
3,947
|
87
|
(51
)
|
9
|
6,124
|
|
Other
comprehensive (loss) / income for the year
|
-
|
-
|
(910
)
|
-
|
795
|
-
|
-
|
(167
)
|
-
|
(282
)
|
|
Total comprehensive (loss) / income for the year
|
-
|
-
|
(910
)
|
-
|
795
|
-
|
-
|
(167
)
|
-
|
(282
)
|
|
As resolved by Ordinary and Extraordinary Shareholders' Meeting
held on October 29, 2018
|
|
|
|
|
|
|
|
|
|
|
|
- Results distribution
|
-
|
-
|
-
|
-
|
-
|
32,531
|
-
|
-
|
-
|
32,531
|
|
Purchase
own shares in portfolio
|
(1,228
)
|
-
|
-
|
-
|
-
|
-
|
-
|
-
|
-
|
(1,228
)
|
|
Distribution
of dividends in shares
|
1,481
|
-
|
-
|
-
|
-
|
(1,481
)
|
-
|
-
|
-
|
-
|
|
Reserve
for share-based payments
|
-
|
-
|
-
|
16
|
-
|
-
|
-
|
-
|
-
|
16
|
|
Changes
in non-controlling interest
|
-
|
(703
)
|
-
|
-
|
-
|
-
|
-
|
-
|
-
|
(703
)
|
|
Reversal
by sale of investment properties
|
-
|
-
|
-
|
-
|
(31
)
|
-
|
-
|
-
|
-
|
(31
)
|
|
Balance as of June 30, 2019
|
(1,664
)
|
(2,776
)
|
4,549
|
483
|
960
|
34,997
|
87
|
(218
)
|
9
|
36,427
|
The accompanying notes are an
integral part of these Consolidated Financial
Statements.
|
PRICE WATERHOUSE & CO. S.R.L.
(Socio)
|
|
)
|
|
)
|
|
C.P.C.E.C.A.B.A. T° 1 F° 17
Dr. Mariano C. Tomatis
Contador Público (UBA)
C.P.C.E.C.A.B.A. T° 241 F° 118
|
|
José Daniel Abelovich
Síndico Titular
Por Comisión Fiscalizadora
|
|
|
F-8
Cresud Sociedad Anónima,
Comercial, Inmobiliaria, Financiera y Agropecuaria
Consolidated Statements of Changes in Shareholders’
Equity
for the fiscal years ended June 30, 2020, 2019 and
2018
(All
amounts in millions of Argentine Pesos, except otherwise
indicated)
|
|
Attributable to equity holders of the parent
|
|
|
|
|||||||||
|
|
Share capital
|
Treasury shares
|
Inflation adjustment of share capital and treasury shares
(i)
|
Share premium
|
Additional paid-in capital from treasury shares
|
Legal reserve
|
Special
reserve Resolution CNV 609/12 (ii)
|
Other reserves (iii)
|
Retained earnings
|
Subtotal
|
Non-controlling interest
|
Total Shareholders' equity
|
|
|
Balance as of June 30, 2017
|
499
|
3
|
9,786
|
10,592
|
89
|
286
|
5,179
|
7,113
|
19,477
|
53,024
|
97,860
|
150,884
|
|
|
Profit
for the year
|
-
|
-
|
-
|
-
|
-
|
-
|
-
|
-
|
6,106
|
6,106
|
21,314
|
27,420
|
|
|
Other
comprehensive (loss) / income for the year
|
-
|
-
|
-
|
-
|
-
|
-
|
-
|
(331
)
|
-
|
(331
)
|
17,023
|
16,692
|
|
|
Total comprehensive (loss) / income
for the year
|
-
|
-
|
-
|
-
|
-
|
-
|
-
|
(331
)
|
6,106
|
5,775
|
38,337
|
44,112
|
|
|
As resolved by Ordinary and Extraordinary Shareholders' Meeting
held on October 31, 2017
|
|
|
|
|
|
|
|
|
|
|
|
|
|
|
- Legal reserve
|
-
|
-
|
-
|
-
|
-
|
87
|
-
|
-
|
(87
)
|
-
|
-
|
-
|
|
|
- Cash dividends
|
-
|
-
|
-
|
-
|
-
|
-
|
-
|
-
|
(1,065
)
|
(1,065
)
|
-
|
(1,065
)
|
|
|
- Reserve for new developments
|
-
|
-
|
-
|
-
|
-
|
-
|
-
|
3,947
|
(3,947
)
|
-
|
-
|
-
|
|
|
Purchase
own shares in portfolio
|
(17
)
|
17
|
-
|
-
|
-
|
-
|
-
|
(1,779
)
|
-
|
(1,779
)
|
-
|
(1,779
)
|
|
|
Changes
of interest in subsidiaries
|
-
|
-
|
-
|
-
|
-
|
-
|
-
|
-
|
-
|
-
|
17
|
17
|
|
|
Share
of changes in subsidiaries' equity
|
-
|
-
|
-
|
-
|
-
|
-
|
-
|
(2,833
)
|
105
|
(2,728
)
|
-
|
(2,728
)
|
|
|
Reserve
for share-based payments
|
-
|
-
|
-
|
-
|
-
|
-
|
-
|
7
|
-
|
7
|
113
|
120
|
|
|
Equity
incentive plan granted
|
-
|
-
|
-
|
-
|
2
|
-
|
-
|
-
|
-
|
2
|
-
|
2
|
|
|
Loss
of control in subsidiary
|
-
|
-
|
-
|
-
|
-
|
-
|
-
|
-
|
-
|
-
|
(16,765
)
|
(16,765
)
|
|
|
Changes
in non-controlling interest
|
-
|
-
|
-
|
-
|
-
|
-
|
-
|
-
|
-
|
-
|
9,000
|
9,000
|
|
|
Dividends
distribution to non-controlling interest
|
-
|
-
|
-
|
-
|
-
|
-
|
-
|
-
|
-
|
-
|
(5,371
)
|
(5,371
)
|
|
|
Capitalized
contributions
|
-
|
-
|
-
|
-
|
-
|
-
|
-
|
-
|
-
|
-
|
17
|
17
|
|
|
Issuance
of capital
|
-
|
-
|
-
|
-
|
-
|
-
|
-
|
-
|
-
|
-
|
7
|
7
|
|
|
Acquisition
of non-controlling interest
|
-
|
-
|
-
|
-
|
-
|
-
|
-
|
-
|
-
|
-
|
3
|
3
|
|
|
Balance as of June 30, 2018
|
482
|
20
|
9,786
|
10,592
|
91
|
373
|
5,179
|
6,124
|
20,589
|
53,236
|
123,218
|
176,454
|
|
(i) Includes Ps. 1
and Ps. 1 of inflation adjustment of Treasury shares as of June 30,
2018 and 2017, respectively.
(ii) Related to CNV
General Resolution N° 609/12. See Note 19.
(iii) Group’s
other reserves for the year ended June 30, 2018 were as
follows:
|
|
Cost of treasury shares
|
Changes in non-controlling interest
|
Reserve for currency translation adjustment
|
Reserve shared-based compensation
|
Revaluation surplus
|
Special reserve
|
Reserve for the acquisition of securities issued by the
Company
|
Other comprehensive income from subsidiaries
|
Other reserves from subsidiaries
|
Total other reserves
|
|
Balance as of June 30, 2017
|
(138
)
|
760
|
5,848
|
460
|
-
|
-
|
87
|
9
|
87
|
7,113
|
|
Other
comprehensive (loss) / income for the year
|
-
|
-
|
(389
)
|
-
|
196
|
-
|
-
|
-
|
(138
)
|
(331
)
|
|
Total comprehensive (loss) / income
for the year
|
-
|
-
|
(389
)
|
-
|
196
|
-
|
-
|
-
|
(138
)
|
(331
)
|
|
As resolved by Ordinary and Extraordinary Shareholders' Meeting
held on October 31, 2017
|
-
|
-
|
-
|
-
|
-
|
-
|
-
|
-
|
-
|
-
|
|
- Reserve for new developments
|
-
|
-
|
-
|
-
|
-
|
3,947
|
-
|
-
|
-
|
3,947
|
|
Purchase
own shares in portfolio
|
(1,779
)
|
-
|
-
|
-
|
-
|
-
|
-
|
-
|
-
|
(1,779
)
|
|
Share
of changes in subsidiaries' equity
|
-
|
(2,833
)
|
-
|
-
|
-
|
-
|
-
|
-
|
-
|
(2,833
)
|
|
Reserve
for share-based payments
|
-
|
-
|
-
|
7
|
-
|
-
|
-
|
-
|
-
|
7
|
|
Balance as of June 30, 2018
|
(1,917
)
|
(2,073
)
|
5,459
|
467
|
196
|
3,947
|
87
|
9
|
(51
)
|
6,124
|
The accompanying notes are an
integral part of these Consolidated Financial
Statements.
|
PRICE WATERHOUSE & CO. S.R.L.
(Socio)
|
|
)
|
|
)
|
|
C.P.C.E.C.A.B.A. T° 1 F° 17
Dr. Mariano C. Tomatis
Contador Público (UBA)
C.P.C.E.C.A.B.A. T° 241 F° 118
|
|
José Daniel Abelovich
Síndico Titular
Por Comisión Fiscalizadora
|
|
|
F-9
Cresud Sociedad Anónima,
Comercial, Inmobiliaria, Financiera y Agropecuaria
Consolidated Statements of Cash Flows
for the fiscal years ended June 30, 2020, 2019 and
2018
(All
amounts in millions of Argentine Pesos, except otherwise
indicated)
|
|
Note
|
06.30.20
|
06.30.19
|
06.30.18
|
|
Operating activities:
|
|
|
|
|
|
Net
cash generated from operating activities before income tax
paid
|
17
|
33,536
|
19,922
|
11,716
|
|
Income
tax paid
|
|
(650
)
|
(730
)
|
(1,686
)
|
|
Net cash generated from continuing operating
activities
|
|
32,886
|
19,192
|
10,030
|
|
Net
cash generated from discontinued operating activities
|
|
2,848
|
6,354
|
14,120
|
|
Net cash generated from operating activities
|
|
35,734
|
25,546
|
24,150
|
|
Investing activities:
|
|
|
|
|
|
(Increase)
/ Decrease of interest in associates and joint
ventures
|
|
-
|
(996
)
|
(576
)
|
|
Acquisition
of subsidiaries, net of funds acquire
|
|
(544
)
|
672
|
733
|
|
Decrease
in cash due to deconsolidation of subsidiaries
|
|
-
|
-
|
(344
)
|
|
Capital
contributions to associates and joint ventures
|
|
(2,852
)
|
(31
)
|
-
|
|
Acquisition,
improvements and advance payments for the development of investment
properties
|
|
(4,389
)
|
(6,430
)
|
(4,729
)
|
|
Proceeds
from sales of investment properties
|
|
13,402
|
1,462
|
887
|
|
Acquisitions
and improvements of property, plant and equipment
|
|
(6,116
)
|
(6,940
)
|
(6,557
)
|
|
Advance
payments
|
|
(79
)
|
(9
)
|
(51
)
|
|
Acquisition
of intangible assets
|
|
(4,043
)
|
(4,022
)
|
(1,668
)
|
|
Proceeds
from sales of property, plant and equipment
|
|
3,382
|
31
|
51
|
|
Net
decrease / (increase) of restricted assets, net
|
|
6,494
|
1,909
|
(7,226
)
|
|
Dividends
collected from associates and joint ventures
|
|
2,033
|
1,556
|
739
|
|
Proceeds
from sales of interest held in associates and joint
ventures
|
|
5,049
|
8,377
|
96
|
|
Proceeds
from loans granted
|
|
-
|
240
|
1,612
|
|
Acquisition
of investment in financial assets
|
|
(12,837
)
|
(57,996
)
|
(78,493
)
|
|
Proceeds
from disposal of investments in financial assets
|
|
36,619
|
78,765
|
73,775
|
|
Interest
collected from financial assets
|
|
728
|
-
|
-
|
|
Dividends
received
|
|
107
|
(24
)
|
367
|
|
Proceeds
/ (Payments) from other assets acquisition
|
|
28
|
-
|
(297
)
|
|
Loans
granted to related parties
|
|
(165
)
|
(6
)
|
(1,065
)
|
|
Loans
granted
|
|
(922
)
|
(130
)
|
(280
)
|
|
Advanced
proceeds from sales of farmlands
|
|
-
|
206
|
300
|
|
Farmlands
sale advance
|
|
-
|
-
|
209
|
|
Proceeds
from liquidation of associate
|
|
-
|
-
|
29
|
|
Cash
incorporated by business combination, net of cash paid
|
|
1,961
|
-
|
-
|
|
Net cash generated from / (used in) continuing investing
activities
|
|
37,856
|
16,634
|
(22,488
)
|
|
Net
cash (used in) / generated from discontinued investing
activities
|
|
2,455
|
(6,082
)
|
(9,065
)
|
|
Net cash generated from / (used in) investing
activities
|
|
40,311
|
10,552
|
(31,553
)
|
|
Financing activities:
|
|
|
|
|
|
Borrowings
and issuance of non-convertible notes
|
|
47,777
|
55,708
|
47,023
|
|
Payment
of borrowings and non-convertible notes
|
|
(72,590
)
|
(54,274
)
|
(45,233
)
|
|
Obtaining
/ (Payment) of short term loans, net
|
|
(2,459
)
|
2,248
|
1,661
|
|
Interest
paid
|
|
(21,909
)
|
(20,059
)
|
(14,266
)
|
|
Repurchase
of own shares
|
|
-
|
(1,228
)
|
(1,784
)
|
|
Repurchase
of non-convertible notes
|
|
(13,644
)
|
(8,291
)
|
(1,329
)
|
|
Capital
contributions from non-controlling interest in
subsidiaries
|
|
-
|
2,761
|
791
|
|
Acquisition
of non-controlling interest in subsidiaries
|
|
(602
)
|
(7,200
)
|
(1,634
)
|
|
Capital
distribution to subsidiaries non-controlling interest
|
|
-
|
-
|
(89
)
|
|
Proceeds
from sales of non-controlling interest in subsidiaries
|
|
379
|
13
|
6,933
|
|
Loans
received from associates and joint ventures, net
|
|
-
|
-
|
143
|
|
Issuance
of capital in subsidiaries
|
|
-
|
-
|
-
|
|
Dividends
paid to subsidiaries non-controlling interest
|
|
(1,997
)
|
(2,138
)
|
(4,363
)
|
|
Proceeds
from derivative financial instruments, net
|
|
(3,928
)
|
(726
)
|
(4
)
|
|
Payment
from derivative financial instruments
|
|
-
|
-
|
(147
)
|
|
Charge
for issue of shares and other equity instrument in
subsidiaries
|
|
1,897
|
-
|
40
|
|
Payment
of seller financing
|
|
-
|
(4
)
|
(224
)
|
|
Net cash (used in) /generated from continuing financing
activities
|
|
(67,076
)
|
(33,190
)
|
(12,482
)
|
|
Net
cash generated from / (used in) discontinued financing
activities
|
|
(5,548
)
|
7,455
|
8,473
|
|
Net cash (used in) / generated from financing
activities
|
|
(72,624
)
|
(25,735
)
|
(4,009
)
|
|
Net
(decrease) / increase in cash and cash equivalents from continuing
activities
|
|
3,666
|
2,636
|
(24,940
)
|
|
Net
(decrease) / increase in cash and cash equivalents from
discontinued activities
|
|
(245
)
|
7,727
|
13,528
|
|
Net (decrease) / increase in cash and cash equivalents
|
|
3,421
|
10,363
|
(11,412
)
|
|
Cash
and cash equivalents at beginning of the year
|
17
|
89,304
|
85,938
|
73,012
|
|
Cash
and cash equivalents reclassified as held-for-sale
|
|
(450
)
|
(242
)
|
(856
)
|
|
Foreign
exchange gain / (loss) and inflation adjustment on cash and changes
in fair value of cash equivalents
|
|
8,651
|
(6,755
)
|
25,194
|
|
Cash and cash equivalents at the end of the year
|
|
100,926
|
89,304
|
85,938
|
The accompanying notes are an integral
part of these Consolidated Financial Statements.
|
PRICE WATERHOUSE & CO. S.R.L.
(Socio)
|
|
)
|
|
)
|
|
C.P.C.E.C.A.B.A. T° 1 F° 17
Dr. Mariano C. Tomatis
Contador Público (UBA)
C.P.C.E.C.A.B.A. T° 241 F° 118
|
|
José Daniel Abelovich
Síndico
Titular
Por
Comisión Fiscalizadora
|
|
|
F-10
Cresud Sociedad Anónima,
Comercial, Inmobiliaria, Financiera y Agropecuaria
Notes to Consolidated Financial Statements
(Amounts
in millions, except otherwise indicated)
1.
The
Group’s business and general information
Cresud
was founded in 1936 as a subsidiary of Credit Foncier, a Belgian
company primarily engaged in providing rural and urban loans in
Argentina and administering real estate holdings foreclosed by
Credit Foncier. Credit Foncier was liquidated in 1959, and as part
of such liquidation, the shares of Cresud were distributed to
Credit Foncier’s shareholders. From the 1960s through the end
of the 1970s, the business of Cresud shifted exclusively to
agricultural activities.
In
2002, Cresud acquired a 19.85% interest in IRSA, a real estate
company related to certain shareholders of Cresud. In 2009, Cresud
increased its ownership percentage in IRSA to 55.64% and IRSA
became Cresud’s direct principal subsidiary.
Cresud
and its subsidiaries are collectively referred to hereinafter as
the Group.
Main
shareholders of the Company are jointly Inversiones Financieras del
Sur S.A. and Agroinvestment S.A. Both entities are companies
incorporated in Uruguay and belong to the same controlling group
and ultimate beneficiary.
The
Board of Directors has approved these Financial Statements for
issuance on November 16, 2020.
As of
June 30, 2020, the Group operates in two major lines of business:
(i) agricultural business and (ii) urban properties and investments
business, which is divided into two operations centers: (a)
Operations Center in Argentina and (b) Operations Center in Israel.
They are developed through several operating companies and the main
ones are listed below (Note 7):
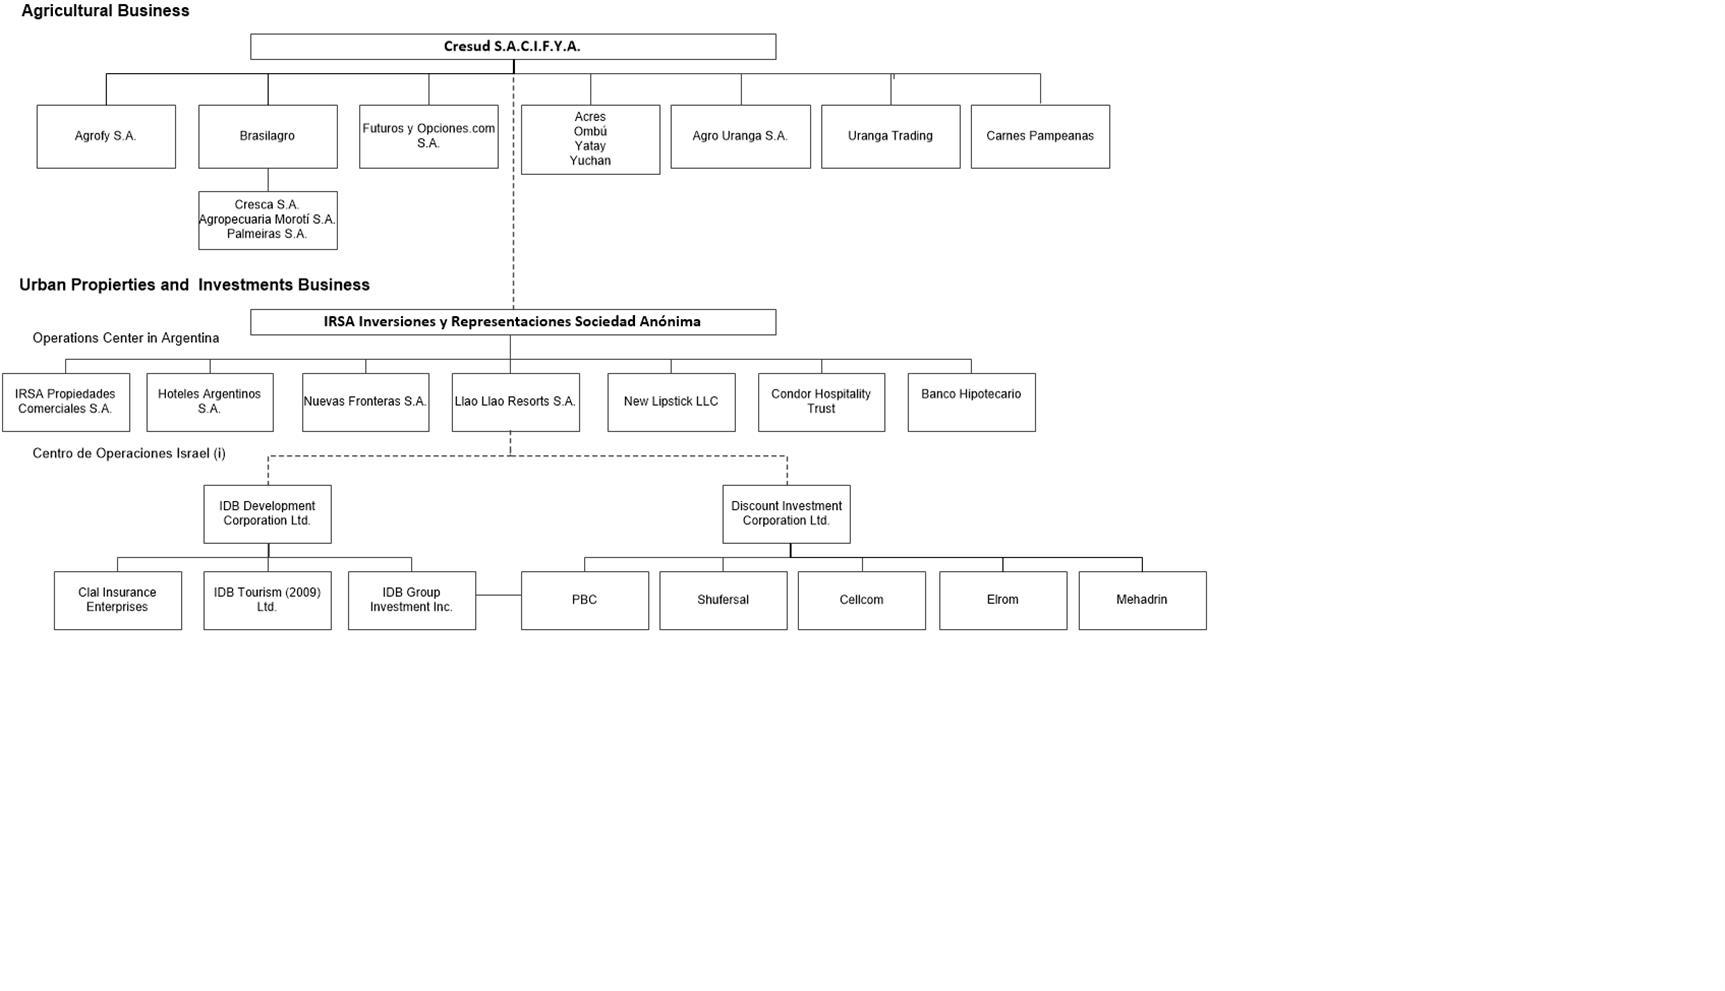
(i)
See Note 4 for more
information about the change within the Operations Center in
Israel.
F-11
Cresud Sociedad Anónima,
Comercial, Inmobiliaria, Financiera y Agropecuaria
Agricultural Business
Within
the agricultural business, the Group, through Cresud, engaged in
the operation of crop production, cattle feeding, raising,
fattening and slaughtering, milk production, sugarcane production,
brokerage activities and sale of supplies. The Group currently has
agricultural operations and investments in Argentina, Brazil,
Uruguay, Paraguay and Bolivia.
Cresud's shares are
listed on the BYMA (BYMA: CRES) and the NASDAQ (NASDAQ: CRESY). The
shares of our subsidiary Brasilagro are listed and traded on both
the Novo Mercado del BOVESPA (SAO: AGRO3) and the NYSE (NYSE:
LND).
Urban Properties and Investments Business
Operations
Center in Argentina
The
activities of the Operations Center in Argentina are mainly
developed through IRSA and its principal subsidiary, IRSA CP.
Through IRSA and IRSA CP, the Group owns, manages and develops 14
shopping malls across Argentina, a portfolio of offices and other
rental properties in the Autonomous City of Buenos Aires, and it
entered the United States of America (“USA”) real
estate market in 2009, mainly through the acquisition of
non-controlling interests in office buildings and hotels. Through
IRSA or IRSA CP, the Group also develops residential properties for
sale. The Group, through IRSA, is also involved in the operation of
branded hotels. The Group uses the term “real estate”
indistinctively in these Consolidated Financial Statements to
denote investment, development and/or trading properties
activities. IRSA CP's shares are listed and traded on both the BYMA
(BYMA: IRCP) and the NASDAQ (NASDAQ: IRCP). IRSA's shares are
listed on the BYMA (BYMA: IRSA) and the NYSE (NYSE:
IRSA).
The
activities of the Group’s “Others” segment is
carried out mainly through BHSA, where IRSA holds, directly or
indirectly, a 29.91% interest. BHSA is a commercial bank offering a
wide variety of banking activities and related financial services
to individuals, small and medium-sized companies and large
corporations, including the provision of mortgaged loans. BHSA's
shares are listed on the BYMA (BYMA: BHIP).
Operations
Center in Israel
The
activities of the Operations Center in Israel are mainly developed
through the subsidiaries, IDBD and DIC, whose activities correspond
to one of the Israeli largest and most diversified conglomerates,
which are involved, through its subsidiaries and other investments,
in several markets and industries, including real estate,
supermarkets, insurance, telecommunications, and others;
controlling or holding an equity interest in companies such as Clal
(Insurance), Cellcom (Telecommunications), Shufersal
(Supermarkets), PBC (Real Estate), among others. IDBD is listed in
the TASE as a “Debentures Company” in accordance with
Israeli law, since some series of bonds are traded in that
Exchange.
DIC
shares are listed in the TASE.
IDBD
and DIC have certain restrictions and financial agreements in
relation to their financial debt, including their debentures and
loans with banks and financial institutions. Regarding IDBD's
financial position, its cash flow and its ability to meet its
financial debt commitments, the following should be
considered:
As of June 30, 2020, IDBD
had a deficit in shareholders’
equity
,
ongoing negative cash flows from continuing
operating activities
and a low
credit rating, which circumstance may cast significant doubt about
IDBD´s ability to continue operating as a going concern.
IDBD´s cash flow required to meet its liabilities, including
short-term liabilities is based on the realization of assets wich
the realization date is not under IDBD´s control. These assets
include the current price of Clal’s shares and the impact
thereof on swap transaction deposits and the fact that IDBD shall
receive, among others, the proceeds from the sale of private
investments which are directly owned by IDBD.
As
of June 30, 2020, the aggregate principal amount of the (i) IDBD
Series 9 Bonds was NIS 901 million (“Series 9”), (ii)
IDBD Series 14 Bonds was NIS 889 million collateralized by DIC
shares owned directly or indirectly by IDBD representing 70% of the
share capital of DIC (“Series 14”), (iii) IDBD Series
15 Bonds was NIS 238 million collateralized by shares of Clal
representing 5% of the share capital of Clal (“Series
15”).
In
July 2019 and in June 2020, each of debenture holders (Series 9 and
Series 14) and debenture holders (Series 15), respectively, decided
to appoint a representative and legal and economic advisor, inter
alia, in order to maintain contact with IDBD and / or third parties
and to examine proposals that will be presented to the bondholders
in connection with the repayment of IDBD's obligations towards the
bondholders and to evaluate IDBD’s financial position and the
remedies which may be available to the debenture
holders.
In
June 2020, general meetings of the holders of IDBD's debentures
were convened (all of the series, each series separately), where a
resolution on the agenda was not to convene a general meeting on
the agenda of which would be the making of the debentures repayable
immediately. The meetings of the debenture holders (Series 9 and
Series 15), each decided to pass the said resolution; The meeting
of the debenture holders (Series 14), decided not to pass the
said resolution, and a later stage to instruct the trustee for
debenture holders (Series 14) to postpone the date of the said
meeting to September 17, 2020;
In
July 2020, Dolphin Netherlands and the controlling interest
therein, Mr. Eduardo Elsztain committed vis-à-vis the
generality of the debenture holders in IDBD, that subject to
defined terms and conditions, during a certain period of time, some
transactions will not be executed and/or initiated and/or promoted,
and that subject to the provisions of the law, the power of control
in corporations that are controlled by the controlling interest in
IDBD will not be operated in order to promote any of those actions,
unless notification has been delivered in writing to the trustees
for debenture holders (Series 9, 14 and 15), at least 14 business
days in advance.
On August 31, 2019, IDBD 's Audit Committee and
the Board of Directors approved the acceptance of an irrevocable
commitment by Dolphin Netherlands B.V. (“Dolphin
Netherland”), the controlling interest in IDBD, to make
capital injections into IDBD in an overall amount of NIS 210
million, in three equal annual payments
on
September 2 in each of the years 2019 to 2021, which would be made
in consideration for shares in IDBD or as a subordinated loan on
similar terms to the subordinated loans that had been provided by
the controlling interest.
F-12
Cresud Sociedad Anónima,
Comercial, Inmobiliaria, Financiera y Agropecuaria
In August 2020, IDBD received a letter from
Dolphin Netherlands stating, inter alia, that given the fact that
some of IDBD's bondholders are expected to include in their agenda
for the bondholder's meetings, a proposal to make the outstanding
balances of their bonds immediately due and payable, in preparation
for the additional inflow of NIS 70 million scheduled for September
2, 2020, Dolphin Netherlands would examine its undertaking
towards
IDBD, taking into account the
questions that arise from IDBD’s bondholders conducts and
intentions. To the said Dolphin Netherlands' letter was attached a
letter from IRSA to Dolphin Netherlands, according to which, among
other things, IRSA will consider the validity of its undertaking to
Dolphin Netherlands to transfer to it (in accordance with Dolphin
Netherlands request) the amounts required for Dolphin Netherlands
to meet its commitment to carry out the capital injections into
IDBD on September 2, 2020, as aforementioned.
IDBD responded to Dolphin Netherlands’ and
IRSA’s letters, noting that, among other things, Dolphin
Netherlands'
commitment (dated
August 29, 2019) towards
IDBD
is binding and
irrevocable
, and that there is
no basis for not making the capital injections into IDBD, due to
other events related to IDBD’s bondholders, which do not fall
within the scope of the events listed in the wording of the
commitment as expropriating the validity of Dolphin Netherlands'
commitment. In addition, it was also mentioned in IDBD’s
response letter, that failure to make the payments into IDBD is not
acceptable and will leave IDBD with no other choice than to use all
its power and rights according to the law to enforce Dolphin
Netherlands' commitment as well as IRSA’s
undertaking.
Following
the above mentioned, on September 13, 2020, IDBD submitted a
statement of claim against Dolphin Netherlands and against IRSA, in
which it has sought to require them to pay it an amount of NIS 70
million (with the addition of linkage differentials and interest in
accordance with the law). In tandem with the submission of the
lawsuit, as aforesaid, IDBD submitted an urgent petition for
placing temporary attachments (in the presence of one party) on
Dolphin Netherlands and IRSA (which was not accepted by the Court
in the presence of one party and which has been passed on for the
respondents to respond to the petition).
On
June 2, 2020, IDBD received a draft proposal from Dolphin IL for
IDBD and for the trustees for IDBD’s debentures (Series 9, 14
and 15) for the strengthening of IDBD 's capital structure, by way
of an arrangement between Dolphin, IDBD and the debenture holders,
based on an economic contribution to IDBD on Dolphin IL's part,
together with a full or partial (as the case may be) redemption of
the generality of IDBD's debentures;On June 21, 2020, IDBD received
an updated proposal in relation to the abovementioned proposal and
on June 28, 2020, Dolphin IL approached each of the trustees for
the debentures with a request to put said proposal, with slight
amendments, on the agenda of meetings of the debenture
holders.
On July 6, 2020, the Meeting of debenture holders
(Series 9) decided to order the trustee for debenture holders
(Series 9) not to accept Dolphin IL's offer
;
On July 7, 2020, the Meeting of the debenture
holders (Series 14) decided to negotiate for a fixed period of one
month in connection with Dolphin IL's proposal, and on July 8,
2020, the Meeting of debenture holders (Series 15) made a similar
decision.
On September 2, 2020 IDBD
received an updated offer from Dolphin IL which was addressed to it
and to IDBD’s debenture holders (Series 9, 14 and 15);On
September 9, 2020, Dolphin IL updated the commercial terms of its
proposal for debenture holders (Series 9), and on September 16,
2020, IDBD received binding offers to debenture holders (Series 14)
and debenture holders (Series 15), for the purchase of DIC shares
pledged in favor of debenture holders (Series 14) of IDBD, as part
of an agreed realization process
.
As
no agreement has been reached, on September 17, 2020, the Series 9
trustee submitted to the District Court in Tel-Aviv-Jaffa (the
"Court") a petition to grant an order for the opening of
proceedings for IDBD pursuant to the Insolvency and Economic
Rehabilitation Law, 5778 – 2018 and to instruct the
appointment of a trustee for IDBD pursuant to Section 43 and to
grant the trustee any and all authority over the decision making of
IDBD.
On
September 21, 2020, the Series 14 bond holders approved the
immediate fully payment of the remaining balances of such
serie.
On
September 22, 2020, IDBD and Dolphin Netherlands B.V. submitted an
initial response to the Petition, arguing that it is in the best
interest of IDBD and its creditors to exhaust the negotiations
among the controlling shareholder and its creditors during a short
period with the aim to maximize the value of its assets, avoid
costs and additional negative effects.
In
addition, responses by the Series 14 trustee and the Series 15
trustee were filed requesting the enforcement of liens and the
appointment of a receiver as well as an urgent hearing, which was
scheduled for September 24, 2020.
On
September 25, 2020, the Court resolved that IDBD is insolvent and
therefore it resolved to grant all three orders requested and
accordingly, issued an order for the initiation of proceedings and
liquidation of IDBD, and has appointed a liquidator to IDBD and
interim receivers over the Pledged DIC and Clal
Shares.
Under
IFRS 10 “Consolidated Financial Statements”
(“IFRS 10”),
an investor controls
an investee if and only if the investor has all the following: a)
power over the investee; b) exposure, or rights, to variable
returns from its involvement with the investee; and c) the ability
to use its power over the investee to affect the amount of the
investor’s returns
. Based
on the facts and circumstances outlined above, our management
believe that, as from September 25, 2020, IRSA lost control over
IDBD and DIC (as this term is defined by IFRS 10). Accordingly, our
investment in IDBD and DIC will be deconsolidated in our financial
statements as of and for the three-month period ended September 30,
2020.
The
assets and liabilities from the Israel Business Center have been
consolidated line by line in these financial statements, totaling a
net value attributable to the controlling shareholders of Ps.
2,006 as of june 30, 2020. In addition negative currency
translation adjustment reserve amounting to Ps. 1,537 will be
expensed upon deconsolidation.
The
assets and liabilities consolidated in this financial statement are
as follow:
Current
assets: Ps. 188,619
Non-current
assets: Ps. 255,865
Current
liabilities: Ps. 101,927
Non-current
liabilities: Ps. 299,150
Total
equity: Ps. 43,407
Equity
Attributable to equity holders of the parent: Ps.
2,006
The
commitments and other restrictions resulting from the indebtedness
of IDBD and DIC have no effect on IRSA since said indebtedness has
no recourse against IRSA, nor has IRSA guaranteed it with its
assets.
2.
Summary
of significant accounting policies
2.1.
Basis
of preparation of the Consolidated Financial Statement
(a)
Basis
of preparation
These
Consolidated Financial Statements have been prepared in accordance
with IFRS issued by IASB and interpretations issued by the IFRIC.
All IFRS applicable as of the date of these Consolidated Financial
Statements have been applied.
IAS 29
"Financial Reporting in Hyperinflationary Economies" requires that
the financial statements of an entity whose functional currency is
one of a hyperinflationary economy be expressed in terms of the
current unit of measurement at the closing date of the reporting
period, regardless of whether they are based on the historical cost
method or the current cost method. To do so, in general terms, the
inflation produced from the date of acquisition or from the
revaluation date, as applicable, must be calculated in the
non-monetary items. This requirement also includes the comparative
information of the financial statements.
In
order to conclude on whether an economy is categorized as
hyper-inflationary in the terms of IAS 29, the standard details a
series of factors to be considered, including the existence of an
accumulated inflation rate in three years that is approximate or
exceeds 100%. Accumulated inflation in Argentina in the last three
years is over 100%. It is for this reason that, in accordance with
IAS 29, Argentina must be considered a country with high inflation
economy starting July 1, 2018.
In
addition, Law No. 27,468 (published in the Official Gazette on
December 4, 2018), amended Section 10 of Law No. 23,928, as
amended, and established that the derogation of all the laws or
regulations imposing or authorizing price indexation, monetary
restatement, cost variation or any other method for strengthening
debts, taxes, prices or rates of goods, works or services, does not
extend to financial statements, as to which the provisions of
Section 62 of the General Companies Law No. 19,550 (1984 revision),
as amended, shall continue to apply. Moreover, the referred law
repealed Decree No. 1269/2002 dated July 16, 2002, as amended, and
delegated to the Argentine Executive Branch the power to establish,
through its controlling agencies, the effective date of the
referred provisions in connection with the financial statements
filed with it. Therefore, under General Resolution 777/2018
(published in the Official Gazette on December 28, 2018) the
Argentine Securities Commission (CNV) ordered that issuers subject
to its supervision shall apply the inflation adjustment to reflect
the financial statements in terms of the measuring unit current at
the end of the reporting period set forth in IAS 29 in their
annual, interim and special financial statements closed on or after
December 31, 2018. Thus, these financial statements have been
reported in terms of the measuring unit current as of June 30, 2020
accordingly to IAS 29.
Pursuant to IAS 29,
the financial statements of an entity whose functional currency is
that of a high inflationary economy should be reported in terms of
the measuring unit current as of the reporting date of the
financial statements. All the amounts included in the statement of
financial position which are not stated in terms of the measuring
unit current as of the date of the financial statements should be
restated applying the general price index. All items in the
statement of income should be stated in terms of the measuring unit
current as of the date of the financial statements, applying
the
F-13
Cresud Sociedad Anónima,
Comercial, Inmobiliaria, Financiera y Agropecuaria
changes
in the general price index occurred from the date on which the
revenues and expenses were originally recognized in the financial
statements.
Adjustment for
inflation in the initial balances has been calculated considering
the indexes reported by the FACPCE based on the price indexes
published by the Argentine Institute of Statistics and Census
(INDEC).
The
principal inflation adjustment procedures are the
following:
-
Monetary assets and
liabilities that are already recorded at the measuring unit as of
the balance sheet’s closing date are not restated because
they are already stated in terms of the measuring unit current as
of the date of the financial statements.
-
Non-monetary
assets, and liabilities and equity component are recorded at
restated cost as of the balance sheet date.
-
All items in the
statement of income are restated applying the relevant conversion
factors.
-
The effect of
inflation in the Company’s net monetary position is included
in the statement of income under Financial results, net, in the
item “Inflation adjustment”.
-
Comparative figures
have been adjusted for inflation following the procedure explained
in the previous paragraphs.
Upon
initially applying inflation adjustment, the equity accounts were
restated as follows:
-
Capital was
restated as from the date of subscription or the date of the most
recent inflation adjustment for accounting purposes, whichever is
later.
-
The resulting
amount was included in the “Comprehensive Inflation
adjustment of share capital and treasury shares adjustment”
account.
-
Other comprehensive
income / (loss) was restated as from each accounting
allocation.
-
The other reserves
in the statement of income were restated from the initial
application date, i.e., June 30, 2016.
In
relation to the inflation index to be used and in accordance with
the FACPCE Resolution No. 539/18, it will be determined based on
the Wholesale Price Index (IPIM) until 2016, considering for the
months of November and December 2015 the average variation of
Consumer Price indices (CPI) of the Autonomous City of Buenos
Aires, because during those two months there were no national IPIM
measurements. Then, from January 2017, the National Consumer Price
Index (National CPI) will be considered. The tables below show the
evolution of these indices in the last two fiscal years and as of
June 30, 2020 according to official statistics (INDEC) following
the guidelines described in Resolution 539/18:
|
Price
variation
|
June
30, 2018
|
June
30, 2019
|
June
30, 2020
|
Cumulative
as of June 30,2020 (3 years)
|
|
Annual
|
29
%
|
56
%
|
43
%
|
128
%
|
As a
consequence of the aforementioned, these financial statements as of
June 30, 2020 were restated in accordance with IAS 29.
IDBD
and DIC report their quarterly and annual results following the
Israeli regulations, whose legal deadlines are after the deadlines
in Argentina and since IDBD and DIC fiscal years end differently
from IRSA, the results of operations from IDBD and DIC are
consolidated with a lag of three months and adjusted for the
effects of significant transactions taking place in such period.
For these reasons, it is possible to obtain the quarterly results
of IDBD and DIC in time so that they can be consolidated by IRSA
and reported to the CNV in its consolidated financial statements
within the legal deadlines set in Argentina. This way, the Group's
consolidated comprehensive income for the year ended June 30, 2020
includes the results of IDBD and DIC for the 12-month period from
April 1, 2019 to March 31, 2020, adjusted for the significant
transactions that occurred between April 1, 2020 and June 30,
2020.
(b)
Current
and non-current classification
The
Group presents current and non-current assets, and current and
non-current liabilities, as separate classifications in its
Statement of Financial Position according to the operating cycle of
each activity. Current assets and current liabilities include the
assets and liabilities that are either realized or settled within
12 months from the end of the fiscal year.
All
other assets and liabilities are classified as non-current. Current
and deferred tax assets and liabilities (income tax liabilities)
are presented separately from each other and from other assets and
liabilities, classified as current and non-current,
respectively.
F-14
Cresud Sociedad Anónima,
Comercial, Inmobiliaria, Financiera y Agropecuaria
(c)
Presentation
currency
The
Consolidated Financial Statements are presented in millions of
Argentine Pesos. Unless otherwise stated or the context otherwise
requires, references to ‘Peso amounts’ or
‘Ps.’, are millions of Argentine Pesos, references to
‘US$’ or ‘US Dollars’ are millions of US
Dollars, references to ‘Rs.’ are millions of Brazilian
Reals and references to "NIS" are millions of New Israeli Shekel.
As of June 30, 2020 and 2019, the exchange rate between the
Argentine Peso and the NIS was Ps. 20.34 and Ps. 11.93 per NIS
respectively.
(d)
Fiscal
year-end
The
fiscal year begins on July 1st and ends on June 30 of each
year.
(e)
Accounting
criteria
See
Notes 2.2 through 2.31 with the accounting policies of each
item.
(f)
Reporting
cash flows
The
Group reports operating activities cash flows using the indirect
method. Interest paid is presented within financing activities.
Interest received is presented within investing activities. The
acquisitions and disposals of investment properties are disclosed
within investing activities as this most appropriately reflects the
Group’s business activities. Cash flows in respect to trading
properties are disclosed within operating activities because these
items are sold in the ordinary course of business.
(g)
Use
of estimates
The
preparation of Financial Statements at a certain date requires the
Management to make estimations and evaluations affecting the amount
of assets and liabilities recorded and contingent assets and
liabilities disclosed at such date, as well as income and expenses
recorded during the year. Actual results might differ from the
estimates and evaluations made at the date of preparation of these
Consolidated Financial Statements. The most significant judgments
made by Management in applying the Group’s accounting
policies and the major estimations and significant judgments are
described in Note 3.
2.2
New
accounting standards and amendments
The
following standards and amendments have been issued by the IASB.
Below we outline the standards and amendments that may potentially
have an impact on the Group at the time of
application.
Standards and amendments adopted by the Group
|
Standards
and amendments
|
Description
|
Date
of mandatory adoption for the Group in the year ended
on
|
|
IFRS 16
"Leases".
|
Lessees are
required to account for all leases under one single model in the
balance sheet that is similar to the one used to account for
financial leases under IAS 17, including two exceptions for the
recognition of leases; low-cost asset leases and short-term leases.
Accounting by the lessor has no significant changes.
|
06-30- 2020
|
|
Amendment to
IAS 28 “Investment in associates and joint
ventures”
|
Requires the
adoption of IFRS 9 regarding long-term investments that are
essentially part of the net investment of an entity in an associate
or joint venture.
|
06-30- 2020
|
|
Definition of
Material - Amendments to IAS 1 and IAS 8
|
The IASB has
made modifications to IAS 1 “Presentation of Financial
Statements” and IAS 8“Accounting policies, changes in
accounting estimates and errors” which requires that the
assessment of materiality be consistent for the application of
IFRS.
|
06-30-2020
|
|
Defining a business
- Amendments to IFRS 3
|
The new business
definition requires that a business combination contribute
significantly to creating products or services.
|
06-30-2020
|
|
Amendments to IAS
19- Plan amendment, curtailment or settlement.
|
Clarifies the
accounting for defined benefit plan amendments, curtailments or
settlements. The amendments require an entity to: (i) determine
current service cost and net interest for the remainder of the
period after a plan amendment, curtailment or settlement, using
updated assumptions at the time of the amendment; (ii) recognize
any reduction in a surplus immediately in gains or losses, as part
of past service cost or a gain or loss on settlement. In other
words, any surplus reduction must be recognized, even if that
surplus was not previously recognized because of the impact of the
asset ceiling; and (iii) separately recognize any change in the
asset ceiling through other comprehensive income.
|
06-30-2019
|
F-15
Cresud Sociedad Anónima,
Comercial, Inmobiliaria, Financiera y Agropecuaria
The
adoption of these standards and amendments have not had a material
impact for the Group, except for the following:
●
IFRS
16: Leases
The
standard allows excluding the short-term contracts (under 12
months) and those in which the underlying asset has low value, such
option has been adopted by the Group. Likewise, the Group has opted
to recognize as consideration for the right of use, the amount of
Ps. 16,797 as lease liabilities. The commitments under operating
leases reported in our consolidated financial statements as of June
30, 2019, amounted to Ps. 18.395 (such difference mainly
corresponds to the effect of the discount from future payments and
the excluded short-term contracts).
●
Modification
to IAS 28 “Investment in associates and joint
ventures”
In
accordance with the amendment to IAS 28, an entity shall implement
the provisions of IFRS 9 to Long-term Investments that are
essentially part of the entity's net investment in the associate or
in the joint venture according to the definitions of said standard.
The provisions of IFRS 9 shall apply to such investments with
respect to the participation in the losses of an associate or a
joint venture, as well as with respect to the recognition of the
impairment of an investment in an associate or joint venture. In
addition, when applying IFRS 9 to such long-term investments, the
entity will make it prior to the adjustments made to the carrying
amount of the investment in accordance with IAS 28.
The
Group opted for an accounting policy where the currency translation
adjustments arising from these loans are recorded as part of other
comprehensive income.
The
effect on retained earnings as of July 1, 2019 arising from the
initial adoption of IFRS 16 and IAS 28 is as follows:
|
|
IFRS 16 impact
|
IAS 28 impact
|
Total
|
|
ASSETS
|
|
|
|
|
Non-current assets
|
|
|
|
|
Investment
properties
|
426
|
-
|
426
|
|
Right-of-use
assets
|
16,374
|
-
|
16,374
|
|
Investments
in associates and joint ventures
|
-
|
(1,979
)
|
(1,979
)
|
|
Trade
and other receivables
|
81
|
-
|
81
|
|
Total non-current assets
|
16,881
|
(1,979
)
|
14,902
|
|
Income
tax and MPIT credit
|
17
|
-
|
17
|
|
Group
of assets held for sale
|
3,121
|
-
|
3,121
|
|
Trade
and other receivables
|
(169
)
|
-
|
(169
)
|
|
Total current assets
|
2,969
|
-
|
2,969
|
|
TOTAL ASSETS
|
19,850
|
(1,979
)
|
17,871
|
|
SHAREHOLDERS’ EQUITY
|
|
|
|
|
Shareholders' equity attributable to equity holders of the
parent
|
|
|
|
|
Retained
earnings
|
(117
)
|
(697
)
|
(814
)
|
|
Non-controlling
interest
|
(70
)
|
(1,282
)
|
(1,352
)
|
|
TOTAL SHAREHOLDERS’ EQUITY
|
(187
)
|
(1,979
)
|
(2,166
)
|
|
LIABILITIES
|
|
|
|
|
Non-current liabilities
|
|
|
|
|
Lease
liabilities
|
12,221
|
-
|
12,221
|
|
Total non-current liabilities
|
12,221
|
-
|
12,221
|
|
Current liabilities
|
|
|
|
|
Lease
liabilities
|
4,574
|
-
|
4,574
|
|
Trade
and other payables
|
(68
)
|
-
|
(68
)
|
|
Group
of liabilities held for sale
|
3,310
|
-
|
3,310
|
|
Total current liabilities
|
7,816
|
-
|
7,816
|
|
TOTAL LIABILITIES
|
20,037
|
-
|
20,037
|
|
TOTAL SHAREHOLDERS’ EQUITY AND LIABILITIES
|
19,850
|
(1,979
)
|
17,871
|
The
Group applied the cumulative effect approach, therefore,
accumulated impact was recognized in retained earnings as of July
1, 2018. Comparative figures were not restated.
F-16
Cresud Sociedad Anónima,
Comercial, Inmobiliaria, Financiera y Agropecuaria
Standards and amendments not yet adopted by the Group
|
Standards
and amendments
|
Description
|
Date
of mandatory adoption for the Group in the year ended
on
|
|
Covid-19- related lease concessions – Amendments to IFRS
16
|
As a result of the
COVID-19 pandemic, lessees have been granted lease concessions.
Such concessions may take a variety of forms, including forgiveness
or deferral of rental payments. In May 2020, the IASB amended IFRS
16 – Leases, whereby lessees are permitted to account for the
rent concessions as if they were not lease modifications. In
several cases, this will result in such concessions being accounted
for as variable rent payments within the term same period in which
they are granted.
|
06-30- 2021
|
|
Property, Plant and Equipment: Proceeds before Intended Use
– Amendments to IAS 16
|
Amendment to IAS 16
– Property, Plant and Equipment (PP&E) prohibits
deducting from the cost of an item of property, plant and equipment
any proceeds from selling items produced while the entity is
preparing the asset for its intended use. It also specifies that an
entity is “testing whether an item of PPE is functioning
properly” when it assesses its technical and physical
performance. The financial performance of the asset is not relevant
for such assessment.
|
06-30- 2023
|
|
Reference to the Conceptual Framework – Amendments to IFRS
3
|
Some minor
amendments were made to IFRS 3 Business combinations to update
references to the Conceptual Framework for financial information
and add an exception to the recognition principles for liabilities
and contingent liabilities within the scope of IAS 37, Provisions,
Contingent liabilities and contingent assets and interpretation 21
Levies. The amendments also confirm that contingent assets should
not be recognized on the acquisition date.
|
06-30-2023
|
|
Annual Improvements to IFRS 2018-2020
|
The following
improvements were issued in May 2020:
IFRS 9 Financial
instruments. The amendment clarifies which fees an entity includes
when it applies the ‘10 per cent’ test in assessing
whether to derecognize a financial liability.
IFRS 16 Leases. The
amendment to Illustrative Example 13 removes from the example the
illustration of the reimbursement of leasehold improvements by the
lessor in order to resolve any potential confusion regarding the
treatment of lease incentives that might arise.
IFRS 1 First-time
adoption of International Financial Reporting Standards: Entities
that have measured their assets and liabilities at the carrying
amounts in their parents´ books are also allowed to measure
cumulative translation differences using the amounts reported by
their parents. This amendment will also apply to associated and
joint ventures that have also taken the IFRS 1
exemption.
IAS 41: This
amendment removes the requirement for entities to exclude taxation
cash flows when measuring the fair value pursuant to IAS 41. This
amendment is intended to align with the requirement in the standard
to discount cash flows on a post-tax basis.
|
06-30-2023
|
The
future adoption of these standards and amendments will not have a
significant impact to the Group.
At the
date of issuance of these consolidated financial statements, there
are no other standards or modifications issued by the IASB that are
not yet effective and are expected to have a significant effect on
the Group.
2.3
Scope
of consolidation
(a)
Subsidiaries
Subsidiaries are
all entities (including structured entities) over which the Group
has control. The Group controls an entity when the Group is exposed
to, or has rights to variable returns from its involvement with the
entity and has the ability to affect those returns through its
power over the entity. The Group also analyzes whether there is
control when it does not hold more than 50% of the voting rights of
an entity, but does have capacity to define its relevant activities
because of de-facto control.
The
Group uses the acquisition method of accounting to account for
business combinations. The consideration transferred for the
acquisition of a subsidiary is the fair value of the assets
transferred, the liabilities incurred and the equity interests
issued by the Group. Acquisition-related costs are expensed as
incurred. Identifiable assets acquired and liabilities and
contingent liabilities assumed in a business combination are
measured initially at their fair values at the acquisition
date.
The
Group recognizes any non-controlling interest in the acquiree on an
acquisition-by-acquisition basis either at fair value or at the
non-controlling interest’s proportionate share of the
acquirer’s net assets. The Group chooses the method to be
used on a case-by-case basis.
The
excess of the sum of the consideration transferred the amount of
any non-controlling interest in the acquiree and the
acquisition-date fair value of any previous equity interest in the
acquiree over the fair value of the identifiable net assets
acquired is recorded as goodwill. If the total of consideration
transferred, non-controlling interest recognized and previously
held interest measured is less than the fair value of the net
assets of the subsidiary acquired in the case of a bargain
purchase, the difference is recognized directly in the Statement of
Income as “Bargain purchase gains”.
F-17
Cresud Sociedad Anónima,
Comercial, Inmobiliaria, Financiera y Agropecuaria
The
Group conducts its business through several operating and
investment companies, the principal are listed below:
Agricultural
Business
|
|
|
|
% of ownership interest held by the Group
|
||
|
Name of the entity
|
Country
|
Principal activity
|
06.30.20
|
06.30.19
|
06.30.18
|
|
Cresud's direct equity interest in:
|
|
|
|
|
|
|
Brasilagro-CompanhIa
Brasileira de Propriedades Agrícolas (1) (2)
|
Brazil
|
Agricultural
|
33.55
%
|
43.29
%
|
43.29
%
|
|
Sociedad
Anónima Carnes Pampeanas S.A. (2)
|
Argentina
|
Agro-industrial
|
100.00
%
|
100.00
%
|
100.00
%
|
|
Futuros
y Opciones.Com S.A.
|
Argentina
|
Brokerage
|
50.10
%
|
50.10
%
|
50.10
%
|
|
Helmir
S.A.
|
Uruguay
|
Investment
|
100.00
%
|
100.00
%
|
100.00
%
|
|
IRSA
Inversiones y Representaciones Sociedad Anónima
(2)
|
Argentina
|
Real
estate
|
61.95
%
|
62.35
%
|
63.74
%
|
|
Agropecuaria
Santa Cruz S.A.
|
Uruguay
|
Investment
|
100.00
%
|
100.00
%
|
100.00
%
|
|
Brasilagro's direct equity interest in:
|
|
|
|
|
|
|
Araucária
Ltda.
|
Brazil
|
Agricultural
|
99.99
%
|
99.99
%
|
99.99
%
|
|
Cajueiro
Ltda.
|
Brazil
|
Agricultural
|
99.99
%
|
99.99
%
|
99.99
%
|
|
Ceibo
Ltda.
|
Brazil
|
Agricultural
|
99.99
%
|
99.99
%
|
99.99
%
|
|
Cremaq
Ltda.
|
Brazil
|
Agricultural
|
99.99
%
|
99.99
%
|
99.99
%
|
|
Engenho
de Maracajú Ltda.
|
Brazil
|
Agricultural
|
99.99
%
|
99.99
%
|
99.99
%
|
|
Flamboyant
Ltda.
|
Brazil
|
Agricultural
|
99.99
%
|
99.99
%
|
99.99
%
|
|
Jaborandi
Agrícola Ltda.
|
Brazil
|
Agricultural
|
99.99
%
|
99.99
%
|
99.99
%
|
|
Jaborandi
Propriedades Agrícolas S.A.
|
Brazil
|
Agricultural
|
99.99
%
|
99.99
%
|
99.99
%
|
|
Mogno
Ltda.
|
Brazil
|
Agricultural
|
99.99
%
|
99.99
%
|
99.99
%
|
|
Palmeiras
S.A.
|
Paraguay
|
Agricultural
|
99.99
%
|
99.99
%
|
99.99
%
|
|
Agropecuaria
Morotí S.A.
|
Paraguay
|
Agricultural
|
99.99
%
|
99.99
%
|
99.99
%
|
|
Agrifirma
S.A.
|
Brazil
|
Agricultural
|
99.99
%
|
-
|
-
|
|
Futuros y Opciones.Com. S.A.'s direct equity interest
in:
|
|
|
|
|
|
|
Amauta
Agro S.A. (3)
|
Argentina
|
Brokerage
|
98.57
%
|
98.57
%
|
98.57
%
|
|
FyO
Acopio S.A. (3)
|
Argentina
|
Warehousing
and brokerage
|
98.57
%
|
98.57
%
|
98.57
%
|
|
FyO
Chile SPA
|
Chile
|
Brokerage
|
100.00
%
|
100.00
%
|
100.00
%
|
|
Agropecuaria Santa Cruz S.A.'s direct equity interest
in:
|
|
|
|
|
|
|
Agropecuaria
Acres del Sud S.A. (2)
|
Bolivia
|
Agricultural
|
100.00
%
|
100.00
%
|
100.00
%
|
|
Ombú
Agropecuaria S.A.
|
Bolivia
|
Agricultural
|
100.00
%
|
100.00
%
|
100.00
%
|
|
Yatay
Agropecuaria S.A.
|
Bolivia
|
Agricultural
|
100.00
%
|
100.00
%
|
100.00
%
|
|
Yuchán
Agropecuaria S.A. (2)
|
Bolivia
|
Agricultural
|
100.00
%
|
100.00
%
|
100.00
%
|
|
Sedelor
S.A.
|
Uruguay
|
Investment
|
100.00
%
|
100.00
%
|
100.00
%
|
|
Codalis
S.A.
|
Uruguay
|
Investment
|
100.00
%
|
100.00
%
|
100.00
%
|
|
Alafox
S.A.
|
Uruguay
|
Investment
|
100.00
%
|
100.00
%
|
100.00
%
|
(1)
The Group exercises
“de facto control” over Brasilagro as a result of (i)
the percentage and concentration of voting rights of the Group, as
well as the potential voting rights of the warrants held by the
Group, and the absence of other shareholders with significant
voting rights, (ii) the absence of a voting agreement among the
other shareholders to vote together as a group, (iii) the record of
attendance to Shareholders’ Meetings and the record of votes
casted by the other shareholders; and (iv) the effective control
exercised by the Group to direct Brasilagro’s relevant
activities through its seat in the Board of Directors. See Note 7
for further information regarding to Brasilagro.
(2)
Includes interest
indirectly held through Helmir.
(3)
Includes interest
directly held through Cresud.
Urban
Properties and Investments Business
|
|
|
|
% of ownership interest held by the Group
|
||
|
Name of the entity
|
Country
|
Principal activity
|
06.30.20
|
06.30.19
|
06.30.18
|
|
IRSA's direct equity interest:
|
|
|
|
|
|
|
IRSA
CP (1)
|
Argentina
|
Real
estate
|
80.65
%
|
83.80
%
|
86.34
%
|
|
E-Commerce
Latina S.A.
|
Argentina
|
Investment
|
100.00
%
|
100.00
%
|
100.00
%
|
|
Efanur
S.A.
|
Uruguay
|
Investment
|
100.00
%
|
100.00
%
|
100.00
%
|
|
Hoteles
Argentinos S.A.U.
|
Argentina
|
Hotel
|
100.00
%
|
100.00
%
|
80.00
%
|
|
Inversora
Bolívar S.A.
|
Argentina
|
Investment
|
100.00
%
|
100.00
%
|
100.00
%
|
|
Llao
Llao Resorts S.A. (2)
|
Argentina
|
Hotel
|
50.00
%
|
50.00
%
|
50.00
%
|
|
Nuevas
Fronteras S.A.
|
Argentina
|
Hotel
|
76.34
%
|
76.34
%
|
76.34
%
|
|
Palermo
Invest S.A.
|
Argentina
|
Investment
|
100.00
%
|
100.00
%
|
100.00
%
|
|
Ritelco
S.A.
|
Uruguay
|
Investment
|
100.00
%
|
100.00
%
|
100.00
%
|
|
Tyrus
S.A.
|
Uruguay
|
Investment
|
100.00
%
|
100.00
%
|
100.00
%
|
|
UT
IRSA y Galerías Pacífico S.A. (2)
|
Argentina
|
Investment
|
50.00
%
|
50.00
%
|
50.00
%
|
|
IRSA CP's direct equity interest in:
|
|
|
|
|
|
|
Arcos
del Gourmet S.A.
|
Argentina
|
Real
estate
|
90.00
%
|
90.00
%
|
90.00
%
|
|
Emprendimiento
Recoleta S.A.
|
Argentina
|
Real
estate
|
53.68
%
|
53.68
%
|
53.68
%
|
|
Fibesa
S.A. (3)
|
Argentina
|
Real
estate
|
100.00
%
|
100.00
%
|
100.00
%
|
|
Panamerican
Mall S.A.
|
Argentina
|
Real
estate
|
80.00
%
|
80.00
%
|
80.00
%
|
|
Shopping
Neuquén S.A.
|
Argentina
|
Real
estate
|
99.95
%
|
99.95
%
|
99.92
%
|
|
Torodur
S.A.
|
Uruguay
|
Investment
|
100.00
%
|
100.00
%
|
100.00
%
|
|
EHSA
|
Argentina
|
Investment
|
70.00
%
|
70.00
%
|
70.00
%
|
|
Centro
de Entretenimiento La Plata
|
Argentina
|
Real
estate
|
100.00
%
|
100.00
%
|
100.00
%
|
|
Pareto
S.A.
|
Argentina
|
Design
and software development
|
69.69
%
|
69.69
%
|
-
|
|
La
Malteria
|
Argentina
|
Real
estate
|
-
|
100.00
%
|
-
|
|
Tyrus S.A.'s direct equity interest in:
|
|
|
|
|
|
|
DFL
and DN BV
|
Bermudas
|
Investment
|
97.04
%
|
96.46
%
|
91.57
%
|
|
IRSA
International LLC
|
United
States
|
Investment
|
100.00
%
|
100.00
%
|
100.00
%
|
|
Jiwin
S.A.
|
Uruguay
|
Investment
|
100.00
%
|
100.00
%
|
100.00
%
|
|
Liveck
S.A. (7)
|
Uruguay
|
Investment
|
100.00
%
|
100.00
%
|
100.00
%
|
|
Real
Estate Investment Group V LP (REIG V)
|
Bermudas
|
Investment
|
-
|
100.00
%
|
100.00
%
|
|
Real
Estate Strategies LLC
|
United
States
|
Investment
|
100.00
%
|
100.00
%
|
100.00
%
|
F-18
Cresud Sociedad Anónima,
Comercial, Inmobiliaria, Financiera y Agropecuaria
|
|
|
|
% of ownership interest held by the Group
|
||
|
Name of the entity
|
Country
|
Principal activity
|
06.30.20
|
06.30.19
|
06.30.18
|
|
Efanur S.A.'s direct equity interest in:
|
|
|
|
|
|
|
Real
Estate Investment Group VII LP (REIG VII)
|
Bermudas
|
Investment
|
100.00
%
|
100.00
%
|
100.00
%
|
|
DFL's direct equity interest in:
|
|
|
|
|
|
|
IDB
Development Corporation Ltd.
|
Israel
|
Investment
|
100.00
%
|
100.00
%
|
100.00
%
|
|
Dolphin
IL Investment Ltd.
|
Israel
|
Investment
|
100.00
%
|
100.00
%
|
100.00
%
|
|
DIL's direct equity interest in:
|
|
|
|
|
|
|
Discount
Investment Corporation Ltd. (4)
|
Israel
|
Investment
|
83.72
%
|
83.77
%
|
76.57
%
|
|
IDBD's direct equity interest in:
|
|
|
|
|
|
|
IDB
Tourism (2009) Ltd.
|
Israel
|
Tourism
services
|
100.00
%
|
100.00
%
|
100.00
%
|
|
IDB
Group Investment Inc
|
Israel
|
Investment
|
100.00
%
|
100.00
%
|
100.00
%
|
|
DIC's direct equity interest in:
|
|
|
|
|
|
|
Property
& Building Corporation Ltd.
|
Israel
|
Real
estate
|
72.40
%
|
68.80
%
|
64.40
%
|
|
Cellcom
Israel Ltd. (5)
|
Israel
|
Telecommunications
|
46.20
%
|
-
|
-
|
|
Elron
Electronic Industries Ltd.
|
Israel
|
Investment
|
61.06
%
|
44.10
%
|
43.14
%
|
|
Bartan
Holdings and Investments Ltd.
|
Israel
|
Investment
|
55.68
%
|
61.06
%
|
50.30
%
|
|
Epsilon
Investment House Ltd.
|
Israel
|
Investment
|
68.75
%
|
55.68
%
|
55.68
%
|
|
Mehadrin
Ltd. (8)
|
Israel
|
Agricultural
|
43.75
%
|
68.75
%
|
68.75
%
|
|
PBC's direct equity interest in:
|
|
|
|
|
|
|
Gav-Yam
Bayside Land Corporation Ltd. (6)
|
Israel
|
Real
estate
|
-
|
51.70
%
|
51.70
%
|
|
Ispro
The Israeli Properties Rental Corporation Ltd.
|
Israel
|
Real
estate
|
100.00
%
|
100.00
%
|
100.00
%
|
|
Matam
- Scientific Industries Center Haifa Ltd.
|
Israel
|
Real
estate
|
50.10
%
|
50.10
%
|
50.10
%
|
|
Hadarim
Properties Ltd.
|
Israel
|
Real
estate
|
100.00
%
|
100.00
%
|
100.00
%
|
|
Property
& Building (Commercial Centers) Ltd.
|
Israel
|
Real
estate
|
100.00
%
|
100.00
%
|
100.00
%
|
|
PBC
USA Investments Inc
|
United
States
|
Real
estate
|
100.00
%
|
100.00
%
|
100.00
%
|
(1)
Includes interest
held through E-Commerce Latina S.A. and Tyrus S.A.
(2)
The Group has
consolidated the investment in Llao Llao Resorts S.A. and UT IRSA
and Galerías Pacífico considering its equity interest and
a shareholder agreement that confers it majority of votes in the
decision making process.
(3)
Includes interest
held through Ritelco S.A. and Torodur S.A.
(4)
Includes Tyrus'
equity interest.
(5)
DIC considers it
exercises effective control over Cellcom because DIC is the group
with the higher percentage of votes (47.2%) vis-à-vis other
shareholders, also taking into account the historic voting
performance in the Shareholders’ Meetings, as well as the
evaluation of the holdings of the remaining shareholders, which are
highly atomized.
(6)
Control was lost in
September 30, 2018 (see Note 4.(k)).
(7)
Includes
Tyrus’ and IRSA S.A.’s equity interests.
(8)
DIC considers that
it exercises control because DIC is the group with the higher
percentage of votes (43.75%) vis-à-vis other shareholders that
are highly atomized.
Except
for the aforementioned items, the percentage of votes does not
differ from the stake.
The
Group takes into account both quantitative and qualitative aspects
in order to determine which non-controlling interests in
subsidiaries are considered significant.
(b)
Changes
in ownership interests in subsidiaries without change of
control
Transactions with
non-controlling interests that do not result in loss of control are
accounted for as equity transactions – i.e., as transactions
with the owners in their capacity as owners. The recorded value
corresponds to the difference between the fair value of the
consideration paid and/or received and the relevant share acquired
and/or transferred of the carrying value of the net assets of the
subsidiary.
(c)
Disposal
of subsidiaries with loss of control
When
the Group ceases to have control over a subsidiary, any retained
interest in the entity is re-measured at its fair value at the date
when control is lost, with changes in carrying amount recognized in
profit or loss. The fair value is the initial carrying amount for
the purposes of subsequently accounting for the retained interest
as an associate, joint venture or financial asset. In addition, any
amounts previously recognized in other comprehensive income in
respect of that entity are accounted for as if the Group had
directly disposed of the related assets or liabilities. This may
mean that amounts previously recognized in other comprehensive
income are reclassified to profit or loss.
(d)
Associates
Associates are all
entities over which the Group has significant influence but not
control, usually representing an interest between 20% and at least
50% of the voting rights. Investments in associates are accounted
for using the equity method of accounting, except as otherwise
indicated as explained below. Under the equity method, the
investment is initially recognized at cost, and the carrying amount
is increased or decreased to recognize the investor’s share
of the profit or loss of the investee after the date of
acquisition. The Group’s investment in associates includes
goodwill identified on acquisition.
As of
each year-end or upon the existence of evidence of impairment, a
determination is made, as to whether there is any objective
indication of impairment in the value of the investments in
associates. If this is the case, the Group calculates the amount of
impairment as the difference between the recoverable amount of the
Associates and its carrying value and recognizes the amount
adjacent to "Share of profit / (loss) of associates and joint
ventures " in the Statement of Income and Other Comprehensive
Income.
F-19
Cresud Sociedad Anónima,
Comercial, Inmobiliaria, Financiera y Agropecuaria
Profit
and losses resulting from transactions between the Group and the
associate are recognized in the Group's financial statements only
to the extent of the interests in the associates of the unrelated
investor. Unrealized losses are eliminated unless the transaction
reflects signs of impairment of the value of the asset transferred.
The accounting policies of associates are modified to ensure
uniformity within Group policies.
The
Group takes into account quantitative and qualitative aspects to
determine which investments in associates are considered
significant.
(e)
Joint
arrangements
Joint
arrangements are arrangements of which the Group and another party
or parties have joint control bound by a contractual arrangement.
Under IFRS 11, investments in joint arrangements are classified as
either joint ventures or joint operations depending on the
contractual rights and obligations each investor has rather than
the legal structure of the joint arrangement. A joint venture is a
joint arrangement whereby the parties that have joint control of
the arrangement have rights to the net assets of the arrangement. A
joint operation is a joint arrangement whereby the parties that
have joint control of the arrangement have rights to the assets,
and obligations for the liabilities, relating to the arrangement.
The Group has assessed the nature of its joint arrangements and
determined them to be joint ventures.
Investments in
joint ventures are accounted for under the equity method. Under the
equity method of accounting, interests in joint ventures are
initially recognized in the Consolidated Statements of Financial
Position at cost and adjusted thereafter to recognize the
Group’s share of post-acquisition profits or losses and other
comprehensive income in the Statements of Income and Other
Comprehensive Income.
The
Group determines at each reporting date whether there is any
objective evidence that the investment in joint ventures is
impaired. If this is the case, the Group calculates the amount of
impairment as the difference between the recoverable amount of the
joint venture and its carrying value and recognizes such difference
in "Share of profit / (loss) of associates and joint ventures" in
the Statements of Income.
2.4
Segment
information
Operating segments
are reported in a manner consistent with the internal reporting
provided to the Chief Operating Decision-Maker
(“CODM”), responsible for allocating resources and
assessing performance. The operating segments are described in Note
6.
2.5
Foreign
currency translation
(a)
Functional
and presentation currency
Items
included in the Financial Statements of each of the Group’s
entities are measured using the currency of the primary economic
environment in which the entity operates (‘the functional
currency’). The Consolidated Financial Statements are
presented in Argentine Pesos, which is the Group’s
presentation currency.
(b)
Transactions
and balances in foreign currency
Foreign
currency transactions are translated into the functional currency
using the exchange rates prevailing at the dates of the
transactions. Foreign exchange gains and losses resulting from the
settlement of such transactions and from the translation at
year-end exchange rates of monetary assets and liabilities
nominated in foreign currencies are recognized in the profit or
loss for the year.
Foreign
exchange gains and losses are presented in the Statement of Income
within other financial income, as appropriate, unless they have
been capitalized.
F-20
Cresud Sociedad Anónima,
Comercial, Inmobiliaria, Financiera y Agropecuaria
(c)
Group
companies
The
results and financial position of all the Group entities (none of
which has the currency of a hyperinflationary economy) that have a
functional currency different from the presentation currency are
translated into the presentation currency as follows:
(i)
assets, liabilities
and goodwill for each Statement of Financial Position presented are
translated at the closing rate at the date of that financial
position;
(ii)
income and expenses
for each Statement of Comprehensive Income are translated at
average exchange rates (unless this average is not a reasonable
approximation of the cumulative effect of the rates prevailing on
the transaction dates, in which case income and expenses are
translated at the rate on the dates of the transactions);
and
(iii)
all resulting
exchange differences are recognized in the Statement of
Comprehensive Income.
The
accounting policy of the Group consists in accounting for the
translation difference of its subsidiaries by the
“step-by-step” method according to IAS 21.
2.6
Investment
properties
Investment
properties are those properties owned either by the Group that are
held to earn long-term rental income or for capital appreciation,
or both and that are not occupied by the Group for its own
operations. Investment property also includes property that is
being constructed or developed for future use as investment
property. The Group also classifies as investment properties land
whose future use has not been determined yet. The Group’s
investment properties primarily comprise the Group’s
portfolio of shopping malls and offices, certain property under
development and undeveloped land.
Where a
property is partially owner-occupied, with the rest being held for
rental income or capital appreciation, the Group accounts for the
portions separately. The portion that is owner-occupied is
accounted for as property, plant and equipment under IAS 16
“Property, Plant and Equipment” and the portion that is
held for rental income or capital appreciation, or both, is treated
as investment properties under IAS 40 “Investment
Properties”.
Investment
properties are measured initially at cost. Cost comprises the
purchase price and directly attributable expenditures, such as
legal fees, certain direct taxes, commissions and in the case of
properties under construction, the capitalization of financial
costs.
For
properties under development, capitalization of costs includes not
only financial costs, but also all costs directly attributable to
works in process, from commencement of construction until it is
completed and property is in condition to start
operating.
Direct
expenses related to lease contract negotiation (such as payment to
third parties for services rendered and certain specific taxes
related to execution of such contracts) are capitalized as part of
the book value of the relevant investment properties and amortized
over the term of the lease.
Borrowing costs
associated with properties under development or undergoing major
refurbishment are capitalized. The finance cost capitalized is
calculated using the Group’s weighted average cost of
borrowings after adjusting for borrowings associated with specific
developments. Where borrowings are associated with specific
developments, the amount capitalized is the gross interest incurred
on those borrowings less any investment income arising on their
temporary investment. Finance cost is capitalized from the
commencement of the development work until the date of practical
completion. Capitalization of finance costs is suspended if there
are prolonged periods when development activity is interrupted.
Finance cost is also capitalized on the purchase cost of land or
property acquired specifically for redevelopment in the short term
but only where activities necessary to prepare the asset for
redevelopment are in progress.
After
initial recognition, investment property is carried at fair value.
Investment property that is being redeveloped for continuing use as
investment property or for which the market has become less active
continues to be measured at fair value. Investment properties under
construction are measured at fair value if the fair value is
considered to be reliably determinable. On the other hand,
properties under construction for which the fair value cannot be
determined reliably, but for which the Group expects it to be
determinable when construction is completed, are measured at cost
less impairment until the fair value becomes reliably determinable
or construction is completed, whichever is earlier.
F-21
Cresud Sociedad Anónima,
Comercial, Inmobiliaria, Financiera y Agropecuaria
Fair
values are determined differently depending on the type of property
being measured.
Generally, fair
value of owner occupied farmland, office buildings and land
reserves is based on active market prices, adjusted, if necessary,
for differences in the nature, location or condition of the
specific asset. If this information is not available, the Group
uses alternative valuation methods, such as recent prices on less
active markets or discounted cash flow projections.
The
fair value of the Group’s portfolio of Shopping Malls is
based on discounted cash flow projections. This method of valuation
is commonly used in the shopping mall industry in the region where
the Group conducts its operations.
Fair
value of office buildings in the Operations Center in Israel are
based on discounted cash flow projections.
As
required by CNV 576/10 Resolution, valuations are performed as of
the financial position date by accredited external appraisers who
have recognized professional qualifications and have recent
experience in the location and category of the investment property
being valued. These valuations form the basis for the carrying
amounts in the Consolidated Financial Statements. The fair value of
investment property reflects, among other things, rental income
from current leases and other assumptions market participants would
make when pricing the property under current market
conditions.
Subsequent
expenditures are capitalized to the asset’s carrying amount
only when it is probable that future economic benefits associated
with the expenditure will flow to the Group and the cost can be
measured reliably. All other repairs and maintenance costs are
expensed when incurred. When part of an investment property is
replaced, the carrying amount of the replaced part is
derecognized.
Changes
in fair values are recognized in the Statement of Income under the
line item “Net gain or (loss) from fair value adjustment of
investment properties”.
Asset
transfers, including assets classified as investments properties
which are reclassified under other items or vice-versa, may only be
carried out when there is a change of use evidenced by: a)
commencement of occupation of real property by the Group, where
investment property is transferred to property, plant and
equipment; b) commencement of development activities for sale
purposes, where investment property is transferred to property for
sale; c) the end of Group occupation, where it is transferred from
property, plant and equipment to investment properties; or d)
commencement of an operating lease transaction with a third party,
where properties for sale are transferred to investment property.
The value of the transfer is the one that the property had at the
time of the transfer and subsequently is valued in accordance with
the accounting policy related to the item.
The
Group may sell its investment property when it considers that such
property no longer forms part of the lease business. The carrying
value immediately prior to the sale is adjusted to the transaction
price, and the adjustment is recorded in the Statement of Income
and other comprehensive income in the line “Net gain from
fair value adjustments of investment
properties”.
Investment
properties are derecognized when they are disposed of or when they
are permanently withdrawn from use and no future economic benefits
are expected to arise from their disposals. The disposal of
properties is recognized when the significant risks and rewards
have been transferred to the buyer. As for unconditional
agreements, proceeds are accounted for when title to property
passes to the buyer and the buyer intends to make the respective
payment. In the case of conditional agreements, proceeds are
accounted for when title to property passes to the buyer and the
buyer intends to make the respective payment, and when the
conditions the agreement is subject to have been met. Where
consideration receivable for the sale of the properties is
deferred, it is discounted to present value. The difference between
the discounted amount and the amount receivable is treated as
interest income and recognized over the period using the effective
interest method. Direct expenses related to the sale are recognized
in the line "Other operating results, net" in the Statement of
Income at the time they are incurred.
2.7
Property,
plant and equipment
This
category primarily comprises, buildings or portions of a building
used for administrative purposes, machines, computers, and other
equipment, motor vehicles, furniture, fixtures and fittings and
improvements to the Group’s corporate offices.
The
Group has also several hotel properties. Based on the respective
contractual arrangements with hotel managers and / or given their
direct operators nature, the Group considers it retains significant
exposure to the variations in the cash flows of the hotel
operations, and accordingly, hotels are treated as owner-occupied
properties and classified under "Property, plant and
equipment".
F-22
Cresud Sociedad Anónima,
Comercial, Inmobiliaria, Financiera y Agropecuaria
All
property, plant and equipment (“PPE”) is stated at
acquisition cost less accumulated depreciation and impairment, if
any. The acquisition cost includes expenditures, which are directly
attributable to the acquisition of the items. For properties under
development, capitalization of costs includes not only financial
costs, but also all costs directly attributable to works in
process, from commencement of construction until it is completed
and the property is in conditions to start operating.
Subsequent costs
are included in the asset’s carrying amount or recognized as
a separate asset, as appropriate, only when it is probable that
future economic benefits associated with the item will flow to the
Group and the cost of the item can be measured reliably. Such costs
may include the cost of improvements and replacement of parts as
they meet the conditions to be capitalized. The carrying amount of
those parts that are replaced is derecognized. Repairs and
maintenance are charged as incurred in the Statement of Income.
Depreciation, based on a component approach, is calculated using
the straight-line method to allocate the cost over the
assets’ estimated useful lives.
The
remaining useful life as of June 30, 2020 is as
follows:
|
Buildings and facilities
|
Between 5 and 50 years
|
|
Machinery and equipment
|
Between 3 and 24 years
|
|
Communication networks
|
Between 4 and 20 years
|
|
Others
|
Between 3 and 25 years
|
As of
each fiscal year-end, an evaluation is performed to determine the
existence of indicators of any decrease in recoverable value or
useful life of assets. If there are any indicators, the recoverable
amount and/or residual useful life of impaired asset(s) is
estimated, and an impairment adjustment is made, if applicable. As
of each fiscal year-end, the residual useful life of assets is
estimated and adjusted, if necessary. The book amount of an asset
is reduced to its recoverable value if the book value is greater
than its estimated recoverable value.
Gains
from the sale of these assets are recognized when the significant
risks and rewards have transferred to the buyer. This will normally
take place on unconditional exchange, generally when legal title
passes to the buyer and it is probable that the buyer will pay. For
conditional exchanges, sales are recognized when these conditions
are satisfied.
Gains
and losses on disposals are determined by comparing the proceeds,
net of direct expenses related to such sales, with the carrying
amount. Gains and losses from the disposal of farmlands are
disclosed within “Gains from disposal of farmlands” in
the Statements of Income. All other gains and losses from the
disposal of property, plant and equipment items are recognized
within “Other operating results, net” in the Statement
of Comprehensive Income.
When
assets of property, plant and equipment are transferred to
investment property, the difference between the value at cost
transferred and the fair value of the investment property is
allocated to a reserve within equity.
Group's
sugarcane fields are recognized as bearer plants under the
definition included in IAS 41. For this reason, they are accounted
as property, plant and equipment and are valued at amortized
cost.
2.8
Leases
Leases
are recorded pursuant to IFRS 16. The Group recognizes an asset for
the right of use and a liability at present value with respect to
those contracts that meet the definition of lease agreements
according to IFRS 16. For the prior periods’ leases were
classified at their inception as either operating or finance leases
based on the economic substance of the agreement.
A Group company is the lessor
Properties leased
out to tenants under operating leases are included in
“Investment properties” in the Statement of Financial
Position. See Note 2.25 for the recognition of rental
income.
A Group company is the lessee
The
Group has entered into some operating lease agreements, mainly
related to agribusiness activities. By virtue of these contracts,
the Group leases land open for agricultural exploitation during one
or more crop seasons. The lease price is generally set at a fixed
amount in dollars or at a certain number of quintals of soybeans
(or equivalent measurement unit) during the entire lease term.
Lease payments can be made in installments or in advance at the
beginning of the lease. The lease costs are recognized in the
Statements of Income in relation to the degree of ripeness of the
harvest since the Group considers that this systematic base is more
representative of the time pattern of the leases’
benefits.
Additionally, the
Group maintains other operating leases not related to agricultural
activity, mainly associated with the leasing of offices. Payments,
including prepayments, made under operating leases (net of any
incentives received from the lessor) are charged to the Statement
of Income on a straight-line basis over the period of the
lease.
F-23
Cresud Sociedad Anónima,
Comercial, Inmobiliaria, Financiera y Agropecuaria
The
Group acquires certain specific assets (especially machinery,
computer equipment and real property exploitation concessions)
under leases pursuant to IFRS 16. Assets so acquired are recorded
as an asset at the present value of the minimum future lease
payments. Capitalized lease assets are depreciated over the shorter
of the estimated useful life of the assets and the lease term. The
finance charges are charged over the lease period so as to produce
a constant periodic rate of interest on the remaining balance of
the liability for each period.
Leases
falling within the IFRS 16 exemption, where the Group acts as
lessee are charged to results at the time they accrue. They mainly
include contracts for less than one year and/or for non-material
items.
2.9
Intangible
assets
(a)
Goodwill
Goodwill represents
future economic benefits arising from assets that are not capable
of being individually identified and separately recognized by the
Group on an acquisition. Goodwill is initially measured as the
difference between the fair value of the consideration transferred,
plus the amount of non-controlling interest in the acquisition and,
in business combinations achieved in stages, the acquisition-date
fair value of the previously held equity interest in the
acquisition; and the net fair value of the identifiable assets and
liabilities assumed on the acquisition date.
Goodwill is not
amortized but tested for impairment at each fiscal year-end, or
more frequently if there is an indication of
impairment.
For the
purpose of impairment testing, assets are grouped at the lowest
levels for which there are separately identifiable cash flows,
referred to as cash-generating units (“CGU”). In order
to determine whether any impairment loss should be recognized, the
book value of CGU or CGU groups is compared against its recoverable
value. Net book value of CGU and CGU groups include goodwill and
assets with limited useful life (such as, investment properties,
property, plant and equipment, intangible assets and working
capital).
If the
recoverable amount of the CGU is less than the carrying amount of
the unit, the impairment loss is allocated first to reduce the
carrying amount of any goodwill allocated to the unit and then to
the other assets of the unit pro rata on the basis of the carrying
amount of each asset in the unit. Impairment losses recognized for
goodwill are not reversed in a subsequent period.
The
recoverable amount of a CGU is the higher of the fair value less
costs-to-sell and the value-in-use. The fair value is the amount at
which a CGU may be sold in a current transaction between unrelated,
willing and duly informed parties. Value-in-use is the present
value of all estimated future cash flows expected to be derived
from CGU or CGU groups.
Goodwill is
assigned to the Group's cash generating units on the basis of
operating segments. The recoverable amount of a cash-generating
unit is determined based on fair value calculations. These
calculations use the price of the CGU assets, they are compared
with the book values, plus the goodwill assigned to each
cash-generating unit.
No
material impairment was recorded as a result of the analysis
performed (Note 12).
(b)
Computer
software
Acquired computer
software licenses are capitalized based on the costs incurred to
acquire and bring to use the specific software. These costs are
amortized over their estimated useful lives of three years. Costs
associated with maintaining computer software programs are
recognized as an expense as incurred.
(c)
Branding
and client relationships
This
relates to the fair value of brands and client relationships
arising at the time of the business combination with IDBD. They are
subsequently valued at cost, less the accumulated amortization or
impairment. Client relationships have an average twelve-year useful
life, while one of the brands have an indefinite useful life and
the other ten-year useful life.
(d)
Right
to receive future units under barter agreements
The
Group also enters into barter transactions where it normally
exchanges undeveloped parcels of land with third-party developers
for future property to be constructed on the bartered land. The
Group generally receives monetary assets as part of the
transactions and/or a right to receive future units to be
constructed by developers. Such rights are initially recognized at
cost (which is the fair value of the land assigned) and are not
adjusted later, unless there is any sign of
impairment.
F-24
Cresud Sociedad Anónima,
Comercial, Inmobiliaria, Financiera y Agropecuaria
At each
year-end, the Group reviews the carrying amounts of its intangible
assets to determine whether there is any indication that those
assets have suffered an impairment loss. If any of such signs
exists, the recoverable amount of the asset is estimated in order
to determine the extent, if any, of the impairment loss. For
intangible assets with indefinite useful lives, the Group annually
reviews the existence of an impairment, or more frequently if signs
of impairment are identified.
2.10
Trading
properties
Trading
properties comprises those properties intended either for sale or
in the process of construction for subsequent sale. Trading
properties are carried at the lower of cost and net realizable
value. Where there is a change in use of investment properties
evidenced by the commencement of development with a view to sale,
the properties are reclassified as trading properties at cost,
which is the carrying value at the date of change in use. They are
subsequently carried at the lower of cost and net realizable value.
Cost comprises all costs of purchase, costs of conversion and other
costs incurred in bringing the trading properties to their present
location and condition.
2.11
Inventories
Inventories include
assets held for sale in the ordinary course of the Group’s
business activities, assets in production or construction process
for sale purposes, and materials, supplies or other assets held for
consumption in the process of producing sales and/or
services.
Supplies used in
the Group's agricultural activities comprise fertilizers,
agrochemicals, vaccines, seeds, feed for livestock and other items.
Harvested agricultural produce comprise harvested crops, and raw
meat.
For the
Group’s operations in Argentina and Brazil, harvested crops
are perpetually measured at net realizable value until the point of
sale because there is an active market for such products, there is
a negligible risk that the produce will not be sold and there is a
well-established practice in the industry of measuring the
inventories at net realizable value. Changes in net realizable
value are recognized in the Statements of Income in the year in
which they arise under the line item “Changes in net
realizable value of agricultural produce after
harvest”.
Net
realizable value is the estimated selling price in the ordinary
course of business less selling expenses. It is determined on an
ongoing basis, taking into account the product type and aging,
based on the accumulated prior experience with the useful life of
the product. The Group periodically reviews the inventory and its
aging and books an allowance for impairment, as
necessary.
The
cost of consumable supplies, materials and other assets is
determined using the weighted average cost method, the cost of
inventories of mobile phones, related accessories and spare parts
is priced under the moving average method, and the cost of the
remaining inventories is priced under the first in, first out
(FIFO) method.
Cost
comprises all costs of purchase, costs of conversion and other
costs incurred in bringing the inventories to their present
location and condition. Inventories are recorded at the cash cost
and the difference between that and the actual amount paid is
treated as finance cost.
Inventories are
measured at the lower of cost or net realizable value.
2.12
Biological
assets and agriculture produce at the point of harvest
Biological assets
comprise unharvested crops (mainly corn, wheat, soybeans and
sunflower), sugarcane, livestock (breeding and dairy cattle and
cattle held for sale or meat production) and other less significant
biological assets such as sheep and tree plantations.
The
Group distinguishes between consumable and bearer biological
assets. Consumable biological assets are those assets that may be
harvested as agricultural produce or sold as biological assets, for
example livestock intended for the production of meat and/or
livestock held for sale. Bearer biological assets are those assets
capable of producing more than one harvest, for example sugarcane,
dairy cattle and breeding cattle. Consumable biological assets are
generally classified as current while bearer biological assets are
generally classified as non-current.
Expenses relating
to the agricultural activity include items such as planting,
harvesting, irrigation, agrochemicals, fertilizers, veterinary
services and others. The Group elected to capitalize all costs as
part of the biological assets.
The line item
“Cost of sales of biological assets and agricultural
produce” within “Costs” in the Statements of
Income represents the recognition as an expense of agricultural
produce held in inventory, valued at either cost or net realizable
value, as applicable, or biological assets valued at fair value
less costs to sell.
F-25
Cresud Sociedad Anónima,
Comercial, Inmobiliaria, Financiera y Agropecuaria
Either
the fair value of a biological asset in its present location and
condition is determined based on the present value of expected net
cash flows from the biological asset discounted at a current
market-determined pre-tax rate or the current quoted market price
in the most relevant market.
Biological assets
are measured at fair value less costs to sell on initial
recognition and at each Statement of Financial Position date,
except where fair value cannot be reliably measured. Cost
approximates fair value when little or no biological transformation
has taken place since the costs were originally incurred or the
impact of biological transformation on price is not expected to be
material. Costs to sell include all incremental costs directly
attributable to the sale of the biological assets, excluding
finance costs and income taxes.
Additionally, the
Group’s costs of planting the sugarcane are accounted for as
property, plant and equipment and are valued at amortized cost. The
growing agricultural product of sugarcane is classified as a
biological asset and valued at fair value less costs to
sell.
The
gain or loss arising from initial recognition of a) agricultural
produce and b) biological assets at fair value less costs to sell
and from a change in fair value less costs to sell of a biological
asset is recognized in profit or loss in the year in which occur
within the line item “Initial recognition and changes in fair
value of biological assets and agricultural produce at the point of
harvest”.
2.13
Financial
instruments
The
Group classifies financial assets in the following categories:
those to be measured subsequently at fair value, and those to be
measured at amortized cost. This classification depends on whether
the financial asset is an equity investment or a debt
investment.
Debt investments
A debt
investment is classified at amortized cost only if both of the
following criteria are met: (i) the objective of the Group’s
business model is to hold the asset to collect the contractual cash
flows; and (ii) the contractual terms give rise on specified dates
to cash derived solely from payments of principal and interest due
on the principal outstanding. The nature of any derivatives
embedded in the debt investment are considered in determining
whether the cash derives solely from payment of principal and
interest due on the principal outstanding and are not accounted for
separately.
If
either of the two criteria mentioned in the previous paragraph is
not met, the debt instrument is classified at fair value through
profit or loss. The Group has not designated any debt investment as
measured at fair value through profit or loss to eliminate or
significantly reduce an accounting mismatch. Changes in fair values
and gains from disposal of financial assets at fair value through
profit or loss are recorded within “Financial results,
net” in the Statement of Income.
Equity investments
All
equity investments, which are neither subsidiaries nor associate
companies nor joint venture of the Group, are measured at fair
value. Equity investments that are held for trading are measured at
fair value through profit or loss. For all other equity
investments, the Group can make an irrevocable election at initial
recognition to recognize changes in fair value through other
comprehensive income rather than profit or loss. The Group decided
to recognize changes in fair value of equity investments through
changes in profit or loss.
At
initial recognition, the Group measures a financial asset at its
fair value plus, in the case of a financial asset not at fair value
through profit or loss, transaction costs that are directly
attributable to the acquisition of the financial asset. Transaction
costs of financial assets carried at fair value though profit or
loss are expensed in the Statement of Income.
In
general, the Group uses the transaction price to ascertain the fair
value of a financial instrument on initial recognition. In the
other cases, the Group records a gain or loss on initial
recognition only if the fair value of the financial instrument can
be supported by other comparable transactions observable in the
market for the same type of instrument or if based on a technical
valuation that only inputs observable market data. Unrecognized
gains or losses on initial recognition of a financial asset are
recognized later on, only to the extent they arise from a change in
factors (including time) that market participants would consider
upon setting the price.
Gains/losses on
debt instruments measured at amortized cost and not identified for
hedging purposes are charged to income where the financial assets
are derecognized or an impairment loss is recognized, and during
the amortization process under the effective interest method. The
Group is required to reclassify all affected debt investments when
and only when its business model for managing those assets
changes.
F-26
Cresud Sociedad Anónima,
Comercial, Inmobiliaria, Financiera y Agropecuaria
The
Group assesses at the end of each reporting period whether there is
objective evidence that a financial asset or group of financial
assets measured at amortized cost is impaired. A financial asset or
a group of financial assets is impaired and impairment losses are
incurred only if there is objective evidence of impairment as a
result of one or more events that occurred after the initial
recognition of the asset (a ‘loss event’) and that loss
event (or events) can be reliably estimated. The amount of the loss
is measured as the difference between the asset’s carrying
amount and the present value of estimated future cash flows
(excluding future credit losses that have not been incurred)
discounted at the financial asset’s original effective
interest rate.
Financial assets
and liabilities are offset, and the net amount reported in the
statement of financial position, when there is a legally
enforceable right to offset the recognized amounts and there is an
intention to settle on a net basis, or realize the asset and settle
the liability simultaneously.
2.14
Derivative
financial instruments and hedging activities and
options
Derivative
financial instruments are initially recognized at fair value. The
method of recognizing the resulting gain or loss depends on whether
the derivative is designated as a hedging instrument, and if so,
the nature of the item being hedged.
The
Group manages exposures to various risks using hedging instruments
that provide coverage. The Group does not use derivative financial
instruments for speculative purposes. To date, the Group has used
put and call options, foreign currency future and forward contracts
and interest rate swaps, as appropriate.
The
Group’s policy is to apply hedge accounting where it is
permissible under IFRS 9, practical to do so and its application
reduces volatility, but transactions that may be effective hedges
in economic terms may not always qualify for hedge accounting under
IFRS 9.
Trading
derivatives are classified as a current asset or liability on the
Statement of Financial Position. Gains and losses on derivatives
are classified according to their nature. Gains and losses on
commodity derivatives are classified within the line item
“Other operating income, net”. Gain and losses on all
other derivatives are classified in the Statements of Income where
the results of the items covered are recognized.
The
fair values of financial instruments that are traded in active
markets are computed by reference to market prices. The fair value
of financial instruments that are not traded in an active market is
determined by using valuation techniques. The Group uses its
judgment to select a variety of methods and make assumptions that
are mainly based on market conditions existing at the end as each
reporting year.
2.15
Groups
of assets and liabilities held for sale
Groups
of assets and liabilities are classified as held for sale when the
Group is expected to recover their value by means of a sale
transaction (rather than through use) and where such sale is highly
probable. Groups of assets and liabilities held for sale are valued
at the lower of their net book value and fair value less selling
costs.
2.16
Trade
and other receivables
Trade
receivables are recognized initially at fair value and subsequently
measured at amortized cost using the effective interest
method.
An
allowance for doubtful accounts is recorded based on the expected
loss of the receivables portfolio. Indicators of doubtful accounts
include significant financial distress of the debtor, the debtor
potentially filing a petition for reorganization or bankruptcy, or
any event of default or past due account.
In the
case of larger non-homogeneous receivables, the impairment
provision is calculated on an individual basis.
The
Group collectively evaluates smaller-balance homogeneous
receivables for impairment. For that purpose, they are grouped on
the basis of similar risk characteristics, and account asset type,
collateral type, past-due status and other relevant factors are
taken into account.
The
amount of the allowance is the difference between the asset’s
carrying amount and the present value of estimated future cash
flows, discounted at the original effective interest rate. The
carrying amount of the asset is reduced through the use of a
separate account, and the amount of the loss is recognized in the
Statements of Income within “Selling expenses”.
Subsequent recoveries of amounts previously written off are
credited against “Selling expenses” in the Statements
of Income.
F-27
Cresud Sociedad Anónima,
Comercial, Inmobiliaria, Financiera y Agropecuaria
2.17
Other
assets
Other
assets are recognized initially at cost and subsequently measured
at the acquisition cost or the net realizable value, the
lower.
2.18
Trade
and other payables
Trade
payables are initially recognized at fair value and subsequently
measured at amortized cost using the effective interest
method.
2.19
Borrowings
Borrowings are
recognized initially at fair value, net of transaction costs
incurred. Borrowings are subsequently stated at amortized cost; any
difference between the proceeds (net of transaction costs) and the
redemption value is recognized as finance cost over the period of
the borrowings using the effective interest method.
2.20
Provisions
Provisions are
recognized when: (i) the Group has a present (legal or
constructive) obligation as a result of past events; (ii) it is
probable that an outflow of resources will be required to settle
the obligation; and (iii) a reliable estimate of the amount of the
obligation can be made. Provisions are not recognized for future
operating losses.
The
Group bases its accruals on up-to-date developments, estimates of
the outcomes of the matters and legal counsel´s experience in
contesting, litigating and settling matters. As the scope of the
liabilities becomes better defined or more information is
available, the Group may be required to change its estimates of
future costs, which could have a material adverse effect on its
results of operations and financial condition or
liquidity.
Provisions are
measured at the present value of the cash flows expected to be
required to settle the obligation using a pre-tax rate that
reflects current market assessments of the time value of money and
the risks specific to the obligation. The increase in the
provisions due to passage of time is recognized in the Statements
of Income.
2.21
Irrevocable
right of use of the capacity of underwater communication
lines
Transactions
carried out to acquire an irrevocable right of use of the capacity
of underwater communication lines are accounted for as service
contracts. The amount paid for the rights of use of the
communication lines is recognized as “Prepaid expenses”
under trade and other receivables, and is amortized over a
straight-line basis during the period set forth in the contract
(including the option term), which is the estimated useful life of
such capacity.
2.22
Employee
benefits
(a)
Defined
contribution plans
The
Group operates a defined contribution plan, which is a pension plan
under which the Group pays fixed contributions into a separate
entity. The Group has no legal or constructive obligations to pay
further contributions if the fund does not hold sufficient assets
to pay all employees the benefits relating to employee service in
the current year or prior periods. The contributions are recognized
as employee benefit expense in the Statements of Income in the
fiscal year they are due.
(b)
Termination
benefits
Termination
benefits are payable when employment is terminated by the Group
before the normal retirement date, or whenever an employee accepts
voluntary redundancy in exchange for these benefits. The Group
recognizes termination benefits when it is demonstrably committed
to either terminating the employment of current employees according
to a detailed formal plan without possibility of withdrawal or as a
result of an offer made to encourage voluntary termination as a
result of redundancy.
(c)
Bonus
plans
The
Group recognizes a liability and an expense for bonuses based on a
formula that takes into consideration the profit attributable to
the Company’s shareholders after certain adjustments. The
Group recognizes a provision where contractually obliged or where
there is a past practice that has created a constructive
obligation.
F-28
Cresud Sociedad Anónima,
Comercial, Inmobiliaria, Financiera y Agropecuaria
(d)
Defined
benefit plans
The
Group’s net obligation concerning defined benefit plans are
calculated on an individual basis for each plan, estimating the
future benefits employees have gained in exchange for their
services in the current and prior periods. The benefit is disclosed
at its present value, net of the fair value of the plan assets.
Calculations are made on an annual basis by a qualified
actuary.
(e)
Share-based
payments
The
fair value of share-based payments is measured at the date of
grant. The Group measures the fair value using the valuation
technique that it considers to be the most appropriate to value
each class of award. Methods used may include Black-Scholes
calculations or other models as appropriate. The valuations take
into account factors such as non-transferability, exercise
restrictions and behavioral considerations.
The
fair value of the share-based payment is expensed and charged to
income under the straight-line method over the vesting period in
which the right to the equity instrument becomes irrevocable
(“vesting period”); such value is based on the best
available estimate of the number of equity instruments expected to
vest. Such estimate is revised if subsequent information available
indicates that the number of equity instruments expected to vest
differs from original estimates.
(f)
Other
long-term benefits
The net
obligations of IDBD, DIC and its subsidiaries concerning employee
long-term benefits, other than retirement plans, is the amount of
the minimum future benefits employees have gained in exchange for
their services in the current and prior periods. These benefits are
discounted at their present values.
2.23
Current
income tax, deferred income tax and minimum presumed income
tax
Tax
expense for the year comprises the charge for tax currently payable
and deferred income. Income tax is recognized in the statements of
income, except to the extent that it relates to items recognized in
other comprehensive income or directly in equity, in which case,
the tax is also recognized in other comprehensive income or
directly in equity, respectively.
Current
income tax expense is calculated on the basis of the tax laws
enacted or substantially enacted at the date of the Statements of
Financial Position in the countries where the Company and its
subsidiaries operate and generate taxable income. The Group
periodically evaluates positions taken in tax returns with respect
to situations in which applicable tax regulation is subject to
interpretation. The Group establishes provisions where appropriate
on the basis of amounts expected to be paid to the tax
authorities.
Deferred income tax
is recognized, using the deferred tax liability method, on
temporary differences arising between the tax bases of assets and
liabilities and their carrying amounts in the Consolidated
Financial Statements. However, deferred tax liabilities are not
recognized if they arise from the initial recognition of goodwill;
deferred income tax is not accounted for if it arises from initial
recognition of an asset or liability in a transaction other than a
business combination that at the time of the transaction affects
neither accounting nor taxable profit or loss. Deferred income tax
is determined using tax rates (and laws) that have been enacted or
substantively enacted by the date of the Statements of Financial
Position and are expected to apply when the related deferred income
tax asset is realized or the deferred income tax liability is
settled.
Deferred income tax
assets are recognized only to the extent that it is probable that
future taxable profit will be available, against which the
temporary differences can be utilized. Deferred income tax is
provided on temporary differences arising on investments in
subsidiaries, joint ventures and associates, except for deferred
income tax liabilities where the timing of the reversal of the
temporary difference is controlled by the Group and it is probable
that the temporary difference will not reverse in the foreseeable
future.
Deferred income tax
assets and liabilities are offset when there is a legally
enforceable right to offset current tax assets against current tax
liabilities and when the deferred income taxes assets and
liabilities relate to income taxes levied by the same taxation
authority on either the same taxable entity or different taxable
entities where there is an intention to settle the balances on a
net basis.
The
Group is able to control the timing of dividends from its
subsidiaries and hence does not expect taxable profit. Hence,
deferred tax is recognized in respect of the retained earnings of
overseas subsidiaries only if at the date of the Statements of
Financial Position, dividends have been accrued as receivable a
binding agreement to distribute past earnings in future has been
entered into by the subsidiary or there are sale plans in the
foreseeable future.
F-29
Cresud Sociedad Anónima,
Comercial, Inmobiliaria, Financiera y Agropecuaria
Entities in
Argentina are subject to the Minimum Presumed Income Tax
(“MPIT”). Pursuant to this tax regime, an entity is
required to pay the greater of the income tax or the MPIT. The MPIT
provision is calculated on an individual entity basis at the
statutory asset tax rate of 1% and is based upon the taxable assets
of each company as of the end of the year, as defined by Argentine
law. Any excess of the MPIT over the income tax may be carried
forward and recognized as a tax credit against future income taxes
payable over a 10-year period. When the Group assesses that it is
probable that it will use the MPIT payment against future taxable
income tax charges within the applicable 10-year period, recognizes
the MPIT as a current or non-current receivable, as applicable,
within “Trade and other receivables” in the Statements
of Financial Position.
The
minimum presumed income tax was repealed by Law N ° 27,260 in
its article 76 for the periods that begin as of January 1,
2019.
Regarding the above
mentioned, considering the Instruction No. 2 of the Federal
Administration of Public Revenues (AFIP), it is not appropriate to
record the provision of the above mention tax, in the event that
accounting and tax losses occur.
2.24
Cash
and cash equivalents
Cash
and cash equivalents include cash on hand, deposits held with
banks, and other short-term liquid investments with original
maturities of three months or less. Bank overdrafts are not
included.
2.25
Revenue
recognition
The
group identifies contracts with customers and evaluates the goods
and services committed therein to determine performance obligations
and their classification between performance obligations that are
satisfied at a given time or over time.
Revenue
from satisfaction of performance obligations at a given time is
recognized when the client obtains control of the committed asset
or service considering whether there is a right to collection, if
the client has the physical possession, if the client has the legal
right and if they have the transferred the risks and
benefits.
Additionally and in
accordance with IFRS 15, the Group recognizes revenues over time
from the sales of real estate developments in which there is no
alternative use for the asset and the Group has the right to demand
payment of the contract. When these conditions are not met, the
income is recognized at the time of delivery or deed.
Revenue
from satisfaction of performance obligations over time for real
estate developments is recognized by measuring progress towards
compliance with the obligation when it can be measured reliably.
For this measurement, the Group uses the resourced method, that is,
the effort consumed by the entity and determines the percentage of
progress based on the estimate of the total development
costs.
The
Group's revenue is recognized at the probable value of the
consideration to which it will be entitled in exchange for
transferring the products or services to the customer which is not
expected to suffer significant changes.
Agricultural activities
Revenue
from Group’s agricultural activities comes primarily from
sales of agricultural produce and biological assets, from provision
of services related to the activity and from leases of
farmlands.
The
Group also provides agricultural-related (including but not limited
to watering and feedlot services) and brokerage services to third
parties. Revenue from services are recognized when services are
effective rendered.
The
Group also leases land to third parties under operating lease
agreements. Lease income is recognized on a straight-line basis
over the period of the lease.
Urban properties and investments activities
●
Rental and services
- Shopping malls portfolio
Revenues derived
from business activities developed in the Group’s shopping
malls mainly include rental income under operating leases,
admission rights, commissions and revenue from several
complementary services provided to the Group’s
lessees.
Rental
income from shopping mall, admission rights and commissions, are
recognized in the Statements of Income on a straight-line basis
over the term of the leases. When lease incentives are granted,
they are recognized as
F-30
Cresud Sociedad Anónima,
Comercial, Inmobiliaria, Financiera y Agropecuaria
an
integral part of the net consideration for the use of the property
and are therefore recognized on the same straight-line
basis.
Contingent rents,
i.e. lease payments that are not fixed at the inception of a lease,
are recorded as income in the periods in which they are known and
can be determined. Rent reviews are recognized when such reviews
have been agreed with tenants.
The
Group’s lease contracts also provide that common area
maintenance charges and collective promotion funds of the
Group’s shopping malls are borne by the corresponding
lessees, generally on a proportionally basis. These common area
maintenance charges include all expenses necessary for various
purposes including, but not limited to, the operation, maintenance,
management, safety, preservation, repair, supervision, insurance
and enhancement of the shopping malls. The lessor is responsible
for determining the need and suitability of incurring a common area
expense. The Group makes the original payment for such expenses,
which are then reimbursed by the lessees. The Group considers that
it acts as a principal in these cases. Service charge income is
presented separately from property operating expenses. Property
operating expenses are expensed as incurred.
●
Rental and services
- Offices and other rental properties
Rental
income from offices and other rental properties include rental
income from offices leased out under operating leases, income from
services and expenses recovery paid by tenants.
Rental
income from offices and other rental properties is recognized in
the Statements of Income on a straight-line basis over the term of
the leases. When lease incentives are granted, they are recognized
as an integral part of the net consideration for the use of the
property and are therefore recognized on the same straight-line
basis.
A
substantial portion of the Group’s leases requires the tenant
to reimburse the Group for a substantial portion of operating
expenses, usually a proportionate share of the allocable operating
expenses. Such property operating expenses include necessary
expenses such as property operating, repairs and maintenance,
security, janitorial, insurance, landscaping, leased properties and
other administrative expenses, among others. The Group manages its
own rental properties. The Group makes the original payment for
these expenses, which are then reimbursed by the lessees. The Group
considers that it acts as a principal in these cases. The Group
accrues reimbursements from tenants as service charge revenue in
the period the applicable expenditures are incurred and is
presented separately from property operating expenses. Property
operating expenses are expensed as incurred.
●
Revenue from
communication services and sale of communication
equipment
Revenue
derived from the use of the Group’s communication networks,
including mobile phones, Internet services, international calls,
fixed line calls, interconnection rates and roaming service rates
and television, are recognized when the service is provided,
proportionally to the extent the transaction has been realized, and
provided all other criteria have been met for revenue
recognition.
Revenue
from the sale of mobile phone cards is initially recognized as
deferred revenue and then recognized as revenue as they are used or
upon expiration, whichever takes place earlier.
A
transaction involving the sale of equipment to a final user
normally also involves a service sale transaction. In general, this
type of sale is performed without a contractual obligation by the
client to consume telephone services for a minimum amount over a
predetermined period. As a result, the Group records the sale of
equipment separately of the performance obligations and recognizes
revenue pursuant to the transaction value upon delivery of the
equipment to the client. Revenue from telephone services is
recognized and accounted for as they are provided over time. When
the client is bound to make a minimum consumption of services
during a predefined period, the contract formalizes a transaction
of several elements and, therefore, revenue from the sale of
equipment is recorded at an amount that should not exceed its fair
value, and is recognized upon delivery of the equipment to the
client and provided the criteria for recognition are met. The Group
ascertains the fair value of individual elements, based on the
price at which it is normally sold, after taking into account the
relevant discounts.
Revenue
derived from long-term contracts is recognized at the present value
of future cash flows, discounted at market rates prevailing on the
transaction date. Any difference between the original credit and
its net present value is accounted for as interest income over the
credit term.
●
Revenue from
agricultural products
Revenue
from agricultural products is recognized when the product is
delivered and at the time all other criteria for revenue
recognition have been met.
F-31
Cresud Sociedad Anónima,
Comercial, Inmobiliaria, Financiera y Agropecuaria
●
Revenue from
supermarkets
Revenue
from the sale of goods in the ordinary course of business is
recognized at the fair value of the consideration collected or
receivable, net of returns and discounts. When the credit term is
short and financing is that typical in the industry, consideration
is not discounted. When the credit term is longer than the
industry’s average, in accounting for the consideration, the
Group discounts it to its net present value by using the
client’s risk premium or the market rate. The difference
between the fair value and the nominal amount is accounted for
under financial income. If discounts are granted and their amount
can be measured reliably, the discount is recognized as a reduction
of revenue.
Revenues from
supermarkets have been recognized in discontinued operations (see
Note 4.(p)).
2.26
Cost
of sales
The
cost of sales, includes the acquisition costs and the operational
and management costs for shopping malls held by the Group as part
of its real estate investments. The Group’s cost of sales in
relation to the supply of communication services mainly includes
the costs to purchase equipment, salaries and related expenses,
service costs, royalties, ongoing license dues, interconnection and
roaming expenses, cell tower lease costs, depreciation and
amortization expenses and maintenance expenses directly related to
the services provided.
The
cost of sales of supermarkets, includes the acquisition costs for
the products less discounts granted by suppliers, as well as all
expenses associated with storing and handling inventories and is
classified as discontinued operations.
2.27
Cost
of borrowings and capitalization
The
costs for general and specific loans that are directly attributable
to the acquisition, construction or production of suitable assets
for which a prolonged period is required to place them in the
conditions required for their use or sale, are capitalized as part
of the cost of those assets until the assets are substantially
ready for use or sale. The general loan costs are capitalized
according to the average debt rate of the Group. Foreign exchange
differences for loans in foreign currency are capitalized if they
are considered an adjustment to interest costs. The interest earned
on the temporary investments of a specific loan for the acquisition
of qualifying assets are deducted from the eligible costs to be
capitalized. The rest of the costs from loans are recognized as
expenses in the period in which they are incurred.
2.28
Share
capital
Ordinary shares are
classified as equity. Incremental costs directly attributable to
the issue of new ordinary shares or options are shown in equity as
a deduction, net of tax, from the proceeds.
When
any Group’s subsidiary purchases the Company’s equity
share capital (treasury shares), the consideration paid, including
any directly attributable incremental costs (net of income taxes)
is deducted from equity attributable to the Company’s equity
holders until the shares are cancelled or reissued. When such
ordinary shares are subsequently reissued, any consideration
received, net of any directly attributable incremental transaction
costs and related income tax effects, is included in
equity.
Instruments issued
by the Group that will be settled by the Company delivering a fixed
number of its own equity instruments in exchange for a fixed amount
of cash or another financial asset are classified as
equity.
2.29
Comparability
of information
The
balances as of June 30, 2019 and 2018 that are disclosed for
comparative purposes were restated in accordance with IAS 29, see
Note 2.1. Certain items from prior fiscal years have been
reclassified for consistency purposes. See Note 4. d. for the loss
of control of Shufersal and Note 4.c for the loss of control of
Gay-Yam.
During
the years ended June 30, 2020, 2019 and 2018, the Argentine Peso
suffered a decrease in its value compared to the US dollar and
other currencies close to 66%, 45% and 73%, respectively, which has
an impact on the comparability of the figures exposed in the
financial statements, mainly due to the exposure to the exchange
rate of our Income and costs of “offices” segment, and
our assets and liabilities, nominated in foreign currency of the
Argentine operations center, the aforementioned devaluation also
had an effect on the total balances of the Israel operations
center.
F-32
Cresud Sociedad Anónima,
Comercial, Inmobiliaria, Financiera y Agropecuaria
3.
Significant
judgments, key assumptions and estimates
Not all
of these significant accounting policies require management to make
subjective or complex judgments or estimates. The following is
intended to provide an understanding of the policies that
management considers critical because of the level of complexity,
judgment or estimations involved in their application and their
impact on the Consolidated Financial Statements. These judgments
involve assumptions or estimates in respect of future events.
Actual results may differ from these estimates.
|
Estimation
|
Main assumptions
|
Potential implications
|
Main references
|
|
Business
combination - Allocation of acquisition prices
|
Assumptions
regarding timing, amount of future revenues and expenses, revenue
growth, expected rate of return, economic conditions, and discount
rate, among other.
|
Should
the assumptions made be inaccurate, the recognized combination may
not be correct.
|
|
|
Recoverable
amounts of cash-generating units (even those including goodwill),
associates and assets.
|
The
discount rate and the expected growth rate before taxes in
connection with cash-generating units.
The
discount rate and the expected growth rate after taxes in
connection with associates.
Cash
flows are determined based on past experiences with the asset or
with similar assets and in accordance with the Group’s best
factual assumption relative to the economic conditions expected to
prevail.
Business
continuity of cash-generating units.
Appraisals
made by external appraisers and valuators with relation to the
assets’ fair value, net of realization costs (including real
estate assets).
|
Should
any of the assumptions made be inaccurate; this could lead to
differences in the recoverable values of cash-generating
units.
|
Note 10
– Property, plant and equipment
Note 12
– Intangible assets
|
|
Control,
joint control or significant influence
|
Judgment
relative to the determination that the Group holds an interest in
the shares of investees (considering the existence and influence of
significant potential voting rights), its right to designate
members in the executive management of such companies (usually the
Board of directors) based on the investees’ bylaws; the
composition and the rights of other shareholders of such investees
and their capacity to establish operating and financial policies
for investees or to take part in the establishment
thereof.
|
Accounting
treatment of investments as subsidiaries (consolidation) or
associates (equity method)
|
|
|
Estimated
useful life of intangible assets and property, plant and
equipment
|
Estimated
useful life of assets based on their conditions.
|
Recognition
of accelerated or decelerated depreciation by comparison against
final actual earnings (losses).
|
|
|
Fair
value valuation of investment properties
|
Fair
value valuation made by external appraisers and valuators. See Note
10.
|
Incorrect
valuation of investment property values
|
|
|
Income
tax
|
The
Group estimates the income tax amount payable for transactions
where the Treasury’s Claim cannot be clearly
determined.
Additionally,
the Group evaluates the recoverability of assets due to deferred
taxes considering whether some or all of the assets will not be
recoverable.
|
Upon
the improper determination of the provision for income tax, the
Group will be bound to pay additional taxes, including fines and
compensatory and punitive interest.
|
|
|
Allowance
for doubtful accounts
|
A
periodic review is conducted of receivables risks in the
Group’s clients’ portfolios. Bad debts based on the
expiration of account receivables and account receivables’
specific conditions.
|
Improper
recognition of charges / reimbursements of the allowance for bad
debt.
|
|
|
Level 2
and 3 financial instruments
|
Main
assumptions used by the Group are:
●
Discounted
projected income by interest rate
●
Values determined
in accordance with the shares in equity funds on the basis of its
Financial Statements, based on fair value or investment
assessments.
●
Comparable market
multiple (EV/GMV ratio).
●
Underlying
asset price (Market price); share price volatility (historical) and
market interest rate (Libor rate curve).
|
Incorrect
recognition of a charge to income / (loss).
|
Note 16
– Financial instruments by category
|
|
Probability
estimate of contingent liabilities.
|
Whether
more economic resources may be spent in relation to litigation
against the Group, such estimate is based on legal advisors’
opinions.
|
Charge
/ reversal of provision in relation to a claim.
|
|
|
Qualitative
considerations for determining whether or not the replacement of
the debt instrument involves significantly different
terms
|
The
entire set of characteristics of the exchanged debt instruments,
and the economic parameters represented therein:
Average
lifetime of the exchanged liabilities; Extent of effects of the
debt terms (linkage to index; foreign currency; variable interest)
on the cash flows from the instruments.
|
Classification
of a debt instrument in a manner whereby it will not reflect the
change in the debt terms, which will affect the method of
accounting recording.
|
(Financial
liabilities)
|
|
Biological
assets
|
Main
assumptions used in valuation are yields, production costs, selling
expenses, forwards of sales prices, discount rates.
|
Wrong
recognition/valuation of biological assets. See sensitivities
modeled on these parameters in Note 13.
|
|
F-33
Cresud Sociedad Anónima,
Comercial, Inmobiliaria, Financiera y Agropecuaria
4.
Acquisitions
and disposals
Agricultural
business
(a)
Sale
and purchase of Farmlands
Acquisition of Serra Grande Farmland
On May
18, 2020, the Group through its subsidiary BrasilAgro purchased a
farm in Baixa Grande do Ribeiro, Piauí of 4,500 hectares (of
which 2,900 can be developed for crop production). The amount of
the acquisition was set at BRL 25 million (equivalent ARS 316
million), with an initial payment of BRL 8 million (equivalent ARS
101 million). The balance will be cancelled in three annual
installments.
Sale of Alto Taquari Farmland
On May
29, 2020, the Group through its subsidiary BrasilAgro has entered
into a purchase-sale agreement for an area of 105 hectares of Alto
Taquari farm. The total amount of the sale was 115,478 soybean bags
per arable hectare equivalent BRL 11 million (equivalent ARS 139
million). The buyer made the initial payment of BRL 1,8 million
(equivalent ARS 22 million). The remaining balance will be paid in
five annual installments. The Company has recognized gains of BRL 8
million (equivalent ARS 100 million) as result of this
transaction.
On
October 29, 2019, the Group through its subsidiary BrasilAgro has
entered into a purchase-sale agreement for an area of 85 hectares
(65 are production hectares) of Alto Taquari farm, a rural property
located in the municipality of Alto Taquari, for a total amount of
BRL 5.5 (equivalent ARS 94 million). The same date, the buyer made
the initial payment of 14,300 soybean bags per arable hectare
equivalent BRL 1 million (equivalent ARS 18 million). The remaining
balance will be paid in four annual installments. The Company has
recognized gains of BRL 4 million (equivalent ARS 68 million) as
result of this transaction.
On
November 21, 2018, the Group through its subsidiary BrasilAgro has
entered into a purchase-sale agreement for an area of 103 hectares
of Alto Taquari farm. The total amount of the sale was 1,100
soybean bags per arable hectare equivalent to R$ 7 (equivalent to
Ps. 114). The buyer made the initial payment of 22,656 soybeans
bags equivalent to equivalent to R$ 1.5 (equivalent to Ps. 17); and
the remaining balance will be paid in eight biannual installments.
The Company has recognized gains of R$ 5 (equivalent to Ps. 91) as
result of this transaction.
Jatobá
On June
30, 2020, the Group through its subsidiary BrasilAgro has entered
into a purchase-sale agreement for an area of 1,875 hectares (1,500
are production hectares) of Jatobá farm. The total amount of
BRL 45 million (equivalent ARS 567 million), of which BRL 5 million
(equivalent ARS 63 million) were already collected. The remaining
balance will be paid in six annual installments. The Company has
recognized gains of BRL 32.8 million (equivalent ARS 413 million)
as result of this transaction.
On July
11, 2019, the Group through its subsidiary BrasilAgro has entered
into a purchase-sale agreement for an area of 1,134 hectares (893
are production hectares) of Jatobá Farmland, a rural property
located in the municipality of Jaborandi – BA. The total
amount of sale was 302 soybean bags per arable hectare equivalent
or BRL 23 million (equivalent ARS 394 million). The buyer, on
September 2, 2019 made the initial payment of 38,000 soybean bags
per arable hectare equivalent BRL 3 million (equivalent ARS 45
million). The remaining balance will be paid in six annual
installments. Handover of possession and gains as result of this
transaction has recognized on September 30, 2019, approximately,
BRL 17 million (equivalent ARS 272 million).
On June
2019, the Group through its subsidiary BrasilAgro has entered into
a purchase-sale agreement for an area of 3,124 hectares of
Jatobá Farm. The total amount of the sale was 285 soybean bags
per arable hectare or R$ 47 (equivalent to Ps. 776). The buyer
already made an initial payment of R$ 5 (equivalent to Ps. 83) and
on July 31, 2019 had pay R$ 5 (equivalent to Ps. 83) more; and the
remaining balance, equivalent to 563,844 soybeans bags, will be
paid in six equal annual installments. This sale was accounted on
June 30, 2019, the gain of this transaction amount R$ 36.5
(equivalent to Ps. 573).
On June
13, 2018, the Group, through its subsidiary BrasilAgro, entered
into a sales agreement for a total area of 9,784 hectares (7,485
are production hectares) of the Jatobá Establishment, a rural
property located in the Municipality of Jaborandi . On July 31,
2018, the buyer made the payment of the first installment of
300,000 bags of soybeans, equivalent to an amount of R$ 21
(equivalent to Ps. 223) according to the conditions set in the
agreement, obtaining the transfer of the possession and thus
recognizing the disposal of the farmland
, for
the value of 285 bags per useful hectare, equivalent R$ 123
(equivalent to $ 1,309).. The remaining balance will be paid in six
annual installments. The group did not recognize the result of this
operation since almost all of the hectares sold corresponded to the
Investment Property, and therefore were valued at fair
value.
F-34
Cresud Sociedad Anónima,
Comercial, Inmobiliaria, Financiera y Agropecuaria
La Suiza
On June
29, 2018 Cresud signed a deed with a non-related third party for
the sale of a fraction of 10,000 hectares of livestock activity of
"La Suiza". The total amount of the transaction was set at US$ 10,
of which US$ 3 have been already paid. The remaining balance of US$
7, guaranteed by a mortgage on the property, will be collected in
10 installments of the same amount ending on June 2023, which will
accrue an annual interest of 4.5% on the remaining balances. The
gain of the transaction amounts approximately to Ps.
380.
La Esmeralda
On July
20, 2017, we executed a purchase-sale agreement for all of
“La Esmeralda” establishment consisting of 9,352
hectares devoted to agricultural and cattle raising activities in
the 9 de Julio district, Province of Santa Fe, Argentina. On June
25, 2018, the Company has made effective with the sign of the deed
and delivery of the property, the sale of "La Esmeralda" farm. The
amount of the transaction was set at US$ 19, of which US$ 7 have
been already paid. The balance, guaranteed with a mortgage on the
property, will be collected in 4 installments of the same amount
ending in April 2022, which will accrue an annual interest of 4% on
the remaining balances. The gain from the sale amounts
approximately to Ps. 686.
Araucária
On May
3, 2018, the Company through its subsidiary Brasilagro, has entered
into a purchase-sale agreement for the partial sale 956 hectares
(660 arable hectares) of Araucaria Farm, located in Mineiros,
Brazil, for an amount of 1,208 soybean bags per arable hectare or
Rs. 66.2 (equal to Ps. 639.2) (Rs./ha. 93,356). The company has
recognized gains of Ps. 590 as result of this
transaction.
(b)
Merger
of BrasilAgro-Agrifirma, Purchase and Sale of BrasilAgro
Shares
Sale of BrasilAgro’s shares
On
January 20, 2020, the Company sold in the market 3,400,000 shares
of its subsidiary BrasilAgro representatives of 6.30% of the share
capital for an amount of USD 15.6 million (equivalent ARS 962
million).
Agrifirma
On
January 27, 2020, and in accordance with the terms and conditions
established in the Merger Agreement signed on November 22, 2019,
Agrifirma Holding was merged by BrasilAgro and extinguished for all
legal purposes, becoming BrasilAgro the controlling shareholder of
Agrifirma Agropecuária owning 100% of the total voting share
capital. The capital of BrasilAgro increased by BRL 115,586,580
from BRL 584,224,000 to BRL 699,810,577, through the issuance of
5,215,385 new common, registered, book-entry shares with no par
value, which were subscribed and paid-up by the shareholders of
Agrifirma Holding, in such manner that the share capital of
BrasilAgro increased to 62,104,201 shares.
A
subscription warrant was also issued in favor of AB Holdings, a
shareholder of Agrifirma Holding, which will entitle AB Holding (or
its permitted successors and assigns) to subscribe up to 654,487
new ordinary shares, registered with no par value of BrasilAgro,
subject to the terms and conditions established in the Merger
Agreement.
The
merger was made upon exchange of shares and the initial exchange
rate was BRL 31.50 per share of BrasilAgro based on the net worth
of BrasilAgro and Agrifirma Holding, as of June 30, 2019 (taken
into consideration, especially, the properties owned by BrasilAgro
and Agrifirma Holding) as per the appraisal made by Deloitte Touche
Tohmatsu Consultores Ltda., adjusted in view of the negotiations
between the parties, in accordance with the Merger
Agreement.
F-35
Cresud Sociedad Anónima,
Comercial, Inmobiliaria, Financiera y Agropecuaria
Below
is a breakdown of the fair value of the assets acquired,
liabilities assumed and minority interest of the
acquisiton:
|
|
03.31 20
|
|
Fair
value of identifiable assets and assumed liabilities:
|
|
|
Cash and cash
equivalents
|
16
|
|
Trade and other
receivables
|
387
|
|
Inventories
|
22
|
|
Biological
assets
|
74
|
|
Taxes and
contributions to recover
|
45
|
|
Group of assets
held for sale
|
362
|
|
Property, plant and
equipment
|
3,365
|
|
Trade and other
payables
|
(297
)
|
|
Borrowings
|
(1,884
)
|
|
Taxes to
pay
|
(9
)
|
|
Payroll and social
security liabilities
|
(43
)
|
|
Provisions
|
(1
)
|
|
Deferred income tax
liabilities
|
(423
)
|
|
Total
identifiable net assets
|
1,614
|
|
Non-controlling
interest
|
-
|
|
Key pending
allocation
|
63
|
|
Total consideration
|
1,677
|
Acquisition of Brasilagro’s shares
On
March 30, 2020, Cresud purchased in the market 19,100 ordinary
shares of its subsidiary BrasilAgro, representing 0.03% of its
issued capital, for an amount of ARS 6 million.
As a
result of the above-mentioned sale and purchase of shares and the
merger with Agrifirma, the Company reduced its equity interest in
BrasilAgro from 43.17% to 33.55% of its issued
capital.
On June
29, 2020, Cresud made a contribution in kind to the 100% its
controlled subsidiary Helmir S.A. It corresponds to 18,576,400 ADRs
of BrasilAgro Comphania de Propriedades Agrícolas, in which
the Company currently participates as a shareholder. The total
value was USD 69.7 million (equivalent to ARS 4,892 million). At
the end of the fiscal year, the Cresud percentage, the percentage
of direct ownership is 2.25% and the percentage of indirect
ownership through Helmir is 31.30%. In this way, Cresud will
continue to control BrasilAgro indirectly through its control of
Helmir S.A.
Although
Cresud maintains less than 50% of the voting rights, in accordance
with IFRS, control may exist without a majority of voting
rights.
Cresud
exercises “de facto control” over BrasilAgro as a
result of:
i)
the percentage and
concentration of voting rights of the Group and the absence of
other shareholders with significant voting rights,
ii)
the absence of a
voting agreement among the other shareholders to vote together as a
group,
iii)
the record of
attendance to Shareholders’ Meetings and the record of votes
casted by the other shareholders; and
iv)
the effective
control exercised by the Group to direct Brasilagro’s
relevant activities through its seat in the Board of Directors. See
Note 7 for further information regarding to
Brasilagro.
Therefore, Cresud
will continue to consolidate BrasilAgro in its financial
statements, after the business combination with
Agrifirma.
Urban
properties and investments business
Operations
Center in Argentina
(b)
Distribution
of a dividend in kind
On
October 30, 2019, the General Ordinary Shareholders´ Meeting
approved the distribution of a dividend in kind for an equivalent
of Ps. 480 (representing Ps. 0.83 per share and equivalent of Ps.
589 at current currency as of June 30, 2020) payable in IRSA CP
shares. For distribution, the quoted price of the IRSA CP share was
taken as of October 29, 2019, which was Ps. 205 per share. The
number of shares distributed amounts to 2,341,463. This transaction
was accounted for in equity as a decrease in the net equity
attributable to the parent company for an amount of Ps.504,
restated as of the date of these financial statements. The stake of
the Group in IRSA CP as at year-end is 80.65%.
F-36
Cresud Sociedad Anónima,
Comercial, Inmobiliaria, Financiera y Agropecuaria
On
October 29, 2018 a General Ordinary and Extraordinary
Shareholder’s meeting was held, whereby the distribution of a
dividend in kind for an equivalent of Ps. 1,827 payable in shares
of IRSA CP S.A. was resolved (representing Ps 2.44 per share and
equivalent of Ps. 2,610 at current currency as of June 30, 2020).
For the distribution, the value of IRSA CP share was taken as of
October 26, 2018, which was Ps. 220 per share. The number of shares
distributed amounted to 6,418,182. This transaction was accounted
for as an equity transaction generating a decrease in the net
equity attributable to the parent for Ps. 1,534, restated as of the
date of these financial statements.
(c)
Sale
of IRSA CP floors
On June
9, 2020, IRSA CP executed the assignment and transfer the right to
sign a title deed, with delivery of possession, with respect to two
medium-height floors in the tower under construction known as
“200 Della Paolera”, located in the Catalinas district
of the Autonomous City of Buenos Aires, covering a total area of
approximately 2,430 sq. meters and 16 parking lots, located in the
building.
The
transaction price was set at approximately Ps. 1,165 million (USD
16.9 million), which has already been fully paid.
(d)
Condor
Merger Agreement
On July
19, 2019, Condor executed a merger agreement. As per the
contractual terms, each common share of Condor, with a par value of
USD 0.01 per share, shall be cancelled prior to the merger and
converted into the right to receive an amount in cash equivalent of
USD 11.10 per common share. Additionally, pursuant to the terms and
conditions of the merger agreement, each convertible Class E share
shall be automatically cancelled and shall be converted into the
right to receive an amount in cash equivalent of USD 10.00 per
share.
The
closing of the transaction, scheduled for March 23, 2020, has not
yet taken place.
Condor
is currently discussing with NexPoint Hospitality Trust the
potential amendments to restructure the previously reported
acquisition by merger of the company. No assurances may be given
with respect to the outcome of such discussions. The Company will
continue to review the options and reserves all its rights and
remedies under the original merger agreement.
As of
the date of presentation of these financial statements, the Group
has 2,197,023 common shares and 325,752 Series E
shares.
(e)
TGLT
– Recapitalization Agreement
On
August 8, 2019, we entered into certain arrangements with TGLT S.A.
(“TGLT”) providing for collaboration in TGLT’s
financial restructuring and recapitalization. We participated in
the recapitalization agreement whereby TGLT committed: (i) to make
a public offer to subscribe Class A preferred shares at a
subscription price of USD 1.00 per TGLT share; (ii) to make a
public offering of new Class B preferred shares which may be
subscribed by (a) the exchange for ordinary shares of TGLT, at an
exchange ratio of one Class B preferred share for every 6.94
ordinary shares of the Company and / or (b) the exchange for
convertible notes, at an exchange ratio of a Class B preferred
share for each USD 1.00 of convertible notes (including accumulated
and unpaid interests under the existing convertible notes); and
(iii) to grant an option to subscribe new Class C preferred shares
in a public offer for cash to be carried out if: (a) the public
offer of Class A and Class B preferred shares are consummated and
(b) a minimum number of option holders have exercised that option
at a subscription price per Class C preferred share of USD 1.00 (or
its equivalent in pesos).
Likewise, IRSA CP
signed as a holder of convertible notes of TGLT an agreement for
deferment of payment of interest payable as of February 15, 2019
and August 15, 2019 until November 8, 2019 and an option agreement
which may be subscribed Class C preferred shares.
Finally, supporting
the recapitalization plan, IRSA CP signed with TGLT a subscription
commitment for Class A preferred shares under Class A Public Offer
to make a contribution in kind of shares of the company La
Maltería SA, 100% of its ownership, for an amount up to USD 24
million and promised to exchange its convertible negotiable
obligations into preferred Class B shares.
In
turn, on November 22, 2019, TGLT held a bondholders of convertible
negotiable obligations meeting in order to consider the
modification of different clauses of the indenture in force at that
date, and in line with what was agreed in the recapitalization
agreement , IRSA CP voted in favor of the
modifications.
F-37
Cresud Sociedad Anónima,
Comercial, Inmobiliaria, Financiera y Agropecuaria
Under
the agreements described above, the successful consummation of the
offer by TGLT, and having reached the thresholds of consent of the
holders of convertible notes of TGLT, on December 11, 2019, the
Company concluded the envisaged process in the recapitalization
agreement and related documents through the subscription of
preferred Class A shares, integrating them in kind through the
contribution of the shares of the company La Maltería SA, 100%
of their ownership and, likewise, proceeded to the exchange of the
convertible note - including deferred interest and accrued interest
from August 15, 2019 to December 11, 2019 - in preferred Class B
shares.
During
the fiscal year 2020, preferred shares were converted into ordinary
shares, which is why IRSA CP begin to have significant influence,
considering TGLT S.A. as an associate company.
(f)
Sale
of Tarshop
On
February 14, 2019, IRSA CP sold its entire stake in Tarshop to
BHSA. Following this acquisition, BHSA became the holder of 100% of
the capital stock of said company.
The
loss recognized for this transaction was approximately Ps. 177,
restated as of the date of these financial statements.
(g)
Purchase
of equity interest in HASAU (owner of Libertador
Hotel)
On
February 28, 2019, the Group reported the acquisition, from an
unrelated third party, of the twenty percent (20%) of HASAU for an
amount of US$ 1.2. As a result of this acquisition, IRSA holds 100%
of HASAU's share capital. This transaction was accounted for as an
equity transaction generating a decrease in the net equity
attributable to the controlling shareholders by Ps. 3 restated at
the date of these financial statements.
Operations
Center in Israel
(h)
Partial
sale of Clal
Sales and Swap transactions
On May
1, 2017, August 30, 2017, January 1, 2018, May 3, 2018, August 30,
2018, and January 2, 2019, continuing with the instructions given
by the Israel Capital Market, Insurance and Savings Commission,
IDBD sold 5% of its stake in Clal on each occasion and 4.5% on the
last one respectively, with a subsequent swap transaction with a 2-
year expiration term for each transaction. The consideration for
the transactions amounted to approximately NIS 944.5, which is
partially restricted according to these agreements until the swap
expires. These transactions did not meet the de-recognition
criteria so the Group maintains the asset as “Financial
assets available for sale” and accounted for the loans as a
financial liability.
On
December 16, 2019, Clal made a public capital increase for
12,066,000 shares at a price of NIS 53.87 per share. IDBD did not
take part in such transaction.
Additionally, on
that date, IDBD sold 200,000 Clal shares at a price of NIS 53.95
per share, representing 0.3% of the new capital stock.
On
December 18, 2019, IDBD sold 617,017 Clal shares at an average
price of NIS 53.77 per share, representing 0.9% of the issued
capital stock.
Furthermore, a swap
transaction carried out by IDBD involving 2,771,309 shares expired
in December 2019. The closing price was NIS 52.25 per
share.
A swap
transaction involving 751,000 shares expired within the
January-March 2020 period. The closing price was NIS 45.09 per
share.
Other sales agreements
On May
2, 2019, continuing with the instructions given by the Israel
Capital Market, Insurance and Savings Commission, IDBD entered into
sales agreements with two unrelated parties (the
“Buyers”), according to which each of the Buyers will
acquire Clal shares representing 4.99% of its share capital at a
cash price of NIS 47.7 per share (approximately Ps. 602 per share).
In addition, they were granted an option to acquire additional Clal
shares for approximately 3% of the issued capital, for a period of
120 days (subject to obtaining a holding permit) at a price of NIS
50 per share.
F-38
Cresud Sociedad Anónima,
Comercial, Inmobiliaria, Financiera y Agropecuaria
Additionally on the
same day, IDBD also entered into an agreement with a third
unrelated buyer (the "Additional Buyer"), according to which the
Additional Buyer will receive an option from IDBD, valid for a
period of 50 days, to acquire approximately 4.99% of Clal shares
(and not less than 3%), at a price of NIS 47.7 per share
(approximately Ps. 602 per share). Subject to the exercise of the
option by the Additional Buyer, the price will be paid 10% in cash
and the rest through a loan that will be provided to the Additional
Buyer by IDBD and / or by a related entity and / or by a banking
corporation and / or financial institution, under the agreed
conditions.
The
aforementioned agreements include, among others, a commitment by
the Buyers and the Additional Buyer to not sell the shares acquired
during an agreed period of 24 months. It is clarified that each of
the Buyers and the Additional Buyer have declared and committed to
IDBD that there are no agreements or understandings between them
regarding the joint ownership of Clal shares that are subject to
the aforementioned agreements.
The
total amount of Clal shares that can be acquired by the three
buyers mentioned above, to the extent that the three agreements are
completed and the options are exercised, represents approximately
18% of Clal's share capital.
As of
the date of these financial statements, all previously agreed sales
transactions have been consummated.
On June
28 and July 6, 2020, IDBD sold 4,791,618 Clal shares held by it
through swap transactions, at an average price of approximately NIS
30 per share, representing 7.1% of the capital stock.
Additionally, on
September 3, 2020, IDBD sold 2,376,527 Clal shares at an average
price of NIS 32,475 per share, for a total amount of NIS 77.2
million, representing 3.5% of Clal´s capital
stock.
As a
result of the aforementioned transactions, as of this date,
IDBD´s holding in Clal represents 4.99% of its capital stock.
It no longer has swap transactions and, accordingly, it is no
longer considered as Clal interested party within the context of
Israel´s Securities Regulations.
On
February 4, 2020, Dolphin furnished to the financial entities
through which IDB carried out the swap transactions of Clal shares
in August and November 2018, guarantees of approximately NIS 11
million, which shall be part of the committed deposits that IDB
undertook as part of the terms of such transactions. Furthermore,
on February 18, it deposited further guarantees in the amount of
NIS 9 million. Following the last sale described above, the
guarantees were returned.
(i)
Distribution
of dividends in kind by PBC. Purchase of Mehadrin shares and
acquisition of control
On
December 10, 2019, PBC distributed its entire holding in Mehadrin
as a dividend in kind and, as a result, DIC holds, directly, a
31.4% interest in Mehadrin. As a consequence of such transaction,
Mehadrin became an associate.
In
January and February 2020, DIC purchased approximately 8.8% of
Mehadrin’s capital stock, for a total cost of NIS 39
(approximately Ps. 712); therefore, the interest in Mehadrin has
increased from 31.4% to approximately 40.2%. Such acquisitions
resulted in DIC obtaining control over Mehadrin, by the end of
February, as it has the majority votes while the remaining equity
interests are distributed among several shareholders.
Additionally, from
April to June 2020, DIC purchased an additional 3.5% interest in
Mehadrin for NIS 14 (approximately Ps. 277), increasing its
interest to 43.7%.
Following the
taking of control, as mentioned above, since March 9, 2020, the
Group has consolidated the operations of this company.
Below
is a detail of incorporated net assets and income from such
transaction. The process for the assessment of the fair value of
incorporated net assets has been significantly completed as of June
30, 2020 and it is expected to conclude in the first months of the
fiscal year ending June 30, 2021. However, the Management does not
foresee any material adjustments to the incorporated net assets
detailed below:
F-39
Cresud Sociedad Anónima,
Comercial, Inmobiliaria, Financiera y Agropecuaria
|
|
03.31.2020
|
|
Fair value of identifiable assets and liabilities
incurred
|
|
|
Investment
properties
|
244
|
|
Property,
plant and equipment
|
6,108
|
|
Intangible
assets
|
57
|
|
Investments
in associates and joint ventures
|
1,879
|
|
Restricted
assets
|
164
|
|
Income
tax receivables
|
146
|
|
Trade
and other receivables
|
10,211
|
|
Rights
of use
|
4,019
|
|
Derivative
financial instruments
|
37
|
|
Inventories
|
2,503
|
|
Borrowings
|
(7,363
)
|
|
Deferred
income tax liabilities
|
(945
)
|
|
Trade
and other payables
|
(4,711
)
|
|
Lease
liabilities
|
(2,119
)
|
|
Provisions
|
(56
)
|
|
Employee
benefits
|
(128
)
|
|
Salaries
and social security liabilities
|
(201
)
|
|
Income
Tax
|
(18
)
|
|
Cash
and cash equivalents
|
2,612
|
|
TOTAL IDENTIFIABLE NET ASSETS
|
12,439
|
|
Non-controlling
interest
|
(7,443
)
|
|
Negative
goodwill (*)
|
(376
)
|
|
Write-off
of Investments in associates
|
3,908
|
|
Cash
and cash equivalents
|
712
|
|
TOTAL CONSIDERATION
|
4,620
|
(*)
Included in “Other operating income, net”
(j)
Partial
sale of equity interests in Gav-Yam
On July
1, 2019, PBC sold approximately 11.7% of Gav-Yam´s capital
stock by private agreements. Following this transaction, PBC´s
interest in Gav-Yam decreased from 51.7% to 40%. The consideration
received for such sale was NIS 46 (approximately $ 6,949, restated
as of the date of these financial statements).
Furthermore, on
September 1, 2019, PBC sold an additional 5.14%, approximately, of
Gav-Yam shares and, as a result, PBC´s interest in Gav-Yam
decreased from 40% to 34.9%. As a consequence of such sales, PBC
forfeited its right to nominate the majority members of the Board
of Directors and to appoint or remove key management members.
Accordingly, PBC has lost its control over Gav-Yam and has
de-consolidated such investment since such date.
Below
are the details of the sale:
|
|
09.30.2019
|
|
Cash
received
|
14,261
|
|
Remediation
of the fair value of the remaining interest
|
32,165
|
|
Total
|
46,426
|
|
Net
assets disposed including goodwill
|
(28,128
)
|
|
Gain
from the sale of a subsidiary, net of taxes (*)
|
18,298
|
(*)
Said results are disclosed within discontinued operations, under
the caption "other operating results, net"
F-40
Cresud Sociedad Anónima,
Comercial, Inmobiliaria, Financiera y Agropecuaria
The
following table details the net assets disposed:
|
|
09.30.2019
|
|
Investment
properties
|
155,846
|
|
Property,
plant and equipment
|
1,061
|
|
Intangible
assets
|
3,281
|
|
Right-of-use
assets
|
42
|
|
Investments
in associates and joint ventures
|
4,396
|
|
Restricted
assets
|
378
|
|
Trade
and other receivables
|
1,157
|
|
Investments
in financial assets
|
13,544
|
|
Trading
properties
|
155
|
|
Income
tax credit
|
190
|
|
Cash
and cash equivalents
|
10,623
|
|
TOTAL ASSETS
|
190,673
|
|
Borrowings
|
95,443
|
|
Lease
liabilities
|
42
|
|
Deferred
income tax liabilities
|
21,151
|
|
Trade
and other payables
|
2,398
|
|
Employee
benefits
|
21
|
|
Salaries
and social security liabilities
|
63
|
|
Income
tax and MPIT liabilities
|
125
|
|
TOTAL LIABILITIES
|
119,243
|
|
Non-controlling
interest
|
43,301
|
|
Net assets written off including business key
|
28,128
|
On
January 12, 2020, PBC received a communication from the Ministry of
Justice of Israel questioning the loss of control of Gav-Yam in
September 2019 and, accordingly, raising its objections to
observance by PBC of the concentration law in Israel.
In May
2020, PBC agreed to sell approximately 4.96% of Gav-Yam´s
capital stock to an unrelated third party. Therefore, its interest
in Gav-Yam decreased from 34.9% to 29.9% after the consummation of
the sales transaction and it was thus able to overcome the
questioning from the Ministry of Justice of Israel.
(k)
Changes
in equity interest in Shufersal and loss of control
On
December 24, 2017, DIC sold Shufersal shares, decreasing its stake
from 53.30% to 50.12%. The consideration with respect to the sale
of the shares amounted to NIS 169.5 (equivalent to Ps. 2,148). Both
transactions were accounted for as an equity transaction generating
an increase in equity attributable to the controlling company
for
Ps. 727
and Ps. 976, respectively.
On June
16, 2018, DIC announced the sale of a percentage of its stake in
Shufersal to institutional investors which was completed on June
21, 2018. The percentage sold amounted to 16.56% and the net amount
of the consideration was approximately NIS 848 (equivalent to Ps.
13,845), consequently DIC lost control of Shufersal, so the Group
deconsolidated the subsidiary at that date.
Below
are the details of the sale:
|
|
06.30.2018
|
|
Cash
received
|
14,275
|
|
Remediation
of the fair value of the remaining interest
|
29,271
|
|
Total
|
43,546
|
|
Net
assets disposed including goodwill
|
(18,902
)
|
|
Gain
from the sale of a subsidiary, net of taxes (*)
|
24,644
|
(*)
Includes Ps. 5,856 as a result of the sale and Ps. 18,789 as a
result of the re-measurement at the fair value of the new stake,
both included in discontinued operations.
F-41
Cresud Sociedad Anónima,
Comercial, Inmobiliaria, Financiera y Agropecuaria
The
following table details the net assets disposed:
|
|
06.30.2018
|
|
Investment
properties
|
10,332
|
|
Property,
plant and equipment
|
64,484
|
|
Intangible
assets
|
16,203
|
|
Investments
in associates and joint ventures
|
892
|
|
Restricted
assets
|
203
|
|
Trade
and other receivables
|
32,516
|
|
Investments
in financial assets
|
280
|
|
Derivative
financial instruments
|
51
|
|
Inventories
|
13,955
|
|
Cash
and cash equivalents
|
12,404
|
|
TOTAL ASSETS
|
151,320
|
|
Borrowings
|
47,383
|
|
Deferred
income tax liabilities
|
6,244
|
|
Trade
and other payables
|
53,306
|
|
Provisions
|
1,025
|
|
Employee
benefits
|
2,812
|
|
Salaries
and social security liabilities
|
5,322
|
|
Income
tax and MPIT liabilities
|
17
|
|
TOTAL LIABILITIES
|
116,109
|
|
Non-controlling
interest
|
16,309
|
|
Net assets disposed including goodwill
|
18,902
|
Additionally, on
November 27, 2018, DIC sold 7.5% of the total shares of Shufersal
to institutional investors for a consideration of NIS 416 million
(approximately Ps. 7,266). After this transaction, the group
holding went down to 26.02% approximately. The profit for this sale
was NIS 27 (approximately Ps. 430). See Note 34 regarding the sale
of the entire equity interest.
(l)
Interest
increase in Cellcom
On June
27, 2018, Cellcom increased its capital stock in consideration for
a gross amount of NIS 280 (approximately Ps. 4,918). DIC
participated in such increase and disbursed NIS 145.9
(approximately Ps. 2,561) for 6,314,200 shares.
Furthermore, in
December 2018, DIC exercised 1.5 million options (Series 1) held by
it in Cellcom, for an amount of NIS 31 million (approximately Ps.
527). In December 2019 and February 2020, DIC purchased Cellcom
shares for NIS 19 million (approximately Ps. 357). As a consequence
of the exercise of the options and the acquisition, DIC interest in
Cellcom increased by 0.9%. These transactions were accounted for as
equity transactions generating a decrease in the net equity
attributable to the controlling company by Ps. 226, restated as of
the date of these financial statements.
Additionally, on
December 5, 2019, Cellcom increased its capital stock with the
participation of DIC that purchased almost 50% of the shares
issued. The consideration paid amounted to NIS 307 (approximately
Ps. 6,011 as of such date). Cellcom issued an aggregate number of
30,600,000 common shares, 7,038,000 Series 3 Options and 6,426,000
Series 4 Options at a price of NIS 1.021 per unit (each unit will
represent 100 common shares, 23 Series 3 Options and 21 Series 4
Options).
Following the
participation of DIC in such issue, the interest percentage was
46.2% of the issued capital stock and approximately 48.5% of the
Company´s voting rights (directly and by means of agreements
executed with other shareholders of the Company).
(m)
Sale
of IDBT subsidiary
On
August 14, 2018, IDBT´s Board of Directors approved an
agreement to sell 50% of a subsidiary of IDBT, entrusted with
tourism operations for Israir, for a total price of NIS 26
(approximately Ps. 506), which transaction was consummated on
December 31, 2018. Such transaction does not affect the intention
to sell IDBT in its entirety. The Group evaluated maintaining the
criteria to classify the investment as a discontinued operation
pursuant to IFRS 5.
F-42
Cresud Sociedad Anónima,
Comercial, Inmobiliaria, Financiera y Agropecuaria
(n)
Agreement
to sell plot of land in USA
In July
2019, a subsidiary of IDBG signed an agreement to sell a plot of
land next to the Tivoli project in Las Vegas for a consideration of
US$ 18 million. At this stage, no assurances may be given that the
sales transaction will be completed.
(o)
Sale
of Real Estate
In
October 2018, a subsidiary of Ispro signed an agreement for the
sale of all of its rights in real estate area of approximately 29
dunams (equivalent to 1 hectare), in which there are 12,700 square
meters in the northern industrial zone in Yavneh for NIS 86
million, (equivalent to Ps.6,439). Such agreement has already been
executed.
(p)
Interest
increase in PBC
In
December 2018 and February 2019, DIC acquired an additional 4.40%
of PBC in the market for NIS 81 million (equivalent to Ps.1,435).
The present transactions were accounted for as equity transactions,
generating an increase in net equity attributable to the
controlling company for Ps. 101, restated as of the date of these
financial statements. See Note 35
(q)
Repurchase
of own shares by DIC
In
December 2018, DIC's Board of Directors approved a plan to buy back
DIC shares, for a period of one year, until December 2020 amounting
up to NIS 120 million (approximately Ps.2,498). Acquisition of
securities shall be carried out in accordance with market
opportunities, dates, prices and quantities, as determined by the
management of DIC, in such a way that in any event, the public
holdings shall be, at any time, at least 10.1% of the total issued
share capital of DIC.
Since
December 2018 as of the fiscal year-end date, DIC acquired 12.2
million shares for a total amount of NIS 119 million (approximately
Ps. 2,040). Additionally, in December 2018, minority shareholders
of DIC exercised DIC Series 6 options for an amount of NIS 9
million (approximately Ps.174).
As a
result of the operations described above, the participation of
Dolphin IL in DIC increased approximately by 5.4%. The present
transactions were accounted for as equity transactions generating a
decrease in the equity attributable to the controlling company for
Ps. 133, restated as of the date of these financial
statements.
(r)
Interest
increase in Elron
In
November and December 2018, DIC acquired an additional 9.2% of
Elron in the market for NIS 31 million (equivalent to Ps. 557).
Additionally, in June 2020, Elron issued shares to the market and
third parties unrelated to the Group acquired an interest in the
Company in consideration for NIS 26. These transactions were
accounted for as an equity transaction generating a decrease in the
equity attributable to the controlling company for Ps.
64.
(s)
Interest
increase in DIC
On July
5, 2018, Tyrus acquired 2,062,000 of DIC’s shares in the
market for a total amount of NIS 20 million (equivalent to Ps.
490), which represent 1.35% of the Company’s outstanding
shares at such date. As a result of this transaction, the
Group’s equity interest has increased from 76.57% to 77.92%.
This transaction was accounted for as an equity transaction
generating an increase in the net equity attributable to the
controlling company by Ps. 46, restated as of the date of these
financial statements.
Considering was
what mentioned in note 4.G. above, the stake of the Group in DIC is
approximately 83.77% considering the repurchase of treasury
shares.
(t)
Early
payment of Ispro bonds
In
August 2019, the Audit Committee and the Board of Directors of
Ispro approved the full advance payment of (Tranche B) corporate
bonds, traded on the TASE. The aggregate amount was NIS 131
(approximately Ps. 2,465 restated as of the date of these financial
statements). The prepayment of these corporate bonds caused Ispro
to become a reporting company for TASE and not a listed
company.
F-43
Cresud Sociedad Anónima,
Comercial, Inmobiliaria, Financiera y Agropecuaria
(u)
Agreement
for the sale of Ispro
On
January 26, 2020, PBC executed an agreement for the sale of all
Ispro shares and the rights over the loans granted by the
shareholders to ISPRO in consideration for NIS 885. The
consummation of the transaction is subject to approval by the
Commissioner of Competition pursuant to the Law on Economic
Competition, which must be given within a term of 150 days
following the execution of the agreement. For this reason, the
Group has reclassified the assets and liabilities as available for
sale.
At the
time of the execution of the agreement, the buyer made a deposit of
NIS 15 into an account and undertook to deposit an additional
amount of NIS 40, following completion of the due diligence
process.
On
March 23, 2020, the buyer contacted PBC and requested a
postponement of the dates specified in the sales agreement. PBC
informed the buyer that its request would be considered without
detrimentally affecting PBC´s rights and obligations pursuant
to the agreement. On March 26, 2020, that is, the date of
completion of the due diligence process, the buyer defaulted on its
obligation to deposit the second payment installment in an amount
of NIS 40, into a trust account.
PBC
demanded the buyer to cure its default and immediately deposit the
second payment installment and proceed with the closing of the
transaction in accordance with its terms, without this entailing a
limitation on its rights and obligations and any consideration
available for the buyer pursuant to the agreement and under the
law, until April 20, 2020. Since non-compliance was not occurred
until April 20, 2020, the agreement was terminated.
In
April 2020, PBC executed an agreement with another buyer for NIS
800 involving all ISPRO shares and the rights over the loans
granted by PBC to ISPRO. As a consequence of the agreement for the
sale of ISPRO´s shares, the Group has reclassified net assets
totaling Ps. 15,473 as “Group of Assets available for
Sale”. Income to be recognized at the time of the
consummation of the transaction shall be NIS 47 (equivalent of Ps.
842 as of the current fiscal year-end).
(v)
Cellcom-
Golan Telecom Agreement
In
February 2020, Cellcom, the shareholders of Golan Telecom and Golan
Telecom executed a binding memorandum of understanding for the
acquisition of Golan Telecom entire capital stock, for a total
amount of NIS 590, payable in 2 installments (NIS 413 at the
closing date of the transaction and NIS 177 within a term of 3
years following such closing date). Cellcom shall issue and deposit
the Company´s shares for 8.2 million, with a trustee into a
trust account (“Shares held in Trust”), as
collateral.
The
transaction provides for standard conditions and representations
and is subject to a due diligence process to be performed by
Cellcom and the relevant regulatory authorizations and approvals
from material third parties. The parties shall carry out
negotiations regarding a detailed agreement; however, they are
bound to the memorandum of understanding, regardless of whether the
agreement may be executed or not. In the event the conditions for
the closing of the transaction were not satisfied before December
31, 2020, the memorandum of understanding or the detailed
agreement, as applicable, shall be terminated.
See
Note 40 for further information about the execution of the
agreement and the grant of the respective approvals.
5.
Financial
risk management and fair value estimates
The
Group's activities expose it to a variety of financial risks:
market risk (including foreign currency risk, interest rate risk,
indexing risk due to specific clauses and other price risks),
credit risk, liquidity risk and capital risk. Within the Group,
risk management functions are conducted in relation to financial
risks associated to financial instruments to which the Group is
exposed during a certain period or as of a specific
date.
The
general risk management policies of the Group seek both to minimize
adverse potential effects on the financial performance of the Group
and to manage and control the financial risks effectively. The
Group uses financial instruments to hedge certain risk exposures
when deemed appropriate based on its internal management risk
policies, as explained below.
F-44
Cresud Sociedad Anónima,
Comercial, Inmobiliaria, Financiera y Agropecuaria
Given
the diversity of characteristics in the activities conducted under
its business and operations center, the Group has decentralized the
risk management policies based on two significant line of business:
(i) agricultural business and (ii) urban properties and investments
business, which is divided into two: (a) Argentina and (b) Israel,
in order to identify and properly analyze the various types of
risks to which each of the subsidiaries is exposed.
The
Group’s main financial instruments in the agricultural
business and urban properties and investments business of the
Operation Center in Argentina comprise cash and cash equivalents,
receivables, payables, interest bearing assets and liabilities,
other financial liabilities, other investments and derivative
financial instruments. The Group manages its exposure to key
financial risks in accordance with the Group’s risk
management policies.
The
Group’s management framework includes policies, procedures,
limits and allowed types of derivative financial instruments. The
Group has established a Risk Committee, comprising members of
senior management and a member of the Audit Committee, which
reviews and oversees management’s compliance with these
policies, procedures and limits and has overall accountability for
the identification and management of risk across the
Group.
Given
the diversity of the activities conducted by the Operations Center
in Israel of the urban properties and investments business (IDBD,
DIC and its subsidiaries), and the resulting risks, IDBD and DIC
manage the exposure to their own key financial risks and those of
its wholly-owned subsidiaries (except for IDB Tourism) in
conformity with a centralized risk management policy, with the
non-wholly owned IDBD and DIC subsidiaries being responsible for
establishing the risk policy, taking action to cover market risks
and managing their activities in a decentralized way. Both IDBD and
DIC as holding and each subsidiary are responsible for managing
their own financial risks in accordance with agreed global
guidelines. The Chief Financial Officers of each entity are
responsible for managing the risk management policies and systems,
the definition of hedging strategies, insofar as applicable and
based on any restriction that may be apply as a result of financial
debt, the supervision of its implementation and the answer to such
restrictions. The management framework includes policies,
procedures, limits and allowed types of derivative financial
instruments.
This
section provides a description of the principal risks that could
have a material adverse effect on the Group’s strategy,
performance, results of operations and financial condition. The
risks facing the businesses, set out below, do not appear in any
particular order of potential materiality or probability of
occurrence.
The
analysis of sensitivities to market risks included below are based
on a change in one factor while holding all other factors constant.
In practice, this is unlikely to occur, and changes in some of the
factors may be correlated – for example, changes in interest
rate and changes in foreign currency rates.
This
sensitivity analysis provides only a limited, point-in-time view.
The actual impact on the Group’s financial instruments may
differ significantly from the impact shown in the sensitivity
analysis.
(a)
Market
risk management
Market
risk is the risk that the market prices, the fair value or the
future cash flows of financial instrument instruments with which
the Group operates will fluctuate due to changes in market prices.
The Group’s market risks arise from open positions in foreign
currencies, interest-bearing assets and liabilities, commodity
price risks and equity securities of certain companies, to the
extent that these are exposed to market value movements. The Group
sets limits on the exposure to these risks that may be accepted,
which are monitored on a regular basis.
Foreign Exchange risk and associated derivative financial
instruments
The
Group publishes its Consolidated Financial Statements in Argentine
pesos but conducts operations and holds positions in other
currencies. As a result, the Group is exposed to foreign currency
exchange risk through exchange rate movements, which affect the
value of the Group’s foreign currency positions. Foreign
exchange risk arises when future commercial transactions or
recognized assets or liabilities are denominated in a currency that
is not the entity’s functional currency.
The
Group's activities are carried out as follows:
1)
Agricultural business
: The commercial
and/or agro-industrial activities of the Group's subsidiaries are
primarily developed in Argentina and have as functional currency
the Argentine Peso. The agricultural activities of the
Group’s subsidiaries are primarily developed in Argentina,
Brazil and Bolivia, where the functional currencies are the
respective local currencies.
F-45
Cresud Sociedad Anónima,
Comercial, Inmobiliaria, Financiera y Agropecuaria
2)
Urban properties
and investments business:
-
Operation Center in Argentina
: The real
estate, commercial and/or financial activities of the Group’s
subsidiaries from the operations center in Argentina have the
Argentine Peso as functional currency. An important part of the
business activities of these subsidiaries is conducted in that
currency, thus not exposing the Group to foreign exchange risk.
Other Group's subsidiaries have other functional currencies,
principally US Dollar. In the ordinary course of business, the
Group, through its subsidiaries, transacts in currencies other than
the respective functional currencies of the subsidiaries. These
transactions are primarily denominated in US Dollars and New
Israeli Shekel.
-
Operation Center in Israel:
Real
estate, business and/or financial activities of IDBD subsidiaries
in the operations center in Israel are developed mainly in Israeli
currency, although some operations, mostly borrowing, are expressed
in United States’ dollars, thereby exposing IDBD to a foreign
currency risk.
An
important part of the business activities of these subsidiaries is
conducted in above-mentioned local currencies, thus not exposing
the Group to foreign exchange risk. Net financial position exposure
to the functional currencies is managed on a case-by-case basis,
partly by entering into foreign currency derivative instruments
and/or by borrowings in foreign currencies, or other methods,
considered adequate by the Management, according to
circumstances.
Financial
instruments are considered sensitive to foreign exchange rates only
when they are not in the functional currency of the entity that
holds them. The following tables shows the net carrying amounts of
the Company’s financial instruments nominated in US$, broken
down by the functional currencies in which the Company operates for
the years ended June 30, 2019 and 2018. The amounts are presented
in Argentine Pesos, the presentation currency of the
Group:
1)
Agricultural business
|
|
Net
monetary position (Liability) /
Asset
|
|
|
|
06.30.20
|
06.30.19
|
|
Functional
currency
|
US$
|
US$
|
|
Argentine
Peso
|
(31,328
)
|
(25,618
)
|
|
Brazilian
Reais
|
180
|
332
|
|
Bolivian
Peso
|
(103
)
|
(110
)
|
|
Total
|
(31,251
)
|
(25,396
)
|
The
Group estimates that, other factors being constant, a 10%
appreciation of the US dollar against the respective functional
currencies at year-end would result in a lower gain before income
tax for the years ended June 30, 2020 and 2019 for an amount of Ps.
3,125 and Ps. 2,539, respectively. A 10% depreciation of the US
dollar against the functional currencies would have an equal and
opposite effect on the Statements of Income.
On the
other hand, the Group also uses derivative instruments, such as
future foreign exchange contracts to manage its exposure to foreign
exchange risk. As of June 30, 2020, the Group has future exchange
contracts pending for an amount of Ps. 16 (asset) and Ps. 178
(liability). As of June 30, 2019, , the Group has future exchange
contracts pending for an amount of Ps. 44 (asset) and Ps. 36
(liability).
2)
Urban properties and investments business
Operation Center in Argentina
|
|
Net
monetary position (Liability) / Asset
|
|||
|
|
06.30.20
|
06.30.19
|
||
|
Functional currency
|
US$
|
NIS
|
US$
|
NIS
|
|
Argentine
Peso
|
(38,397
)
|
-
|
(21,134
)
|
-
|
|
Uruguayan
Peso
|
152
|
-
|
(274
)
|
-
|
|
Total
|
(38,245
)
|
-
|
(21,408
)
|
-
|
The
Group estimates that, other factors being constant, a 10%
appreciation of the US Dollar against the respective functional
currencies at year-end for the Operations Center in Argentina would
result in a net additional loss before income tax for the years
ended June 30, 2020 and 2019 for an amount of Ps. 1,497 and Ps.
2,140, respectively. A 10% depreciation of the US Dollar against
the functional currencies would have an equal and opposite effect
on the statements of income.
On the
other hand, the Group also uses derivatives, such as future
exchange contracts, to manage its exposure to foreign currency
risk. As of June 30, 2020 and 2019 the Group has future exchange
contracts pending for an amount of US$ 95 and US$ 22,
respectively.
F-46
Cresud Sociedad Anónima,
Comercial, Inmobiliaria, Financiera y Agropecuaria
Operation Center in Israel
As of
June 30, 2020 and 2019, the net position of financial instruments
in US Dollars, which exposes the Group to the foreign currency risk
amounts to Ps. (1,324) and Ps. (11,895), respectively. The Group
estimates that, other factors being constant, a 10% appreciation of
the US Dollar against the Israeli currency would increase loss
before income tax for the year ended June 30, 2020 for an amount of
Ps. 498 (Ps. 868 loss in 2019).
Interest rate risk
The
Group is exposed to interest rate risk on its investments in debt
instruments, short-term and long-term borrowings and derivative
financial instruments.
The
primary objective of the Group’s investment activities is to
preserve principal while at the same time maximizing yields without
significantly increasing risk. To achieve this objective, the Group
diversifies its portfolio in accordance with the limits set by the
Group. The Group maintains a portfolio of cash equivalents and
short-term investments in a variety of securities, including both
government and corporate obligations and money market
funds.
The
Group’s interest rate risk principally arises from long-term
borrowings (Note 21). Borrowings issued at variable rates expose
the Group to cash flow interest rate risk. Borrowings issued at
fixed rates expose the Group to fair value interest rate
risk.
The
Group manages this risk by maintaining an appropriate mix between
fixed and floating rate interest bearing liabilities. These
activities are evaluated regularly to determine that the Group is
not exposed to interest rate fluctuations that could adversely
affect its ability to meet its financial obligations and to comply
with its borrowing covenants.
The
Group occasionally manages its cash flow interest rate risk
exposure by different hedging instruments, including but not
limited to interest rate swap, depending on each particular case.
For example, interest rate swaps have the economic effect of
converting borrowings from floating rates to fixed rates or vice
versa.
The
interest rate risk policy is approved by the Board of Directors.
Management analyses the Group’s interest rate exposure on a
dynamic basis. Various scenarios are simulated, taking into
consideration refinancing, renewal of existing positions and
alternative financing sources. Based on these scenarios, the Group
calculates the impact on profit and loss of a defined interest rate
shift. The scenarios are run only for liabilities that represent
the major interest-bearing positions. Trade payables are normally
interest-free and have settlement dates within one year. The
simulation is done on a regular basis to verify that the maximum
potential loss is within the limits set by management.
Note 22
shows a breakdown of the Group’s fixed-rate and floating-rate
borrowings per currency denomination and functional currency of the
subsidiary that holds the loans for the fiscal years ended June 30,
2020 and 2019.
1)
Agricultural business
The
Group estimates that, other factors being constant, a 1% increase
in floating rates at year-end would increase net loss before income
tax for the years ended June 30, 2020 and 2019 in the amount of Ps.
44.0 and Ps. 32.8, respectively. A 1% decrease in floating rates
would have an equal and opposite effect on the Statement of
Income.
2)
Urban properties and investments business
Operation Center in Argentina
The
Group estimates that, other factors being constant, a 1% increase
in floating rates at year-end would increase net loss before income
tax for the years ended June 30, 2020 and 2019 in the amount of Ps.
30.9 and Ps. 31.2, respectively. A 1% decrease in floating rates
would have an equal and opposite effect on the Statement of
Income.
As of
June 30, 2020 and 2019, 95.2% and 94.1% of the Group’s
long-term financial loans in this operation center have a fixed
interest rate so that IRSA is not significantly exposed to the
fluctuation risk of the interest rate.
Operation Center in Israel
IDBD
and DIC manage the exposure to the interest rate risk in a
decentralized way and it is monitored regularly by different
management offices in order to confirm that there are no adverse
effects over their ability to meet their financial obligations and
to comply with their borrowings covenants.
As of
June 30, 2020 and 2019, the 99.4% and 97.1%, respectively, of the
Group’s long-term financial borrowings in this operations
center are at fixed interest rate, therefore, the Group is not
significantly exposed to the interest rate fluctuation
risk.
F-47
Cresud Sociedad Anónima,
Comercial, Inmobiliaria, Financiera y Agropecuaria
The
Group estimates that, other factors being constant, a 1% increase
in floating rates at year-end would increase net loss before income
tax for the year ended June 30, 2020, in approximately Ps. 56
(approximately Ps. 139 in 2019). A 1% decrease in floating rates
would have an equal and opposite effect on the Statement of
Income.
Commodity price risk and associated derivative financial
instruments
The
Group’s agricultural activities expose it to specific
financial risks related to commodity prices. Prices for commodities
have historically been cyclical, reflecting overall economic
conditions and changes in capacity within the industry, which
affect the profitability of entities engaged in the agricultural
industry.
Generally, the
Group uses derivative instruments to hedge risks arising out of its
agricultural business operations. The Group uses a variety of
commodity-based derivative instruments to manage exposure to price
volatility stemming from its integrated crop production activities.
These instruments consist mainly of crop forwards, future contracts
and put and call option contracts. Contract positions are designed
to ensure that the Group will receive a defined minimum price for
certain quantities of its production. The Group combines option
contracts with future contracts only as a means of reducing the
exposure towards the decrease in commodity prices, as being a
producer means that the price is uncertain until the time the
products are harvested and sold. The Group manages maximum and
minimum prices for each commodity and the idea is to choose the
best spot price at which to sell.
The
Group generally covers up to 49.9% of its crop production in order
to finance its operating costs. The hedge consists of taking
positions on purchased puts or sold futures and calls that assure a
fixed exit price. In the past, the Group has never kept a short
position greater than its crop inventories and does not intend to.
On the other hand, it is not the Group’s current intention to
be exposed in a long derivative position in excess of its actual
production.
The
following tables show the outstanding positions for each type of
derivative contract for the years ended June 30, 2020 and
2019:
|
|
06.30.20
|
||||
|
Type of derivative contract
|
Tons
|
Margin
|
Premium
paid or (collected)
|
Derivatives
at fair value
|
Gain
/ (Loss) for valuation at fair value at year-end
|
|
Forward:
|
|
|
|
|
|
|
Sales
|
|
|
|
|
|
|
Corn
|
152,531
|
70
|
-
|
(23
)
|
7
|
|
Soybeans
|
86,421
|
60
|
-
|
(23
)
|
227
|
|
Wheat
|
18,500
|
10
|
-
|
3
|
-
|
|
Livestock
|
54,450
|
-
|
-
|
-
|
(19
)
|
|
Cotton
|
893
|
-
|
-
|
13
|
-
|
|
Ethanol
|
600
|
-
|
-
|
-
|
(8
)
|
|
Purchase
|
|
|
|
|
|
|
Corn
|
46,480
|
(21
)
|
-
|
8
|
-
|
|
Soybeans
|
16,665
|
22
|
-
|
5
|
-
|
|
Wheat
|
17,700
|
(3
)
|
-
|
1
|
-
|
|
Options:
|
|
|
|
|
|
|
Sale put
|
|
|
|
|
|
|
Corn
|
40,265
|
-
|
-
|
(23
)
|
(24
)
|
|
Soybeans
|
35,572
|
-
|
-
|
(5
)
|
47
|
|
Cotton
|
625
|
-
|
-
|
(5
)
|
-
|
|
Livestock
|
-
|
-
|
-
|
-
|
(1
)
|
|
Purchase put
|
|
|
|
|
|
|
Corn
|
-
|
-
|
-
|
(7
)
|
-
|
|
Soybeans
|
1,000
|
-
|
-
|
(5
)
|
-
|
|
Sale call
|
|
|
|
|
|
|
Corn
|
89,700
|
52
|
(5
)
|
31
|
-
|
|
Soybeans
|
4,500
|
2
|
(17
)
|
28
|
-
|
|
Wheat
|
8,000
|
4
|
-
|
3
|
-
|
|
Purchase call
|
|
|
|
|
|
|
Wheat
|
-
|
-
|
5
|
(5
)
|
-
|
|
Soybeans
|
-
|
-
|
9
|
(4
)
|
-
|
|
Total
|
573,902
|
196
|
(8
)
|
(8
)
|
229
|
F-48
Cresud Sociedad Anónima,
Comercial, Inmobiliaria, Financiera y Agropecuaria
|
|
06.30.19
|
||||
|
Type of derivative contract
|
Tons
|
Margin
|
Premium
paid or (collected)
|
Derivatives
at fair value
|
Gain
/ (Loss) for valuation at fair value at year-end
|
|
Forward:
|
|
|
|
|
|
|
Sales
|
|
|
|
|
|
|
Corn
|
123,905
|
35
|
-
|
(40
)
|
(47
)
|
|
Soybeans
|
184,592
|
129
|
-
|
(51
)
|
(29
)
|
|
Wheat
|
26,200
|
9
|
-
|
-
|
-
|
|
Livestock
|
6,930
|
-
|
-
|
-
|
-
|
|
Cotton
|
423
|
-
|
-
|
4
|
-
|
|
Ethanol
|
1,500
|
-
|
-
|
-
|
5
|
|
Purchase
|
|
|
|
|
|
|
Corn
|
86,262
|
(2
)
|
-
|
4
|
4
|
|
Soybeans
|
61,284
|
(21
)
|
-
|
6
|
6
|
|
Wheat
|
4,100
|
(1
)
|
-
|
(1
)
|
(1
)
|
|
Options:
|
|
|
|
|
|
|
Sale put
|
|
|
|
|
|
|
Corn
|
25,949
|
-
|
-
|
(21
)
|
(9
)
|
|
Soybeans
|
54,407
|
-
|
-
|
(66
)
|
106
|
|
Wheat
|
-
|
-
|
1
|
-
|
(1
)
|
|
Cotton
|
1,473
|
-
|
-
|
(1
)
|
-
|
|
Livestock
|
16,500
|
-
|
-
|
(1
)
|
-
|
|
Purchase put
|
|
|
|
|
|
|
Corn
|
-
|
-
|
(1
)
|
-
|
1
|
|
Wheat
|
-
|
-
|
(1
)
|
-
|
1
|
|
Sale call
|
|
|
|
|
|
|
Corn
|
108,900
|
54
|
6
|
14
|
4
|
|
Soybeans
|
131,765
|
52
|
(1
)
|
24
|
26
|
|
Wheat
|
14,400
|
2
|
(1
)
|
4
|
6
|
|
Purchase call
|
|
|
|
|
|
|
Corn
|
-
|
-
|
(1
)
|
(9
)
|
3
|
|
Soybeans
|
-
|
-
|
(8
)
|
-
|
-
|
|
Total
|
848,590
|
257
|
(6
)
|
(134
)
|
75
|
Gains
and losses on commodity-based derivative instruments were Ps. 229
(gain) and Ps. 75 (gain) for the years ended June 30, 2020 and
2019, respectively. These gains and losses are included in
“Other operating results, net” in the Statements of
Income.
Crops
future contracts fair values are computed with reference to quoted
market prices on future exchanges.
Risk of fluctuations of the Consumer Price Index ("CPI") of
Israel
The
Operations Center in Israel has financial liabilities indexed by
the Israeli CPI.
Net
financial position exposure to the Israeli CPI fluctuations is
managed in a decentralized way on a case-by-case basis, by entering
into different derivative financial instruments, as the case may
be, or by other methods, considered adequate by the Management,
based on the circumstances.
As of
June 30, 2020, 36.9% of the loans are affected by the evolution of
the CPI. A 1% increase in the CPI would generate a loss of Ps.
1,033 (Ps.1,502 for 2019) and a decrease of 1% generates a profit
of Ps. 1,054 (Ps.1,519 for 2019).
Other price risks
The
Group is exposed to equity securities price risk or derivative
financial instruments because of investments held in entities that
are publicly traded, which were classified on the Consolidated
Statements of Financial Position at “fair value through
profit or loss”. The Group regularly reviews the prices
evolution of these equity securities in order to identify
significant movements.
As of
June 30, 2020 and 2019 the total value of Group’s investments
in shares and derivative financial instruments of public companies
amounts to Ps. 19,385 and Ps. 7,984, respectively.
In the
Operations Center in Israel the investment in Clal is classified on
the Statements of Financial Position at “fair value through
profit or loss” and represents the most significant
IDBD’s exposure to price risk. Neither IDBD or DIC has used
hedging against these risks (Note 15). IDBD and DIC regularly
review the prices evolution of these equity securities in order to
identify significant movements.
F-49
Cresud Sociedad Anónima,
Comercial, Inmobiliaria, Financiera y Agropecuaria
The
Group estimates that, other factors being constant, a 10% decrease
in quoted prices of equity securities and in derivative financial
instruments portfolio at year-end would generate a loss before
income tax for the year ended June 30, 2020, of Ps. 1,938 (Ps. 798
in 2019) for the Operations Center in Argentina and a loss before
income tax for the year ended June 30, 2020, of Ps. 431 (Ps. 2,551
in 2019) for the Operations Center in Israel. An increase of 10% on
these prices would have an equal and opposite effect in the
Statement of Income.
(b)
Credit
risk management
The
credit risk arises from the potential non-performance of
contractual obligations by the parties, with a resulting financial
loss for the Group. Credit limits have been established to ensure
that the Group deals only with approved counterparties and that
counterparty concentration risk is addressed and the risk of loss
is mitigated. Counterparty exposure is measured as the aggregate of
all obligations of any single legal entity or economic entity to
the Group.
The
Group is subject to credit risk arising from deposits with banks
and financial institutions, investments of surplus cash balances,
the use of derivative financial instruments and from outstanding
receivables. The credit risk is managed on a country-by-country
basis. Each local entity is responsible for managing and analyzing
the credit risk.
The
Group’s policy in each operations center is to manage credit
exposure from deposits, short-term investments and other financial
instruments by maintaining diversified funding sources in various
financial institutions. All the institutions that operate with the
Group are well known because of their experience in the market and
high credit quality. The Group places its cash and cash
equivalents, investments, and other financial instruments with
various high credit quality financial institutions, thus mitigating
the amount of credit exposure to any one institution. The maximum
exposure to credit risk is represented by the carrying amount of
cash and cash equivalents and short-term investments in the
Statements of Financial Position.
1)
Agricultural business
The
Group’s primary objective for holding derivative financial
instruments is to manage currency exchange rate risk and interest
rate risk and commodities prices. The Group generally enters into
derivative transactions with high-credit-quality counterparties
and, by policy, limits the amount of credit exposure to each
counter party. The amounts subject to credit risk related to
derivative instruments are generally limited to the amounts, if
any, by which counterparty’s obligations exceed the
obligations that the Group has with that counterparty. The credit
risk associated with derivative financial instruments is
representing by the carrying value of the assets positions of these
instruments.
The
Group’s policy is to manage credit risks associated with
trade and other receivables within defined trading limits. All
Group’s significant counterparties have internal trading
limits. The Group’s customers are distinguished between those
customers arising out of the investment and development properties
activities of the Group from those arising out of its agricultural
and agro-industrial operations. These two groups of customers are
monitored separately due to their distinct
characteristics.
Trade
receivables from agriculture and agro-industrial activities are
primarily derived from the sale of commodities, raw milk, cattle,
and sugarcane; receivables from feedlot operations and raw meat
products; receivables from the lease of farmland properties;
receivables from the sale of farmland properties; and, other
receivables from ancillary activities. Trade receivables from
agriculture and agro-industrial activities represent 9% and 4% of
the Group’s total trade receivables as of June 30, 2020 and
2019, respectively. In contrast with the investment and development
properties activities of the Group, the Group’s agribusiness
is conducted through several international subsidiaries. The Group
has subsidiaries in Argentina, Brazil, Bolivia and Paraguay.
However, Argentina and Brazil together concentrate more than 96%
and 94% of the Group’s grain production for the years ended
June 30, 2020 and 2019, respectively. For the years ended June 30,
2020 and 2019, the grain production in Bolivia has not been
significant representing only 3% and 6% of the total Group’s
crop sales, respectively. Each country has its own established
market for the respective grain production. Generally, the entire
country’s grain production is sold in the domestic market to
well-known multinational exporters such as Molinos, Cargill or
Bunge, and/or local exporters. Prices for grains are also generally
based on the market prices quoted in the domestic markets, which
normally take as reference the prices in international grain
exchanges such as the Chicago Board of Trade.
For the
years ended June 30, 2020 and 2019, 47% and 44% of sales of crops
in Argentina and Brazil were sold to well-known exporters. The
Group performs credit evaluations of its customers and generally
does not require collateral. Although sales are highly
concentrated, the Group does not believe that significant credit
risk exists at the reporting period due to the high credit rating
of these customers.
The
Group concentrates its cattle production in Argentina where it is
entirely sold in the domestic market. The main buyers are
slaughterhouses and supermarkets and are well dispersed. Prices in
the cattle market in Argentina are basically fixed by local supply
and demand. The principal market is the Liniers Market in Buenos
Aires, which provides a standard in price formation for the rest of
the domestic markets. Live animals are sold by auction on a daily
basis in the
F-50
Cresud Sociedad Anónima,
Comercial, Inmobiliaria, Financiera y Agropecuaria
market,
whereas prices are negotiated by kilogram of live weight and are
mainly determined by local supply and demand. Some supermarkets and
meat packers establish their prices by kilogram of processed meat.
In these cases, processing yields influences the final
price.
The
Group’s sugarcane production is based in Brazil and to a
lesser extent in Bolivia. Brazil concentrates the 100% and 97% of
the Group's total sugarcane production as of June 30, 2020 and
2019, respectively. Currently, the group has two supply agreements
of sugarcane. One of them is with Brenco Companhia Brasileira de
Energía Renovable (ETH) and the other one Aparecería IV
with Agroserra - Agro Pecuária e Industria, in the
municipality of São Raimundo das Mangabeiras. Sales to ETH
amounted to Ps. 1,320 and Ps. 1,173 and from Agroserra amounted to
Ps. 1,757 and Ps. 1,392 during fiscal years ended June 30, 2020 and
2019, respectively. Thus, total sales amounted to Ps. 3,077 and Ps.
2,565 in fiscal year ended June 30, 2020 and 2019, representing 12%
and 14% of consolidated agricultural business revenues of the Group
of each fiscal year. Although sales are agreed, the Group do not
believe that there is a significant collection risk as of the date
of year fiscal year, considering the rating of ETH and
Agroserra.
The
Company does not expect any significant losses resulting from the
non-performance of the counterparties in any of the business
lines.
The
maximum exposure to Group’s credit risk is represented by the
carrying amount of each financial asset in the Statement of
Financial Position after deducting any impairment allowance. The
Group’s overall exposure of credit risk arising from trade
receivables is set out in Note 16.
2)
Urban properties and investments business
Operation Center in Argentina
Trade
receivables related to leases and services provided by the Group
represent a diversified tenant base and account for 94.2% and 99.1%
of the Group’s total trade receivables of the operations
center as of June 30, 2020 and 2019, respectively. The Group has
specific policies to ensure that rental contracts are transacted
with counterparties with appropriate credit quality. The majority
of the Group’s shopping mall, offices and other rental
properties’ tenants are well recognized retailers,
diversified companies, professional organizations, and others.
Owing to the long-term nature and diversity of its tenancy
arrangements, the credit risk of this type of trade receivables is
considered to be low. Generally, the Group has not experienced any
significant losses resulting from the non-performance of any
counterpart to the lease contracts and, as a result, the allowance
for doubtful accounts balance is low. Individual risk limits are
set based on internal or external ratings in accordance with limits
set by the Group. If there is no independent rating, risk control
assesses the credit quality of the customer, taking into account
its past experience, financial position, actual experience and
other factors.
Based
on the Group’s analysis, the Group determines the size of the
deposit that is required from the tenant at inception. Management
does not expect any material losses from non-performance by these
counterparties (see details on Note 16).
On the
other hand, property receivables related to the sale of trading
properties represent 5.8% and 0.9% of the Group’s total trade
receivables as of June 30, 2020 and 2019, respectively. Payments on
these receivables have generally been received when due. These
receivables are generally secured by mortgages on the properties.
Therefore, the credit risk on outstanding amounts is considered
very low.
Operation Center in Israel
IDBD’s and
DIC’s primary objective for holding derivative financial
instruments is to manage currency exchange rate risk and interest
rate risk. IDBD and DIC generally enters into derivative
transactions with high-credit-quality counterparties and, by
policy, limits the amount of credit exposure to each counterparty.
The amounts subject to credit risk related to derivative
instruments are generally limited to the amounts, if any, by which
counterparty’s obligations exceed the obligations that IDBD
has with that counterparty. The credit risk associated with
derivative financial instruments is representing by the carrying
value of the assets positions of these instruments.
IDBD
and DIC’s policy is to manage credit exposure to trade and
other receivables within defined trading limits. All IDBD’s
significant counterparties have internal trading
limits.
Trade
receivables from investment and development property activities are
primarily derived from leases and services from shopping malls,
offices and other rental properties; receivables from the sale of
trading properties and investment properties (primarily undeveloped
land and non-retail rental properties). IDBD and DIC have a large
customer base and is not dependent on any single customer. The
credits for sales from the activities of telecommunications and
supermarkets do not present large concentrations of credit risk,
not depending on a few customers and with most of their
transactions in cash or with credit cards (Note 16).
F-51
Cresud Sociedad Anónima,
Comercial, Inmobiliaria, Financiera y Agropecuaria
(c)
Liquidity
risk management
The
Group is exposed to liquidity risks, including risks associated
with refinancing borrowings as they mature the risk that borrowing
facilities are not available to meet cash requirements, and the
risk that financial assets cannot readily be converted to cash
without loss of value. Failure to manage liquidity risks could have
a material impact on the Group’s cash flow and Statements of
Financial Position. Prudent liquidity risk management implies
maintaining sufficient cash, the availability of funding through an
adequate amount of committed credit facilities and the ability to
close out market positions. Due to the dynamic nature of the
underlying businesses, the Group aims to maintain flexibility in
funding its existing and prospective debt requirements by
maintaining diversified funding sources.
Each
business (or operation center, as appropriate) monitors its current
and projected financial position using several key internally
generated reports: cash flow; debt maturity; and interest rate
exposure. The Group also undertakes sensitivity analysis to assess
the impact of proposed transactions, movements in interest rates
and changes in property values on the key profitability, liquidity
and balance sheet ratios.
The
debt of each operation center and the derivative positions are
continually reviewed to meet current and expected debt
requirements. Each operation center maintains a balance between
longer-term and shorter-term financings. Short-term financing is
principally raised through bank facilities and overdraft positions.
Medium- to longer-term financing comprises public and private bond
issues, including private placements. Financing risk is spread by
using a variety of types of debt. The maturity profile is managed
in accordance with each operation center needs, by spreading the
repayment dates and extending facilities, as
appropriate.
The
tables below show financial liabilities, including each operation
center derivative financial liabilities groupings based on the
remaining period at the Statements of Financial Position to the
contractual maturity date. The amounts disclosed in the tables are
the contractual undiscounted cash flows and as a result, they do
not reconcile to the amounts disclosed on the Statements of
Financial Position. However, undiscounted cash flows in respect of
balances due within 12 months generally equal their carrying
amounts in the Statements of Financial Position, as the impact of
discounting is not significant. The tables include both interest
and principal flows.
Where
the interest payable is not fixed, the amount disclosed has been
determined by reference to the existing conditions at the reporting
date.
1)
Agricultural business
|
|
06.30.20
|
|||||
|
|
Less
than 1 year
|
Between
1 and 2 years
|
Between
2 and 3 years
|
Between
3 and 4 years
|
More
than 4 years
|
Total
|
|
Trade and other
payables
|
6,313
|
123
|
188
|
54
|
101
|
6,779
|
|
Borrowings
|
21,628
|
14,944
|
9,041
|
296
|
289
|
46,198
|
|
Finance lease
obligations
|
790
|
515
|
335
|
270
|
1,074
|
2,984
|
|
Derivative
financial instruments
|
243
|
19
|
-
|
-
|
-
|
262
|
|
Total
|
28,974
|
15,601
|
9,564
|
620
|
1,464
|
56,223
|
|
|
06.30.19
|
|||||
|
|
Less than 1 year
|
Between 1 and 2 years
|
Between 2 and 3 years
|
Between 3 and 4 years
|
More than 4 years
|
Total
|
|
Trade
and other payables
|
5,844
|
44
|
39
|
33
|
80
|
6,040
|
|
Borrowings
(excluding finance lease liabilities)
|
17,451
|
6,966
|
2,279
|
7,952
|
472
|
35,120
|
|
Finance
lease obligations
|
11
|
-
|
-
|
-
|
332
|
343
|
|
Derivative
financial instruments
|
229
|
-
|
-
|
-
|
-
|
229
|
|
Total
|
23,535
|
7,010
|
2,318
|
7,985
|
884
|
41,732
|
2)
Urban properties and investments business
Operation Center in Argentina
|
|
06.30.20
|
|||||
|
|
Less
than 1 year
|
Between
1 and 2 years
|
Between
2 and 3 years
|
Between
3 and 4 years
|
More
than 4 years
|
Total
|
|
Trade and other
payables
|
1,546
|
156
|
69
|
219
|
1
|
1,991
|
|
Borrowings
|
38,402
|
3,283
|
27,280
|
65
|
216
|
69,246
|
|
Finance
lease obligations
|
53
|
49
|
51
|
54
|
1,291
|
1,498
|
|
Derivative
financial instruments
|
83
|
28
|
6
|
-
|
-
|
117
|
|
Total
|
40,084
|
3,516
|
27,406
|
338
|
1,508
|
72,852
|
F-52
Cresud Sociedad Anónima,
Comercial, Inmobiliaria, Financiera y Agropecuaria
|
|
06.30.19
|
|||||
|
|
Less
than 1 year
|
Between
1 and 2 years
|
Between
2 and 3 years
|
Between
3 and 4 years
|
More
than 4 years
|
Total
|
|
Trade
and other payables
|
2,198
|
334
|
146
|
2
|
386
|
3,066
|
|
Borrowings
(excluding finance lease liabilities)
|
13,110
|
19,562
|
3,787
|
2,475
|
21,871
|
60,805
|
|
Purchase
obligations
|
1,827
|
-
|
-
|
-
|
-
|
1,827
|
|
Finance
lease obligations
|
16
|
6
|
1
|
-
|
-
|
23
|
|
Derivative
financial instruments
|
19
|
11
|
6
|
1
|
-
|
37
|
|
Total
|
17,170
|
19,913
|
3,940
|
2,478
|
22,257
|
65,758
|
Operation Center in Israel
|
|
06.30.20
|
|||||
|
|
Less
than 1 year
|
Between
1 and 2 years
|
Between
2 and 3 years
|
Between
3 and 4 years
|
More
than 4 years
|
Total
|
|
Trade
and other payables
|
25,507
|
346
|
61
|
20
|
20
|
25,954
|
|
Borrowings
|
53,289
|
54,401
|
94,044
|
43,051
|
123,016
|
367,801
|
|
Finance
lease obligations
|
5,238
|
4,026
|
2,854
|
1,806
|
6,588
|
20,512
|
|
Purchase
obligations
|
5,695
|
854
|
590
|
-
|
-
|
7,139
|
|
Derivative
financial
instruments
|
20
|
-
|
-
|
-
|
-
|
20
|
|
Total
|
89,749
|
59,627
|
97,549
|
44,877
|
129,624
|
421,426
|
|
|
06.30.19
|
|||||
|
|
Less
than 1 year
|
Between
1 and 2 years
|
Between
2 and 3 years
|
Between
3 and 4 years
|
More
than 4 years
|
Total
|
|
Trade
and other payables
|
21,615
|
426
|
204
|
-
|
-
|
22,245
|
|
Borrowings
(excluding finance lease liabilities)
|
67,151
|
54,850
|
58,112
|
91,233
|
196,123
|
467,469
|
|
Finance
lease obligations
|
34
|
34
|
1
|
-
|
-
|
69
|
|
Purchase
obligations
|
4,282
|
1,365
|
750
|
495
|
-
|
6,892
|
|
Derivative financial
instruments
|
34
|
-
|
-
|
-
|
-
|
34
|
|
Total
|
93,116
|
56,675
|
59,067
|
91,728
|
196,123
|
496,709
|
See
Note 21 for a description of the commitments and restrictions
related to loans and the ongoing renegotiations.
(d)
Capital
risk management
The
capital structure of the Group consists of shareholders’
equity and net borrowings. The type and maturity of the
Group’s borrowings are analyzed further in Note 21. The
Group’s equity is analyzed into its various components in the
Statement of Changes in Equity.
Capital
is managed so as to promote the long-term success of the business
and to maintain sustainable returns for shareholders.
The
Group seeks to manage its capital requirements to maximize value
through the mix of debt and equity funding, while ensuring that
Group entities continue to operate as going concerns, comply with
applicable capital requirements and maintain strong credit
ratings.
The
Group assesses the adequacy of its capital requirements, cost of
capital and gearing (i.e., debt/equity mix) as part of its broader
strategic plan. The Group continuously reviews its capital
structure to ensure that (i) sufficient funds and financing
facilities are available to implement the Group’s property
development and business acquisition strategies, (ii) adequate
financing facilities for unforeseen contingencies are maintained,
and (iii) distributions to shareholders are maintained within the
Group’s dividend distribution policy. The Group also protects
its equity in assets by obtaining appropriate
insurance.
The
Group’s strategy is to maintain key financing metrics (net
debt to total equity ratio or gearing and debt ratio) in order to
ensure that asset level performance is translated into enhanced
returns for shareholders whilst maintaining an appropriate risk
reward balance to accommodate changing financial and operating
market cycles.
The
following tables details the Group’s key metrics in relation
to managing its capital structure. The ratios are within the ranges
previously established by the Group’s strategy.
1)
Agricultural business
|
|
06.30.20
|
06.30.19
|
|
Gearing ratio
(i)
|
63.03
%
|
57.02
%
|
|
Debt ratio
(ii)
|
251.91
%
|
218.38
%
|
(i)
Calculated as total debt over total capital (including equity plus
total debt).
(ii)
Calculated as total debt over total properties at fair value
(including trading properties, properties, plant and equipment,
investment properties, farmland rights to receive units under
barter agreements).
F-53
Cresud Sociedad Anónima,
Comercial, Inmobiliaria, Financiera y Agropecuaria
Urban properties and investments business
Operation Center in Argentina
|
|
06.30.20
|
06.30.19
|
|
Gearing ratio
(iii)
|
49.57
%
|
40.80
%
|
|
Debt ratio
(iv)
|
44.42
%
|
47.54
%
|
Operation Center in Israel
|
|
06.30.20
|
06.30.19
|
|
Gearing
ratio (iii)
|
82.63
%
|
83.68
%
|
|
Debt
ratio (iv)
|
244.57
%
|
149.40
%
|
(iii)
Calculated as total
of borrowings over total borrowings plus equity attributable equity
holders of the parent company.
(iv)
Calculated as total
borrowings over total properties (including trading properties,
property, plant and equipment, investment properties and rights to
receive units under barter agreements).
(e)
Other
non-financial risks
Nature risks
The
Group’s revenue arising from agricultural activities depends
significantly on the ability to manage biological assets and
agricultural produce. The ability to manage biological assets and
agricultural produce may be affected by unfavorable local weather
conditions and natural disasters. Weather conditions such as
floods, droughts, hail, windstorms and natural disasters such as
fire, disease, insect infestation and pests are examples of such
unpredictable events. The Group manages this risk by locating its
farmlands in different geographical areas. The Group has not taken
out insurance for this kind of risks. The occurrence of severe
weather conditions or natural disasters may affect the growth of
our biological assets, which in turn may have a material adverse
effect on the Group’s ability to harvest agricultural produce
in sufficient quantities and in a timely way.
6.
Segment
information
IFRS
8 requires an entity to report financial and descriptive
information about its reportable segments, which are operating
segments or aggregations of operating segments that meet specified
criteria. Operating segments are components of an entity about
which separate financial information is available that is evaluated
regularly by the CODM. According to IFRS 8, the CODM represents a
function whereby strategic decisions are made and resources are
assigned. The CODM function is carried out by the President of the
Group, Mr. Eduardo S. Elsztain. In addition, two responsibility
levels have been established for resource allocation and assessment
of results of the two operations centers, through executive
committees in Argentina and Israel.
Segment
information is reported from the perspective of products and
services: (i) agricultural business and (ii) urban properties and
investment business. In addition, this last segment is reported
(ie., divided) from the geographic point of view in two Operations
Centers to manage its global interests: Argentina and Israel.
Within each operations center, the Group considers separately the
various activities being developed, which represent reporting
operating segments given the nature of its products, services,
operations and risks. Management believes the operating segment
clustering in each operations center reflects similar economic
characteristics in each region, as well as similar products and
services offered, types of clients and regulatory
environments.
As
from fiscal year 2018 the CODM reviews the operating income/loss of
each business excluding the amounts related to management fees,
being such amount reviewed at an aggregate level outside each
business. Additionally, the CODM reviews certain corporate expenses
associated with each business in an aggregate manner and separately
from each of the segments, such expenses have been disclosed in the
"Corporate" segment of each operation center.
Below
is the segment information prepared as follows:
Agricultural business
●
Agricultural
production
: segment consists of
planting, harvesting and sale of crops as wheat, corn, soybeans,
cotton and sunflowers; the sale of grain derivatives, such as flour
and oil, breeding, purchasing and/or fattening of free-range cattle
for sale to meat processors and local livestock auction markets.;
agricultural services; leasing of the Group's farms to third
parties; and planting, harvesting and sale of
sugarcane
●
Land transformation and
sales
: comprises gains from the
disposal and development of farmlands
activities.
●
Corporate
: includes corporate expenses related to
agricultural business.
●
Other
segments
: includes,
principally, slaughtering and processing in the meat refrigeration
plant; and brokerage activities, among others.
F-54
Cresud Sociedad Anónima,
Comercial, Inmobiliaria, Financiera y Agropecuaria
Urban properties and investments business
●
Operation Center in
Argentina
includes the assets
and operating results of the following
segments:
o
Shopping Malls
:
includes results principally comprised of
lease and service revenues related to rental of commercial space
and other spaces in the shopping malls of the Group.
o
Offices
:
includes the operating results from lease
revenues of offices, other rental spaces and other service revenues
related to the office activities.
o
Sales and developments
: includes the
operating results of the development, maintenance and sales of
undeveloped parcels of land and/or trading properties. Real estate
sales results are also included.
o
Hotels
: includes the operating results
mainly comprised of room, catering and restaurant
revenues.
o
International
: includes assets and
operating profit or loss from business related to associates Condor
(hotels) and New Lipstick (offices).
o
Corporate
:
includes the expenses related to the corporate
activities of the Operations Center in
Argentina.
o
Others
: primarily includes the
entertainment activities through La Arena and La Rural S.A. and the
financial activities carried out by BHSA and Tarshop.
As
of fiscal year 2018, the CODM also reviews the office business as a
single segment and the entertainment business in an aggregate and
separate manner from offices, including that concept in the
"Others" segment.
The
CODM periodically reviews the results and certain asset categories
and assesses performance of operating segments of this operations
center based on a measure of profit or loss of the segment composed
by the operating income plus the share of profit / (loss) of joint
ventures and associates. The valuation criteria used in preparing
this information are consistent with IFRS standards used for the
preparation of the Consolidated Financial Statements, except for
the following:
●
Operating
results from joint ventures are evaluated by the CODM applying
proportional consolidation method. Under this method, the
profit/loss generated and assets are reported in the Statement of
Income line-by-line based on the percentage held in joint ventures
rather than in a single item as required by IFRS. Management
believes that the proportional consolidation method provides more
useful information to understand the business return. On the other
hand, the investment in the joint venture La Rural S.A. is
accounted for under the equity method since this method is
considered to provide more accurate information in this
case.
●
Operating
results from Shopping Malls and Offices segments do not include the
amounts pertaining to building administration expenses and
collective promotion funds (“FPC”, as per its Spanish
acronym) as well as total recovered costs, whether by way of
expenses or other concepts included under financial results (for
example default interest and other concepts). The CODM examines the
net amount from these items (total surplus or deficit between
building administration expenses and FPC and recoverable
expenses).
Revenues
for each reporting segments derive from a large and diverse client
base and, therefore, there is no revenue concentration in any
particular segment.
●
Operation Center in
Israel
includes the assets and
operating results of the following segments:
o
Real Estate
: segment in which, through
PBC, the Group operates rental properties and residential
properties in Israel, USA and other parts of the world and carries
out commercial projects in Las Vegas, USA. In this fiscal year, the
Company lost control over Gav-Yam. Income was reclassified to
discontinued operations and no longer forms part of this segment in
this fiscal year. Such effect was reclassified in the comparative
information. As of September 2018, Gav-Yam started to be valued as
an associate.
o
Supermarkets
: segment in which, through
Shufersal, the Group operated a supermarket chain in Israel. Upon
the loss of control in 2018 this segment was reclassified to
discontinued operations and presented as an associate since
2019.
Due to
the loss of control, it was reclassified to discontinued operations
and no longer forms part of the segment for fiscal year
2018.
o
Telecommunications
: includes Cellcom
whose main activities include the provision of mobile phone
services, fixed line phone services, data and Internet and
television, among others.
o
Insurance
: includes the investment in
Clal, insurance company which main activities includes pension and
social security insurance, among others. As stated in Note 18, the
Group does not have control over Clal; therefore, the business is
reported in a single line as a financial asset held for sale and
valued at fair value.
o
Corporate
: includes the expenses related
with the activities of the holding companies.
o
Others
: includes other diverse business
activities, such as technological developments, tourism, oil and
gas assets, electronics, sale of fruits and others.
The
CODM periodically reviews the results and certain asset categories
and assesses performance of operating segments of this operations
center based on a measure of profit or loss of the segment composed
by the operating
F-55
Cresud Sociedad Anónima,
Comercial, Inmobiliaria, Financiera y Agropecuaria
income
plus the share of profit / (loss) of associates and joint ventures.
The valuation criteria used in preparing this information are
consistent with IFRS standards used for the preparation of the
Consolidated Financial Statements.
Goods
and services exchanged between segments are calculated on the basis
of established prices. Intercompany transactions between segments,
if any, are eliminated.
Within
the agricultural business, the majority of revenue is derived from
operating segments in Argentina and Brazil, where most operating
assets are located. .
Within
the Operations Center in Argentina, most revenue from its operating
segments is derived from, and their assets are located in,
Argentina, except for the share of profit / (loss) of associates
included in the “International” segment located in
USA.
Within
the urban properties and investment business in the operations
center in Israel, most revenue from its operating segments are
derived from and their assets are located in Israel, except for
certain earnings from the Real Estate segment, which are generated
from activities outside Israel, mainly in USA.
Within
the agricultural business and the urban properties and investments
business from the operations center in Argentina, the assets
categories reviewed by the CODM are investment properties,
property, plant and equipment, trading properties, inventories,
biological assets, right to receive future units under barter
agreements, investment in joint ventures and associates and
goodwill. The aggregate of these assets, classified by business
segment, are disclosed as “segment assets”. Assets are
allocated to each segment based on the operations and/or their
physical location.
F-56
Cresud Sociedad Anónima,
Comercial, Inmobiliaria, Financiera y Agropecuaria
Below is a
summarized analysis of the lines of business of the Group for the
year ended June 30, 2020:
|
|
06.30.20
|
|||||||||
|
|
|
Urban
Properties and Investment business (II
)
|
|
|
|
|
|
|
||
|
|
Agricultural
business (I)
|
Operations
Center in Argentina
|
Operations
Center in Israel
|
Subtotal
|
Total
segment information
|
Joint
ventures (i)
|
Discontinued
operations (ii)
|
Adjustments
(iii)
|
Elimination
of inter-segment transactions and non-reportable assets /
liabilities (iv)
|
Total
Statement of Income / Financial Position
|
|
Revenues
|
26,259
|
11,138
|
81,637
|
92,775
|
119,034
|
(60
)
|
-
|
3,100
|
(818
)
|
121,256
|
|
Costs
|
(22,283
)
|
(2,755
)
|
(56,296
)
|
(59,051
)
|
(81,334
)
|
53
|
-
|
(3,230
)
|
540
|
(83,971
)
|
|
Initial recognition
and changes in the fair value of biological assets and agricultural
products at the point of harvest
|
2,623
|
-
|
-
|
-
|
2,623
|
-
|
-
|
-
|
204
|
2,827
|
|
Changes in the net
realizable value of agricultural products after
harvest
|
657
|
-
|
-
|
-
|
657
|
-
|
-
|
-
|
-
|
657
|
|
Gross
profit / (loss)
|
7,256
|
8,383
|
25,341
|
33,724
|
40,980
|
(7
)
|
-
|
(130
)
|
(74
)
|
40,769
|
|
Gain from disposal
of farmlands
|
838
|
-
|
-
|
-
|
838
|
-
|
-
|
-
|
-
|
838
|
|
Net gain / (loss) from fair value
adjustment
of investment properties
|
780
|
33,464
|
(2,989
)
|
30,475
|
31,255
|
(263
)
|
-
|
-
|
-
|
30,992
|
|
General and
administrative expenses
|
(1,419
)
|
(2,150
)
|
(8,764
)
|
(10,914
)
|
(12,333
)
|
15
|
-
|
-
|
51
|
(12,267
)
|
|
Selling
expenses
|
(2,610
)
|
(1,232
)
|
(12,544
)
|
(13,776
)
|
(16,386
)
|
19
|
-
|
-
|
19
|
(16,348
)
|
|
Impairment of
associates
|
-
|
-
|
(2,470
)
|
(2,470
)
|
(2,470
)
|
-
|
-
|
-
|
-
|
(2,470
)
|
|
Other operating
results, net
|
1,662
|
(48
)
|
1,127
|
1,079
|
2,741
|
18
|
-
|
17
|
(6
)
|
2,770
|
|
Management
fees
|
-
|
-
|
-
|
-
|
-
|
-
|
-
|
(211
)
|
-
|
(211
)
|
|
Profit
/ (loss) from operations
|
6,507
|
38,417
|
(299
)
|
38,118
|
44,625
|
(218
)
|
-
|
(324
)
|
(10
)
|
44,073
|
|
Share of profit of
associates and joint ventures
|
127
|
7,047
|
1,299
|
8,346
|
8,473
|
169
|
-
|
-
|
20
|
8,662
|
|
Segment
profit / (loss)
|
6,634
|
45,464
|
1,000
|
46,464
|
53,098
|
(49
)
|
-
|
(324
)
|
10
|
52,735
|
|
|
|
|
|
|
|
|
-
|
|
|
|
|
Reportable
assets
|
37,070
|
157,987
|
451,267
|
609,254
|
646,324
|
(671
)
|
-
|
-
|
41,287
|
686,940
|
|
Reportable
liabilities
|
-
|
-
|
(403,184
)
|
(403,184
)
|
(403,184
)
|
-
|
-
|
-
|
(161,603
)
|
(564,787
)
|
|
Net
reportable assets
|
37,070
|
157,987
|
48,083
|
206,070
|
243,140
|
(671
)
|
-
|
-
|
(120,316
)
|
122,153
|
F-57
Cresud Sociedad Anónima,
Comercial, Inmobiliaria, Financiera y Agropecuaria
Below is a
summarized analysis of the lines of business of the Group for the
year ended June 30, 2019:
|
|
30.10.19
|
|||||||||
|
|
|
Urban Properties and Investment business (II
)
|
|
|
|
|
|
|
||
|
|
Agricultural
business (I)
|
Operations
Center in Argentina
|
Operations
Center in Israel
|
Subtotal
|
Total
segment information
|
Joint
ventures (i)
|
Discontinued
operations (ii)
|
Adjustments
(iii)
|
Elimination
of inter-segment transactions and non-reportable assets /
liabilities (iv)
|
Total
Statement of Income / Financial Position
|
|
Revenues
|
19,061
|
15,056
|
73,537
|
88,593
|
107,654
|
(93
)
|
-
|
3,706
|
(526
)
|
110,741
|
|
Costs
|
(16,165
)
|
(3,201
)
|
(52,426
)
|
(55,627
)
|
(71,792
)
|
67
|
-
|
(3,855
)
|
196
|
(75,384
)
|
|
Initial
recognition and changes in the fair value of biological assets and
agricultural products at the point of harvest
|
2,035
|
-
|
-
|
-
|
2,035
|
-
|
-
|
-
|
270
|
2,305
|
|
Changes
in the net realizable value of agricultural products after
harvest
|
(43
)
|
-
|
-
|
-
|
(43
)
|
-
|
-
|
-
|
-
|
(43
)
|
|
Gross profit / (loss)
|
4,888
|
11,855
|
21,111
|
32,966
|
37,854
|
(26
)
|
-
|
(149
)
|
(60
)
|
37,619
|
|
Gain
from disposal of farmlands
|
665
|
-
|
-
|
-
|
665
|
-
|
-
|
-
|
-
|
665
|
|
Net gain from fair value
adjustment of investment
properties
|
-
|
(39,477
)
|
892
|
(38,585
)
|
(38,585
)
|
839
|
-
|
-
|
-
|
(37,746
)
|
|
General
and administrative expenses
|
(1,525
)
|
(2,668
)
|
(8,031
)
|
(10,699
)
|
(12,224
)
|
17
|
-
|
-
|
55
|
(12,152
)
|
|
Selling
expenses
|
(1,717
)
|
(1,085
)
|
(11,192
)
|
(12,277
)
|
(13,994
)
|
7
|
-
|
-
|
11
|
(13,976
)
|
|
Other
operating results, net
|
819
|
(659
)
|
742
|
83
|
902
|
193
|
-
|
17
|
(11
)
|
1,101
|
|
Management
fees
|
-
|
-
|
-
|
-
|
-
|
-
|
-
|
-
|
-
|
-
|
|
Profit / (loss) from operations
|
3,130
|
(32,034
)
|
3,522
|
(28,512
)
|
(25,382
)
|
1,030
|
-
|
(132
)
|
(5
)
|
(24,489
)
|
|
Share
of profit / (loss) of associates and joint ventures
|
11
|
(6,183
)
|
(150
)
|
(6,333
)
|
(6,322
)
|
(1,006
)
|
-
|
-
|
-
|
(7,328
)
|
|
Segment profit / (loss)
|
3,141
|
(38,217
)
|
3,372
|
(34,845
)
|
(31,704
)
|
24
|
-
|
(132
)
|
(5
)
|
(31,817
)
|
|
|
|
|
|
|
|
|
|
|
|
|
|
Reportable
assets
|
34,597
|
111,717
|
535,565
|
647,282
|
681,879
|
(592
)
|
-
|
-
|
44,747
|
726,034
|
|
Reportable
liabilities
|
-
|
-
|
(461,015
)
|
(461,015
)
|
(461,015
)
|
-
|
-
|
-
|
(137,818
)
|
(598,833
)
|
|
Net reportable assets
|
34,597
|
111,717
|
74,550
|
186,267
|
220,864
|
(592
)
|
-
|
-
|
(93,071
)
|
127,201
|
F-58
Cresud Sociedad Anónima,
Comercial, Inmobiliaria, Financiera y Agropecuaria
Below is a summarized
analysis of the lines of business of the Group for the year ended
June 30, 2018:
|
|
06.30.18
|
||||||||
|
|
|
Urban Properties and Investment business (II)
|
|
|
|
|
|
||
|
|
Agricultural
business (I)
|
Operations
Center in Argentina
|
Operations
Center in Israel
|
Subtotal
|
Total
segment information
|
Joint
ventures (i)
|
Adjustments
(iii)
|
Elimination
of inter-segment transactions and non-reportable assets /
liabilities (iv)
|
Total
Statement of Income / Financial Position
|
|
Revenues
|
15,393
|
13,872
|
60,057
|
73,929
|
89,322
|
(111
)
|
4,387
|
(332
)
|
93,266
|
|
Costs
|
(13,096
)
|
(2,822
)
|
(41,935
)
|
(44,757
)
|
(57,853
)
|
69
|
(4,445
)
|
151
|
(62,078
)
|
|
Initial
recognition and changes in the fair value of biological assets and
agricultural products at the point of harvest
|
1,530
|
-
|
-
|
-
|
1,530
|
4
|
-
|
140
|
1,674
|
|
Changes
in the net realizable value of agricultural products after
harvest
|
532
|
-
|
-
|
-
|
532
|
-
|
-
|
-
|
532
|
|
Gross profit / (loss)
|
4,359
|
11,050
|
18,122
|
29,172
|
33,531
|
(38
)
|
(58
)
|
(41
)
|
33,394
|
|
Net
gain from fair value adjustment of investment
properties
|
216
|
19,809
|
-
|
19,809
|
20,025
|
(1,054
)
|
-
|
-
|
18,971
|
|
Loss
from disposal of farmlands
|
1,656
|
-
|
-
|
-
|
1,656
|
-
|
-
|
-
|
1,656
|
|
General
and administrative expenses
|
(1,381
)
|
(2,335
)
|
(7,233
)
|
(9,568
)
|
(10,949
)
|
40
|
-
|
33
|
(10,876
)
|
|
Selling
expenses
|
(1,753
)
|
(1,126
)
|
(10,639
)
|
(11,765
)
|
(13,518
)
|
16
|
-
|
13
|
(13,489
)
|
|
Other
operating results, net
|
1,541
|
(56
)
|
2,136
|
2,080
|
3,621
|
42
|
(2
)
|
(4
)
|
3,657
|
|
Management
fees
|
-
|
-
|
-
|
-
|
-
|
-
|
(1,456
)
|
-
|
(1,456
)
|
|
Profit / (loss) from operations
|
4,638
|
27,342
|
2,386
|
29,728
|
34,366
|
(994
)
|
(1,516
)
|
1
|
31,857
|
|
Share
of (loss) / profit of associates and joint ventures
|
37
|
(4,227
)
|
(422
)
|
(4,649
)
|
(4,612
)
|
1,160
|
-
|
-
|
(3,452
)
|
|
Segment profit / (loss)
|
4,675
|
23,115
|
1,964
|
25,079
|
29,754
|
166
|
(1,516
)
|
1
|
28,405
|
|
|
|
|
|
|
|
|
|
|
|
|
Reportable
assets
|
30,755
|
152,860
|
563,654
|
716,514
|
747,269
|
592
|
-
|
49,183
|
797,044
|
|
Reportable
liabilities
|
-
|
-
|
(479,056
)
|
(479,056
)
|
(479,056
)
|
-
|
-
|
(141,534
)
|
(620,590
)
|
|
Net reportable assets
|
30,755
|
152,860
|
84,598
|
237,458
|
268,213
|
592
|
-
|
(92,351
)
|
176,454
|
(i)
Represents the
equity value of joint ventures that were proportionately
consolidated for information by segment purposes.
(ii)
Includes Ps. (130),
Ps. (149) and Ps. (58) corresponding to Expenses and FPC and Ps. 0,
Ps. (336) and Ps. (1,456) to management fees, as of June 30, 2020
and 2018, respectively.
(iv)
Includes deferred
income tax assets, income tax and MPIT credits, trade and other
receivables, investment in financial assets, cash and cash
equivalents and intangible assets except for rights to receive
future units under barter agreements, net of investments in
associates with negative equity which are included in provisions in
the amount of Ps. 17, Ps. 8,658 and Ps. 5,453, as of June 30, 2020,
2019 and 2018, respectively.
F-59
Cresud Sociedad Anónima,
Comercial, Inmobiliaria, Financiera y Agropecuaria
Agriculture line of business:
The
following tables present the reportable segments of the agriculture
line of business:
|
|
06.30.20
|
||||
|
|
Agricultural
production
|
Land
transformation and sales
|
Corporate
|
Others
|
Total
Agricultural business
|
|
Revenues
|
17,186
|
-
|
-
|
9,073
|
26,259
|
|
Costs
|
(14,676
)
|
(25
)
|
-
|
(7,582
)
|
(22,283
)
|
|
Initial recognition
and changes in the fair value of biological assets and agricultural
products at the point of harvest
|
2,613
|
-
|
-
|
10
|
2,623
|
|
Changes in the net
realizable value of agricultural products after
harvest
|
657
|
-
|
-
|
-
|
657
|
|
Gross
profit / (loss)
|
5,780
|
(25
)
|
-
|
1,501
|
7,256
|
|
Gain from disposal
of farmlands
|
-
|
838
|
-
|
-
|
838
|
|
Net gain from fair
value adjustment of investment properties
|
-
|
780
|
-
|
-
|
780
|
|
General and
administrative expenses
|
(953
)
|
(3
)
|
(177
)
|
(286
)
|
(1,419
)
|
|
Selling
expenses
|
(1,815
)
|
(1
)
|
-
|
(794
)
|
(2,610
)
|
|
Other operating
results, net
|
454
|
962
|
-
|
246
|
1,662
|
|
Management
fees
|
-
|
-
|
-
|
-
|
-
|
|
Profit
/ (loss) from operations
|
3,466
|
2,551
|
(177
)
|
667
|
6,507
|
|
Share of profit of
associates
|
55
|
-
|
-
|
72
|
127
|
|
Segment
profit / (loss)
|
3,521
|
2,551
|
(177
)
|
739
|
6,634
|
|
|
-
|
|
|
|
|
|
Investment
properties
|
4,129
|
-
|
-
|
-
|
4,129
|
|
Property, plant
and equipment
|
20,886
|
179
|
-
|
54
|
21,119
|
|
Investments in
associates
|
419
|
-
|
-
|
293
|
712
|
|
Other reportable
assets
|
7,283
|
331
|
-
|
3,496
|
11,110
|
|
Reportable
assets
|
32,717
|
510
|
-
|
3,843
|
37,070
|
From
all of the Group’s revenues corresponding to Agricultural
Business, Ps.18,167 are originated in Argentina and Ps. 8,092 in
other countries, principally in Brazil for Ps.
7,278.
From
all of the Group’s assets included in the segment
corresponding to Agricultural Business, Ps. 13,269 are located in
Argentina and Ps. 23,801 in other countries, principally in Brazil
for Ps. 18.912.
|
|
06.30.19
|
||||
|
|
Agricultural
production
|
Land transformation
and sales
|
Corporate
|
Others
|
Total
Agricultural business
|
|
Revenues
|
11,100
|
-
|
-
|
7,961
|
19,061
|
|
Costs
|
(9,466
)
|
(24
)
|
-
|
(6,675
)
|
(16,165
)
|
|
Initial
recognition and changes in the fair value of biological assets and
agricultural products at the point of harvest
|
2,029
|
-
|
-
|
6
|
2,035
|
|
Changes
in the net realizable value of agricultural products after
harvest
|
(43
)
|
-
|
-
|
-
|
(43
)
|
|
Gross profit / (loss)
|
3,620
|
(24
)
|
-
|
1,292
|
4,888
|
|
Gain
from disposal of farmlands
|
-
|
665
|
-
|
-
|
665
|
|
Net
gain from fair value adjustment of investment
properties
|
-
|
-
|
-
|
-
|
-
|
|
General
and administrative expenses
|
(959
)
|
(3
)
|
(274
)
|
(289
)
|
(1,525
)
|
|
Selling
expenses
|
(1,026
)
|
(1
)
|
-
|
(690
)
|
(1,717
)
|
|
Other
operating results, net
|
428
|
244
|
-
|
147
|
819
|
|
Management
fees
|
-
|
-
|
-
|
-
|
-
|
|
(Loss) / Profit from operations
|
2,063
|
881
|
(274
)
|
460
|
3,130
|
|
Share
of profit / (loss) of associates
|
57
|
-
|
-
|
(46
)
|
11
|
|
Segment (loss) / profit
|
2,120
|
881
|
(274
)
|
414
|
3,141
|
|
|
|
|
|
|
|
|
Investment
properties
|
2,634
|
-
|
-
|
-
|
2,634
|
|
Property,
plant and equipment
|
20,219
|
149
|
-
|
767
|
21,135
|
|
Investments
in associates
|
391
|
-
|
-
|
23
|
414
|
|
Other
reportable assets
|
8,472
|
-
|
-
|
1,942
|
10,414
|
|
Reportable assets
|
31,716
|
149
|
-
|
2,732
|
34,597
|
From
all of the Group’s revenues corresponding to Agricultural
Business, Ps.
12,680
are originated in Argentina and Ps. 6,381 in other countries,
principally in Brazil for Ps. 5,923.
From
all of the Group’s assets included in the segment
corresponding to Agricultural Business, Ps. 13,765 are located in
Argentina and Ps. 20,832 in other countries, principally in Brazil
for Ps. 18,974.
F-60
Cresud Sociedad Anónima,
Comercial, Inmobiliaria, Financiera y Agropecuaria
|
|
06.30.18
|
||||
|
|
Agricultural
production
|
Land transformation and
sales
|
Corporate
|
Others
|
Total Agricultural
business
|
|
Revenues
|
9,096
|
-
|
-
|
6,297
|
15,393
|
|
Costs
|
(7,388
)
|
(36
)
|
-
|
(5,672
)
|
(13,096
)
|
|
Initial
recognition and changes in the fair value of biological assets and
agricultural products at the point of harvest
|
1,539
|
-
|
-
|
(9
)
|
1,530
|
|
Changes
in the net realizable value of agricultural products after
harvest
|
532
|
-
|
-
|
-
|
532
|
|
Gross profit / (loss)
|
3,779
|
(36
)
|
-
|
616
|
4,359
|
|
Net
gain from fair value adjustment of investment
properties
|
-
|
216
|
-
|
-
|
216
|
|
Loss
from disposal of farmlands
|
-
|
1,656
|
-
|
-
|
1,656
|
|
General
and administrative expenses
|
(878
)
|
(2
)
|
(225
)
|
(276
)
|
(1,381
)
|
|
Selling
expenses
|
(1,322
)
|
-
|
-
|
(431
)
|
(1,753
)
|
|
Other
operating results, net
|
(20
)
|
1,457
|
-
|
104
|
1,541
|
|
Management
fees
|
-
|
-
|
-
|
-
|
-
|
|
Profit / (Loss) from operations
|
1,559
|
3,291
|
(225
)
|
13
|
4,638
|
|
Share
of profit / (loss) of associates
|
39
|
-
|
-
|
(2
)
|
37
|
|
Segment profit / (loss)
|
1,598
|
3,291
|
(225
)
|
11
|
4,675
|
|
|
|
|
|
|
|
|
Investment
properties
|
2,052
|
-
|
-
|
-
|
2,052
|
|
Property,
plant and equipment
|
19,620
|
131
|
-
|
605
|
20,356
|
|
Investments
in associates
|
316
|
-
|
-
|
91
|
407
|
|
Other
reportable assets
|
7,073
|
-
|
-
|
867
|
7,940
|
|
Reportable assets
|
29,061
|
131
|
-
|
1,563
|
30,755
|
From
all of the Group’s revenues corresponding to Agricultural
Business, Ps. 11,296 are originated in Argentina and Ps. 4,097 in
other countries, principally in Brazil for Ps. 3,743.
From
all of the Group’s assets included in the segment
corresponding to Agricultural Business, Ps. 11,735 are located in
Argentina and Ps. 19,020 in other countries, principally in Brazil
for Ps. 17,128.
(I)
Urban properties and investments line of business
Below
is a summarized analysis of the lines of business of Group’s
operations center in Argentina for the fiscal years ended June 30,
2020, 2019 and 2018:
|
|
06.30.20
|
|||||||
|
|
Shopping Malls
|
Offices
|
Sales and developments
|
Hotels
|
International
|
Corporate
|
Others
|
Total
|
|
Revenues
|
5,935
|
2,358
|
735
|
2,021
|
11
|
-
|
78
|
11,138
|
|
Costs
|
(567
)
|
(144
)
|
(690
)
|
(1,244
)
|
(12
)
|
-
|
(98
)
|
(2,755
)
|
|
Gross profit / (loss)
|
5,368
|
2,214
|
45
|
777
|
(1
)
|
-
|
(20
)
|
8,383
|
|
Net
gain from fair value adjustment of investment
properties
|
(2,105
)
|
22,756
|
12,179
|
-
|
-
|
-
|
634
|
33,464
|
|
General
and administrative expenses
|
(829
)
|
(220
)
|
(228
)
|
(365
)
|
(110
)
|
(282
)
|
(116
)
|
(2,150
)
|
|
Selling
expenses
|
(709
)
|
(85
)
|
(197
)
|
(230
)
|
-
|
-
|
(11
)
|
(1,232
)
|
|
Other
operating results, net
|
(38
)
|
(30
)
|
(27
)
|
(20
)
|
-
|
-
|
67
|
(48
)
|
|
Management
fees
|
-
|
-
|
-
|
-
|
-
|
-
|
-
|
-
|
|
Profit / (Loss) from operations
|
1,687
|
24,635
|
11,772
|
162
|
(111
)
|
(282
)
|
554
|
38,417
|
|
Share
of profit / (loss) of associates and joint ventures
(**)
|
-
|
-
|
-
|
-
|
7,377
|
-
|
(330
)
|
7,047
|
|
Segment profit / (loss)
|
1,687
|
24,635
|
11,772
|
162
|
7,266
|
(282
)
|
224
|
45,464
|
|
|
|
|
|
|
|
|
|
|
|
Investment
and trading properties
|
49,109
|
61,284
|
32,171
|
-
|
307
|
-
|
1,442
|
144,313
|
|
Property,
plant and equipment
|
225
|
1,130
|
-
|
1,943
|
-
|
-
|
-
|
3,298
|
|
Investment
in associates and joint ventures (*)
|
-
|
-
|
532
|
-
|
2,004
|
-
|
6,738
|
9,274
|
|
Other
reportable assets
|
111
|
122
|
753
|
26
|
-
|
-
|
90
|
1,102
|
|
Reportable assets
|
49,445
|
62,536
|
33,456
|
1,969
|
2,311
|
-
|
8,270
|
157,987
|
From
all the revenues corresponding to the Operations Center in
Argentina, Ps. 11,127 are originated in Argentina, and Ps. 11 in
the U.S. No external client represents 10% or more of revenue of
any of the reportable segments.
From
all of the assets corresponding to the Operations Center in
Argentina segments, Ps. 155,377 are located in Argentina and Ps.
2,886 in other countries, principally in USA for Ps. 2, 311 and
Uruguay for Ps. 575.
F-61
Cresud Sociedad Anónima,
Comercial, Inmobiliaria, Financiera y Agropecuaria
|
|
06.30.19
|
|||||||
|
|
Shopping Malls
|
Offices
|
Sales and developments
|
Hotels
|
International
|
Corporate
|
Others
|
Total
|
|
Revenues
|
8,541
|
2,239
|
1,119
|
2,953
|
14
|
-
|
190
|
15,056
|
|
Costs
|
(776
)
|
(153
)
|
(527
)
|
(1,588
)
|
(6
)
|
-
|
(151
)
|
(3,201
)
|
|
Gross profit
|
7,765
|
2,086
|
592
|
1,365
|
8
|
-
|
39
|
11,855
|
|
Net
gain from fair value adjustment of investment
properties
|
(40,582
)
|
747
|
726
|
-
|
6
|
-
|
(374
)
|
(39,477
)
|
|
General
and administrative expenses
|
(945
)
|
(206
)
|
(283
)
|
(492
)
|
(110
)
|
(519
)
|
(113
)
|
(2,668
)
|
|
Selling
expenses
|
(530
)
|
(99
)
|
(119
)
|
(316
)
|
-
|
-
|
(21
)
|
(1,085
)
|
|
Other
operating results, net
|
(109
)
|
(40
)
|
(286
)
|
114
|
(24
)
|
-
|
(314
)
|
(659
)
|
|
Management
fees
|
-
|
-
|
-
|
-
|
-
|
-
|
-
|
-
|
|
Profit / (Loss) from operations
|
(34,401
)
|
2,488
|
630
|
671
|
(120
)
|
(519
)
|
(783
)
|
(32,034
)
|
|
Share
of profit / (loss) of associates and joint ventures
|
-
|
-
|
(37
)
|
-
|
(3,679
)
|
-
|
(2,467
)
|
(6,183
)
|
|
Segment profit / (loss)
|
(34,401
)
|
2,488
|
593
|
671
|
(3,799
)
|
(519
)
|
(3,250
)
|
(38,217
)
|
|
|
|
|
|
|
|
|
|
|
|
Investment
and trading properties
|
50,104
|
31,432
|
27,777
|
-
|
90
|
-
|
1,062
|
110,465
|
|
Property,
plant and equipment
|
260
|
136
|
-
|
2,024
|
180
|
-
|
-
|
2,600
|
|
Investment
in associates and joint ventures
|
-
|
-
|
443
|
-
|
(7,222
)
|
-
|
4,895
|
(1,884
)
|
|
Other
reportable assets
|
113
|
123
|
184
|
26
|
-
|
-
|
90
|
536
|
|
Reportable assets
|
50,477
|
31,691
|
28,404
|
2,050
|
(6,952
)
|
-
|
6,047
|
111,717
|
From
all the revenues corresponding to the Operations Center in
Argentina, included in the segments Ps. 14,563 are originated in
Argentina, Ps. 478 are originated in Uruguay and Ps. 14 are
originated in USA. No external client represents 10% or more of
revenue of any of the reportable segments.
From
all of the assets corresponding to the Operations Center in
Argentina segments, Ps. 117,932 are located in Argentina and Ps.
(6,370) in other countries, principally in USA for Ps. (6,952) and
Uruguay for Ps. 582.
|
|
06.30.18
|
|||||||
|
|
Shopping Malls
|
Offices
|
Sales and developments
|
Hotels
|
International
|
Corporate
|
Others
|
Total
|
|
Revenues
|
9,750
|
1,332
|
300
|
2,446
|
-
|
-
|
44
|
13,872
|
|
Costs
|
(829
)
|
(124
)
|
(149
)
|
(1,672
)
|
-
|
-
|
(48
)
|
(2,822
)
|
|
Gross profit / (loss)
|
8,921
|
1,208
|
151
|
774
|
-
|
-
|
(4
)
|
11,050
|
|
Net
gain from fair value adjustment of investment
properties
|
6,266
|
5,843
|
7,338
|
-
|
-
|
-
|
362
|
19,809
|
|
General
and administrative expenses
|
(854
)
|
(216
)
|
(198
)
|
(487
)
|
(118
)
|
(385
)
|
(77
)
|
(2,335
)
|
|
Selling
expenses
|
(607
)
|
(143
)
|
(58
)
|
(311
)
|
-
|
-
|
(7
)
|
(1,126
)
|
|
Other
operating results, net
|
(105
)
|
(24
)
|
138
|
(40
)
|
(58
)
|
-
|
33
|
(56
)
|
|
Management
fees
|
-
|
-
|
-
|
-
|
-
|
-
|
-
|
-
|
|
Profit / (Loss) from operations
|
13,621
|
6,668
|
7,371
|
(64
)
|
(176
)
|
(385
)
|
307
|
27,342
|
|
Share
of profit / (loss) of associates and joint ventures
|
-
|
-
|
4
|
-
|
(4,425
)
|
-
|
194
|
(4,227
)
|
|
Segment profit / (loss)
|
13,621
|
6,668
|
7,375
|
(64
)
|
(4,601
)
|
(385
)
|
501
|
23,115
|
|
|
|
|
|
|
|
|
|
|
|
Investment
and trading properties
|
89,983
|
28,142
|
25,166
|
-
|
-
|
-
|
1,334
|
144,625
|
|
Property,
plant and equipment
|
213
|
120
|
-
|
2,135
|
198
|
-
|
-
|
2,666
|
|
Investment
in associates and joint ventures
|
-
|
-
|
447
|
-
|
(3,869
)
|
-
|
8,251
|
4,829
|
|
Other
reportable assets
|
129
|
122
|
189
|
27
|
-
|
-
|
273
|
740
|
|
Reportable assets
|
90,325
|
28,384
|
25,802
|
2,162
|
(3,671
)
|
-
|
9,858
|
152,860
|
From
all the revenues corresponding to the Operations Center in
Argentina, the 100% are originated in Argentina. No external client
represents 10% or more of revenue of any of the reportable
segments.
From
all of the assets corresponding to the Operations Center in
Argentina segments, Ps. 155,890 are located in Argentina and Ps.
(2,987) in other countries, principally in USA for Ps. (3,672) and
Uruguay for Ps. 685 million.
F-62
Cresud Sociedad Anónima,
Comercial, Inmobiliaria, Financiera y Agropecuaria
Below
is a summarized analysis of the lines of business of Group’s
Operations Center in Israel for the years ended June 30, 2020, 2019
and 2018:
|
|
06.30.20
|
||||||
|
|
Real
Estate
|
Supermarkets
|
Telecommunications
|
Insurance
|
Corporate
|
Others
|
Total
|
|
Revenues
|
12,954
|
-
|
64,838
|
-
|
-
|
3,845
|
81,637
|
|
Costs
|
(6,787
)
|
-
|
(47,231
)
|
-
|
-
|
(2,278
)
|
(56,296
)
|
|
Gross
profit
|
6,167
|
-
|
17,607
|
-
|
-
|
1,567
|
25,341
|
|
Net gain from fair
value adjustment of investment properties
|
(2,989
)
|
-
|
-
|
-
|
-
|
-
|
(2,989
)
|
|
General and
administrative expenses
|
(812
)
|
-
|
(5,519
)
|
-
|
(1,071
)
|
(1,362
)
|
(8,764
)
|
|
Selling
expenses
|
(223
)
|
-
|
(11,887
)
|
-
|
-
|
(434
)
|
(12,544
)
|
|
Impairment of
associates
|
(2,470
)
|
-
|
-
|
-
|
-
|
-
|
(2,470
)
|
|
Other operating
results, net
|
(296
)
|
-
|
501
|
-
|
(48
)
|
970
|
1,127
|
|
Profit
/ (Loss) from operations
|
(623
)
|
-
|
702
|
-
|
(1,119
)
|
741
|
(299
)
|
|
Share of profit/
(loss) of associates and joint ventures
|
1,495
|
1,063
|
(265
)
|
-
|
-
|
(994
)
|
1,299
|
|
Segment
profit / (loss)
|
872
|
1,063
|
437
|
-
|
(1,119
)
|
(253
)
|
1,000
|
|
|
|
|
|
|
|
|
|
|
Reportable
assets
|
152,941
|
28,090
|
140,025
|
3,377
|
17,911
|
108,923
|
451,267
|
|
Reportable
liabilities
|
(146,331
)
|
-
|
(106,076
)
|
-
|
(111,649
)
|
(39,128
)
|
(403,184
)
|
|
Net
reportable assets
|
6,610
|
28,090
|
33,949
|
3,377
|
(93,738
)
|
69,795
|
48,083
|
No
external client represents 10% or more of the revenue of any of the
reportable segments. From all assets corresponding to the
Operations Center in Israel segments, Ps. 82,707 are located in
USA
(Ps.
74,170 in 2019 and Ps. 77,664 in 2018), Ps. 0 (Ps. 1,979 in 2019
and Ps. 2,333 in 2018) in India and the remaining are located in
Israel.
|
|
06.30.19
|
||||||
|
|
Real Estate
|
Supermarkets
|
Telecommunications
|
Insurance
|
Corporate
|
Others
|
Total
|
|
Revenues
|
14,392
|
-
|
57,506
|
-
|
-
|
1,639
|
73,537
|
|
Costs
|
(9,121
)
|
-
|
(42,424
)
|
-
|
-
|
(881
)
|
(52,426
)
|
|
Gross profit
|
5,271
|
-
|
15,082
|
-
|
-
|
758
|
21,111
|
|
Net
gain from fair value adjustment of investment
properties
|
892
|
-
|
-
|
-
|
-
|
-
|
892
|
|
General
and administrative expenses
|
(707
)
|
-
|
(4,779
)
|
-
|
(1,058
)
|
(1,487
)
|
(8,031
)
|
|
Selling
expenses
|
(197
)
|
-
|
(10,562
)
|
-
|
-
|
(433
)
|
(11,192
)
|
|
Other
operating results, net
|
-
|
-
|
397
|
-
|
-
|
345
|
742
|
|
Management
fees
|
-
|
-
|
-
|
-
|
-
|
-
|
-
|
|
Profit / (Loss) from
operations
|
5,259
|
-
|
138
|
-
|
(1,058
)
|
(817
)
|
3,522
|
|
Share of profit / (loss) of associates
and
joint ventures
|
37
|
717
|
-
|
-
|
-
|
(904
)
|
(150
)
|
|
Segment profit / (loss)
|
5,296
|
717
|
138
|
-
|
(1,058
)
|
(1,721
)
|
3,372
|
|
|
|
|
|
|
|
|
|
|
Reportable
assets
|
303,425
|
23,013
|
109,380
|
22,638
|
41,536
|
35,573
|
535,565
|
|
Reportable
liabilities
|
(235,553
)
|
-
|
(84,800
)
|
-
|
(126,585
)
|
(14,077
)
|
(461,015
)
|
|
Net reportable assets
|
67,872
|
23,013
|
24,580
|
22,638
|
(85,049
)
|
21,496
|
74,550
|
|
|
06.30.18
|
||||||
|
|
Real Estate
|
Supermarkets
|
Telecommunications
|
Insurance
|
Corporate
|
Others
|
Total
|
|
Revenues
|
9,497
|
-
|
49,066
|
-
|
-
|
1,494
|
60,057
|
|
Costs
|
(5,957
)
|
-
|
(35,189
)
|
-
|
-
|
(789
)
|
(41,935
)
|
|
Gross profit
|
3,540
|
-
|
13,877
|
-
|
-
|
705
|
18,122
|
|
Net
gain from fair value adjustment of investment
properties
|
-
|
-
|
-
|
-
|
-
|
-
|
-
|
|
General
and administrative expenses
|
(578
)
|
-
|
(4,594
)
|
-
|
(854
)
|
(1,207
)
|
(7,233
)
|
|
Selling
expenses
|
(200
)
|
-
|
(10,059
)
|
-
|
-
|
(380
)
|
(10,639
)
|
|
Other
operating results, net
|
256
|
-
|
772
|
-
|
1,141
|
(33
)
|
2,136
|
|
Management
fees
|
-
|
-
|
-
|
-
|
-
|
-
|
-
|
|
Profit / (Loss) from
operations
|
3,018
|
-
|
(4
)
|
-
|
287
|
(915
)
|
2,386
|
|
Share of profit / (loss) of associates
and
joint ventures
|
158
|
-
|
-
|
-
|
-
|
(580
)
|
(422
)
|
|
Segment profit / (loss)
|
3,176
|
-
|
(4
)
|
-
|
287
|
(1,495
)
|
1,964
|
|
|
|
|
|
|
|
|
|
|
Reportable
assets
|
298,031
|
29,579
|
110,723
|
27,247
|
47,432
|
50,642
|
563,654
|
|
Reportable
liabilities
|
(231,693
)
|
-
|
(86,280
)
|
-
|
(155,567
)
|
(5,516
)
|
(479,056
)
|
|
Net reportable assets
|
66,338
|
29,579
|
24,443
|
27,247
|
(108,135
)
|
45,126
|
84,598
|
F-63
Cresud Sociedad Anónima,
Comercial, Inmobiliaria, Financiera y Agropecuaria
7.
Information
about the main subsidiaries
The
Group conducts its business through several operating subsidiaries
and holdings. The Group considers that the subsidiaries below are
the ones with non-controlling interests material to the
Group.
|
|
Direct interest of non-controlling interest % (1)
|
Current assets
|
Non-current assets
|
Current liabilities
|
Non-current liabilities
|
Net assets
|
Book value of non-controlling interests
|
|
|
As of June 30, 2020
|
||||||
|
Subsidiaries with direct participation of Cresud
|
|
|
|
|
|
|
|
|
IRSA
|
37.67
%
|
205,717
|
421,482
|
143,384
|
361,16
|
122,655
|
65,528
|
|
Subsidiaries with indirect participation of Cresud
|
|
|
|
|
|
|
|
|
Brasilagro
|
66.45
%
|
21,976
|
8,338
|
5,121
|
7,903
|
17,29
|
11,489
|
|
Elron
|
38.94
%
|
3,377
|
3,966
|
509
|
142
|
6,692
|
4,149
|
|
PBC
|
27.60
%
|
79,327
|
112,404
|
26,138
|
118,789
|
46,804
|
19,263
|
|
Cellcom
(2)
|
53.80
%
|
54,777
|
79,796
|
31,386
|
74,691
|
28,496
|
17,92
|
|
Mehadrin
|
56.25
%
|
13,038
|
17,839
|
13,954
|
3,336
|
13,587
|
8,136
|
|
IRSA
CP
|
16.73
%
|
14,925
|
129,578
|
16,423
|
52,507
|
75,573
|
4,089
|
|
|
As of June 30, 2019
|
||||||
|
Subsidiaries with direct participation of Cresud
|
|
|
|
|
|
|
|
|
IRSA
|
37.65
%
|
201,916
|
476,445
|
105,704
|
450,001
|
122,656
|
76,813
|
|
Brasilagro
|
56.71
%
|
7,075
|
18,856
|
3,595
|
5,252
|
17,084
|
-
|
|
Subsidiaries with indirect participation of Cresud
|
|
|
|
|
|
|
|
|
Elron
|
38.94
%
|
4,521
|
3,77
|
529
|
69
|
7,693
|
4,624
|
|
PBC
|
31.20
%
|
63,904
|
236,44
|
25,708
|
208,515
|
66,121
|
47,766
|
|
Cellcom
(2)
|
55.90
%
|
45,957
|
59,076
|
27,278
|
57,524
|
20,231
|
12,777
|
|
IRSA
CP
|
14.73
%
|
24,563
|
91,203
|
5,797
|
51,924
|
58,045
|
3,113
|
|
|
Revenues
|
Net income / (loss)
|
Total comprehensive income / (loss)
|
Total comprehensive income / (loss) attributable to non-controlling
interest
|
Cash of operating activities
|
Cash of investing activities
|
Cash of financial activities
|
Net Increase (decrease) in cash and cash equivalents
|
Dividends distribution to non-controlling shareholders
|
|
|
Year ended June 30, 2020
|
||||||||
|
Subsidiaries with direct participation of Cresud
|
|
|
|
|
|
|
|
|
|
|
IRSA
|
95,793
|
23,731
|
14,182
|
9,482
|
31,113
|
40,644
|
(76,125
)
|
(4,368
)
|
(2,283
)
|
|
Subsidiaries with indirect participation of Cresud
|
|
|
|
|
|
|
|
|
|
|
Brasilagro
|
7,605
|
2,368
|
(2,701
)
|
(1,795
)
|
1,295
|
(706
)
|
9
|
598
|
-
|
|
Elron
|
-
|
(1,774
)
|
(1,864
)
|
5,540
|
(776
)
|
350
|
874
|
448
|
-
|
|
PBC
|
12,31
|
12,648
|
12,165
|
19,586
|
6,328
|
23,872
|
(20,243
)
|
9,957
|
1,684
|
|
Cellcom
(2)
|
56,076
|
(2,068
)
|
(2,100
)
|
534
|
14,914
|
(7,425
)
|
(6,323
)
|
1,166
|
-
|
|
Mehadrin
|
1,952
|
106
|
123
|
251
|
246
|
(70
)
|
(246
)
|
(70
)
|
17
|
|
IRSA
CP
|
8,563
|
18,153
|
18,405
|
1,064
|
4,890
|
(2,879
)
|
(3,561
)
|
(1,550
)
|
663
|
|
|
Year ended June 30, 2019
|
||||||||
|
Subsidiaries with direct participation of Cresud
|
|
|
|
|
|
|
|
|
|
|
IRSA
|
99,713
|
(38,371
)
|
(2,025
)
|
(2,848
)
|
27,041
|
11,189
|
(27,754
)
|
10,476
|
(3,330
)
|
|
Brasilagro
|
5,798
|
1,995
|
(342
)
|
-
|
849
|
(356
)
|
(417
)
|
76
|
-
|
|
Subsidiaries with indirect participation of Cresud
|
|
|
|
|
|
|
|
|
|
|
Elron
|
-
|
(1,056
)
|
(909
)
|
2,122
|
(1,012
)
|
207
|
1,338
|
533
|
-
|
|
PBC
|
18,061
|
6,953
|
7,575
|
5,23
|
9,081
|
1,072
|
2,926
|
13,079
|
2,337
|
|
Cellcom
(2)
|
47,535
|
(1,524
)
|
(1,538
)
|
(1,352
)
|
10,025
|
(8,614
)
|
1,666
|
3,077
|
-
|
|
IRSA
CP
|
14,537
|
(25,923
)
|
(25,923
)
|
(150
)
|
5,588
|
(4,958
)
|
(2,631
)
|
(2,001
)
|
1,008
|
(1)
Corresponds to the
direct interest from the Group.
(2)
DIC considers it
exercises effective control over Cellcom because DIC is the group
with the higher percentage of votes vis-à-vis other
shareholders, also taking into account the historic voting
performance in the Shareholders’ Meetings.
Restrictions, commitments and other relevant issues
Analysis of the impact of the Concentration Law
On
December 2013, was published in the Official Gazette of Israel the
Promotion of Competition and Reduction of Concentration Law
N°, 5774-13 (‘the Concentration Law’) which has
material implications for IDBD, DIC and its investors, including
the disposal of the controlling interest in Clal. In accordance
with the provisions of the law, the structures of companies that
make public offer of their securities are restricted to two layers
of public companies.
In
November 2017, Dolphin IL, a subsidiary of Dolphin Netherlands B.V.
acquired all the shares owned by IDBD in DIC (See note 4). Thus,
the section required by the aforementioned law for the year 2017 is
completed.
F-64
Cresud Sociedad Anónima,
Comercial, Inmobiliaria, Financiera y Agropecuaria
Prior
to December 31, 2019 the Group lost control over Gav-Yam and in
March 2020 it acquired control over Mehadrin, thus complying with
the above-mentioned law.
Dolphin arbitration process
There
is an arbitration process going on between Dolphin and ETH
(previous shareholder of IDBD) in relation to certain issues
connected to the control obtainment of IDBD (mainly regarding who
had the right of purchase and the price of the acquisition). In the
arbitration process the parties have agreed to designate Eyal
Rosovshy and Giora Erdinas to promote a mediation. On August 17,
2017, a mediation hearing was held and the parties failed to reach
an agreement. On January 31, 2018, the parties agreed to follow the
process in court. As of the date of presentation of these
Consolidated Financial Statements, there have been no other
developments in the process and it is still pending resolution.
Management, based on the opinion of its legal advisors, considers
that the resolution of the present litigation will not have an
adverse effect for Dolphin.
8.
Investments
in associates and joint ventures
Changes
of the Group’s investments in associates and joint ventures
for the fiscal years ended June 30, 2019 and 2018 were as
follows:
|
|
06.30.20
|
06.30.19
|
|
Beginning
of the
year
|
36,212
|
52,739
|
|
Adjustment of
previous years (IFRS 9 and IAS 28
)
|
(1,979
)
|
-
|
|
Share-holding
increase
in associates and joint
ventures
|
2,774
|
697
|
|
Capital
contribution
|
2,852
|
163
|
|
Share of profit /
(loss)
|
8,812
|
(7,328
)
|
|
Decrease for
control
obtainment (Note
4)
|
-
|
(153
)
|
|
Currency
translation adjustment
|
9
|
(429
)
|
|
Cash dividends
(i
)
|
(1,846
)
|
(1,734
)
|
|
Sale of
associates
|
-
|
(7,178
)
|
|
Capital
reduction
|
(106
)
|
(672
)
|
|
Other comprehensive
loss
|
(1,244
)
|
-
|
|
Deconsolidation
(ii)
|
29,176
|
-
|
|
Reclassification to
held-for-sale
|
(2,070
)
|
-
|
|
Incorporation
by business
combination
|
2,517
|
212
|
|
Others
|
4
|
(105
)
|
|
End
of the
year (iii)
|
75,111
|
36,212
|
(i)
See Note
32.
(ii)
Includes Ps. (17)
and Ps. (8,658) reflecting interests in companies with negative
equity as of June 30, 2020 and 2019, respectively, which are
disclosed in “Provisions” (see Note 21).
Below
is a detail of the investments and the values of the stake held by
the Group in associates and joint ventures for the years ended as
of June 30, 2020 and 2019, as well as the Group's share of the
comprehensive results of these companies for the years ended on
June 30, 2020, 2019 and 2018:
|
|
% of ownership interest held
|
Value of Group's interest in equity
|
Group's interest in comprehensive income
|
|||||
|
Name of the entity
|
06.30.20
|
06.30.19
|
06.30.18
|
06.30.20
|
06.30.19
|
06.30.20
|
06.30.19
|
06.30.18
|
|
|
|
|
|
|
|
|
|
|
|
New
Lipstick
|
49.96
%
|
49.96
%
|
49.90
%
|
467
|
(8,658
)
|
7,633
|
(3,199
)
|
(5,292
)
|
|
BHSA
(1)
|
29.91
%
|
29.91
%
|
29.91
%
|
4,073
|
4,451
|
(380
)
|
(2,411
)
|
416
|
|
Condor
(2)
|
18.89
%
|
18.89
%
|
28.10
%
|
1,481
|
1,392
|
120
|
39
|
596
|
|
PBEL
|
45.00
%
|
45.40
%
|
45.40
%
|
-
|
1,979
|
-
|
(117
)
|
416
|
|
Shufersal
(5)
|
26.02
%
|
26.02
%
|
33.56
%
|
28,111
|
23,013
|
5,215
|
297
|
-
|
|
Quality
(3)
|
50.00
%
|
50.00
%
|
50.00
%
|
2,101
|
1,869
|
185
|
(583
)
|
876
|
|
La
Rural S.A.
|
50.00
%
|
50.00
%
|
50.00
%
|
203
|
101
|
102
|
144
|
(44
)
|
|
TGLT
|
30.50
%
|
-
|
-
|
2,059
|
-
|
(116
)
|
-
|
-
|
|
Cresca
S.A. (4)
|
50.00
%
|
50.00
%
|
50.00
%
|
21
|
20
|
(16
)
|
18
|
1
|
|
Mehadrin
|
45.41
%
|
45.41
%
|
45.41
%
|
-
|
4,845
|
-
|
(111
)
|
1,276
|
|
Gav-Yam
|
34.90
%
|
-
|
-
|
27,277
|
-
|
(786
)
|
-
|
-
|
|
Other
associates and joint ventures
|
-
|
-
|
-
|
9,318
|
7,200
|
(3,136
)
|
(1,834
)
|
2,368
|
|
Total associates and joint ventures
|
|
|
|
75,111
|
36,212
|
8,821
|
(7,757
)
|
613
|
F-65
Cresud Sociedad Anónima,
Comercial, Inmobiliaria, Financiera y Agropecuaria
The
following is additional information about the Group's investments
in associates and joint ventures:
|
|
|
|
|
Last financial statement issued
|
||
|
Name of the entity
|
Place of business / Country of incorporation
|
Main activity
|
Common shares 1 vote
|
Share capital (nominal value)
|
Income / (loss) for the year
|
Shareholders' equity
|
|
|
|
|
|
|
|
|
|
New
Lipstick
|
United
States
|
Real
Estate
|
N/A
|
-
|
(*) 179
|
(*) (31)
|
|
BHSA
(1)
|
Argentina
|
Financing
|
448,689,072
|
(***) 1,500
|
(***) (1,272)
|
(***) 13,186
|
|
Condor
(2)
|
United
States
|
Hotel
|
2,245,100
|
(*) 232
|
(*) (9)
|
(*) 86
|
|
PBEL
|
India
|
Real
Estate
|
(**) 1
|
(**) (2)
|
(**) -
|
(**) (2)
|
|
Shufersal
(5)
|
Israel
|
Retail
|
123,917,650
|
(**) 1,399
|
(**) 310
|
(**) 1,930
|
|
Mehadrin
|
Israel
|
Agriculture
|
N/A
|
N/A
|
N/A
|
N/A
|
|
Gav-Yam
|
Israel
|
Real
Estate
|
639,727
|
(**) 1,356
|
(**) 411
|
(**) 3,496
|
|
Quality
(3)
|
Argentina
|
Real
Estate
|
163,039,244
|
326
|
370
|
4,140
|
|
La
Rural S.A.
|
Argentina
|
Event organization
and others
|
714,498
|
1
|
224
|
327
|
|
TGLT
|
Argentina
|
Real
Estate
|
279,502,813
|
925
|
(311
)
|
6,004
|
N/A:
Not applicable.
(1)
BHSA is a
commercial bank of comprehensive services that offers a variety of
banking and financial services for individuals, small and medium
business and large companies. The market price of the share is 8.45
pesos per share. The effect of the treasury shares in the BHSA
portfolio is considered for the calculation.
(2)
Condor is an
investment company focused on US hotels. The price of its shares as
of June 30, 2020 is US$ 4.07 per share
(3)
Quality is
dedicated to the exploitation of the San Martín property
(former property of Nobleza Piccardo S.A.I.C. and F.).
(4)
Cresca is a joint
venture between the Company and Carlos Casado S.A. with
agricultural operations in Paraguay.
(5)
Shufersal is a
company that has supermarkets and pharmacies in Israel, the market
price of the share is NIS 22,59 as of June 30, 2019.
(*)
Amounts presented
in millions of US dollars under USGAAP. Condor’s year-end
falls on December 31, so the Group estimates their interest will a
three-month lag including any material adjustments, if
any.
(**)
Amounts in millions
of NIS.
(***)
Amounts as of June
30, 2020, prepared in accordance with BCRA’
regulations.
For
the purpose of the valuation of the investment in the Company, the
adjustments necessary to adequate the Financial Statements to IFRS
have been considered
New Lipstick
On
August 7, 2020, as a consequence of negotiations conducted in the
context of an increased lease price effective as of May 2020, as
set forth in the lease (hereinafter, “Ground Lease”),
Metropolitan (a company where IRSA holds, indirectly, a 49.96%
interest) executed an agreement with the Ground Lease lessor to
conclude the relationship and terminate the ground lease,
abandoning the administration of the building. As a consequence of
the foregoing, Metropolitan derecognised the liability associated
to the ground lease, as well as all assets and liabilities
associated to the building and the administration. Pursuant to such
agreement, Metropolitan was fully released from liability except
for (i) claims for liabilities prior to June 1, 2020, from those
persons who performed works or rendered services in the Building or
for Metropolitan and (ii) claims from persons who had an accident
in the property after August 7, 2020.
Gav-Yam
Considering that,
on June 30, 2020, the market value of Gav-Yam was lower than its
carrying value, PBC management considered whether there may be
signs of impairment of the investment in such company. Based on the
management´s review, with the assistance of external advisors,
PBC considered that there was no evidence of investment impairment.
Some of the factors considered are listed below:
●
The price of
Gav-Yam shares has been significantly volatile since mid-March
2020; therefore, the fact that the market cap of the company was
lower than the carrying value as of June 30, 2020 has not been
considered as tantamount to a significant or sustained
decrease;
●
On August 4, 2020,
Aharon Frenkel purchased approximately 8.6% of Gav-Yam´s
capital stock at a value of NIS 2,091/share, which circumstance
reinforces the management´s conclusions;
●
Gav-Yam income as
of March 31, 2020 and June 30, 2020 show that Gav-Yam is a stable
company with a high quality and wide-ranging client
portfolio.
F-66
Cresud Sociedad Anónima,
Comercial, Inmobiliaria, Financiera y Agropecuaria
Set out
below is summarized financial information of the associates and
joint ventures considered material to the Group:
|
|
Current
assets
|
Non-current
assets
|
Current
liabilities
|
Non-current
liabilities
|
Net
assets
|
% of
ownership interest held
|
Interest
in associates / joint ventures
|
Goodwill
and others
|
Book
value
|
|
|
As
of June 30, 2020
|
||||||||
|
Associates
|
|
|
|
|
|
|
|
|
|
|
BHSA
|
76,869
|
43,610
|
102,290
|
4,629
|
13,560
|
29.91
%
|
4,056
|
17
|
4,073
|
|
Gav-Yam
|
41,963
|
165,878
|
19,791
|
117,752
|
70,298
|
34.90
%
|
24,534
|
2,743
|
27,277
|
|
Shufersal
|
73,348
|
187,032
|
91,899
|
129,224
|
39,257
|
26.02
%
|
10,213
|
17,898
|
28,111
|
|
|
|
|
|
|
|
|
|
|
|
|
Joint ventures
|
|
|
|
|
|
|
|
|
|
|
Quality
Invest (ii)
|
4
|
5,525
|
87
|
1,302
|
4,140
|
50.00
%
|
2,070
|
31
|
2,101
|
|
|
As
of June 30, 2019
|
||||||||
|
Associates
|
|
|
|
|
|
|
|
|
|
|
BHSA
|
87,812
|
31,989
|
89,513
|
15,287
|
15,001
|
29.91
%
|
4,487
|
35
|
4,451
|
|
PBEL
|
3,173
|
853
|
632
|
12,128
|
(8,734
)
|
45.00
%
|
(3,930
)
|
5,910
|
1,980
|
|
Shufersal
|
51,741
|
89,475
|
54,708
|
54,794
|
31,714
|
26.02
%
|
8,253
|
14,761
|
23,014
|
|
|
|
|
|
|
|
|
|
|
|
|
Joint ventures
|
|
|
|
|
|
|
|
|
|
|
Quality
Invest (ii)
|
24
|
4,921
|
118
|
1,152
|
3,675
|
50.00
%
|
1,838
|
32
|
1,870
|
|
Mehadrin
|
11,890
|
15,318
|
13,068
|
3,719
|
10,421
|
45.41
%
|
4,733
|
112
|
4,846
|
|
|
Revenues
|
Net
income / (loss)
|
Total
comprehensive income / (loss)
|
Dividends
distributed to non-controlling shareholders
|
Cash
of operating activitie
|
Cash
of investment activities
|
Cash
of financial activities
|
Net
increase / (decrease) in cash and cash equivalents
|
|
|
Year
ended June 30, 2020 (i)
|
|||||||
|
Associates
|
|
|
|
|
|
|
|
|
|
BHSA
|
13,033
|
(1,272
)
|
(1,272
)
|
-
|
4,656
|
37
|
(3,465
)
|
1,228
|
|
Gav-Yam
|
11,551
|
6,765
|
5,456
|
3,587
|
5,086
|
(5,723
)
|
15,869
|
15,232
|
|
Shufersal
|
218,000
|
5,046
|
4,500
|
1,435
|
21,874
|
(2,709
)
|
(13,793
)
|
5,372
|
|
|
|
|
|
|
|
|
|
|
|
Joint ventures
|
|
|
|
|
|
|
|
|
|
Quality
Invest (ii)
|
4
|
5,525
|
87
|
1,302
|
4,140
|
1
|
2,070
|
31
|
|
|
Year
ended June 30, 2019 (i)
|
|||||||
|
Associates
|
|
|
|
|
|
|
|
|
|
BHSA
|
24,306
|
2,426
|
2,426
|
358
|
11,348
|
(2,917
)
|
(7,209
)
|
1,222
|
|
PBEL
|
12
|
(260
)
|
(319
)
|
-
|
57
|
239
|
(306
)
|
(10
)
|
|
Shufersal
|
165,640
|
3,165
|
3,148
|
2,448
|
4,457
|
(11,530
)
|
1,396
|
(5,677
)
|
|
|
|
|
|
|
|
|
|
|
|
Joint ventures
|
|
|
|
|
|
|
|
|
|
Quality
Invest (ii)
|
35
|
(1,167
)
|
(1,167
)
|
-
|
(124
)
|
-
|
124
|
-
|
|
Mehadrin
|
17,330
|
775
|
819
|
-
|
671
|
(277
)
|
(1,262
)
|
(868
)
|
(i)
Information under
GAAP applicable in the associate and joint ventures´
jurisdiction.
(ii)
In March 2011,
Quality acquired an industrial plant located in San Martín,
Province of Buenos Aires. The facilities are suitable for multiple
uses. On January 20, 2015, Quality agreed with the Municipality of
San Martin on certain re zoning and other urban planning matters
(“the Agreement”) to surrender a non-significant
portion of the land and a monetary consideration of Ps. 40 million,
payable in two installments of Ps. 20 each, the first of which was
actually paid on June 30, 2015. In July 2017, the Agreement was
amended as follows: 1) a revised zoning plan must be submitted
within 120 days as from the amendment date, and 2) the second
installment of the monetary considerations was increased to Ps. 71
million payables in 18 equal monthly installments. On March 8,
2018, it was agreed with the well-known Gehl Study (Denmark) -
Urban Quality Consultant - the elaboration of a Master Plan,
generating a modern concept of New Urban District of Mixed
Uses.
(iii)
Information under
BCRA Standards except for the book value of the interest in the
associate, goodwill and others.
BHSA
BHSA is
subject to certain restrictions on the distribution of profits, as
required by BCRA regulations.
As of
June 30, 2020, BHSA has a remnant of 35.2 million Class C treasury
shares of a par value of Ps. 1 received in 2009 as a result of
certain financial transactions. The Annual Shareholders' Meeting
decided to allocate 35.1 million of such shares to an employee
compensation plan pursuant to Section 67 of Law 26,831. The
remaining shares belong to third party holders of Stock
Appreciation Rights, who have failed to produce the documentation
required for redemption purposes. As of June 30, 2020, considering
the effect of such treasury shares, the Group’s interest in
BHSA amounts to 29.91%.
The
Group estimated that the value in use of its investment in BHSA as
of June 30, 2020 and 2019 amounted to Ps. 5,933, Ps. 5,521,
respectively. The value in use was estimated based on the present
value of future business cash flows. The main assumptions used were
the following:
-
The Group
considered 7 years as the horizon for the projection of BHSA cash
flows.
-
The “Private
BADLAR” interest rate was projected based on internal data
and information gathered from external advisors.
F-67
Cresud Sociedad Anónima,
Comercial, Inmobiliaria, Financiera y Agropecuaria
-
The projected
exchange rate was estimated in accordance with internal data and
external information provided by independent
consultants.
-
The discount rate
used to discount actual dividend flows was 13.82% in 2020 and
14.37% in 2019.
-
The sensitivity to
a 1% increase in the discount rate would be a reduction in the
value in use of Ps. 536 for 2020 and of Ps.503 for
2019.
Puerto Retiro (joint venture):
At
present, this 8.3-hectare plot of land, is affected by a zoning
regulation defined as U.P. which prevents the property from being
used for any purposes other than strictly port
activities.
Puerto
Retiro was involved in a judicial bankruptcy action brought by the
National Government. The current Board of Directors would not be
held personally liable with regard to this action. Management and
legal counsel of the Company believe that there are sufficient
legal and technical arguments to consider that the petition for
extension of the bankruptcy case will be dismissed by the court.
However, in view of the current status of the action, its result
cannot be predicted.
Moreover, Tandanor
filed a civil action against Puerto Retiro S.A. and the other
defendants in the criminal case for violation of Section 174 (5)
based on Section 173 (7) of the Criminal Code of Argentina. Such
action seeks -on the basis of the nullity of the decree that
approved the bidding process involving the Dársena Norte
property- the restitution of the property and a reimbursement in
favor of Tandanor for all such amounts it has allegedly lost as a
result of a suspected fraudulent transaction involving the sale of
the property. Puerto Retiro has presented the allegation on the
merit of the evidence, highlighting that the current shareholders
of Puerto Retiro did not participate in any of the suspected acts
in the criminal case since they acquired the shares for
consideration and in good faith several years after the facts told
in the process. Likewise, it was emphasized that the company Puerto
Retiro is foreign to the bidding / privatization carried out for
the sale of Tandanor shares. On September 7, 2018, the Oral Federal
Criminal Court No. 5 rendered a decision. According to the sentence
read by the president of the Court, Puerto Retiro won the
preliminary objection of limitation filed in the civil action.
However, in the criminal case, where Puerto Retiro is not a party,
it was ordered, among other issues, the confiscation
(“decomiso”) of the property owned by Puerto Retiro
known as Planta I. The grounds of the Court`s judgment were read on
November 11, 2018. From that moment, all the parties were able to
present the appeals. Given this fact, an extraordinary appeal was
filed, which was rejected, and as a result, a complaint was filed
for a rejected appeal, which was granted. Consequently, the appeal
is under study in the Argentine Supreme Court of
Justice.
In the
criminal action, the claimant reported the violation by Puerto
Retiro of the injunction ordered by the criminal court consisting
in an order to stay (“prohibición de innovar”) and
not to contract with respect to the property disputed in the civil
action. As a result of this complaint, the Federal Oral Court No. 5
formed an incident and ordered and executed the closure of the
property where the lease agreements were being executed (a heliport
and a mooring), in order to enforce compliance with the measure
before mentioned. As a result of this circumstance, it was learned
that the proceedings were turned over to the Criminal Chamber for
the allocation of the court to investigate the possible commission
of a crime of disobedience. As of the date of issuance of these
financial statements there has been no news about the progress of
this cause.
Faced
with the evolution of the legal cases that affect it and based on
the reports of its legal advisors, Puerto Retiro Management has
decided to register in fiscal year 2019 an allowance equivalent to
100% of the book value of its investment property, without
prejudice to reverse it when a favorable ruling is obtained in the
interposed actions.
9.
Investment
properties
Changes
in the Group’s investment properties according to the fair
value hierarchy for the years ended June 30, 2020 and 2019 were as
follows:
|
|
06.30.20
|
06.30.19
|
||
|
|
Level 2
|
Level 3
|
Level 2
|
Level 3
|
|
Fair value at the beginning of the year
|
45,415
|
289,601
|
38,116
|
325,559
|
|
Reclassifications
of previous periods (IFRS 16)
|
-
|
426
|
-
|
-
|
|
Currency
translation adjustment
|
(670
)
|
53,460
|
59
|
(3,001
)
|
|
Additions
|
3,621
|
1,838
|
5,165
|
6,446
|
|
Additions
of capitalized leasing costs
|
4
|
16
|
11
|
4
|
|
Depreciation
of capitalized leasing costs (i)
|
(6
)
|
(9
)
|
(9
)
|
(4
)
|
|
Transfers
|
6,116
|
(28,781
)
|
849
|
1,135
|
|
Disposals
|
(1,740
)
|
(13,412
)
|
(2,122
)
|
(3,676
)
|
|
Balance
incorporated by business combination
|
-
|
244
|
-
|
-
|
|
Deconsolidation
|
(1,694
)
|
(155,846
)
|
-
|
-
|
|
Capitalized
finance costs
|
-
|
-
|
217
|
16
|
|
Net
gain / (loss) from fair value adjustment
|
28,523
|
3,061
|
3,129
|
(36,878
)
|
|
Fair value at the end of the year
|
79,569
|
150,598
|
45,415
|
289,601
|
(i)
Amortization
charges of capitalized leasing costs were included in
“Costs” in the Statements of Income (Note
27)
(ii)
Ps. 1,694
corresponde a La Maltería y Ps. 155,846 a
Gav-Yam.
F-68
Cresud Sociedad Anónima,
Comercial, Inmobiliaria, Financiera y Agropecuaria
The
following is the balance by type of investment property of the
Group as of June 30, 2020 and 2019:
|
|
06.30.20
|
06.30.19
|
|
Leased
out farmland
|
4,129
|
2,633
|
|
Rental
properties
|
191,175
|
287,149
|
|
Undeveloped
parcels of land
|
27,534
|
33,713
|
|
Properties
under development
|
7,329
|
11,521
|
|
Total
|
230,167
|
335,016
|
Certain
investment property assets of the Group have been mortgaged or
restricted to secure some of the Group’s borrowings and other
payables. Book amount of those properties amounts to Ps. 18,171 and
Ps. 15,510 as June 30, 2020 and 2019, respectively.
The
following amounts have been recognized in the Statements of
Income:
|
|
06.30.20
|
06.30.19
|
06.30.18
|
|
Rental
and services income
|
22,131
|
30,504
|
27,869
|
|
Direct
operating expenses
|
(8,983
)
|
(8,385
)
|
(7,699
)
|
|
Development
expenses
|
121
|
(87
)
|
(4,206
)
|
|
Net
realized gain from fair value adjustment of investment
property
|
1,080
|
822
|
527
|
|
Net
unrealized gain / (loss) from fair value adjustment of investment
property
|
30,380
|
(38,568
)
|
23,554
|
See
Note 5 (liquidity schedule) for detail of contractual commitments
related to investment properties.
Valuation processes
The
Group’s investment properties were valued at each reporting
date by independent professionally qualified appraisers who hold a
recognized relevant professional qualification and have experience
in the locations and segments of the investment properties
appraised. For all investment properties, their current use equates
to the highest and best use.
Each
business (or operations center, as appropriate) has a team, which
reviews the appraisals performed by the independent appraisers (the
“review team”). The review team: i) verifies all major
and important assumptions relevant to the appraisal in the
valuation report from the independent appraisers; ii) assesses
property valuation movements compared to the valuation report from
the prior period; and iii) holds discussions with the independent
appraisers.
Changes
in Level 2 and 3 fair values, if any, are analyzed at each
reporting date during the valuation discussions between the review
team and the independent appraisers. In the case of the Operations
Center in Argentina, the Board of Directors ultimately approves the
fair value calculation for recording into the Financial Statements.
In the case of the Operations Center in Israel, the appraisals are
examined by Israel Management and reported to the Financial
Statements Committee.
Valuation techniques used for the estimation of fair value of the
investment property
Agricultural business
For all
leases of agricultural land with a total valuation of Ps. 4,193 and
Ps. 5,598 for fiscal years ended on June 30, 2020 and 2019,
respectively, the valuation was determined using comparable values.
Sale prices of comparable properties are adjusted considering the
specific aspects of each property, the most relevant premise being
the price per hectare.
Urban properties and investments business
Argentina operations center
The
Group has defined valuation techniques according to the
characteristics of each property and the type of market in which
these assets are located, in order to maximize the use of
observable information available for the determination of fair
value.
For the
Shopping Malls there is no liquid market for the sale of properties
with these characteristics that can be taken as a reference of
value. Likewise, the Shopping Malls, being a business denominated
in pesos, are highly related to the fluctuation of macroeconomic
variables in Argentina, the purchasing power of individuals, the
economic cycle of Gross Domestic Product (GDP) growth, the
evolution of inflation, among others. Consequently, the methodology
adopted by the Group for the valuation of Shopping Malls is the
discounted cash flow model (“DCF”), which allows the
volatility of the Argentine economy to be taken into account and
its correlation with the revenue streams of the Malls and the
inherent risk of the Argentine macroeconomy. The DCF methodology
contemplates the use of certain unobservable
F-69
Cresud Sociedad Anónima,
Comercial, Inmobiliaria, Financiera y Agropecuaria
valuation
assumptions, which are determined reliably based on the information
and internal sources available at the date of each measurement.
These assumptions mainly include the following:
●
Future cash flow projected income based on the current locations,
type and quality of the properties, backed by the lease agreements
that the Company has signed with its tenants. The Company's
revenues are equal to the higher of: i) a Minimum Insured Fixed
Value (“VMA”) and ii) a percentage of the tenant's
sales in each Shopping Mall. Accordingly, estimates of the
evolution of the Gross Domestic Product (“GDP) and the
Inflation of the Argentine economy, as provided by an external
consultant were used to estimate the evolution of tenant sales,
which have a high correlation with these macroeconomic variables.
These macroeconomic projections were contrasted with the
projections prepared by the International Monetary Fund
(“IMF”), the Organization for Economic Cooperation and
Development (“OECD”) and with the Survey of Market
Expectations (“REM”), which consists of a Survey
prepared by the Central Bank of Argentina (BCRA) aimed to local and
foreign specialized analysts in order to allow a systematic
follow-up of the main short and medium term macroeconomic forecasts
on the evolution of the Argentine economy.
●
The income from all Shopping Malls was considered to grow with the
same elasticity in relation to the evolution of the GDP and the
projected inflation. The specific characteristics and risks of each
Shopping Mall are captured through the use of the historical
average EBITDA Margin of each of them.
●
Cash flows from future investments, expansions or improvements in
Shopping Mall were not contemplated.
●
Terminal value: a perpetuity calculated from the cash flow of the
last year of useful life was considered.
●
The cash flow for concessions was projected until the termination
date of the concession stipulated in the current
contract.
●
Given the prevailing inflationary context and the volatility of
certain macroeconomic variables, a reference long term interest
rate in pesos is not available to discount the projected cash flows
from shopping malls. Consequently, the projected cash flows were
dollarized through the future ARS / US$ exchange rate curve
provided by an external consultant, which are contrasted to assess
their reasonableness with those of the IMF, OECD, REM and the
On-shore Exchange Rate Futures Market (ROFEX). Finally, dollarized
cash flows were discounted with a long-term dollar rate, the
weighted average capital cost rate (“WACC”), for each
valuation date.
●
The estimation of the WACC discount rate was determined according
to the following components:
a)
United State Governments Bonds risk-free rate;
b)
Industry beta, considering comparable companies from the United
States, Brazil, Chile and Mexico, in order to contemplate the
Market Risk on the risk-free rate;
c)
Argentine country risk considering the EMBI + Index;
and
d)
Cost of debt and capital structure, considering that information
available from the Argentine corporate market (“blue
chips”) was determined as a reference, since sovereign bonds
have a history of defaults. Consequently, and because IRSA CP,
based on its representativeness and market share represents the
most important entity in the sector, we have taken its indicators
to determine the discount rate.
For offices, other rental properties and plot of lands, the
valuation was determined using transactions of comparable market
assets, since the market for offices and land banks in Argentina is
liquid and has market transactions that can be taken as reference.
These values are adjusted to the differences in key attributes such
as location, property size and quality of interior fittings. The
most significant input to the comparable market approach is the
price per square meter that derives from the supply and demand in
force in the market at each valuation date.
Since September 2019, the real estate market has faced certain
changes in terms of its operation as a consequence of the
implementation of regulations applicable to the foreign exchange
market. In general terms, the measure adopted on September 1, 2019
by the BCRA sets forth that exporters of goods and services should
settle foreign currency from abroad in the local exchange market 5
days after the collection of such funds, at the latest.
Furthermore, it provides that legal entities residing in Argentina
may buy foreign currency without restrictions for imports or
payments of debts on the maturity date thereof, although they shall
apply for the BCRA´s prior authorization for the purposes of:
buying foreign currency in order to form external assets, prepaying
debts, making remittances of profits and dividends abroad or
transferring funds abroad. Likewise, pursuant to such regulations,
access to the market by natural persons for the purchase of dollars
was restricted. Afterwards, the BCRA implemented stricter measures,
further limiting access to the foreign exchange market (see Note 39
to these consolidated financial statements).
At present, purchase and sales transactions for office buildings
may be settled in Pesos (by using an implicit foreign exchange rate
higher than the official one) or in dollars. However, due to the
restrictions applicable to access to dollars to which market
participant are subject (most of them are domestic companies and
local subsidiaries of foreign companies, all of them subject to the
foreign exchange restrictions described above), the chances that a
natural person or legal entity may obtain the funds required to
execute a transaction in dollars are remote. Consequently, the most
probable scenario is that any sale of office buildings/reserves be
settled in Pesos at an implicit foreign exchange rate higher than
the official one. This is evidenced by the transactions consummated
by the Company prior to and after the closing of these financial
statements. (See Note 4 and Note 39 to the consolidated financial
statements). Therefore, the
F-70
Cresud Sociedad Anónima,
Comercial, Inmobiliaria, Financiera y Agropecuaria
Company has valued its office buildings and land
reserves as of the fiscal year-end taking into account the
circumstances described above, which represents a gain with respect
to the values previously recorded.
In certain situations, it is complex to determine reliably the fair
value of developing properties. In order to assess whether the fair
value of a developing property can be determined reliably,
management considers the following factors, among
others:
● The provisions of the construction contract.
● The stage of completion.
● Whether the project / property is standard (typical for the
market) or non-standard.
● The level of reliability of cash inflows after
completion.
● The specific development risk of the property.
● Previous experience with similar
constructions.
● Status of construction permits.
There were no changes in the valuation techniques during the
year.
Israel operations center
Valuations were performed using the DCF method. The discount rates
used by appraisers in Israel are mainly in the range of 7% - 9% and
are established taking into account the type of property, purpose,
location, the level of rent compared to the market price and
quality of the tenants.
When determining the value of office buildings, buildings aimed at
to the technology sector and commercial spaces (mainly located in
the city center and in high-tech office parks with high-quality
tenants), the discount rates mainly used are between 7% to 9%,
while for workshop, storage and industry buildings (mainly located
in peripheral areas of the city) they are valuated using a discount
rate between 7.75% -9%.
There were no changes in valuation techniques during the years
ended June 30, 2020 and 2019.
The
following table presents information regarding the fair value
measurements of investment properties using significant
unobservable inputs (Level 3):
|
|
|
|
|
Sensitivity (i)
|
|||
|
|
|
|
|
06.30.20
|
06.30.19
|
||
|
Description
|
Valuation technique
|
Parameters
|
Range fiscal year 2019 / (2018)
|
Increase
|
Decrease
|
Increase
|
Decrease
|
|
Rental properties in Israel - Offices (Level 3)
|
Discounted cash flows
|
Discount
rate
|
7.50%
to 9.75% /
|
(406
)
|
539
|
|
|
|
|
|
|
(7.00%
to 9.00% )
|
|
|
(3,816
)
|
4,353
|
|
|
|
Weighted
average rental value per square meter (m2) per month, in
NIS
|
NIS 77
/ (NIS 63)/
|
366
|
(366
)
|
|
|
|
|
|
|
|
|
|
|
|
|
|
|
|
|
|
|
6,713
|
(6,713
)
|
|
Rental properties in Israel - Commercial use (Level 3)
|
Discounted cash flows
|
Discount
rate
|
7.50%
to 7.80% /
|
(198
)
|
261
|
|
|
|
|
|
|
(7.00%
to 9.00%)
|
|
|
(1,931
)
|
2,207
|
|
|
|
Weighted
average rental value per square meter (m2) per month, in
NIS
|
NIS 41
/ (NIS 87)
|
165
|
(165
)
|
|
|
|
|
|
|
|
|
|
|
|
|
|
|
|
|
|
|
3,047
|
(3,047
)
|
|
Rental properties in Israel - Industrial use (Level 3)
|
Discounted cash flows
|
Discount
rate
|
N/A
|
N/A
|
N/A
|
|
|
|
|
|
|
(7.75%
to 9.00%)
|
|
|
(717
)
|
815
|
|
|
|
Weighted
average rental value per square meter (m2) per month, in
NIS
|
N/A /
(NIS 31)
|
N/A
|
N/A
|
|
|
|
|
|
|
|
|
|
|
|
|
|
|
|
|
|
|
1,731
|
(1,731
)
|
|
Rental properties in USA - HSBC Building (Level 3)
|
Discounted cash flows
|
Discount
rate
|
4.75
% / (6.25%)
|
(6,059
)
|
7,507
|
(2,181
)
|
2,31
|
|
|
|
Weighted
average rental value per square meter (m2) per month, in
US$
|
$
US 79 /
(US$ 73)
|
6,284
|
(6,284
)
|
|
|
|
|
|
|
|
|
|
|
|
|
|
|
|
|
|
|
4,772
|
(4,772
)
|
|
Rental properties in USA - Las Vegas project (Level 3)
|
Discounted cash flows
|
Discount
rate
|
6.50
% / (8.50%)
|
(1,792
)
|
2,512
|
(467
)
|
493
|
|
|
|
Weighted
average rental value per square meter (m2) per month, in
US$
|
$
US 25 /
(US$ 33)
|
(1,307
)
|
1,307
|
|
|
|
|
|
|
|
|
|
|
|
|
|
|
|
|
|
|
586
|
(586
)
|
|
Shopping Malls in Argentina (Level 3)
|
Discounted cash flows
|
Discount
rate
|
12.18
% / (12.10% )
|
(4,252
)
|
5,207
|
(4,668
)
|
5,821
|
|
|
|
Growth
rate
|
2.3
% / (3%)
|
2,027
|
(1,655
)
|
2,195
|
(1,761
)
|
|
|
|
Inflation
|
(*)
|
8,852
|
(7,282
)
|
4,088
|
(3,742
)
|
|
|
|
Devaluation
|
(*)
|
(4,115
)
|
5,030
|
(4,338
)
|
6,237
|
|
Plot of land in Argentina (Level 3)
|
Comparable with incidence adjustment
|
Value
per square meter (m2)
|
Ps.
30,148 / (Ps. 14,312)
|
2,159
|
(2,159
)
|
1,336
|
(1,336
)
|
|
|
|
% of
incidence
|
30
% / (30%)
|
7,196
|
(7,196
)
|
4,458
|
(4,458
)
|
|
Properties under development in Israel (Level 3)
|
Estimated fair value of the investment property after completing
the construction
|
Weighted
average construction cost per square meter (m2) in NIS
|
5,787
NIS/m2 /
|
|
|
|
|
|
|
|
|
(5,787
NIS/m2)
|
|
|
|
|
|
|
|
Annual
weighted average discount rate
|
7.00%
to 9.00% /
|
(1,307
)
|
1,307
|
|
|
|
|
|
|
(7.00%
to 9.00%)
|
|
|
(918
)
|
918
|
(*)
For the next 5
years, an average AR$ / US$ exchange rate with an upward trend was
considered, starting at Ps. 59.81 (corresponding to the year ended
June 30, 2020) and arriving at Ps.243.89. In the long term, a
nominal devaluation rate of 2.1% calculated based on the quotient
between inflation in Argentina and the United States is assumed.
The considered inflation shows a downward trend, which starts at
47.9% (corresponding to the year ended June 30, 2020) and
stabilizes at 23.2% after 5 years.
(i)
Considering an
increase or decrease of: 100 points for the discount and growth
rate in Argentina, 10% for the incidence and inflation, 10% for the
devaluation, 50 points for the discount rate of Israel and USA, and
1% for the value of the m2.
F-71
Cresud Sociedad Anónima,
Comercial, Inmobiliaria, Financiera y Agropecuaria
10.
Property,
plant and equipment
Changes
in the Group’s property, plant and equipment for the years
ended June 30, 2018 and 2017 were as follows:
|
|
Owner
occupied farmland (i)
|
Bearer
plant (v)
|
Buildings
and facilities
|
Machinery
and equipment
|
Communication
networks
|
Others
(ii)
|
Total
|
|
Balance
as of June 30, 2018
|
18,198
|
1,166
|
4,900
|
763
|
21,383
|
5,663
|
52,073
|
|
Costs
|
20,035
|
1,450
|
11,690
|
2,322
|
87,309
|
10,920
|
133,726
|
|
Accumulated
depreciation
|
(1,837
)
|
(284
)
|
(6,790
)
|
(1,559
)
|
(65,926
)
|
(5,257
)
|
(81,653
)
|
|
Net
book amount at June 30, 2018
|
18,198
|
1,166
|
4,900
|
763
|
21,383
|
5,663
|
52,073
|
|
|
|
|
|
|
|
|
|
|
Currency
translation adjustment
|
(545
)
|
(55
)
|
89
|
96
|
(550
)
|
(364
)
|
(1,329
)
|
|
Additions
|
793
|
582
|
549
|
147
|
4,599
|
2,353
|
9,023
|
|
Transfers
|
652
|
-
|
950
|
19
|
-
|
-
|
1,621
|
|
Disposals
|
(436
)
|
-
|
(1
)
|
(3
)
|
(43
)
|
(24
)
|
(507
)
|
|
Depreciation charge
(iii)
|
(229
)
|
(294
)
|
(510
)
|
(140
)
|
(3,792
)
|
(1,810
)
|
(6,775
)
|
|
Balance
as of June 30, 2019
|
18,433
|
1,399
|
5,977
|
882
|
21,597
|
5,818
|
54,106
|
|
|
|
|
|
|
|
|
|
|
Costs
|
20,498
|
1,978
|
13,278
|
2,581
|
91,315
|
12,884
|
142,534
|
|
Accumulated
depreciation
|
(2,065
)
|
(579
)
|
(7,301
)
|
(1,699
)
|
(69,718
)
|
(7,066
)
|
(88,428
)
|
|
Net
book amount at June 30, 2019
|
18,433
|
1,399
|
5,977
|
882
|
21,597
|
5,818
|
54,106
|
|
|
|
|
|
|
|
|
|
|
Additions
|
761
|
312
|
507
|
82
|
3,417
|
1,775
|
6,854
|
|
Disposals
|
(120
)
|
-
|
(64
)
|
(6
)
|
(3,197
)
|
(111
)
|
(3,498
)
|
|
Desconsolidation
|
-
|
-
|
(423
)
|
(594
)
|
-
|
(44
)
|
(1,061
)
|
|
Incorporation by
business combination
|
7,151
|
-
|
1,614
|
377
|
-
|
332
|
9,474
|
|
Currency
translation adjustment
|
(887
)
|
(238
)
|
447
|
189
|
3,551
|
1,229
|
4,291
|
|
Transfers
|
(1,336
)
|
(2
)
|
(1,141
)
|
(34
)
|
377
|
(378
)
|
(2,514
)
|
|
Depreciation charge
(i)
|
(271
)
|
(343
)
|
(477
)
|
(107
)
|
(4,631
)
|
(1,867
)
|
(7,696
)
|
|
Balance
as of June 30, 2020
|
23,731
|
1,128
|
6,440
|
789
|
21,114
|
6,754
|
59,956
|
|
|
|
|
|
|
|
|
|
|
Costs
|
30,627
|
1,885
|
13,554
|
4,743
|
100,931
|
13,563
|
165,303
|
|
Accumulated
depreciation
|
(6,896
)
|
(757
)
|
(7,114
)
|
(3,954
)
|
(79,817
)
|
(6,809
)
|
(105,347
)
|
|
Net
book amount at June 30, 2020
|
23,731
|
1,128
|
6,440
|
789
|
21,114
|
6,754
|
59,956
|
(i) On January 9,
2017, the INRA released a report declaring that Las Londras farm
(4565 ha.), with a book value of Ps. 540 as of June 30, 2020, is
within the area of the “Guarayos Forestry Reserve” and
establishes that the property of Agropecuaria Acres del Sud S.A.
should be reduced to 50 hectares, while the remaining acreage would
be reverted upon as a fiscal land once the process is concluded. It
should be noted that the report is preliminary and is subject to
appeal by the interested parties. The Company exercising its rights
presented an administrative filing and within the associations of
producers that the company is part of. Recently a census was
ordered in the affected area, but no definitive resolution was
issued to delimit the reservation. At the same time, a claim was
made to our sellers to respond for eviction by virtue of the
declarations and guarantees granted at the time of the sale of the
property.
(ii) Includes
furniture and fixtures and vehicles.
(iii) Amortization
charge was recognized in the amount of Ps. 5,909 and Ps. 5,631
under "Costs", in the amount of Ps. 784 and Ps. 409 under "General
and administrative expenses" and Ps. 1,533 and Ps. 114 under
"Selling expenses" as of June 30, 2019 and 2018, respectively in
the Statements of Income (Note 27) and Ps. 738 and Ps. 583 were
capitalized as part of biological assets’ cost. In addition,
a charge of Ps. 912 and Ps. 2,200 was recognized under
"Discontinued operations" as of June 30, 2020 and 2019,
respectively.
(iv)
See Note 4. Includes other non-significant business
combinations.
(v) Corresponds to
the plantation of sugarcane with a useful life of more than one
year.
11.
Trading
properties
Changes
in the Group’s trading properties for the fiscal years ended
June 30, 2020 and 2019 were as follows:
|
|
Completed
properties
|
Properties
under development (i)
|
Undeveloped
properties
|
Total
|
|
As
of June 30,
2018
|
5,846
|
12,124
|
4,116
|
22,086
|
|
IFRS 15
adjustments
|
(1,558
)
|
(6,767
)
|
-
|
(8,325
)
|
|
Additions
|
-
|
3,603
|
61
|
3,664
|
|
Currency
translation adjustment
|
(633
)
|
(499
)
|
(217
)
|
(1,349
)
|
|
Transfers
|
3,470
|
(2,803
)
|
(614
)
|
53
|
|
Impairment
|
-
|
-
|
(46
)
|
(46
)
|
|
Capitalized finance
costs
|
-
|
17
|
-
|
17
|
|
Disposals
|
(4,439
)
|
(3,283
)
|
-
|
(7,722
)
|
|
As
of June 30, 2019
|
2,686
|
2,392
|
3,300
|
8,378
|
|
Additions
|
24
|
1,640
|
563
|
2,227
|
|
Capitalized finance
costs
|
-
|
93
|
-
|
93
|
|
Currency
translation adjustment
|
302
|
33
|
543
|
878
|
|
Transfers
|
1,238
|
(990
)
|
(33
)
|
215
|
|
Desconsolidation
|
-
|
(155
)
|
-
|
(155
)
|
|
Disposals
|
(2,226
)
|
(2,185
)
|
(53
)
|
(4,464
)
|
|
As
of June 30, 2020
|
2,024
|
828
|
4,320
|
7,172
|
|
|
06.30.20
|
06.30.19
|
|
Non-current
|
4,856
|
7,855
|
|
Current
|
2,316
|
523
|
|
Total
|
7,172
|
8,378
|
F-72
Cresud Sociedad Anónima,
Comercial, Inmobiliaria, Financiera y Agropecuaria
(i)
Includes Zetol and
Vista al Muelle plots of land, which have been mortgaged to secure
Group's borrowings. The net book value amounted to Ps. 407 as of
June 30, 2020 and 2019, respectively. Additionally, the Group has
contractual obligations not provisioned related to these plot of
lands committed when certain properties were acquired or real
estate projects were approved, and amount to Ps. 432 and Ps. 578,
respectively. Both projects are expected to be completed in
2029.
12.
Intangible
assets
Changes
in the Group’s intangible assets for the years ended June 30,
2020 and 2019 were as follows:
|
|
Goodwill business
|
Trademarks
|
Licenses
|
Customer relations
|
Information systems and software
|
Contracts and others (
iii) (iv)
|
Total
|
|
Balance as of June 30, 2018
|
7,105
|
6,842
|
2,615
|
5,117
|
3,742
|
2,575
|
27,996
|
|
Costs
|
7,105
|
7,265
|
9,718
|
15,399
|
6,995
|
6,753
|
53,235
|
|
Accumulated
depreciation
|
-
|
(423
)
|
(7,103
)
|
(10,282
)
|
(3,253
)
|
(4,178
)
|
(25,239
)
|
|
Net book amount at June 30, 2018
|
7,105
|
6,842
|
2,615
|
5,117
|
3,742
|
2,575
|
27,996
|
|
|
|
|
|
|
|
|
|
|
Assets incorporated by business combination
(i
)
|
-
|
-
|
-
|
-
|
31
|
-
|
31
|
|
Impairment
|
(184
)
|
-
|
-
|
-
|
-
|
-
|
(184
)
|
|
Currency
translation
adjustment
|
(189
)
|
(200
)
|
(97
)
|
(312
)
|
(87
)
|
53
|
(832
)
|
|
Transfers
|
-
|
-
|
-
|
-
|
3
|
(3
)
|
-
|
|
Additions
|
-
|
-
|
-
|
15
|
1,531
|
2,190
|
3,736
|
|
Disposals
|
-
|
-
|
-
|
-
|
(61
)
|
-
|
(61
)
|
|
Depreciation charge
(i)
|
-
|
(125
)
|
(216
)
|
(1,669
)
|
(1,305
)
|
(1,353
)
|
(4,668
)
|
|
Balance as of June
30, 2019
|
6,732
|
6,517
|
2,302
|
3,151
|
3,854
|
3,462
|
26,018
|
|
Costs
|
6,732
|
7,064
|
9,621
|
15,102
|
8,412
|
8,993
|
55,924
|
|
Accumulated
depreciation
|
-
|
(547
)
|
(7,319
)
|
(11,951
)
|
(4,558
)
|
(5,531
)
|
(29,906
)
|
|
Net
book amount at June 30,
2019
|
6,732
|
6,517
|
2,302
|
3,151
|
3,854
|
3,462
|
26,018
|
|
|
|
|
|
|
|
|
|
|
Additions
|
-
|
-
|
-
|
-
|
1,572
|
2,965
|
4,537
|
|
Disposals
|
-
|
-
|
-
|
(18
)
|
(137
)
|
-
|
(155
)
|
|
Deconsolidation
|
(3,259
)
|
-
|
-
|
-
|
(22
)
|
-
|
(3,281
)
|
|
Transfers
|
1
|
-
|
-
|
-
|
9
|
(64
)
|
(54
)
|
|
Assets incorporated
by business combination
|
11
|
-
|
-
|
38
|
19
|
-
|
68
|
|
Currency
translation
adjustment
|
2,336
|
1,233
|
397
|
432
|
665
|
692
|
5,755
|
|
Depreciation
charge (i)
|
-
|
(122
)
|
(279
)
|
(1,128
)
|
(1,705
)
|
(1,462
)
|
(4,696
)
|
|
Balance
as of June 30, 2020
|
5,821
|
7,628
|
2,420
|
2,475
|
4,255
|
5,593
|
28,192
|
|
|
|
|
|
|
|
|
|
|
Costs
|
5,821
|
8,421
|
11,289
|
23,731
|
8,043
|
13,751
|
71,056
|
|
Accumulated
depreciation
|
-
|
(793
)
|
(8,869
)
|
(21,256
)
|
(3,788
)
|
(8,158
)
|
(42,864
)
|
|
Net
book amount at June 30, 2020
|
5,821
|
7,628
|
2,420
|
2,475
|
4,255
|
5,593
|
28,192
|
(i)
Amortization charge
was recognized in the amount of Ps. 343 and Ps.
1,052
under "Costs", in the amount of Ps. 1,
653
and Ps. 2,265 under "General and administrative expenses" and Ps.
2,700 and Ps. 2,238 under "Selling expenses" as of June 30, 2020
and 2019, respectively in the Statements of Income (Note 27). In
addition, a charge of Ps.
529
was recognized under "Discontinued operations" as of June 30,
2019.
The
goodwill assigned to real estate in Israel amounts to NIS 268 (Ps.
5,451 at the exchange rate at the end of the financial year 2020),
the one assigned to supermarkets amounted to NIS 192 and the
assigned to Israel real state amounted to NIS 113. The rest is
goodwill that is allocated to the real estate segment of
Argentina.
Goodwill impairment test
The
Group performs an annual impairment test of the goodwill. For
fiscal year 2020, the recoverable value obtained for said test
corresponding to the CGUs where the goodwill is assigned (Israel's
Telecommunications) was calculated based on the fair value (market
value) minus the costs of sale.
For the
fiscal year 2019, based on the significant decrease in the market
value of Cellcom and its results in the last financial year, caused
by the greater competition in the cell phone market in Israel as a
result of the entry of new competitors, the Group calculated the
recoverable value at the end of the year of the telecommunications
CGU based on the value in use of the assets. This test resulted in
the goodwill attributable to Cellcom for an amount of Ps. 4,569
(NIS 268) being recoverable.
The
value in use as of June 30, 2019, was determined by an independent
appraiser and was estimated at Ps. 84,159 (NIS 4,936).
F-73
Cresud Sociedad Anónima,
Comercial, Inmobiliaria, Financiera y Agropecuaria
The
cash flow was calculated based on the budgets approved by
management covering a period of 5 years. Subsequent cash flows were
estimated based on the long-term growth rate. The main data and
assumptions used in the calculation of the value in use were the
following:
|
|
06.30.19
|
|
Net value of the
CGU net of taxes
|
NIS
294
|
|
Value of the net
operating assets of the telecommunications CGU of Israel (including
brands and excluding goodwill)
|
NIS
3,668
|
|
Value of goodwill
of the CGU
|
NIS
268
|
|
Annual discount
rate after tax
|
8.5
%
|
|
Long-term growth
rate
|
1.5
%
|
|
Long-term market
share
|
25
%
|
|
ARPU (average
monthly income per user) during the representative term (excludes
income from international hosting and roaming)
|
NIS
55.50
|
The
recoverable amount of the CGU would be equal to the book value in
the scenarios in which the relevant variables are the following, in
the event that the rest of the variables remain
constant:
|
Annual net discount
rate after taxes
|
9.20
%
|
|
ARPU (average
monthly income per user) during the representative term (excludes
income from international hosting and roaming)
|
NIS
53
|
13.
Rights
of use of assets
Below
is the composition of the rights of use of the Group´s assets
as of June 30, 2020 and June 30, 2019:
|
|
06.30.20
|
06.30.19
|
|
Farmland
|
2,027
|
-
|
|
Offices, shopping
malls and other buildings
|
4,116
|
-
|
|
Communication
networks
|
11,004
|
-
|
|
Machinery and
equipment
|
34
|
-
|
|
Others
|
4,747
|
-
|
|
Right-of-use
assets
|
21,928
|
-
|
|
|
|
|
|
Non-current
|
21,928
|
-
|
|
Total
|
21,928
|
-
|
Changes
in the Group´s rights of use during the fiscal year ended June
30, 2020, were as follows:
|
|
06.30.20
|
|
IFRS
16 initial adjustments
|
16,374
|
|
Additions
(i)
|
8,859
|
|
Disposals
|
(4
)
|
|
Transfer
|
164
|
|
Previsions
|
69
|
|
Amortization
charges
|
(5,388
)
|
|
Currency
translation adjustment
|
1,779
|
|
Deconsolidation
|
(42
)
|
|
Valorization
|
117
|
|
Total saldo al cierre
|
21,928
|
(i) Includes
incorporation by business combination
Depreciation charge
for rights of use is detailed below:
|
|
06.30.20
|
06.30.19
|
|
Farmland
|
254
|
-
|
|
Offices, shopping
malls and other buildings
|
538
|
-
|
|
Communication
networks
|
3,155
|
-
|
|
Others
|
1,018
|
-
|
|
Depreciation
charge of right-of-use assets
|
4,965
|
-
|
Other
charges to income related to rights of use were as
follows:
|
|
06.30.20
|
|
Right-of-use
interests
|
(134
)
|
|
Results
from short-term leases
|
19,610
|
|
Results from
variable leases not recognized as lease liabilities
|
797
|
The average
discount rate and the term of liability for lease recognized as of
June 30, 2020 are detailed below:
|
Agricultural business
|
Operations Center Argentina
|
Operations Center Israel
|
|||
|
Average discount rate
|
Maturity date
|
Average discount rate
|
Maturity date
|
Average discount rate
|
Maturity date
|
|
6.9
%
|
2022-2050
|
10,61
%
|
2023-2041
|
3
%
|
2022-2090
|
F-74
Cresud Sociedad Anónima,
Comercial, Inmobiliaria, Financiera y Agropecuaria
14.
Biological
assets
Changes
in the Group’s biological assets
and
their allocation to the fair value hierarchy for the years ended
June 30, 2020 and 2019 were as follows:
|
|
Agricultural business
|
|||||||
|
|
Sown land-crops
|
Sugarcane fields
|
Breeding cattle and cattle for sale
|
Dairy cattle
|
Other cattle
|
Others
|
Total
|
|
|
Level 1
|
Level
3
|
Level
3
|
Level
2
|
Level
2
|
Level
2
|
Level
1
|
||
|
Balance as of June 30, 2018
|
131
|
587
|
1,003
|
2,164
|
-
|
124
|
33
|
4,042
|
|
|
|
|
|
|
|
|
|
|
|
Non-current
(Production)
|
-
|
-
|
-
|
1,944
|
-
|
35
|
33
|
2,012
|
|
Current
(Consumable)
|
131
|
587
|
1,003
|
220
|
-
|
89
|
-
|
2,030
|
|
Balance as of June 30, 2018
|
131
|
587
|
1,003
|
2,164
|
-
|
124
|
33
|
4,042
|
|
|
|
|
|
|
|
|
|
|
|
Purchases
|
-
|
-
|
-
|
134
|
-
|
336
|
-
|
470
|
|
Changes
by transformation
|
(131
)
|
131
|
-
|
-
|
-
|
-
|
-
|
-
|
|
Initial
recognition and changes in the fair value of biological assets
(i)
|
-
|
1,635
|
552
|
(10
)
|
-
|
111
|
-
|
2,288
|
|
Decrease
due to harvest
|
-
|
(7,338
)
|
(2,435
)
|
-
|
-
|
-
|
-
|
(9,773
)
|
|
Sales
|
-
|
-
|
-
|
(707
)
|
-
|
(3
)
|
-
|
(710
)
|
|
Consumptions
|
-
|
-
|
-
|
(6
)
|
-
|
(384
)
|
(4
)
|
(394
)
|
|
Costs
for the year
|
140
|
6,743
|
2,002
|
832
|
-
|
18
|
5
|
9,740
|
|
Foreign
exchange gain / (loss)
|
-
|
3
|
(29
)
|
(37
)
|
-
|
-
|
-
|
(63
)
|
|
Balance as of June 30, 2019
|
140
|
1,761
|
1,093
|
2,370
|
-
|
202
|
34
|
5,600
|
|
Non-current
(Production)
|
-
|
-
|
-
|
1,744
|
-
|
27
|
34
|
1,805
|
|
Current
(Consumable)
|
140
|
1,761
|
1,093
|
626
|
-
|
175
|
-
|
3,795
|
|
Balance as of June 30, 2019
|
140
|
1,761
|
1,093
|
2,370
|
-
|
202
|
34
|
5,600
|
|
|
|
|
|
|
|
|
|
|
|
Transfers
|
(145
)
|
145
|
-
|
-
|
-
|
-
|
-
|
-
|
|
Purchases
|
-
|
-
|
-
|
176
|
-
|
110
|
-
|
286
|
|
Initial
recognition and changes in the fair value of biological assets
(i)
|
-
|
1,312
|
1,243
|
182
|
-
|
77
|
-
|
2,814
|
|
Decrease
due to harvest
|
-
|
(9,520
)
|
(3,448
)
|
-
|
-
|
-
|
-
|
(12,968
)
|
|
Sales
|
-
|
-
|
-
|
(1,608
)
|
-
|
(1
)
|
-
|
(1,609
)
|
|
Consumptions
|
-
|
-
|
-
|
(4
)
|
-
|
(359
)
|
(7
)
|
(370
)
|
|
Costs
for the period year
|
439
|
7,544
|
2,369
|
1,074
|
-
|
-
|
5
|
11,431
|
|
Incorporation
by business combination
|
-
|
62
|
-
|
-
|
-
|
-
|
-
|
62
|
|
Foreign
exchange gain / (loss)
|
(191
)
|
(233
)
|
(229
)
|
(61
)
|
-
|
-
|
-
|
(714
)
|
|
Balance as of June 30, 2020
|
243
|
1,071
|
1,028
|
2,129
|
-
|
29
|
32
|
4,532
|
|
|
|
|
|
|
|
|
|
|
|
Non-current
(Production)
|
-
|
-
|
-
|
1,700
|
-
|
27
|
32
|
1,759
|
|
Current
(Consumable)
|
243
|
1,071
|
1,028
|
429
|
-
|
2
|
-
|
2,773
|
|
Balance as of June 30, 2020
|
243
|
1,071
|
1,028
|
2,129
|
-
|
29
|
32
|
4,532
|
(i)
Biological assets
with a production cycle of more than one year (that is, cattle)
generated “Initial recognition and changes in fair value of
biological assets” amounting to Ps. 259 and Ps. 101 for the
fiscal years ended June 30, 2020 and 2019, respectively. For the
fiscal years ended June 30, 2020 and 2019, amounts of Ps. 271 and
Ps. (93), was attributable to price changes, and amounts of Ps.
(12) and Ps.
194,
was attributable to physical changes generated by production
result, respectively.
Crops and oilseeds
The
Group’s crops generally include crops and oilseeds (corn,
wheat, soybean and sunflower) as well as peanut. The Group measures
biological assets that have attained significant biological growth
at fair value less costs to sell. The Group measures biological
assets that have not attained significant biological growth or when
the impact of biological transformation on price is not expected to
be material, at cost less any impairment losses, which approximates
fair value.
Sugarcane
The
Group’s sugarcane production is based in Brazil and to a
lesser extent in Bolivia. This crop’s production requires
specific weather conditions (tropical and subtropical climates. The
Group recognizes these crops at a fair value net of costs of sales
from the moment of planting.
Fair value of biological assets
When an
active market exists for biological assets, the Group uses the
quoted market price in the principal market as a basis to determine
the fair value of its biological. Live cattle is measured at fair
value less cost to sell, based on market quoted at an auction
involving cattle of the same age, breed and genetic merit adjusted,
if applicable, to reflect any difference. When there is no active
market or market-determined prices are not available, (for example,
unharvested crops with significant growth or growing agricultural
produce of sugarcane), the Group determines the fair value of a
biological asset based on discounted cash flows
models.
F-75
Cresud Sociedad Anónima,
Comercial, Inmobiliaria, Financiera y Agropecuaria
These
models require the input of highly subjective assumptions including
observable and unobservable data. The not observable information is
determined based on the best information available for example, by
reference to historical information of past practices and results,
statistics and agricultural information and other analytical
techniques. Key assumptions utilized in this method include future
market prices, estimated yields at the point of harvest and
estimated future costs of harvesting and other costs.
Market
prices are generally determined by reference to observable data in
the principal market for the agricultural produce. Harvesting costs
and other costs are estimated based on historical and statistical
data. Yields are estimated based on several factors including the
location of the farmland and soil type, environmental conditions,
infrastructure and other restrictions and growth at the time of
measurement. Yields are subject to a high degree of uncertainty and
may be affected by several factors out of the Group’s control
including but not limited to extreme or unusual weather conditions,
plagues and other crop diseases.
The key
assumptions discussed above are highly sensitive. Reasonable shifts
in assumptions including but not limited to increases or decreases
in prices, costs and discount factors used may result in a
significant increase or decrease to the fair value of biological
assets recognized at any given time. Cash flows are projected based
on estimated production. Estimates of production in themselves are
dependent on various assumptions, in addition to those described
above, including but not limited to several factors such as
location, environmental conditions and other restrictions. Changes
in these estimates could materially impact on estimated production,
and could therefore affect estimates of future cash flows used in
the assessment of fair value. The valuation models and their
assumptions are reviewed periodically, and, if necessary,
adjusted.
As of
June 30 of each year, the Group’s biological assets that are
subject to a valuation model include unharvested crops and
sugarcane plantations.
During
years ended June 30, 2020 and 2019, there have been no transfers
between the several tiers used in estimating the fair value of the
Group’s biological assets, or reclassifications among their
respective categories.
The
fair value less estimated point of sale costs of agricultural
produce at the point of harvest amount to Ps. 12,981 and Ps. 9,790
for the years ended June 30, 2020 and 2019,
respectively.
When no
quoted prices are available in an active market, the Group uses a
range of valuation models. The following table presents main
parameters:
|
|
|
|
|
Sensitivity (i)
|
|||
|
|
|
|
|
06.30.20
|
06.30.19
|
||
|
Description
|
Valuation technique
|
Parameters
|
Range fiscal year 2018
|
Increase
|
Decrease
|
Increase
|
Decrease
|
|
Cattle (Level 2)
|
Comparable market prices
|
Price
per livestock head/kg and per category
|
|
|
|
|
|
|
Sown land-crops (Level 3)
|
Discounted cash flows
|
Yields
- Operating costs - Selling expenses - Future of sale
prices
|
Argentina
|
|
|
|
|
|
|
|
|
Yields:
0.61 - 11.05 tn./ha.
|
86
|
(86
)
|
177
|
(177
)
|
|
|
|
|
Future
of sale prices: 9,283 - 19,964 $/tn
|
123
|
(123
)
|
239
|
(239
)
|
|
|
|
|
Operating
cost: 2,126 - 20,781 $/ha
|
(51
)
|
51
|
(99
)
|
99
|
|
|
|
|
Bolivia:
|
|
|
|
|
|
|
|
|
Yields:
5.00 tn./ha.
|
-
|
-
|
9
|
(9
)
|
|
|
|
|
Future
of sale prices: 160 US$/tn.
|
-
|
-
|
19
|
(19
)
|
|
|
|
|
Operating
cost: 56 US$./ha.
|
-
|
-
|
(10
)
|
10
|
|
Sugarcane fields (Level 3)
|
Discounted cash flows
|
Yields
- Operating costs - Selling expenses - Future of sale prices -
Discount rate
|
Brazil:
|
|
|
|
|
|
|
|
|
Yields:
84.40 tn/ha
|
142
|
(142
)
|
176
|
(176
)
|
|
|
|
|
Future
of sale prices: 94.04 Rs./tn.
|
207
|
-207
|
256
|
(256
)
|
|
|
|
|
Operating
cost: 60.16 Rs./tn.
|
(160
)
|
160
|
(199
)
|
199
|
|
|
|
|
Bolivia:
|
|
|
|
|
|
|
|
|
Yields:
65 - 104 tn./ha.
|
13
|
(13
)
|
-
|
-
|
|
|
|
|
Future
of sale prices: 22.56 US$/tn
|
27
|
(27
)
|
(3
)
|
3
|
|
|
|
|
Operating
cost: 445 - 461 US$/ha.
|
(15
)
|
15
|
3
|
(3
)
|
(i)
Sensitivities for the biological assets measured at Level 3 have
been modeled considering a 10% change in the indicated variable,
all else being equal.
As of
June 30, 2020 and 2019, the better and maximum use of biological
assets shall not significantly differ from the current
use.
F-76
Cresud Sociedad Anónima,
Comercial, Inmobiliaria, Financiera y Agropecuaria
15.
Inventories
Breakdown of
Group’s inventories as of June 30, 2020 and 2019 are as
follows:
|
|
06.30.20
|
06.30.19
|
|
Crops
|
2,697
|
2,929
|
|
Materials and
supplies
|
1,675
|
1,426
|
|
Seeds and
fodders
|
275
|
300
|
|
Sugarcane
|
4
|
-
|
|
Beef
|
-
|
149
|
|
Agricultural
inventories
|
4,651
|
4,804
|
|
Good for resale and
supplies
|
-
|
3
|
|
Telephones and
others communication equipment
|
1,714
|
1,569
|
|
Fruit
|
2,705
|
-
|
|
Others
|
-
|
27
|
|
Total
inventories
|
9,070
|
6,403
|
As of
June 30, 2020 and 2019 the cost of inventories recognized as
expense amounted to Ps. 18,714 and Ps. 14,135, respectively and
have been included in “Costs” in the Statements of
Income.
16.
Financial
instruments by category
The
following note presents the financial assets and financial
liabilities by category and a reconciliation to the corresponding
line in the Consolidated Statements of Financial Position, as
appropriate. Since the line items “Trade and other
receivables” and “Trade and other payables”
contain both financial instruments and non-financial assets or
liabilities (such as prepayments, trade receivables, trade payables
in-kind and tax receivables and payables), the reconciliation is
shown in the columns headed “Non-financial assets” and
“Non-financial liabilities”. Financial assets and
liabilities measured at fair value are assigned based on their
different levels in the fair value hierarchy
IFRS 9
defines the fair value of a financial instrument as the amount for
which an asset could be exchanged, or a financial liability
settled, between knowledgeable, willing parties in an arm’s
length transaction. All financial instruments recognized at fair
value are allocated to one of the valuation hierarchy levels of
IFRS 7. This valuation hierarchy provides for three
levels.
In the
case of Level 1, valuation is based on quoted prices (unadjusted)
in active markets for identical assets and liabilities that the
Company can refer to at the date of valuation.
In the
case of Level 2, fair value is determined by using valuation
methods based on inputs directly or indirectly observable in the
market. If the financial instrument concerned has a fixed contract
period, the inputs used for valuation must be observable for the
whole of this period.
In the
case of Level 3, the Group uses valuation techniques not based on
inputs observable in the market. This is only permissible insofar
as no market data is available. The inputs used reflect the
Group’s assumptions regarding the factors which market
players would consider in their pricing.
The
Group’s Finance Division has a team in place in charge of
estimating the valuation of financial assets required to be
reported in the Consolidated Financial Statements, including the
fair value of Level-3 instruments. The team directly reports to the
Chief Financial Officer ("CFO"). The CFO and the valuation team
discuss the valuation methods and results upon the acquisition of
an asset and, as of the end of each reporting period.
According to the
Group’s policy, transfers among the several categories of
valuation are recognized when occurred, or when there are changes
in the prevailing circumstances requiring the
transfer.
F-77
Cresud Sociedad Anónima,
Comercial, Inmobiliaria, Financiera y Agropecuaria
Financial assets
and financial liabilities as of June 30, 2020 are as
follows:
|
|
|
Financial
assets at fair value through profit or loss
|
|
|
|
||
|
|
Financial
assets at amortized cost (i)
|
Level
1
|
Level
2
|
Level
3
|
Subtotal
financial assets
|
Non-financial
assets
|
Total
|
|
June
30, 2020
|
|
|
|
|
|
|
|
|
Assets
as per Statement of Financial Position
|
|
|
|
|
|
|
|
|
Trade and other
receivables (excluding the allowance for doubtful accounts and
other receivables) (Note 17)
|
57,759
|
-
|
-
|
-
|
57,759
|
17,134
|
74,893
|
|
Investment in
financial assets:
|
|
|
|
|
|
|
|
|
- Equity securities
in public companies
|
-
|
574
|
230
|
-
|
804
|
-
|
804
|
|
- Equity securities
in private companies
|
-
|
-
|
-
|
2,909
|
2,909
|
-
|
2,909
|
|
-
Deposits
|
956
|
61
|
-
|
-
|
1,017
|
-
|
1,017
|
|
-
Bonds
|
-
|
7,823
|
1,444
|
-
|
9,267
|
-
|
9,267
|
|
- Mutual
funds
|
-
|
4,455
|
-
|
-
|
4,455
|
-
|
4,455
|
|
-
Others
|
-
|
2,213
|
810
|
232
|
3,255
|
-
|
3,255
|
|
Derivative
financial instruments:
|
|
|
|
|
|
|
|
|
- Crops
options contracts
|
-
|
86
|
-
|
-
|
86
|
-
|
86
|
|
- Crops
future contracts
|
-
|
15
|
-
|
-
|
15
|
-
|
15
|
|
- Foreign-currency options
contracts
|
-
|
-
|
-
|
-
|
-
|
-
|
-
|
|
-
Foreign-currency future contracts
|
-
|
16
|
128
|
-
|
144
|
-
|
144
|
|
- Swaps
|
-
|
-
|
17
|
-
|
17
|
-
|
17
|
|
-
Warrants
|
-
|
-
|
-
|
142
|
142
|
-
|
142
|
|
-
Others
|
61
|
-
|
20
|
-
|
81
|
-
|
81
|
|
Restricted assets
(ii)
|
8,145
|
-
|
-
|
-
|
8,145
|
-
|
8,145
|
|
Financial assets
held for sale
|
|
|
|
|
|
|
|
|
-
Clal
|
-
|
3,377
|
-
|
-
|
3,377
|
-
|
3,377
|
|
Cash and cash
equivalents (excluding bank overdrafts):
|
|
|
|
|
|
|
|
|
- Cash on
hand and at bank
|
27,031
|
-
|
-
|
-
|
27,031
|
-
|
27,031
|
|
- Short-term
investments
|
63,765
|
10,130
|
-
|
-
|
73,895
|
-
|
73,895
|
|
Total
assets
|
157,717
|
28,750
|
2,649
|
3,283
|
192,399
|
17,134
|
209,533
|
|
|
|
Financial
liabilities at fair value
|
|
|
|
||
|
|
Financial
liabilities at amortized cost
|
Level
1
|
Level
2
|
Level
3
|
Subtotal
financial liabilities
|
Non-financial
liabilities
|
Total
|
|
June
30, 2020
|
|
|
|
|
|
|
|
|
Liabilities
as per Statement of Financial Position
|
|
|
|
|
|
|
|
|
Trade and other
payables (Note 20)
|
30,928
|
-
|
-
|
-
|
30,928
|
7,881
|
38,809
|
|
Borrowings
(excluding finance lease liabilities) (Note 22)
|
418,807
|
-
|
-
|
-
|
418,807
|
-
|
418,807
|
|
Finance lease
obligations (Note 22)
|
-
|
-
|
-
|
-
|
-
|
-
|
-
|
|
Derivative
financial instruments:
|
|
|
|
|
|
|
|
|
- Crops
options contracts
|
-
|
71
|
-
|
-
|
71
|
-
|
71
|
|
- Crops
futures contracts
|
-
|
37
|
-
|
-
|
37
|
-
|
37
|
|
- Crops
options contracts
|
-
|
171
|
50
|
-
|
221
|
-
|
221
|
|
-
Swaps
|
-
|
-
|
95
|
-
|
95
|
-
|
95
|
|
-
Forwards
|
-
|
-
|
61
|
-
|
61
|
-
|
61
|
|
-
Others
|
-
|
-
|
956
|
20
|
976
|
-
|
976
|
|
Total
liabilities
|
449,735
|
279
|
1,162
|
20
|
451,196
|
7,881
|
459,077
|
Financial assets
and financial liabilities as of June 30, 2019 were as
follows
|
|
|
Financial assets at fair value through profit or
loss
|
|
|
|
||
|
|
Financial assets at amortized cost (i)
|
Level 1
|
Level 2
|
Level 3
|
Subtotal financial assets
|
Non-financial assets
|
Total
|
|
June 30, 2019
|
|
|
|
|
|
|
|
|
Assets
as per Statement of Financial Position
|
|
|
|
|
|
|
|
|
Trade and other
receivables (excluding the allowance for doubtful accounts and
other receivables) (Note 17)
|
49,341
|
-
|
-
|
-
|
49,341
|
13,547
|
62,888
|
|
Investment in
financial assets:
|
|
|
|
|
|
|
|
|
- Equity securities
in public companies
|
-
|
1,367
|
197
|
-
|
1,564
|
-
|
1,564
|
|
- Equity securities
in private companies
|
-
|
-
|
-
|
2,610
|
2,610
|
-
|
2,610
|
|
-
Deposits
|
5,301
|
51
|
-
|
-
|
5,352
|
-
|
5,352
|
|
-
Bonds
|
-
|
22,430
|
1,518
|
966
|
24,914
|
-
|
24,914
|
|
- Mutual
funds
|
-
|
10,289
|
-
|
-
|
10,289
|
-
|
10,289
|
|
-
Others
|
-
|
3,411
|
623
|
500
|
4,534
|
-
|
4,534
|
|
Derivative
financial instruments:
|
|
|
|
|
|
|
|
|
- Crops
futures contracts
|
-
|
13
|
-
|
-
|
13
|
-
|
13
|
|
-
Swaps
|
-
|
-
|
16
|
-
|
16
|
-
|
16
|
|
- Warrants
|
-
|
-
|
-
|
136
|
136
|
-
|
136
|
|
- Crops
options contracts
|
-
|
46
|
-
|
-
|
46
|
-
|
46
|
|
-
Foreign-currency options contracts
|
-
|
43
|
-
|
-
|
43
|
-
|
43
|
|
-
Foreign-currency future contracts
|
-
|
3
|
41
|
-
|
44
|
-
|
44
|
|
-
Others
|
-
|
-
|
17
|
-
|
17
|
-
|
17
|
|
Restricted assets
(ii)
|
10,808
|
-
|
-
|
-
|
10,808
|
-
|
10,808
|
|
Financial assets
held for sale
|
|
|
|
|
|
|
|
|
-
Clal
|
-
|
22,638
|
-
|
-
|
22,638
|
-
|
22,638
|
|
Cash and cash
equivalents (excluding bank overdrafts):
|
|
|
|
|
|
|
|
|
- Cash on
hand and at bank
|
10,142
|
-
|
-
|
-
|
10,142
|
-
|
10,142
|
|
- Short-term
investments
|
74,873
|
4,289
|
-
|
-
|
79,162
|
-
|
79,162
|
|
Total
assets
|
150,465
|
64,580
|
2,412
|
4,212
|
221,669
|
13,547
|
235,216
|
F-78
Cresud Sociedad Anónima,
Comercial, Inmobiliaria, Financiera y Agropecuaria
|
|
Financial
liabilities at
amortized cost (i)
|
Financial
liabilities at fair
value
|
Subtotal
financial
liabilities
|
Non-financial
liabilities
|
Total
|
||
|
|
|
Level 1
|
Level 2
|
Level 3
|
|
|
|
|
June
30,
2019
|
|
|
|
|
|
|
|
|
Liabilities as per
Statement of
Financial Position
|
|
|
|
|
|
|
|
|
Trade
and other payables (Note 20)
|
26,444
|
-
|
-
|
-
|
26,444
|
8,685
|
35,129
|
|
Borrowings
(excluding finance lease liabilities) (Note
22)
|
477,432
|
-
|
-
|
-
|
477,432
|
-
|
477,432
|
|
Finance lease obligations
(Note 22)
|
366
|
-
|
-
|
-
|
366
|
-
|
366
|
|
Derivative
financial instruments:
|
|
|
|
|
|
|
|
|
- Crops futures
contracts
|
-
|
103
|
-
|
-
|
103
|
-
|
103
|
|
-
Foreign-currency contracts
|
-
|
36
|
-
|
-
|
36
|
-
|
36
|
|
- Crops options
contracts
|
-
|
89
|
-
|
-
|
89
|
-
|
89
|
|
-
Swaps
|
-
|
-
|
192
|
-
|
192
|
-
|
192
|
|
-
Others
|
-
|
-
|
1,246
|
69
|
1,315
|
-
|
1,315
|
|
Total liabilities
|
504,242
|
228
|
1,438
|
69
|
505,977
|
8,685
|
514,662
|
(i) The fair
value of financial assets and liabilities at their amortized cost
does not differ significantly from their book value, except for
borrowings (Note 22).
(ii) Corresponds
to deposits in guarantee and escrows.
Liabilities carried
at amortized cost also include liabilities under finance leases
where the Group is the lessee and which therefore have to be
measured in accordance with IAS 17 “Leases”. The
categories disclosed are determined by reference to IFRS 9. Finance
leases are excluded from the scope of IFRS 7 “Financial
Instruments Disclosures”. Therefore, finance leases have been
shown separately
The
following are details of the book value of financial instruments
recognized, which were offset in the statements of financial
position:
|
|
06.30.20
|
06.30.19
|
||||
|
|
|
Gross amounts offset
|
Net amount presented
|
Gross amounts recognized
|
Gross amounts offset
|
Net amount presented
|
|
Financial assets
|
|
|
|
|
|
|
|
Trade
and other receivables (excluding the allowance for doubtful
accounts and other receivables)
|
60,296
|
(2,537
)
|
57,759
|
51,753
|
(2,412
)
|
49,341
|
|
Financial liabilities
|
|
|
|
|
|
|
|
Trade
and other payables
|
33,465
|
(2,537
)
|
30,928
|
28,856
|
(2,412
)
|
26,444
|
Income,
expense, gains and losses on financial instruments can be assigned
to the following categories:
|
|
Financial
assets and liabilities at amortized cost
|
Financial
assets and liabilities at fair value through profit or
loss
|
Total
|
|
June
30, 2020
|
|
|
|
|
Interest
income
|
1,059
|
-
|
1,059
|
|
Interest
earned on operating assets
|
1,782
|
-
|
1,782
|
|
Interest
expenses
|
(24,357
)
|
-
|
(24,357
)
|
|
Foreign exchange
loss
|
(10,197
)
|
-
|
(10,197
)
|
|
Dividends
income
|
168
|
-
|
168
|
|
Fair value gains
financial
assets at fair value through
profit or loss
|
-
|
(9,862
)
|
(9,862
)
|
|
Gain
from repurchase of
Non-convertible
Notes
|
2,885
|
-
|
2,885
|
|
Gain on financial
instruments derived from
commodities
|
-
|
439
|
439
|
|
Results from
derivative financial instruments,
net
|
-
|
(1,493
)
|
(1,493
)
|
|
Other financial
income
|
236
|
-
|
236
|
|
Other financial
results
|
(1,439
)
|
-
|
(1,439
)
|
|
Net result
(i)
|
(29,863
)
|
(10,916
)
|
(40,779
)
|
|
|
Financial assets and liabilities at amortized
cost
|
Financial assets and liabilities at fair value through profit
or loss
|
Total
|
|
June 30, 2019
|
|
|
|
|
Interest
income
|
983
|
-
|
983
|
|
Interest
earned on operating assets
|
841
|
-
|
841
|
|
Interest
expenses
|
(21,893
)
|
-
|
(21,893
)
|
|
Foreign
exchange loss
|
2,633
|
-
|
2,633
|
|
Dividends
income
|
97
|
-
|
97
|
|
Fair
value gains financial assets at fair value through profit or
loss
|
-
|
2,797
|
2,797
|
|
Gain / (loss)
from repurchase of Non-convertible
Notes
|
74
|
-
|
74
|
|
Gain
on financial instruments derived from commodities
|
-
|
446
|
446
|
|
Results
from derivative financial instruments,
net
|
-
|
477
|
477
|
|
Other
financial income
|
695
|
-
|
695
|
|
Other
financial results
|
(971
)
|
-
|
(971
)
|
|
Net result
(i)
|
(17,541
)
|
3,720
|
(13,821
)
|
F-79
Cresud Sociedad Anónima,
Comercial, Inmobiliaria, Financiera y Agropecuaria
|
|
Financial assets and liabilities at amortized
cost
|
Financial assets and liabilities at fair value through profit
or loss
|
Total
|
|
June 30, 2018
|
|
|
|
|
Interest
income
|
1,267
|
-
|
1,267
|
|
Interest
earned on operating assets
|
156
|
-
|
156
|
|
Interest
expenses
|
(19,564
)
|
-
|
(19,564
)
|
|
Foreign
exchange loss
|
(19,587
)
|
-
|
(19,587
)
|
|
Dividends
income
|
209
|
-
|
209
|
|
Fair
value loss in financial assets at fair value through profit or
loss
|
-
|
(1,834
)
|
(1,834
)
|
|
Loss
from repurchase of Non-convertible
Notes
|
(5,908
)
|
-
|
(5,908
)
|
|
Results from derivative financial
instruments,
net
|
-
|
(743
)
|
(743
)
|
|
Loss
from repurchase of Non-convertible Notes
|
-
|
(4
)
|
(4
)
|
|
Gain
on financial instruments derived from commodities
|
-
|
56
|
56
|
|
Other
financial results
|
(1,078
)
|
-
|
(1,078
)
|
|
Net result
(i)
|
(44,505
)
|
(2,525
)
|
(47,030
)
|
Clal
Clal is
a holding company that mainly operates in the insurance and pension
markets and in segments of pension funds. The Company holds assets
and other businesses (such as insurance agencies) and is one of the
largest insurance groups in Israel. Clal mainly develops its
activities in three operating segments: long-term savings, general
insurance and health insurance.
Given
that IDBD failed to meet the requirements set forth to have control
over an insurance company, on August 21, 2013, the Commissioner
required that IDBD granted an irrevocable power of attorney to Mr.
Moshe Tery ("the Trustee") for the 51% of the shareholding capital
and vote interests in Clal, thus transferring control over that
investee. From such date, IDBD recognized its equity interest in
Clal as a financial asset held for sale, at fair value through
profit or loss.
On
December 30, 2014, the Commissioner sent an additional letter
setting a term by which IDBD’s control over and equity
interests in Clal were to be sold and giving directions as to the
Trustee’s continuity in office, among other aspects. Refer to
Note 4 and Note 40 of these financial statements for the sale of
Clal shares.
The
following table presents the changes in Level 3 financial
instruments as of June 30, 2020 and 2019:
|
|
Derivative financial instruments - Forwards
|
Investments in financial assets - Private companies'
securities
|
Investments in financial assets - Others
|
Investments in financial assets - Warrants
|
Total
|
|
Balance as of June 30, 2018
|
(51
)
|
2,597
|
2,064
|
-
|
4,610
|
|
Additions
and acquisitions
|
-
|
172
|
-
|
-
|
172
|
|
Transfer
to level 1 (ii)
|
-
|
153
|
(197
)
|
103
|
59
|
|
Currency
translation adjustment
|
-
|
(65
)
|
(31
)
|
19
|
(77
)
|
|
Gains
and losses recognized in the year (i)
|
(18
)
|
(247
)
|
(370
)
|
14
|
(621
)
|
|
Balance as of June 30, 2019
|
(69
)
|
2,610
|
1,466
|
136
|
4,143
|
|
Additions
and acquisitions
|
-
|
35
|
-
|
-
|
35
|
|
Transfer
to level 1 (ii)
|
-
|
-
|
-
|
351
|
351
|
|
Currency
translation adjustment
|
(7
)
|
476
|
106
|
245
|
820
|
|
Write
off
|
-
|
-
|
(977
)
|
(610
)
|
(1,587
)
|
|
Gains
and losses recognized in the year (i)
|
56
|
(212
)
|
(363
)
|
20
|
(499
)
|
|
Balance as of June 30, 2020
|
(20
)
|
2,909
|
232
|
142
|
3,263
|
(i)
Included within
“Financial results, net” in the Statements of
income.
(ii)
The Group
transferred a financial asset measured at fair value from level 3
to level 1, because it began trading in the stock
exchange.
During
the fiscal year ended June 30, 2020 and 2019, shares of private
companies were transferred from level 3 to level 1 when they began
trading. When there are no quoted prices available in an active
market, fair values (especially derivative instruments) are based
on recognized valuation methods. The Group uses a range of
valuation models for the measurement of Level 2 and Level 3
instruments, details of which may be obtained from the following
table.
F-80
Cresud Sociedad Anónima,
Comercial, Inmobiliaria, Financiera y Agropecuaria
|
Description
|
Pricing model / method
|
Parameters
|
Fair value hierarchy
|
Range
|
|
Interest
rate swaps
|
Cash
flows - Theoretical price
|
Interest
rate futures contracts and cash flows
|
Level
2
|
-
|
|
Investments
in financial assets - Other private companies’ securities
(*)
|
Cash
flow / NAV - Theoretical price
|
Projected revenue
discounted at the discount rate
The value is
calculated in accordance with shares in the equity funds on the
basis of their Financial Statements, based on fair value or
investments assessments.
|
Level
3
|
1 - 3.5
|
|
Investments
in financial assets - Others
|
Discounted
cash flows - Theoretical price
|
Projected revenue
discounted at the discount rate
The value is
calculated in accordance with shares in the equity funds on the
basis of their Financial Statements, based on fair value or
investment assessments.
|
Level
3
|
1 - 3.5
|
|
Derivative
financial instruments Forwards
|
Theoretical
price
|
Underlying
asset price and volatility
|
Level 2 and
3
|
-
|
(*) An
increase in the discount rate would decrease the value of
investments in private companies, while an increase in projected
revenues would increase their value.
As of
June 30, 2020, there have been no changes to the economic or
business circumstances affecting the fair value of the financial
assets and liabilities of the group.
17.
Trade
and other receivables
Group’s trade
and other receivables as of June 30, 2020 and 2019 were as
follows:
|
|
06.30.20
|
06.30.19
|
|
Trade, leases and
services receivable
|
45,922
|
42,794
|
|
Less: allowance for
doubtful accounts
|
(3,850
)
|
(2,706
)
|
|
Total
trade receivables
|
42,072
|
40,088
|
|
Prepaid
expenses
|
11,839
|
8,462
|
|
Guarantee
deposits
|
3
|
3
|
|
Tax
credits
|
1,548
|
1,632
|
|
Borrowings granted,
deposits, and other balances
|
7,642
|
4,192
|
|
Others
|
7,939
|
5,805
|
|
Total
other receivables
|
28,971
|
20,094
|
|
Total
trade and other receivables
|
71,043
|
60,182
|
|
|
|
|
|
Non-current
|
27,326
|
21,730
|
|
Current
|
43,717
|
38,452
|
|
Total
|
71,043
|
60,182
|
Book
amounts of Group's trade and other receivables in foreign
currencies are detailed in Note 34.
The
fair value of current receivables approximates their respective
carrying amounts because, due to their short-term nature, the
effect of discounting is not considered significant.
Trade
accounts receivables are generally presented in the Statements of
Financial Position net of allowances for doubtful accounts.
Impairment policies and procedures by type of receivables are
discussed in detail in Note 2. Movements on the Group’s
allowance for doubtful accounts were as follows
|
|
06.30.20
|
06.30.19
|
|
Beginning
of the year
|
2,706
|
1,861
|
|
IFRS 15
adjustments
|
-
|
194
|
|
Recoveries
(i)
|
(113
)
|
(92
)
|
|
Used during the
year
|
(720
)
|
(472
)
|
|
Additions
(i)
|
1,081
|
806
|
|
Currency
translation adjustment
|
1,103
|
646
|
|
Deconsolidation
|
(20
)
|
-
|
|
Incorporation by
business combination
|
(180
)
|
-
|
|
Transfer to / from
assets available for sale
|
18
|
-
|
|
Inflation
adjustment
|
(25
)
|
(237
)
|
|
End
of the year
|
3,850
|
2,706
|
(i)
The creation and
release of the provision for impaired receivables have been
included in “Selling expenses” in the Statements of
Income (Note
.
27).
The
Group’s trade receivables comprise several classes. The
maximum exposure to credit risk at the reporting date is the
carrying amount of each class of receivables (see Note 5). The
Group also has receivables from related parties neither of them is
due nor impaired.
F-81
Cresud Sociedad Anónima,
Comercial, Inmobiliaria, Financiera y Agropecuaria
Due to
the distinct characteristics of each type of receivables, an aging
analysis of past due unimpaired and impaired receivables is shown
by type and class, as of June 30, 2020 and 2019 (a column of
non-past due receivables is also included so that the totals can be
reconciled with the amounts appearing on the Statement of Financial
Position):
|
|
Expired
|
|
|
|
|
||
|
|
Up
to 3
months
|
From
3 to 6 months
|
Over
6 months
|
Not
past
due
|
Allowance
|
Total
|
% of
representation
|
|
Leases and
services
|
599
|
67
|
115
|
2,622
|
787
|
4,190
|
9.2
%
|
|
Consumer
financing
|
-
|
-
|
-
|
-
|
16
|
16
|
0.0
%
|
|
Sale of properties and
developments
|
189
|
5
|
5
|
5,606
|
1
|
5,806
|
12.6
%
|
|
Sale of
communication equipment
|
-
|
-
|
-
|
13,674
|
468
|
14,142
|
30.8
%
|
|
Telecommunication
services
|
1,485
|
-
|
447
|
12,240
|
2,535
|
16,707
|
36.4
%
|
|
Agricultural
products
|
1,571
|
264
|
122
|
3,027
|
43
|
5,027
|
10.9
%
|
|
Securities to
deposit
|
3
|
-
|
-
|
31
|
-
|
34
|
0.1
%
|
|
Total
as
of 06.30.20
|
3,847
|
336
|
689
|
37,200
|
3,850
|
45,922
|
100
%
|
|
|
Expired
|
|
|
|
|
||
|
|
Up to 3 months
|
From 3 to 6 months
|
Over 6 months
|
Not past due
|
Allowance
|
Total
|
% of representation
|
|
Agricultural
products
|
91
|
-
|
19
|
1,561
|
32
|
1,703
|
4.0
%
|
|
Shopping
leases and services
|
344
|
15
|
13
|
780
|
21
|
1,173
|
2.7
%
|
|
Office
leases and services
|
420
|
124
|
176
|
2,758
|
472
|
3,950
|
9.2
%
|
|
Hotel
leases and services
|
-
|
-
|
-
|
147
|
-
|
147
|
0.3
%
|
|
Consumer
financing
|
-
|
-
|
-
|
-
|
23
|
23
|
0.1
%
|
|
Sale of
communication equipment
|
-
|
-
|
-
|
14,234
|
204
|
14,438
|
33.7
%
|
|
Sale of properties
and developments
|
86
|
14
|
14
|
6,883
|
26
|
7,023
|
16.4
%
|
|
Telecommunication
services
|
1,604
|
-
|
495
|
10,310
|
1,928
|
14,337
|
33.6
%
|
|
Total as of 06.30.19
|
2,545
|
153
|
717
|
36,673
|
2,706
|
42,794
|
100
%
|
18.
Cash
flow information
Following is a
detailed description of cash flows generated by the Group’s
operations for the years ended June 30, 2020, 2019 and
2018.
|
|
Note
|
06.30.20
|
06.30.19
|
06.30.18
|
|
(Loss) / Profit for the period
|
|
20,003
|
(40,729
)
|
27,420
|
|
Profit from discontinued operations
|
|
(18,085
)
|
(7,140
)
|
(36,441
)
|
|
Adjustments for:
|
|
|
|
|
|
Income
tax
|
23
|
8,107
|
780
|
(9,964
)
|
|
Amortization
and depreciation
|
27
|
16,425
|
10,822
|
9,741
|
|
(Gain)
/ Loss from disposal of property, plant and equipment
|
|
-
|
(3
)
|
4
|
|
Net
(gain) / loss from fair value adjustment of investment
properties
|
|
(30,992
)
|
37,746
|
(18,971
)
|
|
Share-based
compensation
|
|
211
|
63
|
89
|
|
Net
gain / (loss) from fair value adjustment of financial
assets
|
|
1,026
|
(419
)
|
(1,199
)
|
|
Loss
from disposal of property, plant and equipment
|
|
-
|
(3
)
|
-
|
|
Loss
from disposal of intangible assets
|
|
-
|
(13
)
|
-
|
|
Disposal
of intangible assets by TGLT agreement
|
|
-
|
-
|
(3
)
|
|
Gain
/ (Loss) from disposal of subsidiary and associates
|
|
247
|
(983
)
|
(860
)
|
|
Loss
from disposal of trading properties
|
|
-
|
(639
)
|
-
|
|
Impairment
of other assets
|
|
2,470
|
317
|
-
|
|
Financial
results, net
|
|
41,973
|
13,239
|
37,705
|
|
Provisions
and allowances
|
|
1,271
|
1,491
|
2,365
|
|
Share
of loss / (profit) of associates and joint ventures
|
|
(8,662
)
|
7,328
|
3,452
|
|
Loss
from revaluation of receivables arising from the sale of
farmland
|
|
-
|
-
|
(200
)
|
|
(Gain)
/ Loss from repurchase of Non-convertible Notes
|
|
1
|
-
|
3
|
|
Changes
in net realizable value of agricultural products after
harvest
|
|
(657
)
|
43
|
(745
)
|
|
Unrealized
initial recognition and changes in fair value of biological assets
and agricultural products at the point of harvest
|
|
(3,333
)
|
(2,294
)
|
(1,869
)
|
|
Unrealized
gain from derivative financial instruments
|
|
36
|
293
|
267
|
|
Other
operating results
|
|
262
|
157
|
-
|
|
Gain
from disposal of farmlands
|
|
(838
)
|
(665
)
|
(1,656
)
|
|
Impairment
of associates and joint ventures
|
|
-
|
184
|
-
|
|
Result
from the revaluation of the participation held before the business
combination
|
|
(3,501
)
|
-
|
(93
)
|
|
Granting
Plan of actions
|
|
-
|
-
|
3
|
|
|
|
|
|
|
|
Changes in operating assets and liabilities:
|
|
|
|
|
|
Decrease
in inventories
|
|
722
|
(730
)
|
(1,025
)
|
|
Decrease
in trading properties
|
|
930
|
1,392
|
1,265
|
|
Increase
in restricted assets
|
|
(1,165
)
|
(203
)
|
-
|
|
Increase
in right-of-use assets
|
|
(1,053
)
|
-
|
-
|
|
Increase
in lease liabilities
|
|
59
|
-
|
-
|
|
Decrease
/ (increase) in trade and other receivables
|
|
10,826
|
2,473
|
82
|
|
Decrease
in trade and other payables
|
|
(6,161
)
|
(3,562
)
|
1,212
|
|
Decrease
in salaries and social security liabilities
|
|
(280
)
|
(16
)
|
296
|
|
Decrease
in provisions
|
|
(1,603
)
|
(427
)
|
(525
)
|
|
Decrease
in biological assets
|
|
5,188
|
1,263
|
1,572
|
|
Net
variation in derivative financial instruments
|
|
109
|
157
|
(209
)
|
|
|
|
|
|
|
|
Net cash generated by continuing operating activities before income
tax paid
|
|
33,536
|
19,922
|
11,716
|
|
Net cash generated by discontinued operating activities before
income tax paid
|
|
2,848
|
6,354
|
14,120
|
|
Net cash generated by operating activities before income tax
paid
|
|
36,384
|
26,276
|
25,836
|
F-82
Cresud Sociedad Anónima,
Comercial, Inmobiliaria, Financiera y Agropecuaria
The
following table shows balances incorporated as result of business
combination / deconsolidation or reclassification of assets and
liabilities held for sale of subsidiaries:
|
|
06.30.20
|
06.30.19
|
|
Investment
properties
|
155,602
|
(9,743
)
|
|
Property,
plant and equipment
|
(7,776
)
|
(62,036
)
|
|
Trading
properties
|
155
|
-
|
|
Intangible
assets
|
3,232
|
(13,759
)
|
|
Investments
in associates and joint ventures
|
2,517
|
(812
)
|
|
Biological
assets
|
(74
)
|
-
|
|
Deferred
income tax
|
1
|
(269
)
|
|
Trade
and other receivables
|
(8,668
)
|
(26,404
)
|
|
Right-of-use
assets
|
(3,977
)
|
-
|
|
Investment
in financial assets
|
13,544
|
(6,329
)
|
|
Derivative
financial instruments
|
(37
)
|
(51
)
|
|
Inventories
|
(2,170
)
|
(13,110
)
|
|
Restricted
assets
|
214
|
(203
)
|
|
Trade
and other payables
|
2,218
|
50,898
|
|
Lease
liabilities
|
2,077
|
-
|
|
Salaries
and social security liabilities
|
70
|
5,312
|
|
Borrowings
|
(87,016
)
|
46,804
|
|
Provisions
|
46
|
960
|
|
Income tax
and MPIT liabilities
|
(99
)
|
16
|
|
Deferred
income tax liabilities
|
(19,882
)
|
6,217
|
|
Employee
benefits
|
107
|
2,790
|
|
Net amount of non-cash assets incorporated / held for
sale
|
50,084
|
(19,719
)
|
|
Cash
and cash equivalents
|
(4,393
)
|
(12,350
)
|
|
Non-controlling
interest
|
50,745
|
16,296
|
|
Goodwill
|
347
|
164
|
|
Net amount of assets incorporated / held for sale
|
96,783
|
(15,609
)
|
|
Interest
held before acquisition
|
-
|
(1,049
)
|
|
Seller
financing
|
-
|
(84
)
|
|
Foreign
exchange losses
|
-
|
602
|
|
Fair
value of interest held before business combination
|
-
|
(1,259
)
|
|
Net (outflow) inflow of cash and cash equivalents / assets and
liabilities held for sale
|
96,783
|
(17,399
)
|
The
following table shows a detail of significant non-cash transactions
occurred in the years ended June 30, 2020, 2019 and
2018:
|
|
06.30.20
|
06.30.19
|
06.30.18
|
|
Dividends
not collected
|
(401
)
|
(300
)
|
(252
)
|
|
Increase
in investment properties through an increase in
borrowings
|
-
|
234
|
-
|
|
Decrease
in trade and other receivables through an increase in investments
in subsidiaries, associates and joint ventures
|
-
|
3,354
|
-
|
|
Decrease
in participation in subsidiaries, associates and joint ventures due
to transient conversion differences
|
(1,565
)
|
928
|
(4,185
)
|
|
Increase
in trade and other receivables through an increase in investments
in associates and joint ventures
|
-
|
-
|
16
|
|
Increase
in property, plant and equipment through a decrease in investment
property
|
-
|
20
|
-
|
|
Increase
in property, plant and equipment through an increase in trade and
other payables
|
739
|
853
|
1,921
|
|
Decrease
in trade and other receivable through an increase in investments in
associates and joint venture
|
-
|
-
|
447
|
|
Registration
of investment properties through a reduction of credits for sale
and other credits
|
-
|
574
|
77
|
|
Increase
in properties for sale through an increase in
borrowings
|
12
|
17
|
-
|
|
Increase
in properties for sale through a decrease in investment
properties
|
-
|
97
|
23
|
|
Purchase
of non-controlling interest through reduction of credits for sale
and other credits
|
711
|
1,048
|
-
|
|
Decrease
in associates and joint ventures through an increase in trade and
other receivable
|
-
|
1,198
|
-
|
|
Changes
in non-controlling interest through a decrease in trade and other
receivables
|
-
|
-
|
3,069
|
|
Distribution
of dividends to non-controlling shareholders pending
payment
|
1,761
|
(340
)
|
3,400
|
|
Increase
in property, plant and equipment through a business
combination
|
-
|
-
|
(2,004
)
|
|
Increase
in property, plant and equipment through increased
borrowings
|
-
|
6
|
20
|
|
Increase
in non-current trade and other receivables through an increase in
current and non-current borrowings
|
-
|
-
|
243
|
|
Decrease
in investments in associates and joint ventures through dividends
pending collection
|
-
|
-
|
24
|
|
Increase
of trading properties through an interest
capitalization
|
-
|
-
|
24
|
|
Increase
of investment properties through an interest
capitalization
|
-
|
-
|
40
|
|
Decrease
in associates and joint ventures through an increase in assets held
for sale
|
2,071
|
-
|
97
|
|
Increase
in investments in associates and joint ventures through a decrease
in investments in financial assets
|
-
|
-
|
9
|
|
Dividend
payment through increased business debt
|
-
|
-
|
17
|
|
Transfers
of property, plant and equipment to investment
properties
|
-
|
-
|
(1,269
)
|
|
Grants
Action Plan
|
-
|
-
|
3
|
|
Increase
in Investment Properties through an increase in Other reserves due
to the difference between cost and fair value.
|
-
|
-
|
47
|
|
Increase
in financial operations through a decrease in investments in
associates and joint ventures
|
-
|
-
|
144
|
|
Increase
in trading properties through an increase in trade and other
payables
|
-
|
-
|
137
|
|
Increase
in trading properties through a decrease in credits
|
-
|
-
|
69
|
|
Increase
in investment properties through a decrease in trading
properties
|
-
|
-
|
785
|
|
Increase
in participation in subsidiaries, associates and joint ventures due
to an increase in the reserve share-based payments
|
(4
)
|
-
|
-
|
|
Decrease
in loans through a decrease in financial assets
|
2,454
|
-
|
-
|
|
Increase
in investment properties through a decrease in financial
assets
|
278
|
-
|
-
|
|
Increase
in intangible assets through an increase in trade and other
payabels
|
494
|
-
|
-
|
|
Increase
in investment in associates through loss of control in
subsidiaries
|
1,335
|
-
|
-
|
|
Distribution
of dividends on shares
|
589
|
-
|
-
|
|
Acquisition
of investment properties through a decrease in trade and other
receivables
|
28
|
-
|
-
|
|
Issuance
of Negotiable Obligations
|
21
|
-
|
-
|
|
Increase
in investment properties through an increase in
borrowings
|
81
|
-
|
-
|
|
Increase
of use-rights through a decrease in property, plant and
equipment
|
-
|
-
|
-
|
|
Increase
in investments in financial assets through a decrease in
investments in associates and joint ventures
|
-
|
-
|
-
|
|
Increase
in investment in associates through a decrease in investments in
financial assets
|
854
|
-
|
-
|
|
Increase
in investments in financial assets through a decrease in investment
properties
|
1,188
|
-
|
-
|
|
Dividends
pending collection from associates and joint ventures
|
-
|
-
|
-
|
|
Increase
in investments in financial assets through a decrease in investment
properties
|
-
|
-
|
-
|
|
Increase
in rights of use through an increase in lease liabilities -
Adjustment of opening balances (IFRS 16)
|
14,124
|
-
|
-
|
|
Increase
in rights of use through an increase in lease
liabilities
|
8,091
|
-
|
-
|
F-83
Cresud Sociedad Anónima,
Comercial, Inmobiliaria, Financiera y Agropecuaria
19.
Shareholders’
Equity
Share capital and share premium
The
Group's share capital is represented by ordinary shares with a
nominal value of 1 peso per share and one vote each. No other
activity has been recorded for the fiscal year ended June 30, 2020
in the capital accounts.
Inflation adjustment of share capital
The
inflation adjustment related to share capital is allocated to an
inflation adjustment reserve that forms part of shareholders'
equity. The balance of this reserve could be applied only towards
the issuance of common stock to shareholders of the
Company
Treasury shares
On
December 5, 2018, the Board of Directors of Cresud approved the
repurchase of shares issued by the Company and established the
terms and conditions for the acquisition of treasury shares, under
the terms of Article 64 of Law No. 26,831 and the CNV rules, for up
to a maximum amount of Ps. 429 million and up to 10% of the share
capital in the form of ordinary shares or American Depositary
Shares (“ADS”) representative of 10 shares each, up to
daily limit of up to 25% of the average volume of daily
transactions that the Company's shares have experienced, jointly in
the listed markets, during the previous 90 business days, and at a
maximum price of up to US$ 15.50 per ADS and up to a maximum value
in pesos equivalent to the maximum price per ADS divided by 10 and
multiplied by the value of the exchange rate of the National Bank
of at each period. Also, on March 1, 2019, the Board of Directors
of Cresud approved the extension of the repurchase term for a
period of 30 days in addition to the timely approved.
On
March 13, 2019, the above mention plan was completed and the
Company acquired the equivalent of 6,394,009 common shares
representing 99.97% of the approved program and 1.27% of Cresud's
share capital, which correspond to 1,095,009 ordinary shares for a
total of Ps. 74 and 529,900 ADRs (representing 5,299,000 ordinary
shares) for a total of US$ 6.5 (equivalent to Ps.
354).
On
March 14, 2019, the Board of Directors of Cresud approved a new
repurchase of shares by the Company and established the terms and
conditions for the acquisition of treasury shares by the Company,
under the terms of Article 64 of the Law No. 26,831 and the CNV
rules, for up to a maximum amount of Ps. 429 million and up to 10%
of the share capital in the form of ordinary shares or ADS, up to a
daily limit of up to 25% of the average volume of transactions
daily that have experienced the shares of the Company, jointly in
the markets that it quotes, during the previous 90 business days,
and to a maximum of up to US$ 15.50 per ADS and up to a maximum
value in pesos equivalent to the maximum price per ADS divided by
10 and multiplied by the value of the exchange rate of the National
Bank of at each period. The repurchase period was set in up to 90
days, beginning the day following the date of publication of the
information in the Daily Bulletin of the Buenos Aires Stock
Exchange.
On June
26, 2019, the repurchase plan was completed, and the Company
acquired the equivalent of 6,712,465 ordinary shares representing
99.96% of the approved program and 1.34% of Cresud's share capital
which correspond to 3,824,035 ordinary shares for a total of Ps.
244 and 288,843 ADRs (representative of 2,888,430 ordinary shares)
for a total of US$ 2.9 (equivalent to Ps. 184).
Legal reserve
According to Law
N° 19,550, 5% of the profit of the year is destinated to
constitute a legal reserve until it reaches the legal capped
amounts (20% of total capital). This legal reserve is not available
for dividend distribution and can only be released to absorb
losses. The Group has not reached the legal limit of this
reserve.
Special reserve
The
CNV, through General Ruling N° 562/9 and 576/10, has provided
for the application of Technical Resolutions N° 26 and 29 of
the FACPCE, which adopt the IFRS, IASB for companies subject to the
public offering regime ruled by Law 17,811, due to the listing of
their shares or corporate notes, and for entities that have applied
for authorization to be listed under the mentioned regime. The
Group has applied IFRS, as issued by the IASB, for the first time
in the year beginning July 1, 2012, with the transition date being
July 1, 2011. Pursuant to CNV General Ruling N° 609/12, the
Company set up a special reserve, to reflect the positive
difference between the balance at the beginning of retained
earnings disclosed in the first Financial Statements prepared
according to IFRS and the balance at closing of retained earnings
disclosed in the last Financial Statements prepared in accordance
with previously effective accounting standards. The reserve
recorded in due course amounted to Ps. 993, which as of June 30,
2018 were fully used to absorb the negative balances in the
retained earnings account.
During
fiscal year ended June 30, 2018, the Company’s
F-84
Cresud Sociedad Anónima,
Comercial, Inmobiliaria, Financiera y Agropecuaria
Board
of Directors decided to change the accounting policy of investment
property from the cost method to the fair value method, as allowed
by IAS 40.
For
this reason, as of the transition date, figures have been modified
and, hence, the special reserve as set forth by General Ruling CNV
N° 609/12 has been increased to Ps. 3,625, which may only be
reversed to be capitalized or to absorb potential negative balances
under retained earnings.
Dividends
The
Shareholders Meeting held on October 31, 2017, approved a
distribution of dividends for Ps. 565, which were paid during the
month of November 2017. During the year ended June 30, 2020 and
2018 there was no dividend distribution.
Distribution of treasury shares
In
accordance with the resolutions Shareholders' Meeting held on
October 30, 2019 and the provisions of the Board of Directors of
Cresud on the same day, the distribution of treasury stock of the
Company duly acquired by a company took place on November 13, 2019.
The number of shares distributed was 13,000,000, which constitutes
0.026 shares per ordinary share and 0.26 per ADS, and a percentage
of 2.59% of the capital of Ps. 502 and 2.66% of the net capital
which exclude treasury shares of Ps. 499.
20.
Trade
and other payables
Group’s trade
and other payables as of June 30, 2019 and 2018 were as
follows:
|
|
06.30.20
|
06.30.19
|
|
Trade
|
22,650
|
19,672
|
|
Sales, rental and
services payments received in advance
|
1,972
|
6,407
|
|
Construction
obligations
|
407
|
1,331
|
|
Accrued
invoices
|
1,221
|
1,705
|
|
Deferred
incomes
|
142
|
-
|
|
Admission
rights
|
1,017
|
-
|
|
Deposits
in guarantee
|
101
|
-
|
|
Total
trade payables
|
27,510
|
29,115
|
|
Dividends payable
to non-controlling shareholders
|
355
|
569
|
|
Taxes
payable
|
745
|
1,355
|
|
Construction
obligations
|
-
|
1,451
|
|
Management fees
(Note 32)
|
190
|
-
|
|
Others
|
10,009
|
2,639
|
|
Total
other payables
|
11,299
|
6,014
|
|
Total
trade and other payables
|
38,809
|
35,129
|
|
|
|
|
|
Non-current
|
2,986
|
2,830
|
|
Current
|
35,823
|
32,299
|
|
Total
|
38,809
|
35,129
|
The
fair value of payables approximates their respective carrying
amounts because, due to their short-term nature, the effect of
discounting is not considered significant. Fair values are based on
discounted cash flows (Level 3).
21.
Provisions
The
Group is subject to claims, lawsuits and other legal proceedings in
the ordinary course of business, including claims from clients
where a third party seeks reimbursement or damages. The
Group’s responsibility under such claims, lawsuits and legal
proceedings cannot be estimated with certainty. From time to time,
the status of each major issue is evaluated and its potential
financial exposure is assessed. If the potential loss involved in
the claim or proceeding is deemed probable and the amount may be
reasonably estimated, a liability is recorded. The Group estimates
the amount of such liability based on the available information and
in accordance with the provisions of the IFRS. If additional
information becomes available, the Group will make an evaluation of
claims, lawsuits and other outstanding proceeding, and will revise
its estimates.
F-85
Cresud Sociedad Anónima,
Comercial, Inmobiliaria, Financiera y Agropecuaria
The
following table shows the movements in the Group's provisions
categorized by type:
|
|
Legal
claims (i)
|
Investments
in associates and joint ventures (ii)
|
Site
dismantling and remediation (iii)
|
Onerous
contracts (iv)
|
Other
provisions (v)
|
Total
|
|
June
30, 2018
|
2,344
|
5,453
|
367
|
-
|
2,122
|
10,286
|
|
Additions
|
659
|
17
|
-
|
-
|
272
|
948
|
|
Recoveries
|
(104
)
|
(7
)
|
-
|
-
|
-
|
(111
)
|
|
Share
of profit / (loss) of associates and
joint ventures
|
-
|
3,733
|
-
|
-
|
-
|
3,733
|
|
Used
during the year
|
(339
)
|
-
|
(15
)
|
-
|
-
|
(354
)
|
|
Inflation
adjustment
|
(106
)
|
-
|
-
|
-
|
-
|
(106
)
|
|
Currency
translation adjustment
|
(27
)
|
(535
)
|
(10
)
|
-
|
131
|
(441
)
|
|
As
of June 30, 2019
|
2,427
|
8,661
|
342
|
-
|
2,525
|
13,955
|
|
Additions
|
470
|
-
|
33
|
-
|
-
|
503
|
|
Transfers
|
(18
)
|
-
|
-
|
-
|
-
|
(18
)
|
|
Incorporated
by business
combinations
|
57
|
-
|
-
|
-
|
-
|
57
|
|
Share
of profit / (loss) of associates and
joint ventures
|
-
|
(7,461
)
|
-
|
-
|
-
|
(7,461
)
|
|
Used during the
year
|
(698
)
|
(1,018
)
|
-
|
-
|
(181
)
|
(1,897
)
|
|
Inflation
adjustment
|
(80
)
|
-
|
-
|
-
|
-
|
(80
)
|
|
Currency
translation adjustment
|
369
|
(165
)
|
72
|
-
|
199
|
475
|
|
As
of June 30, 2020
|
2,527
|
17
|
447
|
-
|
2,543
|
5,534
|
|
|
06.30.20
|
06.30.19
|
|
Non-current
|
3,091
|
11,478
|
|
Current
|
2,443
|
2,477
|
|
Total
|
5,534
|
13,955
|
(i)
Additions and
recoveries are included in "Other operating results,
net"
(ii)
Corresponds to the
equity interest in New Lipstick with negative equity in 2019 and
Puerto Retiro in 2020 and 2019. Additions and recoveries are
included in "Share of profit / (loss) of associates and joint
ventures".
(iii)
The Group’s
companies are required to recognize certain costs related to the
dismantling of assets and remediation of sites from the places
where such assets are located. The calculation of such expenses is
based on the dismantling value for the current year, taking into
consideration the best estimate of future changes in prices,
inflation, etc. and such costs are capitalized at a risk-free
interest rate. Volume projections for retired or built assets are
recast based on expected changes from technological rulings and
requirements.
(iv)
Provisions for
other contractual obligations include a series of obligations
resulting from a contractual liability or law, regarding which
there is a high degree of uncertainty as to the terms and the
necessary amounts to discharge such liability.
(v)
In November 2009,
PBC’s Audit Committee and Board of Directors approved the
agreement with Rock Real whereby the latter would look for and
propose to PBC the acquisition of commercial properties outside
Israel, in addition to assisting in the negotiations and management
of such properties. In return, Rock Real would receive 12% of the
net income generated by the acquired property. Pursuant to
amendment 16 of the Israel Commercial Act 5759-1999, the agreement
must be ratified by the Audit Committee before the third year after
the effective date; otherwise, it expires. The agreement has not
been ratified by the audit committee within such three-year term,
so in January 2017 PBC issued a statement that hinted at the
expiration of the agreement and informed that it would begin
negotiations to reduce the debt. The parties have appointed an
arbitrator that should render a decision on the dispute. The
remaining corresponds to provisions related to investment
properties.
Cresud
On
February 23, 2016, a class action was filed against IRSA, the
Company, some first-line managers and directors with the District
Court of the USA for the Central District of California. The
complaint, on behalf of people holding American Depositary Receipts
of IRSA between November 3, 2014 and December 30, 2015, claims
presumed violations to the US federal securities laws. In addition,
it argues that defendants have made material misrepresentations and
made some omissions related to IRSA’s investment in
IDBD.
Such
complaint was voluntarily waived on May 4, 2016 by the plaintiff
and filed again on May 9, 2016 with the US District Court by the
East District of Pennsylvania.
Furthermore,
the Companies and some of its first-line managers and directors are
defendants in a class action filed on April 29, 2016 with the US
District Court of the East District of Pennsylvania. The complaint,
on behalf of people holding American Depositary Receipts of the
Company between May 13, 2015 and December 30, 2015, claims
violations to the US federal securities laws. In addition, it
argues that defendants have made material misrepresentations and
made some omissions related to the IRSA’s investment in
IDBD.
Subsequently,
Cresud and IRSA requested that the complaint be moved to the
district of New York, which request was later granted.
On
December 8, 2016, the Court appointed the representatives of each
presumed class as primary plaintiffs and the lead legal advisor for
each of the classes. On February 13, 2017, the plaintiffs of both
classes filed a document containing certain amendments. The Company
and IRSA filed a petition requesting that the class action brought
by IRSA’s shareholders should be dismissed. On April 12,
2017, the court suspended the class action filed by the
Company’s shareholders until the Court decides on the
petition of dismissal of such class action. Filing information on
the motion to dismiss the collective remedy filed by shareholders
of IRSA was completed on July 7, 2017.
F-86
Cresud Sociedad Anónima,
Comercial, Inmobiliaria, Financiera y Agropecuaria
On
September 10, 2018, the New York Court issued an order granting the
motion to dismiss the IRSA Case in its entirety.
On
September 24, 2018, Plaintiff in the Cresud Case filed a document
acknowledging that the Cresud Class Action complaint should be
dismissed for the same reasons set forth in the Court’s
September 10, 2018 order in the IRSA Case, subject to a right of
appeal.
On
October 9, 2018, the Plaintiff in the IRSA Case filed a notice of
appeal to the United States Court of Appeals for the Second
Circuit. On December 12, 2018, Plaintiff in the Cresud Case filed a
notice of voluntary dismissal, with prejudice. On December 13,
2018, Plaintiff moved to dismiss the appeal of the IRSA Case in the
Second Circuit upon agreement with IRSA and Cresud that the parties
shall bear their own costs and fees in the litigation, including
the appeal, and that no fees are due. Accordingly, the Second
Circuit dismissed Plaintiff’s appeal on December 18,
2018.
The
IRSA and Cresud case are fully resolved without any penalty for the
Group.
Claims against Cellcom and its subsidiaries
In
the ordinary course of business, Cellcom receives various consumer
complaints, mainly through collective actions. They allege excess
collections, breach of agreements with customers and failure to
comply with established norms or licenses, which could cause harm
to consumers.
In
addition, the Company receives other claims from employees,
subcontractors, suppliers and authorities, generally in relation to
non-compliance with the provisions of the law with respect to
payments upon termination of employment relationships, breach of
contracts, violation of copyright and patents or disputes for
payments demanded by the authorities.
Claims against PBC
On
July 4, 2017, PBC was served notice from the tax authority of
Israel of income tax official assessments based on a “better
assessment” of taxes for the years 2012-2015, and concluded
that PBC is required to pay approximately NIS 187 (including
interest) since compensation of losses is not
admitted.
In
the opinion of legal advisors to PBC, the Company has sound
arguments against the Revenue Administration’s position and
will file its objection to it. As of the date of these Consolidated
Financial Statements, there is no provision in relation to this
claim.
DIC class action
On
October 3, 2018 it was sent an action and a motion to approve that
action as a class action (jointly – the "Motion"), which had
been filed within the District Court of Tel Aviv Yafo (the "Court")
against the Group; against Mr. Eduardo Elsztain, the controlling
person of the Company (the "Controlling Person"), who serves as
chairman of the Company's board of directors; against directors
serving in the Group who have an interest in the Controlling
Person; and against additional directors and officers serving in
the Company (all jointly – the "Respondents"), in connection
with the exit of the Company's share, on February 1, 2018, from the
TA 90 and TA 125 indices, whereon it had been traded on the Tel
Aviv Stock Exchange Ltd. up to that date (the "Indices"), by an
applicant alleging to have held the Group's shares prior to
February 1, 2018.
In
the Motion, the Court is requested, inter alia, to approve the
action as a class action and to charge the Respondents with
compensating the members of the group according to the damage
caused them. The estimated amount is approximately NIS 17.6
million.
The
Company believes that it acted lawfully and as required in all that
pertains to the subject of the Motion, and accordingly, after
having preliminarily reviewed the Group's Motion, believes that it
is unfounded.
IDBD class action
On
October 3, 2018, an action and a motion to approve a class action
had been filed with the District Court in Tel Aviv Yafo (jointly
– the "Motion"). The Motion has been filed, against IDBD,
against Dolphin IL, against Mr. Eduardo Elsztain and against the
Official Receiver, and in it, the Court was requested to hold that
the Transaction was not in compliance with the provisions of the
Centralization Law, to appoint a trustee over DIC's shares owned by
the respondents and to order the payment of monetary damages to the
public shareholders in DIC for the alleged preservation of the
pyramidal structure in IDBD, at a scope of between NIS 58 and NIS
73.
F-87
Cresud Sociedad Anónima,
Comercial, Inmobiliaria, Financiera y Agropecuaria
The
bulk of the Applicant's allegations is that the Group continues to
be the Controlling Person in DIC (potentially and effectively) even
after the completion of the sale of DIC shares to DIL as described
in Note 4 in the Annual Financial Statements (the
“transaction”) and that the controlling person of IDBD
(in his capacity as chairman of the Board of Directors and
controlling person of DIC as well) had a personal interest separate
from the personal interest of the minority shareholders in DIC, in
the manner of implementation of the Centralization Law's
provisions, and that he and the Group breached the duty of good
faith and the duty of decency toward DIC, and additionally the
controlling person of IDBD breached his duty of trust and duty of
care toward DIC, this being, allegedly, due to the fact that the
decision regarding the preferred alternative for complying with the
Centralization Law's Provisions was not brought before DIC's
general meeting. The Applicant further alleges deprivation of the
minority shareholders in DIC.
Having
preliminarily reviewed the Motion, the Management believes that it
is unfounded and that once the transaction is consummated , IDBD
complies with the provisions of the Concentration Law.
22.
Borrowings
The
breakdown and the fair value of the Group borrowings as of June 30,
2019 and 2018 was as follows:
|
|
Book
value
|
Fair
value
|
||
|
|
06.30.20
|
06.30.19
|
06.30.20
|
06.30.19
|
|
Non-convertible
notes
|
343,028
|
395,552
|
276,854
|
389,689
|
|
Bank loans and
others
|
69,884
|
74,140
|
58,954
|
72,638
|
|
Bank
overdrafts
|
4,283
|
1,431
|
3,233
|
1,431
|
|
Other borrowings
(i)
|
1,612
|
6,675
|
6,506
|
9,235
|
|
Total
borrowings (ii)
|
418,807
|
477,798
|
345,547
|
472,993
|
|
|
|
|
|
|
|
Non-current
|
320,418
|
397,414
|
|
|
|
Current
|
98,389
|
80,384
|
|
|
|
Total
|
418,807
|
477,798
|
|
|
(i)
Includes financial leases for Ps. 366 as of June 30,
2019.
(ii)
Includes Ps. 311,674 and Ps. 393,641 as of June 30, 2020 and 2019,
respectively, corresponding to the Operations Center in
Israel.
As of
June 30, 2020 and 2019, total borrowings include collateralized
liabilities (seller financing, leases and bank loans) of Ps. 14,920
and Ps. 19,831, respectively. These borrowings are mainly
collateralized by investment properties and property, plant and
equipment of the Group (Notes 9 and 10).
Borrowings also
include liabilities under finance leases where the Group is the
lessee. Information regarding liabilities under finance leases is
disclosed in Note 24.
The
terms of the loans include standard covenants for this type of
financial operations. As of the date of these financial statements,
the Group has complied with the covenants contemplated in its
respective loan agreements, with the exception of an IDBG loan,
which was reclassified to current loans, since it breached a term
that determined the IDBD debt rating (company that guaranteed that
loan). The amount thereof is NIS 153.
The
maturity of the Group's borrowings (excluding obligations under
finance leases) is as follows:
|
|
06.30.20
|
06.30.19
|
|
|
|
|
|
Principal:
|
|
|
|
Less than one
year
|
96,414
|
75,709
|
|
Between 1 and 2
years
|
64,197
|
64,202
|
|
Between 2 and 3
years
|
110,333
|
48,517
|
|
Between 3 and 4
years
|
35,896
|
109,928
|
|
Between 4 and 5
years
|
32,328
|
41,489
|
|
More than 5
years
|
77,375
|
132,823
|
|
|
416,543
|
472,668
|
|
Interest:
|
|
|
|
Less than one
year
|
1,962
|
4,329
|
|
Between 1 and 2
years
|
76
|
56
|
|
Between 2 and 3
years
|
89
|
54
|
|
Between 3 and 4
years
|
28
|
254
|
|
Between 4 and 5
years
|
44
|
27
|
|
More than 5
years
|
65
|
44
|
|
|
2,264
|
4,764
|
|
Finance
lease obligations
|
-
|
366
|
|
|
418,807
|
477,798
|
F-88
Cresud Sociedad Anónima,
Comercial, Inmobiliaria, Financiera y Agropecuaria
The
following table shows a detail of evolution of borrowing during the
years ended June 30, 2019 and 2018:
|
|
06.30.20
|
06.30.19
|
|
Balance at the beginning of the year
|
477,798
|
488,156
|
|
Borrowings
|
47,777
|
55,708
|
|
Payment
of borrowings
|
(72,590
)
|
(54,274
)
|
|
Collection
/ (Payment) of short term loans, net
|
(2,459
)
|
2,248
|
|
Interests
paid
|
(21,909
)
|
(20,059
)
|
|
Accrued
interests
|
24,357
|
21,893
|
|
Cumulative
translation adjustment and exchange differences, net
|
74,853
|
(1,433
)
|
|
Deconsolidation
|
(95,443
)
|
8,751
|
|
Changes
in fair value of third-party loans
|
-
|
(27
)
|
|
Repurchase
of non-convertible notes
|
(13,644
)
|
(8,291
)
|
|
Inflation
adjustment
|
(997
)
|
(14,601
)
|
|
Incorporation
by business combination
|
1,884
|
-
|
|
Transfer
to / from assets available for sale
|
(820
)
|
-
|
|
Reclassifications
and other movements
|
-
|
(273
)
|
|
Balance at the end of the year
|
418,807
|
477,798
|
The
following tables shows a breakdown of Group’s borrowing by
type of fixed-rate and floating-rate, per currency denomination and
per functional currency of the subsidiary that holds the loans for
the fiscal years ended June 30, 2020 and 2019.
|
|
06.30.20
|
||||||
|
|
Argentine Peso
|
Brazilian Reais
|
Bolivian Peso
|
Uruguayan Peso
|
US Dollar
|
NIS
|
Total
|
|
Fixed rate:
|
|
|
|
|
|
|
|
|
Argentine
Peso
|
7,793
|
-
|
-
|
-
|
-
|
-
|
7,793
|
|
Brazilian
Reais
|
-
|
1,594
|
-
|
-
|
-
|
-
|
1,594
|
|
US
Dollar
|
86,26
|
110
|
-
|
517
|
146
|
(1,162
)
|
85,871
|
|
Bolivian
pesos
|
-
|
-
|
-
|
-
|
-
|
1,424
|
1,424
|
|
NIS
|
-
|
-
|
-
|
-
|
-
|
176,617
|
176,617
|
|
Subtotal fixed-rate borrowings
|
94,053
|
1,704
|
-
|
517
|
146
|
176,879
|
273,299
|
|
Floating rate:
|
-
|
|
|
|
|
|
|
|
Argentine
Peso
|
1,934
|
-
|
-
|
-
|
-
|
-
|
1,934
|
|
Brazilian
Reais
|
-
|
4,877
|
-
|
-
|
-
|
-
|
4,877
|
|
US
Dollar
|
3,902
|
-
|
-
|
-
|
-
|
-
|
3,902
|
|
NIS
|
-
|
-
|
-
|
-
|
-
|
134,795
|
134,795
|
|
Subtotal floating rate borrowings
|
5,836
|
4,877
|
-
|
-
|
-
|
134,795
|
145,508
|
|
Total borrowings as per analysis
|
99,889
|
6,581
|
-
|
517
|
146
|
311,674
|
418,807
|
|
Finance
lease obligations
|
-
|
-
|
-
|
-
|
-
|
-
|
-
|
|
Total borrowings as per Statement of Financial
Position
|
99,889
|
6,581
|
-
|
517
|
146
|
311,674
|
418,807
|
|
|
06.30.19
|
||||||
|
|
Argentine Peso
|
Brazilian Reais
|
Bolivian Peso
|
Uruguayan Peso
|
US Dollar
|
NIS
|
Total
|
|
Fixed rate:
|
|
|
|
|
|
|
|
|
Argentine
Peso
|
1,456
|
-
|
-
|
-
|
-
|
-
|
1,456
|
|
Brazilian
Reais
|
-
|
2,265
|
-
|
-
|
-
|
-
|
2,265
|
|
US
Dollar
|
71,803
|
6
|
-
|
449
|
121
|
11,896
|
84,275
|
|
Bolivian
pesos
|
-
|
-
|
4
|
-
|
-
|
-
|
4
|
|
NIS
|
-
|
-
|
-
|
-
|
-
|
225,582
|
225,582
|
|
Subtotal fixed-rate borrowings
|
73,259
|
2,271
|
4
|
449
|
121
|
237,478
|
313,582
|
|
Floating rate:
|
-
|
|
|
|
|
|
|
|
Argentine
Peso
|
1,086
|
-
|
-
|
-
|
-
|
-
|
1,086
|
|
Brazilian
Reais
|
-
|
2,600
|
-
|
-
|
-
|
-
|
2,600
|
|
US
Dollar
|
4,002
|
-
|
-
|
-
|
-
|
-
|
4,002
|
|
NIS
|
-
|
-
|
-
|
-
|
-
|
156,162
|
156,162
|
|
Subtotal floating rate borrowings
|
5,088
|
2,6
|
-
|
-
|
-
|
156,162
|
163,85
|
|
Total borrowings as per analysis
|
78,347
|
4,871
|
4
|
449
|
121
|
393,64
|
477,432
|
|
Finance
lease obligations
|
366
|
-
|
-
|
-
|
-
|
-
|
366
|
|
Total borrowings as per Statement of Financial
Position
|
78,713
|
4,871
|
4
|
449
|
121
|
393,64
|
477,798
|
F-89
Cresud Sociedad Anónima,
Comercial, Inmobiliaria, Financiera y Agropecuaria
The
following describes the debt issuances made by the Group for the
years ended June 30, 2019, and 2018:
|
|
|
|
|
|
Interest
|
|
|
|
|
Entity
|
Class
|
Issuance / expansion date
|
Amount in original currency
|
Maturity date
|
rate
|
Principal payment
|
Interest payment
|
|
|
CRESUD
|
Class XXIII
|
feb-18
|
USD 113
|
02/16/2023
|
6.50% n.a.
|
At expiration
|
biannual
|
|
|
CRESUD
|
Class XXIV
|
nov-18
|
USD 73.6
|
11/14/2020
|
9.00% n.a.
|
At expiration
|
quarterly
|
|
|
CRESUD
|
Class XXV
|
jul-19
|
USD 59.6
|
07/11/2021
|
9.00% n.a.
|
At expiration
|
biannual
|
|
|
CRESUD
|
Class
XXVI
|
jan-20
|
ARS
1,095
|
01/30/2021
|
Bladar
+650pts
|
At expiration
|
quarterly
|
|
|
CRESUD
|
Class
XXVII
|
jan-20
|
USD
5.7
|
07/30/2021
|
7.45%
n.a.
|
At expiration
|
quarterly
|
|
|
CRESUD
|
Class
XXVIII
|
jan-20
|
USD
27.5
|
04/30/2021
|
9%
n.a.
|
At expiration
|
quarterly
|
|
|
PBC
|
SERIE I
|
jul-18
|
NIS 507
|
06/29/2029
|
3.95% n.a.
|
At expiration
|
Quarterly
|
(1)
|
|
PBC
|
SERIE j
|
may-19
|
NIS 515
|
12/31/2029
|
4.15% n.a.
|
At expiration
|
Annual
|
|
|
Gav - Yam
|
SERIE H
|
sep-17
|
NIS 424
|
06/30/2034
|
2.55% n.a.
|
Annual payments since 2019
|
biannual
|
(1)
|
|
Gav - Yam
|
SERIE A
|
jul-18
|
NIS 320
|
10/31/2023
|
3.55% n.a.
|
Annual payments since 2021
|
biannual
|
(1)
|
|
Gav - Yam
|
SERIE H
|
sep-18
|
NIS 596
|
06/30/2024
|
2.55% n.a.
|
Annual payments since 2019
|
annual
|
(1)
|
|
Gav - Yam
|
SERIE A
|
dic-18
|
NIS 351
|
10/31/2023
|
3.55% n.a.
|
Annual payments since 2021
|
biannual
|
|
|
Cellcom
|
SERIE L
|
jan-18
|
NIS 401
|
01/05/2028
|
2.5% n.a.
|
Annual payments since 2023
|
annual
|
(1)
|
|
Cellcom
|
SERIE K
|
jul-18
|
NIS 220
|
07/05/2026
|
3.55% n.a.
|
Annual payments since 2021
|
annual
|
(1)
|
|
Cellcom
|
SERIE K
|
dic-18
|
NIS 187
|
01/07/2026
|
3.55% n.a.
|
Annual payments since 2021
|
annual
|
|
|
Cellcom
|
SERIE L
|
dic-18
|
NIS 213
|
01/15/2028
|
2.50% n.a.
|
Annual payments since 2023
|
annual
|
|
|
IRSA
|
Class I 2
nd
tranch
|
aug-19
|
USD 85
|
11/15/2028
|
10.00% n.a.
|
At expiration
|
quarterly
|
|
|
IRSA
|
Class II
|
aug-19
|
CLP 31,503
|
08/06/2020
|
10.50% n.a.
|
At expiration
|
quarterly
|
(1)
|
|
IDBD
|
Serie 15
|
nov-19
|
NIS 237
|
06/30/2022
|
4.70% n.a
|
Two payments
|
quarterly
|
|
|
IRSA
|
Class II
|
may-20
|
ARS 354
|
02/19/2021
|
Badlar.+ 0.6%n.a.
|
At expiration
|
quarterly
|
(1)
|
|
IRSA
|
Cass IV
|
may-20
|
USD 51
|
05/19/2021
|
7% n.a.
|
At expiration
|
quarterly
|
|
|
IRSA
|
Class V
|
may-20
|
USD 9
|
05/19/2022
|
9% n.a.
|
At expiration
|
quarterly
|
|
(1) Corresponds to
an expansion of the series.
23.
Income
tax
The
Group’s income tax has been calculated on the estimated
taxable profit for each year at the rates prevailing in the
respective tax jurisdictions. The subsidiaries of the Group in the
jurisdictions where the Group operates are required to calculate
their income taxes on a separate basis; thus, they are not
permitted to compensate subsidiaries’ losses against
subsidiaries income.
Argentine tax reform
On
December 27, 2017, the Argentine Congress approved the Tax Reform,
through Law No. 27,430, which was enacted on December 29, 2017, and
has introduced many changes to the income tax treatment applicable
to financial income. The key components of the Tax Reform are as
follows:
Dividends: Tax on
dividends distributed by Argentine companies would be as follows:
(i) dividends originated from profits obtained before fiscal year
ending June 30, 2018 will not be subject to withholding tax; (ii)
dividends derived from profits generated during fiscal years of the
Company ending June 30, 2019 and 2020 paid to argentine individuals
and/or foreign residents, will be subject to a 7% withholding tax;
and (iii) dividends originated from profits obtained during fiscal
year ending June 30, 2021 onward will be subject to withholding tax
at a rate of 13%.
Income
tax: Corporate income tax would be gradually reduced to 30% for
fiscal years commencing after January 1, 2018 through December 31,
2019, and to 25% for fiscal years beginning after January 1, 2020,
inclusive.
Presumptions of
dividends: Certain facts will be presumed to constitute dividend
payments, such as: i) withdrawals from shareholders, ii)
shareholders private use of property of the company, iii)
transactions with shareholders at values different from market
values, iv) personal expenses from shareholders or shareholder
remuneration without substance.
Revaluation of
assets: The regulation establishes that, at the option of the
companies, tax revaluation of assets is permitted for assets
located in Argentina and affected to the generation of taxable
profits. The special tax on the amount of the revaluation depends
on the asset, being (i) 8% for real estate not classified as
inventories, (ii) 15% for real estate classified as inventories,
(iii) 5% for shares, quotas and equity interests owned by
individuals and (iv) 10% for the rest of the assets. Once the
option is exercised for a particular asset, all other assets in the
same category must be revalued. The tax result that originates the
revaluation is not subject to the income tax and the special tax on
the revaluation amount will not be deductible from said tax.
Through regulations (Decree 353/2018 and 613/2018, and General
Resolution (AFP) 4287), the National Executive Power has been
extending the date for the exercise of the option, based on the
international context and the greater volatility that it is
observed in the financial variables that affect the decision
regarding the exercise of the option. The expiration of the term
for the exercise of this option for companies with fiscal year end
as of June 30, was July 31, 2019.
The
Group has analyzed the impacts of the option mentioned above and
has chosen for the application of the optional tax revaluation in
some companies of the Group.
F-90
Cresud Sociedad Anónima,
Comercial, Inmobiliaria, Financiera y Agropecuaria
Tax
inflation adjustment: Law 27,430 establishes the following rules
for the application of the inflation adjustment in income tax: (i)
the update of the cost for goods acquired or investments made in
the fiscal years that begin as of January 1, 2018 (applicable to
IRSA for the year end June 30, 2019), considering the percentage
variations of the CPI provided by the National Institute of
Statistics and Census (INDEC); and (ii) the application of the
adjustment set forth in Title VI of the Income Tax Law when a
percentage of variation -of the aforementioned index price -
accumulated in thirty-six (36) months prior to the fiscal year end
that is liquidated, is greater than 100%, or, with respect to the
first, second and third year after its validity, this procedure
will be applicable in case the accumulated variation of that index
price, calculated from the beginning of the first of them and until
the end of each year, exceeds 55%, 30% and 15% for the first,
second and third year of application, respectively. At the end of
this year, there has been an accumulative variation of 55.72% in
the index price that exceeds the expected condition of 55% for the
application of the adjustment in said first year. Consequently, the
tax inflation adjustment has been applied and the cost of goods
acquired during the year 2019 has been updated as established in
article 58 of the Argentine Income Tax Law.
In
addition, the argentine tax reform contemplates other amendments
regarding the following matters: social security contributions, tax
administrative procedures law, criminal tax law, tax on liquid
fuels, and excise taxes, among others. As of the date of
presentation of these Financial Statements, some aspects are
pending regulation by the National Executive Power.
US tax reform
In
December 2017, a bill was passed to reform the Federal Taxation Law
in the United States. The reform included a reduction of the
corporate tax rate from 35% to 21%, for the tax years 2018 and
thereafter. The reform has impact in certain subsidiaries of the
Group in the United States.
The
details of the provision for the Group’s income tax, is as
follows:
|
|
06.30.20
|
06.30.19
|
06.30.18
|
|
Current income
tax
|
(721
)
|
(1,938
)
|
(48
)
|
|
Deferred income
tax
|
(7,252
)
|
1,079
|
10,229
|
|
MPIT
|
(134
)
|
79
|
(217
)
|
|
Income
tax
|
(8,107
)
|
(780
)
|
9,964
|
The
statutory taxes rates in the countries where the Group operates for
all of the years presented are:
|
Tax jurisdiction
|
Income tax rate
|
|
Argentina
|
25
% - 35%
|
|
Brazil
|
25
% - 34%
|
|
Uruguay
|
0
% - 25%
|
|
Bolivia
|
25
%
|
|
U.S.
|
0
% - 40%
|
|
Bermudas
|
0
%
|
|
Israel
|
23
% - 24%
|
Below
is a reconciliation between income tax expense and the tax
calculated applying the current tax rate, applicable in the
respective countries, to profit before taxes for years ended June
30, 2020, 2019 and 2018:
|
|
06.30.20
|
06.30.19
|
06.30.18
|
|
Tax
calculated at the tax rates applicable to profits in the respective
countries
|
(5,116
)
|
11,154
|
4,265
|
|
Permanent differences:
|
|
|
|
|
Tax inflation
adjustment
|
(4,106
)
|
(5,826
)
|
-
|
|
Share of profit /
(loss
) of associates and joint
ventures
|
1,724
|
(1,104
)
|
(575
)
|
|
Unrecognized
tax loss carry-forwards
(i)
|
(3,094
)
|
(4,255
)
|
(4,016
)
|
|
Expiration
of tax loss
carry-forwards
|
13
|
-
|
(164
)
|
|
Provision for
unrecoverability
of tax loss
carry-forwards
|
(1,997
)
|
(3,184
)
|
(1,945
)
|
|
Changes in fair
value of financial instruments and
sale of shares (ii)
|
(1,684
)
|
74
|
(720
)
|
|
Change of
tax rate
|
2,858
|
400
|
11,767
|
|
Non-taxable
profit
|
150
|
-
|
-
|
|
Non-deductible
expenses
|
(12
)
|
(26
)
|
(16
)
|
|
Others
|
(638
)
|
1,071
|
1,361
|
|
Inflation
adjustment
permanent
difference
|
3,795
|
916
|
7
|
|
Income
tax from continuing
operations
|
(8,107
)
|
(780
)
|
9,964
|
(i)
Corresponds mainly
to holding companies in the Operations Center in
Israel.
F-91
Cresud Sociedad Anónima,
Comercial, Inmobiliaria, Financiera y Agropecuaria
Deferred tax assets
and liabilities of the Group as of June 30, 2020 and 2019 will be
recovered as follows:
|
|
06.30.20
|
06.30.19
|
|
Deferred
income tax assets to be recovered
after more than 12 months
|
15,748
|
12,806
|
|
Deferred
income tax assets to be recovered
within 12 months
|
1,207
|
2,425
|
|
Deferred
income tax assets
|
16,955
|
15,231
|
|
|
|
|
|
|
06.30.20
|
06.30.19
|
|
Deferred
income tax liabilities to be recovered
after more than 12 months
|
(62,318
)
|
(51,537
)
|
|
Deferred
income tax liabilities to be recovered
within 12 months
|
(3,179
)
|
(20,114
)
|
|
Deferred
income tax liabilities
|
(65,497
)
|
(71,651
)
|
|
Total
deferred income tax (liabilities) assets, net
|
(48,542
)
|
(56,420
)
|
The
movement in the deferred income tax assets and liabilities during
the years ended June 30, 2020 and 2019, without taking into
consideration the offsetting of balances within the same tax
jurisdiction, is as follows:
|
|
At the beginning
|
Business combinations and reclassification to other assets held for
sale (i)
|
Foreign exchange gain
|
Charged to the Statement of Income (ii)
|
Reserve for changes of non-controlling interest
|
Deconsolidation (see Note 4 (l))
|
Use of tax loss carry-forwards
|
At the end
|
|
June 30, 2020
|
|
|
|
|
|
|
|
|
|
Assets
|
|
|
|
|
|
|
|
|
|
Trade
and other payables
|
5,766
|
(1
)
|
863
|
(834
)
|
-
|
-
|
(431
)
|
5,363
|
|
Tax
loss carry-forwards
|
7,904
|
-
|
803
|
908
|
-
|
-
|
(83
)
|
9,532
|
|
Others
|
1,561
|
(3
)
|
149
|
276
|
77
|
-
|
-
|
2,060
|
|
Subtotal assets
|
15,231
|
(4
)
|
1,815
|
350
|
77
|
-
|
(514
)
|
16,955
|
|
Liabilities
|
|
|
|
|
|
|
|
|
|
Investment
properties and property, plant and equipment
|
(61,085
)
|
(558
)
|
1,301
|
(8,904
)
|
-
|
204
|
14,973
|
(54,069
)
|
|
Biological
assets
|
(514
)
|
-
|
73
|
(192
)
|
-
|
-
|
-
|
(633
)
|
|
Trade
and other receivables
|
(889
)
|
-
|
-
|
(33
)
|
-
|
-
|
-
|
(922
)
|
|
Investments
|
(73
)
|
-
|
(80
)
|
59
|
-
|
-
|
-
|
(94
)
|
|
Intangible
assets
|
(2,266
)
|
-
|
(510
)
|
383
|
-
|
-
|
-
|
(2,393
)
|
|
Tax
inflation adjustment
|
(4,385
)
|
(33
)
|
-
|
(1,856
)
|
-
|
-
|
-
|
(6,274
)
|
|
Borrowings
|
(1,058
)
|
-
|
(282
)
|
386
|
-
|
-
|
-
|
(954
)
|
|
Inventories
|
(728
)
|
(3
)
|
134
|
(49
)
|
-
|
-
|
-
|
(646
)
|
|
Others
|
(653
)
|
(593
)
|
(543
)
|
2,459
|
-
|
-
|
(182
)
|
488
|
|
Subtotal liabilities
|
(71,651
)
|
(1,187
)
|
93
|
(7,747
)
|
-
|
204
|
14,791
|
(65,497
)
|
|
(Liabilities) / Assets, net
|
(56,420
)
|
(1,191
)
|
1,908
|
(7,397
)
|
77
|
204
|
14,277
|
(48,542
)
|
|
|
At the beginning
|
Business combinations and reclassification to other assets held for
sale (i)
|
Foreign exchange gain
|
Charged to the Statement of Income
|
Reclassification of opening amounts
|
Use of tax loss carry-forwards
|
At the end
|
|
June 30, 2019
|
|
|
|
|
|
|
|
|
Assets
|
|
|
|
|
|
|
|
|
Trade
and other payables
|
4,661
|
-
|
193
|
912
|
-
|
-
|
5,766
|
|
Tax
loss carry-forwards
|
13,022
|
-
|
(309
)
|
(4,809
)
|
-
|
-
|
7,904
|
|
Others
|
2,029
|
-
|
(68
)
|
(687
)
|
287
|
-
|
1,561
|
|
Subtotal assets
|
19,712
|
-
|
(184
)
|
(4,584
)
|
287
|
-
|
15,231
|
|
Liabilities
|
|
|
|
|
|
|
|
|
Investment
properties and property, plant and equipment
|
(69,039
)
|
-
|
1,059
|
7,839
|
64
|
(1,008
)
|
(61,085
)
|
|
Biological
assets
|
(359
)
|
-
|
1
|
(156
)
|
-
|
-
|
(514
)
|
|
Trade
and other receivables
|
(536
)
|
-
|
3
|
(356
)
|
-
|
-
|
(889
)
|
|
Investments
|
(30
)
|
-
|
(13
)
|
(30
)
|
-
|
-
|
(73
)
|
|
Intangible
assets
|
(2,985
)
|
-
|
262
|
457
|
-
|
-
|
(2,266
)
|
|
Tax
inflation adjustment
|
-
|
-
|
-
|
(4,385
)
|
-
|
-
|
(4,385
)
|
|
Borrowings
|
(1,286
)
|
-
|
93
|
135
|
-
|
-
|
(1,058
)
|
|
Inventories
|
(202
)
|
-
|
30
|
(556
)
|
-
|
-
|
(728
)
|
|
Others
|
(2,628
)
|
-
|
626
|
1,349
|
-
|
-
|
(653
)
|
|
Subtotal liabilities
|
(77,065
)
|
-
|
2,061
|
4,297
|
64
|
(1,008
)
|
(71,651
)
|
|
(Liabilities) / Assets, net
|
(57,353
)
|
-
|
1,877
|
(287
)
|
351
|
(1,008
)
|
(56,420
)
|
F-92
Cresud Sociedad Anónima,
Comercial, Inmobiliaria, Financiera y Agropecuaria
Deferred income tax
assets are recognized for tax loss carry-forwards to the extent
that the realization of the related tax benefits through future
taxable profits is probable. Tax loss carry-forwards may have
expiration dates or may be permanently available for use by the
Group depending on the tax jurisdiction where the tax loss carry
forward is generated. Tax loss carry forwards in Argentina and
Uruguay generally expire within 5 years, while in Israel they do
not expire. Tax loss carry forward in Bolivia expire within 3
years. Tax loss carry forwards in Brazil do not expire. However, in
Brazil, the taxable profit for each year can only be reduced by tax
losses up to a maximum of 30%.
As of
June 30, 2020, the Group's recognized tax loss carry forward
prescribed as follows:
|
Jurisdiction
|
06.30.20
|
Date of generation
|
Due date
|
|
Argentina
|
3
|
2016
|
2021
|
|
Argentina
|
11
|
2017
|
2022
|
|
Argentina
|
2,785
|
2018
|
2023
|
|
Argentina
|
1,186
|
2019
|
2024
|
|
Argentina
|
4,809
|
2020
|
2025
|
|
Bolivia
|
1
|
2011-2020
|
Do not
expire
|
|
Do
not expire
|
3,784
|
|
|
|
Total cumulative tax loss carry-forwards
|
12,579
|
|
|
The
Group assesses the realizability of deferred income tax assets, by
considering whether it is probable that some portion or all of the
deferred income tax assets will not be realized. In order to make
this assessment, Management considers the scheduled reversal of
deferred income tax liabilities, projected business and tax
planning strategies.
On this
basis, it is estimated that as of June 30, 2020, all deferred tax
assets and tax credits will be realized.
The
Group did not recognize deferred income tax assets (tax loss carry
forwards) of Ps. 456,299 and Ps. 332,739
as
of June 30, 2020 and 2019, respectively. Although management
estimates that the business will generate sufficient income,
pursuant to IAS 12, management has determined that, as a result of
the recent loss history and the lack of verifiable and objective
evidence due to the subsidiary’s results of operations
history, there is sufficient uncertainty as to the generation of
sufficient income to be able to offset losses within a reasonable
timeframe, therefore, no deferred tax asset is recognized in
relation to these losses.
The
Group did not recognize deferred income tax liabilities of Ps. 90
and Ps. 86 as of June 30, 2020 and 2019, respectively, related to
their investments in foreign subsidiaries, associates and joint
ventures. In addition, the withholdings and/or similar taxes paid
at source may be creditable against the Group’s potential
final tax liability.
On June
30, 2020 and 2019, the Group recognized a deferred liability in the
amount of Ps. 906 and Ps. 938, respectively, related to the
potential future sale of one of its subsidiaries
shares.
IDBD
and DIC assess whether it is necessary to recognize deferred tax
liabilities for the temporary differences arising in relation to
its investments in subsidiaries; in this respect, IDBD, DIC and PBC
estimate that if each of them is required to dispose of its
respective holdings in subsidiaries, they would not be liable to
income tax on the sale and, for such reason, they did not recognize
the deferred tax liabilities related to this difference in these
Consolidated Financial Statements.
24.
Leases
The
Group as lessee
Operating leases
In the
ordinary course of business, the Group enters into several
operating lease agreements. Group conducts a portion of its
agricultural activities on land rented from third parties under
operating lease contracts averaging a harvest year. Rent expense
for the years ended as of June 30, 2020, 2019 and 2018 amounted to
Ps. 645, Ps. 269.6 and Ps. 444, respectively and is included in the
line item "Costs" in the Statement of Income.
The
Group is also using land in the Province of Salta under rights of
use agreement (the "Anta Agreement") for which the Group is
currently paying a rent fee of 10% of the production. Rent expense
paid for the years ended as of June 30, 2020, 2019 and 2018
amounted to Ps. 103, Ps. 73 and Ps. 91, respectively and is
included in the line item "Costs" in the Statement of
Income.
The
Group leases property or spaces for administrative or commercial
use both in Argentina and in Israel, under operating leases. The
agreements entered into include several clauses, including but not
limited, to fixed, variable or
F-93
Cresud Sociedad Anónima,
Comercial, Inmobiliaria, Financiera y Agropecuaria
adjustable
payments. Some leases were agreed upon with related parties (Note
32). The amounts involved are not material for any of the periods
filed.
The
future aggregate minimum lease payments the Group will have to
cancel under non-cancellable operating leases were as
follows:
|
|
06.30.20
|
06.30.19
|
06.30.18
|
|
No later than 1
year
|
2,428
|
9,825
|
5,750
|
|
Later than 1 year
and not later than 5 years
|
5,410
|
15,160
|
11,118
|
|
More than 5
years
|
2,397
|
2,098
|
2,680
|
|
|
10,235
|
27,083
|
19,548
|
The
Group as lessor
Operating leases (Shopping malls, offices and other
buildings)
In the
segments Shopping malls and Offices and Others in the Operations
Center in Argentina and in the segment Real Estate of the
Operations Center in Israel, the Group enters into operating lease
agreements typical in the business. Given the diversity of
properties and lessees, and the various economic and regulatory
jurisdictions where the Group operates, the agreements may adopt
different forms, such as fixed, variable, adjustable leases, etc.
For example, in the Operations Center in Argentina, operating lease
agreements with lessees of Shopping malls generally include
escalation clauses and contingent payments. In Israel, agreements
tend to be agreed upon for fixed amounts, although in some cases
they may include adjustment clauses. Income from leases are
recorded in the Statement of Income under rental and service income
in all of the filed periods.
Rental
properties are considered to be investment property. Book value is
included in Note 9. The future minimum proceeds generated from
non-cancellable operating leases from Group’s Shopping malls,
offices and other buildings are as follows:
|
|
06.30.20
|
06.30.19
|
06.30.18
|
|
No later than 1
year
|
1,211
|
13,216
|
11,334
|
|
Later than 1 year
and not later than 5 years
|
22,063
|
29,731
|
51,018
|
|
More than 5
years
|
10,673
|
21,360
|
18,625
|
|
|
33,947
|
64,307
|
80,977
|
Operating leases (Farmlands)
From
time to time, the Group leases certain farmlands. The leases have
an average term of one crop year. Rental income is generally based
on the market price of a particular crop multiplied by a fixed
amount of tons per hectare leased or based on a fixed amount in
dollars per hectare leased.
The
future aggregate minimum lease proceeds under non-cancellable
operating leases from the Group are as follows:
|
|
06.30.20
|
06.30.19
|
06.30.18
|
|
No later than 1
year
|
122
|
87
|
60
|
|
Later than 1 year
and not later than 5 years
|
148
|
241
|
160
|
|
More than 5
years
|
-
|
7
|
17
|
|
|
270
|
335
|
237
|
Finance leases:
The
Group does not act as a lessor in connection with finance
leases.
25.
Revenues
|
|
06.30.20
|
06.30.19
|
06.30.18
|
|
Beef
|
6,228
|
5,764
|
4,821
|
|
Crops
|
11,462
|
6,509
|
5,426
|
|
Sugarcane
|
3,177
|
2,652
|
2,049
|
|
Cattle
|
1,326
|
625
|
720
|
|
Supplies
|
1,046
|
766
|
420
|
|
Dairy
|
-
|
517
|
237
|
|
Consignment
|
596
|
576
|
269
|
|
Advertising and
brokerage fees
|
736
|
929
|
387
|
|
Agricultural rental
and other
services
|
922
|
238
|
750
|
|
Income
from agricultural sales and services
|
25,493
|
18,576
|
15,079
|
|
Trading properties
and developments
|
5,529
|
8,079
|
4,336
|
|
Communication
services
|
48,657
|
42,704
|
36,514
|
|
Sale of
communication equipment
|
16,180
|
14,803
|
12,551
|
|
Rental and
services
|
19,531
|
22,689
|
21,627
|
|
Hotel operations,
tourism services and others
|
5,866
|
3,890
|
3,159
|
|
Total
revenues
|
121,256
|
110,741
|
93,266
|
F-94
Cresud Sociedad Anónima,
Comercial, Inmobiliaria, Financiera y Agropecuaria
26.
Costs
|
|
06.30.20
|
06.30.19
|
06.30.18
|
|
Other operative
costs
|
25
|
24
|
36
|
|
Cost
of property operations
|
25
|
24
|
36
|
|
Beef
|
5,087
|
5,160
|
4,542
|
|
Crops
|
9,787
|
6,160
|
4,393
|
|
Sugarcane
|
2,993
|
2,311
|
1,948
|
|
Cattle
|
1,622
|
725
|
749
|
|
Supplies
|
837
|
790
|
332
|
|
Dairy
|
-
|
-
|
172
|
|
Consignment
|
653
|
133
|
67
|
|
Advertising and
brokerage fees
|
464
|
397
|
307
|
|
Agricultural rental
and other
services
|
274
|
266
|
399
|
|
Costs
of agricultural sales and services
|
21,717
|
15,942
|
12,909
|
|
Trading properties
and developments
|
4,529
|
6,889
|
4,206
|
|
Communication
services
|
35,136
|
31,782
|
26,684
|
|
Sale of
communication equipment
|
12,128
|
10,643
|
8,505
|
|
Rental and
services
|
6,934
|
7,639
|
7,280
|
|
Hotel operations,
tourism services and others
|
3,502
|
2,465
|
2,458
|
|
Total
costs
|
83,971
|
75,384
|
62,078
|
27.
Expenses
by nature
The
Group disclosed expenses in the statements of income by function as
part of the line items “Costs”, “General and
administrative expenses” and “Selling expenses”.
The following tables provide additional disclosure regarding
expenses by nature and their relationship to the function within
the Group as of June 30, 2020, 2019 and 2018.
|
|
Production
costs
|
Costs (
i)
|
General
and administrative expenses
|
Selling
expenses
|
Total
as of 06.30.20
|
|
Leases, services
charges and vacant property costs
|
9
|
164
|
33
|
21
|
227
|
|
Depreciation and
amortization
|
1,372
|
10,180
|
2,987
|
3,258
|
17,797
|
|
Doubtful
accounts
|
-
|
89
|
-
|
967
|
1,056
|
|
Advertising,
publicity and other selling expenses
|
-
|
515
|
-
|
2,475
|
2,990
|
|
Taxes, rates and
contributions
|
46
|
687
|
135
|
1,329
|
2,197
|
|
Maintenance and
repairs
|
88
|
4,680
|
600
|
428
|
5,796
|
|
Fees and payments
for services
|
33
|
4,954
|
1,958
|
113
|
7,058
|
|
Director's
fees
|
-
|
-
|
748
|
-
|
748
|
|
Payroll and social
security liabilities
|
561
|
7,695
|
4,851
|
5,760
|
18,867
|
|
Cost of sale of
goods
and services
|
-
|
17,050
|
-
|
-
|
17,050
|
|
Cost
of sale of agricultural products and biological
assets
|
-
|
12,249
|
-
|
-
|
12,249
|
|
Supplies and
labors
|
8,385
|
5,275
|
2
|
90
|
13,752
|
|
Freights
|
78
|
54
|
-
|
1,258
|
1,390
|
|
Commissions
and bank charges
|
-
|
6
|
100
|
-
|
106
|
|
Conditioning and
clearance
|
-
|
-
|
-
|
179
|
179
|
|
Travel, library
expenses
and
stationery
|
48
|
50
|
76
|
25
|
199
|
|
Interconnection and
roaming expenses
|
-
|
6,960
|
-
|
-
|
6,960
|
|
Fees to other
operators
|
-
|
9,711
|
-
|
-
|
9,711
|
|
Others
|
811
|
3,652
|
777
|
445
|
5,685
|
|
Total
expenses by nature as of
06.30.20
|
11,431
|
83,971
|
12,267
|
16,348
|
124,017
|
|
|
Production costs
|
Costs
(i)
|
General
and administrative expenses
|
Selling
expenses
|
Total as of 06.30.19
|
|
Leases, services
charges and vacant property costs
|
10
|
174
|
57
|
404
|
645
|
|
Depreciation and
amortization
|
583
|
6,680
|
1,792
|
2,350
|
11,405
|
|
Doubtful
accounts
|
-
|
6
|
13
|
645
|
664
|
|
Advertising,
publicity and other selling expenses
|
-
|
585
|
24
|
2,315
|
2,924
|
|
Taxes, rates and
contributions
|
50
|
781
|
109
|
1,206
|
2,146
|
|
Maintenance and
repairs
|
99
|
4,723
|
652
|
380
|
5,854
|
|
Fees and payments
for services
|
30
|
7,332
|
2,812
|
200
|
10,374
|
|
Director's
fees
|
-
|
-
|
1,000
|
-
|
1,000
|
|
Payroll and social
security liabilities
|
517
|
7,185
|
4,578
|
5,018
|
17,298
|
|
Cost of sale of
goods and services
|
-
|
18,024
|
-
|
-
|
18,024
|
|
Cost of sale of
agricultural products and biological assets
|
-
|
7,503
|
-
|
-
|
7,503
|
|
Supplies and
labors
|
7,994
|
5,134
|
1
|
44
|
13,173
|
|
Freights
|
61
|
36
|
-
|
655
|
752
|
|
Commissions and
bank charges
|
-
|
73
|
80
|
3
|
156
|
|
Conditioning and
clearance
|
-
|
-
|
-
|
121
|
121
|
|
Travel, library
expenses and stationery
|
63
|
60
|
119
|
27
|
269
|
|
Interconnection and
roaming expenses
|
-
|
6,064
|
-
|
-
|
6,064
|
|
Fees to other
operators
|
-
|
8,950
|
31
|
-
|
8,981
|
|
Others
|
333
|
2,074
|
884
|
608
|
3,899
|
|
Total
expenses by nature as of 06.30.19
|
9,740
|
75,384
|
12,152
|
13,976
|
111,252
|
F-95
Cresud Sociedad Anónima,
Comercial, Inmobiliaria, Financiera y Agropecuaria
|
|
Production costs
|
Costs (
i)
|
General and administrative expenses
|
Selling expenses
|
Total as of 06.30.18
|
|
Leases,
services charges and vacant property costs
|
4
|
123
|
49
|
347
|
523
|
|
Depreciation
and amortization
|
500
|
5,852
|
1,552
|
2,337
|
10,241
|
|
Doubtful
accounts
|
-
|
7
|
-
|
676
|
683
|
|
Advertising,
publicity and other selling expenses
|
-
|
693
|
13
|
3,258
|
3,964
|
|
Taxes,
rates and contributions
|
53
|
710
|
200
|
949
|
1,912
|
|
Maintenance
and repairs
|
117
|
4,169
|
423
|
247
|
4,956
|
|
Fees
and payments for services
|
13
|
5,418
|
2,310
|
192
|
7,933
|
|
Director's
fees
|
-
|
-
|
753
|
-
|
753
|
|
Food,
beverage and other lodging expenses
|
-
|
100
|
7
|
23
|
130
|
|
Payroll and social
security
liabilities
|
607
|
6,912
|
4,651
|
3,804
|
15,974
|
|
Cost
of sale of goods and services
|
-
|
12,996
|
-
|
-
|
12,996
|
|
Cost
of sale of agricultural products and biological assets
|
-
|
6,390
|
-
|
-
|
6,390
|
|
Supplies
and labors
|
4,701
|
4,668
|
3
|
27
|
9,399
|
|
Freights
|
53
|
3
|
-
|
820
|
876
|
|
Bank
commissions and expenses
|
-
|
-
|
24
|
-
|
24
|
|
Conditioning
and clearance
|
-
|
-
|
-
|
153
|
153
|
|
Travel, library expenses
and
stationery
|
40
|
7
|
20
|
7
|
74
|
|
Interconnection
and roaming expenses
|
-
|
5,241
|
-
|
-
|
5,241
|
|
Fees
to other operators
|
-
|
6,499
|
-
|
-
|
6,499
|
|
Others
|
878
|
2,290
|
871
|
649
|
4,688
|
|
Total expenses by nature as of 06.30.18
|
6,966
|
62,078
|
10,876
|
13,489
|
93,409
|
28.
Other
operating results, net
|
|
06.30.20
|
06.30.19
|
06.30.18
|
|
Gain
from commodity derivative financial instruments
|
439
|
446
|
56
|
|
(Loss)
/ Gain from disposal of associates
|
(260
)
|
983
|
860
|
|
Fair
value of interest held before business combination
|
-
|
-
|
1,259
|
|
Currency
translation adjustment reversal
|
-
|
-
|
476
|
|
Operating
interest expense
|
1,782
|
841
|
156
|
|
Gain
from agreement with TGLT
|
-
|
-
|
189
|
|
Contingencies
|
(132
)
|
(101
)
|
1,052
|
|
Donations
|
(170
)
|
(286
)
|
(170
)
|
|
Others
(i)
|
1,111
|
(782
)
|
(221
)
|
|
Total other operating results, net
|
2,770
|
1,101
|
3,657
|
(i)
As of June 30,
2018, includes the favorable ruling of a trial in the Operations
Center in Israel for an amount of approximately Ps. 1,165. Includes
legal costs and expenses Includes legal costs and
expenses.
29.
Financial
results, net
|
|
06.30.20
|
06.30.19
|
06.30.18
|
|
Financial income
|
|
|
|
|
Interest
income
|
1,059
|
983
|
1,267
|
|
Dividends
income
|
168
|
97
|
209
|
|
Other
financial income
|
236
|
695
|
-
|
|
Total financial income
|
1,463
|
1,775
|
1,476
|
|
Financial costs
|
|
|
|
|
Interest
expenses
|
(24,357
)
|
(21,893
)
|
(19,564
)
|
|
Loss
on debt swap (Note 21)
|
-
|
-
|
(5,908
)
|
|
Other
financial costs
|
(1,439
)
|
(971
)
|
(1,078
)
|
|
Less:
capitalized financial costs
|
113
|
293
|
173
|
|
Total financial costs
|
(25,683
)
|
(22,571
)
|
(26,377
)
|
|
Other financial results:
|
|
|
|
|
Exchange
differences, net
|
(10,197
)
|
2,633
|
(19,587
)
|
|
Fair
value results of financial assets and liabilities at fair value
through profit or loss
|
(9,862
)
|
2,797
|
(1,834
)
|
|
Gain
/ (Loss) from repurchase of Non-convertible notes
|
2,885
|
74
|
(4
)
|
|
(Loss)
/ Gain from derivative financial instruments (except
commodities)
|
(1,493
)
|
477
|
(743
)
|
|
Total other financial results
|
(18,667
)
|
5,981
|
(22,168
)
|
|
Inflation
adjustment
|
177
|
(457
)
|
(321
)
|
|
Total financial results, net
|
(42,710
)
|
(15,272
)
|
(47,390
)
|
F-96
Cresud Sociedad Anónima,
Comercial, Inmobiliaria, Financiera y Agropecuaria
30.
Earnings
per share
(a)
Basic
Basic
earnings per share amounts are calculated in accordance with IAS
33, by dividing the profit attributable to equity holders of the
Group by the weighted average number of ordinary shares outstanding
during the year, excluding ordinary shares purchased by the Group
and held as treasury shares.
|
|
06.30.20
|
06.30.19
|
06.30.18
|
|
Loss for the year
from continuing operations attributable to equity
holders of the parent
|
(2,368
)
|
(28,334
)
|
(9,492
)
|
|
Profit for the year
from discontinued operations attributable to equity
holders of the parent
|
6,297
|
1,538
|
15,598
|
|
Profit / (Loss) for
the year attributable
to equity
holders of the parent
|
3,929
|
(26,796
)
|
6,106
|
|
Weighted average
number of ordinary shares outstanding
|
(499
)
|
489
|
497
|
|
Basic
earnings per share
|
(7.87
)
|
(54.79
)
|
12.29
|
(b)
Diluted
Diluted
earnings per share amounts are calculated by adjusting the weighted
average number of ordinary shares outstanding to assume conversion
of all dilutive potential shares. As of June 30, 2018, the Group
holds treasury shares associated with incentive plans with
potentially dilutive effect, therefore, diluted earnings per share
is as follows:
|
|
06.30.18
|
|
Loss for the year
from continuing operations attributable to equity
holders of the parent
|
(9,492
)
|
|
Profit for the year
from discontinued operations attributable to equity
holders of the parent
|
15,598
|
|
Profit for the year
per share attributable to
equity
holders of the parent
|
6,106
|
|
Weighted average
number of ordinary shares outstanding
|
516
|
|
Diluted
earnings per share
|
11.82
|
Given
that the results for the years ended June 30, 2019 and 2017 showed
losses, there is no diluted effect of said results.
31.
Employee
benefits and share-based payments
Incentive Plan
The
Group has an equity incentive plan, created in September 30, 2011,
which aims at certain selected employees, directors and top
management of the Company, IRSA and IRSA CP (the
“Participants”). Participation in the plan was
voluntary and employees were invited to participate by the
Board.
Under
the Incentive Plan, entitle the Participants to receive shares
("Contributions") of the Company and IRSA, based on a percentage of
their annual bonus for the years 2011, 2012 and 2013, providing
they remain as employees of the Company for at least five years,
among other conditions, required to qualify such Contributions
(except in case of disability or death, where there is no time
limit). Contributions shall be held by the Company and IRSA, and as
the conditions established by the Plan are verified, such
contributions shall be transferred to the Participants only when
the employees retire from the Company. In spite of this, the
economic rights of the shares in the portfolio assigned to said
participants will be received by them.
As of
June 30, 2020, 2019 and 2018, a reserve has been set up under
Shareholders’ equity as a result of this Incentive Plan for
Ps. 51, Ps. 50 and Ps. 90, respectively, based on the market value
of the shares to be granted pertaining to the Group’s
contributions, proportionately to the period already elapsed for
the vesting of shares in the Incentive Plan and adjusted for the
probability that any beneficiary leaves the Group before the term
and/or the conditions required to qualify for the benefits of said
plan are met at each fiscal year-end.
For the
fiscal years ended June 30, 2018, the Group has incurred a charge
related to the Incentive Plan of Ps. 30 and total cost was recorded
considering that the vesting period has elapsed.
During
the fiscal years ended June 30, 2020, 2019 and 2018, the Group
granted 0.48, 0.52 and 0.45 million shares, respectively,
corresponding to the Participants’
Contributions.
Movements in the
number of matching shares outstanding under the incentive plan
corresponding to the Company´s contributions are as
follows
|
|
06.30.20
|
06.30.19
|
06.30.18
|
|
At the beginning
|
4,966,463
|
5,485,194
|
5,834,676
|
|
Granted
|
(482,807
)
|
(518,731
)
|
(349,482
)
|
|
Disposals
|
-
|
-
|
-
|
|
At the end
|
4,483,656
|
4,966,463
|
5,485,194
|
F-97
Cresud Sociedad Anónima,
Comercial, Inmobiliaria, Financiera y Agropecuaria
The
fair value determined at the time of granting the plan after
obtaining all the corresponding authorizations was Ps. 23.5 per
share of IRSA and Ps. 16.45 per share of Cresud. This fair value
was estimated by taking into account the market price of the shares
of the Company on said date.
Defined contribution plan
The
Group operates a defined contribution plan (the “Plan”)
which covers certain selected managers from Argentina. The Plan was
effective as from January 1, 2006. Participants can make pre-tax
contributions to the Plan of up to 2.5% of their monthly salary
(“Base Contributions”) and up to 15% of their annual
bonus (“Extraordinary Contributions”). Under the Plan,
the Group matches employee contributions to the plan at a rate of
200% for Base Contributions and 300% for Extraordinary
Contributions.
All
contributions are invested in funds administered outside of the
Group. Participants or their assignees, as the case may be, will
have access to the 100% of the Company contributions under the
following circumstances:
(i) ordinary
retirement in accordance with applicable labor
regulations;
(ii) total or
permanent incapacity or disability;
(iii) death.
In case
of resignation or termination without fair cause, the manager will
receive the Group’s contribution only if he or she has
participated in the Plan for at least 5 years.
Contributions made
by the Group under the Plan amount to Ps. 51 and Ps. 60 for the
fiscal years ended June 30, 2020 and 2019,
respectively.
Share base plans associated with certain key members of the
management - Israel
DIC and
Cellcom have granted an options benefit plans to key management
personnel. For the years ended June 30, 2020, 2019 and 2018, the
Group has incurred an expense in relation to said benefit plans of
Ps. 10, Ps. 63 and Ps. 66, respectively.
The
following table shows the detail of the options pending at
year-end:
|
|
DIC
|
Cellcom
|
|
Exercise price
range of outstanding options
|
NIS
6.90 – 12.5
|
NIS
15.05 – 27.7
|
|
Average price of
outstanding options
|
NIS
6.72
|
NIS
17.8
|
|
Amount of
outstanding options
|
2,124,000
|
759,332
|
|
Average remaining
useful life
|
4.43
years
|
3.4
years
|
The
fair value of the options was calculated according to the
Black-Scholes method, which included assumptions such as the value
of the share at the date of granting the plan, expected volatility,
expected life of the option or the risk-free rate.
Employee benefits - Israel
Benefits to hired
employees include post-employment benefits, retirement benefits,
share-based plans and other short and long-term benefits. The
Group’s liabilities in relation to severance pay and/or
retirement benefits of Israeli employees are calculated in
accordance with Israeli laws.
|
|
June 30, 2020
|
June 30, 2019
|
June 30, 2018
|
|
Present
value of unfunded obligations
|
-
|
615
|
703
|
|
Present
value of funded obligations
|
1,363
|
819
|
825
|
|
Total present value of defined benefits obligations
(post-employment)
|
1,363
|
1,434
|
1,528
|
|
Fair
value of plan assets
|
(936
)
|
(1,245
)
|
(1,316
)
|
|
Recognized liability for defined benefits obligations
|
427
|
189
|
212
|
|
Liability
for other long-term benefits
|
793
|
682
|
33
|
|
Total recognized liabilities
|
1,220
|
871
|
245
|
|
Assets
designed for payment of employee benefits
|
(773
)
|
(683
)
|
-
|
|
Net position from employee benefits
|
447
|
188
|
245
|
Employee long-term incentive - Brasilagro
On
October 2, 2017, the Shareholders approved the creation of the Long
Term Incentive Plan based on Shares (or "ILPA Plan"). By the terms
of the ILPA Plan, participants will be entitled to receive a number
of shares if they remain in the Company during certain period of
time and comply with certain key performance indicators ("KPIs").
The terms of
F-98
Cresud Sociedad Anónima,
Comercial, Inmobiliaria, Financiera y Agropecuaria
the
ILPA Plan determine that the Board of Directors will have broad
powers to implement the ILPA Plan and take all necessary measures
for its implementation.
The
shares to be granted under the ILPA Plan may not exceed at any time
the maximum and cumulative amount of 2% of the shares issued by the
Company.
The
first award of incentives was approved by the Board of Directors on
June 18, 2018, the date on which the First ILPA Program was
approved and the beneficiaries, the number of shares to be
delivered, the vesting period and the KPIs to be reached were
defined.
The
vesting period for the first ILPA Program is between October 2,
2017 and October 2, 2019 and the participants were selected among
those who acted as company’s employees at the beginning of
the vesting period considering their position in the company and
its related remuneration as of that date.
Certain
KPIs must be achieved for shares to be delivered to participants,
in addition to remain in the Company until the end of the vesting
period. One of the KPIs is to reach a certain percentage of
valuation in the price of AGRO3 shares during the vesting period:
If this percentage is not reached, the participants will not be
entitled to receive any share. In the event that the KPI for the
valuation of the shares is fulfilled, the number of shares to be
delivered will vary in 3 ranges depending on the level of
achievement of another 3 KPI, in addition to being adjusted by the
dividends per share distributed during the vesting period, as well
as an increase in a fixed amount if the value of the share is above
the floor value.
The
fair value of the benefit was estimated at Ps. 0.10. In the initial
measurement of the fair value of the benefit, the price of the
AGRO3 per share was considered on the date of granting and the
probable quotation of the share price is projected at the end of
the vesting period based on the past performance of the price per
share in a period of 1 year and 4 months (compatible with the
period between the granting in June 2018 and the end of the vesting
period in October 2018). Considering the volatility of the AGRO3
share, the probability of the price per share at the end of the
vesting period was determined to reach the value necessary to
comply with the KPI.
To
determine the number of shares and the amount of the remuneration
expense, the Company determines for each year the estimated amount
of shares to be delivered based on its best estimate of the amount
of each of the 3 KPIs which do not depend on the price of the
shares and the dividends to be paid in the same vesting period. The
amount of the expense is adjusted based on said estimate and the
effects recognized prospectively. The estimated expense is
recognized as of the granting in June 2018 ratably during the
vesting period between October 2, 2017 and October 2,
2019.
In the
year ended June 30, 2020, compensation expenses and remuneration
charges are Ps. 45.2 (Ps. 19.7 and Ps. 53.7 as of June 30, 2019 and
2018, respectively) and the accumulated amount is Ps.
77.1.
32.
Related
party transactions
In the
normal course of business, the Group conducts transactions with
different entities or parties related to it. All transactions are
carried out in accordance with market parameters.
Remunerations
of the Board of Directors
The Act
N° 19,550 provides that the remuneration of the Board of
Directors, where it is not set forth in the Company’s
by-laws, shall be fixed by the Shareholders' Meetings. The maximum
amount of remuneration that the members of the Board are allowed to
receive, including salary and other performance-based remuneration
of permanent technical-administrative functions, may not exceed 25%
of the profits.
Such
maximum amount will be limited to 5% where no dividends are
distributed to the Shareholders, and will be increased
proportionately to the distribution, until reaching such cap where
the total of profits is distributed.
Some of
the Group's Directors are hired under the Employment Contract Act
N° 20,744. This Act rules on certain conditions of the work
relationship, including remuneration, salary protection, working
hours, vacations, paid leaves, minimum age requirements, workmen
protection and forms of suspension and contract termination. The
remuneration of directors for each fiscal year is based on the
provisions established by the Act N° 19,550, taking into
consideration whether such directors perform
technical-administrative functions and depending upon the results
recorded by the Company during the fiscal year. Once such amounts
are determined, they should be approved by the Shareholders’
Meeting.
F-99
Cresud Sociedad Anónima,
Comercial, Inmobiliaria, Financiera y Agropecuaria
Senior
Management remuneration
The
members of the Senior or Top Management are appointed and removed
by the Board of Directors, and perform functions in accordance with
the instructions delivered by the Board itself.
The
Society’s Senior Management is composed of as
follows:
|
Name
|
Date of birth
|
Position
|
Current
position since
|
|
Alejandro
G. Elsztain
|
03/31/1966
|
General
Manager
|
1994
|
|
Carlos
Blousson
|
09/21/1963
|
General
Manager of Operations in Argentina and Bolivia
|
2008
|
|
Matías
I. Gaivironsky
|
02/23/1976
|
Administrative
and Financial Manager
|
2011
|
|
Alejandro
Casaretto
|
10/15/1952
|
Regional
Agricultural Manager
|
2008
|
The
remuneration earned by Senior Management for their functions
consists of an amount that is fixed taking into account the
manager's backgrounds, capacity and experience, plus an annual
bonus based on their individual performance and the Group's
results. Members of the senior management participate in defined
contributions and share-based incentive plans that are described in
Note 30, respectively.
The
aggregate compensation to the Senior Management of the Operations
Center in Argentina for the year ended June 30, 2020 amounts to Ps.
15.
Corporate
Service Agreement with IRSA and IRSA CP
Considering that
IRSA, Cresud and IRSA CP have operating overlapping areas, the
Board of Directors considered it convenient to implement
alternatives that allow reducing certain fixed costs of its
activity, in order to reduce its impact on operating results,
taking advantage of and optimizing the individual efficiencies of
each of the companies in the different areas that make up the
operational administration.
For
this purpose, on June 30, 2004, a Framework Agreement for the
Exchange of Corporate Services (“Framework Agreement”)
was signed, between IRSA, Cresud and IRSA CP, which was
periodically modified, the last update being on June 28,
2019.
Under
this Framework Agreement, corporate services are currently provided
in the following areas: Corporate Human Resources, Administration
and Finance, Planning, Institutional Relations, Compliance, Shared
Services Center, Real Estate Business Administration, Directory to
distribute Real Estate, HR Real Estate Business, Security,
Corporate Legal Management, Corporate Environment, Technical
Management Infrastructure and Services, Purchasing and Contracting,
Management and Enabling, Investments, Government Affairs, Hotels,
Fraud Prevention, Bolivar, Proxy, General Management to distribute,
Directory Security.
Under
this agreement, the companies entrusted to an external consultant
the semiannual review and evaluation of the criteria used in the
process of liquidating corporate services, as well as the
distribution bases and supporting documentation used in the
aforementioned process, through the preparation of a semi-annual
report.
It
should be noted that the operation under comment allows Cresud,
IRSA and IRSA CP to maintain absolute independence and
confidentiality in their strategic and commercial decisions, being
the allocation of costs and benefits made on the basis of
operational efficiency and equity, without pursuing individual
economic benefits for each of the companies.
Offices
and Shopping malls spaces leases
The
offices of our President are located at 108 Bolivar, in the
Autonomous City of Buenos Aires. The property has been rented to
Isaac Elsztain e Hijos S.A., a company controlled by some family
members of Eduardo Sergio Elsztain, our president, and to Hamonet
S.A., a company controlled by Fernando A. Elsztain, one of our
directors, and some of its family members.
In
addition, Tarshop, BACS, BHN Sociedad de Inversión S.A., BHN
Seguros Generales S.A. and BHN Visa S.A. rent offices owned by IRSA
CP in different buildings.
Furthermore, we
also let various spaces in our Shopping malls (stores, stands,
storage space or advertising space) to third parties and related
parties such us Tarshop S.A. and BHSA.
Lease
agreements entered into with associates included similar provisions
and amounts to those included in agreements with third
parties.
F-100
Cresud Sociedad Anónima,
Comercial, Inmobiliaria, Financiera y Agropecuaria
Donations
granted to Fundación IRSA and Fundación Museo de los
Niños
Fundación IRSA
is a non-profit charity institution that seeks to support and
generate initiatives concerning education, the promotion of
corporate social responsibility and the entrepreneurial spirit of
the youth. It carries out corporate volunteering programs and
fosters donations by the employees. The main members of
Fundación IRSA's Board of Directors are Eduardo S. Elsztain
(President), Saul Zang (Vice President I), Alejandro Elsztain (Vice
President II) and Mariana C. de Elsztain (secretary). It funds its
activities with the donations made by us, IRSA and IRSA CP.
Fundación Museo de los Niños is a non-profit association,
created by the same founders of Fundación IRSA and its
Management Board is formed by the same members as Fundación
IRSA.
Fundación
Museo de los Niños acts as special vehicle for the development
of "Museo de los Niños, Abasto" and "Museo de los Niños,
Rosario". On October 29, 1999, our shareholders approved the award
of the agreement “Museo de los Niños, Abasto” to
Fundación Museo de los Niños.
On
October 31, 1997, IRSA CP entered into an agreement with
Fundación IRSA whereby it loaned 3,800 square meters of the
area built in the Abasto Shopping Mall for a total term of 30
years, and on November 29, 2005, shareholders of IRSA CP approved
another agreement entered into with Fundación Museo de los
Niños whereby 2,670.11 square meters built in the Shopping
Mall Alto Rosario were loaned for a term of 30 years.
Fundación IRSA has used the available area to house the museum
called “Museo de los Niños, Abasto” an interactive
learning center for kids and adults, which was opened to the public
in April 1999.
Legal
services
The
Group hires legal services from Estudio Zang, Bergel &
Viñes, at which Saúl Zang was a founding partner and sits
at the Board of Directors of the Group companies.
Hotel
services
Our
company and related parties sometimes rent from NFSA and Hoteles
Argentinos S.A. hotel services and conference rooms for
events.
Purchase-Sale
of goods and/or services hiring
In the
normal course of its business and with the aim of make resources
more efficient, in certain occasions purchase and/or hire services
which later sells and/or recover for companies or other related
parties, based upon their actual utilization.
Sale
of advertising space in media
Our
company and our related parties frequently enter into agreements
with third parties whereby we sell/acquire rights of use to
advertise in media (TV, radio stations, newspapers, etc.) that will
later be used in advertising campaigns. Normally, these spaces are
sold and/or recovered to/from other companies or other related
parties, based on their actual use.
Purchase-sale
of financial assets
Cash
surplus are usually invested in several instruments that may
include those issued by related companies acquired at issuance or
from unrelated third parties through transactions in the secondary
market.
Investment
in investment funds managed by BACS
The
Group invests parts of liquid funds in mutual funds managed by BACS
among other entities.
Borrowings
In the
normal course of its activities, the Group enters into diverse loan
agreements or credit facilities between the group’s companies
and/or other related parties. These borrowings accrue interests at
market rates.
Financial
and service operations with BHSA
The
Group works with several financial entities in the Argentine market
for operations including, but not limited to, credit, investment,
purchase and sale of securities and financial derivatives. Such
entities include BHSA and its subsidiaries. BHSA and BACS usually
act as underwriters in Capital Market transactions. In addition, we
have entered into agreements with BHSA, who provides collection
services for our shopping malls.
F-101
Cresud Sociedad Anónima,
Comercial, Inmobiliaria, Financiera y Agropecuaria
San
Bernardo lease
The
Company leased in January 2019 a farm in the Province of
Córdoba owned by San Bernardo de Córdoba S.A. (formerly
Isaac Elsztain e hijos S.C.A), continuing the lease held in August
2015, for a fraction of 12,590 hectares.
The
lease was agreed for 12,590 hectares and the price was set at the
amount of pesos equivalent to 2.5 kg of meat per hectare. The price
of meat will be set taking into account the price per kilo of meat
determined by the I.N.M.L (cattle index of the Liniers Market)
reported on the website of said Market. Additionally, a production
prize equivalent to 15% of the kilos produced in excess of 175,000
was agreed for the total of the existing property.
Consulting
Agreement
In
accordance with the terms of the Consulting Agreement, in force as
from November 7, 1994, and its amendments, CAMSA provides us with
advisory services on matters related to activities and investments
included agricultural, real estate, financial and hotel operations,
among others. An 85% of the capital stock of CAMSA is held by one
of our shareholders and President of our Board of Directors, while
the remaining 15% of the capital stock is owned by our First Vice
President.
Based
on the terms and conditions of the Consulting Agreement, CAMSA
provides us with the following services:
● advise
in relation to investing in all aspects of the agricultural
business, real estate, financial, and hotel operations, among
others, and business proposals;
● acts
on behalf of our company in such transactions, negotiating prices,
terms and conditions and other terms of each transaction;
and
● provides
advisory services on investments in securities related to such
transactions.
As
regards the Consulting Agreement, in consideration for its services
we pay CAMSA an annual fee equal to 10% of our annual net income
after tax. During fiscal year 2020, Ps. 221 was recognized in
results for fee services. During fiscal year 2019, no charge was
recognized. On January 10, 2019, the deferred fees for the
2012-2016 period and the accrued fees from 2017 to June 2018
corresponding to the management agreement signed with CAMSA for the
total amount of Ps. 1,130 were paid. The payment was made
approximately one third in cash, one third with shares of IRSA and
one third with shares of IRSA CP, both owned by the
Company.
The
Consulting Agreement can be revoked by any of the parties upon
prior written notice that should not exceed 60 days. If we revoke
the Consulting Agreement without cause, we will be liable to pay
CAMSA twice the average fee amounts paid for management services
during the two fiscal years preceding such revocation.
The
following is a summary presentation of the balances with related
parties as of June 30, 2019 and 2018:
|
Item
|
06.30.20
|
06.30.19
|
|
Trade and other
payables
|
(326
)
|
(393
)
|
|
Borrowings
|
(209
)
|
(74
)
|
|
Trade and other
receivables
|
1,050
|
1,780
|
|
Investments in
Financial Assets
|
269
|
237
|
|
Total
|
784
|
1,550
|
F-102
Cresud Sociedad Anónima,
Comercial, Inmobiliaria, Financiera y Agropecuaria
The
following is a summary of the results with related parties for the
years ended June 30, 2020, 2019 and 2018:
|
Related party
|
06.30.20
|
06.30.19
|
Description of transaction
|
|
Agro
Uranga S.A.
|
-
|
13
|
Sale
of goods and / or services receivable
|
|
New
Lipstick LLC
|
16
|
14
|
Reimbursement
of expenses receivable
|
|
|
(77
)
|
(63
)
|
Loans
payable
|
|
|
-
|
1,258
|
Loans
granted
|
|
Condor
|
269
|
237
|
Public
companies securities
|
|
|
-
|
21
|
Dividends
receivables
|
|
Other
associates and joint ventures (i)
|
84
|
16
|
Leases
and/or rights of use receivable
|
|
|
8
|
-
|
Leases
and/or rights of use payable
|
|
|
-
|
1
|
Shared-based
compensation receivable
|
|
|
(27
)
|
(11
)
|
Loans
payable
|
|
|
-
|
1
|
Loans
granted
|
|
|
203
|
-
|
Sale
of goods and / or services payable
|
|
|
122
|
11
|
Reimbursement
of expenses
|
|
|
(1
)
|
(6
)
|
Reimbursement
of expenses payable
|
|
Total associates and joint ventures
|
597
|
1,492
|
|
|
CAMSA
and its subsidiaries
|
(190
)
|
-
|
Fees
payable
|
|
|
1
|
43
|
Reimbursement
of expenses receivable
|
|
BHN
Vida
|
(52
)
|
-
|
Reimbursement
of expenses payable
|
|
LRSA
|
-
|
35
|
Leases
and/or rights of use receivable
|
|
|
-
|
364
|
Dividends
receivables
|
|
IRSA
Real Estate Strategies LP
|
116
|
-
|
Reimbursement
of expenses
|
|
Taaman
|
-
|
(17
)
|
Leases
and/or rights of use payable
|
|
PBS
Real Estate Holdings S.R.L
|
472
|
-
|
Financial
operations payable
|
|
Other
related parties (ii)
|
-
|
(93
)
|
Other
liabilities
|
|
|
-
|
3
|
Other
receivables
|
|
|
(53
)
|
-
|
|
|
|
-
|
(3
)
|
Legal
services payable
|
|
|
18
|
-
|
Leases
and/or rights of use receivable
|
|
Total other related parties
|
312
|
332
|
|
|
IFISA
|
6
|
-
|
Financial
operations receivable
|
|
Total Parent Company
|
6
|
-
|
|
|
Directors
and Senior Management
|
(135
)
|
(274
)
|
Fees
payable
|
|
|
4
|
-
|
|
|
Total Directors and Senior Management
|
(131
)
|
(274
)
|
|
|
Total
|
784
|
1,550
|
|
(i)
Includes
Agrofy Global, BHSA, Lipstick, Tarshop, Mehadrin, Austral Gold
Ltd., Cyrsa S.A., NPSF, Puerto Retiro, Shufersal and
Quality.
(ii)
Includes
Estudio Zang, Bergel & Viñes, Lartiyrigoyen, SAMSA and
Museo de los Niños.
|
Related party
|
06.30.20
|
06.30.19
|
06.30.18
|
Description of transaction
|
|
Agrofy
S.A.
|
-
|
3
|
13
|
Management
fees / Directory
|
|
Agro-Uranga
S.A.
|
-
|
-
|
7
|
Sale
of goods and/or services
|
|
Banco
de Crédito y Securitización S.A.
|
51
|
54
|
43
|
Leases
and/or rights of use
|
|
|
(5
)
|
-
|
-
|
Financial
operations
|
|
Condor
|
-
|
-
|
284
|
Financial
operations
|
|
Tarshop
S.A.
|
-
|
59
|
-
|
Leases
and/or rights of use
|
|
ISPRO-MEHADRIN
|
-
|
30
|
296
|
Sale
of goods and/or services
|
|
Other
associates and joint ventures
|
9
|
59
|
67
|
Leases
and/or rights of use
|
|
|
-
|
-
|
9
|
Fees
and remunerations
|
|
|
(131
)
|
30
|
84
|
Corporate
services
|
|
|
37
|
10
|
3
|
Financial
operations
|
|
Total associates and joint ventures
|
(39
)
|
245
|
806
|
|
|
CAMSA
and its subsidiaries
|
(211
)
|
-
|
(1,456
)
|
Management
fee
|
|
Taaman
|
-
|
46
|
397
|
Corporate
services
|
|
Willi-Food
International Ltd.
|
-
|
-
|
364
|
Corporate
services
|
|
Other
related parties (i)
|
(4
)
|
31
|
27
|
Leases
and/or rights of use
|
|
|
(23
)
|
(16
)
|
(23
)
|
Fees
and remunerations
|
|
|
-
|
-
|
11
|
Corporate
services
|
|
|
(4
)
|
(9
)
|
(9
)
|
Legal
services
|
|
|
-
|
3
|
63
|
Financial
operations
|
|
|
-
|
(33
)
|
(33
)
|
Donations
|
|
Total other related parties
|
(242
)
|
22
|
(659
)
|
|
|
IFISA
|
5
|
-
|
156
|
Financial
operations
|
|
Total Parent Company
|
5
|
-
|
156
|
|
|
Directors
|
(30
)
|
(63
)
|
(40
)
|
Compensation
of Directors and senior management
|
|
|
(406
)
|
(546
)
|
(480
)
|
Fees
and remunerations
|
|
Senior
Management
|
(17
)
|
(54
)
|
(64
)
|
Compensation
of Directors and senior management
|
|
Total Directors and Senior Management
|
(453
)
|
(663
)
|
(584
)
|
|
|
Total
|
(729
)
|
(396
)
|
(281
)
|
|
F-103
Cresud Sociedad Anónima,
Comercial, Inmobiliaria, Financiera y Agropecuaria
(i)
Includes Estudio Zang, Bergel & Viñes, Isaac Elsztain e
Hijos S.C.A., San Bernando de Córdoba S.A., Fundación
IRSA, Hamonet, BHN Sociedad de Inversión, BACS Administradora
de Activos S.A., BHN Seguros Generales S.A. and BHN Vida
S.A.
The
following is a summary of the transactions with related parties for
the years ended June 30, 2020 and 2019:
|
Related party
|
06.30.20
|
06.30.19
|
Description of transaction
|
|
Manibil
|
87
|
31
|
Irrevocable
contributions
|
|
Uranga
Trading S.A.
|
-
|
32
|
Irrevocable
contributions
|
|
Puerto
Retiro
|
17
|
27
|
Irrevocable
contributions
|
|
Quality
|
47
|
73
|
Irrevocable
contributions
|
|
Total contributions
|
151
|
163
|
|
|
Uranga
Trading S.A.
|
-
|
12
|
Dividends
paid
|
|
Total dividends paid
|
-
|
12
|
|
|
Agro-Uranga
S.A.
|
25
|
28
|
Dividends
received
|
|
Shufersal
|
400
|
663
|
Dividends
received
|
|
Nave
by the sea
|
-
|
47
|
Dividends
received
|
|
Banco
Hipotecario
|
-
|
113
|
Dividends
received
|
|
Condor
|
32
|
114
|
Dividends
received
|
|
Emco
|
16
|
86
|
Dividends
received
|
|
La
Rural S.A.
|
-
|
433
|
Dividends
received
|
|
Manaman
|
-
|
106
|
Dividends
received
|
|
Mehadin
|
-
|
141
|
Dividends
received
|
|
Nuevo
Puerto Santa Fe S.A.
|
38
|
14
|
Dividends
received
|
|
Gav-Yam
|
1,334
|
-
|
Dividends
received
|
|
Total dividends received
|
1,845
|
1,745
|
|
|
TGLT
S.A.
|
1,394
|
-
|
Compra
y canje de acciones
|
|
Gav-Yam
|
1,334
|
-
|
Dividends
received
|
|
Total other transactions
|
2,728
|
-
|
|
33.
Cost
of goods sold and services provided
|
Description
|
Cost of sales and services from agricultural business
(i)
|
Cost of sales and services from sales and services from urban
properties and investment business (ii) (iii)
|
Total as of 06.30.20
|
Total as of 06.30.19
|
Total as of 06.30.18
|
|
Inventories at the beginning of the period / year
|
7,164
|
10,170
|
17,334
|
29,624
|
34,392
|
|
Adjustment
previous periods (IFRS 15 and 9)
|
-
|
-
|
-
|
(8,325
)
|
-
|
|
Initial
recognition and changes in the fair value of biological assets and
agricultural products at the point of harvest
|
2,038
|
-
|
2,038
|
1,275
|
689
|
|
Changes
in the net realizable value of agricultural products after
harvest
|
657
|
-
|
657
|
(43
)
|
43
|
|
Deconsolidation
|
-
|
(155
)
|
(155
)
|
(637
)
|
(14,360
)
|
|
Capitalized
finance costs
|
-
|
12
|
12
|
17
|
24
|
|
Currency
translation adjustment
|
(816
)
|
8,262
|
7,446
|
(1,935
)
|
12,290
|
|
Acquisition
for business combination
|
-
|
-
|
-
|
-
|
848
|
|
Transfers
|
(355
)
|
98
|
(257
)
|
149
|
(700
)
|
|
Harvest
|
10,639
|
-
|
10,639
|
8,009
|
6,197
|
|
Acquisitions
and classifications
|
8,274
|
57,605
|
65,879
|
66,811
|
49,286
|
|
Consume
|
(2,610
)
|
-
|
(2,610
)
|
(4,864
)
|
343
|
|
Disposals
due to sales
|
-
|
(19
)
|
(19
)
|
-
|
(23
)
|
|
Disposals due to advance
in work in
progress
|
-
|
264
|
264
|
-
|
-
|
|
Expenses
incurred
|
3,271
|
-
|
3,271
|
2,613
|
2,637
|
|
Inventories at the end of the period / year
|
(6,545
)
|
(11,855
)
|
(18,400
)
|
(17,334
)
|
(29,624
)
|
|
Costs as of 06.30.20
|
21,717
|
64,382
|
86,099
|
-
|
-
|
|
Costs as of 06.30.19
|
15,942
|
59,418
|
-
|
75,360
|
-
|
|
Costs as of 06.30.18
|
12,909
|
49,133
|
-
|
-
|
62,042
|
(i) Includes
biological assets (see Note 13.)
(ii) Includes
trade properties (see Note 11).
F-104
Cresud Sociedad Anónima,
Comercial, Inmobiliaria, Financiera y Agropecuaria
34.
Foreign
currency assets and liabilities
Book
amounts of foreign currency assets and liabilities are as
follows:
|
|
Amount of foreign currency (2)
|
Prevailing exchange rate (1)
|
Total as of 06.30.20
|
Total as of 06.30.19
|
|
Assets
|
|
|
|
|
|
Trade and other receivables
|
|
|
|
|
|
US
Dollar
|
66
|
70.26
|
4,617
|
4,584
|
|
Euros
|
11
|
78.87
|
880
|
196
|
|
Trade and other receivables related parties
|
|
|
|
|
|
US
Dollar
|
4
|
70.26
|
299
|
217
|
|
Total Trade and other receivables
|
|
|
5,796
|
4,997
|
|
Investment in financial assets
|
|
|
|
|
|
US
Dollar
|
55
|
70.26
|
3,870
|
5,428
|
|
Pounds
|
1
|
86.90
|
78
|
69
|
|
Total Investment in financial assets
|
|
|
3,948
|
5,497
|
|
Derivative financial instruments
|
|
|
|
|
|
US
Dollar
|
1
|
70.26
|
82
|
61
|
|
Total Derivative financial instruments
|
|
|
82
|
61
|
|
Cash and cash equivalents
|
|
|
|
|
|
US
Dollar
|
221
|
70.26
|
15,542
|
17,064
|
|
Euros
|
20
|
78.87
|
1,549
|
103
|
|
Chilean
Pesos
|
-
|
-
|
-
|
1
|
|
Total Cash and cash equivalents
|
|
|
17,091
|
17,168
|
|
Total Assets
|
|
|
26,917
|
27,723
|
|
|
|
|
|
|
|
Liabilities
|
|
|
|
|
|
Trade and other payables
|
|
|
|
|
|
US
Dollar
|
208
|
70.46
|
14,687
|
11,272
|
|
Euros
|
3
|
87.36
|
305
|
51
|
|
Total Trade and other payables
|
|
|
14,992
|
11,323
|
|
Borrowings
|
|
|
|
|
|
US
Dollar
|
1,308
|
70.46
|
92,189
|
79,458
|
|
Total Borrowings
|
|
|
92,189
|
79,458
|
|
Derivative financial instruments
|
|
|
|
|
|
US
Dollar
|
4
|
70.46
|
288
|
96
|
|
Total Derivative financial instruments
|
|
|
288
|
96
|
|
Total Liabilities
|
|
|
107,469
|
90,877
|
(1)
Exchange rate as of June 30, of each year according to Banco
Nación Argentina records.
(2)
Considering foreign currencies those that differ from each
Group’s functional currency at each year-end.
(3)
The Group uses derivative instruments as complement in order to
reduce its exposure to exchange rate movements (see Note
15).
35.
Groups
of assets and liabilities held for sale
As
mentioned in Note 4, the investment in Israir has been reclassified
to "Group of assets and liabilities held for sale".
Pursuant to IFRS 5,
assets and liabilities held for sale have been valued at the lower
between their carrying value and fair value less cost of sale.
Given some assets’ carrying value was higher, an impairment
loss of Ps. 465 has been recorded for the year ended June 30,
2017.
The
following table shows the main assets and liabilities classified as
held for sale:
|
|
06.30.20
|
06.30.19
|
|
Property, plant and
equipment
|
36,718
|
6,449
|
|
Intangible
assets
|
1,370
|
136
|
|
Investments in
associates
|
224
|
597
|
|
Deferred
income tax assets
|
814
|
290
|
|
Income tax
credit
|
3
|
-
|
|
Inventories
|
355
|
-
|
|
Trade
and other receivables
|
2,621
|
3,003
|
|
Cash and cash
equivalents
|
1,711
|
1,023
|
|
Total
group of assets held
for
sale
|
43,816
|
11,498
|
|
Trade and other
payables
|
10,392
|
4,845
|
|
Salaries and social
security liabilities
|
498
|
-
|
|
Employee
benefits
|
386
|
290
|
|
Deferred income tax
liability
|
1,981
|
51
|
|
Provisions
|
12
|
-
|
|
Borrowings
|
10,380
|
2,951
|
|
Total
group of liabilities held for
sale
|
23,649
|
8,137
|
|
Total
net
financial assets held for
sale
|
20,167
|
3,361
|
F-105
Cresud Sociedad Anónima,
Comercial, Inmobiliaria, Financiera y Agropecuaria
36.
Results
from discontinued operations
As
mentioned in Note 4., the investments in Israir, Ispro and others
have been reclassified to "Group of assets and liabilities held for
sale".
The
following table shows the main assets and liabilities classified as
held for sale:
|
|
06.30.20
|
06.30.19
|
06.30.18
|
|
|
Revenues
|
21,921
|
26,148
|
175,194
|
|
|
Costs
|
(17,950
)
|
(17,336
)
|
(127,564
)
|
|
|
Gross
profit
|
3,971
|
8,812
|
47,630
|
|
|
Net gain
from fair value adjustment of
investment properties
|
-
|
3,990
|
5,529
|
|
|
General and
administrative
expenses
|
(1,198
)
|
(1,212
)
|
(3,299
)
|
|
|
Selling
expenses
|
(977
)
|
(1,049
)
|
(32,990
)
|
|
|
Other operating
results, net
(i)
|
17,554
|
250
|
24,894
|
|
|
Profit
from operations
|
19,350
|
10,791
|
41,764
|
|
|
Share of profit of
associates and joint
ventures
|
150
|
289
|
320
|
|
|
Profit
before financial results
and income
tax
|
19,500
|
11,080
|
42,084
|
|
|
Financial
income
|
191
|
460
|
466
|
|
|
Finance
costs
|
(1,720
)
|
(2,651
)
|
(2,901
)
|
|
|
Other financial
results
|
115
|
(24
)
|
(102
)
|
|
|
Financial
results,
net
|
(1,414
)
|
(2,215
)
|
(2,537
)
|
|
|
Profit
before income
tax
|
18,086
|
8,865
|
39,547
|
|
|
Income
tax
|
(1
)
|
(1,725
)
|
(3,106
)
|
|
|
Profit
for the period from
discontinued
operations
|
18,085
|
7,140
|
36,441
|
|
|
|
|
|
|
|
|
Profit
for the period from discontinued operations
attributable to:
|
|
|
|
|
|
Equity
holders of the parent
|
6,297
|
1,538
|
15,598
|
|
|
Non-controlling
interest
|
11,788
|
5,602
|
20,843
|
|
|
|
|
|
|
|
|
Profit
per share
from discontinued operations
attributable to equity holders of the parent:
|
|
|
|
|
|
Basic
|
12.80
|
3.15
|
31.40
|
|
|
Diluted
|
12.29
|
3.02
|
30.21
|
|
(i)
Includes the
remediation, at fair value, of the residual holding in
Gav-Yam.
37.
Economic
framework of the Group’s business
The
Company does business in a complex framework due to the
macroeconomic conditions, whose main variables have recently shown
high volatility, and also due to regulatory, social and political
conditions, both at a national and international
level.
Its
operating income may be affected by the fluctuations in the
inflation rate and in the exchange rate at which the peso is
converted into other currencies, mainly the US dollar, the
variations in interest rates, which have an impact on the cost of
capital, the changes in governmental policies, capital controls and
other local and international political or economic
events.
In
December 2019, a novel strain of coronavirus (SARS-COV-2) causing a
severe acute respiratory syndrome (“COVID-19”) was
reported to have surfaced in Wuhan, China. COVID-19 has since
spread across the world, including Argentina, and on March 11,
2020, the World Health Organization declared COVID-19 a pandemic.
By early November approximately [1,284,519] cases of infections had
been confirmed in Argentina. In response, countries have adopted
extraordinary measures to contain the spread of the virus,
including imposing travel restrictions and closing borders,
requiring closures of non-essential businesses, instructing
residents to practice social distancing, issuing stay-at-home
orders, implementing quarantines and similar actions. The ongoing
pandemic and these extraordinary government measures are disrupting
global economic activity and resulting in significant volatility in
global financial markets. According to the International Monetary
Fund (“IMF”), the global economy has recently entered
into a recession.
The
Argentine government has adopted multiple measures in response to
the COVID-19 pandemic, including a nationwide mandatory lockdown
that began on March 19, 2020 that has been extended several times,
most recently through November 8, 2020. The government has also
required during the last months the mandatory shutdown of
businesses not considered essential. Finally, on November 6, 2020,
the government announced the end of the mandatory lockdown for the
AMBA (the “Área Metropolitana de Buenos Aires or
“AMBA”) and the beginning of the new phase of social
distancing. However, Coronavirus cases have risen over the last few
months in several regions of the world and the rate of infections
is still increasing. Lockdowns return to Europe as cases rise
again. Spain, France and the UK have all recorded more than one
million cases, and several others are seeing their highest number
of new infections since the start of the pandemic.
F-106
Cresud Sociedad Anónima,
Comercial, Inmobiliaria, Financiera y Agropecuaria
These measures have significantly affected
Argentine companies, which have faced drops in income and the
deterioration of their flow of payments. In this context, the
Argentine Government announced several actions intended to tackle
the financial crisis of the companies adversely affected by the
COVID-19 pandemic. In addition to the stagnation of
the
Argentine economy, there is an international crisis caused by the
COVID-19 pandemic. In view of this scenario, a severe downturn in
the Argentine economy is expected.
After
several negotiations between the Argentine Government and the
bondholders, the Argentine Government announced the execution of an
agreement in principle with the main groups of bondholders in order
to avoid the default. On August 28, 2020, the Government informed
that the holders of 93.55% of the aggregate outstanding principal
amount of all bonds have accepted a debt exchange and, on August
31, 2020, the Argentine Government obtained the consents required
to exchange and/or amend 99.01% of the aggregate outstanding
principal amount of all series of eligible bonds. As of the date of
these financial statements, the new bonds are already being traded
on the market.
However, the
Government still faces the challenge of arriving at a successful
renegotiation of the debt with the IMF. A favorable outcome for
Argentina and the restructuring of its debt with the IMF would have
a positive impact on the Argentine economy in the mid- and
long-term. On the contrary, failure to reach an agreement with
foreign private creditors might lead Argentina to default on its
sovereign debt and, as a result, this situation may trigger
restrictions on the companies’ ability to obtain new
financing.
At a
local level, the following circumstances may be noted:
●
In June 2020, the
Estimador Mensual de Actividad Económica (“EMAE”)
reported by the National Institute of Statistics and Census
(Instituto Nacional de Estadísticas y Censos or INDEC)
recorded a (12.3)% variation compared to the same month in 2019 and
a (7.4)% variation compared to the previous month.
●
The market
expectations survey prepared by the Central Bank in July 2020
called Relevamiento de Expectativas de Mercado (“REM”)
forecasts that the retail inflation rate for 2020 will be 39.5%.
The REM analysts foresee a (12.5)% decrease in the real GDP for
2020. In turn, they foresee a recovery in the economy for 2021 that
will grow up to 5.6%. The economy is expected to grow during the
third quarter of 2020 as the effects of the pandemic are perceived
as transitory and economic recovery is expected to start
soon.
●
The year-over-year
inflation rate as of June 30, 2020 was 42.8%.
●
From July 2019 to
June 2020, the peso depreciated 66% compared to the US dollar at
the average wholesale exchange rate quoted by Banco de la
Nación Argentina. In view of the foreign exchange restrictions
in force since 2019, the gap between the official peso/US dollar
exchange rate and the peso/US dollar exchange rate offered in the
black market is almost 75%. This has an impact on the level of
economic activity and detrimentally affects the reserves of the
Argentine Central Bank. In addition, the current foreign exchange
restrictions or those that may be imposed in the future may impair
the Company’s ability to access the Sole Free FX Market
(Mercado Único Libre de Cambio or MULC) to purchase the
currency required to meet its financial obligations.
On
September 15, 2020, the Argentine Central Bank issued Communication
“A” 7106 which establishes, among other things, that
entities with principal maturities falling due between October 15,
2020 and March 31, 2021 related to the issuance of foreign-currency
denominated publicly-registered debt securities in Argentina by
private sector clients or by the entities themselves, must submit
to the Argentine Central Bank a refinancing plan based on the
following criteria: (a) the net amount for which access to the
foreign exchange is granted within the original terms must not
exceed 40% of the principal amount due, and (b) the remaining
principal amount must have been refinanced through new foreign debt
with an average life of at least 2 years. Therefore, the Company is
analyzing the impact of this provision in order to comply with the
Central Bank’s requirements in due time and manner, if
applicable.
Series
I Non-convertible Notes having a par value of USD 181,518,707 and
other bank debts shall become due on November 15,
2020.
COVID-19 Pandemic
As it
arises from the ‘Economic framework of the Group’s
business’ note, the COVID-19 pandemic is having an adverse
impact on both the global and the Argentine economy and the
Company’s business. Although the COVID-19 pandemic has had an
impact nationwide on the business conducted by the Company, it is
still too early to assess the total scope of its
impact.
Below
follows a description of the expected effects of the COVID-19
pandemic on the Company as of the date of these financial
statements:
Agricultural business
The
agricultural business of Cresud and its subsidiaries in Brazil,
Paraguay and Bolivia continued to operate relatively normally;
since the agricultural activity has been considered an essential
activity in the countries where the Company operates. In any case,
the effect of Covid-19 could cause changes in demand on a global
scale and affect the prices of commodities in the international and
local markets in the short term.
F-107
Cresud Sociedad Anónima,
Comercial, Inmobiliaria, Financiera y Agropecuaria
Urban properties and investments business
Operations Center in Argentina
●
As a consequence of
the preventive and mandatory social isolation, shopping malls
across the country have been closed since March 20, 2020. Only
those stores engaged in essential activities remain open such as
pharmacies, supermarkets and banks whereas some food and clothing
stores are offering delivery services and selling products on
WhatsApp. In May and June, these measures were relaxed and certain
activities were resumed in some marketplaces in the Argentine
provinces such as Salta, Mendoza, Santa Fe and Córdoba.
Actually, the shopping malls Alto Noa, Mendoza Plaza, Alto Rosario,
La Ribera and Córdoba Shopping reopened under strict health
and safety protocols providing for reduced shopping hours, social
distancing and access controls. The shopping mall in Neuquén
was reopened in July 2020 whereas the Distrito Arcos shopping mall,
a premium open-air outlet in the City of Buenos Aires, was reopened
early in August 2020. As of this date, 44% of the square meters of
the Company’s Shopping Malls are open. Nevertheless, the
uncertainty posed by this situation may cause the closing of stores
that have already opened.
●
As a result of the
shopping mall closings, the Company has decided to differ the
invoicing and collection of the Monthly Guaranteed Amount (Valor
Mensual Asegurado or V.M.A.) until September 30, 2020, with some
exceptions, and not to collect the collective promotion fund during
such period in an attempt to prioritize its long-term relationship
with the lessees. Additionally, an increase in the delinquency rate
of some lessees has been noticed. The ensuing impact on shopping
malls has been a 30.5% decrease in income from rentals and services
compared to the previous fiscal year and an 83% decrease compared
to the last quarter of the previous fiscal year. Moreover, the
allowance for bad debts is Ps. 305 million for the fiscal year
ended June 30, 2020 and Ps. 187 million for the last quarter of the
fiscal year.
●
As regards the
rental of offices, although most of the lessees are working
remotely, they are open under strict health and safety protocols.
As of this date, the Company has not experienced any collection
difficulties.
●
La Rural, the
Buenos Aires and Punta del Este Convention Centers and the DIRECTV
Arena stadium, which are owned directly or indirectly by the
Company, are also closed since March 20. All scheduled conferences
have been suspended, most of the fairs and conventions were
postponed, and most of the scheduled shows in the DIRECTV Arena
stadium have been cancelled. The reopening date of these premises
is uncertain as well as the future calendar of fairs, conventions
and shows.
●
In order to reduce
the risk of the virus spreading and protect public health, the
Libertador hotels in the City of Buenos Aires and the Llao Llao
hotel in the province of Río Negro are temporarily closed and
it is still uncertain when they will reopen and go back to normal
operations. As regards Hotel Intercontinental in the city of Buenos
Aires, it is operating only under a contingency and emergency plan.
The impact of all the above on these financial statements has been
a 32% decrease in income compared to the previous fiscal year and a
100% decrease compared to the same quarter of the previous
year.
Operation Center Israel
●
The COVID-19
pandemic has had a negative impact on the market valuation of IDBD,
DIC and operating subsidiaries due to the sharp fall in prices. The
mandatory shutdown lasted almost 10 days and was then relaxed under
strict health and safety protocols. The effects on the operating
businesses have been diverse:
o as regards
supermarkets (Shufersal) and agriculture (Mahadrin), the impact has
been positive in the short-term as these are considered essential
activities;
o as concerns
telecommunications (Cellcom), in particular the international
roaming service, there has been a decrease in consumption keyed to
a significant drop in international tourism. Cellcom has taken
actions to reduce such negative effects by cutting back on expenses
and investments during the coronavirus crisis period, including
staff downsizing measures.
o In PBC, the
activities and income from real estate transactions have been
adversely affected by the economic situation and the bans on
circulation. Consequently, PBC’s cash flow is expected to be
somehow vulnerable although it is not possible to estimate as of
this date to which extent PBC has made an assessment of its
investment properties showing signs of impairment and, as a
consequence, a reduction in the value of its properties of Ps.
2,989 has been accounted for.
As
regards the Group’s financial debt:
●
IRSA must honor the
following maturities within the next 12 months: Series II
Non-convertible Notes, having a par value of US$ 71.4, due on July
20, 2020; Series II Non-convertible Notes, having a par value of
CLP 31,502.6 (equivalent to US$ 41 approximately), due on August 6,
2020; Series I Non-convertible Notes, having a par value of US$
181.5, due on November 15, 2020, Series III Non-convertible Notes,
having a par value of Ps. 354 (equivalent to US$5), due on February
21, 2021, Series IV Non-convertible Notes, having a par value of
US$ 51.3, due on May 21, 2021 and a bank debt in an amount
equivalent to US$14.3.
F-108
Cresud Sociedad Anónima,
Comercial, Inmobiliaria, Financiera y Agropecuaria
●
Our subsidiary,
IRSA CP, must honor the maturity of its Series IV Non-convertible
Notes, having a par value of US$ 140, which will become due in
September 2020 and a bank debt of US$ 23.
●
The short-term
financial debts of our subsidiaries, IDBD-DIC, have a nominal value
of US$ 202 (including non-convertible notes and borrowing from
banks and financial entities). It should be noted that such
commitments have no effects on IRSA because such indebtedness is
without recourse against IRSA and is not guaranteed by IRSA’s
assets as described in Note 1 to these interim consolidated
condensed financial statements.
In May
and July 2020, IRSA issued US$ 105.4 non-convertible notes in the
local market intended to refinance its short-term debt. The
proceeds of such issuances were used by the Company to repay its
Non-convertible Notes due on July and August 2020.
The
alternatives that the Company is considering to refinance the
repayment of its Non-convertible Notes due in November 2020,
February 2021 and June 2021 are a capital increase in an
approximate amount of US$ 70 / US$ 100 resolved at the annual
shareholders’ meeting held in October 30, 2019 and obtaining
financing in the domestic or international capital markets through
new issues of debt securities or liability management transactions
in the range of US$ 40 and US$ 100, in addition to the transactions
already conducted in May and July. In addition, IRSA has a
long-standing relationship with banks of the local financial system
that may supplement and diversify the Company’s sources of
financing in addition to capital market financing. Moreover, as
part of our strategy, the Company may sell a portion of its
portfolio of assets (hotels and/or land reserves and offices
through its subsidiary, IRSA CP) to generate additional
funds.
Lastly,
IRSA CP has granted IRSA a three-year credit facility up to US$
180, of which US$ 53.4 were used by IRSA on June 30, 2020. IRSA may
still use the remaining balance of such facility and receive
dividends from such company in its capacity as controlling
shareholder of 80.65% of its capital stock. It should be noted that
IRSA CP’s cash and cash equivalents (including current
financial investments) as of June 30, 2020 amount to US$ 155 and,
following the fiscal year-end, it sold office assets worth US$
128.6. Moreover, it is working on different financing alternatives
in pesos with local banks (syndicated loans and/or bilateral loans)
in estimated amounts equivalent to USD 50 and USD 100 to discharge
its short-term obligations and it may eventually resort to debt
transactions in the local capital market.
The
final effects of the coronavirus outbreak and its impact on the
country’s economy is unknown and cannot be reasonably
foreseen. Nevertheless, although it has had significant effects in
the short-run, it is not expected that they will affect the
continuation of business. Although there are short-term economic
impacts, it is foreseen that the Company will be able to continue
meeting its financial commitments in the following twelve
months.
The
Company is closely monitoring the situation and taking all
necessary actions to preserve human life and the Company’s
businesses.
38.
Subsequent
events
Sale of Bananal Farmland
In July
2020, Brasilagro sold 2,160 hectares (of which 1,714 hectares were
useful for crop production) of the “Bananal” farmland
(municipality Magalhães - BA).The establishment was in groups
of assets held for sale due to a disagreement involving the tenant
at the time of sale. The previous conditions recognized in the
Purchase Agreement were fully met on July 31, 2020 after receipt of
R $ 5.5 (equivalent to Ps. 84). The amount of the sale was set at
BRL 28 (equivalent to Ps. 392). The face value of the sale is BRL
7.5 (equivalent to Ps. 112) was received. It is not expected to
obtain a result from this operation since the asset was valuated at
its fair value.
Issuance of Cresud Notes
On
August 31, 2020, after the close of the fiscal year, the
seventeenth Series of Notes public tender was carried out, within
the framework of the Program approved by the Shareholders Meeting,
for up to USD 500, being the liquidation date on June 9, 2020. The
main characteristics of the issuance are detailed
bellow:
- Series XXX:
denominated in USD and payable in ARS at the applicable exchange
rate, as defined in the issuance documents, with a nominal value of
USD 25.0, maturing 36 months from the date of issuance. At a fixed
rate of 3.5%, maturing 18 months from the date of issuance with
quarterly payments and principal expiring at maturity. The issue
price was 100.0% of Nominal Value.
F-109
Cresud Sociedad Anónima,
Comercial, Inmobiliaria, Financiera y Agropecuaria
●
Sale of floors in the Boston Tower
On July
15, 2020, IRSA CP entered into a preliminary sales agreement (with
delivery of possession) with respect to a medium-height floor in
the Boston tower located at Della Paolera 265, Catalinas district,
City of Buenos Aires, covering a total area of approximately 1,063
sq. meters and 5 parking lots located in the building. The price of
the transaction was Ps. 477.7 (US$ 6.7), which has been paid in
full.
On
August 26, 2020, IRSA CP executed a preliminary sales agreement
(with delivery of possession) with respect to 5 floors in the
Boston tower located at Della Paolera 265, Catalinas district, City
of Buenos Aires, covering a total area of approximately 6,235 sq.
meters and 25 parking lots located in the building. The price of
the transaction was Ps. 2,562 million (US$ 34.7 million), which has
been paid in full.
Bouchard Sale
On July
30, 2020, IRSA CP sold the entire “Bouchard 710”
building, located in the Plaza Roma district of the City of Buenos
Aires. The tower has a gross leasable area of 15,014 sq. meters
divided into 12 floors for office use and 116 parking lots. The
price of the transaction was approximately Ps. 6,300 million (US$
87 million), which has been paid in full.
Issuance of IRSA Non-convertible Notes
On
July 21, 2020, subsequently to the closing of the fiscal year, the
Company issued USD 38.4 Non-convertible Notes in the local market
through the following instruments:
●
Ps.
335.2 million (equivalent to USD 4.7 million) Series VI NCNs
denominated and payable in Argentine pesos at a variable rate
(Private Badlar) + 4.0%, with interest accruing on a quarterly
basis. The principal amount is repayable in two installments: the
first one -equal to 30% of the par value of the notes- payable on
the date that is 9 (nine) months after the Issue and Settlement
Date and the second installment -equal to 70% of the par value of
the notes- payable on the relevant due date, i.e. July 21, 2021.
Notes were issued at 100% of their par value.
●
US$
33.7 million Series VII NCNs denominated in US$ and payable in
Argentine pesos at the applicable exchange rate, at a fixed 4.0%
rate, with interest accruing on a quarterly basis. Repayment of
capital is due on January 21, 2021. Notes were issued at 100% of
their par value. The proceeds will be used to refinance short-term
indebtedness.
Payment of non-convertible notes
On
July 20, 2020, the Company paid the twentieth interest installment
and the principal installment of the US$ 75 Series II
Non-convertible Notes issued on July 20, 2010.
On
August 6, 2020, the Company paid the second interest installment
and the principal installment of the US$ 47 Series II
Non-convertible Notes issued on August 6, 2019.
Payment of IRSA CP’s Series IV Non-convertible
Notes
On
September 14, 2020, the aggregate principal amount of the Series IV
Non-convertible Notes in the amount of Ps. 10,381 (US$ 140) and
interest accrued as of such date in the amount of Ps. 134 (US$ 1.8)
were paid.
Sale of remaining shares in Shufersal
On July
22, 2020, DIC accepted a private investors’ offer to purchase
its aggregate shares in Shufersal, representing 26% of the capital
stock, in the amount of NIS 1,456 million (NIS 23.5 per share).
After the sale, DIC does no longer have any equity interest in such
company.
Cellcom
On
August 13, 2020, the Israeli Ministry of Communications approved
the acquisition of Golan by Cellcom subject to certain conditions.
It is worth noting that by such date the Antitrust Commissioner had
already granted clearance.
On
August 26, 2020, Cellcom informed that it completed the acquisition
of Golan in consideration for approximately NIS 545 million in the
aggregate, plus the cash equivalents held by Golan as of the
closing date less its financial debts, which were paid in full by
Cellcom to the Golan shareholders in cash. See information on the
agreement in note 4 to these financial statements.
F-110
Cresud Sociedad Anónima,
Comercial, Inmobiliaria, Financiera y Agropecuaria
Sale of a subsidiary owned by Elron
On July
16, 2020, Elron, through the investment held by it in CartiHeal
(2009) Ltd. (a company in which Elron holds a 27% interest approx.)
("CartiHeal"), entered into an agreement with Bioventus LLC (an
international company engaged in the manufacture of medical
devices, "Bioventus"), which is a current shareholder of CartiHeal,
providing as follows:
●
Bioventus will make an additional US$ 15 – US$ 20 investment
in CartiHeal, at a company value of USD 180.
●
Bioventus will be granted a call option to buy 100% of the shares
in CartiHeal.
●
CartiHeal will have a put option to sell 100% of its capital stock
to Bioventus.
The
call option may be exercised at any time after the investment is
made. The put option may be exercised subject to pivotal clinical
trial success, which includes the successful attainment of certain
goals of the secondary trial, subject to obtaining the FDA’s
approval of the Agili-C device of CartiHeal, which fully coincides
with the success of the trial.
Sale of Clal Shares
On June
28 and July 6, 2020, IDBD sold 4,791,618 shares in Clal held by it
through swap transactions, at an average price of NIS 30/share,
representing 7.1% of the capital stock.
In
addition, on September 3, 2020, IDBD sold 2,376,527 shares in Clal,
representing 3.5% of its capital stock, at an average price of NIS
32.475/share, amounting to NIS 77.2 in the aggregate.
As a
consequence of such transactions, IDBD’s current stake in
Clal represents 4.99% of its capital stock and, as a result, IDBD
is no longer regarded as an interested party in Clal under the
Israeli Securities Regulations.
Increase in the interest held in PBC
In July
2020, DIC acquired 1.4% of PBC capital stock in consideration for
NIS 18.
DIC notes repurchase plan
On
August 20, 2020, DIC’s Board of Directors approved the
extension of its notes repurchase plan (Series F and J) until
December 31, 2020 up to NIS 300. Repurchases shall be made on the
basis of market opportunities and the scope thereof shall be
determined by the management.
IDBD financing agreement
On
August 30, 2019, the Company's Board of Directors approved the
signing of a commitment with Dolphin, to make capital contributions
for up to the amount of NIS 210, according to the schedule of
commitments assumed by Dolphin between September 2019 and September
2021 with IDBD.
Dolphin
undertook to make contributions to IDBD subject to the occurrence
of certain events in accordance with the following scheme: (i) NIS
70 to be contributed immediately; (ii) NIS 70 to be contributed
until September 2, 2020 and (iii) NIS 70 to be contributed until
September 2, 2021. According to Dolphin's agreement with IDBD, said
contributions will have the character of capital contributions
resulting in the issuance of new IDBD shares in favor of the parent
company or may be granted in the form of a subordinated
loan.
On
September 7, 2020, the Company communicated that, with respect to
the capital contributions committed for September 2, 2020 and 2021,
it considers that there are doubts regarding the fulfillment of the
pre-conditions established for making such contributions.
Accordingly, it has resolved not to make the contribution
corresponding to 2020.
Exchange Offer - Issuance of Series XXXI and XXXII
Notes
As a consequence of the new
restrictions on access to the Foreign Exchange Market, we launched
an exchange offer on our Series XXIV Notes due on November 14, 2020
(the “Existing Notes”). The abovementioned restrictions
to obtain United States dollars established under Communication
“A” 7,106 apply for the purchase of foreign currency
intended for repayment of principal maturing between October 15,
2020 and March 31, 2021 in respect of the issuance of foreign
currency-denominated debt securities registered with official
registries in Argentina by private sector clients or the entities
themselves. For such purposes, all Eligible Holders (the
“Eligible Holders”) were invited by us to Exchange the
Existing Notes, Series XXIV Notes.
F-111
On October 23, 2020, we announced Notes to be
issued in exchange for the Existing Notes, Series XXIV Notes, as
applicable, pursuant to the terms and methods for the exchange of
the Existing Notes. The exchange offer consisted on the
following
two options for the
bondholders terms:
(i)
A repayment of
principal amount of Existing Notes tendered for Exchange, in cash
in United States Dollars, in an amount resulting from dividing USD
29,442,160,00 by the total number of Existing Notes tendered in
Exchange for the Series XXXI, always provided such quotient is less
than or equal to USD 1 whereas if such quotient is higher than USD
1 the consideration shall be equal to USD 1 (“
Principal
Repayment
”);which would represent at least 40% of the
amount of the Existing Notes tendered and the remaining amount
until reaching USD 1 of each USD 1 of the Existing Notes tendered
for Exchange, in Series XXXI Notes. Series XXXI Notes to be issued
at a fixed nominal interest rate of 9.00% per annum and maturing 3
(three) years after the Date of Issue and Settlement, with annual
repayments, denominated and payable in United States Dollars, in a
principal amount up to USD 44,163,240 to be paid in kind by
tendering for exchange of the Existing Notes.
In all cases, the sum
of (i) and (ii) shall be the equivalent to USD 1 per each USD 1 of
Existing Notes tendered for Exchange.; and
(ii)
A par for par exchange of notes
Series XXXII for each Existing Notes presented to the
Exchange.
Series XXXII Notes to be issued at a nominal fixed
interest rate of 9% per annum, maturing 24 (twenty-four) months
after the Date of Issue and Settlement, denominated and payable in
a principal amount up to USD 44,163,240, to be paid in kind by
tendering for exchange the Existing Notes.
For both options
interest accrued on the Existing Notes until the Date of Settlement
of the Exchange Offer will be paid in cash:
Moreover, the Company offers an early exchange
consideration equivalent to USD 0.02 per each USD 1 of Existing
Notes tendered and accepted in exchange for Series XXXII Notes
prior to the deadline to receive the consideration for early
acceptance (the “Early Exchange Consideration”). Such
consideration shall be paid in Pesos on the Date of Issue and
Settlement as per the exchange rate reported by Communication
“A” 3,500 of the Central Bank of Argentina on the
business day next preceding the Exchange Expiration Date. For the
purposes of receiving the Early Exchange Consideration, the
Eligible Holders shall tender the Existing Notes in their
possession on or before the Deadline to Receive the Early Exchange
Consideration.
On November 2, 2020, the
Company announced the results of the Early Bird of Series
XXXII
Notes. As of October 30, 2020,
deadline for accessing the Early Bird, exchange orders have been
submitted for a total amount equivalent to USD
31,820,655
for Series
XXXII
Notes.
All existing notes presented
on or before the above mentioned deadline have been accepted by the
Company and will be eligible to receive the consideration on the
Issue and Settlement Date
.
As timely announced, the
Exchange Offer would expire on November 5, 2020, unless it is
extended by the Company. Finally, on November 6, 2020, the Company
decided to extend the Exchange Offer, to November 10,
2020
. This extension
does not imply a modification to the economic terms of the Exchange
Offer.
On November 11, 2020,
the
Company
reported the results of
the Exchange Offer. Eligible holders have been presented for a
total amount equivalent (for both Classes) to USD
65.075.746
,
representing
88.41%
of the face value of the Existing
Notes in Circulation, through the participation of
1,098
orders.
SERIES XXXI Notes issuance:
The Face Value of Existing Notes presented and
accepted for the Exchange totaled USD
30,751,640
and the Nominal
Value of Series
XXXI
Notes to be issued was
USD
1,309,480
.
The maturity date will be November 12, 2023.
According to the terms and subject to the
conditions established in the Prospectus Supplement, Eligible
Holders whose
Existing
Notes
have been accepted for the Exchange by the Company,
will receive for every USD 1 of Existing Notes submitted to the
Exchange, the accrued interest of the
Existing Notes
until the
settlement and issue date and the following:
a. USD 0.
95741755
in cash for each USD
1 of Existing Notes presented to the Exchange; and
b. The remaining amount until completing USD
1
for each USD
1
of Existing
Notes presented to the Exchange, in Series
XXXI Notes.
SERIES XXXII
Notes Issuance:
Face Value of Existing Notes presented and
accepted for the Exchange totaled USD
34,324,106
and the Nominal
Value of Series
XXXII
Notes to be issued is
USD
34,324,106
.
The maturity date will be November 12,
2022.
F-112
Exchange Offer- Issuance of Series VIII and IX
Notes
As a
consequence of the new restrictions on access to the Foreign
Exchange Market, IRSA launched an exchange offer on its Series I
Notes due on November 15, 2020 (the “Existing Notes”).
The abovementioned restrictions to obtain United States dollars
established under Communication “A” 7,106 apply for the
purchase of foreign currency intended for repayment of principal
maturing between October 15, 2020 and March 31, 2021 in respect of
the issuance of foreign currency-denominated debt securities
registered with official registries in Argentina by private sector
clients or the entities themselves. For such purposes, all Eligible
Holders (the “Eligible Holders”) were invited by IRSA
to Exchange the Existing Notes, Series I Notes.
On October
22, 2020, IRSA announced Notes to be issued in exchange for the
Existing Notes, Series I Notes, or through the Cash Subscription
(the “Cash Subscription”), as applicable, pursuant to
the terms and methods for the exchange of the Existing Notes. The
exchange offer consisted on the following
two options for the
bondholders terms:
(i)
A repayment of
principal amount of Existing Notes tendered for Exchange, in cash
in United States Dollars, in an amount resulting from dividing USD
72,607,482.80 by the total number of Existing Notes tendered in
Exchange for the Series VIII, always provided such quotient is less
than or equal to USD 1 whereas if such quotient is higher than USD
1 the consideration shall be equal to USD 1 (“
Principal Repayment
”);
which would represent at least 40% of the amount of the Existing
Notes tendered and the remaining amount until reaching USD 1 of
each USD1 of the Existing Notes tendered for Exchange, in Series
VIII Notes. Series VIII Notes to be issued at a fixed nominal
interest rate of 10.00% per annum and maturing 3 (three) years
after the Date of Issue and Settlement, with annual repayments,
denominated and payable in United States Dollars, in a principal
amount up to USD 108,911224 to be paid in kind by tendering for
exchange of the Existing Notes .
In all cases, the sum
of (i) and (ii) shall be the equivalent to USD1 per each USD1 of
Existing Notes tendered for Exchange.; and
(ii)
A par for par exchange of notes
Series IX for each Existing Notes presented to the Exchange.
Series IX Notes to be issued at a nominal fixed interest rate of
10% per annum, maturing on March 1, 2023, denominated and payable
in a principal amount up to USD 108,911,224, that may be increased
up to the Maximum Aggregate Principal Amount (the “Maximum
Aggregate Principal Amount”), to be paid in kind by tendering
for exchange the Existing Notes, or by Subscription in
Cash.
For both options
interest accrued on the Existing Notes
until the Date of Settlement of the Exchange Offer will be paid in
cash:
Moreover,
the Company offers an early exchange consideration equivalent to
USD 0.02 per each USD 1 of Existing Notes tendered and accepted in
exchange for Series IX Notes prior to the deadline to receive the
consideration for early acceptance (the “Early Exchange
Consideration”). Such consideration shall be paid in Pesos on
the Date of Issue and Settlement as per the exchange rate reported
by Communication “A” 3500 of the Central Bank of
Argentina on the business day next preceding the Exchange
Expiration Date. For the purposes of receiving the Early Exchange
Consideration, the Eligible Holders shall tender the Existing Notes
in their possession on or before the Deadline to Receive the Early
Exchange Consideration.
On November 2, 2020, the Company, announced the
results of the Early Bird of Series IX Notes. As of October 30,
2020, deadline for accessing the Early Bird, exchange orders have
been submitted for a total amount equivalent to USD 70,971,181 for
Series IX Notes.
All existing notes presented on or before the
above mentioned deadline have been accepted by the Company and will
be eligible to receive the consideration on the Issue and
Settlement Date
.
As timely announced, the Exchange Offer would
expire on November 5, 2020, unless it is extended by the Company.
Finally, on November 6, 2020, the Company decided to extend the
Exchange Offer, to November 10, 2020
. This extension
does not imply a modification to the economic terms of the Exchange
Offer.
On November 11, 2020, IRSA reported the results
of the Exchange Offer. Eligible holders have been presented for a
total amount equivalent (for both Classes) to USD 178,458,188,
representing 98.31% of the face value of the Existing Notes in
Circulation, through the participation of 6,571
orders.
SERIES VIII Notes issuance:
The Face
Value of Existing Notes presented and accepted for the Exchange
totaled USD 104,287,243 and the Nominal Value of Series VIII Notes
to be issued was USD 31,679,760. The maturity date will be November
12, 2023.
According
to the terms and subject to the conditions established in the
Prospectus Supplement, Eligible Holders whose existing notes have
been accepted for the Exchange by the Company, will receive for
every USD 1 of Existing Notes submitted to the Exchange, the
accrued interest of the existing notes until the settlement and
issue date and the following:
a. USD 0.69622593 in cash for
each USD 1 of Existing Notes presented to the Exchange;
and
b. The remaining amount until
completing 1 USD for each 1 USD of Existing Notes presented to the
Exchange, in Notes Series VIII.
SERIES IX Notes Issuance:
Face Value
of Existing Notes presented and accepted for the Exchange totaled
USD 74,170,945 and the Nominal Value of Series IX Notes to be
issued (together with the Face Value to be issued as a result of
the cash subscription) is USD 80,676,505. The maturity date will be
March 1, 2023.
Modifications to the Terms of the Existing Notes:
Pursuant to the
terms and conditions specified on the pricing supplement of the
Existing Notes, and considering that consent has been obtained for
an amount greater than 90% of the principal of the Existing Notes,
the Company made the Non-Essential Proposed Modifications and / or
the Essential Proposed Modifications, by means of which the terms
and conditions of the existing notes will be modified and
replaced.
Consequently, by virtue of the implementation of the Proposed
Non-Essential Modifications, the entire section of "Certain
Commitments" and "Events of Default" was eliminated from the terms
and conditions set forth in the prospectus supplements dated May 2,
2019 and dated July 25, 2019 corresponding to the Existing
Notes.
Additionally, pursuant to the implementation of the Proposed
Essential Modifications, the following terms and conditions of the
Existing Notes were modified and replaced:
- Expiration Date: It will be
March 1, 2023.
- Interest Payment Dates:
will be the same dates reported for Class IX in the Notice of
Results.
The terms
and conditions of the Series I Notes are not modified by the
Proposed Essential Modifications and the Proposed Non-Essential
Modifications will maintain their full validity.
The
implementation of the Proposed Essential Modifications and the
Proposed Non-Essential Modifications have been approved by the
Company's Board of Directors, dated November 11, 2020.
For more
information, see "Proposed Modifications to Existing Notes" of the
Prospectus and Exchange Supplement.
Series I Cancellation:
In
relation to the Exchange Offer ended on November 10, 2020, and as a
result of the settlement of said Exchange, on November 12, 2020,
the Company made a partial cancelation for a Nominal Value of USD
178,458,188 of Series I Notes, after the cancellation the Nominal
Value under circulation will be USD 3,060,519.
Corporate Information: IDBD
IDBD
has been maintaining negotiations with creditors in order to
restructure its financial debt in favorable terms. As of June 30,
2020, the total balance of (i) IDBD’s Series 9 Bonds was NIS
901 million (the "Series 9"), (ii) IDBD's Series 14 Bonds were NIS
889 million guaranteed by IDBD’s 70% of DIC's shares (the
“Series 14”), (iii) IDBD’s Series 15 Bonds were
NIS 238 million guaranteed by 5% of Clal’s shares (the
"Series 15"). Due to lack of agreement, on September 17, 2020, a
petition was submitted in the District Court in Tel-Aviv-Jaffa
(“The Court”) on the subject of granting of an order
for the opening of proceedings by the Trustee for the holders of
the Company's Bonds (Series 9) (“The petition”). Within
the framework of the petition, the Court was requested to grant an
order for the opening of proceedings for the Company pursuant to
Section 18 of the Insolvency and Economic Rehabilitation Law, 5778
– 2018 (“The Law”); to instruct the appointment
of a trustee for the Company according to law. On September 21,
2020, the holders of the bonds (Series 14) of IDB Development
approved making the entire uncleared balance of IDB Development's
bonds (Series 14) repayable immediately. On September 22, 2020, the
Company submitted its initial response to the Petition in the
Court, in which it argues that it is in the best interest of the
company and all its creditors to exhaust the negotiations with the
controlling shareholder and its creditors during a short period in
order to try and maximize the value of its assets, for the benefit
of the creditors and the company, and avoid costs and additional
harmful consequences. In addition, the response of Dolphin
Netherlands B.V. (the controlling shareholder of the Company) was
also submitted, as were responses by the Trustees for the
bondholders (Series 15 and Series 14) of the Company to the
Petition. It should be mentioned that in tandem to his response,
the Trustee of bondholders (Series 14) of the company submitted
petitions for the enforcement of a lien and for the appointment of
a receiver as well as an urgent petition for the setting of a
hearing on the said petitions for a receivership, together with the
hearing on the petition, which was set for September 24, 2020. On
September 25, 2020, declared the insolvency and liquidation of IDBD
and initiated liquidation proceedings. The Court appointed a
trustee for the shares of IDBD and a custodian for the shares of
DIC and Clal. We are analyzing together with our local and
international advisors the decision, including alternatives and
courses of action.
Boston Tower floor´s sale by IRSA CP
On
November 5, 2020, IRSA CP has sold and transferred 4 floors of the
Boston tower located at 265 Della Paolera Street, in the Catalinas
district of the Autonomous City of Buenos Aires for a gross
leasable area of approximately 3,892 sqm and 15 garage units
located in the building. The transaction price was approximately
USD 22.9 million (USD/sqm 5,570), which was paid in full. After
this operation, IRSA CP owns 3 floors with an approximate location
area of 3,266 m2 in addition to garage units and other
complementary spaces.
On November 12, 2020, IRSA CP has sold and transferred three floors
of the Boston tower located at 265 Della Paolera Street, in the
Catalinas district of the Autonomous City of Buenos Aires for a
gross leasable area of approximately 3,266 sqm, a retail store of
approximately 225 sqm and 15 garage units located in the building.
The transaction price was approximately USD 19.1 million (USD/sqm
5,490), which was paid in full. After this operation, IRSA CP has
no remaining leasable area in the building, only keeping a space of
the first basement.
F-113
Cresud Sociedad Anónima,
Comercial, Inmobiliaria, Financiera y Agropecuaria
NEW LIPSTICK, LLC AND SUBSIDIARY
C
ONSOLIDATED
F
INANCIAL
S
TATEMENTS
J
UNE
30, 2020
F-114
|
NEW LIPSTICK, LLC AND SUBSIDIARY
|
TABLE OF CONTENTS
|
INDEPENDENT AUDITOR’S REPORT
|
F-116
|
|
CONSOLIDATED FINANCIAL STATEMENTS
|
F-119
|
|
Consolidated
Balance Sheet
|
F-119
|
|
Consolidated
Statement of Operations
|
F-120
|
|
Consolidated
Statement of Changes in Members’ Deficit
|
F-121
|
|
Consolidated
Statement of Cash Flow
|
F-122
|
|
Notes to
Consolidated Financial Statements
|
F-123
|
|
SUPPLEMENTAL INFORMATION
|
F-129
|
|
Consolidating
Balance Sheet
|
F-131
|
|
Consolidating
Statement of Operations
|
F-132
|
F-115
Daniel
Abelovich
Ciro
Polano
Marcelo
Fuxman
Roberto
Murmis
Noemí
Cohn
To the
Members of
New
Lipstick, LLC
Report on the Consolidated Financial Statements
We have
audited the accompanying consolidated financial statements of New
Lipstick, LLC and Subsidiary (a limited liability company) (the
‘Company’) as of June 30, 2020, which comprise the
consolidated balance sheet and the consolidated statements of
operations, changes in members’ deficit and cash flow for the
year then ended, and the related notes to the consolidated
financial statements.
Responsibilities of Management for the Consolidated Financial
Statements
Management
is responsible for the preparation and fair presentation of these
consolidated financial statements in accordance with accounting
principles generally accepted in the United States of America; this
includes the design, implementation and maintenance of internal
control relevant to the preparation and fair presentation of
consolidated financial statements that are free from material
misstatement, whether due to fraud or error.
Auditor’s Responsibilities for the Audit of the Consolidated
Financial Statements
Our
responsibility is to express an opinion on these consolidated
financial statements based on our audit. We conducted our audit in
accordance with auditing standards generally accepted in the United
States of America. Those standards require that we plan and perform
the audit to obtain reasonable assurance about whether the
consolidated financial statements are free from material
misstatement.
An
audit involves performing procedures to obtain audit evidence about
the amounts and disclosures in the consolidated financial
statements. The procedures selected depend on the auditor’s
judgment, including the assessment of the risks of material
misstatement of the consolidated financial statements, whether due
to fraud or error. In making those risk assessments, the auditor
considers internal control relevant to the entity’s
preparation and fair presentation of the consolidated financial
statements in order to design audit procedures that are appropriate
in the circumstances, but not for the purpose of expressing an
opinion on the effectiveness of the entity’s internal
control. Accordingly, we express no such opinion. An audit also
includes evaluating the appropriateness of accounting policies used
and the reasonableness of significant accounting estimates made by
management, as well as evaluating the overall presentation of the
consolidated financial statements
.
We
believe the audit evidence we have obtained is sufficient and
appropriate to provide a basis for our audit opinion.
Opinion
In our
opinion, the accompanying consolidated financial statements present
fairly, in all material respects, the consolidated financial
position of the Company as of June 30, 2020, and the results of its
operations and its cash flows for the year then ended in accordance
with accounting principles generally accepted in the United States
of America.
|
Abelovich,
Polano & Asociados S.R.L. NEXIA is a member firm of the
“Nexia International” network. Nexia International
Limited does not deliver services in its own name or otherwise.
Nexia International Limited and the member firms of the Nexia
International network (including those members which trade under a
name which includes the word NEXIA) are not part of a worldwide
partnership. Member firms of the Nexia International network are
independently owned and operated.
Nexia
International Limited does not accept any responsibility for the
commission of any act, or omission to act by, or the liabilities
of, any of its members.
Nexia
International Limited does not accept liability for any loss
arising from any action taken, or omission, on the basis of the
content in this document or any documentation and external links
provided. The trade marks NEXIA INTERNATIONAL, NEXIA and the NEXIA
logo are owned by Nexia International Limited and used under
licence. References to Nexia or Nexia International are to Nexia
International Limited
or
to the “Nexia International” network of firms, as the
context may dictate.
|
|
F-116
Daniel
Abelovich
Ciro
Polano
Marcelo
Fuxman
Roberto
Murmis
Noemí
Cohn
|
Abelovich,
Polano & Asociados S.R.L. NEXIA is a member firm of the
“Nexia International” network. Nexia International
Limited does not deliver services in its own name or otherwise.
Nexia International Limited and the member firms of the Nexia
International network (including those members which trade under a
name which includes the word NEXIA) are not part of a worldwide
partnership. Member firms of the Nexia International network are
independently owned and operated.
Nexia
International Limited does not accept any responsibility for the
commission of any act, or omission to act by, or the liabilities
of, any of its members.
Nexia
International Limited does not accept liability for any loss
arising from any action taken, or omission, on the basis of the
content in this document or any documentation and external links
provided. The trade marks NEXIA INTERNATIONAL, NEXIA and the NEXIA
logo are owned by Nexia International Limited and used under
licence. References to Nexia or Nexia International are to Nexia
International Limited
or
to the “Nexia International” network of firms, as the
context may dictate.
|
|
F-117
Emphasis of Matter - Termination of the ground lease and abandoning
of the administration of the building
We draw
attention to Notes 5 and 6 of the consolidated financial statements
which describe the effects of the termination of the ground lease
and the abandonment of the administration of the building that
occurred subsequent to the date of the accompanying consolidated
financial statements.
Our
opinion is not modified in respect of the above mentioned
matters
.
Other matters
As of June 30,
2020, the Company had a members’ deficit of $37,984,853. This
deficit relates to the notes payable to the members described in
Note 4.
The supplemental
information presented on pages 13-14 is for additional analysis and
is not a required part of the consolidated financial statements.
Such information has not been subject to the audit procedures
applied in the audit of the consolidated financial statements, and
accordingly, we do not express an opinion or provide any assurance
on it.
October
30, 2020
|
(Partner)
|
|
Noemí
I. Cohn
|
F-118
|
NEW LIPSTICK, LLC AND SUBSIDIARY
|
C
ONSOLIDATED
B
ALANCE
S
HEET
JUNE 30, 2020
|
ASSETS
|
06/30/2020
(Audited)
|
06/30/2019
(Unaudited)
|
|
|
|
|
|
Real estate,
net
|
$
-
|
$
122.374.260
|
|
Cash and cash
equivalents
|
6.132.232
|
860.849
|
|
Restricted
cash
|
-
|
3.711.128
|
|
Tenant receivables,
net
|
48.794
|
361.278
|
|
Prepaid expenses
and other assets
|
-
|
6.665.497
|
|
Due from related
party
|
2.188.579
|
120.274
|
|
Deferred rent
receivable
|
-
|
7.871.348
|
|
Goodwill
|
|
-
|
|
Lease intangibles,
net
|
-
|
10.779.121
|
|
|
|
|
|
TOTAL
ASSETS
|
$
8.369.605
|
$
152.743.755
|
|
|
|
|
|
LIABILITIES
AND MEMBERS' DEFICIT
|
|
|
|
|
|
|
|
LIABILITIES
|
|
|
|
Accounts payable
and accrued expenses
|
$
1.788.955
|
$
1.720.601
|
|
Notes payable to
members
|
44.275.534
|
42.904.739
|
|
Note
payable
|
-
|
44.450.269
|
|
Deferred ground
rent payable
|
-
|
246.100.408
|
|
Due to related
parties
|
241.175
|
240.874
|
|
Tenant security
deposits
|
-
|
872.682
|
|
Deferred
revenue
|
48.794
|
567.572
|
|
Lease intangibles,
net
|
-
|
30.940.147
|
|
|
|
|
|
TOTAL
LIABILITIES
|
46.354.458
|
367.797.292
|
|
|
|
|
|
MEMBERS'
DEFICIT
|
(37.984.853
)
|
(215.053.537
)
|
|
|
|
|
|
TOTAL
LIABILITIES AND MEMBERS' DEFICIT
|
$
8.369.605
|
$
152.743.755
|
The
accompanying notes are an integral part of these consolidated
financial statements.
F-119
|
NEW LIPSTICK, LLC AND SUBSIDIARY
|
CONSOLIDATED
S
TATEMENT OF
O
PERATIONS
F
OR
T
HE
Y
EAR
E
NDED
JUNE 30, 2020
|
REVENUES:
|
06/30/2020
(Audited)
|
06/30/2019
(Unaudited)
|
06/30/2018
(Unaudited)
|
|
Base
rents
|
$
42.376.323
|
$
42.591.305
|
42.640.302
|
|
Tenant
reimbursements
|
8.868.733
|
7.851.478
|
7.672.918
|
|
Other rental
revenue
|
252.478
|
385.239
|
50.029
|
|
|
|
|
|
|
TOTAL
REVENUES
|
51.497.534
|
50.828.022
|
50.363.249
|
|
|
|
|
|
|
EXPENSES:
|
|
|
|
|
Real estate
taxes
|
12.829.755
|
12.121.647
|
11.620.716
|
|
Utilities
|
2.335.535
|
2.393.263
|
2.381.489
|
|
Janitorial
|
1.819.490
|
1.813.184
|
1.776.052
|
|
Insurance
|
380.405
|
344.508
|
325.138
|
|
Repairs and
maintenance
|
2.106.485
|
1.379.744
|
1.712.889
|
|
Security
|
1.228.882
|
1.149.765
|
1.014.923
|
|
Goodwill
|
-
|
5.422.615
|
0
|
|
Bad
debt
|
-
|
-
|
30.593
|
|
General and
administrative
|
3.868.430
|
3.067.133
|
2.827.316
|
|
Management
fees
|
1.232.949
|
1.120.813
|
1.130.602
|
|
Elevator
|
328.939
|
364.581
|
302.620
|
|
HVAC
|
64.748
|
85.035
|
80.215
|
|
Ground
rent
|
42.597.980
|
45.895.545
|
45.457.736
|
|
Interest
expense
|
2.359.235
|
3.890.401
|
4.015.781
|
|
Depreciation and
amortization
|
5.226.229
|
5.520.008
|
5.745.481
|
|
Amortization of
lease intangibles
|
3.054.196
|
3.097.661
|
3.079.859
|
|
|
|
|
|
|
TOTAL
EXPENSES
|
79.433.258
|
87.665.903
|
81.501.410
|
|
OTHER
INCOME
|
|
|
|
|
Gain on debt
forgiveness
|
40.196.070
|
-
|
20.000.000
|
|
Gain due to
cancelation of ground lease and loss of control over the
building
|
164.808.338
|
-
|
-
|
|
|
|
|
|
|
|
|
|
|
|
NET
LOSS
|
$
177.068.684
|
$
(36.837.881
)
|
$
(11.138.161
)
|
The
accompanying notes are an integral part of these consolidated
financial statements.
F-120
|
NEW LIPSTICK, LLC AND SUBSIDIARY
|
C
ONSOLIDATED
S
TATEMENT OF
C
HANGES IN
M
EMBERS
’ D
EFICIT
F
OR
T
HE
Y
EAR
E
NDED
JUNE 30, 2020
|
Members' deficit -
July 1, 2017 (unaudited)
|
$
(167.127.495
)
|
|
|
|
|
Net
loss
|
(11.138.161
)
|
|
Members' deficit -
July 1, 2018 (Unaudited)
|
$
(178.265.656
)
|
|
|
|
|
Capital
contribution
|
50.000
|
|
Net
loss
|
(36.837.881
)
|
|
Members' deficit -
June 30, 2019 (Unaudited)
|
$
(215.053.537
)
|
|
|
|
|
Net
Gain
|
177.068.684
|
|
Members' deficit -
June 30, 2020 (Audited)
|
$
(37.984.853
)
|
The
accompanying notes are an integral part of these consolidated
financial statements.
F-121
NEW LIPSTICK, LLC AND SUBSIDIARY
C
ONSOLIDATED
S
TATEMENT OF
C
ASH
F
LOW
F
OR
T
HE
Y
EAR ENDED
JUNE 30, 2020
|
|
06/30/2020
(Audited)
|
06/30/2019
(Unaudited)
|
06/30/2018
(Unaudited)
|
|
|
|
|
|
|
CASH FLOWS FROM
OPERATING ACTIVITIES:
|
|
|
|
|
|
|
|
|
|
Net
result
|
$
177.068.684
|
$
(36.837.881
)
|
$
(11.138.161
)
|
|
|
|
|
|
|
Adjustments to
reconcile net loss to net
|
|
|
|
|
cash provided
by operating activities:
|
|
|
|
|
Depreciation
and amortization
|
5.226.229
|
5.726.461
|
5.745.481
|
|
Bad
debt
|
-
|
-
|
30.593
|
|
Gain
on debt forgiveness
|
-
|
-
|
(20.000.000
)
|
|
Deferred
rent receivable
|
-
|
1.610.861
|
390.793
|
|
Amortization
of above market leases
|
-
|
1.407.363
|
1.407.364
|
|
Accretion
of below market leases
|
-
|
(2.363.408
)
|
(2.387.552
)
|
|
Accretion
of above market ground lease
|
-
|
(437.809
)
|
(437.809
)
|
|
Amortization
of lease intangible assets
|
3.054.196
|
(3.097.661
)
|
3.079.859
|
|
Deferred
ground rent
|
-
|
-
|
27.129.005
|
|
Amortization
of loan costs
|
-
|
231.355
|
-
|
|
Gain on debt
forgiveness
|
(40.196.070
)
|
-
|
-
|
|
Gain due to
cancelation of ground lease and loss of control over the
building
|
(164.808.338
)
|
-
|
-
|
|
Interest
costs
|
1.370.796
|
-
|
-
|
|
Write-off of
tenants receivable
|
(727.423
)
|
-
|
-
|
|
Goodwill
|
-
|
5.422.615
|
-
|
|
(Increase) in
operating assets:
|
|
|
|
|
Tenant
receivables
|
1.039.907
|
3.265
|
18.195
|
|
Prepaid
expenses and other assets
|
6.665.497
|
(289.946
)
|
(510.810
)
|
|
Lease
intangibles
|
-
|
6.032.359
|
(281.225
)
|
|
Restricted
cash
|
3.711.128
|
-
|
-
|
|
Receivables from
related party
|
(2.068.305
)
|
-
|
-
|
|
Increase (decrease)
in operating liabilities:
|
|
|
|
|
Accounts
payable and accrued expenses
|
9.628.400
|
(918.623
)
|
290.404
|
|
Deferred
ground rent
|
-
|
26.678.815
|
-
|
|
Tenant
security deposits
|
-
|
(52.174
)
|
(21.017
)
|
|
Deferred
revenue
|
-
|
246.138
|
(342.260
)
|
|
Deferred rent
receivable
|
7.871.348
|
-
|
-
|
|
Lease intangibles,
net
|
8.435.334
|
-
|
-
|
|
|
|
|
|
|
TOTAL
ADJUSTMENTS
|
(160.797.301
)
|
40.199.611
|
14.111.021
|
|
NET CASH PROVIDED
BY OPERATING ACTIVITIES
|
16.271.383
|
3.361.730
|
2.972.860
|
|
|
|
|
|
|
CASH FLOWS FROM
INVESTING ACTIVITIES:
|
|
|
|
|
Capital
expenditures
|
-
|
(35.001
)
|
(1.418.777
)
|
|
Repayment on notes
payable
|
(11.000.000
)
|
-
|
-
|
|
NET CASH USED IN
INVESTING ACTIVITIES
|
(11.000.000
)
|
(35.001
)
|
(1.418.777
)
|
|
|
|
|
|
|
CASH FLOWS FROM
FINANCING ACTIVITIES:
|
|
|
|
|
Payments on debt
issuance costs
|
-
|
(298.295
)
|
-
|
|
Repayments to
related parties
|
|
-
|
(39.979
)
|
|
Contribution from
Members
|
-
|
50.000
|
-
|
|
Net change in
restricted cash
|
-
|
265.499
|
181.496
|
|
Repayments on notes
payable
|
-
|
(5.989.372
)
|
-
|
|
Borrowings from
shareholders
|
-
|
1.771.768
|
-
|
|
NET CASH USED IN
FINANCING ACTIVITIES
|
-
|
(4.200.400
)
|
(1.108.941
)
|
|
|
|
|
|
|
NET DECREASE IN
CASH AND CASH EQUIVALENTS
|
5.271.383
|
(873.671
)
|
445.142
|
|
CASH AND CASH
EQUIVALENTS AT BEGINNING OF YEAR
|
860.849
|
1.734.520
|
1.289.378
|
|
CASH AND CASH
EQUIVALENTS AT END OF YEAR
|
$
6.132.232
|
$
860.849
|
$
1.734.520
|
|
SUPPLEMENTAL
DISCLOSURE OF CASH FLOW INFORMATION:
|
|
|
|
|
Cash paid for
interest
|
|
$
4.126.052
|
$
4.244.626
|
F-122
NEW LIPSTICK, LLC AND SUBSIDIARY
N
OTES
T
O
C
ONSOLIDATED
F
INANCIAL
S
TATEMENTS
JUNE 30, 2020
1.
ORGANIZATION AND SUMMARY OF SIGNIFICANT ACCOUNTING
POLICIES
Organization
New
Lipstick, LLC (the “Company”) was organized as a
Delaware limited liability company and commenced operations on
November 3, 2010. The Company was formed among IRSA International,
LLC (“IRSA”), Marciano Investment Group, LLC
(“Marciano”), Avi Chicouri (“Avi”), Par
Holdings, LLC (“Par”), and Armenonville, collectively
(the “Members”). On December 15, 2010, Armenonville
assigned 100 percent of its membership interest to Lomas Urbanas
S.A. IRSA is a wholly-owned subsidiary of Tyrus S.A.
(“TYRUS”), a wholly-owned subsidiary of IRSA
Inversiones y RepresentacionesSociedad Anonima, a company whose
shares are listed on the Buenos Aires and New York Stock exchanges.
The Company wasformed in order to acquire 100% interest in
Metropolitan 885 Third Avenue Leasehold LLC (“Metro
885”), its wholly-owned subsidiary.
Metro
885 was organized for the purpose of acquiring and operating a 34
story class A office tower more commonly known as the Lipstick
Building, located at 885 Third Avenue in New York (the
“Property”). Metro 885 leased the land which contains
approximately 28,000 square feet. On July 9, 2007, the Company
acquired the Property. The Property contains approximately 635,800
square feet of rentable space, consisting of rental and office
spaces.
The
Company operates under the guidelines of an Operating Agreement
(the “Agreement”) entered into by the Members on
November 15, 2010. The Company has adopted a fiscal year end of
June 30. The manager of the Company is Lipstick Management, LLC
(“LM”), a company affiliated with IRSA.
The
Agreement calls for Class A and Class B Members’, Class A
Members are IRSA, Marciano and Lomas Urbanas
S.A.
and Class B members are Avi and PAR.
Class
B Membership interests of any Class B Member shall be automatically
converted, in whole and not in part, into an equal number of Class
A Membership interests on the earlier to occur of the date on which
LM certifies that all unreturned additional Class A capital
contributions and all unreturned Class A capital contributions have
been reduced to zero.
Any
Class A Member, as defined in the Agreement, may transfer, directly
or indirectly, any or all of its percentage interest as a Member in
the Company to an unaffiliated third party, but the offering member
must first offer the right of first offer (“ROFO”) to
each of the Class A members by written notice specifying the cash
price and the other terms and conditions of the offer. Upon receipt
of the ROFO notice, each of the offeree members has the right,
exercisable in ten (10) days, to accept or decline the
offer.
The
Company shall continue perpetually until dissolution, liquidation
or termination. The liability of the members of the Company is
limited to the members’ total contribution, plus any amounts
guaranteed by the members.
The
terms of the Agreement provide for initial capital contributions
and percentage interests as follows:
|
|
Percentage of
|
Initial Capital
|
|
IRSA
International, LLC
|
49.0
%
|
15,417,925
|
|
Marciano
Investment Group, LLC
|
42.0
%
|
13,215,365
|
|
Lomas
Urbanes S.A.
|
2.27
%
|
714,259
|
|
Avi
Chicouri
|
3.07
%
|
-
|
|
Par
Holdings, LLC
|
3.66
%
|
-
|
|
Total
|
100.00
%
|
29,347,549
|
F-123
|
NEW LIPSTICK, LLC AND SUBSIDIARY
|
|
N
OTES
T
O
C
ONSOLIDATED
F
INANCIAL
S
TATEMENTS
JUNE
30, 2020
|
1.
ORGANIZATION AND SUMMARY OF SIGNIFICANT ACCOUNTING POLICIES
(CONTINUED)
Organization (continued)
In
accordance with the Agreement, the members may be required to make
additional capital contributions which are reasonably related to
the operations and/or leasing of the Property and its activities.
For the year ended June 30, 2020, there were no contributions made
by any of the members.
Distributions
of capital will be made to the Members at the times, and in
aggregated amounts determined by the Board of Directors of the
Company. There were no distributions for the year ended June 30,
2020.
The
Company’s profits and losses are allocated to the
members.
Principles of Consolidation
The
consolidated financial statements include the accounts of New
Lipstick, LLC and its wholly owned subsidiary, Metro 885,
collectively referred to as the “Company”. All
significant intercompany balances and transactions have been
eliminated in consolidation.
Basis of Preparation
The
Company prepares its consolidated financial statements on the
accrual basis of accounting in accordance with accounting
principles generally accepted in the United States of America
(“U.S. GAAP”).
Use of Estimates
To
prepare consolidated financial statements in conformity with U.S.
GAAP, management makes estimates and assumptions that affect the
reported amounts of assets and liabilities and disclosure of
contingent assets and liabilities at the date of the consolidated
financial statements and the reported amounts of revenues and
expenses during the reporting period. Actual results could differ
significantly from those estimates.
Cash and Cash Equivalents
The
Company considers highly liquid investments purchased with
maturities of three months or less upon acquisition to be cash
equivalents
Concentration of Credit Risk
Financial
instruments which potentially subject the Company to concentrations
of credit risk consist principally of cash deposits in excess of
the Federal Deposit Insurance Corporation insured limit of
$250,000. As at June 30, 2020 cash deposits exceeded these insured
limits.
Tenant Receivables, Net
The
Company carries its tenant receivables at the amount due pursuant
to lease agreements but uncollected, less an allowance for doubtful
accounts. The Company continuously monitors collections from
tenants and makes a provision for estimated losses based upon
historical experience and any specific tenant collection issues
that the Company has identified. As of June 30, 2020, the
Company’s allowance for doubtful accounts was approximately
$727,423. Account balances are charged off against the allowance
after all means of collection have been exhausted and the potential
for recovery is considered remote.
F-124
|
NEW LIPSTICK, LLC AND SUBSIDIARY
|
|
N
OTES
T
O
C
ONSOLIDATED
F
INANCIAL
S
TATEMENTS
JUNE
30, 2020
|
1.
ORGANIZATION AND SUMMARY OF SIGNIFICANT ACCOUNTING POLICIES
(CONTINUED)
Revenue Recognition
The
Company recognizes lease revenue on a straight–line basis
over the terms of the lease agreements. Capitalized below market
base values are accreted as an increase to base rents. Capitalized
above market base values are amortized as a decrease to base
rents.
The
Company also receives reimbursements from tenants for certain costs
as provided for in the lease agreements. These costs include real
estate taxes, utilities, insurance, common area maintenance and
other recoverable costs in excess of a base year amount. The
reimbursements are recognized when the tenants are
billed.
Deferred Ground Rent Payable
Ground
rent expense is accounted for on a straight-line basis over the
non-cancelable terms of the ground leases. All future minimum
increases in the non-cancelable ground rents consist of either 2.5%
or 3% annual increases through May 1, 2068.
No
balance remain as of June 30, 2020 (see subsequent
events)
Lease Intangibles
Leasing
costs and commissions incurred in connection with leasing
activities are capitalized and amortized on straight-line basis
over the lives of the respective leases. Unamortized deferred
leasing costs are charged to amortization expense upon early
termination of the lease.
Above
and below market lease and above market ground lease values were
recorded on the Property’s reorganization date based on the
present value (using an interest rate which reflected the risk
associated with the leases acquired) of the difference between (i)
the contractual amounts to be paid pursuant to the in-place leases
and ground lease, and (ii) management’s estimate of fair
market lease rates for the corresponding in-place leases and ground
leases, measured over a period equal to the remaining
non-cancelable term of the leases.
Above
market lease values are capitalized as an asset and amortized as a
decrease to rental income over the remaining terms of the
respective leases on a straight line basis. Below market leases are
capitalized as a liability and are amortized as in increase to
rental income over the remaining terms of the respective leases on
a straight- line basis.
The
above market ground lease value is capitalized as a liability and
amortized as a decrease in operating expenses over the remaining
terms of the respective leases.
The
aggregate value of in-place leases were measured based on the
differences between (i) the Property valued with existing in-place
leases adjusted to market rental rates, and (ii) the Property
valued as if vacant, based upon management’s estimates.
Factors considered by management in their analysis included an
estimate of carrying costs during the expected lease-up periods
considering current market conditions and costs to execute similar
leases. In estimating carrying costs, management included real
estate taxes, insurance and other operating expenses and estimates
of lost rentals at market rates during the expected lease-up
periods, which primarily were a year. Management also estimated
costs to execute similar leases including leasing commissions,
legal and other related expenses.
No balance remained as of June 30, 2020 (see
subsequent events)
.
F-125
|
NEW LIPSTICK, LLC AND SUBSIDIARY
|
|
N
OTES
T
O
C
ONSOLIDATED
F
INANCIAL
S
TATEMENTS
JUNE
30, 2020
|
1.
ORGANIZATION AND SUMMARY OF SIGNIFICANT ACCOUNTING POLICIES
(CONTINUED)
Income Taxes
The
Company is treated as a partnership for federal income tax purposes
and, accordingly, generally would not incur income taxes or have
any unrecognized tax benefits. Instead, its earnings and losses are
included in the personal tax returns of the members and taxed
depending on the members’ personal tax situation. As a
result, the consolidated financial statements do not reflect a
provision for federal income taxes. The Company is no longer
subject to U.S. Federal examinations by tax authorities for years
before 2015.
The
Company recognizes and measures tax positions taken or expected to
be taken in its tax return based on their technical merit and
assesses the likelihood that the positions will be sustained upon
examination based on the facts, circumstances and information
available at the end of each period. Interest and penalties on tax
liabilities, if any, would be recorded in interest expense and
other non-interest expense, respectively.
2. RELATED PARTY TRANSACTIONS
Guaranty of Management Fee
On April 20, 2011, LM entered into an agreement
with the Company’s lender which provides that the Company
would be directly responsible for certain fees that are payable to
Herald Square Properties, LLC (“HSP”). HSP is a 49%
owner in LM. The Company and LM are affiliated by a common 49%
owner. These fees are based on a consulting agreement between LM
and HSP. On December 1, 2015, the parties agreed to extend the
agreement for an additional year for a fee of $3,700 per month. The
parties have the right to terminate this agreement at any time upon
(30 days written notice served to the other party). The total
management fees in the accompanying consolidated statement of
operations, amounted to approximately $719,000, of which
approximately $7
,
400 is unpaid as of June 30,
2020
.
Property Management Agreement
On
May 3, 2011, the Company entered into an asset management agreement
with LM. The Company is charged an asset management fee of 1.0% of
its gross revenues. Asset management fees incurred by the Company
to LM amounted to approximately $514,000 for the year ended June
30, 2020, of which approximately $40,000 is unpaid at June 30,
2020. Asset management fees are included in management fees in the
accompanying consolidated statement of operations.
Operating Lease
Effective
August 1, 2011, LM leased office space from the Company. The term
of the agreement runs through November 30, 2026. The total amount
of rental income earned for the year ended June 30, 2020 amounted
to approximately $201,000.
Other Related Party Transactions
At
June 30, 2020 the Company is owed the following balances from the
following related parties for expenses paid on their
behalf.
|
Due from related
party:
|
|
|
Lipstick
Management LLC
|
$
120,274
|
|
IRSA
International LLC
|
2,068,305
|
|
|
$
2,188,579
|
F-126
|
NEW LIPSTICK, LLC AND SUBSIDIARY
|
|
N
OTES
T
O
C
ONSOLIDATED
F
INANCIAL
S
TATEMENTS
JUNE
30, 2020
|
2.
RELATED PARTY TRANSACTIONS (CONTINUED)
Additionally,
at June 30,2020, the amounts listed below represent expenses paid
by the Company on behalf of related companies, which will be
reimbursed by related companies.
|
Due to related
parties:
|
|
|
IRSA
Inversiones y Representaciones
|
|
|
Sociedad
Anonima
|
$
240,874
|
|
IRSA
International LLC
|
301
|
|
|
$
241,175
|
3.
NOTE PAYABLE
Metro
885 used to have note agreements with Royal Bank of Canada (the
“Lender”) which were amended and restated in 2010. The
the amended note was $115,000,000 and bore interest at (i) the
London Interbank Offers Rate (“LIBOR”) plus 400 basis
points, or (ii) Prime Rate plus Prime rate Margin, if converted
into a prime Rate Loan. The amended note provided for a maximum
interest rate of 5.25% through February 29, 2012, and 6.25% from
March 1, 2012 through August 31, 2015, and matured on August 1,
2017.
On
September 15, 2017, the Company amended again its existing note
agreement with the Lender. Upon entering into the amendment, the
Company paid down $40,000,000 through two prepayments. The first
prepayment of $20,000,000 occurred in September 2017, bringing the
total principal down from approximately $113,100,000 outstanding on
the note to approximately $93,100,000 as of September 30, 2017. The
second prepayment of $20,000,000 occurred on October 15, 2017 and
the Lender forgave $20,000,000 of principal bringing the total
principal down to $53,100,000 as of June, 2018. The note bears
interest at LIBOR plus 200 basis points. The note matured on April
30, 2020.
.
Pursuant
to a cash management agreement with the Lender, all rents collected
are required to be deposited in a clearing account and all funds
are disbursed in accordance with the loan agreement, including the
funding of all reserve accounts. In addition, after payment of debt
service operating expenses and other expenses, $250,000 of the
remaining cash flow in the cash management account is applied to
the outstanding principal balance of the loan on a monthly basis.
The note is collateralized by the property including all related
facilities, amenities, fixtures, and personal property owned by the
Company.
On March 4, 2019, Metro 885
renegotiated its debt, which was stipulated in US$
11 million plus a contingent amount calculated on the purchase
price of the option on a part of the land where the Lipstick
building is built. The debt must be canceled before April 30,
2021.
On
February 12, 2020 Metro 885 made the final payment on the
$11,000,000 trigger amount associated with the contingent debt
forgiveness, and Metro 885’s lender terminated the mortgage
associated with the Property resulting in a gain on debt
forgiveness of approximately $40,000,000. Metro 885 was not
required to make any additional payments in excess of the
$11,000,000 which was agreed to on March 4, 2019.
4.
NOTES PAYABLE TO MEMBERS
On August 15, 2017, the Company entered into notes
payable with two Members, IRSA International, LLC and Marciano
Investment Group, LLC. The notes payable are for the totalamount of
$40,000,000, and originally matured on August 15, 2019, but was
extended without a specif date but with the same terms.. The notes
bear interest at LIBOR plus 200 basis points (2.16% at June 30,
2020). Interest expense related to these notes was approximately
$1,371,000 for the year ended June 30,2020. There were no principal
payments during the year ended June 30, 2020
.
F-127
|
NEW LIPSTICK, LLC AND SUBSIDIARY
|
|
N
OTES
T
O
C
ONSOLIDATED
F
INANCIAL
S
TATEMENTS
JUNE
30, 2020
|
4.
NOTES PAYABLE TO MEMBERS (CONTINUED)
As
of June 30, 2020, the balance of the notes including accrued
interest amounted to approximately $44,276,000. Proceeds were
contributed to the Company’s wholly owned subsidiary. The
subsidiary recorded monies received as capital contribution and
used the money to paydown the note payable with the bank (NOTE
3).
5.
COMMITMENTS AND CONTINGENCIES
Litigation
The
Company, from time to time, is involved in litigation arising
during the ordinary course of business. Based on currently
available information, management believes that the resolution of
any potential claims will not have a material adverse effect on the
Company’s consolidated operating results or financial
position.
6.
SUBSEQUENTS EVENTS
Subsequents
adjusting events
On
August 7, 2020, as a result of negotiations initiated in the
context of the increase in the local levy from May 2020 established
by the lease itself (hereinafter "Ground Lease"), signed an
agreement with the owner of the Ground Lease in which the
relationship is terminated and the lease is terminated, leaving the
building management. For this reason, Metropolitan preceded
eliminating as of June 30, 2020, the liability it had associated
with the ground lease, as well as all the assets and liabilities
associated with the building and the operation of the
administration. The net effect amounted to $ 164.8 million that is
included within ‘Other income’ in the consolidated
Statement of Operations. Additionally to this, on the same date,
the Company:
●
Reported
that it has decided to stop facing the cost of renting land (Ground
Lease) where the Lipstick Building is located in New York City,
handing over the management of the property;
●
Signed
an agreement with the owner of the Ground Lease to terminate the
commercial relationship, leaving the administration of the
building. For this reason, Metropolitan derecognised as of June 30,
2020, the liability associated with the ground lease, as well as
all the assets and liabilities associated with the building and the
operation of the administration.
Pursuant
to such agreement, Metropolitan was fully released from liability
except for (i) claims for liabilities prior to June 1, 2020, from
those persons who performed works or rendered services in the
Building or for Metropolitan and (ii) claims from persons who had
an accident in the property after August 7, 2020.
F-128
SUPPLEMENTAL
INFORMATION
F-129
|
NEW LIPSTICK, LLC AND SUBSIDIARY
|
|
C
ONSOLIDATED
B
ALANCE
S
HEET
JUNE
30, 2020
|
|
ASSETS
|
Metro
885
|
New
Lipstick
|
Consolidating
Entries
|
Totals
|
|
|
|
|
|
|
|
Cash and cash
equivalents
|
$
6,128,565
|
$
3,667
|
$
-
|
$
6,132,232
|
|
Restricted
cash
|
-
|
-
|
-
|
-
|
|
Investment in Metro
885
|
-
|
6,407,915
|
(6,407,915
)
|
-
|
|
Tenant receivables,
net
|
48,794
|
-
|
-
|
48,794
|
|
Due from related
party
|
2,068,305
|
120,274
|
-
|
2,188,579
|
|
|
|
|
|
|
|
TOTAL
ASSETS
|
$
8,245,664
|
$
6,531,856
|
$
(6,407,915
)
|
$
8,369,605
|
|
|
|
|
|
|
|
LIABILITIES
AND MEMBERS' DEFICIT
|
|
|
|
|
|
|
|
|
|
|
|
|
|
|
|
|
|
Accounts payable
and accrued expenses
|
$
1,788,955
|
$
-
|
$
-
|
$
1,788,955
|
|
Notes payable to
related parties
|
-
|
44,275,534
|
-
|
44,275,534
|
|
Due to related
parties
|
-
|
241,175
|
-
|
241,175
|
|
Deferred
revenue
|
48,794
|
-
|
-
|
48,794
|
|
|
|
|
|
|
|
TOTAL
LIABILITIES
|
1,837,749
|
44,516,709
|
-
|
46,354,458
|
|
|
|
|
|
|
|
MEMBERS'
DEFICIT
|
6,407,915
|
(37,984,853
)
|
(6,407,915
)
|
(37,984,853
)
|
|
|
|
|
|
|
|
TOTAL
LIABILITIES AND MEMBERS' DEFICIT
|
$
8,245,664
|
$
6,531,856
|
$
(6,407,915
)
|
$
8,369,605
|
|
|
|
|
|
|
F-130
|
NEW LIPSTICK, LLC AND SUBSIDIARY
|
|
C
ONSOLIDATED
S
TATEMENT OF
O
PERATIONS
JUNE
30, 2020
|
|
|
Metro
885
|
New
Lipstick
|
Consolidating
Entries
|
Totals
|
|
|
|
|
|
|
|
REVENUES:
|
|
|
|
|
|
Base rents,
net
|
$
42,376,323
|
$
-
|
$
-
|
$
42,376,323
|
|
Tenant
reimbursements
|
8,868,733
|
|
|
8,868,733
|
|
Other rental
revenue
|
252,478
|
-
|
-
|
252,478
|
|
Investment
loss
|
-
|
178.450.375
|
(178.450.375
)
|
-
|
|
|
|
|
|
|
|
TOTAL
REVENUES
|
51,497,534
|
178.450.375
|
(178.450.375
)
|
51,497,534
|
|
|
|
|
|
|
|
EXPENSES:
|
|
|
|
|
|
Real estate
taxes
|
$
12,829,755
|
$
-
|
$
-
|
$
12,829,755
|
|
Utilities
|
2,332,135
|
3,400
|
-
|
2,335,535
|
|
Janitorial
|
1,819,490
|
-
|
-
|
1,819,490
|
|
Insurance
|
380,405
|
-
|
-
|
380,405
|
|
Repairs and
maintenance
|
2,106,485
|
-
|
-
|
2,106,485
|
|
Security
|
1,228,882
|
-
|
-
|
1,228,882
|
|
General and
administrative
|
3,860,935
|
7,495
|
-
|
3,868,430
|
|
Management
fees
|
1,232,949
|
-
|
-
|
1,232,949
|
|
Elevator
|
328,939
|
-
|
-
|
328,939
|
|
HVAC
|
64,748
|
-
|
-
|
64,748
|
|
Ground
rent
|
42,597,980
|
-
|
-
|
42,597,980
|
|
Interest
expense
|
988,439
|
1,370,796
|
-
|
2,359,235
|
|
Depreciation and
amortization
|
5,226,229
|
-
|
-
|
5,226,229
|
|
Amortization
of lease
intangibles
|
3,054,196
|
-
|
-
|
3,054,196
|
|
|
|
|
|
|
|
TOTAL
EXPENSES
|
78,051,567
|
1,381,691
|
-
|
79,433,258
|
|
OTHER
INCOME
|
|
|
|
|
|
Gain
on debt forgiveness
|
40,196,070
|
-
|
-
|
40,196,070
|
|
Management
quitment
|
164,808,338
|
-
|
-
|
164,808,338
|
|
|
|
|
|
|
|
NET
INCOME
|
$
178,450,375
|
$
177,068,684
|
$
(178,450,375
)
|
$
177,068,684
|
|
|
|
|
|
|
F-131
|
NEW LIPSTICK, LLC AND SUBSIDIARY
|
|
C
ONSOLIDATED
S
TATEMENT OF
O
PERATIONS
JUNE
30, 2020
|
TABLE OF CONTENTS
Part IItem 1. Identity Of Directors, Senior Management and AdvisersItem 2. Offer Statistics and Expected TimetableItem 3. Key InformationItem 10. Additional Information D. Exchange ControlsItem 4. Information on The CompanyItem 4A. Unresolved Staff CommentsItem 5. Operating and Financial Review and ProspectsItem 3 Key Information D. Risk FactorsItem 6. Directors, Senior Management and EmployeesItem 7. Major Shareholders and Related Party TransactionsItem 8. Financial InformationItem 9. The Offer and ListingItem 10. Additional InformationItem 11. Quantitative and Qualitative Disclosures About Market RiskItem 12. Description Of Securities Other Than Equity SecuritiesPart IIItem 13. Defaults, Dividend Arrearages and DelinquenciesItem 14. Material Modifications To The Rights Of Security Holders and Use Of ProceedsItem 15. Controls and ProceduresItem 16. ReservedItem 16A. Audit Committee Financial ExpertItem 16B. Code Of EthicsItem 16C. Principal Accountant Fees and ServiceItem 16D. Exemption From The Listing Standards For Audit CommitteesItem 16. E. Purchases Of Equity Securities By The Issuer and Affiliated PurchasersItem 16F. Change in Registrant S Certifying AccountantItem 16G. Corporate GovernanceItem 16H. Mine Safety DisclosuresPart IIIItem 17. Financial StatementsItem 18. Financial StatementsItem 19. ExhibitsNote 1 - The Group's Business and General Information F-11Note 1 - The Group's Business and General InformationNote 2 - Summary Of Significant Accounting Policies F-13Note 2 - Summary Of Significant Accounting PoliciesNote 3 - Significant Judgments, Key Assumptions and Estimates F-33Note 3 - Significant Judgments, Key Assumptions and EstimatesNote 4 - Acquisitions and Disposals F-34Note 4 - Acquisitions and DisposalsNote 5 - Financial Risk Management and Fair Value Estimates F-44Note 5 - Financial Risk Management and Fair Value EstimatesNote 6 - Segment Information F-55Note 6 - Segment InformationNote 7 - Information About The Main Subsidiaries F-65Note 7 - Information About The Main SubsidiariesNote 8 - Investments in Associates and Joint Ventures F-66Note 8 - Investments in Associates and Joint VenturesNote 9 - Investment Properties F-69Note 9 - Investment PropertiesNote 10 - Property, Plant and Equipment F-74Note 10 - Property, Plant and EquipmentNote 11 - Trading Properties F-74Note 11 - Trading PropertiesNote 12 - Intangible Assets F-75Note 12 - Intangible AssetsNote 13 - Rights Of Use Of Assets F-76Note 13 - Rights Of Use Of AssetsNote 13 - RightsNote 14 - Biological Assets F-77Note 14 - Biological AssetsNote 15 - Inventories F-79Note 15 - InventoriesNote 16 - Financial Instruments By Category F-79Note 16 - Financial Instruments By CategoryNote 17 - Trade and Other Receivables F-83Note 17 - Trade and Other ReceivablesNote 18 - Cash Flow Information F-84Note 18 - Cash Flow InformationNote 19 - Shareholders Equity F-86Note 19 - Shareholders EquityNote 20 - Trade and Other Payables F-87Note 20 - Trade and Other PayablesNote 21 - Provisions F-87Note 21 - ProvisionsNote 22 - Borrowings F-90Note 22 - BorrowingsNote 23 - Income Tax F-92Note 23 - Income TaxNote 24 - Leases F-95Note 24 - LeasesNote 25 - Revenues F-96Note 25 - RevenuesNote 26 - Costs F-97Note 26 - CostsNote 27 - Expenses By Nature F-97Note 27 - Expenses By NatureNote 28 - Other Operating Results, Net F-98Note 28 - Other Operating Results, NetNote 29 - Financial Results, Net F-98Note 29 - Financial Results, NetNote 30 - Earnings Per Share F-99Note 30 - Earnings Per ShareNote 31 - Employee Benefits and Share-based Payments F-99Note 31 - Employee Benefits and Share-based PaymentsNote 32 - Related Party Transactions F-101Note 32 - Related Party TransactionsNote 33 - Cost Of Sales and Services Provided F-106Note 33 - Cost Of Sales and Services ProvidedNote 34 - Foreign Currency Assets and Liabilities F-107Note 34 - Foreign Currency Assets and LiabilitiesNote 35 - Groups Of Assets and Liabilities Held For Sale F-107Note 35 - Groups Of Assets and Liabilities Held For SaleNote 36 - Results From Discontinued Operations F-108Note 36 - Results From Discontinued OperationsNote 37 - Economic Framework Of The Group's Business F-108Note 37 - Economic Framework Of The Group's BusinessNote 38 - Subsequent Events F-111Note 38 - Subsequent EventsNote 06. 30.20 06. 30.19Note 06. 30.20 06. 30.19 06. 30.18Note 8 Includes Summary Financial Information and Other Information Of The Group's AssociatesNote 4 Acquisitions and DispositionsNote 10 Property, Plant and EquipmentNote 12 Intangible AssetsNote 2. 3 Scope Of ConsolidationNote 9 Investment PropertiesNote 23 TaxesNote 16 Trade and Other ReceivablesNote 16 Financial Instruments By CategoryNote 21 ProvisionsNote 13 Biological AssetsItem 06. 30.20 06. 30.19Item (3) / Currency Amount Of Foreign Currency (2) Prevailing Exchange Rate (1) Total As Of 06. 30.20 Total As Of 06. 30.19Item (3) / Currency