Table of Contents
UNITED STATES
SECURITIES AND EXCHANGE COMMISSION
| (Mark One) | WASHINGTON, D.C. 20549 |
FORM 20-F
☐ REGISTRATION STATEMENT PURSUANT TO SECTION 12(b) OR (g) OF THE SECURITIES EXCHANGE ACT OF 1934
OR
X ANNUAL REPORT PURSUANT TO SECTION 13 OR 15(d) OF THE SECURITIES EXCHANGE ACT OF 1934
For the fiscal year ended: December 31, 2019
OR
☐ TRANSITION REPORT PURSUANT TO SECTION 13 OR 15(d) OF THE SECURITIES EXCHANGE ACT OF 1934
For the transition period from to
OR
☐ SHELL COMPANY REPORT PURSUANT TO SECTION 13 OR 15(d) OF THE SECURITIES EXCHANGE ACT OF 1934
Date of event requiring this shell company report
Commission file number: 001-32846
CRH public limited company
(Exact name of Registrant as specified in its charter)
Republic of Ireland
(Jurisdiction of incorporation or organisation)
Stonemason’s Way, Rathfarnham, Dublin 16, Ireland
(Address of principal executive offices)
Senan Murphy
Tel: +353 1 404 1000
mail@crh.com
Stonemason’s Way, Rathfarnham, Dublin 16, Ireland
(Name, Telephone, Email and/or Facsimile number and Address of Company Contact Person)
Securities registered or to be registered pursuant to Section 12(b) of the Act.
| Title of each class | Trading symbol(s) | Name of each exchange on which registered | ||
|
CRH plc |
||||
|
Ordinary Shares/Income Shares of € 0.34 each |
New York Stock Exchange* |
|||
| American Depositary Shares, each representing the right to receive one Ordinary Share | CRH | New York Stock Exchange | ||
| CRH America Inc. | ||||
| 5.750% Notes due 2021 guaranteed by CRH plc | CRH/21 | New York Stock Exchange | ||
–
| * |
Not for trading but only in connection with the registration of American Depositary Shares, pursuant to the requirements of the Securities and Exchange Commission. |
Securities registered or to be registered pursuant to Section 12(g) of the Act. None
Securities for which there is a reporting obligation pursuant to Section 15(d) of the Act. None
Indicate the number of outstanding shares of each of the issuer’s classes of capital or common stock as of the close of the period covered by the annual report.
|
Ordinary Shares/Income Shares of € 0.34 each ** |
799,640,338 |
|||
|
5% Cumulative Preference Shares of € 1.27 each |
50,000 | |||
|
7% ‘A’ Cumulative Preference Shares of € 1.27 each |
872,000 |
–
| ** |
Each Income Share is tied to an Ordinary Share and may only be transferred or otherwise dealt with in conjunction with such Ordinary Share. |
Indicate by check mark if the registrant is a well-known seasoned issuer, as defined in Rule 405 of the Securities Act. Yes X No ☐
If this report is an annual or transition report, indicate by check mark if the registrant is not required to file reports pursuant to Section 13 or 15(d) of the Securities Exchange Act of 1934. Yes ☐ No X
Note – Checking the box above will not relieve any registrant required to file reports pursuant to Section 13 or 15(d) of the Securities Exchange Act of 1934 from their obligations under those Sections.
Indicate by check mark whether the registrant (1) has filed all reports required to be filed by Section 13 or 15(d) of the Securities Exchange Act of 1934 during the preceding 12 months (or for such shorter period that the registrant was required to file such reports), and (2) has been subject to such filing requirements for the past 90 days. Yes X No ☐
Indicate by check mark whether the registrant has submitted electronically every Interactive Data File required to be submitted pursuant to Rule 405 of Regulation S-T (§232.405 of this chapter) during the preceding 12 months (or for such shorter period that the registrant was required to submit such files). Yes X No ☐
Indicate by check mark whether the registrant is a large accelerated filer, an accelerated filer, a non-accelerated filer, or an emerging growth company. See definition of “large accelerated filer”, “accelerated filer”, and “emerging growth company” in Rule 12b-2 of the Exchange Act.
Large accelerated filer X Accelerated filer ☐ Non-accelerated filer ☐ Emerging Growth Company ☐
If an emerging growth company that prepares its financial statements in accordance with U.S. GAAP, indicate by check mark if the registrant has elected not to use the extended transition period for complying with any new or revised financial accounting standards† provided pursuant to Section 13(a) of the Exchange Act ☐
| † |
The term “new or revised financial accounting standard” refers to any update issued by the Financial Accounting Standards Board to its Accounting Standards Codification after April 5, 2012. |
Indicate by check mark which basis of accounting the registrant has used to prepare the financial statements included in this filing:
| U.S. GAAP ☐ | International Financial Reporting Standards as issued by the | Other ☐ | ||
| International Accounting Standards Board X |
If “Other” has been checked in response to the previous question, indicate by check mark which financial statement item the registrant has elected to follow. Item 17 ☐ Item 18 ☐
If this is an annual report, indicate by check mark whether the registrant is a shell company (as defined in Rule 12b-2 of the Exchange Act). Yes ☐ No X
Table of Contents
[THIS PAGE INTENTIONALLY LEFT BLANK]
Table of Contents

|
2019 Annual Report and Form 20-F |
Table of Contents

|
|
||||||||||||||||||||
| Overview | Business Performance | Financial Statements | ||||||||||||||||||
| CRH at a glance | 2 | Business Overview | 32 | Independent Auditor’s Reports | 125 | |||||||||||||||
| Chairman’s Introduction | 4 | Finance Director’s Review | 33 | Consolidated Income Statements | 128 | |||||||||||||||
| Strategy Review | Segmental Reviews | 40 | Accounting Policies | 133 | ||||||||||||||||
| Why Invest in Us | 8 | Governance |
Notes on Consolidated
Financial Statements |
145 |
||||||||||||||||
| Our Executive Leadership | 9 | Board of Directors | 56 | |||||||||||||||||
| Chief Executive’s Review | 10 | Corporate Governance Report | 60 |
Supplementary
20-F Disclosures |
||||||||||||||||
| Market Backdrop | 12 | Directors’ Remuneration Report | 74 | 224 | ||||||||||||||||
| Strategy | 14 | Directors’ Report | 102 | Shareholder Information | 248 | |||||||||||||||
| Business Model | 16 | Other Information | 260 | |||||||||||||||||
| Measuring Performance | 18 | Cross Reference to Form 20-F | 267 | |||||||||||||||||
| Sustainability | 20 | Index | 270 | |||||||||||||||||
| Risk Governance | 26 | |||||||||||||||||||
|
Our Business
CRH is the leading building materials business in the world. Our global footprint spans 30 countries, employing c. 80,300 people at over 3,100 operating locations, serving customers across the breadth of the building materials spectrum. |
|
This document constitutes the Annual Report and Financial Statements in accordance with Irish and UK requirements and the Annual Report on Form 20-F in accordance with the US Securities Exchange Act of 1934, for CRH plc for the year ended 31 December 2019. A cross reference to Form 20-F requirements is included on page 267.
The Directors’ Statements (comprising the Statement of Directors’ Responsibilities, the Viability Statement and the Directors’ Compliance Statement on pages 104 to 106), the Principal Risks and Uncertainties (on pages 108 to 113), the Independent Auditor’s Report (on pages 116 to 124) |
and the Parent Company financial statements of CRH plc (on pages 216 to 221) do not form part of CRH’s Annual Report on Form 20-F as filed with the Securities and Exchange Commission (SEC).
Forward-Looking Statements
This document contains forward-looking statements, which by their nature involve risk and uncertainty. Please see Disclaimer/Forward-Looking Statements on page 103 for more information about these statements and certain factors that may cause them to prove inaccurate. |
|
View the Report on our website: www.crh.com/investors/annual-reports/ |
|
Ergon, part of CRH’s Europe Materials Division, supplied 10,300m² of hollow-core floor slabs and 289 concrete beams
and columns for the construction of a new 15,000m² plumbing and heating distribution centre in Merelbeke, Belgium. |
Table of Contents

|
CRH ANNUAL REPORT AND FORM 20-F I 2019
|
1
|
|
2019 Performance Highlights
During 2019 the Europe Distribution business was classified as discontinued operations under IFRS 5 Non-Current Assets Held for Sale and Discontinued Operations (refer to note 3 to the Consolidated Financial Statements for further information). Accordingly, all references to income statement data are on a continuing operations basis throughout the Overview, Strategy Review and Business Performance sections (pages 2 to 51), unless otherwise stated.
* EBITDA is defined as earnings before interest, taxes, depreciation, amortisation, asset impairment charges, profit on disposals and the Group’s share of equity accounted investments’ profit after tax. 1. Details of how non-GAAP measures are calculated are set out on pages 225 to 228. |
Table of Contents
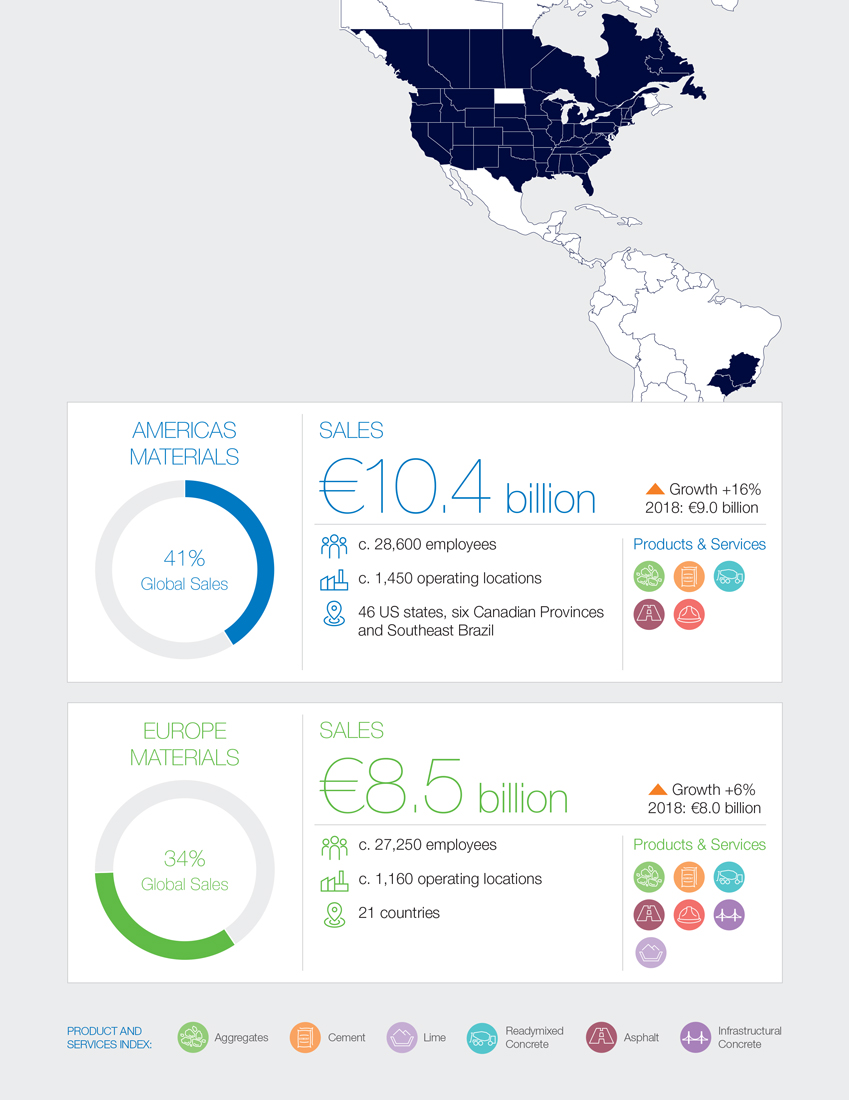
Table of Contents
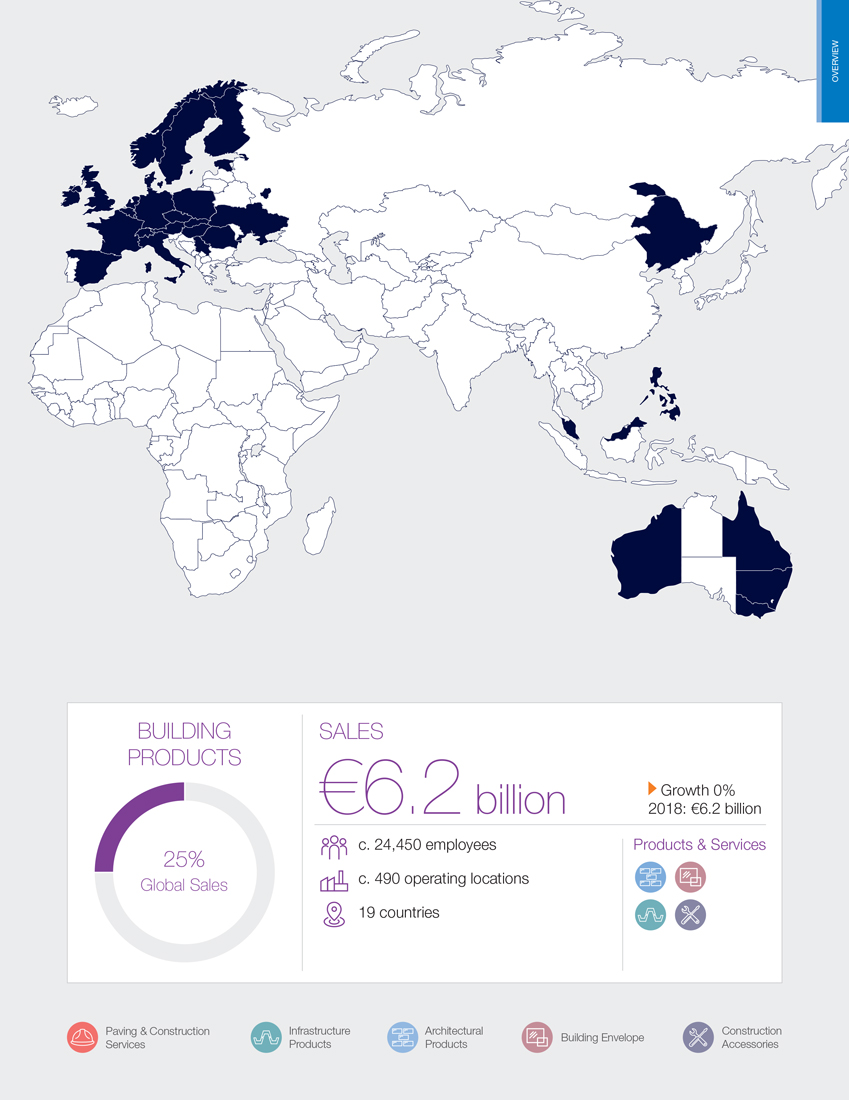
Table of Contents

| * |
EBITDA is defined as earnings before interest, taxes, depreciation, amortisation, asset impairment charges, profit on disposals and the Group’s share of equity accounted investments’ profit after tax. |
| 1. |
See cautionary statement regarding forward-looking statements on page 103. |
| 2. |
Net Debt/EBITDA (as defined)* is a non-GAAP measure as defined on page 227. The GAAP figures that are most directly comparable to the components of Net Debt/EBITDA (as defined)* include: interest-bearing loans and borrowings (2019: € 9,014 million; 2018: € 9,316 million) and profit after tax (2019: € 1,638 million; 2018: € 1,345 million). In line with the purpose of the metric, as set out on page 228, to “assess the Company’s level of indebtedness relative to its profitability and cash-generating capabilities”, the 2019 calculation is based on a continuing operations basis. For 2018, the Group net debt position includes debt related to operations discontinued in 2019 and therefore for comparability purposes the 2018 calculation uses EBITDA (as defined)* from continuing and discontinued operations. |
Table of Contents
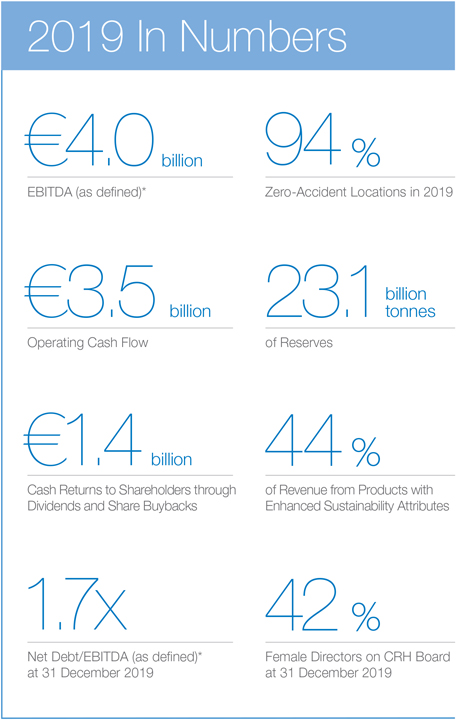

Table of Contents

|
Inclusion and diversity is an important focus area for all CRH operating companies. Staker Parson Materials
& Construction, part of CRH’s Americas Materials Division, supports an inclusive and diverse environment at its operations in Ogden, Utah, where it employs 300 people. |
Table of Contents

| Strategy Review |
| Why Invest in Us | 8 | |||||||
| Our Executive Leadership | 9 | |||||||
| Chief Executive’s Review | 10 | |||||||
| Market Backdrop | 12 | |||||||
| Strategy | 14 | |||||||
| Business Model | 16 | |||||||
| Measuring Performance | 18 | |||||||
| Sustainability | 20 | |||||||
| Risk Governance | 26 | |||||||
Table of Contents
| 8 |
CRH ANNUAL REPORT AND FORM 20-F I 2019
|
| * |
EBITDA is defined as earnings before interest, taxes, depreciation, amortisation, asset impairment charges, profit on disposals and the Group’s share of equity accounted investments’ profit after tax. |
| 1. |
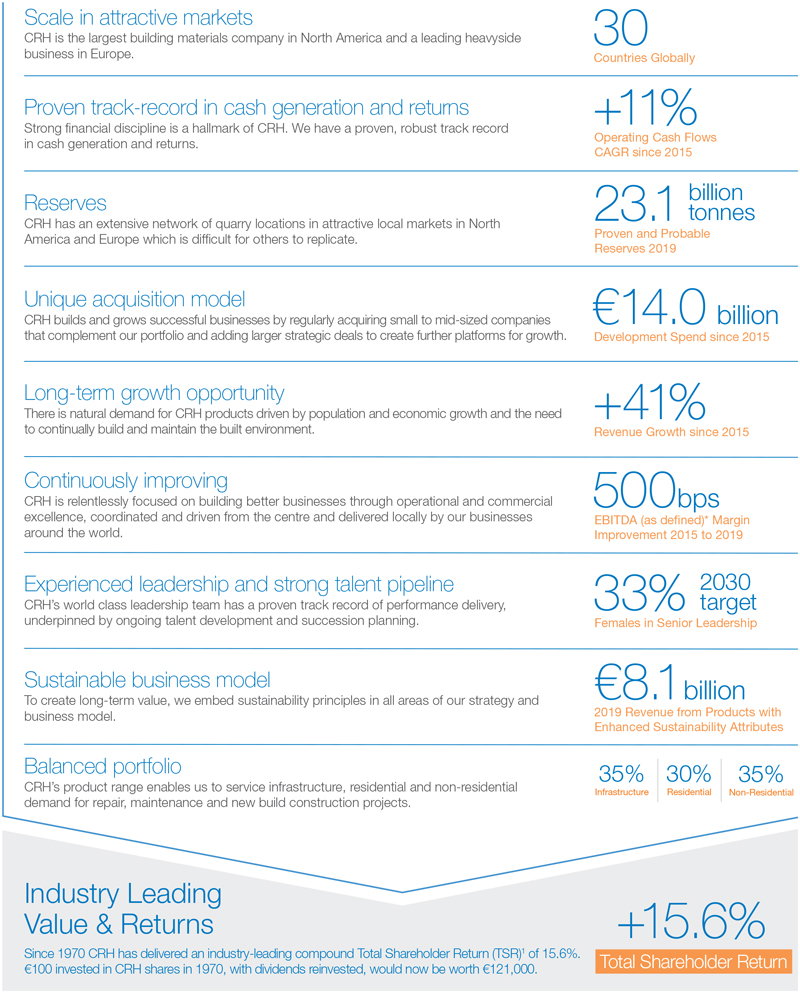
TSR represents the total accumulated value delivered to shareholders (via gross dividends reinvested and share appreciation). |
Table of Contents
|
CRH ANNUAL REPORT AND FORM 20-F I 2019
|
9
|


Table of Contents

| * |
EBITDA is defined as earnings before interest, taxes, depreciation, amortisation, asset impairment charges, profit on disposals and the Group’s share of equity accounted investments’ profit after tax. |
| 1. |
See cautionary statement regarding forward-looking statements on page 103. |
| 2. |
RONA is a non-GAAP measure as defined on page 226. The GAAP figures that are most directly comparable to the components of RONA include: Group operating profit (2019: € 2,494 million; 2018: € 2,071 million), total assets and total liabilities, respectively (2019: € 37,310 million and € 19,830 million respectively; 2018: € 35,173 million and € 18,619 million respectively). Details of how non-GAAP measures are calculated are set out on pages 225 to 228. |
Table of Contents
|
CRH ANNUAL REPORT AND FORM 20-F I 2019
|
11 |
Table of Contents
| 12 |
CRH ANNUAL REPORT AND FORM 20-F I 2019
|


Table of Contents
|
CRH ANNUAL REPORT AND FORM 20-F I 2019
|
13 |
Table of Contents
| 14 |
CRH ANNUAL REPORT AND FORM 20-F I 2019
|
Table of Contents
|
CRH ANNUAL REPORT AND FORM 20-F I 2019
|
15 |
Table of Contents
| 16 |
CRH ANNUAL REPORT AND FORM 20-F I 2019
|
Table of Contents
|
CRH ANNUAL REPORT AND FORM 20-F I 2019
|
17 |
Table of Contents
| 18 |
CRH ANNUAL REPORT AND FORM 20-F I 2019
|

Table of Contents
|
CRH ANNUAL REPORT AND FORM 20-F I 2019
|
19 |

Table of Contents
| 20 |
CRH ANNUAL REPORT AND FORM 20-F I 2019
|
Table of Contents
|
CRH ANNUAL REPORT AND FORM 20-F I 2019
|
21 |
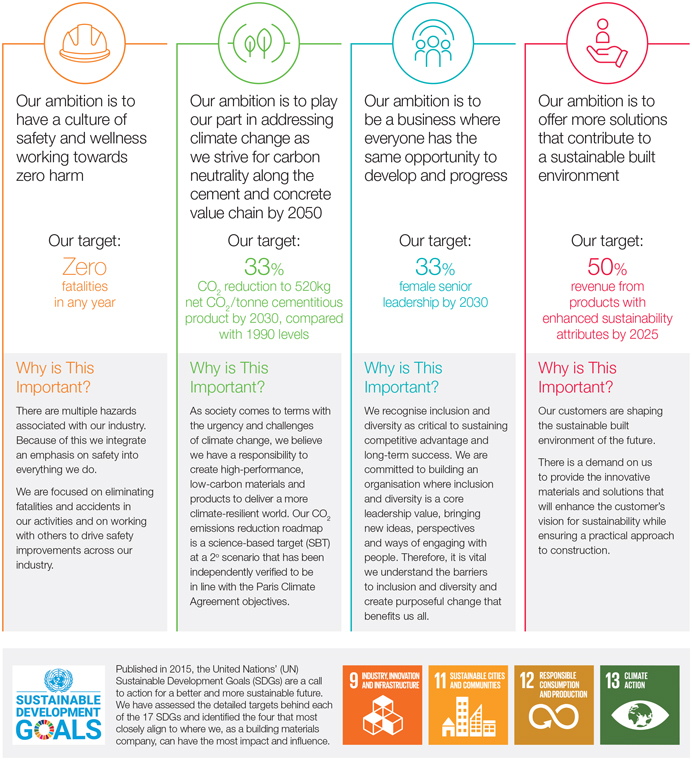
Table of Contents
| 22 |
CRH ANNUAL REPORT AND FORM 20-F I 2019
|
Table of Contents
|
CRH ANNUAL REPORT AND FORM 20-F I 2019
|
23 |
Table of Contents
| 24 |
CRH ANNUAL REPORT AND FORM 20-F I 2019
|

Table of Contents
|
CRH ANNUAL REPORT AND FORM 20-F I 2019
|
25 |
Table of Contents
| 26 |
CRH ANNUAL REPORT AND FORM 20-F I 2019
|


Table of Contents
|
CRH ANNUAL REPORT AND FORM 20-F I 2019
|
27 |


Table of Contents
| 28 |
CRH ANNUAL REPORT AND FORM 20-F I 2019
|
Table of Contents
|
CRH ANNUAL REPORT AND FORM 20-F I 2019
|
29 |
Table of Contents
| The Joliette cement plant in Quebec, Canada, part of CRH’s Americas Materials Division, supplies more than ten types of cement to customers across Canada and the Northeastern US. The plant has 180 employees and has been in operation for more than 50 years. It is a pioneer in the use of Alternative Fuels and Raw Material (AFR) in the cement production process, with more than 30% of fossil fuels replaced by alternative fuels. |
Table of Contents
Table of Contents
| 32 |
CRH ANNUAL REPORT AND FORM 20-F I 2019
|
Table of Contents


Table of Contents
| 34 |
CRH ANNUAL REPORT AND FORM 20-F I 2019
|
Table of Contents
|
CRH ANNUAL REPORT AND FORM 20-F I 2019
|
35 |
Table of Contents
| 36 |
CRH ANNUAL REPORT AND FORM 20-F I 2019
|
Table of Contents
|
CRH ANNUAL REPORT AND FORM 20-F I 2019
|
37 |
Table of Contents

| Roadstone, part of CRH’s Europe Materials Division, developed over 4,500m³ of high-strength concrete for The Rose Fitzgerald Kennedy Bridge in Ireland, which opened in January 2020. The three-tower, 887m extrados bridge is the longest of its type in the world. Extending more than 230m over the River Barrow, and with a 36-metre clearance, it provides vital connectivity for surrounding communities and for shipping navigation to the Port of New Ross. |
Table of Contents

Table of Contents
| 40 |
CRH ANNUAL REPORT AND FORM 20-F I 2019
|
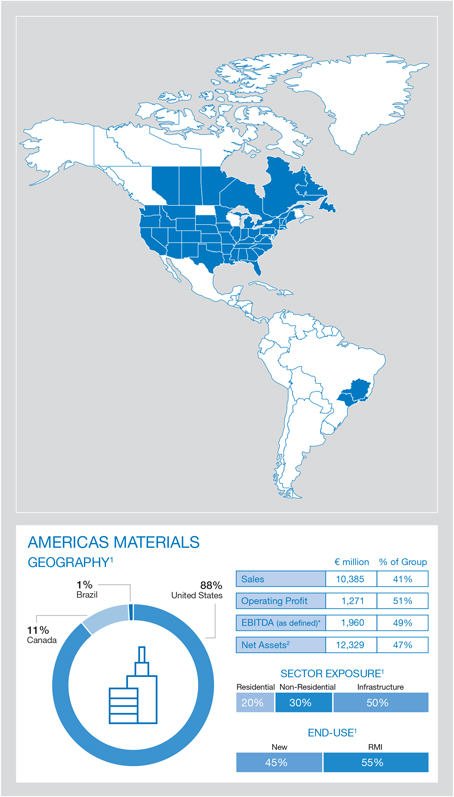
Table of Contents
|
CRH ANNUAL REPORT AND FORM 20-F I 2019
|
41 |

Table of Contents
| 42 |
CRH ANNUAL REPORT AND FORM 20-F I 2019
|
Table of Contents
|
CRH ANNUAL REPORT AND FORM 20-F I 2019
|
43 |
Table of Contents
| 44 |
CRH ANNUAL REPORT AND FORM 20-F I 2019
|
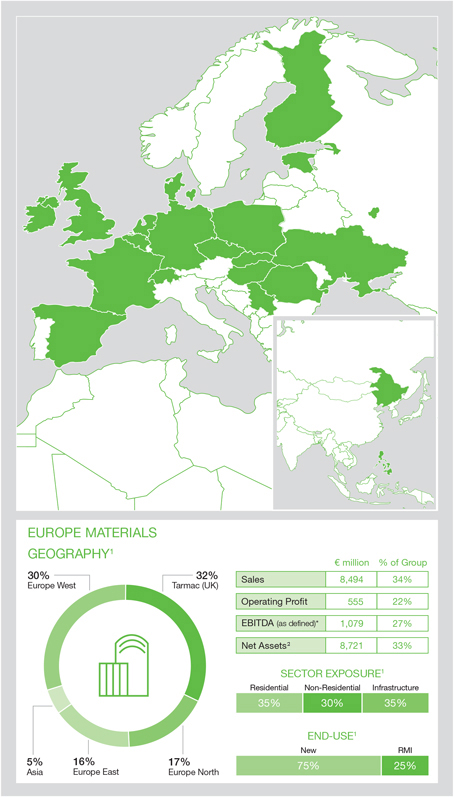
Table of Contents
|
CRH ANNUAL REPORT AND FORM 20-F I 2019
|
45 |
Table of Contents
| 46 |
CRH ANNUAL REPORT AND FORM 20-F I 2019
|
Table of Contents
|
CRH ANNUAL REPORT AND FORM 20-F I 2019
|
47 |
Table of Contents
| 48 |
CRH ANNUAL REPORT AND FORM 20-F I 2019
|
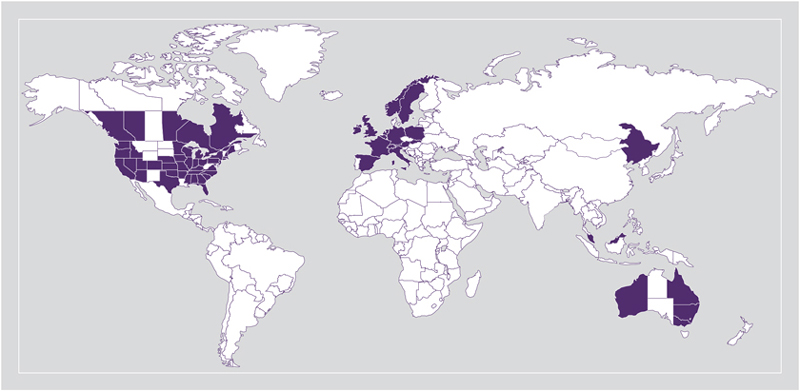

Table of Contents
|
CRH ANNUAL REPORT AND FORM 20-F I 2019
|
49 |

Table of Contents
| 50 |
CRH ANNUAL REPORT AND FORM 20-F I 2019
|
Table of Contents
|
CRH ANNUAL REPORT AND FORM 20-F I 2019
|
51 |
Table of Contents
| 52 |
CRH ANNUAL REPORT AND FORM 20-F I 2019
|
Table of Contents
|
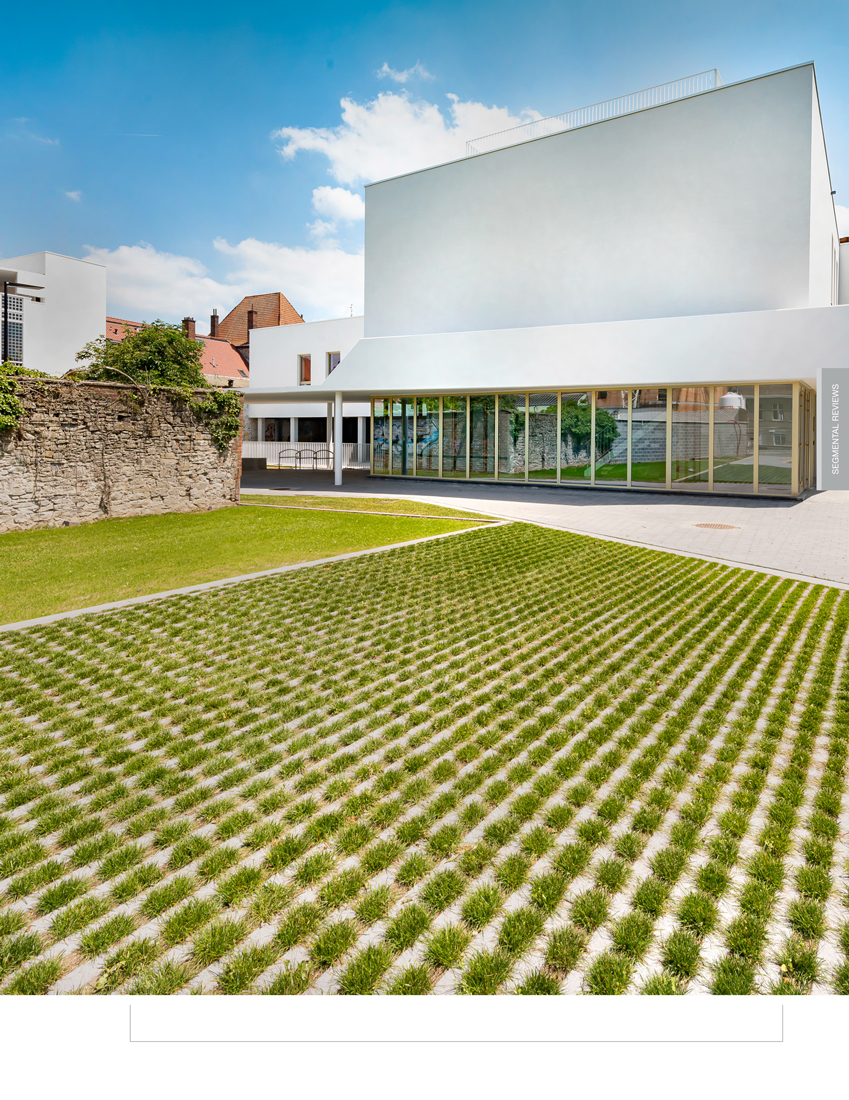
Stradus, part of CRH’s Building Products Division, supplied c.1,000 Hydro Lineo XL grass tiles to pave the surroundings of an office complex in Doornik, Belgium. The lattice structure allows water to slowly drain away, keeping the surface free from water while not overloading drainage systems.
|
Table of Contents

HALFEN, part of CRH’s Building Products Division, supplied 200 panel anchors to affix the facade of
the new Pavilion 6 of the Paris Expo Porte de Versailles exhibition centre. The centre, which is Europe’s
largest conference venue, welcomes more than 7.5 million visitors and hosts 200 events each year.
Table of Contents

|
Governance
|
|
|||||||||||
| 56 - 113 | Board of Directors | 56 | ||||||||||
| Corporate Governance Report | 60 | |||||||||||
| Directors’ Remuneration Report | 74 | |||||||||||
| Directors’ Report | 102 | |||||||||||
Table of Contents
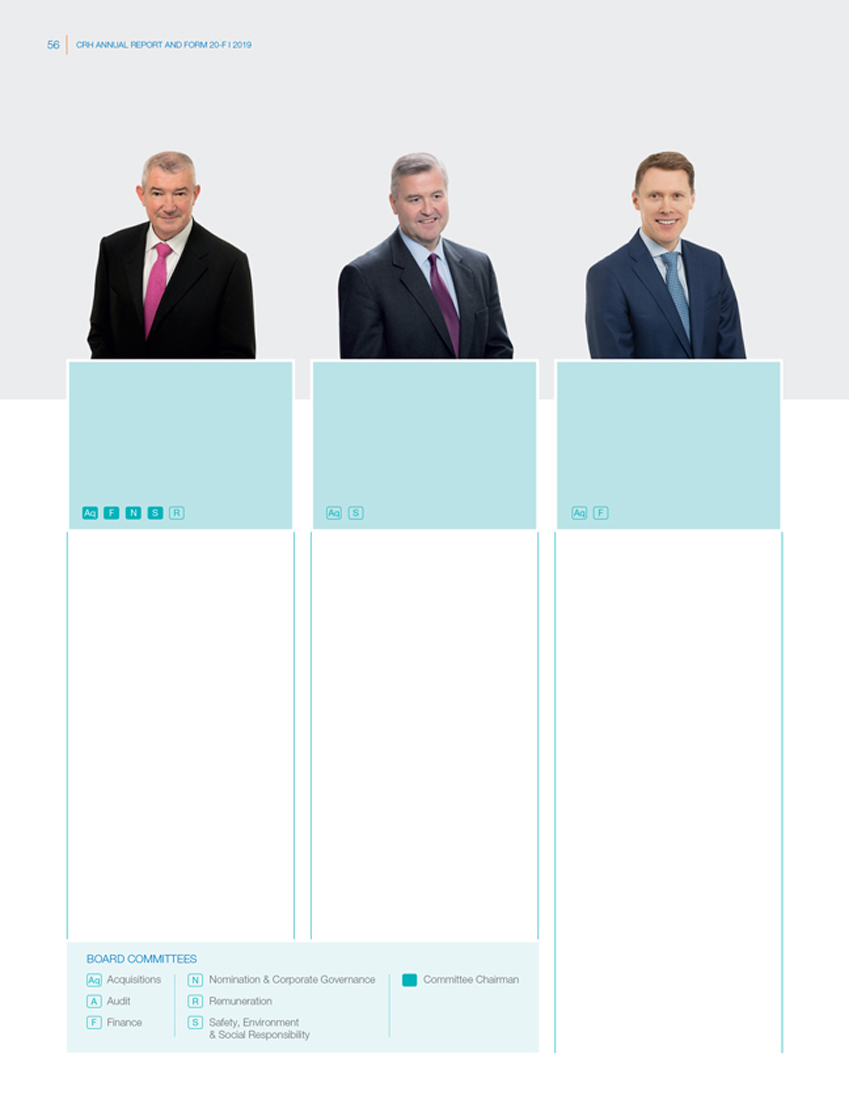
Table of Contents

|
Gillian L. Platt |
Johan Karlström |
Shaun Kelly |
||||||||||
|
Senior Independent Director |
Non-executive Director |
Non-executive Director |
||||||||||
|
Appointed to the Board: January 2017 |
Appointed to the Board: September 2019 |
Appointed to the Board: December 2019 |
||||||||||
|
Nationality: Canadian Age: 66 |
Nationality: Swedish Age: 63 |
Nationality: Dual United States and Irish |
||||||||||
|
Committee membership:
|
Committee membership:
|
Age: 60 Committee membership:
|
||||||||||
|
Skills and experience:
During the course of her executive career, Gillian has held a number of senior leadership positions in a variety of industries, geographies and roles including human resources, corporate affairs and strategy. Most recently she was Executive Vice President and Chief Human Resources Officer at Finning International, Inc. (the world’s largest Caterpillar equipment dealer) with global responsibility for human resources, talent development and communications. She previously held senior executive roles at Aviva, the multinational insurance company, as Executive Vice President Human Resources and Executive Vice President Strategy and Corporate Development.
Qualifications: Bachelor of Arts from the University of Western Ontario and a Masters of Education from the University of Toronto.
External appointments:
Listed: Non-executive Director and Chair of the Management Resources & Compensation Committee of Interfor Corporation, a Canadian listed company, which is one of the world’s largest providers of lumber.
Non-listed: Not applicable. |
Skills and experience:
Johan was President and Chief Executive Officer of Skanska AB, a leading multinational construction and project development company until 2017. Over a thirty-year career with Skanska, he held a variety of leadership roles in Europe and America, before becoming President and Chief Executive in 2008. He also served as President and Chief Executive Officer of BPA (now Bravida), a listed mechanical and installation group from 1996 to 2000.
Qualifications: Masters degree in Engineering from the KTH Royal Institute of Technology, Sweden.
External appointments:
Listed: Non-executive Director of Sandvik AB.
Non-listed: Not applicable. |
Skills and experience:
Shaun was until September 2019, the Global Chief Operating Officer of KPMG International, where he was responsible for the execution of the firm’s global strategy and for the delivery of various global initiatives. Over a thirty-year career with KPMG, the majority of which was spent in the US, he held a variety of senior leadership positions, including Partner in Charge, US Transaction Services (2001-2005), Vice Chair and Head of US Tax (2005 to 2010) and Vice Chair Operations and Chief Operating Officer Americas (2010 to 2015), before his appointment as Global Chief Operating Officer in 2015.
Qualifications: Fellow of Chartered Accountants Ireland and a US Certified Public Accountant. Shaun also holds a Bachelor of Commerce and Diploma in Professional Accounting from University College Dublin and an honorary doctorate from Queen’s University Belfast.
External appointments:
Listed: Not applicable.
Non-listed: Shaun holds a number of non-profit board memberships.
*Audit Committee Financial Expert as determined by the Board. |
||||||||||
Table of Contents

| Board of Directors - continued | ||||||||||||
|
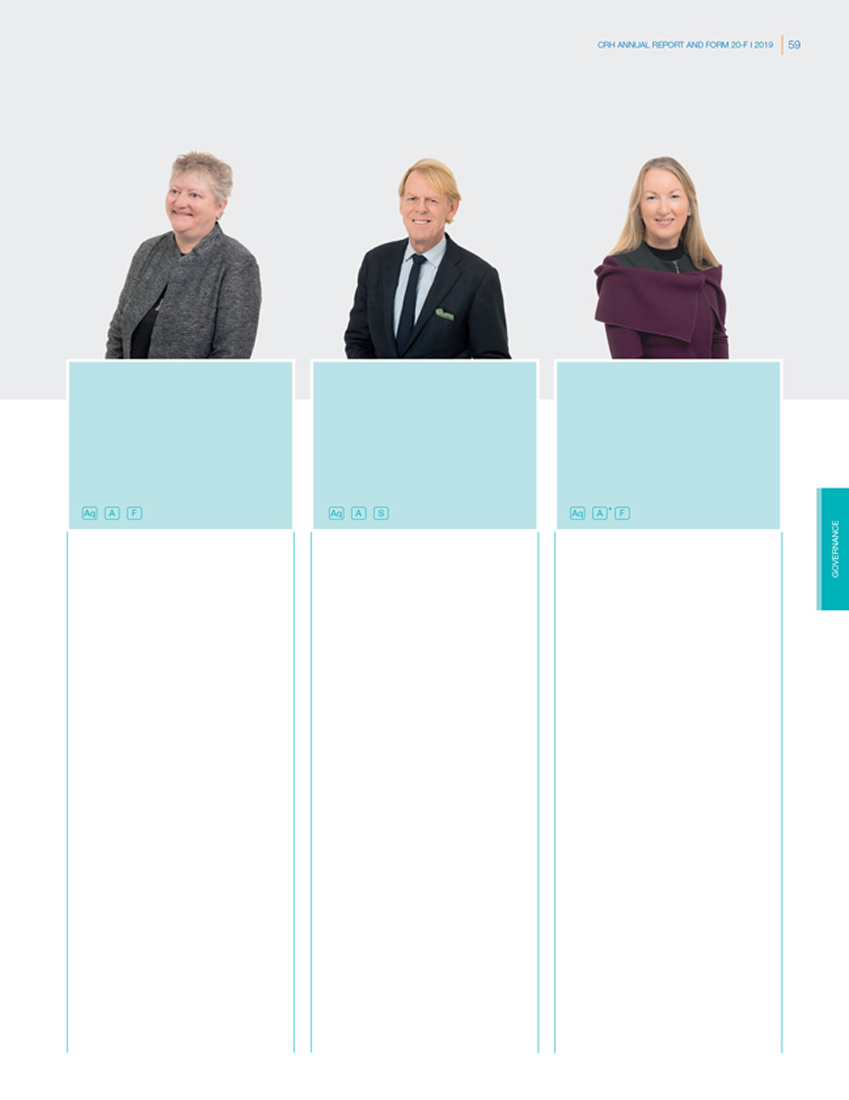
Patrick J. Kennedy |
Heather Ann McSharry |
Mary K. Rhinehart |
||||||||||
|
Non-executive Director |
Non-executive Director |
Non-executive Director |
||||||||||
|
Appointed to the Board: January 2015 |
Appointed to the Board: February 2012 |
Appointed to the Board: October 2018 |
||||||||||
|
Nationality: Irish Age: 66 |
Nationality: Irish Age: 58 |
Nationality: United States Age: 61 |
||||||||||
|
Committee membership: |
Committee membership: |
Committee membership: |
||||||||||
|
Skills and experience:
Pat was Chairman of the Executive Board of Directors of SHV Holdings (SHV), a large family-owned Dutch multinational company with a diverse portfolio of businesses, including the production and distribution of energy, the provision of industrial services, heavy lifting and transport solutions, cash and carry wholesale and the provision of private equity. During a 32 year career with SHV, he held various leadership roles across SHV’s diverse portfolio of businesses, while living in various parts of the world, and was a member of the Executive Board of SHV from 2001, before becoming Executive Chairman in 2006. He retired from SHV in mid-2014.
Qualifications: BComm, MBS.
External appointments:
Listed: Not applicable.
Non-listed: Member of the Supervisory Board of SHV Holdings N.V. |
Skills and experience:
Heather Ann is a former Managing Director Ireland of Reckitt Benckiser and Boots Healthcare and was previously a non-executive Director of Bank of Ireland plc and IDA Ireland.
Qualifications: BComm, MBS.
External appointments:
Listed: Non-executive Director of Greencore Group plc, Jazz Pharmaceuticals plc and Uniphar Group plc.
Non-listed: Director of the Institute of Directors in Ireland. |
Skills and experience:
Mary is Chairman, Chief Executive Officer and President of Johns Manville Corporation, a Berkshire Hathaway company, which is a leading global manufacturer of premium-quality building products and engineered specialty materials. Over nearly 40 years with Johns Manville she has held a wide range of global leadership roles, encompassing responsibility for business management and strategic business development and was also Chief Financial Officer. Mary was until recently a non-executive Director of Ply Gem Holdings Inc., a leader in exterior building products in North America, and lead Director of CoBiz Financial Inc.
Qualifications: Bachelor’s degree in Finance from the University of Colorado; MBA from the University of Denver.
External appointments:
Listed: Not applicable.
Non-listed: Chairman, Chief Executive Officer and President of Johns Manville Corporation and member of the Board of Trustees of the University of Denver.
*Audit Committee Financial Expert as determined by the Board. |
||||||||||
Table of Contents
|
|
||||||||||||
|
Lucinda J. Riches |
Henk Th. Rottinghuis |
Siobhán Talbot |
||||||||||
|
Non-executive Director |
Non-executive Director |
Non-executive Director |
||||||||||
|
Appointed to the Board: March 2015 |
Appointed to the Board: February 2014 |
Appointed to the Board: December 2018 |
||||||||||
|
Nationality: British Age: 58 |
Nationality: Dutch Age: 64 |
Nationality: Irish Age: 56 |
||||||||||
|
Committee membership: |
Committee membership: |
Committee membership: |
||||||||||
|
Skills and experience:
Lucinda spent the majority of her career in investment banking, including 21 years in UBS Investment Bank and its predecessor firms where she worked until 2007. She held senior management positions in the UK and the US, including Global Head and Chairman of UBS’ Equity Capital Markets Group and Vice Chairman of the Investment Banking Division.
Qualifications: Masters in Philosophy, Politics and Economics and a Masters in Political Science.
External appointments:
Listed: Non-executive Director of Ashtead Group plc, Greencoat UK Wind plc and ICG Enterprise Trust plc.
Non-listed: Non-executive Director of the British Standards Institution. |
Skills and experience:
Henk has a background in distribution, wholesale and logistics. Until 2010, he was Chief Executive Officer at Pon Holdings B.V., a large, privately held international company which is focused on the supply and distribution of passenger cars and trucks, and equipment for the construction and marine sectors. He was also a member of the Supervisory Boards of the Royal Bank of Scotland N.V., the food-retail group Detailresult Groep, the retail group Blokker Holding B.V. and Chairman of the Supervisory Board of Stork Technical Services B.V.
Qualifications: Masters degree in Dutch Law; PMD Harvard Business School.
External appointments:
Listed: Not applicable.
Non-listed: Chairman of Koole Terminals B.V. Henk also holds several non-profit board memberships. |
Skills and experience:
Siobhán is Group Managing Director of Glanbia plc, a global nutrition company with operations in 32 countries, a position she has held since 2013. She has been a member of the Glanbia Board since 2009 and was previously Finance Director, a role which encompassed responsibility for Glanbia’s strategic planning. Prior to joining Glanbia, she worked with PricewaterhouseCoopers in Dublin and Sydney.
Qualifications: Fellow of Chartered Accountants Ireland; Bachelor of Commerce; Diploma in Professional Accounting from University College Dublin.
External appointments:
Listed: Group Managing Director of Glanbia plc.
Non-listed: Director of the Irish Business Employers Confederation (IBEC).
*Audit Committee Financial Expert as determined by the Board. |
||||||||||
Table of Contents

| 1. |
The Governance Appendix is published in conjunction with the Directors’ Report in compliance with Section 1373 of the Companies Act 2014. For the purposes of Section 1373(2) of the Companies Act 2014, the Governance Appendix and the risk management disclosures on pages 26 to 29 and 108 to 113 form part of, and are incorporated by reference into, this Corporate Governance Report. |
The primary (premium) listing of CRH plc is on the LSE, with the listing on Euronext Dublin characterised as secondary. For this reason, CRH plc is not subject to the same ongoing listing requirements as would apply to an Irish company with a primary listing on Euronext Dublin. For further information, shareholders should consult their financial adviser. Further details on the Group’s listing arrangements, including its premium listing on the LSE, are set out on page 72.
Table of Contents
|
CRH ANNUAL REPORT AND FORM 20-F I 2019
|
61 |

Table of Contents
| 62 |
CRH ANNUAL REPORT AND FORM 20-F I 2019
|

Table of Contents
|
CRH ANNUAL REPORT AND FORM 20-F I 2019
|
63 |


Table of Contents
| 1. |
The Board has determined that all of the non-executive Directors on the Audit Committee are independent according to the requirements of Rule 10A.3 of the rules of the Securities and Exchange Commission (SEC) and Provision 10 of the 2018 Code. |
| 2. |
A copy of Section 404 of the Sarbanes Oxley Act 2002 can be obtained from the SEC’s website, www.sec.gov. |
Table of Contents
|
CRH ANNUAL REPORT AND FORM 20-F I 2019
|
65 |


Table of Contents
| 66 |
CRH ANNUAL REPORT AND FORM 20-F I 2019
|
Table of Contents
|
CRH ANNUAL REPORT AND FORM 20-F I 2019
|
67 |

Table of Contents

Table of Contents
|
CRH ANNUAL REPORT AND FORM 20-F I 2019
|
69 |


Table of Contents
| 70 |
CRH ANNUAL REPORT AND FORM 20-F I 2019
|
Table of Contents
|
CRH ANNUAL REPORT AND FORM 20-F I 2019
|
71 |
Table of Contents
| 72 |
CRH ANNUAL REPORT AND FORM 20-F I 2019
|
Table of Contents
|
CRH ANNUAL REPORT AND FORM 20-F I 2019
|
73 |
Table of Contents

Table of Contents
|
CRH ANNUAL REPORT AND FORM 20-F I 2019
|
75 |

Table of Contents
| 76 |
CRH ANNUAL REPORT AND FORM 20-F I 2019
|
Table of Contents
|
CRH ANNUAL REPORT AND FORM 20-F I 2019
|
77 |
Table of Contents
| 78 |
CRH ANNUAL REPORT AND FORM 20-F I 2019
|

Table of Contents
|
CRH ANNUAL REPORT AND FORM 20-F I 2019
|
79 |
Table of Contents
| 80 |
CRH ANNUAL REPORT AND FORM 20-F I 2019
|

Table of Contents
|
CRH ANNUAL REPORT AND FORM 20-F I 2019
|
81 |
Table of Contents
| 82 |
CRH ANNUAL REPORT AND FORM 20-F I 2019
|
Table of Contents
|
CRH ANNUAL REPORT AND FORM 20-F I 2019
|
83 |
Table of Contents
| 84 |
CRH ANNUAL REPORT AND FORM 20-F I 2019
|

Table of Contents
|
CRH ANNUAL REPORT AND FORM 20-F I 2019
|
85 |
Table of Contents
| 86 |
CRH ANNUAL REPORT AND FORM 20-F I 2019
|
Table of Contents

|
CRH is a leading provider of structural concrete to the Danish market. In 2019, CRH Denmark, part of our Europe Materials Division, supplied 15,000m² of materials to the ‘Karré 31’ project in the town of Holbaek, north-east of Copenhagen. Products included hollow-core floor slabs, walls and facades for the 17-story apartment building. |
Table of Contents
| 88 |
CRH ANNUAL REPORT AND FORM 20-F I 2019
|
Table of Contents
|
CRH ANNUAL REPORT AND FORM 20-F I 2019
|
89 |
Table of Contents
| 90 |
CRH ANNUAL REPORT AND FORM 20-F I 2019
|
Table of Contents
|
CRH ANNUAL REPORT AND FORM 20-F I 2019
|
91 |
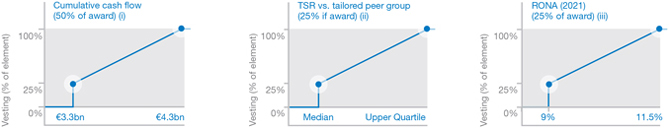
Table of Contents
| 92 |
CRH ANNUAL REPORT AND FORM 20-F I 2019
|
Table of Contents
|
CRH ANNUAL REPORT AND FORM 20-F I 2019
|
93 |
Table of Contents
| 94 |
CRH ANNUAL REPORT AND FORM 20-F I 2019
|
Table of Contents
|
CRH ANNUAL REPORT AND FORM 20-F I 2019
|
95 |
Table of Contents
| 96 |
CRH ANNUAL REPORT AND FORM 20-F I 2019
|

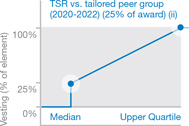
Table of Contents
|
CRH ANNUAL REPORT AND FORM 20-F I 2019
|
97 |
Table of Contents
| 98 |
CRH ANNUAL REPORT AND FORM 20-F I 2019
|
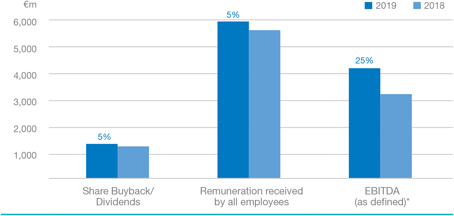
Table of Contents
|
CRH ANNUAL REPORT AND FORM 20-F I 2019
|
99 |
Table of Contents
| 100 |
CRH ANNUAL REPORT AND FORM 20-F I 2019
|
Table of Contents

|
Part of CRH’s Americas Materials Division and in operation since January 2005, Texas Materials’ plant at Seward Junction, located in the Greater Austin metropolitan area, includes a rail terminal to facilitate delivery of aggregates from the company’s nearby quarry in Marble Falls. The rail terminal was expanded in 2016 to help meet strong demand in what is the fastest growing large city in the US. |
Table of Contents
| 102 |
CRH ANNUAL REPORT AND FORM 20-F I 2019
|
Table of Contents
|
CRH ANNUAL REPORT AND FORM 20-F I 2019
|
103 |
Table of Contents
| 104 |
CRH ANNUAL REPORT AND FORM 20-F I 2019
|
Table of Contents
|
CRH ANNUAL REPORT AND FORM 20-F I 2019
|
105 |
Table of Contents
| 106 |
CRH ANNUAL REPORT AND FORM 20-F I 2019
|
Table of Contents
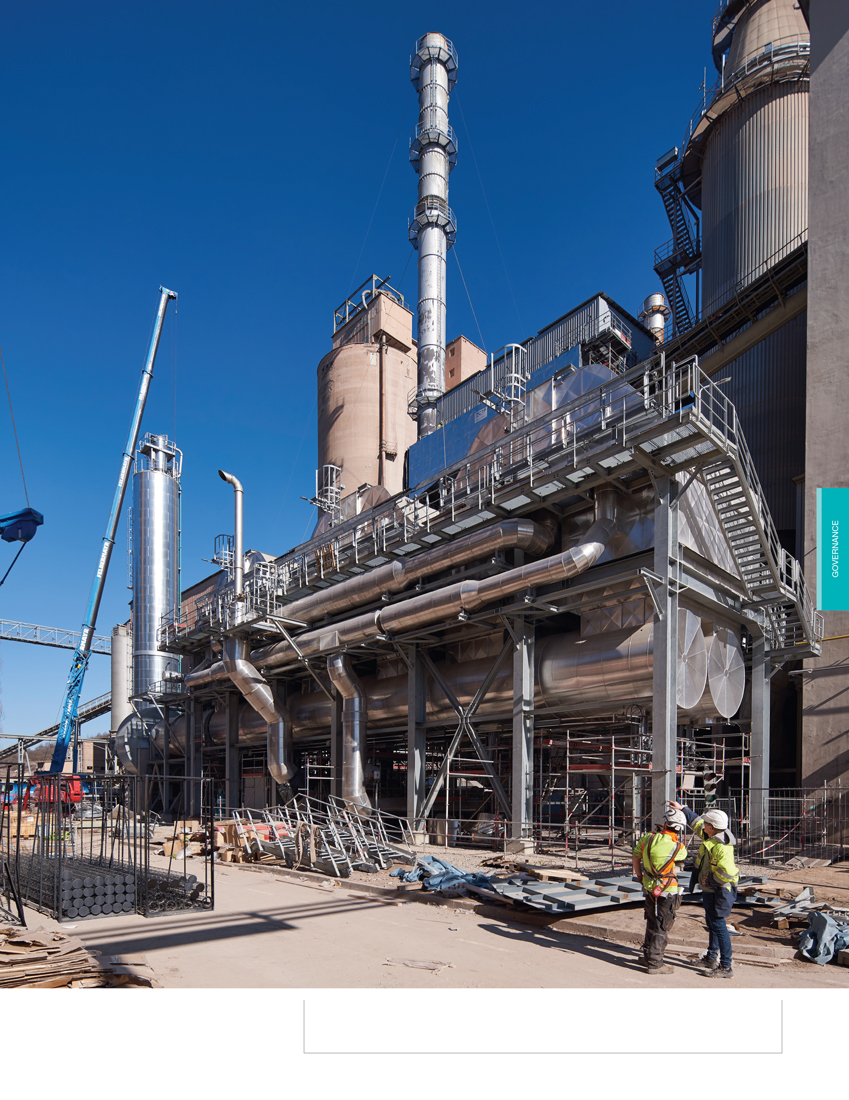
| In July 2019, OPTERRA, part of CRH’s Europe Materials Division and one of the leading cement producers in Germany, officially inaugurated a new exhaust gas purification system at its Karsdorf cement plant near Leipzig. The new filter technology, which includes a state-of-the-art AUTONOX ® Low Dust System installed on the existing kilns, enables the factory to comply with new limits for dust, ammonia and nitrogen oxide emissions. |
Table of Contents
| 108 |
CRH ANNUAL REPORT AND FORM 20-F I 2019
|
Table of Contents
|
CRH ANNUAL REPORT AND FORM 20-F I 2019
|
109 |
Table of Contents
| 110 |
CRH ANNUAL REPORT AND FORM 20-F I 2019
|
Table of Contents
|
CRH ANNUAL REPORT AND FORM 20-F I 2019
|
111 |
Table of Contents
| 112 |
CRH ANNUAL REPORT AND FORM 20-F I 2019
|
Table of Contents
|
CRH ANNUAL REPORT AND FORM 20-F I 2019
|
113 |
Table of Contents

Oldcastle Infrastructure, part of CRH’s Building Products Division, is supplying 2.1 miles of pre-fabricated concrete
box culverts to a storm water drainage project in downtown Tampa, Florida. The project will reduce flooding and
provide enhanced safety for pedestrians and vehicles. Construction is expected to be completed in 2021.
Table of Contents

| Financials |
Table of Contents
|
116 |
CRH ANNUAL REPORT AND FORM 20-F | 2019 |
Table of Contents
|
CRH ANNUAL REPORT AND FORM 20-F | 2019 |
117 |

Table of Contents
|
118 |
CRH ANNUAL REPORT AND FORM 20-F | 2019 |
[THIS PAGE INTENTIONALLY LEFT BLANK]
Table of Contents
|
CRH ANNUAL REPORT AND FORM 20-F | 2019 |
119 |
Table of Contents
|
120 |
CRH ANNUAL REPORT AND FORM 20-F | 2019 |
[THIS PAGE INTENTIONALLY LEFT BLANK]
Table of Contents
|
CRH ANNUAL REPORT AND FORM 20-F | 2019 |
121 |
Table of Contents
|
122 |
CRH ANNUAL REPORT AND FORM 20-F | 2019 |
[THIS PAGE INTENTIONALLY LEFT BLANK]
Table of Contents
|
CRH ANNUAL REPORT AND FORM 20-F | 2019 |
123 |
Table of Contents
|
124 |
CRH ANNUAL REPORT AND FORM 20-F | 2019 |
[THIS PAGE INTENTIONALLY LEFT BLANK]
Table of Contents
Table of Contents
|
126 |
CRH ANNUAL REPORT AND FORM 20-F | 2019 |
Independent Auditor’s US Reports - continued
| estimates and performed sensitivity analysis of significant assumptions to evaluate the change in the fair value of the CGUs resulting from changes in these assumptions. We involved valuation specialists to assist in our evaluation of the valuation methodology and comparison of key inputs to external market data (principally risk-free rates, country risk premium and inflation rates) used by management in calculating discount rates. | ||
| We also evaluated management’s disclosures in respect of impairment testing. | ||
| Assessment of the carrying value of property, plant and equipment and financial assets | ||
|
Description of the Matter |
At 31 December 2019, the Company’s carrying value of property, plant and equipment (PP&E) and financial assets was € 17.4 billion and € 0.7 billion respectively. As discussed in notes 15 and 17 of the financial statements, the carrying values of PP&E and financial assets are reviewed for indicators of impairment at each reporting date and are subject to impairment testing when events or changes in circumstances indicate that the carrying values may not be recoverable. For an asset that does not generate largely independent cash inflows, the recoverable amount is determined by reference to the CGU to which the asset belongs. | |
| Auditing management’s impairment test is complex and judgemental due to the significant estimation required in determining the fair value of the CGUs. In particular,judgemental aspects include assumptions of future profitability, revenue growth, margins and forecast cash flows, and the selection of appropriate discount rates. | ||
|
How We Addressed the Matter in Our Audit |
We obtained an understanding, evaluated the design and tested the operating effectiveness of controls over the Company’s impairment review process. For example, we tested controls over the Company’s review of significant assumptions, including future profitability, revenue growth, margins and forecast cash flows, and the selection of appropriate discount rates, among others. | |
| To test the estimated fair value of the Company CGUs where indicators of impairment existed, we performed audit procedures that included, among others, evaluation of the internal and external indicators of impairment used within the Company’s assessment, assessing fair values methodologies and testing the significant assumptions discussed above and the underlying data used by the Company in its analysis. We compared the significant assumptions used by management to external economic forecasts and construction activity measures, the Company’s historical results, and evaluated whether changes in the Company’s business would affect the significant assumptions. We assessed the historical accuracy of management’s estimates and performed sensitivity analysis of significant assumptions to evaluate the change in the fair value of the reporting units resulting from changes in these assumptions. We involved valuation specialists to assist in our evaluation of the valuation methodology and comparison of key inputs to external market data (principally risk-free rates, country risk premium and inflation rates) used by management in calculating discount rates. | ||
| Revenue recognition for construction contracts | ||
|
Description of the Matter |
At 31 December 2019, the Company’s revenue for construction contracts was € 5.9 billion. As discussed in note 1 of the financial statements, revenue yet to be recognised from fixed-price long-term construction contracts, primarily within the Europe Materials and Americas Materials businesses, amounted to € 1.9 billion at 31 December 2019. The majority of the Company’s construction contracts have a maturity within one year. | |
| Auditing management’s revenue recognition for construction contracts is complex and judgemental as such recognition is materially affected by changes in assumptions regarding the determination of the stage of completion, the timing of revenue recognition and the calculation under the percentage-of-completion method. In particular, judgemental aspects include assumptions of the estimated materials, hours, and other costs required to fulfil contractual performance obligations. | ||
|
How We Addressed the Matter in Our Audit |
We obtained an understanding, evaluated the design and tested the operating effectiveness of controls over the Company’s revenue recognition for construction contracts process. For example, we tested controls over the Company’s process for evaluating the estimated contract value, estimated and actual costs upon completion, including the estimation of units of measurement, and the amount of profit or loss to be recognised in accordance with IFRS 15. | |
| To test the revenue recognised by the Company, we performed audit procedures that included, among others, testing a sample of contracts and evaluating the original executed contract including any change orders. For these contracts, we tested key components of the cost to complete estimates and actual costs to date, including vouching materials, hours, and subcontractor costs to source documentation, and conducted interviews with and inspected questionnaires prepared by project personnel. We recalculated revenues recognised and assessed compliance with IFRS 15. In addition, our audit procedures included performing a retrospective review of estimated profit and costs to complete and enquiring of key personnel regarding adjustments for job costing and potential contract losses. | ||
ERNST & YOUNG
We have served as the Company’s auditor since 1988.
Dublin, Ireland
27 February 2020
Table of Contents
|
CRH ANNUAL REPORT AND FORM 20-F | 2019 |
127 |
Table of Contents
|
128 |
CRH ANNUAL REPORT AND FORM 20-F | 2019 |
for the financial year ended 31 December 2019
|
2019 € m |
Restated (i)
€ m |
Restated (i)
€ m |
||||||||||||
|
Notes |
||||||||||||||
|
1,2 |
Revenue |
25,129 | 23,241 | 21,653 | ||||||||||
|
4 |
Cost of sales |
(16,846) | (15,572) | (14,275) | ||||||||||
|
Gross profit |
8,283 | 7,669 | 7,378 | |||||||||||
|
4 |
Operating costs |
(5,789) | (5,598) | (5,451) | ||||||||||
|
2,5,7,8 |
Group operating profit |
2,494 | 2,071 | 1,927 | ||||||||||
|
2,6 |
(Loss)/profit on disposals |
(1) | (27) | 54 | ||||||||||
|
Profit before finance costs |
2,493 | 2,044 | 1,981 | |||||||||||
|
10 |
Finance costs |
(346) | (339) | (301) | ||||||||||
|
10 |
Finance income |
20 | 34 | 12 | ||||||||||
|
10 |
Other financial expense |
(112) | (46) | (59) | ||||||||||
|
11 |
Share of equity accounted investments’ profit |
60 | 48 | 52 | ||||||||||
|
2 |
Profit before tax from continuing operations |
2,115 | 1,741 | 1,685 | ||||||||||
|
12 |
Income tax expense |
(477) | (396) | (12) | ||||||||||
| Group profit for the financial year from continuing operations | 1,638 | 1,345 | 1,673 | |||||||||||
|
3 |
Profit after tax for the financial year from discontinued operations | 310 | 1,176 | 246 | ||||||||||
| Group profit for the financial year | 1,948 | 2,521 | 1,919 | |||||||||||
|
Profit attributable to: |
||||||||||||||
|
Equity holders of the Company |
||||||||||||||
|
From continuing operations |
1,620 | 1,342 | 1,650 | |||||||||||
|
From discontinued operations |
309 | 1,175 | 245 | |||||||||||
|
Non-controlling interests |
||||||||||||||
|
From continuing operations |
18 | 3 | 23 | |||||||||||
|
From discontinued operations |
1 | 1 | 1 | |||||||||||
|
Group profit for the financial year |
1,948 | 2,521 | 1,919 | |||||||||||
|
14 |
Basic earnings per Ordinary Share |
240.7c | 302.4c | 226.8c | ||||||||||
|
14 |
Diluted earnings per Ordinary Share |
238.8c | 300.9c | 225.4c | ||||||||||
|
14 |
Basic earnings per Ordinary Share from continuing operations | 202.2c | 161.2c | 197.4c | ||||||||||
|
14 |
Diluted earnings per Ordinary Share from continuing operations | 200.6c | 160.4c | 196.2c | ||||||||||
| (i) |
Restated to show the results of our former Europe Distribution segment in discontinued operations. See note 3 for further details. |
Table of Contents
Table of Contents
|
130 |
CRH ANNUAL REPORT AND FORM 20-F | 2019 |
as at 31 December 2019
|
2019 € m |
2018 € m |
|||||||||
|
Notes |
||||||||||
|
ASSETS |
||||||||||
|
Non-current assets |
||||||||||
|
15 |
Property, plant and equipment |
17,424 | 15,761 | |||||||
|
16 |
Intangible assets |
8,434 | 8,433 | |||||||
|
17 |
Investments accounted for using the equity method |
690 | 1,163 | |||||||
|
17 |
Other financial assets |
12 | 23 | |||||||
|
19 |
Other receivables |
317 | 181 | |||||||
|
27 |
Derivative financial instruments |
76 | 30 | |||||||
|
29 |
Deferred income tax assets |
67 | 71 | |||||||
|
Total non-current assets |
27,020 | 25,662 | ||||||||
|
Current assets |
||||||||||
|
18 |
Inventories |
2,742 | 3,061 | |||||||
|
19 |
Trade and other receivables |
3,767 | 4,074 | |||||||
|
Current income tax recoverable |
20 | 15 | ||||||||
|
27 |
Derivative financial instruments |
6 | 15 | |||||||
|
25 |
Cash and cash equivalents |
3,755 | 2,346 | |||||||
|
Total current assets |
10,290 | 9,511 | ||||||||
|
Total assets |
37,310 | 35,173 | ||||||||
|
EQUITY |
||||||||||
|
Capital and reserves attributable to the Company’s equity holders |
||||||||||
|
31 |
Equity share capital |
272 | 287 | |||||||
|
31 |
Preference share capital |
1 | 1 | |||||||
|
31 |
Share premium account |
6,534 | 6,534 | |||||||
|
31 |
Treasury Shares and own shares |
(325) | (792) | |||||||
|
Other reserves |
326 | 296 | ||||||||
|
Foreign currency translation reserve |
210 | (109) | ||||||||
|
Retained income |
9,922 | 9,812 | ||||||||
|
Capital and reserves attributable to the Company’s equity holders |
16,940 | 16,029 | ||||||||
|
33 |
Non-controlling interests |
540 | 525 | |||||||
|
Total equity |
17,480 | 16,554 | ||||||||
|
LIABILITIES |
||||||||||
|
Non-current liabilities |
||||||||||
|
22 |
Lease liabilities |
1,240 | - | |||||||
|
26 |
Interest-bearing loans and borrowings |
8,199 | 8,698 | |||||||
|
27 |
Derivative financial instruments |
1 | 18 | |||||||
|
29 |
Deferred income tax liabilities |
2,338 | 2,209 | |||||||
|
20 |
Other payables |
485 | 472 | |||||||
|
30 |
Retirement benefit obligations |
427 | 424 | |||||||
|
28 |
Provisions for liabilities |
760 | 719 | |||||||
|
Total non-current liabilities |
13,450 | 12,540 | ||||||||
|
Current liabilities |
||||||||||
|
22 |
Lease liabilities |
271 | - | |||||||
|
20 |
Trade and other payables |
4,376 | 4,609 | |||||||
|
Current income tax liabilities |
503 | 443 | ||||||||
|
26 |
Interest-bearing loans and borrowings |
815 | 618 | |||||||
|
27 |
Derivative financial instruments |
16 | 41 | |||||||
|
28 |
Provisions for liabilities |
399 | 368 | |||||||
|
Total current liabilities |
6,380 | 6,079 | ||||||||
|
Total liabilities |
19,830 | 18,619 | ||||||||
|
Total equity and liabilities |
37,310 | 35,173 | ||||||||
|
R. Boucher, A. Manifold, Directors |
||||||||||
Table of Contents
Table of Contents
|
132 |
CRH ANNUAL REPORT AND FORM 20-F | 2019 |
Consolidated Statement of Cash Flows
for the financial year ended 31 December 2019
|
2019 € m |
2018 € m |
2017 € m |
||||||||||||
|
Notes |
||||||||||||||
|
Cash flows from operating activities |
||||||||||||||
|
Profit before tax from continuing operations |
2,115 | 1,741 | 1,685 | |||||||||||
|
3 |
Profit before tax from discontinued operations |
333 | 1,679 | 328 | ||||||||||
|
Profit before tax |
2,448 | 3,420 | 2,013 | |||||||||||
|
10 |
Finance costs (net) |
445 | 351 | 349 | ||||||||||
|
11 |
Share of equity accounted investments’ profit |
(72) | (60) | (65) | ||||||||||
|
6 |
Profit on disposals |
(226) | (1,539) | (59) | ||||||||||
|
Group operating profit |
2,595 | 2,172 | 2,238 | |||||||||||
|
15,22 |
Depreciation charge |
1,538 | 1,071 | 1,006 | ||||||||||
|
16 |
Amortisation of intangible assets |
59 | 61 | 66 | ||||||||||
|
15,16 |
Impairment charge |
8 | 56 | - | ||||||||||
|
9 |
Share-based payment expense |
77 | 67 | 65 | ||||||||||
|
Other (primarily pension payments) |
(3) | (67) | (186) | |||||||||||
|
21 |
Net movement on working capital and provisions |
(64) | (463) | (209) | ||||||||||
|
Cash generated from operations |
4,210 | 2,897 | 2,980 | |||||||||||
|
Interest paid (including leases) (i) |
(419) | (335) | (317) | |||||||||||
|
Corporation tax paid |
(325) | (663) | (474) | |||||||||||
|
Net cash inflow from operating activities |
3,466 | 1,899 | 2,189 | |||||||||||
|
Cash flows from investing activities |
||||||||||||||
|
6 |
Proceeds from disposals (net of cash disposed and deferred proceeds) |
2,096 | 3,009 | 222 | ||||||||||
|
Interest received |
20 | 34 | 11 | |||||||||||
|
17 |
Dividends received from equity accounted investments |
35 | 48 | 31 | ||||||||||
|
15 |
Purchase of property, plant and equipment |
(1,229) | (1,121) | (1,044) | ||||||||||
|
32 |
Acquisition of subsidiaries (net of cash acquired) |
(650) | (3,505) | (1,841) | ||||||||||
|
17 |
Other investments and advances |
(29) | (2) | (11) | ||||||||||
|
21 |
Deferred and contingent acquisition consideration paid |
(48) | (55) | (53) | ||||||||||
|
Net cash inflow/(outflow) from investing activities |
195 | (1,592) | (2,685) | |||||||||||
|
Cash flows from financing activities |
||||||||||||||
|
31 |
Proceeds from issue of shares (net) |
- | 11 | 42 | ||||||||||
|
Proceeds from exercise of share options |
20 | 7 | - | |||||||||||
|
Transactions involving non-controlling interests |
(19) | - | (37) | |||||||||||
|
23 |
Increase in interest-bearing loans and borrowings |
91 | 1,434 | 1,010 | ||||||||||
|
23 |
Net cash flow arising from derivative financial instruments |
(36) | 6 | 169 | ||||||||||
|
10 |
Premium paid on early debt redemption |
- | - | (18) | ||||||||||
|
23 |
Repayment of interest-bearing loans, borrowings and finance leases (ii) |
(572) | (246) | (343) | ||||||||||
|
22 |
Repayment of lease liabilities (iii) |
(317) | - | - | ||||||||||
|
31 |
Treasury Shares/own shares purchased |
(852) | (792) | (3) | ||||||||||
|
13 |
Dividends paid to equity holders of the Company |
(584) | (521) | (469) | ||||||||||
|
13 |
Dividends paid to non-controlling interests |
(10) | (12) | (8) | ||||||||||
|
Net cash (outflow)/inflow from financing activities |
(2,279) | (113) | 343 | |||||||||||
|
Increase/(decrease) in cash and cash equivalents |
1,382 | 194 | (153) | |||||||||||
|
Reconciliation of opening to closing cash and cash equivalents |
||||||||||||||
|
Cash and cash equivalents at 1 January |
2,346 | 2,135 | 2,449 | |||||||||||
|
Translation adjustment |
27 | 17 | (161) | |||||||||||
|
Increase/(decrease) in cash and cash equivalents |
1,382 | 194 | (153) | |||||||||||
|
25 |
Cash and cash equivalents at 31 December |
3,755 | 2,346 | 2,135 | ||||||||||
| (i) |
Leases include finance leases previously capitalised under IAS 17 Leases in 2018 and 2017 and all capitalised leases included as lease liabilities under IFRS 16 Leases in 2019. |
| (ii) |
Finance leases as previously capitalised under IAS 17 in 2018 and 2017. |
| (iii) |
Repayment of lease liabilities capitalised under IFRS 16 in 2019 amounted to € 386 million, of which € 69 million related to interest paid which is presented in cash flows from operating activities. |
Table of Contents
Table of Contents
|
134 |
CRH ANNUAL REPORT AND FORM 20-F | 2019 |
Accounting Policies - continued
Primary statement line item / financial metric
|
As at 1 January 2019
€ m |
||||||
| Consolidated Balance Sheet | ||||||
|
Property, plant and equipment (i) (ii) |
+1,939 | |||||
| Lease liabilities; net debt (i) (ii) | +1,954 | |||||
|
For the year ended
31 December 2019 € m |
||||||
| Consolidated Income Statement | ||||||
|
Depreciation (i) |
+334 | |||||
|
Finance costs |
+69 | |||||
|
EPS (i) (iii) |
-3c | |||||
| Consolidated Statement of Cash Flows | ||||||
|
Net cash flow from operating activities |
+317 | |||||
| Net cash flow from financing activities | -317 | |||||
| (i) |
The operating profit and depreciation impact of IFRS 16 on discontinued operations included above are + € 4 million and + € 63 million respectively for the year ended 31 December 2019. The right-of-use asset and discounted lease liability related to discontinued operations are € 398 million as at 1 January 2019. |
| (ii) |
The impact of the adoption of IFRS 16 on property, plant and equipment and net debt is net of existing finance leases ( € 23 million at 31 December 2018) which have been recorded as part of the right-of-use assets and lease liabilities at their previous carrying amounts on 1 January 2019. |
| (iii) |
The impact of the adoption of IFRS 16 on operating profit for the year ended 31 December 2019 is € 0.05 billion and has been calculated based only on the portfolio of leases which existed at 1 January 2019. |
A reconciliation of the operating lease commitment previously reported under IAS 17 to the discounted lease liability as at 1 January 2019 under IFRS 16 is as follows:
|
As at 1 January 2019
€ m |
||||
|
Operating lease commitment under IAS 17 |
1,911 | |||
|
Lease extensions beyond break date |
632 | |||
|
Leases that are cancellable at any time |
35 | |||
|
Existing IAS 17 finance leases (i) |
23 | |||
|
Other lease payments not included in discounted lease liability under IFRS 16 (ii) |
(108) | |||
|
Undiscounted lease liability under IFRS 16 |
2,493 | |||
|
Less impact of discounting |
(516) | |||
|
Discounted lease liability under IFRS 16 |
1,977 | |||
| (i) |
Existing IAS 17 finance leases are presented at discounted amounts as the impact of discounting on these leases is not considered material. |
| (ii) |
Other lease payments not included in the discounted lease liability under IFRS 16 include payments related to short-term and low-value leases which were included in the operating lease commitment under IAS 17 but are exempt from capitalisation under IFRS 16. |
Table of Contents
|
CRH ANNUAL REPORT AND FORM 20-F | 2019 |
135 |
Table of Contents
|
136 |
CRH ANNUAL REPORT AND FORM 20-F | 2019 |
Accounting Policies - continued
Table of Contents
|
CRH ANNUAL REPORT AND FORM 20-F | 2019 |
137 |
Table of Contents
|
138 |
CRH ANNUAL REPORT AND FORM 20-F | 2019 |
Accounting Policies - continued
Table of Contents
|
CRH ANNUAL REPORT AND FORM 20-F | 2019 |
139 |
Table of Contents
|
140 |
CRH ANNUAL REPORT AND FORM 20-F | 2019 |
Accounting Policies - continued
Table of Contents
|
CRH ANNUAL REPORT AND FORM 20-F | 2019 |
141 |
Table of Contents
|
142 |
CRH ANNUAL REPORT AND FORM 20-F | 2019 |
Accounting Policies - continued
Table of Contents
|
CRH ANNUAL REPORT AND FORM 20-F | 2019 |
143 |
Table of Contents
|
144 |
CRH ANNUAL REPORT AND FORM 20-F | 2019 |
Accounting Policies - continued
The principal exchange rates used for the translation of results, cash flows and balance sheets into euro were as follows:
| Average | Year-end | |||||||||||||||||||||||
| euro 1 = | 2019 | 2018 | 2017 | 2019 | 2018 | |||||||||||||||||||
|
Brazilian Real |
4.4134 | 4.3085 | 3.6054 | 4.5157 | 4.4440 | |||||||||||||||||||
|
Canadian Dollar |
1.4855 | 1.5294 | 1.4647 | 1.4598 | 1.5605 | |||||||||||||||||||
|
Chinese Renminbi |
7.7355 | 7.8081 | 7.6290 | 7.8205 | 7.8751 | |||||||||||||||||||
|
Hungarian Forint |
325.2967 | 318.8897 | 309.1933 | 330.5300 | 320.9800 | |||||||||||||||||||
|
Indian Rupee |
78.8361 | 80.7332 | 73.5324 | 80.1870 | 79.7298 | |||||||||||||||||||
|
Philippine Peso |
57.9851 | 62.2101 | 56.9734 | 56.9000 | 60.1130 | |||||||||||||||||||
|
Polish Zloty |
4.2976 | 4.2615 | 4.2570 | 4.2568 | 4.3014 | |||||||||||||||||||
|
Pound Sterling |
0.8778 | 0.8847 | 0.8767 | 0.8508 | 0.8945 | |||||||||||||||||||
|
Romanian Leu |
4.7453 | 4.6540 | 4.5688 | 4.7830 | 4.6635 | |||||||||||||||||||
|
Serbian Dinar |
117.8377 | 118.2302 | 121.3232 | 117.8237 | 118.3157 | |||||||||||||||||||
|
Swiss Franc |
1.1124 | 1.1550 | 1.1117 | 1.0854 | 1.1269 | |||||||||||||||||||
|
Ukrainian Hryvnia |
28.8881 | 32.0987 | 30.0341 | 26.7377 | 31.6900 | |||||||||||||||||||
|
US Dollar |
1.1195 | 1.1810 | 1.1297 | 1.1234 | 1.1450 | |||||||||||||||||||
Table of Contents
Table of Contents
|
146 |
CRH ANNUAL REPORT AND FORM 20-F | 2019 |
1. Revenue - continued
|
Year ended 31 December |
||||||||||||||||||||||||||||||||||||
|
Americas
Materials (iii) 2019 |
Europe
Materials (iii) 2019 |
Building
Products 2019 |
Total
2019 |
Americas
Materials (iii) 2018 |
Europe
Materials (iii) 2018 |
Building
Products 2018 |
Total
2018 |
|||||||||||||||||||||||||||||
| Principal activities and products | € m | € m | € m | € m | € m | € m | € m | € m | ||||||||||||||||||||||||||||
|
Continuing operations |
||||||||||||||||||||||||||||||||||||
|
Cement, lime and cement products |
1,222 | 2,646 | - | 3,868 | 810 | 2,506 | - | 3,316 | ||||||||||||||||||||||||||||
|
Aggregates, asphalt and readymixed products |
5,046 | 3,061 | - | 8,107 | 4,330 | 2,919 | - | 7,249 | ||||||||||||||||||||||||||||
|
Construction contract activities* |
4,117 | 1,609 | 165 | 5,891 | 3,811 | 1,542 | 240 | 5,593 | ||||||||||||||||||||||||||||
|
Architectural products |
- | 955 | 2,664 | 3,619 | - | 903 | 2,597 | 3,500 | ||||||||||||||||||||||||||||
|
Infrastructure products |
- | 223 | 1,239 | 1,462 | - | 172 | 1,080 | 1,252 | ||||||||||||||||||||||||||||
|
Construction accessories |
- | - | 590 | 590 | - | - | 593 | 593 | ||||||||||||||||||||||||||||
| Architectural glass and glazing systems and wholesale hardware distribution | - | - | 1,592 | 1,592 | - | - | 1,431 | 1,431 | ||||||||||||||||||||||||||||
|
DIY |
- | - | - | - | - | - | 307 | 307 | ||||||||||||||||||||||||||||
|
Total Group from continuing operations |
10,385 | 8,494 | 6,250 | 25,129 | 8,951 | 8,042 | 6,248 | 23,241 | ||||||||||||||||||||||||||||
|
Discontinued operations |
||||||||||||||||||||||||||||||||||||
| Exterior and interior products - Americas Distribution | - | 7 | ||||||||||||||||||||||||||||||||||
| General Builders Merchants, DIY Germany and Sanitary, Heating & Plumbing - Europe Distribution | 3,177 | 3,549 | ||||||||||||||||||||||||||||||||||
|
Total Group |
28,306 | 26,797 | ||||||||||||||||||||||||||||||||||
| (iii) |
Americas Materials and Europe Materials both operate vertically integrated businesses, which are founded in resource-backed cement and aggregates assets and which support the manufacture and supply of aggregates, asphalt, cement, readymixed and precast concrete and landscaping products. Accordingly, for the purpose of disaggregation of revenue we have included certain products together, as this is how management review and evaluate this business line. |
|
* Revenue principally recognised over time. Construction contracts are generally completed within the same financial reporting year. |
Table of Contents
|
CRH ANNUAL REPORT AND FORM 20-F | 2019 |
147 |
2. Segment Information
|
* EBITDA is defined as earnings before interest, taxes, depreciation, amortisation, asset impairment charges, profit on disposals and the Group’s share of equity accounted investments’ profit after tax. |
Table of Contents
|
148 |
CRH ANNUAL REPORT AND FORM 20-F | 2019 |
2. Segment Information - continued
A. Operating segments disclosures - Consolidated Income Statement data
| Year ended 31 December | ||||||||||||||||||||||||||||||||||||||||||||||||||||||
| Revenue |
Group EBITDA
(as defined)* |
Depreciation,
amortisation and impairment |
Group
operating profit |
|||||||||||||||||||||||||||||||||||||||||||||||||||
|
2019
€ m |
2018
€ m |
2017
€ m |
2019
€ m |
2018
€ m |
2017
€ m |
2019
€ m |
2018
€ m |
2017
€ m |
2019
€ m |
2018
€ m |
2017
€ m |
|||||||||||||||||||||||||||||||||||||||||||
|
Continuing operations |
||||||||||||||||||||||||||||||||||||||||||||||||||||||
|
Americas Materials |
10,385 | 8,951 | 7,970 | 1,960 | 1,493 | 1,270 | 689 | 484 | 412 | 1,271 | 1,009 | 858 | ||||||||||||||||||||||||||||||||||||||||||
|
Europe Materials |
8,494 | 8,042 | 7,338 | 1,079 | 936 | 891 | 524 | 449 | 398 | 555 | 487 | 493 | ||||||||||||||||||||||||||||||||||||||||||
|
Building Products |
6,250 | 6,248 | 6,345 | 961 | 787 | 769 | 293 | 212 | 193 | 668 | 575 | 576 | ||||||||||||||||||||||||||||||||||||||||||
|
Total Group from continuing operations |
25,129 | 23,241 | 21,653 | 4,000 | 3,216 | 2,930 | 1,506 | 1,145 | 1,003 | 2,494 | 2,071 | 1,927 | ||||||||||||||||||||||||||||||||||||||||||
|
Discontinued operations |
||||||||||||||||||||||||||||||||||||||||||||||||||||||
|
Americas Distribution |
- | 7 | 2,343 | - | (5) | 164 | - | - | 21 | - | (5) | 143 | ||||||||||||||||||||||||||||||||||||||||||
|
Europe Distribution |
3,177 | 3,549 | 3,567 | 200 | 149 | 216 | 99 | 43 | 48 | 101 | 106 | 168 | ||||||||||||||||||||||||||||||||||||||||||
|
Total Group |
28,306 | 26,797 | 27,563 | 4,200 | 3,360 | 3,310 | 1,605 | 1,188 | 1,072 | 2,595 | 2,172 | 2,238 | ||||||||||||||||||||||||||||||||||||||||||
|
Group operating profit from continuing operations |
|
2,494 | 2,071 | 1,927 | ||||||||||||||||||||||||||||||||||||||||||||||||||
|
(Loss)/profit on disposals (i) |
(1) | (27) | 54 | |||||||||||||||||||||||||||||||||||||||||||||||||||
|
Finance costs less income |
(326) | (305) | (289) | |||||||||||||||||||||||||||||||||||||||||||||||||||
|
Other financial expense |
(112) | (46) | (59) | |||||||||||||||||||||||||||||||||||||||||||||||||||
|
Share of equity accounted investments’ profit (ii) |
|
60 | 48 | 52 | ||||||||||||||||||||||||||||||||||||||||||||||||||
|
Profit before tax from continuing operations |
|
2,115 | 1,741 | 1,685 | ||||||||||||||||||||||||||||||||||||||||||||||||||
|
(i) (Loss)/profit on
disposals (note 6) |
(ii) Share of equity
accounted investments’ profit (note 11) |
|||||||||||||||||||||||||||||||||||||||||
|
Americas Materials |
2 | 44 | 29 | 38 | 25 | 32 | ||||||||||||||||||||||||||||||||||||
|
Europe Materials |
(131) | 7 | 19 | 13 | 18 | 18 | ||||||||||||||||||||||||||||||||||||
|
Building Products |
128 | (78) | 6 | 9 | 5 | 2 | ||||||||||||||||||||||||||||||||||||
|
Total Group from continuing operations |
(1) | (27) | 54 | 60 | 48 | 52 | ||||||||||||||||||||||||||||||||||||
|
* EBITDA is defined as earnings before interest, taxes, depreciation, amortisation, asset impairment charges, profit on disposals and the Group’s share of equity accounted investments’ profit after tax. |
Table of Contents
|
CRH ANNUAL REPORT AND FORM 20-F | 2019 |
149 |
Table of Contents
|
150 |
CRH ANNUAL REPORT AND FORM 20-F | 2019 |
2. Segment Information - continued
D. Information about geographical areas
The non-current assets (as defined in IFRS 8) attributable to the country of domicile and all foreign countries of operation, for which revenue exceeds 10% of total external Group revenue, are set out below.
| As at 31 December | ||||||||
| Non-current assets* | ||||||||
| 2019 | 2018 | |||||||
| € m | € m | |||||||
|
Republic of Ireland (country of domicile) |
506 | 495 | ||||||
|
United Kingdom |
2,772 | 2,461 | ||||||
|
United States |
14,259 | 12,925 | ||||||
|
Other |
9,011 | 9,476 | ||||||
|
Total Group |
26,548 | 25,357 | ||||||
3. Assets Held for Sale and Discontinued Operations
A. Profit on disposal of discontinued operations
In October 2019, the Group completed the divestment of its Europe Distribution business, formerly part of our Building Products segment. With the exception of our Europe Distribution business, no other businesses divested in 2019 are considered to be either separate major lines of business or geographical areas of operation and therefore do not constitute discontinued operations as defined in IFRS 5 Non-Current Assets Held for Sale and Discontinued Operations .
In January 2018, the Group completed the divestment of its 100% holding in Allied Building Products, the trading name of our former Americas Distribution segment, which was considered a discontinued operation in 2018 and was classified accordingly.
Assets and liabilities that met the IFRS 5 criteria at 31 December 2019 have not been separately disclosed as held for sale as they were not considered material in the context of the Group.
The table overleaf sets out the proceeds and related profit recognised on divestment which is included in profit after tax for the financial year from discontinued operations.
|
* Non-current assets comprise property, plant and equipment, intangible assets and investments accounted for using the equity method. |
Table of Contents
|
CRH ANNUAL REPORT AND FORM 20-F | 2019 |
151 |
|
* EBITDA is defined as earnings before interest, taxes, depreciation, amortisation, asset impairment charges, profit on disposals and the Group’s share of equity accounted investments’ profit after tax. |
Table of Contents
|
152 |
CRH ANNUAL REPORT AND FORM 20-F | 2019 |
4. Cost Analysis
Continuing operations
|
2019 € m |
2018 € m |
2017 € m |
||||||||||
| Cost of sales analysis | ||||||||||||
|
Raw materials and goods for resale |
5,216 | 5,058 | 4,785 | |||||||||
|
Employment costs (note 7) |
3,467 | 3,155 | 2,869 | |||||||||
|
Energy conversion costs |
1,307 | 1,222 | 1,004 | |||||||||
|
Repairs and maintenance |
980 | 882 | 811 | |||||||||
|
Depreciation, amortisation and impairment (i) |
1,225 | 939 | 830 | |||||||||
|
Change in inventory |
(62) | (179) | (117) | |||||||||
|
Other production expenses (primarily sub-contractor costs) |
4,713 | 4,495 | 4,093 | |||||||||
|
Total |
16,846 | 15,572 | 14,275 | |||||||||
|
Operating costs analysis |
||||||||||||
|
Selling and distribution costs |
4,062 | 3,822 | 3,561 | |||||||||
|
Administrative expenses |
1,727 | 1,776 | 1,890 | |||||||||
|
Total |
5,789 | 5,598 | 5,451 | |||||||||
|
(i) Depreciation, amortisation and impairment analysis |
| Cost of sales | Operating costs | Total | ||||||||||||||||||||||||||||||||||||||||||
|
2019 € m |
2018 € m |
2017 € m |
2019 € m |
2018 € m |
2017 € m |
2019 € m |
2018 € m |
2017 € m |
||||||||||||||||||||||||||||||||||||
|
Depreciation and depletion (note 15, 22) |
1,219 | 903 | 830 | 223 | 127 | 121 | 1,442 | 1,030 | 951 | |||||||||||||||||||||||||||||||||||
|
Amortisation of intangible assets (note 16) |
- | - | - | 57 | 59 | 52 | 57 | 59 | 52 | |||||||||||||||||||||||||||||||||||
|
Impairment of property, plant and equipment (note 15) |
6 | 36 | - | 1 | - | - | 7 | 36 | - | |||||||||||||||||||||||||||||||||||
|
Impairment of intangible assets (note 16) |
- | - | - | - | 20 | - | - | 20 | - | |||||||||||||||||||||||||||||||||||
|
Total |
1,225 | 939 | 830 | 281 | 206 | 173 | 1,506 | 1,145 | 1,003 | |||||||||||||||||||||||||||||||||||
Table of Contents
|
CRH ANNUAL REPORT AND FORM 20-F | 2019 |
153 |
5. Auditor’s Remuneration
Continuing operations
Table of Contents
|
154 |
CRH ANNUAL REPORT AND FORM 20-F | 2019 |
6. Business and Non-Current Asset Disposals
| Business disposals |
Disposal of other
non-current assets |
Total |
||||||||||||||||||||||||||||||||||||||||||
|
2019
€ m |
2018
€ m |
2017
€ m |
2019
€ m |
2018
€ m |
2017
€ m |
2019
€ m |
2018
€ m |
2017
€ m |
||||||||||||||||||||||||||||||||||||
|
Continuing operations |
||||||||||||||||||||||||||||||||||||||||||||
| Assets/(liabilities) disposed of at net carrying amount: | ||||||||||||||||||||||||||||||||||||||||||||
|
- non-current assets |
596 | 622 | 47 | 140 | 56 | 78 | 736 | 678 | 125 | |||||||||||||||||||||||||||||||||||
|
- cash and cash equivalents |
45 | 60 | 11 | - | - | - | 45 | 60 | 11 | |||||||||||||||||||||||||||||||||||
|
- working capital and provisions |
83 | 132 | 29 | - | - | - | 83 | 132 | 29 | |||||||||||||||||||||||||||||||||||
|
- current tax |
(1) | (2) | - | - | - | - | (1) | (2) | - | |||||||||||||||||||||||||||||||||||
|
- lease liabilities |
(48) | - | - | (29) | - | - | (77) | - | - | |||||||||||||||||||||||||||||||||||
|
- deferred tax |
(3) | (2) | 2 | - | - | - | (3) | (2) | 2 | |||||||||||||||||||||||||||||||||||
|
- retirement benefit obligations |
(2) | (6) | - | - | - | - | (2) | (6) | - | |||||||||||||||||||||||||||||||||||
|
Net assets disposed |
670 | 804 | 89 | 111 | 56 | 78 | 781 | 860 | 167 | |||||||||||||||||||||||||||||||||||
| Reclassification of currency translation effects on disposal | 66 | 15 | 9 | - | - | - | 66 | 15 | 9 | |||||||||||||||||||||||||||||||||||
|
Total |
736 | 819 | 98 | 111 | 56 | 78 | 847 | 875 | 176 | |||||||||||||||||||||||||||||||||||
|
Proceeds from disposals (net of disposal costs) |
699 | 697 | 99 | 147 | 100 | 131 | 846 | 797 | 230 | |||||||||||||||||||||||||||||||||||
|
Asset exchange (note 32) |
- | 12 | - | - | - | - | - | 12 | - | |||||||||||||||||||||||||||||||||||
|
Profit on step acquisition (note 32) |
- | 39 | - | - | - | - | - | 39 | - | |||||||||||||||||||||||||||||||||||
| (Loss)/profit on disposals from continuing operations | (37) | (71) | 1 | 36 | 44 | 53 | (1) | (27) | 54 | |||||||||||||||||||||||||||||||||||
|
Discontinued operations |
||||||||||||||||||||||||||||||||||||||||||||
| Profit on disposals from discontinued operations (note 3) | 224 | 1,563 | - | 3 | 3 | 5 | 227 | 1,566 | 5 | |||||||||||||||||||||||||||||||||||
|
Total Group profit on disposals |
187 | 1,492 | 1 | 39 | 47 | 58 | 226 | 1,539 | 59 | |||||||||||||||||||||||||||||||||||
|
Net cash inflow arising on disposal |
||||||||||||||||||||||||||||||||||||||||||||
|
Continuing operations |
||||||||||||||||||||||||||||||||||||||||||||
| Proceeds from disposals from continuing operations | 699 | 697 | 99 | 147 | 100 | 131 | 846 | 797 | 230 | |||||||||||||||||||||||||||||||||||
|
Less: cash and cash equivalents disposed |
(45) | (60) | (11) | - | - | - | (45) | (60) | (11) | |||||||||||||||||||||||||||||||||||
| Less: deferred proceeds arising on disposal (note 21) (i) | (269) | (10) | (3) | - | - | - | (269) | (10) | (3) | |||||||||||||||||||||||||||||||||||
| Less: investment and loan to associate in lieu of cash proceeds (note 17) (ii) | - | (85) | - | - | - | - | - | (85) | - | |||||||||||||||||||||||||||||||||||
| Net cash inflow arising on disposal from continuing operations | 385 | 542 | 85 | 147 | 100 | 131 | 532 | 642 | 216 | |||||||||||||||||||||||||||||||||||
|
Discontinued operations |
||||||||||||||||||||||||||||||||||||||||||||
| Net cash inflow arising on disposal from discontinued operations (note 3) | 1,563 | 2,361 | - | 1 | 6 | 6 | 1,564 | 2,367 | 6 | |||||||||||||||||||||||||||||||||||
|
Total Group net cash inflow arising on disposal |
1,948 | 2,903 | 85 | 148 | 106 | 137 | 2,096 | 3,009 | 222 | |||||||||||||||||||||||||||||||||||
| (i) |
On 31 December, CRH completed the sale of the Group’s 50% stake in its joint venture in India, MHIL for deferred proceeds of € 0.3 billion which will be received in several agreed tranches. |
|
For the purposes of compliance with Indian law requirements, CRH is obliged to retain a minority shareholding and associated minority board representation in MHIL both of which will further reduce as the tranches are completed. The Group no longer has any rights to share in the profit/loss of MHIL or to receive any dividends. CRH has determined that MHIL has ceased to be a joint venture or an associate as the Group is no longer exposed to variability of returns from the performance of MHIL and does not have significant influence (as defined under IAS 28 Interests in Associates and Joint Ventures ) over MHIL. With the other partners acting in concert to exercise control, CRH effectively retains only protective voting rights in defined limited circumstances. Accordingly, the Group has discontinued the use of the equity method of accounting for its interest in MHIL from 31 December 2019. The fair value of the retained interest in MHIL is recorded as a financial asset within Other Receivables as it represents a contractual right to receive cash. |
| (ii) |
In 2018, as part of the divestment of our DIY business in Belgium and the Netherlands (see note 16 and note 17 for further details) we acquired an equity stake of 22.78% in, and advanced a loan of € 50 million to the purchaser, Intergamma, which was repaid in 2019. |
Table of Contents
|
CRH ANNUAL REPORT AND FORM 20-F | 2019 |
155 |
7. Employment
Continuing operations
Table of Contents
|
156 |
CRH ANNUAL REPORT AND FORM 20-F | 2019 |
9. Share-based Payment Expense
Continuing operations
|
2019 € m |
2018 € m |
2017 € m |
||||||||||
|
Performance Share Plans and Restricted Share Plan expense |
71 | 62 | 55 | |||||||||
|
Share option expense |
3 | 3 | 3 | |||||||||
|
Total share-based payment expense (i) |
74 | 65 | 58 | |||||||||
| (i) |
The total share-based payment expense including discontinued operations amounted to € 77 million (2018: € 67 million; 2017: € 65 million). |
Share-based payment expense relates primarily to awards granted under the 2014 Performance Share Plan and the Group’s Savings-related Share Option Schemes. The expense, which also includes charges in relation to the 2013 Restricted Share Plan, is reflected in operating costs in the Consolidated Income Statement.
2014 Performance Share Plan
The structure of the 2014 Performance Share Plan is set out in the Directors’ Remuneration Report on page 90. An expense of € 70 million was recognised in 2019 (2018: € 61 million; 2017: € 54 million).
Details of awards granted under the 2014 Performance Share Plan
| Number of shares | ||||||||||||||
|
Share price at
date of award |
Period to earliest release date |
Initial award (i) |
Net outstanding at
31 December 2019 |
|||||||||||
|
Granted in 2019 |
€ 29.44 | 3 years | 3,688,027 | 3,578,105 | ||||||||||
|
Granted in 2018 |
€ 28.32 | 3 years | 3,863,433 | 3,610,323 | ||||||||||
|
Granted in 2017 |
€ 33.21 | 3 years | 3,342,900 | 2,818,931 | ||||||||||
| (i) |
Numbers represent the initial awards including those granted to employees of Europe Distribution in 2019, 2018 and 2017 and Allied Building Products in 2017. The Remuneration Committee has determined that dividend equivalents will accrue on awards under the 2014 Performance Share Plan. Subject to satisfaction of the applicable performance criteria, such dividend equivalents will be released to participants in the form of additional shares on vesting. |
25% of each award made in 2019 is subject to TSR performance measured against a tailored peer group; 25% is subject to a new RONA metric introduced in 2019; with the remaining 50% subject to a cumulative cashflow metric (2018 and 2017: 50% of each award is subject to a TSR measure, with 25% being measured against a tailored sector peer group and 25% against the FTSE All-World Construction & Materials Index. The other 50% of each award is subject to a cumulative cashflow metric). Further details are set out on page 90 in the Directors’ Remuneration Report.
The fair values assigned to the portion of awards which are subject to TSR performance against peers and, in the case of 2018 and 2017, the index, was € 18.59 (2018: € 13.52 and € 13.18 respectively; 2017: € 17.43 and € 14.99 respectively). The fair value of these awards was calculated using a TSR pricing model taking account of peer group TSR, volatilities and correlations together with the following assumptions:
| 2019 | 2018 | 2017 | ||||||||||
|
Risk-free interest rate (%) |
(0.37) | (0.43) | (0.40) | |||||||||
|
Expected volatility (%) |
23.2 | 27.4 | 30.1 | |||||||||
The expected volatility was determined using a historical sample of daily CRH share prices.
The fair value of (i) the portion of awards subject to cash flow performance; (ii) from 2019, the portion of awards subject to a RONA metric; and (iii) the awards with no performance conditions (which are subject to a one or three-year service period) was € 29.44 (2018: € 28.32; 2017: € 33.21). The fair value was calculated using the closing CRH share price at the date the award was granted.
Table of Contents
|
CRH ANNUAL REPORT AND FORM 20-F | 2019 |
157 |
Table of Contents
|
158 |
CRH ANNUAL REPORT AND FORM 20-F | 2019 |
9. Share-based Payment Expense - continued
Continuing operations
| 2019 | 2018 | 2017 | ||||||||||
| Weighted average remaining contractual life for the share options outstanding at 31 December (years) | 1.87 | 1.50 | 1.90 | |||||||||
|
euro-denominated options outstanding at end of year (number) |
290,627 | 304,713 | 304,963 | |||||||||
|
Range of exercise prices ( € ) |
17.67-27.86 | 14.15-27.86 | 13.64-27.86 | |||||||||
| Pound Sterling-denominated options outstanding at end of year (number) | 1,218,235 | 1,381,463 | 1,251,336 | |||||||||
|
Range of exercise prices (Stg£) |
14.94-24.51 | 14.94-24.51 | 12.22-24.51 | |||||||||
The weighted fair values assigned to options issued under the Savings-related Share Option Schemes, which were computed in accordance with the trinomial valuation methodology, were as follows:
| 3-year | 5-year | |||||||
|
Granted in 2019 (April) |
€ 7.55 | € | 7.98 | |||||
|
Granted in 2019 (May) |
€ 6.67 | € | 7.19 | |||||
|
Granted in 2018 |
€ 5.38 | € 5.88 | ||||||
|
Granted in 2017 |
€ 5.97 | € | 6.49 | |||||
| The fair value of these options were determined using the following assumptions: |
| 2019 | 2018 | 2017 | ||||||||||||||||||||||||||||||||||
| 3-year | 5-year | 3-year | 5-year | 3-year | 5-year | |||||||||||||||||||||||||||||||
| April | May | April | May | April | April | March | March | |||||||||||||||||||||||||||||
|
Weighted average exercise price ( € ) |
23.30 | 24.24 | 23.30 | 24.24 | 23.39 | 23.39 | 27.86 | 27.86 | ||||||||||||||||||||||||||||
|
Risk free interest rate (%) |
(0.56) | (0.58) | (0.40) | (0.41) | (0.44) | (0.06) | (0.72) | (0.45) | ||||||||||||||||||||||||||||
|
Expected dividend payments over the expected life ( € ) |
2.34 | 2.34 | 4.06 | 4.06 | 2.21 | 3.83 | 2.07 | 3.55 | ||||||||||||||||||||||||||||
|
Expected volatility (%) |
19.6 | 20.0 | 21.1 | 21.3 | 20.0 | 20.5 | 20.9 | 20.6 | ||||||||||||||||||||||||||||
|
Expected life in years |
3 | 3 | 5 | 5 | 3 | 5 | 3 | 5 | ||||||||||||||||||||||||||||
The expected volatility was determined using a historical sample of 37 month-end CRH share prices in respect of the three-year savings-related share options and 61 month-end share prices in respect of the five-year savings-related share options. The expected lives of the options are based on historical data and are therefore not necessarily indicative of exercise patterns that may materialise.
Other than the assumptions listed above, no other features of options grants were factored into the determination of fair value.
The terms of the options issued under the Savings-related Share Option Schemes do not contain any market conditions within the meaning of IFRS 2 Share-based Payment.
Table of Contents
|
CRH ANNUAL REPORT AND FORM 20-F | 2019 |
159 |
10. Finance Costs and Finance Income
Continuing operations
Table of Contents
|
160 |
CRH ANNUAL REPORT AND FORM 20-F | 2019 |
11. Share of Equity Accounted Investments’ Profit
Continuing operations
The Group’s share of joint ventures’ and associates’ profit after tax is equity accounted and is presented as a single line item in the Consolidated Income Statement; it is analysed as follows between the principal Consolidated Income Statement captions:
| Joint Ventures | Associates | Total | ||||||||||||||||||||||||||||||||||||||||||
|
2019 € m |
2018 € m |
2017 € m |
2019 € m |
2018 € m |
2017 € m |
2019 € m |
2018 € m |
2017 € m |
||||||||||||||||||||||||||||||||||||
|
Group share of: |
||||||||||||||||||||||||||||||||||||||||||||
|
Revenue |
634 | 603 | 517 | 615 | 603 | 534 | 1,249 | 1,206 | 1,051 | |||||||||||||||||||||||||||||||||||
|
EBITDA (as defined)* |
70 | 51 | 71 | 68 | 63 | 58 | 138 | 114 | 129 | |||||||||||||||||||||||||||||||||||
|
Depreciation and amortisation |
(24) | (22) | (27) | (35) | (34) | (33) | (59) | (56) | (60) | |||||||||||||||||||||||||||||||||||
|
Operating profit |
46 | 29 | 44 | 33 | 29 | 25 | 79 | 58 | 69 | |||||||||||||||||||||||||||||||||||
|
Profit on disposals |
- | - | - | - | 3 | - | - | 3 | - | |||||||||||||||||||||||||||||||||||
|
Profit before finance costs |
46 | 29 | 44 | 33 | 32 | 25 | 79 | 61 | 69 | |||||||||||||||||||||||||||||||||||
|
Finance costs (net) |
- | 1 | (1) | (12) | (9) | (9) | (12) | (8) | (10) | |||||||||||||||||||||||||||||||||||
|
Profit before tax |
46 | 30 | 43 | 21 | 23 | 16 | 67 | 53 | 59 | |||||||||||||||||||||||||||||||||||
|
Income tax expense |
(5) | (1) | (4) | (2) | (4) | (3) | (7) | (5) | (7) | |||||||||||||||||||||||||||||||||||
|
Profit after tax (i) |
41 | 29 | 39 | 19 | 19 | 13 | 60 | 48 | 52 | |||||||||||||||||||||||||||||||||||
An analysis of the profit after tax by operating segment is presented in note 2. The aggregated balance sheet data (analysed between current and non-current assets and liabilities) in respect of the Group’s investment in joint ventures and associates is presented in note 17.
| (i) |
Share of profit after tax for 2019 including discontinued operations amounted to € 72 million (2018: € 60 million; 2017: € 65 million). |
12. Income Tax Expense
Continuing operations
|
Recognised within the Consolidated Income Statement
|
2019 € m |
2018 € m |
2017 € m |
|||||||||
|
(a) Current tax |
||||||||||||
|
Republic of Ireland |
17 | 10 | 9 | |||||||||
|
Overseas |
345 | 279 | 275 | |||||||||
|
Total current tax expense |
362 | 289 | 284 | |||||||||
|
(b) Deferred tax |
||||||||||||
|
Origination and reversal of temporary differences: |
||||||||||||
|
Retirement benefit obligations |
(1) | 4 | 6 | |||||||||
|
Share-based payment expense |
(5) | 4 | (4) | |||||||||
|
Derivative financial instruments |
2 | (1) | 2 | |||||||||
|
Other items (2017 includes deferred tax credit associated with the
“Tax Cuts and Jobs Act”) |
119 | 100 | (276) | |||||||||
|
Total deferred tax expense/(income) |
115 | 107 | (272) | |||||||||
|
Income tax reported in the Consolidated Income Statement |
477 | 396 | 12 | |||||||||
|
* EBITDA is defined as earnings before interest, taxes, depreciation, amortisation, asset impairment charges and profit on disposals. |
Table of Contents
|
CRH ANNUAL REPORT AND FORM 20-F | 2019 |
161 |
Table of Contents
|
162 |
CRH ANNUAL REPORT AND FORM 20-F | 2019 |
13. Dividends
The dividends paid and proposed in respect of each class of share capital are as follows:
|
2019 € m
|
2018 € m
|
2017 € m
|
||||||||||
|
Dividends to shareholders |
||||||||||||
|
Preference |
||||||||||||
|
5% Cumulative Preference Shares € 3,175 (2018: € 3,175; 2017: € 3,175) |
- | - | - | |||||||||
|
7% ‘A’ Cumulative Preference Shares € 77,521 (2018: € 77,521; 2017: € 77,521) |
- | - | - | |||||||||
|
Equity |
||||||||||||
|
Final - paid 52.40c per Ordinary Share (2018: 48.80c; 2017: 46.20c) |
425 | 409 | 386 | |||||||||
|
Interim - paid 20.00c per Ordinary Share (2018: 19.60c; 2017: 19.20c) |
159 | 163 | 160 | |||||||||
|
Total |
584 | 572 | 546 | |||||||||
|
Reconciliation to Consolidated Statement of Cash Flows |
||||||||||||
|
Dividends to shareholders |
584 | 572 | 546 | |||||||||
|
Less: issue of scrip shares in lieu of cash dividends (note 31) |
- | (51) | (77) | |||||||||
|
Dividends paid to equity holders of the Company |
584 | 521 | 469 | |||||||||
|
Dividends paid by subsidiaries to non-controlling interests |
10 | 12 | 8 | |||||||||
|
Total dividends paid |
594 | 533 | 477 | |||||||||
|
Dividends proposed (memorandum disclosure) |
||||||||||||
|
Equity |
||||||||||||
|
Final 2019 - proposed 63.00c per Ordinary Share (2018: 52.40c; 2017: 48.80c) |
495 | 425 | 409 | |||||||||
Table of Contents
|
CRH ANNUAL REPORT AND FORM 20-F | 2019 |
163 |
14. Earnings per Ordinary Share
Table of Contents
|
164 |
CRH ANNUAL REPORT AND FORM 20-F | 2019 |
15. Property, Plant and Equipment
|
Land and buildings (i) € m |
Plant and machinery € m |
Assets in course of construction € m |
Total € m |
|||||||||||||
|
At 31 December 2019 |
||||||||||||||||
|
Cost/deemed cost |
9,189 | 16,283 | 674 | 26,146 | ||||||||||||
|
Accumulated depreciation (and impairment charges) |
(2,322) | (7,835) | (35) | (10,192) | ||||||||||||
|
Net carrying amount |
6,867 | 8,448 | 639 | 15,954 | ||||||||||||
|
At 1 January 2019, net carrying amount |
6,972 | 8,196 | 593 | 15,761 | ||||||||||||
|
Effect of adopting IFRS 16 |
(7) | (20) | 4 | (23) | ||||||||||||
|
Translation adjustment |
155 | 203 | 19 | 377 | ||||||||||||
|
Reclassifications |
101 | 446 | (547) | - | ||||||||||||
|
Transfer (to)/from leased assets (note 22) |
(5) | 17 | - | 12 | ||||||||||||
|
Additions at cost |
72 | 590 | 567 | 1,229 | ||||||||||||
|
Additions to leased mineral reserves (note 21) (ii) |
86 | - | - | 86 | ||||||||||||
|
Arising on acquisition (note 32) |
152 | 94 | 7 | 253 | ||||||||||||
|
Disposals at net carrying amount |
(405) | (120) | (4) | (529) | ||||||||||||
|
Depreciation charge for year (iii) |
(251) | (953) | - | (1,204) | ||||||||||||
|
Impairment charge for year (iv) |
(3) | (5) | - | (8) | ||||||||||||
|
At 31 December 2019, net carrying amount |
6,867 | 8,448 | 639 | 15,954 | ||||||||||||
|
Land and buildings € m |
Plant and machinery € m |
Other € m |
||||||||||||||
|
Leased right-of-use assets (v) |
||||||||||||||||
|
At 31 December 2019, net carrying amount (note 22) |
1,086 | 337 | 47 | 1,470 | ||||||||||||
|
Total property, plant and equipment |
17,424 | |||||||||||||||
| The equivalent disclosure for the prior year is as follows: | ||||||||||||||||
|
Land and buildings (i) € m |
Plant and machinery € m |
Assets in course of construction € m |
Total € m |
|||||||||||||
|
At 31 December 2018 |
||||||||||||||||
|
Cost/deemed cost |
9,335 | 15,535 | 629 | 25,499 | ||||||||||||
|
Accumulated depreciation (and impairment charges) |
(2,363) | (7,339) | (36) | (9,738) | ||||||||||||
|
Net carrying amount |
6,972 | 8,196 | 593 | 15,761 | ||||||||||||
|
At 1 January 2018, net carrying amount |
6,224 | 6,319 | 551 | 13,094 | ||||||||||||
|
Reclassified from held for sale |
22 | 79 | 3 | 104 | ||||||||||||
|
Translation adjustment |
139 | 112 | 8 | 259 | ||||||||||||
|
Reclassifications |
71 | 386 | (457) | - | ||||||||||||
|
Additions at cost |
74 | 541 | 506 | 1,121 | ||||||||||||
|
Arising on acquisition (note 32) |
832 | 1,759 | 23 | 2,614 | ||||||||||||
|
Disposals at net carrying amount |
(158) | (161) | (5) | (324) | ||||||||||||
|
Depreciation charge for year (iii) |
(232) | (839) | - | (1,071) | ||||||||||||
|
Impairment charge for year (iv) |
- | - | (36) | (36) | ||||||||||||
|
At 31 December 2018, net carrying amount |
6,972 | 8,196 | 593 | 15,761 | ||||||||||||
|
At 1 January 2018 |
||||||||||||||||
|
Cost/deemed cost |
8,472 | 13,157 | 551 | 22,180 | ||||||||||||
|
Accumulated depreciation (and impairment charges) |
(2,248) | (6,838) | - | (9,086) | ||||||||||||
|
Net carrying amount |
6,224 | 6,319 | 551 | 13,094 | ||||||||||||
Table of Contents
|
CRH ANNUAL REPORT AND FORM 20-F | 2019 |
165 |
Table of Contents
|
166 |
CRH ANNUAL REPORT AND FORM 20-F | 2019 |
16. Intangible Assets
| Other intangible assets | ||||||||||||||||||||
|
Goodwill € m |
Marketing-
€ m |
Customer-
€ m |
Contract- based € m |
Total € m |
||||||||||||||||
|
At 31 December 2019 |
||||||||||||||||||||
|
Cost/deemed cost |
8,378 | 148 | 512 | 77 | 9,115 | |||||||||||||||
|
Accumulated amortisation (and impairment charges) |
(284) | (64) | (276) | (57) | (681) | |||||||||||||||
|
Net carrying amount |
8,094 | 84 | 236 | 20 | 8,434 | |||||||||||||||
|
At 1 January 2019, net carrying amount |
8,116 | 76 | 217 | 24 | 8,433 | |||||||||||||||
|
Translation adjustment |
203 | 1 | 4 | 1 | 209 | |||||||||||||||
|
Arising on acquisition (note 32) |
278 | 17 | 75 | - | 370 | |||||||||||||||
|
Disposals |
(503) | (1) | (15) | - | (519) | |||||||||||||||
|
Amortisation charge for year (ii) |
- | (9) | (45) | (5) | (59) | |||||||||||||||
|
At 31 December 2019, net carrying amount |
8,094 | 84 | 236 | 20 | 8,434 | |||||||||||||||
|
The equivalent disclosure for the prior year is as follows: |
||||||||||||||||||||
|
At 31 December 2018 |
||||||||||||||||||||
|
Cost/deemed cost |
8,400 | 138 | 592 | 79 | 9,209 | |||||||||||||||
|
Accumulated amortisation (and impairment charges) |
(284) | (62) | (375) | (55) | (776) | |||||||||||||||
|
Net carrying amount |
8,116 | 76 | 217 | 24 | 8,433 | |||||||||||||||
|
At 1 January 2018, net carrying amount |
6,905 | 75 | 204 | 30 | 7,214 | |||||||||||||||
|
Reclassified from held for sale |
363 | - | 8 | 1 | 372 | |||||||||||||||
|
Translation adjustment |
137 | 3 | 8 | 1 | 149 | |||||||||||||||
|
Reclassifications |
- | - | (2) | 2 | - | |||||||||||||||
|
Arising on acquisition (note 32) |
1,504 | 6 | 51 | 1 | 1,562 | |||||||||||||||
|
Disposals |
(773) | - | (9) | (1) | (783) | |||||||||||||||
|
Amortisation charge for year (ii) |
- | (8) | (43) | (10) | (61) | |||||||||||||||
|
Impairment charge for year (iii) |
(20) | - | - | - | (20) | |||||||||||||||
|
At 31 December 2018, net carrying amount |
8,116 | 76 | 217 | 24 | 8,433 | |||||||||||||||
|
At 1 January 2018 |
||||||||||||||||||||
|
Cost/deemed cost |
7,198 | 129 | 535 | 80 | 7,942 | |||||||||||||||
|
Accumulated amortisation (and impairment charges) |
(293) | (54) | (331) | (50) | (728) | |||||||||||||||
|
Net carrying amount |
6,905 | 75 | 204 | 30 | 7,214 | |||||||||||||||
| (i) |
The customer-related intangible assets relate predominantly to non-contractual customer relationships. |
| (ii) |
The amortisation charge for the year includes € 2 million (2018: € 2 million; 2017: € 14 million) in respect of discontinued operations, which primarily relates to customer-related intangible assets. |
| (iii) |
In July 2018, the Group divested of its DIY business in the Netherlands and Belgium, together with certain related property assets, which formed part of the former Europe Distribution segment, for total consideration of € 0.5 billion. The decision to divest resulted in the recognition of an impairment charge of € 20 million. The recoverable amount, at the date of impairment, was based on fair value less costs of disposal. The fair value was determined using Level 2 inputs in accordance with the fair value hierarchy, as a market price was agreed and paid. |
Table of Contents
|
CRH ANNUAL REPORT AND FORM 20-F | 2019 |
167 |
|
* EBITDA is defined as earnings before interest, taxes, depreciation, amortisation, asset impairment charges, profit on disposals and the Group’s share of equity accounted investments’ profit after tax. |
Table of Contents
|
168 |
CRH ANNUAL REPORT AND FORM 20-F | 2019 |
16. Intangible Assets - continued
|
Americas
|
Americas
|
|||||||||||||||||||
| 2019 | 2018 | 2019 | 2018 | |||||||||||||||||
|
Goodwill allocated to the cash-generating unit at balance sheet date |
€ 1,450m | € 1,412m | € 1,883m | € 1,655m | ||||||||||||||||
|
Discount rate applied to the cash flow projections (real pre-tax) |
7.6% | 8.2% | 8.4% | 9.1% | ||||||||||||||||
|
Average EBITDA (as defined)* margin over the initial 5-year period |
39.1% | 37.9% | 18.3% | 15.3% | ||||||||||||||||
|
Value-in-use (present value of future cash flows) |
€ 7,031m | € 5,579m | € 8,560m | € 6,753m | ||||||||||||||||
|
Excess of value-in-use over carrying amount |
€ 3,529m | € 2,594m | € 4,938m | € 3,412m | ||||||||||||||||
| One cash-generating unit | ||||
|
Reduction in EBITDA (as defined)* margin |
2.2 percentage points | |||
|
Reduction in profit before tax |
15.7% | |||
|
Reduction in net cash flow |
14.4% | |||
|
Increase in pre-tax discount rate |
1.3 percentage points | |||
|
* EBITDA is defined as earnings before interest, taxes, depreciation, amortisation, asset impairment charges, profit on disposals and the Group’s share of equity accounted investments’ profit after tax. |
Table of Contents
|
CRH ANNUAL REPORT AND FORM 20-F | 2019 |
169 |
17. Financial Assets
Table of Contents
|
170 |
CRH ANNUAL REPORT AND FORM 20-F | 2019 |
18. Inventories
|
2019
€ m |
2018
€ m |
|||||||
|
Raw materials |
1,142 | 1,149 | ||||||
|
Work-in-progress (i) |
128 | 109 | ||||||
|
Finished goods |
1,472 | 1,803 | ||||||
|
Total inventories at the lower of cost and net realisable value |
2,742 | 3,061 | ||||||
| (i) |
Work-in-progress includes € 2 million (2018: € 3 million) in respect of the cumulative costs incurred, net of amounts transferred to cost of sales under percentage-of-completion accounting, for construction contracts in progress at the balance sheet date. |
An analysis of the Group’s cost of sales expense is provided in note 4 to the financial statements.
Write-downs of inventories recognised as an expense within cost of sales for continuing operations amounted to € 8 million (2018: € 10 million; 2017: € 23 million).
19. Trade and Other Receivables
|
2019 € m |
2018 € m |
|||||||
|
Current |
||||||||
|
Trade receivables |
2,387 | 2,761 | ||||||
|
Amounts receivable in respect of construction contracts (i) |
914 | 878 | ||||||
|
Total trade receivables, gross |
3,301 | 3,639 | ||||||
|
Loss allowance |
(118) | (133) | ||||||
|
Total trade receivables, net |
3,183 | 3,506 | ||||||
|
Amounts receivable from equity accounted investments |
8 | 9 | ||||||
|
Prepayments and other receivables |
576 | 559 | ||||||
|
Total |
3,767 | 4,074 | ||||||
|
Non-current |
||||||||
|
Other receivables |
317 | 181 | ||||||
| (i) |
Includes unbilled revenue and retentions held by customers in respect of construction contracts at the balance sheet date amounting to € 247 million and € 183 million respectively (2018: € 245 million and € 168 million respectively). |
Trade and other receivables are measured at amortised cost (less any loss allowance) as the Group’s business model is to “hold to collect” contractual cash flows, and the cash flows arising from trade and other receivables are solely payments of principal and interest.
Table of Contents
|
CRH ANNUAL REPORT AND FORM 20-F | 2019 |
171 |
Table of Contents
|
172 |
CRH ANNUAL REPORT AND FORM 20-F | 2019 |
19. Trade and Other Receivables - continued
Aged analysis
The aged analysis of trade receivables and amounts receivable in respect of construction contracts at the balance sheet date was as follows:
|
2019 € m |
2018 € m |
|||||||
|
Neither past due nor impaired |
2,140 | 2,319 | ||||||
|
Past due but not impaired: |
||||||||
|
- less than 60 days |
770 | 922 | ||||||
|
- 60 days or greater but less than 120 days |
186 | 169 | ||||||
|
- 120 days or greater |
87 | 96 | ||||||
|
Impaired (partial or full provision) |
118 | 133 | ||||||
|
Total |
3,301 | 3,639 | ||||||
Trade receivables and amounts receivable in respect of construction contracts are in general receivable within 90 days of the balance sheet date.
Table of Contents
|
CRH ANNUAL REPORT AND FORM 20-F | 2019 |
173 |
20. Trade and Other Payables
Table of Contents
|
174 |
CRH ANNUAL REPORT AND FORM 20-F | 2019 |
21. Movement in Working Capital and Provisions for Liabilities
|
Inventories
€ m |
Trade and
other
|
Trade
and
other payables € m |
Provisions
for liabilities € m |
Total € m |
||||||||||||||||
|
At 1 January 2019 |
3,061 | 4,255 | (5,081) | (1,087) | 1,148 | |||||||||||||||
|
Effect of adopting IFRS 16 |
- | 3 | 11 | 1 | 15 | |||||||||||||||
|
Translation adjustment |
64 | 94 | (107) | (17) | 34 | |||||||||||||||
|
Arising on acquisition (note 32) |
58 | 66 | (73) | (6) | 45 | |||||||||||||||
|
Disposals |
(520) | (669) | 510 | - | (679) | |||||||||||||||
|
Deferred and contingent acquisition consideration: |
||||||||||||||||||||
|
- arising on acquisitions during year (note 32) |
- | - | (18) | - | (18) | |||||||||||||||
|
- paid during year |
- | - | 48 | - | 48 | |||||||||||||||
|
Deferred proceeds arising on disposals during year |
- | 269 | - | - | 269 | |||||||||||||||
|
Interest accruals and discount unwinding |
- | (11) | (1) | (22) | (34) | |||||||||||||||
|
Additions to leased mineral reserves |
- | - | (86) | - | (86) | |||||||||||||||
|
Increase/(decrease) in working capital and provisions for liabilities |
79 | 77 | (64) | (28) | 64 | |||||||||||||||
|
At 31 December 2019 |
2,742 | 4,084 | (4,861) | (1,159) | 806 | |||||||||||||||
|
The equivalent disclosure for the prior years is as follows: |
||||||||||||||||||||
|
At 1 January 2018 |
2,715 | 3,786 | (4,760) | (1,064) | 677 | |||||||||||||||
|
Reclassified from held for sale |
266 | 334 | (306) | - | 294 | |||||||||||||||
|
Translation adjustment |
52 | 57 | (71) | (10) | 28 | |||||||||||||||
|
Arising on acquisition (note 32) |
255 | 318 | (224) | (84) | 265 | |||||||||||||||
|
Disposals |
(405) | (390) | 293 | 3 | (499) | |||||||||||||||
|
Deferred and contingent acquisition consideration: |
||||||||||||||||||||
|
- arising on acquisitions during year (note 32) |
- | - | (103) | - | (103) | |||||||||||||||
|
- paid during year |
- | - | 55 | - | 55 | |||||||||||||||
|
Deferred proceeds arising on disposals during year |
- | 10 | - | - | 10 | |||||||||||||||
|
Interest accruals and discount unwinding |
- | - | (21) | (21) | (42) | |||||||||||||||
|
Increase in working capital and provisions for liabilities |
178 | 140 | 56 | 89 | 463 | |||||||||||||||
|
At 31 December 2018 |
3,061 | 4,255 | (5,081) | (1,087) | 1,148 | |||||||||||||||
|
At 1 January 2017 |
2,939 | 4,191 | (5,276) | (1,060) | 794 | |||||||||||||||
|
Translation adjustment |
(218) | (286) | 348 | 72 | (84) | |||||||||||||||
|
Arising on acquisition (note 32) |
114 | 129 | (149) | (49) | 45 | |||||||||||||||
|
Disposals |
(34) | (16) | 20 | 1 | (29) | |||||||||||||||
|
Deferred and contingent acquisition consideration: |
||||||||||||||||||||
|
- arising on acquisitions during year (note 32) |
- | - | (45) | - | (45) | |||||||||||||||
|
- paid during year |
- | - | 53 | - | 53 | |||||||||||||||
|
Deferred proceeds arising on disposals during year |
- | 3 | - | - | 3 | |||||||||||||||
|
Interest accruals and discount unwinding |
- | 1 | - | (24) | (23) | |||||||||||||||
|
Reclassification |
(3) | (14) | 65 | - | 48 | |||||||||||||||
|
Increase/(decrease) in working capital and provisions for liabilities |
183 | 112 | (82) | (4) | 209 | |||||||||||||||
|
Reclassified as held for sale |
(266) | (334) | 306 | - | (294) | |||||||||||||||
|
At 31 December 2017 |
2,715 | 3,786 | (4,760) | (1,064) | 677 | |||||||||||||||
Table of Contents
|
CRH ANNUAL REPORT AND FORM 20-F | 2019 |
175 |
22. Leases
Table of Contents
|
176 |
CRH ANNUAL REPORT AND FORM 20-F | 2019 |
22. Leases - continued
The Group avails of the exemption from capitalising lease costs for short-term leases and low-value assets where the relevant criteria are met. Variable lease payments directly linked to sales or usage are also expensed as incurred. The following lease costs have been charged to the Consolidated Income Statement as incurred:
| Continuing operations |
2019 € m |
|||
|
Short-term leases |
171 | |||
|
Lease of low-value assets |
7 | |||
|
Variable lease payments not included in the lease liability |
90 | |||
|
Total |
268 | |||
|
Total cash outflow for lease payments |
654 | |||
Lease commitments for short-term leases are similar to the portfolio of short-term leases for which the costs, as above, were expensed to the Consolidated Income Statement. The effect of excluding future cash outflows arising from variable lease payments, termination options, residual value guarantees and leases not yet commenced from lease liabilities was not material for the Group. The potential undiscounted future cash outflows arising from the exercise of renewal options that are not expected to be exercised (and are therefore not included in the lease term) are as follows:
|
As
at
31 December 2019 € m |
||||
|
Within one year |
2 | |||
|
Between one and two years |
3 | |||
|
Between two and three years |
4 | |||
|
Between three and four years |
6 | |||
|
Between four and five years |
7 | |||
|
After five years |
483 | |||
|
Total |
505 | |||
Income from subleasing and gains/losses on sale and leaseback transactions were not material for the Group.
B. IAS 17 Leases disclosures
Operating lease rentals charged to the Consolidated Income Statement for the years ended 31 December 2018 and 31 December 2017 under IAS 17 were as follows:
|
2018 € m |
2017 € m |
|||||||
|
Continuing operations |
||||||||
|
Hire of plant and machinery |
308 | 279 | ||||||
|
Land and buildings |
174 | 188 | ||||||
|
Other operating leases |
51 | 46 | ||||||
|
Total |
533 | 513 | ||||||
Lease commitments were provided for up to the earliest break clause in the lease.
|
As at
31 December 2018 € m |
||||
|
Within one year |
353 | |||
|
After one year but not more than five years |
769 | |||
|
More than five years |
789 | |||
|
Total |
1,911 | |||
The commitments above include € 408 million of operating lease commitments relating to discontinued operations in 2018.
Table of Contents
|
CRH ANNUAL REPORT AND FORM 20-F | 2019 |
177 |
23. Analysis of Net Debt
|
* All interest-bearing loans and borrowings are Level 2 fair value measurements. |
Table of Contents
|
178 |
CRH ANNUAL REPORT AND FORM 20-F | 2019 |
23. Analysis of Net Debt - continued
The following table shows the effective interest rates on period-end fixed, gross and net debt:
| As at 31 December 2019 | As at 31 December 2018 | |||||||||||||||||||||||||||
| € m |
Interest
rate |
Weighted average fixed period Years |
€ m |
Interest
rate |
Weighted average fixed period Years |
|||||||||||||||||||||||
|
Interest-bearing loans and borrowings nominal - fixed rate (iii) |
(8,743) | (9,107) | ||||||||||||||||||||||||||
|
Derivative financial instruments - fixed rate |
1,599 | 1,726 | ||||||||||||||||||||||||||
|
Net fixed rate debt including derivatives |
(7,144) | 3.4% | 9.2 | (7,381) | 3.5% | 9.8 | ||||||||||||||||||||||
|
Interest-bearing loans and borrowings nominal - floating rate (iv) |
(158) | (157) | ||||||||||||||||||||||||||
|
Adjustment of debt from nominal to book value (iii) |
(113) | (52) | ||||||||||||||||||||||||||
|
Derivative financial instruments - currency floating rate |
(1,534) | (1,740) | ||||||||||||||||||||||||||
| Gross debt including derivative financial instruments, excluding lease liabilities | (8,949) | 3.3% | (9,330) | 3.6% | ||||||||||||||||||||||||
|
Lease liabilities - fixed rate |
(1,511) | - | ||||||||||||||||||||||||||
| Gross debt including derivative financial instruments, including lease liabilities | (10,460) | (9,330) | ||||||||||||||||||||||||||
|
Cash and cash equivalents - floating rate (note 25) |
3,755 | 2,346 | ||||||||||||||||||||||||||
|
Group net debt |
(6,705) | (6,984) | ||||||||||||||||||||||||||
| (i) |
All leases capitalised under IFRS 16 have been included as lease liabilities in 2019. |
| (ii) |
Interest-bearing loans and borrowings in 2018 include finance leases previously capitalised under IAS 17. |
| (iii) |
Of the Group’s nominal fixed rate debt at 31 December 2019, € 1,599 million (2018: € 1,726 million) is hedged to floating rate using interest rate swaps. |
| (iv) |
Floating rate debt comprises bank borrowings bearing interest at rates set in advance for periods ranging from overnight to less than one year largely by reference to inter-bank interest rates. |
Table of Contents
|
CRH ANNUAL REPORT AND FORM 20-F | 2019 |
179 |
Table of Contents
|
180 |
CRH ANNUAL REPORT AND FORM 20-F | 2019 |
23. Analysis of Net Debt - continued
|
Liquidity and capital resources
|
| The following table provides certain information related to our cash generation and changes in our cash and cash equivalents position: |
|
2019 € m |
2018 € m |
2017 € m |
||||||||||
|
Net cash inflow from operating activities |
3,466 | 1,899 | 2,189 | |||||||||
|
Net cash inflow/(outflow) from investing activities |
195 | (1,592) | (2,685) | |||||||||
|
Net cash (outflow)/inflow from financing activities |
(2,279) | (113) | 343 | |||||||||
|
Increase/(decrease) in cash and cash equivalents |
1,382 | 194 | (153) | |||||||||
|
Cash and cash equivalents at beginning of year, excluding overdrafts (note 25) |
2,346 | 2,135 | 2,449 | |||||||||
|
Effect of exchange rate changes |
27 | 17 | (161) | |||||||||
|
Cash and cash equivalents at end of year, excluding overdrafts (note 25) |
3,755 | 2,346 | 2,135 | |||||||||
|
Lease liabilities under IFRS 16 |
(1,511) | - | - | |||||||||
|
Bank overdrafts |
(41) | (113) | (71) | |||||||||
|
Borrowings |
(8,973) | (9,203) | (7,910) | |||||||||
|
Derivative financial instruments |
65 | (14) | 50 | |||||||||
|
Total liabilities from financing activities |
(10,460) | (9,330) | (7,931) | |||||||||
|
Net debt at end of year |
(6,705) | (6,984) | (5,796) | |||||||||
|
Cash at bank and in hand reclassified as held for sale |
- | - | (20) | |||||||||
|
Bank overdrafts reclassified as held for sale |
- | - | 5 | |||||||||
|
Group net debt excluding net debt reclassified as held for sale |
(6,705) | (6,984) | (5,811) | |||||||||
The Group believes that its financial resources (operating cash together with cash and cash equivalents of € 3.8 billion and undrawn committed loan facilities of € 3.6 billion) will be sufficient to cover the Group’s cash requirements.
At 31 December 2019, euro and US Dollar denominated cash and cash equivalents represented 52% (2018: 46%) and 23% (2018: 27%) of total cash and cash equivalents respectively.
Table of Contents
|
CRH ANNUAL REPORT AND FORM 20-F | 2019 |
181 |
Table of Contents
|
182 |
CRH ANNUAL REPORT AND FORM 20-F | 2019 |
24. Capital and Financial Risk Management
Table of Contents
|
CRH ANNUAL REPORT AND FORM 20-F | 2019 |
183 |
Table of Contents
|
184 |
CRH ANNUAL REPORT AND FORM 20-F | 2019 |
24. Capital and Financial Risk Management - continued
The notional and fair values in respect of derivative contracts as at 31 December 2019 and 31 December 2018 were as follows:
| Profile of commodity products | ||||||||||||||||||||
| As at 31 December 2019 | As at 31 December 2018 | |||||||||||||||||||
|
Notional
value
€ m |
Fair value
€ m |
Notional value
€ m |
Fair value
€ m |
|||||||||||||||||
|
Commodity contracts |
105 | - | 162 | - | ||||||||||||||||
|
Derivative liability |
- | - | - | (27) | ||||||||||||||||
Table of Contents
|
CRH ANNUAL REPORT AND FORM 20-F | 2019 |
185 |
Table of Contents
|
186 |
CRH ANNUAL REPORT AND FORM 20-F | 2019 |
25. Cash and Cash Equivalents
Cash and cash equivalents balances are spread across a wide number of highly-rated financial institutions. The credit risk attaching to these items is documented in note 24.
Cash and cash equivalents are included in the Consolidated Balance Sheet at amortised cost and are analysed as follows:
|
2019 € m |
2018 € m |
|||||||
|
Cash at bank and in hand |
1,005 | 814 | ||||||
|
Investments (short-term deposits) |
2,750 | 1,532 | ||||||
|
Total |
3,755 | 2,346 | ||||||
Cash at bank earns interest at floating rates based on daily deposit bank rates. Short-term deposits, which include bank and money market deposits, are made for varying periods of between one day and three months depending on the immediate cash requirements of the Group, and earn interest at the respective short-term deposit rates.
26. Interest-bearing Loans and Borrowings
|
2019 € m |
2018 € m |
|||||||
|
Bank overdrafts |
41 | 113 | ||||||
|
Bank loans |
465 | 356 | ||||||
|
Bonds |
8,508 | 8,825 | ||||||
|
Finance leases (i) |
- | 21 | ||||||
|
Other |
- | 1 | ||||||
|
Interest-bearing loans and borrowings |
9,014 | 9,316 | ||||||
Interest-bearing loans and borrowings include loans of € nil million (2018: € 5 million) secured on specific items of property, plant and equipment; these figures do not include finance leases.
| (i) |
Finance leases in 2018 relate to leases previously capitalised under IAS 17. Refer to note 22 for all leases capitalised under IFRS 16 in 2019. |
Table of Contents
|
CRH ANNUAL REPORT AND FORM 20-F | 2019 |
187 |
Table of Contents
|
188 |
CRH ANNUAL REPORT AND FORM 20-F | 2019 |
27. Derivative Financial Instruments
The fair values of derivative financial instruments are analysed by year of maturity and by accounting designation as follows:
|
Fair
value
hedges € m |
Cash
flow
hedges € m |
Net
investment hedges € m |
Not
designated as hedges € m |
Total
€ m |
||||||||||||||||
|
At 31 December 2019 |
||||||||||||||||||||
|
Derivative assets |
||||||||||||||||||||
|
Within one year - current assets |
- | 3 | 2 | 1 | 6 | |||||||||||||||
|
Between one and two years |
- | 1 | - | - | 1 | |||||||||||||||
|
Between three and four years |
23 | - | - | - | 23 | |||||||||||||||
|
After five years |
52 | - | - | - | 52 | |||||||||||||||
|
Non-current assets |
75 | 1 | - | - | 76 | |||||||||||||||
|
Total derivative assets |
75 | 4 | 2 | 1 | 82 | |||||||||||||||
|
Derivative liabilities |
||||||||||||||||||||
|
Within one year - current liabilities |
- | (8) | (4) | (4) | (16) | |||||||||||||||
|
Between one and two years - non-current liabilities |
- | (1) | - | - | (1) | |||||||||||||||
|
Total derivative liabilities |
- | (9) | (4) | (4) | (17) | |||||||||||||||
|
Net asset/(liability) arising on derivative financial instruments |
75 | (5) | (2) | (3) | 65 | |||||||||||||||
|
The equivalent disclosure for the prior year is as follows: |
||||||||||||||||||||
|
At 31 December 2018 |
||||||||||||||||||||
|
Derivative assets |
||||||||||||||||||||
|
Within one year - current assets |
- | 3 | 10 | 2 | 15 | |||||||||||||||
|
Between one and two years |
- | 2 | - | - | 2 | |||||||||||||||
|
Between two and three years |
- | 1 | - | - | 1 | |||||||||||||||
|
Between four and five years |
24 | - | - | - | 24 | |||||||||||||||
|
After five years |
3 | - | - | - | 3 | |||||||||||||||
|
Non-current assets |
27 | 3 | - | - | 30 | |||||||||||||||
|
Total derivative assets |
27 | 6 | 10 | 2 | 45 | |||||||||||||||
|
Derivative liabilities |
||||||||||||||||||||
|
Within one year - current liabilities |
- | (32) | (2) | (7) | (41) | |||||||||||||||
|
Between one and two years |
- | (2) | - | - | (2) | |||||||||||||||
|
After five years |
(16) | - | - | - | (16) | |||||||||||||||
|
Non-current liabilities |
(16) | (2) | - | - | (18) | |||||||||||||||
|
Total derivative liabilities |
(16) | (34) | (2) | (7) | (59) | |||||||||||||||
|
Net asset/(liability) arising on derivative financial instruments |
11 | (28) | 8 | (5) | (14) | |||||||||||||||
Table of Contents
|
CRH ANNUAL REPORT AND FORM 20-F | 2019 |
189 |
Table of Contents
|
190 |
CRH ANNUAL REPORT AND FORM 20-F | 2019 |
28. Provisions for Liabilities
|
At 1
January € m |
Effect of
adopting IFRS 16 € m |
Translation
adjustment € m |
Arising on
acquisition (note 32) € m |
Provided
€ m |
Utilised
during year € m |
Disposed
€ m |
Reversed
unused € m |
Discount
unwinding € m |
At 31
December € m |
|||||||||||||||||||||||||||||||
|
31 December 2019 |
||||||||||||||||||||||||||||||||||||||||
|
Insurance (i) |
279 | - | 5 | - | 114 | (88) | - | (24) | 8 | 294 | ||||||||||||||||||||||||||||||
| Environment and remediation (ii) | 484 | - | 13 | 6 | 41 | (26) | - | (8) | 11 | 521 | ||||||||||||||||||||||||||||||
| Rationalisation and redundancy (iii) | 23 | - | - | - | 29 | (35) | - | (3) | - | 14 | ||||||||||||||||||||||||||||||
|
Other (iv) |
301 | (1) | (1) | - | 108 | (34) | - | (46) | 3 | 330 | ||||||||||||||||||||||||||||||
|
Total |
1,087 | (1) | 17 | 6 | 292 | (183) | - | (81) | 22 | 1,159 | ||||||||||||||||||||||||||||||
|
Analysed as: |
||||||||||||||||||||||||||||||||||||||||
|
Non-current liabilities |
719 | 760 | ||||||||||||||||||||||||||||||||||||||
|
Current liabilities |
368 | 399 | ||||||||||||||||||||||||||||||||||||||
|
Total |
1,087 | 1,159 | ||||||||||||||||||||||||||||||||||||||
| The equivalent disclosure for the prior year is as follows: |
|
|||||||||||||||||||||||||||||||||||||||
|
31 December 2018 |
||||||||||||||||||||||||||||||||||||||||
|
Insurance (i) |
292 | - | 10 | 7 | 95 | (71) | - | (61) | 7 | 279 | ||||||||||||||||||||||||||||||
| Environment and remediation (ii) | 441 | - | - | 75 | 28 | (26) | (2) | (43) | 11 | 484 | ||||||||||||||||||||||||||||||
| Rationalisation and redundancy (iii) | 25 | - | - | - | 30 | (31) | - | (1) | - | 23 | ||||||||||||||||||||||||||||||
|
Other (iv) |
306 | - | - | 2 | 75 | (32) | (1) | (52) | 3 | 301 | ||||||||||||||||||||||||||||||
|
Total |
1,064 | - | 10 | 84 | 228 | (160) | (3) | (157) | 21 | 1,087 | ||||||||||||||||||||||||||||||
|
Analysed as: |
||||||||||||||||||||||||||||||||||||||||
|
Non-current liabilities |
693 | 719 | ||||||||||||||||||||||||||||||||||||||
|
Current liabilities |
371 | 368 | ||||||||||||||||||||||||||||||||||||||
|
Total |
1,064 | 1,087 | ||||||||||||||||||||||||||||||||||||||
| (i) |
This provision relates to obligations arising under the self-insurance components of the Group’s insurance arrangements which comprise employers’ liability (workers’ compensation in the US), public and products liability (general liability in the US), automobile liability, property damage, business interruption and various other insurances; a substantial proportion of the total provision pertains to claims which are classified as “incurred but not reported”. Due to the extended timeframe associated with many of the insurances, a significant proportion of the total provision is subject to periodic actuarial valuation. The projected cash flows underlying the discounting process are established through the application of actuarial triangulations, which are extrapolated from historical claims experience. The triangulations applied in the discounting process indicate that the Group’s insurance provisions have an average life of five years (2018: five years). |
| (ii) |
This provision comprises obligations governing site remediation, restoration and environmental works to be incurred in compliance with either local or national environmental regulations together with constructive obligations stemming from established best practice. Whilst a significant element of the total provision will reverse in the medium-term (two to ten years), those legal and constructive obligations applicable to long-lived assets (principally mineral-bearing land) will unwind over a 30-year timeframe. In discounting the related obligations, expected future cash outflows have been determined with due regard to extraction status and anticipated remaining life. |
| (iii) |
These provisions relate to irrevocable commitments under various rationalisation and redundancy programmes, none of which are individually material to the Group. In 2019, € 29 million (2018: € 30 million; 2017: € 32 million) was provided in respect of rationalisation and redundancy activities as a consequence of undertaking various cost reduction initiatives across all operations. These initiatives included removing excess capacity from manufacturing and distribution networks and scaling operations to match market supply; back office rationalisation; and the consolidation of certain regional support functions into central and more coordinated hubs. The Group expects that these provisions will primarily be utilised within one to two years of the balance sheet date (2018: one to two years). |
| (iv) |
Other provisions primarily relate to legal claims, onerous contracts, guarantees and warranties and employee related provisions. The Group expects the majority of these provisions will be utilised within two to five years of the balance sheet date (2018: two to five years); however due to the nature of the legal provisions there is a level of uncertainty in the timing of settlement as the Group generally cannot determine the extent and duration of the legal process. |
Table of Contents
|
CRH ANNUAL REPORT AND FORM 20-F | 2019 |
191 |
29. Deferred Income Tax
Table of Contents
|
192 |
CRH ANNUAL REPORT AND FORM 20-F | 2019 |
30. Retirement Benefit Obligations
Financial assumptions—scheme liabilities
The major long-term assumptions used by the Group’s actuaries in the computation of scheme liabilities and post-retirement healthcare obligations are as follows:
| Eurozone | Switzerland |
United States and Canada |
||||||||||||||||||||||||||||||||||||||||||
|
2019 % |
2018 % |
2017 % |
2019 % |
2018 % |
2017 % |
2019 % |
2018 % |
2017 % |
||||||||||||||||||||||||||||||||||||
|
Rate of increase in: |
||||||||||||||||||||||||||||||||||||||||||||
|
- salaries |
3.37 | 3.50 | 3.59 | 1.50 | 1.50 | 1.25 | 3.37 | 3.38 | 3.27 | |||||||||||||||||||||||||||||||||||
|
- pensions in payment |
1.46 | 1.62 | 1.70 | - | - | - | - | - | - | |||||||||||||||||||||||||||||||||||
|
Inflation |
1.50 | 1.65 | 1.75 | 1.00 | 1.00 | 0.75 | 2.00 | 2.00 | 2.00 | |||||||||||||||||||||||||||||||||||
|
Discount rate |
1.43 | 2.12 | 2.05 | 0.30 | 0.85 | 0.70 | 3.14 | 4.10 | 3.52 | |||||||||||||||||||||||||||||||||||
|
Medical cost trend rate |
n/a | n/a | n/a | n/a | n/a | n/a | 5.18 | 1.55 | 6.33 | |||||||||||||||||||||||||||||||||||
Table of Contents
|
CRH ANNUAL REPORT AND FORM 20-F | 2019 |
193 |
Table of Contents
|
194 |
CRH ANNUAL REPORT AND FORM 20-F | 2019 |
30. Retirement Benefit Obligations - continued
| Reconciliation of scheme assets (bid value) |
2019 € m |
2018 € m |
||||||
|
At 1 January |
2,913 | 2,622 | ||||||
|
Movement in year |
||||||||
|
Interest income on scheme assets (ii) |
68 | 59 | ||||||
|
Arising on acquisition (note 32) |
3 | 337 | ||||||
|
Disposals |
(592) | - | ||||||
|
Remeasurement adjustments |
||||||||
|
- return on scheme assets excluding interest income |
316 | (137) | ||||||
|
Employer contributions paid |
52 | 118 | ||||||
|
Contributions paid by plan participants |
13 | 14 | ||||||
|
Benefit and settlement payments |
(139) | (130) | ||||||
|
Administration expenses (ii) |
(7) | (4) | ||||||
|
Translation adjustment |
55 | 34 | ||||||
|
At 31 December |
2,682 | 2,913 | ||||||
The composition of scheme assets is as follows:
|
Eurozone |
1,283 | 1,181 | ||||||
|
Switzerland |
344 | 808 | ||||||
|
United States and Canada |
845 | 728 | ||||||
|
Other |
210 | 196 | ||||||
|
Total |
2,682 | 2,913 |
| Reconciliation of actuarial value of liabilities | ||||||||
|
At 1 January |
(3,337) | (2,999) | ||||||
|
Movement in year |
||||||||
|
Current service cost (ii) |
(60) | (64) | ||||||
|
Past service credit (net) (ii) |
18 | 17 | ||||||
|
Interest cost on scheme liabilities (ii) |
(81) | (69) | ||||||
|
Arising on acquisition (note 32) |
(4) | (452) | ||||||
|
Disposals |
636 | 6 | ||||||
|
Remeasurement adjustments |
||||||||
|
- experience variations |
33 | 1 | ||||||
|
- actuarial (loss)/gain from changes in financial assumptions |
(384) | 120 | ||||||
|
- actuarial gain from changes in demographic assumptions |
18 | 26 | ||||||
|
Contributions paid by plan participants |
(13) | (14) | ||||||
|
Benefit and settlement payments |
139 | 130 | ||||||
|
Translation adjustment |
(74) | (39) | ||||||
|
At 31 December |
(3,109) | (3,337) | ||||||
The composition of the actuarial value of liabilities is as follows:
|
Eurozone |
(1,425) | (1,318) | ||||||
|
Switzerland |
(341) | (829) | ||||||
|
United States and Canada |
(1,058) | (946) | ||||||
|
Other |
(285) | (244) | ||||||
|
Total |
(3,109) | (3,337) | ||||||
|
Recoverable deficit in schemes |
(427) | (424) | ||||||
|
Related deferred income tax asset |
91 | 95 | ||||||
|
Net pension liability |
(336) | (329) | ||||||
The composition of the net pension liability is as follows:
|
Eurozone |
(119) | (113) | ||||||
|
Switzerland |
3 | (17) | ||||||
|
United States and Canada |
(160) | (162) | ||||||
|
Other |
(60) | (37) | ||||||
|
Total |
(336) | (329) | ||||||
Table of Contents
|
CRH ANNUAL REPORT AND FORM 20-F | 2019 |
195 |
Table of Contents
|
196 |
CRH ANNUAL REPORT AND FORM 20-F | 2019 |
30. Retirement Benefit Obligations - continued
| Split of scheme assets |
2019 € m |
2018 € m |
||||||
|
Investments quoted in active markets |
||||||||
|
Equity instruments (i) |
746 | 862 | ||||||
|
Debt instruments (ii) |
1,594 | 1,596 | ||||||
|
Property |
93 | 109 | ||||||
|
Cash and cash equivalents |
27 | 34 | ||||||
|
Investment funds |
128 | 9 | ||||||
|
Assets held by insurance company |
- | 123 | ||||||
|
Unquoted investments |
||||||||
|
Equity instruments |
2 | 2 | ||||||
|
Debt instruments (iii) |
9 | 9 | ||||||
|
Property |
52 | 112 | ||||||
|
Cash and cash equivalents |
18 | 40 | ||||||
|
Assets held by insurance company |
13 | 17 | ||||||
|
Total assets |
2,682 | 2,913 | ||||||
| (i) |
Equity instruments primarily relate to developed markets. |
| (ii) |
Quoted debt instruments are made up of € 1,101 million (2018: € 845 million) and € 493 million (2018: € 751 million) of non-government and government instruments respectively. |
| (iii) |
Unquoted debt instruments primarily relate to government debt instruments. |
Table of Contents
|
CRH ANNUAL REPORT AND FORM 20-F | 2019 |
197 |
Table of Contents
|
198 |
CRH ANNUAL REPORT AND FORM 20-F | 2019 |
31. Share Capital and Reserves
| Equity share capital |
2019
|
2018
|
||||||||||||||||||
|
Ordinary
Shares of € 0.32 each (i) |
Income
Shares of € 0.02 each (ii) |
Ordinary
Shares of € 0.32 each (i) |
Income
Shares of € 0.02 each (ii) |
|||||||||||||||||
|
Authorised |
||||||||||||||||||||
|
At 1 January and 31 December ( € m) |
400 | 25 | 400 | 25 | ||||||||||||||||
|
Number of Shares at 1 January and 31 December (millions) |
1,250 | 1,250 | 1,250 | 1,250 | ||||||||||||||||
|
Allotted, called-up and fully paid |
||||||||||||||||||||
|
At 1 January ( € m) |
272 | 15 | 271 | 15 | ||||||||||||||||
|
Cancellation of Treasury Shares (iii) |
(14 | ) | (1 | ) | - | - | ||||||||||||||
|
Performance Share Plan Awards |
- | - | 1 | - | ||||||||||||||||
|
At 31 December ( € m) |
258 | 14 | 272 | 15 | ||||||||||||||||
|
The movement in the number of shares (expressed in millions) during the financial year was as follows: |
|
|||||||||||||||||||
|
At 1 January |
843 | 843 | 839 | 839 | ||||||||||||||||
|
Cancellation of Treasury Shares (iii) |
(44 | ) | (44 | ) | - | - | ||||||||||||||
|
Performance Share Plan Awards |
- | - | 2 | 2 | ||||||||||||||||
|
Issue of scrip shares in lieu of cash dividends (iv) |
- | - | 2 | 2 | ||||||||||||||||
|
At 31 December |
799 | 799 | 843 | 843 | ||||||||||||||||
| (i) |
The Ordinary Shares represent 93.71% of the total issued share capital. |
| (ii) |
The Income Shares, which represent 5.86% of the total issued share capital, were created on 29 August 1988 for the express purpose of giving shareholders the choice of receiving dividends on either their Ordinary Shares or on their Income Shares (by notice of election to the Company). The Income Shares carried a different tax credit to the Ordinary Shares. The creation of the Income Shares was achieved by the allotment of fully paid Income Shares to each shareholder equal to his/her holding of Ordinary Shares but the shareholder is not entitled to an Income Share certificate, as a certificate for Ordinary Shares is deemed to include an equal number of Income Shares and a shareholder may only sell, transfer or transmit Income Shares with an equivalent number of Ordinary Shares. Income Shares carry no voting rights. Due to changes in Irish tax legislation since the creation of the Income Shares, dividends on the Company’s shares no longer carry a tax credit. As elections made by shareholders to receive dividends on their holding of Income Shares were no longer relevant, the Articles of Association were amended on 8 May 2002 to cancel such elections. |
| (iii) |
During 2019 43,750,000 Ordinary Shares (including Income Shares) were cancelled. The amount paid to repurchase these shares was initially recognised in Treasury Shares/own shares and was transferred to retained income on cancellation. |
| (iv) |
Issue of scrip shares in lieu of cash dividends: |
| Number of shares | Price per share | |||||||||||||||||||
| 2018 | 2017 | 2018 | 2017 | |||||||||||||||||
|
May 2018: Final 2017 dividend (2017: Final 2016 dividend) |
1,841,430 | 433,046 | € | 27.47 | € | 33.08 | ||||||||||||||
|
September 2018: Interim 2018 dividend (2017: Interim 2017 dividend) |
- | 2,130,496 | - | € | 29.24 | |||||||||||||||
|
Total |
1,841,430 | 2,563,542 | ||||||||||||||||||
In 2019, the Final 2018 and Interim 2019 dividends were paid wholly in cash in May and September respectively. The Interim 2018 dividends were also paid wholly in cash in September 2018.
Share schemes
The aggregate number of shares which may be committed for issue in respect of any share option scheme, savings-related share option scheme, share participation scheme, performance share plan or any subsequent option scheme or share plan, may not exceed 10% of the issued ordinary share capital from time to time.
Table of Contents
|
CRH ANNUAL REPORT AND FORM 20-F | 2019 |
199 |
Table of Contents
|
200 |
CRH ANNUAL REPORT AND FORM 20-F | 2019 |
31. Share Capital and Reserves - continued
The movement in the number of Treasury Shares/own shares during the financial year was as follows:
| Number of shares | ||||||||
| 2019 | 2018 | |||||||
|
At 1 January |
27,843,927 | 391,757 | ||||||
|
New Shares allotted to the Employee Benefit Trust (own shares) |
- | 2,034,112 | ||||||
|
Own Shares released by the Employee Benefit Trust under the 2014 Performance Share Plan |
(2,256,986) | (2,034,112) | ||||||
|
Shares acquired by CRH plc (Treasury Shares) (i) |
27,357,116 | 27,901,471 | ||||||
|
Shares acquired by Employee Benefit Trust (own shares) |
2,189,448 | 108,377 | ||||||
|
Treasury Shares/own shares reissued (ii) |
(1,147,149) | (557,678) | ||||||
|
Cancellation of Treasury Shares |
(43,750,000) | - | ||||||
|
At 31 December |
10,236,356 | 27,843,927 | ||||||
|
Split of Treasury Shares/own shares (iii) |
||||||||
|
Treasury Shares |
10,011,353 | 27,551,386 | ||||||
|
Own shares |
225,003 | 292,541 | ||||||
| 10,236,356 | 27,843,927 | |||||||
| (i) |
In April 2018, CRH announced its intention to introduce a share repurchase programme (the ‘Programme’) to repurchase Ordinary Shares (including Income Shares) of up to € 1 billion. During 2018, CRH repurchased a total of 27,901,471 Ordinary Shares under the Programme, returning a total of € 0.8 billion in cash to shareholders. The Programme was extended in 2019, with CRH repurchasing a total of 27,357,116 Ordinary Shares in 2019 and returning a further € 0.8 billion to shareholders. As at 31 December 2019, a total of € 1.6 billion cash has been returned to shareholders under the Programme. |
On 7 January 2020, CRH announced a further extension of the Programme for an additional € 200 million.
| (ii) |
These reissued Treasury Shares were previously purchased at an average price of € 30.56 (2018: € 27.96). |
| (iii) |
As at the balance sheet date, the nominal value of the Treasury Shares and own shares was € 3.4 million and € 0.1 million respectively (2018: € 9.4 million and € 0.1 million respectively). Dividends have been waived by the Trustees of the own shares. |
| Reconciliation of shares issued to net proceeds |
2018
€ m |
2017
€ m |
||||||
|
Shares issued at nominal amount: |
||||||||
|
- Performance Share Plan Awards |
1 | 1 | ||||||
|
- scrip shares issued in lieu of cash dividends |
- | 1 | ||||||
|
Premium on shares issued |
117 | 180 | ||||||
|
Total value of shares issued |
118 | 182 | ||||||
|
Issue of scrip shares in lieu of cash dividends (note 13) |
(51) | (77) | ||||||
|
Shares allotted to the Employee Benefit Trust (vi) |
(56) | (63) | ||||||
|
Net proceeds from issue of shares |
11 | 42 | ||||||
| (vi) |
In 2018 and 2017, shares were allotted/re-issued to the Employee Benefit Trust to satisfy the vesting and release of awards under the 2014 Performance Share Plan to qualifying employees. An increase in nominal Share Capital and Share Premium of € 56 million and € 63 million, respectively, arose on the allotment to the Employee Benefit Trust. No such allotment occured during 2019. |
|
Share premium |
|
2019
€ m |
|
|
2018
€ m |
|
||
|
At 1 January |
6,534 | 6,417 | ||||||
|
Premium arising on shares issued |
- | 117 | ||||||
|
At 31 December |
6,534 | 6,534 | ||||||
Table of Contents
|
CRH ANNUAL REPORT AND FORM 20-F | 2019 |
201 |
32. Business Combinations
Table of Contents
|
202 |
CRH ANNUAL REPORT AND FORM 20-F | 2019 |
32. Business Combinations - continued
The identifiable net assets acquired, including adjustments to provisional fair values, were as follows:
|
2019 € m |
2018 € m |
2017 € m |
||||||||||
|
ASSETS |
||||||||||||
|
Non-current assets |
||||||||||||
|
Property, plant and equipment |
319 | 2,614 | 1,536 | |||||||||
|
Intangible assets |
92 | 58 | 56 | |||||||||
|
Equity accounted investments |
- | 1 | - | |||||||||
|
Total non-current assets |
411 | 2,673 | 1,592 | |||||||||
|
Current assets |
||||||||||||
|
Inventories |
58 | 255 | 114 | |||||||||
|
Trade and other receivables (i) |
66 | 318 | 129 | |||||||||
|
Cash and cash equivalents |
10 | 69 | 174 | |||||||||
|
Total current assets |
134 | 642 | 417 | |||||||||
|
LIABILITIES |
||||||||||||
|
Trade and other payables |
(73) | (224) | (149) | |||||||||
|
Provisions for liabilities |
(6) | (84) | (49) | |||||||||
|
Retirement benefit obligations |
(1) | (115) | (52) | |||||||||
|
Lease liabilities |
(64) | - | - | |||||||||
|
Interest-bearing loans and borrowings and finance leases* |
(9) | (74) | (12) | |||||||||
|
Current income tax liabilities |
9 | (15) | (22) | |||||||||
|
Deferred income tax liabilities |
- | (411) | (132) | |||||||||
|
Total liabilities |
(144) | (923) | (416) | |||||||||
|
Total identifiable net assets at fair value |
401 | 2,392 | 1,593 | |||||||||
|
Goodwill arising on acquisition (ii) |
278 | 1,504 | 487 | |||||||||
|
Joint ventures becoming subsidiaries |
- | (120) | - | |||||||||
|
Non-controlling interests** |
(1) | (48) | (20) | |||||||||
|
Total consideration |
678 | 3,728 | 2,060 | |||||||||
|
Consideration satisfied by: |
||||||||||||
|
Cash payments |
660 | 3,574 | 2,015 | |||||||||
|
Asset exchange |
- | 12 | - | |||||||||
|
Deferred consideration (stated at net present cost) |
10 | 10 | 45 | |||||||||
|
Contingent consideration |
8 | 93 | - | |||||||||
|
Profit on step acquisition |
- | 39 | - | |||||||||
|
Total consideration |
678 | 3,728 | 2,060 | |||||||||
|
Net cash outflow arising on acquisition |
||||||||||||
|
Cash consideration |
660 | 3,574 | 2,015 | |||||||||
|
Less: cash and cash equivalents acquired |
(10) | (69) | (174) | |||||||||
|
Total outflow in the Consolidated Statement of Cash Flows |
650 | 3,505 | 1,841 | |||||||||
Notes (i) to (ii) are set out overleaf.
|
* Includes € 6 million in 2018 relating to finance leases previously capitalised under IAS 17. All leases capitalised under IFRS 16 have been included as lease liabilities in 2019. ** Non-controlling interests are measured at the proportionate share of net assets. |
Table of Contents
|
CRH ANNUAL REPORT AND FORM 20-F | 2019 |
203 |
Table of Contents
|
204 |
CRH ANNUAL REPORT AND FORM 20-F | 2019 |
32. Business Combinations - continued
The post-acquisition impact of acquisitions completed during the year on the Group’s profit for the financial year was as follows:
| 2019 | 2018 | 2017 | ||||||||||
| Continuing operations | € m | € m | € m | |||||||||
|
Revenue |
204 | 1,202 | 505 | |||||||||
|
Profit/(loss) before tax for the financial year |
2 | 145 | (1) | |||||||||
The revenue and profit of the Group for the financial year determined in accordance with IFRS as though the acquisitions effected during the year had been at the beginning of the year would have been as follows:
|
2019 acquisitions |
CRH Group excluding 2019 acquisitions |
Pro-forma consolidated Group |
||||||||||
| Continuing operations | € m | € m | € m | |||||||||
|
Revenue |
458 | 24,925 | 25,383 | |||||||||
|
Profit before tax for the financial year |
18 | 2,113 | 2,131 | |||||||||
There have been no acquisitions completed subsequent to the balance sheet date which would be individually material to the Group, thereby requiring disclosure under either IFRS 3 or IAS 10 Events after the Balance Sheet Date . Development updates, giving details of acquisitions which do not require separate disclosure on the grounds of materiality, are published periodically.
Table of Contents
|
CRH ANNUAL REPORT AND FORM 20-F | 2019 |
205 |
33. Non-controlling Interests
Table of Contents
|
206 |
CRH ANNUAL REPORT AND FORM 20-F | 2019 |
34. Related Party Transactions
The principal related party relationships requiring disclosure in the Consolidated Financial Statements of the Group under IAS 24 Related Party Disclosures pertain to: the existence of subsidiaries, joint ventures and associates; transactions with these entities entered into by the Group; the identification and compensation of key management personnel; and lease arrangements.
Subsidiaries, joint ventures and associates
The Consolidated Financial Statements include the financial statements of the Company (CRH plc, the ultimate parent) and its subsidiaries, joint ventures and associates as documented in the accounting policies on pages 133 to 144. The Group’s principal subsidiaries, joint ventures and associates are disclosed on pages 260 to 264.
Sales to and purchases from joint ventures and associates are as follows:
| Joint ventures | Associates | |||||||||||||||||||||||||||
|
Continuing operations |
2019 € m |
2018 € m |
2017 € m |
2019 € m |
2018 € m |
2017 € m |
||||||||||||||||||||||
|
Sales |
118 | 107 | 111 | 37 | 40 | 51 | ||||||||||||||||||||||
|
Purchases |
24 | 31 | 55 | 16 | 193 | 400 | ||||||||||||||||||||||
Loans extended by the Group to joint ventures and associates (see note 17) are included in financial assets. Amounts receivable from and payable to equity accounted investments (arising from the aforementioned sales and purchases transactions) as at the balance sheet date are included as separate line items in notes 19 and 20 to the Consolidated Financial Statements.
Terms and conditions of transactions with subsidiaries, joint ventures and associates
In general, the transfer pricing policy implemented by the Group across its subsidiaries is market-based. Sales to and purchases from joint ventures and associates are conducted in the ordinary course of business and on terms equivalent to those that prevail in arms-length transactions. The outstanding balances included in receivables and payables as at the balance sheet date in respect of transactions with joint ventures and associates are unsecured and settlement arises in cash. No guarantees have been either requested or provided in relation to related party receivables and payables. Loans to joint ventures and associates (as disclosed in note 17) are extended on normal commercial terms in the ordinary course of business with interest accruing and, in general, paid to the Group at predetermined intervals.
Key management personnel
For the purposes of the disclosure requirements of IAS 24, the term “key management personnel” (i.e. those persons having authority and responsibility for planning, directing and controlling the activities of the Company) comprises the Board of Directors which manages the business and affairs of the Company.
| Key management remuneration amounted to: |
2019 € m |
2018 € m |
2017 € m |
|||||||||
|
Short-term benefits |
8 | 8 | 9 | |||||||||
|
Post-employment benefits |
1 | 1 | 1 | |||||||||
| Share-based payments - calculated in accordance with the principles disclosed in note 9 | 5 | 4 | 3 | |||||||||
|
Total |
14 | 13 | 13 | |||||||||
Other than these compensation entitlements, there were no other transactions involving key management personnel.
Lease arrangements
CRH has a number of lease arrangements in place with related parties across the Group, which have been negotiated on an arms-length basis at market rates. We do not consider these arrangements to be material either individually or collectively in the context of the 2019, 2018 and 2017 Consolidated Financial Statements.
35. Events after the Balance Sheet Date
With effect from 1 January 2020, the Group’s reporting currency changed from euro to US Dollar to reduce the potential for foreign exchange volatility in our future reported earnings.
36. Board Approval
The Board of Directors approved and authorised for issue the financial statements on pages 128 to 215 in respect of the year ended 31 December 2019 on 27 February 2020.
Table of Contents
|
CRH ANNUAL REPORT AND FORM 20-F | 2019 |
207 |
37. Supplemental Guarantor Information
Table of Contents
|
208 |
CRH ANNUAL REPORT AND FORM 20-F | 2019 |
37. Supplemental Guarantor Information - continued
Supplemental Condensed Consolidated Balance Sheet as at 31 December 2019
|
Guarantor € m |
Issuer
€ m |
Non-Guarantor subsidiaries € m |
Eliminate and reclassify € m |
CRH and subsidiaries € m |
||||||||||||||||
|
ASSETS |
||||||||||||||||||||
|
Non-current assets |
||||||||||||||||||||
|
Property, plant and equipment |
- | - | 17,424 | - | 17,424 | |||||||||||||||
|
Intangible assets |
- | - | 8,434 | - | 8,434 | |||||||||||||||
|
Subsidiaries |
15,621 | 709 | 1,682 | (18,012) | - | |||||||||||||||
|
Investments accounted for using the equity method |
- | - | 690 | - | 690 | |||||||||||||||
|
Advances to subsidiaries and parent undertakings |
- | 3,549 | - | (3,549) | - | |||||||||||||||
|
Other financial assets |
- | - | 12 | - | 12 | |||||||||||||||
|
Other receivables |
- | - | 317 | - | 317 | |||||||||||||||
|
Derivative financial instruments |
- | 20 | 56 | - | 76 | |||||||||||||||
|
Deferred income tax assets |
- | - | 67 | - | 67 | |||||||||||||||
|
Total non-current assets |
15,621 | 4,278 | 28,682 | (21,561) | 27,020 | |||||||||||||||
|
Current assets |
||||||||||||||||||||
|
Inventories |
- | - | 2,742 | - | 2,742 | |||||||||||||||
|
Trade and other receivables |
- | - | 3,767 | - | 3,767 | |||||||||||||||
|
Advances to subsidiaries and parent undertakings |
967 | - | 106 | (1,073) | - | |||||||||||||||
|
Current income tax recoverable |
- | - | 20 | - | 20 | |||||||||||||||
|
Derivative financial instruments |
- | - | 6 | - | 6 | |||||||||||||||
|
Cash and cash equivalents |
458 | - | 3,297 | - | 3,755 | |||||||||||||||
|
Total current assets |
1,425 | - | 9,938 | (1,073) | 10,290 | |||||||||||||||
|
Total assets |
17,046 | 4,278 | 38,620 | (22,634) | 37,310 | |||||||||||||||
|
EQUITY |
||||||||||||||||||||
|
Capital and reserves attributable to the Company’s equity holders |
16,940 | 2,087 | 15,925 | (18,012) | 16,940 | |||||||||||||||
|
Non-controlling interests |
- | - | 540 | - | 540 | |||||||||||||||
|
Total equity |
16,940 | 2,087 | 16,465 | (18,012) | 17,480 | |||||||||||||||
|
LIABILITIES |
||||||||||||||||||||
|
Non-current liabilities |
||||||||||||||||||||
|
Lease liabilities |
- | - | 1,240 | - | 1,240 | |||||||||||||||
|
Interest-bearing loans and borrowings |
- | 2,171 | 6,028 | - | 8,199 | |||||||||||||||
|
Derivative financial instruments |
- | - | 1 | - | 1 | |||||||||||||||
|
Deferred income tax liabilities |
- | - | 2,338 | - | 2,338 | |||||||||||||||
|
Other payables |
- | - | 485 | - | 485 | |||||||||||||||
|
Advances from subsidiary and parent undertakings |
- | - | 3,549 | (3,549) | - | |||||||||||||||
|
Retirement benefit obligations |
- | - | 427 | - | 427 | |||||||||||||||
|
Provisions for liabilities |
- | - | 760 | - | 760 | |||||||||||||||
|
Total non-current liabilities |
- | 2,171 | 14,828 | (3,549) | 13,450 | |||||||||||||||
|
Current liabilities |
||||||||||||||||||||
|
Lease liabilities |
- | - | 271 | - | 271 | |||||||||||||||
|
Trade and other payables |
- | 20 | 4,356 | - | 4,376 | |||||||||||||||
|
Advances from subsidiary and parent undertakings |
106 | - | 967 | (1,073) | - | |||||||||||||||
|
Current income tax liabilities |
- | - | 503 | - | 503 | |||||||||||||||
|
Interest-bearing loans and borrowings |
- | - | 815 | - | 815 | |||||||||||||||
|
Derivative financial instruments |
- | - | 16 | - | 16 | |||||||||||||||
|
Provisions for liabilities |
- | - | 399 | - | 399 | |||||||||||||||
|
Total current liabilities |
106 | 20 | 7,327 | (1,073) | 6,380 | |||||||||||||||
|
Total liabilities |
106 | 2,191 | 22,155 | (4,622) | 19,830 | |||||||||||||||
|
Total equity and liabilities |
17,046 | 4,278 | 38,620 | (22,634) | 37,310 | |||||||||||||||
Table of Contents
|
CRH ANNUAL REPORT AND FORM 20-F | 2019 |
209 |
Table of Contents
|
210 |
CRH ANNUAL REPORT AND FORM 20-F | 2019 |
37. Supplemental Guarantor Information - continued
Supplemental Condensed Consolidated Income Statement
| Year ended 31 December 2019 | ||||||||||||||||||||
|
Guarantor
€ m |
Issuer
€ m |
Non-Guarantor
subsidiaries € m |
Eliminate and
reclassify
|
CRH and
subsidiaries
|
||||||||||||||||
|
Revenue |
- | - | 25,129 | - | 25,129 | |||||||||||||||
|
Cost of sales |
- | - | (16,846) | - | (16,846) | |||||||||||||||
|
Gross profit |
- | - | 8,283 | - | 8,283 | |||||||||||||||
|
Operating income/(costs) |
1,531 | - | (7,320) | - | (5,789) | |||||||||||||||
|
Group operating profit |
1,531 | - | 963 | - | 2,494 | |||||||||||||||
|
(Loss)/profit on disposals |
(13) | - | 12 | - | (1) | |||||||||||||||
|
Profit before finance costs |
1,518 | - | 975 | - | 2,493 | |||||||||||||||
|
Finance costs |
(3) | (280) | (353) | 290 | (346) | |||||||||||||||
|
Finance income |
- | 290 | 20 | (290) | 20 | |||||||||||||||
|
Other financial expense |
- | - | (112) | - | (112) | |||||||||||||||
|
Share of subsidiaries’ profit before tax |
522 | 136 | - | (658) | - | |||||||||||||||
|
Share of equity accounted investments’ profit |
60 | - | 60 | (60) | 60 | |||||||||||||||
|
Profit before tax from continuing operations |
2,097 | 146 | 590 | (718) | 2,115 | |||||||||||||||
|
Income tax expense |
(477) | (36) | (441) | 477 | (477) | |||||||||||||||
|
Group profit for the financial year from continuing operations |
1,620 | 110 | 149 | (241) | 1,638 | |||||||||||||||
|
Profit after tax for the financial year from discontinued operations |
309 | - | 310 | (309) | 310 | |||||||||||||||
|
Group profit for the financial year |
1,929 | 110 | 459 | (550) | 1,948 | |||||||||||||||
|
Profit attributable to: |
||||||||||||||||||||
|
Equity holders of the Company |
||||||||||||||||||||
|
From continuing operations |
1,620 | 110 | 131 | (241) | 1,620 | |||||||||||||||
|
From discontinued operations |
309 | - | 309 | (309) | 309 | |||||||||||||||
|
Non-controlling interests |
||||||||||||||||||||
|
From continuing operations |
- | - | 18 | - | 18 | |||||||||||||||
|
From discontinued operations |
- | - | 1 | - | 1 | |||||||||||||||
|
Group profit for the financial year |
1,929 | 110 | 459 | (550) | 1,948 | |||||||||||||||
| Supplemental Condensed Consolidated Statement of Comprehensive Income | ||||||||||||||||||||
|
Group profit for the financial year |
1,929 | 110 | 459 | (550) | 1,948 | |||||||||||||||
|
Other comprehensive income |
||||||||||||||||||||
|
Items that may be reclassified to profit or loss in subsequent years: |
||||||||||||||||||||
|
Currency translation effects |
319 | 27 | 316 | (319) | 343 | |||||||||||||||
|
Gains relating to cash flow hedges |
24 | - | 24 | (24) | 24 | |||||||||||||||
|
Tax relating to cash flow hedges |
(3) | - | (3) | 3 | (3) | |||||||||||||||
| 340 | 27 | 337 | (340) | 364 | ||||||||||||||||
|
Items that will not be reclassified to profit or loss in subsequent years: |
||||||||||||||||||||
|
Remeasurement of retirement benefit obligations |
(17) | - | (17) | 17 | (17) | |||||||||||||||
|
Tax relating to retirement benefit obligations |
(3) | - | (3) | 3 | (3) | |||||||||||||||
| (20) | - | (20) | 20 | (20) | ||||||||||||||||
|
Total other comprehensive income for the financial year |
320 | 27 | 317 | (320) | 344 | |||||||||||||||
|
Total comprehensive income for the financial year |
2,249 | 137 | 776 | (870) | 2,292 | |||||||||||||||
|
Attributable to: |
||||||||||||||||||||
|
Equity holders of the Company |
2,249 | 137 | 733 | (870) | 2,249 | |||||||||||||||
|
Non-controlling interests |
- | - | 43 | - | 43 | |||||||||||||||
|
Total comprehensive income for the financial year |
2,249 | 137 | 776 | (870) | 2,292 | |||||||||||||||
Table of Contents
|
CRH ANNUAL REPORT AND FORM 20-F | 2019 |
211 |
Table of Contents
|
212 |
CRH ANNUAL REPORT AND FORM 20-F | 2019 |
37. Supplemental Guarantor Information - continued
Supplemental Condensed Consolidated Income Statement
| Year ended 31 December 2017 | Restated (i) | |||||||||||||||||||
|
Guarantor € m |
Issuer € m |
Non-Guarantor subsidiaries € m |
Eliminate and reclassify € m |
CRH and subsidiaries € m |
||||||||||||||||
|
Revenue |
- | - | 21,653 | - | 21,653 | |||||||||||||||
|
Cost of sales |
- | - | (14,275) | - | (14,275) | |||||||||||||||
|
Gross profit |
- | - | 7,378 | - | 7,378 | |||||||||||||||
|
Operating income/(costs) |
22 | - | (5,473) | - | (5,451) | |||||||||||||||
|
Group operating profit |
22 | - | 1,905 | - | 1,927 | |||||||||||||||
|
Profit on disposals |
- | - | 54 | - | 54 | |||||||||||||||
|
Profit before finance costs |
22 | - | 1,959 | - | 1,981 | |||||||||||||||
|
Finance costs |
- | (235) | (308) | 242 | (301) | |||||||||||||||
|
Finance income |
2 | 242 | 10 | (242) | 12 | |||||||||||||||
|
Other financial expense |
- | - | (59) | - | (59) | |||||||||||||||
|
Share of subsidiaries’ profit before tax |
1,586 | 83 | - | (1,669) | - | |||||||||||||||
|
Share of equity accounted investments’ profit |
52 | - | 52 | (52) | 52 | |||||||||||||||
|
Profit before tax from continuing operations |
1,662 | 90 | 1,654 | (1,721) | 1,685 | |||||||||||||||
|
Income tax expense |
(12) | (29) | 17 | 12 | (12) | |||||||||||||||
|
Group profit for the financial year from continuing operations |
1,650 | 61 | 1,671 | (1,709) | 1,673 | |||||||||||||||
|
Profit after tax for the financial year from discontinued operations |
245 | - | 246 | (245) | 246 | |||||||||||||||
|
Group profit for the financial year |
1,895 | 61 | 1,917 | (1,954) | 1,919 | |||||||||||||||
|
Profit attributable to: |
||||||||||||||||||||
|
Equity holders of the Company |
||||||||||||||||||||
|
From continuing operations |
1,650 | 61 | 1,648 | (1,709) | 1,650 | |||||||||||||||
|
From discontinued operations |
245 | - | 245 | (245) | 245 | |||||||||||||||
|
Non-controlling interests |
||||||||||||||||||||
|
From continuing operations |
- | - | 23 | - | 23 | |||||||||||||||
|
From discontinued operations |
- | - | 1 | - | 1 | |||||||||||||||
|
Group profit for the financial year |
1,895 | 61 | 1,917 | (1,954) | 1,919 | |||||||||||||||
|
(i) Restated to show the results of our former Europe Distribution segment in discontinued operations. |
|
|||||||||||||||||||
| Supplemental Condensed Consolidated Statement of Comprehensive Income | ||||||||||||||||||||
|
Group profit for the financial year |
1,895 | 61 | 1,917 | (1,954) | 1,919 | |||||||||||||||
|
Other comprehensive income |
||||||||||||||||||||
|
Items that may be reclassified to profit or loss in subsequent years: |
||||||||||||||||||||
|
Currency translation effects |
(1,015) | (186) | (890) | 1,015 | (1,076) | |||||||||||||||
|
Gains relating to cash flow hedges |
8 | - | 8 | (8) | 8 | |||||||||||||||
| (1,007) | (186) | (882) | 1,007 | (1,068) | ||||||||||||||||
|
Items that will not be reclassified to profit or loss in subsequent years: |
||||||||||||||||||||
|
Remeasurement of retirement benefit obligations |
114 | - | 114 | (114) | 114 | |||||||||||||||
|
Tax on items recognised directly within other comprehensive income |
(33) | - | (33) | 33 | (33) | |||||||||||||||
| 81 | - | 81 | (81) | 81 | ||||||||||||||||
|
Total other comprehensive income for the financial year |
(926) | (186) | (801) | 926 | (987) | |||||||||||||||
|
Total comprehensive income for the financial year |
969 | (125) | 1,116 | (1,028) | 932 | |||||||||||||||
|
Attributable to: |
||||||||||||||||||||
|
Equity holders of the Company |
969 | (125) | 1,153 | (1,028) | 969 | |||||||||||||||
|
Non-controlling interests |
- | - | (37) | - | (37) | |||||||||||||||
|
Total comprehensive income for the financial year |
969 | (125) | 1,116 | (1,028) | 932 | |||||||||||||||
Table of Contents
|
CRH ANNUAL REPORT AND FORM 20-F | 2019 |
213 |
Table of Contents
|
214 |
CRH ANNUAL REPORT AND FORM 20-F | 2019 |
37. Supplemental Guarantor Information - continued
Supplemental Condensed Consolidated Statement of Cash Flow
| Year ended 31 December 2018 | ||||||||||||||||||||
|
Guarantor
€ m |
Issuer
€ m |
Non-Guarantor
€ m |
Eliminate and
€ m |
CRH
and
subsidiaries € m |
||||||||||||||||
|
Cash flows from operating activities |
||||||||||||||||||||
|
Profit before tax from continuing operations |
1,738 | 122 | 7 | (126) | 1,741 | |||||||||||||||
|
Profit before tax from discontinued operations |
1,678 | - | 1,679 | (1,678) | 1,679 | |||||||||||||||
|
Profit before tax |
3,416 | 122 | 1,686 | (1,804) | 3,420 | |||||||||||||||
|
Finance costs (net) |
(1) | (7) | 359 | - | 351 | |||||||||||||||
|
Share of subsidiaries’ profit before tax |
(1,629) | (115) | - | 1,744 | - | |||||||||||||||
|
Share of equity accounted investments’ profit |
(60) | - | (60) | 60 | (60) | |||||||||||||||
|
Loss/(profit) on disposals |
15 | - | (1,554) | - | (1,539) | |||||||||||||||
|
Group operating profit |
1,741 | - | 431 | - | 2,172 | |||||||||||||||
|
Depreciation charge |
- | - | 1,071 | - | 1,071 | |||||||||||||||
|
Amortisation of intangible assets |
- | - | 61 | - | 61 | |||||||||||||||
|
Impairment charge |
- | - | 56 | - | 56 | |||||||||||||||
|
Share-based payment (income)/expense |
(13) | - | 80 | - | 67 | |||||||||||||||
|
Other (primarily pension payments) |
- | - | (67) | - | (67) | |||||||||||||||
|
Net movement on working capital and provisions |
- | (4) | (459) | - | (463) | |||||||||||||||
|
Cash generated from operations |
1,728 | (4) | 1,173 | - | 2,897 | |||||||||||||||
|
Interest paid (including leases) |
- | (224) | (342) | 231 | (335) | |||||||||||||||
|
Corporation tax paid |
- | (32) | (631) | - | (663) | |||||||||||||||
|
Net cash inflow/(outflow) from operating activities |
1,728 | (260) | 200 | 231 | 1,899 | |||||||||||||||
|
Cash flows from investing activities |
||||||||||||||||||||
|
Proceeds from disposals (net of cash disposed and deferred proceeds) |
- | - | 3,009 | - | 3,009 | |||||||||||||||
|
Interest received |
1 | 231 | 33 | (231) | 34 | |||||||||||||||
|
Dividends received from equity accounted investments |
- | - | 48 | - | 48 | |||||||||||||||
|
Purchase of property, plant and equipment |
- | - | (1,121) | - | (1,121) | |||||||||||||||
|
Advances from subsidiary and parent undertakings |
(184) | 241 | 238 | (295) | - | |||||||||||||||
|
Acquisition of subsidiaries (net of cash acquired) |
- | - | (3,505) | - | (3,505) | |||||||||||||||
|
Other investments and advances |
- | - | (2) | - | (2) | |||||||||||||||
|
Deferred and contingent acquisition consideration paid |
- | - | (55) | - | (55) | |||||||||||||||
|
Net cash (outflow)/inflow from investing activities |
(183) | 472 | (1,355) | (526) | (1,592) | |||||||||||||||
|
Cash flows from financing activities |
||||||||||||||||||||
|
Proceeds from issue of shares (net) |
11 | - | - | - | 11 | |||||||||||||||
|
Proceeds from exercise of share options |
7 | - | - | - | 7 | |||||||||||||||
|
Advances to subsidiary and parent undertakings |
(238) | - | (57) | 295 | - | |||||||||||||||
|
Increase in interest-bearing loans and borrowings |
- | 31 | 1,403 | - | 1,434 | |||||||||||||||
|
Net cash flow arising from derivative financial instruments |
- | - | 6 | - | 6 | |||||||||||||||
|
Repayment of interest-bearing loans, borrowings and finance leases |
(2) | (243) | (1) | - | (246) | |||||||||||||||
|
Treasury Shares/own shares purchased |
(792) | - | - | - | (792) | |||||||||||||||
|
Dividends paid to equity holders of the Company |
(521) | - | - | - | (521) | |||||||||||||||
|
Dividends paid to non-controlling interests |
- | - | (12) | - | (12) | |||||||||||||||
|
Net cash (outflow)/inflow from financing activities |
(1,535) | (212) | 1,339 | 295 | (113) | |||||||||||||||
|
Increase in cash and cash equivalents |
10 | - | 184 | - | 194 | |||||||||||||||
|
Reconciliation of opening to closing cash and cash equivalents |
||||||||||||||||||||
|
Cash and cash equivalents at 1 January |
401 | - | 1,734 | - | 2,135 | |||||||||||||||
|
Translation adjustment |
- | - | 17 | - | 17 | |||||||||||||||
|
Increase in cash and cash equivalents |
10 | - | 184 | - | 194 | |||||||||||||||
|
Cash and cash equivalents at 31 December |
411 | - | 1,935 | - | 2,346 | |||||||||||||||
Table of Contents
|
CRH ANNUAL REPORT AND FORM 20-F | 2019 |
215 |
Table of Contents
|
216 |
CRH ANNUAL REPORT AND FORM 20-F | 2019 |
[THIS PAGE INTENTIONALLY LEFT BLANK]
Table of Contents
|
CRH ANNUAL REPORT AND FORM 20-F | 2019 |
217 |
Table of Contents
|
218 |
CRH ANNUAL REPORT AND FORM 20-F | 2019 |
[THIS PAGE INTENTIONALLY LEFT BLANK]
Table of Contents
|
CRH ANNUAL REPORT AND FORM 20-F | 2019 |
219 |
Table of Contents
|
220 |
CRH ANNUAL REPORT AND FORM 20-F | 2019 |
[THIS PAGE INTENTIONALLY LEFT BLANK]
Table of Contents
|
CRH ANNUAL REPORT AND FORM 20-F | 2019 |
221 |
Table of Contents

CRH’s office in Atlanta, Georgia underwent a significant redesign of its 80,000 sq. ft workspace in 2019. CRH’s own materials and products feature throughout the three office floors, including aggregates, concrete, hardware, glass and staircases. The project was completed in June 2019, creating a state-of-the-art, open-plan work environment.
Table of Contents

| 224 - 245 | Selected Financial Data | 224 | ||||||||
|
|
225 | |||||||||
| Contractual Obligations | 229 | |||||||||
| Property, Plants and Equipment | 230 | |||||||||
| Mineral Reserves | 231 | |||||||||
| Risk Factors | 233 | |||||||||
| Corporate Governance Practices | 242 | |||||||||
| The Environment and Government Regulations | 244 | |||||||||
| Other Disclosures | 245 | |||||||||
Table of Contents
| 224 |
CRH ANNUAL REPORT AND FORM 20-F I 2019
|
Table of Contents
|
CRH ANNUAL REPORT AND FORM 20-F I 2019
|
225 |

Table of Contents
| 226 |
CRH ANNUAL REPORT AND FORM 20-F I 2019
|
Table of Contents
|
CRH ANNUAL REPORT AND FORM 20-F I 2019
|
227 |
Table of Contents
| 228 |
CRH ANNUAL REPORT AND FORM 20-F I 2019
|
Table of Contents
|
CRH ANNUAL REPORT AND FORM 20-F I 2019
|
229 |
Table of Contents
| 230 |
CRH ANNUAL REPORT AND FORM 20-F I 2019
|
Table of Contents
|
CRH ANNUAL REPORT AND FORM 20-F I 2019
|
231 |
Table of Contents
| 232 |
CRH ANNUAL REPORT AND FORM 20-F I 2019
|
Table of Contents
|
CRH ANNUAL REPORT AND FORM 20-F I 2019
|
233 |
Table of Contents
| 234 |
CRH ANNUAL REPORT AND FORM 20-F I 2019
|
Table of Contents
|
CRH ANNUAL REPORT AND FORM 20-F I 2019
|
235 |
Table of Contents
| 236 |
CRH ANNUAL REPORT AND FORM 20-F I 2019
|
Table of Contents
|
CRH ANNUAL REPORT AND FORM 20-F I 2019
|
237 |
Table of Contents
| 238 |
CRH ANNUAL REPORT AND FORM 20-F I 2019
|
Table of Contents
|
CRH ANNUAL REPORT AND FORM 20-F I 2019
|
239 |
Table of Contents
| 240 |
CRH ANNUAL REPORT AND FORM 20-F I 2019
|
Table of Contents
|
CRH ANNUAL REPORT AND FORM 20-F I 2019
|
241 |
Table of Contents
| 242 |
CRH ANNUAL REPORT AND FORM 20-F I 2019
|
Table of Contents
|
CRH ANNUAL REPORT AND FORM 20-F I 2019
|
243 |
Table of Contents
| 244 |
CRH ANNUAL REPORT AND FORM 20-F I 2019
|
Table of Contents
|
CRH ANNUAL REPORT AND FORM 20-F I 2019
|
245 |
Table of Contents
|
Polbruk, part of CRH’s Building Products Division, supplied products for this school in Rzeszów, Poland. Urbanika 60 slabs covered the courtyard and main entrance and a range of other products finished off areas around the buildings, comprising over 5,000m2 of products in total. |
Table of Contents

Table of Contents
| 248 |
CRH ANNUAL REPORT AND FORM 20-F I 2019
|
Table of Contents
|
CRH ANNUAL REPORT AND FORM 20-F I 2019
|
249 |

Table of Contents
| 250 |
CRH ANNUAL REPORT AND FORM 20-F I 2019
|
Table of Contents
|
CRH ANNUAL REPORT AND FORM 20-F I 2019
|
251 |
Table of Contents
| 252 |
CRH ANNUAL REPORT AND FORM 20-F I 2019
|
Table of Contents
|
CRH ANNUAL REPORT AND FORM 20-F I 2019
|
253 |
Table of Contents
| 254 |
CRH ANNUAL REPORT AND FORM 20-F I 2019
|
Table of Contents
|
CRH ANNUAL REPORT AND FORM 20-F I 2019
|
255 |


Table of Contents
| 256 |
CRH ANNUAL REPORT AND FORM 20-F I 2019
|
Table of Contents
|
CRH ANNUAL REPORT AND FORM 20-F I 2019
|
257 |
Table of Contents
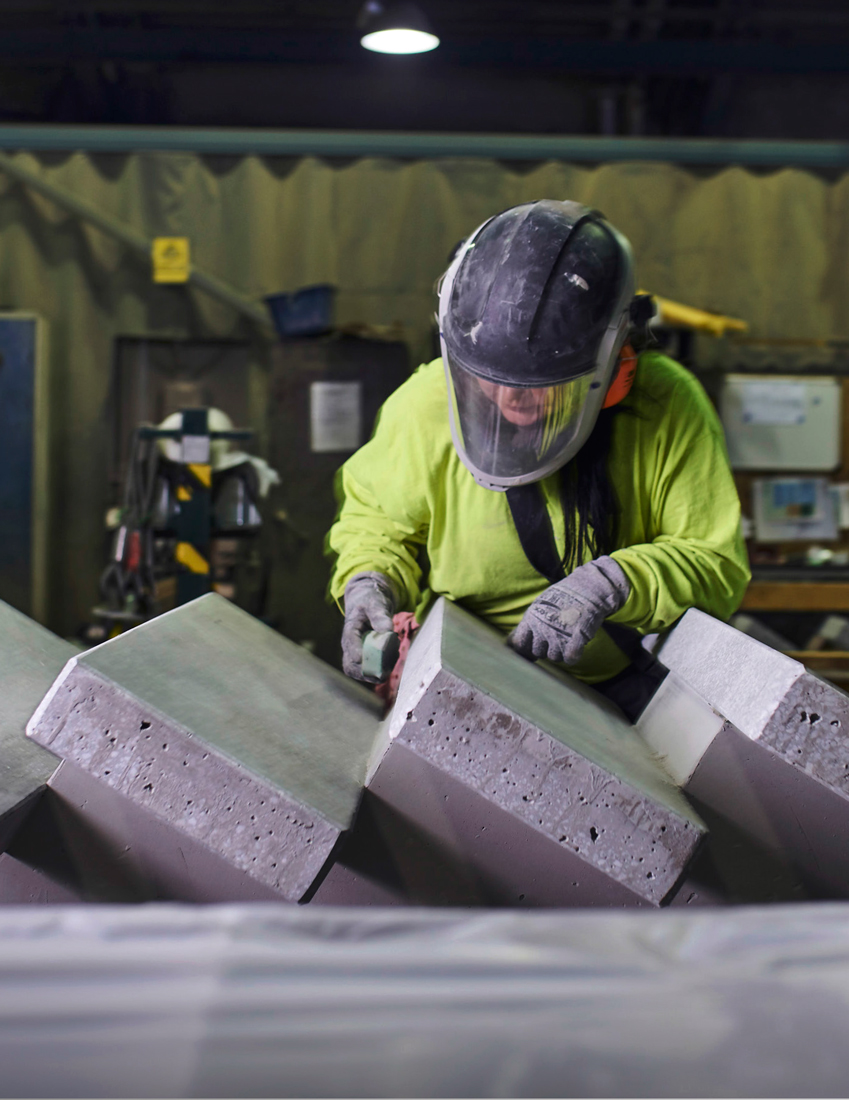
|
Rudus, part of CRH’s Europe Materials Division, is a leading manufacturer of stone-based building materials in Finland. The Sammonmäki plant in Tuusula produces a range of concrete stair elements. With a dedicated product design team at the plant, Rudus ensures an efficient and seamless design and production process, delivering high-quality, tailored products to its customers. |
Table of Contents
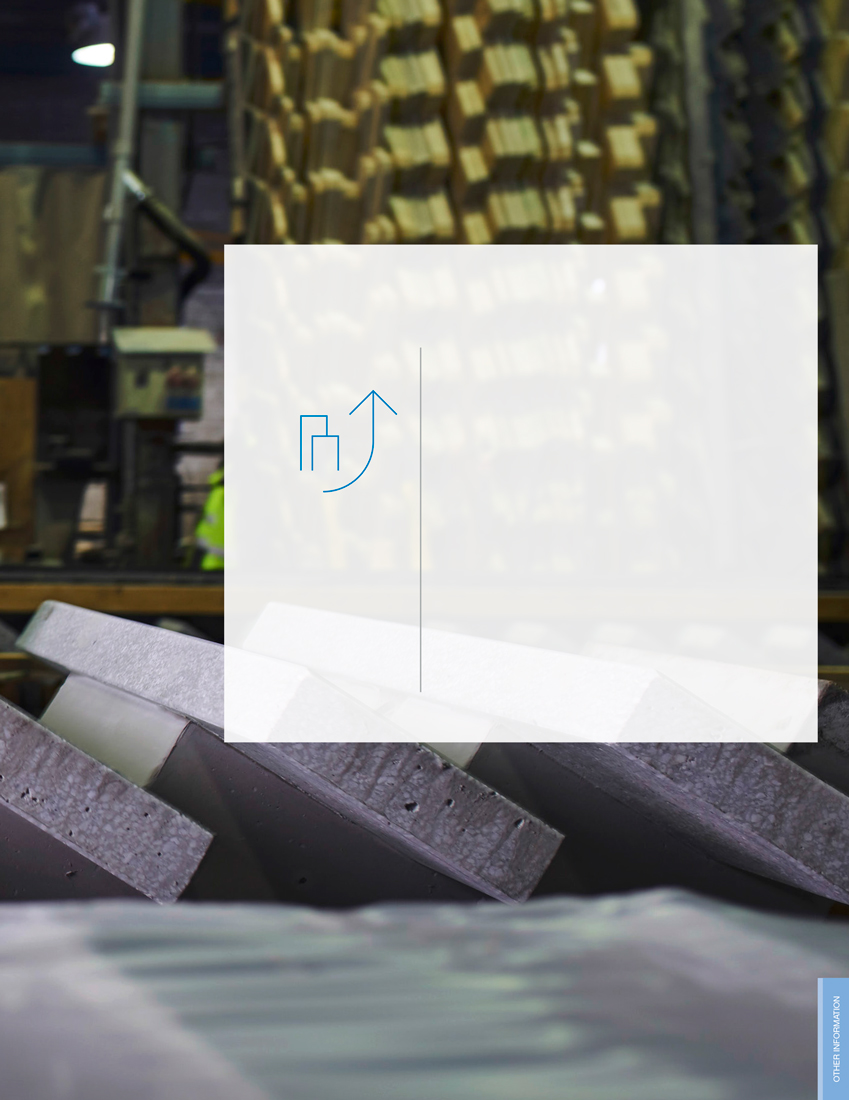
Table of Contents
| 260 |
CRH ANNUAL REPORT AND FORM 20-F I 2019
|
Table of Contents
|
CRH ANNUAL REPORT AND FORM 20-F I 2019
|
261 |

Table of Contents
| 262 |
CRH ANNUAL REPORT AND FORM 20-F I 2019
|
Table of Contents
|
CRH ANNUAL REPORT AND FORM 20-F I 2019
|
263 |
Table of Contents
| 264 |
CRH ANNUAL REPORT AND FORM 20-F I 2019
|
Table of Contents
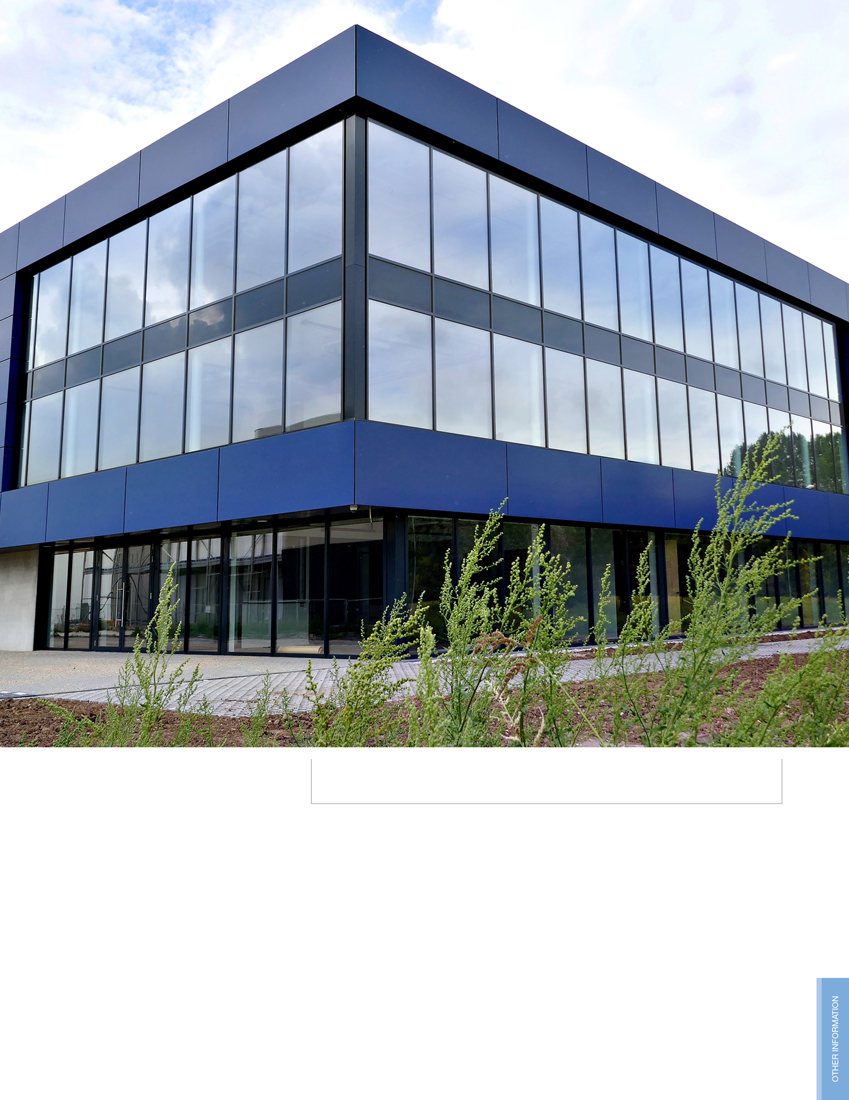
|
CRH’s Building Products Division acquired Filoform B.V. in May 2019. The business, which is headquartered in Geldermalsen in the Netherlands, manufactures components and systems for network infrastructure solutions and exports to over 40 countries. |
|
Table of Contents
| 266 |
CRH ANNUAL REPORT AND FORM 20-F I 2019
|
Table of Contents
|
CRH ANNUAL REPORT AND FORM 20-F I 2019
|
267 |
Table of Contents
| 268 |
CRH ANNUAL REPORT AND FORM 20-F I 2019
|


Table of Contents
|
CRH ANNUAL REPORT AND FORM 20-F I 2019
|
269 |
Table of Contents
| 270 |
CRH ANNUAL REPORT AND FORM 20-F I 2019
|
Table of Contents
|
CRH ANNUAL REPORT AND FORM 20-F I 2019
|
271 |
Table of Contents
| 272 |
CRH ANNUAL REPORT AND FORM 20-F I 2019
|
Table of Contents

Table of Contents

|
||||
|
CRH plc
Stonemason’s Way Rathfarnham Dublin 16 D16 KH51 Ireland
Telephone: +353 1 404 1000 E-mail: mail@crh.com
Website: www.crh.com
Registered Office 42 Fitzwilliam Square Dublin 2 D02 R279 Ireland
Telephone: +353 1 634 4340 E-mail: crh42@crh.com |
Cover image: Oldcastle Infrastructure, part of CRH’s Building Products Division, designed bespoke floating concrete slabs for a Los Angeles Metro Rail project in California. The slabs reduce vibration and noise from trains passing under the Walt Disney Concert Hall. When complete, over 500 slabs will support a section of track around three-quarters of a mile long. | |||
|
CRH ® is a registered trade mark of CRH plc. |