CHARLES RIVER LABORATORIES INTERNATIONAL, INC.
10-Ks and 10-Qs
|
|
|
|
|
|
|
|
|
|
|
|
|
|
|
|
|
|
|
|
|
|
|
|
|
|
|
|
|
|
|
|
|
|
|
|
|
|
|
|
|
|
|
|
|
|
|
|
|
|
|
|
|
|
|
|
UNITED STATES
SECURITIES AND EXCHANGE COMMISSION
Washington, D.C. 20549
____________________________________________
FORM 10-K
|
(Mark One)
|
|
|
ý
|
ANNUAL REPORT PURSUANT TO SECTION 13 OR 15(d) OF THE SECURITIES EXCHANGE ACT OF 1934
|
|
FOR THE FISCAL YEAR ENDED DECEMBER 29, 2018
|
|
|
OR
|
|
|
o
|
TRANSITION REPORT PURSUANT TO SECTION 13 OR 15(d) OF THE SECURITIES EXCHANGE ACT OF 1934
|
|
FOR THE TRANSITION PERIOD FROM TO
|
|
Commission File No. 001-15943

CHARLES RIVER LABORATORIES INTERNATIONAL, INC.
(Exact Name of Registrant as Specified in Its Charter)
|
Delaware
|
|
06-1397316
|
|
(State or Other Jurisdiction of
Incorporation or Organization)
|
|
(I.R.S. Employer
Identification No.)
|
|
251 Ballardvale Street
Wilmington, Massachusetts
|
|
01887
|
|
(Address of Principal Executive Offices)
|
(Zip Code)
|
|
____________________________________________________________________________
(Registrant’s telephone number, including area code):
(781) 222-6000
Securities registered pursuant to Section 12(b) of the Act:
|
Title of each class
|
Name of each exchange
on which registered
|
|
|
Common Stock, $0.01 par value
|
New York Stock Exchange
|
|
Securities registered pursuant to Section 12(g) of the Act: None
Indicate by check mark whether the registrant is a well-known seasoned issuer, as defined in Rule 405 of the Securities Act. Yes
ý
No
o
Indicate by check mark if the registrant is not required to file reports pursuant to Section 13 or Section 15(d) of the Act. Yes
o
No
ý
Indicate by check mark whether the Registrant (1) has filed all reports required to be filed by Section 13 or 15(d) of the Securities Exchange Act of 1934 during the preceding 12 months (or for such shorter period that the Registrant was required to file such reports), and (2) has been subject to such filing requirements for the past 90 days. Yes
ý
No
o
Indicate by check mark whether the registrant has submitted electronically every Interactive Data File required to be submitted pursuant to Rule 405 of Regulation S-T (§ 232.405 of this chapter) during the preceding 12 months (or for such shorter period that the registrant was required to submit such files.) Yes
ý
No
o
Indicate by check mark if disclosure of delinquent filers pursuant to Item 405 of Regulation S-K is not contained herein, and will not be contained, to the best of the Registrant’s knowledge, in definitive proxy or information statements incorporated by reference in Part III of this Form 10-K or any amendment to this Form 10-K.
ý
Indicate by check mark whether the Registrant is a large accelerated filer, an accelerated filer, a non-accelerated filer, a smaller reporting company, or an emerging growth company. See the definitions of “large accelerated filer,” “accelerated filer”, “smaller reporting company”, and “emerging growth company” in Rule 12b-2 of the Exchange Act.
|
Large accelerated filer
ý
|
Accelerated filer
o
|
Non-accelerated filer
o
|
||
|
Smaller reporting company
o
|
Emerging growth company
o
|
|||
If an emerging growth company, indicate by a check mark if the registrant has elected not to use the extended transition period for complying with any new or revised financial accounting standards provided pursuant to Section 13(a) of the Exchange Act.
o
Indicate by check mark whether the registrant is a shell company (as defined in Rule 12b-2 of the Exchange Act). Yes
o
No
ý
On
June 30, 2018
, the aggregate market value of the Registrant’s voting common stock held by non-affiliates of the Registrant was approximately
$5,286,825,427
. As of
January 25, 2019
, there were
48,226,323
shares of the Registrant’s common stock outstanding, $0.01 par value per share.
DOCUMENTS INCORPORATED BY REFERENCE
Portions of the Registrant’s definitive Proxy Statement for its
2019
Annual Meeting of Shareholders scheduled to be held on
May 21, 2019
, which will be filed with the Securities and Exchange Commission (SEC) not later than 120 days after
December 29, 2018
,
are incorporated by reference into Part III of this Annual Report on Form 10-K. With the exception of the portions of the
2019
Proxy Statement expressly incorporated into this Annual Report on Form 10-K by reference, such document shall not be deemed filed as part of this Form 10-K.
CHARLES RIVER LABORATORIES INTERNATIONAL, INC.
ANNUAL REPORT ON FORM 10-K
FOR FISCAL YEAR
2018
TABLE OF CONTENTS
|
Item
|
|
Page
|
|
PART I
|
|
|
|
1
|
||
|
1A
|
||
|
1B
|
||
|
2
|
||
|
3
|
||
|
4
|
Mine Safety Disclosures
|
|
|
PART II
|
||
|
5
|
Market for Registrant’s Common Equity, Related Stockholder Matters and Issuer Purchases of Equity Securities
|
|
|
6
|
||
|
7
|
||
|
7A
|
Quantitative and Qualitative Disclosures
about Market Risk
|
|
|
8
|
||
|
9
|
||
|
9A
|
||
|
9B
|
||
|
PART III
|
||
|
10
|
||
|
11
|
||
|
12
|
||
|
13
|
||
|
14
|
||
|
PART IV
|
||
|
15
|
||
|
16
|
Form 10-K Summary
|
|
|
Signatures
|
||
|
Exhibit Index
|
||
PART I
Item 1. Business
General
This Annual Report on Form 10-K contains forward-looking statements regarding future events and the future results of Charles River Laboratories International, Inc. that are based on our current expectations, estimates, forecasts and projections about the industries in which we operate and the beliefs and assumptions of our management. Words such as “expect,” “anticipate,” “target,” “goal,” “project,” “intend,” “plan,” “believe,” “seek,” “estimate,” “will,” “likely,” “may,” “designed,” “would,” “future,” “can,” “could” and other similar expressions that are predictions, indicate future events and trends or which do not relate to historical matters are intended to identify such forward-looking statements. These statements are based on our current expectations and beliefs and involve a number of risks, uncertainties and assumptions that are difficult to predict. For example, we may use forward-looking statements when addressing topics such as: goodwill and asset impairments still under review; future demand for drug discovery and development products and services, including the outsourcing of these services; our expectations regarding stock repurchases, including the number of shares to be repurchased, expected timing and duration, the amount of capital that may be expended and the treatment of repurchased shares; present spending trends and other cost reduction activities by our clients; future actions by our management; the outcome of contingencies; changes in our business strategy, business practices and methods of generating revenue; the development and performance of our services and products; market and industry conditions, including competitive and pricing trends; our strategic relationships with leading pharmaceutical companies and venture capital limited partnerships, and opportunities for future similar arrangements; our cost structure; the impact of completed and in-process acquisitions (including Argenta, BioFocus, VivoPath, ChanTest, Sunrise, Celsis, Oncotest, WIL Research, Blue Stream, Agilux, Brains On-Line, KWS BioTest, MPI Research, and Citoxlab) and the timing of closing of in-process acquisitions; our expectations with respect to revenue growth and operating synergies (including the impact of specific actions intended to cause related improvements); the impact of specific actions intended to improve overall operating efficiencies and profitability (and our ability to accommodate future demand with our infrastructure), including gains and losses attributable to businesses we plan to close, consolidate or divest; changes in our expectations regarding future stock option, restricted stock, performance share units and other equity grants to employees and directors; expectations with respect to foreign currency exchange; assessing (or changing our assessment of) our tax positions for financial statement purposes; and our liquidity. In addition, these statements include the impact of economic and market conditions on us and our clients; the effects of our cost-saving actions and the steps to optimize returns to shareholders on an effective and timely basis.
You should not rely on forward-looking statements because they are predictions and are subject to risks, uncertainties and assumptions that are difficult to predict. Therefore, actual results may differ materially and adversely from those expressed in any forward-looking statements. You are cautioned not to place undue reliance on these forward-looking statements, which speak only as of the date of this document or in the case of statements incorporated by reference, on the date of the document incorporated by reference. Factors that might cause or contribute to such differences include, but are not limited to, those discussed in this Form 10-K under the sections entitled “Our Strategy,” “Risk Factors,” "Management's Discussion and Analysis of Financial Condition and Results of Operations,” in our press releases and other financial filings with the SEC. We have no obligation to publicly update or revise any forward-looking statements, whether as a result of new information, future events or risks. New information, future events or risks may cause the forward-looking events we discuss in this report not to occur.
Corporate History
We began operating in 1947 and since then, we have undergone several changes to our business structure. Charles River Laboratories International, Inc. was incorporated in 1994 and in 2000 we completed our initial public offering. Our stock is traded on the New York Stock Exchange under the symbol “CRL” and is included in the Standard & Poor's MidCap 400, 1000 and Composite 1500 indices, the Dow Jones U.S. Health Care Index, the NYSE Arca Biotechnology Index, the NYSE Composite, and many of the Russell indices, among others. We are headquartered in Wilmington, Massachusetts. Our headquarters mailing address is 251 Ballardvale Street, Wilmington, MA, 01887, and the telephone number at that location is (781) 222-6000. Our Internet site is www.criver.com. Material contained on our Internet site is not incorporated by reference into this Form 10-K. Unless the context otherwise requires, references in this Form 10-K to “Charles River,” “we,” “us” “the Company” or “our” refer to Charles River Laboratories International, Inc. and its subsidiaries.
This Form 10-K, as well as all other reports filed with the SEC, is available free of charge through the Investor Relations section of our Internet site (
www.criver.com
) as soon as practicable after we electronically file such material with, or furnish it
1
to, the SEC. The SEC maintains an Internet site (http://www.sec.gov) that contains reports, proxy and information statements, and other information regarding issuers that file electronically with the SEC.
Overview
We are a full service, early-stage contract research organization (CRO). We have built upon our core competency of laboratory animal medicine and science (research model technologies) to develop a diverse portfolio of discovery and safety assessment services, both Good Laboratory Practice (GLP) and non-GLP, which is able to support our clients from target identification through non-clinical development. We also provide a suite of products and services to support our clients’ manufacturing activities. Utilizing our broad portfolio of products and services enables our clients to create a more flexible drug development model, which reduces their costs, enhances their productivity and effectiveness, and increases speed to market.
Discovery represents the earliest stages of research in the life sciences, directed at the identification, screening, and selection of a lead molecule for future drug development. Discovery activities typically extend anywhere from 4 to 6 years in conventional pharmaceutical research and development timelines.
Development activities, which follow, and which can take up to 7 to 10 years, are directed at demonstrating the safety, tolerability, and clinical efficacy of the selected drug candidates. During the non-clinical stage of the development process, a drug candidate is tested
in vitro
(non-animal, typically on a cellular or sub-cellular level in a test tube or multi-well petri plate) and
in vivo
(in research models) to support human clinical trials.
The development of new drugs requires a steadily increasing investment of time and money. Various studies and reports estimate that it takes between 10 to 15 years, up to $2.0 billion excluding time costs, and exploration of between 10,000 and 15,000 drug molecules to produce a single Food and Drug Administration (FDA)-approved drug. We are positioned to leverage our leading portfolio in early-stage drug research in an efficient and cost-effective way to aid our clients in bringing their drugs to market faster.
For over 70 years, we have been in the business of providing the research models required in research and development of new drugs, devices, and therapies. Over this time, we have built upon our core competency of
in vivo
biology to develop a diverse and expanding portfolio of products and services, which now encompasses the broader early-stage drug research process. Our client base includes global pharmaceutical companies, biotechnology companies, government agencies, and hospitals and academic institutions around the world. We currently operate in over 80 facilities and in approximately 20 countries worldwide, which numbers exclude our Insourcing Solutions (IS) sites.
Our products and services, supported by our global infrastructure and deep scientific expertise, enable our clients to overcome many of the challenges of early-stage life sciences research.
In
2018
, our total revenue was
$2.3 billion
and our operating income from continuing operations, before income taxes, was
$281.7 million
.
We have three reporting segments: Research Models and Services (RMS), Discovery and Safety Assessment (DSA), and Manufacturing Support (Manufacturing).
Through our RMS segment, we have been supplying research models to the drug development industry since 1947. With over 150 different strains, we continue to maintain our position as a global leader in the production and sale of the most widely used rodent research model strains and purpose-bred rats and mice. We also provide a variety of related services that are designed to assist our clients in supporting the use of research models in drug discovery and development. We maintain multiple production centers, including barrier rooms and/or isolator facilities, on three continents (North America, Europe, and Asia). In 2018, RMS accounted for
22.9%
of our total revenue and approximately 3,600 of our employees, including approximately 130 science professionals with advanced degrees.
Our DSA business segment provides services that enable our clients to outsource their innovative drug discovery research, their related drug development activities, and their regulatory-required safety testing of potential new drugs, industrial and agricultural chemicals and medical devices to us. The demand for these services is driven by the needs of large global pharmaceutical companies that have exceeded their internal capacity or that are, or who are transitioning, to an outsourcing model of drug development, as well as by the needs of small biotechnology companies and non-governmental organizations who rely on outsourcing for most of their discovery, development and safety testing programs. Global pharmaceutical, biotechnology, and chemical companies choose to outsource their discovery, development, and safety activities because outsourcing reduces the significant investment in personnel, facilities and capital resources necessary to efficiently and effectively conduct required scientific studies. Additionally, outsourcing to Charles River provides companies access to scientific expertise that they may not have internally or otherwise available to them.
2
We are the largest provider of drug discovery, non-clinical development, and safety testing services worldwide and offer a comprehensive portfolio of services required for the development and regulatory submission of pharmaceuticals and industrial and agricultural chemicals. We have extensive expertise in the discovery of clinical candidates and in the design, execution, and reporting of safety assessment studies for numerous types of compounds including small and large molecule pharmaceuticals, industrial and agricultural chemicals, biocides and medical devices. We currently provide discovery and safety assessment services at multiple facilities located in the United States (U.S.), Canada, and Europe. Our DSA segment represented
58.1%
of our total revenue in
2018
and employed approximately 8,800 of our employees including approximately 1,300 science professionals with advanced degrees.
Through our Manufacturing segment, we help ensure the safe production and release of products manufactured by our clients. Our Microbial Solutions business provides
in vitro
methods for conventional and rapid quality control testing of sterile and non-sterile pharmaceuticals and consumer products. Our Biologics Testing Solutions business provides specialized testing of biologics frequently outsourced by global pharmaceutical and biotechnology companies. Our Avian Vaccine Services business provides specific-pathogen-free (SPF) fertile chicken eggs, SPF chickens and diagnostic products used to manufacture vaccines.
In
2018
, Manufacturing accounted for
19.0%
of our total revenue from continuing operations and approximately 1,800 of our employees, including approximately 140 science professionals with advanced degrees.
In recent years, we have focused our efforts on improving the efficiency of our global operations to enhance our ability to support our clients. Our pharmaceutical and biotechnology clients are increasingly seeking full service, “one-stop” global partners to whom they can outsource more of their drug discovery and development efforts. It is estimated that the market for regulated safety assessment services is at least 50% outsourced, while emerging growth areas such as discovery and certain research model services are currently believed to be less outsourced.
Research Models and Services (RMS)
.
Our RMS segment is comprised of (1) Research Models and (2) Research Model Services.
Research Models
.
Our Research Models business is comprised
of the production and sale of research models.
Research Models.
A significant portion of this business involves the commercial production and sale of research models, principally purpose-bred rats and mice for use by researchers. We provide our rodent models to numerous clients around the world, including most pharmaceutical companies, a broad range of biotechnology companies, and many government agencies, hospitals, and academic institutions. We have a global footprint with production facilities strategically located in 8 countries, in close proximity to our clients. Our research models include standard stocks and strains and disease models such as those with compromised immune systems, which are in demand as early-stage research tools. The FDA and foreign regulatory agencies typically require that the safety and efficacy of new drug candidates be tested on research models like ours prior to testing in humans. As a result, our research models are an essential part of the drug discovery and development process.
Our rodent species have been, and continue to be, some of the most extensively used research models in the world, largely as a result of our geographic footprint and continuous commitment to innovation and quality. Our research models are bred and maintained in controlled environments, which are designed to ensure that the models are free of specific viral and bacterial agents and other contaminants that can disrupt research operations and distort research results. With our production capabilities, we are able to deliver consistently high-quality research models worldwide.
Our research models include:
|
•
|
inbred, which are bred to be homogeneous;
|
|
•
|
outbred, which are purposefully bred for heterogeneity;
|
|
•
|
hybrid, which are the offspring of two different inbred parents;
|
|
•
|
spontaneous mutant, whose genotype results in a naturally occurring genetic mutation (such as immune deficiency); and
|
|
•
|
other genetically modified research models, such as knock-out models with one or more disabled genes and transgenic models.
|
Certain of our research models are proprietary rodent models used to research treatments for diseases such as diabetes, obesity, cardiovascular, cancer, central nervous system (CNS) and kidney disease.
3
We are also a premier provider of high quality, purpose bred, SPF large research models to the biomedical research community.
Research Model Services.
RMS also offers a variety of services designed to support our clients' use of research models in basic research and screening non-clinical drug candidates. These services address the need among pharmaceutical and biotechnology companies to outsource the non-core aspects of their drug discovery activities. Our services include those which are related to the maintenance and monitoring of research models, and managing research operations for government entities, academic organizations, and commercial clients. We currently have three service offerings in research models services: Genetically Engineered Models and Services, Insourcing Solutions, and Research Animal Diagnostic Services.
Genetically Engineered Models and Services (GEMS)
.
We create, breed and maintain research models required by our clients for biomedical research activities. The creation of a genetically engineered model (GEM) is a critical scientific event, but it is only the first step in the discovery process, and our scientists can advise clients on how to efficiently create custom models utilizing in-licensed technologies and approaches to modify the genome. Through our phenotyping platforms we can also design and conduct the relevant studies and tests allowing characterization of the generated models. Productive utilization of GEMs requires significant additional technical expertise in order to properly support basic and early discovery research. We provide breeding expertise and colony development, quarantine, health and genetic testing and monitoring, germplasm cryopreservation, and rederivation including assisted reproduction and model creation. Our team of project managers is supported by a technologically advanced Internet Colony Management (ICM™) system that allows for real-time data exchange. We provide these services to clients around the world, including pharmaceutical and biotechnology companies, hospitals, universities, and government agencies.
Insourcing Solutions (IS)
.
We manage research operations (including recruitment, training, staffing and management services) in our clients’ facilities or in custom-designed facilities in which we lease space to government entities, academic organizations, and commercial clients. Some research institutions prefer to retain certain elements of their research in-house, while outsourcing staffing and management, thus driving demand for our services. We believe that our expertise in early-stage drug research, and in particular research model care, scientific and technical support, facility operations, and discovery and development services, enhances the productivity and quality of our clients' research programs.
Research Animal Diagnostic Services (RADS)
.
We monitor and analyze the health profiles of our clients’ research models and research biologics by providing infectious agents and pathology assessment. We developed this capability internally in order to address the quality control of our research model business. We are able to serve as our clients’ sole-source testing laboratory, or as an alternative source supporting our clients’ internal laboratory capabilities. We believe we are the reference laboratory of choice for health assessment of laboratory research models and an industry leader in the field of laboratory animal diagnostics.
Discovery and Safety Assessment (DSA)
We currently offer discovery and safety assessment services, both regulated and non-regulated, in which we include both
in vitro
and
in vivo
studies, supporting laboratory services, and strategic non-clinical consulting and program management to support product development.
Discovery Services
.
We offer a full spectrum of discovery services from identification of a novel druggable target, followed by high-throughput screening and medicinal chemistry, through delivery of non-clinical drug and therapeutic candidates ready for safety assessment. Our Early Discovery,
In Vitro
and
In Vivo
Discovery businesses are integrated into a single business line - Discovery Services - as evidence of our efforts to streamline and enhance the support we can provide for clients’ integrated drug discovery programs from target identification to a therapeutic candidate before progressing into safety assessment process. One seamless discovery organization also allows us to better engage with clients at any stage of their drug discovery and support their complex scientific needs. We support a variety of therapeutic areas including oncology, CNS, immunology, bone and musculoskeletal, inflammation, metabolic diseases, respiratory and fibrotic diseases, cardiovascular, gastrointestinal, genito-urinary, anti-infectives, and ophthalmology. We also provide expertise in the growing area of rare and orphan diseases, which are typically diseases of high unmet medical need in smaller patient populations, such as myotonic dystrophy, cystic fibrosis, and Huntington’s Disease. We believe there are emerging opportunities to assist our clients in a variety of drug discovery applications and platforms from target discovery to candidate selection and across a range of modalities including small molecules, antibody and gene therapy.
Early Discovery.
We are a global leader in integrated drug discovery services, with a predominant focus on
in vitro
biology and medicinal chemistry capabilities. Our knowledge and expertise allow us to support our clients as they drive their molecules forward through design and implementation of clear program plans. Our full suite of service offerings allows us to support our clients at the earliest stages of their research, and to stay with them through the entire drug discovery process. Our Early Discovery service capabilities include:
4
|
•
|
target discovery and validation;
|
|
•
|
hit identification and optimization to deliver candidate molecules; and
|
|
•
|
target engagement biomarker development to support pre-clinical and potentially downstream clinical studies.
|
We also offer ion channel testing for both discovery and pre-clinical purposes. Our genome editing capabilities enable us to develop more translationally relevant research models designed to enhance scientific understanding and improve the efficiency and effectiveness of the drug discovery process. These services extend from the early discovery screening process through to
in vitro
GLP safety assessment testing. In addition, we also provide many of these services at our clients’ laboratories with Charles River scientists as part of an in-sourcing service model. In October 2018, we entered into an exclusive partnership with Distributed Bio, Inc., a leader in the computational design and optimization of antibody platforms. This partnership will enable our clients to access Distributed Bio’s extensive antibody libraries and integrated antibody optimization technologies. The combination of Distributed Bio’s antibody libraries with our extensive biologics development expertise creates a unique end-to-end platform for therapeutic antibody discovery and development.
In Vivo Discovery Services
.
In Vivo
Discovery Services are essential in early stage, non-clinical discovery research, directed at the identification, screening, optimization and selection of a candidate compounds for drug development. These
in vivo
activities typically extend anywhere from 2 to 4 years in conventional pharmaceutical research and development timelines. We offer research and development expertise, capabilities, and services globally to accelerate our clients' drug discovery pipelines from lead generation to candidate selection and on occasion, complete
in vivo
studies in support of clinical efforts or post-marketing work. We complement and extend clients' capabilities and expertise to improve their decision-making, increase their flexibility, and reduce their internal costs and product development timelines. In addition, we provide
in vitro
assays in support of lead optimization to candidate selection activities. Examples of this include early pharmacokinetic and pharmacodynamic studies and
in vitro
and
in vivo
assays to assess mechanism, bioavailability, metabolism, efficacy, pharmacology and safety.
In recent years we have made key acquisitions designed to augment our
In Vivo
Discovery Services offerings. In August 2017, we acquired Brains On-Line (BOL), a leading CRO that provides critical data that advances novel therapeutics for the treatment of CNS diseases. In January 2018, we acquired KWS BioTest (KWS), a leading CRO specializing in
in vitro
and
in vivo
discovery testing services for immuno-oncology and inflammatory and infectious diseases. Through partnerships, we are also expanding towards the integrated discovery and pre-clinical development of therapeutic antibodies.
Safety Assessment
.
We offer a full range of safety assessment studies required for regulatory submission on a global basis.
Bioanalysis, Drug Metabolism and Pharmacokinetics
. In support of non-clinical drug safety testing, our clients are required to demonstrate appropriate stability in the collected biological sample, pharmacokinetics of their drug or compound in circulation, the presence of metabolites, and, with biologics, the presence or absence of anti-drug antibodies. We have scientific depth in the sophisticated bioanalytical techniques required to satisfy these requirements for a number of drug classes. Once the analysis is complete, our scientists evaluate the data to provide information on the pharmacokinetics and/or toxicokinetics of the drug, and complete an evaluation of the biologic disposition of the drug and its potential metabolites. Pharmacokinetics refers to the understanding of what the body does to a drug or compound administered at therapeutic dose levels, including the process by which the drug is absorbed, distributed in the body, metabolized and excreted. Toxicokinetics refers to the same understanding as applied at higher doses that may result in adverse effects. These studies are required for the full non-clinical assessment of the disposition of the drug and the results are used in the final non-clinical safety evaluation of the compound to support the start of clinical trials. After performing sample analysis in support of non-clinical studies, we also have the capabilities to support the clinical bioanalysis required in clinical trials.
Safety Pharmacology.
Our clients are also required to conduct an assessment of Safety Pharmacology. This suite of studies is used to determine any effects on the vital organ systems of the body - cardiovascular, respiratory and CNS. Along with heart rate and blood pressure measurements, the cardiovascular assessment will also assess if the test article has the potential to inhibit the cardiac ion channel and prolong the cardiac QT interval of the electrocardiogram. Additionally, effects on the CNS and respiratory
system
s
are assessed
to complete the battery of studies to evaluate the vital organ systems of the body. Supplemental studies can also be performed to assess the renal, gastrointestinal, and autonomic nervous systems, as well as, dependency potential
. We have assays (both
in vitro
and
in vivo
) and can perform the screening prior to the commencement of first-in-human clinical trials. Our capabilities can also be used to investigate the mode of action behind an adverse effect found in a safety assessment study.
5
Toxicology.
We have expertise in the design and execution of development
programs in support of essentially all modalities of chemically-derived and biotechnology-derived pharmaceuticals. We also support safety studies to test industrial chemical, agrochemicals and medical devices. For human pharmaceutical candidates, once a lead molecule is selected, toxicology studies are required to support clinical trials in humans and for new drug registration. These toxicology studies focus on assessing the safety of the potential therapeutic to determine if administration to humans might cause any unintended harmful effects. For new chemicals, industrial chemicals, agrochemicals and medical devices, safety studies are performed to identify potential hazards to humans and the environment and are required for regulatory registration. Toxicology studies performed for any of these compounds are typically performed using
in vitro
and
in vivo
research models to identify any potential adverse effects that a compound has on an organism over a variety of doses and over various time periods of exposure.
Our toxicology services feature:
|
•
|
a broad offering of
in vitro
and
in vivo
capabilities and study types designed to identify possible safety risks;
|
|
•
|
a broad offering of
in vitro
and
in vivo
studies in support of general toxicology (acute, sub-acute, and chronic studies), genetic toxicology, safety pharmacology, and carcinogenicity bioassays that are required for regulatory submissions supporting “first-in-human” to “first-to-the-market” strategies for potential human therapeutics;
|
|
•
|
a broad offering of
in vitro
and
in vivo
studies in support of general toxicology (acute, sub-acute, and chronic studies), genetic toxicology, reproductive and developmental toxicology, environmental toxicology, and carcinogenicity bioassays that are required for regulatory submissions supporting the registration of industrial chemicals, agrochemicals, and biocides;
|
|
•
|
expertise in standard and specialty routes of administration (e.g., infusion, intravitreal, intrathecal, and inhalation) that are important not only for the testing of potential pharmaceuticals and biopharmaceuticals, but also for the safety testing of medical devices, nutraceuticals, animal health products, and other materials;
|
|
•
|
expertise in the conduct and assessment of reproductive, developmental, and juvenile toxicology studies (in support of larger-scale and later-stage human clinical trials or chemical registration);
|
|
•
|
expertise in environmental toxicology (aquatic and terrestrial) and regulatory submissions required for chemical and agrochemical registration;
|
|
•
|
services in important specialty areas such as ocular, bone, juvenile/neonatal, immune-toxicology, ototoxicology, photobiology, inhalation, drug abuse liability, surgery, imaging capabilities and dermal testing;
|
|
•
|
expertise in determining the potential for abuse of human pharmaceuticals (Drug Abuse Liability Testing);
|
|
•
|
expertise in testing of medical devices in the assessment of those devices and surrounding tissues;
|
|
•
|
expertise and experience and expertise in immunology and immunotoxicology;
|
|
•
|
expertise in all major therapeutic areas, particularly in stem and gene therapy, and orphan drugs;
|
|
•
|
study design and strategic advice to our clients based on our wealth of experience and scientific expertise in support of drug development and chemical registration; and
|
|
•
|
a strong history of assisting our clients in achieving their regulatory and/or internal milestones for the safety testing of numerous therapy types including stem cells, vaccines, proteins, antibodies, drug conjugates, oligonucleotide biotherapeutics, small molecules, medical devices, chemicals, and agrochemicals.
|
Our safety assessment facilities comply with GLP to the extent required by the FDA, Environmental Protection Agency, USDA, European Medicines Agency, European Chemicals Agency, Organization for Economic Co-operation and Development (OECD), as well as other international regulatory agencies. Furthermore, our early-stage discovery work, which is not subject to GLP standards, is typically carried out under a quality management system such as ISO 9100 or similarly constructed internally developed quality systems. Our facilities are regularly inspected by U.S. and other regulatory compliance monitoring authorities, our clients' quality assurance departments, and our own internal quality assessment program.
Pathology Services.
The ability to identify and characterize clinical and anatomic pathologic changes is critical in determining the safety and efficacy of potential new therapeutics, industrial and agriculture chemicals and medical devices. Key “go/no-go” decisions regarding continued product development are typically dependent on the identification, characterization and evaluation of fluid, tissue, and cellular changes that our experts identify and interpret for our clients. We employ a large number of highly trained veterinary anatomic and clinical pathologists and other scientists who use state-of-the-art techniques to
6
identify potential test compound-related changes. In addition to all standard anatomic and clinical pathology techniques, we provide specialized evaluations such as cytology, platelet function, assay development, immunohistochemistry,
in situ
hybridization, electron microscopy, image analysis, tissue morphometry, and stereology services.
In April 2018, we acquired MPI Research (MPI), a premier non-clinical contract research organization providing comprehensive testing services to biopharmaceutical and medical device companies worldwide. Acquiring MPI enhanced our position as a leading global early-stage CRO by strengthening our ability to partner with clients across the drug discovery and development continuum. The MPI business we acquired reports through our Discovery and Safety Assessment segment.
Manufacturing Support (Manufacturing)
Microbial Solutions
. Our Microbial Solutions business provides
in vitro
methods for conventional and rapid quality control testing of sterile and non-sterile biopharmaceutical and consumer products. Our legacy Endosafe business provides lot release testing of medical devices and injectable drugs for endotoxin contamination. Our Celsis business provides rapid microbial detection systems for quality control testing in the pharmaceutical and consumer products industries. Our Accugenix business provides state-of-the-art microbial identification and genetic sequencing services for manufacturing in the biopharmaceutical, medical device, nutraceutical, and consumer care industries.
Endotoxin testing is an
in vitro
process which uses a processed extract from the raw materials of the horseshoe crab, known as limulus amebocyte lysate (LAL). The LAL test is the first and most successful FDA-validated alternative to an
in vivo
test to date. The extraction of the raw materials for LAL does not harm the crabs, which are subsequently returned to their natural ocean environment. Our Microbial Solutions business produces and distributes a comprehensive portfolio of endotoxin testing, microbial detection and identification kits, reagents, software, accessories, instruments, and associated microbial quality control laboratory services to a broad range of companies manufacturing and releasing products from the pharmaceutical, biotechnology and consumer products industries, including the dairy, food and beverage markets through our strategic partnership with Hygiena. We are a market leader in endotoxin testing products and services, which are used for FDA-required quality control testing of injectable drugs and medical devices, their components, and the processes by which they are manufactured.
The growth in our Microbial Solutions business is driven by our FDA-approved line of next-generation endotoxin testing products. This line is based on the Endosafe Portable Testing System (Endosafe
®
-PTS™) technology, which allows rapid endotoxin testing in the central laboratory or manufacturing environment. In recent years, we expanded the PTS product portfolio to include a multiple sample testing system known as the Endosafe®-MCS™ (multi-cartridge system) and the first fully automated robotic system developed specifically for high-volume endotoxin testing, Endosafe®-Nexus, to satisfy the demand of our clients who require higher sample throughput. We have seen expanded use of this rapid endotoxin testing technology as clients transition from traditional methods to our rapid cartridge technology.
Celsis’ systems are principally used for product-release testing to help ensure the safe manufacture of pharmaceutical and consumer products. The Celsis Advance II™ and Celsis Accel™ systems for rapid microbial detection applications complement our PTS-Micro™, a rapid endotoxin detection system for sterile biopharmaceutical applications. We expect our comprehensive portfolio to drive increased adoption of our quality control testing solutions across both sterile and non-sterile applications.
Our Accugenix global lab network is the premier provider of ISO17025-accredited contract microbial identification services. Accugenix is an industry leader in species-level identification and strain typing of bacteria and fungi that are recovered from manufacturing facilities. Utilizing state-of-the-art and proprietary technologies, coupled with scientific expertise and analysis, Accugenix excels in providing accurate, timely, and cost-effective microbial identification services required to meet internal quality standards and government regulations.
Biologics Testing Solutions
.
We perform specialized testing of biologics frequently outsourced by pharmaceutical and biotechnology companies globally. Our laboratories in the U.S., Germany, Scotland, Ireland, and France provide timely and regulatory-compliant services in the areas of analytical, molecular biology, virology, cell-based bioassays, bioanalysis, immunochemistry, microbiology, cell biology,
in vivo
studies and related services. We provide analytical characterization, lot release and safety testing support for chemistry, manufacturing and controls and investigational new drug (IND) filings and confirm that biomanufacturing of clinical drug candidates and commercial drugs are consistent, correctly defined, stable, and essentially contaminant free. This testing is required by the FDA, EMA and other international regulatory authorities for our clients to obtain new drug approvals, to maintain government-licensed manufacturing facilities, and to manufacture and release market-approved therapeutic products for patient treatment.
7
Our cGMP manufacturing services facilities grow and store well-characterized early-stage client cell lines for later development or manufacture of therapeutic proteins and vaccines for clinical trials. We further design and provide viral clearance programs for Phase I, II, and III human clinical studies in our German and U.S. facilities.
To meet growing demand, we are currently expanding our Biologics Testing Solutions service offerings and facilities in the US and Europe.
Avian Vaccine Services
.
We are the global leader for the supply of SPF fertile chicken eggs and chickens. SPF chicken embryos are used by vaccine producers as self-contained “bioreactors” for the manufacture of live viruses. These viruses are used as a raw material for human and veterinary vaccine applications. The production of SPF eggs is performed under biosecure conditions, similar in many ways to our research model production. We have a worldwide presence, with several SPF egg production facilities in the U.S., and contracted production capabilities in Hungary. We also operate a specialized avian laboratory in the U.S., which provides in-house quality control testing of the SPF flocks, offers testing services to vaccine companies and commercial poultry operations, and manufactures poultry diagnostics and bulk antigens for poultry vaccines.
Our Strategy
Our objective is to be the preferred strategic global partner for our clients. Our strategy is to deliver a comprehensive and integrated portfolio of drug discovery and non-clinical development products, services, and solutions to support our clients' discovery and early-stage drug research, process development, scale up, and manufacturing efforts, and enable them to bring new and improved therapies to market faster and more cost effectively. In addition, we believe we can improve and augment drug discovery and early-stage development effectiveness by coordinating the dialog between large pharmaceutical, biotechnology, academic and non-governmental organizations, and venture capitalists. Separately, through our various Manufacturing segment businesses, we aim to be the premier provider of products and services that ensure our clients produce and release their products safely.
We believe we have certain competitive advantages in executing this strategy, as a result of our continuing focus on the following:
Integrated Early-Stage Portfolio
.
We are the only large, global CRO with a portfolio of products, services, and solutions that focuses on drug discovery and early-stage development. We provide research models and associated services, discovery research studies and services, and comprehensive safety assessment studies in both regulated and non-regulated environments. As such, we are able to collaborate with clients from target discovery through candidate selection. When critical decisions are made regarding which therapeutics will progress from discovery to development, we continue to work alongside our clients as the drug candidates move downstream. Our recognized expertise in early-stage drug research and pharmacology provides us with a competitive advantage and enables our clients to make critical drug development decisions more quickly. We understand our clients' therapies and the challenges they face during the discovery and development process, including mechanism of action, efficacy, drug metabolism, safety assessment, and toxicological testing critical for making “go/no-go” decisions.
Pharmaceutical Manufacturing Support Portfolio.
We also offer a portfolio of products, services, and solutions that supports the process development, scale up, and quality control efforts of the biopharmaceutical industry. We provide products and services that support the development and release of commercialized biologics products. In particular, we are an industry leader in the areas of microbial detection and microbial identification to support process development and ongoing commercial production. Our portfolio spans a broad range of traditional and rapid methods, which provide the highest testing quality, enhance productivity, and reduce cycle time.
Deep Scientific Expertis
e.
We provide a breadth and depth of scientific expertise across a broad range of therapeutic areas which may be too costly for our clients to build and/or maintain in-house. We provide essential capabilities, including biomarkers, biologics, medicinal chemistry,
in vitro
screening,
in vivo
pharmacology, immunology, pathology, biologics process development testing, microbial detection and identification, and other specialty service areas that have high infrastructure costs or are cost-prohibitive for clients to maintain independently. We continue to expand our portfolio in key therapeutic and pharmacology areas to align with our clients' internal drug discovery and development areas of focus. These areas of disease focus and expertise include oncology, metabolism and obesity, immunology, respiratory, bone and musculoskeletal, diabetes, cardiovascular, otology, ophthalmology, and CNS. In the areas of functional expertise, it includes synthetic and medicinal chemistry, cell line development,
in vitro
and
in vivo
assay development screening, non-clinical imaging, structural biology, process chemistry, reproductive and general toxicology, safety pharmacology, veterinary pathology, bioanalysis, scale up, and formulation development. We also continue to enhance our small molecule and biologics manufacturing portfolio in areas of greatest industry need,
8
where outsourcing provides major benefits for our clients and where we could provide significant benefits given our unique early development portfolio and global footprint.
Commitment to Animal Welfare
.
We are committed to being the worldwide leader in the humane care of laboratory animals and implementation of the “3Rs” initiative (Replacement, Reduction, and Refinement). As researchers, we are responsible to our clients, our animals and the public for the health and well-being of the animals in our care. We work hand-in-hand with the scientific community to understand how living conditions, handling procedures, and reduction of stress play an important role in the quality and efficiency of research.
Superior Quality and Client Support
.
We maintain scientific rigor and high-quality standards through management of key performance indicators and an intense focus on biosecurity and quality. These standards allow clients to access our global portfolio of products and services with the confidence that they will obtain consistent results no matter where they choose to obtain their products or conduct their research.
Flexible and Customized Environment to Provide the Right Solutions
.
Each of our clients is different, with unique needs and specific requirements. We understand the importance of flexibility, and leverage the expertise embedded in our integrated early-stage portfolio to provide customized solutions tailored to the specific need or therapeutic area for a particular client. By utilizing our streamlined and efficient facilities, we help clients create a flexible and integrated infrastructure in order to improve their workload and staffing requirements. This allows our clients to reduce internal capacity and/or staff while ensuring the conduct of effective quality research for their projects. We provide enhanced value to clients who use us as a full-service integrated partner over a longer period of time.
Large, Global Partner
.
We believe there is a particular advantage in being a full service, high-quality provider of research models and associated services, discovery and non-clinical
in vivo
and
in vitro
services, and manufacturing support on a global scale. Many of our clients, especially large biopharmaceutical companies, have decided to limit the number of suppliers with which they work. They frequently chose to partner with large Tier 1 CROs like Charles River, who can offer clients support across the early-stage drug research process as a result of broader portfolios and experience in project management. This includes extensive scientific, technical, and therapeutic area expertise, real-time access to data through secure portals, accelerated reporting and industry-leading Standard Exchange of Non-Clinical Data (SEND) capabilities, a global footprint, and streamlined and simplified processes and communications including professional project and relationship management. We are focused on leveraging our competitive advantages to ensure we are recognized as the premier preferred provider, thereby enabling us to build broader and deeper long-term strategic relationships with our clients.
Global biopharmaceutical companies are continuing to make the decision to outsource more significant tranches of their drug discovery, development, and manufacturing processes. Over the past few years we have entered into strategic relationships with leading global biopharmaceutical companies and expanded existing preferred provider agreements with other leading global biopharmaceutical companies. We also continue to broaden and extend our relationships with other research institutions across the portfolio. For example, during the past year we were awarded a large multi-year contract in our RMS segment with the National Institute of Allergy and Infectious Diseases (NIAID), one of the NIH’s largest institutes, to manage NIAID’s research model operations. We also extended our long-standing collaboration with The Michael J. Fox Foundation for Parkinson’s Research (MJFF). Since 2011, we have worked together with MJFF to accelerate the discovery of therapies for Parkinson’s disease.
Our clients' research and development needs continue to evolve, particularly with regard to larger biopharmaceutical companies. These clients are increasingly emphasizing studies that have greater translation to the clinic so that they can make appropriate decisions regarding the progression of potential therapeutic entities earlier in the development process. The result is a greater focus on discovery services, including
in vivo
pharmacology studies consisting of efficacy and non-GLP DMPK (drug metabolism and pharmacokinetics) studies. Second, these clients are choosing to outsource additional discovery and safety assessment services in order to increase the efficiency and effectiveness of their drug selection processes.
We believe that this changing environment will provide enhanced outsourcing opportunities for us in the future. We remain optimistic that our clients are increasingly receptive to partnering with CROs as a means of meeting their discovery and non-clinical support needs. We believe that the successful development of new therapies and outsourcing by the pharmaceutical industry will continue to be positive drivers of demand for our products and services.
We also believe that larger biopharmaceutical companies will increasingly focus on efficiencies and execution. They will continue to reassess what are core differentiators from research and development to commercialization. We expect they will also continue to be conservative in re-building infrastructure and expertise. This should lead to more opportunities for strategic
9
outsourcing as clients choose to utilize external resources rather than invest in internal infrastructure. By partnering with a CRO like Charles River, they can take advantage of scientific reporting efficiencies that can result in months or years saved in getting a drug to market. In addition, with one of the largest and most experienced SEND team in the industry, we believe that our services, quality and ability to navigate the complex world of electronic data for submission is an unmatched competitive advantage to be shared with all our clients. In the aggregate, we believe that the evolving large biopharmaceutical research and development business model will make our essential products and services even more relevant to our clients, and allow them to leverage our integrated offerings and expertise to drive their research, non-clinical development, and manufacturing efficiency and cost effectiveness.
We believe it is critical to participate in the strategic partnering process because these relationships are likely to extend for lengthy periods of time - three to five years. Furthermore, both the client and the CRO invest heavily in the initial phases of the relationship to successfully transfer work streams and establish governance processes. Given this investment, clients are less likely to change CROs at the conclusion of the initial relationship. As a result of this strategy, we have been successfully renewing the majority of our strategic partnerships.
We also believe that our portfolio provides flexible solutions that meet the customized needs for virtual and small biotechnology companies, which have limited or no infrastructure. These clients also value our ability to provide a broad range of services and integrated services where we work hand in hand with our clients to design, plan, and manage integrated projects and programs. This includes classically outsourced services, “insourced” services, and hybrid offerings blending resources from both our clients and our staff.
We maintain an intense focus on initiatives designed to allow us to drive profitable growth and maximize value for shareholders, and better position ourselves to operate successfully in the current and future business environment. As a result, we believe that we are well positioned to exploit both existing and new outsourcing opportunities.
We intend to continue to broaden the scope of the products and services we provide across the drug discovery and early-stage development continuum primarily through internal development, and, as needed, through focused acquisitions and alliances. Acquisitions are an integral part of our growth strategy, both to expand our portfolio and broaden our geographic footprint. We are committed to a disciplined approach that seeks to target businesses that are a sound strategic fit and that offer the prospect of enhancing shareholder value, typically including the achievement of a hurdle rate for return on invested capital above our weighted average cost of capital. For example, in each of 2017 and 2018, we completed strategic acquisitions. In August 2017, we acquired Brains On-Line (BOL), a leading CRO that provides critical data that advances novel therapeutics for the treatment of CNS diseases. In January 2018, we acquired KWS, a leading CRO specializing in
in vitro
and
in vivo
discovery testing services for immuno-oncology and inflammatory and infectious diseases and in April 2018 we acquired MPI, a premier non-clinical CRO providing comprehensive testing services to biopharmaceutical and medical device companies worldwide.
In addition to conventional mergers and acquisitions, our long-term strategy includes growth through establishing relationships and exploring other opportunities and areas that have the potential to strengthen our broad-based portfolio of products and services. Among other arrangements could include entering into a license agreement, strategic partnership or joint venture which will allow us to access cutting-edge or nascent technologies with an investment component (which ultimately may later become an acquisition). For example,
in October 2018, we entered into an exclusive partnership with Distributed Bio, Inc., a leader in the computational design and optimization of antibody platforms.
We are also partnering with a diverse set of leading venture capital firms around the world primarily investing in life sciences, health care, and therapeutics with an emphasis on early-stage companies. Through these partnerships and close relationships, we gain insight into their company and asset portfolios and are thus able to promote our contract research services for discovery, safety assessment, and biologics testing. Thus, we have the opportunity to establish ourselves as a provider of choice for a unique client group which has emerged as biopharmaceutical companies rationalize and prioritize their development pipelines.
Clients
Our go-to-market approach employs a number of sales and marketing strategies, including dedicated sales teams for each of our major lines of business. We also maintain several sales specialists which either have specific technical expertise (often degreed scientists) or cover unique markets.
Our clients continue to consist primarily of all of the major biopharmaceutical companies; many biotechnology, agricultural and industrial chemical, life science, veterinary medicine, medical device, diagnostic, and consumer product companies; contract research and contract manufacturing organizations; and other commercial entities, as well as leading hospitals, academic
10
institutions, and government agencies. We have stable, long-term relationships with many of our clients. During
2018
,
no single commercial client accounted for more than 2.5% of our total revenue and no single client accounted for more than 6% of the revenue of any of our three business segments.
We continue to pursue a goal of expanding our relationships with our large biopharmaceutical clients, and with many of our larger mid-market clients. These relationships take different forms, from preferred provider arrangements to strategic partnerships. The structure of these relationships incentivizes clients to purchase more products and services across our early-stage portfolio. Because of the strength of these relationships, we have better insight into our clients' planning processes, and therefore, better visibility than in the past. For information regarding revenue attributable to each of our business segments for the last three fiscal years, please see Note 4, “Segment and Geographic Information” included in the Notes to Consolidated Financial Statements included elsewhere in this Form 10-K. For information regarding revenue and long-lived assets attributable to operations in the United States, Europe, Canada, Asia Pacific, and other countries for each of the last three fiscal years, please review Note 4, “Segment and Geographic Information” included in the Notes to Consolidated Financial Statements included elsewhere in this Form 10-K.
Sales, Marketing and Customer Support
In addition to our fields sales teams and related specialists, we also have a team of alliance managers who are organized by key client within our market segments (global biopharmaceutical, small and mid-sized pharmaceutical and biotechnology companies, and academic and government institutions). This enhances our ability to meet client needs by offering customized, tailored solutions across our entire portfolio. In addition, our clients benefit by additional support from a combination of technical specialists with specific scientific and therapeutic area expertise. We also apply the use of dedicated sales specialists for certain technical product lines, such as in our Manufacturing businesses.
We sell our products and services principally through our direct sales and business development teams who work in North America, Europe, and Asia. In addition to interactions with our direct sales force, our primary promotional activities include organizing scientific symposia, publishing scientific papers and newsletters, hosting webinars and seminars and making presentations at, and participating in, scientific conferences and trade shows in North America, Europe, and Asia. We supplement these scientifically based marketing activities with digital marketing, advertising, and direct mail. In certain areas, our direct sales force is supplemented by international distributors and agents.
Our internal marketing/product management teams support the field sales and business development teams while developing and implementing programs to create close working relationships with our clients in the biomedical research industry. We maintain client engagement, digital experience, inbound client support, technical assistance, and consulting service departments (in addition to project managers for our service businesses), which address both our clients' routine and more specialized needs and generally serve as a scientific resource for them. We frequently assist our clients in solving problems related to animal husbandry, health and genetics, biosecurity, non-clinical study design, regulatory consulting, protocol development, and other areas in which our expertise is widely recognized as a valuable resource by our clients.
Our marketing efforts are focused on stimulating demand for further outsourcing across our entire services portfolio. We believe that our ability to provide solutions that address all aspects of early-stage drug research are increasingly attractive to our clients, and we continue to design and market our commercial activities to deliver flexible, customized programs designed by segment to meet our clients' global and site-specific needs.
Competition
Our goal is to be a leader in each of the markets in which we participate. We compete in the marketplace on the basis of our therapeutic and scientific expertise in early-stage drug research, quality, reputation, flexibility, responsiveness, pricing, innovation, and global capabilities. We are able to offer a unique portfolio of early-stage products and services to support drug discovery and development.
We encounter a broad range of competitors of different sizes and capabilities in each of our three businesses segments, although the largest competitors within any segment vary. We also face competition from the internal discovery and development resources of our clients.
|
•
|
For RMS, we have five main competitors of which one is a government funded, not-for-profit entity; one is part of a large public company; two are privately held in Europe and one is privately held in the U.S. We believe that none of these competitors compares to us in global reach, financial strength, breadth of product and services offerings, technical expertise, or pharmaceutical and biotechnology industry relationships.
|
11
|
•
|
For DSA, both our Discovery Services and Safety Assessment businesses have numerous competitors. Discovery has hundreds of competitors, as it is a highly competitive and fragmented market; Safety Assessment has dozens of competitors of varying size, but it has five main competitors; one is part of a large public company in the U.S.; one is a public company in China; one is privately held in Canada; and two are privately held in Europe. Our DSA segment also competes with in-house departments of pharmaceutical and biotechnology companies, universities, and teaching hospitals.
|
|
•
|
For Manufacturing, each of our underlying businesses has several competitors. In addition to many smaller competitors, Biologics has five main competitors, of which four are public companies in Europe and one is a public company in China. Avian has one main competitor to its SPF eggs business, which is privately held in Europe, and numerous competitors for specialized avian laboratory services. Microbial Solutions has four main competitors, of which three are public companies in Europe and one is privately held in the U.S.
|
Industry Support and Animal Welfare
One of our core values is a concern for, and commitment to, animal welfare. We have been in the forefront of animal welfare improvements in our industry, and continue to show our commitment with special recognition programs for employees who demonstrate an extraordinary commitment in this critical aspect of our business. We created our own Humane Care Initiative, which is directed by our Animal Welfare and Training Group. The goal of the initiative is to assure that we continue as a worldwide leader in the humane care of laboratory animals and implementation of the 3Rs (Replacement, Reduction and Refinement). Laboratory animals are an important resource that further our knowledge of living systems and contribute to the discovery of life-saving drugs and procedures. We work hand-in-hand with the scientific community to understand how living conditions, handling procedures and stress play a role in the quality and efficiency of research. As researchers, we are responsible to our clients and the public for the health and well-being of the animals in our care.
We are firmly committed to the 3Rs and to reducing the number of animals used by emphasizing health and genetic integrity to decrease study data variability. Whenever possible, we use technological advances such as new diagnostic tests for screening pathogens in laboratory rodents, microsampling and
in vitro
assays. We also partner with clients to develop study designs decreasing the number of animals needed and suggesting pilot studies where appropriate. We also maintain a quarterly award recognizing our employees’ efforts to continually implement the 3Rs at our sites globally.
We support a wide variety of organizations and individuals working to further animal welfare as well as the interests of the biomedical research community. We fund scholarships to laboratory animal training programs, provide financial support to non-profit institutions that educate the public about the benefits of animal research and provide awards and prizes to outstanding leaders in the laboratory animal medicine field and the supporters of 3Rs.
Employees
As of
December 29, 2018
,
we had approximately 14,700 employees (including approximately 1,600 science professionals with advanced degrees, including Ph.D.s, D.V.M.s and M.D.s). Our employees are not unionized in the U.S. Employees at some of our European facilities are represented by works councils, employee representative groups and/or unions, which is consistent with local customs for our industry. We believe we have good relationships with our employees, based on a number of factors including employee retention.
Backlog
Our backlog for our RMS, DSA and Manufacturing reportable segments was $106.5 million, $900.8 million and $74.4 million, respectively, as of
December 29, 2018
,
as compared to $96.8 million, $590.0 million and $46.9 million, respectively, as of
December 30, 2017
.
Related services are performed over varying durations, from short to extended periods of time, which may be as long as several years. We maintain an order backlog to track anticipated revenue from studies and projects that either have not started, but are anticipated to begin in the near future, or are in process and have not been completed. We only recognize a study or project in backlog after we have received written evidence of a client's intention to proceed. Canceled studies or projects are removed from backlog.
We believe our aggregate backlog as of any date is not necessarily a meaningful indicator of our future results for a variety of reasons. First, studies vary in duration (i.e., some studies or projects that are included in
December 29, 2018
backlog may be completed in 2019, while others may be completed in later years). Second, the scope of studies or projects may change, which may either increase or decrease their value. Third, studies or projects included in backlog may be subject to bonus or penalty payments. Fourth, studies or projects may be terminated or delayed at any time by the client or regulatory authorities for a number of reasons, including the failure of a drug to satisfy safety and efficacy requirements, or a sponsor making a strategic
12
decision that a study or service is no longer necessary. Delayed contracts remain in our backlog until a determination of whether to continue, modify, or cancel the study has been made. We cannot provide any assurance that we will be able to realize all or most of the net revenues included in backlog or estimate the portion to be filled in the current year.
Regulatory Matters
As our business operates in a number of distinct operating environments and in a variety of locations worldwide, we are subject to numerous, and sometimes overlapping, regulatory environments.
The Animal Welfare Act (AWA) governs the care and use of certain species of animals used for research in the U.S. other than laboratory rats, mice and chickens bred for use in research. As a result, most of our U.S. small animal research models activities and our avian vaccine services operations are not subject to regulation under the AWA. For regulated species, the AWA and the associated Animal Care regulations require producers and users of regulated species to provide veterinary care and to utilize specific husbandry practices such as cage size, shipping conditions, sanitation and environmental enrichment to assure the welfare of these animals. Separately, facilities using live vertebrate animals in research funded by the U.S. Public Health Service (PHS) must also adhere to the PHS Policy on Humane Care and Use of Laboratory Animals and follow the Guide for the Care and Use of Laboratory Animals produced by the Institute for Laboratory Animal Research.
We comply with licensing and registration requirement standards set by the United States Department of Agriculture (USDA) and similar agencies in other countries such as Europe, China and Japan for the care, handling and use of regulated species and birds bred for research. All of our DSA and RMS facilities in North America and Europe are either accredited or in the process of initiating accreditation by AAALAC International, a private, nonprofit, international organization that promotes the humane treatment of animals in science through voluntary accreditation and assessment programs.
Our import and export of animals and our operations in foreign countries are subject to international agreements and conventions, as well as a variety of national, regional, and local laws and regulations, which establish the standards for the humane treatment, care, handling, and transport of animals by dealers and research facilities.
We conduct non-clinical safety assessment studies to support the submissions for approval or licensing of our clients' products throughout the world. Many of these studies must comply with national statutory or regulatory requirements for GLP. GLP regulations describe a quality system for the scientific, operational and quality process and the conditions under which non-clinical studies are planned, performed, monitored, recorded, reported and archived. GLP compliance is required by such regulatory agencies as the FDA, United States Environmental Protection Agency, European Medicines Agency, Medicines and Healthcare Products Regulatory Agency in the United Kingdom (U.K.), Health Products Regulatory Authority in Ireland, Health Canada and other similar monitoring authorities in the countries where we operate. GLP requirements are significantly harmonized throughout the world and our laboratories are capable of conducting studies in compliance with all necessary requirements.
Regulatory monitoring authorities such as the FDA, Medicines and Healthcare Products Regulatory Agency and OECD countries have indicated an increased emphasis on the management of electronic records generated by computerized systems to ensure data integrity under newly issued guidance.
We have established a formal program to manage regulatory and client expectations regarding data integrity within our regulated businesses. Although each business has a different impact on patient safety, all are expected to generate data with integrity. We recognize the importance of generating quality, reliable, sustainable data and have instituted a number of processes to ensure we are consistent in our approach.
At a global level, retention of data and controls for electronic systems, proprietary data and quality standards are covered by global policies. We also have controls in place such as quality manuals, policies and procedures, work instructions, document control processes, training, quality assurance and quality control processes and personnel, validated computerized systems and archiving requirements. Within businesses, procedures govern performance of activities to ensure data integrity throughout its life cycle.
Our Manufacturing businesses produce endotoxin test kits, reagents, cell banks used in research and biopharmaceutical production, clinical trial vaccines and vaccine support products. Additionally, several of our laboratories conduct biosafety and analytical testing such as identity, stability, sterility and potency testing in support of our clients' manufacturing programs working with our clients to fulfill their validation requirements as applicable. These activities are subject to regulation and consequently require these businesses to be inspected by the FDA and other national regulatory agencies under their respective current Good Manufacturing Practice (cGMP) regulations. These regulations require that we manufacture our products or perform testing in a prescribed manner with respect to cGMP compliance, and maintain records of our manufacturing, testing
13
and control activities. In addition, the specific activities of some of our businesses require us to hold specialized licenses for the manufacture, distribution and/or marketing of particular products.
All of our sites are subject to licensing and regulation, as appropriate under international treaties and conventions, including national, regional and local laws relating to:
|
•
|
the surface and air transportation of chemicals, biological reagents and laboratory specimens;
|
|
•
|
the handling, use, storage, and disposal of chemicals (including narcotics and psychotropic drugs), biological reagents, laboratory specimens, hazardous waste, and radioactive materials;
|
|
•
|
the procurement, handling, use, storage, and disposal of human cells, tissues, and cellular and tissue-based products for research purposes;
|
|
•
|
the safety and health of employees and visitors to our facilities; and
|
|
•
|
protection of the environment and general public.
|
Global compliance programs are managed by a dedicated group responsible for global regulatory affairs and compliance, including internal assessment of quality programs and systems to ensure that all business sectors comply with applicable statutory and regulatory requirements and satisfy our clients’ expectations for quality and regulatory compliance. To assure these compliance obligations, we established quality assurance units (QAUs) in each of our regulated businesses that require independent oversight. The QAUs operate independently from those individuals that direct and conduct studies, manufacturing or analytical testing that studies that supports manufacturing.
Intellectual Property
We develop and implement computer software and technically derived procedures and products intended to maximize the quality and effectiveness of our services. Although our intellectual property rights are valuable to our success, we believe that such factors as the technical expertise, proprietary know-how, ability, and experience of our professionals are more important, and that, overall, these technological capabilities provide significant benefits to our clients. Where we consider it appropriate, steps are taken to protect our know-how through confidentiality agreements and registrations. In addition, we in-license technology and products from other companies when it enhances our product and services businesses. In the future, in-licensing may become a larger initiative to enhance our offerings, particularly as we focus on therapeutic area expertise. With the exception of technology related to our Microbial Solutions testing business, we have no patents, trademarks, licenses, franchises, or concessions which are material and upon which any of our products or services are dependent.
Corporate Governance
We are committed to operating our business with integrity and accountability. We strive to meet or exceed all of the corporate governance standards established by the New York Stock Exchange, the SEC, and the United States Federal government as implemented by the Sarbanes-Oxley Act of 2002, the Dodd-Frank Wall Street Reform and Consumer Protection Act of 2010 and other applicable laws, rules and regulations. Each member of our Board of Directors, other than Mr. Foster who is also our Chief Executive Officer, is independent and has no significant financial, business, or personal ties to us or management and all of our board committees (with the exception of our Executive Committee and our Strategic Planning and Capital Allocation Committee) are composed entirely of independent directors. The Board adheres to our Corporate Governance Guidelines and a Code of Business Conduct and Ethics which has been communicated to employees and posted on our website. We are diligent in complying with established accounting principles and are committed to providing financial information that is transparent, timely, and accurate. We have a Related Person Transactions Policy designed to promote the timely identification of such transactions and to ensure we give appropriate consideration to any real or perceived conflicts in our commercial arrangements. We have established global process through which employees, either directly or anonymously, can notify management (and the Audit Committee of the Board of Directors) of alleged accounting and auditing concerns or violations including fraud. Our internal Disclosure Committee meets regularly and operates pursuant to formal disclosure procedures and guidelines to help ensure that our public disclosures, including our periodic reports filed with the SEC, earnings releases and other written information that we disclose to the investment community are complete, accurate and timely. We continually monitor developments in the law and stock exchange regulations, as well as overall corporate governance trends and intend to adopt new procedures consistent with such developments to the extent applicable and appropriate to our Company. Copies of our Corporate Governance Guidelines, Code of Business Conduct and Ethics, and Related Person Transactions Policy are available on our website at
http://ir.criver.com
under the “Investor Relations - Corporate Governance” caption.
Executive Officers of the Registrant (pursuant to Instruction 3 to Item 401(b) of Regulation S-K)
14
Below are the names, ages and principal occupations of each of our current executive officers. All such persons have been elected to serve until their successors are elected and qualified or until their earlier resignation or removal.
James C. Foster
, age 68, joined us in 1976 as General Counsel. During his tenure, Mr. Foster has held various staff and managerial positions, and was named Chief Executive Officer and President in 1992 and our Chairman in 2000.
William D. Barbo
, age 58, joined us in 1982 as a laboratory technician. Between 1982 and 2005, Mr. Barbo served in a variety of positions of increasing responsibilities. He was named Corporate Vice President of Research Models and Services in 2005, Corporate Senior Vice President of Global Sales and Marketing in 2010, and Corporate Executive Vice President and Chief Commercial Officer in October 2016.
Birgit Girshick
, age 49, joined us in 1989 and originally held positions of increasing responsibility in our RMS Germany and RMS Avian Vaccine businesses. In 2004, Ms. Girshick was promoted to General Manager of the RMS Avian Vaccine Services business. She was named Executive Director, RMS Process Improvement in 2009, and Corporate Vice President, Global Biopharmaceutical Services in 2010. In 2013, Ms. Girshick was promoted to Corporate Senior Vice President, Research Models and Biologics Testing Solutions. In 2016, Ms. Girshick was tasked with leading the integration of WIL Research into our Safety Assessment business. Also in 2016, Ms. Girshick assumed the role of Corporate Senior Vice President, Global Discovery Services. In February 2018, Ms. Girshick was appointed Corporate Executive Vice President, Global Discovery and Safety Assessment and in August 2018, additionally took on responsibility for our Biologics Testing Solutions and Avian Vaccine Services business.
David P. Johst
, age 57, joined us in 1991 as Corporate Counsel and was named Vice President, Human Resources in 1995. He became Vice President, Human Resources and Administration in 1996, a Senior Vice President in 1999, and a Corporate Executive Vice President in 2005. He currently serves as our General Counsel and Chief Administrative Officer and is responsible for overseeing our corporate legal function and several other corporate staff departments. Prior to joining us, Mr. Johst was in private practice at the law firm of Hale and Dorr (now WilmerHale).
Joseph W. LaPlume
,
a
ge 45, joined us in 2005 as Senior Corporate Counsel. He became Deputy General Counsel in 2010, Vice President, Corporate Development in 2011, Senior Vice President in 2014, and Corporate Executive Vice President, Corporate Development and Strategy in January 2019. In his current role, he oversees all aspects of strategic planning and corporate development activities across business segments and geographies. Prior to joining us, Mr. LaPlume was a corporate lawyer at GTECH Corporation and in private practice at the law firms of Mintz Levin and Goulston & Storrs. Mr. LaPlume received M.B.A. and J.D. degrees from Boston University, and a Bachelor’s degree from Trinity College.
David R. Smith
, age 53, has served as our Corporate Executive Vice President and Chief Financial Officer since August 2015. He joined us as Corporate Vice President, Discovery Services through our acquisition of Argenta and BioFocus from Galapagos NV in March 2014 and was promoted to Corporate Senior Vice President, Global Discovery Services, in October 2014. At Galapagos, he served in various capacities, including as Chief Executive Officer of its Galapagos Services division and as Chief Financial Officer. Mr. Smith served as Chief Financial Officer for Cambridge University Hospitals from 2007 to 2013. Mr. Smith spent eight years at PricewaterhouseCoopers prior to joining AstraZeneca in 1997, where he spent the next nine years in various finance and business roles of increasingly greater responsibility.
Item 1A. Risk Factors
Set forth below, elsewhere in this Form 10-K and in other documents we file with the SEC are risks and uncertainties that could cause actual results to differ materially from the results contemplated by the forward-looking statements contained in this Form 10-K. We note that factors set forth below, individually or in the aggregate, may cause our actual results to differ materially from expected and historical results. We note these factors for investors as permitted by the Private Securities Litigation Reform Act of 1995. You should understand that it is not possible to predict or identify all such factors. Consequently, you should not consider the following to be a complete discussion of all potential risks or uncertainties.
A reduction in research and development budgets at pharmaceutical and biotechnology companies may adversely affect our business.
Our clients include researchers at pharmaceutical and biotechnology companies. Our ability to continue to grow and win new business is dependent in large part upon the ability and willingness of the pharmaceutical and biotechnology industries to continue to spend on molecules in the non-clinical phases of research and development (and in particular discovery and safety assessment) and to outsource the products and services we provide. Fluctuations in the expenditure amounts in each phase of the research and development budgets of these researchers and their organizations could have a significant effect on the demand for our products and services. Research and development budgets fluctuate due to changes in available resources, mergers of
15
pharmaceutical and biotechnology companies, spending priorities (including available resources of our biotechnology clients, particularly those that are cash-negative, who may be highly focused on rationing their liquid assets in a challenging funding environment), general economic conditions, institutional budgetary policies and the impact of government regulations, including potential drug pricing legislation. Available funding for biotechnology clients in particular may be affected by the capital markets, investment objectives of venture capital investors, and priorities of biopharmaceutical industry sponsors.
Our business could be adversely affected by any significant decrease in drug research and development expenditures by pharmaceutical and biotechnology companies, as well as by academic institutions, government laboratories, or private foundations. Similarly, economic factors and industry trends that affect our clients in these industries also affect their research and development budgets and, consequentially, our business as well. Furthermore, our clients (particularly larger biopharmaceutical companies) continue to search for ways to maximize the return on their investments with a focus on leaner research and development costs per drug candidate. For additional discussion of the factors that we believe have recently been influencing research and development budgets at our clients, please see the sections entitled “Our Strategy” and "Management's Discussion and Analysis of Financial Condition and Results of Operations" included elsewhere in this Form 10-K.
A reduction or delay in government funding of research and development may adversely affect our business.
A portion of revenue, predominantly in our RMS segment, is derived from clients at academic institutions and research laboratories whose funding is partially dependent on both the level and timing of funding from government sources such as the U.S. National Institutes of Health (NIH) and similar domestic and international agencies, which can be difficult to forecast. We also sell directly to the NIH and these other agencies. Government funding of research and development is subject to the political process, which is inherently fluid and unpredictable. Our revenue may be adversely affected if our clients delay purchases as a result of uncertainties surrounding the approval of government budget proposals. Also, government proposals to reduce or eliminate budgetary deficits have sometimes included reduced allocations to the NIH and other government agencies that fund research and development activities. Other programs, such as homeland security or defense, or general efforts to reduce the federal budget deficit could be viewed by the U.S. government as a higher priority. These budgetary pressures may result in reduced allocations in the future to government agencies that fund research and development activities. A reduction in government funding for the NIH or other government research agencies could adversely affect our business and our financial results. Also, there is no guarantee that NIH funding will be directed towards projects and studies that require use of our products and services.
We could experience a breach of the confidentiality of the information we hold or of the security of our computer systems.
We operate large and complex computer systems that contain significant amounts of client data. As a routine element of our business, we collect, analyze, and retain substantial amounts of data pertaining to the non-clinical studies we conduct for our clients. Unauthorized third parties could attempt to gain entry to such computer systems for the purpose of stealing data or disrupting the systems. We believe that we have taken appropriate measures to protect them from intrusion, and we continue to improve and enhance our systems in this regard (including with respect to how we process and report any breaches), but in the event that our efforts are unsuccessful, we could suffer significant harm. Our contracts with our clients typically contain provisions that require us to keep confidential the information generated from these studies. In the event the confidentiality of such information was compromised, we could suffer significant harm.
We are required to comply with the data privacy and security laws in many jurisdictions. For example, we are required to comply with the European Union (EU) General Data Protection Regulation (GDPR) which became effective on May 25, 2018 and imposes heightened obligations and enhanced penalties for noncompliance (including up to four percent (4%) of global revenue). The cost of compliance with the GDPR and the potential for fines and penalties in the event of a violation of the GDPR may have a significant adverse effect on our business and operations. We have made changes to, and investments in, our business practices and will continue to monitor developments and make appropriate changes to help attain compliance with these evolving and complex regulations.
Contaminations in our animal populations can damage our inventory, harm our reputation for contaminant-free production, result in decreased sales and cause us to incur additional costs.
Our research models and fertile chicken eggs must be free of certain infectious agents such as certain viruses and bacteria because the presence of these contaminants can distort or compromise the quality of research results and could adversely impact human or animal health. The presence of these infectious agents in our animal production facilities and certain service operations could disrupt our contaminant-free research model and fertile egg production as well as our animal services businesses including GEMS, harm our reputation for contaminant-free production, and result in decreased sales.
16
If they occur, contaminations typically require cleaning up, renovating, disinfecting, retesting, and restarting production or services. Such clean-ups result in inventory loss, clean-up and start-up costs, and reduced sales as a result of lost client orders and potentially credits for prior shipments. In addition to microbiological contaminations, the potential for genetic mix-ups or mis-matings also exists and may require the restarting of the applicable colonies. While this does not require the complete clean-up, renovation, and disinfection of the room, it would likely result in inventory loss, additional start-up costs and possibly reduced sales. Contaminations also expose us to risks that clients will request compensation for damages in excess of our contractual indemnification requirements. There also exists a risk that contaminations from models that we produce may affect our client's facilities, with similar impact to them for which we could be liable for damages. In some cases, we may produce or import animals carrying infectious agents capable of causing disease in humans; and in the case of such a contamination or undiagnosed infection, there could be a possible risk of human exposure and infection.
We are also subject to similar contamination risks with respect to our large research models. While some of these models are owned by us and maintained at our facilities, others are reserved for us, and maintained at sites operated by the original provider. Accordingly, risk of contamination may be outside of our control, and we depend on the practices and protocols of third parties to ensure a contamination-free environment. A contamination may require extended CDC quarantine with subsequent reduced sales as a result of lost client orders as well as the potential for complete inventory loss and disinfection of the affected quarantine rooms. Furthermore, while we often negotiate for contractual risk indemnification, we may be exposed in the event of such contaminations if the third party does not fulfill its indemnification obligation or is unable to as a result of insolvency or other impediments.
All such contaminations described above are unanticipated and difficult to predict and could adversely impact our financial results. Many of our operations are comprised of complex mechanical systems which are subject to periodic failure, including aging fatigue. Such failures are unpredictable, and while we have made significant capital expenditures designed to create redundancy within these mechanical systems, strengthen our biosecurity, improve our operating procedures to protect against such contaminations, and replace impaired systems and equipment in advance of such events, failures and/or contaminations may still occur.
Any failure by us to comply with applicable regulations and related guidance could harm our reputation and operating results, and compliance with new regulations and guidance may result in additional costs.
Any failure on our part to comply with applicable regulations could result in the termination of ongoing research or the disqualification of data for submission on behalf of our clients to regulatory authorities. This could harm our reputation, our prospects for future work and our operating results. For example, the issuance of a notice of objectionable observations or a warning from the FDA based on a finding of a material violation affecting data integrity by us for GLP or cGMP requirements could materially and adversely affect us. If our operations are found to violate any applicable law or other governmental regulations, we might be subject to civil and criminal penalties, damages and fines. Any action against us for violation of these laws, even if we successfully defend against it, could cause us to incur significant legal expenses, divert our management's attention from the operation of our business and damage our reputation.
Regulatory monitoring authorities such as the FDA, Medicines and Healthcare Products Regulatory Agency and OECD have increased their emphasis on the management of computerized systems to ensure data integrity. New guidance related to the need for data integrity compliance programs have recently been released and we may require additional efforts for validation, audit trail review and archiving activities. To assure that we have proper regulatory oversight over our electronic records, a dedicated quality function reviews our computerized system practices to ensure that appropriate record controls are in place and that a robust audit strategy confirms requirements for compliance. In addition, the FDA’s recently applicable SEND (Standardization for Exchange of Nonclinical Data) standards which apply to our clients’ NDA and IND submissions require us to provide electronic data in specific formats that will allow for more efficient, higher quality regulatory reviews. Accordingly, our clients expect us to timely deliver their nonclinical data compliant with SEND. Notwithstanding, some of these standards require additional operating and capital expenses that will impact not only us and our industry competitors, but clients in the biomedical research community. Non-compliance with any of these expectations could lead to official action by a government authority, damage to our reputation and a potential loss of business.
In addition, regulations and guidance worldwide concerning the production and use of laboratory animals for research purposes continue to evolve. Similarly, guidance has been and continues to be developed for other areas that impact the biomedical research community on both a national and international basis including transportation, mandated contingency planning, euthanasia guidance, import and export requirements of biological materials, health monitoring requirements and the use of disinfectants.
17
The outsourcing trend in non-clinical (discovery and safety assessment) stages of drug discovery and development may decrease, which could impair our growth.
Over the past decade, pharmaceutical and biotechnology companies have generally increased their outsourcing of non-clinical research support activities, such as discovery and safety assessment. While many industry analysts expect the outsourcing trend to continue to increase for the next several years (although with different growth rates for different phases of drug discovery and development), decreases in such outsourcing may result in a diminished growth rate in the sales of any one or more of our service lines and may adversely affect our financial condition and results of operations. For additional discussion of the factors that we believe have recently been influencing outsourcing demand from our clients, please see the section entitled “Our Strategy” included elsewhere in this Form 10-K.
Changes in government regulation or in practices relating to the pharmaceutical or biotechnology industries, including potential healthcare reform, could decrease the need for the services we provide.
Governmental agencies throughout the world strictly regulate the drug development process. Our business involves helping pharmaceutical and biotechnology companies, among others, navigate the regulatory drug approval process. Accordingly, many regulations, and often new regulations, are expected to result in higher regulatory standards and often additional revenues for companies that service these industries. However, some changes in regulations, such as a relaxation in regulatory requirements or the introduction of streamlined or expedited drug approval procedures, or an increase in regulatory requirements that we have difficulty satisfying or that make our services less competitive, could eliminate or substantially reduce the demand for our services.
Although we believe we are currently in compliance in all material respects with national, regional, and local laws, as well as other accepted guidance used by oversight bodies (which include the USDA, the standards set by the International Air Transport Association, the Convention on International Trade in Endangered Species of Wild Fauna and Flora, U.S. Fish and Wildlife Service, The Centers for Disease Control, the Department of Transportation, the Department of State, the office of Laboratory Animal Welfare of NIH, the Drug Enforcement Agency, as well as numerous other oversight agencies in Canada, Europe, and Asia), failure to comply could subject us to denial of the right to conduct business, fines, criminal penalties, and other enforcement actions. In addition, if regulatory authorities were to mandate a significant reduction in safety assessment procedures which utilize laboratory animals (as has been advocated by certain groups), certain segments of our business could be materially adversely affected.
In March 2010, the U.S. Congress enacted healthcare reform legislation, the Patient Protection and Affordable Care Act, or the ACA, intended over time to expand health insurance coverage and impose health industry cost containment measures. In June 2012, the U.S. Supreme Court upheld the constitutionality of this legislation. The Court’s decision allowed implementation of key provisions impacting drug manufacturers going forward, including, but not limited to, (1) expansion of access to health insurance coverage, (2) expansion of the Medicaid program, (3) enactment of an industry fee on pharmaceutical companies, and (4) imposition of an excise tax on the sale of medical devices. In May 2017, the U.S. House of Representatives voted to pass the American Health Care Act (the AHCA), which would repeal many provisions of the ACA. Although the U.S. Senate considered but failed to pass the AHCA and other comparable measures, the U.S. Congress may consider further legislation to repeal or replace elements of the ACA. In addition, the Tax Cuts and Jobs Act, which President Trump signed into law in December 2017, repeals the ACA’s
individual health insurance mandate, which is considered a key component of the ACA. Since the law and its implementation continue to face challenges in Congress and federal courts, and from certain state governments, opposition advocacy groups, and some small business organizations, as well as from the incoming president and his administration, we are uncertain as to the ultimate effects of this legislation on our business and are unable to predict what legislative proposals will be adopted in the future.
Implementation of healthcare reform legislation may have certain benefits, but also may contain costs that could limit the profits that can be made from the development of new drugs. This could adversely affect research and development expenditures by pharmaceutical and biotechnology companies, which could in turn decrease the business opportunities available to us both in the U.S. and abroad. In addition, new laws or regulations may create a risk of liability, increase our costs, or limit our service offerings. Furthermore, if health insurers were to change their practices with respect to reimbursements for pharmaceutical products, our clients may spend less, or reduce their growth in spending on research and development.
While it is not possible to predict whether and when any such changes will occur, changes at the local, state or federal level may significantly impact our domestic and foreign businesses and/or those of our clients. Furthermore, modifications to international trade policy, public company reporting requirements, environmental regulation and antitrust enforcement may have a material impact on us or our clients.
18
Our revenue generating agreements contain termination and service reduction provisions or may otherwise terminate according to their term, which may result in less contract revenue than we anticipate.
Many of our agreements with both large and small clients, including those which underlie our strategic relationships with some of our more significant clients, provide for termination or reduction in scope with little or no notice. Many of our contracts provide for services on a fixed price or fee-for-service with a cap basis and, accordingly, we bear the financial risk if we initially under-price our contracts or otherwise overrun our cost estimates. In addition, we sell our products and services to our competitors, and similarly they sell products and services to us. For instance, we have historically entered into, and currently are party to, contracts with certain of our competitors to distribute specialty research models in locations where our competitors may not have distribution capabilities.
Clients and/or competitors may elect to terminate their agreements with us for various reasons including:
|
•
|
the products being tested fail to satisfy safety requirements;
|
|
•
|
unexpected or undesired study results;
|
|
•
|
production problems resulting in shortages of the drug being tested;
|
|
•
|
a client's decision to forego or terminate a particular study;
|
|
•
|
establishment of alternative distribution channels by our competitors;
|
|
•
|
the loss of funding for the particular research study; or
|
|
•
|
general convenience/counterparty preference.
|
If a client or competitor terminates a contract with us, we are typically entitled under the terms of the contract to receive revenue earned to date as well as certain other costs and, in some cases, termination fees. Cancellation of a large contract or proximate delay, cancellation or conclusion of multiple contracts could materially adversely affect our business and, therefore, may adversely affect our operating results.
Several of our product and service offerings are dependent on a limited source of supply, which if interrupted could adversely affect our business.
We depend on a limited international source of supply for certain products, such as large research models. Disruptions to their continued supply may arise from health problems, export or import laws/restrictions or embargoes, international trade regulations, foreign government or economic instability, severe weather conditions, increased competition among suppliers for models, disruptions to the air travel system, activist campaigns, commercial disputes, supplier insolvency, or other normal-course or unanticipated events. Any disruption of supply could harm our business if we cannot remove the disruption or are unable to secure an alternative or secondary supply source on comparable commercial terms.
If we are not successful in selecting and integrating the businesses and technologies we acquire, or in managing our current and future divestitures, our business may suffer.
During the past sixteen years, we have steadily expanded our business through numerous acquisitions. We plan to continue to acquire businesses and technologies and form strategic alliances. However, businesses and technologies may not be available on terms and conditions we find acceptable. We risk spending time and money investigating and negotiating with potential acquisition or alliance partners, but not completing transactions.
In April 2018, we acquired MPI Research, a non-clinical CRO, providing comprehensive testing services to biopharmaceutical and medical device companies worldwide. This transaction was our largest acquisition since 2004. In February 2019, we
signed a binding offer to acquire Citoxlab for
€448 million
in cash (or approximately
$510 million
based on current exchange rates). Citoxlab is a non-clinical CRO, specializing in regulated safety assessment services, non-regulated discovery services, and medical device testing.
Acquisitions and alliances involve numerous risks which may include:
|
•
|
difficulties in achieving business and financial success;
|
|
•
|
difficulties and expenses incurred in assimilating and integrating operations, services, products, technologies, or pre-existing relationships with our clients, distributors, and suppliers;
|
19
|
•
|
challenges with developing and operating new businesses, including those which are materially different from our existing businesses and which may require the development or acquisition of new internal capabilities and expertise;
|
|
•
|
potential losses resulting from undiscovered liabilities of acquired companies that are not covered by the indemnification we may obtain from the seller or the insurance we acquire in connection with the transaction;
|
|
•
|
loss of key employees;
|
|
•
|
the presence or absence of adequate internal controls and/or significant fraud in the financial systems of acquired companies;
|
|
•
|
diversion of management's attention from other business concerns;
|
|
•
|
becoming subject to a more expansive regulatory environment;
|
|
•
|
acquisitions could be dilutive to earnings, or in the event of acquisitions made through the issuance of our common stock to the shareholders of the acquired company, dilutive to the percentage of ownership of our existing shareholders;
|
|
•
|
risks of not being able to overcome differences in foreign business practices, customs, and importation regulations, language, and other cultural barriers in connection with the acquisition of foreign companies;
|
|
•
|
new technologies and products may be developed which cause businesses or assets we acquire to become less valuable; and
|
|
•
|
risks that disagreements or disputes with prior owners of an acquired business, technology, service, or product may result in litigation expenses and diversion of our management's attention.
|
In the event that an acquired business, technology, or an alliance does not meet our expectations, our results of operations may be adversely affected.
Some of the same risks exist when we decide to sell a business, site, or product line. In addition, divestitures could involve additional risks, including the following:
|
•
|
difficulties in the separation of operations, services, products, and personnel;
|
|
•
|
diversion of management's attention from other business concerns; and
|
|
•
|
the need to agree to retain or assume certain current or future liabilities in order to complete the divestiture.
|
We continually evaluate the performance and strategic fit of our businesses (including specific product lines and service offerings). These and any divestitures may result in significant write-offs, including those related to goodwill and other intangible assets, which could have an adverse effect on our results of operations and financial condition. In addition, we may encounter difficulty in finding buyers, or, alternative exit strategies at acceptable prices and terms, and in a timely manner. We may not be successful in managing these or any other significant risks that we encounter in divesting a business, site, or product line or service offering, and as a result, we may not achieve some or all of the expected benefits of the divestiture.
Impairment of goodwill or other intangible assets may adversely impact future results of operations.
We have intangible assets, including goodwill, on our balance sheet due to our acquisitions of businesses. The initial identification and valuation of these intangible assets and the determination of the estimated useful lives at the time of acquisition involve use of management judgments and estimates. These estimates are based on, among other factors, projections of cash flows that arise from identifiable intangible assets of acquired businesses and discount rates based on an analysis of our weighted average cost of capital, adjusted for specific risks associated with the assets. Disruptions in global financial markets and deterioration of economic conditions could, among other things, impact the discount rate and other assumptions used in the valuations and actual cash flows arising from a particular intangible asset could vary from projected cash flows, which could imply different carrying values from those established at the dates of acquisition and which could result in impairment of such assets.
If the future growth and operating results of our business are not as strong as anticipated, overall macroeconomic or industry conditions deteriorate and/or our market capitalization declines, this could impact the assumptions used in establishing the carrying value of goodwill or other intangible assets. To the extent goodwill or other intangible assets are impaired, their carrying value will be written down to their implied fair values and a charge will be made to our income from continuing
20
operations. Such an impairment charge could materially and adversely affect our operating results. As of
December 29, 2018
, the carrying amount of goodwill and other intangibles on our consolidated balance sheet was
$1.9 billion
.
Our business is subject to risks relating to operating internationally.
A significant part of our revenue is derived from operations outside the U.S. Our international revenue represented approximately one-half of our total revenue in recent years. We expect that international revenue will continue to account for a significant percentage of our total revenue for the foreseeable future. There are a number of risks associated with our international business including:
|
•
|
foreign currencies we receive for sales and in which we record expenses outside the U.S. could be subject to unfavorable exchange rates with the U.S. dollar and reduce the amount of revenue and cash flow (and increase the amount of expenses) that we recognize and cause fluctuations in reported financial results.
The favorable effects of changes in currency exchange rates increased our 2018 revenue
by approximately $24 million, or
1.3%
, while unfavorable foreign currency effects decreased our 2017 revenues by less than $1 million, or less than 1%, respectively;
|
|
•
|
foreign currency exposure associated with differences between where we conduct business, our exposure to currency exchange rate fluctuations results from the currency translation exposure associated with the preparation of our consolidated financial statements, as well as from the exposure associated with transactions of our subsidiaries that are denominated in a currency other than the respective subsidiary's functional currency. While our financial results are reported in U.S. Dollars, the financial statements of many of our subsidiaries outside the U.S. are prepared using the local currency as the functional currency. During consolidation, these results are translated into U.S. Dollars by applying appropriate exchange rates. As a result, fluctuations in the exchange rate of the U.S. Dollar relative to the local currencies in which our foreign subsidiaries report could cause significant fluctuations in our reported results. Moreover, as exchange rates vary, revenue and other operating results may differ materially from our expectations.
Adjustments resulting from financial statement translations are included as a separate component of shareholders' equity. In the year ended December 29, 2018, we recorded net losses from currency translation adjustments of
$27.4 million
. In the year ended December 30, 2017, we recorded net gains from currency translation adjustments of
$77.1 million
;
|
|
•
|
certain contracts, particularly in Canada, are frequently denominated in currencies other than the currency in which we incur expenses related to those contracts, and where expenses are incurred in currencies other than those in which contracts are priced, fluctuations in the relative value of those currencies could have a material adverse effect on our results of operations;
|
|
•
|
potentially negative consequences from changes in U.S. and/or foreign tax laws, or interpretations thereof, notably tax regulations issued and to-be-issued with respect to U.S. Tax Reform and the EU Anti-Tax Avoidance Directives I and II;
|
|
•
|
general economic and political conditions in the markets in which we operate, including possible implications of Brexit;
|
|
•
|
potential international conflicts, including terrorist acts;
|
|
•
|
exchange controls, adverse tax consequences, and legal restrictions on the repatriation of funds into the U.S.;
|
|
•
|
difficulties and costs associated with staffing and managing foreign operations, including risks of work stoppages and/or strikes, as well as violations of local laws or anti-bribery laws such as the U.S. Foreign Corrupt Practices Act (FCPA), the U.K. Bribery Act, and the OECD Convention on Combating Bribery of Foreign Public Officials in International Business Transactions;
|
|
•
|
unexpected changes in regulatory requirements;
|
|
•
|
the difficulties of compliance with a wide variety of foreign laws and regulations;
|
|
•
|
unfavorable labor regulations in foreign jurisdictions;
|
|
•
|
exposure to business disruption or property damage due to geographically unique natural disasters (including within the U.S.);
|
|
•
|
longer accounts receivable cycles in certain foreign countries; and
|
21
|
•
|
compliance with export controls, import requirements and other trade regulations.
|
These risks, individually or in the aggregate, could have an adverse effect on our results of operations and financial condition. For example, as mentioned above, we are subject to compliance with the FCPA and similar anti-bribery laws, which generally prohibit companies and their third-party intermediaries from making improper payments to foreign government officials for the purpose of obtaining or retaining business. While our employees, distributors and agents are required to comply with these laws, we cannot be sure that our internal policies and procedures will always protect us from violations of these laws despite our commitment to legal compliance and corporate ethics. The occurrence or allegation of these types of risks may adversely affect our business, performance, prospects, value, financial condition, and results of operations.
Our facilities could be damaged or disrupted by natural disasters or other catastrophic events which could adversely affect our reputation, financial position, results of operations and cash flows
.
While we have taken precautions to mitigate production and service interruptions at our global facilities, a major catastrophe, such as a hurricane, tornado, earthquake, flood, wildfire or other natural disaster (or other unanticipated displacement) at or near any of our facilities could result in physical damage to our properties, including closure, resulting in a prolonged interruption of our business. A disruption resulting from any one of these events could cause significant delays in shipments of our products, reduce our capacity to provide services, eradicate unique manufacturing capabilities and, ultimately, result in the loss of revenue and clients. Any of these factors could have a material adverse effect on our reputation, financial position, results of operations, and cash flows.
New technologies may be developed, validated, and increasingly used in biomedical research that could reduce demand for some of our products and services.
The scientific and research communities continue to explore methods to develop improved cellular and animal model systems that would increase the translation to human studies and vice-versa and possibly replace or supplement the use of traditional living animals as test platforms in biomedical research. Some companies have developed techniques in these areas that may have scientific merit to improve translation between species. In addition, technological improvements to existing or new processes, such as imaging and other translational biomarker technologies, could result in the refinement and utility for the number of animal research models necessary to improve the translation from non-clinical to clinical studies. There is an increasing push to focus on
in vitro
technologies such that employ human biospecimens, stem cell technologies, and genome editing.
It is our strategy to explore these
in vitro
technologies to refine and potentially reduce the utilization of animal models as these new methods become validated. For example, our Safety and Assessment businesses have a program to evaluate the utility of induced pluripotent stems cells, advanced
in vitro
models, “organ-on-a-chip” technologies, artificial intelligence and machine learning in preclinical development. Successful commercialization of alternatives to traditional research models may not be sufficient to fully offset reduced sales or profits from research models. In addition, alternative research methods could decrease the need for future research models, and we may not be able to develop new products effectively or in a timely manner to replace any lost sales. Lastly, other companies or entities may develop research models with characteristics different than the ones that we produce, and which may be viewed as more desirable by some of our clients.
Negative attention from special interest groups may impair our business.
The products and services which we provide our clients are essential to the drug discovery, development and manufacturing processes, and a significant amount are mandated by law. Notwithstanding, certain special interest groups categorically object to the use of animals for valid research purposes. Historically, our core research model activities with rats, mice and other rodents have not been the subject of significant animal rights media attention. However, research activities with animals have been the subject of adverse attention, including shareholder proposals and attempts to disrupt air carriers from transporting research models, impacting the industry. This has included periodic demonstrations near facilities operated by us and at our annual meetings, as well as shareholder proposals we received for some of our past Annual Meetings of Shareholders. Any negative attention, threats or acts of vandalism directed against either our animal research activities or our third party service providers, such as our airline carriers, in the future could impair our ability to operate our business efficiently.
Our debt level could adversely affect our business and growth prospects.
As of
December 29, 2018
, we had
$1.7 billion
of debt. In connection with our intended acquisition of Citoxlab, we anticipate increasing our debt to finance a substantial portion of the purchase price of approximately
€448 million
in cash (or approximately
$510 million
based on current exchange rates). Our debt could have significant adverse effects on our business, including making it more difficult for us to obtain additional financing on favorable terms; requiring us to dedicate a substantial
22
portion of our cash flows from operations to the repayment of debt and the interest on this debt; limiting our ability to capitalize on significant business opportunities; and making us more vulnerable to rising interest rates. For additional information regarding our debt, please see Note 9, “Long-Term Debt and Capital Lease Obligations”, included in the Notes to Consolidated Financial Statements included elsewhere in this Form 10-K.
The drug discovery, development services and manufacturing support industries are highly competitive.
The drug discovery, non-clinical development, and manufacturing support services industries are highly competitive. We often compete for business not only with other CROs, but also with internal discovery and development departments within our larger clients, who may have greater resources than ours. We also compete with universities and teaching hospitals for outsourced services. We compete on a variety of factors, including:
|
•
|
reputation for on-time quality performance;
|
|
•
|
reputation for regulatory compliance;
|
|
•
|
expertise and experience in multiple specialized areas;
|
|
•
|
scope and breadth of service and product offerings across the drug discovery and development spectrum;
|
|
•
|
scope and breadth of service and product offerings across the manufacturing support spectrum;
|
|
•
|
ability to provide flexible and customized solutions to support our clients' drug discovery, non-clinical development, and manufacturing support needs;
|
|
•
|
broad geographic availability (with consistent quality);
|
|
•
|
price/value, spend and flexibility;
|
|
•
|
technological and scientific expertise and efficient drug development processes;
|
|
•
|
quality of facilities;
|
|
•
|
financial stability;
|
|
•
|
size;
|
|
•
|
ability to acquire, process, analyze, and report data in an accurate manner; and
|
|
•
|
accessibility of client data through secure portals.
|
If we do not compete successfully, our business will suffer. Increased competition might lead to price and other concessions that could adversely affect our operating results. The drug discovery and development services industry has continued to see a trend towards consolidation, particularly among the biotechnology companies, who are targets for each other and for larger pharmaceutical companies. If this trend continues, it is likely to produce more competition among the larger companies and CROs generally, with respect to both clients and acquisition candidates. In addition, small, specialized entities considering entering the CRO industries will continue to find lower barriers to entry, and private equity firms may determine that there are opportunities to acquire and consolidate these companies, thus further increasing possible competition. More generally, our competitors or others might develop technologies, services or products that are more effective or commercially attractive than our current or future technologies, services, or products, or that render our technologies, services, or products less competitive or obsolete. If competitors introduce superior technologies, services, or products and we cannot make enhancements to ours to remain competitive, our competitive position, and in turn our business, revenue, and financial condition, would be materially and adversely affected. In the aggregate, these competitive pressures may affect the attractiveness of our technologies, services, or products and could adversely affect our financial results.
Potential Changes in U.S. and International Tax Law.
On December 22, 2017, President Trump signed into law significant U.S. tax law changes (U.S. Tax Reform) which reduced the U.S. federal statutory tax rate, broadened the corporate tax base through the elimination or reduction of deductions, exclusions, and credits, limited the ability of U.S. corporations to deduct interest expense, and transitioned to a territorial tax system which allows for the repatriation of foreign earnings to the U.S. with a 100% federal dividends received deduction prospectively. In addition, U.S. Tax Reform required a one-time transitional tax on foreign cash equivalents and previously unremitted earnings. Several of the new provisions enacted as part of U.S. Tax Reform require clarification and guidance from the Internal Revenue
23
Service (IRS) and Treasury Department. These or other changes in U.S. tax laws could impact our profits, effective tax rate, and cash flows.
We have substantial operations in Canada, Ireland and the United Kingdom which currently benefit from favorable corporate tax arrangements. We receive substantial tax credits in Canada, from both the Canadian federal and Quebec governments, and the U.K. Any reduction in the availability or amount of these tax credits or increase to tax rates due to tax law changes or outcomes of tax controversies could have a material adverse effect on our profits, cash flows, and effective tax rate.
The OECD has developed an action plan to address concerns regarding base erosion and profit shifting (BEPS). This initiative resulted in proposed and enacted changes to tax laws in various countries including France, Germany, Luxembourg, Netherlands and the U.K. Future changes to tax laws or interpretation of tax laws resulting from the BEPS project could increase our effective tax rate, which would affect our profitability.
Contract research services create a risk of liability.
As a CRO, we face a range of potential liabilities which may include:
|
•
|
errors or omissions in reporting of study detail in non-clinical studies that may lead to inaccurate reports, which may undermine the usefulness of a study or data from the study, or which may potentially advance studies absent the necessary support or inhibit studies from proceeding to the next level of testing;
|
|
•
|
risks associated with our possible failure to properly care for our clients' property, such as research models and samples, study compounds, records, work in progress, other archived materials, or goods and materials in transit, while in our possession;
|
|
•
|
risks that models in our breeding facilities or in facilities that we manage may be infected with diseases that may be harmful and even lethal to them or humans, despite preventive measures contained in our policies for the quarantine and handling of imported animals; and
|
|
•
|
risks that we may have errors and omissions and/or product liabilities related to our products designed to conduct lot release testing of medical devices, injectable drugs, food, beverages, and home and beauty products (primarily through our Microbial Solutions business), or in the testing of biologics and other services performed by our Biologics business, which could result in us or our clients failing to identify unsafe or contaminated materials.
|
While we attempt to mitigate these risks through a variety of methods, it is impossible to completely eradicate such risks. In our RMS business, we mitigate these risks to the best of our abilities through our regimen of animal testing, quarantine procedures, and veterinary staff vigilance, through which we seek to control the exposure of animal related disease or infections. In our DSA and Manufacturing businesses, we attempt to reduce these risks by contractual risk transfer provisions entitling us to be indemnified by our clients and subject to a limitation of liability, by insurance maintained by our clients and/or by us, and by various regulatory requirements we must follow in connection with our business.
Contractual risk transfer indemnifications generally do not protect us against liability arising from certain of our own actions, such as negligence or misconduct. We could be materially and adversely affected if we are required to pay damages or bear the costs of defending any claim that is outside any contractual indemnification provision, or if a party does not fulfill its indemnification obligations, or the damage is beyond the scope or level of insurance coverage. We also often contractually indemnify our clients (subject to a limitation of liability), similar to the way they indemnify us, and we may be materially adversely affected if we have to fulfill our indemnity obligations. Furthermore, there can be no assurance that neither we nor a party required to indemnify us will be able to maintain such insurance coverage (either at all or on terms acceptable to us).
Upgrading and integrating our business systems could result in implementation issues and business disruptions.
In recent years, we have been updating and consolidating systems and automating processes in many parts of our business with a variety of systems. The expansion and ongoing implementation of the systems may occur at a future date based on value to the business. In general, the process of planning and preparing for these types of integrated, wide-scale implementations is extremely complex and we are required to address a number of challenges including data conversion, system cutover, and user training. Problems in any of these areas could cause operational problems during implementation including delayed shipments, missed sales, billing and accounting errors. There have been numerous, well-publicized instances of companies experiencing difficulties with the implementation of similar large-scale systems, which resulted in negative business consequences.
The drug discovery and development industry has a history of patent and other intellectual property litigation, and we might be involved in costly intellectual property lawsuits.
24
The drug discovery and development industry has a history of patent and other intellectual property litigation and these lawsuits will likely continue. Legal proceedings relating to intellectual property are expensive, take significant time, and divert management's attention from other business concerns, whether we win or lose. If we do not prevail in an infringement lawsuit brought against us, we might have to pay substantial damages, including treble damages, and we could be required to stop the infringing activity or obtain a license to use technology on unfavorable terms.
We may not be able to successfully develop and market new services and products.
We may seek to develop and market new services and products that complement or expand our existing business or service offerings. We believe our ability to in-license new technologies from third parties will be critical to our ability to offer new products and services to our clients. Our ability to gain access to technologies that we need for new products and services depends, in part, on our ability to convince inventors and their agents or assignees that we can successfully commercialize their inventions. We cannot guarantee that we will be able to identify new technologies of interest to our clients. Even if we are able to identify new technologies of interest, we may not be able to negotiate license agreements on acceptable terms, or at all. If we are unable to develop new services and products and/or create demand for those newly developed services and products, our future business, results of operations, financial condition, and cash flows could be adversely affected.
The decision by British voters to exit the European Union may adversely affect our business.
The U.K. is currently negotiating the terms of its exit from the European Union (“
Brexit
”) scheduled for March 29, 2019. In November 2018, the U.K. and the European Union agreed upon a draft Withdrawal Agreement that sets out the terms of the U.K.’s departure, including commitments on citizen rights after Brexit, a financial settlement from the U.K., and a transition period from March 29, 2019 through December 31, 2020 to allow time for a future trade deal to be agreed. On January 15, 2019, the draft Withdrawal Agreement was rejected by the U.K. Parliament creating significant uncertainty about the terms (and timing) under which the U.K. will leave the European Union
.
Given the uncertainty concerning the terms of the UK’s departure from the EU, including the possibility of no negotiated agreement, we have formed a committee (comprised of senior managers across our business functions) to address the three main risks: (1) trade and customs, (2) employees and immigration, and (3) strategy and business planning.
In the absence of a future trade deal, the U.K.’s trade with the European Union and the rest of the world would be subject to tariffs and duties set by the World Trade Organization. Additionally, the movement of goods between the U.K. and the remaining member states of the European Union will be subject to additional inspections and documentation checks, leading to possible delays at ports of entry and departure. These changes to the trading relationship between the U.K and European Union would likely result in increased cost of goods imported into and exported from the U.K. and may decrease the profitability of our U.K. and other operations. Additional currency volatility could drive a weaker British pound, which increases the cost of goods imported into our U.K. operations and may decrease the profitability of our U.K. operations. A weaker British pound versus the U.S. dollar also causes local currency results of our U.K. operations to be translated into fewer U.S. dollars during a reporting period
. Although efforts are being undertaken to mitigate for risks within our control, other factors outside our control could adversely affect our business, business opportunities, results of operations, financial condition and cash flows.
We depend on key personnel and may not be able to retain these employees or recruit additional qualified personnel, which would harm our business.
Our success depends to a significant extent on the continued services of our senior management and other members of management. James C. Foster, our Chief Executive Officer and President since 1992 and Chairman since 2000, has held various positions with us for four decades. While we entered into an employment agreement with Mr. Foster in 2018, most members of our senior management do not have employment agreements. If Mr. Foster or other members of senior management do not continue in their present positions, our business may suffer.
Because of the specialized scientific nature of our business, we are highly dependent upon attracting and retaining qualified scientific, technical, and managerial personnel. While we have a strong record of employee retention, and we strive to reduce the impact of the potential loss of existing employees by having an established organizational talent review process which identifies successors and potential talent needs, there is still significant competition for qualified personnel in the veterinary, pharmaceutical, and biotechnology fields. Therefore, we may not be able to attract and retain the qualified personnel necessary for the development of our business. The loss of the services of existing personnel, as well as the failure to recruit additional key scientific, technical, and managerial personnel in a timely manner, could harm our business.
Our quarterly operating results may vary, which could negatively affect the market price of our common stock.
25
Our results of operations in any quarter may vary from quarter to quarter and are influenced by such factors as:
|
•
|
changes in the general global economy;
|
|
•
|
the number and scope of ongoing client engagements;
|
|
•
|
the commencement, postponement, delay, progress, completion, or cancellation of client contracts in the quarter;
|
|
•
|
changes in the mix of our products and services;
|
|
•
|
competitive pricing pressures;
|
|
•
|
the extent of cost overruns;
|
|
•
|
holiday buying patterns of our clients;
|
|
•
|
budget cycles of our clients;
|
|
•
|
changes in tax laws, rules, regulations, and tax rates in the locations in which we operate;
|
|
•
|
the timing and charges associated with completed acquisitions and other events;
|
|
•
|
the financial performance of our venture capital investments;
|
|
•
|
the occasional extra week (“53
rd
week”) that we recognize in a fiscal year (and fourth fiscal quarter thereof) due to our fiscal year ending on the last Saturday in December; and
|
|
•
|
exchange rate fluctuations.
|
We believe that operating results for any particular quarter are not necessarily a meaningful indication of future results. Nonetheless, fluctuations in our quarterly operating results could negatively affect the market price of our common stock.
Since we do not expect to pay any cash dividends for the foreseeable future, our shareholders will benefit from an investment in our common stock only if it appreciates in value.
We have not declared or paid any cash dividends on our common stock, and do not anticipate that we will pay any dividends to holders of our common stock for the foreseeable future. Any payment of cash dividends will be at the discretion of our Board of Directors and will depend on our financial condition, capital requirements, legal requirements, earnings and other factors. Consequently, our shareholders should not rely on dividends to receive a return on their investment.
Item 1B. Unresolved Staff Comments
There are no unresolved comments to be reported in response to Item 1B.
Item 2. Properties
We own or lease the land and buildings where we have facilities. We own large facilities (facilities over 50,000 square feet) for our DSA businesses in Canada, France, Ireland, Netherlands, Scotland, and the U.S. and lease large facilities in England and the U.S. We own large RMS facilities in Canada, France, Germany, Italy, Japan, England, and the U.S. We lease large RMS facilities in China. We own large Manufacturing facilities in the U.S. and China. None of our leases is individually material to our business operations. Many of our leases have an option to renew, and we believe that we will be able to successfully renew expiring leases on terms satisfactory to us. We believe that our facilities in each of our reportable segments are adequate for our operations and that suitable additional space will be available when needed. For additional information, see Note 9, “Long-Term Debt and Capital Lease Obligations” and Note 16, “Commitments and Contingencies” included in Item 8, “Financial Statements and Supplementary Data” in this Annual Report on Form 10-K.
We track room utilization on an ongoing basis and depending on the needs of our clients at given times, we may need to execute on contingent plans for expansion, which average between six and fifteen months to complete.
We may also expand at specific sites in order to accommodate needs resulting from any consolidation strategy. We continue to employ a master site planning strategy to proactively evaluate our real estate needs. In certain circumstances, we dispose of or consolidate operations, which could result in impairment charges. In situations where the associated real estate is leased, and depending on the resolution of these situations, we may be encumbered with the remaining real estate lease obligations.
Item 3. Legal Proceedings
26
We are not party to any material legal proceedings, other than ordinary routine litigation incidental to our business that is not material to our business or financial condition.
Item 4. Mine Safety Disclosures
Not applicable.
PART II
Item 5. Market for Registrant’s Common Equity, Related Stockholder Matters and Issuer Purchases of Equity Securities
Our common stock began trading on the New York Stock Exchange on June 23, 2000 under the symbol “CRL.” There were no equity securities that were not registered under the Securities Act of 1933, as amended, sold during fiscal year
2018
.
Shareholders
As of
January 25, 2019
, there were
92
registered shareholders of the outstanding shares of common stock.
Issuer Purchases of Equity Securities
The following table provides information relating to our purchases of shares of our common stock during the fourth quarter of fiscal
2018
:
|
|
Total Number
of Shares Purchased |
|
Average
Price Paid per Share |
|
Total Number of
Shares Purchased as Part of Publicly Announced Plans or Programs |
|
Approximate Dollar
Value of Shares That May Yet Be Purchased Under the Plans or Programs |
||||||
|
(in thousands)
|
|||||||||||||
|
September 30, 2018 to October 27, 2018
|
173
|
|
$
|
133.55
|
|
—
|
|
$
|
129,105
|
|
|||
|
October 28, 2018 to November 24, 2018
|
46
|
|
121.82
|
|
—
|
|
129,105
|
|
|||||
|
November 25, 2018 to December 29, 2018
|
194
|
|
134.85
|
|
—
|
|
129,105
|
|
|||||
|
Total
|
413
|
|
—
|
|
|
|
|||||||
In July 2010, our Board of Directors authorized a $500.0 million stock repurchase program, and subsequently approved increases to the program of $250.0 million in fiscal year 2010, $250.0 million in fiscal year 2013, $150.0 million in fiscal year 2014, and $150.0 million in fiscal year 2017, for an aggregate authorization of $1.3 billion. During the fourth quarter of fiscal year
2018
, we did not repurchase any shares of common stock under our stock repurchase program or in open market trading.
As of
December 29, 2018
, we had $129.1 million remaining on the authorized stock repurchase program.
Additionally, our stock-based compensation plans permit the netting of common stock upon vesting of restricted stock, restricted stock units, and performance share units in order to satisfy individual
statutory
tax withholding requirements.
27
Comparison of 5-Year Cumulative Total Return
The following stock performance graph compares the annual percentage change in the Company’s cumulative total shareholder return on its Common Stock during a period commencing on
December 28, 2013
and ending on
December 29, 2018
(as measured by dividing (1) the sum of (A) the cumulative amount of dividends for the measurement period, assuming dividend reinvestment, and (B) the difference between the Company’s share price at the end and the beginning of the measurement period; by (2) the share price at the beginning of the measurement period) with the cumulative total return of the S&P 500 Index and the S&P 500 Health Care Index during such period. The Company has not paid any dividends on the Common Stock, and no dividends are included in the representation of the Company’s performance. The stock price performance on the graph below is not necessarily indicative of future price performance. The graph is not “soliciting material,” is not deemed filed with the Securities and Exchange Commission and is not to be incorporated by reference in any filing of the Company under the Securities Act of 1933 or the Securities Exchange Act of 1934 whether made before or after the date hereof and irrespective of any general incorporation language in any such filing. Information used in the graph was obtained from Standards & Poor’s Institutional Market Services, a source believed to be reliable, but the Company is not responsible for any errors or omissions in such information
COMPARISON OF 5-YEAR CUMULATIVE TOTAL RETURN
Among Charles River Laboratories International, Inc., The
S&P 500
Index and
The
S&P 500 Health Care
Index
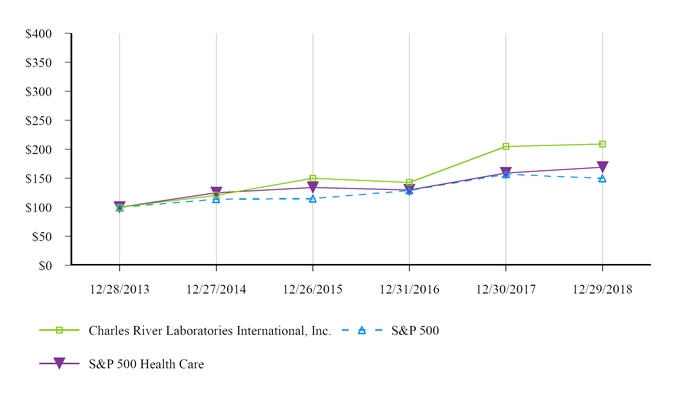
|
Fiscal Year
|
|||||||||||||||||||||||
|
2013
|
2014
|
2015
|
2016
|
2017
|
2018
|
||||||||||||||||||
|
Charles River Laboratories International, Inc.
|
$
|
100
|
|
$
|
121
|
|
$
|
150
|
|
$
|
143
|
|
$
|
205
|
|
$
|
209
|
|
|||||
|
S&P 500
|
100
|
|
114
|
|
115
|
|
129
|
|
157
|
|
150
|
|
|||||||||||
|
S&P 500 Health Care
|
100
|
|
125
|
|
134
|
|
130
|
|
159
|
|
169
|
|
|||||||||||
28
Item 6. Selected Consolidated Financial Data
The selected financial data presented below is derived from our audited consolidated financial statements and should be read in conjunction with “Management’s Discussion and Analysis of Financial Condition and Results of Operations” contained in Item 7 and “Financial Statements and Supplementary Data” contained in Item 8 of this Annual Report on Form 10-K.
Our fiscal year is typically based on 52-week
s
, with each quarter comp
osed
of 13 weeks ending on the last Saturday on, or closest to, March 31, June 30, September 30, and December 31. A 53
rd
week was included in the fourth quarter of fiscal year 2016, which is occasionally necessary to align with a December 31 calendar year-end.
|
|
Fiscal Year
|
||||||||||||||||||
|
|
2018
|
2017
|
2016
|
2015
|
2014
|
||||||||||||||
|
|
(in thousands, except per share amounts)
|
||||||||||||||||||
|
Statement of Income Data
|
|
|
|
|
|
||||||||||||||
|
Total revenue
|
$
|
2,266,096
|
|
$
|
1,857,601
|
|
$
|
1,681,432
|
|
$
|
1,363,302
|
|
$
|
1,297,662
|
|
||||
|
Income from continuing operations, net of income taxes
|
227,218
|
|
125,586
|
|
156,086
|
|
152,037
|
|
129,924
|
|
|||||||||
|
Income (loss) from discontinued operations, net of income taxes
|
1,506
|
|
(137
|
)
|
280
|
|
(950
|
)
|
(1,726
|
)
|
|||||||||
|
Common Share Data
|
|
|
|
|
|
||||||||||||||
|
Earnings per common share from continuing operations:
|
|
|
|
|
|
||||||||||||||
|
Basic
|
$
|
4.69
|
|
$
|
2.60
|
|
$
|
3.28
|
|
$
|
3.23
|
|
$
|
2.76
|
|
||||
|
Diluted
|
$
|
4.59
|
|
$
|
2.54
|
|
$
|
3.22
|
|
$
|
3.15
|
|
$
|
2.70
|
|
||||
|
Other Data
|
|
|
|||||||||||||||||
|
Depreciation and amortization
|
$
|
161,779
|
|
$
|
131,159
|
|
$
|
126,658
|
|
$
|
94,881
|
|
$
|
96,445
|
|
||||
|
Capital expenditures
|
140,054
|
|
82,431
|
|
55,288
|
|
63,252
|
|
56,925
|
|
|||||||||
|
Balance Sheet Data (as of period end)
|
|
|
|||||||||||||||||
|
Cash and cash equivalents
|
$
|
195,442
|
|
$
|
163,794
|
|
$
|
117,626
|
|
$
|
117,947
|
|
$
|
160,023
|
|
||||
|
Total assets
|
3,855,879
|
|
2,929,922
|
|
2,711,800
|
|
2,068,497
|
|
1,870,578
|
|
|||||||||
|
Long-term debt, net and capital leases
|
1,636,598
|
|
1,114,105
|
|
1,207,696
|
|
845,997
|
|
740,557
|
|
|||||||||
|
Redeemable noncontrolling interest
|
18,525
|
|
16,609
|
|
14,659
|
|
28,008
|
|
28,419
|
|
|||||||||
Refer to Note 2, “Business Acquisitions and Divestiture”
included in
Item 8, “Financial Statements and Supplementary Data” in this Annual Report on Form 10-K
for additional information concerning the impact of our recent acquisitions.
29
Item 7. Management’s Discussion and Analysis of Financial Condition and Results of Operations
The following discussion should be read in conjunction with our consolidated financial statements and related notes appearing in Item 8, “Financial Statements and Supplementary Data” in this Annual Report on Form 10-K. The following discussion contains forward-looking statements. Actual results may differ significantly from those projected in the forward-looking statements. Factors that might cause future results to differ materially from those projected in the forward-looking statements include, but are not limited to, those discussed in Item 1A, “Risk Factors” and elsewhere in this Annual Report on Form 10-K. Certain percentage changes may not recalculate due to rounding.
Overview
We are a full service, early-stage contract research organization (CRO). For over 70 years, we have been in the business of providing the research models required in research and development of new drugs, devices, and therapies. Over this time, we have built upon our original core competency of laboratory animal medicine and science (research model technologies) to develop a diverse portfolio of discovery and safety assessment services, both Good Laboratory Practice (GLP) and non-GLP, that enable us to support our clients from target identification through non-clinical development. We also provide a suite of products and services to support our clients’ manufacturing activities. Utilizing our broad portfolio of products and services enables our clients to create a more flexible drug development model, which reduces their costs, enhances their productivity and effectiveness, and increases speed to market.
Our client base includes all major global biopharmaceutical companies, many biotechnology companies, CROs, agricultural and industrial chemical companies, life science companies, veterinary medicine companies, contract manufacturing companies, medical device companies, and diagnostic and other commercial entities, as well as leading hospitals, academic institutions, and government agencies around the world. We currently operate in over 80 facilities and in approximately 20 countries worldwide, which numbers exclude our Insourcing Solutions (IS) sites.
Segment Reporting
Our three reportable segments are Research Models and Services (RMS), Discovery and Safety Assessment (DSA), and Manufacturing Support (Manufacturing). Our RMS reportable segment includes the Research Models and Research Model Services businesses. Research Models includes the commercial production and sale of small research models, as well as the supply of large research models. Research Model Services includes: Genetically Engineered Models and Services (GEMS), which performs contract breeding and other services associated with genetically engineered research models; Research Animal Diagnostic Services (RADS), which provides health monitoring and diagnostics services related to research models; and Insourcing Solutions (IS), which provides colony management of our clients’ research operations (including recruitment, training, staffing, and management services). Our DSA reportable segment includes services required to take a drug through the early development process including discovery services, which are non-regulated services to assist clients with the identification, screening, and selection of a lead compound for drug development, and regulated and non-regulated (GLP and non-GLP) safety assessment services. Our Manufacturing reportable segment includes Microbial Solutions, which provides
in vitro
(non-animal) lot-release testing products, microbial detection products, and species identification services; Biologics Testing Services (Biologics), which performs specialized testing of biologics; Avian Vaccine Services (Avian), which supplies specific-pathogen-free chicken eggs and chickens; and contract development and manufacturing (CDMO) services, which, until we divested this business on February 10, 2017, allowed us to provide formulation design and development, manufacturing, and analytical and stability testing for small molecules.
Recent Acquisitions and Divestiture
Our strategy is to augment internal growth of existing businesses with complementary acquisitions. We continued to make strategic acquisitions designed to expand our portfolio of services to support the drug discovery and development continuum and position us as a market leader in the outsourced discovery services market. Our recent acquisitions and divestiture are described below.
On February 13, 2019, we announced that we signed a
binding offer to acquire Citoxlab for
€448 million
in cash (or approximately
$510 million
based on current exchange rates), subject to customary closing adjustments.
Citoxlab
is a non-clinical CRO, specializing in regulated safety assessment services, non-regulated discovery services, and medical device testing. With operations in Europe and North America, the proposed acquisition of Citoxlab would further strengthen our position as the leading, global, early-stage CRO by expanding our scientific portfolio and geographic footprint, which would enhance our ability to partner with clients across the drug discovery and development continuum.
The proposed transaction is expected to close in the second quarter of 2019, subject to labor consultations, regulatory requirements, and customary closing
30
conditions. Upon completion of the labor consultations, Citoxlab’s shareholders are expected to enter into a definitive purchase agreement.
The proposed acquisition and associated fees are expected to be financed through our
existing revolving credit facility and cash.
In the event the agreement is terminated under specified circumstances, we may be required to pay a termination fee of
€18.2 million
. This business is expected to be reported as part of our DSA reportable segment.
On April 3, 2018, we acquired MPI Research, a non-clinical CRO providing comprehensive testing services to biopharmaceutical and medical device companies worldwide. The acquisition enhances our position as a leading global early-stage CRO by strengthening our ability to partner with clients across the drug discovery and development continuum. The purchase price for MPI Research was
$829.7 million
in cash, subject to certain post-closing adjustments. The acquisition was funded by borrowings on our $2.3 billion credit facility ($2.3B Credit Facility) as well as the issuance of $500.0 million of our senior notes. The MPI Research business is reported as part of our DSA reportable segment.
On
January 11, 2018
, we acquired KWS BioTest Limited (KWS BioTest), a CRO specializing in
in vitro
and
in vivo
discovery testing services for immuno-oncology, inflammatory and infectious diseases. The acquisition enhances our discovery expertise, with complementary offerings that provide our customers with additional tools in the active therapeutic research areas of oncology and immunology. The purchase price for KWS BioTest was
$20.3 million
in cash, subject to certain post-closing adjustments. In addition to the initial purchase price, the transaction includes aggregate, undiscounted contingent payments of up to £
3.0 million
(approximately
$3.8 million
based on recent exchange rates), based on future performance. During the three months ended September 29, 2018, the terms of these contingent payments were amended, resulting in a fixed payment of £
2.0 million
(approximately
$2.5 million
based on recent exchange rates), due in the first quarter of fiscal year 2019. The KWS BioTest business is reported as part of our DSA reportable segment.
On August 4, 2017, we acquired Brains On-Line, a leading CRO providing critical data that advances novel therapeutics for the treatment of central nervous system (CNS) diseases. Brains On-Line strategically expands our existing CNS capabilities and establishes us as a single-source provider for a broad portfolio of discovery CNS services. The purchase price for Brains On-Line was
$21.3 million
in cash. In addition to the initial purchase price, the transaction includes aggregate, undiscounted contingent payments of up to €
6.7 million
(approximately
$7.7 million
based on recent exchange rates), based on future performance and due in the first quarter of fiscal year 2019 if achieved. The Brains On-Line business is reported as part of our DSA reportable segment.
On February 10, 2017, we completed the divestiture of our CDMO business to Quotient Clinical Ltd., based in London, England for
$75.0 million
in proceeds, net of cash, cash equivalents, and working capital adjustments. The CDMO business was acquired in April 2016 as part of the acquisition of WIL Research and was reported in our Manufacturing reportable segment.
Fiscal Quarters
Our
fiscal year
is typically based on 52-week
s
, with each quarter comp
osed
of 13 weeks ending on the last Saturday on, or closest to, March 31, June 30, September 30, and December 31. A 53
rd
week was included in the fourth quarter of fiscal year 2016, which is occasionally necessary to align with a December 31 calendar year-end.
Business Trends
The demand for our products and services increased meaningfully in fiscal year 2018. Our pharmaceutical and biotechnology clients continued to intensify their use of strategic outsourcing to improve their operating efficiency and to access capabilities that they do not maintain internally. Many of our large biopharmaceutical clients have continued to increase investments in their drug discovery and early-stage development efforts and have strengthened their relationships with both CROs, like Charles River, and biotechnology companies to assist them in bringing new drugs to market. In addition, small and mid-size biopharmaceutical clients benefited from the continued strength in the biotechnology funding environment in fiscal year 2018, from capital markets, partnering with large biopharmaceutical companies, and investment by venture capital. Our full service, early-stage portfolio continued to lead to additional client discussions
and new business opportunities in fiscal year 2018, as clients
seek to outsource larger portions of their early-stage drug research programs to us.
The primary result of these trends was robust demand for our Safety Assessment services in fiscal year 2018, particularly from biotechnology clients. As a result of this improvement, our Safety Assessment facilities remained well utilized in fiscal year 2018. In order to accommodate increasing client demand, we continued to open modest amounts of capacity at legacy sites, and gained additional capacity through the acquisition of MPI Research in April 2018. Price also improved slightly in fiscal year 2018, as we believe industry capacity utilization continued to increase, as well. We believe our scientific expertise, quality, and responsiveness remain key criteria when our clients make the decision to outsource to us. As our clients continue to pursue their
31
goal of more efficient and effective drug research, they are evaluating outsourcing new areas of their research programs, such as discovery services. We have enhanced our Discovery Services capabilities over the past five years to enable us to work with clients at the earliest stages of the discovery process. In fiscal year 2018, demand in our Discovery Services business also increased meaningfully, driven by biotechnology clients as many of these clients either initiated or continued to work with us on integrated programs and other projects. Our efforts to enhance our sales strategies and become a trusted scientific partner for our clients’ early-stage programs have been successful, and enabled us to attract new clients for our early discovery services, including a growing base of biotechnology clients. Demand from large biopharmaceutical companies also increased. These clients continue to have significant internal discovery capabilities, on which they can choose to rely. In order for large biopharmaceutical clients to increasingly outsource more work to us, we must continue to demonstrate that our services can augment and accelerate our clients’ drug discovery processes. Demand for our
in vivo
discovery services continued to increase in fiscal year 2018, and we acquired KWS BioTest in January 2018 to enhance our discovery expertise and provide immuno-oncology capabilities to our clients
.
Demand for our products and services that support our clients’ manufacturing activities was also robust in fiscal year 2018. Demand for our Microbial Solutions business remained strong as manufacturers continued to increase their use of our rapid microbial testing solutions. Our Biologics business continued to benefit from increased demand for services associated with the growing proportion of biologic drugs in the pipeline and on the market. To support this increased demand, we continue to expand the capacity of our Biologics business.
Demand for our Research Models and Services increased in fiscal year 2018, driven by strong demand for research models in China, higher revenue for research model services, and improved pricing. Demand for research models in China continued to be robust in fiscal year 2018, as clients in this growing market continue to value our high-quality research models and we expanded our geographic footprint. Demand for research models services also improved in fiscal year 2018, particularly for our IS and GEMS businesses. The IS business further benefited from being awarded a five-year, $95.7 million contract from the National Institute of Allergy and Infectious Diseases, or NIAID, which commenced in September 2018. The continued effect of the consolidation of internal infrastructure within our large biopharmaceutical clients and a longer-term trend towards more efficient use of research models has led to reduced demand for research models outside of China.
We are confident that research models and services will remain essential tools for our clients’ drug discovery and early-stage development efforts, and the RMS business will continue to be an important source of cash flow generation for us.
Overview of Results of Operations and Liquidity
Revenue for fiscal year
2018
was
$2.3 billion
compared to
$1.9 billion
in fiscal year
2017
. The
2018
increase as compared to the corresponding period in
2017
was
$408.5 million
, or
22.0%
, and was primarily due to both growth in our DSA and Manufacturing segments, as discussed in the above “Business Trends” section, as well as the recent acquisitions of MPI Research, KWS BioTest, and Brains On-Line. The positive effect of changes in foreign currency exchange rates increased revenue by
$23.7 million
, or
1.3%
, when compared to the corresponding period in 2017.
In fiscal year
2018
, our operating income and operating income margin were
$331.4 million
and
14.6%
, respectively, compared with
$288.3 million
and
15.5%
, respectively, in fiscal year
2017
. The increase in operating income was primarily due to our recent acquisitions and increased demand from biotechnology and global biopharmaceutical clients. The decrease in operating income margin was primarily due to increased amortization expense and costs related to our recent acquisitions; as well as continued investments to support future growth of the Company, which includes increased investments in personnel (staffing levels and hourly wage increase), facility expansions (primarily in the RMS, Microbial Solutions, and Biologics businesses), and company-wide IT and infrastructure projects. Offsetting the decreases in operating income margin were the realization of improved volume, mix, and pricing across our products and services portfolio as well as the impact of recent productivity initiatives across all businesses.
Net income attributable to common shareholders increased to
$226.4 million
in fiscal year
2018
, from
$123.4 million
in the corresponding period of
2017
. The increase in net income attributable to common shareholders of
$103.0 million
was primarily due to the increase in operating income discussed above and a lower effective tax rate driven primarily by net benefits of U.S. Tax Reform; partially offset by lower gains on our venture capital and life insurance policy investments, higher interest expense related to higher debt balances to support our recent acquisitions, and the absence of a gain recorded in other income, net on the CDMO divestiture in 2017.
During fiscal year
2018
, our cash flows from operations was
$441.1 million
compared with
$318.1 million
for fiscal year
2017
. The increase was primarily driven by an increase in income from continuing operations and positive changes in operating assets
32
and liabilities resulting from an increase in our deferred revenue and customer contract deposits as well as improved collections of our receivables.
On March 26, 2018, we amended and restated our credit facility creating a $2.3B Credit Facility. The $2.3B Credit Facility provides for a $750.0 million term loan and a $1.55 billion multi-currency revolving facility. The term loan facility matures in 19 quarterly installments with the last installment due March 26, 2023. The revolving facility matures on March 26, 2023, and requires no scheduled payment before that date. Under specified circumstances, we have the ability to increase the term loan and/or revolving facility by up to $1.0 billion in the aggregate.
On April 3, 2018, we issued $500.0 million of 5.5% Senior Notes (Senior Notes) due in 2026 in an unregistered offering. Interest on the Senior Notes is payable semi-annually on April 1 and October 1 of each year, beginning on October 1, 2018.
Critical Accounting Policies and Estimates
Our discussion and analysis of our financial condition and results of operations is based upon our consolidated financial statements prepared in accordance with generally accepted accounting principles in the United States (U.S.). The preparation of these financial statements requires us to make certain estimates and assumptions that may affect the reported amounts of assets and liabilities, the reported amounts of revenues and expenses during the reported periods and related disclosures. These estimates and assumptions are monitored and analyzed by us for changes in facts and circumstances, and material changes in these estimates could occur in the future. We base our estimates on our historical experience, trends in the industry, and various other factors that are believed to be reasonable under the circumstances. Actual results may differ from our estimates under different assumptions or conditions.
We believe that the application of our accounting policies, each of which require significant judgments and estimates on the part of management, are the most critical to aid in fully understanding and evaluating our reported financial results. Our significant accounting policies are more fully described in Note 1, “Description of Business and Summary of Significant Accounting Policies”, to our consolidated financial statements contained in Item 8,
“Financial Statements and Supplementary Data”
in this Annual Report on Form 10-K.
We believe the following represent our critical accounting policies and estimates used in the preparation of our financial statements:
Revenue Recognition
Revenue is recognized when, or as, obligations under the terms of a contract are satisfied, which occurs when control of the promised products or services is transferred to customers. Revenue is measured as the amount of consideration we expect to receive in exchange for transferring products or services to a customer (“transaction price”).
To the extent the transaction price includes variable consideration, we estimate the amount of variable consideration that should be included in the transaction price utilizing the amount to which we expect to be entitled. Variable consideration is included in the transaction price if, in our judgment, it is probable that a significant future reversal of cumulative revenue under the contract will not occur. Estimates of variable consideration and determination of whether to include estimated amounts in the transaction price are based largely on an assessment of our anticipated performance and all information (historical, current and forecasted) that is reasonably available. Sales, value add, and other taxes collected on behalf of third parties are excluded from revenue.
When determining the transaction price of a contract, an adjustment is made if payment from a customer occurs either significantly before or significantly after performance, resulting in a significant financing component. Generally, we do not extend payment terms beyond one year. Applying the practical expedient, we do not assess whether a significant financing component exists if the period between when we perform our obligations under the contract and when the customer pays is one year or less. None of our contracts contained a significant financing component during fiscal year
2018
.
Contracts with customers may contain multiple performance obligations. For such arrangements, the transaction price is allocated to each performance obligation based on the estimated relative standalone selling prices of the promised products or services underlying each performance obligation. We determine standalone selling prices based on the price at which the performance obligation is sold separately. If the standalone selling price is not observable through past transactions, we estimate the standalone selling price taking into account available information such as market conditions and internally approved pricing guidelines related to the performance obligations.
Contracts are often modified to account for changes in contract specifications and requirements. Contract modifications exist when the modification either creates new, or changes existing, enforceable rights and obligations. Generally, when contract modifications create new performance obligations, the modification is considered to be a separate contract and revenue is
33
recognized prospectively. When contract modifications change existing performance obligations, the existing transaction price and measure of progress for the performance obligation to which it relates is generally recognized as an adjustment to revenue (either as an increase in or a reduction of revenue) on a cumulative catch-up basis.
Product revenue is generally recognized when the customer obtains control of our product, which occurs at a point in time, and may be upon shipment or upon delivery based on the contractual shipping terms of a contract. Service revenue is generally recognized over time as the services are delivered to the customer based on the extent of progress towards completion of the performance obligation. The selection of the method to measure progress towards completion requires judgment and is based on the nature of the products or services to be provided. Depending on which better depicts the transfer of value to the customer, we generally measure our progress using either cost-to-cost (input method) or right-to-invoice (output method). We use the cost-to-cost measure of progress when it best depicts the transfer of value to the customer which occurs as we incur costs on our contract, generally related to fixed fee service contracts. Under the cost-to-cost measure of progress, the extent of progress towards completion is measured based on the ratio of costs incurred to date to the total estimated costs at completion of the performance obligation. The costs calculation includes variables such as labor hours, allocation of overhead costs, research model costs, and subcontractor costs. Revenue is recorded proportionally as costs are incurred. The right-to-invoice measure of progress is generally related to rate per unit contracts, as the extent of progress towards completion is measured based on discrete service or time-based increments, such as samples tested or labor hours incurred. Revenue is recorded in the amount invoiced since that amount corresponds directly to the value of our performance to date.
Accounting Standard Codification Topic 606, “Revenue from Contracts with Customers” (ASC 606) became effective for us on December 31, 2017 and was adopted using the modified retrospective method for all contracts not completed as of the date of adoption. For contracts that were modified before the effective date, we reflected the aggregate effect of all modifications when identifying performance obligations and allocating transaction price in accordance with the practical expedient, which did not have a material effect on the cumulative impact of adopting ASC 606. The reported results for fiscal year 2018 reflect the application of ASC 606 guidance while the historical results for fiscal years 2017 and 2016 were prepared under the guidance of ASC 605, “Revenue Recognition” (ASC 605).
The cumulative effect of applying ASC 606 to all contracts with customers that were not completed as of
December 30, 2017
was immaterial. There is no material difference in the reporting of revenue during fiscal year
2018
in accordance with ASC 606 when compared to ASC 605.
Income Taxes
We prepare and file income tax returns based on our interpretation of each jurisdiction’s tax laws and regulations. In preparing our consolidated financial statements, we estimate our income tax liability in each of the jurisdictions in which we operate by estimating our actual current tax expense together with assessing temporary differences resulting from differing treatment of items for tax and financial reporting purposes. These differences result in deferred tax assets and liabilities, which are included in our consolidated balance sheets. Significant management judgment is required in assessing the realizability of our deferred tax assets. In performing this assessment, we consider whether it is more likely than not that some portion or all of the deferred tax assets will not be realized. The ultimate realization of deferred tax assets is dependent upon the generation of future taxable income during the periods in which those temporary differences become deductible. In making this determination, under the applicable financial accounting standards, we are allowed to consider the scheduled reversal of deferred tax liabilities, projected future taxable income, and the effects of tax planning strategies. In the event that actual results differ from our estimates, we adjust our estimates in future periods and we may need to establish a valuation allowance, which could materially impact our financial position and results of operations.
We account for uncertain tax positions using a “more-likely-than-not” threshold for recognizing and resolving uncertain tax positions. We evaluate uncertain tax positions on a quarterly basis and consider various factors, that include, but are not limited to, changes in tax law, the measurement of tax positions taken or expected to be taken in tax returns, the effective settlement of matters subject to audit, information obtained during in process audit activities and changes in facts or circumstances related to a tax position. We adjust the level of the liability to reflect any subsequent changes in the relevant facts surrounding the uncertain positions. Our liabilities for uncertain tax positions can be relieved only if the contingency becomes legally extinguished through either payment to the taxing authority or the expiration of the statute of limitations, the recognition of the benefits associated with the position meet the “more-likely-than-not” threshold or the liability becomes effectively settled through the controversy process. We consider matters to be effectively settled once the taxing authority has completed all of its required or expected examination procedures, including all appeals and administrative reviews; we have no plans to appeal or litigate any aspect of the tax position; and we believe that it is highly unlikely that the taxing authority would re-examine the
34
related tax position. We also accrue for potential interest and penalties related to unrecognized tax benefits in income tax expense.
On December 22, 2017, the U.S. government enacted comprehensive tax legislation commonly referred to as U.S. Tax Reform. U.S. Tax Reform makes broad and complex changes to the U.S. tax code, including, but not limited to, (i) reducing the U.S. federal statutory tax rate from 35% to 21%; (ii) requiring companies to pay a one-time transition tax (Transition Tax) on certain unrepatriated earnings of foreign subsidiaries; (iii) generally eliminating U.S federal income taxes on dividends from foreign subsidiaries; (iv) requiring a current inclusion in U.S. federal taxable income of certain earnings of controlled foreign corporations; (v) eliminating the corporate alternative minimum tax (AMT) and changing how existing AMT credits can be realized; (vi) subjecting certain foreign earnings to U.S. taxation through base erosion anti-abuse tax (BEAT) and global intangible low-taxed income (GILTI); (vii) creating a new limitation on deductible interest expense; (viii) changing rules related to uses and limitations of net operating loss carryforwards created in tax years beginning after December 31, 2017, and (ix) modifying the officer’s compensation limitation.
Our accounting for the elements of U.S. Tax Reform is complete. We have made an accounting policy election to treat taxes due on the GILTI inclusion as a current period expense. See Note 11, “Income Taxes” for further discussion.
In March 2018, the Financial Accounting Standards Board (FASB) issued Accounting Standards Update (ASU) 2018-05, “Income Taxes (Topic 740) - Amendments to SEC Paragraphs Pursuant to SEC Staff Accounting Bulletin No. 118 (SAB 118).” This standard amends Accounting Standards Codification 740, Income Taxes (ASC 740) to provide guidance on accounting for the tax effects of U.S. Tax Reform pursuant to SAB 118, which allows companies to complete the accounting under ASC 740 within a one-year measurement period from the enactment date of U.S. Tax Reform. This standard is effective upon issuance and we have complied with the amendments.
In February 2018, the FASB issued ASU 2018-02, “Income Statement - Reporting Comprehensive Income (Topic 220) Reclassification of Certain Tax Effects from Accumulated Other Comprehensive Income.” The standard allows for reclassification from accumulated other comprehensive income to retained earnings for the stranded tax effects arising from the change in the reduction of the U.S. federal statutory income tax rate to 21% from 35%. We elected to early adopt this standard in fiscal year 2018 as permitted on a prospective basis, resulting in a reclassification of $3.3 million from Accumulated other comprehensive income to Retained earnings as a result of remeasuring our deferred tax liabilities related to our pension and other post-retirement benefit plan gains and losses. Our policy is to release material stranded tax effects on a specific identification basis.
Goodwill and Intangible Assets
We use assumptions and estimates in determining the fair value of assets acquired and liabilities assumed in a business combination. The determination of the fair value of intangible assets, which represent a significant portion of the purchase price in many of our acquisitions, requires the use of significant judgment with regard to (i) the fair value; and (ii) whether such intangibles are amortizable or non-amortizable and, if the former, the period and the method by which the intangible asset will be amortized. We utilize commonly accepted valuation techniques, such as the income approach and the cost approach, as appropriate, in establishing the fair value of intangible assets. Typically, key assumptions include projections of cash flows that arise from identifiable intangible assets of acquired businesses as well as discount rates based on an analysis of our weighted average cost of capital, adjusted for specific risks associated with the assets.
We review definite-lived intangible assets for impairment when indication of potential impairment exists, such as a significant reduction in cash flows associated with the assets. Actual cash flows arising from a particular intangible asset could vary from projected cash flows which could imply different carrying values from those established at the dates of acquisition and which could result in impairment of such asset.
We evaluate goodwill for impairment annually, during the fourth quarter, and when events occur or circumstances change that may reduce the fair value of the asset below its carrying amount. Events or circumstances that might require an interim evaluation include unexpected adverse business conditions, economic factors, unanticipated technological changes or competitive activities, loss of key personnel and acts by governments and courts. Estimates of future cash flows require assumptions related to revenue and operating income growth, asset-related expenditures, working capital levels and other factors. Different assumptions from those made in our analysis could materially affect projected cash flows and our evaluation of goodwill for impairment.
We have the option to first assess qualitative factors to determine whether it is necessary to perform the two-step goodwill impairment test. If we elect this option and believe, as a result of the qualitative assessment, that it is more-likely-than-not that
35
the carrying value of goodwill is not recoverable, the quantitative two-step impairment test is required; otherwise, no further testing is required. Alternatively, we may elect to not first assess qualitative factors and immediately perform the quantitative two-step impairment test. In the first step, we compare the fair value of our reporting units to their carrying values. If the carrying values of the net assets assigned to the reporting units exceed the fair values of the reporting units, then the second step of the impairment test is performed in order to determine the implied fair value of our goodwill. If the carrying value of the reporting unit’s goodwill exceeds its implied fair value, then we would record an impairment loss equal to the difference.
In fiscal years
2018
,
2017
and
2016
, we elected to perform the quantitative first step of the two-step goodwill impairment test for our reporting units. Fair value was determined by using a weighted combination of a market-based approach and an income approach, as this combination was deemed to be the most indicative of our fair value in an orderly transaction between market participants. Under the market-based approach, we utilized information about our Company as well as publicly available industry information to determine earnings multiples and sales multiples that are used to value our reporting units. Under the income approach, we determined fair value based on the estimated future cash flows of each reporting unit, discounted by an estimated weighted-average cost of capital, which reflects the overall level of inherent risk of the reporting unit and the rate of return an outside investor would expect to earn.
Our
2018
,
2017
and
2016
impairment tests indicated that goodwill was not impaired.
Valuation and Impairment of Long-Lived Assets
Long-lived assets to be held and used, including property, plant, and equipment, are reviewed for impairment whenever events or changes in circumstances indicate that the carrying amount of the assets or asset group may not be recoverable. Factors we consider important which could trigger an impairment review include, but are not limited to, the following:
|
•
|
significant underperformance relative to expected historical or projected future operating results;
|
|
•
|
significant negative industry or economic trends; or
|
|
•
|
significant changes or developments in strategy or operations that negatively affect the utilization of our long-lived assets.
|
Determination of recoverability is based on an estimate of undiscounted future cash flows resulting from the use of the asset, net of any sublease income, if applicable, and its eventual disposition. In the event that such cash flows are not expected to be sufficient to recover the carrying amount of the assets, the assets are written-down to their fair values. We measure any impairment based on a projected discounted cash flow method using a discount rate determined by management to be commensurate with the risk inherent in our current business model. Significant judgments are required to estimate future cash flows, including the selection of appropriate discount rates and other assumptions. We may also estimate fair value based on market prices for similar assets, as appropriate. Changes in these estimates and assumptions could materially affect the determination of fair value for these assets.
In fiscal 2017, we recognized $17.7 million of asset impairment and accelerated depreciation charges on the RMS facility in Frederick, Maryland in connection with our global RMS restructuring initiatives.
Pension and Other Post-Retirement Benefit Plans
Several of our U.S. and non-U.S. subsidiaries sponsor defined benefit pension and other post-retirement benefit plans. We recognize the funded status of our defined benefit pension and other postretirement benefit plans as an asset or liability. This amount is defined as the difference between the fair value of plan assets and the benefit obligation. We measure plan assets and benefit obligations as of the date of our fiscal year end.
The cost and obligations of these arrangements are calculated using many assumptions to estimate the benefits that the employee earns while working, the amount of which cannot be completely determined until the benefit payments cease. Major assumptions used in the accounting for these employee benefit plans include the expected return on plan assets, withdrawal and mortality rates, discount rate, and rate of increase in employee compensation levels. Assumptions are determined based on our data and appropriate market indicators, and are evaluated each year as of the plans’ measurement date. Should any of these assumptions change, they would have an effect on net periodic pension costs and the unfunded benefit obligation.
The expected long-term rate of return on plan assets reflects the average rate of earnings expected on the funds invested, or to be invested, to provide for the benefits included in the projected benefit obligations. In determining the expected long-term rate of return on plan assets, we consider the relative weighting of plan assets, the historical performance of total plan assets and individual asset classes and economic and other indicators of future performance.
36
The discount rate reflects the rate we would have to pay to purchase high-quality investments that would provide cash sufficient to settle our current pension obligations. A 25 basis point change in the discount rate changes the projected benefit obligation by approximately $16 million to $17 million for all our plans.
The rate of compensation increase reflects the expected annual salary increases for the plan participants based on historical experience and the current employee compensation strategy.
In fiscal year
2018
, new mortality improvement scales were issued in the U.S. and U.K reflecting a decline in longevity projection from the
2017
releases that we adopted, which decreased our benefit obligations by
$1.7 million
as of
December 29, 2018
. In fiscal year
2017
, new mortality improvement scales were issued in the U.S. and U.K. reflecting a decline in longevity projection from the
2016
releases that we adopted, which decreased our benefit obligations by
$5.2 million
as of
December 30, 2017
.
On January 31, 2019, we commenced the process to terminate
The Charles River Laboratories, Inc. Pension Plan (
U.S. Pension Plan) and expect to complete the termination process over the next
two
years. As part of the planned termination, we re-balanced assets to a target asset allocation of 100% fixed income investments. The change in U.S. Pension Plan investments is intended to provide for a better matching of assets to the characteristics of the liabilities. We intend to take further actions to reduce the volatility of the value of pension assets relative to pension liabilities and to settle remaining liabilities. This includes making such contributions to the U.S. Pension Plan as may be necessary to settle all liabilities, including making lump sum distributions to U.S. Pension Plan participants and purchasing annuity contracts to cover vested benefits for participants who decline to elect a lump sum distribution.
Stock-Based Compensation
We grant stock options, restricted stock, restricted stock units (RSUs), and performance share units (PSUs) to employees, and stock options, restricted stock, and RSUs to non-employee directors under stock-based compensation plans. We make certain assumptions in order to value and record expense associated with awards made under our stock-based compensation arrangements. Changes in these assumptions may lead to variability with respect to the timing and amount of expense we recognize in connection with share-based payments. Stock-based compensation is recognized as an expense in the consolidated statements of income based on the grant date fair value, adjusted for forfeitures when they occur, over the requisite service period.
Determining the appropriate valuation model and related assumptions requires judgment. The fair value of stock options granted is calculated using the Black-Scholes option-pricing model and the fair value of PSUs is estimated using a lattice model with a Monte Carlo simulation, both of which require the use of subjective assumptions including volatility and expected term, among others.
Determining the appropriate amount to expense based on the anticipated achievement of PSU’s performance targets requires judgment, including forecasting the achievement of future financial targets. The estimate of expense is revised periodically based on the probability of achieving the required performance targets. The cumulative impact of any changes to our estimates is reflected in the period of change.
New Accounting Pronouncements
For a discussion of new accounting pronouncements, refer to Note 1, “Description of Business and Summary of Significant Accounting Policies” to our consolidated financial statements contained in Item 8,
“Financial Statements and Supplementary Data,”
in this Annual Report on Form 10-K.
37
Results of Operations
Fiscal Year
2018
Compared to Fiscal Year
2017
Revenue and Operating Income
The following tables present consolidated revenue by type and by reportable segment:
|
Fiscal Year
|
||||||||||||||
|
2018
|
2017
|
$ change
|
% change
|
|||||||||||
|
(in millions, except percentages)
|
||||||||||||||
|
Service revenue
|
$
|
1,687.9
|
|
$
|
1,298.3
|
|
$
|
389.6
|
|
30.0
|
%
|
|||
|
Product revenue
|
578.2
|
|
559.3
|
|
18.9
|
|
3.4
|
%
|
||||||
|
Total revenue
|
$
|
2,266.1
|
|
$
|
1,857.6
|
|
$
|
408.5
|
|
22.0
|
%
|
|||
|
Fiscal Year
|
|||||||||||||||||
|
2018
|
2017
|
$ change
|
% change
|
Impact of FX
|
|||||||||||||
|
(in millions, except percentages)
|
|||||||||||||||||
|
RMS
|
$
|
519.7
|
|
$
|
493.6
|
|
$
|
26.1
|
|
5.3
|
%
|
1.6
|
%
|
||||
|
DSA
|
1,316.9
|
|
980.0
|
|
336.9
|
|
34.4
|
%
|
1.1
|
%
|
|||||||
|
Manufacturing
|
429.5
|
|
384.0
|
|
45.5
|
|
11.9
|
%
|
1.4
|
%
|
|||||||
|
Total revenue
|
$
|
2,266.1
|
|
$
|
1,857.6
|
|
$
|
408.5
|
|
22.0
|
%
|
1.3
|
%
|
||||
The following table presents operating income by reportable segment:
|
Fiscal Year
|
||||||||||||||
|
2018
|
2017
|
$ change
|
% change
|
|||||||||||
|
(in millions, except percentages)
|
||||||||||||||
|
RMS
|
$
|
136.5
|
|
$
|
114.6
|
|
$
|
21.9
|
|
19.1
|
%
|
|||
|
DSA
|
227.6
|
|
182.8
|
|
44.8
|
|
24.5
|
%
|
||||||
|
Manufacturing
|
136.2
|
|
123.9
|
|
12.3
|
|
9.9
|
%
|
||||||
|
Unallocated corporate
|
(168.9
|
)
|
(133.0
|
)
|
(35.9
|
)
|
27.0
|
%
|
||||||
|
Total operating income
|
$
|
331.4
|
|
$
|
288.3
|
|
$
|
43.1
|
|
15.0
|
%
|
|||
The following presents the results from operating income by each of our reportable segments:
RMS
|
Fiscal Year
|
|||||||||||||||||
|
2018
|
2017
|
$ change
|
% change
|
Impact of FX
|
|||||||||||||
|
(in millions, except percentages)
|
|||||||||||||||||
|
Revenue
|
$
|
519.7
|
|
$
|
493.6
|
|
$
|
26.1
|
|
5.3
|
%
|
1.6
|
%
|
||||
|
Cost of revenue (excluding amortization of intangible assets)
|
319.8
|
|
317.1
|
|
2.7
|
|
0.9
|
%
|
|||||||||
|
Selling, general and administrative
|
61.8
|
|
60.2
|
|
1.6
|
|
2.7
|
%
|
|||||||||
|
Amortization of intangible assets
|
1.6
|
|
1.7
|
|
(0.1
|
)
|
(5.4
|
)%
|
|||||||||
|
Operating income
|
$
|
136.5
|
|
$
|
114.6
|
|
$
|
21.9
|
|
19.1
|
%
|
||||||
|
Operating income % of revenue
|
26.3
|
%
|
23.2
|
%
|
|
|
3.1
|
%
|
|||||||||
RMS revenue
increased
$26.1 million
due primarily to higher research model product revenue in China and higher revenue for research model services. Research model services benefited from a large government contract in the IS business and strong client demand in the GEMS business resulting from increased research and development activity conducted across biotechnology, global biopharmaceutical, and academic institutional clients, and the effect of changes in foreign currency exchange rates; partially offset by lower research model product revenue outside of China.
RMS operating income increased
$21.9 million
compared to the corresponding period in
2017
. RMS operating income as a percentage of revenue for fiscal year
2018
was
26.3%
, an increase of
3.1%
from
23.2%
for the corresponding period in
2017
. Operating income and operating income as a percentage of revenue increased due primarily to lower amount of costs associated
38
with the realignment of our research model production site in Maryland in 2018 compared to 2017. Restructuring costs (recorded primarily within cost of revenue) incurred during 2017 were
$18.1 million
, which primarily related to non-cash asset impairments and accelerated depreciation charges. Restructuring costs incurred during 2018 were
$2.0 million
, which primarily related to cash payments for severance and transition costs. Additionally, operating income and operating income as a percentage of revenue increased due to the increased revenue discussed above; partially offset by continued investments to support future growth, including increased investments in personnel (staffing levels and hourly wage increases), and facility expansions (primarily in China) as well as lower operating income margins on the aforementioned large government contract.
DSA
|
Fiscal Year
|
|||||||||||||||||
|
2018
|
2017
|
$ change
|
% change
|
Impact of FX
|
|||||||||||||
|
(in millions, except percentages)
|
|||||||||||||||||
|
Revenue
|
$
|
1,316.9
|
|
$
|
980.0
|
|
$
|
336.9
|
|
34.4
|
%
|
1.1
|
%
|
||||
|
Cost of revenue (excluding amortization of intangible assets)
|
903.9
|
|
661.7
|
|
242.2
|
|
36.6
|
%
|
|||||||||
|
Selling, general and administrative
|
131.2
|
|
105.6
|
|
25.6
|
|
24.3
|
%
|
|||||||||
|
Amortization of intangible assets
|
54.2
|
|
29.9
|
|
24.3
|
|
81.4
|
%
|
|||||||||
|
Operating income
|
$
|
227.6
|
|
$
|
182.8
|
|
$
|
44.8
|
|
24.5
|
%
|
||||||
|
Operating income % of revenue
|
17.3
|
%
|
18.7
|
%
|
(1.4
|
)%
|
|||||||||||
DSA revenue
increased
$336.9 million
due primarily to the recent acquisitions of MPI Research, KWS BioTest, and Brains On-Line, which contributed
$209.5 million
, $8.6 million and $6.0 million to service revenue growth, respectively. Additionally, service revenue increased in both the Safety Assessment and Discovery Services businesses due to demand from both biotechnology and global biopharmaceutical clients and favorable pricing and mix of services. The effect of changes in foreign currency exchange rates also increased revenue.
DSA operating income increased
$44.8 million
compared to the corresponding period in
2017
. DSA operating income as a percentage of revenue for fiscal year
2018
was
17.3%
, a decrease of
1.4%
from
18.7%
for the corresponding period in
2017
. The increase to operating income was primarily attributable to contributions from recent acquisitions of MPI Research, KWS BioTest, and Brains On-Line. These increases were partially offset by increased costs to support the growth of the Company, which include costs due to the acquisitions, including a higher service cost base, an increase in compensation, benefits, and other employee-related expenses recorded within both cost of revenue and selling, general, and administrative expense, and higher amortization of intangible assets as substantially all of our acquisitions in fiscal year
2018
are included within the DSA reportable segment. These increased costs collectively decreased operating income as a percentage of revenue in
2018
compared to
2017
.
Manufacturing
|
Fiscal Year
|
|||||||||||||||||
|
2018
|
2017
|
$ change
|
% change
|
Impact of FX
|
|||||||||||||
|
(in millions, except percentages)
|
|||||||||||||||||
|
Revenue
|
$
|
429.5
|
|
$
|
384.0
|
|
$
|
45.5
|
|
11.9
|
%
|
1.4
|
%
|
||||
|
Cost of revenue (excluding amortization of intangible assets)
|
202.3
|
|
177.8
|
|
24.5
|
|
13.8
|
%
|
|||||||||
|
Selling, general and administrative
|
82.0
|
|
72.5
|
|
9.5
|
|
13.0
|
%
|
|||||||||
|
Amortization of intangible assets
|
9.0
|
|
9.8
|
|
(0.8
|
)
|
(7.9
|
)%
|
|||||||||
|
Operating income
|
$
|
136.2
|
|
$
|
123.9
|
|
$
|
12.3
|
|
9.9
|
%
|
||||||
|
Operating income % of revenue
|
31.7
|
%
|
32.3
|
%
|
(0.6
|
)%
|
|||||||||||
Manufacturing revenue
increased
$45.5 million
due primarily to higher demand for endotoxin products and species identification services in the Microbial Solutions business, higher service revenue in the Biologics business, higher product revenue in the Avian business, and the effect of changes in foreign currency exchange rates; partially offset by the absence of $1.8 million of service revenue related to the CDMO business.
Manufacturing operating income increased
$12.3 million
compared to the corresponding period in
2017
. Manufacturing operating income as a percentage of revenue for fiscal year
2018
was
31.7%
, a decrease of
0.6%
from
32.3%
for the corresponding period in
2017
. The increase to operating income was due primarily to the increase in revenue. This increase was partially offset by increased costs to support the growth of the Company, including increased investments in personnel (staffing
39
levels and hourly wage increase), facility expansions (primarily in Microbial Solutions and Biologics), and increased investments in technology to support research and development efforts (primarily in Microbial Solutions). Increased costs are recorded in cost of revenue and selling, general, and administrative expenses and these higher costs decreased operating income as a percentage of revenue in
2018
compared to
2017
.
Unallocated Corporate
|
Fiscal Year
|
||||||||||||||
|
2018
|
2017
|
$ change
|
% change
|
|||||||||||
|
(in millions, except percentages)
|
||||||||||||||
|
Unallocated corporate
|
$
|
168.9
|
|
$
|
133.0
|
|
$
|
35.9
|
|
27.0
|
%
|
|||
Unallocated corporate costs consist of selling, general and administrative expenses that are not directly related or allocated to the reportable segments. The increase in unallocated corporate costs of
$35.9 million
is consistent with the allocated
selling, general, and administrative expense
increases discussed above and are primarily related to an increase in compensation, benefits, and other employee-related expenses and an increase in costs associated with the evaluation and integration of our recent acquisitions to support the growth of the Company.
Costs as a percentage of revenue for fiscal year
2018
was
7.5%
,
an increase
of
0.3%
from
7.2%
for the corresponding period in
2017
.
Interest Income
Interest income, which represents earnings on cash, cash equivalents, and time deposits remained consistent at
$0.8 million
and
$0.7 million
for fiscal years
2018
and
2017
, respectively.
Interest Expense
Interest expense for fiscal year
2018
was
$63.8 million
,
an increase
of
$34.0 million
, or
114.2%
, compared to
$29.8 million
for fiscal year
2017
. The increase was due primarily to higher debt to fund our recent acquisitions.
Other Income, Net
Other income, net, was
$13.3 million
for fiscal year
2018
,
a decrease
of
$24.5 million
, or
64.9%
, compared to
$37.8 million
for fiscal year
2017
. The decrease in other income, net was driven by a decrease of
$7.0 million
in gains recognized related to our venture capital investments, a decrease of $6.0 million in gains related to certain life insurance policies, and the absence of a $10.6 million gain recognized as a result of the CDMO business.
Income Taxes
Income tax expense
was
$54.5 million
for fiscal year
2018
,
a decrease
of
$116.9 million
, compared to
$171.4 million
for fiscal year
2017
.
Our effective tax rate was
19.3%
for fiscal year
2018
, compared to
57.7%
for fiscal year
2017
. The decrease was primarily driven by the net effects of U.S. Tax Reform, including the reduction of the U.S. federal statutory tax rate from 35% in 2017 to 21% in 2018, as well as the impact of the one-time Transition Tax and change of our assertion of indefinite reinvestment of foreign earnings in 2017. In addition, 2017 includes the impact of the gain on the divestiture of the CDMO business.
Fiscal Year
2017
Compared to Fiscal Year
2016
Revenue and Operating Income
The following tables present consolidated revenue by type and by reportable segment:
|
Fiscal Year
|
||||||||||||||
|
2017
|
2016
|
$ change
|
% change
|
|||||||||||
|
(in millions, except percentages)
|
||||||||||||||
|
Service revenue
|
$
|
1,298.3
|
|
$
|
1,130.7
|
|
$
|
167.6
|
|
14.8
|
%
|
|||
|
Product revenue
|
559.3
|
|
550.7
|
|
8.6
|
|
1.6
|
%
|
||||||
|
Total revenue
|
$
|
1,857.6
|
|
$
|
1,681.4
|
|
$
|
176.2
|
|
10.5
|
%
|
|||
|
Fiscal Year
|
|||||||||||||||||
|
2017
|
2016
|
$ change
|
% change
|
Impact of FX
|
|||||||||||||
|
(in millions, except percentages)
|
|||||||||||||||||
|
RMS
|
$
|
493.6
|
|
$
|
494.0
|
|
$
|
(0.4
|
)
|
(0.1
|
)%
|
(0.2
|
)%
|
||||
|
DSA
|
980.0
|
|
836.6
|
|
143.4
|
|
17.1
|
%
|
(0.2
|
)%
|
|||||||
|
Manufacturing
|
384.0
|
|
350.8
|
|
33.2
|
|
9.5
|
%
|
0.7
|
%
|
|||||||
|
Total revenue
|
$
|
1,857.6
|
|
$
|
1,681.4
|
|
$
|
176.2
|
|
10.5
|
%
|
0.0
|
%
|
||||
The following table presents operating income by reportable segment:
40
|
Fiscal Year
|
||||||||||||||
|
2017
|
2016
|
$ change
|
% change
|
|||||||||||
|
(in millions, except percentages)
|
||||||||||||||
|
RMS
|
$
|
114.6
|
|
$
|
136.4
|
|
$
|
(21.8
|
)
|
(16.0
|
)%
|
|||
|
DSA
|
182.8
|
|
135.4
|
|
47.4
|
|
35.0
|
%
|
||||||
|
Manufacturing
|
123.9
|
|
104.6
|
|
19.3
|
|
18.5
|
%
|
||||||
|
Unallocated corporate
|
(133.0
|
)
|
(138.8
|
)
|
5.8
|
|
4.2
|
%
|
||||||
|
Total operating income
|
$
|
288.3
|
|
$
|
237.6
|
|
$
|
50.7
|
|
21.3
|
%
|
|||
The following presents the results from operating income by each of our reportable segments:
RMS
|
Fiscal Year
|
|||||||||||||||||
|
2017
|
2016
|
$ change
|
% change
|
Impact of FX
|
|||||||||||||
|
(in millions, except percentages)
|
|||||||||||||||||
|
Revenue
|
$
|
493.6
|
|
$
|
494.0
|
|
$
|
(0.4
|
)
|
(0.1
|
)%
|
(0.2
|
)%
|
||||
|
Cost of revenue (excluding amortization of intangible assets)
|
317.1
|
|
292.8
|
|
24.3
|
|
8.3
|
%
|
|||||||||
|
Selling, general and administrative
|
60.2
|
|
62.5
|
|
(2.3
|
)
|
(3.7
|
)%
|
|||||||||
|
Amortization of intangible assets
|
1.7
|
|
2.3
|
|
(0.6
|
)
|
(26.1
|
)%
|
|||||||||
|
Operating income
|
$
|
114.6
|
|
$
|
136.4
|
|
$
|
(21.8
|
)
|
(16.0
|
)%
|
||||||
|
Operating income % of revenue
|
23.2
|
%
|
27.6
|
%
|
(4.4
|
)%
|
|||||||||||
RMS revenue decreased $0.4 million due to lower research model revenue outside of China, lower service revenue in the RADS business, and the negative effect of changes in foreign currency exchange rates; partially offset by higher research model product revenue in China, and higher research model services revenue attributable to the IS and GEMS businesses.
RMS operating income decreased
$21.8 million
compared to the corresponding period in
2016
. RMS operating income as a percentage of revenue for fiscal year
2017
was
23.2%
, a decrease of
4.4%
from
27.6%
for the corresponding period in
2016
. Operating income and operating income as a percentage of revenue decreased due primarily to higher restructuring costs (recorded primarily within cost of revenue) associated with the planned closure of our production facility in Maryland; increased employee compensation costs to support the growth of the business; and increased facility investments in China.
DSA
|
Fiscal Year
|
|||||||||||||||||
|
2017
|
2016
|
$ change
|
% change
|
Impact of FX
|
|||||||||||||
|
(in millions, except percentages)
|
|||||||||||||||||
|
DSA
|
$
|
980.0
|
|
$
|
836.6
|
|
$
|
143.4
|
|
17.1
|
%
|
(0.2
|
)%
|
||||
|
Cost of revenue (excluding amortization of intangible assets)
|
661.7
|
|
575.1
|
|
86.6
|
|
15.1
|
%
|
|||||||||
|
Selling, general and administrative
|
105.6
|
|
98.3
|
|
7.3
|
|
7.4
|
%
|
|||||||||
|
Amortization of intangible assets
|
29.9
|
|
27.8
|
|
2.1
|
|
7.6
|
%
|
|||||||||
|
Operating income
|
$
|
182.8
|
|
$
|
135.4
|
|
$
|
47.4
|
|
35.0
|
%
|
||||||
|
Operating income % of revenue
|
18.7
|
%
|
16.2
|
%
|
2.5
|
%
|
|||||||||||
DSA revenue increased $143.4 million due primarily to increased demand from mid-tier biotechnology clients and global biopharmaceuticals clients. The Safety Assessment business had higher service revenue as a result of the WIL Research acquisition, which contributed $62.5 million to service revenue growth, as well as growth of the legacy business, including favorable volume, mix of services, and pricing; and the Discovery Services business had higher service revenue, primarily as a result of the acquisitions of Agilux and Brains On-Line that contributed $28.6 million and $4.9 million to service revenue growth, respectively; partially offset by the negative effect of changes in foreign currency exchange rates.
DSA operating income increased
$47.4 million
compared to the corresponding period in
2016
. DSA operating income as a percentage of revenue for fiscal year
2017
was
18.7%
, an increase of
2.5%
from
16.2%
for the corresponding period in
2016
. The increase to operating income was due primarily to the contributions from the acquisitions of WIL Research, Agilux, and Brains On-line. The increase in operating income as a percentage of revenue resulted from the lower restructuring costs
41
compared to costs incurred in 2016 associated with site consolidations to help improve productivity, lower acquisition costs compared to 2016; partially offset by increased costs to support the growth of the business primarily relating to compensation, benefits, and other employee-related expenses.
Manufacturing
|
Fiscal Year
|
|||||||||||||||||
|
2017
|
2016
|
$ change
|
% change
|
Impact of FX
|
|||||||||||||
|
(in millions, except percentages)
|
|||||||||||||||||
|
Revenue
|
$
|
384.0
|
|
$
|
350.8
|
|
$
|
33.2
|
|
9.5
|
%
|
0.7
|
%
|
||||
|
Cost of revenue (excluding amortization of intangible assets)
|
177.8
|
|
169.5
|
|
8.3
|
|
4.9
|
%
|
|||||||||
|
Selling, general and administrative
|
72.5
|
|
65.1
|
|
7.4
|
|
11.4
|
%
|
|||||||||
|
Amortization of intangible assets
|
9.8
|
|
11.6
|
|
(1.8
|
)
|
(15.5
|
)%
|
|||||||||
|
Operating income
|
$
|
123.9
|
|
$
|
104.6
|
|
$
|
19.3
|
|
18.5
|
%
|
||||||
|
Operating income % of revenue
|
32.3
|
%
|
29.8
|
%
|
2.5
|
%
|
|||||||||||
Manufacturing revenue increased $33.2 million due primarily to higher demand for endotoxin products in the Microbial Solutions business; increased demand in the Biologics business, which included the acquisition of Blue Stream that contributed $3.5 million to service revenue growth; and positive effect of changes in foreign current exchange rates; partially offset by the absence of $10.9 million of service revenue related to the CDMO business; and lower product revenue in the Avian business.
Manufacturing operating income increased
$19.3 million
compared to the corresponding period in
2016
. Manufacturing operating income as a percentage of revenue for fiscal year
2017
was
32.3%
, an increase of
2.5%
from
29.8%
for the corresponding period in
2016
. The increase to operating income and operating income as a percentage of revenue was due primarily to the increase in revenue; partially offset by increased costs to support the growth of the business including an increase in compensation, benefits, and other employee-related expenses.
Unallocated Corporate
|
Fiscal Year
|
||||||||||||||
|
2017
|
2016
|
$ change
|
% change
|
|||||||||||
|
(in millions, except percentages)
|
||||||||||||||
|
Unallocated corporate
|
$
|
133.0
|
|
$
|
138.8
|
|
$
|
(5.8
|
)
|
(4.2
|
)%
|
|||
The decrease in unallocated corporate costs of
$5.8 million
was primarily related to a decrease in costs associated with the evaluation and integration of acquisitions, and decrease in information technology infrastructure related expenses; partially offset by an increase in compensation, benefits, and other employee-related expenses. Costs as a percentage of revenue for fiscal year
2017
was
7.2%
, a decrease of 1.1% from 8.3% for the corresponding period in
2016
.
Interest Income
Interest income, which represents earnings on cash, cash equivalents, and time deposits was $0.7 million for fiscal year 2017, a decrease of $0.6 million, or 47.5%, compared to $1.3 million for fiscal year 2016.
Interest Expense
Interest expense for fiscal year 2017 was $29.8 million, an increase of $2.1 million, or 7.5%, compared to $27.7 million for fiscal year 2016. The increase was due primarily to higher average balances outstanding and higher average interest rates under our $1.65B Credit Facility; partially offset by the increase in fiscal year 2016 attributed to the write-off of a portion of debt issuance costs in connection with the modification of our prior $1.3B Credit Facility.
Other Income, Net
Other income, net, was $37.8 million for fiscal year 2017, an increase of $26.0 million, or 221.0%, compared to $11.8 million for fiscal year 2016. The increase in other income, net was driven by an increase of $12.6 million in gains recognized related to our venture capital investments, a $10.6 million gain recognized as a result of the divestiture of the CDMO business, and higher net gains on life insurance policy investments of $2.0 million.
Income Taxes
Income tax expense
was $171.4 million for fiscal year 2017, an increase of $104.6 million, compared to $66.8 million for fiscal year 2016
.
Our effective tax rate was 57.7% for fiscal year 2017, compared to 30.0% for fiscal year 2016. The increase was primarily driven by the one-time Transition Tax mandated by U.S. Tax Reform, the change of our assertion of indefinite reinvestment of foreign earnings, and a gain on the divestiture of the CDMO business. These increases are net of decreases relating to the excess tax benefits from stock-based compensation due to the adoption of ASU 2016-09, as well as the revaluation of U.S. net deferred tax liabilities to 21% based on enacted U.S. Tax Reform.
42
Liquidity and Capital Resources
We currently require cash to fund our working capital needs, capital expansion, acquisitions, and to pay our debt and pension obligations. Our principal sources of liquidity have been our cash flows from operations, supplemented by long-term borrowings. Based on our current business plan, we believe that our existing funds, when combined with cash generated from operations and our access to financing resources, are sufficient to fund our operations for the foreseeable future.
The following table presents our cash, cash equivalents and investments:
|
December 29, 2018
|
December 30, 2017
|
||||||
|
(in millions)
|
|||||||
|
Cash and cash equivalents:
|
|||||||
|
Held in U.S. entities
|
$
|
67.3
|
|
$
|
30.6
|
|
|
|
Held in non-U.S. entities
|
128.1
|
|
133.2
|
|
|||
|
Total cash and cash equivalents
|
195.4
|
|
163.8
|
|
|||
|
Investments:
|
|||||||
|
Held in non-U.S. entities
|
0.9
|
|
28.5
|
|
|||
|
Total cash, cash equivalents and investments
|
$
|
196.3
|
|
$
|
192.3
|
|
|
Borrowings
On March 26, 2018, we amended and restated our $1.65 billion credit facility, creating our $2.3B Credit Facility which extended the maturity date for the credit facility. The $2.3B Credit Facility provides for a $750.0 million term loan and a $1.55 billion multi-currency revolving facility. The term loan facility matures in 19 quarterly installments with the last installment due March 26, 2023. The revolving facility matures on March 26, 2023, and requires no scheduled payment before that date.
On April 3, 2018, we entered into an indenture (Indenture) with MUFG Union Bank, N.A., in connection with the offering of $500.0 million in aggregate principal amount of the Company’s 5.5% Senior Notes (Senior Notes) due in 2026 in an unregistered offering. Under the terms of the Indenture, interest on the Senior Notes is payable semi-annually on April 1 and October 1 of each year, beginning on October 1, 2018.
Amounts outstanding under our credit facilities and Senior Notes were as follows:
|
December 29, 2018
|
December 30, 2017
|
||||||
|
(in millions)
|
|||||||
|
Term loans
|
$
|
731.3
|
|
$
|
601.3
|
|
|
|
Revolving facility
|
397.5
|
|
501.0
|
|
|||
|
Senior Notes
|
500.0
|
|
—
|
|
|||
|
Total
|
$
|
1,628.8
|
|
$
|
1,102.3
|
|
|
Under specified circumstances, we have the ability to increase the term loan and/or revolving facility by up to $1.0 billion in the aggregate. The interest rates applicable to the term loan and revolving facility under the $2.3B Credit Facility are, at our option, equal to either the base rate (which is the higher of (1) the prime rate, (2) the federal funds rate plus 0.50%, or (3) the one-month adjusted LIBOR rate plus 1.0%) or the adjusted LIBOR rate, plus an interest rate margin based upon our leverage ratio.
The intended acquisition of Citoxlab along with the associated fees are expected to be financed through our existing revolving credit facility and cash.
Repurchases of Common Stock
On
May 9, 2017
, our Board of Directors increased the stock repurchase authorization by
$150.0 million
, to an aggregate amount of
$1.3 billion
. During fiscal year
2018
, we did not repurchase any shares under our authorized stock repurchase program. As of
December 29, 2018
, we had
$129.1 million
remaining on the authorized stock repurchase program.
Our stock-based compensation plans permit the netting of common stock upon vesting of restricted stock,
restricted stock units, and performance share units
in order to satisfy individual statutory tax withholding requirements. During fiscal year
2018
, we acquired
0.1 million
shares for
$13.8 million
through such netting.
43
Cash Flows
The following table presents our net cash provided by operating activities:
|
Fiscal Year
|
|||||||||||
|
2018
|
2017
|
2016
|
|||||||||
|
(in millions)
|
|||||||||||
|
Income from continuing operations
|
$
|
227.2
|
|
$
|
125.6
|
|
$
|
156.1
|
|
||
|
Adjustments to reconcile net income from continuing operations to net cash provided by operating activities
|
199.1
|
|
186.6
|
|
174.3
|
|
|||||
|
Changes in assets and liabilities
|
14.8
|
|
5.9
|
|
(13.5
|
)
|
|||||
|
Net cash provided by operating activities
|
$
|
441.1
|
|
$
|
318.1
|
|
$
|
316.9
|
|
||
Net cash provided by cash flows from operating activities represents the cash receipts and disbursements related to all of our activities other than investing and financing activities. Operating cash flow is derived by adjusting our income from continuing operations for (1) non-cash operating items such as depreciation and amortization, stock-based compensation, deferred income taxes, gains on venture capital investments and divestiture, and impairment charges, as well as (2) changes in operating assets and liabilities, which reflect timing differences between the receipt and payment of cash associated with transactions and when they are recognized in our results of operations. Net cash provided by operating activities increased from fiscal year
2017
to
2018
. The increase was primarily driven by an increase in income from continuing operations and positive changes in operating assets and liabilities resulting from an increase in our deferred revenue (primarily due to a one-time up-front payment received in connection with a strategic agreement), an increase in customer contract deposits, as well as improved collections of our receivables. The increase in net cash provided by operating activities from fiscal year
2016
to
2017
was primarily driven by positive changes in operating assets and liabilities due to the recognition of a tax payable in connection with U.S. Tax Reform, and the timing of our accounts payable and accrued compensation payments. These increases were partially offset by a decrease in income from continuing operations.
The following table presents our net cash used in investing activities:
|
Fiscal Year
|
|||||||||||
|
2018
|
2017
|
2016
|
|||||||||
|
(in millions)
|
|||||||||||
|
Acquisition of businesses and assets, net of cash acquired
|
$
|
(824.9
|
)
|
$
|
(25.0
|
)
|
$
|
(648.5
|
)
|
||
|
Capital expenditures
|
(140.1
|
)
|
(82.4
|
)
|
(55.3
|
)
|
|||||
|
Investments, net
|
10.7
|
|
(37.2
|
)
|
7.4
|
|
|||||
|
Proceeds from divestiture
|
—
|
|
72.5
|
|
—
|
|
|||||
|
Other, net
|
(0.7
|
)
|
(0.5
|
)
|
3.7
|
|
|||||
|
Net cash used in investing activities
|
$
|
(955.0
|
)
|
$
|
(72.6
|
)
|
$
|
(692.7
|
)
|
||
The primary use of cash used in investing activities in fiscal year
2018
related to our acquisitions of MPI Research and KWS BioTest, and our capital expenditures to support the growth of the business; partially offset by proceeds from net investments, which primarily relate to short-term investments held by our U.K. operations. The primary use of cash in fiscal year
2017
related to our capital expenditures to support the growth of the business, net investment activity, and our acquisition of Brains On-Line, partially offset by the proceeds from the divestiture of the CDMO business. The primary use of cash in fiscal year
2016
related to our acquisitions of WIL Research for $577.4 million, net of cash acquired; Agilux for $62.0 million, net of cash acquired; and Blue Stream for $8.7 million, net of cash acquired; as well as our capital expenditures; partially offset by proceeds from net investments.
44
The following table presents our net cash provided by (used in) financing activities:
|
Fiscal Year
|
|||||||||||
|
2018
|
2017
|
2016
|
|||||||||
|
(in millions)
|
|||||||||||
|
Proceeds from long-term debt and revolving credit facility
|
$
|
2,755.0
|
|
$
|
236.8
|
|
$
|
1,044.7
|
|
||
|
Proceeds from exercises of stock options
|
37.7
|
|
38.9
|
|
23.2
|
|
|||||
|
Payments on long-term debt, revolving credit facility, and capital lease obligations
|
(2,201.0
|
)
|
(372.4
|
)
|
(656.6
|
)
|
|||||
|
Payments on debt financing costs
|
(18.3
|
)
|
—
|
|
(3.7
|
)
|
|||||
|
Purchase of treasury stock
|
(13.8
|
)
|
(106.9
|
)
|
(12.3
|
)
|
|||||
|
Other, net
|
(1.5
|
)
|
(4.9
|
)
|
(14.5
|
)
|
|||||
|
Net cash provided by (used in) financing activities
|
$
|
558.1
|
|
$
|
(208.5
|
)
|
$
|
380.8
|
|
||
For fiscal year
2018
, net cash provided by financing activities reflected the incremental proceeds from the refinancing of our previous $1.65 Billion Credit Facility to the $2.3 Billion Credit Facility and the proceeds from our $500.0 million Senior Notes. Subsequent to refinancing our $2.3 Billion Credit Facility, we repaid
€
300 million of our revolving facility borrowed by a non-U.S. Euro functional currency entity and replaced the borrowing with a
$343.3 million
U.S. dollar denominated loan. A forward currency contract was then executed to mitigate any foreign currency gains or losses on the
$343.3 million
U.S. dollar denominated loan. Additionally, proceeds from exercises of employee stock options of
$37.7 million
; partially offset by payments on debt financing costs of
$18.3 million
, and treasury stock purchases of
$13.8 million
made due to the netting of common stock upon vesting of stock-based awards in order to satisfy individual statutory tax withholding requirements. For fiscal year
2017
, cash used in financing activities reflected net payments of $135.6 million on long-term debt, revolving credit facility, and capital lease obligations; and treasury stock purchases of $106.9 million made pursuant to our authorized stock repurchase program and the netting of common stock upon vesting of stock-based awards in order to satisfy individual statutory tax withholding requirements; partially offset by proceeds from exercises of employee stock options of $38.9 million. For fiscal year
2016
, cash provided by financing activities reflected net borrowings of $388.0 million and proceeds from exercises of employee stock options of $23.2 million; partially offset by treasury stock purchases of $12.3 million due to the netting of common stock upon vesting of stock-based awards in order to satisfy individual statutory tax withholding requirements and other activity.
Contractual Commitments and Obligations
Minimum future payments of our contractual obligations as of
December 29, 2018
are as follows:
|
Payments Due by Period
|
|||||||||||||||||||
|
Total
|
Less than
1 Year |
1 - 3 Years
|
3 - 5 Years
|
More Than
5 Years |
|||||||||||||||
|
(in millions)
|
|||||||||||||||||||
|
Notes payable
(1)
|
$
|
1,628.8
|
|
$
|
28.2
|
|
$
|
103.1
|
|
$
|
997.5
|
|
$
|
500.0
|
|
||||
|
Operating leases
(2)
|
170.1
|
|
25.4
|
|
43.9
|
|
33.9
|
|
66.9
|
|
|||||||||
|
Capital leases
|
40.1
|
|
4.0
|
|
6.6
|
|
5.2
|
|
24.3
|
|
|||||||||
|
Redeemable noncontrolling interest
(3)
|
18.5
|
|
18.5
|
|
—
|
|
—
|
|
—
|
|
|||||||||
|
Venture capital investment commitments
(4)
|
55.7
|
|
39.8
|
|
15.9
|
|
|
|
—
|
|
|||||||||
|
Contingent payments
(5)
|
17.7
|
|
3.7
|
|
14.0
|
|
—
|
|
—
|
|
|||||||||
|
Unconditional purchase obligations
(6)
|
145.9
|
|
106.7
|
|
27.9
|
|
11.3
|
|
—
|
|
|||||||||
|
Total contractual cash obligations
|
$
|
2,076.8
|
|
$
|
226.3
|
|
$
|
211.4
|
|
$
|
1,047.9
|
|
$
|
591.2
|
|
||||
|
(1)
|
Notes payable includes the principal payments on our debt, which include our $2.3B Credit Facility and our Senior Notes.
|
|
(2)
|
We lease properties and equipment for use in our operations. In addition to rent, the leases may require us to pay additional amounts for taxes, insurance, maintenance, and other operating expenses. Amounts reflected within the table detail future minimum rental commitments under non-cancellable operating leases, net of income from subleases, for each of the periods presented.
|
|
(3)
|
The estimated cash obligation for redeemable noncontrolling interest is based on the amount that would be paid if settlement occurred as of the balance sheet date based on the contractually defined redemption value as of
December 29, 2018
.
|
|
(4)
|
The timing of the remaining capital commitment payments to venture capital funds is subject to the procedures of the limited liability partnerships and limited liability companies; the above table reflects the earliest possible date the payment can be required under the relevant agreements.
|
|
(5)
|
In connection with certain business and asset acquisitions, we agreed to make additional payments aggregating to
$17.7 million
based upon the achievement of certain financial targets in connection with each acquisition. The contingent payment obligations included in the table above have not been probability adjusted or discounted.
|
45
|
(6)
|
Unconditional purchase obligations include agreements to purchase goods or services that are enforceable and legally binding and that specify all significant terms, including fixed or minimum quantities to be purchased, fixed, minimum or variable price provisions, and the approximate timing of the transaction. Purchase obligations exclude agreements that are cancellable at any time without penalty.
|
The above table excludes obligations related to our pension and other post-retirement benefit plans. Refer to Item 8, “Financial Statements and Supplementary Data,” in this Annual Report on Form 10-K for more details.
Tax Related Obligations
We excluded liabilities pertaining to uncertain tax positions from our summary of contractual obligations presented above, as we cannot make a reliable estimate of the period of cash settlement with the respective taxing authorities. As of
December 29, 2018
, we had
$18.8 million
of liabilities associated with uncertain tax positions.
Additionally, we excluded federal and state income tax liabilities of
$52.1 million
from our summary of contractual obligations presented above, relating to the one-time Transition Tax on unrepatriated earnings under U.S. Tax Reform. The Transition Tax will be paid over an eight-year period which started in 2018 and will not accrue interest.
Off-Balance Sheet Arrangements
As of
December 29, 2018
, we did not have any significant off-balance sheet arrangements, as defined in Item 303(a)(4)(ii) of SEC Regulation S-K promulgated under the Exchange Act, except as disclosed below.
Citoxlab
On February 13, 2019, we announced that we signed a
binding offer to acquire Citoxlab.
In the event the agreement is terminated under specified circumstances, we may be required to pay a termination fee of
€18.2 million
. Refer to Item 8. “Financial Statements and Supplementary Data” in this Annual Report on Form 10-K for more details.
Venture Capital Investments
We invest in several venture capital funds that invest in start-up companies, primarily in the life sciences industry. Our total commitment to the funds as of
December 29, 2018
was
$124.7 million
, of which we funded
$69.0 million
through
December 29, 2018
. Refer to
Note 6, “Venture Capital Investments and Marketable Securities,” to our consolidated financial statements contained in Item 8,
“Financial Statements and Supplementary Data,”
in this Annual Report on Form 10-K for further details.
Letters of Credit
Our off-balance sheet commitments related to our outstanding letters of credit as of
December 29, 2018
were
$6.5 million
.
Item 7A. Quantitative and Qualitative Disclosures about Market Risk
We are exposed to market risk from changes in interest rates and currency exchange rates, which could affect our future results of operations and financial condition. We manage our exposure to these risks through our regular operating and financing activities.
Interest Rate Risk
We are exposed to changes in interest rates while conducting normal business operations as a result of ongoing financing activities. As of
December 29, 2018
, our debt portfolio was comprised primarily of floating interest rate borrowings. A 100-basis point increase in interest rates would increase our annual pre-tax interest expense by
$11.3 million
.
Foreign Currency Exchange Rate Risk
We operate on a global basis and have exposure to some foreign currency exchange rate fluctuations for our financial position, results of operations, and cash flows.
While the financial results of our global activities are reported in U.S. dollars, our foreign subsidiaries typically conduct their operations in their respective local currency. The principal functional currencies of the Company’s foreign subsidiaries are the Euro, British Pound, Canadian Dollar, Chinese Yuan Renminbi, and Japanese Yen. During fiscal year
2018
, the most significant drivers of foreign currency translation adjustment the Company recorded as part of other comprehensive income (loss) were the Euro, British Pound, Canadian Dollar, and Chinese Yuan Renminbi.
Fluctuations in the foreign currency exchange rates of the countries in which we do business will affect our financial position, results of operations, and cash flows. As the U.S. dollar strengthens against other currencies, the value of our non-U.S. revenue, expenses, assets, liabilities, and cash flows will generally decline when reported in U.S. dollars. The impact to net income as a result of a U.S. dollar strengthening will be partially mitigated by the value of non-U.S. expenses, which will decline when reported in U.S. dollars. As the U.S. dollar weakens versus other currencies, the value of the non-U.S. revenue, expenses, assets, liabilities, and cash flows will generally increase when reported in U.S. dollars. For fiscal year
2018
, our revenue would
46
have increased by approximately
$81.8 million
and our operating income would have increased by approximately
$7.0 million
, if the U.S. dollar exchange rate had strengthened by 10%, with all other variables held constant.
We attempt to minimize this exposure by using certain financial instruments in accordance with our overall risk management and our hedge policy. We do not enter into speculative derivative agreements.
During fiscal year
2018
, we entered into foreign exchange forward contracts to limit our foreign currency exposure related to both intercompany loans and a U.S. dollar denominated loan borrowed by a non-U.S. Euro functional currency entity under our Credit Facility. We did not have any foreign currency contracts open related to intercompany loans as of
December 29, 2018
.
47
Item 8. Financial Statements and Supplementary Data
INDEX TO CONSOLIDATED FINANCIAL STATEMENTS
|
Consolidated Statements of Income for fiscal years 2018, 2017 and 2016
|
|
|
Consolidated Statements of Comprehensive Income for fiscal years 2018, 2017 and 2016
|
|
|
Consolidated Balance Sheets as of December 29, 2018 and December 30, 2017
|
|
|
Consolidated Statements of Cash Flows for fiscal years 2018, 2017 and 2016
|
|
|
Consolidated Statements of Changes in Equity for fiscal years 2018, 2017 and 2016
|
|
48
Report of Independent Registered Public Accounting Firm
To the Board of Directors and Shareholders of Charles River Laboratories International, Inc.:
Opinions on the Financial Statements and Internal Control over Financial Reporting
We have audited the accompanying consolidated balance sheets of Charles River Laboratories International, Inc. and its subsidiaries (the “Company”) as of December 29, 2018 and December 30, 2017, and the related consolidated statements of income, comprehensive income, changes in equity and cash flows for each of the three years in the period ended December 29, 2018, including the related notes (collectively referred to as the “consolidated financial statements”). We also have audited the Company's internal control over financial reporting as of December 29, 2018, based on criteria established in
Internal Control - Integrated Framework (2013)
issued by the Committee of Sponsoring Organizations of the Treadway Commission (COSO).
In our opinion, the consolidated financial statements referred to above present fairly, in all material respects, the financial position of the Company as of December 29, 2018 and December 30, 2017, and the results of its operations and its cash flows for each of the three years in the period ended December 29, 2018 in conformity with accounting principles generally accepted in the United States of America. Also in our opinion, the Company maintained, in all material respects, effective internal control over financial reporting as of December 29, 2018, based on criteria established in
Internal Control - Integrated Framework (2013)
issued by the COSO.
Basis for Opinions
The Company's management is responsible for these consolidated financial statements, for maintaining effective internal control over financial reporting, and for its assessment of the effectiveness of internal control over financial reporting, included in Management's Report on Internal Control over Financial Reporting appearing under Item 9A. Our responsibility is to express opinions on the Company’s consolidated financial statements and on the Company's internal control over financial reporting based on our audits. We are a public accounting firm registered with the Public Company Accounting Oversight Board (United States) (PCAOB) and are required to be independent with respect to the Company in accordance with the U.S. federal securities laws and the applicable rules and regulations of the Securities and Exchange Commission and the PCAOB.
We conducted our audits in accordance with the standards of the PCAOB. Those standards require that we plan and perform the audits to obtain reasonable assurance about whether the consolidated financial statements are free of material misstatement, whether due to error or fraud, and whether effective internal control over financial reporting was maintained in all material respects.
Our audits of the consolidated financial statements included performing procedures to assess the risks of material misstatement of the consolidated financial statements, whether due to error or fraud, and performing procedures that respond to those risks. Such procedures included examining, on a test basis, evidence regarding the amounts and disclosures in the consolidated financial statements. Our audits also included evaluating the accounting principles used and significant estimates made by management, as well as evaluating the overall presentation of the consolidated financial statements. Our audit of internal control over financial reporting included obtaining an understanding of internal control over financial reporting, assessing the risk that a material weakness exists, and testing and evaluating the design and operating effectiveness of internal control based on the assessed risk. Our audits also included performing such other procedures as we considered necessary in the circumstances. We believe that our audits provide a reasonable basis for our opinions.
As described in Management’s Report on Internal Control over Financial Reporting, management has excluded MPI Research and KWS BioTest from its assessment of internal control over financial reporting as of December 29, 2018 because they were acquired by the Company in purchase business combinations during 2018. We have also excluded MPI Research and KWS BioTest from our audit of internal control over financial reporting. MPI Research and KWS BioTest are wholly-owned subsidiaries whose total assets and total revenues excluded from management’s assessment and our audit of internal control over financial reporting represent 5.4% and 9.6% respectively, of the related consolidated financial statement amounts as of and for the year ended December 29, 2018.
Definition and Limitations of Internal Control over Financial Reporting
A company’s internal control over financial reporting is a process designed to provide reasonable assurance regarding the reliability of financial reporting and the preparation of financial statements for external purposes in accordance with generally accepted accounting principles. A company’s internal control over financial reporting includes those policies and procedures that (i) pertain to the maintenance of records that, in reasonable detail, accurately and fairly reflect the transactions and
49
dispositions of the assets of the company; (ii) provide reasonable assurance that transactions are recorded as necessary to permit preparation of financial statements in accordance with generally accepted accounting principles, and that receipts and expenditures of the company are being made only in accordance with authorizations of management and directors of the company; and (iii) provide reasonable assurance regarding prevention or timely detection of unauthorized acquisition, use, or disposition of the company’s assets that could have a material effect on the financial statements.
Because of its inherent limitations, internal control over financial reporting may not prevent or detect misstatements. Also, projections of any evaluation of effectiveness to future periods are subject to the risk that controls may become inadequate because of changes in conditions, or that the degree of compliance with the policies or procedures may deteriorate.
/s/ PricewaterhouseCoopers LLP
Boston, Massachusetts
February 13, 2019
We have served as the Company’s auditor since 1999.
50
CHARLES RIVER LABORATORIES INTERNATIONAL, INC.
CONSOLIDATED STATEMENTS OF INCOME
(in thousands, except per share amounts)
|
|
Fiscal Year
|
||||||||||
|
|
2018
|
2017
|
2016
|
||||||||
|
Service revenue
|
$
|
1,687,941
|
|
$
|
1,298,298
|
|
$
|
1,130,733
|
|
||
|
Product revenue
|
578,155
|
|
559,303
|
|
550,699
|
|
|||||
|
Total revenue
|
2,266,096
|
|
1,857,601
|
|
1,681,432
|
|
|||||
|
Costs and expenses:
|
|
|
|
||||||||
|
Cost of services provided (excluding amortization of intangible assets)
|
1,150,371
|
|
867,014
|
|
760,439
|
|
|||||
|
Cost of products sold (excluding amortization of intangible assets)
|
275,658
|
|
289,669
|
|
277,034
|
|
|||||
|
Selling, general and administrative
|
443,854
|
|
371,266
|
|
364,708
|
|
|||||
|
Amortization of intangible assets
|
64,830
|
|
41,370
|
|
41,699
|
|
|||||
|
Operating income
|
331,383
|
|
288,282
|
|
237,552
|
|
|||||
|
Other income (expense):
|
|
|
|
||||||||
|
Interest income
|
812
|
|
690
|
|
1,314
|
|
|||||
|
Interest expense
|
(63,772
|
)
|
(29,777
|
)
|
(27,709
|
)
|
|||||
|
Other income, net
|
13,258
|
|
37,760
|
|
11,764
|
|
|||||
|
Income from continuing operations, before income taxes
|
281,681
|
|
296,955
|
|
222,921
|
|
|||||
|
Provision for income taxes
|
54,463
|
|
171,369
|
|
66,835
|
|
|||||
|
Income from continuing operations, net of income taxes
|
227,218
|
|
125,586
|
|
156,086
|
|
|||||
|
Income (loss) from discontinued operations, net of income taxes
|
1,506
|
|
(137
|
)
|
280
|
|
|||||
|
Net income
|
228,724
|
|
125,449
|
|
156,366
|
|
|||||
|
Less: Net income attributable to noncontrolling interests
|
2,351
|
|
2,094
|
|
1,601
|
|
|||||
|
Net income attributable to common shareholders
|
$
|
226,373
|
|
$
|
123,355
|
|
$
|
154,765
|
|
||
|
Earnings per common share
|
|
|
|
||||||||
|
Basic:
|
|
|
|
||||||||
|
Continuing operations attributable to common shareholders
|
$
|
4.69
|
|
$
|
2.60
|
|
$
|
3.28
|
|
||
|
Discontinued operations
|
$
|
0.03
|
|
$
|
—
|
|
$
|
0.01
|
|
||
|
Net income attributable to common shareholders
|
$
|
4.72
|
|
$
|
2.60
|
|
$
|
3.29
|
|
||
|
Diluted:
|
|
|
|
||||||||
|
Continuing operations attributable to common shareholders
|
$
|
4.59
|
|
$
|
2.54
|
|
$
|
3.22
|
|
||
|
Discontinued operations
|
$
|
0.03
|
|
$
|
—
|
|
$
|
0.01
|
|
||
|
Net income attributable to common shareholders
|
$
|
4.62
|
|
$
|
2.54
|
|
$
|
3.23
|
|
||
|
Weighted-average number of common shares outstanding:
|
|||||||||||
|
Basic
|
47,947
|
|
47,481
|
|
47,014
|
|
|||||
|
Diluted
|
49,018
|
|
48,564
|
|
47,958
|
|
|||||
|
See Notes to Consolidated Financial Statements.
|
|||||||||||
51
CHARLES RIVER LABORATORIES INTERNATIONAL, INC.
CONSOLIDATED STATEMENTS OF COMPREHENSIVE INCOME
(in thousands)
|
Fiscal Year
|
|||||||||||
|
2018
|
2017
|
2016
|
|||||||||
|
Net income
|
$
|
228,724
|
|
$
|
125,449
|
|
$
|
156,366
|
|
||
|
Other comprehensive income (loss):
|
|||||||||||
|
Foreign currency translation adjustment and other
|
(28,305
|
)
|
78,084
|
|
(73,243
|
)
|
|||||
|
Pension and other post-retirement benefit plans (Note 12):
|
|||||||||||
|
Prior service cost and (losses) gains arising during the period
|
(1,659
|
)
|
36,593
|
|
(60,678
|
)
|
|||||
|
Amortization of net loss and prior service benefit included in net periodic cost for pension and other post-retirement benefit plans
|
2,477
|
|
3,344
|
|
1,711
|
|
|||||
|
Comprehensive income, before income taxes
|
201,237
|
|
243,470
|
|
24,156
|
|
|||||
|
Less: Income tax (benefit) expense related to items of other comprehensive income
(Note 10) |
(1,892
|
)
|
7,954
|
|
(12,369
|
)
|
|||||
|
Comprehensive income, net of income taxes
|
203,129
|
|
235,516
|
|
36,525
|
|
|||||
|
Less: Comprehensive income (loss) related to noncontrolling interests, net of income taxes
|
1,398
|
|
3,128
|
|
(24
|
)
|
|||||
|
Comprehensive income attributable to common shareholders, net of income taxes
|
$
|
201,731
|
|
$
|
232,388
|
|
$
|
36,549
|
|
||
|
See Notes to Consolidated Financial Statements.
|
|||||||||||
52
CHARLES RIVER LABORATORIES INTERNATIONAL, INC.
CONSOLIDATED BALANCE SHEETS
(in thousands, except per share amounts)
|
December 29, 2018
|
December 30, 2017
|
||||||
|
Assets
|
|
|
|||||
|
Current assets:
|
|
|
|||||
|
Cash and cash equivalents
|
$
|
195,442
|
|
$
|
163,794
|
|
|
|
Trade receivables, net
|
472,248
|
|
430,016
|
|
|||
|
Inventories
|
127,892
|
|
114,956
|
|
|||
|
Prepaid assets
|
53,447
|
|
36,544
|
|
|||
|
Other current assets
|
48,807
|
|
81,315
|
|
|||
|
Total current assets
|
897,836
|
|
826,625
|
|
|||
|
Property, plant and equipment, net
|
932,877
|
|
781,973
|
|
|||
|
Goodwill
|
1,247,133
|
|
804,906
|
|
|||
|
Client relationships, net
|
537,945
|
|
301,891
|
|
|||
|
Other intangible assets, net
|
72,943
|
|
67,871
|
|
|||
|
Deferred tax assets
|
23,386
|
|
22,654
|
|
|||
|
Other assets
|
143,759
|
|
124,002
|
|
|||
|
Total assets
|
$
|
3,855,879
|
|
$
|
2,929,922
|
|
|
|
Liabilities, Redeemable Noncontrolling Interest and Equity
|
|
|
|||||
|
Current liabilities:
|
|
|
|||||
|
Current portion of long-term debt and capital leases
|
$
|
31,416
|
|
$
|
30,998
|
|
|
|
Accounts payable
|
66,250
|
|
77,838
|
|
|||
|
Accrued compensation
|
137,212
|
|
101,044
|
|
|||
|
Deferred revenue
|
145,139
|
|
117,569
|
|
|||
|
Accrued liabilities
|
106,925
|
|
89,780
|
|
|||
|
Other current liabilities
|
71,280
|
|
44,460
|
|
|||
|
Current liabilities of discontinued operations
|
—
|
|
1,815
|
|
|||
|
Total current liabilities
|
558,222
|
|
463,504
|
|
|||
|
Long-term debt, net and capital leases
|
1,636,598
|
|
1,114,105
|
|
|||
|
Deferred tax liabilities
|
143,635
|
|
89,540
|
|
|||
|
Other long-term liabilities
|
179,121
|
|
194,815
|
|
|||
|
Long-term liabilities of discontinued operations
|
—
|
|
3,942
|
|
|||
|
Total liabilities
|
2,517,576
|
|
1,865,906
|
|
|||
|
Commitments and contingencies (Notes 2, 9, 11, 12, and 16)
|
|
|
|||||
|
Redeemable noncontrolling interest
|
18,525
|
|
16,609
|
|
|||
|
Equity:
|
|
|
|||||
|
Preferred stock, $0.01 par value; 20,000 shares authorized; no shares issued and outstanding
|
—
|
|
—
|
|
|||
|
Common stock, $0.01 par value; 120,000 shares authorized; 48,210 shares issued and 48,209 shares outstanding as of December 29, 2018 and 87,495 shares issued and 47,402 shares outstanding as of December 30, 2017
|
482
|
|
875
|
|
|||
|
Additional paid-in capital
|
1,447,512
|
|
2,560,192
|
|
|||
|
Retained earnings
|
42,096
|
|
288,658
|
|
|||
|
Treasury stock, at cost, 1 and 40,093 shares as of December 29, 2018 and December 30, 2017, respectively
|
(55
|
)
|
(1,659,914
|
)
|
|||
|
Accumulated other comprehensive loss
|
(172,703
|
)
|
(144,731
|
)
|
|||
|
Total equity attributable to common shareholders
|
1,317,332
|
|
1,045,080
|
|
|||
|
Noncontrolling interest
|
2,446
|
|
2,327
|
|
|||
|
Total equity
|
1,319,778
|
|
1,047,407
|
|
|||
|
Total liabilities, redeemable noncontrolling interest and equity
|
$
|
3,855,879
|
|
$
|
2,929,922
|
|
|
|
See Notes to Consolidated Financial Statements.
|
|||||||
53
CHARLES RIVER LABORATORIES INTERNATIONAL, INC.
CONSOLIDATED STATEMENTS OF CASH FLOWS
(in thousands)
|
|
Fiscal Year
|
||||||||||
|
|
2018
|
2017
|
2016
|
||||||||
|
Cash flows relating to operating activities
|
|
|
|
||||||||
|
Net income
|
$
|
228,724
|
|
$
|
125,449
|
|
$
|
156,366
|
|
||
|
Less: Income (loss) from discontinued operations, net of income taxes
|
1,506
|
|
(137
|
)
|
280
|
|
|||||
|
Income from continuing operations, net of income taxes
|
227,218
|
|
125,586
|
|
156,086
|
|
|||||
|
Adjustments to reconcile net income from continuing operations to net cash provided by operating activities:
|
|||||||||||
|
Depreciation and amortization
|
161,779
|
|
131,159
|
|
126,658
|
|
|||||
|
Stock-based compensation
|
47,346
|
|
44,003
|
|
43,642
|
|
|||||
|
Deferred income taxes
|
(9,702
|
)
|
28,254
|
|
1,945
|
|
|||||
|
Gain on venture capital investments
|
(15,928
|
)
|
(22,867
|
)
|
(10,284
|
)
|
|||||
|
Gain on divestiture
|
—
|
|
(10,577
|
)
|
—
|
|
|||||
|
Impairment charges
|
—
|
|
17,239
|
|
6,717
|
|
|||||
|
Other, net
|
15,613
|
|
(666
|
)
|
5,629
|
|
|||||
|
Changes in assets and liabilities:
|
|
|
|
||||||||
|
Trade receivables, net
|
(21,196
|
)
|
(48,279
|
)
|
(52,780
|
)
|
|||||
|
Inventories
|
(13,338
|
)
|
(17,838
|
)
|
(4,021
|
)
|
|||||
|
Accounts payable
|
(12,732
|
)
|
34
|
|
22,076
|
|
|||||
|
Accrued compensation
|
31,616
|
|
3,666
|
|
9,298
|
|
|||||
|
Long-term payable on Transition Tax (Notes 5 and 11)
|
(8,974
|
)
|
61,038
|
|
—
|
|
|||||
|
Deferred revenue
|
36,072
|
|
(8,466
|
)
|
14,580
|
|
|||||
|
Customer contract deposits
|
28,115
|
|
—
|
|
—
|
|
|||||
|
Other assets and liabilities, net
|
(24,749
|
)
|
15,788
|
|
(2,647
|
)
|
|||||
|
Net cash provided by operating activities
|
441,140
|
|
318,074
|
|
316,899
|
|
|||||
|
Cash flows relating to investing activities
|
|
|
|
||||||||
|
Acquisition of businesses and assets, net of cash acquired
|
(824,868
|
)
|
(25,012
|
)
|
(648,482
|
)
|
|||||
|
Capital expenditures
|
(140,054
|
)
|
(82,431
|
)
|
(55,288
|
)
|
|||||
|
Purchases of investments and contributions to venture capital investments
|
(25,125
|
)
|
(46,217
|
)
|
(40,248
|
)
|
|||||
|
Proceeds from sale of investments
|
35,849
|
|
9,128
|
|
47,652
|
|
|||||
|
Proceeds from divestiture
|
—
|
|
72,462
|
|
—
|
|
|||||
|
Other, net
|
(805
|
)
|
(516
|
)
|
3,694
|
|
|||||
|
Net cash used in investing activities
|
(955,003
|
)
|
(72,586
|
)
|
(692,672
|
)
|
|||||
|
Cash flows relating to financing activities
|
|
|
|
||||||||
|
Proceeds from long-term debt and revolving credit facility
|
2,755,028
|
|
236,856
|
|
1,044,666
|
|
|||||
|
Proceeds from exercises of stock options
|
37,657
|
|
38,870
|
|
23,197
|
|
|||||
|
Payments on long-term debt, revolving credit facility, and capital lease obligations
|
(2,201,003
|
)
|
(372,435
|
)
|
(656,636
|
)
|
|||||
|
Payments on debt financing costs
|
(18,337
|
)
|
—
|
|
(3,659
|
)
|
|||||
|
Purchase of treasury stock
|
(13,846
|
)
|
(106,909
|
)
|
(12,267
|
)
|
|||||
|
Other, net
|
(1,440
|
)
|
(4,858
|
)
|
(14,545
|
)
|
|||||
|
Net cash provided by (used in) financing activities
|
558,059
|
|
(208,476
|
)
|
380,756
|
|
|||||
|
Discontinued operations
|
|
|
|
||||||||
|
Net cash used in operating activities from discontinued operations
|
(3,735
|
)
|
(1,809
|
)
|
(2,056
|
)
|
|||||
|
Effect of exchange rate changes on cash, cash equivalents, and restricted cash
|
(9,474
|
)
|
11,234
|
|
(2,996
|
)
|
|||||
|
Net change in cash, cash equivalents, and restricted cash
|
30,987
|
|
46,437
|
|
(69
|
)
|
|||||
|
Cash, cash equivalents, and restricted cash, beginning of period
|
166,331
|
|
119,894
|
|
119,963
|
|
|||||
|
Cash, cash equivalents, and restricted cash, end of period
|
$
|
197,318
|
|
$
|
166,331
|
|
$
|
119,894
|
|
||
|
See Notes to Consolidated Financial Statements.
|
|||||||||||
54
CHARLES RIVER LABORATORIES INTERNATIONAL, INC.
CONSOLIDATED STATEMENTS OF CASH FLOWS (continued)
(in thousands)
|
|
Fiscal Year
|
||||||||||
|
|
2018
|
2017
|
2016
|
||||||||
|
Supplemental cash flow information:
|
|
|
|
||||||||
|
Cash and cash equivalents
|
$
|
195,442
|
|
$
|
163,794
|
|
$
|
117,626
|
|
||
|
Restricted cash included in Other current assets
|
465
|
|
592
|
|
532
|
|
|||||
|
Restricted cash included in Other assets
|
1,411
|
|
1,945
|
|
1,736
|
|
|||||
|
Cash, cash equivalents, and restricted cash, end of period
|
$
|
197,318
|
|
$
|
166,331
|
|
$
|
119,894
|
|
||
|
Cash paid for income taxes
|
$
|
67,600
|
|
$
|
60,377
|
|
$
|
42,868
|
|
||
|
Cash paid for interest
|
$
|
47,540
|
|
$
|
27,417
|
|
$
|
22,756
|
|
||
|
Non-cash investing and financing activities:
|
|||||||||||
|
Additions to property, plant and equipment, net
|
$
|
18,212
|
|
$
|
38,199
|
|
$
|
5,333
|
|
||
|
Assets acquired under capital lease
|
$
|
1,473
|
|
$
|
722
|
|
|
$
|
1,335
|
|
|
|
See Notes to Consolidated Financial Statements.
|
|||||||||||
55
CHARLES RIVER LABORATORIES INTERNATIONAL, INC.
CONSOLIDATED STATEMENTS OF CHANGES IN EQUITY
(in thousands)
|
Common stock
|
Additional Paid-In Capital
|
Retained Earnings
|
Accumulated Other Comprehensive Income (Loss)
|
Treasury Stock
|
Total Equity
Attributable
to Common
Shareholders
|
Noncontrolling
Interest
|
Total
Equity
|
||||||||||||||||||||||||||||||
|
Shares
|
Amount
|
Shares
|
Amount
|
||||||||||||||||||||||||||||||||||
|
December 26, 2015
|
85,464
|
|
$
|
855
|
|
$
|
2,397,960
|
|
$
|
10,538
|
|
$
|
(135,548
|
)
|
38,766
|
|
$
|
(1,540,738
|
)
|
$
|
733,067
|
|
$
|
4,489
|
|
$
|
737,556
|
|
|||||||||
|
Net income
|
—
|
|
—
|
|
—
|
|
154,765
|
|
—
|
|
—
|
|
—
|
|
154,765
|
|
924
|
|
155,689
|
|
|||||||||||||||||
|
Other comprehensive loss
|
—
|
|
—
|
|
—
|
|
—
|
|
(118,216
|
)
|
—
|
|
—
|
|
(118,216
|
)
|
(154
|
)
|
(118,370
|
)
|
|||||||||||||||||
|
Dividends declared to noncontrolling interest
|
—
|
|
—
|
|
—
|
|
—
|
|
—
|
|
—
|
|
—
|
|
—
|
|
(2,902
|
)
|
(2,902
|
)
|
|||||||||||||||||
|
Adjustment of redeemable noncontrolling interest to fair value
|
—
|
|
—
|
|
1,690
|
|
—
|
|
—
|
|
—
|
|
—
|
|
1,690
|
|
—
|
|
1,690
|
|
|||||||||||||||||
|
Purchase of additional equity in redeemable noncontrolling interest
|
—
|
|
—
|
|
1,593
|
|
—
|
|
—
|
|
—
|
|
—
|
|
1,593
|
|
—
|
|
1,593
|
|
|||||||||||||||||
|
Tax benefit associated with stock issued under employee compensation plans
|
—
|
|
—
|
|
9,274
|
|
—
|
|
—
|
|
—
|
|
—
|
|
9,274
|
|
—
|
|
9,274
|
|
|||||||||||||||||
|
Issuance of stock under employee compensation plans
|
837
|
|
8
|
|
23,212
|
|
—
|
|
—
|
|
—
|
|
—
|
|
23,220
|
|
—
|
|
23,220
|
|
|||||||||||||||||
|
Acquisition of treasury shares
|
—
|
|
—
|
|
—
|
|
—
|
|
—
|
|
172
|
|
(12,267
|
)
|
(12,267
|
)
|
—
|
|
(12,267
|
)
|
|||||||||||||||||
|
Stock-based compensation
|
—
|
|
—
|
|
43,642
|
|
—
|
|
—
|
|
—
|
|
—
|
|
43,642
|
|
—
|
|
43,642
|
|
|||||||||||||||||
|
December 31, 2016
|
86,301
|
|
863
|
|
2,477,371
|
|
165,303
|
|
(253,764
|
)
|
38,938
|
|
(1,553,005
|
)
|
836,768
|
|
2,357
|
|
839,125
|
|
|||||||||||||||||
|
Net income
|
—
|
|
—
|
|
—
|
|
123,355
|
|
—
|
|
—
|
|
—
|
|
123,355
|
|
1,179
|
|
124,534
|
|
|||||||||||||||||
|
Other comprehensive income
|
—
|
|
—
|
|
—
|
|
—
|
|
109,033
|
|
—
|
|
—
|
|
109,033
|
|
—
|
|
109,033
|
|
|||||||||||||||||
|
Dividends declared to noncontrolling interest
|
—
|
|
—
|
|
—
|
|
—
|
|
—
|
|
—
|
|
—
|
|
—
|
|
(1,209
|
)
|
(1,209
|
)
|
|||||||||||||||||
|
Issuance of stock under employee compensation plans
|
1,194
|
|
12
|
|
38,818
|
|
—
|
|
—
|
|
—
|
|
—
|
|
38,830
|
|
—
|
|
38,830
|
|
|||||||||||||||||
|
Acquisition of treasury shares
|
—
|
|
—
|
|
—
|
|
—
|
|
—
|
|
1,155
|
|
(106,909
|
)
|
(106,909
|
)
|
—
|
|
(106,909
|
)
|
|||||||||||||||||
|
Stock-based compensation
|
—
|
|
—
|
|
44,003
|
|
—
|
|
—
|
|
—
|
|
—
|
|
44,003
|
|
—
|
|
44,003
|
|
|||||||||||||||||
|
December 30, 2017
|
87,495
|
|
875
|
|
2,560,192
|
|
288,658
|
|
(144,731
|
)
|
40,093
|
|
(1,659,914
|
)
|
1,045,080
|
|
2,327
|
|
1,047,407
|
|
|||||||||||||||||
|
Net income
|
—
|
|
—
|
|
—
|
|
226,373
|
|
—
|
|
—
|
|
—
|
|
226,373
|
|
1,550
|
|
227,923
|
|
|||||||||||||||||
|
Other comprehensive loss
|
—
|
|
—
|
|
—
|
|
—
|
|
(24,642
|
)
|
—
|
|
—
|
|
(24,642
|
)
|
—
|
|
(24,642
|
)
|
|||||||||||||||||
|
Reclassification due to adoption of ASU 2018-02 (See Note 1)
|
—
|
|
—
|
|
—
|
|
3,330
|
|
(3,330
|
)
|
—
|
|
—
|
|
—
|
|
—
|
|
—
|
|
|||||||||||||||||
|
Adjustment due to adoption of ASU 2016-01 (see Note 1)
|
—
|
|
—
|
|
—
|
|
1,424
|
|
—
|
|
—
|
|
—
|
|
1,424
|
|
—
|
|
1,424
|
|
|||||||||||||||||
|
Dividends declared to noncontrolling interest
|
—
|
|
—
|
|
—
|
|
—
|
|
—
|
|
—
|
|
—
|
|
—
|
|
(1,431
|
)
|
(1,431
|
)
|
|||||||||||||||||
|
Adjustment of redeemable noncontrolling interest to redemption value
|
—
|
|
—
|
|
(2,069
|
)
|
—
|
|
—
|
|
—
|
|
—
|
|
(2,069
|
)
|
—
|
|
(2,069
|
)
|
|||||||||||||||||
|
Issuance of stock under employee compensation plans
|
936
|
|
9
|
|
37,657
|
|
—
|
|
—
|
|
—
|
|
—
|
|
37,666
|
|
—
|
|
37,666
|
|
|||||||||||||||||
|
Acquisition of treasury shares
|
—
|
|
—
|
|
—
|
|
—
|
|
—
|
|
129
|
|
(13,846
|
)
|
(13,846
|
)
|
—
|
|
(13,846
|
)
|
|||||||||||||||||
|
Retirement of treasury shares
|
(40,221
|
)
|
(402
|
)
|
(1,195,614
|
)
|
(477,689
|
)
|
—
|
|
(40,221
|
)
|
1,673,705
|
|
—
|
|
—
|
|
—
|
|
|||||||||||||||||
|
Stock-based compensation
|
—
|
|
—
|
|
47,346
|
|
—
|
|
—
|
|
—
|
|
—
|
|
47,346
|
|
—
|
|
47,346
|
|
|||||||||||||||||
|
December 29, 2018
|
48,210
|
|
$
|
482
|
|
$
|
1,447,512
|
|
$
|
42,096
|
|
$
|
(172,703
|
)
|
1
|
|
$
|
(55
|
)
|
$
|
1,317,332
|
|
$
|
2,446
|
|
$
|
1,319,778
|
|
|||||||||
|
See Notes to Consolidated Financial Statements.
|
|||||||||||||||||||||||||||||||||||||
56
CHARLES RIVER LABORATORIES INTERNATIONAL, INC.
NOTES TO CONSOLIDATED FINANCIAL STATEMENTS
1. DESCRIPTION OF BUSINESS AND SUMMARY OF SIGNIFICANT ACCOUNTING POLICIES
Description of Business
Charles River Laboratories International, Inc. (the Company), together with its subsidiaries, is a full service, early-stage contract research organization (CRO). The Company has built upon its core competency of laboratory animal medicine and science (research model technologies) to develop a diverse portfolio of discovery and safety assessment services, both Good Laboratory Practice (GLP) and non-GLP, that enable the Company to support its clients from target identification through non-clinical development. The Company also provides a suite of products and services to support its clients’ manufacturing activities.
Principles of Consolidation
The Company’s consolidated financial statements reflect its financial statements and those of its subsidiaries in which the Company holds a controlling financial interest. For consolidated entities in which the Company owns or is exposed to less than 100% of the economics, the Company records net income (loss) attributable to noncontrolling interests in its consolidated statements of income equal to the percentage of the economic or ownership interest retained in such entities by the respective noncontrolling parties. Intercompany balances and transactions are eliminated in consolidation.
The Company’s fiscal year
is typically based on 52-week
s
, with each quarter comp
osed
of 13 weeks ending on the last Saturday on, or closest to, March 31, June 30, September 30, and December 31. A 53
rd
week was included in the fourth quarter of fiscal year 2016, which is occasionally necessary to align with a December 31 calendar year-end.
Reclassifications
Certain reclassifications have been made in the consolidated statements of income for prior periods to conform to the current year presentation. See “Newly Adopted Accounting Pronouncements” below for further discussion.
Segment Reporting
The Company reports its results in
three
reportable segments: Research Models and Services (RMS), Discovery and Safety Assessment (DSA), and Manufacturing Support (Manufacturing). The Company’s RMS reportable segment includes the Research Models and Research Model Services businesses. Research Models includes the commercial production and sale of small research models, as well as the supply of large research models. Research Model Services includes: Genetically Engineered Models and Services (GEMS), which performs contract breeding and other services associated with genetically engineered research models; Research Animal Diagnostic Services (RADS), which provides health monitoring and diagnostics services related to research models; and Insourcing Solutions (IS), which provides colony management of its clients’ research operations (including recruitment, training, staffing, and management services). The Company’s DSA reportable segment includes services required to take a drug through the early development process including discovery services, which are non-regulated services to assist clients with the identification, screening, and selection of a lead compound for drug development, and regulated and non-regulated (GLP and non-GLP) safety assessment services. The Company’s Manufacturing reportable segment includes Microbial Solutions, which provides
in vitro
(non-animal) lot-release testing products, microbial detection products, and species identification services; Biologics Testing Services (Biologics), which performs specialized testing of biologics; Avian Vaccine Services (Avian), which supplies specific-pathogen-free chicken eggs and chickens; and contract development and manufacturing (CDMO) services, which, until the Company divested this business on February 10, 2017, allowed it to provide formulation design and development, manufacturing, and analytical and stability testing for small molecules.
Use of Estimates
The preparation of consolidated financial statements in accordance with generally accepted accounting principles in the United States (U.S. GAAP) requires that the Company make estimates and judgments that may affect the reported amounts of assets, liabilities, revenues, expenses, and related disclosure of contingent assets and liabilities. On an on-going basis, the Company evaluates its estimates, judgments and methodologies. The Company bases its estimates on historical experience and on various other assumptions that are believed to be reasonable, the results of which form the basis for making judgments about the carrying values of assets and liabilities. Actual results may differ from these estimates under different assumptions or conditions. Changes in estimates are reflected in reported results in the period in which they become known.
Cash and Cash Equivalents
57
CHARLES RIVER LABORATORIES INTERNATIONAL, INC.
NOTES TO CONSOLIDATED FINANCIAL STATEMENTS (Continued)
Cash equivalents include money market funds, time deposits and other investments with remaining maturities at the purchase date of three months or less.
Investments
Marketable securities are reported at fair value. Gains and losses on marketable securities are included in other income, net and are determined using the specific identification method. Time deposits with original maturities of greater than three months are reported as investments.
Trade Receivables, Net
The Company records trade receivables net of an allowance for doubtful accounts. An allowance for doubtful accounts is established based on historical collection information, a review of major client accounts receivable balances and current economic conditions in the geographies in which it operates. Amounts determined to be uncollectible are charged or written off against the allowance.
Concentrations of Credit Risk
Financial instruments that potentially subject the Company to concentrations of credit risk consist primarily of cash and cash equivalents, investments and trade receivables. The Company places cash and cash equivalents and investments in various financial institutions with high credit rating and limits the amount of credit exposure to any one financial institution. Trade receivables are primarily from clients in the pharmaceutical and biotechnology industries, as well as academic and government institutions. Concentrations of credit risk with respect to trade receivables, which are typically unsecured, are limited due to the wide variety of customers using the Company’s products and services as well as their dispersion across many geographic areas.
No
single client accounted for more than
5%
of revenue or trade receivables for the periods ended
December 29, 2018
and
December 30, 2017
.
Fair Value Measurements
The accounting standard for fair value measurements defines fair value, establishes a framework for measuring fair value in accordance with U.S. GAAP, and requires certain disclosures about fair value measurements. Under this standard, fair value is the price that would be received to sell an asset or paid to transfer a liability in an orderly transaction between market participants at the measurement date. The Company has certain financial assets and liabilities recorded at fair value, which have been classified as Level 1, 2 or 3 within the fair value hierarchy:
|
•
|
Level 1 - Fair values are determined utilizing prices (unadjusted) in active markets for identical assets or liabilities that the Company has the ability to access,
|
|
•
|
Level 2 - Fair values are determined by utilizing quoted prices for identical or similar assets and liabilities in active markets or other market observable inputs such as interest rates, yield curves, and foreign currency spot rates,
|
|
•
|
Level 3 - Prices or valuations that require inputs that are both significant to the fair value measurement and unobservable.
|
The fair value hierarchy level is determined by asset and class based on the lowest level of significant input. The observability of inputs may change for certain assets or liabilities. This condition could cause an asset or liability to be reclassified between levels. The Company recognizes transfers between levels within the fair value hierarchy, if any, at the end of each quarter.
Valuation methodologies used for assets and liabilities measured or disclosed at fair value are as follows:
|
•
|
Cash equivalents - Valued at market prices determined through third-party pricing services;
|
|
•
|
Mutual funds - Valued at the unadjusted quoted net asset value of shares held by the Company;
|
|
•
|
Foreign currency forward contracts - Valued using market observable inputs, such as forward foreign exchange points and foreign exchanges rates;
|
|
•
|
Life insurance policies - Valued at cash surrender value based on the fair value of underlying investments;
|
|
•
|
Debt instruments - The book value of the Company’s term and revolving loans, which are variable rate loans carried at amortized cost, approximates the fair value based on current market pricing of similar debt. The book value of the Company’s
5.5%
Senior Notes (Senior Notes) due in 2026, which are fixed rate debt carried at amortized cost, approximates fair value based on quoted market prices and on borrowing rates available to the Company; and
|
58
CHARLES RIVER LABORATORIES INTERNATIONAL, INC.
NOTES TO CONSOLIDATED FINANCIAL STATEMENTS (Continued)
|
•
|
Contingent consideration - Valued based on a probability weighting of the future cash flows associated with the potential outcomes.
|
Inventories
Inventories are stated at the lower of cost or net realizable value.
Inventory value is based on the standard cost method for all businesses except for the Avian business, which is based on an average cost. Standard costs are trued-up to reflect actual cost
. For the small model business, cost includes direct materials such as feed and bedding, costs of personnel directly involved in the care of the models, and an allocation of facility overhead. For the large model business, cost is primarily the external cost paid to acquire the model. Inventory costs are charged to cost of revenue in the period the products are sold to an external party. The Company analyzes its inventory levels on a quarterly basis and writes down inventory that is determined to be damaged, obsolete or otherwise unmarketable, with a corresponding charge to cost of products sold.
Property, Plant and Equipment, Net
Property, plant and equipment, net, including improvements that significantly add to productive capacity or extend useful life, are carried at cost and are subject to review for impairment whenever events or changes in circumstances indicate that the carrying amount of the asset may not be recoverable. The cost of normal, recurring, or periodic repairs and maintenance activities related to property, plant and equipment is expensed as incurred. In addition, the Company capitalizes certain internal use computer software development costs.
Costs incurred during the preliminary project stage are expensed as incurred, while costs incurred during the application development stage are capitalized and amortized over the estimated useful life of the software. The Company also capitalizes costs related to specific upgrades and enhancements when it is probable the expenditures will result in additional functionality. Maintenance and training costs related to software obtained for internal use are expensed as incurred.
Interest costs incurred during the construction of major capital projects are capitalized until the underlying asset is ready for its intended use, at which point the interest costs are amortized as depreciation expense over the life of the underlying asset.
The Company generally depreciates the cost of its property, plant and equipment using the straight-line method over the estimated useful lives of the respective assets as follow:
|
Estimated
Useful Lives |
|
|
(in years)
|
|
|
Land
|
Indefinite
|
|
Buildings
|
20 - 40
|
|
Machinery and equipment
|
3 - 20
|
|
Furniture and fixtures
|
5 - 10
|
|
Computer hardware and software
|
3 - 8
|
|
Vehicles
|
3 - 5
|
Leasehold improvements are amortized over the shorter of the estimated useful life of the asset or the lease term. Capital lease assets are amortized over the lease term, however, if ownership is transferred by the end of the capital lease, or there is a bargain purchase option, such capital lease assets are amortized over the useful life that would be assigned if such assets were owned.
When the Company disposes of property, plant and equipment, it removes the associated cost and accumulated depreciation from the related accounts on its consolidated balance sheet and includes any resulting gain or loss in its consolidated statement of income.
Business Acquisitions
The Company accounts for business combinations under the acquisition method of accounting. The Company allocates the amounts that it pays for each acquisition to the assets it acquires and liabilities it assumes based on their fair values at the dates of acquisition, including identifiable intangible assets. The Company bases the fair value of identifiable intangible assets acquired in a business combination on valuations that use information and assumptions determined by management and which consider management’s best estimates of inputs and assumptions that a market participant would use.
59
CHARLES RIVER LABORATORIES INTERNATIONAL, INC.
NOTES TO CONSOLIDATED FINANCIAL STATEMENTS (Continued)
Contingent Consideration
The consideration for the Company’s acquisitions often includes future payments that are contingent upon the occurrence of a particular event. The Company records an obligation for such contingent payments at fair value on the acquisition date. The Company estimates the fair value of contingent consideration obligations through valuation models that incorporate probability adjusted assumptions related to the achievement of the milestones and the likelihood of making related payments. The Company revalues these contingent consideration obligations each reporting period. Changes in the fair value of the contingent consideration obligations are recognized in the Company’s consolidated statements of income as a component of selling, general and administrative expenses. Changes in the fair value of the contingent consideration obligations can result from changes to one or multiple inputs, including adjustments to the discount rates and changes in the assumed probabilities of successful achievement of certain financial targets.
Discount rates in the Company’s valuation models represent a measure of the credit risk associated with settling the liability. The period over which the Company discounts its contingent obligations is typically based on when the contingent payments would be triggered. These fair value measurements are based on significant inputs not observable in the market. See Note 7, “Fair Value.”
Goodwill and Intangible Assets
Goodwill represents the difference between the purchase price and the fair value of the identifiable tangible and intangible net assets when accounted for using the acquisition method of accounting. Goodwill is not amortized, but reviewed for impairment on an annual basis, during the fourth quarter, or more frequently if an event occurs or circumstances change that would more-likely-than-not reduce the fair value of the Company's reporting units below their carrying amounts.
The Company has the option to first assess qualitative factors to determine whether it is necessary to perform the two-step impairment test. If the Company elects this option and believes, as a result of the qualitative assessment, that it is more-likely-than-not that the carrying value of goodwill is not recoverable, the quantitative two-step impairment test is required; otherwise, no further testing is required. Alternatively, the Company may elect to not first assess qualitative factors and immediately perform the quantitative two-step impairment test. In the first step, the Company compares the fair value of its reporting units to their carrying values. If the carrying values of the net assets assigned to the reporting units exceed the fair values of the reporting units, then the second step of the impairment test is performed in order to determine the implied fair value of the Company’s goodwill. If the carrying value of the reporting unit’s goodwill exceeds its implied fair value, then the Company would record an impairment loss equal to the difference.
Definite-lived intangible assets, including client relationships, are amortized
over the pattern in which the economic benefits of the intangible assets are utilized
and reviewed for impairment whenever events or changes in circumstances indicate that the carrying amount of the assets or asset group may not be recoverable. Determination of recoverability is based on an estimate of undiscounted future cash flows resulting from the use of the asset, which requires the use of customer attribution rates and other assumptions. In the event that such cash flows are not expected to be sufficient to recover the carrying amount of the definite-lived intangible assets, the definite-lived intangible assets are written-down to their fair values.
Valuation and Impairment of Long-Lived Assets
Long-lived assets to be held and used are reviewed for impairment whenever events or changes in circumstances indicate that the carrying amount of the assets or asset group may not be recoverable.
Determination of recoverability is based on an estimate of undiscounted future cash flows resulting from the use of the asset and its eventual disposition. In the event that such cash flows are not expected to be sufficient to recover the carrying amount of the assets, the assets are written-down to their fair values.
Long-lived assets to be disposed of are carried at fair value less costs to sell.
Venture Capital Investments
The Company invests in several venture capital funds that invest in start-up companies, primarily in the life sciences industry. The Company’s
ownership interest in these funds ranges from less than
1%
to
12.0%
.
The
Company accounts for the investments in limited partnerships (LPs), which are variable interest entities, under the equity method of accounting. For publicly-held investments in the LPs, the Company adjusts for changes in fair market value based on reported share holdings at the end of each fiscal quarter. The Company is not the primary beneficiary because it has no power to direct the activities that most significantly affect the LPs’ economic performance. The Company accounts for the investments in limited liability companies, which are not variable interest entities, under the equity method of accounting.
60
CHARLES RIVER LABORATORIES INTERNATIONAL, INC.
NOTES TO CONSOLIDATED FINANCIAL STATEMENTS (Continued)
Under the equity method of accounting, the Company’s portion of the investment gains and losses, as reported in the fund’s financial statements on a quarterly lag each reporting period, is recorded in other income, net in the accompanying consolidated statements of income. In addition, the Company adjusts the carrying value of these investments to reflect its estimate of changes to fair value since the fund’s financial statements are based on information from the fund’s management team, market prices of known public holdings of the fund and other information.
Life Insurance Contracts
Investments in life insurance contracts are recorded at cash surrender value. The initial investment at the transaction price is recognized and remeasured based on fair value of underlying investments or contractual value each reporting period. Investments in and redemptions of these life insurance contracts are reported as cash flows from investing activities in the consolidated statement of cash flows. The Company held
45
and
43
contracts at both
December 29, 2018
and
December 30, 2017
, with a face value of
$65.2 million
and
$61.4 million
, respectively.
Stock-Based Compensation
The Company grants stock options, restricted stock, restricted stock units (RSUs), and performance share units (PSUs) to employees and stock options, restricted stock, and RSUs to non-employee directors under stock-based compensation plans. Stock-based compensation is recognized as an expense in the consolidated statements of income based on the grant date fair value, adjusted for forfeitures when they occur, over the requisite service period.
For stock options, restricted stock and RSUs that vest based on service conditions, the Company uses the straight-line method to allocate compensation expense to reporting periods.
Where awards are made with non-substantive vesting periods and a portion of the award continues to vest after the employee’s eligible retirement, the Company recognizes expense based on the period from the grant date to the date on which the employee is retirement eligible.
The Company records the expense for PSU grants subject to performance and/or market conditions using the accelerated attribution method over the remaining service period when management determines that achievement of the performance-based milestone is probable.
The fair value of stock options granted is calculated using the Black-Scholes option-pricing model and the fair value of PSUs is estimated using a lattice model with a Monte Carlo simulation, both of which require the use of subjective assumptions including volatility and expected term, among others. The expected volatility assumption is typically determined using the historical volatility of the Company’s common stock over the expected life of the stock-based award. The expected term is determined using historical option exercise activity. The fair value of restricted stock and RSUs is based on the market value of the Company’s common stock on the date of grant.
Revenue Recognition
Revenue is recognized when, or as, obligations under the terms of a contract are satisfied, which occurs when control of the promised products or services is transferred to customers. Revenue is measured as the amount of consideration the Company expects to receive in exchange for transferring products or services to a customer (“transaction price”).
To the extent the transaction price includes variable consideration, the Company estimates the amount of variable consideration that should be included in the transaction price utilizing the amount to which the Company expects to be entitled. Variable consideration is included in the transaction price if, in the Company’s judgment, it is probable that a significant future reversal of cumulative revenue under the contract will not occur. Estimates of variable consideration and determination of whether to include estimated amounts in the transaction price are based largely on an assessment of the Company’s anticipated performance and all information (historical, current and forecasted) that is reasonably available. Sales, value add, and other taxes collected on behalf of third parties are excluded from revenue.
When determining the transaction price of a contract, an adjustment is made if payment from a customer occurs either significantly before or significantly after performance, resulting in a significant financing component. Generally, the Company does not extend payment terms beyond one year. Applying the practical expedient, the Company does not assess whether a significant financing component exists if the period between when the Company performs its obligations under the contract and when the customer pays is one year or less. None of the Company’s contracts contained a significant financing component during fiscal year
2018
.
Contracts with customers may contain multiple performance obligations. For such arrangements, the transaction price is allocated to each performance obligation based on the estimated relative standalone selling prices of the promised products or services underlying each performance obligation. The Company determines standalone selling prices based on the price at which the performance obligation is sold separately. If the standalone selling price is not observable through past transactions,
61
CHARLES RIVER LABORATORIES INTERNATIONAL, INC.
NOTES TO CONSOLIDATED FINANCIAL STATEMENTS (Continued)
the Company estimates the standalone selling price taking into account available information such as market conditions and internally approved pricing guidelines related to the performance obligations.
Contracts are often modified to account for changes in contract specifications and requirements. Contract modifications exist when the modification either creates new, or changes existing, enforceable rights and obligations. Generally, when contract modifications create new performance obligations, the modification is considered to be a separate contract and revenue is recognized prospectively. When contract modifications change existing performance obligations, the existing transaction price and measure of progress for the performance obligation to which it relates is generally recognized as an adjustment to revenue (either as an increase in or a reduction of revenue) on a cumulative catch-up basis.
Product revenue is generally recognized when the customer obtains control of the Company’s product, which occurs at a point in time, and may be upon shipment or upon delivery based on the contractual shipping terms of a contract. Service revenue is generally recognized over time as the services are delivered to the customer based on the extent of progress towards completion of the performance obligation. The selection of the method to measure progress towards completion requires judgment and is based on the nature of the products or services to be provided. Depending on which better depicts the transfer of value to the customer, the Company generally measures its progress using either cost-to-cost (input method) or right-to-invoice (output method). The Company uses the cost-to-cost measure of progress when it best depicts the transfer of value to the customer which occurs as the Company incurs costs on its contract, generally related to fixed fee service contracts. Under the cost-to-cost measure of progress, the extent of progress towards completion is measured based on the ratio of costs incurred to date to the total estimated costs at completion of the performance obligation. The costs calculation includes variables such as labor hours, allocation of overhead costs, research model costs, and subcontractor costs. Revenue is recorded proportionally as costs are incurred. The right-to-invoice measure of progress is generally related to rate per unit contracts, as the extent of progress towards completion is measured based on discrete service or time-based increments, such as samples tested or labor hours incurred. Revenue is recorded in the amount invoiced since that amount corresponds directly to the value of the Company’s performance to date.
Advertising Costs
Advertising costs are expensed as incurred. For fiscal years
2018
,
2017
and
2016
, advertising costs totaled
$1.9 million
,
$1.6 million
and
$1.4 million
, respectively.
Income Taxes
The provision for income taxes includes federal, state, local and foreign taxes. Income taxes are accounted for under the liability method. Deferred tax assets and liabilities are recognized for the expected future tax consequences of temporary differences between the financial statements carrying amounts and their respective tax basis. The Company measures deferred tax assets and liabilities using the enacted tax rates in effect when the temporary differences are expected to be settled. The Company evaluates the realizability of its deferred tax assets and establishes a valuation allowance when it is more likely than not that all or a portion of deferred tax assets will not be realized.
The Company accounts for uncertain tax positions using a “more-likely-than-not” threshold for recognizing and resolving uncertain tax positions. The Company evaluates uncertain tax positions on a quarterly basis and considers various factors, including, but not limited to, changes in tax law, the measurement of tax positions taken or expected to be taken in tax returns, the effective settlement of matters subject to audit, information obtained during in-process audit activities and changes in facts or circumstances related to a tax position. The Company also accrues for potential interest and penalties related to unrecognized tax benefits in income tax expense.
In fiscal year 2018, the Company made an accounting policy election to treat taxes due on the Global Intangible Low-Taxed Income (GILTI) inclusion as a current period expense. See Note 11, “Income Taxes” for further discussion.
Foreign Currency Contracts
Foreign currency contracts are recorded at fair value in the Company’s consolidated balance sheets and are not designated as hedging instruments. Any gains or losses on forward contracts associated with intercompany loans are recognized immediately in Other income, net and are largely offset by the remeasurement of the underlying intercompany loan. Any gains or losses on forward contracts associated the Company’s U.S. dollar denominated loan borrowed by a non-U.S. entity under the Company’s
$2.3B
Credit Facility are recognized immediately in Interest expense. Gains or losses incurred on the remeasurement of the Company’s U.S. dollar denominated loan borrowed by a non-U.S. entity with a different functional currency is recorded in Other income, net.
Translation of Foreign Currencies
62
CHARLES RIVER LABORATORIES INTERNATIONAL, INC.
NOTES TO CONSOLIDATED FINANCIAL STATEMENTS (Continued)
For the Company’s subsidiaries that transact in a functional currency other than the U.S. dollar, assets and liabilities are translated at current rates of exchange as of the balance sheet date. Income and expense items are translated at the average foreign exchange rates for the period. Adjustments resulting from the translation of the financial statements of the Company’s foreign operations into U.S. dollars are excluded from the determination of net income and are recorded in accumulated other comprehensive loss, a separate component of equity.
Pension and Other Post-Retirement Benefit Plans
The Company recognizes the funded status of its defined benefit pension and other post-retirement benefit plans as an asset or liability. This amount is defined as the difference between the fair value of plan assets and the benefit obligation. The Company measures plan assets and benefit obligations as of its fiscal year end.
The key assumptions used to calculate benefit obligations and related pension costs include expected long-term rate of return on plan assets, withdrawal and mortality rates, expected rate of increase in employee compensation levels and a discount rate. Assumptions are determined based on the Company’s data and appropriate market indicators, and evaluated each year as of the plan’s measurement date.
The expected long-term rate of return on plan assets reflects the average rate of earnings expected on the funds invested, or to be invested, to provide for the benefits included in the projected benefit obligations. In determining the expected long-term rate of return on plan assets, the Company considers the relative weighting of plan assets, the historical performance of total plan assets and individual asset classes and economic and other indicators of future performance.
In fiscal year 2018, new mortality improvement scales were issued in the U.S. and the United Kingdom (U.K.) reflecting a decline in longevity projection from the 2017 releases that the Company adopted, which decreased the Company’s benefit obligations by
$1.7 million
as of December 29, 2018. In fiscal year 2017, new mortality improvement scales were issued in the U.S. reflecting a decline in longevity projection from the 2016 releases that the Company adopted, which decreased the Company’s benefit obligations by
$5.2 million
as of December 30, 2017.
The discount rate reflects the rate the Company would have to pay to purchase high-quality investments that would provide cash sufficient to settle its current pension obligations. A 25 basis point change across all discount rates changes the projected benefit obligation by approximately
$16 million
to
$17 million
for all Company plans.
The rate of compensation increase reflects the expected annual salary increases for the plan participants based on historical experience and the current employee compensation strategy.
The Company is required to recognize as a component of other comprehensive income, net of tax, the actuarial gains or losses and prior service costs or credits that arise but were not previously required to be recognized as components of net periodic benefit cost. Other comprehensive income is adjusted as these amounts are later recognized in income as components of net periodic benefit cost.
The Company records the service cost component of the net periodic benefit cost within Cost of services provided and Selling, general, and administrative expenses (within Operating income) and all other components of net periodic benefit cost within Other income, net in the consolidated statements of income.
Earnings Per Share
Basic earnings per share is calculated by dividing net income attributable to common shareholders by the weighted average number of common shares outstanding during the period. Except where the result would be anti-dilutive to income from continuing operations, diluted earnings per share is computed using the treasury stock method, assuming the exercise of stock options and the vesting of restricted stock awards, RSUs, or PSUs, as well as their related income tax effects.
Treasury Shares
The Company periodically retires treasury shares acquired through share repurchases and returns those shares to the status of authorized but unissued. The Company accounts for treasury stock transactions under the cost method. For each reacquisition of common stock, the number of shares and the acquisition price for those shares is added to the existing treasury stock count and total value. Thus, the average cost per share is re-averaged each time shares are acquired. When treasury shares are retired, the Company allocates the excess of the repurchase price over the par value of shares acquired to both retained earnings and additional paid-in-capital. The portion allocated to additional paid-in-capital is determined by applying a percentage, determined by dividing the number of shares to be retired by the number of shares issued, to the balance of additional paid-in-capital as of the retirement date.
63
CHARLES RIVER LABORATORIES INTERNATIONAL, INC.
NOTES TO CONSOLIDATED FINANCIAL STATEMENTS (Continued)
Newly Adopted Accounting Pronouncements
In March 2018, the Financial Accounting Standards Board (FASB) issued Accounting Standards Update (ASU) 2018-05, “Income Taxes (Topic 740) - Amendments to SEC Paragraphs Pursuant to SEC Staff Accounting Bulletin No. 118 (SAB 118).” This standard amends Accounting Standards Codification 740, Income Taxes (ASC 740) to provide guidance on accounting for the tax effects of U.S. Tax Reform pursuant to SAB 118, which allows companies to complete the accounting under ASC 740 within a one-year measurement period from the enactment date of U.S. Tax Reform. This standard is effective upon issuance and the Company has complied with the amendments. The Company’s accounting for the elements of U.S. Tax Reform is complete. See Note 11, “Income Taxes” for further discussion.
In February 2018, the FASB issued ASU 2018-02, “Income Statement - Reporting Comprehensive Income (Topic 220) Reclassification of Certain Tax Effects from Accumulated Other Comprehensive Income.” The standard allows for reclassification from accumulated other comprehensive income to retained earnings for the stranded tax effects arising from the change in the reduction of the U.S. federal statutory income tax rate to 21% from 35%. The Company elected to early adopt this standard in fiscal year 2018 as permitted on a prospective basis, resulting in a reclassification of
$3.3 million
from Accumulated other comprehensive income to Retained earnings as a result of remeasuring the Company’s deferred tax liabilities related to its pension and other post-retirement benefit plan gains and losses. The Company’s policy is to release material stranded tax effects on a specific identification basis.
In March 2017, the FASB issued ASU 2017-07, “Improving the Presentation of Net Periodic Pension Cost and Net Periodic Postretirement Benefit Cost.” The standard requires an employer to disaggregate the service cost component from the other components of net benefit cost and provides explicit guidance on the presentation of the service cost component and the other components of net benefit cost in the statements of income. The Company adopted this standard in fiscal year 2018 and applied the changes retrospectively to the presentation of the service cost component and the other components of net periodic pension cost in the consolidated statements of income for all periods presented as required. The adoption of this standard had no impact on Net income, however increased Operating income by
$0.8 million
and
$0.1 million
during fiscal years 2017 and 2016, respectively. In connection with the impact of Operating income to the Company’s reportable segments for fiscal year 2017, Research Models and Services (RMS) decreased by
$0.1 million
, Discovery and Safety Assessment (DSA) decreased by
$1.3 million
, Manufacturing Support (Manufacturing) decreased by less than
$0.1 million
, and Unallocated corporate increased by
$2.2 million
. For fiscal year 2016, Operating income for RMS increased by
$0.1 million
, DSA decreased by
$2.8 million
, Manufacturing increased by less than
$0.1 million
, and Unallocated corporate increased by
$2.8 million
.
In January 2017, the FASB issued ASU 2017-01, “Clarifying the Definition of a Business.” The standard clarifies the definition of a business by adding guidance to assist entities in evaluating whether transactions should be accounted for as acquisitions of assets or businesses. The Company’s adoption of this standard in fiscal year 2018 did not have a significant impact on the consolidated financial statements and related disclosures.
In October 2016, the FASB issued ASU 2016-16, “Intra-Entity Transfers of Assets Other Than Inventory.” The standard requires the immediate recognition of tax effects for an intra-entity asset transfer other than inventory. The Company’s adoption of this standard in fiscal year 2018 did not have a significant impact on the consolidated financial statements and related disclosures.
In January 2016, the FASB issued ASU 2016-01, “Recognition and Measurement of Financial Assets and Liabilities.” This standard, including a subsequently issued amendment under ASU 2018-03, “Technical Corrections and Improvements to Financial Instruments - Recognition and Measurement of Financial Assets and Financial Liabilities”, requires equity investments that are not accounted for under the equity method of accounting to be measured at fair value with changes recognized in net income, simplifies the impairment assessment of certain equity investments, and updates certain presentation and disclosure requirements. The Company adopted this standard in fiscal year 2018, resulting in an increase of
$1.9 million
to Other assets with a corresponding increase to Retained earnings and Deferred taxes of
$1.4 million
and
$0.5 million
, respectively.
In May 2014, the FASB issued ASU 2014-09, “Revenue from Contracts with Customers.” The standard, including subsequently issued amendments, collectively referred to Accounting Standard Codification (ASC) 606, “Revenue From Contracts With Customers”, replaced most existing revenue recognition guidance in U.S. GAAP and permits the use of either a modified retrospective or cumulative effect transition method. The Company elected the modified retrospective transition method. The standard requires an entity to recognize the amount of revenue to which it expects to be entitled for the transfer of promised goods or services to customers. The Company adopted this standard in fiscal year 2018. See Note 3, “Revenue From Contracts With Customers” for a discussion of the Company’s adoption of this standard and its impact on the consolidated financial statements and related disclosures.
64
CHARLES RIVER LABORATORIES INTERNATIONAL, INC.
NOTES TO CONSOLIDATED FINANCIAL STATEMENTS (Continued)
Newly Issued Accounting Pronouncements
In August 2018, the FASB issued ASU 2018-15, “Intangibles - Goodwill and Other - Internal-Use Software (Subtopic 350-40): Customer’s Accounting for Implementation Costs Incurred in a Cloud Computer Arrangement that is a Service Contract.” ASU 2018-15 aligns the requirements for capitalizing implementation costs incurred in a hosting arrangement that is a service contract with the requirements for capitalizing implementation costs incurred to develop or obtain internal-use software (and hosting arrangements that include an internal-use software license). The ASU is effective for fiscal years beginning after December 15, 2019, and interim periods within those fiscal years and will be applied either retrospectively or prospectively. Early adoption is permitted. The Company is still evaluating the impact this standard will have on its consolidated financial statements and related disclosures.
In August 2018, the FASB issued ASU 2018-14, “Compensation Retirement Benefits - Defined Benefit Plans -General (Subtopic 715-20).” ASU 2018-14 removes the requirements to disclose the amounts in Accumulated other comprehensive income (loss) expected to be recognized as components of net periodic benefit cost over the next fiscal year and the related party disclosures about the amount of future annual benefits covered by insurance contracts. In addition, the ASU adds the requirement to disclose an explanation for any significant gains and losses related to changes in the benefit obligation for the period. The ASU is effective for fiscal years ending after December 15, 2020 and will be applied on a retrospective basis to all periods presented. Early adoption is permitted. The Company is still evaluating the impact this standard will have on its consolidated financial statements and related disclosures.
In August 2018, the FASB issued ASU 2018-13, “Fair Value Measurement (Topic 820) - Disclosure Framework - Changes to the Disclosure Requirements for Fair Value Measurement.” ASU 2018-13 removes the disclosure requirement for the amount and reasons for transfers between Level 1 and Level 2 fair value measurements as well as the process for Level 3 fair value measurements. In addition, the ASU adds the disclosure requirements for changes in unrealized gains and losses included in Other comprehensive income (loss) for recurring Level 3 fair value measurements held at the end of the reporting period as well as the range and weighted average of significant unobservable inputs used to develop Level 3 fair value measurements. The ASU is effective for fiscal years beginning after December 15, 2019, and interim periods within those fiscal years and will be applied on a retrospective basis to all periods presented. Early adoption is permitted. The Company is still evaluating the impact this standard will have on its consolidated financial statements and related disclosures.
In June 2018, the FASB issued ASU 2018-07, “Stock Compensation (Topic 718): Improvements to Nonemployee Share-Based Payment Accounting.” ASU 2018-07 aligns the accounting for share-based payment awards issued to employees and nonemployees as well as improves financial reporting for share-based payments to nonemployees. The ASU is effective for fiscal years beginning after December 15, 2018, and interim periods within those fiscal years and will be applied to all new option awards granted after the date of adoption. Early adoption is permitted. The adoption of this standard is not expected to have a material impact on the Company’s consolidated financial statements and related disclosures.
In August 2017, the FASB issued ASU 2017-12, “Derivatives and Hedging (Topic 815) Targeted Improvements to Accounting for Hedging Activities.” ASU 2017-12 refines and expands hedge accounting for both financial and commodity risks. It also creates more transparency around how economic results are presented, both on the face of the financial statements and in the disclosures. In addition, this ASU makes certain targeted improvements to simplify the application of hedge accounting guidance. This ASU is effective for fiscal years beginning after December 15, 2018, and interim periods within those fiscal years, and requires the modified retrospective approach. Early adoption is permitted. This update applies to all existing hedging relationships on the date of adoption with the cumulative effect of adoption being reflected as of the beginning of the fiscal year of adoption. The Company is still evaluating the impact this standard will have on its consolidated financial statements and related disclosures.
In January 2017, the FASB issued ASU 2017-04, “Simplifying the Test for Goodwill Impairment.” The standard simplifies the accounting for goodwill impairment by removing Step 2 of the goodwill impairment test, which requires a hypothetical purchase price allocation. This standard is effective for annual or interim goodwill impairment tests in fiscal years beginning after December 15, 2019, and will be applied on a prospective basis. Early adoption is permitted for interim or annual goodwill impairment tests performed on testing dates after January 1, 2017. The adoption of this standard is not expected to have a material impact on the Company’s consolidated financial statements and related disclosures.
In June 2016, the FASB issued ASU 2016-13, “Financial Instruments - Credit Losses.” The standard
requires a financial asset measured at amortized cost basis, such as accounts receivable, to be presented at the net amount expected to be collected based on relevant information about past events, including historical experience, current conditions, and reasonable and supportable forecasts that affect the collectability of the reported amount.
This ASU is effective for fiscal years beginning after December 15, 2019, and interim periods within those fiscal years, and requires the modified retrospective approach. Early adoption is
65
CHARLES RIVER LABORATORIES INTERNATIONAL, INC.
NOTES TO CONSOLIDATED FINANCIAL STATEMENTS (Continued)
permitted. The Company is still evaluating the impact this standard will have on its consolidated financial statements and related disclosures.
In February 2016, the FASB issued ASU 2016-02, “Leases.” The standard, including subsequently issued amendments, collectively referred to as ASC 842, “Leases”, established the principles that lessees and lessors will apply to report useful information to users of financial statements about the amount, timing and uncertainty of cash flows arising from a lease. This ASU is effective for fiscal years beginning after December 15, 2018, and interim periods within those fiscal years. Early adoption is permitted.
The Company will adopt this standard using a modified retrospective transition approach as applied to leases existing as of or entered into after the adoption date. The implementation team has substantially completed its assessment of the new standard, including a detailed review of the Company’s lease portfolio, and impact on its existing lease accounting policies and newly required financial statement disclosures. In the first quarter of fiscal year 2019, the Company is implementing a new lease accounting system and will enhance certain related business processes and internal controls to support the requirements of the new standard. The adoption of the new standard is expected to result in i) no significant change in the carrying values of assets and liabilities related to its finance leases, previously referred to as capital leases (See Note 9, “Long-Term Debt and Capital Lease Obligations”), ii) derecognition of assets and related liabilities pertaining to certain build-to-suit arrangements previously accounted for under ASC 840, “Leases” and recording them under the guidance of ASC 842, approximating
$26 million
, and iii) the recording of right-of-use assets and corresponding lease liabilities pertaining to its operating leases in its consolidated balance sheet of approximately
$130 million
. The Company does not expect the adoption of the new standard to have a significant impact upon its considered statements of income and cash flows.
2. BUSINESS ACQUISITIONS AND DIVESTITURE
MPI Research
On
April 3, 2018
, the Company acquired MPI Research, a non-clinical contract research organization (CRO) providing comprehensive testing services to biopharmaceutical and medical device companies worldwide. The acquisition enhances the Company’s position as a leading global early-stage CRO by strengthening its ability to partner with clients across the drug discovery and development continuum. The purchase price for MPI Research was
$829.7 million
in cash, subject to certain post-closing adjustments that may change the purchase price. The acquisition was funded by borrowings on the Company’s $
2.3B
Credit Facility as well as the issuance of the Company’s Senior Notes. See Note 9, “Long-Term Debt and Capital Lease Obligations.” This business is reported as part of the Company’s DSA reportable segment.
The preliminary purchase allocation of
$800.8 million
, net of
$27.7 million
of cash acquired and a final net working capital adjustment of
$1.2 million
, was as follows:
|
April 3, 2018
|
|||
|
(in thousands)
|
|||
|
Trade receivables (contractual amount of $35,073)
|
$
|
35,073
|
|
|
Inventories
|
4,463
|
|
|
|
Other current assets (excluding cash)
|
5,893
|
|
|
|
Property, plant and equipment
|
128,403
|
|
|
|
Goodwill
|
441,656
|
|
|
|
Definite-lived intangible assets
|
309,200
|
|
|
|
Other long-term assets
|
1,081
|
|
|
|
Deferred revenue
|
(23,926
|
)
|
|
|
Current liabilities
|
(32,885
|
)
|
|
|
Deferred tax liabilities
|
(65,945
|
)
|
|
|
Other long-term liabilities
|
(2,213
|
)
|
|
|
Total purchase price allocation
|
$
|
800,800
|
|
The purchase price allocation is subject to change as additional information becomes available concerning the fair value and tax basis of the assets acquired and liabilities assumed, including certain contracts and obligations. Any additional adjustments to the purchase price allocation will be made as soon as practicable but no later than one year from the date of acquisition. From the date of the acquisition through
December 29, 2018
, the Company recorded measurement-period adjustments related to the acquisition that resulted in an immaterial change to the purchase price allocation on a consolidated basis.
66
CHARLES RIVER LABORATORIES INTERNATIONAL, INC.
NOTES TO CONSOLIDATED FINANCIAL STATEMENTS (Continued)
The breakout of definite-lived intangible assets acquired was as follows:
|
Definite-Lived Intangible Assets
|
Weighted Average Amortization Life
|
||||
|
(in thousands)
|
(in years)
|
||||
|
Client relationships
|
$
|
264,900
|
|
13
|
|
|
Developed technology
|
23,400
|
|
3
|
||
|
Backlog
|
20,900
|
|
1
|
||
|
Total definite-lived intangible assets
|
$
|
309,200
|
|
12
|
|
The goodwill resulting from the transaction,
$4.1 million
of which is deductible for tax purposes due to a prior asset acquisition, is primarily attributable to the potential growth of the Company’s DSA business from customers introduced through MPI Research and the assembled workforce of the acquired business.
The Company incurred transaction and integration costs in connection with the acquisition of
$16.5 million
during fiscal year 2018, which were primarily included in Selling, general and administrative expenses within the consolidated statements of income.
MPI Research revenue and operating income from
April 3, 2018
through
December 29, 2018
was
$209.5 million
and
$33.4 million
, respectively. Beginning on
April 3, 2018
, MPI Research has been included in the operating results of the Company.
The following selected unaudited pro forma consolidated results of operations are presented as if the MPI Research acquisition had occurred as of the beginning of the period immediately preceding the period of acquisition after giving effect to certain adjustments. For fiscal year 2018, these adjustments included additional amortization of intangible assets and depreciation of fixed assets of
$14.1 million
, additional interest expense on borrowings of
$2.8 million
, elimination of intercompany activity and other one-time costs, and the tax impacts of these adjustments. For fiscal year 2017, these adjustments included additional amortization of intangible assets and depreciation of fixed assets of
$22.4 million
, additional interest expense on borrowings of
$27.1 million
, elimination of intercompany activity and other one-time costs, and the tax impacts of these adjustments.
|
Fiscal Year
|
|||||||
|
2018
|
2017
|
||||||
|
(in thousands)
|
|||||||
|
(unaudited)
|
|||||||
|
Revenue
|
$
|
2,328,213
|
|
$
|
2,095,385
|
|
|
|
Net income attributable to common shareholders
|
225,550
|
|
126,641
|
|
|||
These unaudited pro forma results of operations have been prepared for comparative purposes only, and they do not purport to be indicative of the results of operations that actually would have resulted had the acquisition occurred on the dates indicated or that may result in the future. No effect has been given for synergies, if any, that may be realized through the acquisition.
KWS BioTest Limited
On
January 11, 2018
, the Company acquired KWS BioTest Limited (KWS BioTest), a CRO specializing in
in vitro
and
in vivo
discovery testing services for immuno-oncology, inflammatory and infectious diseases. The acquisition enhances the Company’s discovery expertise, with complementary offerings that provide the Company’s customers with additional tools in the active therapeutic research areas of oncology and immunology. The purchase price for KWS BioTest was
$20.3 million
in cash, subject to certain post-closing adjustments that may change the purchase price, and was funded by the Company’s various borrowings. In addition to the initial purchase price, the transaction includes aggregate, undiscounted contingent payments of up to £
3.0 million
(approximately
$3.8 million
based on recent exchange rates), based on future performance. During the three months ended September 29, 2018, the terms of these contingent payments were amended, resulting in a fixed payment of £
2.0 million
(approximately
$2.5 million
based on recent exchange rates), due in the first quarter of fiscal year 2019. The KWS BioTest business is reported as part of the Company’s DSA reportable segment.
67
CHARLES RIVER LABORATORIES INTERNATIONAL, INC.
NOTES TO CONSOLIDATED FINANCIAL STATEMENTS (Continued)
The purchase price allocation of
$21.5 million
, net of
$1.0 million
of cash acquired and a final net working capital adjustment of
$0.4 million
, was as follows:
|
January 11, 2018
|
|||
|
(in thousands)
|
|||
|
Trade receivables (contractual amount of $1,309)
|
$
|
1,309
|
|
|
Other current assets (excluding cash)
|
99
|
|
|
|
Property, plant and equipment
|
1,136
|
|
|
|
Definite-lived intangible assets - client relationships
|
3,647
|
|
|
|
Goodwill
|
17,660
|
|
|
|
Current liabilities
|
(1,575
|
)
|
|
|
Deferred revenue
|
(151
|
)
|
|
|
Long-term liabilities
|
(596
|
)
|
|
|
Total purchase price allocation
|
$
|
21,529
|
|
From the date of the acquisition through
December 29, 2018
, the Company recorded measurement-period adjustments related to the acquisition that resulted in an immaterial change to the purchase price allocation on a consolidated basis. No further adjustments will be made to the purchase price allocation.
The only definite-lived intangible asset relates to client relationships, which will be amortized over a weighted average life of
12
years.
The goodwill resulting from the transaction is primarily attributable to the potential growth of the Company’s DSA business from customers introduced through KWS BioTest and the assembled workforce of the acquired business. The goodwill attributable to KWS BioTest is not deductible for tax purposes.
The Company incurred transaction and integration costs of
$0.7 million
in connection with the acquisition during fiscal year 2018, which were included in Selling, general and administrative expenses within the consolidated statements of income.
Pro forma financial information as well as actual revenue and operating income (loss) have not been included because KWS BioTest’s financial results are not significant when compared to the Company’s consolidated financial results.
Brains On-Line
On
August 4, 2017
, the Company acquired Brains On-Line, a CRO providing critical data that advances novel therapeutics for the treatment of central nervous system (CNS) diseases. Brains On-Line strategically expands the Company’s existing CNS capabilities and establishes the Company as a single-source provider for a broad portfolio of discovery CNS services. The purchase price for Brains On-Line was
$21.3 million
in cash and was funded by the Company’s various borrowings. In addition to the initial purchase price, the transaction includes aggregate, undiscounted contingent payments of up to €
6.7 million
(approximately
$7.7 million
based on recent exchange rates), based on future performance. The Brains On-Line business is reported as part of the Company’s DSA reportable segment.
The contingent payments become payable based on the achievement of certain revenue and earnings targets. If achieved, the payments become due in the first quarter of fiscal year 2019. The Company estimated the fair value of this contingent consideration based on a probability-weighted set of outcomes.
68
CHARLES RIVER LABORATORIES INTERNATIONAL, INC.
NOTES TO CONSOLIDATED FINANCIAL STATEMENTS (Continued)
The purchase price allocation of
$20.1 million
, net of
$0.6 million
of cash acquired, was as follows:
|
August 4, 2017
|
|||
|
(in thousands)
|
|||
|
Trade receivables (contractual amount of $1,146)
|
$
|
1,146
|
|
|
Other current assets (excluding cash)
|
640
|
|
|
|
Property, plant and equipment
|
664
|
|
|
|
Other long-term assets
|
29
|
|
|
|
Definite-lived intangible assets
|
9,300
|
|
|
|
Goodwill
|
12,582
|
|
|
|
Current liabilities
|
(1,683
|
)
|
|
|
Deferred revenue
|
(405
|
)
|
|
|
Long-term liabilities
|
(2,151
|
)
|
|
|
Total purchase price allocation
|
$
|
20,122
|
|
From the date of the acquisition through June 30, 2018, the Company recorded measurement-period adjustments related to the acquisition that resulted in an immaterial change to the purchase price allocation on a consolidated basis. No further adjustments will be made to the purchase price allocation.
The breakout of definite-lived intangible assets acquired was as follows:
|
Definite-Lived Intangible Assets
|
Weighted Average Amortization Life
|
||||
|
(in thousands)
|
(in years)
|
||||
|
Client relationships
|
$
|
7,000
|
|
13
|
|
|
Other intangible assets
|
2,300
|
|
10
|
||
|
Total definite-lived intangible assets
|
$
|
9,300
|
|
12
|
|
The goodwill resulting from the transaction is primarily attributable to the potential growth of the Company’s DSA businesses from customers and technology introduced through Brains On-Line and the assembled workforce of the acquired business. The goodwill attributable to Brains On-Line is not deductible for tax purposes.
No
significant integration costs were incurred in connection with the acquisition during fiscal year 2018. The Company incurred transaction and integration costs in connection with the acquisition of
$2.6 million
during fiscal year 2017, which were included in selling, general and administrative expenses within the consolidated statements of income.
Pro forma financial information as well as actual revenue and operating income (loss) have not been included because Brains On-Line’s financial results are not significant when compared to the Company’s consolidated financial results.
Agilux
On
September 28, 2016
, the Company acquired Agilux Laboratories, Inc. (Agilux), a CRO that provides a suite of integrated discovery bioanalytical services for small and large molecules, drug metabolism and pharmacokinetic services, and pharmacology services. The acquisition supports the Company’s strategy to offer clients a broader, integrated portfolio that provides services continuously from the earliest stages of drug research through the non-clinical development process. The purchase price for Agilux was
$64.9 million
in cash and was funded by borrowings on the Company’s revolving credit facility. The business is reported as part of the Company’s DSA reportable segment.
69
CHARLES RIVER LABORATORIES INTERNATIONAL, INC.
NOTES TO CONSOLIDATED FINANCIAL STATEMENTS (Continued)
The purchase price allocation of
$62.0 million
, net of
$2.9 million
of cash acquired, was as follows:
|
September 28, 2016
|
|||
|
(in thousands)
|
|||
|
Trade receivables (contractual amount of $4,799)
|
$
|
4,799
|
|
|
Other current assets (excluding cash)
|
794
|
|
|
|
Property, plant and equipment
|
3,907
|
|
|
|
Other long-term assets
|
11
|
|
|
|
Definite-lived intangible assets
|
21,900
|
|
|
|
Goodwill
|
44,517
|
|
|
|
Current liabilities
|
(3,812
|
)
|
|
|
Long-term liabilities
|
(10,091
|
)
|
|
|
Total purchase price allocation
|
$
|
62,025
|
|
From the date of the acquisition through September 30, 2017, the Company recorded measurement-period adjustments related to the acquisition that resulted in an immaterial change to the purchase price allocation on a consolidated basis. No further adjustments will be made to the purchase price allocation.
The breakout of definite-lived intangible assets acquired was as follows:
|
Definite-Lived Intangible Assets
|
Weighted Average Amortization Life
|
||||
|
(in thousands)
|
(in years)
|
||||
|
Client relationships
|
$
|
16,700
|
|
17
|
|
|
Other intangible assets
|
5,200
|
|
4
|
||
|
Total definite-lived intangible assets
|
$
|
21,900
|
|
14
|
|
The goodwill resulting from the transaction is primarily attributable to the potential growth of the Company’s DSA businesses from customers and technology introduced through Agilux and the assembled workforce of the acquired business. The goodwill attributable to Agilux is not deductible for tax purposes.
No
significant integration costs were incurred in connection with the acquisition during fiscal year 2018. The Company incurred transaction and integration costs of
$0.3 million
and
$1.7 million
, respectively, in connection with the acquisition during fiscal years 2017 and 2016, which were included in selling, general and administrative expenses within the consolidated statements of income.
Pro forma financial information as well as actual revenue and operating income (loss) have not been included because Agilux’s financial results are non-significant when compared with the Company’s consolidated financial results.
Blue Stream
On
June 27, 2016
, the Company acquired Blue Stream Laboratories, Inc. (Blue Stream), an analytical CRO supporting the development of complex biologics and biosimilars. Combining Blue Stream with the Company’s existing discovery, safety assessment, and biologics capabilities creates a leading CRO that has the ability to support biologic and biosimilar development from characterization through clinical testing and commercialization. The purchase price for Blue Stream was
$11.7 million
, including
$3.0 million
in contingent consideration, and was subject to certain customary adjustments. The acquisition was funded by borrowings on the Company’s revolving credit facility. The business is reported in the Company’s Manufacturing reportable segment.
The Company estimated the fair value of this contingent consideration based on a probability-weighted set of outcomes. The contingent consideration is a one-time payment payable based on the achievement of a revenue target. The target was achieved and the Company paid the
$3.0 million
in contingent consideration in the third quarter of fiscal year 2017.
70
CHARLES RIVER LABORATORIES INTERNATIONAL, INC.
NOTES TO CONSOLIDATED FINANCIAL STATEMENTS (Continued)
The purchase price allocation of
$11.7 million
, net of a non-significant amount of cash acquired, was as follows:
|
June 27, 2016
|
|||
|
(in thousands)
|
|||
|
Trade receivables (contractual amount of $1,104)
|
$
|
1,104
|
|
|
Other current assets (excluding cash)
|
15
|
|
|
|
Property, plant and equipment
|
912
|
|
|
|
Other long-term assets
|
187
|
|
|
|
Definite-lived intangible assets
|
1,230
|
|
|
|
Goodwill
|
10,334
|
|
|
|
Current liabilities
|
(1,132
|
)
|
|
|
Long-term liabilities
|
(901
|
)
|
|
|
Total purchase price allocation
|
$
|
11,749
|
|
From the date of the acquisition through July 1, 2017, the Company recorded measurement-period adjustments related to the acquisition that resulted in an immaterial change to the purchase price allocation on a consolidated basis. No further adjustments will be made to the purchase price allocation.
The breakout of definite-lived intangible assets acquired was as follows:
|
Definite-Lived Intangible Assets
|
Weighted Average Amortization Life
|
||||
|
(in thousands)
|
(in years)
|
||||
|
Client relationships
|
$
|
650
|
|
10
|
|
|
Other intangible assets
|
580
|
|
5
|
||
|
Total definite-lived intangible assets
|
$
|
1,230
|
|
7
|
|
The goodwill resulting from the transaction is primarily attributable to the potential growth of the Company’s Manufacturing segment from customers and technology introduced through Blue Stream, the assembled workforce of the acquired business, expected synergies, and the development of future proprietary processes. The goodwill attributable to Blue Stream is not deductible for tax purposes.
No
significant integration costs were incurred in connection with the acquisition during fiscal years 2018 and 2017. The Company incurred
$0.6 million
of transaction and integration costs in connection with the acquisition during fiscal year 2016, which were included in selling, general and administrative expenses within the consolidated statements of income.
Pro forma financial information as well as actual revenue and operating income (loss) have not been included because Blue Stream’s financial results are non-significant when compared with the Company’s consolidated financial results.
WIL Research
On
April 4, 2016
, the Company acquired WIL Research, a provider of safety assessment and CDMO services to biopharmaceutical and agricultural and industrial chemical companies worldwide. The acquisition enhanced the Company’s position as a leading, global, early-stage CRO by strengthening its ability to partner with clients across the drug discovery and development continuum. The purchase price for WIL Research was
$604.8 million
, including assumed liabilities of
$0.4 million
. The purchase price included payment for actual working capital of the acquired business. The acquisition was funded by cash on hand and borrowings on the Company’s
$1.65B
Credit Facility. See Note 9, “Long-Term Debt and Capital Lease Obligations.” WIL Research’s safety assessment and CDMO businesses are reported in the Company’s DSA and Manufacturing reportable segments, respectively. On February 10, 2017, the Company divested the CDMO business.
71
CHARLES RIVER LABORATORIES INTERNATIONAL, INC.
NOTES TO CONSOLIDATED FINANCIAL STATEMENTS (Continued)
The purchase price allocation of
$577.4 million
, net of
$27.4 million
of cash acquired, was as follows:
|
April 4, 2016
|
|||
|
(in thousands)
|
|||
|
Trade receivables (contractual amount of $48,625)
|
$
|
48,157
|
|
|
Inventories
|
2,296
|
|
|
|
Other current assets (excluding cash)
|
3,814
|
|
|
|
Property, plant and equipment
|
129,066
|
|
|
|
Other long-term assets
|
1,060
|
|
|
|
Definite-lived intangible assets
|
164,800
|
|
|
|
Goodwill
|
330,175
|
|
|
|
Deferred revenue
|
(39,103
|
)
|
|
|
Other current liabilities
|
(27,386
|
)
|
|
|
Long-term liabilities
|
(35,488
|
)
|
|
|
Total purchase price allocation
|
$
|
577,391
|
|
From the date of the acquisition through April 1, 2017, the Company recorded measurement-period adjustments related to the acquisition that resulted in an immaterial change to the purchase price allocation on a consolidated basis.
No further adjustments will be made to the purchase price allocation.
The breakout of definite-lived intangible assets acquired was as follows:
|
Definite-Lived Intangible Assets
|
Weighted Average Amortization Life
|
||||
|
(in thousands)
|
(in years)
|
||||
|
Client relationships
|
$
|
137,500
|
|
15
|
|
|
Developed technology
|
20,700
|
|
3
|
||
|
Backlog
|
6,600
|
|
1
|
||
|
Total definite-lived intangible assets
|
$
|
164,800
|
|
13
|
|
The goodwill resulting from the transaction,
$19.0 million
of which was deductible for tax purposes due to a prior asset acquisition, was primarily attributed to the potential growth of the Company’s DSA and Manufacturing businesses from clients introduced through WIL Research, the assembled workforce of the acquired business, and expected cost synergies. Subsequent to the divestiture of the CDMO business on February 10, 2017,
$14.8 million
of the goodwill was deductible for tax purposes.
No
significant integration costs were incurred in connection with the acquisition during fiscal year 2018. The Company incurred transaction and integration costs in connection with the acquisition of
$1.7 million
and
$15.5 million
during fiscal years 2017 and 2016, respectively, which were included in selling, general and administrative expenses within the consolidated statements of income.
WIL Research revenue and operating income from
April 4, 2016
through December 31, 2016 was
$176.1 million
and
$12.5 million
, respectively. Beginning on
April 4, 2016
, WIL Research has been included in the operating results of the Company.
The following selected unaudited pro forma consolidated results of operations are presented as if the WIL Research acquisition had occurred as of the beginning of the period immediately preceding the period of acquisition after giving effect to certain adjustments. For fiscal year 2016, these adjustments included additional amortization of intangible assets and depreciation of fixed assets of
$0.4 million
, reversal of interest expense on borrowings of
$2.6 million
, elimination of intercompany activity and other one-time costs, and the tax impacts of these adjustments.
|
Fiscal Year 2016
|
|||
|
(in thousands)
|
|||
|
(unaudited)
|
|||
|
Revenue
|
$
|
1,741,964
|
|
|
Net income attributable to common shareholders
|
175,779
|
|
|
72
CHARLES RIVER LABORATORIES INTERNATIONAL, INC.
NOTES TO CONSOLIDATED FINANCIAL STATEMENTS (Continued)
These unaudited pro forma results of operations have been prepared for comparative purposes only, and they do not purport to be indicative of the results of operations that actually would have resulted had the acquisition occurred on the date indicated or that may result in the future. No effect has been given for synergies, if any, that may have been realized through the acquisition.
Contract Manufacturing
On
February 10, 2017
, the Company sold its CDMO business to Quotient Clinical Ltd., based in London, England, for
$75.0 million
in proceeds, net of
$0.6 million
in cash and cash equivalents transferred in conjunction with the sale and
$0.3 million
of working capital adjustments.
The CDMO business was acquired in April 2016 as part of the acquisition of WIL Research and was reported in the Company’s Manufacturing reportable segment. The Company determined that the CDMO business was not optimized within the Company’s portfolio at its current scale, and that the capital could be better deployed in other long-term growth opportunities.
During the three months ended April 1, 2017, the Company recorded a gain on the divestiture of the CDMO business of
$10.6 million
, which was included in other income, net within the Company’s consolidated statements of income. The carrying amounts of the major classes of assets and liabilities associated with the divestiture of the CDMO business were as follows:
|
February 10, 2017
|
|||
|
(in thousands)
|
|||
|
Assets
|
|||
|
Current assets
|
$
|
5,505
|
|
|
Property, plant and equipment, net
|
11,174
|
|
|
|
Goodwill
|
35,857
|
|
|
|
Long-term assets
|
17,154
|
|
|
|
Total assets
|
$
|
69,690
|
|
|
Liabilities
|
|||
|
Deferred revenue
|
$
|
4,878
|
|
|
Other current liabilities
|
1,158
|
|
|
|
Total liabilities
|
$
|
6,036
|
|
3. REVENUE FROM CONTRACTS WITH CUSTOMERS
Adoption of ASC Topic 606, “Revenue from Contracts with Customers” (ASC 606)
ASC 606 became effective for the Company on December 31, 2017 and was adopted using the modified retrospective method for all contracts not completed as of the date of adoption. For contracts that were modified before the effective date, the Company reflected the aggregate effect of all modifications when identifying performance obligations and allocating transaction price in accordance with the practical expedient, which did not have a material effect on the cumulative impact of adopting ASC 606. The reported results for fiscal year 2018 reflect the application of ASC 606 guidance while the historical results for fiscal years 2017 and 2016 were prepared under the guidance of ASC 605, “Revenue Recognition” (ASC 605).
The cumulative effect of applying ASC 606 to all contracts with customers that were not completed as of
December 30, 2017
was immaterial. There is no material difference in the reporting of revenue during fiscal year
2018
in accordance with ASC 606 when compared to ASC 605.
Disaggregation of Revenue
The following tables disaggregate the Company’s revenue by major business line and timing of transfer of products or services:
|
Major Products/Service Lines:
|
2018
|
||
|
(in thousands)
|
|||
|
RMS
|
$
|
519,682
|
|
|
DSA
|
1,316,854
|
|
|
|
Manufacturing
|
429,560
|
|
|
|
Total revenue
|
$
|
2,266,096
|
|
73
CHARLES RIVER LABORATORIES INTERNATIONAL, INC.
NOTES TO CONSOLIDATED FINANCIAL STATEMENTS (Continued)
|
Timing of Revenue Recognition:
|
2018
|
||
|
(in thousands)
|
|||
|
RMS
|
|||
|
Services and products transferred over time
|
$
|
202,872
|
|
|
Services and products transferred at a point in time
|
316,810
|
|
|
|
DSA
|
|||
|
Services and products transferred over time
|
1,316,005
|
|
|
|
Services and products transferred at a point in time
|
849
|
|
|
|
Manufacturing
|
|||
|
Services and products transferred over time
|
128,287
|
|
|
|
Services and products transferred at a point in time
|
301,273
|
|
|
|
Total revenue
|
$
|
2,266,096
|
|
RMS
The RMS business generates revenue through the commercial production and sale of research models and the provision of services related to the maintenance and monitoring of research models and management of clients’ research operations. Revenue from the sale of research models is recognized at a point in time when the customer obtains control of the product, which may be upon shipment or upon delivery based on the shipping terms of a contract. Revenue generated from research models services is recognized over time and is typically based on a right-to-invoice measure of progress (output method) as invoiced amounts correspond directly to the value of the Company’s performance to date.
DSA
The Discovery and Safety Assessment business provides a full suite of integrated drug discovery services directed at the identification, screening and selection of a lead compound for drug development and offers a full range of safety assessment services including bioanalysis, drug metabolism, pharmacokinetics, toxicology and pathology. Discovery and Safety Assessment services revenue is generally recognized over time using the cost-to-cost or right to invoice measures of progress, primarily representing fixed fee service contracts and per unit service contracts, respectively.
Manufacturing
The Manufacturing business includes Microbial Solutions, which provides
in vitro
(non-animal) lot-release testing products, microbial detection products, and species identification services; Biologics Testing Services (Biologics), which performs specialized testing of biologics; and Avian Vaccine Services (Avian), which supplies specific-pathogen-free chicken eggs and chickens. Species identification service revenue is generally recognized at a point in time as identifications are completed by the Company. Biologics service revenue is generally recognized over time using the cost-to-cost measure of progress. Microbial Solutions and Avian product sales are generally recognized at a point in time when the customer obtains control of the product, which may be upon shipment or upon delivery based on the contractual shipping terms of a contract.
Transaction Price Allocated to Future Performance Obligations
ASC 606 requires that the Company disclose the aggregate amount of transaction price that is allocated to performance obligations that have not yet been satisfied as of
December 29, 2018
. The guidance provides certain practical expedients that limit this requirement and, therefore, the Company does not disclose the value of unsatisfied performance obligations for (i) contracts with an original expected length of one year or less and (ii) contracts for which revenue is recognized at the amount to which the Company has the right to invoice for services performed.
The following table includes estimated revenue expected to be recognized in the future related to performance obligations that are unsatisfied (or partially satisfied) as of
December 29, 2018
:
74
CHARLES RIVER LABORATORIES INTERNATIONAL, INC.
NOTES TO CONSOLIDATED FINANCIAL STATEMENTS (Continued)
|
Revenue Expected to be Recognized in Future Periods
|
|||||||||||||||||||
|
Less than 1 Year
|
1 to 3 Years
|
4 to 5 Years
|
Beyond 5 Years
|
Total
|
|||||||||||||||
|
(in thousands)
|
|||||||||||||||||||
|
DSA
|
$
|
138,132
|
|
$
|
94,230
|
|
$
|
5,022
|
|
$
|
647
|
|
$
|
238,031
|
|
||||
|
Manufacturing
|
10,584
|
|
20,193
|
|
6,448
|
|
31
|
|
37,256
|
|
|||||||||
|
Total
|
$
|
148,716
|
|
$
|
114,423
|
|
$
|
11,470
|
|
$
|
678
|
|
$
|
275,287
|
|
||||
Contract Balances from Contracts with Customers
The timing of revenue recognition, billings and cash collections results in billed receivables (client receivables), contract assets (unbilled revenue), contract liabilities (current and non-current deferred revenue), and customer deposits on the consolidated balance sheets. The Company’s payment terms are generally 30 days in the United States and consistent with prevailing practice in international markets. A contract asset is recorded when a right to consideration in exchange for goods or services transferred to a customer is conditioned other than the passage of time. Client receivables are recorded separately from contract assets since only the passage of time is required before consideration is due. A contract liability is recorded when consideration is received, or such consideration is unconditionally due, from a customer prior to transferring goods or services to the customer under the terms of a contract. Contract liabilities are recognized as revenue after control of the products or services is transferred to the customer and all revenue recognition criteria have been met. The following table provides information about client receivables, contract assets, and contract liabilities from contracts with customers:
|
December 29, 2018
|
December 30, 2017
(1)
|
||||||
|
(in thousands)
|
|||||||
|
Balances from contracts with customers only:
|
|||||||
|
Client receivables
|
$
|
370,131
|
|
$
|
335,839
|
|
|
|
Contract assets (unbilled revenue)
|
105,216
|
|
96,297
|
|
|||
|
Contract liabilities (current and long-term deferred revenue)
|
179,559
|
|
125,882
|
|
|||
|
Contract liabilities (customer contract deposits)
|
38,245
|
|
—
|
|
|||
|
(1)
The beginning balance as of December 30, 2017 is presented under the guidance of ASC 605.
|
|||||||
Under ASC 606, when the Company does not have the unconditional right to advanced billings, both advanced client payments and unpaid advanced client billings are excluded from deferred revenue, with the advanced billings also being excluded from client receivables. As of
December 29, 2018
, the Company excluded approximately
$22 million
of unpaid advanced client billings from both client receivables and deferred revenue and approximately
$38 million
of advanced client payments have been presented as customer contract deposits within other current liabilities in the accompanying consolidated balance sheets.
Other changes in the contract asset and the contract liability balances during fiscal year
2018
were as follows:
(i) Changes due to business combinations:
See Note 2. “Business Acquisitions and Divestiture” for client receivables, unbilled revenue, deferred revenue, and customer contract deposits that were acquired as part of the MPI Research acquisition occurring on April 3, 2018 and the KWS BioTest acquisition occurring on January 11, 2018.
(ii) Cumulative catch-up adjustments to revenue that affect the corresponding contract asset or contract liability, including adjustments arising from a change in the measure of progress, a change in an estimate of the transaction price (including any changes in the assessment of whether an estimate of variable consideration is constrained), or a contract modification:
During fiscal year
2018
, an immaterial cumulative catch-up adjustment to revenue was recorded.
(iii) A change in the time frame for a right to consideration to become unconditional (that is, for a contract asset to be recorded as a client receivable):
Approximately
$92 million
of unbilled revenue as of
December 30, 2017
was billed during fiscal year
2018
.
(iv) A change in the time frame for a performance obligation to be satisfied (that is, for the recognition of revenue arising from a contract liability):
75
CHARLES RIVER LABORATORIES INTERNATIONAL, INC.
NOTES TO CONSOLIDATED FINANCIAL STATEMENTS (Continued)
Approximately
$101 million
of contract liabilities as of
December 30, 2017
were recognized as revenue during fiscal year
2018
.
4. SEGMENT AND GEOGRAPHIC INFORMATION
The Company’s
three
reportable segments are Research Models and Services (RMS), Discovery and Safety Assessment (DSA), and Manufacturing Support (Manufacturing). Asset information on a reportable segment basis is not disclosed as this information is not separately identified and internally reported to the Company’s Chief Operating Decision Maker. The Company retrospectively adopted ASU 2017-07 in fiscal year 2018, which impacted segment information. Service cost is reflected in operating income within the consolidated statements of income while all other components of net periodic cost are recorded in other income, net within the consolidated statements of income. See Note 1, “Description of Business and Summary of Significant Accounting Policies.”
The following table presents revenue and other financial information by reportable segment:
|
2018
|
2017
|
2016
|
|||||||||
|
(in thousands)
|
|||||||||||
|
RMS
|
|
|
|
||||||||
|
Revenue
|
$
|
519,682
|
|
$
|
493,615
|
|
$
|
494,037
|
|
||
|
Operating income
|
136,468
|
|
114,588
|
|
136,418
|
|
|||||
|
Depreciation and amortization
|
19,469
|
|
19,627
|
|
20,853
|
|
|||||
|
Capital expenditures
|
35,172
|
|
20,879
|
|
11,642
|
|
|||||
|
DSA
|
|
|
|
|
|||||||
|
Revenue
|
$
|
1,316,854
|
|
$
|
980,022
|
|
$
|
836,593
|
|
||
|
Operating income
|
227,577
|
|
182,796
|
|
135,379
|
|
|||||
|
Depreciation and amortization
|
112,976
|
|
79,355
|
|
71,816
|
|
|||||
|
Capital expenditures
|
73,425
|
|
36,616
|
|
27,493
|
|
|||||
|
Manufacturing
|
|||||||||||
|
Revenue
|
$
|
429,560
|
|
$
|
383,964
|
|
$
|
350,802
|
|
||
|
Operating income
|
136,212
|
|
123,898
|
|
104,561
|
|
|||||
|
Depreciation and amortization
|
22,529
|
|
22,893
|
|
25,566
|
|
|||||
|
Capital expenditures
|
23,323
|
|
15,188
|
|
12,247
|
|
|||||
The following tables present reconciliations of segment operating income, depreciation and amortization, and capital expenditures to the respective consolidated amounts:
|
Operating Income
|
Depreciation and Amortization
|
||||||||||||||||||||||
|
2018
|
2017
|
2016
|
2018
|
2017
|
2016
|
||||||||||||||||||
|
(in thousands)
|
|||||||||||||||||||||||
|
Total reportable segments
|
$
|
500,257
|
|
$
|
421,282
|
|
$
|
376,358
|
|
$
|
154,974
|
|
$
|
121,875
|
|
$
|
118,235
|
|
|||||
|
Unallocated corporate
|
(168,874
|
)
|
(133,000
|
)
|
(138,806
|
)
|
6,805
|
|
9,284
|
|
8,423
|
|
|||||||||||
|
Total consolidated
|
$
|
331,383
|
|
$
|
288,282
|
|
$
|
237,552
|
|
$
|
161,779
|
|
$
|
131,159
|
|
$
|
126,658
|
|
|||||
|
Capital Expenditures
|
|||||||||||
|
2018
|
2017
|
2016
|
|||||||||
|
(in thousands)
|
|||||||||||
|
Total reportable segments
|
$
|
131,920
|
|
$
|
72,683
|
|
$
|
51,382
|
|
||
|
Unallocated corporate
|
8,134
|
|
9,748
|
|
3,906
|
|
|||||
|
Total consolidated
|
$
|
140,054
|
|
$
|
82,431
|
|
$
|
55,288
|
|
||
Revenue for each significant product or service offering is as follows
:
76
CHARLES RIVER LABORATORIES INTERNATIONAL, INC.
NOTES TO CONSOLIDATED FINANCIAL STATEMENTS (Continued)
|
2018
|
2017
|
2016
|
|||||||||
|
(in thousands)
|
|||||||||||
|
RMS
|
$
|
519,682
|
|
$
|
493,615
|
|
$
|
494,037
|
|
||
|
DSA
|
1,316,854
|
|
980,022
|
|
836,593
|
|
|||||
|
Manufacturing
|
429,560
|
|
383,964
|
|
350,802
|
|
|||||
|
Total revenue
|
$
|
2,266,096
|
|
$
|
1,857,601
|
|
$
|
1,681,432
|
|
||
A summary of unallocated corporate expense consists of the following
:
|
2018
|
2017
|
2016
|
|||||||||
|
(in thousands)
|
|||||||||||
|
Stock-based compensation
|
$
|
32,068
|
|
$
|
27,114
|
|
$
|
27,272
|
|
||
|
Compensation, benefits, and other employee-related expenses
|
69,191
|
|
46,920
|
|
36,349
|
|
|||||
|
External consulting and other service expenses
|
18,652
|
|
22,224
|
|
23,421
|
|
|||||
|
Information technology
|
12,463
|
|
11,997
|
|
13,233
|
|
|||||
|
Depreciation
|
6,805
|
|
9,284
|
|
8,423
|
|
|||||
|
Acquisition and integration
|
16,295
|
|
3,728
|
|
15,608
|
|
|||||
|
Other general unallocated corporate
|
13,400
|
|
11,733
|
|
14,500
|
|
|||||
|
Total unallocated corporate expense
|
$
|
168,874
|
|
$
|
133,000
|
|
$
|
138,806
|
|
||
Other general unallocated corporate expense consists of costs associated with departments such as senior executives, corporate accounting, legal, tax, human resources, treasury, and investor relations.
Revenue and long-lived assets by geographic area are as follows:
|
U.S.
|
Europe
|
Canada
|
Asia Pacific
|
Other
|
Consolidated
|
||||||||||||||||||
|
(in thousands)
|
|||||||||||||||||||||||
|
2018
|
|||||||||||||||||||||||
|
Revenue
|
$
|
1,267,620
|
|
$
|
643,957
|
|
$
|
206,382
|
|
$
|
142,495
|
|
$
|
5,642
|
|
$
|
2,266,096
|
|
|||||
|
Long-lived assets
|
597,223
|
|
205,185
|
|
74,051
|
|
56,262
|
|
156
|
|
932,877
|
|
|||||||||||
|
2017
|
|
|
|
|
|
|
|||||||||||||||||
|
Revenue
|
$
|
959,263
|
|
$
|
569,812
|
|
$
|
200,343
|
|
$
|
126,462
|
|
$
|
1,721
|
|
$
|
1,857,601
|
|
|||||
|
Long-lived assets
|
446,574
|
|
203,911
|
|
82,228
|
|
49,020
|
|
240
|
|
781,973
|
|
|||||||||||
|
2016
|
|
|
|
|
|
|
|
||||||||||||||||
|
Revenue
|
$
|
850,422
|
|
$
|
520,937
|
|
$
|
194,210
|
|
$
|
114,710
|
|
$
|
1,153
|
|
$
|
1,681,432
|
|
|||||
|
Long-lived assets
|
462,330
|
|
177,423
|
|
78,866
|
|
37,111
|
|
97
|
|
755,827
|
|
|||||||||||
Included in the Asia Pacific category above are operations located in China, Japan, Singapore, India, Australia, and Korea. Included in the Other category above are operations located in Brazil and Israel. Revenue represents sales originating in entities physically located in the identified geographic area. Long-lived assets consist of property, plant, and equipment, net.
77
CHARLES RIVER LABORATORIES INTERNATIONAL, INC.
NOTES TO CONSOLIDATED FINANCIAL STATEMENTS (Continued)
5. SUPPLEMENTAL BALANCE SHEET INFORMATION
The composition of trade receivables, net is as follows:
|
December 29, 2018
|
December 30, 2017
|
||||||
|
(in thousands)
|
|||||||
|
Client receivables
|
$
|
370,131
|
|
$
|
335,839
|
|
|
|
Unbilled revenue
|
105,216
|
|
96,297
|
|
|||
|
Total
|
475,347
|
|
432,136
|
|
|||
|
Less: Allowance for doubtful accounts
|
(3,099
|
)
|
(2,120
|
)
|
|||
|
Trade receivables, net
|
$
|
472,248
|
|
$
|
430,016
|
|
|
The following amounts were recorded to the allowance for doubtful accounts in fiscal years
2018
,
2017
, and
2016
; net provisions of
$2.1 million
; net provisions of
$0.9 million
; and net recoveries of
$0.5 million
, respectively.
The composition of inventories is as follows:
|
December 29, 2018
|
December 30, 2017
|
||||||
|
(in thousands)
|
|||||||
|
Raw materials and supplies
|
$
|
22,378
|
|
$
|
19,858
|
|
|
|
Work in process
|
21,732
|
|
18,200
|
|
|||
|
Finished products
|
83,782
|
|
76,898
|
|
|||
|
Inventories
|
$
|
127,892
|
|
$
|
114,956
|
|
|
The composition of other current assets is as follows:
|
December 29, 2018
|
December 30, 2017
|
||||||
|
(in thousands)
|
|||||||
|
Investments
|
$
|
885
|
|
$
|
28,489
|
|
|
|
Prepaid income tax
|
47,157
|
|
52,234
|
|
|||
|
Restricted cash
|
465
|
|
592
|
|
|||
|
Other
|
300
|
|
—
|
|
|||
|
Other current assets
|
$
|
48,807
|
|
$
|
81,315
|
|
|
78
CHARLES RIVER LABORATORIES INTERNATIONAL, INC.
NOTES TO CONSOLIDATED FINANCIAL STATEMENTS (Continued)
The composition of property, plant and equipment, net is as follows:
|
December 29, 2018
|
December 30, 2017
|
||||||
|
(in thousands)
|
|||||||
|
Land
|
$
|
52,266
|
|
$
|
48,989
|
|
|
|
Buildings
(1)
|
938,184
|
|
812,230
|
|
|||
|
Machinery and equipment
(1)
|
501,894
|
|
450,992
|
|
|||
|
Leasehold improvements
|
59,854
|
|
52,969
|
|
|||
|
Furniture and fixtures
|
26,700
|
|
27,455
|
|
|||
|
Computer hardware and software
(1)
|
166,398
|
|
140,216
|
|
|||
|
Vehicles
(1)
|
5,167
|
|
4,582
|
|
|||
|
Construction in progress
|
56,549
|
|
45,518
|
|
|||
|
Total
|
1,807,012
|
|
1,582,951
|
|
|||
|
Less: Accumulated depreciation
|
(874,135
|
)
|
(800,978
|
)
|
|||
|
Property, plant and equipment, net
|
$
|
932,877
|
|
$
|
781,973
|
|
|
(1)
These balances include assets under capital lease. See Note 9, “Long-Term Debt and Capital Lease Obligations.”
Depreciation expense in fiscal years
2018
,
2017
and
2016
was
$96.9 million
,
$89.8 million
and
$85.0 million
, respectively.
The composition of other assets is as follows:
|
December 29, 2018
|
December 30, 2017
|
||||||
|
(in thousands)
|
|||||||
|
Life insurance policies
|
$
|
32,340
|
|
$
|
34,008
|
|
|
|
Venture capital investments
|
88,591
|
|
71,101
|
|
|||
|
Restricted cash
|
1,411
|
|
1,945
|
|
|||
|
Other
|
21,417
|
|
16,948
|
|
|||
|
Other assets
|
$
|
143,759
|
|
$
|
124,002
|
|
|
The composition of other current liabilities is as follows:
|
December 29, 2018
|
December 30, 2017
|
||||||
|
(in thousands)
|
|||||||
|
Accrued income taxes
|
$
|
24,120
|
|
$
|
43,250
|
|
|
|
Customer contract deposits
|
38,245
|
|
—
|
|
|||
|
Other
|
8,915
|
|
1,210
|
|
|||
|
Other current liabilities
|
$
|
71,280
|
|
$
|
44,460
|
|
|
The composition of other long-term liabilities is as follows:
|
December 29, 2018
|
December 30, 2017
|
||||||
|
(in thousands)
|
|||||||
|
U.S. Transition Tax
|
$
|
52,064
|
|
$
|
61,038
|
|
|
|
Long-term pension liability
|
24,671
|
|
52,364
|
|
|||
|
Accrued executive supplemental life insurance retirement plan and deferred compensation plan
|
36,086
|
|
37,582
|
|
|||
|
Long-term deferred revenue
|
34,420
|
|
8,313
|
|
|||
|
Other
|
31,880
|
|
35,518
|
|
|||
|
Other long-term liabilities
|
$
|
179,121
|
|
$
|
194,815
|
|
|
79
CHARLES RIVER LABORATORIES INTERNATIONAL, INC.
NOTES TO CONSOLIDATED FINANCIAL STATEMENTS (Continued)
6. VENTURE CAPITAL INVESTMENTS AND MARKETABLE SECURITIES
Venture Capital Investments
During fiscal years
2018
,
2017
, and
2016
, the Company recognized gains related to the venture capital investments of
$15.9 million
,
$22.9 million
and
$10.3 million
, respectively.
The Company’s total commitment to these venture capital funds as of
December 29, 2018
was
$124.7 million
, of which the Company funded
$69.0 million
through that date. During fiscal years
2018
,
2017
, and
2016
, the Company received dividends totaling
$18.2 million
,
$10.1 million
, and
$7.1 million
, respectively.
As of
December 29, 2018
and
December 30, 2017
, the Company’s consolidated retained earnings included
$14.1 million
and
$12.1 million
, respectively, of the undistributed earnings related to these entities.
Marketable Securities
The Company held
no
marketable securities as of
December 29, 2018
and
December 30, 2017
. During fiscal year 2016, the Company realized non-significant losses and received proceeds of $
4.6 million
from the sale of its available-for-sale securities.
7. FAIR VALUE
Assets and liabilities measured at fair value on a recurring basis are summarized below:
|
|
December 29, 2018
|
||||||||||||||
|
|
Level 1
|
Level 2
|
Level 3
|
Total
|
|||||||||||
|
(in thousands)
|
|||||||||||||||
|
Cash equivalents
|
$
|
—
|
|
$
|
45,982
|
|
$
|
—
|
|
$
|
45,982
|
|
|||
|
Other assets:
|
|||||||||||||||
|
Life insurance policies
|
|
|
24,541
|
|
—
|
|
24,541
|
|
|||||||
|
Total assets measured at fair value
|
$
|
—
|
|
$
|
70,523
|
|
$
|
—
|
|
$
|
70,523
|
|
|||
|
Other current liabilities:
|
|||||||||||||||
|
Contingent consideration
|
$
|
—
|
|
$
|
—
|
|
$
|
3,033
|
|
$
|
3,033
|
|
|||
|
Foreign currency forward contract
|
—
|
|
1,319
|
|
—
|
|
1,319
|
|
|||||||
|
Total liabilities measured at fair value
|
$
|
—
|
|
$
|
1,319
|
|
$
|
3,033
|
|
$
|
4,352
|
|
|||
|
|
December 30, 2017
|
||||||||||||||
|
|
Level 1
|
Level 2
|
Level 3
|
Total
|
|||||||||||
|
(in thousands)
|
|||||||||||||||
|
Cash equivalents
|
$
|
—
|
|
$
|
21
|
|
$
|
—
|
|
$
|
21
|
|
|||
|
Other assets:
|
|||||||||||||||
|
Life insurance policies
|
—
|
|
26,358
|
|
—
|
|
26,358
|
|
|||||||
|
Total assets measured at fair value
|
$
|
—
|
|
$
|
26,379
|
|
$
|
—
|
|
$
|
26,379
|
|
|||
|
Other current liabilities:
|
|||||||||||||||
|
Contingent consideration
|
$
|
—
|
|
$
|
—
|
|
$
|
298
|
|
$
|
298
|
|
|||
|
Total liabilities measured at fair value
|
$
|
—
|
|
$
|
—
|
|
$
|
298
|
|
$
|
298
|
|
|||
During fiscal years
2018
and
2017
, there were
no
transfers between fair value levels.
80
CHARLES RIVER LABORATORIES INTERNATIONAL, INC.
NOTES TO CONSOLIDATED FINANCIAL STATEMENTS (Continued)
Contingent Consideration
The following table provides a rollforward of the contingent consideration related to previous business acquisitions. See Note 2, “Business Acquisitions and Divestiture”.
|
Fiscal Year
|
|||||||
|
2018
|
2017
|
||||||
|
(in thousands)
|
|||||||
|
Beginning balance
|
$
|
298
|
|
$
|
3,621
|
|
|
|
Additions
|
3,315
|
|
296
|
|
|||
|
Payments
|
—
|
|
(3,606
|
)
|
|||
|
Total gains or losses (realized/unrealized):
|
|||||||
|
Foreign currency translation
|
(298
|
)
|
(13
|
)
|
|||
|
Reversal of previously recorded contingent liability and change in fair value
|
(282
|
)
|
—
|
|
|||
|
Ending balance
|
$
|
3,033
|
|
$
|
298
|
|
|
The unobservable inputs used in the fair value measurement of the Company’s contingent consideration are the probabilities of successful achievement of certain financial targets and a discount rate. Increases or decreases in any of the probabilities of success would result in a higher or lower fair value measurement, respectively. Increases or decreases in the discount rate would result in a lower or higher fair value measurement, respectively.
Debt Instruments
The book value of the Company’s term and revolving loans, which are variable rate loans carried at amortized cost, approximates the fair value based on current market pricing of similar debt. As the fair value is based on significant other observable inputs, including current interest and foreign currency exchange rates, it is deemed to be Level 2 within the fair value hierarchy.
The book value of the Company’s Senior Notes, which are a fixed rate obligation carried at amortized cost, approximates the fair value at quoted market prices as well as borrowing rates available to the Company. As the fair value is based on significant other observable outputs, it is deemed to be Level 2 within the fair value hierarchy.
8. GOODWILL AND INTANGIBLE ASSETS
Goodwill
The following table provides a rollforward of the Company’s goodwill:
|
Adjustments to Goodwill
|
Adjustments to Goodwill
|
||||||||||||||||||||||||||
|
December 31, 2016
|
Acquisitions / (Divestiture)
|
Foreign Exchange
|
December 30, 2017
|
Acquisitions
|
Foreign Exchange
|
December 29, 2018
|
|||||||||||||||||||||
|
(in thousands)
|
|||||||||||||||||||||||||||
|
RMS
|
$
|
56,397
|
|
$
|
—
|
|
$
|
1,725
|
|
$
|
58,122
|
|
$
|
—
|
|
$
|
(1,154
|
)
|
$
|
56,968
|
|
||||||
|
DSA
|
1,568,476
|
|
11,942
|
|
29,758
|
|
1,610,176
|
|
460,223
|
|
(13,929
|
)
|
2,056,470
|
|
|||||||||||||
|
Manufacturing
|
167,644
|
|
(36,000
|
)
|
9,964
|
|
141,608
|
|
2,551
|
|
(5,464
|
)
|
138,695
|
|
|||||||||||||
|
Gross carrying amount
|
1,792,517
|
|
(24,058
|
)
|
41,447
|
|
1,809,906
|
|
462,774
|
|
(20,547
|
)
|
2,252,133
|
|
|||||||||||||
|
Accumulated impairment loss - DSA
|
(1,005,000
|
)
|
—
|
|
—
|
|
(1,005,000
|
)
|
—
|
|
—
|
|
(1,005,000
|
)
|
|||||||||||||
|
Goodwill
|
$
|
787,517
|
|
|
|
|
|
$
|
804,906
|
|
|
|
|
|
$
|
1,247,133
|
|
||||||||||
Based on the Company’s step one goodwill impairment test, which was performed in the fourth quarter for each of the fiscal years
2018
,
2017
and
2016
, the fair value of each reporting unit exceeded the reporting unit’s book value and, therefore, goodwill was not impaired.
The increase in goodwill during fiscal year
2018
related primarily to the acquisitions of MPI Research and KWS BioTest in the DSA reportable segment, an immaterial acquisition of an Australian business in the Manufacturing reportable segment, and the impact of foreign exchange.
81
CHARLES RIVER LABORATORIES INTERNATIONAL, INC.
NOTES TO CONSOLIDATED FINANCIAL STATEMENTS (Continued)
Intangible Assets, Net
The following table displays intangible assets, net by major class:
|
|
December 29, 2018
|
December 30, 2017
|
|||||||||||||||||||||
|
Gross
|
Accumulated
Amortization |
Net
|
Gross
|
Accumulated
Amortization |
Net
|
||||||||||||||||||
|
(in thousands)
|
|||||||||||||||||||||||
|
Backlog
|
$
|
20,900
|
|
$
|
(18,691
|
)
|
$
|
2,209
|
|
$
|
8,111
|
|
$
|
(8,111
|
)
|
$
|
—
|
|
|||||
|
Technology
|
101,506
|
|
(41,870
|
)
|
59,636
|
|
81,309
|
|
(27,157
|
)
|
54,152
|
|
|||||||||||
|
Trademarks and trade names
|
8,331
|
|
(4,640
|
)
|
3,691
|
|
8,661
|
|
(4,562
|
)
|
4,099
|
|
|||||||||||
|
Other
|
17,448
|
|
(10,041
|
)
|
7,407
|
|
17,465
|
|
(7,845
|
)
|
9,620
|
|
|||||||||||
|
Other intangible assets
|
148,185
|
|
(75,242
|
)
|
72,943
|
|
115,546
|
|
(47,675
|
)
|
67,871
|
|
|||||||||||
|
Client relationships
|
791,725
|
|
(253,780
|
)
|
537,945
|
|
540,425
|
|
(238,534
|
)
|
301,891
|
|
|||||||||||
|
Intangible assets
|
$
|
939,910
|
|
$
|
(329,022
|
)
|
$
|
610,888
|
|
$
|
655,971
|
|
$
|
(286,209
|
)
|
$
|
369,762
|
|
|||||
The increase in intangible assets, net during the fiscal year 2018 related primarily to the acquisitions of MPI Research and KWS BioTest in the DSA reportable segment. During fiscal year 2017, the Company divested the CDMO business, which resulted in a net decrease of
$16.8 million
and
$0.3 million
to client relationships and backlog, respectively.
Amortization expense of definite-lived intangible assets, including client relationships, for fiscal years
2018
,
2017
and
2016
was
$64.8 million
,
$41.4 million
and
$41.7 million
, respectively. As of
December 29, 2018
, estimated amortization expense for intangible assets for each of the next five fiscal years is expected to be as follows:
|
Fiscal Year
|
Amortization Expense
|
|||
|
(in thousands)
|
||||
|
2019
|
$
|
77,173
|
|
|
|
2020
|
74,162
|
|
||
|
2021
|
63,089
|
|
||
|
2022
|
56,958
|
|
||
|
2023
|
52,494
|
|
||
9. LONG-TERM DEBT AND CAPITAL LEASE OBLIGATIONS
Long-Term Debt
Long-term debt, net consists of the following:
|
December 29, 2018
|
December 30, 2017
|
||||||
|
(in thousands)
|
|||||||
|
Term loans
|
$
|
731,250
|
|
$
|
601,250
|
|
|
|
Revolving facility
|
397,452
|
|
500,997
|
|
|||
|
Senior Notes
|
500,000
|
|
—
|
|
|||
|
Other long-term debt
|
26,286
|
|
18,292
|
|
|||
|
Total debt
|
1,654,988
|
|
1,120,539
|
|
|||
|
Less: Current portion of long-term debt
|
(28,228
|
)
|
(28,546
|
)
|
|||
|
Long-term debt
|
1,626,760
|
|
1,091,993
|
|
|||
|
Debt discount and debt issuance costs
|
(16,214
|
)
|
(5,770
|
)
|
|||
|
Long-term debt, net
|
$
|
1,610,546
|
|
$
|
1,086,223
|
|
|
As of
December 29, 2018
and
December 30, 2017
, the weighted average interest rate on the Company’s debt was
4.24%
and
2.45%
, respectively.
Term Loans and Revolving Facility
82
CHARLES RIVER LABORATORIES INTERNATIONAL, INC.
NOTES TO CONSOLIDATED FINANCIAL STATEMENTS (Continued)
On March 26, 2018, the Company amended and restated its $
1.65 billion
credit facility creating a $
2.3 billion
credit facility ($
2.3B
Credit Facility) which extends the maturity date for the credit facility. The $
2.3B
Credit Facility provides for a
$750.0 million
term loan and a
$1.55 billion
multi-currency revolving facility. The amendment was accounted for as a debt modification. In connection with the transaction, the Company capitalized approximately
$6.2 million
within long-term debt, net and capital leases in the accompanying consolidated balance sheets and expensed approximately
$1.0 million
of debt issuance costs recorded within interest expense in the accompanying consolidated statements of income.
The term loan facility matures in
19
quarterly installments with the last installment due March 26, 2023. The revolving facility matures on March 26, 2023, and requires no scheduled payment before that date. Under specified circumstances, the Company has the ability to increase the term loan and/or revolving facility by up to $
1.0 billion
in the aggregate.
The interest rates applicable to the term loan and revolving facility under the $
2.3B
Credit Facility are, at the Company’s option, equal to either the base rate (which is the higher of (1) the prime rate, (2) the federal funds rate plus
0.50%
, or (3) the one-month adjusted LIBOR rate plus
1.0%
) or the adjusted LIBOR rate, plus an interest rate margin based upon the Company’s leverage ratio.
The $
2.3B
Credit Facility includes certain customary representations and warranties, events of default, notices of material adverse changes to the Company’s business and negative and affirmative covenants. These covenants include (1) maintenance of a ratio of consolidated earnings before interest, taxes, depreciation and amortization (EBITDA) less capital expenditures to consolidated cash interest expense, for any period of four consecutive fiscal quarters, of no less than
3.50
to 1.0 as well as (2) maintenance of a ratio of consolidated indebtedness to consolidated EBITDA for any period of four consecutive fiscal quarters, of no more than
4.50
to 1.0 with step downs to
3.50
to 1.0 by the last day of the first quarter of 2020. As of
December 29, 2018
, the Company was compliant with all covenants.
The obligations of the Company under the $
2.3B
Credit Facility are collateralized by substantially all of the assets of the Company.
As of
December 29, 2018
the Company had a
$343.3 million
U.S. dollar denominated loan borrowed by a non-U.S. Euro functional currency entity under the Company’s $
2.3B
Credit Facility. The Company entered into a foreign exchange forward contract to limit its foreign currency exposure related to this borrowing. See Note 14, “Foreign Currency Contracts”, for further discussion.
Senior Notes Offering
On April 3, 2018, the Company entered into an indenture (Indenture) with MUFG Union Bank, N.A., (Trustee) in connection with the offering of
$500.0 million
in aggregate principal amount of the Company’s
5.5%
Senior Notes (Senior Notes), due in 2026, in an unregistered offering. Under the terms of the Indenture, interest on the Senior Notes is payable semi-annually on April 1 and October 1 of each year, beginning on October 1, 2018. The Senior Notes are guaranteed fully and unconditionally, jointly and severally on a senior unsecured basis by the Company and certain of its U.S. subsidiaries. In connection with the transaction, the Company incurred approximately
$7.4 million
of debt issuance costs within long-term debt, net and capital leases in the accompanying consolidated balance sheets.
The Company may redeem all or part of the Senior Notes at any time prior to April 1, 2021, at its option, at a redemption price equal to
100%
of the principal amount of such Senior Notes plus the Applicable Premium (as defined in the Indenture). The Company may also redeem up to
40%
of the Senior Notes with the proceeds of certain equity offerings completed before April 1, 2021, at a redemption price equal to
105.5%
of the principal amount of such Senior Notes. On or after April 1, 2021, the Company may on any one or more occasions redeem all or a part of the Senior Notes, at the redemption prices specified in the Indenture based on the applicable date of redemption. Upon the occurrence of a Change of Control Triggering Event (as defined in the Indenture), the Company will be required to offer to repurchase the Senior Notes at a purchase price equal to
101%
of the aggregate principal amount of such Senior Notes. Any redemption of the Senior Notes would also require settlement of accrued and unpaid interest, if any, to but excluding the redemption date.
The Indenture contains certain covenants, including but not limited to, limitations and restrictions on the ability of the Company and its U.S. subsidiaries to (i) create certain liens, (ii) enter into any Sale and Leaseback Transaction (as defined in the Indenture) with respect to any property, and (iii) merge, consolidate, sell or otherwise dispose of all or substantially all of their assets. These covenants are subject to a number of conditions, qualifications, exceptions and limitations. Any event of default, as defined, could result in the acceleration of the repayment of the obligations.
Net proceeds from the Senior Notes of
$493.8 million
were used to partially repay the outstanding revolving credit facility on April 3, 2018.
83
CHARLES RIVER LABORATORIES INTERNATIONAL, INC.
NOTES TO CONSOLIDATED FINANCIAL STATEMENTS (Continued)
Commitment Letter
On February 12, 2018, the Company secured an
$830 million
commitment under a 364-day senior unsecured bridge loan facility (the “Bridge Facility”) for the purpose of financing the acquisition of MPI Research. The Bridge Facility was terminated as of April 3, 2018 upon the successful acquisition of MPI Research. Debt issuance costs of
$1.8 million
, which were capitalized upon the execution of the Bridge Facility, were expensed upon termination of the agreement on April 3, 2018. In addition, the Company incurred and expensed
$2.0 million
of fees pertaining to a temporary backstop facility related to the negotiation of the Credit Facility during the three months ended March 31, 2018. These costs were included in interest expense in the accompanying consolidated statements of income.
Principal maturities of existing debt for the periods set forth in the table below, are as follows:
|
Principal
|
|||
|
(in thousands)
|
|||
|
2019
|
$
|
28,228
|
|
|
2020
|
42,188
|
|
|
|
2021
|
60,938
|
|
|
|
2022
|
93,750
|
|
|
|
2023
|
903,701
|
|
|
|
Thereafter
|
500,000
|
|
|
|
Total
|
$
|
1,628,805
|
|
Excluded from the table above is
$26.2 million
of other debt associated with construction in progress related to build-to-suit operating leases. The minimum rental commitments under these non-cancellable leases are included in Note 16, “Commitments and Contingencies.”
Letters of Credit
As of
December 29, 2018
and
December 30, 2017
, the Company had
$6.5 million
and
$4.9 million
, respectively, in outstanding letters of credit.
Capital Lease Obligations
The Company’s capital lease obligations amounted to
$29.2 million
and
$30.3 million
as of
December 29, 2018
and
December 30, 2017
, respectively.
As of
December 29, 2018
, the minimum lease payments under capital leases for each of the next five years and total thereafter were as follows:
|
Minimum Lease Payments
|
|||
|
(in thousands)
|
|||
|
2019
|
$
|
3,972
|
|
|
2020
|
3,759
|
|
|
|
2021
|
2,869
|
|
|
|
2022
|
2,967
|
|
|
|
2023
|
2,209
|
|
|
|
Thereafter
|
24,304
|
|
|
|
Total
|
$
|
40,080
|
|
84
CHARLES RIVER LABORATORIES INTERNATIONAL, INC.
NOTES TO CONSOLIDATED FINANCIAL STATEMENTS (Continued)
10. EQUITY AND NONCONTROLLING INTERESTS
Earnings Per Share
The following table reconciles the numerator and denominator in the computations of basic and diluted earnings per share:
|
Fiscal Year
|
|||||||||||
|
2018
|
2017
|
2016
|
|||||||||
|
(in thousands)
|
|||||||||||
|
Numerator:
|
|||||||||||
|
Income from continuing operations, net of income taxes
|
$
|
227,218
|
|
$
|
125,586
|
|
$
|
156,086
|
|
||
|
Income (loss) from discontinued operations, net of income taxes
|
1,506
|
|
(137
|
)
|
280
|
|
|||||
|
Less: Net income attributable to noncontrolling interests
|
2,351
|
|
2,094
|
|
1,601
|
|
|||||
|
Net income attributable to common shareholders
|
$
|
226,373
|
|
$
|
123,355
|
|
$
|
154,765
|
|
||
|
Denominator:
|
|||||||||||
|
Weighted-average shares outstanding—Basic
|
47,947
|
|
47,481
|
|
47,014
|
|
|||||
|
Effect of dilutive securities:
|
|||||||||||
|
Stock options, restricted stock, restricted stock units and performance share units
|
1,071
|
|
1,083
|
|
944
|
|
|||||
|
Weighted-average shares outstanding—Diluted
|
49,018
|
|
48,564
|
|
47,958
|
|
|||||
Options to purchase
0.5 million
shares,
0.6 million
shares, and
0.8 million
shares for fiscal years
2018
,
2017
and
2016
, respectively were not included in computing diluted earnings per share because their inclusion would have been anti-dilutive. Basic weighted-average shares outstanding for fiscal year
2018
and for both fiscal years
2017
and
2016
excluded the impact of
1.0 million
shares and
1.1 million
shares, respectively, of non-vested restricted stock and RSUs.
Treasury Shares
In
July 2010
, the Company’s Board of Directors authorized a
$500.0 million
stock repurchase program, and subsequently approved increases to the stock repurchase program of
$250.0 million
in
2010
,
$250.0 million
in
2013
,
$150.0 million
in 2014, and
$150.0 million
in 2017, for an aggregate authorization of
$1.3 billion
. Under its authorized stock repurchase program, the Company repurchased
1.0 million
shares totaling
$90.6 million
in fiscal year
2017
, and did
no
t repurchase any shares in fiscal years 2018 and 2016. As of
December 29, 2018
, the Company had
$129.1 million
remaining on the authorized stock repurchase program.
The Company’s stock-based compensation plans permit the netting of common stock upon vesting of restricted stock, RSUs, and PSUs in order to satisfy individual statutory tax withholding requirements. The Company acquired
0.1 million
shares for
$13.8 million
,
0.2 million
shares for
$16.3 million
, and
0.2 million
shares for
$12.3 million
in fiscal years
2018
,
2017
and
2016
, respectively, from such netting.
In October 2018, the Company’s Board of Directors approved the cancellation and return to the Company’s authorized and unissued capital stock of
40.2 million
treasury shares totaling
$1.7 billion
, reducing treasury stock on the Company’s consolidated balance sheet. The Company allocated the excess of the repurchase price over the par value of shares acquired to reduce both retained earnings and additional paid-in-capital for
$0.5 billion
and
$1.2 billion
, respectively.
85
CHARLES RIVER LABORATORIES INTERNATIONAL, INC.
NOTES TO CONSOLIDATED FINANCIAL STATEMENTS (Continued)
Accumulated Other Comprehensive Income (Loss)
Changes to each component of accumulated other comprehensive income (loss), net of income taxes, are as follows:
|
Foreign Currency Translation Adjustment and Other
|
Pension and Other Post-Retirement Benefit Plans
|
Total
|
|||||||||
|
(in thousands)
|
|||||||||||
|
December 31, 2016
|
$
|
(154,595
|
)
|
$
|
(99,169
|
)
|
$
|
(253,764
|
)
|
||
|
Other comprehensive income before reclassifications
(1)
|
77,050
|
|
36,593
|
|
113,643
|
|
|||||
|
Amounts reclassified from accumulated other comprehensive income (loss)
|
—
|
|
3,344
|
|
3,344
|
|
|||||
|
Net current period other comprehensive income (loss)
|
77,050
|
|
39,937
|
|
116,987
|
|
|||||
|
Income tax expense
|
—
|
|
7,954
|
|
7,954
|
|
|||||
|
December 30, 2017
|
(77,545
|
)
|
(67,186
|
)
|
(144,731
|
)
|
|||||
|
Other comprehensive loss before reclassifications
(1)
|
(27,352
|
)
|
(1,659
|
)
|
(29,011
|
)
|
|||||
|
Amounts reclassified from accumulated other comprehensive income (loss)
|
—
|
|
2,477
|
|
2,477
|
|
|||||
|
Net current period other comprehensive (loss) income
|
(27,352
|
)
|
818
|
|
(26,534
|
)
|
|||||
|
Amount reclassified from accumulated other comprehensive loss due to the adoption of ASU 2018-02 (See Note 1)
|
—
|
|
3,330
|
|
3,330
|
|
|||||
|
Income tax (benefit) expense
|
(2,698
|
)
|
806
|
|
(1,892
|
)
|
|||||
|
December 29, 2018
|
$
|
(102,199
|
)
|
$
|
(70,504
|
)
|
$
|
(172,703
|
)
|
||
|
(1)
The impact of the foreign currency translation adjustment to other comprehensive income (loss) before reclassifications was primarily due to the effect of changes in foreign currency exchange rates of the Euro, British Pound, and Canadian Dollar and to a lesser extent due to the impact of changes in the Chinese Yuan Renminbi and Japanese Yen.
|
|||||||||||
Nonredeemable Noncontrolling Interest
The Company has an investment in an entity whose financial results are consolidated in the Company’s financial statements, as it has the ability to exercise control over this entity. The interest of the noncontrolling party in this entity has been recorded as noncontrolling interest. The activity within the nonredeemable noncontrolling interest during fiscal years 2018 and 2017 was not significant. In 2016, the activity within the nonredeemable noncontrolling interest was a decrease of
$2.1 million
.
Redeemable Noncontrolling Interest
In January 2013, the Company acquired a
75%
ownership interest in Vital River, a commercial provider of research models and related services in China, for $
24.2 million
, net of $
2.7 million
of cash acquired. Concurrent with the acquisition, the Company entered into an agreement with the noncontrolling interest holders that provided the Company with the right to purchase, and the noncontrolling interest holders with the right to sell, the remaining
25%
of the entity for cash at its fair value beginning in January 2016.
The following table provides a rollforward of the fair value of the Company’s redeemable noncontrolling interest for fiscal year 2016:
86
CHARLES RIVER LABORATORIES INTERNATIONAL, INC.
NOTES TO CONSOLIDATED FINANCIAL STATEMENTS (Continued)
|
Redeemable Noncontrolling Interest
|
|||
|
(in thousands)
|
|||
|
December 26, 2015
|
$
|
28,008
|
|
|
Total gains or losses (realized/unrealized):
|
|||
|
Net income attributable to noncontrolling interest
|
320
|
|
|
|
Foreign currency translation
|
(653
|
)
|
|
|
Change in fair value, included in additional paid-in capital
|
(1,690
|
)
|
|
|
July 7, 2016
|
$
|
25,985
|
|
|
Purchase of 12% equity
|
$
|
(12,360
|
)
|
|
Total gains or losses (realized/unrealized):
|
|||
|
Net income attributable to noncontrolling interest
|
357
|
|
|
|
Foreign currency translation
|
(818
|
)
|
|
|
Modification of 13% purchase option
|
1,495
|
|
|
|
December 31, 2016
|
$
|
14,659
|
|
On July 7, 2016, the Company purchased an additional
12%
equity interest in Vital River for
$10.8 million
, resulting in total ownership of
87%
. The Company recorded a
$1.6 million
gain in equity equal to the excess fair value of the
12%
equity interest over the purchase price. Concurrent with the transaction, the original agreement was amended providing the Company with the right to purchase, and the noncontrolling interest holders with the right to sell, the remaining
13%
equity interest at a contractually defined redemption value, subject to a redemption floor (embedded derivative). These rights are exercisable beginning in 2019 and are accelerated in certain events. The Company recorded a charge of
$1.5 million
in other income, net, equal to the excess fair value of the hybrid instrument (equity interest with an embedded derivative) over the fair value of the
13%
equity interest. The redeemable noncontrolling interest is measured at the greater of the amount that would be paid if settlement occurred as of the balance sheet date based on the contractually defined redemption value (
$18.5 million
as of
December 29, 2018
) and its carrying amount adjusted for net income (loss) attributable to the noncontrolling interest. As the noncontrolling interest holders have the ability to require the Company to purchase the remaining
13%
interest, the noncontrolling interest is classified in the mezzanine section of the consolidated balance sheets, which is presented above the equity section and below liabilities. The agreement does not limit the amount that the Company could be required to pay to purchase the remaining
13%
equity interest.
The following table provides a rollforward of the activity related to the Company’s redeemable noncontrolling interest:
|
Fiscal Year
|
|||||||
|
2018
|
2017
|
||||||
|
(in thousands)
|
|||||||
|
Beginning balance
|
$
|
16,609
|
|
$
|
14,659
|
|
|
|
Total gains or losses (realized/unrealized):
|
|||||||
|
Net income attributable to noncontrolling interest
|
800
|
|
916
|
|
|||
|
Adjustment to redemption value
|
2,069
|
|
—
|
|
|||
|
Foreign currency translation
|
(953
|
)
|
1,034
|
|
|||
|
Ending balance
|
$
|
18,525
|
|
$
|
16,609
|
|
|
11. INCOME TAXES
The components of income from continuing operations before income taxes and the related provision for income taxes are presented below:
87
CHARLES RIVER LABORATORIES INTERNATIONAL, INC.
NOTES TO CONSOLIDATED FINANCIAL STATEMENTS (Continued)
|
|
Fiscal Year
|
||||||||||
|
|
2018
|
2017
|
2016
|
||||||||
|
(in thousands)
|
|||||||||||
|
Income from continuing operations before income taxes:
|
|
|
|
|
|||||||
|
U.S.
|
$
|
95,062
|
|
$
|
123,896
|
|
$
|
59,255
|
|
||
|
Non-U.S.
|
186,619
|
|
173,059
|
|
163,666
|
|
|||||
|
$
|
281,681
|
|
$
|
296,955
|
|
$
|
222,921
|
|
|||
|
Income tax provision (benefit):
|
|
|
|
|
|||||||
|
Current:
|
|
|
|
|
|||||||
|
Federal
|
$
|
17,390
|
|
$
|
93,871
|
|
$
|
18,592
|
|
||
|
Foreign
|
38,557
|
|
37,150
|
|
39,829
|
|
|||||
|
State
|
8,837
|
|
12,361
|
|
5,263
|
|
|||||
|
Total current
|
64,784
|
|
143,382
|
|
63,684
|
|
|||||
|
Deferred:
|
|
|
|
|
|||||||
|
Federal
|
(7,145
|
)
|
9,416
|
|
7,206
|
|
|||||
|
Foreign
|
(4,104
|
)
|
14,953
|
|
(4,024
|
)
|
|||||
|
State
|
928
|
|
3,618
|
|
(31
|
)
|
|||||
|
Total deferred
|
(10,321
|
)
|
27,987
|
|
3,151
|
|
|||||
|
$
|
54,463
|
|
$
|
171,369
|
|
$
|
66,835
|
|
|||
U. S. Tax Reform
U.S. Tax Reform, which was signed into law on December 22, 2017, has resulted in significant changes including, but not limited to, (i) reducing the U.S. federal statutory tax rate from 35% to 21%; (ii) requiring companies to pay a one-time transition tax (Transition Tax) on certain unrepatriated earnings of foreign subsidiaries; (iii) generally eliminating U.S federal income taxes on dividends from foreign subsidiaries; (iv) requiring a current inclusion in U.S. federal taxable income of certain earnings of controlled foreign corporations; (v) eliminating the corporate alternative minimum tax (AMT) and changing how existing AMT credits can be realized; (vi) subjecting certain foreign earnings to U.S. taxation through base erosion anti-abuse tax (BEAT) and global intangible low-taxed income (GILTI); (vii) creating a new limitation on deductible interest expense; (viii) changing rules related to uses and limitations of net operating loss carryforwards created in tax years beginning after December 31, 2017, and (ix) modifying the officer’s compensation limitation.
The Company’s accounting for the elements of U.S. Tax Reform is complete. The Company recorded measurement period adjustments under SAB 118 in fiscal year 2018 to the provisional amounts recorded in the fourth quarter of fiscal year 2017. These adjustments included a
$1.0 million
tax benefit relating to a decreased Transition Tax liability compared to the
$73.5 million
obligation reported in fiscal year 2017, and a
$2.2 million
tax benefit compared to the
$18.2 million
of tax recorded in fiscal year 2017 related to the Company’s unremitted foreign earnings. Additionally, the Company recorded a
$2.3 million
tax benefit for additional decreases to the net deferred tax liability relating to the reduction on the U.S. federal statutory tax rate from 35% to 21%.
In fiscal year 2018, the Company made an accounting policy election to treat taxes due on the GILTI inclusion as a current period expense.
Prior to the fourth quarter of fiscal 2017, the Company asserted that the unremitted earnings of its foreign subsidiaries were deemed indefinitely reinvested as they were required to fund needs outside of the U.S. As a result of the Transition Tax and other effects of U.S. Tax Reform enacted during the fourth quarter of fiscal 2017, the Company withdrew its indefinite reinvestment assertion for all of its unremitted foreign earnings.
88
CHARLES RIVER LABORATORIES INTERNATIONAL, INC.
NOTES TO CONSOLIDATED FINANCIAL STATEMENTS (Continued)
The components of deferred tax assets and liabilities are as follows:
|
December 29, 2018
|
December 30, 2017
|
||||||
|
(in thousands)
|
|||||||
|
Deferred tax assets:
|
|||||||
|
Compensation
|
$
|
36,724
|
|
$
|
40,788
|
|
|
|
Accruals and reserves
|
13,183
|
|
8,248
|
|
|||
|
Inventory reserves and valuations
|
2,482
|
|
2,135
|
|
|||
|
Net operating loss and credit carryforwards
|
35,679
|
|
33,160
|
|
|||
|
Other
|
2,578
|
|
7,661
|
|
|||
|
Valuation allowance
|
(9,788
|
)
|
(10,591
|
)
|
|||
|
Total deferred tax assets
|
80,858
|
|
81,401
|
|
|||
|
Deferred tax liabilities:
|
|||||||
|
Goodwill and other intangibles
|
(154,743
|
)
|
(89,636
|
)
|
|||
|
Financing related
|
(898
|
)
|
(429
|
)
|
|||
|
Depreciation related
|
(19,373
|
)
|
(23,763
|
)
|
|||
|
Venture capital investments
|
(10,557
|
)
|
(7,796
|
)
|
|||
|
Tax on unremitted earnings
|
(14,140
|
)
|
(19,204
|
)
|
|||
|
Other
|
(1,398
|
)
|
(7,459
|
)
|
|||
|
Total deferred tax liabilities
|
(201,109
|
)
|
(148,287
|
)
|
|||
|
Net deferred taxes
|
$
|
(120,251
|
)
|
$
|
(66,886
|
)
|
|
The changes recorded to the Company’s valuation allowance were insignificant in fiscal years
2018
,
2017
, and
2016
.
Reconciliations of the statutory U.S. federal income tax rate to effective tax rates are as follows:
|
Fiscal Year
|
||||||||
|
2018
|
2017
|
2016
|
||||||
|
U.S. statutory income tax rate
|
21.0
|
%
|
35.0
|
%
|
35.0
|
%
|
||
|
Foreign tax rate differences
|
0.5
|
|
(6.8
|
)
|
(10.3
|
)
|
||
|
State income taxes, net of federal tax benefit
|
2.4
|
|
2.0
|
|
1.6
|
|
||
|
Research tax credits and enhanced deductions
|
(2.9
|
)
|
(2.4
|
)
|
(3.5
|
)
|
||
|
Stock-based compensation
|
(2.1
|
)
|
(3.2
|
)
|
—
|
|
||
|
Enacted tax rate changes
|
(0.1
|
)
|
(4.2
|
)
|
(0.8
|
)
|
||
|
Transition Tax
|
(0.3
|
)
|
24.8
|
|
—
|
|
||
|
Impact of tax uncertainties
|
(1.1
|
)
|
(0.4
|
)
|
0.2
|
|
||
|
Tax on unremitted earnings
|
1.2
|
|
7.3
|
|
2.0
|
|
||
|
GILTI, net of foreign tax credits
|
1.1
|
|
—
|
|
—
|
|
||
|
Foreign-Derived Intangible Income (FDII)
|
(1.4
|
)
|
—
|
|
—
|
|
||
|
Impact of acquisitions and restructuring
|
0.3
|
|
3.8
|
|
1.8
|
|
||
|
Other
|
0.7
|
|
1.8
|
|
4.0
|
|
||
|
Effective income tax rate
|
19.3
|
%
|
57.7
|
%
|
30.0
|
%
|
||
GILTI, net of foreign tax credits includes
$12.8 million
of tax related to the GILTI inclusion, net of a
$9.6 million
foreign tax credit. FDII includes a
$4.0 million
tax benefit for the FDII deduction.
As of
December 29, 2018
, the Company had foreign net operating loss and tax credit carryforwards of
$35.7 million
, as compared to
$33.2 million
as of
December 30, 2017
. Of this amount,
$2.9 million
will expire beginning in
2019
,
$18.2 million
will begin to expire in 2030 and beyond, and the remainder of
$14.6 million
can be carried forward indefinitely. In accordance with Canadian federal tax law, the Company claims Scientific Research and Experimental Development (SR&ED) credits on qualified research and development costs incurred in its Safety Assessment facility in Montreal, and currently maintains
$15.9
89
CHARLES RIVER LABORATORIES INTERNATIONAL, INC.
NOTES TO CONSOLIDATED FINANCIAL STATEMENTS (Continued)
million
in credit carryforwards, which will begin to expire in 2036. Additionally, the Company records a benefit to operating income for research and development credits in both Quebec and the U.K. related to its Safety Assessment and Early Discovery facilities.
The Company has fully recognized its deferred tax assets on the belief that it is more likely than not that they will be realized. The only exceptions relate to deferred tax assets primarily for net operating losses in France, Hong Kong, Luxembourg, the Netherlands and Germany, capital losses in the U.S., and fixed assets in the U.K. The valuation allowance decreased by
$0.8 million
from
$10.6 million
as of
December 30, 2017
to
$9.8 million
as of
December 29, 2018
.
A reconciliation of the Company’s beginning and ending unrecognized income tax benefits is as follows:
|
Fiscal Year
|
|||||||||||
|
2018
|
2017
|
2016
|
|||||||||
|
(in thousands)
|
|||||||||||
|
Beginning balance
|
$
|
24,710
|
|
$
|
24,186
|
|
$
|
23,338
|
|
||
|
Additions to tax positions for current year
|
2,477
|
|
1,791
|
|
2,194
|
|
|||||
|
Additions to tax positions for prior years
|
—
|
|
1,428
|
|
2,035
|
|
|||||
|
Reductions to tax positions for prior years
|
(4,543
|
)
|
—
|
|
(1,866
|
)
|
|||||
|
Settlements
|
(3,380
|
)
|
(1,754
|
)
|
(918
|
)
|
|||||
|
Expiration of statute of limitations
|
(437
|
)
|
(941
|
)
|
(597
|
)
|
|||||
|
Ending balance
|
$
|
18,827
|
|
$
|
24,710
|
|
$
|
24,186
|
|
||
The
$5.9 million
decrease in unrecognized income tax benefits during fiscal year
2018
is primarily attributable to audit settlements, favorable tax authority rulings, and favorable foreign exchange movement, partially offset by an additional year of Canadian SR&ED credit.
The amount of unrecognized income tax benefits that, if recognized, would favorably impact the effective tax rate was
$17.6 million
as of
December 29, 2018
and
$22.7 million
as of
December 30, 2017
. The
$5.1 million
decrease is primarily attributable to favorable tax rulings and audit settlements during the year ended
December 29, 2018
. It is reasonably possible as of
December 29, 2018
that the liability for unrecognized tax benefits for the uncertain tax position will decrease by $
7.6 million
over the next twelve month period, primarily as a result of lapsing statutes of limitations. The Company continues to recognize interest and penalties related to unrecognized income tax benefits in income tax expense. The total amount of accrued interest related to unrecognized income tax benefits as of
December 29, 2018
and
December 30, 2017
was
$2.7 million
and
$2.5 million
, respectively. The total amount of accrued penalties related to unrecognized income tax benefits as of
December 30, 2017
was
$0.3 million
and
none
as of
December 29, 2018
.
The Company conducts business in a number of tax jurisdictions. As a result, it is subject to tax audits on a regular basis including, but not limited to, such major jurisdictions as the U.S., the U.K., China, Japan, France, Germany, and Canada. With few exceptions, the Company is no longer subject to U.S. and international income tax examinations for years before 2015.
The Company and certain of its subsidiaries have ongoing tax controversies in the U.S. and Canada. The Company does not anticipate resolution of these audits will have a material impact on its financial statements.
12. EMPLOYEE BENEFIT PLANS
Pension Plans
The Charles River Laboratories, Inc. Pension Plan (U.S. Pension Plan) is a qualified, non-contributory defined benefit plan covering certain U.S. employees. Effective 2002, the U.S. Pension Plan was amended to exclude new participants from joining and in 2008 the accrual of benefits was frozen.
On January 31, 2019, the Company commenced the process to terminate the U.S. Pension Plan and expects to complete the termination process over the next
two
years. As part of the planned termination, the Company re-balanced assets to a target asset allocation of
100%
fixed income investments. The change in U.S. Pension Plan investments is intended to provide for a better matching of assets to the characteristics of the liabilities. The Company intends to take further actions to reduce the volatility of the value of pension assets relative to pension liabilities and to settle remaining liabilities. This includes making such contributions to the U.S. Pension Plan as may be necessary to settle all liabilities, including making lump sum distributions to U.S. Pension Plan participants and purchasing annuity contracts to cover vested benefits for participants who decline to elect a lump sum distribution.
90
CHARLES RIVER LABORATORIES INTERNATIONAL, INC.
NOTES TO CONSOLIDATED FINANCIAL STATEMENTS (Continued)
The Charles River Pension Plan is a defined contribution and defined benefit pension plan covering certain U.K. employees. Benefits are based on participants’ final pensionable salary and years of service. Participants’ rights vest immediately. Effective December 31, 2002, the plan was amended to exclude new participants from joining the defined benefit section of the plan and a defined contribution section was established for new entrants. Contributions under the defined contribution plan are determined as a percentage of gross salary.
In the fourth quarter of 2015, the Charles River Pension Plan was amended such that the members of the defined benefit section of the plan ceased to accrue additional benefits; however, their benefits continue to be adjusted for changes in their final pensionable salary or a specified inflation index, as applicable.
In addition, the Company has several defined benefit plans in certain other countries in which it maintains an operating presence, including Canada, France, Germany, Japan, Italy, and the Netherlands.
Charles River Laboratories Deferred Compensation Plan and Executive Supplemental Life Insurance Retirement Plan
The Company maintains a non-qualified deferred compensation plan, known as the Charles River Laboratories Deferred Compensation Plan (DCP), which allows a select group of eligible employees to defer a portion of their compensation. At the present time, no contributions are credited to the DCP, except as set forth below. Participants must specify the distribution date for deferred amounts at the time of deferral, in accordance with applicable IRS regulations. Generally, amounts may be paid in lump sum or installments upon retirement or termination of employment, or later if the employee terminates employment after age 55 and before age 65. Amounts may also be distributed during employment, subject to a minimum deferral requirement of
three
years.
The Company provides certain active employees an annual contribution into their DCP account of
10%
of the employee’s base salary plus the lesser of their target annual bonus or actual annual bonus.
In addition to the DCP, certain officers and key employees also participate, or in the past participated, in the Company’s Executive Supplemental Life Insurance Retirement Plan (ESLIRP), which is a non-funded, non-qualified arrangement. Annual benefits under this plan will equal a percentage of the highest
five
consecutive years of compensation, offset by amounts payable under the CRL Pension Plan and Social Security. In connection with the establishment of the DCP, certain active ESLIRP participants, who agreed to convert their accrued ESLIRP benefit to a comparable deferred compensation benefit, discontinued their direct participation in the ESLIRP. Instead, the present values of the accrued benefits of ESLIRP participants were credited to their DCP accounts, and future accruals are converted to present values and credited to their DCP accounts annually.
The net periodic benefit costs associated with these plans, including the ESLIRP, for fiscal years
2018
,
2017
and
2016
totaled
$2.9 million
, $
2.3 million
and
$2.2 million
, respectively.
The Company has invested in several corporate-owned key-person life insurance policies with the intention of using these investments to fund the ESLIRP and the DCP. Participants have no interest in any such investments. As of
December 29, 2018
and
December 30, 2017
, the cash surrender value of these life insurance policies were
$32.3 million
and
$34.0 million
, respectively.
91
CHARLES RIVER LABORATORIES INTERNATIONAL, INC.
NOTES TO CONSOLIDATED FINANCIAL STATEMENTS (Continued)
The following table provides a reconciliation of benefit obligations and plan assets of the Company’s pension, DCP and ESLIRP plans:
|
|
December 29, 2018
|
December 30, 2017
|
|||||
|
(in thousands)
|
|||||||
|
Change in projected benefit obligations:
|
|
|
|
|
|||
|
Benefit obligation at beginning of year
|
$
|
392,964
|
|
$
|
379,942
|
|
|
|
Service cost
|
2,612
|
|
3,110
|
|
|||
|
Interest cost
|
10,850
|
|
11,642
|
|
|||
|
Other
|
1,499
|
|
—
|
|
|||
|
Benefit payments
|
(8,886
|
)
|
(9,665
|
)
|
|||
|
Plan amendments
|
104
|
|
(1
|
)
|
|||
|
Actuarial gain
|
(21,168
|
)
|
(15,724
|
)
|
|||
|
Administrative expenses paid
|
(195
|
)
|
(698
|
)
|
|||
|
Effect of foreign exchange
|
(14,975
|
)
|
24,358
|
|
|||
|
Benefit obligation at end of year
|
$
|
362,805
|
|
$
|
392,964
|
|
|
|
Change in fair value of plan assets:
|
|||||||
|
Fair value of plan assets at beginning of year
|
$
|
304,325
|
|
$
|
256,903
|
|
|
|
Actual return on plan assets
|
(7,419
|
)
|
33,558
|
|
|||
|
Employer contributions
|
31,174
|
|
5,165
|
|
|||
|
Benefit payments
|
(8,886
|
)
|
(9,665
|
)
|
|||
|
Administrative expenses paid
|
(195
|
)
|
(698
|
)
|
|||
|
Effect of foreign exchange
|
(13,290
|
)
|
19,062
|
|
|||
|
Fair value of plan assets at end of year
|
$
|
305,709
|
|
$
|
304,325
|
|
|
|
Net balance sheet liability
|
$
|
57,096
|
|
$
|
88,639
|
|
|
|
Amounts recognized in balance sheet:
|
|||||||
|
Noncurrent assets
|
$
|
3,280
|
|
$
|
1,169
|
|
|
|
Current liabilities
|
1,095
|
|
1,228
|
|
|||
|
Noncurrent liabilities
|
59,281
|
|
88,580
|
|
|||
Amounts recognized in accumulated other comprehensive loss related to the Company’s
pension, DCP and ESLIRP plans
are as follows:
|
Fiscal Year
|
|||||||
|
|
2018
|
2017
|
|||||
|
(in thousands)
|
|||||||
|
Net actuarial loss
|
$
|
93,483
|
|
$
|
94,705
|
|
|
|
Net prior service cost (credit)
|
(2,585
|
)
|
(3,203
|
)
|
|||
|
Net amount recognized
|
$
|
90,898
|
|
$
|
91,502
|
|
|
92
CHARLES RIVER LABORATORIES INTERNATIONAL, INC.
NOTES TO CONSOLIDATED FINANCIAL STATEMENTS (Continued)
The accumulated benefit obligation and fair value of plan assets for the Company’s pension, DCP and ESLIRP plans with accumulated benefit obligations in excess of plan assets are as follows:
|
|
December 29, 2018
|
December 30, 2017
|
|||||
|
(in thousands)
|
|||||||
|
Accumulated benefit obligation
|
$
|
254,138
|
|
$
|
359,965
|
|
|
|
Fair value of plan assets
|
207,538
|
|
285,609
|
|
|||
The projected benefit obligation and fair value of plan assets for the Company’s pension, DCP and ESLIRP plans with projected benefit obligations in excess of plan assets are as follows:
|
|
December 29, 2018
|
December 30, 2017
|
|||||
|
(in thousands)
|
|||||||
|
Projected benefit obligation
|
$
|
273,625
|
|
$
|
381,960
|
|
|
|
Fair value of plan assets
|
213,249
|
|
292,152
|
|
|||
The amounts in accumulated other comprehensive income expected to be recognized as components of net periodic benefit cost over the next fiscal year are as follows:
|
December 29, 2018
|
|||
|
(in thousands)
|
|||
|
Amortization of net actuarial loss
|
$
|
1,954
|
|
|
Amortization of net prior service credit
|
(486
|
)
|
|
Components of net periodic benefit cost for the Company’s
pension, DCP and ESLIRP plans
are as follows:
|
Fiscal Year
|
|||||||||||
|
|
2018
|
2017
|
2016
|
||||||||
|
(in thousands)
|
|||||||||||
|
Service cost
|
$
|
2,612
|
|
$
|
3,110
|
|
$
|
2,453
|
|
||
|
Interest cost
|
10,850
|
|
11,642
|
|
12,046
|
|
|||||
|
Expected return on plan assets
|
(15,516
|
)
|
(14,249
|
)
|
(14,164
|
)
|
|||||
|
Amortization of prior service cost (credit)
|
(514
|
)
|
(496
|
)
|
(292
|
)
|
|||||
|
Amortization of net loss (gain)
|
2,990
|
|
3,845
|
|
2,003
|
|
|||||
|
Curtailment
|
—
|
|
—
|
|
(279
|
)
|
|||||
|
Settlements
|
—
|
|
—
|
|
788
|
|
|||||
|
Other
|
910
|
|
—
|
|
—
|
|
|||||
|
Net periodic cost (benefit)
|
$
|
1,332
|
|
$
|
3,852
|
|
$
|
2,555
|
|
||
Assumptions
Weighted-average assumptions used to determine projected benefit obligations are as follows:
|
|
December 29, 2018
|
December 30, 2017
|
|||
|
Discount rate
|
3.21
|
%
|
2.82
|
%
|
|
|
Rate of compensation increase
|
3.23
|
%
|
3.16
|
%
|
|
93
CHARLES RIVER LABORATORIES INTERNATIONAL, INC.
NOTES TO CONSOLIDATED FINANCIAL STATEMENTS (Continued)
Weighted-average assumptions used to determine net periodic benefit cost are as follows:
|
|
December 29, 2018
|
December 30, 2017
|
December 31, 2016
|
|||||
|
Discount rate
|
2.82
|
%
|
3.01
|
%
|
3.89
|
%
|
||
|
Expected long-term return on plan assets
|
5.18
|
%
|
5.41
|
%
|
5.83
|
%
|
||
|
Rate of compensation increase
|
3.16
|
%
|
3.25
|
%
|
3.17
|
%
|
||
A
0.5%
decrease in the expected rate of return would increase annual pension expense by
$1.5 million
.
Plan Assets
The Company invests its pension assets with the objective of achieving a total long-term rate of return sufficient to fund future pension obligations and to minimize future pension contributions. The Company is willing to tolerate a commensurate level of risk to achieve this objective. The Company controls its risk by maintaining a diversified portfolio of asset classes. Plan assets did not include any of the Company’s common stock as of
December 29, 2018
or
December 30, 2017
. The weighted-average target asset allocations are
28.5%
to equity securities,
35.8%
to fixed income securities and
35.7%
to other securities.
The fair value of the Company’s pension plan assets by asset category are as follows:
|
|
December 29, 2018
|
December 30, 2017
|
|||||||||||||||||||||||||||||
|
Level 1
|
|
Level 2
|
Level 3
|
Total
|
|
Level 1
|
|
Level 2
|
Level 3
|
Total
|
|||||||||||||||||||||
|
(in thousands)
|
|||||||||||||||||||||||||||||||
|
Cash
|
$
|
7,317
|
|
|
$
|
—
|
|
$
|
—
|
|
$
|
7,317
|
|
|
$
|
564
|
|
$
|
—
|
|
$
|
—
|
|
$
|
564
|
|
|||||
|
Equity securities
(1)
|
72,237
|
|
|
—
|
|
—
|
|
72,237
|
|
|
88,854
|
|
—
|
|
—
|
|
88,854
|
|
|||||||||||||
|
Debt securities
(2)
|
17,147
|
|
|
4,100
|
|
—
|
|
21,247
|
|
|
18,485
|
|
4,117
|
|
—
|
|
22,602
|
|
|||||||||||||
|
Mutual funds
(3)
|
86,282
|
|
|
59,984
|
|
—
|
|
146,266
|
|
|
74,708
|
|
66,656
|
|
—
|
|
141,364
|
|
|||||||||||||
|
Other
(4)
|
718
|
|
56,283
|
|
1,641
|
|
58,642
|
|
472
|
|
48,713
|
|
1,756
|
|
50,941
|
|
|||||||||||||||
|
Total
|
$
|
183,701
|
|
$
|
120,367
|
|
$
|
1,641
|
|
$
|
305,709
|
|
$
|
183,083
|
|
$
|
119,486
|
|
$
|
1,756
|
|
$
|
304,325
|
|
|||||||
|
(1)
This category comprises equity securities held by non-U.S. pension plans valued at the quoted closing price, and translated into U.S. dollars using a foreign currency exchange rate at year end.
|
|||||||||||||||||||||||||||||||
|
(2)
This category comprises debt securities held by non-U.S. pension plans valued at the quoted closing price, and translated into U.S. dollars using a foreign currency exchange rate at year end.
|
|||||||||||||||||||||||||||||||
|
(3)
This category comprises mutual funds valued at the net asset value of shares held at year end.
|
|||||||||||||||||||||||||||||||
|
(4)
This category mainly comprises fixed income securities tied to various UK government bond yields held by non-US pension plans valued at the net asset value of shares held at year-end, and translated into U.S. dollars using a foreign currency exchange rate at year end.
|
|||||||||||||||||||||||||||||||
The activity within the Level 3 pension plan assets was non-significant during the periods presented.
During fiscal year
2018
, the Company contributed
$29.9 million
to the pension plans and
$1.3 million
directly to certain participants outside of plan assets. The Company expects to contribute approximately
$0.9 million
in fiscal year
2019
.
Expected benefit payments are estimated using the same assumptions used in determining the Company’s benefit obligation as of
December 29, 2018
. Benefit payments will depend on future employment and compensation levels, among other factors, and changes in any of these factors could significantly affect these estimated future benefit payments. Estimated future benefit payments during the next five years and in the aggregate for fiscal years thereafter, are as follows:
|
Fiscal Year
|
Pension Plans
|
|||
|
(in thousands)
|
||||
|
2019
|
$
|
9,311
|
|
|
|
2020
|
9,754
|
|
||
|
2021
|
10,374
|
|
||
|
2022
|
11,076
|
|
||
|
2023
|
35,599
|
|
||
|
Thereafter
|
73,903
|
|
||
94
CHARLES RIVER LABORATORIES INTERNATIONAL, INC.
NOTES TO CONSOLIDATED FINANCIAL STATEMENTS (Continued)
Post-Retirement Health and Life Insurance Plans
The Company’s Canadian location offers post-retirement life insurance benefits to its employees and post-retirement medical and dental insurance coverage to certain executives. The plan is non-contributory and unfunded. As of
December 29, 2018
and
December 30, 2017
, the accumulated benefit obligation related to the plan was
$1.5 million
and
$1.4 million
, respectively. The amounts included in other accumulated comprehensive income as well as expenses related to the plan were non-significant for fiscal years
2018
,
2017
and
2016
.
Charles River Laboratories Employee Savings Plan
The Charles River Laboratories Employee Savings Plan is a defined contribution plan in the form of a qualified 401(k) plan in which substantially all U.S. employees are eligible to participate upon employment. The plan contains a provision whereby the Company matches a percentage of employee contributions. During fiscal years
2018
,
2017
and
2016
, the costs associated with this defined contribution plan totaled
$13.4 million
,
$11.6 million
and
$6.2 million
, respectively.
13. STOCK-BASED COMPENSATION
The Company has stock-based compensation plans under which employees and non-employee directors may be granted stock-based awards such as stock options, restricted stock, restricted stock units (RSUs), and performance share units (PSUs).
During fiscal years
2018
,
2017
and
2016
, the primary share-based awards and their general terms and conditions are as follows:
|
•
|
Stock options, which entitle the holder to purchase a specified number of shares of common stock at an exercise price equal to the closing market price of common stock on the date of grant; typically vest over
4
years; and typically expire
5
to
7
years from date of grant.
|
|
•
|
Restricted stock, which is an award of common stock issued on the grant date and subject to vesting, typically over
2
to
4
years. Recipients cannot sell or transfer the shares until the restriction period has lapsed, but are entitled to forfeitable cash dividends and to vote their respective shares upon grant.
|
|
•
|
RSUs, which represent an unsecured promise to grant at no cost a set number of shares of common stock upon the completion of the vesting schedule, and typically vest over
2
to
4
years. With respect to RSUs, recipients are not entitled to cash dividends and have no voting rights on the stock during the vesting period.
|
|
•
|
PSUs, which entitle the holder to receive at no cost, a specified number of shares of common stock within a range of shares from
zero
to a specified maximum and typically vest over
3
years. Payout of this award is contingent upon achievement of certain performance and market conditions.
|
In May 2007, the Company’s shareholders approved the 2007 Incentive Plan, which was amended in 2009, 2011, 2013 and 2015 (2007 Plan). The 2007 Plan provided no further awards to be granted under preexisting stock option and incentive plans; provided, however, that any shares that have been forfeited or canceled in accordance with the terms of the applicable award under a preexisting plan may be subsequently awarded in accordance with the terms of the preexisting plan. The 2007 Plan allows a maximum of
18.7 million
shares to be awarded, of which restricted stock grants, RSUs, and performance based stock awards count as
2.3
shares and stock options count as
1.0
share. Any stock options and other share-based awards that were granted under prior plans and were outstanding in May 2007 continue in accordance with the terms of the respective plans.
In May 2016, the Company’s shareholders approved the 2016 Incentive Plan (2016 Plan). The 2016 Plan provided no further awards to be granted under preexisting stock option and incentive plans; provided, however, that any shares that have been forfeited or canceled in accordance with the terms of the applicable award under a preexisting plan may be subsequently awarded in accordance with the terms of the preexisting plan. The 2016 Plan allows a maximum of
6.1 million
shares to be awarded, of which restricted stock grants, RSUs, and performance based stock awards count as
2.3
shares and stock options count as
1.0
share. Any stock options and other share-based awards that were granted under prior plans and were outstanding in May 2016 continue in accordance with the terms of the respective plans.
In May 2018, the Company’s shareholders approved the 2018 Incentive Plan (2018 Plan). The 2018 Plan provided no further awards to be granted under preexisting stock option and incentive plans; provided, however, that any shares that have been forfeited or canceled in accordance with the terms of the applicable award under a preexisting plan may be subsequently awarded in accordance with the terms of the preexisting plan. The 2018 Plan allows a maximum of
7.2 million
shares to be awarded, of which restricted stock grants, RSUs, and performance based stock awards count as
2.3
shares and stock options count as
1.0
share. Any stock options and other share-based awards that were granted under prior plans and were outstanding in May 2018 continue in accordance with the terms of the respective plans.
95
CHARLES RIVER LABORATORIES INTERNATIONAL, INC.
NOTES TO CONSOLIDATED FINANCIAL STATEMENTS (Continued)
As of
December 29, 2018
, approximately
7.1 million
shares were authorized for future grants under the Company’s share-based compensation plans. The Company settles employee share-based compensation awards with newly issued shares. The following table provides stock-based compensation by the financial statement line item in which it is reflected:
|
Fiscal Year
|
|||||||||||
|
2018
|
2017
|
2016
|
|||||||||
|
(in thousands)
|
|||||||||||
|
Cost of revenue
|
$
|
6,285
|
|
$
|
6,509
|
|
$
|
6,508
|
|
||
|
Selling, general and administrative
|
41,061
|
|
37,494
|
|
37,134
|
|
|||||
|
Stock-based compensation, before income taxes
|
47,346
|
|
44,003
|
|
43,642
|
|
|||||
|
Provision for income taxes
|
(9,188
|
)
|
(13,428
|
)
|
(15,548
|
)
|
|||||
|
Stock-based compensation, net of income taxes
|
$
|
38,158
|
|
$
|
30,575
|
|
$
|
28,094
|
|
||
The Company capitalized
no
stock-based compensation related costs for fiscal years
2018
,
2017
and
2016
.
Stock Options
The following table summarizes stock option activity under the Company’s stock-based compensation plans:
|
Number of shares
|
Weighted Average
Exercise Price |
Weighted Average
Remaining Contractual Life |
Aggregate
Intrinsic Value |
|||||||||
|
(in thousands)
|
(in years)
|
(in thousands)
|
||||||||||
|
Options outstanding as of December 30, 2017
|
1,774
|
|
$
|
73.19
|
|
|
|
|
||||
|
Options granted
|
508
|
|
$
|
109.32
|
|
|
|
|
||||
|
Options exercised
|
(576
|
)
|
$
|
65.40
|
|
|
|
|
||||
|
Options canceled
|
(150
|
)
|
$
|
88.17
|
|
|
|
|
||||
|
Options outstanding as of December 29, 2018
|
1,556
|
|
$
|
86.44
|
|
2.9
|
$
|
39,300
|
|
|||
|
Options exercisable as of December 29, 2018
|
379
|
|
$
|
66.91
|
|
1.8
|
$
|
16,991
|
|
|||
|
Options expected to vest as of December 29, 2018
|
1,175
|
|
$
|
92.74
|
|
3.2
|
$
|
22,309
|
|
|||
The fair value of stock options granted was estimated using the Black-Scholes option-pricing model with the following weighted-average assumptions:
|
Fiscal Year
|
||||||||
|
2018
|
2017
|
2016
|
||||||
|
Expected life (in years)
|
3.7
|
|
3.6
|
|
3.6
|
|
||
|
Expected volatility
|
25
|
%
|
24
|
%
|
25
|
%
|
||
|
Risk-free interest rate
|
2.4
|
%
|
1.6
|
%
|
1.2
|
%
|
||
|
Expected dividend yield
|
0
|
%
|
0
|
%
|
0
|
%
|
||
The weighted-average grant date fair value of stock options granted was
$24.80
,
$18.33
and
$15.12
for fiscal years
2018
,
2017
and
2016
, respectively.
As of
December 29, 2018
, the unrecognized compensation cost related to unvested stock options expected to vest was
$13.4 million
. This unrecognized compensation will be recognized over an estimated weighted-average amortization period of
2.3 years
.
The total intrinsic value of options exercised during fiscal years
2018
,
2017
and
2016
was
$29.0 million
,
$30.0 million
and
$23.0 million
, respectively, with intrinsic value defined as the difference between the market price on the date of exercise and the exercise price.
96
CHARLES RIVER LABORATORIES INTERNATIONAL, INC.
NOTES TO CONSOLIDATED FINANCIAL STATEMENTS (Continued)
Restricted Stock and Restricted Stock Units
The following table summarizes the restricted stock and restricted stock units activity for fiscal year
2018
:
|
Restricted Stock and Restricted Stock Units
|
Weighted
Average Grant Date Fair Value |
|||||
|
(in thousands)
|
||||||
|
December 30, 2017
|
514
|
|
$
|
80.45
|
|
|
|
Granted
|
221
|
|
$
|
109.15
|
|
|
|
Vested
|
(201
|
)
|
$
|
76.84
|
|
|
|
Canceled
|
(44
|
)
|
$
|
92.78
|
|
|
|
December 29, 2018
|
490
|
|
$
|
93.80
|
|
|
As of
December 29, 2018
, the unrecognized compensation cost related to shares of unvested restricted stock and RSUs expected to vest was
$25.7 million
, which is expected to be recognized over an estimated weighted-average amortization period of
2.3 years
. The total fair value of restricted stock and RSU grants that vested during fiscal years
2018
,
2017
and
2016
was
$15.5 million
,
$13.6 million
and
$14.6 million
, respectively.
Performance Based Stock Award Program
The Company issues PSUs to certain corporate officers. The number of shares of common stock issued for each PSU is adjusted based on a performance condition linked to the Company’s financial performance. Certain awards are further adjusted based on a market condition, which is calculated based on the Company’s stock performance relative to a peer group over the
three
-year vesting period. The fair value of the market condition is reflected in the fair value of the award at grant date.
The Company utilizes a Monte Carlo simulation valuation model to value these awards. Information pertaining to the Company’s PSUs and the related estimated weighted-average assumptions used to calculate their fair value were as follows:
|
Fiscal Year
|
|||||||||||
|
2018
|
2017
|
2016
|
|||||||||
|
PSUs granted
|
200,333
|
|
197,645
|
|
190,628
|
|
|||||
|
Weighted average grant date fair value
|
$
|
117.89
|
|
$
|
99.96
|
|
$
|
80.38
|
|
||
|
Key Assumptions:
|
|||||||||||
|
Expected volatility
|
26
|
%
|
26
|
%
|
24
|
%
|
|||||
|
Risk-free interest rate
|
2.4
|
%
|
1.3
|
%
|
0.9
|
%
|
|||||
|
Expected dividend yield
|
0
|
%
|
0
|
%
|
0
|
%
|
|||||
|
20 trading day average stock price on grant date
|
2.9
|
%
|
17.7
|
%
|
(4.8
|
)%
|
|||||
The maximum number of common shares to be issued upon vesting of PSUs is
0.4 million
. For fiscal years
2018
,
2017
and
2016
, the Company recognized stock-based compensation related to PSUs of
$20.4 million
,
$18.9 million
and
$19.7 million
, respectively. The total fair value of PSUs that vested during fiscal years
2018
,
2017
and
2016
was
$18.3 million
,
$14.4 million
and
$18.0 million
, respectively.
In fiscal years
2018
,
2017
and
2016
, the Company also issued approximately
17,000
,
15,000
and
18,000
PSUs using a weighted-average grant date fair value per share of
$109.34
,
$88.05
and
$73.70
respectively. These PSUs vest upon the achievement of financial targets and other performance measures.
14. FOREIGN CURRENCY CONTRACTS
The Company entered into foreign exchange forward contracts during fiscal 2018 to limit its foreign currency exposure related a U.S. dollar denominated loan borrowed by a non-U.S. Euro functional currency entity under the Company’s
$2.3B
Credit Facility. These contracts are not designated as hedging instruments. Any gains or losses on these forward contracts are recognized immediately in Interest expense. The open contract at December 29, 2018, which has a duration of approximately 3 months, is recorded at fair value in the Company’s accompanying consolidated balance sheet.
The notional amount and fair value of the open contract as of
December 29, 2018
is summarized as follows:
97
CHARLES RIVER LABORATORIES INTERNATIONAL, INC.
NOTES TO CONSOLIDATED FINANCIAL STATEMENTS (Continued)
|
December 29, 2018
|
||||||||
|
Notional Amount
|
Fair Value
|
Balance Sheet Location
|
||||||
|
(in thousands)
|
||||||||
|
$
|
343,300
|
|
$
|
(1,319
|
)
|
Other current liabilities
|
||
The Company also entered into foreign exchange forward contracts during fiscal years
2018
,
2017
, and
2016
to limit its foreign currency exposure related to certain intercompany loans. These contracts are not designated as hedging instruments. Any gains or losses on forward contracts associated with intercompany loans are recognized immediately in Other income, net and are largely offset by the remeasurement of the underlying intercompany loans. The Company did not have any foreign currency contracts open related to intercompany loans as of
December 29, 2018
and
December 30, 2017
.
The following table summarizes the effect of all foreign exchange forward contracts on the Company’s consolidated statements of income:
|
Fiscal Year
|
||||||||||||
|
Location of Gain
|
2018
|
2017
|
2016
|
|||||||||
|
(in thousands)
|
||||||||||||
|
Interest expense
|
$
|
1,486
|
|
$
|
—
|
|
$
|
—
|
|
|||
|
Other income, net
|
—
|
|
—
|
|
3,373
|
|
||||||
15. RESTRUCTURING AND ASSET IMPAIRMENTS
Global RMS Restructuring Initiatives
In the fourth quarter of fiscal year 2017, the Company committed to a plan to further reduce costs and improve operating efficiencies in its RMS reportable segment. The plan included ceasing production within the Company’s facility in Maryland and reducing its workforce at various global RMS facilities during 2018. On August 1, 2018, the Company’s Board of Directors approved a modification to the plan which repurposes the facility in Maryland to be used for alternative initiatives. The Company’s existing lease obligation continues through 2028 and the Company expects to remain in the facility for the duration of the lease term.
The following table presents a summary of severance and transition costs, and asset impairments (referred to as restructuring costs) related to this initiative by classification within the consolidated statements of income:
|
Severance and Transition Costs
|
Asset Impairments and Other Costs
|
Total
|
|||||||||
|
(in thousands)
|
|||||||||||
|
December 29, 2018
|
|||||||||||
|
Cost of services provided and products sold (excluding amortization of intangible assets)
|
$
|
847
|
|
$
|
822
|
|
$
|
1,669
|
|
||
|
Selling, general and administrative
|
314
|
|
—
|
|
314
|
|
|||||
|
Total
|
$
|
1,161
|
|
$
|
822
|
|
$
|
1,983
|
|
||
|
December 30, 2017
|
|||||||||||
|
Cost of services provided and products sold (excluding amortization of intangible assets)
|
$
|
362
|
|
$
|
17,716
|
|
$
|
18,078
|
|
||
|
Selling, general and administrative
|
67
|
|
—
|
|
67
|
|
|||||
|
Total
|
$
|
429
|
|
$
|
17,716
|
|
$
|
18,145
|
|
||
No further restructuring costs related to this initiative are expected to be incurred beyond
2018
. Restructuring costs incurred during 2017 were
$18.1 million
, which primarily related to non-cash asset impairments and accelerated depreciation charges of
$17.7 million
. The costs incurred during 2018 were
$2.0 million
, which primarily related to cash payments for severance and transition costs of
$1.2 million
. All of the costs are recorded in the RMS reportable segment.
Other Restructuring Initiatives
98
CHARLES RIVER LABORATORIES INTERNATIONAL, INC.
NOTES TO CONSOLIDATED FINANCIAL STATEMENTS (Continued)
In recent fiscal years, the Company has undertaken productivity improvement initiatives within all reportable segments at various locations across the U.S., Europe, and Japan. This includes workforce right-sizing and scalability initiatives, resulting in severance and transition costs; and cost related to the consolidation of facilities, resulting in asset impairment and accelerated depreciation charges. The Company’s existing lease obligations for certain facilities continue through various dates, the latest being March 2028.
The following table presents a summary of restructuring costs related to these initiatives by classification within the consolidated statements of income:
|
Severance and Transition Costs
|
Lease Obligations
|
Asset Impairments and Other Costs
|
Total
|
||||||||||||
|
(in thousands)
|
|||||||||||||||
|
Fiscal Year 2018
|
|||||||||||||||
|
Cost of services provided and products sold (excluding amortization of intangible assets)
|
$
|
923
|
|
$
|
—
|
|
$
|
27
|
|
$
|
950
|
|
|||
|
Selling, general and administrative
|
6,597
|
|
—
|
|
21
|
|
6,618
|
|
|||||||
|
Total
|
$
|
7,520
|
|
$
|
—
|
|
$
|
48
|
|
$
|
7,568
|
|
|||
|
Fiscal Year 2017
|
|||||||||||||||
|
Cost of services provided and products sold (excluding amortization of intangible assets)
|
$
|
1,944
|
|
$
|
—
|
|
$
|
929
|
|
$
|
2,873
|
|
|||
|
Selling, general and administrative
|
1,905
|
|
—
|
|
—
|
|
1,905
|
|
|||||||
|
Total
|
$
|
3,849
|
|
$
|
—
|
|
$
|
929
|
|
$
|
4,778
|
|
|||
|
Fiscal Year 2016
|
|||||||||||||||
|
Cost of services provided and products sold (excluding amortization of intangible assets)
|
$
|
4,717
|
|
$
|
4,616
|
|
$
|
4,809
|
|
$
|
14,142
|
|
|||
|
Selling, general and administrative
|
3,737
|
|
—
|
|
—
|
|
3,737
|
|
|||||||
|
Total
|
$
|
8,454
|
|
$
|
4,616
|
|
$
|
4,809
|
|
$
|
17,879
|
|
|||
The following table presents restructuring costs by reportable segment for these productivity improvement initiatives:
|
Fiscal Year
|
|||||||||||
|
2018
|
2017
|
2016
|
|||||||||
|
(in thousands)
|
|||||||||||
|
RMS
|
$
|
—
|
|
$
|
291
|
|
$
|
759
|
|
||
|
DSA
|
1,063
|
|
1,604
|
|
17,114
|
|
|||||
|
Manufacturing
|
1,227
|
|
2,883
|
|
6
|
|
|||||
|
Unallocated corporate
|
5,278
|
|
—
|
|
—
|
|
|||||
|
Total
|
$
|
7,568
|
|
$
|
4,778
|
|
$
|
17,879
|
|
||
The following table provides a rollforward for all of the Company’s severance and transition costs, and lease obligation liabilities related to restructuring activities:
|
Fiscal Year
|
|||||||||||
|
2018
|
2017
|
2016
|
|||||||||
|
(in thousands)
|
|||||||||||
|
Beginning balance
|
$
|
6,856
|
|
$
|
8,102
|
|
$
|
2,969
|
|
||
|
Expense
|
8,681
|
|
4,278
|
|
13,070
|
|
|||||
|
Payments / utilization
|
(12,341
|
)
|
(6,103
|
)
|
(7,667
|
)
|
|||||
|
Foreign currency adjustments
|
(275
|
)
|
579
|
|
(270
|
)
|
|||||
|
Ending balance
|
$
|
2,921
|
|
$
|
6,856
|
|
$
|
8,102
|
|
||
As of
December 29, 2018
and
December 30, 2017
,
$2.4 million
and
$3.0 million
of severance and other personnel related costs liabilities and lease obligation liabilities, respectively, were included in accrued compensation and accrued liabilities within the Company’s consolidated balance sheets and
$0.5 million
and
$3.9 million
, respectively, were included in other long-term liabilities within the Company's consolidated balance sheets.
99
CHARLES RIVER LABORATORIES INTERNATIONAL, INC.
NOTES TO CONSOLIDATED FINANCIAL STATEMENTS (Continued)
16. COMMITMENTS AND CONTINGENCIES
Operating Leases
The Company rents laboratory and office space, land, vehicles and certain equipment under non-cancellable operating leases. These lease agreements contain various clauses for renewal at the Company’s option and, in certain cases, rent escalation clauses. Rental expense under these leases amounted to
$30.4 million
,
$26.3 million
and
$21.8 million
in fiscal years
2018
,
2017
and
2016
, respectively. In addition to rent, the leases may require the Company to pay additional amounts for taxes, insurance, maintenance and other operating expenses.
As of
December 29, 2018
, minimum rental commitments under non-cancellable leases, net of income from subleases, for each of the next five years and total thereafter were as follows:
|
Minimum Lease Payments
|
|||
|
(in thousands)
|
|||
|
2019
|
$
|
25,411
|
|
|
2020
|
22,400
|
|
|
|
2021
|
21,544
|
|
|
|
2022
|
18,535
|
|
|
|
2023
|
15,398
|
|
|
|
Thereafter
|
66,870
|
|
|
|
Total
|
$
|
170,158
|
|
Insurance
The Company maintains certain insurance policies that maintain large deductibles up to approximately
$1.0 million
, some with or without stop-loss limits, depending on market availability. Insurance policies at certain locations are based on a percentage of the insured assets, for which deductibles for certain property may exceed
$5.0 million
in the event of a catastrophic event.
Litigation
Various lawsuits, claims and proceedings of a nature considered normal to its business are pending against the Company. While the outcome of any of these proceedings cannot be accurately predicted, the Company does not believe the ultimate resolution of any of these existing matters would have a material adverse effect on the Company’s business or financial condition.
Guarantees
The Company enters into certain agreements with other parties in the ordinary course of business that contain indemnification provisions. These typically include agreements with directors and officers, business partners, contractors, landlords, and customers. Under these provisions, the Company generally indemnifies and holds harmless the indemnified party for losses suffered or incurred by the indemnified party as a result of the Company’s activities. These indemnification provisions generally survive termination of the underlying agreement. The maximum potential amount of future payments the Company could be required to make under these indemnification provisions is unlimited. However, to date the Company has not incurred material costs to defend lawsuits or settle claims related to these indemnification provisions. As a result, the estimated fair value of these obligations is minimal.
Purchase Obligations
The Company enters into unconditional purchase obligations, in the ordinary course of business, that include agreements to purchase goods or services that are enforceable and legally binding and that specify all significant terms including: fixed or minimum quantities to be purchased; fixed, minimum or variable price provisions; and the approximate timing of the transaction. Purchase obligations exclude agreements that are cancellable at any time without penalty. The aggregate amount of the Company’s unconditional purchase obligations totaled
$146.0 million
as of
December 29, 2018
.
100
CHARLES RIVER LABORATORIES INTERNATIONAL, INC.
NOTES TO CONSOLIDATED FINANCIAL STATEMENTS (Continued)
17. SELECTED QUARTERLY FINANCIAL DATA (unaudited)
The following table contains quarterly financial information for fiscal years
2018
and
2017
. The operating results for any quarter are not necessarily indicative of future period results.
|
First
Quarter
|
Second
Quarter
|
Third
Quarter
|
Fourth
Quarter
(1)
|
||||||||||||
|
(in thousands, except per share amounts)
|
|||||||||||||||
|
Fiscal Year 2018
|
|||||||||||||||
|
Total revenue
|
$
|
493,970
|
|
$
|
585,301
|
|
$
|
585,295
|
|
$
|
601,530
|
|
|||
|
Gross profit
(2)
|
181,469
|
|
215,981
|
|
216,200
|
|
226,417
|
|
|||||||
|
Operating income
|
67,829
|
|
76,710
|
|
84,362
|
|
102,482
|
|
|||||||
|
Net income attributable to common shareholders
|
52,631
|
|
53,709
|
|
60,368
|
|
59,665
|
|
|||||||
|
Earnings (loss) per common share
|
|||||||||||||||
|
Basic:
|
|||||||||||||||
|
Continuing operations attributable to common shareholders
|
$
|
1.10
|
|
$
|
1.08
|
|
$
|
1.25
|
|
$
|
1.24
|
|
|||
|
Discontinued operations
|
$
|
—
|
|
$
|
0.03
|
|
$
|
—
|
|
$
|
—
|
|
|||
|
Net income attributable to common shareholders
|
$
|
1.10
|
|
$
|
1.11
|
|
$
|
1.25
|
|
$
|
1.24
|
|
|||
|
Diluted:
|
|||||||||||||||
|
Continuing operations attributable to common shareholders
|
$
|
1.08
|
|
$
|
1.06
|
|
$
|
1.22
|
|
$
|
1.21
|
|
|||
|
Discontinued operations
|
$
|
—
|
|
$
|
0.03
|
|
$
|
—
|
|
$
|
—
|
|
|||
|
Net income attributable to common shareholders
|
$
|
1.08
|
|
$
|
1.10
|
|
$
|
1.22
|
|
$
|
1.21
|
|
|||
|
Fiscal Year 2017
|
|
|
|
|
|||||||||||
|
Total revenue
|
$
|
445,763
|
|
$
|
469,129
|
|
$
|
464,232
|
|
$
|
478,477
|
|
|||
|
Gross profit
(2)
|
171,352
|
|
185,325
|
|
176,847
|
|
167,394
|
|
|||||||
|
Operating income
|
69,706
|
|
81,686
|
|
74,062
|
|
62,827
|
|
|||||||
|
Net income (loss) attributable to common shareholders
|
46,778
|
|
53,952
|
|
52,474
|
|
(29,849
|
)
|
|||||||
|
Earnings (loss) per common share
|
|
|
|
|
|||||||||||
|
Basic:
|
|
|
|
|
|||||||||||
|
Continuing operations attributable to common shareholders
|
$
|
0.98
|
|
$
|
1.14
|
|
$
|
1.11
|
|
$
|
(0.63
|
)
|
|||
|
Discontinued operations
|
$
|
—
|
|
$
|
—
|
|
$
|
—
|
|
$
|
—
|
|
|||
|
Net income (loss) attributable to common shareholders
|
$
|
0.98
|
|
$
|
1.13
|
|
$
|
1.11
|
|
$
|
(0.63
|
)
|
|||
|
Diluted:
|
|
|
|
|
|||||||||||
|
Continuing operations attributable to common shareholders
|
$
|
0.97
|
|
$
|
1.12
|
|
$
|
1.09
|
|
$
|
(0.63
|
)
|
|||
|
Discontinued operations
|
$
|
—
|
|
$
|
—
|
|
$
|
—
|
|
$
|
—
|
|
|||
|
Net income (loss) attributable to common shareholders
|
$
|
0.97
|
|
$
|
1.12
|
|
$
|
1.08
|
|
$
|
(0.63
|
)
|
|||
|
(1)
Net loss attributable to common shareholders in 2017 includes the amounts recorded due to U.S. Tax Reform. See Note 11.
|
|||||||||||||||
|
(2)
Gross profit is calculated as total revenue minus cost of revenue (excluding amortization of intangible assets).
|
|||||||||||||||
Full-year amounts may not sum due to rounding.
18. SUBSEQUENT EVENT
Citoxlab
On February 13, 2019, the Company announced that it has signed a
binding offer to acquire Citoxlab for
€448 million
in cash (or approximately
$510 million
based on current exchange rates), subject to customary closing adjustments.
Citoxlab
is a non-clinical CRO, specializing in regulated safety assessment services, non-regulated discovery services, and medical device testing. With operations in Europe and North America, the proposed acquisition of Citoxlab would further strengthen the Company’s position as the leading, global, early-stage CRO by expanding its scientific portfolio and geographic footprint, which would enhance the Company’s ability to partner with clients across the drug discovery and development continuum.
The proposed transaction is expected to close in the second quarter of 2019, subject to labor consultations, regulatory requirements, and customary closing conditions. Upon completion of the labor consultations, Citoxlab’s shareholders are expected to enter into a definitive purchase agreement.
The proposed acquisition and associated fees are expected to be financed through the
101
CHARLES RIVER LABORATORIES INTERNATIONAL, INC.
NOTES TO CONSOLIDATED FINANCIAL STATEMENTS (Continued)
Company’s
existing revolving credit facility and cash.
In the event the agreement is terminated under specified circumstances, the Company may be required to pay a termination fee of
€18.2 million
. This business is expected to be reported as part of the Company’s DSA reportable segment.
102
Item 9. Changes in and Disagreements with Accountants on Accounting and Financial Disclosure
None.
Item 9A. Controls and Procedures
(a) Evaluation of Disclosure Controls and Procedures
Based on their evaluation, required by paragraph (b) of Rules 13a-15 or 15d-15, promulgated by the Securities Exchange Act of 1934, as amended (Exchange Act), the Company’s principal executive officer and principal financial officer have concluded that the Company’s disclosure controls and procedures, as defined in Rules 13a-15(e) and 15d-15(e) of the Exchange Act, are effective, at a reasonable assurance level, as of
December 29, 2018
, to ensure that information required to be disclosed by the Company in reports that it files or submits under the Exchange Act is recorded, processed, summarized, and reported within the time periods specified in Securities and Exchange Commission rules and forms. Disclosure controls and procedures include, without limitation, controls and procedures designed to ensure that information required to be disclosed by the Company in the reports that it files or submits under the Exchange Act is accumulated and communicated to the Company’s management, including its principal executive and principal financial officers, or persons performing similar functions, as appropriate to allow timely decisions regarding required disclosure. In designing and evaluating the disclosure controls and procedures, our management recognizes that any controls and procedures, no matter how well designed and operated, can provide only reasonable assurances of achieving the desired control objectives, and management necessarily was required to apply its judgment in designing and evaluating the controls and procedures.
Management’s Report on Internal Control Over Financial Reporting
Our management is responsible for establishing and maintaining adequate internal control over financial reporting (as defined in Rules 13a-15(f) and 15d-15(f) under the Securities Exchange Act of 1934, as amended). Our internal control over financial reporting is a process designed to provide reasonable assurance regarding the reliability of financial reporting and the preparation of financial statements for external purposes in accordance with generally accepted accounting principles. Because of its inherent limitations, internal control over financial reporting may not prevent or detect misstatements. Also, projections of any evaluation of effectiveness to future periods are subject to the risk that controls may become inadequate because of changes in conditions, or that the degree of compliance with the policies or procedures may deteriorate.
Under the supervision and with the participation of our management, including our CEO and CFO, we conducted an evaluation of the effectiveness of our internal control over financial reporting based on the framework in Internal Control-Integrated Framework (2013) issued by the Committee of Sponsoring Organizations of the Treadway Commission. Based on our assessment and those criteria, management concluded that the Company maintained effective internal control over financial reporting as of
December 29, 2018
.
We have excluded the business acquisitions completed during fiscal year
2018
, including
MPI Research and KWS BioTest,
from the assessment of the effectiveness of internal control over financial reporting as of
December 29, 2018
. The acquired businesses are
wholly-owned subsidiaries whose total assets and total revenue collectively represent 5.4% and 9.6%, respectively, of the related consolidated financial statement amounts as of and for fiscal year ended
December 29, 2018
.
The effectiveness of our internal control over financial reporting as of
December 29, 2018
, has been audited by PricewaterhouseCoopers LLP, an Independent Registered Public Accounting Firm, as stated in their report which appears
in
Item 8, “Financial Statements and Supplementary Data” in this Annual Report on Form 10-K
.
(b) Changes in Internal Controls
During fiscal year
2018
, the Company continued to execute a plan to centralize certain accounting transaction processing functions to internal shared service centers. There were no other material changes in the Company’s internal control over financial reporting identified in connection with the evaluation required by paragraph (d) of the Exchange Act Rules 13a-15 or 15d-15 that occurred during the fourth quarter of
2018
that materially affected, or were reasonably likely to materially affect, the Company’s internal control over financial reporting.
Item 9B. Other Information
None.
103
PART III
Item 10. Directors, Executive Officers and Corporate Governance
A. Directors and Compliance with Section 16(a) of the Exchange Act
The information required by this Item regarding our directors and compliance with Section 16(a) of the Exchange Act by our officers and directors will be included in the
2019
Proxy Statement under the sections captioned “Nominees for Directors” and “Section 16(a) Beneficial Ownership Reporting Compliance” and is incorporated herein by reference thereto. The information required by this Item regarding our corporate governance will be included in the
2019
Proxy Statement under the section captioned “Corporate Governance” and is incorporated herein by reference thereto.
B. Our Executive Officers
The information required by this Item regarding our executive officers is reported in Part I of this Form 10-K under the heading “Item 1. Business”
C. Audit Committee Financial Expert
The information required by this Item regarding the audit committee of the Board of Directors and financial experts will be included in the
2019
Proxy Statement under the section captioned “The Board of Directors and its Committees-Audit Committee and Financial Experts” and is incorporated herein by reference thereto.
D. Code of Ethics
We have adopted a Code of Business Conduct and Ethics that applies to all of our employees and directors, including our principal executive officer, principal financial officer, principal accounting officer, controller, or persons performing similar functions. Our Code of Business Conduct and Ethics is posted on our website and can be accessed by selecting the “Corporate Governance” link at http://ir.criver.com. We will provide to any person, without charge, a copy of our Code of Business Conduct and Ethics. To obtain a copy, please mail a request to the Secretary, Charles River Laboratories International, Inc., 251 Ballardvale Street, Wilmington, MA 01887. Information on our website is not incorporated by reference in this annual report.
E. Changes to Board Nomination Procedures
Since December 2008, there have been no material changes to the procedures by which security holders may recommend nominees to our Board of Directors.
Item 11. Executive Compensation
The information required by this Item will be included in the
2019
Proxy Statement under the sections captioned “
2018
Director Compensation,” “Compensation Discussion and Analysis,” “Executive Compensation and Related Information,” “Compensation Committee Interlocks and Insider Participation” and “Report of Compensation Committee,” and is incorporated herein by reference thereto.
Item 12. Security Ownership of Certain Beneficial Owners and Management and Related Stockholder Matters
The information required by this Item will be included in the
2019
Proxy Statement under the sections captioned “Beneficial Ownership of Securities” and “Equity Compensation Plan Information” and is incorporated herein by reference thereto.
Item 13. Certain Relationships and Related Transactions, and Director Independence
The information required by this Item will be included in the
2019
Proxy Statement under the sections captioned “Related Person Transaction Policy” and “Corporate Governance-Director Qualification Standards; Director Independence” and is incorporated herein by reference thereto.
Item 14. Principal Accountant Fees and Services
The information required by this Item will be included in the
2019
Proxy Statement under the section captioned “Statement of Fees Paid to Independent Registered Public Accounting Firm” and is incorporated herein by reference thereto.
104
PART IV
Item 15. Exhibits and Financial Statement Schedules
Item 15(a)(1) and (2) Financial Statements and Schedules
See "Index to Consolidated Financial Statements and Financial Statements Schedules" at Item 8 to this Annual Report on Form 10-K. Other financial statement schedules have not been included because they are not applicable or the information is included in the financial statements or notes thereto.
Item 15(a)(3) and Item 15(b) Exhibits
The exhibits filed as part of this Annual Report on Form 10-K are listed in the Exhibit Index immediately preceding the exhibits. We have identified in the Exhibit Index each management contract and compensation plan filed as an exhibit to this Annual Report on Form 10-K in response to Item 15(c) of Form 10-K.
Item 16. Form 10-K Summary
None.
105
SIGNATURES
Pursuant to the requirements of Section 13 or 15(d) of the Securities Exchange Act of 1934, the registrant has duly caused this report to be signed on its behalf by the undersigned, thereunto duly authorized.
|
|
CHARLES RIVER LABORATORIES INTERNATIONAL, INC.
|
|
|
February 13, 2019
|
By:
|
/s/ DAVID R. SMITH
|
|
David R. Smith
|
||
|
Corporate Executive Vice President and
Chief Financial Officer
|
||
Pursuant to the requirements of the Securities Exchange Act of 1934, this report has been signed by the following persons on behalf of the registrant and in the capacities indicated below and on the dates indicated.
|
Signatures
|
Title
|
Date
|
|
|
By:
|
/s/ JAMES C. FOSTER
|
Chairman, President and Chief Executive Officer
|
February 13, 2019
|
|
James C. Foster
|
|||
|
By:
|
/s/ DAVID R. SMITH
|
Corporate Executive Vice President and
|
February 13, 2019
|
|
David R. Smith
|
Chief Financial Officer
|
||
|
By:
|
/s/ MICHAEL G. KNELL
|
Corporate Senior Vice President and
|
February 13, 2019
|
|
Michael G. Knell
|
Chief Accounting Officer
|
||
|
By:
|
/s/ ROBERT J. BERTOLINI
|
Director
|
February 13, 2019
|
|
Robert J. Bertolini
|
|||
|
By:
|
/s/ STEPHEN D. CHUBB
|
Director
|
February 13, 2019
|
|
Stephen D. Chubb
|
|||
|
By:
|
/s/ DEBORAH T. KOCHEVAR
|
Director
|
February 13, 2019
|
|
Deborah T. Kochevar
|
|||
|
By:
|
/s/ MARTIN MACKAY
|
Director
|
February 13, 2019
|
|
Martin Mackay
|
|||
|
By:
|
/s/ JEAN-PAUL MANGEOLLE
|
Director
|
February 13, 2019
|
|
Jean-Paul Mangeolle
|
|||
|
By:
|
/s/ GEORGE E. MASSARO
|
Director
|
February 13, 2019
|
|
George E. Massaro
|
|||
|
By:
|
/s/ GEORGE M. MILNE, JR.
|
Director
|
February 13, 2019
|
|
George M. Milne, Jr.
|
|||
|
By:
|
/s/ C. RICHARD REESE
|
Director
|
February 13, 2019
|
|
C. Richard Reese
|
|||
|
By:
|
/s/ RICHARD F. WALLMAN
|
Director
|
February 13, 2019
|
|
Richard F. Wallman
|
|||
106
EXHIBIT INDEX
|
Exhibit No.
|
Description
|
Filed with this Form 10-K
|
Incorporation by Reference
|
||
|
Form
|
Filing Date
|
Exhibit No.
|
|||
|
3.1
|
S-1/A
|
June 23, 2000
|
3.1
|
||
|
3.2
|
8-K
|
May 16, 2016
|
3.2
|
||
|
4.1
|
S-1/A
|
June 23, 2000
|
4.1
|
||
|
4.2*
|
10-K
|
February 27, 2013
|
4.4
|
||
|
4.3*
|
10-K
|
February 14, 2017
|
4.3
|
||
|
4.4
|
8-K
|
April 3, 2018
|
4.1
|
||
|
4.5
|
8-K
|
April 3, 2018
|
4.2
|
||
|
4.6
|
8-K
|
April 3, 2018
|
4.3
|
||
|
10.1*
|
10-K
|
February 17, 2015
|
10.13
|
||
|
10.2*
|
10-Q
|
August 3, 2016
|
10.1
|
||
|
10.3*
|
10-Q
|
May 10, 2018
|
10.2
|
||
|
10.4*
|
10-K
|
February 20, 2008
|
10.17
|
||
|
10.5*
|
10-K
|
February 14, 2017
|
10.4
|
||
|
10.6*
|
10-K
|
February 20, 2008
|
10.18
|
||
|
10.7*
|
10-K
|
February 14, 2017
|
10.6
|
||
|
10.8*
|
10-K
|
February 14, 2017
|
10.7
|
||
|
10.9*
|
10-Q
|
August 3, 2010
|
10.1
|
||
|
10.10*
|
10-K
|
February 23, 2009
|
10.7
|
||
|
10.11*
|
10-K
|
February 12, 2016
|
10.4
|
||
|
10.12*
|
10-Q
|
May 4, 2016
|
10.1
|
||
|
10.13*
|
10-K
|
March 9, 2005
|
10.23
|
||
|
10.14*
|
10-K
|
February 27, 2012
|
10.11
|
||
|
10.15*
|
10-Q
|
August 7, 2012
|
10.1
|
||
|
10.16*
|
8-K
|
February 13, 2018
|
99.2
|
||
|
10.17*
|
10-K
|
February 12, 2016
|
10.16
|
||
|
10.18
|
8-K
|
March 26, 2018
|
10.1
|
||
|
10.19*
|
10-Q
|
November 7, 2018
|
10.1
|
||
107
|
Exhibit No.
|
Description
|
Filed with this Form 10-K
|
Incorporation by Reference
|
||
|
Form
|
Filing Date
|
Exhibit No.
|
|||
|
10.20*
|
10-Q
|
November 7, 2018
|
10.2
|
||
|
10.21*
|
10-Q
|
November 7, 2018
|
10.3
|
||
|
21.1
|
X
|
||||
|
23.1
|
X
|
||||
|
31.1
|
X
|
||||
|
31.2
|
X
|
||||
|
32.1
|
X
|
||||
|
101.INS
|
eXtensible Business Reporting Language (XBRL) Instance Document
|
X
|
|||
|
101.SCH
|
XBRL Taxonomy Extension Schema
|
X
|
|||
|
101.CAL
|
XBRL Taxonomy Extension Calculation Linkbase
|
X
|
|||
|
101.DEF
|
XBRL Taxonomy Extension Definition Linkbase
|
X
|
|||
|
101.LAB
|
XBRL Taxonomy Extension Labels Linkbase
|
X
|
|||
|
101.PRE
|
XBRL Taxonomy Extension Presentation Linkbase
|
X
|
|||
|
* Management contract or compensatory plan, contract or arrangement.
|
|||||
108
TABLE OF CONTENTS
Part IItem 1. BusinessItem 1A. Risk FactorsItem 1B. Unresolved Staff CommentsItem 2. PropertiesItem 3. Legal ProceedingsItem 4. Mine Safety DisclosuresPart IIItem 5. Market For Registrant S Common Equity, Related Stockholder Matters and Issuer Purchases Of Equity SecuritiesItem 6. Selected Consolidated Financial DataItem 8, Financial Statements and Supplementary Data in This Annual Report on Form 10-kItem 7. Management S Discussion and Analysis Of Financial Condition and Results Of OperationsNote 6, Venture Capital Investments and Marketable Securities, To Our Consolidated Financial Statements Contained in Item 8,Item 7A. Quantitative and Qualitative Disclosures About Market RiskItem 8. Financial Statements and Supplementary DataItem 9. Changes in and Disagreements with Accountants on Accounting and Financial DisclosureItem 9A. Controls and ProceduresItem 9B. Other InformationPart IIIItem 10. Directors, Executive Officers and Corporate GovernanceItem 11. Executive CompensationItem 12. Security Ownership Of Certain Beneficial Owners and Management and Related Stockholder MattersItem 13. Certain Relationships and Related Transactions, and Director IndependenceItem 14. Principal Accountant Fees and ServicesPart IVItem 15. Exhibits and Financial Statement SchedulesItem 15(a)(1) and (2) Financial Statements and SchedulesItem 15(a)(3) and Item 15(b) ExhibitsItem 16. Form 10-k Summary