UNITED STATES
SECURITIES AND EXCHANGE COMMISSION
Washington, D.C. 20549
___________________________
FORM 20-F
|
¨
|
Registration Statement Pursuant to Section 12(b) or 12(g) of The Securities Exchange Act of 1934
|
OR
|
ý
|
Annual Report Pursuant to Section 13 or 15(d) of The Securities Exchange Act of 1934 for the fiscal year ended
December 31, 2017
|
OR
|
¨
|
Transition Report Pursuant to Section 13 or 15(d) of The Securities Exchange Act of 1934
|
OR
|
¨
|
Shell Company Report Pursuant to Section 13 or 15(d) of The Securities Exchange Act of 1934
|
Commission file number 0-30752
AETERNA ZENTARIS INC.
(Exact Name of Registrant as Specified in its Charter)
Not Applicable
(Translation of Registrant's Name into English)
Canada
(Jurisdiction of Incorporation)
315 Sigma Drive
Summerville, South Carolina, USA
29486
(Address of Principal Executive Offices)
Michael V. Ward
Telephone: 843-900-3201
E-mail: mward@aezsinc.com
315 Sigma Drive
Summerville, South Carolina
29486
(Name, Telephone, E-mail and Address of Company Contact Person)
Securities registered or to be registered pursuant to Section 12(b) of the Act:
|
Title of Each Class
|
|
Name of Each Exchange on Which Registered
|
|
Common Shares
|
|
NASDAQ Capital Market
Toronto Stock Exchange
|
Securities registered or to be registered pursuant to Section 12(g) of the Act:
NONE
Securities for which there is a reporting obligation pursuant to Section 15(d) of the ACT:
NONE
Indicate the number of outstanding shares of each of the issuer's classes of capital or common stock as at the close of the period covered by the annual report:
16,440,760
Common Shares as at
December 31, 2017
.
Indicate by check mark whether the registrant is a well-known seasoned issuer, as defined in Rule 405 of the Securities Act. Yes
¨
No
ý
If this report is an annual or transition report, indicate by check mark if the registrant is not required to file reports pursuant to Section 13 or 15(d) of the Securities Exchange Act of 1934. Yes
¨
No
ý
Indicate by check mark whether the registrant (1) has filed all reports required to be filed by Section 13 or 15(d) of the Securities Exchange Act of 1934 during the preceding 12 months (or for such shorter period that the registrant was required to file such reports), and (2) has been subject to such filing requirements for the past 90 days. Yes
ý
No
¨
Indicate by check mark whether the registrant has submitted electronically and posted on its corporate Web site, if any, every Interactive Data File required to be submitted and posted pursuant to Rule 405 of Regulation S-T (§232.405 of this chapter) during the preceding 12 months (or for such shorter period that the registrant was required to submit and post such files). Yes
ý
No
¨
Indicate by check mark whether the registrant is a large accelerated filer, an accelerated filer, a non-accelerated filer, or an emerging growth company. See definitions of "accelerated filer," "large accelerated filer," and "emerging growth company" in Rule 12b-2 of the Exchange Act. (Check one):
Large accelerated filer
¨
Accelerated filer
¨
Non-accelerated filer
ý
Emerging growth company
¨
If an emerging growth company that prepares its financial statements in accordance with U.S. GAAP, indicate by check mark if the registrant has elected not to use the extended transition period for complying with any new or revised financial accounting standards† provided pursuant to Section 13(a) of the Exchange Act.
† The term "new or revised financial accounting standard" refers to any update issued by the Financial Accounting Standards Board to its Accounting Standards Codification after April 5, 2012
Indicate by check mark which basis of accounting the registrant has used to prepare the financial statements included in this filing:
US GAAP
¨
International Financial Reporting Standards as issued by the Other
¨
International Accounting Standards Board
ý
If "other" has been checked in response to the previous question, indicate by check mark which financial statement item the registrant has elected to follow. Item 17
¨
Item 18
¨
If this is an annual report, indicate by check mark whether the registrant is a shell company (as defined in Rule 12b-2 of the Exchange Act). Yes
¨
No
ý
Basis of Presentation
General
Except where the context otherwise requires, all references in this Annual Report on Form 20-F to the "Company", "Aeterna Zentaris", "we", "us", "our" or similar words or phrases are to Aeterna Zentaris Inc. and its subsidiaries, taken together. In this Annual Report on Form 20-F, references to "$" and "U.S.$" are to United States ("U.S.") dollars, references to "CAN$" are to Canadian dollars and references to "EUR" are to euros. Unless otherwise indicated, the statistical and financial data contained in this Annual Report on Form 20-F are presented as at
December 31, 2017
.
All share, option and share purchase warrant as well as per share, option and share purchase warrant information presented in this Annual Report on Form 20-F have been adjusted, including proportionate adjustments being made to each option and share purchase warrant exercise price, to reflect and to give effect to a share consolidation (or reverse stock split), on November 17, 2015, of our issued and outstanding common shares on a 100-to-1 basis (the "Share Consolidation"). The Share Consolidation affected all shareholders, optionholders and warrantholders uniformly and thus did not materially affect any securityholder's percentage of ownership interest.
This Annual Report on Form 20-F also contains certain information regarding products or product candidates that may potentially compete with our products and product candidates, and such information has been primarily derived from information made publicly available by the companies developing such potentially competing products and product candidates and has not been independently verified by Aeterna Zentaris Inc.
Forward-Looking Statements
This Annual Report on Form 20-F contains forward-looking statements made pursuant to the safe-harbor provision of the U.S. Securities Litigation Reform Act of 1995, which reflect our current expectations regarding future events. Forward-looking statements may include, but are not limited to statements preceded by, followed by, or that include the words "will," "expects," "believes," "intends," "would," "could," "may," "anticipates," and similar terms that relate to future events, performance, or our results. Forward-looking statements involve known risks and uncertainties, including those discussed in this Annual Report on Form 20-F, under the caption "Key Information - Risk Factors" filed with the relevant Canadian securities regulatory authorities in lieu of an annual information form and with the U.S. Securities and Exchange Commission ("SEC"). Known and unknown risks and uncertainties could cause our actual results to differ materially from those in forward-looking statements. Such risks and uncertainties include, among others, our now heavy dependence on the success of Macrilen™ (macimorelin) and related out-licensing arrangements and the continued availability of funds and resources to successfully launch the product, the ability of Aeterna Zentaris to enter into out-licensing, development, manufacturing and marketing and distribution agreements with other pharmaceutical companies and keep such agreements in effect, reliance on third parties for the manufacturing and commercialization of our product candidates, potential disputes with third parties, leading to delays in or termination of the manufacturing, development, out-licensing or commercialization of our product candidates, or resulting in significant litigation or arbitration, and, more generally, uncertainties related to the regulatory process, the ability of the Company to efficiently commercialize or out-license Macrilen™ (macimorelin), the degree of market acceptance of Macrilen™ (macimorelin), our ability to obtain necessary approvals from the relevant regulatory authorities to enable us to use the desired brand names for our products, the impact of securities class action litigation, the litigation involving two of our former officers, or other litigation, on our cash flow, results of operations and financial position; any evaluation of potential strategic alternatives to maximize potential future growth and stakeholder value may not result in any such alternative being pursued, and even if pursued, may not result in the anticipated benefits, our ability to take advantage of business opportunities in the pharmaceutical industry, our ability to protect our intellectual property, the potential of liability arising from shareholder lawsuits and general changes in economic conditions. Investors should consult the Company's quarterly and annual filings with the Canadian and U.S. securities commissions for additional information on risks and uncertainties. Given these uncertainties and risk factors, readers are cautioned not to place undue reliance on these forward-looking statements. We disclaim any obligation to update any such factors or to publicly announce any revisions to any of the forward-looking statements contained herein to reflect future results, events or developments, unless required to do so by a governmental authority or applicable law.
TABLE OF CONTENTS
GENERAL INFORMATION
|
Page
|
||
|
Item 1.
|
||
|
Item 2.
|
||
|
Item 3.
|
||
|
Item 4.
|
||
|
Item 4A.
|
||
|
Item 5.
|
||
|
Item 6.
|
||
|
Item 7.
|
||
|
Item 8.
|
||
|
Item 9.
|
||
|
Item 10.
|
||
|
Item 11.
|
||
|
Item 12.
|
||
|
Item 13.
|
||
|
Item 14.
|
||
|
Item 15.
|
||
|
Item 16A.
|
||
|
Item 16B.
|
||
|
Item 16C.
|
||
|
Item 16D.
|
||
|
Item 16E.
|
||
|
Item 16F.
|
||
|
Item 16G.
|
||
|
Item 16H.
|
||
|
Item 17.
|
||
|
Item 18.
|
||
|
Item 19.
|
||
|
Item 1.
|
Identity of Directors, Senior Management and Advisers
|
|
A.
|
Directors and senior management
|
Not applicable.
|
B.
|
Advisers
|
Not applicable.
|
C.
|
Auditors
|
Not applicable.
|
Item 2.
|
Offer Statistics and Expected Timetable
|
|
A.
|
Offer statistics
|
Not applicable.
|
B.
|
Method and expected timetable
|
Not applicable.
|
Item 3.
|
Key Information
|
|
A.
|
Selected financial data
|
The consolidated statement of comprehensive (loss) income information set forth in this Item 3.A. with respect to the years ended
December 31, 2017
,
2016
and
2015
and the consolidated statement of financial position information as at
December 31, 2017
and
2016
have been derived from the audited consolidated financial statements set forth in Item 18, which have been prepared in accordance with International Financial Reporting Standards ("IFRS"), as issued by the International Accounting Standards Board ("IASB"). The consolidated statement of comprehensive (loss) income information with respect to the years ended December 31,
2014
and
2013
and the consolidated statement of financial position information as at December 31,
2015
,
2014
and
2013
set forth in this Item 3.A. have been derived from our previous consolidated financial statements not included herein, and have also been prepared in accordance with IFRS, as issued by the IASB. The selected financial data should be read in conjunction with our audited consolidated financial statements and the related notes included elsewhere in this Annual Report on Form 20-F, as well as "Item 5.
–
Operating and Financial Review and Prospects" of this Annual Report on Form 20-F.
The Company has not declared or paid any dividends per share during the periods covered by the selected financial data.
1
(in thousands of U.S. dollars, except share and per share data)
Derived from consolidated financial statements prepared in accordance with IFRS, as issued by the IASB
|
December 31,
|
||||||||||||||
|
2017
|
2016
|
2015
|
2014
|
2013
|
||||||||||
|
$
|
$
|
$
|
$
|
$
|
||||||||||
|
Revenues
|
||||||||||||||
|
Sales commission and other
|
465
|
|
414
|
|
297
|
|
—
|
|
96
|
|
||||
|
License fees
|
458
|
|
497
|
|
248
|
|
11
|
|
6,079
|
|
||||
|
923
|
|
911
|
|
545
|
|
11
|
|
6,175
|
|
|||||
|
Operating expenses
|
||||||||||||||
|
Cost of Sales
|
—
|
|
—
|
|
—
|
|
—
|
|
51
|
|
||||
|
Research and development costs
|
10,704
|
|
16,495
|
|
17,234
|
|
23,716
|
|
21,284
|
|
||||
|
General and administrative expenses
|
8,198
|
|
7,147
|
|
11,308
|
|
9,840
|
|
11,091
|
|
||||
|
Selling expenses
|
5,095
|
|
6,745
|
|
6,887
|
|
3,850
|
|
1,225
|
|
||||
|
|
23,997
|
|
30,387
|
|
35,429
|
|
37,406
|
|
33,651
|
|
||||
|
Loss from operations
|
(23,074
|
)
|
(29,476
|
)
|
(34,884
|
)
|
(37,395
|
)
|
(27,476
|
)
|
||||
|
Gain (loss) due to changes in foreign currency exchange rates
|
502
|
|
(70
|
)
|
(1,767
|
)
|
1,879
|
|
(1,512
|
)
|
||||
|
Change in fair value of warrant liability
|
2,222
|
|
4,437
|
|
(10,956
|
)
|
18,272
|
|
1,563
|
|
||||
|
Warrant exercise inducement fee
|
—
|
|
—
|
|
(2,926
|
)
|
—
|
|
—
|
|
||||
|
Other finance income
|
75
|
|
150
|
|
305
|
|
168
|
|
185
|
|
||||
|
Net finance income (costs)
|
2,799
|
|
4,517
|
|
(15,344
|
)
|
20,319
|
|
236
|
|
||||
|
Loss before income taxes
|
(20,275
|
)
|
(24,959
|
)
|
(50,228
|
)
|
(17,076
|
)
|
(27,240
|
)
|
||||
|
Income tax recovery
|
3,479
|
|
—
|
|
—
|
|
(111
|
)
|
—
|
|
||||
|
Net loss from continuing operations
|
(16,796
|
)
|
(24,959
|
)
|
(50,228
|
)
|
(17,187
|
)
|
(27,240
|
)
|
||||
|
Net income from discontinued operations
|
—
|
|
—
|
|
85
|
|
623
|
|
34,055
|
|
||||
|
Net (loss) income
|
(16,796
|
)
|
(24,959
|
)
|
(50,143
|
)
|
(16,564
|
)
|
6,815
|
|
||||
|
Other comprehensive (loss) income:
|
||||||||||||||
|
Items that may be reclassified subsequently to profit or loss:
|
||||||||||||||
|
Foreign currency translation adjustments
|
(1,430
|
)
|
569
|
|
1,509
|
|
(1,158
|
)
|
1,073
|
|
||||
|
Items that will not be reclassified to profit or loss:
|
||||||||||||||
|
Actuarial gain (loss) on defined benefit plans
|
694
|
|
(1,479
|
)
|
844
|
|
(1,833
|
)
|
2,346
|
|
||||
|
Comprehensive (loss) income
|
(17,532
|
)
|
(25,869
|
)
|
(47,790
|
)
|
(19,555
|
)
|
10,234
|
|
||||
|
Net loss per share (basic diluted) from continuing operations
1
|
(1.12
|
)
|
(2.41
|
)
|
(18.17
|
)
|
(29.12
|
)
|
(92.41
|
)
|
||||
|
Net income per share (basic and diluted) from discontinued operations
1
|
—
|
|
—
|
|
0.03
|
|
1.06
|
|
115.52
|
|
||||
|
Net (loss) income per share (basic and diluted)
1
|
(1.12
|
)
|
(2.41
|
)
|
(18.14
|
)
|
(28.06
|
)
|
23.11
|
|
||||
|
Weighted average number of shares outstanding:
1
|
||||||||||||||
|
Basic and diluted
|
14,958,704
|
|
10,348,879
|
|
2,763,603
|
|
590,247
|
|
294,765
|
|
||||
|
1
|
Adjusted to reflect the November 17, 2015 100-to-1 Share Consolidation
|
2
(in thousands of U.S. dollars)
Derived from consolidated financial statements prepared in accordance with IFRS, as issued by the IASB
|
|
As at December 31,
|
||||||||||||||
|
2017
|
2016
|
2015
|
2014
|
2013
|
|||||||||||
|
$
|
$
|
$
|
$
|
$
|
|||||||||||
|
Cash and cash equivalents
|
7,780
|
|
21,999
|
|
41,450
|
|
34,931
|
|
43,202
|
|
|||||
|
Restricted cash equivalents
|
381
|
|
496
|
|
255
|
|
760
|
|
865
|
|
|||||
|
Total assets
|
22,195
|
|
31,659
|
|
51,498
|
|
47,435
|
|
59,196
|
|
|||||
|
Warrant liability (current and non-current portion)
|
3,897
|
|
6,854
|
|
10,891
|
|
8,225
|
|
18,010
|
|
|||||
|
Share capital
|
222,335
|
|
213,980
|
|
204,596
|
|
150,544
|
|
134,101
|
|
|||||
|
Shareholders' (deficiency) equity
|
(2,783
|
)
|
6,212
|
|
21,615
|
|
14,484
|
|
17,064
|
|
|||||
|
B.
|
|
Not applicable.
|
C.
|
Reasons for the offer and use of proceeds
|
Not applicable.
|
D.
|
Risk factors
|
An investment in our securities involves a high degree of risk. You should carefully consider the risks described below, together with all of the other information included in this Annual Report, before making an investment decision. If any of the following risks actually occurs, our business, prospects, financial condition or results of operations could suffer. In that case, the trading price, if any, of our securities could decline, and you may lose all or part of your investment.
Risks Relating to Us and Our Business
Investments in biopharmaceutical companies are generally considered to be speculative.
The prospects for companies operating in the biopharmaceutical industry are uncertain, given the very nature of the industry, and, accordingly, investments in biopharmaceutical companies should be considered to be speculative assets.
We have a history of operating losses and we may never achieve or maintain operating profitability. In addition, if we are unsuccessful in generating new revenue, increasing our revenue and/or raising additional funding, we may not be able to continue as a going concern.
We have incurred, and expect to continue to incur, substantial expenses in our efforts to develop and market products. Consequently, we have incurred operating losses historically and in each of the last several years. As at
December 31, 2017
, we had an accumulated deficit of approximately
$314 million
. Our operating losses have adversely impacted, and will continue to adversely impact, our working capital, total assets, operating cash flow and shareholders' equity. We do not expect to reach operating profitability in the immediate future, and our operating expenses are likely to continue to represent a significant component of our overall cost profile as we focus on the development and commercialization of Macrilen™ (macimorelin), including out-licensing arrangements, pursuing in-licensing opportunities or acquiring marketed products. In developing, acquiring, out-licensing or in-licensing Macrilen™ (macimorelin) or other commercial products, we could incur additional operating losses for at least the next several years. If we do not ultimately generate sufficient revenue from a commercialized product and achieve or maintain operating profitability, an investment in our Common Shares or other securities could result in a significant or total loss.
Our ability to continue as a going concern is dependent on the successful execution of our business plan, which will require an increase in revenue and/or additional funding to be provided by potential investors and/or non-traditional sources of financing. Although we did not have, as at
December 31, 2017
, sufficient liquidity and financial resources to fund planned expenditures and
3
other working capital needs, because of the $24 million upfront payment received on January 17, 2018 for the licensing of Macrilen™ (macimorelin) in the United States and Canada, as of the issuance of this Annual Report on Form 20-F we expect to have sufficient resources for the next 12 months.
Additional funding may be in the form of debt or equity or a hybrid instrument depending on our needs, the demands of investors and market conditions. Depending on the prevailing global economic and credit market conditions, we may not be able to raise additional cash through these traditional sources of financing. Although we may also pursue non-traditional sources of financing with third parties, the global equity and credit markets may adversely affect the ability of potential third parties to pursue such transactions with us. Accordingly, as a result of the foregoing, we continue to review traditional sources of financing, such as private and public debt or various equity financing alternatives, as well as other alternatives to enhance shareholder value, including, but not limited to, non-traditional sources of financing, such as strategic alliances with third parties, the sale of assets or licensing of our technology or intellectual property, a combination of operating and related initiatives or a substantial reorganization of our business.
There can be no assurance that we will achieve profitability or positive cash flows or be able to obtain additional funding or that, if obtained, the additional funding will be sufficient, or whether any other initiatives will be successful such that we may continue as a going concern. There could also be material uncertainties related to certain adverse conditions and events that could impact our ability to remain a going concern. If the going concern assumptions were deemed no longer appropriate for our consolidated financial statements, adjustments to the carrying value of assets and liabilities, reported expenses and consolidated statement of financial position classifications would be necessary. Such adjustments could be material.
Our revenues and expenses may fluctuate significantly, and any failure to meet financial expectations may disappoint securities analysts or investors and result in a decline in the price or the value of our Common Shares or other securities.
We have a history of operating losses. Our revenues and expenses have fluctuated in the past and may continue to do so in the future. These fluctuations could cause our share price or the value of our other securities to decline. Some of the factors that could cause our revenues and expenses to fluctuate include but are not limited to:
|
•
|
the inability to complete product development in a timely manner that results in a failure or delay in receiving the required regulatory approvals to commercialize a product;
|
|
•
|
not obtaining necessary regulatory approvals from the U.S. Food and Drug Administration ("FDA"), European Medicines Agency ("EMA") and other agencies that may delay or prevent us from bringing a product to market, which may affect the price of our securities;
|
|
•
|
the timing of regulatory submissions and approvals;
|
|
•
|
the timing and willingness of any current or future collaborators to invest the resources necessary to commercialize Macrilen™ (macimorelin) or other products;
|
|
•
|
the nature and timing of licensing fee revenues;
|
|
•
|
the outcome of litigation, including the securities class action litigation pending against us that is described elsewhere in this Annual Report on Form 20-F;
|
|
•
|
foreign currency fluctuations;
|
|
•
|
the timing of the achievement and the receipt of milestone payments from current or future collaborators; and
|
|
•
|
failure to enter into new or the expiration or termination of current agreements with collaborators.
|
Due to fluctuations in our revenues and expenses, we believe that period-to-period comparisons of our results of operations are not necessarily indicative of our future performance. It is possible that in some future periods, our revenues and expenses will be above or below the expectations of securities analysts or investors. In this case, the price of our Common Shares and/or the value of our other securities could fluctuate significantly or decline.
If we decide to pursue new clinical trial programs for new products in the future and are unable to successfully complete those clinical trial programs, or if such clinical trials take longer to complete than we project, our ability to execute any related business strategy will be adversely affected.
We are currently not conducting any clinical trials but we may decide to do so in the future. If we experience delays in identifying and contracting with sites and/or in-patient enrollment in our future clinical trial programs, we may incur additional costs and delays in our development programs, and may not be able to complete our clinical trials on a cost-effective or timely basis. In
4
addition, conducting multi-national studies adds another level of complexity and risk as we are subject to events affecting countries other than the United States and Canada. Moreover, negative or inconclusive results from the clinical trials we conduct or adverse medical events could cause us to have to repeat or terminate the clinical trials. Accordingly, we may not be able to complete the clinical trials within an acceptable time-frame, if at all. If we or our contract resource organization (a "CRO") have difficulty enrolling a sufficient number of patients to conduct our clinical trials as planned, we may need to delay or terminate ongoing clinical trials.
Clinical trials are subject to continuing oversight by governmental regulatory authorities and institutional review boards and must, among other requirements:
|
•
|
meet the requirements of these authorities from multiple countries and jurisdictions and their related statutes, regulations, and guidances;
|
|
•
|
meet the requirements for informed consent;
|
|
•
|
meet the requirements for institutional review boards; and
|
|
•
|
meet the requirements for good clinical practices
|
If we are unable to commercialize or out-license Macrilen™ (macimorelin), or if we experience significant delays in doing so, our business would be materially harmed and the future and viability of our Company could be imperiled.
Our principal focus is on the licensing and development of Macrilen™ (macimorelin). The commercial success of Macrilen™ (macimorelin) will depend on several factors, including the following:
|
•
|
receipt of approvals from the EMA, and similar foreign regulatory authorities;
|
|
•
|
successfully contracting with qualified third party manufacturers to manufacture Macrilen™ (macimorelin);
|
|
•
|
developing appropriate distribution and marketing infrastructure and arrangements for our product;
|
|
•
|
launching and growing commercial sales of the product;
|
|
•
|
out-licensing Macrilen™ (macimorelin) to third parties; and
|
|
•
|
acceptance of the product in the medical community, among patients and with third party payers.
|
If we are unable to successfully achieve any of these factors, our business, financial condition and results of operations may be materially adversely affected.
We are currently dependent on certain strategic relationships with third parties for the development, manufacturing and licensing of Macrilen™ (macimorelin) and we may enter into future collaborations for the development, manufacturing and licensing of Macrilen™ (macimorelin) or future products
.
We are currently dependent on certain strategic relationships with third parties for the development, manufacturing and licensing of Macrilen™ (macimorelin) and may enter into future collaborations for the development and licensing of Macrilen™ (macimorelin) or future products. Our arrangements with these third parties may not provide us with the benefits we expect and may expose us to a number of risks.
We are dependent on, and rely upon, third parties to perform various functions related to our business, including, but not limited to, development, manufacturing and licensing of Macrilen™ (macimorelin). Our reliance on these relationships poses a number of risks. We may not realize the contemplated benefits of such agreements nor can we be certain that any of these parties will fulfill their obligations in a manner which maximizes our revenue. These arrangements may also require us to transfer certain material rights to third parties. These agreements create certain additional risks. The occurrence of any of the following or other events may delay or impair commercialization of our products:
|
•
|
not all of the third parties are contractually prohibited from developing or commercializing, either alone or with others, products that are similar to or competitive with our product candidates and, with respect to our contracts that do contain such contractual prohibitions or restrictions, prohibitions or restrictions do not always apply to the affiliates of the third parties and they may elect to pursue the development of any additional product candidates and pursue technologies or products either on their own or in collaboration with other parties, including our competitors, whose technologies or products may be competitive with ours; the third parties may under-fund or fail to commit sufficient resources to marketing, distribution or other development of our products;
|
5
|
•
|
the third parties may cease to conduct business for financial or other reasons;
|
|
•
|
we may not be able to renew such agreements;
|
|
•
|
the third parties may not properly maintain or defend certain intellectual property rights that may be important to the commercialization of our products;
|
|
•
|
the third parties may encounter conflicts of interest, changes in business strategy or other issues which could adversely affect their willingness or ability to fulfill their obligations to us (for example, pharmaceutical companies historically have re-evaluated their priorities following mergers and consolidations, which have been common in recent years in this industry);
|
|
•
|
delays in, or failures to achieve, scale-up to commercial quantities, or changes to current raw material suppliers or product manufacturers (whether the change is attributable to us or the supplier or manufacturer) could delay clinical studies, regulatory submissions and commercialization of our products; and
|
|
•
|
disputes may arise between us and the third parties that could result in the delay or termination of the development, manufacturing or commercialization of our product candidates, resulting in litigation or arbitration that could be time-consuming and expensive, or causing the third parties to act in their own self-interest and not in our interest or those of our shareholders or other stakeholders.
|
In addition, the third parties can terminate our agreements with them for a number of reasons based on the terms of the individual agreements that we have entered into with them. If one or more of these agreements were to be terminated, we would be required to devote additional resources to developing, manufacturing and commercializing our products, seek a new third party with which to contract or abandon the product candidate, which would likely cause a drop in the price of our Common Shares and/or a decline in the value of our other securities.
We have incurred, and expect to continue to incur, substantial expenses, and we have made, and expect to continue to make, substantial financial commitments to establish a commercial operation. There can be no assurance how quickly, if ever, we will realize a profit from our commercial operation.
Our business strategy is to become a specialty biopharmaceutical company with commercial operations to market and sell products that we may either develop internally, acquire or in‑license. Currently, we are focused on the commercialization of Macrilen™ (macimorelin), including out-licensing arrangements and pursuing in-licensing opportunities. We have to date incurred, and expect to continue to incur, substantial expenses (including restructuring costs associated with the 2017 German Restructuring described in Item 5), and we have made, and expect to continue to make, substantial financial commitments to build and maintain commercial operations. Establishing a commercial operation is expensive and time-consuming, and there can be no assurance how quickly, if ever, we will realize a profit from our commercial operations. Factors that may inhibit our efforts to realize a profit from our commercial operations include:
|
•
|
our ability to develop appropriate distribution and marketing infrastructure and arrangements for our product;
|
|
•
|
the lack of complementary products, which may put us at a competitive disadvantage relative to companies with more extensive product lines;
|
|
•
|
enforcement action by the FDA, EMA or other regulatory authorities, or lawsuit by a competitor, resulting from the Company or any of its vendors, licenses, agents, or sales representatives marketing a product off-label;
|
|
•
|
compliance issues with healthcare fraud and abuse laws and regulations from multiple countries and jurisdictions; and
|
|
•
|
unforeseen costs and expenses associated with creating an independent sales and marketing organization.
|
Our financial viability depends, in part, on our ability to acquire, in-license or otherwise obtain the right to sell other products. If we are unable to do so, our business, financial condition and results of operations may be materially adversely affected.
In connection with our strategy to further transform the Company into a commercially operating specialty biopharmaceutical organization, we through Aeterna Zentaris GmbH ("AEZS Germany"), entered into a license and assignment agreement on January 16, 2018, with Strongbridge Ireland Limited ("Strongbridge") to carry out development, manufacturing, registration and commercialization of Macrilen™ (macimorelin) in the United States and Canada (the "Strongbridge License Agreement").
We may enter into additional commercial agreements with third parties, in efforts to establish and expand our commercial revenue base. These business activities entail numerous operational and financial risks, including:
6
|
•
|
the difficulty or inability to secure financing to acquire or in-license products;
|
|
•
|
the incurrence of substantial debt or dilutive issuances of securities to pay for the acquisition or in-licensing of new products;
|
|
•
|
the disruption of our business and diversion of our management's time and attention;
|
|
•
|
higher than expected development, acquisition or in-license and integration costs;
|
|
•
|
exposure to unknown liabilities; and
|
|
•
|
the difficulty in locating products that are in our targeted therapeutic areas and that are compatible with other products in our portfolio.
|
We can provide no assurance that we will be able to identify potential product candidates or strategic commercial partners or, if we identify such product candidates or partners, that any related commercial arrangements will be consummated on terms that are favorable to us. We cannot provide any assurance that the Strongbridge License Agreement will be successful, nor can we provide assurance that any future strategic commercial arrangements, or initiatives or activities resulting therefrom, will be successful. To the extent that any related investments in such arrangements, including the Strongbridge License Agreement, do not yield the expected benefits, our business, financial condition and results of operations may be materially adversely affected.
We have limited resources to identify and execute the procurement of additional products and to integrate them into our commercial operations. The failure to successfully integrate the personnel and operations of businesses that we may acquire or of products that we may in-license in the future with our existing operations, business and products could have a material adverse effect on our operations and results. We compete with larger pharmaceutical companies and other competitors in our efforts to acquire, in-license, and/or obtain the right to market and/or detail new products. Our competitors likely will have access to greater financial resources than us and may have greater expertise in identifying and evaluating new opportunities. Moreover, we may devote resources to potential, in-licensing opportunities that are never completed, or we may fail to realize the anticipated benefits of such efforts.
We may require significant additional financing, and we may not have access to sufficient capital.
We may require significant additional capital to fund our commercial operations and may require additional capital to pursue planned clinical trials and regulatory approvals, as well as further R&D and marketing efforts for our product candidates and potential products. Although we have capital from the Strongbridge License Agreement, we do not anticipate generating significant revenues from operations in the near future other than from the Strongbridge License Agreement, and we currently have no committed sources of capital.
We may attempt to raise additional funds through public or private financings, collaborations with other pharmaceutical companies or from other sources, including, without limitation, through at-the-market offerings and issuances of Common Shares. Additional funding may not be available on terms that are acceptable to us. If adequate funding is not available to us on reasonable terms, we may need to delay, reduce or eliminate one or more of our product development programs or obtain funds on terms less favorable than we would otherwise accept. To the extent that additional capital is raised through the sale of equity securities or securities convertible into or exchangeable or exercisable for equity securities, the issuance of those securities would result in dilution to our shareholders. Moreover, the incurrence of debt financing or the issuance of dividend-paying preferred shares, could result in a substantial portion of our future operating cash flow, if any, being dedicated to the payment of principal and interest on such indebtedness or the payment of dividends on such preferred shares and could impose restrictions on our operations and on our ability to make certain expenditures and/or to incur additional indebtedness, which could render us more vulnerable to competitive pressures and economic downturns.
Our future capital requirements are substantial and may increase beyond our current expectations depending on many factors, including:
|
•
|
the duration of changes to and results of our clinical trials for any future products going forward;
|
|
•
|
unexpected delays or developments in seeking regulatory approvals;
|
|
•
|
the time and cost involved in preparing, filing, prosecuting, maintaining and enforcing patent claims;
|
|
•
|
unexpected developments encountered in implementing our business development and commercialization strategies;
|
|
•
|
the potential addition of commercialized products to our portfolio;
|
7
|
•
|
the outcome of litigation, including the securities class action litigation pending against us that is described elsewhere in this Annual Report on Form 20-F; and
|
|
•
|
further arrangements, if any, with collaborators.
|
In addition, global economic and market conditions as well as future developments in the credit and capital markets may make it even more difficult for us to raise additional financing in the future.
We are and will be subject to stringent ongoing government regulation for our products and our product candidates, even if we obtain regulatory approvals for the latter.
The manufacture, marketing and sale of Macrilen™ (macimorelin) and future products are and will be subject to strict and ongoing regulation, even with marketing approval by the FDA for Macrilen™ (macimorelin), and even if the EMA and other regulatory authorities approve our future products. Compliance with such regulation will be expensive and consume substantial financial and management resources. For example, an approval for a product may be conditioned on our agreement to conduct costly post-marketing follow-up studies to monitor the safety or efficacy of the products. In addition, as clinical experience with a drug expands after approval because the drug is used by a greater number and more diverse group of patients than during clinical trials, side effects or other problems may be observed after approval that were not observed or anticipated during pre-approval clinical trials. In such a case, a regulatory authority could restrict the indications for which the product may be sold or revoke the product's regulatory approval. Even though the New Drug Application ("NDA") regarding Macrilen™ (macimorelin) is approved by the FDA, the FDA may still require post-market clinical studies and there is a risk that the results of the studies may not meet FDA's requirements.
We and our contract manufacturers will be required to comply with applicable Current Good Manufacturing Practice regulations for the manufacture of our current or future products and other regulations. These regulations include requirements relating to quality assurance, as well as the corresponding maintenance of rigorous records and documentation. Manufacturing facilities must be approved before we can use them in the commercial manufacturing of a product and are subject to subsequent periodic inspection by regulatory authorities. In addition, material changes in the methods of manufacturing or changes in the suppliers of raw materials are subject to further regulatory review and approval.
If we, or if any future marketing collaborators or contract manufacturers, fail to comply with applicable regulatory requirements, we may be subject to sanctions including fines, product recalls or seizures and related publicity requirements, injunctions, total or partial suspension of production, civil penalties, suspension or withdrawals of previously granted regulatory approvals, warning or untitled letters, refusal to approve pending applications for marketing approval of new products or of supplements to approved applications, complete withdrawal of a marketing application, exclusion from government healthcare programs, import or export bans or restrictions, and/or criminal prosecution and penalties. Any of these penalties could delay or prevent the promotion, marketing or sale of a product.
During the drug development process, regulatory agencies will typically ask questions of drug sponsors. While we endeavor to answer all such questions in a timely fashion, some questions may not be answered in time to prevent the delay of acceptance of an NDA or the rejection of an NDA. Additionally, if the Company plans to market products in other countries, the Company may fail to obtain necessary regulatory approvals in those countries. We are not opining on the success of the Company's products in the United States or in any other countries.
Even with marketing approval for Macrilen™ (macimorelin),
such product approval could be subject to restrictions or withdrawals. Regulatory requirements are subject to change.
On December 20, 2017, the FDA granted marketing approval for Macrilen™ (macimorelin) to be used in the diagnosis of patients with adult growth hormone deficiency ("AGHD"). Regulatory authorities generally approve products for specified indications. If an approval is for a limited indication, this limitation reduces the size of the potential market for that product. Product approvals, once granted, are subject to continual review and periodic inspections by regulatory authorities. Our operations and practices are subject to regulation and scrutiny by the U.S. government, as well as governments of any other countries in which we do business or conduct activities. Later discovery of previously unknown problems or safety issues and/or failure to comply with domestic or foreign laws, knowingly or unknowingly, can result in various adverse consequences, including, among other things, a possible delay in the approval or refusal to approve a product, warning or untitled letters, fines, injunctions, civil penalties, recalls or seizures of products and related publicity requirements, total or partial suspension of production, import or export bans or restrictions, refusal of the government to renew marketing applications, complete withdrawal of a marketing application, criminal prosecution and penalties, suspension or withdrawals of previously granted regulatory approvals, withdrawal of an approved product from the market and/or exclusion from government healthcare programs. Such regulatory enforcement could have a direct and negative impact on the product for which approval is granted, but also could have a negative impact on the approval of any pending applications for marketing approval of new drugs or supplements to approved applications.
8
Because we operate in a highly regulated industry, regulatory authorities could take enforcement action against us in connection with our or our licensees' or collaborators', business and marketing activities for various reasons.
From time to time, new legislation is passed into law that could significantly change the statutory provisions governing the approval, manufacturing, and marketing of products regulated by the FDA, EMA and other health authorities. Additionally, regulations and guidance are often revised or reinterpreted by health agencies in ways that may significantly affect our business Macrilen™ (macimorelin) and our future products. It is impossible to predict whether further legislative changes will be enacted, or whether regulations, guidance, or interpretations will change, and what the impact of such changes, if any, may be.
Healthcare reform measures could hinder or prevent the commercial success of a product and adversely affect our business.
The business prospects and financial condition of pharmaceutical and biotechnology companies are affected by the efforts of governmental and third-party payers to contain or reduce the costs of healthcare. The U.S. government and other governments have shown significant interest in pursuing healthcare reform and reducing healthcare costs. Any government-adopted reform measures could cause significant pressure on the pricing of healthcare products and services, including Macrilen™ (macimorelin) and future products, both in the United States and internationally, as well as the amount of reimbursement available from governmental agencies and other third-party payers. If reimbursement for Macrilen™ (macimorelin) or future products is substantially less than we expect, our revenue prospects could be materially and adversely impacted.
In the United States and in other jurisdictions there have been, and we expect that there will continue to be, a number of legislative and regulatory proposals aimed at changing the healthcare system, such as proposals relating to the pricing of healthcare products and services in the United States or internationally, the reimportation of drugs into the U.S. from other countries (where they are then sold at a lower price), and the amount of reimbursement available from governmental agencies or other third party payers. Furthermore, the pricing of pharmaceutical products, in general, and specialty drugs, in particular, has been a topic of concern in the U.S. Congress, where hearings on the topic have been held, and has been a topic of speeches given by political figures, including President Donald Trump. Additionally, in the United States, states have also passed legislation and proposed bills that are aimed at drug pricing transparency, which will likely impact drug pricing. There can be no assurance as to how this scrutiny on pricing of pharmaceutical products will impact future pricing of Macrilen™ (macimorelin), our future products, or orphan drugs or pharmaceutical products generally.
The
Patient Protection and Affordable Care Act and the Healthcare and Education Affordability Reconciliation Act of 2010
(collectively, the "ACA") has had far-reaching consequences for most healthcare companies, including specialty biopharmaceutical companies like us. The future of the ACA is, however, uncertain. Since January 2017, the U.S. Congress has proposed various bills to revise the ACA. Additionally, President Donald Trump has suggested similar action and enacted Executive Orders to curtail the ACA and its impacts on healthcare in the United States. We cannot predict the ultimate content, timing or effect of any healthcare reform legislation or the impact of potential legislation, regulation, and orders or their impact on us.
In addition, the
Food and Drug Administration Amendments Act of 2007
gives the FDA enhanced post-market authority, including the authority to require post-marketing studies and clinical trials, labeling changes based on new safety information, and compliance with risk evaluations and mitigation strategies approved by the FDA. The FDA's exercise of this authority may result in delays or increased costs during the period of product development, clinical trials and regulatory review and approval, which may also increase costs related to complying with new post-approval regulatory requirements, and increase potential FDA restrictions on the sale or distribution of approved products.
If we market products or interact with health care practitioners in a manner that violates healthcare fraud and abuse laws, we may be subject to civil or criminal penalties, including exclusion from participation in government healthcare programs.
As a pharmaceutical company, even though we do not provide healthcare services or receive payments directly from or bill directly to Medicare, Medicaid or other third-party payers for our current or future products, certain federal and state healthcare laws and regulations pertaining to fraud and abuse are and will be applicable to our business. We are subject to healthcare fraud and abuse regulation by both the federal government and the states in which we conduct our business.
The laws that may affect our ability to operate include the federal healthcare program anti-kickback statute, which prohibits, among other things, knowingly and willfully offering, paying, soliciting, or receiving remuneration to induce, or in return for, the purchase, lease, order, or arrangement for the purchase, lease or order of any healthcare item or service reimbursable under Medicare, Medicaid or other federally financed healthcare programs. This statute applies to arrangements between pharmaceutical manufacturers and prescribers, purchasers and formulary managers. Although there are a number of statutory exceptions and regulatory safe harbors protecting certain common activities, the exceptions and safe harbors are drawn narrowly, and practices that involve remuneration intended to induce prescribing, purchases or recommendations may be subject to scrutiny if they do not qualify for an exception or safe harbor.
9
Federal false claims laws prohibit any person from knowingly presenting, or causing to be presented, a false claim for payment to the federal government, or knowingly making, or causing to be made, a false statement to get a false claim paid. Pharmaceutical companies have been prosecuted under these laws for a variety of alleged promotional and marketing activities, such as providing free product to customers with the expectation that the customers would bill federal programs for the product; reporting to pricing services inflated average wholesale prices that were then used by federal programs to set reimbursement rates; engaging in off-label promotion that caused claims to be submitted to Medicaid for non-covered off-label uses; and submitting inflated best price information to the Medicaid Drug Rebate Program.
The
Health Insurance Portability and Accountability Act of 1996
also created prohibitions against healthcare fraud and false statements relating to healthcare matters. The healthcare fraud statute prohibits knowingly and willfully executing a scheme to defraud any healthcare benefit program, including private payers. The false statements statute prohibits knowingly and willfully falsifying, concealing or covering up a material fact or making any materially false, fictitious or fraudulent statement in connection with the delivery of or payment for healthcare benefits, items or services.
In addition, there has been a recent trend of increased federal and state regulation of payments made to physicians. The ACA, through the Physician Payment Sunshine Act, imposed new requirements on manufacturers of drugs, devices, biologics and medical supplies for which payment is available under Medicare, Medicaid or the Children's Health Insurance Program (with certain exceptions) to report annually to the Centers for Medicare and Medicaid Services ("CMS") information related to payments or other "transfers of value" made to physicians (defined to include doctors, dentists, optometrists, podiatrists and chiropractors) and teaching hospitals, and applicable manufacturers and group purchasing organizations to report annually to CMS ownership and investment interests held by physicians (as defined above) and their immediate family members and payments or other "transfers of value" to such physician owners and their immediate family members. Manufacturers are required to report such data to the government by the 90
th
calendar day of each year.
The majority of states also have statutes or regulations similar to these federal laws, which apply to items and services reimbursed under Medicaid and other state programs, or, in several states, apply regardless of the payer. In addition, some states have laws that require pharmaceutical companies to adopt comprehensive compliance programs. For example, under California law, pharmaceutical companies must comply with both the April 2003 Office of Inspector General Compliance Program Guidance for Pharmaceutical Manufacturers and the PhRMA Code on Interactions with Healthcare Professionals, as amended. Certain states also mandate the tracking and reporting of gifts, compensation, and other remuneration paid by us to physicians and other healthcare providers.
Although compliance programs can mitigate the risk of investigation and prosecution for violations of these laws, the risks cannot be entirely eliminated. Any action against us for violation of these laws, even if we successfully defend against it, could cause us to incur significant legal expenses and divert our management's attention from the operation of our business. Moreover, achieving and sustaining compliance with applicable federal and state laws may prove costly.
Because of the breadth of these laws and the narrowness of the safe harbors, it is possible that some of our business activities could be subject to challenge under one or more of such laws. The ACA also made several important changes to the federal anti-kickback statute, false claims laws, and healthcare fraud statute by weakening the intent requirement under the anti-kickback and healthcare fraud statutes that may make it easier for the government or whistleblowers to charge such fraud and abuse violations. A person or entity no longer needs to have actual knowledge of this statute or specific intent to violate it. In addition, the ACA provides that the government may assert that a claim including items or services resulting from a violation of the federal anti-kickback statute constitutes a false or fraudulent claim for purposes of the false claims statutes. In addition, the ACA increases penalties for fraud and abuse violations. If our past, present or future operations are found to be in violation of any of the laws described above or other similar governmental regulations to which we are subject, we may be subject to significant civil, criminal and administrative penalties, damages, fines, imprisonment, exclusion from government funded healthcare programs, such as Medicare and Medicaid, and the curtailment or restructuring of our operations, any of which could adversely affect our ability to operate our business and negatively impact our financial results.
If our products do not gain market acceptance, we may be unable to generate significant revenues.
Even though Macrilen™ (macimorelin) is approved for commercialization in the U.S., it may not be successful in the marketplace. Market acceptance of Macrilen™ (macimorelin) or any of our products will depend on a number of factors, including, but not limited to:
|
•
|
demonstration of clinical efficacy and safety;
|
|
•
|
the prevalence and severity of any adverse side effects;
|
|
•
|
limitations or warnings contained in the product's approved labeling;
|
10
|
•
|
availability of alternative treatments for the indications we target;
|
|
•
|
the advantages and disadvantages of Macrilen™ (macimorelin) or future products relative to current or alternative treatments;
|
|
•
|
the availability of acceptable pricing and adequate third-party reimbursement; and
|
|
•
|
the effectiveness of marketing and distribution methods for the products.
|
If Macrilen™ (macimorelin) or our future products do not gain market acceptance among physicians, patients, healthcare payers and others in the medical community, who may not accept or utilize our products, our ability to generate significant revenues from these products would be limited, and our financial condition could be materially adversely affected. In addition, if we fail to further penetrate our core markets and existing geographic markets or to successfully expand our business into new markets, the growth in sales of our current or future products, along with our operating results, could be negatively impacted.
Our ability to further penetrate our core markets and existing geographic markets in which we compete or to successfully expand our business into additional countries in Europe, Asia or elsewhere is subject to numerous factors, many of which are beyond our control. Macrilen™ (macimorelin) or our future products, if successfully developed, may compete with a number of drugs, therapies, products and tests currently manufactured and marketed by major pharmaceutical and other biotechnology companies. Macrilen™ (macimorelin) or our future products may also compete with new products currently under development by others or with products which may be less expensive than our current or future products. There can be no assurance that our efforts to increase market penetration in our core markets and existing geographic markets will be successful. Our failure to do so could have an adverse effect on our operating results and would likely cause a drop in the price of our Common Shares and/or a decline in the value of our other securities.
We may expend our limited resources to pursue a particular product or indication and fail to capitalize on other products or indications for which there may be a greater likelihood of success.
Because we have limited financial and managerial resources, we are currently focusing our efforts on Macrilen™ (macimorelin), and we are doing so for specific indications. As a result, we may forego or delay pursuit of opportunities with products or for other indications for which there may be a greater likelihood of success or may prove to have greater commercial potential. Research programs to identify new product candidates or pursue alternative indications for Macrilen™ (macimorelin) require substantial technical, financial and human resources. These activities may initially show promise in identifying potential product candidates or indications, yet fail to yield product candidates or indications for further clinical development.
We may not achieve our projected development goals in the time-frames we announce and expect.
We may set goals and make public statements regarding the timing of the accomplishment of objectives material to our success, such as the commencement, enrollment and anticipated completion of clinical trials, anticipated regulatory submission and approval dates and time of product launch. The actual timing of these events can vary dramatically due to factors such as delays or failures in any clinical trials, the uncertainties inherent in the regulatory approval process and delays in achieving manufacturing or marketing arrangements sufficient to commercialize Macrilen™ (macimorelin) or future products. There can be no assurance that we will make regulatory submissions or receive regulatory approvals as planned or that Strongbridge will be able to adhere to its current schedule for the launch of Macrilen™ (macimorelin) or for any future products we might acquire or license. If we fail to achieve one or more of these milestones as planned, the price of our Common Shares and/or the value of our other securities would likely decline.
If we fail to obtain acceptable prices or adequate reimbursement for Macrilen™ (macimorelin) or future products, our ability to generate revenues will be diminished.
Our ability or that of our licensee(s) to successfully commercialize Macrilen™ (macimorelin) or future products will depend significantly on our or their ability to obtain acceptable prices and the availability of reimbursement to the patient from third-party payers, such as governmental and private insurance plans. These third-party payers frequently require companies to provide predetermined discounts from list prices, and they are increasingly challenging the prices charged for pharmaceuticals and other medical products. Macrilen™ (macimorelin) or our future products may not be considered cost-effective, and reimbursement to the patient may not be available or sufficient to allow us or our licensee(s) to sell our products on a competitive basis. It may not be possible to negotiate favorable reimbursement rates for Macrilen™ (macimorelin) or future products. Adverse pricing and reimbursement conditions would also likely diminish our ability to induce third parties to in-license Macrilen™ (macimorelin) or our future products.
In addition, the continuing efforts of third-party payers to contain or reduce the costs of healthcare through various means may limit our commercial opportunity and reduce any associated revenue and profits. We expect that proposals to implement similar government controls will continue. The pricing of pharmaceutical products, in general, and specialty drugs, in particular, has been
11
a topic of concern in the U.S. Congress, where hearings on the topic have been held, and has been a topic of speeches given by political figures, including President Donald Trump. Specifically, there have been several recent U.S. Congressional inquiries and proposed bills designed to, among other things, bring more transparency to drug pricing, review the relationship between pricing and manufacturer patient programs, and reform government program reimbursement methodologies for drugs. Additionally, there is drug pricing reform taking place at the state level in the United States, in the form of laws and bills, that will impact how pharmaceutical companies can market and sell drug products and at what price. Further, third-party payers are increasingly challenging the price, examining the medical necessity and reviewing the cost-effectiveness of medical drug products and medical services, in addition to questioning their safety and efficacy. There can be no assurance as to how this scrutiny on pricing of pharmaceutical products will impact future pricing of a product or orphan drugs or pharmaceutical products generally. In addition, increasing emphasis on managed care will continue to put pressure on the pricing of pharmaceutical and biopharmaceutical products. Cost control initiatives could decrease the price that we or any current or potential collaborators could receive a product and could adversely affect our profitability. In addition, in the United States, Canada and many other countries, pricing and/or profitability of some or all prescription pharmaceuticals and biopharmaceuticals are subject to government control.
If we or our licensee(s) fail to obtain acceptable prices or an adequate level of reimbursement for Macrilen™ (macimorelin) or future products, the sales of these products would be adversely affected or there may be no commercially viable market for these products.
Competition in our targeted markets is intense, and development by other companies could render Macrilen™ (macimorelin) or future products or technologies non-competitive.
The biopharmaceutical field is highly competitive. New products developed by other companies in the industry could render Macrilen™ (macimorelin) or future products uncompetitive. Competitors are developing and testing products and technologies that would compete with Macrilen™ (macimorelin) or products that we could develop, acquire or license. Some of these products may be more effective or have an entirely different approach or means of accomplishing the desired effect than Macrilen™ (macimorelin) or future products. We expect competition from pharmaceutical and biopharmaceutical companies and academic research institutions to continue to increase over time. Many of our competitors and potential competitors have substantially greater product development capabilities and financial, scientific, marketing and human resources than we do. Our competitors may succeed in developing products earlier and in obtaining regulatory approvals and patent protection for such products more rapidly than we can or at a lower price.
We may not obtain adequate protection for our products through our intellectual property.
We rely heavily on our proprietary information in developing and manufacturing our product candidates. Our success depends, in large part, on our ability to protect our competitive position through patents, trade secrets, trademarks and other intellectual property rights. The patent positions of pharmaceutical and biopharmaceutical firms, including us, are uncertain and involve complex questions of law and fact for which important legal issues remain unresolved. We have filed and are pursuing applications for patents and trademarks in many countries. Pending patent applications may not result in the issuance of patents and we may not be able to obtain additional issued patents relating to our technology or products.
The laws of some countries do not protect intellectual property rights to the same extent as the laws of the United States and Canada. Many companies have encountered significant problems in protecting and defending such rights in foreign jurisdictions. Many countries, including certain countries in Europe, have compulsory licensing laws under which a patent owner may be compelled to grant licenses to third parties. In addition, many countries limit the enforceability of patents against government agencies or government contractors. In these countries, the patent owner may have limited remedies, which could materially diminish the value of the patent. Compulsory licensing of life-saving drugs is also becoming increasingly popular in developing countries either through direct legislation or international initiatives. Such compulsory licenses could be extended to include some of our product candidates, which could limit our potential revenue opportunities. Moreover, the legal systems of certain countries, particularly certain developing countries, do not favor the aggressive enforcement of patent and other intellectual property protection, which makes it difficult to stop and prevent infringement.
Our patents and/or the patents that we license from others may be challenged, narrowed, invalidated, held to be unenforceable or circumvented, which could limit our ability to stop competitors from marketing similar products or limit the length of term of patent protection we may have for our products. Changes in either patent laws or in interpretations of patent laws in the U.S. and other countries may diminish the value of our intellectual property or narrow the scope of our patent protection. The patents issued or to be issued to us may not provide us with any competitive advantage or protect us against competitors with similar technology. In addition, it is possible that third parties with products that are very similar to ours will circumvent our patents by means of alternate designs or processes. We may have to rely on method-of-use, methods of manufacture and/or new-formulation protection for our compounds in development, and any resulting products, which may not confer the same protection as claims to compounds
per se
.
12
In addition, our patents may be challenged by third parties in patent litigation, which is becoming widespread in the biopharmaceutical industry. There may be prior art of which we are not aware that may affect the validity or enforceability of a patent claim. There may also be prior art of which we are aware, but which we do not believe affects the validity or enforceability of a claim, which may, nonetheless, ultimately be found to affect the validity or enforceability of a claim. No assurance can be given that our patents would, if challenged, be held by a court to be valid or enforceable or that a competitor's technology or product would be found by a court to infringe our patents. Our granted patents could also be challenged and revoked in U.S. post-grant proceedings as well as in opposition or nullity proceedings in certain countries outside the U.S. In addition, we may be required to disclaim part of the term of certain patents.
Patent applications relating to or affecting our business have been filed by a number of pharmaceutical and biopharmaceutical companies and academic institutions. A number of the technologies in these applications or patents may conflict with our technologies, patents or patent applications, and any such conflict could reduce the scope of patent protection that we could otherwise obtain. Because patent applications in the U.S. and many other jurisdictions are typically not published until eighteen months after their first effective filing date, or in some cases not at all, and because publications of discoveries in the scientific literature often lag behind actual discoveries, we cannot be certain that we were the first to make the inventions claimed in issued patents or pending patent applications, or that we were the first to file for protection of the inventions set forth in the patent applications. If a third party has also filed a patent application in the U.S. covering our product candidates or a similar invention, we may have to participate in adversarial proceedings, such as interferences and deviation proceedings, before the United States Patent and Trademark Office and/or applicable adjudicators to determine which party is entitled to a U.S. patent claiming the disputed invention. The costs of these proceedings could be substantial and it is possible that our efforts could be unsuccessful, resulting in a loss of our U.S. patent position.
We also rely on trade secrets and proprietary know-how to protect our intellectual property. If we are unable to protect the confidentiality of our proprietary information and know-how, the value of our technology and products could be adversely affected. We seek to protect our unpatented proprietary information in part by requiring our employees, consultants, outside scientific collaborators and sponsored researchers and other advisors to enter into confidentiality agreements. These agreements provide that all confidential information developed or made known to the individual during the course of the individual's relationship with us is to be kept confidential and not disclosed to third parties except in specific circumstances. In the case of our employees, the agreements provide that all of the technology that is conceived by the individual during the course of employment is our exclusive property. These agreements may not provide meaningful protection or adequate remedies in the event of unauthorized use or disclosure of our proprietary information. In addition, it is possible that third parties could independently develop proprietary information and techniques substantially similar to ours or otherwise gain access to our trade secrets. If we are unable to protect the confidentiality of our proprietary information and know-how, competitors may be able to use this information to develop products that compete with our products and technologies, which could adversely impact our business.
We currently have the right to use certain patents and technologies under license agreements with third parties. Our failure to comply with the requirements of one or more of our license agreements could result in the termination of such agreements, which could cause us to terminate the related development program and cause a complete loss of our investment in that program. Inventions claimed in certain in-licensed patents may have been made with funding from the U.S. government and may be subject to the rights of the U.S. government and we may be subject to additional requirements in the event we seek to commercialize or manufacture product candidates incorporating such in-licensed technology.
As a result of the foregoing factors, we may not be able to rely on our intellectual property to protect our products in the marketplace.
We may infringe the intellectual property rights of others.
Our commercial success depends significantly on our ability to operate without infringing the patents and other intellectual property rights of third parties. There could be issued patents of which we are not aware that our products or methods may be found to infringe, or patents of which we are aware and believe we do not infringe but which we may ultimately be found to infringe. Moreover, patent applications and their underlying discoveries are in some cases maintained in secrecy until patents are issued. Because patents can take many years to issue, there may be currently pending applications of which we are unaware that may later result in issued patents that our products or technologies are found to infringe. Moreover, there may be published pending applications that do not currently include a claim covering our products or technologies but which nonetheless provide support for a later drafted claim that, if issued, our products or technologies could be found to infringe.
If we infringe or are alleged to infringe intellectual property rights of third parties, it will adversely affect our business. Third parties may own or control these patents or patent applications in the U.S. and abroad. These third parties could bring claims against us or our collaborators that would cause us to incur substantial expenses and, if successful against us, could cause us to pay substantial damages. Further, if a patent infringement suit were brought against us or our collaborators, we or they could be
13
forced to stop or delay research, development, manufacturing or sales of the product or product candidate that is the subject of the suit.
The biopharmaceutical industry has produced a proliferation of patents, and it is not always clear to industry participants, including us, which patents cover various types of products. The coverage of patents is subject to interpretation by the courts, and the interpretation is not always uniform. In the event of infringement or violation of another party's patent or other intellectual property rights, we may not be able to enter into licensing arrangements or make other arrangements at a reasonable cost. Any inability to secure licenses or alternative technology could result in delays in the introduction of our products or lead to prohibition of the manufacture or sale of products by us or our partners and collaborators.
Patent litigation is costly and time consuming and may subject us to liabilities.
If we become involved in any patent litigation, interference, opposition, re-examination or other administrative proceedings we will likely incur substantial expenses in connection therewith, and the efforts of our technical and management personnel will be significantly diverted. In addition, an adverse determination in litigation could subject us to significant liabilities.
We may not obtain trademark registrations for our current or future products.
We have filed applications for trademark registrations, including Macrilen™ (macimorelin), in various jurisdictions, including the U.S. We may file applications for other possible trademarks for current or future products in the future. No assurance can be given that any of our trademarks will be registered in the U.S. or elsewhere, or that the use of any registered or unregistered trademarks will confer a competitive advantage in the marketplace.
We rely on third parties to conduct, supervise and monitor our clinical trials, and those third parties may not perform satisfactorily.
We are not currently conducting any clinical trials but we may decide to do so in the future. We rely on third parties such as contract resource organizations, medical institutions and clinical investigators to enroll qualified patients and to conduct, supervise and monitor our clinical trials. Our reliance on these third parties for clinical development activities reduces our control over these activities. Our reliance on these third parties, however, does not relieve us of our regulatory responsibilities, including ensuring that our clinical trials are conducted in accordance with Good Clinical Practice guidelines and the investigational plan and protocols contained in an Investigational New Drug application to the FDA, or a comparable foreign regulatory submission. Furthermore, these third parties may also have relationships with other entities, some of which may be our competitors. In addition, they may not complete activities on schedule, or may not conduct our preclinical studies or clinical trials in accordance with regulatory requirements or our trial design. If these third parties do not successfully carry out their contractual duties or meet expected deadlines, our efforts to obtain regulatory approvals for, and to commercialize, our products may be delayed or prevented.
In carrying out our operations, we are dependent on a stable and consistent supply of ingredients and raw materials.
There can be no assurance that we, our contract manufacturers or our licensees, will be able, in the future, to continue to purchase products from our current suppliers or any other supplier on terms that are favorable or similar to current terms or at all. An interruption in the availability of certain raw materials or ingredients, or significant increases in the prices we pay for them, could have a material adverse effect on our business, financial condition, liquidity and operating results.
The failure to perform satisfactorily by third parties upon which we expect to rely to manufacture and supply products may lead to supply shortfalls.
We expect to rely on third parties to manufacture and supply marketed products. We also have or may have certain supply obligations
vis-à-vis
our existing and potential licensees, who are or will be responsible for the marketing of the products. To be successful, our current or future products have to be manufactured in commercial quantities in compliance with quality controls and regulatory requirements. Even though it is our objective to minimize such risk by introducing alternative suppliers to ensure a constant supply at all times, there are a limited number of contract manufacturers or suppliers that are capable of manufacturing our current or future products or the materials used in their manufacture. If we are unable to do so ourselves or to arrange for third-party manufacturing or supply of these products or materials, or to do so on commercially reasonable terms, we may not be able to complete development of these products or to commercialize them ourselves or through our licensees. Reliance on third-party manufacturers entails risks to which we would not be subject if we manufactured products ourselves, including reliance on the third party for regulatory compliance, the possibility of breach of the manufacturing agreement by the third party because of factors beyond our control, and the possibility of termination or non-renewal of the agreement by the third party, based on its own business priorities, at a time that is costly or inconvenient for us.
We are subject to intense competition for our skilled personnel, and the loss of key personnel or the inability to attract additional personnel could impair our ability to conduct our operations.
14
We are highly dependent on our management and our clinical, regulatory and scientific staff, the loss of whose services might adversely impact our ability to achieve our objectives. Recruiting and retaining qualified management and clinical, scientific and regulatory personnel is critical to our success. Reductions in our staffing levels have eliminated redundancies in key capabilities and skill sets among our full-time staff and required us to rely more heavily on outside consultants and third parties. We have been unable to increase the compensation of our associates to the extent required to remain fully competitive for their services, which increased our employee retention risk. The competition for qualified personnel in the biopharmaceutical field is intense, and if we are not able to continue to attract and retain qualified personnel and/or maintain positive relationships with our outside consultants, we may not be able to achieve our strategic and operational objectives.
We are currently subject to the following litigation matters and we may be subject to similar or other litigation in the future.
Securities class action litigation
We and certain of our current and former officers are defendants in a class-action lawsuit pending in the U.S. District Court for the District of New Jersey (the "Court"), brought on behalf of shareholders of the Company. The lawsuit alleges violations of the
Securities Exchange Act of 1934
(the "Exchange Act") in connection with allegedly false and misleading statements made by the defendants between April 2, 2012 and November 6, 2014 (the "Class Period"), regarding the safety and efficacy of Macrilen™ (macimorelin), and the prospects for the approval of the Company's NDA for the product by the FDA. The plaintiffs represent a class comprised of purchasers of our Common Shares during the Class Period and seek damages, costs and expenses and such other relief as determined by the Court. On September 14, 2015, the Court dismissed the lawsuit stating that the plaintiffs failed to state a claim, but granted the plaintiffs leave to amend. On October 14, 2015, the plaintiffs filed a second amended complaint against us. We subsequently filed a motion to dismiss because we believed that the second amended complaint also failed to state a claim.
On March 2, 2016, the Court issued an order granting our motion to dismiss the complaint in part and denying it in part. The Court dismissed certain of our current and former officers from the lawsuit. The Court allowed the claim that we omitted material facts from our public statements during the Class Period to proceed against us and our former Chief Executive Officer, who departed in 2013, while dismissing such claims against other current and former officers. The Court also allowed a claim for "controlling person" liability to proceed against certain current and former officers. On March 16, 2016, we filed a motion for reconsideration of the Court's March 2, 2016 order and on April 6, 2016 we filed an answer to the second amended complaint. On June 30, 2016, the Court issued an order denying our motion for reconsideration. On February 28, 2018, the Court granted a motion for class certification which we appealed. We filed an interlocutory petition for review on March 14, 2018. Lead Plaintiff’s opposition to the petition was due on Monday, March 26, 2018. The discovery process has commenced and is on-going. While we believe we have meritorious defenses and intend to continue to defend this lawsuit vigorously, we cannot predict the outcome.
Litigation pertaining to former officers of the Company
In late July 2017, we terminated for cause the employment of Mr. David A. Dodd, the former President and Chief Executive Officer of the Company and we also terminated the employment of Mr. Philip A. Theodore, the former Senior Vice President, Chief Administrative Officer, General Counsel and Corporate Secretary of the Company. All outstanding stock options held by both former officers were cancelled effective as of their respective termination dates, in accordance with the provisions of our Stock Option Plan (as defined below).
On August 3, 2017, we announced that we had filed a lawsuit against both Messrs. Dodd and Theodore for damages suffered by us for breach of confidence and/or breach of fiduciary duty in an amount to be determined prior to trial. We are also seeking, among other things, an injunction to prevent both Messrs. Dodd and Theodore from: (i) continuing to use our confidential and proprietary information without authorization; and (ii) mounting a proxy contest that will be premised upon the breaches of fiduciary and statutory duties and breaches of confidence alleged in the lawsuit. We engaged external counsel to conduct an internal investigation related to this lawsuit, which is still ongoing. Messrs. Dodd and Theodore have requested indemnification advances from the Company to cover their expenses in defending this lawsuit. On December 21, 2017, Messrs. Dodd and Theodore brought a counterclaim against the Company and its Chair, Carolyn Egbert, in the amount of CAN$6.0 million alleging, among other things, that defamatory statements were made against Messrs. Dodd and Theodore. The Company and its Chair consider the counterclaim against them to be entirely without merit, and intend to vigorously defend against the counterclaim.
On August 4, 2017, Mr. Dodd filed a lawsuit in the Court of Common Pleas of South Carolina against us for damages of approximately U.S.$1.7 million, alleging breach of his employment contract. He is also requesting that all of his outstanding stock options vest effective upon his termination date. On September 5, 2017, the lawsuit in the Court of Common Pleas of South Carolina was moved to the Federal Court in South Carolina. The court has set a scheduling order, with discovery set to end on June 29, 2018. While we believe we have meritorious defenses and intend to continue to defend this lawsuit vigorously, we cannot predict the outcome.
15
Cogas litigation
Cogas Consulting, LLC ('Cogas') filed a lawsuit against the Company in state court in Fulton County, Georgia on February 2, 2018. Cogas alleges that its employee (and sole shareholder) John Sharkey is entitled to a "success fee" commission on the Strongbridge License Agreement. Cogas is claiming damages in the form of a lost commission on the transaction. Cogas claims its commission is 5% on payments the Company receives within the first three years after January 14, 2018. Cogas alleges it is entitled to 5% of the $24 million that Strongbridge already paid the Company, plus 5% of any royalty Strongbridge pays the Company through January 17, 2021. The Company plans to vigorously defend this matter.
Furthermore, we may, from time to time, be a party to other litigation in the normal course of business. Monitoring and defending against legal actions, whether or not meritorious, is time-consuming for our management and detracts from our ability to fully focus our internal resources on our business activities. In addition, legal fees and costs incurred in connection with such activities may be significant and we could, in the future, be subject to judgments or enter into settlements of claims for significant monetary damages. A decision adverse to our interests could result in the payment of substantial damages and could have a material adverse effect on our cash flow, results of operations and financial position.
With respect to any litigation, our insurance may not reimburse us or may not be sufficient to reimburse us for the expenses or losses we may suffer in contesting and concluding such lawsuit. Substantial litigation costs, including the substantial self-insured retention that we are required to satisfy before any insurance applies to a claim, unreimbursed legal fees or an adverse result in any litigation may adversely impact our business, operating results or financial condition. We believe that our directors' and officers' liability insurance will cover our potential liability with respect to the securities class-action lawsuit and the litigation pertaining to former officers of the Company described above; however, the insurer has reserved its rights to contest the applicability of the insurance to such claims and the limits of the insurance may be insufficient to cover our eventual liability.
We are subject to the risk of product liability claims, for which we may not have or may not be able to obtain adequate insurance coverage.
The use of Macrilen™ (macimorelin) on human participants in our clinical trials subjects us to the risk of liability to such participants, who may suffer unintended consequences. The sale and use of Macrilen™ (macimorelin) will involve the risk of product liability claims and associated adverse publicity. Product liability claims might be made against us directly by patients, healthcare providers or pharmaceutical companies or others selling, buying or using our products. We attempt to manage our liability risks by means of insurance. We maintain insurance covering our liability for our preclinical and clinical studies as well as products liability insurance. However, we may not have or be able to obtain or maintain sufficient and affordable insurance coverage, including coverage for potentially very significant legal expenses, and without sufficient coverage any claim brought against us could have a materially adverse effect on our business, financial condition or results of operations.
Our business involves the use of hazardous materials. We are required to comply with environmental and occupational safety laws regulating the use of such materials. If we violate these laws, we could be subject to significant fines, liabilities or other adverse consequences.
Our discovery and development processes involve the controlled use of hazardous materials. We are subject to federal, provincial and local laws and regulations governing the use, manufacture, storage, handling and disposal of such materials and certain waste products. The risk of accidental contamination or injury from these materials cannot be eliminated. In the event of an accident or a failure to comply with environmental or occupational safety laws, we could be held liable for any damages that result, and any such liability could exceed our resources. We may not be adequately insured against this type of liability. We may be required to incur significant costs to comply with environmental laws and regulations in the future, and our operations, business or assets may be materially adversely affected by current or future environmental laws or regulations.
We are a holding company, and claims of creditors of our subsidiaries will generally have priority as to the assets of such subsidiaries over our claims and those of our creditors and shareholders. In addition, we may be required to fund obligations of AEZS Germany.
Aeterna Zentaris Inc. is a holding company and a substantial portion of our non-cash assets is the share capital of our subsidiaries. AEZS Germany, our principal operating subsidiary, based in Frankfurt, Germany, holds most of our intellectual property rights. Because Aeterna Zentaris Inc. is a holding company, our obligations to our creditors are structurally subordinated to all existing and future liabilities of our subsidiaries, which may incur additional or other liabilities and/or obligations. Therefore, our rights and the rights of our creditors to participate in any distribution of the assets of any subsidiary in the event that such subsidiary were to be liquidated or reorganized or in the event of any bankruptcy or insolvency proceeding relating to or involving such subsidiary, and therefore the rights of the holders of our Common Shares to participate in those assets, are subject to the prior claims of such subsidiary's creditors. To the extent that we may be a creditor with recognized claims against any such subsidiary,
16
our claims would still be subject to the prior claims of our subsidiary's creditors to the extent that they are secured or senior to those held by us.
Holders of our Common Shares are not creditors of our subsidiaries. Claims to the assets of our subsidiaries will derive from our own ownership interest in those operating subsidiaries. Claims of our subsidiaries' creditors will generally have priority as to the assets of such subsidiaries over our own ownership interest claims and will therefore have priority over the holders of our Common Shares. Our subsidiaries' creditors may from time to time include general creditors, trade creditors, employees, secured creditors, taxing authorities, and creditors holding guarantees. Accordingly, in the event of any foreclosure, dissolution, winding-up, liquidation or reorganization, or a bankruptcy, insolvency or creditor protection proceeding relating to us or our property, or any subsidiary, there can be no assurance as to the value, if any, that would be available to holders of our Common Shares. In addition, any distributions to us by our subsidiaries could be subject to monetary transfer restrictions in the jurisdictions in which our subsidiaries operate.
We provided the Letter of Comfort to AEZS Germany in 2017 and prior years because German law imposes an obligation on the managing director of AEZS Germany to institute insolvency proceedings if the managing director concludes that AEZS Germany is insolvent because it is either illiquid or "over-indebted". The purpose of the Letter of Comfort is to preclude the managing director from determining that AEZS Germany is illiquid or over-indebted. The Letter of Comfort will be sufficient for that purpose only as long as the managing director reasonably believes that we will be able to honor our obligations under the Letter of Comfort. If we fail to renew the Letter of Comfort or if the managing director concludes that we will be unable to honor our obligations under the Letter of Comfort, the managing director of AEZS Germany may determine that he or she is obligated to institute insolvency proceedings in Germany for AEZS Germany.
Because we are a holding company and because we may have an obligation to advance funds to AEZS Germany to prevent it from becoming either illiquid or over-indebted, we may be required to use our cash to fund payments by AEZS Germany to its creditors. Therefore, in the event of any winding-up, liquidation or reorganization, or a bankruptcy or insolvency proceeding relating to us or our property, there can be no assurance as to the value or assets, if any, that would be available to holders of our Common Shares because we may be required to advance cash to AEZS Germany.
It may be difficult for U.S. investors to obtain and enforce judgments against us because of our Canadian incorporation and German presence.
We are a company existing under the laws of Canada. A number of our directors and officers, and certain of the experts named herein, are residents of Canada or otherwise reside outside the U.S., and all or a substantial portion of their assets, and a substantial portion of our assets, are located outside the U.S. Consequently, although we have appointed an agent for service of process in the U.S., it may be difficult for investors in the U.S. to bring an action against such directors, officers or experts or to enforce against those persons or us a judgment obtained in a U.S. court predicated upon the civil liability provisions of federal securities laws or other laws of the U.S. Investors should not assume that foreign courts (i) would enforce judgments of U.S. courts obtained in actions against us or such directors, officers or experts predicated upon the civil liability provisions of the U.S. federal securities laws or the securities or "blue sky" laws of any state within the U.S. or (ii) would enforce, in original actions, liabilities against us or such directors, officers or experts predicated upon the U.S. federal securities laws or any such state securities or "blue sky" laws.
We are subject to various internal control reporting requirements under applicable Canadian securities laws and the Sarbanes-Oxley Act in the U.S. We can provide no assurance that we will at all times in the future be able to report that our internal controls over financial reporting are effective.
As a public company, we are required to comply with Section 404 of the U.S.
Sarbanes-Oxley Act
("Section 404") and National Instrument 52-109 -
Certification of Disclosure in Issuers' Annual and Interim Filings
of the Canadian securities administrators. In any given year, we cannot be certain as to the time of completion of our internal control evaluation, testing and remediation actions or of their impact on our operations. Upon completion of this process, we may identify control deficiencies of varying degrees of severity under applicable SEC and Public Company Accounting Oversight Board (U.S.) rules and regulations. As a public company, we are required to report, among other things, control deficiencies that constitute material weaknesses or changes in internal controls that, or that are reasonably likely to, materially affect internal controls over financial reporting. A "material weakness" is a deficiency, or a combination of deficiencies, in internal control over financial reporting, such that there is a reasonable possibility that a material misstatement of our annual consolidated financial statements will not be prevented or detected on a timely basis. If we fail to comply with the requirements of Section 404 or similar Canadian requirements or if we report a material weakness, we might be subject to regulatory sanction and investors may lose confidence in our consolidated financial statements, which may be inaccurate if we fail to remedy such material weakness.
It is possible that we may be a passive foreign investment company, which could result in adverse tax consequences to U.S. investors.
17
Adverse U.S. federal income tax rules apply to "U.S. Holders" (as defined in "Item 10.E - Taxation - Certain Material U.S. Federal Income Tax Considerations" in this Annual Report on Form 20-F) who directly or indirectly hold Common Shares of a passive foreign investment company ("PFIC"). We will be classified as a PFIC for U.S. federal income tax purposes for a taxable year if (i) at least 75% of our gross income is "passive income" or (ii) at least 50% of the average value of our assets, including goodwill (based on annual quarterly average), is attributable to assets which produce passive income or are held for the production of passive income.
We believe that we were a PFIC for the 2015 taxable year, but were not a PFIC for the 2016 and 2017 taxable years. However, the PFIC determination depends on the application of complex U.S. federal income tax rules concerning the classification of our assets and income for this purpose, and these rules are uncertain in some respects. In addition, the fair market value of our assets may be determined in large part by the market price of our Common Shares, which is likely to fluctuate, and the composition of our income and assets will be affected by how, and how quickly, we spend any cash that is raised in any financing transaction. No assurance can be provided that we will not be classified as a PFIC for the 2018 taxable year and for any future taxable year.
If we are a PFIC for any taxable year during which a U.S. Holder holds Common Shares, we generally would continue to be treated as a PFIC with respect to that U.S. Holder for all succeeding years during which the U.S. Holder holds such Common Shares, even if we ceased to meet the threshold requirements for PFIC status. PFIC characterization could result in adverse U.S. federal income tax consequences to U.S. Holders. In particular, absent certain elections, a U.S. Holder would generally be subject to U.S. federal income tax at ordinary income tax rates, plus a possible interest charge, in respect of a gain derived from a disposition of our Common Shares, as well as certain distributions by us. If we are treated as a PFIC for any taxable year, a U.S. Holder may be able to make an election to "mark to market" Common Shares each taxable year and recognize ordinary income pursuant to such election based upon increases in the value of the Common Shares. In addition, U.S. Holders may mitigate the adverse tax consequences of the PFIC rules by making a "qualified electing fund" ("QEF") election; however, there can be no assurance that the Company will satisfy the record keeping requirements applicable to a QEF or that it will provide the information regarding its income that would be necessary for a U.S. Holder to make a QEF election.
If the Company is a PFIC, U.S. Holders will generally be required to file an annual information return with the Internal Revenue Service (the "IRS") (on IRS Form 8621, which PFIC shareholders will be required to file with their U.S. federal income tax or information returns) relating to their ownership of Common Shares. This filing requirement is in addition to any preexisting reporting requirements that apply to a U.S. Holder's interest in a PFIC (which this requirement does not affect).
For a more detailed discussion of the potential tax impact of us being a PFIC, see "Item 10.E - Taxation - Material U.S. Federal Income Tax Considerations" in this Annual Report on Form 20-F. The PFIC rules are complex. U.S. Holders should consult their tax advisors regarding the potential application of the PFIC regime and any reporting obligations to which they may be subject under that regime.
Our net operating losses may be limited for U.S. federal income tax purposes under Section 382 of the Internal Revenue Code.
If a corporation with net operating losses ("NOLs") undergoes an "ownership change" within the meaning of Section 382 of the United States Internal Revenue Code of 1986, as amended, then such corporation's use of such "pre-change" NOLs to offset income incurred following such ownership change may be limited. Such limitation also may apply to certain losses or deductions that are "built-in" (i.e., attributable to periods prior to the ownership change but not yet taken into account for tax purposes) as of the date of the ownership change that are subsequently recognized. An ownership change generally occurs when there is either (i) a shift in ownership involving one or more "5% shareholders"; or (ii) an "equity structure shift" and, as a result, the percentage of stock of the corporation owned by one or more 5% shareholders (based on value) has increased by more than 50 percentage points over the lowest percentage of stock of the corporation owned by such shareholders during the "testing period" (generally the 3 years preceding the testing date). In general, if such change occurs, the corporation's ability to utilize its net operating loss carry-forwards and certain other tax attributes would be subject to an annual limitation, as described below. The unused portion of any such net operating loss carry-forwards or tax attributes each year is carried forward, subject to the same limitation in future years. The impact of an ownership change on state NOL carryforwards may vary from state to state. Recent legislation added several limitations to the ability to claim deductions for NOLs, including a deduction limit equal to 80% of taxable income and a restriction on NOL carryback deductions.
We may incur losses associated with foreign currency fluctuations.
Our operations are in many instances conducted in currencies other than our functional currency or the functional currencies of our subsidiaries. Fluctuations in the value of currencies could cause us to incur currency exchange losses. We do not currently employ a hedging strategy against exchange rate risk. We cannot assert with any assurance that we will not suffer losses as a result of unfavorable fluctuations in the exchange rates between the U.S. dollar, the euro, the Canadian dollar and other currencies.
18
Legislative actions, new accounting pronouncements and higher insurance costs may adversely impact our future financial position or results of operations.
Changes in financial accounting standards or implementation of accounting standards may cause adverse, unexpected revenue or expense fluctuations and affect our financial position or results of operations. New pronouncements and varying interpretations of pronouncements have occurred with greater frequency and are expected to occur in the future, and we may make or be required to make changes in our accounting policies in the future. Compliance with changing regulations of corporate governance and public disclosure, notably with respect to internal controls over financial reporting, may result in additional expenses. Changing laws, regulations and standards relating to corporate governance and public disclosure are creating uncertainty for companies such as ours, and insurance costs are increasing as a result of this uncertainty.
Data security breaches may disrupt our operations and adversely affect our operating results.
Our network security and data recovery measures and those of third parties with which we contract, may not be adequate to protect against computer viruses, cyber-attacks, breaches, and similar disruptions from unauthorized tampering with our computer systems. The misappropriation, theft, sabotage or any other type of security breach with respect to any of our proprietary and confidential information that is electronically stored, including research or clinical data, could cause interruptions in our operations, could result in a material disruption of our clinical activities and business operations and could expose us to third-party legal claims. Furthermore, we could be required to make substantial expenditures of resources to remedy the cause of cyber-attacks or break-ins. This disruption could have a material adverse impact on our business, operating results and financial condition. Additionally, any break-in or trespass of our facilities that results in the misappropriation, theft, sabotage or any other type of security breach with respect to our proprietary and confidential information, including research or clinical data, or that results in damage to our R&D equipment and assets could have a material adverse impact on our business, operating results, and financial condition.
Our business processes personal information, both in connection with clinical activities and our employees. The use of this information is critical to our operations and innovation, including the development of our products, as well as management of our employees. New and evolving regulations, such as the European Union General Data Protection Regulation, could bring increased scrutiny of our data management in the future. Any cyber-attacks or other failure to protect critical and sensitive systems and information could damage our reputation, prompt litigation or lead to regulatory sanctions, all of which could materially affect our financial condition and results of operation.
19
Risks Relating to our Common Shares
Our Common Shares may be delisted from the NASDAQ Capital Market ("NASDAQ") or the Toronto Stock Exchange ("TSX"), which could affect their market price and liquidity. If our Common Shares were to be delisted, investors may have difficulty in disposing of their shares.
Our Common Shares are currently listed on both NASDAQ and TSX under the symbol "AEZS". We must meet continuing listing requirements to maintain the listing of our Common Shares on NASDAQ and TSX. For continued listing, NASDAQ requires, among other things, that listed securities maintain a minimum closing bid price of not less than $1.00 per share. There can be no assurance that the market price of our Common Shares will not fall below $1.00 in the future or that, if it does, we will regain compliance with the minimum bid price requirement.
In addition to the minimum bid price requirement, the continued listing rules of NASDAQ require us to meet at least one of the following listing standards: (i) stockholders' equity of at least $2.5 million, (ii) market value of listed securities (calculated by multiplying the daily closing bid price of our Common Shares by our total outstanding Common Shares) of at least $35 million or (iii) net income from continuing operations (in the latest fiscal year or in two of the last three fiscal years) of at least $500,000 (collectively, the "Additional Listing Standards"). If we fail to meet at least one of the Additional Listing Standards, our Common Shares may be subject to delisting after the expiration of the period of time, if any, that we are allowed for regaining compliance.
As at December 31, 2017, we were not in compliance with the continued listing standards of NASDAQ. However, in January 2018, we received an upfront milestone payment of $24 million pursuant to the Strongbridge License Agreement and we believe that the impact of this payment will cure any default of the continuing listing standards of NASDAQ that might have been present as at December 31, 2017, however there is no assurance that we will obtain and maintain compliance or that NASDAQ will determine that we have achieved compliance.
There can be no assurance that our Common Shares will remain listed on NASDAQ
or TSX. If we fail to meet any of NASDAQ's
or TSX's continued listing requirements, our Common Shares may be delisted. Any delisting of our Common Shares may adversely affect a shareholder's ability to dispose, or obtain quotations as to the market value, of such shares.
Our share price is volatile, which may result from factors outside of our control.
Our valuation and share price since the beginning of trading after our initial listings, first in Canada and then in the U.S., have had no meaningful relationship to current or historical financial results, asset values, book value or many other criteria based on conventional measures of the value of shares.
Between
January 1, 2017
and
December 31, 2017
, the closing price of our Common Shares ranged from $
0.84
to $
3.65
per share on NASDAQ and from C$
1.13
to C$
4.81
per share on TSX. Our share price may be affected by developments directly affecting our business and by developments out of our control or unrelated to us. The stock market generally, and the biopharmaceutical sector in particular, are vulnerable to abrupt changes in investor sentiment. Prices of shares and trading volume of companies in the biopharmaceutical industry can swing dramatically in ways unrelated to, or that bear a disproportionate relationship to, operating performance. Our share price and trading volume may fluctuate based on a number of factors including, but not limited to:
|
•
|
clinical and regulatory developments regarding our product candidates;
|
|
•
|
delays in our anticipated development or commercialization timelines;
|
|
•
|
developments regarding current or future third-party collaborators and licensee(s);
|
|
•
|
announcements by us regarding technological, product development or other matters;
|
|
•
|
arrivals or departures of key personnel;
|
|
•
|
governmental or regulatory action affecting our product candidates and our competitors' products in the U.S., Canada and other countries;
|
|
•
|
developments or disputes concerning patent or proprietary rights;
|
|
•
|
actual or anticipated fluctuations in our revenues or expenses;
|
|
•
|
general market conditions and fluctuations for the emerging growth and biopharmaceutical market sectors; and
|
|
•
|
economic conditions in the U.S., Canada or abroad.
|
20
Our listing on both NASDAQ and TSX may increase price volatility due to various factors, including different ability to buy or sell our Common Shares, different market conditions in different capital markets and different trading volumes. In addition, low trading volume may increase the price volatility of our Common Shares. A thin trading market could cause the price of our Common Shares to fluctuate significantly more than the stock market as a whole.
We do not intend to pay dividends in the near future.
To date, we have not declared or paid any dividends on our Common Shares. We currently intend to retain our future earnings, if any, to finance further research and the overall commercial expansion of our business. As a result, the return on an investment in our Common Shares will depend upon any future appreciation in value. There is no guarantee that our Common Shares or any of our other securities will appreciate in value or even maintain the price at which shareholders have purchased them.
Future issuances of securities and hedging activities may depress the trading price of our Common Shares.
Any additional or future issuance of Common Shares or Convertible Securities, including the issuance of Common Shares upon the exercise of stock options and upon the exercise of warrants, could dilute the interests of our existing shareholders, and could substantially decrease the trading price of our Common Shares.
We may issue equity securities in the future for a number of reasons, including to finance our operations and business strategy, to satisfy our obligations upon the exercise of options or warrants or for other reasons. Our Stock Option Plan generally permits us to have outstanding, at any given time, stock options that are exercisable for a maximum number of Common Shares equal to 11.4% of all then issued and outstanding Common Shares. As at
March 27, 2018
, there were:
|
16,440,760
|
|
Common Shares issued and outstanding
|
|
|
—
|
|
Preferred Shares issued and outstanding
|
|
|
3,417,840
|
|
Common Shares issuable upon exercise of outstanding warrants
|
|
|
711,252
|
|
Stock Options outstanding
|
|
|
1,162,995
|
|
Additional Common Shares available for future grants under our stock option plan
|
|
In addition, the price of our Common Shares could also be affected by possible sales of Common Shares by investors who view other investment vehicles as more attractive means of equity participation in us and by hedging or arbitrage trading activity that may develop involving our Common Shares. This hedging or arbitrage could, in turn, affect the trading price of our Common Shares.
In the event we were to lose our foreign private issuer status as of June 30 of a given financial year, we would be required to comply with the Exchange Act's domestic reporting regime, which could cause us to incur additional legal, accounting and other expenses.
In order to maintain our current status as a foreign private issuer, either (1) a majority of our Common Shares must not be either directly or indirectly owned of record by residents of the U.S. or (2) (a) a majority of our executive officers and of our directors must not be U.S. citizens or residents, (b) more than 50 percent of our assets cannot be located in the U.S. and (c) our business must be administered principally outside the U.S.
In 2017, our management conducted its annual assessment of the various facts and circumstances underlying the determination of our status as a foreign private issuer and, based on the foregoing, our management has determined that, as of the date of such determination and as of June 30, 2017, we continued to be a foreign private issuer.
There can be no assurance, however, that we will remain a foreign private issuer either in 2018 or in future financial years.
If we were to lose our foreign private issuer status as of June 30 of any given financial year, we would be required to comply with the Exchange Act reporting and other requirements applicable to U.S. domestic issuers, which are more detailed and extensive than the requirements for foreign private issuers. We may also be required to make changes in our corporate governance practices in accordance with various SEC rules and NASDAQ listing standards. The regulatory and compliance costs to us of complying with the reporting requirements applicable to a U.S. domestic issuer under U.S. securities laws may be higher than the cost we have historically incurred as a foreign private issuer. In addition, if we were to lose our foreign private issuer status, we would no longer qualify under the Canada-U.S. multijurisdictional disclosure system to benefit from being able to file registration statements on Form F-10 (even if we satisfy the other conditions to eligibility), which could make it longer and more difficult to register our securities and raise funds by way of public, registered offerings in the U.S., and we would become subject to "baby shelf" rules that place limitations on our ability to issue an amount of securities above a certain threshold depending on our market capitalization and public float at a given point in time. As a result, we would expect that a potential loss of foreign private issuer status at some
21
future point in time could increase our legal, financial reporting and accounting compliance costs, and it is difficult at this time to estimate by how much our legal, financial reporting and accounting compliance costs may increase in such eventuality.
Our articles of incorporation contain "blank check" preferred share provisions, which could delay or impede an acquisition of our Company.
Our articles of incorporation, as amended, authorize the issuance of an unlimited number of "blank check" preferred shares, which could be issued by our Board of Directors without shareholder approval and which may contain liquidation, dividend and other rights equivalent or superior to our Common Shares. In addition, we have implemented in our constating documents an advance notice procedure for shareholder approvals to be brought before an annual meeting of our shareholders, including proposed nominations of persons for election to our Board of Directors. These provisions, among others, whether alone or together, could delay or impede hostile takeovers and changes in control or changes in our management. Any provision of our constating documents that has the effect of delaying or deterring a change in control could limit the opportunity for our shareholders to receive a premium for their Common Shares and could also affect the price that some investors are willing to pay for our Common Shares.
Our business could be negatively affected as a result of the actions of activist shareholders.
Proxy contests have been waged against many companies in the biopharmaceutical industry over the last few years. If faced with a proxy contest, we may not be able to successfully respond to the contest, which would be disruptive to our business. Even if we are successful, our business could be adversely affected by a proxy contest because:
|
•
|
responding to proxy contests and other actions by activist shareholders may be costly and time‑consuming, and may disrupt our operations and divert the attention of management and our employees;
|
|
•
|
perceived uncertainties as to the potential outcome of any proxy contest may result in our inability to consummate potential acquisitions, collaborations or in‑licensing opportunities and may make it more difficult to attract and retain qualified personnel and business partners; and
|
|
•
|
if individuals that have a specific agenda different from that of our management or other members of our Board of Directors are elected to our board as a result of any proxy contest, such an election may adversely affect our ability to effectively and timely implement our strategic plan and to create value for our shareholders.
|
|
Item 4.
|
Information on the Company
|
|
A.
|
History and development of the Company
|
We are a specialty biopharmaceutical company engaged in developing and commercializing pharmaceutical therapies, currently focused on the development and commercialization of Macrilen™ (macimorelin), including through out-licensing arrangements and pursuing in-licensing opportunities.
We were incorporated on September 12, 1990 under the
Canada Business Corporations Act
(the "CBCA") and continue to be governed by the CBCA. Our registered address is located at 1155 René-Lévesque Blvd, West 41
st
Floor, Montréal, Quebec, Canada H3B 3V2 c/o Stikeman Elliott, LLP. Our executive offices are located at 315 Sigma Drive, Summerville, South Carolina 29486; our telephone number is (843) 900-3223 and our website is www.aezsinc.com. None of the documents or information found on our website shall be deemed to be included in or incorporated by reference into this Annual Report on Form 20-F, unless such document is specifically incorporated herein by reference.
On December 30, 2002, we acquired Zentaris AG, a biopharmaceutical company based in Frankfurt, Germany. Zentaris was a spin-off of Asta Medica GmbH, a former pharmaceutical company affiliated with Degussa AG.
In May 2004, we changed our name to Aeterna Zentaris Inc. and on May 11, 2007, Zentaris GmbH was renamed Aeterna Zentaris GmbH ("AEZS Germany"). AEZS Germany conducts our drug development efforts. In September 2007, we incorporated Aeterna Zentaris, Inc. under the laws of Delaware. This wholly-owned subsidiary, which is based in the Charleston, South Carolina area, conducts certain of our administrative and commercial operations.
On November 17, 2015, we effected a 100-to-1 Share Consolidation (reverse stock split). Our Common Shares commenced trading on a consolidated and adjusted basis on both NASDAQ and TSX on November 20, 2015.
22
We currently have three wholly-owned direct and indirect subsidiaries, AEZS Germany, based in Frankfurt, Germany; Zentaris IVF GmbH, a direct wholly-owned subsidiary of AEZS Germany based in Frankfurt, Germany; and Aeterna Zentaris, Inc., an entity incorporated in the State of Delaware with an office in the Charleston, South Carolina area in the United States.
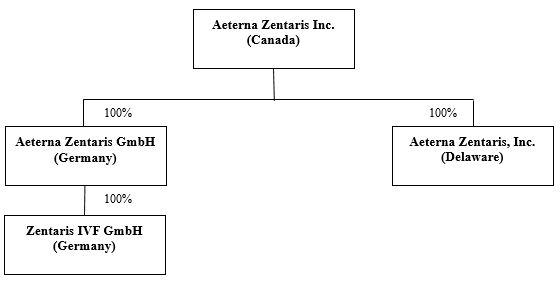
Our Common Shares are listed for trading on both NASDAQ and TSX under the trading symbol "AEZS".
Our agent for service of process and SEC matters in the United States is our wholly-owned subsidiary, Aeterna Zentaris, Inc., located at 315 Sigma Drive, Summerville, South Carolina 29486.
There have been no public takeover offers by third parties with respect to us or by us in respect of other companies' shares during the last or current financial year.
Recent Developments
For a complete description of our recent corporate and pipeline developments, refer to "Item 5. - Operating and Financial Review and Prospects - Key Developments".
|
B.
|
Business overview
|
On December 20, 2017, the FDA granted marketing approval for Macrilen™ (macimorelin) to be used in the diagnosis of patients with adult growth hormone deficiency ("AGHD").
Macrilen™ (macimorelin), a ghrelin receptor agonist, is a novel orally-active small molecule that stimulates the secretion of growth hormone. Macrilen™ (macimorelin) has been granted orphan drug designation by the FDA for the evaluation of growth hormone deficiency. We own the worldwide rights to this novel patented compound. Macrilen™ (macimorelin) is our proposed trade name for macimorelin. The proposed trade name was conditionally approved by the FDA. On December 16, 2016, we were advised by the EMA that Macrilen™ was rejected as the proposed invented name for macimorelin because of its similarity to the names of other medicines. On March 8, 2018, we applied for two new invented names for macimorelin: Macrilen ST and Macrilen GHST; however, we are also evaluating alternative names given recent feedback received from the EMA.
On January 16, 2018, through AEZS Germany, we entered into the Strongbridge License Agreement. We received an upfront cash payment of $24,000,000 from Strongbridge, and, for as long as Macrilen™ (macimorelin) is patent-protected, the Company will be entitled to a 15% royalty on net sales up to $75,000,000 and an 18% royalty on net sales above $75,000,000. Following the end of patent protection in United States or Canada for Macrilen™ (macimorelin), the Company will be entitled to a 5% royalty
23
on net sales in that country. In addition, the Company will also receive one-time payments from Strongbridge following the first achievement of the following commercial milestone events:
|
•
|
$4,000,000 on achieving $25,000,000 annual net sales,
|
|
•
|
$10,000,000 on achieving $50,000,000 annual net sales,
|
|
•
|
$20,000,000 on achieving $100,000,000 annual net sales,
|
|
•
|
$40,000,000 on achieving $200,000,000 annual net sales, and
|
|
•
|
$100,000,000 on achieving $500,000,000 annual net sales.
|
Upon approval by the FDA of a pediatric indication for Macrilen™ (macimorelin), the Company will receive a one-time milestone payment of $5,000,000 from Strongbridge.
Strongbridge will fund 70% of the costs of a worldwide pediatric development program to be run by the Company with customary oversight from a joint steering committee. The joint steering committee will be comprised of four persons, two of whom will be appointed by each of Strongbridge and the Company.
In 2017, we completed a Phase 3 study of the internally developed compound Zoptrex™ (zoptarelin doxorubicin), in the indication for advanced, recurrent endometrial cancer, the results of which study are not supportive to pursue regulatory approval by the FDA. In light of the results of the Zoptrex™ study, our focus has shifted entirely to the commercialization, either directly or through third parties, of Macrilen™ (macimorelin).
The commercial success of Macrilen™ (macimorelin) will depend on several factors, including, but not limited to, the receipt of approvals from the EMA and similar foreign regulatory authorities; developing appropriate distribution and marketing infrastructure and arrangements for our product; launching and growing commercial sales of the product; and acceptance of the product in the medical community, among patients and with third party payers. We are not currently conducting any clinical studies.
We continue to explore various alternatives to monetize our rights to macimorelin in other countries around the globe.
We also continue to seek opportunities to in-license and acquire products. Our goal is to become a growth-oriented specialty biopharmaceutical company by pursuing successful development, commercialization and licensing of a product portfolio achieving successful commercial presence and growth, while consistently delivering value to our shareholders, employees and the medical providers and patients who will benefit from our products.
Our Business Strategy
Our primary business strategy is to finalize the development, manufacturing, registration and commercialization of Macrilen™ (macimorelin) through the Strongbridge License Agreement in the United States and Canada. We continue to explore various alternatives to monetize our rights to Macrilen™ (macimorelin) in other countries around the globe, including whether to find other license partners in these jurisdictions or to use our internal resources to commercialize Macrilen™ (macimorelin) in one or more of these countries. Our vision is to become a growth-oriented specialty biopharmaceutical company.
Macrilen™ (macimorelin)
Macrilen™ (macimorelin) is a novel orally available peptidomimetic ghrelin receptor agonist that stimulates the secretion of growth hormone by binding to the ghrelin receptor (GHSR-1a) and that has potential uses in both endocrinology and oncology indications. Macrilen™ (macimorelin) was granted orphan-drug designation by the FDA for use in evaluating growth hormone deficiency ("GHD").
Competitors for Macrilen™ (macimorelin) as a product for the evaluation of AGHD are principally the diagnostic tests currently performed by endocrinologists, although none of these tests are approved by the FDA for this purpose. The most commonly used diagnostic tests for GHD are:
|
•
|
Measurement of blood levels of Insulin Growth Factor ("IGF")-1, which is typically used as the first test when GHD is suspected. However, this test is not used to definitively diagnose GHD because many growth hormone deficient patients show normal IGF-1 levels.
|
|
•
|
The Insulin Tolerance Test ("ITT"), which has historically been considered the gold standard for the evaluation of AGHD because of its high sensitivity and specificity. However, the ITT is inconvenient to both patients and physicians, administered
|
24
intravenously (IV), and contra-indicated in certain patients, such as patients with coronary heart disease or seizure disorder, because it requires the patient to experience hypoglycemia to obtain a result. Some physicians will not induce full hypoglycemia, intentionally compromising accuracy to increase safety and comfort for the patient. Furthermore, administration of the ITT includes additional costs associated with the patient being closely monitored by a physician for the two- to four-hour duration of the test and the test must be administered in a setting where emergency equipment is available and where the patient may be quickly hospitalized. The ITT is not used for patients with co-morbidities, such as cardiovascular disease, seizure disorder or a history of brain cancer or for patients who are elderly and frail, due to safety concerns.
|
•
|
The Glucagon Stimulation Test ("GST") is considered relatively safe by endocrinologists. The mechanism of action for this test is unclear. Also, this test takes up to three to four hours. It produces side effects in up to one-third of the patients with the most common being nausea during and after the test. This test is administered intramuscularly (IM).
|
|
•
|
The GHRH + ARG test (growth hormone releasing hormone-arginine stimulation) which is an easier test to perform in an office setting and has a good safety profile but is considered to be costly to administer compared to the ITT and the GST. GHRH + ARG is approved in the EU and has been proposed to be the best alternative to ITT, but GHRH is no longer available in the United States. This test is administered intravenously (IV).
|
Oral administration of Macrilen™ (macimorelin) offers convenience and simplicity over the current GHD tests used, all of which require either intravenous or intramuscular administration. Additionally, Macrilen™ (macimorelin) may demonstrate a more favorable safety profile than existing diagnostic tests, some of which may be inappropriate for certain patient populations, e.g. diabetes mellitus or coronary heart disease, and have demonstrated a variety of side effects, which Macrilen™ (macimorelin) has not thus far. These factors may be limiting the use of GHD testing and may potentially enable Macrilen™ (macimorelin) to become the product of choice in evaluating AGHD. We believe that Macrilen™ (macimorelin) is likely to rapidly displace the ITT as the preferred means of evaluating AGHD for the following reasons:
|
•
|
it is safer and more convenient than the ITT because it does not require the patient to become hypoglycemic;
|
|
•
|
Macrilen™ (macimorelin) is administered orally, while the ITT requires an intravenous injection of insulin;
|
|
•
|
Macrilen™ (macimorelin) is a more robust test than the ITT leading to evaluable test results;
|
|
•
|
Macrilen™ (macimorelin) results are highly reproducible;
|
|
•
|
the evaluation of AGHD using Macrilen™ (macimorelin) is less time-consuming and labor-intensive than the ITT; and
|
|
•
|
the evaluation can be conducted in the physician's office rather than in a hospital-like setting.
|
We believe that approximately 60,000 AGHD tests will be conducted annually, in the U.S, after the introduction of Macrilen™ (macimorelin). In addition, based on published information from the U.S. Centers for Disease Control and Prevention, different scientific publications and Navigant Research, we estimate that the total potential U.S. market for AGHD evaluation is approximately 150,000 tests per year, including the evaluation of patients who have suffered traumatic brain injury ("TBI"). In patients with TBI, GHD is frequent and may contribute to cognitive sequelae and reduction in quality of life. GHD may develop in approximately 19% of both severe and moderate hospitalized TBI victims.
Development History
The following is a summary of the history of our development of Macrilen™ (macimorelin):
|
•
|
We out-licensed the development compound macimorelin acetate to Ardana Bioscience in 2004. Ardana Bioscience subsequently initiated the clinical development program of macimorelin acetate as an orally active compound intended to be used in the diagnosis of AGHD. Following agreement with the FDA on the study design, Ardana Bioscience initiated a pivotal Phase 3 study in 2007, which tested the compound compared to a test of growth hormone- releasing hormone ("GHRH") + L-Arginine ("ARG"), using a competitor's compound. The study was discontinued in 2008 due to Ardana Bioscience's bankruptcy. We terminated Ardana Bioscience's license to the compound due to its bankruptcy.
|
|
•
|
On October 19, 2009, we announced that we had initiated activities intended to complete the clinical development of Macrilen™ (macimorelin) for use in evaluating AGHD. We had already assumed the sponsorship of the Investigational New Drug Application ("IND") from Ardana Bioscience and discussed with the FDA the best way to complete the ongoing Phase 3 clinical trial and subsequently to file an NDA for approval of Macrilen™ (macimorelin) for use in evaluating AGHD. The pivotal Phase 3 trial was designed to investigate the safety and efficacy of the oral administration of Macrilen™ (macimorelin) as a growth hormone stimulator for use in evaluating AGHD. It was accepted by the FDA that for the ongoing part of the
|
25
study, Macrilen™ (macimorelin) would not be compared to the GHRH + ARG test because the competitor's compound had been removed from the market.
|
•
|
On December 20, 2010, we announced we had reached agreement with the FDA on a Special Protocol Assessment ("SPA") for Macrilen™ (macimorelin), enabling us to complete the ongoing registration study required to gain approval for use in evaluating AGHD. The first part of the study, conducted by our former licensee, Ardana, was a two-way cross-over study and included 43 patients with confirmed AGHD or multiple pituitary hormone deficiencies and a low IGF-1. A control group of ten subjects without AGHD was matched to patients for age, gender, body mass index and (for females) estrogen status.
|
|
•
|
On July 26, 2011, we announced the completion of the Phase 3 study of Macrilen™ (macimorelin) as a first oral product for use in evaluating AGHD and the decision to meet with the FDA for the future filing of an NDA for the registration of Macrilen™ (macimorelin) in the United States.
|
|
•
|
On June 26, 2012, we announced that the final results from a Phase 3 trial for Macrilen™ (macimorelin) showed that the drug is safe and effective in evaluating AGHD. Jose M. Garcia, MD, PhD, then of the Baylor College of Medicine and the Michael E. DeBakey VA Medical Center, disclosed these data during an oral presentation at the 94th ENDO Annual Meeting and Expo in Houston, Texas. The study had originally been designed as a cross-over trial of Macrilen™ (macimorelin) compared to the GHRH + ARG test in AGHD patients and in controls matched for body mass index ("BMI"), estrogen status, gender and age. After 43 AGHD patients and ten controls had been tested, the GHRH + ARG test became unavailable because the competitor's compound was withdrawn from the market. The study was completed by testing ten more AGHD patients and 38 controls with Macrilen™ (macimorelin) alone. Of the 53 AGHD subjects enrolled, 52 received Macrilen™ (macimorelin), and 50 who had confirmed AGHD prior to study entry were included in this analysis, along with 48 controls. Two AGHD subjects could not be matched due to the combination of young age, high BMI and estrogen use. The objective of this clinical trial was to determine the efficacy and safety of Macrilen™ (macimorelin) in the evaluation of AGHD. Mean peak growth hormone ("GH") levels in AGHD patients and controls following Macrilen™ (macimorelin) administration were 2.36ng/mL (range 0.03-33) and 17.71ng/mL (range 10.5-94), respectively. The ROC plot analysis yielded an optimal GH cut-point of 2.7ng/mL, with 82% sensitivity, 92% specificity and a 13% misclassification rate. Obesity (BMI>30) was present in 58% of cases and controls, and peak GH levels were inversely associated with BMI in controls. Adverse events ("AE") were seen in 37% of AGHD patients and in 21% of controls following Macrilen™ (macimorelin). In contrast, 61% of AGHD subjects and 30% of controls experienced AEs with L ARG+GHRH. The most common AEs after Macrilen™ (macimorelin) were unpleasant taste (19.2%) and diarrhea (3.8%) for the AGHD patients and unpleasant taste (4.2%) and diarrhea (4.2%) for the matched controls. No clinically meaningful changes from baseline in ECG results during the study for AGHD patients were observed; however, one control subject had an ECG change (T wave abnormality and QTc interval prolongation) one hour after treatment with Macrilen™ (macimorelin) that was considered a serious treatment-related adverse event and resolved spontaneously within 24 hours. The subject had been pre-treated with citalopram, a drug that was later reported by the FDA to be associated with QT prolongation, although the patient had stopped this medication seven days prior to dosing. In an expert statement of January 9, 2015, Prof. Dr. W. Haverkamp, Centrum Herz-, Kreislauf- und Gefäßmedizin, Charité, Berlin, considered the observed QT prolongation to be not related to Macrilen™ (macimorelin). Overall, this study demonstrated that Macrilen™ (macimorelin) is safe and effective for use in evaluating AGHD.
|
|
•
|
In November 2013, we filed an NDA for Macrilen™ (macimorelin) for the evaluation of AGHD by evaluating the pituitary gland secretion of growth hormone in response to an oral dose of the product. The FDA accepted the NDA for substantive review in January 2014. On November 6, 2014, the FDA informed us, by issuing a Complete Response Letter ("CRL"), that it had determined that our NDA could not be approved in its then present form. The CRL stated that the planned analysis of our pivotal trial did not meet its stated primary efficacy objective as agreed to in the SPA. The CRL further mentioned issues related to the lack of complete and verifiable source data for determining whether patients were accurately diagnosed with AGHD. The FDA concluded that, "in light of the failed primary analysis and data deficiencies noted, the clinical trial does not by itself support the indication." To address the deficiencies identified above, the CRL stated that we needed to demonstrate the efficacy of Macrilen™ (macimorelin) as a diagnostic test for GHD in a new, confirmatory clinical study. The CRL also stated that a serious event of electrocardiogram QT interval prolongation occurred for which attribution to drug could not be excluded. Therefore, a dedicated thorough QT study to evaluate the effect of macimorelin on the QT interval would be necessary.
|
|
•
|
Following receipt of the CRL, we assembled a panel of experts in the field of growth-hormone deficiency, including experts in the field from both the United States and the EU. The panel met on January 8, 2015, during which we discussed our conclusions from the CRL, as well as the potential design of a new pivotal study. The panel advised us to continue to seek approval for Macrilen™ (macimorelin) because of their confidence in its efficacy and because there currently is no FDA-approved diagnostic test for AGHD. In parallel, we collected information on timelines and costs for such a study.
|
26
|
•
|
During an end-of-review meeting with the FDA on March 6, 2015, we agreed with the FDA on the general design of the confirmatory Phase 3 study of Macrilen™ (macimorelin) for the evaluation of AGHD, as well as evaluation criteria. We agreed with the FDA that the confirmatory study will be conducted as a two-way crossover with the ITT as the benchmark comparator.
|
|
•
|
On April 13, 2015, we announced plans to conduct a new, confirmatory Phase 3 clinical study to demonstrate the efficacy of Macrilen™ (macimorelin) for the evaluation of AGHD, as well as a dedicated thorough QT study to evaluate the effect of Macrilen™ (macimorelin) on myocardial repolarization. The confirmatory Phase 3 clinical study of Macrilen™ (macimorelin), entitled "Confirmatory validation of oral macimorelin as a growth hormone (GH) stimulation test (ST) for the diagnosis of AGHD in comparison with the insulin tolerance test (ITT)", was designed as a two-way crossover study with the ITT as the benchmark comparator and involved 31 sites in the United States and Europe. The study population was planned to include at least 110 subjects (at least 55 ITT-positive and 55 ITT-negative) with a medical history documenting risk factors for AGHD, and was planned to include a spectrum of subjects from those with a low risk of having AGHD to those with a high risk of having the condition.
|
|
•
|
On May 26, 2015, we announced that we had received written scientific advice from the EMA regarding the further development plan, including the study design, for the new confirmatory Phase 3 clinical study of Macrilen™ (macimorelin) for use in evaluating AGHD. As a result of the advice, we believe that the confirmatory Phase 3 study that was agreed with the FDA meets the EMA's study-design expectations as well, allowing for U.S. and European approval, if the study is successful.
|
|
•
|
On November 19, 2015, we announced the enrollment of the first patient in the confirmatory Phase 3 clinical study of Macrilen™ (macimorelin).
|
|
•
|
On October 26, 2016, we announced completion of patient recruitment for the confirmatory Phase 3 clinical trial of Macrilen™ (macimorelin) as a growth hormone stimulation test for the evaluation of AGHD.
|
|
•
|
The dedicated thorough QT study to evaluate the effect of macimorelin on the QT interval, as requested by the FDA in the CRL, was conducted and completed in 2016.
|
|
•
|
On January 4, 2017, we announced that, based on an analysis of top-line data, the confirmatory Phase 3 clinical trial of Macrilen™ (macimorelin) failed to achieve one of its co-primary endpoints. Under the study protocol, the evaluation of AGHD with Macrilen™ (macimorelin) would be considered successful, if the lower bound of the two-sided 95% confidence interval for the primary efficacy variables was 75% or higher for "percent negative agreement" with the ITT, and 70% or higher for the "percent positive agreement" with the ITT. While the estimated percent negative agreement met the success criteria, the estimated percent positive agreement did not reach the criteria for a successful outcome. Therefore, the results did not meet the pre-defined equivalence criteria which required success for both the percent negative agreement and the percent positive agreement.
|
|
•
|
On February 13,
2017, we announced that, after reviewing the raw data on which the top-line data were based, we had concluded that Macrilen™ (macimorelin) had demonstrated performance supportive of achieving FDA registration and that we intended to pursue registration. The announcement set forth the facts on which our conclusion was based. The Company met with the FDA at the end of March 2017 to discuss this position.
|
|
•
|
On March 7, 2017, we announced that the Pediatric Committee ("PDCO") EMA agreed to the Company's Pediatric Investigation Plan ("PIP") for Macrilen™ (macimorelin) and agreed that the Company may defer conducting the PIP until after it files a Marketing Authorization Application ("MAA") seeking marketing authorization for the use of Macrilen™ (macimorelin) for the evaluation of AGHD.
|
|
•
|
On July 18, 2017, we were provided a PDUFA date of December 30, 2017 by the FDA.
|
|
•
|
On November 27, 2017, the EMA accepted our MMA submission for Macrilen™ (macimorelin).
|
|
•
|
On December 20, 2017, the FDA approved the market authorization for Macrilen™ (macimorelin), to be used in the diagnosis of patients with adult growth hormone deficiency (AGHD).
|
|
•
|
On March 23, 2018, we received from the EMA a Day 120 List of Questions, which was issued in connection with our MMA submission for Macrilen™ (macimorelin). We are in the process of reviewing.
|
Zoptrex™
Zoptrex
TM
is a complex molecule that combines a synthetic peptide carrier with doxorubicin, a well-known chemotherapy agent. The synthetic peptide carrier is a luteinizing hormone-releasing hormone ("LHRH") agonist, a modified natural hormone with
27
affinity for the LHRH receptor. The design of the compound allows for the specific binding and selective uptake of the cytotoxic conjugate by LHRH receptor-positive tumors.
On January 30, 2017, we announced the completion of the clinical phase of the pivotal Phase 3 ZoptEC (Zoptarelin Doxorubicin in Endometrial Cancer) study with the occurrence of the 384th death.
On May 1, 2017, we announced that the ZoptEC pivotal Phase 3 clinical study of Zoptrex™ (zoptarelin doxorubicin) in women with locally advanced, recurrent or metastatic endometrial cancer did not achieve its primary endpoint of demonstrating a statistically significant increase in the median period of overall survival of patients treated with Zoptrex™ (zoptarelin doxorubicin) as compared to patients treated with doxorubicin. The results of the study are not supportive to pursue regulatory approval by the FDA. Based on this outcome, we do not anticipate conducting clinical trials of Zoptrex™ (zoptarelin doxorubicin) with respect to any other indications. We also discontinued the development of AEZS-138/Disorazol Z, as it was based on the same concept as Zoptrex™ (zoptarelin doxorubicin).
We have licensed the development, commercialization and certain other rights to Zoptrex™ to Sinopharm A-Think for China, Hong Kong and Macau; to an affiliate of Orient EuroPharma Co., Ltd. for Taiwan and southeast Asia; to Rafa Laboratories, Ltd for Israel and the Palestinian territories and to Specialised Therapeutics Asia Pte Ltd for Australia and New Zealand.
Overview of our Commercial Operations
Our commercial operations were significantly reduced in the fourth quarter of 2017. We eliminated our contract sales team in its entirety, as well as remaining sales management in November 2017, in accordance with the terms of our agreement with inVentiv Commercial Services, LLC, an affiliate of inVentiv Health, Inc. ("inVentiv"), a contract-sales organization. Our agreement with inVentiv commenced in November 2014.
Pursuant to termination of the inVentiv agreement, we ended our co-promotion with EMD Serono, Inc. ("EMD Serono") and Armune BioScience, Inc. ("Armune").
Until September 1, 2016, we co-promoted a product, EstroGel®, and until termination of our sales team in November 2017, the inVentiv sales force promoted two products:
Saizen
®
[somatropin (rDNA origin) for injection] is a prescription medicine indicated for the treatment of growth hormone deficiency in children and adults. We promoted Saizen
®
pursuant to our promotional services agreement (the “EMD Serono Agreement”) with EMD Serono Inc. (“EMD Serono”), which we entered into in May 2015 and amended as of December 31, 2016. The EMD Serono Agreement, as amended, provided that we were to promote Saizen
®
in specific agreed-upon U.S. territories to adult and pediatric endocrinologists in exchange for a sales commission that was based upon new patient starts of the product. The agreement was terminated in accordance with its terms in December 2017.
APIFINY
®
is the only cancer-specific, non-PSA blood test for the evaluation of the risk of prostate cancer. The test was developed by Armune BioScience, Inc. (“Armune”), a medical diagnostics company that develops and commercializes unique proprietary technology exclusively licensed from the University of Michigan for diagnostic and prognostic tests for cancer. We entered into a co-marketing agreement with Armune in November 2015 (the “Armune Agreement”), which was amended effective as of June 1, 2016, which allowed us to exclusively promote APIFINY
®
throughout the entire United States. We received a commission for each test performed resulting from our targeted promotion without regard to any established baseline. The Armune Agreement, as amended, had a three-year term that renewed automatically for successive one-year periods. The parties agreed in January 2018 that the Armune Agreement was terminated.
On December 20, 2017, we received FDA approval for Macrilen™ (macimorelin) indicated for the diagnosis of AGHD. Following a detailed review process undertaken by a committee of our independent directors, we entered into the Strongbridge License Agreement to carry out development, manufacturing, registration and commercialization of Macrilen™ (macimorelin) in the United States and Canada. We continue to explore various alternatives to monetizing rights to macimorelin in other countries around the globe, including whether to find other license partners in these jurisdictions or to use its internal resources to commercialize in certain of these countries.
Under the Strongbridge License Agreement, we received an upfront cash payment of $24,000,000, and, for as long as Macrilen™ (macimorelin) is patent-protected, we will be entitled to a 15% royalty on net sales up to $75,000,000 and an 18% royalty on net sales above $75,000,000. Following the end of patent protection in United States or Canada for Macrilen™ (macimorelin), we will be entitled to a 5% royalty on net sales in these countries. In addition, we also will receive one-time payments from Strongbridge following the first achievement of the following commercial milestone events:
|
•
|
$4,000,000 on achieving $25,000,000 annual net sales
|
28
|
•
|
$10,000,000 on achieving $50,000,000 annual net sales
|
|
•
|
$20,000,000 on achieving $100,000,000 annual net sales
|
|
•
|
$40,000,000 on achieving $200,000,000 annual net sales
|
|
•
|
$100,000,000 on achieving $500,000,000 annual net sales
|
Upon approval by the FDA of a pediatric indication for Macrilen™ (macimorelin), we will receive a one-time milestone payment of $5,000,000 from Strongbridge.
Strongbridge will fund 70% of the costs of a worldwide pediatric development program to be run by the Company with customary oversight from a joint steering committee. The joint steering committee will be comprised of four persons, two of whom will be appointed by each of Strongbridge and the Company.
A description of the principal geographic areas in which we compete, including a geographical and categorical breakdown of our revenues in the past three years is presented in note 23 (Segment information) to our consolidated financial statements included in this Annual Report on Form 20-F at Item 18.
Seasonality
As a specialty biopharmaceutical company, the Company does not consider any of its products or services to be seasonal.
Raw Materials
Raw materials and supplies are generally available in quantities adequate to meet the needs of our business. We will be dependent on third-party manufacturers for the pharmaceutical products that we will market. An interruption in the availability of certain raw materials or ingredients, or significant increases in the prices paid by us for them, could have a material adverse effect on our business, financial condition, liquidity and operating results.
Regulation of Drug Development
Generally.
Governmental authorities in the United States, Canada, Europe and other countries extensively regulate the preclinical and clinical testing, manufacturing, labeling, storage, record keeping, advertising, promotion, export, marketing and distribution, among other things, of pharmaceuticals. Under the laws of the United States, the countries of the EU, and other countries, we are subject to obligations to ensure that our clinical trials are conducted in accordance with Good Clinical Practices ("GCP") guidelines and the investigational plan and protocols contained in an Investigational New Drug ("IND") application, or comparable foreign regulatory submission. Set forth below is a brief summary of the material governmental regulations affecting us in the major markets in which we intend to market our products and/or promote products that we acquire or in-license or to which we obtain promotional rights.
The United States.
In the United States, the FDA's Center for Drug Evaluation and Research (CDER) under the Federal Food, Drug and Cosmetic Act of 1938, as amended (the "FDCA"), the Public Health Service Act and other federal statutes and regulations, subjects pharmaceutical products to rigorous review. In order to market and sell a new drug product in the United States, we must first test it and send CDER evidence from these tests to prove that the drug is safe and effective for its intended use. In most cases, these tests include extensive preclinical, clinical, and laboratory tests. A team of CDER physicians, statisticians, chemists, pharmacologists, and other scientists reviews the company's data and proposed labeling. If this independent and unbiased review establishes that a drug's health benefits outweigh its known risks, the drug is approved for sale. CDER does not test the drug itself but it does conduct limited research in the areas of drug quality, safety, and effectiveness standards. Before approving a new drug or marketing application, the FDA may conduct pre-approval inspections of the developer of the drug (the "sponsor"), its CROs and/or its clinical trial sites to ensure that clinical, safety, quality control, and other regulated activities are compliant with GCP, or Good Laboratory Practices ("GLP"), for specific non-clinical toxicology studies. Manufacturing facilities used to produce a product are also subject to ongoing inspection by the FDA. The FDA may also require confirmatory trials, post-marketing testing, and/or extra surveillance to monitor the effects of approved products, or place conditions on any approvals that could restrict the commercial applications of a product. Once approved, the labeling, advertising, promotion, marketing, and distribution of a drug or biologic product must be in compliance with FDA regulatory requirements.
The first stage required for ultimate FDA approval of a new biologic or drug involves completion of preclinical studies whereby a sponsor must test new drugs on animals for toxicity. Multiple species are used to gather basic information on the safety and efficacy of the compound being investigated and/or researched. The FDA regulates preclinical studies under a series of regulations called the current GLP regulations as well as regulatory requirements found in Part 21 subchapter D of the Code of Federal Regulations. If the sponsor violates these regulations, the FDA may require that the sponsor replicate those studies or can subject
29
the sponsor to enforcement actions or penalties as described further below. The sponsor then submits to the FDA an IND application based on the results from initial testing that include the drug's composition and manufacturing, along with a plan for testing the drug on humans. The FDA reviews the IND to ensure that the proposed studies (clinical trials) do not place human subjects at unreasonable risk of harm. FDA also verifies that there are adequate informed consent and human subject protections in place.
After a sponsor submits an IND application, it must wait 30 days before starting a clinical trial to allow FDA time to review the prospective study. If FDA finds a problem, it can order a clinical hold to delay an investigation, or interrupt a clinical trial if problems occur during the study. After the IND application is in effect, a sponsor may commence human clinical trials. The sponsor typically conducts human clinical trials in three sequential phases, but the phases may overlap. In Phase 1 trials, the sponsor tests the product in a small number of patients or healthy volunteers (typically 20-80 healthy volunteers), primarily for safety at one or more doses. The goal in this phase is to determine what the drug's most frequent side effects are and, often, how the drug is metabolized and excreted. Phase 2 studies begin if Phase 1 studies do not reveal unacceptable toxicity. In Phase 2, in addition to safety, the sponsor evaluates the efficacy of the product in a patient population somewhat larger than Phase 1 trials. The number of subjects in Phase 2 studies typically ranges from a few dozen to about 300. This phase aims to obtain preliminary data on whether a drug works in people who have a certain disease or condition. At the end of Phase 2, the FDA and sponsor try to come to an agreement on how large-scale studies in Phase 3 should be done.
Phase 3 studies begin if evidence of effectiveness is shown in Phase 2. Phase 3 trials typically involve additional testing for safety and clinical efficacy in an expanded population at geographically dispersed test sites. The sponsor must submit to the FDA a clinical plan, or "protocol", accompanied by the approval of the institutions participating in the trials, prior to commencement of each clinical trial. The FDA may order the temporary or permanent discontinuation of a clinical trial at any time. In the case of product candidates for cancer, the initial human testing may be done in patients with the disease rather than in healthy volunteers. Because these patients are already afflicted with the target disease, such studies may provide results traditionally obtained in Phase 2 studies. Accordingly, these studies are often referred to as "Phase 1/2" studies as they combine two phases. Even if patients participate in initial human testing and a Phase 1/2 study is carried out, the sponsor is still responsible for obtaining all the data usually obtained in both Phase 1 and Phase 2 studies.
The sponsor must submit to the FDA the results of the preclinical and clinical testing, together with, among other things, detailed information on the manufacture and composition of the product, in the form of a New Drug Application ("NDA") or, in the case of a biologic, a Biologics License Applications ("BLA"). In a process that can take a year or more, the FDA reviews this application and, when and if it decides that adequate data are available to show that the new compound is both safe and effective for a particular indication and that other applicable requirements have been met, approves the drug or biologic for marketing. The amount of time taken for this approval process is a function of a number of variables, including the quality of the submission and studies presented and the potential contribution that the compound will make in improving the treatment of the disease in question.
Orphan-drug designation is granted by the FDA Office of Orphan Drug Products to novel drugs or biologics that are intended for the safe and effective treatment, diagnosis or prevention of rare diseases or disorders that affect fewer than 200,000 people in the U.S., or that affect more than 200,000 people but are not expected to recover the costs of developing and marketing a treatment drug. The designation provides the sponsor with a seven-year period of U.S. marketing exclusivity if the drug is the first of its type approved for the specified indication or if it demonstrates superior safety, efficacy or a major contribution to patient care versus another drug of its type previously granted the designation for the same indication. We have been granted orphan drug designations for Macrilen™ (macimorelin) for the evaluation of growth hormone deficiency.
Under the Drug Price Competition and Patent Term Restoration Act of 1984 (the "Hatch-Waxman Act"), newly-approved drugs and indications may benefit from a statutory period of non-patent data exclusivity. The Hatch-Waxman Act provides five-year data exclusivity to the first applicant to gain approval of an NDA for a new chemical entity, or NCE, meaning that the FDA has not previously approved any other drug containing the same active pharmaceutical ingredient, or active moiety. Although protection under the Hatch-Waxman Act will not prevent the submission or approval of another full NDA, such an NDA applicant would be required to conduct its own preclinical and adequate, well-controlled clinical trials to demonstrate safety and effectiveness.
The Hatch-Waxman Act also provides three years of data exclusivity for the approval of new and supplemental NDAs, including Section 505(b)(2) applications, for, among other things, new indications, dosage forms, routes of administration, or strengths of an existing drug, or for a new use, if new clinical investigations that were conducted or sponsored by the sponsor are determined by the FDA to be essential to the approval of the application. This exclusivity, which is sometimes referred to as clinical investigation exclusivity, would not prevent the approval of another application if the sponsor has conducted its own adequate, well-controlled clinical trials demonstrating safety and efficacy, nor would it prevent approval of a generic product that did not incorporate the exclusivity-protected changes of the approved drug product.
30
The labeling, advertising, promotion, marketing, and distribution of a drug or biologic product must be in compliance with FDA regulatory requirements. Failure to comply with applicable requirements can lead to the FDA demanding that production and shipment cease and, in some cases, that the manufacturer recall products, or to enforcement actions that can include seizures, injunctions, and criminal prosecution. These failures can also lead to FDA withdrawal of approval to market a product.
Canada.
In Canada, the Therapeutic Products Directorate of Health Canada is the Canadian federal authority that regulates pharmaceutical drugs and medical devices for human use. Prior to being given market authorization, a sponsor must present substantive scientific evidence of a product's safety, efficacy and quality as required by the Food and Drugs Act and other legislation and regulations. The requirements for the development and sale of pharmaceutical drugs in Canada are substantially similar to those in the United States, which are described above.
The European Union.
Medicines can be authorized in the EU by using either the centralized authorization procedure or national authorization procedures. The EU has implemented a centralized procedure coordinated by the EMA for the approval of human medicines, which results in a single marketing authorization issued by the European Commission that is valid across the EU, as well as Iceland, Liechtenstein and Norway. The centralized procedure is compulsory for human medicines that are derived from biotechnology processes, such as genetic engineering, that contain a new active substance indicated for the treatment of certain diseases, such as HIV/AIDS, cancer, diabetes, neurodegenerative disorders or autoimmune diseases and other immune dysfunctions, and designated orphan medicines. For medicines that do not fall within these categories, an applicant has the option of submitting an application for a centralized marketing authorization to the EMA, as long as the medicine concerned is a significant therapeutic, scientific or technical innovation, or if its authorization would be in the interest of public health.
There are also two other possible routes to authorize medicinal products in several EU countries, which are available for investigational drug products that fall outside the scope of the centralized procedure:
•
Decentralized procedure.
Using the decentralized procedure, a sponsor may apply for simultaneous authorization in more than one EU country of medicinal products that have not yet been authorized in any EU country and that do not fall within the mandatory scope of the centralized procedure. The application will be reviewed by a selected Reference Member State ("RMS"). The Marketing Authorization granted by the RMS will then be recognized by the other Member States involved in this procedure.
•
Mutual recognition procedure.
In the mutual recognition procedure, a medicine is first authorized in one EU Member State, in accordance with the national procedures of that country. Following this, further marketing authorizations can be sought from other EU countries in a procedure whereby the countries concerned agree to recognize the validity of the original, national marketing authorization.
Regulation of Commercial Operations
The marketing, promotional, and pricing practices of human pharmaceutical manufacturers, as well as the manner in which manufacturers interact with purchasers and prescribers, are subject to various U.S. federal and state laws, including the federal anti-kickback statute and the False Claims Act and state laws governing kickbacks, false claims, unfair trade practices, and consumer protection, and to similar laws in other countries. In the U.S., these laws are administered by, among others, the Department of Justice ("DOJ"), the Office of Inspector General of the Department of Health and Human Services, the Federal Trade Commission, the Office of Personnel Management, and state attorneys general. Over the past several years, the FDA, the DOJ, and many other agencies have increased their enforcement activities with respect to pharmaceutical companies and increased the inter-agency coordination of enforcement activities.
In the U. S., biopharmaceutical and medical device manufacturers are required to record any transfers of value made to licensed physicians and teaching hospitals and to disclose such data to the Department of Health and Human Services ("HHS"). In addition to civil penalties for failure to report transfers of value to physicians or teaching hospitals, there will be criminal penalties if a manufacturer intentionally makes false statements or excludes information in such reports. The payment data across biopharmaceutical and medical device companies is posted by HHS on a publicly available website. Increased access to such data by fraud and abuse investigators, industry critics and media will draw attention to our collaborations with reported entities and will importantly provide opportunities to underscore the critical nature of our collaborations for developing new medicines and exchanging scientific information. This national payment transparency effort coupled with industry commitment to uphold voluntary codes of conduct (such as the PhRMA Code on Interactions with Healthcare Professionals and PhRMA Guiding Principles Direct to Consumer Advertisements About Prescription Medicines) and rigorous internal training and compliance efforts will complement existing laws and regulations to help ensure ethical collaboration and truthful product communications.
The Canadian association of Research-Based Pharmaceutical Companies ("Rx & D") has adopted "Guidelines for Transparency in Stakeholder Funding" that require member companies to regularly disclose, by means of the web sites and annual reports, a list of all stakeholders to which they provide direct funding. The term "stakeholder" is defined in Rx & D's Code of Ethical Practices to include "Health Care Professionals". In the EU, the disclosure code of transfers of value to healthcare professionals
31
and organizations adopted by the European Federation of Pharmaceutical Industries and Associations ("EFPIA") requires all members of EFPIA to disclose transfers of value to healthcare professionals and healthcare organizations beginning in 2016, covering the relevant transfers in 2015. Each member company will be required to document and disclose: (i) the names of healthcare professionals and associations that have received payments or other transfers of value and (ii) the amounts or value transferred, and the type of relationship.
For more information about the regulatory risks associated with our business operations, see "Item 3D. Risk Factors".
Intellectual Property - Patents
We seek to protect our compounds, manufacturing processes, compositions and methods of medical use for our lead drugs and drug candidates through a combination of patents, trade secrets and know-how. Our patent portfolio consists of approximately 12 owned and in-licensed patent families (issued, granted or pending in the United States, Europe and other jurisdictions). The patent positions of companies in the biotechnology and pharmaceutical industries are highly uncertain and involve complex legal and factual questions. Therefore, we cannot predict the breadth of claims, if any, that may be allowed under any of our patent applications, or the enforceability of any of our allowed patents. See "Item 3.D. Risk Factors - We may not obtain adequate protection for our products through our intellectual property."
Patents extend for varying periods according to the date of patent filing or grant and the legal term of patents in the various countries where patent protection is obtained. The actual protection afforded by a patent, which can vary from country to country, depends on the type of patent, the scope of its coverage and the availability of legal remedies in the country. In the United States, the patent term of a patent that covers an FDA-approved drug may also be eligible for patent term extension, which permits patent term restoration as compensation for the patent term lost during the FDA regulatory review process. The Hatch-Waxman Act permits a patent term extension of up to five years beyond the expiration of the patent, in which the patentee may file an application for yearly interim extensions within five years if the patent will expire and the FDA has not yet approved the NDA. The length of the patent term extension is related to the length of time the drug is under regulatory review. Patent extension cannot extend the remaining term of a patent beyond a total of 14 years from the date of product approval and only one patent applicable to an approved drug may be extended.
Similar provisions are available in Europe and other foreign jurisdictions to extend the term of a patent that covers an approved drug. In these jurisdictions, however, no interim extensions exist and the marketing approval must be granted before the patent expires. In the future, if and when our pharmaceutical products receive FDA approval, we expect to apply for patent term extensions on patents covering those products. While we anticipate that any such applications for patent term extensions will likely be granted, we cannot predict the precise length of time for which such patent terms would be extended in the United States, Europe or other jurisdictions. If we are not able to secure patent term extensions on patents covering our products for meaningful periods of additional time, we may not achieve or sustain profitability, which would adversely affect our business.
In addition to patent protection, our products may benefit from the market-exclusivity provisions contained in the orphan-drug regulations or the pediatric-exclusivity provisions or other provisions of the FDA Act, such as new chemical entity exclusivity or new formulation exclusivity. Orphan drug regulations provide incentives to pharmaceutical and biotechnology companies to develop and manufacture drugs for the treatment of rare diseases, currently defined as diseases that exist in fewer than 200,000 individuals in the U.S., or diseases that affect more than 200,000 individuals in the U.S. but that the sponsor does not realistically anticipate will generate a net profit. Under these provisions, a manufacturer of a designated orphan drug can seek tax benefits, and the holder of the first FDA approval of a designated orphan product will be granted a seven-year period of marketing exclusivity for such FDA-approved orphan product. In the U.S., the FDA has the authority to grant additional data protection for approved drugs where the sponsor conducts specified testing in pediatric or adolescent populations. If granted, this pediatric exclusivity provides an additional six months which are added to the term of data protection as well as to the term of any relevant patents, to the extent these protections have not already expired. We may also seek to utilize market exclusivities in other territories, such as in the EU. There can be no assurance that any of our drug candidates will obtain such orphan drug designation, pediatric exclusivity, new chemical entity exclusivity or any other market exclusivity in the U.S., the EU or any other territory, or that we will be the first to receive the regulatory approval in a given country or territory for such drugs so as to be eligible for any market exclusivity protection.
Zoptrex™
We have licensed the intellectual property and associated rights relating to LHRH agonists and LH-RH antagonists carrying various cytotoxic radicals (including zoptarelin doxorubicin) from the Administrators of the Tulane Educational Fund ("Tulane") pursuant to a license agreement dated September 17, 2002 between Tulane, as licensor, and AEZS GmbH, as licensee (the "Tulane Agreement"). The Tulane Agreement grants to us an exclusive worldwide license for all therapeutic uses of LH-RH agonists and LH-RH antagonists carrying various cytotoxic radicals, to the extent covered by one of the patents listed below. The term of the Tulane Agreement continues for ten years after the first commercial sale of a product based on the licensed intellectual property
32
(a "Licensed Product") or until the expiration of the last to expire of the patents listed below, whichever is longer, on a country-by- country basis.
Pursuant to the Tulane Agreement, we are required to pay Tulane the following amounts: (i) $400,000 upon the first grant of regulatory approval for a Licensed Product in the U.S., Canada, the EU or Japan; (ii) 10% of all consideration received by us from a sublicensee for authorization to use the licensed intellectual property to develop, manufacture, market, distribute and sell a Licensed Product; (iii) 2.5% of our net sales of Licensed Products; and (iv) 50% of any royalties that we receive from a sublicensee with respect to its net sales of Licensed Products; provided, however, that the payment with respect to royalties received from a sublicensee shall not be less than 1.75% nor more than 2.5% of the sublicensee's net sales of the Licensed Product.
The following patents are covered by the Tulane Agreement:
|
•
|
U.S. patent 5,843,903 covers zoptarelin doxorubicin and other related targeted cytotoxic anthracycline analogs, pharmaceutical compositions comprising the compounds as well as their medical use for the treatment of tumors. This patent expired in November 2015.
|
|
•
|
European patent 0 863 917 B1 covers zoptarelin doxorubicin and other related targeted cytotoxic anthracycline analogs, pharmaceutical compositions comprising the compounds as well as their medical use for the treatment of tumors. This patent expired in November 2016.
|
|
•
|
Japanese patent 3 987 575 covers zoptarelin doxorubicin and other related targeted cytotoxic anthracycline analogs, pharmaceutical compositions comprising the compounds as well as their medical use for the treatment of tumors. This patent expired in November 2016.
|
|
•
|
Chinese patent ZL96198605.0 covers zoptarelin doxorubicin and other related targeted cytotoxic anthracycline analogs, pharmaceutical compositions comprising the compounds as well as their medical use for the treatment of tumors. This patent expired in November 2016.
|
|
•
|
Hong Kong patent 1017363 covers zoptarelin doxorubicin and other related targeted cytotoxic anthracycline analogs, pharmaceutical compositions comprising the compounds as well as their medical use for the treatment of tumors. This patent expired in November 2016.
|
In early 2015, we filed a European patent application directed to a novel method of manufacturing Zoptrex™. Within the 12 months priority period, we also filed an international patent application for the manufacturing process, as well as national patent applications in selected countries, including the U.S., China, and Taiwan, Japan and India. We decided to file patent applications in additional territories after the European Patent Office issued a search report for the European patent application that we consider to be favorable. The claimed manufacturing process is expected to result in a significant reduction in our cost of manufacturing Zoptrex™, providing us with what should be a stronger competitive position and discouraging competition from generic manufacturers after our five-year period of data exclusivity expires.
Macrilen™ (macimorelin)
:
We hold the worldwide rights to macimorelin pursuant to an exclusive license agreement with the French Centre National de la Recherche Scientifique, as licensor, and AEZS GmbH, as licensee.
The following patents relate to Macrilen™ (macimorelin):
|
•
|
U.S. patent 6,861,409 covers Macrilen™ (macimorelin) and U.S. patent 7,297,681 covers other related growth hormone secretagogue compounds, each also covering pharmaceutical compositions comprising the compounds as well as their medical use for elevating the plasma level of growth hormone. U.S. patent 6,861,409 and U.S. patent 7,297,681 both expire in August 2022.
|
|
•
|
European patent 1 289 951 covers Macrilen™ (macimorelin) and European patent 1 344 773 covers other related growth hormone secretagogue compounds, pharmaceutical compositions comprising the compounds as well as their medical use for elevating the plasma level of growth hormone. EP patent 1 289 951 and EP patent 1 344 773 both expire in June 2021.
|
|
•
|
Japanese patent 3 522 265 covers Macrilen™ (macimorelin) and pharmaceutical compositions comprising the compounds as well as their medical use for elevating the plasma level of growth hormone. This patent expires in June 2021.
|
|
•
|
Canadian patent 2,407,659 covers Macrilen™ (macimorelin) and pharmaceutical compositions comprising the compounds as well as their medical use for elevating the plasma level of growth hormone. This patent expires in June 2021.
|
|
•
|
U.S. patent 8,192,719 covers a method of assessing pituitary-related growth hormone deficiency in a human or animal subject
|
33
comprising an oral administration of the compound Macrilen™ (macimorelin) and determination of the level of growth hormone in the sample and assessing whether the level of growth hormone in the sample is indicative of growth hormone deficiency. This patent expires in October 2027.
|
•
|
European patent 1 984 744 covers a method of assessing pituitary-related growth hormone deficiency by oral administration of Macrilen™ (macimorelin). This patent expires in February 2027.
|
|
•
|
Japanese patent 4 852 728 covers a method of assessing pituitary-related growth hormone deficiency by oral administration of Macrilen™ (macimorelin). This patent expires in February 2027.
|
Disorazol Z - LHRH conjugates (AEZS-138)
:
We own a number of patents that relate to our Disorazol Z - LHRH conjugates, as follows:
|
•
|
U.S. patent 7,741,277 covers AEZS-138 (disorazol Z - LHRH conjugate). This patent expires in January 2028 (including PTA).
|
|
•
|
U.S. patent 8,470,776 covers methods of treatment for compound AEZS-138 (disorazol Z - LHRH conjugate). This patent expires in February 2029 (including PTA).
|
|
•
|
European patent application 2,066,679 covers AEZS-138 (disorazol Z - LHRH conjugate) as well as methods of treatment for this compound. If granted, this patent will expire in September 2027.
|
|
•
|
Japanese patent 5,340,155 covers AEZS-138 (disorazol Z - LHRH conjugate) as well as methods of treatment for this compound. This patent expires in September 2027.
|
|
C.
|
Organizational structure
|
Our corporate structure, the jurisdiction of incorporation of our direct and indirect subsidiaries and the percentage of shares that we held in those subsidiaries as at
December 31, 2017
is depicted in the chart set forth under the caption "Item 4.A. History and development of the Company".
34
|
D.
|
Property, plants and equipment
|
Our registered address is located in Montreal, Canada. Our corporate head office is located in Summerville, South Carolina, which is a suburb of Charleston, South Carolina. We do not own any real property. The following table sets forth information with respect to our main facilities as at
December 31, 2017
.
|
Location
|
Use of space
|
Square Footage
|
Type of interest
|
||||
|
315 Sigma Drive, Summerville SC 29486
|
Partially occupied for management, administration, commercial operations and business development
|
300
|
|
Leasehold
|
|||
|
Weismüllerstr. 50
D-60314
Frankfurt-am-Main, Germany
|
Occupied for management, R&D, business development and administration
|
36,168
|
|
Leasehold
|
|||
We believe that our current facilities are adequate to meet our ongoing needs and that, if we require additional space, we will be able to obtain additional facilities on commercially reasonable terms.
|
Item 4A
|
Unresolved Staff Comments
|
None.
|
Item 5.
|
Operating and Financial Review and Prospects
|
Key Developments
Macrilen™ (macimorelin), a ghrelin receptor agonist, is a novel orally-active small molecule that stimulates the secretion of growth hormone. Macrilen™ (macimorelin) has been granted orphan drug designation by the FDA for the evaluation of growth hormone deficiency. We own the worldwide rights to this novel patented compound. Macrilen™ (macimorelin) is our proposed trade name for macimorelin. The proposed trade name was conditionally approved by the FDA. On December 16, 2016, we were advised by the EMA that Macrilen™ was rejected as the proposed invented name for macimorelin because of its similarity to the names of other medicines. On March 8, 2018, we applied for two new invented names for macimorelin: Macrilen ST and Macrilen GHST; however, we are also evaluating alternative names given recent feedback received from the EMA.
In late 2016, we concluded a confirmatory Phase 3 clinical trial of Macrilen™ (macimorelin) for the evaluation of growth hormone deficiency in adults AGHD. The confirmatory trial was an open-label, randomized, two-way crossover study that compared the results of the evaluation of AGHD using Macrilen™ (macimorelin) to the results of the evaluation of AGHD using a procedure known as the "Insulin Tolerance Test" (the "ITT") on the same patients. The trial involved patients, each of whom was evaluated for AGHD using both Macrilen™(macimorelin) and the ITT. Thirty of the patients were evaluated using Macrilen™(macimorelin) a second time to measure the repeatability of the result obtained using Macrilen™ (macimorelin) as the evaluation method. The study population consisted of more than 110 patients who were suspected of having AGHD as a result of the presence of one or more symptoms. This segment of the population included a range of patients from those considered at low risk of having AGHD to those considered at high risk. The study population also included 25 healthy subjects, who had no risk of having AGHD.
On January 4, 2017, we announced that the confirmatory Phase 3 clinical trial of Macrilen™(macimorelin) failed to achieve its objective of validating a single oral dose of Macrilen™ (macimorelin) for the evaluation of AGHD, using the ITT as a comparator. Based on an analysis of top-line data, Macrilen™ (macimorelin) did not achieve equivalence to the ITT as a means of diagnosing AGHD. Under the study protocol, the evaluation of AGHD with Macrilen™ (macimorelin) would have been considered successful if the lower bound of the two-sided 95% confidence interval for the primary efficacy variables was 75% or higher for "percent negative agreement" with the ITT, and 70% or higher for the "percent positive agreement" with the ITT. While the estimated percent negative agreement met the success criteria, the estimated percent positive agreement did not reach the criteria for a successful outcome. Therefore, the results did not meet the pre-defined equivalence criteria which required success for both the percent negative agreement and the percent positive agreement.
On February 13, 2017, we announced that, following a comprehensive review of the data obtained from the confirmatory Phase 3 clinical trial of Macrilen™(macimorelin) for the evaluation of AGHD using the ITT as a comparator, we concluded that Macrilen™(macimorelin) demonstrated performance supportive of FDA registration consideration.
35
On March 7, 2017, we announced that the Pediatric Committee of the EMA agreed to our Pediatric Investigation Plan ("PIP") for Macrilen™
(macimorelin) and agreed that we may defer conducting the PIP until after we file an MAA seeking marketing authorization for the use of Macrilen™
(macimorelin) for the evaluation of AGHD.
On March 30, 2017, we announced that, following our meeting with the FDA on March 29, 2017, we intended to file an NDA seeking approval of Macrilen
TM
(macimorelin) for the evaluation of AGHD. The announcement also indicated that during our meeting with the FDA, the FDA stated that the clinical studies performed with respect to Macrilen
TM
(macimorelin) address the prior deficiencies mentioned in the November 5, 2014 complete response letter and that this conclusion paved the way for re-submission by us of an NDA for Macrilen
TM
(macimorelin). While indicating that the conclusions regarding the performance of Macrilen
TM
(macimorelin) are review issues subject to an examination of the complete data set, the FDA indicated that the summary data submitted by us prior to the meeting appear to support the propositions advanced by us. Most importantly, the FDA specified the additional statistical analysis of existing data that would be required to further support our conclusions.
On June 30, 2017, we announced that we had resubmitted an NDA to the FDA seeking approval of Macrilen
TM
(macimorelin).
On July 18, 2017, we announced that we had been notified by the FDA that our NDA seeking approval of Macrilen
TM
(macimorelin) for the evaluation of AGHD had been accepted as a complete response to the FDA's November 5, 2014 complete response letter and granted a PDUFA date of December 30, 2017.
On November 27, 2017, we announced that the MAA for the use of Macrilen
TM
(macimorelin) for the evaluation of AGHD has been accepted by the EMA for regulatory review. The start of the EMA review procedure for the MAA has been confirmed by EMA as November 23, 2017.
On December 20, 2017, we announced that the FDA granted marketing approval for Macrilen
TM
(macimorelin) to be used in the diagnosis of patients with AGHD. On January 17, 2018, we announced that through AEZS Germany, we entered into the Strongbridge License Agreement to carry out development, manufacturing, registration and commercialization of Macrilen™ (macimorelin) in the United States and Canada. We continue to explore various alternatives to monetize our rights to Macimorelin in other countries around the globe.
36
Outsourcing and Out-Licensing Non-Strategic Activities/Assets
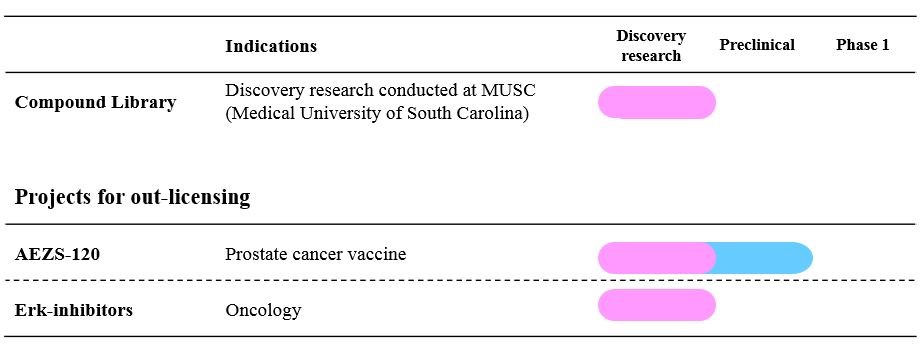
Zoptrex™
On May 1, 2017, we announced that the ZoptEC pivotal Phase 3 clinical study of Zoptrex™ (zoptarelin doxorubicin) in women with locally advanced, recurrent or metastatic endometrial cancer did not achieve its primary endpoint of demonstrating a statistically significant increase in the median period of overall survival of patients treated with Zoptrex™ (zoptarelin doxorubicin) as compared to patients treated with doxorubicin. The results of the study are not supportive to pursue regulatory approval by the FDA. Based on this outcome, we do not anticipate conducting clinical trials of Zoptrex™ (zoptarelin doxorubicin) with respect to any other indications. We also discontinued the development of AEZS-138/Disorazol Z, as it was based on the same concept as Zoptrex™ (zoptarelin doxorubicin).
Commercial Operations
Our commercial operations were significantly reduced in the fourth quarter of 2017. We eliminated our contract sales team in its entirety, as well as remaining sales management in November 2017, in accordance with the terms of our agreement with inVentiv Commercial Services, LLC, an affiliate of inVentiv Health, Inc. ("inVentiv"), a contract-sales organization.
Pursuant to termination of the inVentiv agreement, we ended our co-promotion with EMD Serono, Inc. and Armune BioScience, Inc.
Until termination of our sales team in November 2017, the inVentiv sales force promoted two products during 2017:
Saizen
®
[somatropin (rDNA origin) for injection] is a prescription medicine indicated for the treatment of growth hormone deficiency in children and adults. We promoted Saizen
®
pursuant to our promotional services agreement (the "EMD Serono Agreement") with EMD Serono, which we entered into in May 2015 and amended as of December 31, 2016. The EMD Serono Agreement, as amended, provided that we were to promote Saizen
®
in specific agreed-upon U.S. territories to adult and pediatric endocrinologists in exchange for a sales commission that was based upon new patient starts of the product. The agreement was terminated in accordance with its terms on December, 13 2017.
APIFINY
®
is the only cancer-specific, non-PSA blood test for the evaluation of the risk of prostate cancer. The test was developed by Armune BioScience, Inc. ("Armune"), a medical diagnostics company that develops and commercializes unique proprietary technology exclusively licensed from the University of Michigan for diagnostic and prognostic tests for cancer. We entered into a co-marketing agreement with Armune in November 2015 (the "Armune Agreement"), which was amended effective as of June 1, 2016, which allowed us to exclusively promote APIFINY
®
throughout the entire United States. We received a commission for each test performed resulting from our targeted promotion without regard to any established baseline. The Armune Agreement, as amended, had a three-year term that renewed automatically for successive one-year periods. The parties agreed in January 2018 that the Armune Agreement was terminated.
Effective on November 3, 2017, we terminated the employment of Jude Dinges, our Senior Vice President and Chief Commercial Officer.
37
Corporate Activities
In July 2017, our subsidiary located in Germany and its Works Council approved a restructuring program (the "2017 German Restructuring"), which was rolled out as a consequence of the negative Phase 3 clinical trial results of Zoptrex™ (zoptarelin doxorubicin) announced on May 1, 2017 and the related impact on our product pipeline. This was also part of the continued strategy to transition the Company into a commercially operating specialty biopharmaceutical organization focused on the development and commercialization of Macrilen™ (macimorelin), including through out-licensing arrangements and pursuing in-licensing opportunities. The goal of the 2017 German Restructuring is to reduce to a minimum our research and development ("R&D") activities and is expected to result in the termination of approximately 24 employees of the German subsidiary.
The Company started implementing the 2017 German Restructuring in the fourth quarter of 2017, with staff departures expected to be completed over a period of approximately
18
months. Total initial restructuring costs associated with the 2017 German Restructuring
include severance accruals and other directly related costs ($2,002,000) and an onerous lease provision ($1,113,000), which has been recorded as follows in the accompanying consolidated statement of comprehensive loss: $2,644,000 in R&D costs, $275,000 in General and administrative ("G&A") expenses and $196,000 in selling expenses. These estimated costs may vary as a result of changes in the underlying assumptions applied thereto, including but not limited to, the time needed to sublease the unused premises.
Most of the restructuring accruals are expected to be paid in the financial year ending
December 31, 2018
.
CEO Appointment and CFO Resignation and Appointment
On July 20, 2017, the board of directors of the Company (the "Board") announced the appointment of Michael Ward as the Company's President and Chief Executive Officer ("CEO"). Further, on September 25, 2017, the Company announced the appointment of Jeffrey Whitnell to the position of Interim Chief Financial Officer ("CFO"). Mr. Whitnell resigned as CFO effective December 7, 2017.
On March 5, 2018, the Company appointed James Clavijo as the Chief Financial Officer, effective that date.
Strategic Review Committee
On July 20, 2017, the Company announced that the Board had established a special committee of independent directors (the "Strategic Review Committee") to develop, consider, investigate and exercise oversight relating to potential strategic alternatives to maximize potential future growth and stakeholder value of the Company, including continuing to execute on our existing business plan and/or considering and recommending changes to our management and governance.
On August 8, 2017, we announced that the Strategic Review Committee engaged a consulting firm and a financial advisor to assist in its efforts. The Strategic Review Committee retained Stifel, Nicolaus & Company as advisor in part to validate the commercial potential of Macrilen™(macimorelin) to assist it in determining the best means of maximizing value, which included evaluating and recommending modes of distribution including entering into partnerships or building an internal sales force, raising capital including through an investment from a strategic partner, or selling some or all of the Company and its assets. On January 16, 2018, through AEZS Germany, the Company entered into the Strongbridge License Agreement.
In January 2018, in accordance with the written mandate of the Strategic Review Committee, the members of the Strategic Review Committee determined that the responsibilities of the Strategic Review Committee had been performed and were at an end and the Strategic Review Committee was dissolved effective as of January 22, 2018.
Contingencies
In late July 2017, we terminated for cause the employment of Mr. David A. Dodd, the former President and Chief Executive Officer of the Company and the employment of Mr. Philip A. Theodore, the former Senior Vice President, Chief Administrative Officer, General Counsel and Corporate Secretary of the Company. All outstanding stock options held by both former officers were cancelled effective as of their respective termination dates, in accordance with the provisions of our Stock Option Plan (as defined below).
On August 3, 2017, we announced that we had filed a lawsuit against both Messrs. Dodd and Theodore for damages suffered by us for breach of confidence and/or breach of fiduciary duty in an amount to be determined prior to trial. We are also seeking, among other things, an injunction to prevent both Messrs. Dodd and Theodore from (i) continuing to use our confidential and proprietary information without authorization; and (ii) mounting a proxy contest that will be premised upon the breaches of fiduciary and statutory duties and breaches of confidence alleged in the lawsuit. We engaged external counsel to conduct an internal investigation related to this lawsuit, which is still ongoing.
On December 21, 2017, Messrs. Dodd and Theodore brought a counterclaim against the Company and its Chair, Carolyn Egbert, in the amount of CAN$6.0 million alleging, among other things, that defamatory statements were made against Messrs. Dodd and
38
Theodore. The Company and its Chair consider the counterclaim against them to be entirely without merit, and intend to vigorously defend against the counterclaim.
In August 2017, Mr. Dodd filed a lawsuit in the Court of Common Pleas of South Carolina against us for damages of approximately U.S.$1.7 million. He is also requesting that all of his outstanding stock options vest effective upon his termination date. We cannot predict at this time the final outcome or potential losses, if any, with respect to this lawsuit. On September 5, 2017, the lawsuit in the Court of Common Pleas of South Carolina was moved to the Federal Court in South Carolina.
Cogas Consulting, LLC ("Cogas") filed a lawsuit against the Company in state court in Fulton County, Georgia on February 2, 2018. Cogas alleges that its employee (and sole shareholder) John Sharkey is entitled to a "success fee" commission on the Strongbridge License Agreement. Cogas is claiming damages in the form of a lost commission on the transaction. Cogas claims its commission is 5% on payments the Company receives within the first three years after January 14, 2018. Cogas alleges it is entitled to 5% of the $24 million Strongbridge already paid the Company, plus 5% of any royalty Strongbridge pays the Company through January 17, 2021. The Company plans to vigorously defend this matter.
39
|
A.
|
Operating Results
|
Consolidated Statements of Comprehensive Loss Information
|
Three months ended December 31,
|
Years ended December 31,
|
||||||||||||||
|
(in thousands, except share and per share data)
|
2017
|
2016
|
2017
|
2016
|
2015
|
||||||||||
|
$
|
$
|
$
|
$
|
$
|
|||||||||||
|
Revenues
|
|||||||||||||||
|
Sales commission and other
|
59
|
|
94
|
|
465
|
|
414
|
|
297
|
|
|||||
|
License fees
|
119
|
|
210
|
|
458
|
|
497
|
|
248
|
|
|||||
|
178
|
|
304
|
|
923
|
|
911
|
|
545
|
|
||||||
|
Operating expenses
|
|||||||||||||||
|
Research and development costs
|
526
|
|
4,619
|
|
10,704
|
|
16,495
|
|
17,234
|
|
|||||
|
General and administrative expenses
|
2,778
|
|
1,757
|
|
8,198
|
|
7,147
|
|
11,308
|
|
|||||
|
Selling expenses
|
452
|
|
1,526
|
|
5,095
|
|
6,745
|
|
6,887
|
|
|||||
|
|
3,756
|
|
7,902
|
|
23,997
|
|
30,387
|
|
35,429
|
|
|||||
|
Loss from operations
|
(3,578
|
)
|
(7,598
|
)
|
(23,074
|
)
|
(29,476
|
)
|
(34,884
|
)
|
|||||
|
Gain (loss) due to changes in foreign currency exchange rates
|
72
|
|
(396
|
)
|
502
|
|
(70
|
)
|
(1,767
|
)
|
|||||
|
Change in fair value of warrant liability
|
(478
|
)
|
(245
|
)
|
2,222
|
|
4,437
|
|
(10,956
|
)
|
|||||
|
Warrant exercise inducement fee
|
—
|
|
—
|
|
—
|
|
—
|
|
(2,926
|
)
|
|||||
|
Other finance income
|
21
|
|
19
|
|
75
|
|
150
|
|
305
|
|
|||||
|
Net finance income (costs)
|
(385
|
)
|
(622
|
)
|
2,799
|
|
4,517
|
|
(15,344
|
)
|
|||||
|
Loss before income taxes
|
(3,963
|
)
|
(8,220
|
)
|
(20,275
|
)
|
(24,959
|
)
|
(50,228
|
)
|
|||||
|
Income tax recovery
|
3,479
|
|
—
|
|
3,479
|
|
—
|
|
—
|
|
|||||
|
Net loss from continuing operations
|
(484
|
)
|
(8,220
|
)
|
(16,796
|
)
|
(24,959
|
)
|
(50,228
|
)
|
|||||
|
Net income from discontinued operations
|
—
|
|
—
|
|
—
|
|
—
|
|
85
|
|
|||||
|
Net loss
|
(484
|
)
|
(8,220
|
)
|
(16,796
|
)
|
(24,959
|
)
|
(50,143
|
)
|
|||||
|
Other comprehensive loss:
|
|||||||||||||||
|
Items that may be reclassified subsequently to profit or loss:
|
|||||||||||||||
|
Foreign currency translation adjustments
|
(238
|
)
|
870
|
|
(1,430
|
)
|
569
|
|
1,509
|
|
|||||
|
Items that will not be reclassified to profit or loss:
|
|||||||||||||||
|
Actuarial gain (loss) on defined benefit plans
|
59
|
|
1,143
|
|
694
|
|
(1,479
|
)
|
844
|
|
|||||
|
Comprehensive loss
|
(663
|
)
|
(6,207
|
)
|
(17,532
|
)
|
(25,869
|
)
|
(47,790
|
)
|
|||||
|
Net loss per share (basic and diluted) from continuing operations
1
|
(0.03
|
)
|
(0.71
|
)
|
(1.12
|
)
|
(2.41
|
)
|
(18.17
|
)
|
|||||
|
Net income per share (basic and diluted) from discontinued operations
1
|
—
|
|
—
|
|
—
|
|
—
|
|
0.03
|
|
|||||
|
Net loss per share (basic and diluted)
1
|
(0.03
|
)
|
(0.71
|
)
|
(1.12
|
)
|
(2.41
|
)
|
(18.14
|
)
|
|||||
|
Weighted average number of shares outstanding:
1
|
|||||||||||||||
|
Basic and Diluted
|
16,440,760
|
|
11,565,210
|
|
14,958,704
|
|
10,348,879
|
|
2,763,603
|
|
|||||
|
1
|
Adjusted to reflect the November 17, 2015 100-to-1 Share Consolidation
|
Our operating and financial review and prospects should be read in conjunction with our consolidated financial statements, accompanying notes and other information appearing in this Annual Report.
40
2017
compared to
2016
Revenues
Sales commission and other
were
$0.1 million
and
$0.5 million
for the
three and twelve
months ended
December 31, 2017
and
$0.1 million
and
$0.4 million
for the same periods in
2016
, and thus increased in
2017
as compared to
2016
. In
2017
, those revenues mainly resulted from our sales team exceeding pre-established unit sales baseline thresholds under our co-promotion agreement to sell Saizen
®
. We also generated sales commission in connection with our promotion of APIFINY
®
. In the corresponding periods in
2016
, sales commission and other revenues were mainly related to EstroGel
®
.
License fees
were
$0.1 million
and
$0.5 million
for the
three and twelve
months ended
December 31, 2017
, as compared to
$0.2 million
and
$0.5 million
for the same periods in
2016
.
The Company currently has deferred revenues at
December 31, 2017
of $541,000 relating to non-refundable upfront payments it previously received for licensing and technology transfer arrangements that it entered into with respect to the development of Zoptrex™ in various territories. Due to events that occurred in 2018, the Company does not anticipate development of Zoptrex™ under the licensing agreements, therefore the Company's remaining carrying amount of deferred revenues will be recognized in the first quarter of 2018 as income.
Operating Expenses
R&D
costs
were
$0.5 million
and
$10.7 million
for the
three and twelve
months ended
December 31, 2017
, compared to
$4.6 million
and
$16.5 million
for the same periods in
2016
.
R&D costs decreased for the three-month and twelve-month periods ended
December 31, 2017
as compared to the same period in
2016
. The decrease in R&D costs is mainly attributable to lower comparative third-party costs, as described below, partially offset by the recording, in the third quarter of 2017, of a provision in connection with the 2017 German Restructuring.
Additionally, the decrease in our R&D costs for the
twelve
months ended
December 31, 2017
, as compared to the same period in
2016
, is attributable to lower employee compensation and benefits costs, lower facilities rent and maintenance costs as well as lower other costs. A substantial portion of this decrease is due to the realization of cost savings in connection with our ongoing efforts to streamline our R&D activities and to increase our commercial operations and flexibility by reducing our R&D staff, which was started in 2014 (the "Resource Optimization Program"). The R&D costs for the year ended December 31, 2017 were lower than anticipated mainly because we were able to negotiate reductions to a change order received from our principal R&D third-party service provider.
The following table summarizes our net R&D costs by nature of expense:
|
Three months ended December 31,
|
Years ended December 31,
|
|||||||||||||||
|
(in thousands)
|
2017
|
2016
|
2017
|
2016
|
2015
|
|||||||||||
|
$
|
$
|
$
|
$
|
$
|
||||||||||||
|
Third-party costs
|
(539
|
)
|
3,233
|
|
3,936
|
|
11,829
|
|
11,891
|
|
||||||
|
Employee compensation and benefits
|
822
|
|
845
|
|
4,868
|
|
*
|
3,216
|
|
3,699
|
|
|||||
|
Facilities rent and maintenance
|
273
|
|
232
|
|
1,898
|
|
**
|
873
|
|
940
|
|
|||||
|
Other costs
***
|
86
|
|
309
|
|
138
|
|
579
|
|
727
|
|
||||||
|
Gain on disposal of equipment
|
(116
|
)
|
—
|
|
(136
|
)
|
(2
|
)
|
(23
|
)
|
||||||
|
526
|
|
4,619
|
|
10,704
|
|
16,495
|
|
17,234
|
|
|||||||
_________________________
* Includes a provision for restructuring in the amount of $1.6 million.
** Includes a provision for restructuring in the amount of $1.0 million.
*** Includes mainly depreciation, amortization, impairment, reversal of impairment, gain on disposal of equipment and operating foreign exchange losses.
41
The following table summarizes third-party R&D costs, by product candidate, incurred by the Company during the three months ended
December 31, 2017
and
2016
.
|
(in thousands, except percentages)
|
Three months ended December 31,
|
|||||||||||
|
Product Candidate
|
2017
|
2016
|
||||||||||
|
$
|
%
|
$
|
%
|
|||||||||
|
Zoptrex™
|
(89
|
)
|
16.5
|
|
1,453
|
|
44.9
|
|
||||
|
Macrilen™
|
(471
|
)
|
87.4
|
|
1,568
|
|
48.5
|
|
||||
|
LHRH - Disorazol Z
|
—
|
|
(0.2
|
)
|
16
|
|
0.5
|
|
||||
|
Erk inhibitors
|
1
|
|
—
|
|
86
|
|
2.7
|
|
||||
|
Other
|
20
|
|
(3.7
|
)
|
110
|
|
3.4
|
|
||||
|
(539
|
)
|
100.0
|
|
3,233
|
|
100.0
|
|
|||||
The following table summarizes third-party R&D costs, by product candidate, incurred by the Company during the years ended
December 31, 2017
,
2016
and
2015
.
|
(in thousands, except percentages)
|
Years ended December 31,
|
|||||||||||||||||
|
Product Candidate
|
2017
|
2016
|
2015
|
|||||||||||||||
|
$
|
%
|
$
|
%
|
$
|
%
|
|||||||||||||
|
Zoptrex™
|
2,495
|
|
63.4
|
|
6,742
|
|
57.0
|
|
8,635
|
|
72.6
|
|
||||||
|
Macrilen™
|
1,237
|
|
31.4
|
|
4,326
|
|
36.6
|
|
1,555
|
|
13.1
|
|
||||||
|
LHRH - Disorazol Z
|
44
|
|
1.1
|
|
294
|
|
2.5
|
|
212
|
|
1.8
|
|
||||||
|
Erk Inhibitors
|
18
|
|
0.5
|
|
130
|
|
1.1
|
|
1,081
|
|
9.1
|
|
||||||
|
Other
|
142
|
|
3.6
|
|
337
|
|
2.8
|
|
408
|
|
3.4
|
|
||||||
|
3,936
|
|
100.0
|
|
11,829
|
|
100.0
|
|
11,891
|
|
100.0
|
|
|||||||
As shown above, a substantial portion of the R&D costs relates to development initiatives associated with Zoptrex™, and with our pivotal Phase 3 ZoptEC clinical trial initiated in 2013 with Ergomed. Third-party costs attributable to Zoptrex™ decreased considerably during the
twelve
months ended
December 31, 2017
, as compared to the same period in
2016
, mainly since we completed the clinical portion of the ZoptEC trial during the first quarter of 2017 which was partially offset by the additional liability recognized following the negative Zoptrex
TM
top-line results.
Third-party costs attributable to Zoptrex™ decreased during the three and
twelve
months ended
December 31, 2017
, as compared to the same period in
2016
, mainly since we closed out the study and related activities in the second quarter following the negative Zoptrex
TM
top-line results on May 1, 2017. The negative costs for the three-month period ended December 31, 2017 are mainly explained by lower close out costs as compared to the accrual made in the second quarter.
Third-party costs attributable to Macrilen™ (macimorelin) decreased during the three and
twelve
months ended
December 31, 2017
, as compared to the same period in
2016
. This is mainly since we completed the Phase 3 clinical trial at the end of 2016. The costs incurred in 2017 related to the detailed analysis of the top-line results as well as the preparation of the NDA filing which was submitted on June 30, 2017. The costs reversal in the fourth quarter of 2017 are explained mainly by the reductions to close out costs.
Excluding the impact of foreign exchange rate fluctuations, we expect that we will incur overall R&D costs of between $1.0 million and $2.0 million for the year ended December 31, 2018.
G&A expenses
were
$2.8 million
and
$8.2 million
for both the
three and twelve
-month periods ended
December 31, 2017
, as compared to
$1.8 million
and
$7.1 million
for the same periods in
2016
. The increase in our G&A costs for the three and twelve months ended
December 31, 2017
, as compared to the same period in
2016
, is mainly due to outside legal costs. The G&A expenses are in line with expectations.
42
Excluding the impact of foreign exchange rate fluctuations and the recording of transaction costs related to potential financing activities (not currently known or estimable), we expect that G&A expenses will range between $9.0 million and $11.0 million in 2018.
Selling expenses
were
$0.5 million
and
$5.1 million
for the
three and twelve
months ended
December 31, 2017
, as compared to
$1.5 million
and
$6.7 million
for the same periods in
2016
. Selling expenses for the
three and twelve
months ended
December 31, 2017
and
2016
represent mainly the costs of our sales force related to the co-promotion activities as well as our sales management team.
The decrease in selling expenses is explained by the elimination of sales representatives. In the fourth quarter, we eliminated all sales representatives as part of the restructuring efforts. Based on currently available information, we expect selling expenses to range between $0.2 million and $0.5 million in 2018.
Net finance income (costs)
was
$(0.4) million
and
$2.8 million
for the
three and twelve
months ended
December 31, 2017
, as compared to
$(0.6) million
and
$4.5 million
, for the same periods in
2016
. The decrease in finance income is mainly attributable to the change in fair value of warrant liability. Such change in fair value results from the periodic "mark-to-market" revaluation, via the application of pricing models, of outstanding share purchase warrants. The closing price of our common shares, which, on the NASDAQ, fluctuated from
$0.84
to
$3.65
during the
twelve
-month period ended
December 31, 2017
, compared to
$2.67
to
$4.94
during the same period in
2016
, also had a direct impact on the change in fair value of warrant liability.
Net loss
for the
three and twelve
months ended
December 31, 2017
was
$0.5 million
and
$16.8 million
(or
$0.03
and
$1.12
per share), as compared to a net loss of
$8.2 million
and
$25.0 million
(or
$0.71
and
$2.41
per share) for the same periods in
2016
.
The decrease in net loss for the three-month period ended December 31, 2017 is a result of the reduction in third party R&D costs. The reduction is attributed to closing out the Zoptrex study and successful completion in the U.S. of the Macrilen™ (macimorelin) filing.
2016 compared to 2015
Revenues
Revenues
were
$0.9 million for the year ended December 31, 2016 compared to $0.5 million for the same period in 2015. In 2016, the sales commission and other revenue mainly resulted from our sales team exceeding pre-established unit sales baseline thresholds under our co-promotion agreement to sell Saizen
®
. We also generated sales commission in connection with our promotion of APIFINY
®
. In the corresponding periods in 2015, sales commission and other revenues were mainly related to EstroGel
®
. The increase in licensing fees is explained by the out-licensing agreements that we entered into in 2016 for Zoptrex
TM
.
Operating Expenses
R&D costs
were $16.5 million for the year ended December 31, 2016 compared to $17.2 million for the same period in 2015.
The decrease in our R&D costs for the twelve months ended December 31, 2016, as compared to the same period in 2015, is attributable to lower employee compensation and benefits costs, lower facilities rent and maintenance costs as well as lower other costs. A substantial portion of this decrease is due to the realization of cost savings in connection with the Resource Optimization Program.
In addition, during 2015, we initiated the new confirmatory Phase 3 clinical trial of Macrilen™ (macimorelin), which explains the increase in costs for this product candidate. The first patient was enrolled in the fourth quarter of 2015, we announced completion of patient recruitment in the fourth quarter of 2016 and we announced top-line results of the trial on January 4, 2017. Finally, in 2015, we also decided to suspend our efforts on internally developing Erk inhibitor, a molecule for potential cancer therapies, to conserve our resources for other projects.
G&A expenses
were $7.1 million for the year ended December 31, 2016, as compared to $11.3 million for the same period in 2015. The decrease in our G&A costs for 2016, as compared to the same periods in 2015, is due to the recording of a provision, in the fourth quarter of 2015, related to a corporate restructuring that we announced on October 12, 2015 (the "2015 Corporate Restructuring"). The 2015 Corporate Restructuring included the restructuring of our finance and accounting staff and the closure of our office in Quebec City. As a result of the 2015 Corporate Restructuring, recurring G&A expenses also decreased in 2016, as compared to 2015. Finally, the comparative decrease is also explained by certain transaction costs allocated to warrants in connection with the completion of share issuances in March and December 2015.
Selling expenses
were $6.7 million for the year ended December 31, 2016, as compared to $6.9 million for the same period in 2015. The selling expenses are slightly below what we anticipated because we postponed some expenses related to the potential
43
commercial launch of Zoptrex™ and Macrilen™ (macimorelin) mainly because the related clinical trials took more time than expected.
Net finance income (costs)
were $4.5 million for the year ended December 31, 2016, as compared to $(15.3) million for the same period in 2015 and are
comprised predominantly of the change in fair value of warrant liability and of gains and losses recorded due to changes in foreign currency exchange rates.
The change in fair value of our warrant liability results from the periodic "mark-to-market" revaluation, via the application of the pricing models, of share purchase warrants that were outstanding during the relevant period. The "mark-to-market" warrant valuation was most notably impacted by the issuance of 3.1 million additional share purchase warrants in 2015 and by the closing price of our common shares, which, on the NASDAQ, fluctuated from $2.67 to $4.94 during the year ended December 31, 2016 and from $4.00 to $84.20 during the year ended December 31, 2015.
In addition, with specific reference to 2015, finance costs were also impacted by the warrant exercise inducement fee paid to certain holders of the Series B Warrants.
Net loss
for the year ended December 31, 2016
was $(25.0) million, or $(2.41) per basic and diluted share compared to $(50.1) million, or $(18.14) per basic and diluted share for the same period in 2015. The decrease in our net loss for the year ended December 31, 2016, as compared to the same period in 2015, is due to the lower comparative R&D costs and G&A expenses and the change in fair value of warrant liability as presented above.
Quarterly Consolidated Results of Operations Information
|
(in thousands, except for per share data)
|
Three months ended
|
|||||||||||
|
December 31, 2017
|
September 30, 2017
|
June 30, 2017
|
March 31, 2017
|
|||||||||
|
$
|
$
|
$
|
$
|
|||||||||
|
Revenues
|
178
|
|
241
|
|
243
|
|
261
|
|
||||
|
Loss from operations
|
(3,578
|
)
|
(7,200
|
)
|
(6,679
|
)
|
(5,617
|
)
|
||||
|
Net loss
|
(484
|
)
|
(9,631
|
)
|
(2,550
|
)
|
(4,131
|
)
|
||||
|
Net loss per share (basic and diluted)*
|
(0.03
|
)
|
(0.61
|
)
|
(0.18
|
)
|
(0.31
|
)
|
||||
|
(in thousands, except for per share data)
|
Three months ended
|
|||||||||||
|
December 31, 2016
|
September 30, 2016
|
June 30, 2016
|
March 31, 2016
|
|||||||||
|
$
|
$
|
$
|
$
|
|||||||||
|
Revenues
|
304
|
|
269
|
|
96
|
|
242
|
|
||||
|
Loss from operations
|
(7,598
|
)
|
(7,703
|
)
|
(7,184
|
)
|
(6,991
|
)
|
||||
|
Net loss
|
(8,220
|
)
|
(6,055
|
)
|
(7,008
|
)
|
(3,676
|
)
|
||||
|
Net loss per share (basic and diluted)*
|
(0.71
|
)
|
(0.61
|
)
|
(0.71
|
)
|
(0.37
|
)
|
||||
_________________________
* Net loss per share is based on the weighted average number of shares outstanding during each reporting period, which may differ on a quarter-to-quarter basis. As such, the sum of the quarterly net loss per share amounts may not equal full-year net loss per share.
Historical quarterly results of operations and net loss cannot be taken as reflective of recurring revenue or expenditure patterns or of predictable trends, largely given the non-recurring nature of certain components of our historical revenues, due most notably to unpredictable quarterly variations attributable to our net finance income, which in turn are comprised mainly of the impact of the periodic "mark-to-market" revaluation of our warrant liability and of foreign exchange gains and losses. Additionally, our net R&D costs have historically varied on a quarter-over-quarter basis due to the ramping up or winding down of potential product candidate activities, which in turn are dependent upon many factors that often do not occur on a linear or predictable basis.
Our selling expenses have been consistent but can also vary on a quarter-over-quarter basis due to the ramping up of pre-commercialization activities associated with Macrilen™ (macimorelin).
44
Condensed Consolidated Statement of Financial Position Information
|
December 31,
|
||||||
|
(in thousands)
|
2017
|
2016
|
||||
|
$
|
$
|
|||||
|
Cash and cash equivalents
1
|
7,780
|
|
21,999
|
|
||
|
Trade and other receivables and other current assets
|
958
|
|
744
|
|
||
|
Restricted cash equivalents
|
381
|
|
496
|
|
||
|
Inventory
|
643
|
|
—
|
|
||
|
Property, plant and equipment
|
101
|
|
204
|
|
||
|
Deferred tax assets
|
3,479
|
|
—
|
|
||
|
Other non-current assets
|
8,853
|
|
8,216
|
|
||
|
Total assets
|
22,195
|
|
31,659
|
|
||
|
Payables and other current liabilities
|
2,987
|
|
3,745
|
|
||
|
Provision for restructuring costs
|
2,296
|
|
33
|
|
||
|
Current portion of deferred revenues
|
486
|
|
426
|
|
||
|
Warrant liability
|
3,897
|
|
6,854
|
|
||
|
Non-financial non-current liabilities
2
|
15,312
|
|
14,389
|
|
||
|
Total liabilities
|
24,978
|
|
25,447
|
|
||
|
Shareholders' (deficiency) equity
|
(2,783
|
)
|
6,212
|
|
||
|
Total liabilities and shareholders' (deficiency) equity
|
22,195
|
|
31,659
|
|
||
_________________________
|
1.
|
Approximately $0.6 million and $1.5 million were denominated in EUR as at
December 31, 2017
and
December 31, 2016
, respectively, and approximately $1.0 million and $3.7 million were denominated in Canadian dollars as at
December 31, 2017
and
December 31, 2016
, respectively.
|
|
2.
|
Comprised mainly of employee future benefits, provisions for onerous contracts and non-current portion of deferred revenues.
|
The decrease in cash and cash equivalents as at
December 31, 2017
, as compared to
December 31, 2016
, is due to the net cash used in operating activities including variations in components of our working capital. The decrease was partially offset by the net proceeds generated by various issuances of common shares under our April 2016, March 2017 and April 2017 "At-the-Market" ("ATM") Programs
.
The increase in inventory is the result of capitalizing direct manufacturing costs incurred from Macrilen™ (macimorelin) following its FDA approval.
The decrease in payables and other current liabilities is mainly attributable to the reduction in R&D costs and selling expenses, partially offset by an increase in G&A expenses, in the
fourth
quarter of
2017
as compared to the fourth quarter of
2016
which is explained by the completion of our Phase 3 clinical trials.
The decrease in our warrant liability from
December 31, 2016
to
December 31, 2017
is mainly due to a net fair value revaluation gain of $2.2 million, which was recorded pursuant to our periodic "mark-to-market" revaluation of the underlying outstanding share purchase warrants. The revaluation gain is mainly explained by the decrease of the price of our common shares during the period. The remaining variance is explained by the exercise of some Series A Warrants in July 2017.
The increase in non-financial non-current liabilities from
December 31, 2016
to
December 31, 2017
is mainly due to the increase in the EUR/USD foreign exchange rate offset by a slight increase in the discount rate used to estimate our employee future benefits obligation.
The decrease in shareholders' (deficiency) equity as at
December 31, 2017
,
as compared to
December 31, 2016
, is attributable primarily to the recording of a net loss for the
twelve
-month period, partially offset by the net proceeds generated by various issuances of common shares under our April 2016, March 2017 and April 2017 ATM Programs
.
45
Outstanding Share Data
As at
March 27, 2018
we had
16,440,760
,Common Shares issued and outstanding, as well as
711,252
stock options outstanding. Share purchase warrants outstanding as at
March 27, 2018
represented a total of
3,417,840
equivalent common shares.
Recent Accounting Pronouncements
The IASB continues to issue new and revised IFRS. A listing of the recent accounting pronouncements promulgated by the IASB and not yet adopted by the Company is included in
note 4
to the Company's
December 31, 2017
consolidated financial statements which are included in Item 18 of this Annual Report on Form 20-F.
|
B.
|
Liquidity, Cash Flows and Capital Resources
|
Our operations and capital expenditures have been financed through certain transactions impacting our cash flows from operating activities, public equity offerings and issuances under various ATM programs.
At
December 31, 2017
, we had
$7.8 million
of cash and cash equivalents. We expect existing cash balances and operating cash flows (including the upfront cash payment of $24 million from Strongbridge discussed below) will provide us with adequate funds to support our current operating plan for at least twelve months after the date of the issuance of this Annual Report Form 20-F and for the foreseeable future.
Strongbridge License Agreement
On January 17, 2018, the Company received an upfront cash payment of $24,000,000 from Strongbridge, and, for as long as Macrilen™ (macimorelin) is patent-protected, the Company will be entitled to a 15% royalty on net sales up to $75,000,000 and an 18% royalty on net sales above $75,000,000. Following the end of patent protection in United States or Canada for Macrilen™ (macimorelin), the Company will be entitled to a 5% royalty on net sales in that country. In addition, the Company will also receive one-time payments from Strongbridge following the first achievement of the following commercial milestone events:
|
•
|
$4,000,000 on achieving $25,000,000 annual net sales,
|
|
•
|
$10,000,000 on achieving $50,000,000 annual net sales,
|
|
•
|
$20,000,000 on achieving $100,000,000 annual net sales,
|
|
•
|
$40,000,000 on achieving $200,000,000 annual net sales, and
|
|
•
|
$100,000,000 on achieving $500,000,000 annual net sales.
|
Upon approval by the FDA of a pediatric indication for Macrilen™ (macimorelin), the Company will receive a one-time milestone payment of $5,000,000 from Strongbridge.
Strongbridge will fund 70% of the costs of a worldwide pediatric development program to be run by the Company with customary oversight from a joint steering committee. The joint steering committee will be comprised of four persons, two of whom will be appointed by each of Strongbridge and the Company.
The Strongbridge License Agreement will expire at the end of a defined royalty period in each of the United States and Canada (the "Territory"), at which time the license that the Company granted to Strongbridge will become irrevocable, fully paid-up, perpetual and royalty-free in such country. Strongbridge has the right to terminate the Strongbridge License Agreement if there is a safety concern related to Macrilen™ (macimorelin), withdrawal of regulatory approval for Macrilen™ (macimorelin) in the U.S. believed to be permanent, two hundred and seventy (270) days' prior written notice, or if the Company commits a material breach of any term of the Strongbridge License Agreement that it fails to cure within 90 days after receiving written notice of the breach. The Company has the right to terminate the Strongbridge License Agreement if Strongbridge commits a material breach of any term of the Strongbridge License Agreement that it fails to cure within 90 days after receiving written notice of the breach. If the breach relates to Canada then the Company shall only have the right to terminate the Strongbridge License Agreement in relation to Canada. If the breach relates to the United States, then the Company shall have the right to terminate the Strongbridge License Agreement in its entirety.
46
The Strongbridge License Agreement contains customary provisions related to, among other things, confidentiality and non-disclosure, representations and warranties, indemnity and dispute resolution. The Strongbridge License Agreement is governed by the laws of the State of New York, United States.
Public Offerings
On April 1, 2016, we entered into an ATM sales agreement under which we are able, at our discretion and from time to time, to sell up to 3 million of our common shares through ATM issuances on the NASDAQ for aggregate gross proceeds of up to approximately $10 million (the "April 2016 ATM Program"). The ATM program provides that common shares are to be sold at market prices prevailing at the time of sale and, as a result, prices may vary. During the year ended
December 31, 2016
, the Company issued an additional 555,068 common shares under the April 2016 ATM Program at an average price of approximately $3.20 per share for gross proceeds of $1.8 million. The shelf registration statement pursuant to which this program was established expired on March 28, 2017.
On March 28, 2017, we commenced a new ATM offering pursuant to its existing ATM Sales Agreement, dated April 1, 2016, under which we were able, at our discretion, from time to time, to sell up to a maximum of 3 million common shares through ATM issuances on the NASDAQ, up to an aggregate amount of $9.0 million (the "March 2017 ATM Program"). The common shares were to be sold at market prices prevailing at the time of the sale of the common shares and, as a result, sale prices varied.
Between March 28, 2017 and April 18, 2017, we issued a total of 597,994 common shares under the March 2017 ATM Program at an average issuance price of $2.97 per share for aggregate gross proceeds of $1.8 million less cash transaction costs of $55,000 and previously deferred financing costs of $65,000.
On April 27, 2017, we entered into a new ATM Sales Agreement (the "New ATM Sales Agreement"), and filed with the SEC a prospectus supplement (the "Prospectus Supplement") related to sales and distributions of up to a maximum of 2,240,000 common shares through ATM issuances on the NASDAQ, up to an aggregate amount of $6.9 million under the New ATM Sales Agreement. The common shares will be sold at market prices prevailing at the time of the sale of the common shares and, as a result, prices may vary. The New ATM Sales Agreement and the Prospectus Supplement superseded and replaced the March 2017 ATM Program, which itself had superseded and replaced the April 2016 ATM Program. The Prospectus Supplement supplements the base prospectus included in our Shelf Registration Statement on Form F-3, as amended (the "2017 Shelf Registration Statement"), which was declared effective by the SEC on April 27, 2017. The 2017 Shelf Registration Statement allows us to offer up to $50 million of common shares and is effective for a three-year period. Between May 30, 2017 and December 31, 2017, we issued 1.8 million common shares at an average issuance price of $1.71 per share under the New ATM Sales Agreement.
On November 1, 2016, we completed a registered direct offering of 2,100,000 units (the "Units"), with each Unit consisting of one common share or one pre-funded warrant to purchase one common share and 0.45 of a warrant to purchase one common share (the "November 2016 Offering"). Total gross cash proceeds raised through the November 2016 Offering amounted to $7.6 million, less cash transaction costs of $1.0 million, including the placement agent's fee and expenses. The warrants are exercisable six months after their date of issuance and for a period of three years thereafter at an exercise price of $4.70 per share. The warrants contain a call provision which provides that, in the event our common shares trade at or above $10.00 on the principal trading market of our common shares during a specified measurement period and subject to a minimum volume of trading during such measurement period, then, subject to certain conditions, we have the right to call for cancellation all or any portion of the warrants which are not exercised by holders within 10 trading days following receipt of a call notice from us. Upon complete exercise for cash, these warrants would result in the issuance of an aggregate of 945,000 common shares that would generate additional proceeds of approximately $4.4 million, although these warrants may be exercised on a "net" or "cashless" basis.
47
The variations in our liquidity by activity are explained below.
|
(in thousands)
|
Three months ended December 31,
|
Years ended December 31,
|
|||||||||||||
|
2017
|
2016
|
2017
|
2016
|
2015
|
|||||||||||
|
$
|
$
|
$
|
$
|
$
|
|||||||||||
|
Cash and cash equivalents - Beginning of period
|
12,173
|
|
21,052
|
|
21,999
|
|
41,450
|
|
34,931
|
|
|||||
|
Cash flows from operating activities:
|
|||||||||||||||
|
Net cash used in operating activities
|
(4,527
|
)
|
(8,131
|
)
|
(22,913
|
)
|
(29,010
|
)
|
(33,929
|
)
|
|||||
|
Cash provided by operating activities from discontinued operations
|
—
|
|
—
|
|
—
|
|
—
|
|
85
|
|
|||||
|
(4,527
|
)
|
(8,131
|
)
|
(22,913
|
)
|
(29,010
|
)
|
(33,844
|
)
|
||||||
|
Cash flows from financing activities:
|
|||||||||||||||
|
Net proceeds from issuance of common shares
|
—
|
|
9,361
|
|
8,030
|
|
9,924
|
|
49,427
|
|
|||||
|
Payment pursuant to warrant amendment agreements and Series B Warrants exercise inducement fee
|
—
|
|
—
|
|
—
|
|
—
|
|
(8,629
|
)
|
|||||
|
—
|
|
9,361
|
|
8,030
|
|
9,924
|
|
40,798
|
|
||||||
|
Cash flows from investing activities:
|
|||||||||||||||
|
Net cash provided by (used in) investing activities
|
140
|
|
(9
|
)
|
307
|
|
(314
|
)
|
913
|
|
|||||
|
140
|
|
(9
|
)
|
307
|
|
(314
|
)
|
913
|
|
||||||
|
Effect of exchange rate changes on cash and cash equivalents
|
(6
|
)
|
(274
|
)
|
357
|
|
(51
|
)
|
(1,348
|
)
|
|||||
|
Cash and cash equivalents - End of period
|
7,780
|
|
21,999
|
|
7,780
|
|
21,999
|
|
41,450
|
|
|||||
Operating Activities
2017
compared to
2016
Cash used in operating activities
totaled
$4.5 million
and
$22.9 million
for the
three and twelve
months ended
December 31, 2017
, as compared to
$8.1 million
and
$29.0 million
for the same periods in
2016
. The decrease in cash used in operating activities for the
twelve
months ended
December 31, 2017
, as compared to the same periods in
2016
, is mainly due to lower operating expenses.
We expect net cash used in operating activities to range from $11.0 million to $12.0 million for the year ending December 31, 2018. We expect most of the expenses related to G&A to be for employee, insurance, rent, travel, and professional fees, such as legal, accounting and public company related expenses. The timing of the termination notices, that will be given to employees as part of the 2017 German Restructuring, will have an impact on the net cash used in operating activities. This guidance may vary significantly in future periods and it can also be significantly impacted by ongoing business development initiatives.
2016
compared to
2015
Cash used in operating activities
totaled $29.0 million and $33.8 million for the
twelve
months ended
December 31, 2016
and
2015
, respectively. The decrease in cash used in operating activities for the
twelve
months ended
December 31, 2016
, as compared to the same period in
2015
, was mainly due to lower operating expenses.
Financing Activities
2017
compared to
2016
Cash flows from financing activities
totaled
$0.0 million
and
$8.0 million
for the
three and twelve
months ended
December 31, 2017
, as compared to
$9.4 million
and
$9.9 million
for the same periods in
2016
. The decrease is mainly due to higher net proceeds received from the November 2016 Offering.
48
2016
compared to
2015
Cash flows from financing activities
totaled
$9.9 million
for the
twelve
months ended
December 31, 2016
, as compared to $40.8 million for the same period in
2015
.
The decrease is mainly due to lower net proceeds received from the issuance of common shares and warrants in 2016 as compared to 2015.
Investing Activities
2017
compared to
2016
Cash (used in) provided by investing activities
totaled
$0.1 million
and
$0.3 million
for the
three and twelve
months ended
December 31, 2017
, as compared to
$0.0 million
and
$(0.3) million
for the same periods in
2016
.
2016
compared to
2015
Cash (used in) provided by investing activities
totaled
$(0.3) million
and $0.9 million for the
twelve
months ended
December 31, 2016
and
2015
, respectively. The decrease for the
twelve
-month period ended
December 31, 2016
, as compared to the same period in
2015
, is due to proceeds received in connection with the disposal of equipment in connection with our Resource Optimization Program during the first quarter of 2015.
Critical Accounting Policies, Estimates and Judgments
Our consolidated financial statements as at
December 31, 2017
and
December 31, 2016
and for the years ended
December 31,
2017
,
2016
and
2015
have been prepared in accordance with IFRS as issued by the IASB.
The preparation of consolidated financial statements in accordance with IFRS requires management to make judgments, estimates and assumptions that affect the reported amounts of our assets, liabilities, revenues, expenses and related disclosures. Judgments, estimates and assumptions are based on historical experience, expectations, current trends and other factors that management believes to be relevant when our consolidated financial statements are prepared.
Management reviews, on a regular basis, the Company's accounting policies, assumptions, estimates and judgments in order to ensure that the consolidated financial statements are presented fairly and in accordance with IFRS. Revisions to accounting estimates are recognized in the period in which the estimates are revised and in any future periods affected.
Critical accounting estimates and assumptions, as well as critical judgments used in applying accounting policies in the preparation of our interim condensed consolidated financial statements were the same as those that applied to our annual consolidated financial statements as of
December 31, 2017
and
December 31, 2016
and for the years ended
December 31, 2017
,
2016
and
2015
.
Capital Disclosures
Our objective in managing capital, consisting of shareholders' equity, with cash and cash equivalents and restricted cash equivalents being its primary components, is to ensure sufficient liquidity to fund R&D costs, selling expenses, G&A expenses, working capital and capital expenditures.
Over the past several years, we have increasingly raised capital via public equity offerings and drawdowns and issuances under various ATM sales programs as our primary source of liquidity.
Our capital management objective remains the same as that in previous periods. The policy on dividends is to retain cash to keep funds available to finance the activities required to advance our product development portfolio and to pursue appropriate commercial opportunities as they may arise. We are not subject to any capital requirements imposed by any regulators or by any other external source.
|
C.
|
Research and development, patents and licenses, etc.
|
For a description of our R&D policies for the last three years, see "Item 4.B. Business Overview" and "Key Developments" at the beginning of this Item 5. You can also find relevant information in our consolidated financial statements in Item 18 as well as the details of amounts spent during the last three years in the "Operating Results" section of this Item 5.
49
|
D.
|
Trend Information
|
Outlook for
2018
Product Development
Macrilen™ (macimorelin)
Macrilen™ (macimorelin), a ghrelin receptor agonist, is a novel orally-active small molecule that stimulates the secretion of growth hormone. Macrilen™ (macimorelin) has been granted orphan drug designation by the FDA for the evaluation of growth hormone deficiency. We own the worldwide rights to this novel patented compound. Macrilen™ (macimorelin) is our proposed trade name for macimorelin. The proposed trade name is subject to approval by the FDA. On September 25, 2017, the FDA rejected the Company's proposed trade name Macrilen™ (macimorelin) due to orthographic similarities and overlapping product characteristics. Subsequently, on October 11, 2017 the Company appealed the FDA's decision rejecting the proposed trade name Macrilen™ (macimorelin). On October 26, 2017, the FDA granted a user fee goal date of January 9, 2018 for the use of the proposed trade name, Macrilen™ (macimorelin). On November 15, 2017, the FDA concluded that the use of the proposed proprietary name, Macrilen™ (macimorelin), is conditionally acceptable. On December 16, 2016, we were advised by the EMA that Macrilen™ (macimorelin) was rejected as the proposed invented name for macimorelin because of its similarity to the names of other medicines. On March 8, 2018, we applied for two invented names for macimorelin: Macrilen ST and Macrilen GHST.
On January 16, 2018, through AEZS Germany, we entered into the Strongbridge License Agreement. We received an upfront cash payment of $24,000,000 from Strongbridge, and, for as long as Macrilen™ (macimorelin) is patent-protected, the Company will be entitled to a 15% royalty on net sales up to $75,000,000 and an 18% royalty on net sales above $75,000,000. Following the end of patent protection in United States or Canada for Macrilen™ (macimorelin), the Company will be entitled to a 5% royalty on net sales in that country. In addition, the Company will also receive one-time payments from Strongbridge following the first achievement of the following commercial milestone events:
|
•
|
$4,000,000 on achieving $25,000,000 annual net sales,
|
|
•
|
$10,000,000 on achieving $50,000,000 annual net sales,
|
|
•
|
$20,000,000 on achieving $100,000,000 annual net sales,
|
|
•
|
$40,000,000 on achieving $200,000,000 annual net sales, and
|
|
•
|
$100,000,000 on achieving $500,000,000 annual net sales.
|
Upon approval by the FDA of a pediatric indication for Macrilen™ (macimorelin), the Company will receive a one-time milestone payment of $5,000,000 from Strongbridge.
Strongbridge will fund 70% of the costs of a worldwide pediatric development program to be run by the Company with customary oversight from a joint steering committee. The joint steering committee will be comprised of four persons, two of whom will be appointed by each of Strongbridge and the Company.
The commercial success of Macrilen™ (macimorelin) will depend on several factors, including, but not limited to, the receipt of approvals from the EMA and similar foreign regulatory authorities; developing appropriate distribution and marketing infrastructure and arrangements for our product; launching and growing commercial sales of the product; and acceptance of the product in the medical community, among patients and with third party payers. We are not currently conducting any clinical studies.
We continue to explore various alternatives to monetize our rights to macimorelin in other countries around the globe.
We also continue to seek opportunities to in-license and acquire products. Our goal is to become a growth-oriented specialty biopharmaceutical company by pursuing successful development, commercialization and licensing of a product portfolio achieving successful commercial presence and growth, while consistently delivering value to our shareholders, employees and the medical providers and patients who will benefit from our products.
Commercial Operations
Our commercial operations were significantly reduced in the fourth quarter of 2017. We eliminated our contract sales team in its entirety, as well as remaining sales management in November 2017, in accordance with the terms of our agreement with inVentiv Commercial Services, LLC, an affiliate of inVentiv Health, Inc. ("inVentiv"), a contract-sales organization. Our agreement with inVentiv commenced in November 2014.
50
Pursuant to termination of the inVentiv agreement, we ended our co-promotion with EMD Serono and Armune.
Summary of key expectations for revenues, operating expenditures and cash flows
The following represents forward-looking information and users are cautioned that actual results may vary.
Excluding the impact of future foreign exchange rate fluctuations, we expect that we will incur R&D costs of between $1.0 million and $2.0
million for the year ending
December 31, 2018
. We expect most of the expenses related to R&D to be for employee, commercial service, patent and consultant costs related to the Macrilen™ (macimorelin) PIP study (which Strongbridge will fund 70%).
Based on currently available information, we expect selling expenses to range between $0.2 million and $0.5 million during the year ending
December 31, 2018
.
We expect most of the expenses related to selling to be for website, branding and marketing.
Excluding the impact of foreign exchange rate fluctuations, we expect G&A expenses to range between $10.0 million and $11.0 million for the year ending
December 31, 2018
. We expect most of the expenses related to G&A to be for employee, insurance, rent, travel, and professional fees, such as legal, accounting and public company related expenses.
Excluding any foreign exchange impacts, as well as income from new business development initiatives, we expect that our overall use of cash for operations in
December 31, 2018
will range from $11.0 million to $12.0 million, as we continue to fund ongoing operating activities and working capital requirements and as outlined in the above paragraphs.
Financial Risk Factors and Other Instruments
The nature and extent of our exposure to risks arising from financial instruments, including credit risk, liquidity risk and market risk (share price risk) and how we manage those risks are described in note 22 to the Company's annual audited consolidated financial statements as at December 31, 2017 and 2016 and for the years ended December 31, 2017, 2016 and 2015.
The consolidated financial statements filed as part of this Annual Report on Form 20-F are presented under "Item 18. – Financial Statements".
|
E.
|
Off-Balance Sheet Arrangements
|
As at
December 31, 2017
, we did not have any interests in special purpose entities or any other off-balance sheet arrangements.
|
F.
|
Tabular disclosure of contractual obligations
|
Financial Liabilities, Obligations and Commitments
Expected future minimum lease payments, which also include future payments in connection with utility service agreements and future minimum sublease receipts under non-cancellable operating leases (subleases), as well as future payments in connection with service and manufacturing agreements, as at
December 31, 2017
are as follows:
|
(in thousands)
|
Minimum lease payments
|
Minimum sublease receipts
|
Service and manufacturing
|
||||||
|
$
|
$
|
$
|
|||||||
|
Less than 1 year
|
448
|
|
(143
|
)
|
403
|
|
|||
|
1 - 3 years
|
633
|
|
(26
|
)
|
283
|
|
|||
|
4 - 5 years
|
105
|
|
—
|
|
259
|
|
|||
|
More than 5 years
|
100
|
|
—
|
|
250
|
|
|||
|
Total
|
1,286
|
|
(169
|
)
|
1,195
|
|
|||
51
In accordance with the assumptions used in our employee future benefit obligation calculation as at
December 31, 2017
, undiscounted benefits expected to be paid are as follows:
|
(in thousands)
|
$
|
||
|
Less than 1 year
|
522
|
|
|
|
1 – 3 years
|
1,094
|
|
|
|
4 – 5 years
|
1,122
|
|
|
|
More than 5 years
|
16,589
|
|
|
|
Total
|
19,327
|
|
|
|
Item 6.
|
Directors, Senior Management and Employees
|
|
A.
|
Directors and senior management
|
The following table sets forth information about our directors and our senior corporate officers as at
March 27, 2018
:
|
Name and Place of Residence
|
Position with Aeterna Zentaris
|
|
|
Ammer, Nicola
|
Chief Medical Officer, Vice President Clinical Development
|
|
|
Frankfurt, Germany
|
||
|
Cardiff, Michael
|
Director
|
|
|
Ontario, Canada
|
||
|
Clavijo, James
|
Chief Financial Officer
|
|
|
Florida, United States
|
||
|
Dodd, David
|
Director
|
|
|
South Carolina, United States
|
||
|
Egbert, Carolyn
|
Chair of the Board of Directors
|
|
|
Texas, United States
|
||
|
Ernst, Juergen
|
Director
|
|
|
North Rhine-Westphalia, Germany
|
||
|
Garrison, Brian
|
Sr Vice President, Global Commercial Operations
|
|
|
Pennsylvania, United States
|
||
|
Grau, Günther
|
Vice President, Finance
|
|
|
Frankfurt, Germany
|
||
|
Guenther, Eckhard
|
Vice President, Alliance Management
|
|
|
Hessen, Germany
|
||
|
Limoges, Gérard
|
Director
|
|
|
Quebec, Canada
|
||
|
Teifel, Michael
|
Vice President, Non-Clinical Sciences
|
|
|
Hessen, Germany
|
||
|
Ward, Michael
|
President and Chief Executive Officer
|
|
|
Illinois, United States
|
||
52
There are no family relationships among any of our directors or executive officers. The following is a brief biography of each of our directors and executive officers.
Nicola Ammer
was appointed as our Vice President, Clinical Development and as Chief Medical Officer in February 2014. She serves as one of our executive officers. Dr. Ammer, who is based in the Frankfurt, Germany, office of our German subsidiary, began her career in the pharmaceutical medicine environment in the CRO business in 2002 and gained profound knowledge of all aspects of clinical research & development in various positions with increasing responsibility, including a Director of Clinical Operations. She joined Aeterna Zentaris GmbH in March 2015 as Clinical Program Director and took over the role of the Head of Clinical Development in January 2016. She possesses numerous skills in the area of pharmaceutical medicine and contributed significantly to the successful completion of the macimorelin clinical development program in the adult indication. Dr. Ammer obtained the license to practice medicine in 1995 after completion of her academic studies at the University of Essen. She was awarded a doctorate diploma in medicine by the University of Münster in 2004 and a Master of Science in Pharmaceutical Medicine by the University Duisburg-Essen in 2009.
Michael Cardiff
was appointed to our Board
on January 29, 2016 and elected as a director by our shareholders at our 2016 annual meeting. He was most recently Global Senior Vice President for the Office of the CFO Business Unit at INFOR, a $3 billion revenue software company. His business unit included software for financials, payroll, human resources, performance management, business improvement, planning and forecasting, compliance and risk management. Prior to holding that position, Mr. Cardiff held numerous senior positions in a number of technology companies, including large multinationals such as EDS, SAP and IBM, as well as startup companies such as Fincentric, Convergent Technologies, Tandem, and Stratus Computer. Mr. Cardiff is currently a director of Hydrogenics Corporation (NASDAQ: HYGS; TSX: HYG), and Startech.Com. Mr. Cardiff has also served as a director of other publicly traded companies, including Husky Injection Molding, Descartes Systems Group, Visible Genetics and Burntsand Inc. He has also been a director of private companies, including Solcorp, Spectra Security Software and Visible Decisions and not-for-profit organizations such as The Toronto Film Festival, Roy Thomson Hall and Medic Alert Foundation. Mr. Cardiff is a member of, and holds the ICD.D designation from, the Institute of Corporate Directors.
James Clavijo
became our Chief Financial Officer in March 2018. He has over 25 years of experience in executive, finance and accounting activities, including experience as a Chief Financial Officer for several pharmaceutical, healthcare and manufacturing companies. Mr. Clavijo's experience has included building, leading and advising companies with strategic plans for pharmaceutical commercialization and manufacturing, negotiating licensing and drug development agreements, as well as advising companies with complex restructurings, mergers and acquisitions, capital market transactions, and system implementations. Most recently, Mr. Clavijo served as the Chief Financial Officer for Tri-source Pharma, a pharmaceutical company focused on procuring pharmaceutical products facing supply issues and supplying pharmaceutical products to veterinary markets. Prior to, Mr. Clavijo, served for seven years as founder and principal of Capital View Partners, a consulting firm that provided Chief Financial Officer services, including regulatory and S.E.C. filings. Previously, Mr. Clavijo served for five years as the Chief Accounting Officer at Soligenix (NASDAQ: SNGX), a public biopharmaceutical company. In addition, Mr. Clavijo worked with Deloitte and Touche and was an Officer in the U.S. Army serving for 13 years in active and reserve duty. Mr. Clavijo received his license as a Certified Public Accountant from the state of Florida. Mr. Clavijo received a bachelor's in Chemistry from the University of Florida, a bachelor's, in Accounting from the University of Nebraska, and a master's degree in Accounting from Florida International University.
David A. Dodd
has served as a director on our Board since April 2013. Mr. Dodd also served as our President and Chief Executive Officer from 2013 to 2017. Since September 2017, Mr. Dodd has served as a Director and Chief Executive Officer of Medizone International, Inc., a publicly-traded (OTCQB: MZEI), global provider of disinfection solutions. Since March 2010, Mr. Dodd has been a member and ultimately chairman (from January 2011) of the Board of Directors of GeoVax Labs, Inc., a publicly-traded (OTC:GOVX) vaccine development company. Mr. Dodd's executive management experience in the pharmaceutical and biotechnology industries spans more than 35 years. Prior to joining Aeterna Zentaris, Mr. Dodd was President and Chief Executive Officer of Solvay Pharmaceuticals, Inc. During his six-year tenure as President, Chief Executive Officer and director of Serologicals Corporation, the market value of the company increased from $85 million in June 2000 to an all-cash sale to Millipore Corporation in July 2006 for $1.5 billion. He was also President, Chief Executive Officer and Chairman of BioReliance Corporation, a leading provider of biological safety and related testing services. Prior to that, Mr. Dodd held various senior management positions at Wyeth-Ayerst Laboratories, the Mead Johnson Laboratories Division at Bristol-Myers Squibb, and Abbott Laboratories. Mr. Dodd holds a Master of Science degree from Georgia State University.
Carolyn Egbert
has served as a director on our Board since August 2012 and as Chair of our Board since May 2016. After enjoying the private practice of law as a defense litigator in Michigan and Washington, D.C., she joined Solvay America, Inc. ("Solvay") (a chemical and pharmaceutical company) in Houston, Texas. Over the course of a twenty-year career with Solvay, she held the positions of Vice President, Human Resources, President of Solvay Management Services, Global Head of Human Resources and Senior Executive Vice President of Global Ethics and Compliance. During her tenure with Solvay, she served as a director on the Board of Directors of seven subsidiary companies and as Chair of one subsidiary board. After retiring in 2010, she established a
53
consulting business providing expertise in corporate governance, ethics and compliance, organizational development, executive compensation and strategic human resources. She holds a Bachelor of Sciences degree in Biological Sciences from George Washington University, Washington D.C. and a Juris Doctor degree from Seattle University, Seattle, Washington. She also was a Ph.D. candidate in Pharmacology at both Georgetown University Medical School at Washington, D.C. and Northwestern University Medical School at Chicago, Illinois. She remains an active member of both the Michigan State Bar and the District of Columbia Bar, Washington, D.C.
Juergen Ernst
has served as a director on our Board since 2005. As the former General Manager of the Pharmaceutical Sector of Solvay S.A. (international chemical and pharmaceutical group), Mr. Ernst had extensive senior management experience, where, among other functions, he oversaw the human resources department. Mr. Ernst is also a member of the Board of Directors of Pharming Group N.V., a publicly traded biotechnology company based in the Netherlands.
Brian Garrison
became our Senior Vice President, Global Commercial Operations in December 2017. For the last three years he has held the roles of National Sales Director, managing the co-promotion efforts for two endocrinology products and a urology diagnostic and as the Marketing Director for Macrilen™(macimorelin). Mr. Garrison worked at Amgen, Inc. where he held the role of Oncology Reimbursement Marketing Director. In this position, he was in charge of the Field Reimbursement Team and the Oncology Call Center for all of Amgen's oncology brands. Mr. Garrison also worked on the access strategy for several of the key oncology brands, such as Neulasta
®
, Neupogen
®
, Vectibix
®
and Imlygic
®
. Also, while at Amgen, Mr. Garrison served as a Marketing Manager in the Inflammatory Business Unit working on key access programs for Enbrel
®
. Prior to his work on Enbrel
®
, Mr. Garrison was a Sales Manager for the Bone Health Business Unit, launching the first-in-class biologic therapy for osteoporosis, Prolia
®
. Mr. Garrison began his career at Merck & Co. where he held various positions of increasing responsibility in sales and marketing, winning top national sales honors, both as a representative and sales manager. Mr. Garrison is a combat veteran, leading an infantry platoon with the 10
th
Mountain Division through combat operations in the Horn of Africa. Mr. Garrison is a graduate of the U.S. Military Academy, West Point, where he was commissioned as an Infantry officer, serving ten years active duty in the U.S. Army.
Günther
Grau
was appointed as our Vice President, Finance in February 2018. Mr. Grau, has been part of the Company since 2000. He began his career in the pharmaceutical industry at ASTA Medica AG, a predecessor of our Company, in 1995, assuming roles of increasing responsibility in areas of internal and external accounting during his career. Mr. Grau obtained a diploma in Business Administration from the Philipps-University, Marburg, in 1991.
Eckhard Günther
was appointed as our Vice President, Business Development in October 2014 and as Vice President, Alliance Management in June 2016. He serves as one of our executive officers. From 2008 through 2014, he was our Vice President, Alliance Management and Intellectual Property and from 2006 through 2008, he was our Vice President, Head of Drug Discovery and Preclinical Development. Dr. Günther, who is based in the Frankfurt, Germany, office of our German subsidiary, began his career in the pharmaceutical industry in 1985. He joined ASTA Medica AG, a predecessor of our Company, in 1990, assuming roles of increasing responsibility in areas of medicinal chemistry and drug discovery during his career. He possesses numerous scientific and business skills and has a long record of successful innovation and alliance building and management. Dr. Günther obtained a diploma in Chemistry from the Martin-Luther-University of Halle-Wittenberg in 1979 and was awarded his doctorate diploma in synthetic organic chemistry by the University of Halle-Wittenberg in 1985.
Gérard Limoges, C.M., FCPA, FCA
has served as a director on our Board since 2004. Mr. Limoges served as the Deputy Chairman of Ernst & Young LLP Canada until his retirement in September 1999. After a career of 37 years with Ernst & Young, Mr. Limoges has been devoting his time as a director of a number of companies. Mr. Limoges began his career with Ernst & Young in Montreal in 1962. After graduating from the Management Faculty of the Université de Montréal (HEC Montréal) in 1966, he wrote the CICA exams the same year (Honors: Governor General's Gold Medal for the highest marks in Canada and Gold Medal of the Ordre des Comptables Agréés du Québec). He became a chartered accountant in 1967 and partner of Ernst & Young in 1971. After practicing as auditor since 1962 and partner since 1971, he was appointed Managing Partner of the Montreal Office in 1979 and Chairman for Quebec in 1984 when he also joined the National Executive Committee. In 1992, he was appointed Vice Chairman of Ernst & Young Canada and the following year, Deputy Chairman of the Canadian firm. After retirement from practice at the end of September 1999, he was appointed Trustee of the School Board of Greater Montreal (1999), member of the Quebec Commission on Health Care and Social Services (2000-2001) and special advisor to the Rector of the Université de Montréal and affiliate schools (2000-2003). Mr. Limoges, at the request of the Board of Directors of the Université de Montréal, participated in the selection of the Dean of the Faculty of Medicine in 2011. Mr. Limoges is also a trustee and chairman of the Audit Committee of PROREIT (TSX). He is also a board member of various private companies and charities. Mr. Limoges became an FCPA, FCA (Fellow) in 1984 and received the Order of Canada in 2002.
Michael Teifel
became our Vice President, Non-Clinical Sciences in October 2014. He joined our German subsidiary, which is based in Frankfurt, in 2004, where he has been involved in a number of roles focused on the design and implementation of non-clinical development programs for small molecule drugs, targeted therapies and biologics. He serves as one of our executive
54
officers. Prior to joining us, Dr. Teifel co-founded Munich Biotech AG, which developed anti-tumor diagnostics and therapeutics, from 1998 through August 2004. Prior to founding Munich Biotech AG, Dr. Teifel was employed by Boehringer Mannheim GmbH/Roche Diagnostics GmbH where his focus was on gene therapy. He received his diploma in biology from the Technical University Darmstadt in 1992 and his doctorate from the same institution in 1996.
Michael Ward
became our President and Chief Executive Officer in July 2017. He has over thirty years of executive and legal experience in the healthcare, pharmaceutical and technology industries. Most recently, Mr. Ward served as Chief Compliance & Legal Officer and Corporate Secretary for Sagent Pharmaceuticals, a global specialty generic pharmaceutical company, and led its sale to Nichi-Iko Pharmaceutical Co., Ltd. for $736 million. Mr. Ward has served as Strategic Advisor to Benevolent Capital Partners for the last five years and is an inactive Partner with Outside GC LLC. Prior to Sagent Pharmaceuticals, Mr. Ward was Vice President, Assistant General Counsel of Global Compliance, Ethics & Litigation and Chief Privacy Officer at CDK Global. Mr. Ward has served in several executive roles and was responsible for business development, compliance, legal and operational matters in the healthcare, pharmaceutical and technology industries during his career. Mr. Ward graduated from Albion College and Case Western Reserve University Law School.
|
B.
|
Compensation
|
Our directors and executive officers are generally paid in their home country currency. Unless otherwise indicated, all compensation information included in this
document
is presented in U.S. dollars and, to the extent a director or officer has been paid in a currency other than U.S. dollars, the amounts have been converted from such person's home country currency to U.S. dollars based on the following annual average exchange rates: for the financial year ended December 31, 2017: €1.000 = U.S.$1.198 and CAN$1.000 = U.S.$0.797; for the financial year ended December 31, 2016: €1.000 = U.S.$1.110 and CAN$1.000 = U.S.$0.754; and for the financial year ended December 31, 2015: €1.000 = U.S.$1.110 and CAN$1.000 = U.S.$0.783.
Compensation of Outside Directors
The compensation paid to members of our Board who are not our employees (our "Outside Directors") is designed to (i) attract and retain the most qualified people to serve on the Board and its committees, (ii) align the interests of the Outside Directors with those of our shareholders, and (iii) provide appropriate compensation for the risks and responsibilities related to being an effective Outside Director. This compensation is recommended to the Board by the
Nominating, Governance and Compensation Committee (the "NGCC").
The NGCC is composed of three Outside Directors, each of whom is independent, namely Ms. Carolyn Egbert (Chair), Mr. Juergen Ernst and Mr. Michael Cardiff.
Retainers and Attendance Fees
Our Outside Directors are paid an annual retainer, the amount of which depends on the position held on the Board, and attendance fees. Annual retainers and attendance fees are paid on a quarterly basis to our Outside Directors , Members of the Strategic Review Committee (the "SRC") received a monthly retainer in the amount of U.S. $7,500 from July 2017 up to and including January 2018.
55
|
Type of Compensation
|
Annual Retainer for the year 2017
(in US$) |
Monthly Retainer for the year 2017
|
|
|
Chair of the Board Retainer
|
80,000
|
-
|
|
|
Board Member Retainer
|
40,000
|
-
|
|
|
Audit Committee Chair Retainer
|
20,000
|
-
|
|
|
Audit Committee Member Retainer
|
5,000
|
-
|
|
|
NGCC Chair Retainer
|
15,000
|
-
|
|
|
NGCC Member Retainer
|
3,000
|
-
|
|
|
SRC Chair Retainer
|
-
|
7,500
|
|
|
SRC Member Retainer
|
-
|
7,500
|
|
All Directors are reimbursed for travel and other out-of-pocket expenses incurred in attending Board or committee meetings.
Outstanding Option-Based Awards and Share-Based Awards
The following table shows all awards outstanding to each Outside Director as at December 31, 2017:
|
Option-based Awards
|
Share-based Awards
|
|||||||||||||||||||
|
Name
|
Issuance Date
|
Number of
Securities
Underlying
Unexercised
Options
(1)
|
Option
Exercise Price
|
Option
Expiration Date
|
Value of
Unexercised In-the-money
Options
(2)
|
Issuance Date
|
Number of
Shares or
Units of Shares
that have Not
Vested
|
Market or Payout
Value of Share-based
Awards that have Not Vested
|
||||||||||||
|
(mm-dd-yyyy)
|
(#)
|
($)
|
(mm-dd-yyyy)
|
($)
|
(mm-dd-yyyy)
|
(#)
|
($)
|
|||||||||||||
|
Cardiff, Michael
|
05-10-2016
|
20,000
|
3.48
|
05-09-2023
|
—
|
|
—
|
|
—
|
|
||||||||||
|
12-06-2016
|
7,850
|
3.45
|
12-06-2023
|
—
|
|
—
|
|
—
|
|
—
|
|
|||||||||
|
08-15-2017
|
60,000
|
2.05
|
08-15-2024
|
18,600
|
|
—
|
|
—
|
|
—
|
|
|||||||||
|
Egbert, Carolyn
|
05-10-2016
|
10,000
|
3.48
|
05-09-2023
|
—
|
|
—
|
|
—
|
|
—
|
|
||||||||
|
12-06-2016
|
7,850
|
3.45
|
12-06-2023
|
—
|
|
—
|
|
—
|
|
—
|
|
|||||||||
|
08-15-2017
|
60,000
|
2.05
|
08-15-2024
|
18,600
|
|
—
|
|
—
|
|
—
|
|
|||||||||
|
Ernst, Juergen
|
05-10-2016
|
10,000
|
3.48
|
05-09-2023
|
—
|
|
—
|
|
—
|
|
—
|
|
||||||||
|
12-06-2016
|
7,850
|
3.45
|
12-06-2023
|
—
|
|
—
|
|
—
|
|
—
|
|
|||||||||
|
08-15-2017
|
60,000
|
2.05
|
08-15-2024
|
18,600
|
|
—
|
|
—
|
|
—
|
|
|||||||||
|
Limoges, Gérard
|
05-10-2016
|
10,000
|
3.48
|
05-09-2023
|
—
|
|
—
|
|
—
|
|
—
|
|
||||||||
|
12-06-2016
|
7,850
|
3.45
|
12-06-2023
|
—
|
|
—
|
|
—
|
|
—
|
|
|||||||||
|
08-15-2017
|
60,000
|
2.05
|
08-15-2024
|
18,600
|
|
—
|
|
—
|
|
—
|
|
|||||||||
|
(1)
|
The number of securities underlying unexercised options represents all awards outstanding as at December 31, 2017.
|
|
(2)
|
"Value of unexercised in-the-money options" at financial year-end is calculated based on the difference between the closing prices of the Common Shares on the NASDAQ on the last trading day of the fiscal year (December 29, 2017) of $2.36 and the exercise price of the options, multiplied by the number of unexercised options.
|
See "Summary of the Stock Option Plan" for more details on the Stock Option Plan (as defined below).
56
Total Compensation of Outside Directors
The table below summarizes the total compensation paid to our Outside Directors during the financial year ended December 31, 2017 (all amounts are in U.S. dollars). Our Outside Directors are paid in their home currency, Messrs. Cardiff and Limoges were paid in Canadian dollars. Ms. Egbert and Mr. Newport were paid in U.S. dollars and Mr. Ernst was paid in euros.
|
Name
|
Fees earned
|
Share-based
Awards |
Option-based
Awards (1) |
Non-Equity
Incentive Plan Compensation |
Pension
Value |
All Other
Compensation |
Total
|
|||||||
|
($)
|
($)
|
($)
|
($)
|
($)
|
($)
|
($)
|
||||||||
|
Cardiff, Michael
|
92,022
|
—
|
78,000
|
—
|
—
|
—
|
170,022
|
|||||||
|
Egbert, Carolyn
|
139,022
|
—
|
50,000
|
—
|
—
|
—
|
189,022
|
|||||||
|
Ernst, Juergen
|
77,524
|
—
|
50,000
|
—
|
—
|
—
|
127,524
|
|||||||
|
Limoges, Gérard
|
73,207
|
—
|
50,000
|
—
|
—
|
—
|
123,207
|
|||||||
|
Dodd, David A.
|
17,826
|
—
|
—
|
—
|
—
|
—
|
17,826
|
|||||||
|
Newport, Kenneth
(2)
|
25,565
|
—
|
—
|
—
|
—
|
—
|
25,565
|
|||||||
_________________________
(1) The value of option based awards represents the closing price of the Common Shares on the NASDAQ on the last trading day preceding the date of grant ($2.03) multiplied by the Black-Scholes factor as at such date (81%) and the number of stock options granted on such date.
(2) Mr. Newport ceased to be a director of the Company on July 12, 2017.
During the financial year ended December 31, 2017, we paid an aggregate amount of $363,940
to all of our Outside Directors for services rendered in their capacity as directors, excluding reimbursement of out-of-pocket expenses and the value of option- based awards granted in 2017.
Compensation of Executive Officers
The following is disclosure of information related to the compensation that we paid to our “Named Executive Officers” during 2016.
For the 2017 year, our "Named Executive Officers" were as follows:
|
•
|
Mr. David A. Dodd, who served as our President and Chief Executive Officer up to and including July 20, 2017;
|
|
•
|
Mr. Michael V. Ward, who served as our Interim President and Chief Executive Officer pursuant to a services contract and not as our employee, from July 20, 2017 up to and including October 1, 2017; and currently serves as President and Chief Executive Officer as an employee from October 1, 2017;
|
|
•
|
Mr. Jeffrey Whitnell, who served as our Interim Chief Financial Officer from September 25, 2017 up to December 7, 2017;
|
|
•
|
Ms. Genevieve Lemaire, who served as our Vice President, Finance and Chief Accounting Officer and as our interim principal financial officer pursuant to a services contract and not as our employee, up to and including September 30, 2017; and
|
|
•
|
Mr. Philip A. Theodore, Senior Vice President, Chief Administrative Officer, General Counsel and Corporate Secretary up to and including July 28, 2017; and Jude Dinges, our Senior Vice President and Chief Commercial Officer up to and including November 3, 2017; and Dr. Richard Sachse, our Senior Vice President and Chief Scientific and Chief Medical Officer, who were our three most highly compensated executive officers (other than our Chief Executive Officer, our current and former Chief Accounting Officer and interim principal financial officer) during 2017.
|
Compensation Discussion & Analysis
Compensation Philosophy and Objectives
Our Board, through the NGCC, establishes our executive compensation program that is market-based and at a competitive percentile grouping for both total cash and total direct compensation. The NGCC has established a compensation program that is designed
57
to attract, motivate and retain high-performing senior executives, encourage and reward superior performance and align the executives' interests with those of our shareholders by:
|
•
|
providing the opportunity for an executive to earn compensation that is competitive with the compensation received by executives serving in the same or measurably similar positions within comparable companies;
|
|
•
|
providing the opportunity for executives to participate in equity-based incentive compensation plans;
|
|
•
|
aligning executive compensation with our corporate objectives; and
|
|
•
|
attracting and retaining highly qualified individuals in key positions.
|
Compensation
Elements
Our executive compensation is targeted at the 50th percentile for small cap biopharmaceutical companies within both the local and national markets and is comprised of both fixed and variable components. The variable components include equity and non-equity incentive plans. Each compensation component is intended to serve a different function, but all elements are intended to work in concert to maximize both corporate and individual performance by establishing specific, competitive operational and corporate goals and by providing financial incentives to employees based on their level of attainment of these goals.
Our current executive compensation program is comprised of the following four basic components: (i) base salary; (ii) an annual bonus linked to both individual and corporate performance; (iii) equity incentives, consisting solely of stock options granted under our second amended and restated stock option plan adopted by the Board on March 29, 2016 and ratified by the shareholders of Aeterna on May 10, 2016 (the "Stock Option Plan") established for the benefit of our directors, certain executive officers and other participants as may be designated from time to time by either the Board or the NGCC; and (iv) other elements of compensation, consisting of benefits, perquisites and retirement benefits.
Base Salary.
Base salaries are intended to provide a steady income to our executive officers regardless of share price. In determining individual base salaries, the NGCC takes into consideration individual circumstances that may include the scope of an executive's position, the executive's relevant competencies or experience and retention risk. The NGCC also takes into consideration the fulfillment of our corporate objectives, as well as the individual performance of the executive.
Short-Term, Non-Equity Incentive Compensation.
Our short-term, non-equity incentive compensation plan sets a target cash bonus for each executive officer, expressed as a percentage of the executive officer's base salary. The amount of cash bonus paid to an executive officer depends on the extent to which he or she contributed to the achievement of the annual performance objectives established by the Board for the year. The annual performance objectives are specific operational, clinical, regulatory, financial, commercial and corporate goals that are intended to advance our product pipeline, to promote the success of our commercial efforts and to enhance our financial position. The annual performance objectives are set at the end of each financial year as part of the annual review of corporate strategies. The performance objectives are not established for individual executive officers but rather by functional area(s), many of which are carried out by or fall within the responsibility of our President and Chief Executive Officer, Chief Financial Officer (or principal financial officer) and our other executive officers, including our Named Executive Officers. The award of a cash bonus requires the approval of both the NGCC and the Board and is based upon an assessment of each individual's performance, as well as our overall performance at a corporate level. The determination of individual performance does not involve quantitative measures using a mathematical calculation in which each individual performance objective is given a numerical weight. Instead, the NGCC's determination of individual performance is a subjective determination as to whether a particular executive officer substantially achieved the stated objectives or over-performed or under-performed with respect to corporate objectives that were deemed to be important to our success.
Long-Term Equity Compensation Plan of Executive Officers.
The long-term component of the compensation of our executive officers is based exclusively on the Stock Option Plan, which permits the award of a number of options based on the contribution of the officers and their responsibilities. The Board adopted a policy regarding stock option grants in December 2014 (the "2014 Stock Option Policy"), which provides that each Named Executive Officer is eligible to receive options to acquire our Common Shares having a value, based on the Black-Scholes option pricing model, equal to a specified multiple of his or her salary. The specified multiple for the President and Chief Executive Officer is 1.5. The specified multiple for each other Named Executive Officer is 0.75. To encourage retention and focus management on developing and successfully implementing our continuing growth strategy, stock options vest over a period of three years, with the first third vesting on the first anniversary of the date of grant. Stock options are usually granted to executive officers in December of each year.
Other Forms of Compensation.
Our executive employee benefits program also includes life, medical, dental and disability insurance to the same extent and in the same manner as all other employees. Several of our executive officers also receive a car allowance as a perquisite. These benefits and perquisites are designed to be competitive overall with equivalent positions in comparable
58
North American organizations in the life sciences industry. We also contribute to our North American employees' retirement plans to the extent of 50% of the employee's contribution up to an annual maximum amount of $9,000 for employees in the United States, and up to a maximum of $12,000 for employees and executive officers over 50 years old in the United States. The contribution amounts for our United States employees are subject to limitations imposed by the United States Internal Revenue Service on contributions to our most highly compensated employees. Employees based in Frankfurt, Germany also benefit from certain employer contributions into the employees' pension funds. Our executive officers, including the Named Executive Officers, are eligible to participate in such employer-contribution plans to the same extent and in the same manner as all other employees
.
Positioning
The NGCC is authorized to engage its own independent consultant to advise it with respect to executive compensation matters. While the NGCC may rely on external information and advice, all of the decisions with respect to executive compensation are made by the Board upon the recommendation of the NGCC and may reflect factors and considerations other than, or that may differ from, the information and recommendations provided by any external compensation consultants that may be retained from time to time.
In 2013, the NGCC retained a compensation consultant to benchmark our executive compensation plan in an effort to determine whether we were achieving our objective of providing market competitive compensation opportunities. The compensation consultant gathered compensation data from companies that it concluded were of comparable size and/or stage of development as us and from other companies with which we compete for executive talent and advised the NGCC that our executive compensation should be generally aligned with the 50th percentile, or the mid-point, of the companies surveyed by the consultant. Furthermore, the consultant advised the NGCC that the total cash target payment (base salary and, if applicable or awarded in cash, annual bonus) for our executive officers in 2013 generally fell around the 50th percentile of the companies surveyed. The NGCC did not repeat or update the benchmarking process in 2014, 2015, 2016 or 2017 because it concluded that doing so would not provide additional meaningful data, considering the expense of the process. However, the NGCC, as a matter of good governance, will review and assess the current compensation program and make appropriate adjustments, if any, during 2018.
Risk Assessment of Executive Compensation Program
The Board, through the NGCC, oversees the implementation of compensation methods that tie a portion of executive compensation to our short-term and longer-term performance and that of each executive officer and that take into account the advantages and risks associated with such compensation methods. In addition, the Board oversees the creation of compensation policies that are intended to reward the creation of shareholder value while reflecting a balance between our short-term and longer-term performance and that of each executive officer. The NGCC has considered in general terms the concept of risk as it relates to our executive compensation program.
Base salaries are fixed in amount to provide a steady income to the executive officers regardless of share price and thus do not encourage or reward risk-taking to the detriment of other important business, operational, commercial or clinical metrics or milestones. The variable compensation elements (annual bonuses and stock options) are designed to reward each of short-term, mid-term and long-term performance. For short-term performance, a discretionary annual bonus may be awarded based on the timing and level of attainment of specific operational and corporate goals that the NGCC believes to be challenging, yet does not encourage unnecessary or excessive risk-taking. While our bonus payments are generally based on annual performance, a maximum bonus payment is pre-fixed for each senior executive officer and represents only a portion of each individual's overall total compensation opportunities. In exceptional circumstances, a particular executive officer may be awarded a bonus that exceeds his or her maximum pre-fixed or target bonus amount. Finally, a significant portion of executive compensation is provided in the form of stock options, which is intended to further align the interests of executives with those of shareholders. The NGCC believes that these awards do not encourage unnecessary or excessive risk-taking since the ultimate value of the awards is tied to our share price, and in the case of grants under the long-term incentive compensation plan, are generally subject to mid-term and long-term vesting schedules to help ensure that executives generally have significant value tied to long-term share price performance.
The NGCC believes that the variable compensation elements (annual bonuses and stock options) represent a percentage of overall compensation that is sufficient to motivate our executive officers to produce superior short-term, mid-term and long-term corporate results, while the fixed compensation element (base salary) is also sufficient to discourage executive officers from taking unnecessary or excessive risks. The NGCC and the Board also generally have the discretion to adjust annual bonuses and stock option grants based on individual performance and any other factors they may determine to be appropriate in the circumstances. Such factors may include, where necessary or appropriate, the level of risk-taking a particular executive officer may have engaged in during the preceding year.
Based on the foregoing, the NGCC has not identified any specific risks associated with our executive compensation program that are reasonably likely to have a material adverse effect on us. The NGCC believes that our executive compensation program does not encourage or reward any unnecessary or excessive risk-taking behavior.
59
Our directors, executive officers and employees are prohibited from purchasing, selling or otherwise trading in derivative securities relating to our Common Shares. Derivative securities are securities whose value varies in relation to the price of our securities. Examples of derivative securities include warrants to purchase our Common Shares, and put or call options written on our Common Shares, as well as individually arranged derivative transactions, such as financial instruments, including, for greater certainty, pre-paid variable forward contracts, equity swaps, collars, or units of exchange funds, which are designed to hedge or offset a decrease in market value of our equity securities granted as executive compensation or directors' remuneration. Options to acquire Common Shares issued pursuant to our Stock Option Plan are not derivative securities for this purpose.
60
2017
Compensation
Base Salary.
The primary element of our compensation program is base salary. Our view is that a competitive base salary is a necessary element for retaining qualified executive officers. In determining individual base salaries, the NGCC takes into consideration individual circumstances that may include the scope of an executive's position, the executive's relevant competencies or experience and retention risk. The NGCC also takes into consideration the fulfillment of our corporate objectives, as well as the individual performance of the executive.
Short-Term, Non-Equity Incentive Compensation.
The Board, based on the NGCC's recommendation, adopted the following performance objectives for 2017:
|
Goal
|
Result
|
|
|
Strengthen Financial Leadership
|
Hire new CFO (contingent on positive results for Macrilen™ and/or Zoptrex™)
|
On September 25, 2017, the Company announced the appointment of Jeffrey Whitnell to the position of Interim CFO. Mr. Whitnell resigned as CFO effective December 7, 2017. On March 5, 2018, the Company appointed James Clavijo as CFO, effective that date.
|
|
Financing
|
Secure minimum of $15 Million (contingent on positive results for Macrilen™ and/or Zoptrex™), within parameters to be determined by the Board at the time of the financing
|
Not completed. The Company worked on securing the Strongbridge License Agreement
|
|
Investment Banking Relationships
|
Identify 2-3 new improved-tier
investment-banking relationships for presentation to and evaluation by the Board
|
Not completed. The Company continues to work to establish improved investment banking relationships
|
|
Zoptrex™
|
Report top-line results
|
Results were unsuccessful.
|
|
If trial successful, submit regulatory dossier
|
In light of the results of Zoptrex
TM
study, the Company shifted its focus to the commercialization of Macrilen
TM
(macimorlein)
|
|
|
Macrilen™
|
Report top-line results
|
Results were released. FDA approval issued on December 20, 2017.
|
|
If confirmatory trial successful, complete submission dossier
|
||
|
Commercial Operations
|
Launch Macrilen™ field selling
|
Not completed. The Company worked on securing the Strongbridge License Agreement
|
|
Achieve total revenues of $2.34 Million:
Macrilen™: $1.0 M
|
The Company achieved revenues of $0.9 million in 2017. Revenues of Macrilen
TM
(macimorlein) reported in 2018
|
|
|
Apifiny®: $700,000
Saizen®: $343,000
|
The Company achieved sales of $0.5 million in 2017
|
|
|
Business Development
|
Out-license Zoptrex™ for Europe and other non-US territories
|
Not completed. Results were unsuccessful
|
|
Out-license Macrilen™ for Europe and other non-US territories
|
Not completed. The Company continues to explore out-licensing opportunities
|
|
|
Present proposal for in-license of Lutrate Depot to Board
|
Not completed
|
|
The Chief Executive Officer recommended to the NGCC that we award a cash bonus to Dr. Richard Sachse, our Senior Vice President, Chief Medical Officer and Chief Scientific Officer with respect to 2017. The NCC concurred with the Chief Executive Officer's recommendation as did the full Board. Dr. Sachse was awarded a cash bonus with respect to 2017 in the amount of €100,000 (equivalent to $120,000), which represented 50% of his target bonus. The bonus was recommended by the Chief Executive Officer based on performance he deemed significant.
61
Long-Term Equity Compensation
The Board approved option awards to Mr. Ward on August 15, 2017 in accordance with the Stock Option Plan. Mr. Ward was awarded 150,000 stock options. The stock options have an exercise price of $2.05 and vest in three annual installments commencing on August 15, 2018.
Summary of the Stock Option Plan
We established the Stock Option Plan in order to attract and retain directors, officers, employees and suppliers of ongoing services, who will be motivated to work towards ensuring our success.
The Board has full and complete authority to interpret the Stock Option Plan, to establish applicable rules and regulations and to make all other determinations it deems necessary or useful for the administration of the Stock Option Plan, provided that such interpretations, rules, regulations and determinations are consistent with the rules of all stock exchanges and quotation systems on which our securities are then traded and with all relevant securities legislation.
The Stock Option Plan provides that the sole persons eligible to receive grants under the Stock Option Plan (each, a "Participant") shall be: (i) our most senior executive officers, including the persons occupying the positions of Chief Executive Officer, Chief Financial Officer, Chief Scientific Officer, Chief Commercial Officer, Chief Administrative Officer and Chief Compliance Officer; (ii) such other of our executive officers or executive officers of our subsidiaries that may, from time to time, report directly to the Chief Executive Officer; (iii) the non-employee, independent members of the Board; and (iv) such other of our officers or employees or the officers or employees of any of our subsidiaries, as the case may be, or suppliers of ongoing services, as may be expressly designated by resolution of the Board or the NGCC.
The maximum number of Common Shares issuable under the Stock Option Plan is fixed at 11.4% of the issued and outstanding Common Shares at any given time, which, as of
March 27, 2018
, represented approximately
1.9
million Common Shares. There were
711,252
options outstanding under the Stock Option Plan representing approximately
4.3%
of all issued and outstanding Common Shares on
March 27, 2018
.
Under the Stock Option Plan, (i) the number of securities issuable to insiders, at any time, or issued within any one-year period, under all of our security-based compensation arrangements, cannot exceed 10% of our issued and outstanding securities and (ii) no single Participant may hold options to purchase, from time to time, more than 5% of our issued and outstanding Common Shares. In addition: (i) the aggregate fair value of options granted under all of our security-based compensation arrangements to any one of our Outside Directors entitled to receive a benefit under the Stock Option Plan, within any one-year period, cannot exceed $100,000 valued on a Black-Scholes basis and as determined by the NGCC; and (ii) the aggregate number of securities issuable to all of our Outside Directors entitled to receive a benefit under the Stock Option Plan, within any one-year period, under all of our security-based compensation arrangements, cannot exceed 1% of its issued and outstanding securities.
Options granted under the Stock Option Plan may be exercised at any time within a maximum period of seven or ten years following the date of their grant (the "Outside Expiry Date"), depending on the date of grant. The Board or the NGCC, as the case may be, designates, at its discretion, the specific Participants to whom stock options are granted under the Stock Option Plan and determines the number of Common Shares covered by each of such option grants, the grant date, the exercise price of each option, the Outside Expiry Date and any other matter relating thereto, in each case in accordance with the applicable rules and regulations of the regulatory authorities. The price at which the Common Shares may be purchased may not be lower than the greater of the closing prices of the Common Shares on the NASDAQ on the last trading day preceding the date of grant of the option. Options granted under the Stock Option Plan shall vest in equal tranches over a three-year period (one-third each year, starting on the first anniversary of the grant date) or as otherwise determined by the Board or the NGCC, as the case may be. Participants may not assign their options (nor any interest therein) other than by will or in accordance with the applicable laws of estates and succession.
Unless the Board or the NGCC decides otherwise, Participants cease to be entitled to exercise their options under the Stock Option Plan: (i) immediately, in the event a Participant who is an officer or employee resigns or voluntarily leaves his or her employment or his or her employment is terminated with cause and, in the case of a Participant who is a non-employee director of us or one of our subsidiaries, the date on which such Participant ceases to be a member of the relevant Board of Directors; (ii) six months following the date on which employment is terminated as a result of the death of a Participant who is an officer or employee and, in the case of a Participant who is an Outside Director, six months following the date on which such Participant ceases to be a member of the Board of Directors by reason of death; (iii) 90 days following the date on which a Participant's employment is terminated for a reason other than those mentioned in (i) or (ii) above including, without limitation, upon the disability, long-term illness, retirement or early retirement of the Participant; and (iv) where the Participant is a service supplier, 30 days following the date on which such Participant ceases to act as such, for any cause or reason (each, an "Early Expiry Date").
The Stock Option Plan also provides that, if the expiry date of one or more options (whether an Early Expiry Date or an Outside Expiry Date) occurs during a "blackout period" or within the seven business days immediately after a blackout period imposed by
62
us, the expiry date will be automatically extended to the date that is seven business days after the last day of the blackout period. For the purposes of the foregoing, "blackout period" means the period during which trading in our securities is restricted in accordance with our corporate policies.
If (i) we accept an offer to amalgamate, merge or consolidate with any other entity (other than one of our wholly-owned subsidiaries) or to sell or license all or substantially all of our assets to any other entity (other than one of our wholly-owned subsidiaries); (ii) we sign a support agreement in customary form pursuant to which the Board agrees to support a takeover bid and recommends that our shareholders tender their Common Shares to such takeover bid; or (iii) holders of more than 50% of our then outstanding Common Shares tender all of their Common Shares to a takeover bid made to all of the holders of the Common Shares to purchase all of the then issued and outstanding Common Shares, then, in each case, all of the outstanding options shall, without any further action required to be taken by us, immediately vest. Each Participant shall thereafter be entitled to exercise all of such options at any time up to and including, but not after the close of business on that date which is ten days following the Closing Date (as defined below). Upon the expiration of such ten-day period, all rights of the Participant to such options or to the exercise of same (to the extent not already exercised) shall automatically terminate and have no further force or effect whatsoever. "Closing Date" is defined to mean (x) the closing date of the amalgamation, merger, consolidation, sale or license transaction in the case of clause (i) above; (y) the first expiry date of the takeover bid on which each of the offeror's conditions are either satisfied or waived in the case of clause (ii) above; or (z) the date on which it is publicly announced that holders of greater than 50% of our then outstanding Common Shares have tendered their Common Shares to a takeover bid in the case of clause (iii) above.
The Stock Option Plan provides that the following amendments may be made to the plan only upon approval of each of the Board and our shareholders as well as receipt of all required regulatory approvals:
|
•
|
any amendment to Section 3.2 of the Stock Option Plan (which sets forth the limit on the number of options that may be granted to insiders) that would have the effect of permitting, without having to obtain shareholder approval on a "disinterested vote" at a duly convened shareholders' meeting, the grant of any option(s) under the Stock Option Plan otherwise prohibited by Section 3.2;
|
|
•
|
any amendment to the number of securities issuable under the Stock Option Plan (except for certain permitted adjustments, such as in the case of stock splits, consolidations or reclassifications);
|
|
•
|
any amendment that would permit any option granted under the Stock Option Plan to be transferable or assignable other than by will or in accordance with the applicable laws of estates and succession;
|
|
•
|
the addition of a cashless exercise feature, payable in cash or securities, which does not provide for a full deduction of the number of underlying securities from the Stock Option Plan reserve;
|
|
•
|
the addition of a deferred or restricted share unit component or any other provision that results in employees receiving securities while no cash consideration is received by us;
|
|
•
|
with respect to any Participant, whether or not such Participant is an "insider" and except in respect of certain permitted adjustments, such as in the case of stock splits, consolidations or reclassifications:
|
|
•
|
any reduction in the exercise price of any option after the option has been granted, or
|
|
•
|
any cancellation of an option and the re-grant of that option under different terms, or
|
|
•
|
any extension to the term of an option beyond its Outside Expiry Date to a Participant who is an "insider" (except for extensions made in the context of a "blackout period");
|
|
•
|
any amendment to the method of determining the exercise price of an option granted pursuant to the Stock Option Plan;
|
|
•
|
the addition of any form of financial assistance or any amendment to a financial assistance provision which is more favorable to employees; and
|
|
•
|
any amendment to the foregoing amending provisions requiring Board, shareholder and regulatory approvals.
|
The Stock Option Plan further provides that the following amendments may be made to the Stock Option Plan upon approval of the Board and upon receipt of all required regulatory approvals, but without shareholder approval:
|
•
|
amendments of a "housekeeping" or clerical nature or to clarify the provisions of the Stock Option Plan;
|
|
•
|
amendments regarding any vesting period of an option;
|
63
|
•
|
amendments regarding the extension of an option beyond an Early Expiry Date in respect of any Participant, or the extension of an option beyond the Outside Expiry Date in respect of any Participant who is a "non-insider";
|
|
•
|
adjustments to the number of issuable Common Shares underlying, or the exercise price of, outstanding options resulting from a split or a consolidation of the Common Shares, a reclassification, the payment of a stock dividend, the payment of a special cash or non-cash distribution to our shareholders on a
pro rata
basis provided such distribution is approved by our shareholders in accordance with applicable law, a recapitalization, a reorganization or any other event which necessitates an equitable adjustment to the outstanding options in proportion with corresponding adjustments made to all outstanding Common Shares;
|
|
•
|
discontinuing or terminating the Stock Option Plan; and
|
|
•
|
any other amendment which does not require shareholder approval under the terms of the Stock Option Plan.
|
Outstanding Option-Based Awards and Share-Based Awards
The following table shows all awards outstanding to our Named Executive Officers as of December 31, 2017:
|
Option-based Awards
|
Share-based Awards
|
||||||||||||||||
|
Name
|
Issuance Date
|
Number of
Securities Underlying Unexercised Options (1) |
Option
Exercise Price |
Option
Expiration Date |
Value of
Unexercised In-the-money Options (2) |
Issuance Date
|
Number of
Shares or Units of shares that have Not Vested |
Market or Payout
Value of Share-based Awards that have Not Vested |
|||||||||
|
(mm-dd-yyyy)
|
(#)
|
($)
|
(mm-dd-yyyy)
|
($)
|
(#)
|
($)
|
|||||||||||
|
Dodd, David A.
(3)
|
—
|
—
|
—
|
—
|
—
|
—
|
—
|
—
|
|||||||||
|
Theodore, Philip
(4)
|
—
|
—
|
—
|
—
|
—
|
—
|
—
|
—
|
|||||||||
|
Dinges, Jude
(5)
|
—
|
—
|
—
|
—
|
—
|
—
|
—
|
—
|
|||||||||
|
Sachse, Richard
|
12/21/2015
|
40,000
|
4.58
|
12/20/2022
|
—
|
—
|
—
|
—
|
|||||||||
|
11/08/2016
|
2,800
|
3.50
|
11/08/2023
|
—
|
—
|
—
|
—
|
||||||||||
|
12/06/2016
|
57,360
|
3.45
|
12/06/2023
|
—
|
—
|
—
|
—
|
||||||||||
|
12/16/2016
|
28,950
|
3.80
|
12/16/2023
|
—
|
—
|
—
|
—
|
||||||||||
|
Ward, Michael V.
(6)
|
08/15/2017
|
150,000
|
(3)
|
2.05
|
08/15/2024
|
46,500
|
—
|
—
|
—
|
||||||||
|
Lemaire, Genevieve
(7)
|
—
|
—
|
—
|
—
|
—
|
—
|
—
|
—
|
|||||||||
|
Whitnell, Jeffrey
|
—
|
—
|
—
|
—
|
—
|
—
|
—
|
—
|
|||||||||
_________________________
|
(1)
|
The number of securities underlying unexercised options represents all awards outstanding at December 31, 2017.
|
|
(2)
|
"Value of unexercised in-the-money options" at financial year-end is calculated based on the difference between the closing price of the Common Shares on the NASDAQ on the last trading day of the fiscal year (December 29, 2017) of $2.36 and the exercise price of the options, multiplied by the number of unexercised options.
|
|
(3)
|
Mr. Dodd ceased to be the Company's President and Chief Executive Officer on July 20, 2017. All outstanding stock options held by Mr. Dodd were cancelled effective as of his termination date in accordance with the provisions of the Stock Option Plan.
|
|
(4)
|
Mr. Theodore ceased to be the Company's Senior Vice President, Chief Administrative Officer, General Counsel and Corporate Secretary on July 28, 2017. All outstanding stock options held by Mr. Theodore were cancelled effective as of his termination date in accordance with the provisions of the Stock Option Plan.
|
|
(5)
|
Mr. Dinges' employment was terminated on November 3, 2017. All outstanding stock options held by Mr. Dinges were cancelled effective as of his termination date in accordance with the provisions of the Stock Option Plan.
|
|
(6)
|
Michael V. Ward was appointed President and Chief Executive Officer effective October 1, 2017 and was granted 150,000 stock options in connection with his appointment as Interim President and Chief Executive Officer.
|
(7) Ms. Lemaire served as interim principal financial officer pursuant to a services contract and is not entitled to receive incentive plan awards.
There were no share-based awards outstanding
at December 31, 2017
.
64
Incentive Plan Awards - Value Vested or Earned During the Year
The following table shows the incentive plan awards value vested or earned for each Named Executive Officer for the financial year ended December 31, 2017:
|
Name
|
Option-based awards — Value
vested during the year (1) |
Share-based awards —
Value vested during the year |
Non-equity incentive plan compensation — Value earned during the year
|
|||
|
($)
|
($)
|
($)
|
||||
|
Dodd, David A.
|
—
|
—
|
—
|
|||
|
Theodore, Philip A.
|
—
|
—
|
—
|
|||
|
Dinges, Jude
|
—
|
—
|
—
|
|||
|
Sachse, Richard
|
—
|
—
|
120,000
|
|||
|
Ward, Michael V.
|
—
|
—
|
—
|
|||
|
Lemaire, Genevieve
(2)
|
—
|
—
|
—
|
|||
|
Whitnell, Jeffrey
|
—
|
—
|
—
|
|||
|
(1)
|
Represents the aggregate dollar value that would have been realized if the options had been exercised on the vesting date, based on the difference between the closing price of the Common Shares on the NASDAQ and the exercise price on such vesting date.
|
(2) Ms. Lemaire served as interim principal financial officer pursuant to a services contract and is not entitled to receive incentive plan awards.
65
Summary Compensation Table
The Summary Compensation Table set forth below shows compensation information for each of the Named Executive Officers for services rendered in all capacities during each of the financial years ended December 31, 2017, 2016 and 2015. All amounts in the table below are in U.S. dollars. All cash amounts paid to Messrs. Ward, Dodd, Dinges, Whitnell and Theodore were paid in U.S. dollars, while Ms. Lemaire’s cash payments were made in Canadian dollars and Dr. Sachse’s cash payments were made in euros.
|
Non-equity incentive plan compensation
|
||||||||||||||||||||||||
|
Name and principal position
|
Years
|
Salary
|
Share
based awards |
Option based awards (1)
|
Annual
incentive plan |
Long-term
incentive plans |
Pension
Value |
All other compensation (2)
|
Total
compensation |
|||||||||||||||
|
($)
|
($)
|
($)
|
($)
|
($)
|
($)
|
($)
|
($)
|
|||||||||||||||||
|
Ward, Michael V.
(3)
President and Chief Executive Officer
|
2017
|
121,461
|
—
|
|
248,091
|
|
—
|
|
—
|
|
—
|
|
—
|
|
369,552
|
|
||||||||
|
2016
|
—
|
|
—
|
|
—
|
|
—
|
|
—
|
|
—
|
|
—
|
|
—
|
|
||||||||
|
2015
|
—
|
|
—
|
|
—
|
|
—
|
|
—
|
|
—
|
|
—
|
|
—
|
|
||||||||
|
Whitnell, Jeffrey
(4)
Former Interim Chief Financial Officer
|
2017
|
76,920
|
|
—
|
|
—
|
|
—
|
|
—
|
|
—
|
|
—
|
|
76,920
|
|
|||||||
|
2016
|
—
|
|
—
|
|
—
|
|
—
|
|
—
|
|
—
|
|
—
|
|
—
|
|
||||||||
|
2015
|
—
|
|
—
|
|
—
|
|
—
|
|
—
|
|
—
|
|
—
|
|
—
|
|
||||||||
|
Dodd, David A.
(5)
Former President and Chief Executive Officer |
2017
|
273,770
|
|
—
|
|
—
|
|
—
|
|
—
|
|
—
|
|
—
|
|
273,770
|
|
|||||||
|
2016
|
475,000
|
—
|
|
712,500
|
|
—
|
|
—
|
|
—
|
|
—
|
|
1,187,500
|
|
|||||||||
|
2015
|
475,000
|
—
|
|
358,690
|
|
—
|
|
—
|
|
—
|
|
—
|
|
833,690
|
|
|||||||||
|
Lemaire, Genevieve
(6)
Former Vice President, Finance and Chief Accounting Officer |
2017
|
—
|
|
—
|
|
—
|
|
—
|
|
|
—
|
|
—
|
|
237,552
|
|
(7)
|
237,552
|
|
|||||
|
2016
|
—
|
|
—
|
|
—
|
|
—
|
|
|
—
|
|
—
|
|
210,156
|
|
210,156
|
|
|||||||
|
2015
|
—
|
|
—
|
|
—
|
|
—
|
|
|
—
|
|
—
|
|
—
|
|
—
|
|
|||||||
|
Sachse, Richard
(7)
Former Senior Vice President, Chief Scientific Officer and Chief Medical Officer |
2017
|
222,000
|
—
|
|
257,000
|
|
100,000
|
|
—
|
|
37,067
|
|
(8)
|
—
|
|
616,067
|
|
|||||||
|
2016
|
222,000
|
—
|
|
257,000
|
|
55,500
|
|
—
|
|
37,067
|
|
(8)
|
—
|
|
571,567
|
|
||||||||
|
2015
|
221,900
|
—
|
|
168,795
|
|
111,000
|
|
—
|
|
47,349
|
|
(8)
|
—
|
|
549,044
|
|
||||||||
|
Dinges, Jude
(8)
Former Senior Vice President and Chief Commercial Officer |
2017
|
277,596
|
—
|
|
—
|
|
—
|
|
—
|
|
—
|
|
—
|
|
277,596
|
|
||||||||
|
2016
|
320,000
|
—
|
|
240,000
|
|
—
|
|
—
|
|
—
|
|
—
|
|
560,000
|
|
|||||||||
|
2015
|
320,000
|
—
|
|
168,795
|
|
—
|
|
—
|
|
—
|
|
—
|
|
488,795
|
|
|||||||||
|
Theodore, Philip A.
(9)
Former Senior Vice President, Chief Administrative Officer and General Counsel |
2017
|
196,154
|
—
|
|
—
|
|
—
|
|
—
|
|
—
|
|
—
|
|
196,154
|
|
||||||||
|
2016
|
320,000
|
—
|
|
240,000
|
|
64,000
|
|
—
|
|
—
|
|
—
|
|
624,000
|
|
|||||||||
|
2015
|
320,000
|
|
—
|
|
168,795
|
|
35,000
|
|
—
|
|
—
|
|
—
|
|
523,795
|
|
||||||||
_________________________
|
(1)
|
The value of option-based awards represents the closing price of the Common Shares on the NASDAQ on the last trading day preceding the date of grant multiplied by the Black-Scholes factor as at such date and the number of stock options granted on such date. The following table sets forth the value of the option-based awards and the corresponding Black-Scholes factor:
|
|
Date of Grant
|
Value of Grant
|
Black-Scholes Factor
|
|
December 21, 2015
|
$4.58
|
92.14%
|
|
November 9, 2016
|
$3.50
|
80.35%
|
|
December 6, 2016
|
$3.45
|
80.57%
|
|
December 16, 2016
|
$3.80
|
80.68%
|
|
August 15, 2017
|
$2.05
|
80.70%
|
|
(2)
|
“All Other Compensation” represents perquisites and other personal benefits which, in the aggregate, amount to $50,000 or more, or are equivalent to 10% or more of a Named Executive Officer's total salary for the financial year ended December 31, 2017. The type and amount of each perquisite, the value of which exceeds 25% of the total value of perquisites, is separately disclosed for each Named Executive Officer, if applicable.
|
|
(3)
|
Mr. Ward became our Interim Presdient and Chief Executive Officer on July 20, 2017. All values reflective are for partial year considerations. Effective December 11, 2017, Mr. Ward's base salary increased to $325,000 upon approval of Macrilen
TM
(macrilomen) by the FDA.
|
66
|
(4)
|
Mr. Whitnell resigned effective December 7, 2017.
|
|
(5)
|
Mr. Dodd ceased to be the Company's President and Chief Executive Officer on July 20, 2017. All outstanding stock options held by Mr. Dodd were cancelled effective as of his termination date in accordance with the provisions of the Stock Option Plan.
|
|
(6)
|
Ms. Lemaire provides services to us as a contractor and not as an employee. She is compensated for her services at the rate of CAN$170 per hour. She is not entitled to participate in or to receive benefits pursuant to any of our programs customarily made available to our employees. The amount shown represents all payments to her pursuant to her agreement with us.
|
|
(7)
|
We maintain a reinsured benevolent fund (
Rückgedeckte Unterstützungskasse
), which is a type of private defined contribution pension plan, for Dr. Sachse. We contribute to a private pension provider an amount equal to 2.4% of Dr. Sachse’s salary, up to a monthly salary limit of €6,050, plus an additional contribution of 18% of the amount of Dr. Sachse’s salary that exceeds the monthly limit. Dr. Sachse also contributes a percentage of his salary to the plan. We are liable to Dr. Sachse for the pension benefits that have been promised, if the private pension provider does not, or cannot, pay the promised pension payments. We obtained reinsurance against the insolvency or liquidation of the private pension provider. The table below sets forth additional information regarding Dr. Sachse’s pension plan. The difference between (i) the sum of the Accumulated Value at Start of Year column plus the Compensatory column and (ii) the Accumulated Value at End of Year column is attributable to Dr. Sachse’s contributions to the pension plan during the year ended December 31, 2017, as well as changes in the foreign exchange rate, his contributions being made in euros.
|
|
Accumulated value at start of year
|
Compensatory
|
Accumulated value at year end
|
|
$106,391
|
$27,248
|
$133,639
|
|
(8)
|
Jude Dinges' employment was terminated on November 3, 2017. All outstanding stock options held by Mr. Dinges were cancelled effective as of his termination date in accordance with the provisions of the Stock Option Plan.
|
Philip A. Theodore's employment was terminated on July 28, 2017. All outstanding stock options held by Mr. Theodore were cancelled effective as of his termination date in accordance with the provisions of the Stock Option Plan.
Compensation of the Chief Executive Officer
The compensation of our President and Chief Executive Officer is governed by our executive compensation policy described in the section titled "Compensation of Executive Officers", and the President and Chief Executive Officer participates, together with the other Named Executive Officers, in all of our incentive plans.
Mr. Ward's total earnings during the financial year ended December 31, 2017 was $121,461. Mr. Ward was not awarded an annual incentive bonus with respect to 2017.
Mr. Dodd's total earned salary during the financial year ended December 31, 2017 was $274,154. Mr. Dodd was not awarded an annual incentive bonus with respect to 2017.
For the financial year ended December 31, 2017, the NGCC recommended that 150,000 stock options be granted to Mr. Ward under our Stock Option Plan. The grant to Mr. Ward is included in the Summary Compensation Table above under the column captioned "Option-Based Awards".
See "Long-Term Equity Compensation Plan of Executive Officers - Summary of the Stock Option Plan", for a complete description of the Stock Option Plan.
Pension, retirement or similar benefits
As at December 31, 2017, the Company and its subsidiaries had accrued pension, retirement or similar benefits obligations amounting to $14.1 million. See note 18 - Employee future benefits, to the audited consolidated financial statements included in Item 18 of this Annual Report on Form 20-F.
|
C.
|
Board practices
|
Our Articles provide that our Board shall be composed of a minimum of five and a maximum of 15 directors. Directors are elected annually by our shareholders, but the directors may from time to time appoint one or more directors, provided that the total number of directors so appointed does not exceed one-third of the number of directors elected at the last annual meeting of shareholders. Each elected director will remain in office until termination of the next annual meeting of the shareholders or until his or her successor is duly elected or appointed, unless his or her post is vacated earlier. We do not have service agreements with our independent directors.
See Item 6A. for information about the period of service of each of our directors and senior corporate officers.
Standing Committees of the Board of Directors
67
Our Board has established an Audit Committee and a NGCC.
Audit Committee
The Audit Committee assists the Board in fulfilling its oversight responsibilities. The Audit Committee reviews the financial reporting process, the system of internal control, the audit process, and our process for monitoring compliance with laws and regulations and with our Code of Ethical Conduct. In performing its duties, the Audit Committee will maintain effective working relationships with the Board, management, and the external auditors. To effectively perform his or her role, each committee member will obtain an understanding of the detailed responsibilities of committee membership as well as our business, operations and risks.
The function of the Audit Committee is oversight and while it has the responsibilities and powers set forth in its charter (incorporated by reference to Exhibit 11.3 to this Annual Report on Form 20-F), it is neither the duty of the committee to plan or to conduct audits or to determine that our financial statements are complete, accurate and in accordance with generally accepted accounting principles, nor to maintain internal controls and procedures.
The current members of the Audit Committee are Gérard Limoges (Chair), Michael Cardiff and Juergen Ernst.
NGCC
The NGCC is responsible for, among other matters, (i) assisting the Board in developing our approach to corporate governance issues, (ii) proposing new Board nominees, (iii) overseeing the assessment of the effectiveness of the Board and its committees, their respective chairs and individual directors and (iv) making recommendations to the Board with respect to board member nominees and directors' compensation, as well as serving in a leadership role for our corporate governance practices. It is also responsible for taking all reasonable actions to ensure that appropriate human resources policies, procedures and systems, e.g., recruitment and retention policies, competency and performance metrics and measurements, training and development programs, and market-based, competitive compensation and benefits structures, are in place so that we can attract, motivate and retain the quality of personnel required to achieve our business objectives. The NGCC also assists the Board in discharging its responsibilities relating to the recruitment, retention, development, assessment, compensation and succession planning for our executive and senior management members.
Thus, the NGCC recommends the appointment of senior officers, including the terms and conditions of their appointment and termination, and reviews the evaluation of the performance of our senior officers, including recommending their compensation and overseeing risk identification and management in relation to executive compensation policies and practices. The Board, which includes the members of the NGCC, reviews the Chief Executive Officer's corporate strategy, goals and performance objectives and evaluates and measures his or her performance and compensation against the achievement of such goals and objectives.
The NGCC recognizes that the industry, regulatory and competitive environment in which we operate requires a balanced level of risk-taking to promote and achieve the performance expectations of executives of a specialty biopharmaceutical company that is also seeking to acquire or in-license new commercial products. The NGCC is of the view that our executive compensation program should not encourage senior executives to take inappropriate or unreasonable risk. In this regard, the NGCC recommends the implementation of compensation methods that appropriately connect a portion of senior executive compensation with our short-term and longer-term performance, as well as that of each individual executive officer and that take into account the advantages and risks associated with such compensation methods. The NGCC is also responsible for establishing compensation policies that are intended to reward the creation of shareholder value while reflecting a balance between our short-term and longer-term performance and that of each executive officer.
The current members of the Compensation Committee are Carolyn Egbert (Chair), Juergen Ernst and Michael Cardiff.
|
D.
|
Employees
|
As at
December 31, 2017
, we had a total of 34 active employees, of which 30 are based in Frankfurt, Germany. The remaining four employees are based in the United States. Our employees are engaged in the following activities: (i)
22
are engaged in research and development, regulatory affairs and quality assurance; (ii) four are involved in commercial operations and business development; and (iii) 8 are involved in various administrative functions, including finance and accounting. We do not employ any sales representatives. Under the 2017 German Restructuring, we terminated 22 employees of our German subsidiary as of
December 31, 2017
. We have agreements with our employees covering confidentiality, loyalty, non-competition and assignment of all intellectual property rights developed during the employment period.
68
|
E.
|
Share ownership
|
The table below sets forth information as of
March 27, 2018
provided to us by our directors and executive officers concerning their ownership of Common Shares and stock options of the Company:
|
Name
|
No. of Common Shares owned or held
|
Percent
(1)
|
No. of stock options held
(2)
|
No. of currently exercisable options
|
|||||||
|
Cardiff, Michael
|
—
|
|
—
|
87,850
|
|
9,284
|
|
||||
|
Dinges, Jude
|
6,533
|
|
*
|
—
|
|
—
|
|
||||
|
Dodd, David A.
|
34,003
|
|
*
|
—
|
|
—
|
|
||||
|
Egbert, Carolyn
|
1,920
|
|
*
|
77,850
|
|
5,951
|
|
||||
|
Ernst, Juergen
|
1,348
|
|
*
|
77,850
|
|
5,951
|
|
||||
|
Guenther, Eckhard
|
—
|
|
—
|
15,398
|
|
6,801
|
|
||||
|
Lemaire, Geneviève
|
2,350
|
|
*
|
—
|
|
—
|
|
||||
|
Limoges, Gérard
|
1,200
|
|
*
|
77,850
|
|
5,951
|
|
||||
|
Newport, Kenneth
|
—
|
|
—
|
—
|
|
—
|
|
||||
|
Sachse, Richard
|
—
|
|
—
|
129,380
|
|
56,461
|
|
||||
|
Teifel, Michael
|
—
|
|
—
|
30,350
|
|
13,451
|
|
||||
|
Theodore, Philip A.
|
10,894
|
|
*
|
—
|
|
—
|
|
||||
|
Total
|
58,248
|
|
*
|
496,528
|
|
103,850
|
|
||||
|
*
|
Less than 1%
|
|
(1)
|
Based on
16,440,760
Common Shares outstanding as at
December 31, 2017
.
|
|
(2)
|
For information regarding option expiration dates and exercise price refer to the tables included under the caption "Outstanding Option-Based Awards and Share-Based Awards".
|
See "Summary of the Stock Option Plan" for more details on the Stock Option Plan.
|
Item 7.
|
Major Shareholders and Related Party Transactions
|
|
A.
|
Major shareholders
|
We are not directly or indirectly owned or controlled by another corporation or by any foreign government.
Based on filings with the SEC and the Canadian securities regulatory authorities, as at
March 27, 2018
, no individual or entity beneficially owned, directly or indirectly, or exercised control or direction over our Common Shares carrying more than 5% of the voting rights attached to all our Common Shares.
United States Shareholders
As at March
27, 2018
, there w
ere 39 hold
ers of record of our Common Shares, of which six were registered with an address in the United States holding in the aggregate approximat
ely 99.8% of o
ur outstanding Common Shares. We believe that the number of beneficial owners of our Common Shares is substantially greater than the number of record holders, because the overwhelming majority of our Common Shares are held in broker "street names".
|
B.
|
Related party transactions
|
Other than employment agreements and indemnification agreements with our management, there are no related party transactions.
|
C.
|
Interests of experts and counsel
|
Not applicable.
69
|
Item 8.
|
Financial Information
|
|
A.
|
Consolidated statements and other financial information
|
The consolidated financial statements filed as part of this Annual Report on Form 20-F are presented under "Item 18. – Financial Statements".
|
B.
|
Significant changes
|
No significant changes occurred since the date of our annual consolidated financial statements included elsewhere in this Annual Report on Form 20-F.
|
Item 9.
|
The Offer and Listing
|
|
A.
|
Offer and listing details
|
Not Applicable, except for Item 9A(4). Our Common Shares are listed on both NASDAQ and TSX under the symbol "AEZS". The following table indicates, for the relevant periods, the high and low closing prices of our Common Shares on NASDAQ and on the TSX:
|
NASDAQ (US$)
|
TSX (CAN$)
|
|||||||
|
High
|
Low
|
High
|
Low
|
|||||
|
2017
|
3.65
|
|
0.84
|
|
4.81
|
|
1.13
|
|
|
2016
|
4.94
|
|
2.67
|
|
6.62
|
|
3.85
|
|
|
2015
|
84.20
|
|
4.00
|
|
104.00
|
|
5.39
|
|
|
2014
|
150.00
|
|
52.00
|
|
166.00
|
|
57.00
|
|
|
2013
|
323.00
|
|
103.00
|
|
327.00
|
|
108.00
|
|
|
2018
|
||||||||
|
First quarter
1
|
2.41
|
|
1.56
|
|
3.01
|
|
2.08
|
|
|
2017
|
||||||||
|
Fourth quarter
|
2.70
|
|
1.87
|
|
3.48
|
|
2.38
|
|
|
Third quarter
|
2.87
|
|
0.98
|
|
3.57
|
|
1.28
|
|
|
Second quarter
|
3.35
|
|
0.84
|
|
4.50
|
|
1.13
|
|
|
First quarter
|
3.65
|
|
2.45
|
|
4.81
|
|
3.24
|
|
|
2016
|
||||||||
|
Fourth quarter
|
4.94
|
|
3.25
|
|
6.62
|
|
4.40
|
|
|
Third quarter
|
3.73
|
|
3.30
|
|
4.83
|
|
4.26
|
|
|
Second quarter
|
4.38
|
|
3.01
|
|
5.69
|
|
3.90
|
|
|
First quarter
|
4.40
|
|
2.67
|
|
6.08
|
|
3.85
|
|
|
Most recent 6 months
|
||||||||
|
February 2018
|
2.18
|
|
1.79
|
|
2.66
|
|
2.30
|
|
|
January 2018
|
2.41
|
|
2.07
|
|
3.01
|
|
2.59
|
|
|
December 2017
|
2.70
|
|
1.96
|
|
3.48
|
|
2.50
|
|
|
November 2017
|
2.10
|
|
1.87
|
|
2.72
|
|
2.38
|
|
|
October 2017
|
2.29
|
|
1.88
|
|
2.87
|
|
2.40
|
|
|
September 2017
|
2.23
|
|
1.84
|
|
2.74
|
|
2.23
|
|
|
B.
|
Plan of distribution
|
Not applicable.
|
C.
|
Markets
|
Our Common Shares are listed and posted for trading on both NASDAQ and the TSX under the symbol "AEZS".
|
D.
|
Selling shareholders
|
Not applicable.
|
E.
|
Dilution
|
Not applicable.
|
F.
|
Expenses of the issue
|
Not applicable.
71
|
Item 10.
|
Additional Information
|
|
A.
|
Share capital
|
Not applicable.
|
B.
|
Memorandum and articles of association
|
We are governed by our restated articles of incorporation (the "Restated Articles of Incorporation") under the CBCA and by articles of amendment dated October 2, 2012 and November 17, 2015 (together with the Restated Articles of Incorporation, the "Articles") and by our bylaws, as amended and restated on March 21, 2013 (the "bylaws"). Our Articles are on file with Corporations Canada under Corporation Number 264271-9. The Articles do not include a stated purpose and do not place any restrictions on the business that we may carry on.
Inspection Rights of Shareholders
Under the CBCA, shareholders are entitled to be provided with a copy of the list of our registered shareholders. In order to obtain the shareholder list, a shareholder must provide to us an affidavit including, among other things, a statement that the list will only be used for the purposes permitted by the CBCA. These permitted purposes include an effort to influence the voting of our shareholders, an offer to acquire our securities and any other matter relating to our affairs. We are entitled to charge a reasonable fee for the provision of the shareholder list and must deliver that list no more than ten days after receipt of the affidavit described above.
Under the CBCA, shareholders have the right to inspect certain corporate records, including our Articles and bylaws and minutes of meetings and resolutions of the shareholders. Shareholders have no statutory right to inspect minutes of meetings and resolutions of our directors. Our shareholders have the right to certain financial information respecting us. In addition to the annual and quarterly financial statements required to be filed under applicable securities laws, we are required by the CBCA to place before every annual meeting of shareholders our audited comparative annual financial statements. In addition, shareholders have the right to examine the financial statements of each of our subsidiaries and any other corporate entity whose accounts are consolidated in our financial statements.
Directors
The minimum number of directors we must have is five and the maximum number is 15. In accordance with the CBCA, at least 25% of our directors must be residents of Canada. In order to serve as a director, a person must be a natural person at least 18 years of age, of sound mind, not bankrupt, and must not be prohibited by any court from holding the office of director. None of the Articles, the bylaws and the CBCA imposes any mandatory retirement requirements for directors.
The directors are elected by a majority of the votes cast at the annual meeting at which an election of directors is required, to hold office until the election of their successors, except in the case of resignations or if their offices become vacant by death or otherwise. Subject to the provisions of our bylaws, all directors may, if still qualified to serve as directors, stand for re-election. The Board is not replaced at staggered intervals but is elected annually.
There is no provision in our bylaws or Articles that requires that a director must be a shareholder.
The directors are entitled to remuneration as shall from time to time be determined by the Board or by a committee to which the
Board may delegate the power to do so. Under the mandate of the NGCC, such committee, comprised of at least a majority of independent directors, is tasked with making recommendations to the Board concerning director remuneration.
The CBCA provides that a director who is a party to, or who is a director or officer of, or has a material interest in, any person who is a party to a material contract or transaction or proposed material contract or transaction with us must disclose to us the nature and extent of his or her interest at the time and in the manner provided by the CBCA, or request that same be entered in the minutes of the meetings of the Board, even if such contract, in connection with our normal business activity, does not require the approval of either the directors or the shareholders. At the request of the president or any director, the director placed in a situation of conflict of interest must leave the meeting while the Board discusses the matter. The CBCA prohibits such a director from voting on any resolution to approve the contract or transaction unless the contract or transaction:
|
•
|
relates primarily to his or her remuneration as our director, officer, employee or agent or as a director, officer, employee or agent of an affiliate of us;
|
|
•
|
is for indemnity or insurance for director's liability as permitted by the CBCA; or
|
72
|
•
|
is with our affiliate.
|
The CBCA provides that the Board may, on our behalf and without authorization of our shareholders:
|
•
|
borrow money upon our credit;
|
|
•
|
issue, reissue, sell or pledge our debt obligations;
|
|
•
|
give a guarantee on our behalf to secure performance of an obligation of any person; and
|
|
•
|
mortgage, hypothecate, pledge or otherwise create a security interest in all or any of our property, owned or subsequently acquired, to secure any of our obligations.
|
The shareholders have the ability to restrict such powers through our Articles or bylaws
(or through a unanimous shareholder agreement), but no such restrictions are in place.
The CBCA prohibits the giving of a guarantee to any of our shareholders, directors, officers or employees or of an affiliated corporation or to an associate of any such person for any purpose or to any person for the purpose of or in connection with a purchase of a share issued or to be issued by us or our affiliates, where there are reasonable grounds for believing that we are or, after giving the guarantee, would be unable to pay our liabilities as they become due, or the realizable value of our assets in the form of assets pledged or encumbered to secure a guarantee, after giving the guarantee, would be less than the aggregate of our liabilities and stated capital of all classes. These borrowing powers may be varied by our bylaws or Articles. However, our bylaws and Articles do not contain any restrictions on or variations of these borrowing powers.
Pursuant to the CBCA, our directors manage and administer our business and affairs and exercise all such powers and authority as we are authorized to exercise pursuant to the CBCA, the Articles and the bylaws. The general duties of our directors and officers under the CBCA are to act honestly and in good faith with a view to our best interests and to exercise the care, diligence and skill that a reasonably prudent person would exercise in comparable circumstances. Any breach of these duties may lead to liability to us and our shareholders for breach of fiduciary duty. In addition, a breach of certain provisions of the CBCA, including the improper payment of dividends or the improper purchase or redemption of shares, will render the directors who authorized such action liable to account to us for any amounts improperly paid or distributed.
Our bylaws provide that the Board may, from time to time, appoint from amongst their number committees of the Board, and delegate to any such committee any of the powers of the Board except those which pursuant to the CBCA a committee of the Board has no authority to exercise. As such, the Board has two standing committees: the Audit Committee and the Nominating, Governance and Compensation Committee, or the NGCC.
Subject to the limitations provided by the CBCA, our bylaws provide that we shall, to the full extent provided by law, indemnify a director or an officer, a former director or officer or a person who acts or acted at our request as a director or officer of a body corporate of which we are or were a shareholder or creditor, and his or her heirs and legal representatives, against all costs, losses, charges and expenses, including an amount paid to settle an action or satisfy a judgment, reasonably incurred by him or her in respect of any civil, criminal or administrative action or proceeding to which he or she is made a party by reason of having been our director or officer or such body corporate, provided: (a)
he or she acted in good faith in our best interests and (b) in the case of a criminal or an administrative action or proceeding that is enforced by a monetary penalty, he or she had reasonable grounds to believe that his or her conduct was lawful.
Our directors are authorized to indemnify from time to time any director or other person who has assumed or is about to assume in the normal course of business any liability for us or for any corporation controlled by us and to secure such director or other person against any loss by the pledge of all or part of our movable or immovable property through the creation of a hypothec or any other real right in all or part of such property or in any other manner.
We have also agreed to indemnify and save harmless our directors and senior corporate officers as well as the managing directors of our German subsidiary pursuant to various Director and Officer Indemnification Agreements against certain charges, damages, awards, settlements, liabilities, interest, judgments, fines, penalties, statutory obligations, professional fees and retainers and other expenses of whatever nature or kind, provided that any such costs, charges, professional fees and other expenses are reasonable (collectively, "Expenses") and from and against all Expenses sustained or incurred by the indemnified party as a result of serving as a director, officer or employee of the Company (or its subsidiary) in respect of any act, matter, deed or thing whatsoever made, done, committed, permitted, omitted or acquiesced in by the indemnified party as a director, officer or employee of the Company (or its subsidiary). The form of Director and Officer Indemnification Agreement has been furnished to the SEC as Exhibit 99.1 to our Report on Form 6-K dated October 21, 2016.
73
Share Capitalization
Our authorized share capital structure consists of an unlimited number of shares of the following classes (all classes are without nominal or par value):
Common Shares
; and first preferred shares (the "First Preferred Shares") and second preferred shares
(the "Second Preferred Shares" and, together with the First Preferred Shares, the "Preferred Shares"), both issuable in series. As at
March 27, 2018
, there were approximately
16.4 million
Common Shares
outstanding. No Preferred Shares have been issued to date. We have also issued warrants to acquire
Common Shares
in connection with certain equity financings.
Common Shares
The holders of the
Common Shares
are entitled to one vote for each Common Share held by them at all meetings of shareholders, except meetings at which only shareholders of a specified class of shares are entitled to vote. In addition, the holders are entitled to receive dividends if, as and when declared by our Board of Directors on the
Common Shares
. Finally, the holders of the
Common Shares
are entitled to receive our remaining property upon any liquidation, dissolution or winding-up of our affairs, whether voluntary or involuntary. Shareholders have no liability to further capital calls as all shares issued and outstanding are fully paid and non-assessable.
Preferred Shares
The First and Second Preferred Shares are issuable in series with rights and privileges specific to each class. The holders of Preferred Shares are generally not entitled to receive notice of or to attend or vote at meetings of shareholders. The holders of First Preferred Shares are entitled to preference and priority to any participation of holders of Second Preferred Shares,
Common Shares
or shares of any other class of shares of our share capital ranking junior to the First Preferred Shares with respect to dividends and, in the event of our liquidation, the distribution of our property upon our dissolution or winding-up, or the distribution of all or part of our assets among the shareholders, to an amount equal to the value of the consideration paid in respect of such shares outstanding, as credited to our issued and paid-up share capital, on an equal basis, in proportion to the amount of their respective claims in regard to such shares held by them. The holders of Second Preferred Shares are entitled to preference and priority to any participation of holders of
Common Shares
or shares of any other class of shares of our share capital ranking junior to the Second Preferred Shares with respect to dividends and, in the event of our liquidation, the distribution of our property upon our dissolution or winding-up, or the distribution of all or part of our assets among the shareholders, to an amount equal to the value of the consideration paid in respect of such shares outstanding, as credited to our issued and paid-up share capital, on an equal basis, in proportion to the amount of their respective claims in regard to such shares held by them.
Our Board of Directors may, from time to time, provide for additional series of Preferred Shares to be created and issued, but the issuance of any Preferred Shares is subject to the general duties of the directors under the CBCA to act honestly and in good faith with a view to our best interests and to exercise the care, diligence and skill that a reasonably prudent person would exercise in comparable circumstances.
Warrants
For a description of our Warrants,
see note 14 - warrant liability, to the audited consolidated financial statements included in Item 18 of this Annual Report on Form 20-F
.
Shareholder Actions
The CBCA provides that our shareholders may, with leave of a court, bring an action in our name and on our behalf for the purpose of prosecuting, defending or discontinuing an action on our behalf. In order to grant leave to permit such an action, the CBCA provides that the court must be satisfied that our directors were given adequate notice of the application, the shareholder is acting in good faith and that it appears to be in our best interests that the
action be brought.
Shareholder Rights Plan
Our Board of Directors adopted a shareholder rights plan on March 29, 2016 (the "Rights Plan"). Our shareholders approved, ratified and confirmed the Rights Plan at our Annual Meeting of Shareholders on May 10, 2016.
Objectives and Background of the Shareholder Rights Plan
The fundamental objectives of the Rights Plan are to provide adequate time for our Board and shareholders to assess an unsolicited take-over bid for us, to provide the Board with sufficient time to explore and develop alternatives for maximizing shareholder value if a take-over bid is made, and to provide shareholders with an equal opportunity to participate in a take-over bid.
74
The Rights Plan encourages a potential acquiror who makes a take-over bid to proceed either by way of a "Permitted Bid", as described below, which requires a take-over bid to satisfy certain minimum standards designed to promote fairness, or with the concurrence of our Board. If a take-over bid fails to meet these minimum standards and the Rights Plan is not waived by the Board, the Rights Plan provides that holders of Common Shares, other than the acquiror, will be able to purchase additional Common Shares at a significant discount to market, thus exposing the person acquiring Common Shares to substantial dilution of its holdings.
Summary of the Rights Plan
The following is a summary of the principal terms of the Rights Plan, which summary is qualified in its entirety by reference to the terms thereof. Capitalized terms not otherwise defined in this summary shall have the meaning ascribed to such terms in the Shareholder Rights Plan Agreement which sets forth the Rights Plan. The Rights Plan is incorporated by reference as Exhibit 2.1 to this Annual Report on Form 20-F.
For the purposes of this summary and as set out in the Rights Plan, the term "NI 62-104" refers to National Instrument 62-104-
Take-Over Bids and Issuer Bids
adopted by the Canadian securities regulatory authorities, as now in effect or as the same may from time to time be amended, re-enacted or replaced and including for greater certainty any successor instrument thereto.
Operation of the Rights Plan
Pursuant to the terms of the Rights Plan, one right was issued in respect of each common share outstanding at 5:01 p.m. on March 29, 2016 (the "Record Time"). In addition, we will issue one right for each additional Common Share issued after the Record Time and prior to the earlier of the Separation Time (as defined below) and the Expiration Time (as defined below). The rights have an initial exercise price equal to the Market Price (as defined below) of the Common Shares as determined at the Separation Time, multiplied by five, subject to certain anti-dilution adjustments (the "Exercise Price"), and they are not exercisable until the Separation Time. Upon the occurrence of a Flip-in Event (as defined below), each right will entitle the holder thereof, other than an Acquiring Person or any other person whose rights are or become void pursuant to the provisions of the Rights Plan, to purchase from us, effective at the close of business on the eighth trading day after the Stock Acquisition Date (as defined below), upon payment to us of the Exercise Price, Common Shares having an aggregate Market Price equal to twice the Exercise Price on the date of consummation or occurrence of such Flip-in Event, subject to certain anti-dilution adjustments.
Definition of Market Price
Market Price is generally defined in the Rights Plan, on any given day on which a determination must be made, as the volume weighted average trading price of the Common Shares for the five consecutive trading days (i.e. days on which the TSX or another stock exchange or national securities quotation system on which the Common Shares are traded (including for greater certainty, each of the Nasdaq Global Select Market, the Nasdaq Global Market and the Nasdaq Capital Market) is open for the transaction of business, subject to certain exceptions), through and including the trading day immediately preceding such date of determination, subject to certain exceptions.
Trading of Rights
Until the Separation Time (or the earlier termination or expiration of the rights), the rights trade together with the Common Shares and are represented by the same share certificates as the Common Shares or an entry in our securities register in respect of any outstanding Common Shares. From and after the Separation Time and prior to the Expiration Time, the rights are evidenced by rights certificates and trade separately from the Common Shares. The rights do not carry any of the rights attaching to the Common Shares such as voting or dividend rights.
Separation Time
The rights will separate from the Common Shares to which they are attached and become exercisable at the time (the "Separation Time") of the close of business on the eighth business day after the earliest to occur of:
|
1.
|
the first date (the "Stock Acquisition Date") of a public announcement of facts indicating that a person has become an Acquiring Person; and
|
|
2.
|
the date of the commencement of, or first public announcement of the intention of any person (other than us or any of our subsidiaries) to commence a take-over bid or a share exchange bid for more than 20% of our outstanding Common Shares other than a Permitted Bid or a Competing Permitted Bid (as defined below), so long as such take-over bid continues to satisfy the requirements of a Permitted Bid or a Competing Permitted Bid, as the case may be.
|
75
The Separation Time can also be such later time as may from time to time be determined by the Board, provided that if any such take-over bid expires, or is canceled, terminated or otherwise withdrawn prior to the Separation Time, without securities deposited thereunder being taken up and paid for, it shall be deemed never to have been made and if the Board determines to waive the application of the Rights Plan to a particular Flip-in Event, the Separation Time in respect of such Flip-in Event shall be deemed never to have occurred.
From and after the Separation Time and prior to the Expiration Time, each right entitles the holder thereof to purchase one Common Share upon payment of the Exercise Price to us.
Flip-in Event
The acquisition by a person (an "Acquiring Person"), including others acting jointly or in concert with such person, of more than 20% of the outstanding Common Shares, other than by way of a Permitted Bid, a Competing Permitted Bid or in certain other limited circumstances described in the Rights Plan, is referred to as a "Flip-in Event".
In the event that, prior to the Expiration Time, a Flip-in Event that has not been waived occurs (see "Waiver and Redemption" below), each right (other than those held by or deemed to be held by the Acquiring Person) will thereafter entitle the holder thereof, effective as at the close of business on the eighth trading day after the Stock Acquisition Date, to purchase from us, upon payment of the Exercise Price and otherwise exercising such right in accordance with the terms of the Rights Plan, that number of Common Shares having an aggregate Market Price on the date of consummation or occurrence of the Flip-in Event equal to twice the Exercise Price, for an amount in cash equal to the Exercise Price (subject to certain anti-dilution adjustments described in the Rights Plan).
A bidder may enter into Lock-up Agreements with our shareholders ("Locked-up Persons") who are not affiliates or associates of the bidder and who are not, other than by virtue of entering into such agreement, acting jointly or in concert with the bidder, whereby such shareholders agree to tender their Common Shares to the take-over bid (the "Lock-up Bid") without the bidder being deemed to beneficially own the Common Shares deposited pursuant to the Lock-up Bid. Any such agreement must include a provision that permits the Locked-up Person to withdraw the Common Shares to tender to another take-over bid or to support another transaction that will either provide greater consideration to the shareholder than the Lock-up Bid or provide for a right to sell a greater number of shares than the Lock-up Bid contemplates (provided that the Lock-up Agreement may require that such greater number exceed the number of shares under the Locked-up Bid by a specified percentage not to exceed 7%).
The Lock-up Agreement may require that the consideration under the other transaction exceed the consideration under the Lock-up Bid by a specified amount. The specified amount may not be greater than 7%. For greater certainty, a Lock-up Agreement may contain a right of first refusal or require a period of delay (or other similar limitation) to give a bidder an opportunity to match a higher price in another transaction as long as the limitation does not preclude the exercise by the Locked-up Person of the right to withdraw the Common Shares during the period of the other take-over bid or transaction.
The Rights Plan requires that any Lock-up Agreement be made available to us and the public. The definition of Lock-up Agreement also provides that under a Lock-up Agreement, no "break up" fees, "topping" fees, penalties, expenses or other amounts that exceed in aggregate the greater of (i) 2.5% of the price or value of the aggregate consideration payable under the Lock-up Bid, and (ii) 50% of the amount by which the price or value of the consideration received by a Locked-up Person under another take-over bid or transaction exceeds what such Locked-up Person would have received under the Lock-up Bid, can be payable by such Locked-up Person if the Locked-up Person fails to deposit or tender Common Shares to the Lock-up Bid or withdraws Common Shares previously tendered thereto in order to deposit such Common Shares to another take-over bid or support another transaction.
Permitted Bid Requirements
The requirements of a Permitted Bid include the following:
|
1.
|
the take-over bid must be made by means of a take-over bid circular;
|
|
2.
|
the take-over bid must be made to all holders of Common Shares wherever resident, on identical terms and conditions, other than the bidder;
|
|
3.
|
the take-over bid must not permit Common Shares tendered pursuant to the bid to be taken up or paid for:
|
|
a)
|
prior to the close of business on a date that is not less than 105 days following the date of the relevant take-over bid or such shorter minimum period that a take-over bid (that is not exempt from any of the requirements of
|
76
Division 5 (Bid Mechanics of NI 62-104)) must remain open for deposits of securities thereunder, in the applicable circumstances at such time, pursuant to NI 62-104;
|
b)
|
then only if at the close of business on the date Common Shares (and/or "Convertible Securities", as defined in the Rights Plan) are first taken up or paid for under such take-over bid, outstanding Common Shares and Convertible Securities held by shareholders other than any other Acquiring Person, the bidder, the bidder’s affiliates or associates, persons acting jointly or in concert with the bidder and any employee benefit plan, deferred profit-sharing plan, stock participation plan or trust for the benefit of our employees or the employees of any of our subsidiaries, unless the beneficiaries of such plan or trust direct the manner in which the Common Shares are to be voted or direct whether the Common Shares are to be tendered to a take-over bid (collectively, "Independent Shareholders") that represent more than 50% of the aggregate of (I) then outstanding Common Shares and (II) Common Shares issuable upon the exercise of Convertible Securities, have been deposited or tendered pursuant to the take-over bid and not withdrawn;
|
|
4.
|
the take-over bid must allow Common Shares and/or Convertible Securities to be deposited or tendered pursuant to such take-over bid, unless such take-over bid is withdrawn, at any time prior to the close of business on the date Common Shares and/or Convertible Securities are first taken up or paid for under the take-over bid;
|
|
5.
|
the take-over bid must allow Common Shares and/or Convertible Securities to be withdrawn until taken up and paid for; and
|
|
6.
|
in the event the requirement set forth in clause 3.b) above is satisfied, the bidder must make a public announcement of that fact and the take-over bid must remain open for deposits and tenders of Common Shares for not less than ten days from the date of such public announcement.
|
A Permitted Bid need not be a bid for all outstanding Common Shares not held by the bidder, i.e., a Permitted Bid may be a partial bid. The Rights Plan also allows a competing Permitted Bid (a "Competing Permitted Bid") to be made while a Permitted Bid is in existence. A Competing Permitted Bid must satisfy all the requirements of a Permitted Bid other than the requirement set out in clause 3.a) above and must not permit Common Shares tendered or deposited pursuant to the bid to be taken up or paid for prior to the close of business on the last day of the minimum initial deposit period that such take-over bid must remain open for deposits of securities thereunder pursuant to NI 62-104 after the date of the take-over bid constituting the Competing Permitted Bid; provided, however, that a take-over bid that has qualified as a Competing Permitted Bid shall cease to be a Competing Permitted Bid at any time and as soon as such time as when such take-over bid ceases to meet any or all of the foregoing provisions of the definition of "Competing Permitted Bid" and any acquisition of Common Shares and/or Convertible Securities made pursuant to such take-over bid that qualified as a Competing Permitted Bid, including any acquisition of Common Shares and/or Convertible Securities made before such take-over bid ceased to be a Competing Permitted Bid, will not be a "Permitted Bid Acquisition" (as defined in the Rights Plan).
Waiver and Redemption
The Board may, prior to the occurrence of a Flip-in Event, waive the dilutive effects of the Rights Plan in respect of, among other things, a particular Flip-in Event resulting from a take-over bid made by way of a take-over bid circular to all holders of our Common Shares. In such an event, such waiver shall also be deemed to be a waiver in respect of any other Flip-in Event occurring under a take-over bid made by way of a take-over bid circular to all holders of Common Shares prior to the expiry of the first mentioned take-over bid.
The Board may, with the approval of a majority of Independent Shareholders (or, after the Separation Time has occurred, holders of rights, other than rights which are void pursuant to the provisions of the Rights Plan or which, prior to the Separation Time, are held otherwise than by Independent Shareholders), at any time prior to the occurrence of a Flip-in Event which has not been waived, elect to redeem all, but not less than all, of the then outstanding rights at a price of CAN$0.00001 each, appropriately adjusted as provided in the Rights Plan (the "Redemption Price").
Where a take-over bid that is not a Permitted Bid or Competing Permitted Bid is withdrawn or otherwise terminated after the Separation Time has occurred and prior to the occurrence of a Flip-in Event, the Board may elect to redeem all the outstanding rights at the Redemption Price without the consent of the holders of the Common Shares or the rights and reissue rights under the Rights Plan to holders of record of Common Shares immediately following such redemption. Upon the rights being so redeemed and reissued, all the provisions of the Rights Plan will continue to apply as if the Separation Time had not occurred, and the Separation Time will be deemed not to have occurred and we shall be deemed to have issued replacement rights to the holders of its then outstanding Common Shares.
77
Amendment to the Rights Plan
The Rights Plan may be amended to correct any clerical or typographical error or to make such changes as are required to maintain the validity of the Rights Plan as a result of any change in any applicable legislation, regulations or rules thereunder, without the approval of the holders of the Common Shares or rights. Prior to the Separation Time, we may, with the prior consent of the holders of Common Shares, amend, vary or delete any of the provisions of the Rights Plan in order to effect any changes which the Board, acting in good faith, considers necessary or desirable. We may, with the prior consent of the holders of rights, at any time after the Separation Time and before the Expiration Time, amend, vary or delete any of the provisions of the Rights Plan.
Protection Against Dilution
The Exercise Price, the number and nature of securities which may be purchased upon the exercise of rights and the number of rights outstanding are subject to adjustment from time to time to prevent dilution in the event of stock dividends, subdivisions, consolidations, reclassifications or other changes in the outstanding Common Shares, pro rata distributions to holders of Common Shares and other circumstances where adjustments are required to appropriately protect the interests of the holders of rights.
Fiduciary Duty of Board
The Rights Plan will not detract from or lessen the duty of the Board to act honestly and in good faith with a view to our best interests and the best interests of our shareholders. The Board will continue to have the duty and power to take such actions and make such recommendations to our shareholders as are considered appropriate.
Exemptions for Investment Advisors
Fund managers, investment advisors (for fully-managed accounts), trust companies (acting in their capacities as trustees and administrators), statutory bodies whose business includes the management of funds, and administrators of registered pension plans are exempt from triggering a Flip-in Event, provided that they are not making, or are not part of a group making, a take-over bid.
Term
The Rights Plan will expire (the "Expiration Time") at the close of business on the date on which the first annual meeting of our shareholders following March 29, 2019 (being the third anniversary of the Record Time) is held; provided, however, that if our Independent Shareholders approve a resolution confirming the Rights Plan at or prior to the 2019 annual meeting of our shareholders, Expiration Time shall mean the close of business on the date on which the first annual meeting of our shareholders following March 29, 2022 (being the sixth anniversary of the Record Time) is held.
Action Necessary to Change Rights of Shareholders
In order to change the rights of our shareholders, we would need to amend our Articles to effect the change. Such an amendment would require the approval of holders of two-thirds of the issued and outstanding shares cast at a duly called special meeting. For certain amendments, a shareholder is entitled under the CBCA to dissent in respect of such a resolution amending the Articles and, if the resolution is adopted and we implement such changes, demand payment of the fair value of its shares.
Disclosure of Share Ownership
In general, under applicable securities regulation in Canada, a person or company who beneficially owns, or who directly or indirectly exercises control or direction over voting securities of a reporting issuer, voting securities of an issuer or a combination of both, carrying more than ten percent of the voting rights attached to all the issuer's outstanding voting securities is an insider and must, within ten days of becoming an insider, file a report in the required form effective the date on which the person became an insider, disclosing any direct or indirect beneficial ownership of, or control or direction over, securities of the reporting issuer.
Additionally, securities regulation in Canada provides for the filing of a report by an insider of a reporting issuer whose holdings change, which report must be filed within five days from the day on which the change takes place.
Section 13 of the Exchange Act imposes reporting requirements on persons who acquire beneficial ownership (as such term is defined in the Rule 13d-3 under the Exchange Act) of more than five percent of a class of an equity security registered under Section 12 of the Exchange Act. Our
Common Shares
are so registered. In general, such persons must file, within ten days after such acquisition, a report of beneficial ownership with the SEC containing the information prescribed by the regulations under Section 13 of the Exchange Act. This information is also required to be sent to the issuer of the securities and to each exchange where the securities are traded.
78
Meeting of Shareholders
An annual meeting of shareholders is held each year for the purpose of considering the financial statements and reports, electing directors, appointing auditors and fixing or authorizing the Board to fix their remuneration and for the transaction of other business as may properly come before a meeting of shareholders. Any annual meeting may also constitute a special meeting to take cognizance and dispose of any matter of which a special meeting may take cognizance and dispose. Under the bylaws, our Chief Executive Officer or our President has the power to call a meeting of shareholders.
The CBCA provides that the holders of not less than 5% of our outstanding voting shares may requisition our directors to call a meeting of shareholders for the purpose stated in the requisition. Except in limited circumstances, including where a meeting of shareholders has already been called and a notice of meeting already given or where it is clear that the primary purpose of the requisition is to redress a personal grievance against us or our directors, officers or shareholders, our directors, on receipt of such requisition, must call a meeting of shareholders. If the directors fail to call a meeting of shareholders within twenty-one days after receiving the requisition, any shareholder who signed the requisition may call the meeting of shareholders and, unless the shareholders resolve otherwise at the meeting, we shall reimburse the shareholders for the expenses reasonably incurred by them in requisitioning, calling and holding the meeting of shareholders.
The CBCA also provides that, except in limited circumstances, a resolution in writing signed by all of the shareholders entitled to vote on that resolution at a meeting of shareholders is as valid as if it had been passed at a meeting of shareholders.
A quorum of shareholders is present at an annual or special meeting of shareholders, regardless of the number of persons present in person at the meeting, if the holder(s) of shares representing at least 10% of the outstanding voting shares at such meeting are present in person or represented in accordance with our bylaws. In the case where the CBCA, our Articles or our bylaws require or permit the vote by class of holders of a given class of shares of our share capital, the quorum at any meeting will be one or more persons representing 10% of the outstanding shares of
such class.
Notice of the time and place of each annual or special meeting of shareholders must be given not less than 21 days, nor more than
50 days, before the date of each meeting to each director, to the auditor and to each shareholder entitled to vote thereat. If the address
of any shareholder, director or auditor does not appear in our books, the notice may be sent to such address as the person sending the notice may consider to be most likely to reach such shareholder, director or auditor promptly. Every person who, by operation of the CBCA, transfers or by any other means whatsoever, becomes entitled to any share, shall be bound by every notice given in respect of such share which, prior to the entry of his or her name and address on our register, is given to the person whose name appears on the register at the time such notice is sent. Notice of meeting of shareholders called for any other purpose other than consideration of the financial statements and auditor's report, election of directors and reappointment of the incumbent auditor, must state the nature of the business in sufficient detail to permit the shareholder to form a reasoned judgment on and must state the text of any special resolution or bylaw to be submitted to the meeting.
Our bylaws include an advance notice provision (the "Advance Notice Requirement"). The Advance Notice Requirement applies in certain circumstances where nominations of persons for election to the Board of Directors are made by our shareholders other than pursuant to: (a) a requisition of a meeting made pursuant to the provisions of the CBCA; or (b) a shareholder proposal made pursuant to the provisions of the CBCA.
Among other things, the Advance Notice Requirement fixes a deadline by which shareholders must submit a notice of director nominations to us prior to any annual or special meeting of shareholders where directors are to be elected and sets forth the information that a shareholder must include in the notice for it to be valid. In the case of an annual meeting of shareholders, we must be given not less than 30 nor more than 65 days' notice prior to the date of the annual meeting; provided, however, that in the event that the annual meeting is to be held on a date that is less than 50 days after the date on which the first public announcement of the date of the annual meeting was made, notice may be made not later than the close of business on the 10
th
day following such public announcement. In the case of a special meeting of shareholders (which is not also an annual meeting), we must be given notice not later than the close of business on the 15
th
day following the day on which the first public announcement of the date of the special meeting was made.
The Board of Directors may, in its sole discretion, waive any requirement of the Advance Notice Requirement.
Limitations on Right to Own Securities
Neither Canadian law nor our Articles or bylaws limit the right of a non-resident to hold or vote our
Common Shares, other than as provided in the
Investment Canada Act
(the "Investment Act").
The Investment Act requires any person that is a "non-Canadian" (as defined in the Investment Act) who acquires "control" (as
defined in the Investment Act) of an existing Canadian business to file either a pre-closing application for review or a post-closing
notification with Industry Canada.
79
On March 25, 2015, the Canadian government announced new Investment Act regulations that changed the thresholds for
determining when an acquisition of control of a Canadian business is a reviewable transaction (from an asset value-based test to an enterprise value-based test, in most cases). As of April 24, 2015, when amendments to the Investment Act and the regulations come into force, the threshold for review of a direct acquisition of control of a non-cultural Canadian business by a World Trade Organization member country investor is an enterprise value of assets that exceeds CAN$600 million. The enterprise value review threshold will remain at CAN$600 million for two years, before increasing to CAN$800 million for the
following two years, and then to CAN$1 billion. For purposes of a publicly traded company, the "enterprise value" of the assets of the Canadian business is equal to the market capitalization of the entity, plus its liabilities (excluding its operating liabilities), minus its cash and cash equivalents.
As such, under the Investment Act, the acquisition of control of us (either through the acquisition of our Common Shares or all or substantially all our assets) by a non-Canadian who is a World Trade Organization member country investor, including a U.S. investor, would be reviewable only if the enterprise value of our assets exceeds the specified threshold for review.
Where the acquisition of control is a reviewable transaction, the Investment Act generally prohibits the implementation of the reviewable transaction unless, after review, the relevant Minister is satisfied or deemed to be satisfied that the acquisition is likely to be of net benefit to Canada.
The acquisition of a majority of the voting interests of an entity is deemed to be acquisition of "control" of that entity. The acquisition of less than a majority but one-third or more of the total number of votes attached to all of the voting shares of a corporation or of an equivalent undivided ownership interest in the total number of votes attached to all of the voting shares of the corporation is presumed to be an acquisition of control of that corporation unless it can be established that, on the acquisition, the corporation is not controlled in fact by the acquiror through the ownership of voting shares. The acquisition of less than one-third of the total number of votes attached to all of the voting shares of a corporation is deemed not to be acquisition of control of that corporation subject to certain discretionary rights relative to investments involving state owned enterprises. Other than in connection with a "national security" review, discussed below, certain transactions in relation to our Common Shares would be exempt from the Investment Act including:
|
•
|
the acquisition of our Common Shares by a person in the ordinary course of that person's business as a trader or dealer in securities;
|
|
•
|
the acquisition or control of us in connection with the realization of security granted for a loan or other financial assistance and not for any purpose related to the provisions of the Investment Act; and
|
|
•
|
the acquisition or control of us by reason of an amalgamation, merger, consolidation or corporate reorganization following which the ultimate direct or indirect control in fact of us, through the ownership of our voting interests, remains unchanged.
|
Under the national security regime in the Investment Act, review on a discretionary basis may also be undertaken by the federal government in respect of a much broader range of investments by a non-Canadian to "acquire, in whole or in part, or to establish an entity carrying on all or any part of its operations in Canada". The relevant test is whether such an investment by a non-Canadian could be "injurious to national security". The Minister of Innovation, Science and Economic Development has broad discretion to determine whether an investor is a non-Canadian and therefore may be subject to national security review. Review on national security grounds is at the discretion of the federal government and may occur on a pre or post-closing basis.
There is no law, governmental decree or regulation in Canada that restricts the export or import of capital, or which would affect the remittance of dividends or other payments by us to non-resident holders of our Common Shares, other than withholding tax requirements.
|
C.
|
Material contracts
|
Other than as disclosed herein under "Shareholder Rights Plan" and below, and except for contracts entered into in the ordinary course of business, there are no material contracts to which we or any of our subsidiaries is a party.
Strongbridge License Agreement
On January 16, 2018, the Company, through AEZS Germany, entered into a license and assignment agreement Strongbridge License Agreement with Strongbridge, to carry out development, manufacturing, registration and commercialization of Macrilen™ (macimorelin) in the United States and Canada.
The Company received an upfront cash payment of $24,000,000 from Strongbridge, and, for as long as Macrilen™ (macimorelin) is patent-protected, the Company will be entitled to a 15% royalty on net sales up to $75,000,000 and an 18% royalty on net sales above $75,000,000. Following the end of patent protection in United States or Canada for Macrilen™ (macimorelin), the Company
80
will be entitled to a 5% royalty on net sales in that country. In addition, the Company will also receive one-time payments from Strongbridge following the first achievement of the following commercial milestone events:
|
•
|
$4,000,000 on achieving $25,000,000 annual net sales,
|
|
•
|
$10,000,000 on achieving $50,000,000 annual net sales,
|
|
•
|
$20,000,000 on achieving $100,000,000 annual net sales,
|
|
•
|
$40,000,000 on achieving $200,000,000 annual net sales, and
|
|
•
|
$100,000,000 on achieving $500,000,000 annual net sales.
|
Upon approval by the FDA of a pediatric indication for Macrilen™ (macimorelin), the Company will receive a one-time milestone payment of $5,000,000 from Strongbridge.
Strongbridge will fund 70% of the costs of a worldwide pediatric development program to be run by the Company with customary oversight from a joint steering committee. The joint steering committee will be comprised of four persons, two of whom will be appointed by each of Strongbridge and the Company.
The Strongbridge License Agreement will expire at the end of a defined royalty period in each country of the United States and Canada, at which time the license that the Company granted to Strongbridge will become irrevocable, fully paid-up, perpetual and royalty-free in such country. Strongbridge has the right to terminate the Strongbridge License Agreement if there is a safety concern related to Macrilen™ (macimorelin), withdrawal of regulatory approval for Macrilen™ (macimorelin) in the U.S. believed to be permanent, two hundred and seventy (270) days' prior written notice, or if the Company commits a material breach of any term of the Strongbridge License Agreement that it fails to cure within 90 days after receiving written notice of the breach. The Company has the right to terminate the Strongbridge License Agreement if Strongbridge commits a material breach of any term of the Strongbridge License Agreement that it fails to cure within 90 days after receiving written notice of the breach. If the breach relates to Canada then the Company shall only have the right to terminate the Strongbridge License Agreement in relation to Canada. If the breach relates to the United States, then the Company shall have the right to terminate the Strongbridge License Agreement in its entirety.
The Strongbridge License Agreement contains customary provisions related to, among other things, confidentiality and non-disclosure, representations and warranties, indemnity and dispute resolution. The Strongbridge License Agreement is governed by the laws of the State of New York, United States.
The Strongbridge License Agreement is incorporated by reference as Exhibit 4.2 to this Annual Report on Form 20-F.
Sinopharm Agreements
On December 1, 2014, we entered into an exclusive master collaboration agreement ("Master Collaboration Agreement"), a technology transfer and technical assistance agreement ("Tech Transfer Agreement") and a license agreement ("Sinopharm License Agreement") with Sinopharm A-Think Pharmaceuticals Co., Ltd. ("Sinopharm") for the development, manufacture and commercialization of Zoptrex™ in all human uses, in the People's Republic of China, including Hong Kong and Macau (collectively, the "Sinopharm Territory"). Under the terms of the Tech Transfer Agreement, Sinopharm made a one-time, non-refundable payment of $1,101,000 ("Transfer Fee") to us for the transfer of technical documentation and materials, know-how and technical assistance services. We will be entitled to receive additional consideration upon achieving certain milestones, including the occurrence of certain regulatory and commercial events in the Sinopharm Territory. Furthermore, we will be entitled to royalties on future net sales of Zoptrex™ in the Sinopharm Territory. Sinopharm will be responsible for the development, production, registration and commercialization of Zoptrex™ in the Sinopharm Territory.
Sinopharm is required to use commercially reasonable efforts to develop, manufacture and commercialize Zoptrex™ in the Sinopharm Territory, in order to maximize the net sales derived from Zoptrex™ during the royalty term of the Sinopharm License Agreement. In particular, Sinopharm is required to use commercially reasonable efforts to: (i) develop Zoptrex™ for the indication of endometrial cancer in the Sinopharm Territory in accordance with an agreed development plan and not to terminate, suspend, halt or delay development, unless there are substantial safety, efficacy, commercial or regulatory reasons for doing so; (ii) apply for and obtain all required regulatory approvals in the Sinopharm Territory following successful completion of all appropriate clinical studies; (iii) make the first commercial sale of Zoptrex™ in the Sinopharm Territory within a specified period of time following the approval of Zoptrex™ for endometrial cancer; (iv) maintain an adequate sales force and provide for relevant staff to manage the pre- and post-launch activities required to commercialize Zoptrex™ in the Sinopharm Territory; and (v) seek to maximize sales of Zoptrex™ in the Sinopharm Territory. Sinopharm’s failure to use commercially reasonable efforts to develop, manufacture and commercialize Zoptrex™ would be a material breach of the Sinopharm License Agreement.
81
The Sinopharm License Agreement imposes on Sinopharm the responsibility for marketing, promoting and selling Zoptrex™ in the Sinopharm Territory after all regulatory approvals for commercial sale have been obtained, including pre-launch and post-launch marketing, promoting, conducting market research, distributing, offering to commercially sell and commercially selling Zoptrex™, importing, exporting or transporting Zoptrex™ for commercial sale, conducting medical education activities, conducting clinical studies that are not required to obtain or maintain regulatory approval of Zoptrex™ for an indication, which may include epidemiological studies, modeling and pharmacoeconomic studies, conducting post-marketing surveillance studies, conducting investigator sponsored studies and health economics studies and regulatory affairs.
The Sinopharm License Agreement will expire at the end of a defined royalty period, at which time the license that we granted to Sinopharm will become a fully paid-up, perpetual license. Sinopharm has the right to terminate the Sinopharm License Agreement if there are material safety, efficacy, commercial or regulatory reasons for doing so; if we commit a material breach of any term of the Sinopharm License Agreement that we fail to cure within 90 days after receiving written notice of the breach; if we file or institute bankruptcy, reorganization, liquidation or receivership proceedings; or if we assign a substantial portion of our assets for the benefit of our creditors. If Sinopharm has the right to terminate because a third party institutes involuntary bankruptcy proceedings against us, we will have 90 days to obtain the dismissal of the proceedings, during which time, Sinopharm may not terminate the Agreement.
We have the right to terminate the Sinopharm License Agreement if Sinopharm commits a material breach of any term of the Sinopharm License Agreement that it fails to cure within 90 days after receiving written notice of the breach; if it files or institutes bankruptcy, reorganization, liquidation or receivership proceedings, or if it assigns a substantial portion of its assets for the benefit of its creditors. If we have the right to terminate because a third-party institutes involuntary bankruptcy proceedings against Sinopharm, it will have 90 days to obtain the dismissal of the proceedings, during which time, we may not terminate the Agreement.
The Sinopharm License Agreement contains customary provisions related to, among other things, our oversight of Sinopharm's commercialization efforts, intellectual property, pharmacovigilance, confidentiality and non-disclosure, representations and warranties, indemnity and dispute resolution. The Sinopharm License Agreement is governed by the laws of Hong Kong.
We do not anticipate significant revenues from the Sinopharm License Agreement in the future other than the amoritzation of the remaining deferred revenue.
The Master Collaboration Agreement, the Sinopharm License Agreement and the Tech Transfer Agreement are incorporated by reference as Exhibits 4.7, 4.8 and 4.9 to this Annual Report on Form 20-F.
Employment and Service Agreements
We had, or one of our subsidiaries had, entered into an employment agreement and, in some cases, a change of control agreement with each of our Named Executive Officers, except for Ms. Genevieve Lemaire, who provides services to us as a contractor and not as an employee. We terminated the employment of Mr. Dodd for cause on July 20, 2017, we terminated the employment of Mr. Theodore on July 28, 2017 and we terminated the employment of Mr. Dinges on November 3, 2017. Mr. Whitnell resigned effective December 7, 2017. We terminated Dr. Sachse’s employment on January 17, 2018.
We entered into an employment agreement and a change of control agreement with Michael V. Ward, Chief Executive Officer, effective as of October 1, 2017 (the "Employment Agreement"). The Employment Agreement provides that we will pay Mr. Ward (the "Executive") an initial base salary of $250,000 and an annual cash bonus, if our financial results and position justify payment of a bonus and subject to the determination and approval of the NGCC and our Board. Additionally, the Executive will be eligible to receive long-term incentive grants in the form of stock options, which will be reviewed annually in accordance with our policies. Under the terms of the Employment Agreement, Mr. Ward's base salary increased to $325,000, upon approval of Macrilen™ (macimorelin) by the FDA, effective as of December 11, 2017.
The Employment Agreement provides that if there is a "separation form service" within the meaning of Section 409A of the U.S. Internal Revenue Code of 1986, as amended, as a result of (i) termination of the Executive's employment by us without "Cause" or (ii) the Executive resigns for "Good Reason," then the Executive will be entitled to receive severance payments in the amount equal to at least eighteen (18) months of his then base salary paid in equal installments over one (1) year, and conditional upon the Executive executing a full and general Release and complying with certain non-compete and confidentiality agreements. The Executive has no right to receive a cash bonus or any other form of remuneration.
The Executive shall not, for a period equal to one year following his termination of employment with us, directly or indirectly, compete with us in a business in the development and commercialization of substantially similar endocrine therapies and oncology treatments; solicit any of our clients or do anything whatsoever to induce or to lead any person to end, in whole or in part, its business relations with us; induce, attempt to induce or otherwise interfere in the relations that we have with our distributors, suppliers, representatives, agents and other parties with whom we deal; or induce, attempt to induce or otherwise solicit our
82
personnel to leave their employment with us or hire our personnel for any enterprise in which the Executive has an interest. The foregoing applies in those geographic areas in the United States, Canada and Europe in which the same or substantially similar endocrine therapies and oncology treatment are developed and commercialized by us.
Pursuant to the Employment Agreement, the Executive is also entitled to receive certain payments in lieu of and not in addition to any severance payments provided under the Employment Agreement (the "Change of Control Payments") in the event (i) a "Change of Control" occurs, and (ii) during the twelve-month period following the Change of Control, either we terminate his employment without "Cause" or he terminates his employment for "Good Reason" during such period. The Change of Control Payment will equal the sum of the following amounts: (i) the equivalent of eighteen (18) months of the Executive’s then annual base salary, (ii) an amount equivalent to eighteen (18) months of the Executive’s annual bonus, if any, which he would have received in the year immediately prior to the year the Change of Control occurred, and (iii) an amount equivalent to eighteen (18) months of the then monthly premium to provide the group medical benefits to the any earned retention bonus, and (iv) an amount equivalent to eighteen (18) months of the then annual cost monthly premium to provide the other benefits to which he is entitled, or our cost to purchase coverage under COBRA for such benefits, whichever is applicable. group medical benefits Executive, his spouse and dependents determined by utilizing the applicable COBRA premium rates for the month the Executive’s employment terminates. The Change of Control Payment is subject to applicable statutory withholdings. Any outstanding stock options to acquire our stock shall, in such circumstances, become fully exercisable, vested and non-forfeitable on the date the Executive’s employment terminates following a Change of Contract during the term of the agreement. The payments are conditional on the Executive executing a full and general Release.
For the purposes of the Employment Agreement:
|
•
|
a "Change of Control" shall be deemed to have occurred in any of the following circumstances: (i) subject to certain exceptions, upon the acquisition by a person (or one or more persons who are affiliates of one another or who are acting jointly or in concert) of a beneficial interest in our securities representing in any circumstance 50% or more of the voting rights attaching to our then outstanding securities; (ii) upon a sale or other disposition of all or substantially all of our assets; (iii) upon a plan of liquidation or dissolution of us; or (iv) if, for any reason, including our amalgamation, merger or consolidation with or into another company, the individuals who, during the term of the change of control agreement, constituted the Board (and any new directors whose appointment by the Board or whose nomination for election by our shareholders was approved by a vote of at least two-thirds of the directors then still in office who either were directors during the term of the change of control agreement or whose appointment or nomination for election was previously so approved) cease to constitute a majority of the members of the Board;
|
|
•
|
termination of employment for "Cause" includes (but is not limited to) (i) if the Executive commits any fraud, theft, embezzlement or other criminal act of a similar nature, or (ii) if the Executive commits an act of serious misconduct or willful or gross negligence in the performance of his duties.
|
Termination of employment by the Executive for "Good Reason" means the occurrence, without the Executive’s express written consent, of any of the following acts: (i) a material reduction of the Executive’s base salary as in effect on the date of his Employment Agreement or as same may be increased from time to time, and (ii) any material and sustained reduction in the Executive’s duties and responsibilities as Chief Executive Officer and the Board has been provided with notice and fails to cure the situation within thirty (30) days following receipt of notice.
We entered into an Amended and Restated Consulting Agreement with Ms. Genevieve Lemaire effective as of February 18, 2016. The Company agreed to pay the Consultant for her services performed under this Agreement at an hourly rate of CAN$170. At the conclusion of the Agreement, in December 2017, the consultant was paid a bonus in the amount of CAN$20,000. There were no change of control provisions in or change of control benefits provided under Ms. Lemaire’s Consulting Agreement. Ms. Lemaire continues to provide occasional services as agreed to and requested by the Company.
The table below shows estimated incremental payments triggered pursuant to termination of employment of our Named Executive Officers who remained employed on December 31, 2017. The amounts shown are in U.S. dollars.
|
Name
|
Termination Provisions
Value ($) (1) (2) |
|
Sachse, Richard
|
120,000
|
|
Ward, Michael V.
|
511,500
|
|
(1)
|
The termination values assume that the triggering event took place on the last business day of our financial year-end (December 31, 2017).
|
|
(2)
|
Value of earned/unused vacation and amounts owing for expense reimbursement are not included as they are not considered as “incremental” payments made in connection with termination of employment.
|
83
|
D.
|
Exchange controls
|
Canada has no system of exchange controls. There are no exchange restrictions on borrowing from foreign countries or on the remittance of dividends, interest, royalties and similar payments, management fees, loan repayments, settlement of trade debts or the repatriation of capital.
E. Taxation
THE FOLLOWING SUMMARY IS OF A GENERAL NATURE ONLY AND IS NOT INTENDED TO BE, NOR SHOULD IT BE CONSTRUED TO BE, LEGAL OR TAX ADVICE TO ANY PARTICULAR HOLDER. CONSEQUENTLY, HOLDERS ARE URGED TO CONSULT THEIR OWN TAX ADVISORS FOR ADVICE AS TO THE TAX CONSEQUENCES OF AN INVESTMENT IN THE COMMON SHARES HAVING REGARD TO THEIR PARTICULAR CIRCUMSTANCES.
Material Canadian Income Tax Considerations
The following summary describes the principal Canadian federal income tax considerations applicable to a holder of Common Shares and who, for the purposes of the Canadian federal Income Tax Act, R.S.C. 1985, as amended (the "Tax Act"), and at all relevant times, deals at arm's length with, and is not affiliated with, the Company and holds their Common Shares as capital property (a "holder"). Common Shares will generally be considered to be capital property to a holder for purposes of the Tax Act unless either the holder holds such Common Shares in the course of carrying on a business of trading or dealing in securities, or the holder has held or acquired such Common Shares in a transaction or transactions considered to be an adventure in the nature of trade.
This summary is not applicable to a holder (i) that is a "financial institution", as defined in the Tax Act for purposes of the mark-to- market rules, (ii) that is a "specified financial institution", as defined in the Tax Act, (iii) an interest in which would be a "tax shelter investment" as defined in the Tax Act, (iv) that has made a functional currency reporting election for purposes of the Tax Act, (v) that has entered or will enter into a "derivative forward agreement", as defined in the Tax Act, in respect of Common Shares, or (vi) that receives dividends on Common Shares under or as part of a dividend rental arrangement as defined in the Tax Act. Such holders should consult their own tax advisors.
Additional considerations, not discussed herein, may be applicable to a holder that is a corporation resident in Canada, and is, or becomes, or does not deal at arm's length for purposes of the Tax Act with a corporation resident in Canada that is or becomes, as part of a transaction or series of transactions or events that includes the acquisition of the Common Shares, controlled by a non-resident corporation for the purposes of the "foreign affiliate dumping" rules in section 212.3 of the Tax Act. Such holders should consult their tax advisors with respect to the consequences of acquiring Common Shares.
This summary is based upon the current provisions of the Tax Act and the regulations promulgated thereunder (the "Regulations") and the Company's understanding of the current published administrative policies and assessing practices of the Canada Revenue Agency ("CRA"). It also takes into account all proposed amendments to the Tax Act and the Regulations publicly released by the Minister of Finance (Canada) prior to the date hereof ("Tax Proposals"), and assumes that all such Tax Proposals will be enacted as currently proposed. No assurance can be given that the Tax Proposals will be enacted in the form proposed or at all. This summary does not otherwise take into account or anticipate any changes in law or administrative or assessing practice or policy of the CRA, whether by legislative, regulatory, judicial or administrative action or interpretation, nor does it address any provincial, local, territorial or foreign tax considerations.
For purposes of the Tax Act, all amounts, including dividends, adjusted cost base and proceeds of disposition, must generally be determined in Canadian dollars. Amounts denominated in a foreign currency must be converted to Canadian currency using exchange rates determined in accordance with the Tax Act. The amount of any capital gain or any capital loss to a holder with respect to the Common Shares may be affected by fluctuations in Canadian dollar exchange rates.
Holders Not Resident in Canada
The following discussion applies to a holder who, at all relevant times, for purposes of the Tax Act, is neither resident nor deemed to be resident in Canada and does not, and is not deemed to, use or hold Common Shares in carrying on a business or part of a business in Canada (a "Non-Resident holder"). In addition, this discussion does not apply to an insurer who carries or is deemed to carry on, an insurance business in Canada and elsewhere or to an "authorized foreign bank" (as defined in the Tax Act).
Disposition of Common Shares
84
A Non-Resident holder generally will not be subject to tax under the Tax Act in respect of any capital gain realized by such Non- Resident holder on a disposition or deemed disposition of Common Shares unless such shares constitute "taxable Canadian property" (as defined in the Tax Act) of the Non-Resident holder at the time of disposition and the gain is not exempt from tax pursuant to the terms of an applicable income tax treaty or convention. As long as the Common Shares are listed on a designated stock exchange (which currently includes NASDAQ and the TSX) at the time of their disposition, the Common Shares generally will not constitute taxable Canadian property of a Non-Resident holder, unless (a) at any time during the 60-month period immediately preceding the disposition (i) one or any combination of (A) the Non-Resident holder, (B) persons with whom the Non-Resident holder did not deal at arm's length, and (C) partnerships in which the Non-Resident holder or a person described in (B) holds a membership interest directly or indirectly through one or more partnerships, owned 25% or more of the issued shares of any class or series of shares of the Company; and (ii) more than 50% of the fair market value of the shares of the Company was derived directly or indirectly from one or any combination of real or immovable property situated in Canada, "Canadian resource properties" (as defined in the Tax Act), "timber resource properties" (as defined in the Tax Act) or options in respect of, or interests in, or for civil law rights in, any such property whether or not such property exists or (b) the Common Shares are otherwise deemed to be taxable Canadian property to the Non-Resident holder.
A Non-Resident holder's capital gain (or capital loss) in respect of Common Shares that constitute or are deemed to constitute taxable Canadian property (and are not "treaty-protected property" as defined in the Tax Act) will generally be computed in the manner described below under the heading "Holders Resident in Canada - Disposition of Common Shares". If the Common Shares were to cease being listed on NASDAQ, the TSX or another "recognized stock exchange" (as defined in the Tax Act), a Non-Resident holder who disposes of Common Shares that are taxable Canadian property may be required to fulfill the requirements of section 116 of the Tax Act, unless the Common Shares are "treaty-protected property" (as defined in the Tax Act) of the disposing Non-Resident holder.
Non-Resident holders whose Common Shares are taxable Canadian property should consult their own tax advisors.
Taxation of Dividends on Common Shares
Dividends paid or credited or deemed to be paid or credited to a Non-Resident holder by the Company are subject to Canadian withholding tax at the rate of 25% unless reduced by the terms of an applicable tax treaty or convention. Under the Canada - United States Tax Convention (1980) (the "Convention") as amended, the rate of withholding tax on dividends paid or credited to a Non-Resident holder who is the beneficial owner of the dividends, is resident in the U.S. for purposes of the Convention and entitled to the benefits of the Convention (a "U.S. holder") is generally limited to 15% of the gross amount of the dividend (or 5% in the case of a U.S. holder that is a company beneficially owning at least 10% of the Company's voting shares). Non-Resident holders should consult their own tax advisors.
Holders Resident in Canada
The following discussion applies to a holder of Common Shares who, at all relevant times, for purposes of the Tax Act, is or is deemed to be resident in Canada (a "Canadian holder"). Certain Canadian holders whose Common Shares might not otherwise qualify as capital property may, in certain circumstances, treat the Common Shares and every other "Canadian security" (as defined in the Tax Act) owned by the Canadian holder as capital property by making an irrevocable election provided by subsection 39(4) of the Tax Act. Canadian holders should consult their own tax advisors for advice as to whether an election under subsection 39(4) of the Tax Act is available and/or advisable in their particular circumstances.
Taxation of Dividends on Common Shares
Dividends received or deemed to have been received on the Common Shares will be included in a Canadian holder's income for purposes of the Tax Act. Such dividends received or deemed to have been received by a Canadian holder that is an individual (other than certain trusts) will be subject to the gross-up and dividend tax credit rules generally applicable under the Tax Act in respect of dividends received on shares of taxable Canadian corporations. Generally, a dividend will be eligible for the enhanced gross-up and dividend tax credit if the Company designates the dividend as an "eligible dividend" (within the meaning of the Tax Act) in accordance with the provisions of the Tax Act. There may be limitations on the ability of the Company to designate dividends as eligible dividends. A Canadian holder that is a corporation will be required to include such dividends in computing its income and will generally be entitled to deduct the amount of such dividends in computing its taxable income. In certain circumstances, subsection 55(2) of the Tax Act may treat a taxable dividend received by a Canadian holder that is a corporation as proceeds of disposition or a capital gain. A Canadian holder that is a "private corporation" or a "subject corporation" (as such terms are defined in the Tax Act), may be liable under Part IV of the Tax Act to pay a refundable tax on dividends received or deemed to have been received on the Common Shares to the extent such dividends are deductible in computing the holder's taxable income.
Disposition of Common Shares
85
A disposition, or a deemed disposition, of a Common Share by a Canadian holder will generally give rise to a capital gain (or a capital loss) equal to the amount by which the proceeds of disposition of the share, net of any reasonable costs of disposition, exceed (or are less than) the adjusted cost base of the share to the holder. Such capital gain (or capital loss) will be subject to the treatment described below under "Taxation of Capital Gains and Capital Losses".
Additional Refundable Tax
A Canadian holder that is a "Canadian-controlled private corporation" (as such term is defined in the Tax Act) may be liable to pay an additional refundable tax on certain investment income including amounts in respect of "Taxable Capital Gains", as defined below.
Taxation of Capital Gains and Capital Losses
In general, one half of any capital gain (a "Taxable Capital Gain") realized by a Canadian holder in a taxation year will be included in the holder's income in the year. Subject to and in accordance with the provisions of the Tax Act, one half of any capital loss (an "Allowable Capital Loss") realized by a Canadian holder in a taxation year must be deducted from Taxable Capital Gains realized by the holder in the year and Allowable Capital Losses in excess of Taxable Capital Gains may be carried back and deducted in any of the three preceding taxation years or carried forward and deducted in any subsequent taxation year against net Taxable Capital Gains realized in such years. The amount of any capital loss realized by a Canadian holder that is a corporation on the disposition or deemed disposition of a Common Share may be reduced by the amount of dividends received or deemed to have been received by it on such Common Share (or on a share for which the Common Share has been substituted) to the extent and under the circumstances prescribed by the Tax Act. Similar rules may apply where a corporation is a member of a partnership or a beneficiary of a trust that owns Common Shares, directly or indirectly, through a partnership or a trust.
Alternative Minimum Tax
A Taxable Capital Gain realized and taxable dividends received or deemed to have been received by a Canadian holder who is an individual (including a trust, other than certain specified trusts) may give rise to liability for alternative minimum tax.
Material U.S. Federal Income Tax Considerations
The following discussion is a summary of the material U.S. federal income tax consequences applicable to the ownership and disposition of Common Shares by a U.S. Holder (as defined below), but does not purport to be a complete analysis of all potential U.S. federal income tax effects. This summary is based on the Internal Revenue Code of 1986, as amended (the "Code"), U.S. Treasury regulations promulgated thereunder, IRS rulings and judicial decisions in effect on the date hereof. All of these are subject to change, possibly with retroactive effect, or different interpretations. This summary does not discuss the potential effects, whether adverse or beneficial, of any proposed legislation that, if enacted, could be applied on a retroactive basis. This summary is not binding on the IRS, and the IRS is not precluded from taking a position that is different from, and contrary to, the positions taken in this summary.
This summary does not address all aspects of U.S. federal income taxation that may be relevant to particular U.S. Holders in light of their specific circumstances (for example, U.S. Holders subject to the alternative minimum tax or the Medicare contribution tax on net investment income under the Code) or to holders that may be subject to special rules under U.S. federal income tax law, including:
|
•
|
dealers in stocks, securities or currencies;
|
|
•
|
securities traders that use a mark-to-market accounting method;
|
|
•
|
banks and financial institutions;
|
|
•
|
insurance companies;
|
|
•
|
regulated investment companies;
|
|
•
|
real estate investment trusts;
|
|
•
|
tax-exempt organizations;
|
|
•
|
retirement plans, individual plans, individual retirement accounts and tax-deferred accounts;
|
|
•
|
partnerships or other pass-through entities for U.S. federal income tax purposes and their partners or members;
|
|
•
|
persons holding Common Shares as part of a hedging or conversion transaction straddle or other integrated or risk reduction transaction;
|
86
|
•
|
persons who or that are, or may become, subject to the expatriation provisions of the Code;
|
|
•
|
persons whose functional currency is not the U.S. dollar; and
|
|
•
|
direct, indirect or constructive owners of 10% or more of the total combined voting power of all classes of our voting stock or 10% or more of the total value of shares of all classes of our stock.
|
This summary also does not address the tax consequences of holding, exercising or disposing of warrants in the Company. If the Company is a PFIC, as described below, U.S. Holders of its warrants will be subject to adverse tax rules and will not be able to make the mark-to-market or the QEF election described below with respect to such warrants. U.S. Holders of warrants should consult their tax advisors with regard to the U.S. federal income tax consequences of holding, exercising or disposing of warrants in the Company, including in the situation in which the Company is classified as a PFIC.
This summary also does not discuss any aspect of state, local or foreign law, or estate or gift tax law as applicable to U.S. Holders. In addition, this discussion is limited to U.S. Holders holding Common Shares as capital assets. For purposes of this summary, "U.S. Holder" means a beneficial holder of Common Shares who or that for U.S. federal income tax purposes is:
|
•
|
an individual citizen or resident of the United States;
|
|
•
|
a corporation or other entity classified as a corporation for U.S. federal income tax purposes created or organized in or under the laws of the United States, any state thereof or the District of Columbia;
|
|
•
|
an estate, the income of which is subject to U.S. federal income taxation regardless of its source; or
|
|
•
|
a trust, if (a) a court within the United States is able to exercise primary supervision over the administration of such trust and one or more "U.S. persons" (within the meaning of the Code) have the authority to control all substantial decisions of the trust, or (b) a valid election is in effect to be treated as a U.S. person for U.S. federal income tax purposes.
|
If a partnership or other entity or arrangement classified as a partnership for U.S. federal income tax purposes holds Common Shares, the U.S. federal income tax treatment of a partner generally will depend on the status of the partner and the activities of the partnership. This summary does not address the tax consequences to any such partner. Such a partner should consult its own tax advisor as to the tax consequences of the partnership owning and disposing of Common Shares.
U.S. HOLDERS SHOULD CONSULT THEIR OWN TAX ADVISORS WITH REGARD TO THE APPLICATION OF THE TAX CONSEQUENCES DESCRIBED BELOW TO THEIR PARTICULAR SITUATIONS AS WELL AS THE APPLICATION OF ANY STATE, LOCAL, FOREIGN OR OTHER TAX LAWS, INCLUDING GIFT AND ESTATE TAX LAWS.
Tax Consequences if we are a Passive Foreign Investment Company ("PFIC")
A foreign corporation will be classified as a PFIC for any taxable year in which, after taking into account the income and assets of the corporation and certain subsidiaries pursuant to applicable "look-through rules", either (i) at least 75% of its gross income is "passive income" or (ii) at least 50% of the average quarterly value of its assets is attributable to assets which produce passive income or are held for the production of passive income. Passive income generally includes dividends, interest, rents and royalties (other than certain rents and royalties derived in the active conduct of a trade or business), annuities and gains from assets that produce passive income. If a non-U.S. corporation owns at least 25% by value of the stock of another corporation, the non-U.S. corporation is treated for purposes of the PFIC tests as owning its proportionate share of the assets of the other corporation and as receiving directly its proportionate share of the other corporation's income.
The Company believes it was a PFIC for the 2015 taxable year but not for the 2016 and 2017 taxable years. However, the fair market value of the Company's assets may be determined in large part by the market price of the Common Shares, which is likely to fluctuate, and the composition of the Company's income and assets will be affected by how, and how quickly, the Company spends any cash that is raised in any financing transaction. Thus, no assurance can be provided that the Company will not be classified as a PFIC for 2018 or any future taxable year. U.S. Holders should consult their tax advisors regarding the Company's PFIC status.
If the Company is classified as a PFIC for any taxable year during which a U.S. Holder owns Common Shares, the U.S. Holder, absent certain elections (including the mark-to-market and QEF elections described below), will generally be subject to adverse rules (regardless of whether the Company continues to be classified as a PFIC) with respect to (i) any "excess distributions" (generally, any distributions received by the U.S. Holder on the Common Shares in a taxable year that are greater than 125% of the average annual distributions received by the U.S. Holder in the three preceding taxable years or, if shorter, the
87
U.S. Holder's holding period for the Common Shares) and (ii) any gain realized on the sale or other disposition of the Common Shares.
Under these adverse rules (a) the excess distribution or gain will be allocated ratably over the U.S. Holder's holding period, (b) the amount allocated to the current taxable year and any taxable year prior to the first taxable year in which the Company is classified as a PFIC will be taxed as ordinary income, and (c) the amount allocated to each of the other taxable years during which the Company was classified as a PFIC will be subject to tax at the highest rate of tax in effect for the applicable category of taxpayer for that year and an interest charge will be imposed with respect to the resulting tax attributable to each such other taxable year. A U.S. Holder that is not a corporation will be required to treat any such interest paid as "personal interest", which is not deductible.
U.S. Holders can avoid the adverse rules described above in part by making a mark-to-market election with respect to the Common Shares, provided that the Common Shares are "marketable". The Common Shares will be marketable if they are "regularly traded" on a "qualified exchange" or other market within the meaning of applicable U.S. Treasury regulations. For this purpose, the Common Shares generally will be considered to be regularly traded during any calendar year during which they are traded, other than in de minimis quantities, on at least 15 days during each calendar quarter. The Common Shares are currently listed on NASDAQ, which constitutes a qualified exchange; however, there can be no assurance that the Common Shares will be treated as regularly traded for purposes of the mark-to-market election on a qualified exchange. If the Common Shares were not regularly traded on NASDAQ or were delisted from NASDAQ and were not traded on another qualified exchange for the requisite time period described above, the mark-to-market election would not be available.
A U.S. Holder that makes a mark-to-market election must include in gross income, as ordinary income, for each taxable year an amount equal to the excess, if any, of the fair market value of the U.S. Holder's Common Shares at the close of the taxable year over the U.S. Holder's adjusted tax basis in the Common Shares. An electing U.S. Holder may also claim an ordinary loss deduction for the excess, if any, of the U.S. Holder's adjusted tax basis in the Common Shares over the fair market value of the Common Shares at the close of the taxable year, but this deduction is allowable only to the extent of any net mark-to-market gains previously included in income. A U.S. Holder that makes a mark-to-market election generally will adjust such U.S. Holder's tax basis in the Common Shares to reflect the amount included in gross income or allowed as a deduction because of such mark-to-market election. Gains from an actual sale or other disposition of the Common Shares will be treated as ordinary income, and any losses incurred on a sale or other disposition of the Common Shares will be treated as ordinary losses to the extent of any net mark-to-market gains previously included in income.
If the Company is classified as a PFIC for any taxable year in which a U.S. Holder owns Common Shares but before a mark-to-market election is made, the adverse PFIC rules described above will apply to any mark-to-market gain recognized in the year the election is made. Otherwise, a mark-to-market election will be effective for the taxable year for which the election is made and all subsequent taxable years. The election cannot be revoked without the consent of the IRS unless the Common Shares cease to be marketable, in which case the election is automatically terminated.
If the Company is classified as a PFIC, a U.S. Holder of Common Shares will generally be treated as owning stock owned by the Company in any direct or indirect subsidiaries that are also PFICs and will be subject to similar adverse rules with respect to distributions to the Company by, and dispositions by the Company of, the stock of such subsidiaries. A mark-to-market election is not permitted for the shares of any subsidiary of the Company that is also classified as a PFIC. U.S. Holders should consult their tax advisors regarding the availability of, and procedure for making, a mark-to-market election.
In some cases, a shareholder of a PFIC can avoid the interest charge and the other adverse PFIC consequences described above by making a QEF election to be taxed currently on its share of the PFIC's undistributed income. We will endeavor to satisfy the record keeping requirements that apply to a QEF and to supply requesting U.S. Holders with the information that such U.S. Holders are required to report under the QEF rules. However, there can be no assurance that the Company will satisfy the record keeping requirements or provide the information required to be reported by U.S. Holders.
A U.S. Holder that makes a timely and effective QEF election for the first tax year in which its holding period of its Common Shares begins generally will not be subject to the adverse PFIC consequences described above with respect to its Common Shares. Rather, a U.S. Holder that makes a timely and effective QEF election will be subject to U.S. federal income tax on such U.S. Holder's pro rata share of (a) the Company's net capital gain, which will be taxed as long-term capital gain to such U.S. Holder, and (b) the Company's ordinary earnings, which will be taxed as ordinary income to such U.S. Holder, in each case regardless of which such amounts are actually distributed to the U.S. Holder by the Company. Generally, "net capital gain" is the excess of (a) net long-term capital gain over (b) net short-term capital loss, and "ordinary earnings" are the excess of (a) "earnings and profits" over (b) net capital gain.
88
A U.S. Holder that makes a timely and effective QEF election with respect to the Company generally (a) may receive a tax-free distribution from us to the extent that such distribution represents "earnings and profits" that were previously included in income by the U.S. Holder because of such QEF election and (b) will adjust such U.S. Holder's tax basis in the Common Shares to reflect the amount included in income or allowed as a tax-free distribution because of such QEF election. In addition, a U.S. Holder that makes a QEF election generally will recognize capital gain or loss on the sale or other taxable disposition of Common Shares.
The QEF election is made on a shareholder-by-shareholder basis. Once made, a QEF election will apply to the tax year for which the QEF election is made and to all subsequent tax years, unless the QEF election is invalidated or terminated or the IRS consents to revocation of the QEF election. In addition, if a U.S. Holder makes a QEF election, the QEF election will remain in effect (although it will not be applicable) during those tax years in which the Company is not a PFIC.
If the Company is classified as a PFIC and then ceases to be so classified, a U.S. Holder may make an election (a "deemed sale election") to be treated for U.S. federal income tax purposes as having sold such U.S. Holder's Common Shares on the last day of the taxable year of the Company during which it was a PFIC. A U.S. Holder that made a deemed sale election would then cease to be treated as owning stock in a PFIC by reason of ownership of Common Shares in the Company. However, gain recognized as a result of making the deemed sale election would be subject to the adverse rules described above and loss would not be recognized.
If the Company is a PFIC in any year with respect to a U.S. Holder, the U.S. Holder will be required to file an annual information return on IRS Form 8621 regarding distributions received on Common Shares and any gain realized on the disposition of Common Shares.
In addition, if the Company is a PFIC, U.S. Holders will generally be required to file an annual information return with the IRS (also on IRS Form 8621, which PFIC shareholders are required to file with their U.S. federal income tax or information returns) relating to their ownership of Common Shares.
U.S. Holders should consult their tax advisors regarding the potential application of the PFIC regime and any reporting obligations to which they may be subject under that regime.
Dividends
Subject to the PFIC rules discussed above, any distributions paid by the Company out of current or accumulated earnings and profits (as determined for U.S. federal income tax purposes), before reduction for any Canadian withholding tax paid with respect thereto, will generally be taxable to a U.S. Holder as foreign source dividend income, and will not be eligible for the dividends received deduction generally allowed to corporations. Distributions in excess of current and accumulated earnings and profits will be treated as a non-taxable return of capital to the extent of the U.S. Holder's adjusted tax basis in the Common Shares and thereafter as capital gain. The Company does not, however, intend to calculate its earnings and profits under U.S. federal income tax principles. Therefore, U.S. Holders should expect that any distribution from the Company generally will be treated for U.S. federal income tax purposes as a dividend. U.S. Holders should consult their own tax advisors with respect to the appropriate U.S. federal income tax treatment of any distribution received from the Company.
Dividends paid to non-corporate U.S. Holders by the Company in a taxable year in which it is treated as a PFIC, or in the immediately following taxable year, will not be eligible for the special reduced rates normally applicable to long-term capital gains. In all other taxable years, dividends paid by the Company should be taxable to a non-corporate U.S. Holder at the special reduced rates normally applicable to long-term capital gains, provided that certain conditions are satisfied. (including a minimum holding period requirement). The Company believes it was not a PFIC for the 2017 taxable year. However, no assurance can be provided that the Company will not be classified as a PFIC for 2018 and, therefore, no assurance can be provided that a U.S. Holder will be able to claim a reduced rate for dividends paid in 2018 or 2019 (if any). See "Passive Foreign Investment Company Considerations" above.
Under current law, payments of dividends by the Company to non-Canadian investors are generally subject to a 25% Canadian withholding tax. The rate of withholding tax applicable to U.S. Holders that are eligible for benefits under the Canada-United States Tax Convention (the "Convention") is reduced to a maximum of 15%. This reduced rate of withholding will not apply if the dividends received by a U.S. Holder are effectively connected with a permanent establishment of the U.S. Holder in Canada. For U.S. federal income tax purposes, U.S. Holders will be treated as having received the amount of Canadian taxes withheld by the Company, and as then having paid over the withheld taxes to the Canadian taxing authorities. As a result of this rule, the amount of dividend income included in gross income for U.S. federal income tax purposes by a U.S. Holder with respect to a payment of dividends may be greater than the amount of cash actually received (or receivable) by the U.S. Holder from the Company with respect to the payment.
89
Subject to certain limitations, a U.S. Holder will generally be entitled, at the election of the U.S. Holder, to a credit against its U.S. federal income tax liability, or a deduction in computing its U.S. federal taxable income, for Canadian income taxes withheld by the Company. This election is made on a year-by-year basis and applies to all foreign taxes paid (whether directly or through withholding) by a U.S. Holder during a year. For purposes of the foreign tax credit limitation, dividends paid by the Company generally will constitute foreign source income in the "passive category income" basket. The foreign tax credit rules are complex and U.S. Holders should consult their tax advisors concerning the availability of the foreign tax credit in their particular circumstances.
Dividends paid in Canadian dollars will be included in the gross income of a U.S. Holder in a U.S. dollar amount calculated by reference to the exchange rate in effect on the date the U.S. Holder (actually or constructively) receives the dividend, regardless of whether such Canadian dollars are actually converted into U.S. dollars at that time. If the Canadian dollars received are not converted into U.S. dollars on the date of receipt, a U.S. Holder will have a tax basis in the Canadian dollars equal to their U.S. dollar value on the date of receipt. Gain or loss, if any, realized on a sale or other disposition of the Canadian dollars will generally be U.S. source ordinary income or loss to a U.S. Holder.
The Company generally does not pay any dividends and does not anticipate paying any dividends in the foreseeable future.
Sale, Exchange or Other Taxable Disposition of Common Shares
Subject to the PFIC rules discussed above, upon a sale, exchange or other taxable disposition of Common Shares, a U.S. Holder generally will recognize capital gain or loss for U.S. federal income tax purposes equal to the difference, if any, between the amount realized on the sale, exchange or other taxable disposition and the U.S. Holder's adjusted tax basis in the Common Shares.
This capital gain or loss will be long-term capital gain or loss if the U.S. Holder's holding period in the Common Shares exceeds one year. The deductibility of capital losses is subject to limitations. Any gain or loss will generally be U.S. source for U.S. foreign tax credit purposes.
Information Reporting and Backup Withholding
Payments made within the U.S., or by a U.S. payor or U.S. middleman, of dividends on, and proceeds arising from sales or other dispositions of Common Shares, generally will be reported to the IRS and to the U.S. Holder as required under applicable regulations. Backup withholding tax may apply to these payments if the U.S. Holder fails to timely provide in the appropriate manner an accurate taxpayer identification number or otherwise fails to comply with, or establish an exemption from, such backup withholding tax requirements. Certain U.S. Holders are not subject to the information reporting or backup withholding tax requirements described herein. U.S. Holders should consult their tax advisors as to their qualification for exemption from backup withholding tax and the procedure for establishing an exemption.
Backup withholding tax is not an additional tax. U.S. Holders generally will be allowed a refund or credit against their U.S. federal income tax liability for amounts withheld, provided the required information is timely furnished to the IRS.
Subject to certain exceptions and future guidance, U.S. tax legislation generally requires a U.S. Holder that is a specified individual or a domestic entity, to report annually to the IRS on IRS Form 8938 such U.S. Holder's interests in stock or securities issued by a non-U.S. person (such as the Company). U.S. Holders should consult their tax advisors regarding the information reporting obligations that may arise from their acquisition, ownership or disposition of Common Shares.
|
F.
|
Dividends and paying agents
|
Not applicable.
|
G.
|
Statement by experts
|
Not applicable.
|
H.
|
Documents on display
|
In addition to placing our audited consolidated annual financial statements before every annual meeting of shareholders as described above, we are subject to the information requirements of the Securities Exchange Act of 1934, as amended. In accordance with these requirements, we file and furnish reports and other information with the SEC. These materials, including this Annual Report on Form 20-F and the exhibits hereto, may be inspected and copied at the SEC's Public Reference Room at 100 F Street, N.E.,
Room 1580, Washington, D.C. 20549. The public may obtain information on the operation of the SEC's Public Reference Room
90
by calling the SEC in the United States at 1-800-SEC-0330. The SEC also maintains a website at www.sec.gov that contains reports, proxy statements and other information regarding registrants that file electronically with the SEC. Our annual reports and some of the other information we submitted to the SEC may be accessed through this website. In addition, material we filed
can be inspected on the Canadian Securities Administrators' electronic filing system, SEDAR, accessible at the website www.sedar.com. This material
includes our Management Information Circular for our annual meeting of shareholders to be held on May 8, 2018 to be furnished to the SEC on Form 6-K, which provides information including directors' and officers' remuneration and indebtedness and principal holders of securities. Additional financial information is provided in our audited annual financial statements for the year ended
December 31, 2017
and our MD&A relating to these statements included elsewhere in this Annual Report on Form 20-F. These documents are also accessible on
SEDAR (www.sedar.com) and on EDGAR (www.sec.gov).
|
I.
|
Subsidiary information
|
Our subsidiaries are set forth under "Item 4C. – Organizational Structure".
|
Item 11.
|
Quantitative and Qualitative Disclosures About Market Risk
|
Fair value
The Company classifies its financial instruments in the following categories: "Financial assets at fair value through profit or loss ("FVTPL")"; "Loans and receivables"; "Financial liabilities at FVTPL"; and "Other financial liabilities".
|
•
|
The Company's loans and receivables are comprised of cash and cash equivalents, trade and other receivables and restricted cash equivalents.
|
|
•
|
Financial liabilities at FVTPL are currently comprised of the Company's warrant liability.
|
|
•
|
Other financial liabilities include payables, accrued liabilities, and provision for restructuring costs.
|
The carrying values of all of the aforementioned financial instruments, excluding warrant liability which is stated at fair value, approximate their fair values due to their short-term maturity or to the prevailing interest rates of these instruments, which are comparable to those of the market.
Financial risk factors
The following provides disclosures relating to the nature and extent of the Company's exposure to risks arising from financial instruments, including credit risk, liquidity risk and market risk (share price risk) and how the Company manages those risks.
(a) Credit risk
Credit risk is the risk of an unexpected loss if a customer or counterparty to a financial instrument fails to meet its contractual obligations. The Company regularly monitors credit risk exposure and takes steps to mitigate the likelihood of this exposure resulting in losses. The Company's exposure to credit risk currently relates to the loans and receivables in the table above. The Company holds its available cash in amounts that are readily convertible to known amounts of cash and deposits its cash balances with financial institutions that have an investment grade rating of at least
"P-2" or the equivalent. This information is supplied by independent rating agencies where available and, if not available, the Company uses publicly available financial information to ensure that it invests its cash in creditworthy and reputable financial institutions.
As at
December 31, 2017
trade accounts receivable for an amount of approximately
$20,000
were with
three
counterparties, and
no
trade accounts receivable were past due and
none
were impaired.
Generally, the Company does not require collateral or other security from customers for trade accounts receivable; however, credit is extended following an evaluation of creditworthiness. In addition, the Company performs ongoing credit reviews of all of its customers and establishes an allowance for doubtful accounts when accounts are determined to be uncollectible.
The maximum exposure to credit risk approximates the amount recognized in the Company's consolidated statement of financial position.
91
(b) Liquidity risk
Liquidity risk is the risk that the Company will not be able to meet its financial obligations as they become due. As indicated in
note 21 - Capital disclosures
, the Company manages this risk through the management of its capital structure. It also manages liquidity risk by continuously monitoring actual and projected cash flows. The Board of Directors reviews and approves the Company's operating and capital budgets, as well as any material transactions occurring outside of the ordinary course of business. The Company has adopted an investment policy in respect of the safety and preservation of its capital to ensure the Company's liquidity needs are met. The instruments are selected with regard to the expected timing of expenditures and prevailing interest rates.
On December 20, 2017, the FDA granted marketing approval for Macrilen™ (macimorelin) to be used in the diagnosis of patients with AGHD. On January 16, 2018, the Company, through AEZS Germany entered into the Strongbridge License Agreement.
The Strongbridge License Agreement will contribute to fulfilling the Company's future obligations (see note 26 - Subsequent events).
(c) Market risk
Share price risk
The change in fair value of the Company's warrant liability, which is measured at FVTPL, results from the periodic "mark-to-market" revaluation, via the application of option pricing models, of currently outstanding share purchase warrants. These valuation models are impacted, among other inputs, by the market price of the Company's common shares. As a result, the change in fair value of the warrant liability, which is reported in the consolidated statements of comprehensive loss, has been and may continue in future periods to be materially affected most notably by changes in the Company's common share closing price, which on the NASDAQ ranged from
$0.84
to
$
3.65
during the year ended
December 31, 2017
.
If variations in the market price of our common shares of -
30%
and +
30%
were to occur, the impact on the Company's net loss related to the warrant liability held at
December 31, 2017
would be as follows:
|
(in thousands)
|
Carrying
amount |
-30%
|
+30%
|
||||||
|
$
|
$
|
$
|
|||||||
|
Warrant liability
|
3,897
|
|
1,359
|
|
(1,474
|
)
|
|||
|
Total impact on net loss – decrease / (increase)
|
1,359
|
|
(1,474
|
)
|
|||||
Foreign currency risk
We have not entered into any forward currency contracts or other financial derivatives to hedge foreign exchange risk. We are therefore subject to foreign currency transaction and translation gains and losses.
92
|
Item 12.
|
Description of Securities Other than Equity Securities
|
|
A.
|
Debt securities
|
Not applicable.
|
B.
|
Warrants and rights
|
Not applicable.
|
C.
|
Other securities
|
Not applicable.
|
D.
|
American depositary shares
|
Not applicable.
|
Item 13.
|
Defaults, Dividend Arrearages and Delinquencies
|
None.
|
Item 14.
|
Material Modifications to the Rights of Security Holders and Use of Proceeds
|
None.
|
Item 15.
|
Controls and Procedures
|
Under the supervision and with the participation of our management, including the Chief Executive Officer and the Chief Financial Officer, we have evaluated the effectiveness of our disclosure controls and procedures as at
December 31, 2017
. Based on that evaluation, the Chief Executive Officer and Chief Financial Officer have concluded that these disclosure controls and procedures were effective as at
December 31, 2017
.
Management's Annual Report on Internal Control over Financial Reporting
Our management is responsible for establishing and maintaining adequate internal control over financial reporting. Our internal control over financial reporting is a process designed to provide reasonable assurance regarding the reliability of financial reporting and the preparation of financial statements for external purposes in accordance with IFRS as issued by the IASB.
Our internal control over financial reporting includes those policies and procedures that: (i) pertain to the maintenance of records that, in reasonable detail, accurately and fairly reflect the transactions and dispositions of the assets of Aeterna Zentaris; (ii) provide reasonable assurance that transactions are recorded as necessary to permit preparation of financial statements in accordance with IFRS, and that receipts and expenditures of the Company are being made only in accordance with authorizations of Company management; and (iii) provide reasonable assurance regarding prevention or timely detection of unauthorized acquisition, use or disposition of Company assets that could have a material effect on the financial statements.
Because of its inherent limitations, internal control over financial reporting may not prevent or detect misstatements. Also, projections of any evaluation of effectiveness to future periods are subject to the risk that controls may become inadequate because of changes in conditions, or that the degree of compliance with the policies or procedures may deteriorate.
Management conducted an evaluation of the effectiveness of our internal control over financial reporting based on the criteria established in
Internal Control – Integrated Framework: 2013
issued by the Committee of Sponsoring Organizations of the Treadway Commission. Based on this evaluation, management has concluded that our internal control over financial reporting was effective as at
December 31, 2017
.
93
Changes in Internal Controls over Financial Reporting
There were no changes in our internal control over financial reporting during the year ended
December 31, 2017
that materially affected, or are reasonably likely to materially affect, our internal control over financial reporting.
The design of any system of controls and procedures is based in part upon certain assumptions about the likelihood of certain events. There can be no assurance that any design will succeed in achieving its stated goals under all potential future conditions, including conditions that are remote.
In accordance with Securities and Exchange Commission’s rules regarding non-accelerated filers, this Annual Report on Form 20-F does not include an attestation report of the Company's independent registered public accounting firm regarding the Company's internal control over financial reporting.
|
Item 16A.
|
Audit Committee Financial Expert
|
Our Board has determined that we have at least one audit committee financial expert (as defined in paragraph (b) of Item 16A to Form 20-F). The name of the audit committee financial expert is Mr. Gérard Limoges, FCPA, FCA, the Audit Committee's Chairman. In accordance with Item 16A, paragraph (d) of Form 20-F, the designation of Mr. Limoges as our audit committee financial expert does not: (i) make Mr. Limoges an "expert" for any purpose, including without limitation for purposes of Section 11 of the Securities Act of 1933, as amended, as a result of this designation; (ii) impose any duties, obligations or liability on Mr. Limoges that are greater than those imposed on him as a member of the Audit Committee and the Board in the absence of such designation; or (iii) affect the duties, obligations or liability of any other member of the Audit Committee or the Board. The other members of the Audit Committee are Messrs. Michael Cardiff and Juergen Ernst, each of whom, along with Mr. Limoges, is independent, as that term is defined in the NASDAQ listing standards. For a description of their respective education and experience, please refer to "Item 6. – Directors, Senior Management and Employees".
|
Item 16B.
|
Code of Ethics
|
On December 16, 2017, the Board adopted a "Code of Conduct and Business Ethics", which replaced the then existing Code of Ethical Conduct as of January 1, 2018. The Code of Conduct and Business Ethics expanded on the previous Code of Ethical Conduct to provide additional details of expected conduct of all employees and directors of the Company, including specific obligations the Company and its employees has as a member of the healthcare industry. We selected an independent third party supplier to provide a confidential and anonymous communication channel for reporting concerns about possible violations to our Code of Ethical Conduct as well as financial and/or accounting irregularities or fraud. A copy of the Code of Ethical Conduct, as amended, is incorporated by reference as Exhibit 11.1 to this Annual Report on Form 20-F and is also available on our Web site at www.aezsinc.com under the Investors - Corporate Governance tab. The Code of Ethical Conduct is a "code of ethics" as defined in paragraph (b) of Item 16B to Form 20- F. The Code of Ethical Conduct applies to all of our employees, directors and officers, including our principal executive officer, principal financial officer, and principal accounting officer or controller, or persons performing similar functions, and includes specific provisions dealing with integrity in accounting matters, conflicts of interest and compliance with applicable laws and regulations. On December 4, 2014, our Board of Directors adopted a "Code of Business Conduct and Ethics for Members of the Board of Directors", which is incorporated by reference as Exhibit 11.2 to this Annual Report on Form 20-F. We will provide these documents without charge to any person or company upon request to our Corporate Secretary, at our head office at 315 Sigma Drive, Summerville, South Carolina 29486.
|
Item 16C.
|
Principal Accountant Fees and Services
|
(All amounts are in U.S. dollars)
|
(a)
|
Audit Fees
|
During th
e financial years ended
December 31, 2017
and
2016
, the Company's principal accountant, PricewaterhouseCoopers LLP, billed $506,309 and
$363
,962,
respectively, for the audit of the
Company's
annual consolidated financial statements and for services rendered in connection with statutory and regulatory filings.
94
|
(b)
|
Audit-related Fees
|
During the financial years ended
December 31, 2017
and
2016
, the
Company's
principal accountant, PricewaterhouseCoopers LLP, billed $113,430 and $164,477
,
respectively, for audit or attest services not required by statute or regulation, for accounting consultations on proposed transactions, for the review of prospectuses and prospectus supplements, including the delivery of customary consent and comfort letters in connection therewith.
|
(c)
|
Tax Fees
|
During the financial years ended
December 31, 2017
and
2016
, the
Company's
principal accountants, PricewaterhouseCoopers LLP billed $5,426 and
$17,153
, respectively, for services related to tax compliance, tax planning and tax advice.
|
(d)
|
All Other Fees
|
During the financial years ended
December 31, 2017
and
2016
, the
Company's
principal accountant, PricewaterhouseCoopers LLP, did not bill us for services not included in audit fees, audit-related fees and tax fees.
|
(e)
|
Audit Committee Pre-Approval Policies and Procedures
|
Under applicable Canadian securities regulations, we are required to disclose whether our Audit Committee has adopted specific policies and procedures for the engagement of non-audit services and to prepare a summary of these policies and procedures. The Audit Committee Charter (incorporated by reference as Exhibit 11.3 to this Annual Report on Form 20-F) provides that it is such committee's responsibility to approve all audit engagement fees and terms as well as reviewing policies for the provision of non-audit services by the external auditors and, when required, the framework for pre-approval of such services. The Audit Committee delegates to its Chairman the pre-approval of such non-audit fees. The pre-approval by the Chairman is then presented to the Audit Committee at its first scheduled meeting following such pre-approval.
For each of the years ended
December 31, 2017
and
2016
, there were no non-audit services provided by our external auditor that required the approval from the Audit Committee pursuant to the "de minimis exception" to the pre-approval requirement for non-audit services.
|
(f)
|
Work performed by Full-time, Permanent Employees of Principal Accountant
|
During the financial year ended
December 31, 2017
, no person other than the full-time, permanent employees of our principal accountant, PricewaterhouseCoopers LLP, performed more than 50% of the audit work on our financial statements.
|
Item 16D.
|
Exemptions from the Listing Standards for Audit Committees
|
None.
|
Item 16E.
|
Purchases of Equity Securities by the Issuer and Affiliated Purchasers
|
None.
|
Item 16F.
|
Change in Registrant's Certifying Accountant
|
None.
|
Item 16G.
|
Corporate Governance
|
We are generally in compliance with the corporate governance requirements of NASDAQ except as described below. We are not in compliance with the NASDAQ requirement that a quorum for a meeting of the holders of our Common Shares be no less than
33 1/3%
of such outstanding shares. Our bylaws provide that a quorum for purposes of any meeting of our shareholders consists of at least 10% of the outstanding voting shares. We benefit from an exemption from NASDAQ from this quorum requirement because the quorum provided for in our bylaws complies with the requirements of the CBCA, our governing corporate statute, and with the rules of TSX, the home country exchange on which our voting shares are traded. In accordance with applicable current
95
NASDAQ requirements, we have in the past, and upon request, provided to NASDAQ letters from outside counsel certifying that these practices are not prohibited by our home country law.
|
Item 16H.
|
Mine Safety Disclosure
|
None.
96
|
Item 17
|
Financial Statements
|
We have elected to provide financial statements pursuant to Item 18.
|
Item 18.
|
Financial Statements
|
The financial statements appear on pages 98 to 146.
97
Aeterna Zentaris Inc.
Consolidated Financial Statements
As at
December 31, 2017
and
December 31, 2016
and for the years ended
December 31, 2017
,
2016
and
2015
(presented in thousands of U.S. dollars)
98
Report of Independent Registered Public Accounting Firm
To the Board of Directors and Shareholders of
Aeterna Zentaris Inc.
Opinion on the Financial Statements
We have audited the accompanying consolidated balance sheets of Aeterna Zentaris Inc. and its subsidiaries as of December 31, 2017 and December 31, 2016, and the related consolidated statements of changes in shareholder’s (deficiency) equity, comprehensive loss and cash flow for each of the three years in the period ended December 31, 2017, including the related notes (collectively referred to as the "consolidated financial statements"). In our opinion, the consolidated financial statements present fairly, in all material respects, the financial position of the Company as of December 31, 2017 and December 31, 2016, and their financial performance and their cash flows for each of the three years in the period ended December 31, 2017 in conformity with International Financial Reporting Standards as issued by the International Accounting Standards Board.
Basis for Opinion
These consolidated financial statements are the responsibility of the Company's management. Our responsibility is to express an opinion on the Company’s consolidated financial statements based on our audits. We are a public accounting firm registered with the Public Company Accounting Oversight Board (United States) ("PCAOB") and are required to be independent with respect to the Company in accordance with the U.S. federal securities laws and the applicable rules and regulations of the Securities and Exchange Commission and the PCAOB.
We conducted our audits of these consolidated financial statements in accordance with the standards of the PCAOB. Those standards require that we plan and perform the audit to obtain reasonable assurance about whether the consolidated financial statements are free of material misstatement, whether due to error or fraud. The Company is not required to have, nor were we engaged to perform, an audit of its internal control over financial reporting. As part of our audits we are required to obtain an understanding of internal control over financial reporting but not for the purpose of expressing an opinion on the effectiveness of the Company’s internal control over financial reporting. Accordingly, we express no such opinion.
Our audits included performing procedures to assess the risks of material misstatement of the consolidated financial statements, whether due to error or fraud, and performing procedures that respond to those risks. Such procedures included examining, on a test basis, evidence regarding the amounts and disclosures in the consolidated financial statements. Our audits also included evaluating the accounting principles used and significant estimates made by management, as well as evaluating the overall presentation of the consolidated financial statements. We believe that our audits provide a reasonable basis for our opinion.

PricewaterhouseCoopers LLP
Quebec, Quebec, Canada
March 27, 2018
We have served as the Company's auditor since 1993
1
CPA auditor, CA, public accountancy permit No. A121191
99
|
Aeterna Zentaris Inc.
|
|
Consolidated Statements of Financial Position
|
|
(in thousands of US dollars)
|
|
December 31, 2017
|
December 31, 2016
|
|||||
|
$
|
$
|
|||||
|
ASSETS
|
||||||
|
Current assets
|
||||||
|
Cash and cash equivalents (note 6)
|
7,780
|
|
21,999
|
|
||
|
Trade and other receivables (note 8)
|
221
|
|
365
|
|
||
|
Inventory (note 7)
|
643
|
|
—
|
|
||
|
Prepaid expenses and other current assets
|
737
|
|
379
|
|
||
|
Total current assets
|
9,381
|
|
22,743
|
|
||
|
Restricted cash equivalents
|
381
|
|
496
|
|
||
|
Property, plant and equipment (note 9)
|
101
|
|
204
|
|
||
|
Deferred tax assets (note 20)
|
3,479
|
|
—
|
|
||
|
Identifiable intangible assets (note 10)
|
90
|
|
70
|
|
||
|
Other non-current assets
|
150
|
|
593
|
|
||
|
Goodwill (note 11)
|
8,613
|
|
7,553
|
|
||
|
Total assets
|
22,195
|
|
31,659
|
|
||
|
LIABILITIES
|
||||||
|
Current liabilities
|
||||||
|
Payables and accrued liabilities (note 12)
|
2,987
|
|
3,745
|
|
||
|
Provision for restructuring costs (note 13)
|
2,296
|
|
33
|
|
||
|
Current portion of deferred revenues (note 5)
|
486
|
|
426
|
|
||
|
Total current liabilities
|
5,769
|
|
4,204
|
|
||
|
Deferred revenues (note 5)
|
55
|
|
474
|
|
||
|
Warrant liability (note 14)
|
3,897
|
|
6,854
|
|
||
|
Employee future benefits (note 18)
|
14,229
|
|
13,414
|
|
||
|
Provisions (note 15)
|
1,028
|
|
501
|
|
||
|
Total liabilities
|
24,978
|
|
25,447
|
|
||
|
SHAREHOLDERS' (DEFICIENCY) EQUITY
|
||||||
|
Share capital (note 16)
|
222,335
|
|
213,980
|
|
||
|
Other capital
|
88,772
|
|
88,590
|
|
||
|
Deficit
|
(314,161
|
)
|
(298,059
|
)
|
||
|
Accumulated other comprehensive income
|
271
|
|
1,701
|
|
||
|
Total shareholders' (deficiency) equity
|
(2,783
|
)
|
6,212
|
|
||
|
Total liabilities and shareholders' (deficiency) equity
|
22,195
|
|
31,659
|
|
||
Commitments and contingencies (note 25)
Subsequent events (note 26)
The accompanying notes are an integral part of these consolidated financial statements.
Approved by the Board of Directors
|
/s/ Carolyn Egbert
|
/s/ Gérard Limoges
|
|
|
Carolyn Egbert
Chair of the Board
|
Gérard Limoges
Director
|
|
100
|
Aeterna Zentaris Inc.
|
|
Consolidated Statements of Changes in Shareholders' (Deficiency) Equity
|
|
For the years ended December 31, 2017, 2016 and 2015
|
|
(in thousands of US dollars, except share data)
|
|
Common shares (number of)
1
|
Share capital
|
Other capital
|
Deficit
|
Accumulated other comprehensive income
|
Total
|
|||||||||||||
|
$
|
$
|
$
|
$
|
$
|
||||||||||||||
|
Balance - January 1, 2017
|
12,917,995
|
|
213,980
|
|
88,590
|
|
(298,059
|
)
|
1,701
|
|
6,212
|
|
||||||
|
Net loss
|
—
|
|
—
|
|
—
|
|
(16,796
|
)
|
—
|
|
(16,796
|
)
|
||||||
|
Other comprehensive income (loss):
|
||||||||||||||||||
|
Foreign currency translation adjustments
|
—
|
|
—
|
|
—
|
|
—
|
|
(1,430
|
)
|
(1,430
|
)
|
||||||
|
Actuarial gain on defined benefit plan (note 18)
|
—
|
|
—
|
|
—
|
|
694
|
|
—
|
|
694
|
|
||||||
|
Comprehensive loss
|
—
|
|
—
|
|
—
|
|
(16,102
|
)
|
(1,430
|
)
|
(17,532
|
)
|
||||||
|
Share issuances pursuant to the exercise of pre-funded warrants (note 16)
|
301,343
|
|
977
|
|
—
|
|
—
|
|
—
|
|
977
|
|
||||||
|
Share issuances in connection with "At-the-Market" drawdowns (note 16)
|
3,221,422
|
|
7,378
|
|
—
|
|
—
|
|
—
|
|
7,378
|
|
||||||
|
Share-based compensation costs
|
—
|
|
—
|
|
182
|
|
—
|
|
—
|
|
182
|
|
||||||
|
Balance - December 31, 2017
|
16,440,760
|
|
222,335
|
|
88,772
|
|
(314,161
|
)
|
271
|
|
(2,783
|
)
|
||||||
|
1
|
Issued and paid in full.
|
The accompanying notes are an integral part of these consolidated financial statements.
101
|
Aeterna Zentaris Inc.
|
|
Consolidated Statements of Changes in Shareholders' (Deficiency) Equity
|
|
For the years ended December 31, 2017, 2016 and 2015
|
|
(in thousands of US dollars, except share data)
|
|
Common shares (number of)
1, 2
|
Share capital
|
Pre-funded warrants
|
Other capital
|
Deficit
|
Accumulated other comprehensive income (loss)
|
Total
|
|||||||||||||||
|
$
|
$
|
$
|
$
|
$
|
$
|
||||||||||||||||
|
Balance - January 1, 2016
|
9,928,697
|
|
204,596
|
|
—
|
|
87,508
|
|
(271,621
|
)
|
1,132
|
|
21,615
|
|
|||||||
|
Net loss
|
—
|
|
—
|
|
—
|
|
—
|
|
(24,959
|
)
|
—
|
|
(24,959
|
)
|
|||||||
|
Other comprehensive loss:
|
|||||||||||||||||||||
|
Foreign currency translation adjustments
|
—
|
|
—
|
|
—
|
|
—
|
|
—
|
|
569
|
|
569
|
|
|||||||
|
Actuarial loss on defined benefit plan (note 18)
|
—
|
|
—
|
|
—
|
|
—
|
|
(1,479
|
)
|
—
|
|
(1,479
|
)
|
|||||||
|
Comprehensive loss
|
—
|
|
—
|
|
—
|
|
—
|
|
(26,438
|
)
|
569
|
|
(25,869
|
)
|
|||||||
|
Share issuances in connection with public offerings (note 16)
|
1,150,000
|
|
3,377
|
|
—
|
|
—
|
|
—
|
|
—
|
|
3,377
|
|
|||||||
|
Pre-funded warrant issuances in connection with a public offering (note 16)
|
—
|
|
—
|
|
2,789
|
|
—
|
|
—
|
|
—
|
|
2,789
|
|
|||||||
|
Share issuances pursuant to the exercise of pre-funded warrants (note 16)
|
950,000
|
|
2,789
|
|
(2,789
|
)
|
—
|
|
—
|
|
—
|
|
—
|
|
|||||||
|
Share issuances in connection with "at-the-market" drawdowns (note 16)
|
889,298
|
|
3,218
|
|
—
|
|
—
|
|
—
|
|
—
|
|
3,218
|
|
|||||||
|
Share-based compensation costs
|
—
|
|
—
|
|
1,082
|
|
—
|
|
—
|
|
1,082
|
|
|||||||||
|
Balance - December 31, 2016
|
12,917,995
|
|
213,980
|
|
—
|
|
88,590
|
|
(298,059
|
)
|
1,701
|
|
6,212
|
|
|||||||
|
Balance - January 1, 2015
|
655,091
|
|
150,544
|
|
—
|
|
86,639
|
|
(222,322
|
)
|
(377
|
)
|
14,484
|
|
||||||
|
Net loss
|
—
|
|
—
|
|
—
|
|
—
|
|
(50,143
|
)
|
—
|
|
(50,143
|
)
|
||||||
|
Other comprehensive loss:
|
||||||||||||||||||||
|
Foreign currency translation adjustments
|
—
|
|
—
|
|
—
|
|
—
|
|
—
|
|
1,509
|
|
1,509
|
|
||||||
|
Actuarial loss on defined benefit plan (note 18)
|
—
|
|
—
|
|
—
|
|
—
|
|
844
|
|
—
|
|
844
|
|
||||||
|
Comprehensive loss
|
—
|
|
—
|
|
—
|
|
—
|
|
(49,299
|
)
|
1,509
|
|
(47,790
|
)
|
||||||
|
Share issuances in connection with public offerings (note 16)
|
3,250,481
|
|
14,322
|
|
—
|
|
—
|
|
—
|
|
—
|
|
14,322
|
|
||||||
|
Pre-funded warrant issuances in connection with a public offering (note 16)
|
—
|
|
—
|
|
8,653
|
|
—
|
|
—
|
|
—
|
|
8,653
|
|
||||||
|
Share issuances pursuant to the exercise of pre-funded warrants (note 16)
|
346,294
|
|
8,653
|
|
(8,653
|
)
|
—
|
|
—
|
|
—
|
|
—
|
|
||||||
|
Share issuances pursuant to the exercise of warrants (other than pre-funded warrants)
|
5,676,831
|
|
31,077
|
|
—
|
|
—
|
|
—
|
|
—
|
|
31,077
|
|
||||||
|
Share-based compensation costs
|
869
|
|
—
|
|
—
|
|
869
|
|
||||||||||||
|
Balance - December 31, 2015
|
9,928,697
|
|
204,596
|
|
—
|
|
87,508
|
|
(271,621
|
)
|
1,132
|
|
21,615
|
|
||||||
1
Issued and paid in full.
|
2
|
Adjusted to reflect the November 17, 2015
100
-to-1 Share Consolidation (see
note 1 - Business overview
and
note 16 - Share capital
).
|
The accompanying notes are an integral part of these consolidated financial statements.
102
|
Aeterna Zentaris Inc.
|
|
Consolidated Statements of Comprehensive Loss
|
|
For the years ended December 31, 2017, 2016 and 2015
|
|
(in thousands of US dollars, except share and per share data)
|
|
|
Years ended December 31,
|
||||||||
|
2017
|
2016
|
2015
|
|||||||
|
$
|
$
|
$
|
|||||||
|
Revenues
|
|||||||||
|
Sales commission and other
|
465
|
|
414
|
|
297
|
|
|||
|
License fees (note 5)
|
458
|
|
497
|
|
248
|
|
|||
|
Total revenues
|
923
|
|
911
|
|
545
|
|
|||
|
Operating expenses (note 17)
|
|||||||||
|
Research and development costs
|
10,704
|
|
16,495
|
|
17,234
|
|
|||
|
General and administrative expenses
|
8,198
|
|
7,147
|
|
11,308
|
|
|||
|
Selling expenses
|
5,095
|
|
6,745
|
|
6,887
|
|
|||
|
Total operating expenses
|
23,997
|
|
30,387
|
|
35,429
|
|
|||
|
Loss from operations
|
(23,074
|
)
|
(29,476
|
)
|
(34,884
|
)
|
|||
|
Gain (loss) due to changes in foreign currency exchange rates
|
502
|
|
(70
|
)
|
(1,767
|
)
|
|||
|
Change in fair value of warrant liability (note 14)
|
2,222
|
|
4,437
|
|
(10,956
|
)
|
|||
|
Warrant exercise inducement fee (note 14)
|
—
|
|
—
|
|
(2,926
|
)
|
|||
|
Other finance income
|
75
|
|
150
|
|
305
|
|
|||
|
Net finance income (costs)
|
2,799
|
|
4,517
|
|
(15,344
|
)
|
|||
|
Loss before income taxes
|
(20,275
|
)
|
(24,959
|
)
|
(50,228
|
)
|
|||
|
Income tax recovery (note 20)
|
3,479
|
|
—
|
|
—
|
|
|||
|
Net loss from continuing operations
|
(16,796
|
)
|
(24,959
|
)
|
(50,228
|
)
|
|||
|
Net income from discontinued operations
|
—
|
|
—
|
|
85
|
|
|||
|
Net loss
|
(16,796
|
)
|
(24,959
|
)
|
(50,143
|
)
|
|||
|
Other comprehensive loss:
|
|||||||||
|
Items that may be reclassified subsequently to profit or loss:
|
|||||||||
|
Foreign currency translation adjustments
|
(1,430
|
)
|
569
|
|
1,509
|
|
|||
|
Items that will not be reclassified to profit or loss:
|
|||||||||
|
Actuarial gain (loss) on defined benefit plans (note 18)
|
694
|
|
(1,479
|
)
|
844
|
|
|||
|
Comprehensive loss
|
(17,532
|
)
|
(25,869
|
)
|
(47,790
|
)
|
|||
|
Net loss per share (basic and diluted) from continuing operations (note 24)¹
|
(1.12
|
)
|
(2.41
|
)
|
(18.17
|
)
|
|||
|
Net income per share (basic and diluted) from discontinued operations (note 24)¹
|
—
|
|
—
|
|
0.03
|
|
|||
|
Net loss per share (basic and diluted) (note 24)¹
|
(1.12
|
)
|
(2.41
|
)
|
(18.14
|
)
|
|||
|
Weighted average number of shares outstanding (note 24):¹
|
|||||||||
|
Basic and Diluted
|
14,958,704
|
|
10,348,879
|
|
2,763,603
|
|
|||
|
1
|
Adjusted to reflect the November 17, 2015
100
-to-1 Share Consolidation (see
|
The accompanying notes are an integral part of these consolidated financial statements.
103
|
Aeterna Zentaris Inc.
|
|
Consolidated Statements of Cash Flows
|
|
For the years ended December 31, 2017, 2016 and 2015
|
|
(in thousands of US dollars)
|
|
Year ended December 31,
|
||||||||
|
2017
|
2016
|
2015
|
||||||
|
$
|
$
|
$
|
||||||
|
Cash flows from operating activities
|
||||||||
|
Net loss for the year
|
(16,796
|
)
|
(24,959
|
)
|
(50,228
|
)
|
||
|
Items not affecting cash and cash equivalents:
|
|
|
||||||
|
Change in fair value of warrant liability (note 14)
|
(2,222
|
)
|
(4,437
|
)
|
10,956
|
|
||
|
Provision for restructuring costs (note 13)
|
3,083
|
|
(8
|
)
|
932
|
|
||
|
Recapture of inventory previously written off (note 7)
|
(643
|
)
|
—
|
|
—
|
|
||
|
Depreciation, amortization and impairment (notes 9 and 10)
|
94
|
|
280
|
|
341
|
|
||
|
Deferred income taxes (note 20)
|
(3,479
|
)
|
—
|
|
—
|
|
||
|
Share-based compensation costs (note 16)
|
182
|
|
1,082
|
|
919
|
|
||
|
Employee future benefits (note 18)
|
246
|
|
382
|
|
351
|
|
||
|
Amortization of deferred revenues (note 5)
|
(458
|
)
|
(345
|
)
|
(248
|
)
|
||
|
Foreign exchange (gain) loss on items denominated in foreign currencies
|
(553
|
)
|
87
|
|
1,581
|
|
||
|
Gain on disposal of property, plant and equipment
|
(136
|
)
|
(1
|
)
|
(264
|
)
|
||
|
Other non-cash items
|
(19
|
)
|
(83
|
)
|
154
|
|
||
|
Gain associated with the extinguishment of warrant liability
|
—
|
|
—
|
|
(162
|
)
|
||
|
Transaction cost allocated to warrants issued (note 16)
|
—
|
|
56
|
|
2,208
|
|
||
|
Series B Warrant exercise inducement fee (note 14)
|
—
|
|
—
|
|
2,926
|
|
||
|
Changes in operating assets and liabilities (note 19)
|
(2,212
|
)
|
(1,064
|
)
|
(3,395
|
)
|
||
|
Net cash provided by operating activities of discontinued operations
|
—
|
|
—
|
|
85
|
|
||
|
Net cash used in operating activities
|
(22,913
|
)
|
(29,010
|
)
|
(33,844
|
)
|
||
|
Cash flows from financing activities
|
|
|||||||
|
Proceeds from issuances of common shares, warrants (including pre-funded warrants), net of cash transaction costs of $250, $1,107, and $4,223 in 2017, 2016, and 2015, respectively (note 16)
|
7,788
|
|
9,924
|
|
49,427
|
|
||
|
Proceeds from warrants exercised (note 14)
|
242
|
|
—
|
|
—
|
|
||
|
Series B Warrant exercise inducement fee (note 14)
|
—
|
|
—
|
|
(2,926
|
)
|
||
|
Payment pursuant to warrant amendment agreements (note 16)
|
—
|
|
—
|
|
(5,703
|
)
|
||
|
Net cash provided by financing activities
|
8,030
|
|
9,924
|
|
40,798
|
|
||
|
Cash flows from investing activities
|
|
|||||||
|
Purchase of property, plant and equipment (note 9)
|
(4
|
)
|
(66
|
)
|
(26
|
)
|
||
|
Disposals of property, plant and equipment (note 9)
|
161
|
|
2
|
|
505
|
|
||
|
Decrease (increase) in restricted cash equivalents
|
150
|
|
(250
|
)
|
434
|
|
||
|
Net cash provided by (used in) investing activities
|
307
|
|
(314
|
)
|
913
|
|
||
|
Effect of exchange rate changes on cash and cash equivalents
|
357
|
|
(51
|
)
|
(1,348
|
)
|
||
|
Net change in cash and cash equivalents
|
(14,219
|
)
|
(19,451
|
)
|
6,519
|
|
||
|
Cash and cash equivalents – Beginning of year
|
21,999
|
|
41,450
|
|
34,931
|
|
||
|
Cash and cash equivalents – End of year
|
7,780
|
|
21,999
|
|
41,450
|
|
||
The accompanying notes are an integral part of these consolidated financial statements.
104
|
Aeterna Zentaris Inc.
|
|
Notes to Consolidated Financial Statements
|
|
As at December 31, 2017 and December 31, 2016 and for the years ended December 31, 2017, 2016 and 2015
|
|
(tabular amounts in thousands of US dollars, except share/option/warrant and per share/option/warrant data and as otherwise noted)
|
1 Business overview
Summary of business
Aeterna Zentaris Inc. ("Aeterna Zentaris" or the "Company") is a specialty biopharmaceutical company engaged in developing and commercializing novel pharmaceutical therapies. On December 20, 2017, the FDA granted marketing approval for Macrilen™ (macimorelin) to be used in the diagnosis of patients with AGHD. On January 16, 2018, the Company through AEZS Germany entered into a license and assignment agreement with Strongbridge Ireland Limited ("Strongbridge") to carry out development, manufacturing, registration and commercialization of Macrilen™ (macimorelin) in the United States and Canada (the "Strongbridge License Agreement").
Reporting entity
The accompanying consolidated financial statements include the accounts of Aeterna Zentaris Inc., an entity incorporated under the
Canada Business Corporations Act
, and its wholly-owned subsidiaries (collectively referred to as the "Group"). Aeterna Zentaris Inc. is the ultimate parent company of the Group.
The Company currently has three wholly-owned direct and indirect subsidiaries, Aeterna Zentaris GmbH ("AEZS Germany"), based in Frankfurt, Germany, Zentaris IVF GmbH, a wholly-owned subsidiary of AEZS Germany, based in Frankfurt, Germany, and Aeterna Zentaris, Inc., an entity incorporated in the state of Delaware and with offices in Summerville, South Carolina, in the United States.
The registered office of the Company is located at 1155 Rene-Levesque Blvd. West, 41
st
Floor, Montreal, Quebec H3B 3V2, Canada.
The Company's common shares are listed on both the Toronto Stock Exchange (the "TSX") and on the NASDAQ Capital Market (the "NASDAQ").
105
|
Aeterna Zentaris Inc.
|
|
Notes to Consolidated Financial Statements
|
|
As at December 31, 2017 and December 31, 2016 and for the years ended December 31, 2017, 2016 and 2015
|
|
(tabular amounts in thousands of US dollars, except share/option/warrant and per share/option/warrant data and as otherwise noted)
|
Basis of presentation
(a) Statement of compliance
These consolidated financial statements as at
December 31, 2017
and
December 31, 2016
and for the years ended
December 31, 2017
,
2016
and
2015
have been prepared in accordance with International Financial Reporting Standards ("IFRS") as issued by the International Accounting Standards Board ("IASB")
.
The accounting policies in these consolidated financial statements are consistent with those of the previous financial year and previous quarter.
These consolidated financial statements were approved by the Company's Board of Directors on
March 27, 2018
.
The preparation of financial statements in accordance with IFRS requires the use of certain critical accounting estimates and the exercise of management's judgment in applying the Company's accounting policies. Areas involving a high degree of judgment or complexity and areas where assumptions and estimates are significant to the Company's consolidated financial statements are discussed in
note 3 - Critical accounting estimates and judgments
.
(b) Principles of consolidation
These consolidated financial statements include any entity in which the Company directly or indirectly holds more than 50% of the voting rights or over which the Company exercises control. The Company controls an entity when the Company is exposed to, or has rights to, variable returns from its involvement with the entity and has the ability to affect those returns through its power over the entity. An entity is included in the consolidation from the date that control is transferred to the Company, while any entities that are sold are excluded from the consolidation from the date that control ceases. All inter-company balances and transactions are eliminated on consolidation.
(c) Foreign currency
Items included in the financial statements of the Group's entities are measured using the currency of the primary economic environment in which the entities operate (the "functional currency"). On
January 1, 2015
, the Company and its U.S. subsidiary, Aeterna Zentaris, Inc., changed their functional currency from the Euro ("EUR") to the U.S. dollar, given that changes to underlying transactions, events and conditions indicated that the U.S. dollar more appropriately reflects the primary economic environment in which these entities operate. This change in functional currency was accounted for prospectively. The functional currency of the German subsidiaries remains the EUR.
Assets and liabilities of the German subsidiaries are translated from EUR balances at the period-end exchange rates, and the results of operations are translated from EUR amounts at average rates of exchange for the period. The resulting translation adjustments are included in accumulated other comprehensive income within shareholders' (deficiency) equity.
Foreign currency transactions are translated into the functional currency using the exchange rates prevailing at the dates of the underlying transaction. Foreign exchange gains and losses resulting from the settlement of such transactions and from the translation of monetary assets and liabilities not denominated in the functional currency are recognized in the consolidated statement of comprehensive loss.
Foreign exchange gains and losses that relate to cash and cash equivalents are presented within finance income or finance costs in the consolidated statement of comprehensive loss. All other foreign exchange gains and losses are presented in the consolidated statement of comprehensive loss within operating expenses.
(d) Share consolidation (reverse stock split)
On
November 17, 2015
, the Company effected a consolidation of its issued and outstanding common shares on a
100 to 1
basis (the "Share Consolidation"). The Share Consolidation affected all shareholders, option holders and warrant holders uniformly and thus did not materially affect any security holder's percentage of ownership interest. All references in these consolidated financial statements to common shares, options and share purchase warrants have been retroactively adjusted to reflect the Share Consolidation.
106
|
Aeterna Zentaris Inc.
|
|
Notes to Consolidated Financial Statements
|
|
As at December 31, 2017 and December 31, 2016 and for the years ended December 31, 2017, 2016 and 2015
|
|
(tabular amounts in thousands of US dollars, except share/option/warrant and per share/option/warrant data and as otherwise noted)
|
2 Summary of significant accounting policies
The accounting policies set out below have been applied consistently to all years presented in these consolidated financial statements and have been applied consistently by all Group entities.
Cash and cash equivalents
Cash and cash equivalents consist of unrestricted cash on hand and balances with banks, as well as short-term interest-bearing deposits, such as money market accounts, that are readily convertible to known amounts of cash and are subject to an insignificant risk of changes in value, with a maturity of three months or less from the date of acquisition.
Inventories
Inventories are valued at the lower of cost or net realizable value. Cost is determined using the first-in, first-out method for all inventories. The Company's policy is to write down inventory that has become obsolete and inventory that has a cost basis in excess of its expected net realizable value. Increases in the reserve are recorded as charges in cost of product sales. For product candidates that have not been approved by the FDA, inventory used in clinical trials is wrote down at the time of production and recorded as research and development ("R&D") costs. For products that have been approved by the FDA, inventory used in clinical trials is expensed at the time the inventory is packaged for the clinical trial. All direct manufacturing costs incurred after approval are capitalized into inventory.
Restricted cash equivalents
Restricted cash equivalents are comprised of bank deposits, related to a guarantee for a long-term operating lease obligation and for a corporate credit card program that cannot be used for current purposes.
Property, plant and equipment and depreciation
Items of property, plant and equipment are recorded at cost, net of related government grants and accumulated depreciation and impairment charges. Depreciation is calculated using the following methods, annual rates and period:
|
Methods
|
Annual rates and period
|
|||
|
Equipment
|
Declining balance and straight-line
|
20%
|
||
|
Furniture and fixtures
|
Declining balance and straight-line
|
10% and 20%
|
||
|
Computer equipment
|
Straight-line
|
25% and 33
1
/3%
|
||
|
Leasehold improvements
|
Straight-line
|
Remaining lease term
|
||
Depreciation expense, which is recorded in the consolidated statement of comprehensive loss, is allocated to the appropriate functional expense categories to which the underlying items of property, plant and equipment relate.
Identifiable intangible assets and amortization
Identifiable intangible assets with finite useful lives consist of in-process R&D acquired in business combinations, patents and trademarks. In-process R&D acquired in business combinations is recognized at fair value at the acquisition date. Patents and trademarks are comprised of costs, including professional fees incurred in connection with the filing of patents and the registration of trademarks for product marketing and manufacturing purposes, net of related government grants, impairment losses, where applicable, and accumulated amortization. Identifiable intangible assets with finite useful lives are amortized, from the time at which the assets are available for use, on a straight-line basis over their estimated useful lives of
eight
to
fifteen
years for in-process R&D and patents and
ten
years for trademarks. Amortization expense, which is recorded in the consolidated statement of comprehensive loss, is allocated to the appropriate functional expense categories to which the underlying identifiable intangible assets relate.
107
|
Aeterna Zentaris Inc.
|
|
Notes to Consolidated Financial Statements
|
|
As at December 31, 2017 and December 31, 2016 and for the years ended December 31, 2017, 2016 and 2015
|
|
(tabular amounts in thousands of US dollars, except share/option/warrant and per share/option/warrant data and as otherwise noted)
|
Goodwill
Goodwill represents the excess of the purchase price over the fair values of the net assets of entities acquired at their respective dates of acquisition. Goodwill is carried at cost less accumulated impairment losses. Goodwill is allocated to each cash-generating unit ("CGU") or group of CGUs that are expected to benefit from the related business combination.
Impairment of assets
Items of property, plant and equipment and identifiable intangible assets with finite lives subject to depreciation or amortization, respectively, are reviewed for impairment whenever events or changes in circumstances indicate that the carrying amounts of the assets may not be recoverable. Management is required to assess at each reporting date whether there is any indication that an asset may be impaired. Where such an indication exists, the asset's recoverable amount is compared to its carrying value, and an impairment loss is recognized for the amount by which the asset's carrying amount exceeds its recoverable amount. The recoverable amount is the higher of an asset's fair value less costs to sell and value in use. For the purpose of assessing impairment, assets are grouped at the lowest levels for which there are separately identifiable cash flows, or CGU. In determining value in use of a given asset or CGU, estimated future cash flows are discounted to their present value using a pre-tax discount rate that reflects current market assessments of the time value of money and the risks specific to the asset. Impairment losses are allocated to the appropriate functional expense categories to which the underlying identifiable intangible assets relate, and are recorded in the consolidated statement of comprehensive loss.
Items of property, plant and equipment and amortizable identifiable intangible assets with finite lives that suffered impairment are reviewed for possible reversal of the impairment if there has been a change, since the date of the most recent impairment test, in the estimates used to determine the impaired asset's recoverable amount. However, an asset's carrying amount, increased due to the reversal of a prior impairment loss, must not exceed the carrying amount that would have been determined, net of depreciation or amortization, had the original impairment not occurred.
Goodwill is not subject to amortization and instead is tested for impairment annually or more often if there is an indication that the CGU to which the goodwill has been allocated may be impaired. Impairment is determined for goodwill by assessing whether the carrying value of a CGU, including the allocated goodwill, exceeds its recoverable amount, which is the higher of fair value less costs to sell and value in use. In the event that the carrying amount of goodwill exceeds its recoverable amount, an impairment loss is recognized in an amount equal to the excess. Impairment losses related to goodwill are not subsequently reversed.
Share purchase warrants
Share purchase warrants are classified as liabilities when the Company does not have the unconditional right to avoid delivering cash to the holders in the future. Each of the Company's share purchase warrants contains a written put option, arising upon the occurrence of a fundamental transaction, as that term is defined in the share purchase warrants, including a change of control. As a result of the existence of these put options, and despite the fact that the repurchase feature is conditional on a defined contingency, the share purchase warrants are required to be classified as a financial liability, since such contingency could ultimately result in the transfer of assets by the Company.
The warrant liability is initially measured at fair value, and any subsequent changes in fair value are recognized as gains or losses through profit or loss. Any transaction costs related to the share purchase warrants are expensed as incurred.
The warrant liability is classified as non-current, unless the underlying share purchase warrants will expire or be settled within
12
months from the end of a given reporting period.
Employee benefits
Salaries and other short-term benefits
Salaries and other short-term benefit obligations are measured on an undiscounted basis and are recognized in the consolidated statement of comprehensive loss over the related service period or when the Company has a present legal or constructive obligation to make payments as a result of past events and when the amount payable can be estimated reliably.
Post-employment benefits
108
|
Aeterna Zentaris Inc.
|
|
Notes to Consolidated Financial Statements
|
|
As at December 31, 2017 and December 31, 2016 and for the years ended December 31, 2017, 2016 and 2015
|
|
(tabular amounts in thousands of US dollars, except share/option/warrant and per share/option/warrant data and as otherwise noted)
|
The Company's subsidiary in Germany maintains defined contribution and unfunded defined benefit plans, as well as other benefit plans for its employees. For defined benefit pension plans and other post-employment benefits, net periodic pension expense is actuarially determined on a quarterly basis using the projected unit credit method. The cost of pension and other benefits earned by employees is determined by applying certain assumptions, including discount rates, the projected age of employees upon retirement, the expected rate of future compensation and employee turnover.
The employee future benefits liability is recognized at its present value, which is determined by discounting the estimated future cash outflows using interest rates of high-quality corporate bonds that are denominated in the currency in which the benefits will be paid and that have terms to maturity approximating the terms of the related future benefit liability. Actuarial gains and losses that arise in calculating the present value of the defined benefit obligation are recognized in other comprehensive loss, net of tax, and simultaneously reclassified in the deficit in the consolidated statement of financial position in the year in which the actuarial gains and losses arise and without recycling to the consolidated statement of comprehensive loss in subsequent periods.
For defined contribution plans, expenses are recorded in the consolidated statement of comprehensive loss as incurred–namely, over the period that the related employee service is rendered.
Termination benefits
Termination benefits are recognized in the consolidated statement of comprehensive loss when the Company is demonstrably committed, without the realistic possibility of withdrawal, to a formal detailed plan to terminate employment earlier than originally expected. Termination benefit liabilities expected to be settled after
12
months from the end of a given reporting period are discounted to their present value, where material.
Financial instruments
The Company classifies its financial instruments in the following categories: "Financial assets at fair value through profit or loss ("FVTPL"); "Loans and receivables"; "Financial liabilities at "FVTPL"; and "Other financial liabilities".
Financial assets and liabilities are offset, and the net amount is reported in the consolidated statement of financial position, when there is a legally enforceable right to offset the recognized amounts and there is an intention to settle on a net basis or realize the asset and settle the liability simultaneously.
(a) Classification
Financial assets at fair value through profit or loss
Financial assets at FVTPL are financial assets held for trading. Fair value is defined as the amount at which the financial assets could be exchanged in a current transaction between willing parties, other than in a forced or liquidation sale. A financial asset is classified as at FVTPL if the instrument is acquired or received as consideration principally for the purpose of selling in the short-term. Financial assets at FVTPL are classified as current assets if expected to be settled within
12
months from the end of a given reporting period; otherwise, the assets are classified as non-current.
As at
December 31, 2017
and
2016
, the Company held
no
assets classified as financial assets at FVTPL.
Loans and receivables
Loans and receivables are non-derivative financial assets with fixed or determinable payments that are not quoted in an active market. Loans and receivables are included in current assets, except for instruments with maturities greater than
12
months after the end of a given reporting period or where restrictions apply that limit the Company from using the instrument for current purposes, which are classified as non-current assets.
The Company's loans and receivables are comprised of cash and cash equivalents, trade and other receivables and restricted cash equivalents.
109
|
Aeterna Zentaris Inc.
|
|
Notes to Consolidated Financial Statements
|
|
As at December 31, 2017 and December 31, 2016 and for the years ended December 31, 2017, 2016 and 2015
|
|
(tabular amounts in thousands of US dollars, except share/option/warrant and per share/option/warrant data and as otherwise noted)
|
Financial liabilities at fair value through profit or loss
Financial liabilities at FVTPL are financial liabilities held for trading. A financial liability is classified as at FVTPL if the instrument is acquired or incurred principally for the purpose of selling or repurchasing in the short-term or where the Company does not have the unconditional right to avoid delivering cash or another financial asset to the holders in certain circumstances. Financial liabilities at FVTPL are classified as current liabilities if required to be settled within
12
months from the end of a given reporting period; otherwise, the liabilities are classified as non-current.
Financial liabilities at FVTPL are currently comprised of the Company's warrant liability.
Other financial liabilities
Other financial liabilities include trade accounts payable and accrued liabilities, provision for restructuring and other non-current liabilities.
(b) Recognition and measurement
Financial assets at fair value through profit or loss
Financial assets at FVTPL are recognized on the settlement date, which is the date on which the asset is delivered to the Company. Financial assets at FVTPL are initially recognized at fair value, and transaction costs are expensed immediately in the consolidated statement of comprehensive loss. Financial assets at FVTPL are derecognized when the right to receive cash flows from the underlying investment have expired or have been transferred and when the Group has transferred substantially all risks and rewards of ownership. Gains and losses arising from changes in the fair value of financial assets at FVTPL are presented in the consolidated statement of comprehensive loss within finance income or finance costs in the period in which they arise.
Loans and receivables
Loans and receivables are recognized on the settlement date and are measured initially at fair value and subsequently at amortized cost using the effective interest rate method.
Financial liabilities at fair value through profit or loss
Financial liabilities at FVTPL are recognized on the settlement date. Financial liabilities at FVTPL are initially recognized at fair value, and transaction costs are expensed immediately in the consolidated statement of comprehensive loss. Gains and losses arising from changes in the fair value of financial liabilities at FVTPL are presented in the consolidated statement of comprehensive loss in the period in which they arise.
Other financial liabilities
Financial instruments classified as "Other financial liabilities" are measured initially at fair value and subsequently at amortized cost using the effective interest rate method.
(c) Impairment
Financial assets measured at amortized cost are reviewed for impairment at each reporting date. Where there is objective evidence that impairment exists for a financial asset measured at amortized cost, an impairment charge equivalent to the difference between the asset's carrying amount and the present value of estimated future cash flows is recorded in the consolidated statement of comprehensive loss. The expected cash flows exclude future credit losses that have not been incurred and are discounted at the financial asset's original effective interest rate.
Impairment charges related to financial assets carried at amortized cost are reversed if, in a subsequent period, the amount of the impairment loss decreases and the decrease can be related objectively to an event occurring after the impairment was recognized. However, the reversal cannot result in a carrying amount of the financial asset that exceeds what the amortized cost would have been had the impairment not been recognized at the date the impairment is reversed.
110
|
Aeterna Zentaris Inc.
|
|
Notes to Consolidated Financial Statements
|
|
As at December 31, 2017 and December 31, 2016 and for the years ended December 31, 2017, 2016 and 2015
|
|
(tabular amounts in thousands of US dollars, except share/option/warrant and per share/option/warrant data and as otherwise noted)
|
Share capital
Common shares are classified as equity. Incremental costs that are directly attributable to the issuance of common shares and stock options are recognized as a deduction from equity, net of any tax effects.
Where offerings result in the issuance of units (where each unit is comprised of a common share of the Company and a share purchase warrant, exercisable in order to purchase a common share or fraction thereof), proceeds received in connection with those offerings are allocated between Share capital and Share purchase warrants based on the residual method. Proceeds are allocated to warrant liability based on the fair value of the share purchase warrants, and the residual amount of proceeds is allocated to Share capital. Transaction costs in connection with such offerings are allocated to the liability and equity unit components in proportion to the allocation of proceeds.
Provisions
Provisions represent liabilities to the Company for which the amount or timing is uncertain. Provisions are recognized when the Company has a present legal or constructive obligation as a result of past events, such as organizational restructuring, when it is probable that an outflow of resources will be required to settle the obligation and where the amount can be reliably estimated. Provisions are not recognized for future operating losses.
Provisions are made for any contracts which are deemed onerous. A contract is onerous if the unavoidable costs of meeting the obligations under the contract exceed the economic benefits expected to be received under it. Provisions for onerous contracts are measured at the present value of the lower of the expected cost of terminating the contract and the expected net cost of continuing with the contract. Present value is determined based on expected future cash flows that are discounted at a pre-tax rate that reflects current market assessments of the time value of money and the risks specific to the liability. The unwinding of the discount is recognized in finance costs.
Revenue recognition
Licensing revenues and multiple element arrangements
The Company is currently in a phase in which certain potential products are being further developed or marketed jointly with partners and licensees. Existing licensing agreements usually involve one-time payments (upfront payments), payments for R&D services in the form of cost reimbursements, milestone payments and royalty receipts for licensing and marketing product candidates. Revenues associated with those multiple-element arrangements are allocated to the various elements based on their relative fair value.
Agreements containing multiple elements are divided into separate units of accounting if certain criteria are met, including whether the delivered element has stand-alone value to the customer and whether there is objective and reliable evidence of the fair value of the undelivered obligation(s). The consideration received is allocated among the separate units based on each unit's fair value, and the applicable revenue recognition criteria are applied to each of the separate units.
License fees representing non-refundable payments received at the time of executing the license agreements are recognized as revenue upon signature of the license agreements when the Company has no significant future performance obligations under a multiple element arrangement and collectibility of the fees is probable. When there are future performance obligations under a multiple element arrangement, upfront payments received at the beginning of licensing agreements are deferred and recognized as revenue on a systematic basis over the period during which the related services are rendered and all obligations are performed.
Milestone payments
Milestone payments, which are generally based on developmental or regulatory events, are recognized as revenue when the milestones are achieved, collectibility is assured, and when the Company has no significant future performance obligations in connection with the milestones.
Sales Commission
Revenues from sales commission are recognized when all the following conditions are satisfied:
111
|
Aeterna Zentaris Inc.
|
|
Notes to Consolidated Financial Statements
|
|
As at December 31, 2017 and December 31, 2016 and for the years ended December 31, 2017, 2016 and 2015
|
|
(tabular amounts in thousands of US dollars, except share/option/warrant and per share/option/warrant data and as otherwise noted)
|
|
i.
|
the service provided;
|
|
ii.
|
the amount of revenue can be measured reliably; and
|
|
iii.
|
it is probable that the economic benefits associated with the transaction will flow to the Company.
|
The Company is responsible for promoting some products. Therefore, there is no continuing involvement following the patient starting the treatment and buying the products.
Share-based compensation costs
The Company operates an equity-settled share-based compensation plan under which the Company receives services from directors, senior executives, employees and other collaborators as consideration for equity instruments of the Company.
The Company accounts for all forms of share-based compensation using the fair value-based method. Fair value of stock options is determined at the date of grant using the Black-Scholes option pricing model, which includes estimates of the number of awards that are expected to vest over the vesting period. Where granted share options vest in installments over the vesting period (defined as graded vesting), the Company treats each installment as a separate share option grant. Share-based compensation expense is recognized over the vesting period, or as specified vesting conditions are satisfied, and credited to Other Capital.
Any consideration received by the Company in connection with the exercise of stock options is credited to Share Capital. Any Other Capital component of the share-based compensation is transferred to Share Capital upon the issuance of shares.
Current and deferred income tax
Income tax on profit or loss comprises current and deferred tax. Tax is recognized in profit or loss, except that a change attributable to an item of income or expense recognized as other comprehensive loss or directly in equity is also recognized directly in other comprehensive loss or directly in equity. Management periodically evaluates positions taken in tax returns with respect to situations in which applicable tax regulation is subject to interpretation and establishes provisions where appropriate on the basis of amounts expected to be paid to the tax authorities.
The current income tax charge is calculated in accordance with tax rates and laws that have been enacted or substantively enacted by the reporting date in the countries where the Company's subsidiaries operate and generate taxable income.
Deferred income tax is recognized on temporary differences (other than, where applicable, temporary differences associated with unremitted earnings from foreign subsidiaries and associates to the extent that the investment is essentially permanent in duration, and temporary differences associated with the initial recognition of goodwill) arising between the tax bases of assets and liabilities and their carrying amounts in the consolidated financial statements and on unused tax losses or R&D non-refundable tax credits in the Group. Deferred income tax is determined using tax rates and laws that have been enacted or substantively enacted by the reporting date.
Deferred income tax assets are recognized only to the extent that it is probable that future taxable profit will be available against which the temporary differences can be utilized.
Deferred income tax assets and liabilities are offset when there is a legally enforceable right to offset current tax assets against current tax liabilities and when the deferred income taxes assets and liabilities relate to income taxes levied by the same taxation authority on either the same taxable entity or different taxable entities where there is an intention to settle the balances on a net basis.
Research and development costs
Research costs are expensed as incurred. Development costs are expensed as incurred, except for those that meet generally accepted criteria for deferral, in which case the costs are capitalized and amortized to operations over the estimated period of benefit.
No
development costs have been capitalized during any of the periods presented.
Discontinued operations
112
|
Aeterna Zentaris Inc.
|
|
Notes to Consolidated Financial Statements
|
|
As at December 31, 2017 and December 31, 2016 and for the years ended December 31, 2017, 2016 and 2015
|
|
(tabular amounts in thousands of US dollars, except share/option/warrant and per share/option/warrant data and as otherwise noted)
|
A discontinued operation is a component of the Company that has been disposed of, or is classified as held for sale, and represents a separate major line of business or geographical area of operations and/or is part of a single co-ordinated plan to dispose of a separate major line of business or geographical area of operations. Classification as a discontinued operation occurs upon the earlier of the disposal of the operation (or disposal group) or the date at which the operation meets the criteria for classification as held for sale. When an operation is classified as discontinued, comparative statements of comprehensive loss and cash flows are presented as if the operations had been discontinued at the beginning of the earliest comparative period presented.
Net (loss) income per share
Basic net (loss) income per share is calculated using the weighted average number of common shares outstanding during the year.
Diluted net (loss) income per share is calculated based on the weighted average number of common shares outstanding during the year, plus the effects of dilutive common share equivalents, such as stock options and share purchase warrants. This method requires that diluted net (loss) income per share be calculated using the treasury stock method, as if all common share equivalents had been exercised at the beginning of the reporting period, or period of issuance, as the case may be, and that the funds obtained thereby were used to purchase common shares of the Company at the average trading price of the common shares during the period.
3 Critical accounting estimates and judgments
The preparation of consolidated financial statements in accordance with IFRS requires management to make judgments, estimates and assumptions that affect the reported amounts of the Company's assets, liabilities, revenues, expenses and related disclosures. Judgments, estimates and assumptions are based on historical experience, expectations, current trends and other factors that management believes to be relevant at the time at which the Company's consolidated financial statements are prepared.
Management reviews, on a regular basis, the Company's accounting policies, assumptions, estimates and judgments in order to ensure that the consolidated financial statements are presented fairly and in accordance with IFRS. Revisions to accounting estimates are recognized in the period in which the estimates are revised and in any future periods affected.
(a) Critical accounting estimates and assumptions
Critical accounting estimates and assumptions are those that have a significant risk of causing material adjustment and are often applied to matters or outcomes that are inherently uncertain and subject to change. As such, management cautions that future events often vary from forecasts and expectations and that estimates routinely require adjustment.
The following discusses the most significant accounting estimates and assumptions that the Company has made in the preparation of the consolidated financial statements.
Fair value of the warrant liability and stock options
Determining the fair value of the warrant liability and stock options requires judgment related to the selection of the most appropriate pricing model, the estimation of stock price volatility and the expected term of the underlying instruments. Any changes in the estimates or inputs utilized to determine fair value could result in a significant impact on the Company's future operating results, liabilities or other components of shareholders' equity. Fair value assumptions used are described in
note 14 - Warrant liability
and
16 - Share capital
.
Goodwill impairment
The annual impairment assessment related to goodwill requires to estimate the recoverable amount, which has been determined using fair value less costs of disposal. This evaluation is based on estimates that are derived from current market capitalization and on other factors, including assumptions related to relevant industry-specific market analyses and potential costs to dispose. The Company also concluded that there was only one CGU as management monitors goodwill on an overall entity basis. Future events, including a significant reduction in the Company's share price, could cause the assumptions utilized in the impairment tests to change, resulting in a potentially adverse effect on the Company's future results due to increased impairment charges.
113
|
Aeterna Zentaris Inc.
|
|
Notes to Consolidated Financial Statements
|
|
As at December 31, 2017 and December 31, 2016 and for the years ended December 31, 2017, 2016 and 2015
|
|
(tabular amounts in thousands of US dollars, except share/option/warrant and per share/option/warrant data and as otherwise noted)
|
Employee future benefits
The determination of expenses and obligations associated with employee future benefits requires the use of assumptions, such as the discount rate to measure obligations, the projected age of employees upon retirement, the expected rate of future compensation and estimated employee turnover. Because the determination of the cost and obligations associated with employee future benefits requires the use of various assumptions, there is measurement uncertainty inherent in the actuarial valuation process. Actual results will differ from results that are estimated based on the aforementioned assumptions. Additional information is included in
note 18 - Employee future benefits
.
Income taxes
The estimation of income taxes includes evaluating the recoverability of deferred tax assets based on an assessment of Group entities' ability to utilize the underlying future tax deductions against future taxable income prior to expiry of those deductions. Management assesses whether it is probable that some or all of the deferred income tax assets will not be realized. The ultimate realization of deferred tax assets is dependent upon the generation of future taxable income, which in turn is dependent upon the successful commercialization of the Company's products. To the extent that management's assessment of any Group entity's ability to utilize future tax deductions changes, the Company would be required to recognize more or fewer deferred tax assets, and future income tax provisions or recoveries could be affected.
Additional information is included in
note 20 - Income taxes
.
(b) Critical judgments in applying the Company's accounting policies
Revenue recognition
Management's assessments related to the recognition of revenues related to arrangements containing multiple elements are based on judgment. Judgment is necessary to identify separate units of accounting and to allocate related consideration to each separate unit of accounting. Where deferral of upfront payments or license fees is deemed appropriate, subsequent revenue recognition is often determined based upon the assessment of the Company's continuing involvement in the arrangement, the benefits expected to be derived by the customer and, where applicable, expected patent lives.
Additional information is included in
note 5 - Deferred revenues
related to licensing arrangements and co-development agreement.
4 Recent accounting pronouncements
Accounting standards adopted without impact
In January 2016, the IASB issued amendments to IAS 12,
Income taxes
to clarify the requirements for recognizing deferred tax assets on unrealized losses. The amendments clarify the accounting for deferred tax where an asset is measured at fair value and that fair value is below the asset's tax base. They also clarify certain other aspects of accounting for deferred tax assets. The amendments are effective from January 1, 2017. The Company concluded that these amendments have no impact on the Company's consolidated financial statements.
In January 2016, the IASB issued an amendment to IAS 7,
Statement of cash flows
, introducing an additional disclosure that will enable users of financial statements to evaluate changes in liabilities arising from financing activities. The amendment is part of the IASB's Disclosure Initiative, which continues to explore how financial statement disclosure can be improved. The amendment is effective from January 1, 2017. The Company believes that the information provided in
note 14
is sufficient to meet this new requirement.
Accounting standards not yet adopted
The final version of IFRS 9,
Financial Instruments
("IFRS 9"), was issued by the IASB in July 2014 and will replace IAS 39,
Financial Instruments: Recognition and Measurement
("IAS 39"). IFRS 9 introduces a model for classification and measurement, a single, forward-looking expected loss impairment model and a substantially reformed approach to hedge accounting. The new single, principle-based approach for determining the classification of financial assets is driven by cash flow characteristics and the business model in which an asset is held. The new model also results in a single impairment
114
|
Aeterna Zentaris Inc.
|
|
Notes to Consolidated Financial Statements
|
|
As at December 31, 2017 and December 31, 2016 and for the years ended December 31, 2017, 2016 and 2015
|
|
(tabular amounts in thousands of US dollars, except share/option/warrant and per share/option/warrant data and as otherwise noted)
|
model being applied to all financial instruments, which will require more timely recognition of expected credit losses. It also includes changes in respect of an entity's own credit risk in measuring liabilities elected to be measured at fair value, so that gains caused by the deterioration of an entity's own credit risk on such liabilities are no longer recognized in profit or loss. IFRS 9, which is to be applied retrospectively, is effective for annual periods beginning on or after January 1, 2018. There are amendments to IFRS 7 which require additional disclosures on transition from IAS 39 to IFRS 9. These amendments are effective upon adoption of IFRS 9. The Company is currently assessing the impact, if any, that these new standards may have on the Company's consolidated financial statements.
In May 2014, the IASB issued IFRS 15,
Revenue from Contracts with Customers
("IFRS 15"). The objective of this new standard is to provide a single, comprehensive revenue recognition framework for all contracts with customers to improve comparability of financial statements of companies globally. This new standard contains principles that an entity will apply to determine the measurement of revenue and timing of when it is recognized. The underlying principle is that an entity will recognize revenue to depict the transfer of goods or services to customers at an amount that the entity expects to be entitled to receive in exchange for those goods or services. This new standard is effective for annual periods beginning on or after January 1, 2018. The Company is currently assessing the impact, if any, that these amendments may have on the Company's consolidated financial statements.
In November 2016, the IFRS Interpretations Committee issued an Interpretation on how to determine the date of the transaction when applying IAS 21,
The Effects of Changes in Foreign Exchange Rates
. The Interpretation applies where an entity either pays or receives consideration in advance for foreign currency-denominated contracts. The Interpretation provides guidance for when a single payment/receipt is made, as well as for situations where multiple payments/receipts are made. The Interpretation is effective for annual periods beginning on or after January 1, 2018. The Company is currently assessing the impact, if any, that these amendments may have on the Company's consolidated financial statements.
In December 2016, IFRIC 22, "Foreign Currency Transactions and Advance Consideration", was issued. IFRIC 22 addresses how to determine the date of the transaction for the purpose of determining the exchange rate to use on initial recognition of the related asset, expense or income (or part of it) and on the derecognition of a non-monetary asset or non-monetary liability arising from the payment or receipt of advance consideration in a foreign currency. IFRIC 22 is effective for annual periods beginning on or after January 1, 2018. Early adoption is permitted. The company is currently assessing the impact, if any, that this new standard may have on the Company's consolidated financial statements.
In January 2016, the IASB issued IFRS 16,
Leases
("IFRS 16"), which supersedes IAS 17,
Leases
, and the related interpretations on leases: IFRIC 4,
Determining Whether an Arrangement Contains a Lease;
Standard Interpretations Committee ("SIC") 15,
Operating Leases - Incentives;
and SIC 27,
Evaluating the Substance of Transactions in the Legal Form of a Lease
. IFRS 16 is effective for annual periods beginning on or after January 1, 2019, with earlier adoption permitted for companies that also apply IFRS 15. The Company is currently assessing the impact, if any, that this new standard may have on the Company's consolidated financial statements.
In June 2017, FRIC 23, "Uncertainty over Income Tax Treatment", was issued. IFRIC 23 provides guidance on how to value uncertain income tax positions based on the probability of whether the relevant tax authorities will accept the company's tax treatments. A company is to assume that a taxation authority with the right to examine any amounts reported to it will examine those amounts and will have full knowledge of all relevant information when doing so. IFRIC 23 is effective for annual periods beginning on or after January 1, 2019. The company is currently assessing the impact, if any, that this new standard may have on the Company's consolidated financial statements.
115
|
Aeterna Zentaris Inc.
|
|
Notes to Consolidated Financial Statements
|
|
As at December 31, 2017 and December 31, 2016 and for the years ended December 31, 2017, 2016 and 2015
|
|
(tabular amounts in thousands of US dollars, except share/option/warrant and per share/option/warrant data and as otherwise noted)
|
5 Deferred revenues related to licensing arrangements and co-development agreement
Zoptrex™ License Agreements
On
July 1, 2016
, the Company entered into a license agreement (the "Cyntec License Agreement") with Cyntec Co., Ltd. ("Cyntec"), an affiliate of Orient EuroPharma Co., Ltd. ("OEP") for Zoptrex™ (zoptarelin doxorubicin) for the initial indication of endometrial cancer. Under the terms of the Cyntec License Agreement, the Company was paid a non-refundable upfront cash payment (the "License Fee") of 500,000 Euros in consideration for the license to Cyntec of the Company's intellectual property related to Zoptrex™ and the grant to Cyntec of the right to commercialize Zoptrex™ in a territory consisting of Taiwan and nine countries in southeast Asia (the "OEP Territory"). Cyntec has also agreed to make additional payments to the Company upon achieving certain pre-established regulatory and commercial milestones.
Furthermore, the Company will receive royalties based on future net sales of Zoptrex™ in the OEP Territory. Cyntec will be responsible for the development, registration, reimbursement and commercialization of the product in the OEP Territory. The Company also entered into related Technology Transfer and Supply Agreements with another affiliate of OEP, pursuant to which the Company will transfer to such affiliate the technology necessary to permit the affiliate to manufacture finished Zoptrex™ using quantities of the active pharmaceutical agreement purchased from the Company pursuant to the Supply Agreement.
On
December 1, 2014
, the Company entered into an exclusive master collaboration agreement ("Master Collaboration Agreement"), a technology transfer and technical assistance agreement ("Tech Transfer Agreement") and a license agreement ("Sinopharm License Agreement") with Sinopharm A-Think Pharmaceuticals Co., Ltd. ("Sinopharm") for the development, manufacture and commercialization of Zoptrex™ in all human uses, in the People's Republic of China, including Hong Kong and Macau (collectively, the "Sinopharm Territory"). Under the terms of the TTA, Sinopharm made a one-time, non-refundable payment (the "Transfer Fee") of $1,000,000 to the Company in consideration for the transfer of technical documentation and materials, know-how and technical assistance services. Additionally, pursuant to the Sinopharm License Agreement, the Company is entitled to receive additional consideration upon achieving certain milestones, including the occurrence of certain regulatory and commercial events in the Sinopharm Territory. Furthermore, the Company is entitled to royalties on future net sales of Zoptrex™ in the Sinopharm Territory.
The Company has continuing involvement in the aforementioned arrangements, including the transfer of documentation, know-how and materials, as well as the provision of technical assistance, such as quality systems implementation, analytical and stability testing, territory-specific development initiatives, and other services.
The Company has applied the provisions of IAS 18,
Revenue
("IAS 18"), and has determined that all deliverables and performance obligations contemplated by the agreements with Cyntec/OEP and Sinopharm should be accounted for as a single unit of accounting, limited to amounts that are not contingent upon the delivery of additional items or the meeting of other specified performance conditions which are not known, probable or estimable at the time at which the agreements with OEP and Sinopharm were entered into.
The Company has deferred the non-refundable License and Transfer Fees and is amortizing the related payment as revenue on a straight-line basis over the period during which the aforementioned services are rendered and obligations are performed.
In determining the period over which the License and Transfer Fee revenues are to be recognized, the Company concluded that its significant continuing involvement in the aforementioned agreements will span approximately until the end of
December 2018
. However, the Company may adjust the amortization period based on appropriate facts and circumstances not yet known, that would significantly change the duration of the Company's continuing involvement and performance obligations or benefits expected to be derived by OEP and Sinopharm.
Future milestone payments will be recognized as revenue individually and in full upon the actual achievement of the related milestone, given the substantive nature of each milestone. Lastly, upon initial commercialization and sale of the developed product, the Company will recognize royalty revenues as earned, based on the contractual percentage applied to the actual net sales achieved by OEP or Sinopharm, as per the license agreement.
On May 1, 2017, the Company announced that the ZoptEC pivotal Phase 3 clinical study of Zoptrex™ in women with locally advanced, recurrent or metastatic endometrial cancer did not achieve its primary endpoint of demonstrating a statistically significant increase in the median period of overall survival of patients treated with Zoptrex™ as compared to
116
|
Aeterna Zentaris Inc.
|
|
Notes to Consolidated Financial Statements
|
|
As at December 31, 2017 and December 31, 2016 and for the years ended December 31, 2017, 2016 and 2015
|
|
(tabular amounts in thousands of US dollars, except share/option/warrant and per share/option/warrant data and as otherwise noted)
|
patients treated with doxorubicin. The results of the study are not supportive to pursue regulatory approval. Based on this outcome, the Company does not anticipate conducting clinical trials of Zoptrex™ with respect to any other indications.
The Company currently has deferred revenues at
December 31, 2017
of $541,000 relating to non-refundable upfront payments it previously received for licensing and technology transfer arrangements that it entered into with respect to the development of Zoptrex™ in various territories. Due to events that occurred in 2018, the Company does not anticipate development of Zoptrex™ under the licensing agreements, therefore the Company's remaining carrying amount of deferred revenues will be recognized in the first quarter of 2018 as income.
Ergomed Agreement
On
April 10, 2013
, the Company entered into a co-development and revenue-sharing agreement ("CDRSA") with Ergomed Clinical Research Limited ("Ergomed"), pursuant to which Ergomed agreed to assist the Company in the clinical development program for Zoptrex™ for the purpose of maximizing the commercialization potential of Zoptrex™ with the ultimate aim of selling or licensing Zoptrex™. Concurrently with the execution of the CDRSA, the Company entered into a master services agreement ("MSA") with Ergomed for a Phase 3 clinical trial of Zoptrex™ in endometrial cancer, pursuant to which Ergomed provided clinical development services with respect to the co-development initiative referred to above.
While Ergomed will not directly contribute any cash proceeds towards the completion of the activities contemplated by the CDRSA, Ergomed, as primary supplier of a substantial portion of Zoptrex™ related clinical and regulatory activities, will contribute to the overall funding of the initiative via the application of a
30%
discount from the costs set forth in the MSA until the cumulative total of such reductions reaches a maximum of
$10,000,000
. As of
December 31, 2017
the amount not charged by Ergomed totaled approximately
9,900,000
. Ergomed will be entitled to receive an agreed upon single-digit percentage of any future net income (as defined in the CDRSA) or other proceeds related to the licensing of Zoptrex™ in endometrial cancer indication, up to a specified maximum amount.
The Company recognizes R&D costs associated with the CDRSA and MSA net of the
30%
discount, as services are rendered by Ergomed in the consolidated statement of comprehensive loss. During the years ended
December 31, 2017
,
2016
and
2015
, the Company expensed a total of
$1,117,000
,
$4,436,000
,
$7,140,000
, respectively, pursuant to the CDRSA and MSA.
As mentioned previously, the results of the Zoptec pivotal Phase 3 clinical study of Zoptrex™ are not supportive to pursue regulatory approval and consequently the Company does not anticipate incurring additional R&D costs associated with the CDRSA and MSA.
117
|
Aeterna Zentaris Inc.
|
|
Notes to Consolidated Financial Statements
|
|
As at December 31, 2017 and December 31, 2016 and for the years ended December 31, 2017, 2016 and 2015
|
|
(tabular amounts in thousands of US dollars, except share/option/warrant and per share/option/warrant data and as otherwise noted)
|
6 Cash and cash equivalents
|
December 31,
|
||||||
|
2017
|
2016
|
|||||
|
$
|
$
|
|||||
|
Cash on hand and balances with banks
|
7,780
|
|
21,999
|
|
||
|
7,780
|
|
21,999
|
|
|||
7 Inventory
|
December 31,
|
||||||
|
2017
|
2016
|
|||||
|
$
|
$
|
|||||
|
Finished goods inventory
|
556
|
|
—
|
|
||
|
Semi-finished goods inventory
|
87
|
|
—
|
|
||
|
643
|
|
—
|
|
|||
Inventory was written off at the end of December 31, 2016. With the approval of Macrilen™ (macimorelin) and the Strongbridge License Agreement (see note 26 - Subsequent events) the Company has re-capitalized the inventory costs in 2017 that were previously written off. Based on the Strongbridge License Agreement, the Company will sell all Macrilen™ (macimorelin) inventory to Strongbridge.
8 Trade and other receivables
|
December 31,
|
||||||
|
2017
|
2016
|
|||||
|
$
|
$
|
|||||
|
Trade accounts receivable
|
20
|
|
155
|
|
||
|
Value added tax
|
186
|
|
130
|
|
||
|
Other
|
15
|
|
80
|
|
||
|
221
|
|
365
|
|
|||
118
|
Aeterna Zentaris Inc.
|
|
Notes to Consolidated Financial Statements
|
|
As at December 31, 2017 and December 31, 2016 and for the years ended December 31, 2017, 2016 and 2015
|
|
(tabular amounts in thousands of US dollars, except share/option/warrant and per share/option/warrant data and as otherwise noted)
|
9 Property, plant and equipment
Components of the Company's property, plant and equipment are summarized below.
|
Cost
|
|||||||||||||||
|
Equipment
|
Furniture and fixtures
|
Computer equipment
|
Leasehold improvements
|
Total
|
|||||||||||
|
$
|
$
|
$
|
$
|
$
|
|||||||||||
|
At January 1, 2016
|
4,039
|
|
19
|
|
746
|
|
19
|
|
4,823
|
|
|||||
|
Additions
|
27
|
|
—
|
|
19
|
|
20
|
|
66
|
|
|||||
|
Disposals / Retirements
|
—
|
|
—
|
|
(3
|
)
|
—
|
|
(3
|
)
|
|||||
|
Impact of foreign exchange rate changes
|
(147
|
)
|
—
|
|
(25
|
)
|
(2
|
)
|
(174
|
)
|
|||||
|
At December 31, 2016
|
3,919
|
|
19
|
|
737
|
|
37
|
|
4,712
|
|
|||||
|
Additions
|
2
|
|
—
|
|
2
|
|
—
|
|
4
|
|
|||||
|
Disposals / Retirements
|
(2,160
|
)
|
—
|
|
(43
|
)
|
—
|
|
(2,203
|
)
|
|||||
|
Impact of foreign exchange rate changes
|
507
|
|
—
|
|
94
|
|
5
|
|
606
|
|
|||||
|
At December 31, 2017
|
2,268
|
|
19
|
|
790
|
|
42
|
|
3,119
|
|
|||||
|
Accumulated depreciation
|
||||||||||||||
|
Equipment
|
Furniture and fixtures
|
Computer equipment
|
Leasehold improvements
|
Total
|
||||||||||
|
$
|
$
|
$
|
$
|
$
|
||||||||||
|
At January 1, 2016
|
3,873
|
|
—
|
|
683
|
|
11
|
|
4,567
|
|
||||
|
Disposals / Retirements
|
—
|
|
—
|
|
(2
|
)
|
—
|
|
(2
|
)
|
||||
|
Depreciation expense
|
70
|
|
2
|
|
36
|
|
4
|
|
112
|
|
||||
|
Impact of foreign exchange rate changes
|
(144
|
)
|
—
|
|
(25
|
)
|
—
|
|
(169
|
)
|
||||
|
At December 31, 2016
|
3,799
|
|
2
|
|
692
|
|
15
|
|
4,508
|
|
||||
|
Disposals / Retirements
|
(2,135
|
)
|
—
|
|
(43
|
)
|
—
|
|
(2,178
|
)
|
||||
|
Depreciation expense
|
50
|
|
2
|
|
30
|
|
18
|
|
100
|
|
||||
|
Impact of foreign exchange rate changes
|
496
|
|
—
|
|
90
|
|
2
|
|
588
|
|
||||
|
At December 31, 2017
|
2,210
|
|
4
|
|
769
|
|
35
|
|
3,018
|
|
||||
|
Carrying amount
|
||||||||||||||
|
Equipment
|
Furniture and fixtures
|
Computer equipment
|
Leasehold improvements
|
Total
|
||||||||||
|
$
|
$
|
$
|
$
|
$
|
||||||||||
|
At December 31, 2016
|
120
|
|
17
|
|
45
|
|
22
|
|
204
|
|
||||
|
At December 31, 2017
|
58
|
|
15
|
|
21
|
|
7
|
|
101
|
|
||||
Depreciation of
$100,000
(
$112,000
in
2016
and
$260,000
in
2015
) is presented in the consolidated statement of comprehensive loss as follows:
$69,000
(
$80,000
in
2016
and
$231,000
in
2015
) in R&D costs,
$10,000
(
$11,000
in
2016
and
$13,000
in
2015
) in G&A expenses and
$21,000
(
$21,000
in
2016
and
$16,000
in
2015
) in selling expenses.
119
|
Aeterna Zentaris Inc.
|
|
Notes to Consolidated Financial Statements
|
|
As at December 31, 2017 and December 31, 2016 and for the years ended December 31, 2017, 2016 and 2015
|
|
(tabular amounts in thousands of US dollars, except share/option/warrant and per share/option/warrant data and as otherwise noted)
|
10 Identifiable intangible assets
Identifiable intangible assets with finite useful lives consist entirely of in-process R&D costs, patents and trademarks. Changes in the carrying value of the Company's identifiable intangible assets with finite useful lives are summarized below.
_________________________
|
Year ended December 31, 2017
|
Year ended December 31, 2016
|
|||||||||||||||||
|
Cost
|
Accumulated amortization
|
Carrying value
|
Cost
|
Accumulated amortization
|
Carrying value
|
|||||||||||||
|
$
|
$
|
$
|
$
|
$
|
$
|
|||||||||||||
|
Balances – Beginning of the year
|
30,032
|
|
(29,962
|
)
|
70
|
|
31,151
|
|
(30,914
|
)
|
237
|
|
||||||
|
Additions
|
—
|
|
—
|
|
—
|
|
5
|
|
—
|
|
5
|
|
||||||
|
Impairment (loss) reversal*
|
—
|
|
44
|
|
44
|
|
—
|
|
(85
|
)
|
(85
|
)
|
||||||
|
Recurring amortization expense*
|
—
|
|
(38
|
)
|
(38
|
)
|
—
|
|
(83
|
)
|
(83
|
)
|
||||||
|
Impact of foreign exchange rate changes
|
4,214
|
|
(4,200
|
)
|
14
|
|
(1,124
|
)
|
1,120
|
|
(4
|
)
|
||||||
|
Balances – End of the year
|
34,246
|
|
(34,156
|
)
|
90
|
|
30,032
|
|
(29,962
|
)
|
70
|
|
||||||
* Recorded with R&D costs in the consolidated statements of comprehensive loss.
11 Goodwill
The change in carrying value is as follows:
|
Cost
|
Accumulated impairment loss
|
Carrying amount
|
|||||||
|
$
|
$
|
$
|
|||||||
|
At January 1, 2016
|
7,836
|
|
—
|
|
7,836
|
|
|||
|
Impact of foreign exchange rate changes
|
(283
|
)
|
—
|
|
(283
|
)
|
|||
|
At December 31, 2016
|
7,553
|
|
—
|
|
7,553
|
|
|||
|
Impact of foreign exchange rate changes
|
1,060
|
|
—
|
|
1,060
|
|
|||
|
At December 31, 2017
|
8,613
|
|
—
|
|
8,613
|
|
|||
120
|
Aeterna Zentaris Inc.
|
|
Notes to Consolidated Financial Statements
|
|
As at December 31, 2017 and December 31, 2016 and for the years ended December 31, 2017, 2016 and 2015
|
|
(tabular amounts in thousands of US dollars, except share/option/warrant and per share/option/warrant data and as otherwise noted)
|
12 Payables and accrued liabilities
|
December 31,
|
||||||
|
2017
|
2016
|
|||||
|
$
|
$
|
|||||
|
Trade accounts payable
|
1,222
|
|
2,044
|
|
||
|
Accrued research and development costs
|
127
|
|
340
|
|
||
|
Salaries, employment taxes and benefits
|
390
|
|
156
|
|
||
|
Current portion of onerous contract provisions (note 15)
|
173
|
|
295
|
|
||
|
Other accrued liabilities
|
1,075
|
|
910
|
|
||
|
2,987
|
|
3,745
|
|
|||
13 Provision for restructuring costs
On October 9, 2015, the Company's Board of Directors approved a plan to restructure the Company's finance and accounting operations and to close the Company's Quebec City office (the "2015 Corporate Restructuring"). The Company transferred all functions performed by the five employees in its Quebec City office to other personnel. As of December 31, 2016, the Corporate Restructuring was completed.
In
July 2017
, the Company's subsidiary located in Germany and its Works Council approved the Company's restructuring program (the "2017 German Restructuring"), creating a constructive obligation from that date. The 2017 German Restructuring is a consequence of the negative Phase 3 clinical trial results of Zoptrex
TM
announced on
May 1, 2017
and the related impact on the Company's product pipeline. This is also part of the continued strategy to transition Aeterna Zentaris into a commercially operating specialty biopharmaceutical organization. The goal of the 2017 German Restructuring is to reduce to a minimum the Company R&D activities and is expected to result in the termination of approximately
24
employees of the German subsidiary.
The Company started implementing the 2017 German Restructuring in the fourth quarter of 2017, with staff departures expected to be completed over a period of approximately
18
months. Total initial restructuring costs associated with the 2017 German Restructuring
include severance accruals and other directly related costs ($2,002,000) and an onerous lease provision ($1,113,000), which has been recorded as follows in the accompanying consolidated statement of comprehensive loss: $2,644,000 in R&D costs, $275,000 in General and administrative ("G&A") expenses and $196,000 in selling expenses. These estimated costs may vary as a result of changes in the underlying assumptions applied thereto, including but not limited to, the time needed to sublease the unused premises.
Most of the restructuring accruals are expected to be paid in the financial year ending
December 31, 2018
.
The changes in the Company's provision for restructuring costs can be summarized as follows:
121
|
Aeterna Zentaris Inc.
|
|
Notes to Consolidated Financial Statements
|
|
As at December 31, 2017 and December 31, 2016 and for the years ended December 31, 2017, 2016 and 2015
|
|
(tabular amounts in thousands of US dollars, except share/option/warrant and per share/option/warrant data and as otherwise noted)
|
|
Resource Optimization Program
|
2015 Corporate Restructuring
|
2017 German Restructuring
|
Total
|
|||||||||
|
$
|
$
|
$
|
$
|
|||||||||
|
At January 1, 2016
|
75
|
|
557
|
|
—
|
|
632
|
|
||||
|
Utilization of provision
|
(43
|
)
|
(523
|
)
|
—
|
|
(566
|
)
|
||||
|
Change in the provision
|
—
|
|
(8
|
)
|
—
|
|
(8
|
)
|
||||
|
Impact of foreign exchange rate changes
|
1
|
|
(26
|
)
|
—
|
|
(25
|
)
|
||||
|
At December 31, 2016
|
33
|
|
—
|
|
—
|
|
33
|
|
||||
|
Provision recognized
|
—
|
|
—
|
|
3,115
|
|
3,115
|
|
||||
|
Utilization of provision
|
(33
|
)
|
—
|
|
(157
|
)
|
(190
|
)
|
||||
|
Change in the provision
|
—
|
|
—
|
|
(32
|
)
|
(32
|
)
|
||||
|
Impact of foreign exchange rate changes
|
—
|
|
—
|
|
88
|
|
88
|
|
||||
|
At December 31, 2017
|
—
|
|
—
|
|
3,014
|
|
3,014
|
|
||||
|
Less: current portion
|
—
|
|
—
|
|
(2,296
|
)
|
(2,296
|
)
|
||||
|
Non-current portion*
|
—
|
|
—
|
|
718
|
|
718
|
|
||||
* The non-current portion consists exclusively of an onerous lease provision.
14 Warrant liability
The change in the Company's warrant liability can be summarized as follows:
|
Years ended December 31,
|
|||||||||
|
2017
|
2016
|
2015
|
|||||||
|
$
|
$
|
$
|
|||||||
|
Balance – Beginning of the year
|
6,854
|
|
10,891
|
|
8,225
|
|
|||
|
Share purchase warrants issued during the year (note 16)
|
—
|
|
400
|
|
28,678
|
|
|||
|
Derecognition due to early expiry (note 16)
|
—
|
|
—
|
|
(5,865
|
)
|
|||
|
Share purchase warrants exercised during the year
|
(735
|
)
|
—
|
|
(31,103
|
)
|
|||
|
Change in fair value of share purchase warrants
|
(2,222
|
)
|
(4,437
|
)
|
10,956
|
|
|||
|
Balance - End of the year
|
3,897
|
|
6,854
|
|
10,891
|
|
|||
|
Less: current portion
|
—
|
|
—
|
|
(1,411
|
)
|
|||
|
Non-current portion
|
3,897
|
|
6,854
|
|
9,480
|
|
|||
A summary of the activity related to the Company's share purchase warrants is provided below.
122
|
Aeterna Zentaris Inc.
|
|
Notes to Consolidated Financial Statements
|
|
As at December 31, 2017 and December 31, 2016 and for the years ended December 31, 2017, 2016 and 2015
|
|
(tabular amounts in thousands of US dollars, except share/option/warrant and per share/option/warrant data and as otherwise noted)
|
|
Years ended December 31,
|
||||||||||||||||||
|
2017
|
2016
|
2015
|
||||||||||||||||
|
Number
|
Weighted average exercise price (US$)
|
Number
|
Weighted average exercise price (US$)
|
Number
|
Weighted average exercise price (US$)
|
|||||||||||||
|
Balance – Beginning of the year
|
3,779,245
|
|
9.66
|
|
*
|
2,842,309
|
|
11.30
|
|
*
|
287,852
|
|
104.46
|
|
||||
|
Issued (note 16)
|
—
|
|
—
|
|
945,000
|
|
4.70
|
|
3,076,956
|
|
5.94
|
|
*
|
|||||
|
Exercised
|
(331,730
|
)
|
**
|
1.07
|
|
—
|
|
—
|
|
(298,088
|
)
|
4.24
|
|
|||||
|
Expired (note 16)
|
(29,675
|
)
|
345.00
|
|
(8,064
|
)
|
4.23
|
|
(224,111
|
)
|
66.90
|
|
||||||
|
Non-current portion
|
3,417,840
|
|
7.59
|
|
3,779,245
|
|
9.66
|
|
2,842,309
|
|
11.30
|
|
||||||
_________________________
|
*
|
As adjusted (
note 16 - Share capital
)
|
** A portion of the Series A warrants was exercised using the cashless feature. Therefore, the total number of equivalent shares issued was
301,343
.
The following table summarizes the share purchase warrants outstanding and exercisable as at
December 31, 2017
:
|
Exercise price ($)
|
Number
|
Weighted average remaining contractual life (years)
|
|||
|
1.07
|
115,844
|
|
2.19
|
||
|
4.70
|
945,000
|
|
2.34
|
||
|
7.10
|
2,331,000
|
|
2.96
|
||
|
185.00
|
25,996
|
|
0.58
|
||
|
3,417,840
|
|
2.74
|
|||
123
|
Aeterna Zentaris Inc.
|
|
Notes to Consolidated Financial Statements
|
|
As at December 31, 2017 and December 31, 2016 and for the years ended December 31, 2017, 2016 and 2015
|
|
(tabular amounts in thousands of US dollars, except share/option/warrant and per share/option/warrant data and as otherwise noted)
|
The table presented below shows the inputs and assumptions applied to the Black-Scholes option pricing model in order to determine the fair value of all warrants outstanding as at
December 31, 2017
. The Black-Scholes option pricing model uses "Level 2" inputs, as defined by IFRS 13,
Fair value measurement
("IFRS 13") and as discussed in
note 22 - Financial instruments and financial risk management
.
|
Number of equivalent shares
|
Market-value per share price
|
Weighted average exercise price
|
Risk-free annual interest rate
|
Expected volatility
|
Expected life (years)
|
Expected dividend yield
|
|||||||||||||
|
($)
|
($)
|
(a)
|
(b)
|
(c)
|
(d)
|
||||||||||||||
|
July 2013 Warrants
|
25,996
|
|
2.36
|
|
185.00
|
|
1.75
|
%
|
136.18
|
%
|
0.58
|
0.00
|
%
|
||||||
|
March 2015 Series A Warrants (e)
|
115,844
|
|
2.36
|
|
1.07
|
|
1.90
|
%
|
132.24
|
%
|
2.19
|
0.00
|
%
|
||||||
|
December 2015 Warrants
|
2,331,000
|
|
2.36
|
|
7.10
|
|
1.97
|
%
|
137.02
|
%
|
2.96
|
0.00
|
%
|
||||||
|
November 2016 Warrants (f)
|
945,000
|
|
2.36
|
|
4.70
|
|
1.91
|
%
|
145.04
|
%
|
2.34
|
0.00
|
%
|
||||||
|
(a)
|
Based on United States Treasury Government Bond interest rates with a term that is consistent with the expected life of the warrants.
|
|
(b)
|
Based on the historical volatility of the Company's stock price over the most recent period consistent with the expected life of the warrants, as well as on future expectations.
|
|
(c)
|
Based upon time to expiry from the reporting period date.
|
|
(d)
|
The Company has not paid dividends and it does not intend to pay dividends in the foreseeable future.
|
|
(e)
|
For the
March 2015
Series A Warrants, the inputs and assumptions applied to the Black-Scholes option pricing model have been further adjusted to take into consideration the value attributed to certain anti-dilution provisions. Specifically, the weighted average exercise price is subject to adjustment (see
note 16 - Share capital
).
|
|
(f)
|
For the
November 2016
Warrants, the Company reduced the fair value of these warrants to take into consideration the fair value of the
$10
call option, which was also calculated using the Black-Scholes pricing model. (see
note 16 - Share capital
).
|
Series B Warrants
In addition to the availability of standard cashless exercise provisions, the Series B Warrants (defined and discussed in
note 16 - Share capital
) were entitled to be exercised on an alternate cashless basis in accordance with their terms. Such an exercise permits the holder to obtain a number of common shares equal to:
200%
of (i) the total number of common shares with respect to which the Series B Warrant was then being exercised multiplied by (ii)
81.00
divided by (iii)
85%
of the quotient of (A) the sum of the per share volume weighted average price ("VWAP") of the common share for each of the
five
lowest trading days during the
fifteen
trading day period ending on and including the trading day immediately prior to the applicable Exercise Date, divided by (B)
five
, less (iv) the total number of common shares with respect to which the Series B Warrant is then being exercised.
Exercises of Series B Warrants on an alternate cashless basis resulted in the issuance of a substantially larger number of the Company's common shares than would have been otherwise issued following a standard cash or cashless exercise of the Series B Warrants.
Management has determined that, in light of the alternate cashless exercise feature and of actual Series B Warrant exercises since original issuance, application of the Black-Scholes option pricing model did not appropriately reflect the fair value of the Series B Warrants outstanding at a given statement of financial position date. Instead, management has determined that the application of an intrinsic valuation method is more representative of the market value of the Series B Warrants.
124
|
Aeterna Zentaris Inc.
|
|
Notes to Consolidated Financial Statements
|
|
As at December 31, 2017 and December 31, 2016 and for the years ended December 31, 2017, 2016 and 2015
|
|
(tabular amounts in thousands of US dollars, except share/option/warrant and per share/option/warrant data and as otherwise noted)
|
On
November 2, 2015
, the Company announced that the holders (the "Participating Holders") of substantially all of the remaining outstanding Series B Warrants at that time had agreed to exercise all Series B Warrants held by them, at a maximum exercise ratio of approximately
33.23
common shares per warrant in accordance with the alternate cashless exercise feature in such Series B Warrants. We paid the Participating Holders a total of
$2,925,653
pursuant to the aforementioned agreements.
The
8,064
Series B Warrants remaining on
December 31, 2015
expired on
September 12, 2016
without having been exercised.
15 Provisions
|
December 31,
|
||||||
|
2017
|
2016
|
|||||
|
$
|
$
|
|||||
|
Onerous contract provisions (detailed below)
|
310
|
|
404
|
|
||
|
Non-current portion of provision for restructuring costs (note 13)
|
718
|
|
—
|
|
||
|
Other
|
—
|
|
97
|
|
||
|
1,028
|
|
501
|
|
|||
|
Cetrotide
®
onerous contracts*
|
Onerous lease**
|
Total
|
|||||||
|
$
|
$
|
$
|
|||||||
|
At January 1, 2016
|
803
|
|
234
|
|
1,037
|
|
|||
|
Change in the provision
|
(24
|
)
|
—
|
|
(24
|
)
|
|||
|
Utilization of provision
|
(196
|
)
|
(113
|
)
|
(309
|
)
|
|||
|
Unwinding of discount and effect of changes in the discount and foreign exchange rates
|
(9
|
)
|
4
|
|
(5
|
)
|
|||
|
At December 31, 2016
|
574
|
|
125
|
|
699
|
|
|||
|
Less: current portion (note 12)
|
(181
|
)
|
(114
|
)
|
(295
|
)
|
|||
|
393
|
|
11
|
|
404
|
|
||||
|
At December 31, 2016
|
574
|
|
125
|
|
699
|
|
|||
|
Change in the provision
|
(20
|
)
|
—
|
|
(20
|
)
|
|||
|
Utilization of provision
|
(145
|
)
|
(119
|
)
|
(264
|
)
|
|||
|
Unwinding of discount and effect of changes in the discount and foreign exchange rates
|
64
|
|
3
|
|
67
|
|
|||
|
At December 31, 2017
|
473
|
|
9
|
|
482
|
|
|||
|
Less: current portion (note 12)
|
(163
|
)
|
(9
|
)
|
(172
|
)
|
|||
|
310
|
|
—
|
|
310
|
|
||||
|
*
|
Recorded following the transfer of the Cetrotide
®
Business (discontinued operations).
|
|
**
|
Represents the present value of the future lease payments that the Company is obligated to make pursuant to a non-cancellable operating lease in the United States, net of estimated future sublease income. The estimate may vary as a result of changes in the utilization of the leased premises and of the sublease arrangement. The lease expired in January 2018.
|
125
|
Aeterna Zentaris Inc.
|
|
Notes to Consolidated Financial Statements
|
|
As at December 31, 2017 and December 31, 2016 and for the years ended December 31, 2017, 2016 and 2015
|
|
(tabular amounts in thousands of US dollars, except share/option/warrant and per share/option/warrant data and as otherwise noted)
|
16 Share capital
The Company has an unlimited number of authorized common shares (being voting and participating shares) with no par value, as well as an unlimited number of preferred, first and second ranking shares, issuable in series, with rights and privileges specific to each class, with no par value.
Share consolidation
The
655,984,512
common shares issued and outstanding immediately prior to the Share Consolidation, which became legally effective on
November 17, 2015
, were consolidated into
6,559,846
common shares (the "Post-Consolidation Shares"). The Post-Consolidation Shares began trading on each of the TSX and NASDAQ at the opening of markets on
November 20, 2015
. The number of outstanding stock options and share purchase warrants were adjusted on the same basis with proportionate adjustments being made to each stock option and share purchase warrant exercise price.
All share, option and share purchase warrant and per share, option and share purchase warrant data have been retroactively adjusted in these consolidated financial statements to reflect and give effect to the Share Consolidation as if it occurred at the beginning of the earliest period presented.
Common shares issued in connection with "At-the-Market" ("ATM") drawdowns
April 2016
ATM Program
On
April 1, 2016
, the Company entered into an ATM sales agreement (the "
April 2016
ATM Program"), under which the Company was able, at its discretion and from time to time, to sell up to
3
million common shares through ATM issuances on the NASDAQ for aggregate gross proceeds of up to approximately
$10 million
.
The
April 2016
ATM Program provides that common shares were to be sold at market prices prevailing at the time of sale and, as a result, prices varied.
Between
April 1, 2016
and
March 24, 2017
, the Company issued a total of
1,706,968
common shares under the
April 2016
ATM Program at an average issuance price of
$3.52
per share for aggregate gross proceeds of
$6.0 million
less cash transaction costs of
$190,000
and previously deferred financing costs of
$225,000
.
March 2017
ATM Program
On
March 28, 2017
, the Company commenced a new ATM offering pursuant to its existing ATM Sales Agreement, dated
April 1, 2016
, under which the Company was able, at its discretion, from time to time, to sell up to a maximum of
3
million common shares through ATM issuances on the NASDAQ, up to an aggregate amount of
$9.0 million
(the "
March 2017
ATM Program"). The common shares were to be sold at market prices prevailing at the time of the sale of the common shares and, as a result, sale prices varied.
Between
March 28, 2017
and
April 18, 2017
, the Company issued a total of
597,994
common shares under the
March 2017
ATM Program at an average issuance price of
$2.97
per share for aggregate gross proceeds of
$1,780,000
less cash transaction costs of
$55,000
and previously deferred financing costs of
$65,000
.
April 2017
ATM Program
On
April 27, 2017
, the Company entered into a New ATM Sales Agreement and filed with the Securities and Exchange Commission (the "SEC") a prospectus supplement (the "
April 2017
ATM Prospectus Supplement" or "April 2017 ATM Program") related to sales and distributions of up to a maximum of
2,240,000
common shares through ATM issuances on the NASDAQ, up to an aggregate amount of
$6.9
million under the New ATM Sales Agreement. The common shares will be sold at market prices prevailing at the time of the sale of the common shares and, as a result, prices may vary. The New ATM Sales Agreement and the
April 2017
ATM Program superseded and replaced the
March 2017
ATM Program, which itself superseded and replaced the
April 2016
ATM Program. The
April 2017
ATM Prospectus Supplement supplements the base prospectus included in the Company's Shelf Registration Statement on Form F-3, as amended (the "
2017
Shelf Registration Statement"), which was declared effective by the SEC on
April 27, 2017
. The
2017
Shelf Registration Statement allows us to offer up to
$50 million
of common shares and is effective for a
three
-year period.
126
|
Aeterna Zentaris Inc.
|
|
Notes to Consolidated Financial Statements
|
|
As at December 31, 2017 and December 31, 2016 and for the years ended December 31, 2017, 2016 and 2015
|
|
(tabular amounts in thousands of US dollars, except share/option/warrant and per share/option/warrant data and as otherwise noted)
|
Between
May 30, 2017
and
December 31, 2017
, the Company issued a total of
1,805,758
common shares under the
April 2017
ATM Program at an average issuance price of
$1.71
per share for aggregate gross proceeds of
$3,761,000
less cash transaction costs of
$115,000
and previously deferred financing costs of
$285,000
. Because of these issuances, the exercise price of the Series A warrants issued in
March 2015
was adjusted to
$1.07
pursuant to the anti-dilution provisions contained in such warrants.
Public offerings
March 2015
Offering
On
March 11, 2015
, the Company completed a public offering of
596,775
units (the "Units"), with each Unit consisting of either
one
common share or
one
pre-funded warrant to purchase
one
common share ("Series C Warrant"),
0.75
of a warrant to purchase one common share ("Series A Warrant") and
0.50
of a warrant to purchase
one
common share ("Series B Warrant"), at a purchase price of
$62.00
per Unit (the "
March 2015
Offering").
Total gross cash proceeds raised through the
March 2015
Offering amounted to
$37,000,000
, less cash transaction costs of
$2,560,000
and previously deferred transaction costs of
$7,000
.
The Series A Warrants were exercisable during a
five
-year term at an initial exercise price of
$81.00
per share, and the Series B Warrants were exercisable during an
18
-month term at an initial exercise price of
$81.00
per share. The Series A Warrants are and the Series B Warrants were subject to certain anti-dilution provision and may at any time be exercised on a standard cashless basis and, in addition, the Series B Warrants were exercisable on an alternate net cashless basis. The exercise of Series B Warrants performed on an alternate net cashless basis resulted in the issuance of a substantially larger number of the Company's common shares than otherwise would be issued following a standard cash or cashless exercise. See also
note 14 - Warrant liability
. The remaining
8,064
Series B Warrants expired
September 12, 2016
.
Between
May 26, 2015
and
December 31, 2015
,
290,318
of the Series B Warrants were exercised on an alternate cashless basis, resulting in the issuance of
5,670,118
common shares.
The Company estimated the fair value attributable to the Series A and Series B warrants as of the date of grant by applying the Black-Scholes pricing model, to which the following assumptions were applied: Series A warrants: a risk-free annual interest rate of
1.59%
, an expected volatility of
95.11%
, an expected life of
5
years and a dividend yield of
0.0%
; Series B warrants: a risk-free annual interest rate of
0.47%
, an expected volatility of
97.34%
, an expected life of
18
months and a dividend yield of
0.0%
. As a result, on
March 11, 2015
, the total fair value of the share purchase warrants was estimated at
$20,980,000
.
The Series C Warrants were offered in the
March 2015
Offering to investors whose purchase of Units would have resulted in their beneficially owning more than an "initial beneficial ownership limitation" of either
4.9%
or
9.9%
of our common shares following the offering. The Series C Warrants, which were exercisable immediately upon issuance and for a period of
five
years at an exercise price of
$62.00
per share, were fully exercised between
March 23, 2015
and
June 5, 2015
. Total gross proceeds payable to the Company in connection with the exercise of the Series C Warrants were pre-funded by investors and therefore were included in the proceeds of the offering. No additional consideration was required to be paid to the Company upon exercise of the Series C Warrants.
Total gross proceeds of the
March 2015
Offering were allocated as follows:
$20,980,000
was allocated to the warrant liability,
$9,296,000
was allocated to pre-funded warrants, and the balance of
$6,724,000
was allocated to Share capital. Transaction costs were allocated to the liability and equity components in proportion to the allocation of proceeds. As such, an amount of
$1,451,000
was allocated to the warrant liability and immediately recognized in general and administrative expenses in the consolidated statement of comprehensive loss, an amount of
$473,000
was allocated to Share capital and an amount of
$643,000
was allocated to pre-funded warrants. Upon exercise of the Series C Warrants, the net proceeds initially allocated to the pre-funded warrants were re-allocated to Share capital.
In connection with the
March 2015
Offering, the holders of
211,230
of the
219,000
then outstanding warrants issued by the Company in connection with public offerings completed in
November 2013
and
January 2014
entered into an amendment agreement that caused such previously issued warrants to expire and terminate. The Company made a cash payment in the aggregate amount of
$5,703,000
out of the proceeds of the
March 2015
Offering as consideration to the relevant
127
|
Aeterna Zentaris Inc.
|
|
Notes to Consolidated Financial Statements
|
|
As at December 31, 2017 and December 31, 2016 and for the years ended December 31, 2017, 2016 and 2015
|
|
(tabular amounts in thousands of US dollars, except share/option/warrant and per share/option/warrant data and as otherwise noted)
|
warrantholders in exchange for the latter agreeing to the aforementioned amendment. Upon expiry of the warrants in question, the Company recognized a gain of
$5,865,000
and derecognized the expired warrants. The gain on derecognition was recorded, net of the aforementioned amendment fee, within finance income in the accompanying consolidated statement of comprehensive loss. For holders of the remaining
7,770
outstanding warrants issued by the Company in connection with the
November 2013
and the
January 2014
offerings who did not enter into a warrant amendment agreement, the exercise price of the corresponding warrants was reduced to
$14.00
per share in accordance with the terms thereof.
December 2015
Offering
On
December 14, 2015
, the Company completed a public offering of
3,000,000
common shares at a purchase price of
$5.54
per share and
2,100,000
warrants to purchase one common share at a purchase price of
$0.01
per warrant (the "
December 2015
Offering").
In connection with the
December 2015
Offering, the Company granted the underwriter a
45
-day over-allotment option to separately acquire up to an additional
330,000
common shares at the same purchase price of
$5.54
per share and/or up to an additional
231,000
warrants at the same purchase price of
$0.01
per warrants. The underwriter exercised its option in full with respect to the
231,000
warrants for market stabilization purposes but did not exercise any of its option in respect of common shares.
Total gross cash proceeds raised through the
December 2015
Offering amounted to
$16,650,000
, less cash transaction costs of
$1,638,000
.
The warrants are exercisable for a period of
five
years at an exercise price of
$7.10
per share. Upon complete exercise for cash, these warrants would result in the issuance of an aggregate of
2,331,000
common shares that would generate additional proceeds for an amount of
$16,550,100
. However, those warrants may at any time be exercised on a "net" or "cashless" basis.
The Company estimated the fair value attributable to the warrants as of the date of grant by applying the Black-Scholes pricing model, to which the following assumptions were applied: a risk-free annual interest rate of
1.68%
, an expected volatility of
107.57%
, an expected life of
5
years and a dividend yield of
0.00%
. As a result, on
December 14, 2015
, the total fair value of the share purchase warrants was estimated at
$7,698,000
.
Total gross proceeds of the
December 2015
Offering were allocated as follows:
$7,698,000
was allocated to the warrant liability and
$8,952,000
was allocated to Share capital. Transaction costs were allocated to the liability and equity components in proportion to the allocation of proceeds. As such, an amount of
$757,000
was allocated to the warrant liability and immediately recognized in general and administrative expenses in the consolidated statement of comprehensive loss, an amount of
$881,000
was allocated to Share capital.
In connection with the
December 2015
Offering and in accordance with the anti-dilution provisions, the exercise prices of the
January 2014
and
March 2015
Series A and Series B warrants were adjusted to
$0.00
and
$4.95
, respectively. The remaining
January 2014
Warrants were exercised on
December 30, 2015
and no longer remain outstanding.
November 2016
Offering
On
November 1, 2016
, the Company completed a registered direct offering of
2,100,000
units (the "Units"), with each Unit consisting of
one
common share or
one
pre-funded warrant to purchase one common share and
0.45
of a warrant to purchase
one
common share (the "
November 2016
Offering").
Total gross cash proceeds raised through the
November 2016
Offering amounted to
$7.6 million
, less cash transaction costs of
$1.0 million
, and previously deferred transactions costs of
$27,000
. The warrants are exercisable
six
months after their date of issuance and for a period of
three
years thereafter at an exercise price of
$4.70
per share.
The warrants contain a call provision which provides that, in the event the Company's common shares trade at or above
$10
on the market during a specified measurement period and subject to a minimum volume of trading during such measurement period, then, subject to certain conditions, the Company has the right to call for cancellation all or any portion of the warrants which are not exercised by holders within
10
trading days following receipt of a call notice from the Company.
128
|
Aeterna Zentaris Inc.
|
|
Notes to Consolidated Financial Statements
|
|
As at December 31, 2017 and December 31, 2016 and for the years ended December 31, 2017, 2016 and 2015
|
|
(tabular amounts in thousands of US dollars, except share/option/warrant and per share/option/warrant data and as otherwise noted)
|
Upon complete exercise for cash, these warrants would result in the issuance of an aggregate of
945,000
common shares that would generate additional proceeds of approximately
$4.4 million
, although these warrants may be exercised on a "net" or "cashless" basis. See also
note 14 - Warrant liability
.
The Company estimated the fair value attributable to the warrants as of the date of grant by applying probability to multiple Black-Scholes pricing models, to which the following weighed average assumptions were applied: a risk-free annual interest rate of
0.63%
, an expected volatility of
112.48%
, an expected life of
1.63
years and a dividend yield of
0.0%
. In addition, the Company reduced the fair value of these warrants to take into consideration the fair value of the
$10.00
call option, which was also calculated using the Black-Scholes pricing model with similar assumptions as described above. As a result, on
November 1, 2016
, being the date of issuance, the total fair value of the share purchase warrants was estimated at
$400,000
.
The pre-funded warrants were offered in the
November 2016
Offering to the investor because the purchase of Units would have resulted in the investor beneficially owning more than an "initial beneficial ownership limitation" of
4.9%
of our common shares following the offering. The pre-funded warrants, which were exercisable immediately upon issuance and for a period of
five
years at an exercise price of
$3.60
per share, were fully exercised between
November 10, 2016
and
December 19, 2016
. Total gross proceeds payable to the Company in connection with the exercise of the pre-funded warrants were pre-funded by the investor and therefore were included in the proceeds of the offering. No additional consideration was required to be paid to the Company upon exercise of the pre-funded warrants.
Total gross proceeds of the
November 2016
Offering were allocated as follows:
$400,000
was allocated to the warrant liability,
$3,239,000
was allocated to the pre-funded warrants, and the balance of
$3,921,000
was allocated to Share capital. Transaction costs were allocated to the liability and equity components in proportion to the allocation of proceeds. As such, an amount of
$56,000
was allocated to the warrant liability and immediately recognized in general and administrative expenses in the consolidated statement of comprehensive loss, an amount of
$544,000
was allocated to Share capital and an amount of
$450,000
was allocated to pre-funded warrants. Upon exercise of the pre-funded warrants, the net proceeds initially allocated to the pre-funded warrants were re-allocated to Share capital.
Shareholder rights plan
The Company has a shareholder rights plan (the "Rights Plan") that provides the Board of Directors and the Company's shareholders with additional time to assess any unsolicited take-over bid for the Company and, where appropriate, to pursue other alternatives for maximizing shareholder value. Under the Rights Plan, one right has been issued for each currently issued common share, and one right will be issued with each additional common share that may be issued from time to time. The Rights Plan was approved, ratified and confirmed by the Company's shareholders at its annual meeting of shareholders held on
May 10, 2016
.
Stock options
The Company has in place a stock option plan (the "Stock Option Plan") for its directors, senior executives, employees and other collaborators who provide services to the Company. The total number of common shares that may be issued under the Stock Option Plan cannot exceed
11.4%
of the total number of issued and outstanding common shares at any given time. The Company's Board of Directors amended the Stock Option Plan on
March 20, 2014
and the Company's Shareholders approved, ratified and confirmed the Stock Option Plan on
May 10, 2016
.
Options granted under the Stock Option Plan prior to the
2014
amendment expire after a maximum period of
10
years following the date of grant. Options granted after the
2014
amendment expire after a maximum period of
seven
years following the date of grant.
The following tables summarize the activity under the Stock Option Plan.
129
|
Aeterna Zentaris Inc.
|
|
Notes to Consolidated Financial Statements
|
|
As at December 31, 2017 and December 31, 2016 and for the years ended December 31, 2017, 2016 and 2015
|
|
(tabular amounts in thousands of US dollars, except share/option/warrant and per share/option/warrant data and as otherwise noted)
|
|
Years ended December 31,
|
||||||||||||||||||
|
2017
|
2016
|
2015
|
||||||||||||||||
|
US dollar-denominated options
|
Number
|
Weighted average exercise price (US$)
|
Number
|
Weighted average exercise price (US$)
|
Number
|
Weighted average exercise price (US$)
|
||||||||||||
|
Balance – Beginning of the year
|
966,539
|
|
7.23
|
|
272,874
|
|
25.88
|
|
33,956
|
|
187.36
|
|
||||||
|
Granted
|
390,000
|
|
2.05
|
|
713,573
|
|
3.47
|
|
243,000
|
|
5.17
|
|
||||||
|
Forfeited
|
(643,271
|
)
|
6.02
|
|
(10,034
|
)
|
99.22
|
|
(4,082
|
)
|
136.17
|
|
||||||
|
Cancelled
|
—
|
|
—
|
|
(9,874
|
)
|
157.00
|
|
—
|
|
—
|
|
||||||
|
Expired
|
(853
|
)
|
704.88
|
|
—
|
|
—
|
|
—
|
|
—
|
|
||||||
|
Balance – End of period
|
712,415
|
|
4.66
|
|
966,539
|
|
7.23
|
|
272,874
|
|
25.88
|
|
||||||
|
Years ended December 31,
|
||||||||||||||||||
|
2017
|
2016
|
2015
|
||||||||||||||||
|
Canadian dollar-denominated options
|
Number
|
Weighted average exercise price (CAN$)
|
Number
|
Weighted average exercise price (CAN$)
|
Number
|
Weighted average exercise price (CAN$)
|
||||||||||||
|
Balance – Beginning of the year
|
1,858
|
|
820.27
|
|
3,787
|
|
845.46
|
|
4,909
|
|
1,010.40
|
|
||||||
|
Forfeited
|
—
|
|
—
|
|
(1,028
|
)
|
967.63
|
|
(271
|
)
|
923.20
|
|
||||||
|
Cancelled
|
—
|
|
—
|
|
(901
|
)
|
758.00
|
|
—
|
|
—
|
|
||||||
|
Expired
|
(355
|
)
|
1,728.15
|
|
—
|
|
—
|
|
(851
|
)
|
1,772.17
|
|
||||||
|
Balance – End of the year
|
1,503
|
|
605.84
|
|
1,858
|
|
820.27
|
|
3,787
|
|
845.46
|
|
||||||
|
US$ options outstanding as at December 31, 2017
|
|||||||||
|
Exercise price
(US$) |
Number
|
Weighted average remaining
contractual life (years) |
Weighted average exercise price
(US$) |
||||||
|
2.05 to 2.75
|
390,000
|
|
6.62
|
|
2.05
|
|
|||
|
2.76 to 3.47
|
168,864
|
|
5.93
|
|
3.45
|
|
|||
|
3.48 to 3.49
|
50,000
|
|
5.35
|
|
3.48
|
|
|||
|
3.50 to 4.19
|
32,498
|
|
5.94
|
|
3.77
|
|
|||
|
4.20 to 1,044.00
|
71,053
|
|
4.89
|
|
23.09
|
|
|||
|
712,415
|
|
6.17
|
|
4.66
|
|
||||
130
|
Aeterna Zentaris Inc.
|
|
Notes to Consolidated Financial Statements
|
|
As at December 31, 2017 and December 31, 2016 and for the years ended December 31, 2017, 2016 and 2015
|
|
(tabular amounts in thousands of US dollars, except share/option/warrant and per share/option/warrant data and as otherwise noted)
|
|
US$ options exercisable as at December 31, 2017
|
|||||||||
|
Exercise price
(US$) |
Number
|
Weighted average remaining
contractual life (years) |
Weighted average exercise price
(US$) |
||||||
|
2.76 to 3.47
|
56,851
|
|
5.93
|
|
3.45
|
|
|||
|
3.48 to 3.49
|
16,669
|
|
5.35
|
|
3.48
|
|
|||
|
3.50 to 4.19
|
10,834
|
|
5.94
|
|
3.77
|
|
|||
|
4.20 to 1,044.00
|
49,055
|
|
4.86
|
|
31.39
|
|
|||
|
133,409
|
|
5.46
|
|
13.75
|
|
||||
|
CAN$ options both outstanding and exercisable as at December 31, 2017
|
|||||||||
|
Exercise price
(CAN$) |
Number
|
Weighted average remaining
contractual life (years) |
Weighted average exercise price
(CAN$) |
||||||
|
330.00 to 360.00
|
197
|
|
0.92
|
|
330.00
|
|
|||
|
360.01 to 480.00
|
333
|
|
0.87
|
|
390.00
|
|
|||
|
480.01 to 741.00
|
502
|
|
1.94
|
|
570.00
|
|
|||
|
741.01 to 912.00
|
471
|
|
2.87
|
|
912.00
|
|
|||
|
1,503
|
|
1.86
|
|
605.84
|
|
||||
As at
December 31, 2017
, the total compensation cost related to unvested US Dollar stock options not yet recognized amounted to
$444,450
(
$2,057,188
in
2016
). This amount is expected to be recognized over a weighted average period of
1.38
years (
1.71
years in
2016
).
The Company settles stock options exercised through the issuance of new common shares as opposed to purchasing common shares on the market to settle stock option exercises.
Fair value input assumptions for US dollar-denominated options granted
The table below shows the assumptions, or weighted average parameters, applied to the Black-Scholes option pricing model in order to determine share-based compensation costs over the life of the awards.
________________________
|
Years ended December 31,
|
||||||
|
2017
|
2016
|
|||||
|
Expected dividend yield
|
(a)
|
0.00
|
%
|
0.00
|
%
|
|
|
Expected volatility
|
(b)
|
137.60
|
%
|
115.10
|
%
|
|
|
Risk-free annual interest rate
|
(c)
|
1.53
|
%
|
1.80
|
%
|
|
|
Expected life (years)
|
(d)
|
3.26
|
4.92
|
|||
|
Weighted average share price
|
$2.05
|
$3.47
|
||||
|
Weighted average exercise price
|
$2.05
|
$3.47
|
||||
|
Weighted average grant date fair value
|
$1.62
|
$2.80
|
||||
|
(a)
|
The Company has not paid dividends and it does not intend to pay dividends in the foreseeable future.
|
|
(b)
|
Based on the historical volatility of the Company's stock price over the most recent period consistent with the expected life of the stock options, as well as on future expectations.
|
|
(c)
|
Based on United States Treasury Government Bond interest rates with a term that is consistent with the expected life of the stock options.
|
131
|
Aeterna Zentaris Inc.
|
|
Notes to Consolidated Financial Statements
|
|
As at December 31, 2017 and December 31, 2016 and for the years ended December 31, 2017, 2016 and 2015
|
|
(tabular amounts in thousands of US dollars, except share/option/warrant and per share/option/warrant data and as otherwise noted)
|
|
(d)
|
Based upon historical data related to the exercise of stock options, on post-vesting employment terminations and on future expectations related to exercise behavior.
|
The Black-Scholes pricing models referred above use "Level 2" inputs in calculating fair value, as defined by IFRS 13, and as discussed in
note 22 - Financial instruments and financial risk management
.
132
|
Aeterna Zentaris Inc.
|
|
Notes to Consolidated Financial Statements
|
|
As at December 31, 2017 and December 31, 2016 and for the years ended December 31, 2017, 2016 and 2015
|
|
(tabular amounts in thousands of US dollars, except share/option/warrant and per share/option/warrant data and as otherwise noted)
|
17 Operating expenses
The nature of the Company's operating expenses from continuing operations include the following:
_________________________
|
Years ended December 31,
|
|||||||||
|
2017
|
2016
|
2015
|
|||||||
|
$
|
$
|
$
|
|||||||
|
Key management personnel compensation
(1)
|
|||||||||
|
Salaries and short-term employee benefits
|
2,081
|
|
2,430
|
|
2,957
|
|
|||
|
Termination benefits
|
—
|
|
—
|
|
843
|
|
|||
|
Post-employment benefits
|
59
|
|
78
|
|
119
|
|
|||
|
Share-based compensation costs
|
87
|
|
1,051
|
|
828
|
|
|||
|
2,227
|
|
3,559
|
|
4,747
|
|
||||
|
Other employees compensation:
|
|||||||||
|
Salaries and short-term employee benefits
|
3,584
|
|
3,574
|
|
4,431
|
|
|||
|
Termination benefits
|
1,806
|
|
—
|
|
245
|
|
|||
|
Post-employment benefits
|
441
|
|
500
|
|
511
|
|
|||
|
Share-based compensation costs
|
95
|
|
31
|
|
91
|
|
|||
|
5,926
|
|
4,105
|
|
5,278
|
|
||||
|
Goods and services
(2)
|
13,575
|
|
21,217
|
|
21,429
|
|
|||
|
Leasing costs, net of sublease receipts of $359 in 2017, $345 in 2016 and $380 in 2015
(3)
|
2,247
|
|
1,131
|
|
1,452
|
|
|||
|
Refundable tax credits and grants
|
—
|
|
—
|
|
(23
|
)
|
|||
|
Onerous contract expenses resulting from the Restructuring
|
—
|
|
—
|
|
(202
|
)
|
|||
|
Transaction costs related to share purchase warrants
|
—
|
|
56
|
|
2,208
|
|
|||
|
Depreciation and amortization
|
138
|
|
195
|
|
271
|
|
|||
|
Impairment (reversal) losses
|
(44
|
)
|
85
|
|
70
|
|
|||
|
Operating foreign exchange (gains) losses
|
(72
|
)
|
39
|
|
199
|
|
|||
|
15,844
|
|
22,723
|
|
25,404
|
|
||||
|
23,997
|
|
30,387
|
|
35,429
|
|
||||
|
(1)
|
Key management includes the Company's directors and members of the executive management team.
|
|
(2)
|
Goods and services include third-party R&D costs, laboratory supplies, professional fees, contracted sales force costs, marketing services, insurance and travel expenses.
|
|
(3)
|
Leasing costs also include changes in the onerous lease provision (note 15 - provisions), other than attributable to the unwinding of the discount.
|
Most of the employment agreements entered into between the Company and its executive officers include termination provisions, whereby the executive officers would be entitled to receive benefits that would be payable if the Company were to terminate the executive officers' employment without cause or if their employment is terminated following a change of control. Separation benefits generally are calculated based on an agreed-upon multiple of applicable base salary and incentive compensation and, in certain cases, other benefit amounts.
133
|
Aeterna Zentaris Inc.
|
|
Notes to Consolidated Financial Statements
|
|
As at December 31, 2017 and December 31, 2016 and for the years ended December 31, 2017, 2016 and 2015
|
|
(tabular amounts in thousands of US dollars, except share/option/warrant and per share/option/warrant data and as otherwise noted)
|
18 Employee future benefits
The Company's subsidiary in Germany provides unfunded defined benefit pension plans and unfunded post-employment benefit plans for certain groups of employees. Provisions for pension obligations are established for benefits payable in the form of retirement, disability and surviving dependent pensions.
The unfunded defined benefit pension plans are final salary pension plans, which provide benefits to members (or to their surviving dependents) in the form of a guaranteed level of pension payable for life. The level of benefits provided depends on the member's length of service and on his or her base salary in the final years leading up to retirement. Current pensions vary in accordance with applicable statutory requirements, which foresee an adjustment every three years on an individual basis that is based on inflationary increases or in relation to salaries of comparable groups of active employees in the Company. An adjustment may be denied by the Company if the Company's financial situation does not allow for an increase in pensions. These plans are unfunded, and the Company meets benefit payment obligations as they fall due.
The change in the Company's accrued benefit obligations is summarized as follows:
|
Pension benefit plans
Years ended December 31, |
Other benefit plans
Years ended December 31, |
|||||||||||||||||
|
2017
|
2016
|
2015
|
2017
|
2016
|
2015
|
|||||||||||||
|
$
|
$
|
$
|
$
|
$
|
$
|
|||||||||||||
|
Balances – Beginning of the year
|
13,197
|
|
12,375
|
|
14,619
|
|
217
|
|
281
|
|
433
|
|
||||||
|
Current service cost
|
107
|
|
87
|
|
103
|
|
14
|
|
13
|
|
14
|
|
||||||
|
Interest cost
|
237
|
|
282
|
|
260
|
|
3
|
|
—
|
|
8
|
|
||||||
|
Actuarial (gain) loss arising from changes in financial assumptions
|
(694
|
)
|
1,479
|
|
(844
|
)
|
(115
|
)
|
—
|
|
(34
|
)
|
||||||
|
Benefits paid
|
(485
|
)
|
(399
|
)
|
(410
|
)
|
(66
|
)
|
(60
|
)
|
(97
|
)
|
||||||
|
Impact of foreign exchange rate changes
|
1,783
|
|
(627
|
)
|
(1,353
|
)
|
31
|
|
(17
|
)
|
(43
|
)
|
||||||
|
Balances – End of the year
|
14,145
|
|
13,197
|
|
12,375
|
|
84
|
|
217
|
|
281
|
|
||||||
|
Amounts recognized:
|
||||||||||||||||||
|
In net loss
|
(344
|
)
|
(369
|
)
|
(363
|
)
|
98
|
|
(13
|
)
|
12
|
|
||||||
|
In other comprehensive loss
|
(1,089
|
)
|
(852
|
)
|
2,197
|
|
(31
|
)
|
17
|
|
43
|
|
||||||
The cumulative amount of actuarial net losses recognized in other comprehensive loss as at
December 31, 2017
is approximately
$4,277,000
(approximately
$4,971,000
as at
December 31, 2016
and approximately
$3,492,000
as at
December 31, 2015
).
The significant actuarial assumptions applied to determine the Company's accrued benefit obligations are as follows:
|
Pension benefit plans
|
Other benefit plans
|
|||||||||||
|
Years ended December 31,
|
Years ended December 31,
|
|||||||||||
|
Actuarial assumptions
|
2017
|
2016
|
2015
|
2017
|
2016
|
2015
|
||||||
|
%
|
%
|
%
|
%
|
%
|
%
|
|||||||
|
Discount rate
|
1.70
|
1.60
|
2.40
|
1.70
|
1.60
|
2.40
|
||||||
|
Pension benefits increase
|
1.80
|
1.80
|
1.80
|
1.80
|
1.80
|
2.40
|
||||||
|
Rate of compensation increase
|
2.00
|
2.00
|
2.00
|
2.00
|
2.00
|
2.00
|
||||||
134
|
Aeterna Zentaris Inc.
|
|
Notes to Consolidated Financial Statements
|
|
As at December 31, 2017 and December 31, 2016 and for the years ended December 31, 2017, 2016 and 2015
|
|
(tabular amounts in thousands of US dollars, except share/option/warrant and per share/option/warrant data and as otherwise noted)
|
The calculation of the pension benefit obligation is sensitive to the discount rate assumption. Since
January 1, 2017
, management determined that the discount rate assumption should be adjusted from
1.6%
to
1.7%
as a result of changes in the European economic environment.
Assumptions regarding future mortality are set based on actuarial advice in accordance with published statistics and experience in Germany. These assumptions translate into an average remaining life expectancy in years for a pensioner retiring at age
65
:
|
2017
|
2016
|
2015
|
||||
|
Retiring at the end of the reporting period:
|
||||||
|
Male
|
20
|
20
|
20
|
|||
|
Female
|
24
|
24
|
24
|
|||
|
Retiring 20 years after the end of the reporting period:
|
||||||
|
Male
|
22
|
22
|
22
|
|||
|
Female
|
26
|
26
|
26
|
|||
The most recent actuarial reports give effect to the pension and post-employment benefit obligations as at
December 31, 2017
. The next actuarial reports are planned for
December 31, 2018
.
In accordance with the assumptions used as at
December 31, 2017
, undiscounted defined pension benefits expected to be paid are as follows:
|
$
|
|||
|
2018
|
522
|
|
|
|
2019
|
541
|
|
|
|
2020
|
553
|
|
|
|
2021
|
558
|
|
|
|
2022
|
564
|
|
|
|
Thereafter
|
16,589
|
|
|
|
19,327
|
|
||
The weighted average duration of the defined benefit obligation is
15.8
years.
Total expenses for the Company's defined contribution plan in its German subsidiary amounted to approximately
$119,000
for the year ended
December 31, 2017
(
$129,000
for
2016
and
$159,000
for
2015
).
135
|
Aeterna Zentaris Inc.
|
|
Notes to Consolidated Financial Statements
|
|
As at December 31, 2017 and December 31, 2016 and for the years ended December 31, 2017, 2016 and 2015
|
|
(tabular amounts in thousands of US dollars, except share/option/warrant and per share/option/warrant data and as otherwise noted)
|
19 Supplemental disclosure of cash flow information
|
Years ended December 31,
|
|||||||||
|
2017
|
2016
|
2015
|
|||||||
|
$
|
$
|
$
|
|||||||
|
Changes in operating assets and liabilities:
|
|||||||||
|
Trade and other receivables
|
158
|
|
228
|
|
270
|
|
|||
|
Prepaid expenses and other current assets
|
(343
|
)
|
(45
|
)
|
(111
|
)
|
|||
|
Other non-current assets
|
39
|
|
(233
|
)
|
58
|
|
|||
|
Payables and accrued liabilities
|
(1,113
|
)
|
(313
|
)
|
(1,013
|
)
|
|||
|
Deferred revenues
|
—
|
|
555
|
|
—
|
|
|||
|
Provision for restructuring costs (note 13)
|
(190
|
)
|
(566
|
)
|
(1,840
|
)
|
|||
|
Employee future benefits (note 18)
|
(551
|
)
|
(459
|
)
|
(507
|
)
|
|||
|
Provisions
|
(212
|
)
|
(231
|
)
|
(252
|
)
|
|||
|
(2,212
|
)
|
(1,064
|
)
|
(3,395
|
)
|
||||
20 Income taxes
Significant components of current and deferred income tax expense are as follows:
|
Years ended December 31,
|
|||||||||
|
2017
|
2016
|
2015
|
|||||||
|
$
|
$
|
$
|
|||||||
|
Current tax expense
|
—
|
|
—
|
|
—
|
|
|||
|
Deferred tax:
|
|||||||||
|
Origination and reversal of temporary differences
|
6,395
|
|
9,199
|
|
8,581
|
|
|||
|
Adjustments in respect of prior years
|
(149
|
)
|
36
|
|
—
|
|
|||
|
Change in unrecognized tax assets
|
(2,767
|
)
|
(9,235
|
)
|
(8,581
|
)
|
|||
|
Income tax recovery
|
3,479
|
|
—
|
|
—
|
|
|||
The reconciliation of the combined Canadian federal and provincial income tax rate to the income tax expense is provided below:
|
Years ended December 31,
|
|||||||||
|
2017
|
2016
|
2015
|
|||||||
|
Combined Canadian federal and provincial statutory income tax rate
|
26.8
|
%
|
26.9
|
%
|
26.9
|
%
|
|||
136
|
Aeterna Zentaris Inc.
|
|
Notes to Consolidated Financial Statements
|
|
As at December 31, 2017 and December 31, 2016 and for the years ended December 31, 2017, 2016 and 2015
|
|
(tabular amounts in thousands of US dollars, except share/option/warrant and per share/option/warrant data and as otherwise noted)
|
|
Years ended December 31,
|
|||||||||
|
2017
|
2016
|
2015
|
|||||||
|
$
|
$
|
$
|
|||||||
|
Income tax recovery based on combined statutory income tax rate
|
5,434
|
|
6,714
|
|
13,511
|
|
|||
|
Change in unrecognized tax assets
|
(2,701
|
)
|
(9,235
|
)
|
(8,581
|
)
|
|||
|
Change in unrecognized tax assets related to OCI
|
(228
|
)
|
436
|
|
(269
|
)
|
|||
|
Share issuance costs
|
164
|
|
224
|
|
—
|
|
|||
|
Permanent difference attributable to the use of local currency for tax reporting
|
(71
|
)
|
(30
|
)
|
(1,297
|
)
|
|||
|
Change in enacted rates used
|
(358
|
)
|
(16
|
)
|
—
|
|
|||
|
Permanent difference attributable to net change in fair value of warrant liability
|
595
|
|
1,194
|
|
(3,754
|
)
|
|||
|
Share-based compensation costs
|
(49
|
)
|
(291
|
)
|
(248
|
)
|
|||
|
Difference in statutory income tax rate of foreign subsidiaries
|
768
|
|
972
|
|
1,135
|
|
|||
|
Permanent difference attributable to expiring loss carry forward
|
—
|
|
—
|
|
(563
|
)
|
|||
|
Adjustments in respect of prior years
|
(149
|
)
|
36
|
|
—
|
|
|||
|
Other
|
74
|
|
(4
|
)
|
66
|
|
|||
|
3,479
|
|
—
|
|
—
|
|
||||
Deferred income tax assets are recognized to the extent that the realization of the related tax benefit through reversal of temporary differences and future taxable profits is probable.
Loss before income taxes
Loss before income taxes is attributable to the Company's tax jurisdictions as follows:
|
Years ended December 31,
|
|||||||||
|
2017
|
2016
|
2015
|
|||||||
|
$
|
$
|
$
|
|||||||
|
Germany
|
(13,950
|
)
|
(19,179
|
)
|
(20,500
|
)
|
|||
|
Canada
|
(5,592
|
)
|
(5,659
|
)
|
(29,496
|
)
|
|||
|
United States
|
(733
|
)
|
(121
|
)
|
(232
|
)
|
|||
|
(20,275
|
)
|
(24,959
|
)
|
(50,228
|
)
|
||||
Significant components of deferred tax assets and liabilities are as follows:
137
|
Aeterna Zentaris Inc.
|
|
Notes to Consolidated Financial Statements
|
|
As at December 31, 2017 and December 31, 2016 and for the years ended December 31, 2017, 2016 and 2015
|
|
(tabular amounts in thousands of US dollars, except share/option/warrant and per share/option/warrant data and as otherwise noted)
|
|
December 31,
|
||||||
|
2017
|
2016
|
|||||
|
$
|
$
|
|||||
|
Deferred tax assets
|
||||||
|
Current:
|
||||||
|
Operating losses carried forward
|
3,479
|
|
—
|
|
||
|
Non-current:
|
||||||
|
Operating losses carried forward
|
696
|
|
1,009
|
|
||
|
Intangible assets
|
4,812
|
|
5,199
|
|
||
|
8,987
|
|
6,208
|
|
|||
|
Deferred tax liabilities
|
||||||
|
Current:
|
||||||
|
Payables and accrued liabilities
|
—
|
|
109
|
|
||
|
—
|
|
109
|
|
|||
|
Non-current:
|
||||||
|
Property, plant and equipment
|
5
|
|
7
|
|
||
|
Deferred revenues
|
5,316
|
|
5,658
|
|
||
|
Warrant liability
|
—
|
|
386
|
|
||
|
Other
|
187
|
|
48
|
|
||
|
5,508
|
|
6,099
|
|
|||
|
5,508
|
|
6,208
|
|
|||
|
Deferred tax assets (liabilities), net
|
3,479
|
|
—
|
|
||
Significant components of unrecognized deferred tax assets are as follows:
|
December 31,
|
||||||
|
2017
|
2016
|
|||||
|
$
|
$
|
|||||
|
Deferred tax assets
|
||||||
|
Current:
|
||||||
|
Deferred revenues and other provisions
|
584
|
|
217
|
|
||
|
584
|
|
217
|
|
|||
|
Non-current:
|
||||||
|
Deferred Revenues
|
—
|
|
—
|
|
||
|
Operating losses carried forward
|
82,421
|
|
71,654
|
|
||
|
Research and development costs
|
9,167
|
|
9,195
|
|
||
|
Unused tax credits
|
8,019
|
|
8,019
|
|
||
|
Employee future benefits
|
2,296
|
|
2,275
|
|
||
|
Property, plant and equipment
|
407
|
|
175
|
|
||
|
Share issuance expenses
|
841
|
|
941
|
|
||
|
Onerous contract provisions
|
—
|
|
26
|
|
||
|
Intangible assets
|
—
|
|
189
|
|
||
|
Other
|
335
|
|
144
|
|
||
|
103,486
|
|
92,618
|
|
|||
|
Unrecognized deferred tax assets
|
104,070
|
|
92,835
|
|
||
138
|
Aeterna Zentaris Inc.
|
|
Notes to Consolidated Financial Statements
|
|
As at December 31, 2017 and December 31, 2016 and for the years ended December 31, 2017, 2016 and 2015
|
|
(tabular amounts in thousands of US dollars, except share/option/warrant and per share/option/warrant data and as otherwise noted)
|
As at
December 31, 2017
, amounts and expiry dates of tax attributes to be deferred for which no deferred tax asset was recognized were as follows:
|
Canada
|
||||||
|
Federal
|
Provincial
|
|||||
|
$
|
$
|
|||||
|
2028
|
6,429
|
|
5,043
|
|
||
|
2029
|
4,791
|
|
4,773
|
|
||
|
2030
|
4,104
|
|
4,089
|
|
||
|
2031
|
1,753
|
|
1,737
|
|
||
|
2032
|
4,250
|
|
4,250
|
|
||
|
2033
|
3,721
|
|
3,721
|
|
||
|
2034
|
4,153
|
|
4,153
|
|
||
|
2035
|
10,418
|
|
10,452
|
|
||
|
2036
|
10,592
|
|
10,592
|
|
||
|
2037
|
7,610
|
|
7,610
|
|
||
|
57,821
|
|
56,420
|
|
|||
The Company has estimated non-refundable R&D investment tax credits of approximately
$8,019,000
which can be carried forward to reduce Canadian federal income taxes payable and which expire at dates ranging from
2018
to
2037
. Furthermore, the Company has unrecognized tax assets in respect of operating losses to be carried forward in Germany and in the United States. The federal tax losses amount to approximately
$211,000,000
in Germany, for which there is no expiry date, and to
$2,165,000
in the United States, which expire as follows:
|
United States
|
|||
|
$
|
|||
|
2028
|
369
|
|
|
|
2029
|
178
|
|
|
|
2034
|
151
|
|
|
|
2035
|
447
|
|
|
|
2036
|
195
|
|
|
|
2037
|
825
|
|
|
|
2,165
|
|
||
The operating loss carryforwards and the tax credits claimed are subject to review, and potential adjustment, by tax authorities.
Other deductible temporary differences for which tax assets have not been booked are not subject to a time limit, except for share issuance expenses which are amortizable over five years.
21 Capital disclosures
The Company's objective in managing capital, consisting of shareholders' equity, with cash and cash equivalents and restricted cash equivalents being its primary components, is to ensure sufficient liquidity to fund R&D costs, selling expenses, G&A expenses and working capital requirements.
Over the past several years, the Company has raised capital via public equity offerings and issuances under various ATM sales programs as its primary source of liquidity, as discussed in
note 16 - Share capital
.
139
|
Aeterna Zentaris Inc.
|
|
Notes to Consolidated Financial Statements
|
|
As at December 31, 2017 and December 31, 2016 and for the years ended December 31, 2017, 2016 and 2015
|
|
(tabular amounts in thousands of US dollars, except share/option/warrant and per share/option/warrant data and as otherwise noted)
|
The capital management objective of the Company remains the same as that in previous periods. The policy on dividends is to retain cash to keep funds available to finance the activities required to advance the Company's product development portfolio and to pursue appropriate commercial opportunities as they may arise.
The Company is not subject to any capital requirements imposed by any regulators or by any other external source.
22 Financial instruments and financial risk management
Financial assets (liabilities) as at
December 31, 2017
and
December 31, 2016
are presented below.
|
December 31, 2017
|
Loans and
receivables |
Financial
liabilities at FVTPL |
Other
financial liabilities |
Total
|
|||||||
|
$
|
$
|
$
|
$
|
||||||||
|
Cash and cash equivalents (note 6)
|
7,780
|
|
—
|
|
—
|
|
7,780
|
|
|||
|
Trade and other receivables (note 8)
|
35
|
|
—
|
|
—
|
|
35
|
|
|||
|
Restricted cash equivalents
|
381
|
|
—
|
|
—
|
|
381
|
|
|||
|
Payables and accrued liabilities (note 12)
|
—
|
|
—
|
|
(2,689
|
)
|
(2,689
|
)
|
|||
|
Provision for restructuring costs (note 13)
|
—
|
|
—
|
|
(1,806
|
)
|
(1,806
|
)
|
|||
|
Warrant liability (note 14)
|
—
|
|
(3,897
|
)
|
—
|
|
(3,897
|
)
|
|||
|
8,196
|
|
(3,897
|
)
|
(4,495
|
)
|
(196
|
)
|
||||
|
December 31, 2016
|
Loans and receivables
|
Financial liabilities at FVTPL
|
Other financial liabilities
|
Total
|
||||||||
|
$
|
$
|
$
|
$
|
|||||||||
|
Cash and cash equivalents (note 6)
|
21,999
|
|
—
|
|
—
|
|
21,999
|
|
||||
|
Trade and other receivables (note 8)
|
235
|
|
—
|
|
—
|
|
235
|
|
||||
|
Restricted cash equivalents
|
496
|
|
—
|
|
—
|
|
496
|
|
||||
|
Payables and accrued liabilities (note 12)
|
—
|
|
—
|
|
(3,352
|
)
|
(3,352
|
)
|
||||
|
Provision for restructuring costs (note 13)
|
—
|
|
—
|
|
(33
|
)
|
(33
|
)
|
||||
|
Warrant liability (note 14)
|
—
|
|
(6,854
|
)
|
—
|
|
(6,854
|
)
|
||||
|
Other non-current liabilities (note 15)
|
—
|
|
—
|
|
(97
|
)
|
(97
|
)
|
||||
|
22,730
|
|
(6,854
|
)
|
(3,482
|
)
|
12,394
|
|
|||||
Fair value
The Black-Scholes valuation methodology uses "Level 2" inputs in calculating fair value, as defined in IFRS 13, which establishes a hierarchy that prioritizes the inputs used to measure fair value. The hierarchy gives the highest priority to unadjusted quoted prices in active markets for identical assets or liabilities (Level 1 measurement) and the lowest priority to unobservable inputs (Level 3 measurement). The input levels discussed in IFRS 13 are:
Level 1 – Unadjusted quoted prices in active markets for identical assets or liabilities.
Level 2 – Inputs other than quoted prices included within Level 1 that are observable for an asset or liability, either directly (i.e. prices) or indirectly (i.e. derived from prices).
Level 3 – Inputs for an asset or liability that are not based on observable market data (unobservable inputs).
140
|
Aeterna Zentaris Inc.
|
|
Notes to Consolidated Financial Statements
|
|
As at December 31, 2017 and December 31, 2016 and for the years ended December 31, 2017, 2016 and 2015
|
|
(tabular amounts in thousands of US dollars, except share/option/warrant and per share/option/warrant data and as otherwise noted)
|
The carrying values of the Company's cash and cash equivalents, trade and other receivables, restricted cash equivalents, payables and accrued liabilities, provision for restructuring costs and other non-current liabilities approximate their fair values due to their short-term maturities or to the prevailing interest rates of the related instruments, which are comparable to those of the market.
Financial risk factors
The following provides disclosures relating to the nature and extent of the Company's exposure to risks arising from financial instruments, including credit risk, liquidity risk and market risk (share price risk) and how the Company manages those risks.
(a) Credit risk
Credit risk is the risk of an unexpected loss if a customer or counterparty to a financial instrument fails to meet its contractual obligations. The Company regularly monitors credit risk exposure and takes steps to mitigate the likelihood of this exposure resulting in losses. The Company's exposure to credit risk currently relates to the loans and receivables in the table above. The Company holds its available cash in amounts that are readily convertible to known amounts of cash and deposits its cash balances with financial institutions that have an investment grade rating of at least
"P-2" or the equivalent. This information is supplied by independent rating agencies where available and, if not available, the Company uses publicly available financial information to ensure that it invests its cash in creditworthy and reputable financial institutions.
As at
December 31, 2017
, trade accounts receivable for an amount of approximately
$20,000
were with
three
counterparties, and
no
trade accounts receivable were past due and
none
were impaired.
Generally, the Company does not require collateral or other security from customers for trade accounts receivable; however, credit is extended following an evaluation of creditworthiness. In addition, the Company performs ongoing credit reviews of all of its customers and establishes an allowance for doubtful accounts when accounts are determined to be uncollectible.
The maximum exposure to credit risk approximates the amount recognized in the Company's consolidated statement of financial position.
(b) Liquidity risk
Liquidity risk is the risk that the Company will not be able to meet its financial obligations as they become due. As indicated in
note 21 - Capital disclosures
, the Company manages this risk through the management of its capital structure. It also manages liquidity risk by continuously monitoring actual and projected cash flows. The Board of Directors reviews and approves the Company's operating and capital budgets, as well as any material transactions occurring outside of the ordinary course of business. The Company has adopted an investment policy in respect of the safety and preservation of its capital to ensure the Company's liquidity needs are met. The instruments are selected with regard to the expected timing of expenditures and prevailing interest rates.
On December 20, 2017, the FDA granted marketing approval for Macrilen™ (macimorelin) to be used in the diagnosis of patients with AGHD. On January 16, 2018, the Company, through AEZS Germany entered into the Strongbridge License Agreement.
The Strongbridge License Agreement will contribute to fulfilling the Company's future obligations (see note 26 - Subsequent events).
(c) Market risk
Share price risk
The change in fair value of the Company's warrant liability, which is measured at FVTPL, results from the periodic "mark-to-market" revaluation, via the application of option pricing models, of currently outstanding share purchase warrants. These valuation models are impacted, among other inputs, by the market price of the Company's common shares. As a result, the change in fair value of the warrant liability, which is reported in the consolidated statements
141
|
Aeterna Zentaris Inc.
|
|
Notes to Consolidated Financial Statements
|
|
As at December 31, 2017 and December 31, 2016 and for the years ended December 31, 2017, 2016 and 2015
|
|
(tabular amounts in thousands of US dollars, except share/option/warrant and per share/option/warrant data and as otherwise noted)
|
of comprehensive loss, has been and may continue in future periods to be materially affected most notably by changes in the Company's common share closing price, which on the NASDAQ ranged from
$0.84
to
$3.65
during the year ended
December 31, 2017
.
If variations in the market price of our common shares of -
30%
and +
30%
were to occur, the impact on the Company's net loss related to the warrant liability held at
December 31, 2017
would be as follows:
|
Carrying
amount |
-30%
|
+30%
|
|||||||
|
$
|
$
|
$
|
|||||||
|
Warrant liability
|
3,897
|
|
1,359
|
|
(1,474
|
)
|
|||
|
Total impact on net loss – decrease / (increase)
|
1,359
|
|
(1,474
|
)
|
|||||
23 Segment information
The Company operates in a single operating segment, being the biopharmaceutical segment.
Geographical information
Revenues by geographical area are detailed as follows:
|
Years ended December 31,
|
|||||||||
|
2017
|
2016
|
2015
|
|||||||
|
$
|
$
|
$
|
|||||||
|
United States
|
452
|
|
410
|
|
217
|
|
|||
|
China
|
262
|
|
249
|
|
302
|
|
|||
|
Singapore
|
—
|
|
101
|
|
—
|
|
|||
|
British Virgin Islands
|
206
|
|
100
|
|
—
|
|
|||
|
Switzerland
|
—
|
|
—
|
|
312
|
|
|||
|
Other
|
3
|
|
51
|
|
45
|
|
|||
|
923
|
|
911
|
|
876
|
|
||||
|
Amounts presented:
|
|||||||||
|
Within discontinued operations
|
—
|
|
—
|
|
331
|
|
|||
|
Within continuing operations
|
923
|
|
911
|
|
545
|
|
|||
|
923
|
|
911
|
|
876
|
|
||||
Revenues have been allocated to geographic regions based on the country of residence of the Company's external customers or licensees.
Non-current assets* by geographical area are detailed as follows:
|
December 31,
|
||||||
|
2017
|
2016
|
|||||
|
$
|
$
|
|||||
|
Germany
|
8,792
|
|
7,793
|
|
||
|
United States
|
2
|
|
2
|
|
||
|
Canada
|
10
|
|
32
|
|
||
|
8,804
|
|
7,827
|
|
|||
|
*
|
Non-current assets include property, plant and equipment, identifiable intangible assets and goodwill.
|
142
|
Aeterna Zentaris Inc.
|
|
Notes to Consolidated Financial Statements
|
|
As at December 31, 2017 and December 31, 2016 and for the years ended December 31, 2017, 2016 and 2015
|
|
(tabular amounts in thousands of US dollars, except share/option/warrant and per share/option/warrant data and as otherwise noted)
|
Major customers representing
10%
or more of the Company's revenues in each of the last
three
years are as follows:
|
Years ended December 31,
|
|||||||||
|
2017
|
2016
|
2015
|
|||||||
|
$
|
$
|
$
|
|||||||
|
Company 1*
|
—
|
|
—
|
|
312
|
|
|||
|
Company 2
|
—
|
|
20
|
|
217
|
|
|||
|
Company 3
|
262
|
|
249
|
|
302
|
|
|||
|
Company 4
|
323
|
|
222
|
|
—
|
|
|||
|
Company 5
|
129
|
|
167
|
|
—
|
|
|||
|
Company 6
|
—
|
|
101
|
|
—
|
|
|||
|
Company 7
|
206
|
|
100
|
|
—
|
|
|||
*Related to Cetrotide
®
(discontinued operations).
24 Net loss per share
The following table sets forth pertinent data relating to the computation of basic and diluted net (loss) income per share attributable to common shareholders.
|
Years ended December 31,
|
|||||||||
|
2017
|
2016
|
2015
|
|||||||
|
$
|
$
|
$
|
|||||||
|
Net loss from continuing operations
|
(16,796
|
)
|
(24,959
|
)
|
(50,228
|
)
|
|||
|
Net income from discontinued operations
|
—
|
|
—
|
|
85
|
|
|||
|
Net loss
|
(16,796
|
)
|
(24,959
|
)
|
(50,143
|
)
|
|||
|
Basic and diluted weighted average number of shares outstanding
|
14,958,704
|
|
10,348,879
|
|
2,763,603
|
|
|||
|
Items excluded from the calculation of diluted net loss per share because the exercise price was greater than the average market price of the common shares or due to their anti-dilutive effect
|
|
|
|
||||||
|
Stock options
|
713,918
|
|
968,397
|
|
276,661
|
|
|||
|
Share purchase warrants
|
3,417,840
|
|
3,779,245
|
|
2,842,309
|
|
|||
Net loss per share is calculated by dividing net loss by the weighted average number of shares outstanding during the relevant period. Diluted weighted average number of shares reflects the dilutive effect of equity instruments, such as any "in the money" stock options and share purchase warrants. In periods with reported net losses, all stock options and share purchase warrants are deemed anti-dilutive such that basic net loss per share and diluted net loss per share are equal, and thus "in the money" stock options and share purchase warrants have not been included in the computation of net loss per share because to do so would be anti-dilutive.
25 Commitments and contingencies
The Company is committed to various operating leases for its premises. Expected future minimum lease payments, which also include future payments in connection with utility service agreements and future minimum sublease receipts under non-cancellable operating leases (subleases), as well as future payments in connection with service and manufacturing agreements, as at
December 31, 2017
are as follows:
143
|
Aeterna Zentaris Inc.
|
|
Notes to Consolidated Financial Statements
|
|
As at December 31, 2017 and December 31, 2016 and for the years ended December 31, 2017, 2016 and 2015
|
|
(tabular amounts in thousands of US dollars, except share/option/warrant and per share/option/warrant data and as otherwise noted)
|
|
Minimum lease payments
|
Minimum sublease receipts
|
Service and manufacturing
|
|||||||
|
$
|
$
|
$
|
|||||||
|
Less than 1 year
|
448
|
|
(143
|
)
|
403
|
|
|||
|
1 - 3 years
|
633
|
|
(26
|
)
|
283
|
|
|||
|
4 - 5 years
|
105
|
|
—
|
|
259
|
|
|||
|
More than 5 years
|
100
|
|
—
|
|
250
|
|
|||
|
Total
|
1,286
|
|
(169
|
)
|
1,195
|
|
|||
Contingencies
In the normal course of operations, the Company may become involved in various claims and legal proceedings related to, for example, contract terminations and employee-related and other matters. No accruals have been recorded as at
December 31, 2017
or
2016
.
Class Action Lawsuit
The Company and certain of its former officers are defendants in a putative class action lawsuit brought on behalf of shareholders of the Company. The pending lawsuit is the result of the consolidation of several lawsuits, the first of which was filed on
November 11, 2014
. The plaintiffs filed their amended consolidated complaint on
April 10, 2015
. The amended complaint alleged violations of the Securities Exchange Act of 1934 in connection with allegedly false and misleading statements made by the defendants between
August 30, 2011
and
November 6, 2014
(the "Class Period"), regarding the safety and efficacy of Macrilen™ and the prospects for the approval of the Company's new drug application for the product by the FDA. The plaintiffs seek to represent a class comprised of purchasers of the Company's common shares during the Class Period and seek unspecified damages, costs and expenses and such other relief as determined by the Court.
On March 2, 2015, the lawsuits were consolidated into one class action, and a Lead Plaintiff and Lead Counsel were appointed. On April 10, 2015, Lead Plaintiff filed an Amended Complaint. On May 26, 2015, the Company filed a motion to dismiss the class action.
On
September 14, 2015
, the Court dismissed the lawsuit, but granted the plaintiffs leave to amend. In dismissing the lawsuit, the Court affirmed that the plaintiffs had failed to state a claim. On
October 14, 2015
, the plaintiffs filed a
second
amended complaint. The Company subsequently filed a motion to dismiss the
second
amended complaint. On
March 2, 2016
, the Court issued an order granting the Company's motion to dismiss the complaint in part and denying it in part. The Court dismissed certain of the Company's former officers from the lawsuit. The Court allowed the claim that the Company misrepresented and omitted material facts from its public statements during the Class Period to proceed against the Company and its former CEO, who departed in
2013
, while dismissing such claims against other former officers. The Court also allowed a claim for "controlling person" liability to proceed against certain former officers.
The Company filed a motion for reconsideration of the Court's March 2, 2016 order on March 16, 2016 and filed an answer to the second amended complaint on April 6, 2016. On June 30, 2016, the Court issued an order denying the Company's motion for reconsideration. Lead Plaintiffs filed a motion for class certification on May 8, 2017, on which a hearing was held on July 20, 2017. The court granted the motion for class certification on February 28, 2018, which we appealed. We filed an interlocutory petition for review on March 14, 2018. Lead Plaintiff’s opposition to the petition was due on Monday, March 26, 2018.
144
|
Aeterna Zentaris Inc.
|
|
Notes to Consolidated Financial Statements
|
|
As at December 31, 2017 and December 31, 2016 and for the years ended December 31, 2017, 2016 and 2015
|
|
(tabular amounts in thousands of US dollars, except share/option/warrant and per share/option/warrant data and as otherwise noted)
|
The Company's directors' and officers' insurance policies ("D&O Insurance") provide for reimbursement of certain costs and expenses incurred in connection with the defense of this lawsuit, including legal and professional fees, as well as other loss (damages, settlements, and judgments), if any, subject to certain policy exclusions, restrictions, limits, deductibles and other terms. The Company believes that the D&O Insurance applies to the purported class-action lawsuit; however, the insurers have issued standard reservations of rights letters reserving all rights under the D&O Insurance. Legal and professional fees are expensed as incurred, and no reserve is established for them. During the
second
quarter of
2016
, the Company exceeded the deductible amount applicable to this claim. Therefore, the Company believes that the insurers will bear most of the costs for the Company's defense in future periods, subject to the Company's policy limits.
While the Company believes that it has meritorious defenses and intends to defend this lawsuit vigorously, management cannot currently predict the outcome of this suit or reasonably estimate any potential loss that may result from this suit. Accordingly, the Company has not recorded any liability related to the lawsuit. No assurance can be given with respect to the ultimate outcome of such proceedings, and the Company could incur substantial unreimbursed legal fees, damages, settlements, judgments, and other expenses in connection with these proceedings that may not qualify for coverage under, or may exceed the limits of, its applicable D&O Insurance and could have a material adverse impact on the Company's financial condition, results of operations, liquidity and cash flows.
Other lawsuits
In late July 2017, the Company terminated for cause the employment agreement of Mr. David A. Dodd, the former President and Chief Executive Officer and it also terminated the employment of Mr. Philip A. Theodore, the former Senior Vice President, Chief Administrative Officer, General Counsel and Corporate Secretary. All outstanding stock options held by both former officers were cancelled effective as of their respective termination dates, in accordance with the provisions of the Company's Stock Option Plan.
On August 3, 2017, the Company announced that it had filed a lawsuit against both Messrs. Dodd and Theodore for damages suffered by the Company for breach of confidence and/or breach of fiduciary duty in an amount to be determined prior to trial. The Company is also seeking, among other things, an injunction to prevent both Messrs. Dodd and Theodore (i) from continuing to use the Company's confidential and proprietary information without authorization and (ii) from mounting a proxy contest that will be premised upon the breaches of fiduciary and statutory duties and breaches of confidence alleged in the lawsuit. The Company engaged external counsel to conduct an internal investigation related to this lawsuit, which is still ongoing.
On December 21, 2017, Messrs. Dodd and Theodore brought a counterclaim against the Company and its Chair, Carolyn Egbert, in the amount of CAN$6.0 million alleging, among other things, that defamatory statements were made against Messrs. Dodd and Theodore. The Company and its Chair consider the counterclaim against them to be entirely without merit, and intend to vigorously defend against the counterclaim.
In August 2017, Mr. Dodd filed a lawsuit in the Court of Common Pleas of South Carolina against the Company for damages of approximately $1.7 million. He is also requesting that all of his outstanding stock options vest effective upon his termination date. The Company cannot predict at this time the final outcome or potential losses, if any, with respect to this lawsuit.
Cogas Consulting, LLC ("Cogas") filed a lawsuit against the Company in state court in Fulton County, Georgia on February 2, 2018. Cogas alleges that its employee (and sole shareholder) John Sharkey is entitled to a "success fee" commission on the Strongbridge License Agreement. Cogas is claiming damages in the form of a lost commission on the transaction. Cogas claims its commission is 5% on payments the Company receives within the first three years after January 14, 2018. Cogas alleges it is entitled to 5% of the $24 million Strongbridge already paid the Company, plus 5% of any royalty Strongbridge pays the Company through January 17, 2021. The Company plans to vigorously defend this matter.
145
|
Aeterna Zentaris Inc.
|
|
Notes to Consolidated Financial Statements
|
|
As at December 31, 2017 and December 31, 2016 and for the years ended December 31, 2017, 2016 and 2015
|
|
(tabular amounts in thousands of US dollars, except share/option/warrant and per share/option/warrant data and as otherwise noted)
|
26 Subsequent events
On January 16, 2018, the Company through AEZS Germany entered into the Strongbridge License Agreement. The Company received an upfront cash payment of
$24,000,000
from Strongbridge, and, for as long as Macrilen™ (macimorelin) is patent-protected, the Company will be entitled to a
15%
royalty on net sales up to
$75,000,000
and an
18%
royalty on net sales above
$75,000,000
. Following the end of patent protection in United States or Canada for Macrilen™ (macimorelin), the Company will be entitled to a
5%
royalty on net sales in that country. In addition, the Company will also receive one-time payments from Strongbridge following the first achievement of the following commercial milestone events:
•
$4,000,000
on achieving
$25,000,000
annual net sales,
•
$10,000,000
on achieving
$50,000,000
annual net sales,
•
$20,000,000
on achieving
$100,000,000
annual net sales,
•
$40,000,000
on achieving
$200,000,000
annual net sales, and
•
$100,000,000
on achieving
$500,000,000
annual net sales.
Upon approval by the FDA of a pediatric indication for Macrilen™ (macimorelin), the Company will receive a one-time milestone payment of
$5,000,000
from Strongbridge.
Strongbridge will fund
70%
of the costs of a worldwide pediatric development program to be run by the Company with customary oversight from a joint steering committee. The joint steering committee will be comprised of four persons, two of whom will be appointed by each of Strongbridge and the Company.
146
|
Item 19.
|
Exhibits
|
Exhibit Index
|
1.1
|
||
|
1.2
|
||
|
1.3
|
||
|
1.4
|
||
|
2.1
|
||
|
4.1
|
||
|
4.2
|
||
|
4.3
|
||
|
4.4
|
||
|
4.5
|
||
|
4.6
|
||
|
4.7
|
||
|
4.8
|
||
|
4.9
|
||
|
4.10
|
||
|
4.11
|
||
|
8.1
|
||
|
11.1
|
||
|
11.2
|
||
|
11.3
|
||
|
12.1
|
||
|
12.2
|
||
|
13.1
|
||
|
13.2
|
||
|
15.1
|
||
101. INS XBRL Instance Document
101. SCH XBRL Taxonomy Extension Schema
101. CAL XBRL Taxonomy Extension Schema Calculation Linkbase
101. DEF XBRL Taxonomy Extension Schema Definition Linkbase
101. LAB XBRL Taxonomy Extension Schema Label Linkbase
101. PRE XBRL Taxonomy Extension Schema Presentation Linkbase
147
SIGNATURES
The registrant hereby certifies that it meets all of the requirements for filing on Form 20-F and that it has duly caused and authorized the undersigned to sign this annual report on its behalf.
|
AETERNA ZENTARIS INC.
|
|
/s/ Michael V. Ward
|
|
Michael V. Ward
|
|
President and Chief Executive Officer
|
Date:
March 27, 2018
148
TABLE OF CONTENTS
Part IItem 1. Identity Of Directors, Senior Management and AdvisersItem 2. Offer Statistics and Expected TimetableItem 3. Key InformationItem 4. Information on The CompanyItem 4A Unresolved Staff CommentsItem 5. Operating and Financial Review and ProspectsItem 6. Directors, Senior Management and EmployeesItem 7. Major Shareholders and Related Party TransactionsItem 8. Financial InformationItem 9. The Offer and ListingItem 10. Additional InformationItem 11. Quantitative and Qualitative Disclosures About Market RiskNote 21 - Capital DisclosuresItem 12. Description Of Securities Other Than Equity SecuritiesPart IIItem 13. Defaults, Dividend Arrearages and DelinquenciesItem 14. Material Modifications To The Rights Of Security Holders and Use Of ProceedsItem 15. Controls and ProceduresItem 16A. Audit Committee Financial ExpertItem 16B. Code Of EthicsItem 16C. Principal Accountant Fees and ServicesItem 16D. Exemptions From The Listing Standards For Audit CommitteesItem 16E. Purchases Of Equity Securities By The Issuer and Affiliated PurchasersItem 16F. Change in Registrant's Certifying AccountantItem 16G. Corporate GovernanceItem 16H. Mine Safety DisclosurePart IIIItem 17 Financial StatementsItem 18. Financial StatementsNote 1 - Business OverviewNote 16 - Share CapitalNote 3 - Critical Accounting Estimates and JudgmentsNote 14 - Warrant LiabilityNote 18 - Employee Future BenefitsNote 20 - Income TaxesNote 5 - Deferred RevenuesNote 22 - Financial Instruments and Financial Risk ManagementItem 19. Exhibits