CISCO SYSTEMS, INC.
10-Ks and 10-Qs
|
|
|
|
|
|
|
|
|
|
|
|
|
|
|
|
|
|
|
|
|
|
|
|
|
|
|
|
|
|
|
|
|
|
|
|
|
|
|
|
|
|
|
|
|
|
|
|
|
|
|
|
|
|
|
|
UNITED STATES SECURITIES AND EXCHANGE COMMISSION
WASHINGTON, D.C. 20549
_____________________________________
FORM 10-K
(Mark one)
|
x
|
ANNUAL REPORT PURSUANT TO SECTION 13 OR 15(d) OF THE SECURITIES EXCHANGE ACT OF 1934
For the fiscal year ended July 26, 2014
|
or
|
o
|
TRANSITION REPORT PURSUANT TO SECTION 13 OR 15(d) OF THE SECURITIES EXCHANGE ACT OF 1934
For the transition period from ____ to ____
|
Commission file number 0-18225
_____________________________________

CISCO SYSTEMS, INC.
(Exact name of Registrant as specified in its charter)
|
California
|
|
77-0059951
|
|
(State or other jurisdiction of
incorporation or organization)
|
|
(IRS Employer
Identification No.)
|
|
170 West Tasman Drive
San Jose, California
|
|
95134-1706
|
|
(Address of principal executive offices)
|
|
(Zip Code)
|
Securities registered pursuant to Section 12(b) of the Act:
|
Title of Each Class:
|
|
Name of Each Exchange on which Registered
|
|
Common Stock, par value $0.001 per share
|
|
The NASDAQ Stock Market LLC
|
Securities registered pursuant to Section 12(g) of the Act: None
_____________________________________
Indicate by check mark if the registrant is a well-known seasoned issuer, as defined in Rule 405 of the Securities Act.
x
Yes
o
No
Indicate by check mark if the registrant is not required to file reports pursuant to Section 13 or Section 15(d) of the Act.
o
Yes
x
No
Indicate by check mark whether the registrant (1) has filed all reports required to be filed by Section 13 or 15(d) of the Securities Exchange Act of 1934 during the preceding 12 months (or for such shorter period that the registrant was required to file such reports), and (2) has been subject to such filing requirements for the past 90 days.
x
Yes
o
No
Indicate by check mark whether the registrant has submitted electronically and posted on its corporate Web site, if any, every Interactive Data File required to be submitted and posted pursuant to Rule 405 of Regulation S-T (§232.405 of this chapter) during the preceding 12 months (or for such shorter period that the registrant was required to submit and post such files).
x
Yes
o
No
Indicate by check mark if disclosure of delinquent filers pursuant to Item 405 of Regulation S-K is not contained herein, and will not be contained to the best of registrant’s knowledge, in definitive proxy or information statements incorporated by reference in Part III of this Form 10-K or any amendment to this Form 10-K.
x
Indicate by check mark whether the registrant is a large accelerated filer, an accelerated filer, a non-accelerated filer, or a smaller reporting company. See definitions of “large accelerated filer,” “accelerated filer” and “smaller reporting company” in Rule 12b-2 of the Exchange Act.
|
Large accelerated filer
|
|
x
|
|
Accelerated filer
|
|
o
|
|
|
Non-accelerated filer
|
o
|
(Do not check if a smaller reporting company)
|
|
Smaller reporting company
|
|
o
|
|
Indicate by check mark whether the registrant is a shell company (as defined in Rule 12b-2 of the Exchange Act).
o
Yes
x
No
Aggregate market value of registrant’s common stock held by non-affiliates of the registrant, based upon the closing price of a share of the registrant’s common stock on
January 24, 2014
as reported by the NASDAQ Global Select Market on that date:
$114,846,004,146
Number of shares of the registrant’s common stock outstanding as of
September 4, 2014
:
5,099,203,169
____________________________________
DOCUMENTS INCORPORATED BY REFERENCE
Portions of the registrant’s Proxy Statement relating to the registrant’s
2014
Annual Meeting of Shareholders, to be held on November 20, 2014, are incorporated by reference into Part III of this Annual Report on Form 10-K where indicated.
1
|
PART I
|
||||
|
Item 1.
|
||||
|
Item 1A.
|
||||
|
Item 1B.
|
||||
|
Item 2.
|
||||
|
Item 3.
|
||||
|
Item 4.
|
||||
|
PART II
|
||||
|
Item 5.
|
||||
|
Item 6.
|
||||
|
Item 7.
|
||||
|
Item 7A.
|
||||
|
Item 8.
|
||||
|
Item 9.
|
||||
|
Item 9A.
|
||||
|
Item 9B.
|
||||
|
PART III
|
||||
|
Item 10.
|
||||
|
Item 11.
|
||||
|
Item 12.
|
||||
|
Item 13.
|
||||
|
Item 14.
|
||||
|
PART IV
|
||||
|
Item 15.
|
||||
2
This Annual Report on Form 10-K, including the “Management’s Discussion and Analysis of Financial Condition and Results of Operations,” contains forward-looking statements regarding future events and our future results that are subject to the safe harbors created under the Securities Act of 1933 (the “Securities Act”) and the Securities Exchange Act of 1934 (the “Exchange Act”). All statements other than statements of historical facts are statements that could be deemed forward-looking statements. These statements are based on current expectations, estimates, forecasts, and projections about the industries in which we operate and the beliefs and assumptions of our management. Words such as “expects,” “anticipates,” “targets,” “goals,” “projects,” “intends,” “plans,” “believes,” “seeks,” “estimates,” “continues,” “endeavors,” “strives,” “may,” variations of such words, and similar expressions are intended to identify such forward-looking statements. In addition, any statements that refer to projections of our future financial performance, our anticipated growth and trends in our businesses, and other characterizations of future events or circumstances are forward-looking statements. Readers are cautioned that these forward-looking statements are only predictions and are subject to risks, uncertainties, and assumptions that are difficult to predict, including those identified below, under “Item 1A. Risk Factors,” and elsewhere herein. Therefore, actual results may differ materially and adversely from those expressed in any forward-looking statements. We undertake no obligation to revise or update any forward-looking statements for any reason.
|
Item 1.
|
Business
|
General
We design, manufacture, and sell Internet Protocol (IP) based networking products and services related to the communications and information technology (IT) industry. Our customers include businesses of all sizes, public institutions, telecommunications companies, other service providers and individuals. We connect people, process, data and things with products that transport data, voice, and video within buildings, across campuses, and around the world. We are a key strategic partner to companies that helps them as they seek to make the most of the Internet of Everything (IoE) and connect the unconnected.
We conduct our business globally and manage our business by geography. Our business is organized into the following three geographic segments: The Americas; Europe, Middle East, and Africa (EMEA); and Asia Pacific, Japan, and China (APJC). For revenue and other information regarding these segments, see Note 17 to the Consolidated Financial Statements.
We were incorporated in California in December 1984, and our headquarters are in San Jose, California. The mailing address of our headquarters is 170 West Tasman Drive, San Jose, California 95134-1706, and our telephone number at that location is (408) 526-4000. Our website is www.cisco.com. Through a link on the Investor Relations section of our website, we make available the following filings as soon as reasonably practicable after they are electronically filed with or furnished to the Securities and Exchange Commission (SEC): our Annual Report on Form 10-K, Quarterly Reports on Form 10-Q, Current Reports on Form 8-K, and any amendments to those reports filed or furnished pursuant to Section 13(a) or 15(d) of the Exchange Act. All such filings are available free of charge. The information posted on our website is not incorporated into this report.
As part of our business focus on the network as the platform for all forms of communications and IT, our products and services are designed to help our customers use technology to address their business imperatives and opportunities—driving growth, improving productivity, reducing costs, mitigating risk, and gaining a competitive advantage. We deliver networking products and solutions designed to simplify and secure customers’ network infrastructures and help them connect more effectively with their key stakeholders, including their customers, prospects, business partners, suppliers, and employees. We continually focus on delivering products and solutions that leverage the network to most effectively address market transitions. In recent periods, we have developed and delivered products and services to address the transitions driven by virtualization, cloud, software, collaboration, and video. Our products and technologies are grouped into the following categories: Switching; Next-Generation Network (NGN) Routing; Service Provider Video; Collaboration; Data Center; Wireless; Security; and Other Products. We believe that integrating products and services into architectures and solutions helps our customers reduce their operational complexity, increase their agility, and reduce their total cost of network ownership.
Network architectures, developed from our core routing and switching technologies, are evolving to accommodate the demands of increasing numbers of users, network applications, and new network-related markets. These new markets are a natural extension of our core business and have emerged as the network has become the platform for provisioning, integrating, and delivering an ever-increasing array of IT-based products and services.
1
Strategy and Focus Areas
Our strategy is to deliver the integrated architectures, solutions, and outcomes to help our customers grow, manage costs, and mitigate risk. We see our customers, in almost every industry, becoming increasingly reliant on technology—and specifically the network—to meet their business objectives and compete successfully in the market.
Our focus continues to be on capitalizing on market transitions to maintain leadership in our core markets and to enter new markets where the network is foundational. We believe this focus best positions us to become a more relevant and trusted partner to our customers and to expand our share of our customers’ IT spending. We are focused on driving the innovation, speed, agility, and efficiencies in our company required to deliver leading technology solutions for our customers and shareholder value for our investors.
Over the last few years, we have been working to transform our business to move from selling individual products and services to selling products and services integrated into architectures and solutions, as well as to meet customers' business outcomes. As a part of this transformation, we are making changes to how we are organized and how we deliver our technology. We believe these changes enable us to better meet our customers’ requirements and help them stay ahead of market transitions.
As part of the ongoing transformation of our business, we continue to drive product transitions in our core business, including the introduction of next-generation products with better price-performance and architectural advantages compared with both our prior generation of products and the product offerings of our competitors. We believe that many of these product transitions are gaining momentum based on the strong year-over-year product revenue growth in certain of the new products, but we do continue to manage through the transitions of several of our existing key product platforms, and we continue to see the impact thereof on our overall core performance. Going forward, a focus on utilizing our core products within the integrated solutions that we provide customers to meet their business outcomes will be a critical part of our strategy.
In our view our routing and switching product leadership has been foundational to our success in the data center market. We initially captured the market transition to converged infrastructure, bringing together networking, compute, and storage into one integrated architecture with the Unified Computing System (UCS). We continue to expand the opportunity relating to UCS, including incorporating the UCS solution within our solutions for cloud and virtualization. We believe that disruption in the enterprise data center market is accelerating, due to changing technology trends that, we believe, depend on an intelligent network—trends such as network virtualization, cloud, and the increased demands of applications. To take advantage of our position in our customers' network infrastructure, we are implementing strategies and offering strong products to address each of these major transitions, including:
|
•
|
Virtualization, which we refer to as the process of creating a virtual, or nonphysical, version of a device or resource, such as a server, storage device, network, or operating system, in such a way that users as well as other devices and resources are able to interact with the virtual resource as if it were an actual physical resource.
|
|
•
|
The cloud, which we refer to as an IT hosting and delivery system in which resources, such as servers or software applications, are no longer tethered to a user’s physical infrastructure but instead are delivered to and consumed by the user “on demand” as an Internet-based service, whether singularly or with multiple other users simultaneously.
|
We also remain focused on continued investment in our services portfolio, tightly integrated with our product portfolio, to deliver the solutions our customers want. A few examples of new service offerings include security services, cloud and managed services and consulting services.
Among our other areas of focus are:
|
•
|
Our security products, where we are seeing strong momentum as we integrate our recently acquired Sourcefire, Inc. ("Sourcefire") portfolio into an integrated security architecture
|
|
•
|
Our collaboration products, where we have recently introduced an entirely new portfolio of products designed to deliver a much richer experience at much lower price points
|
|
•
|
Our wireless products, where we are seeing strong growth of our cloud networking business, which we acquired from Meraki, Inc.
|
|
•
|
Our software offerings, where we are focused on delivering our technology and solutions via new license models by which we seek to increase our recurring revenue
|
2
Market Transitions
We continue to seek to capitalize on market transitions as sources of future revenue opportunities as part of the continued transformation of our business, and we believe market transitions in the IT industry are occurring with greater frequency. Market transitions relating to the network are becoming, in our view, more significant as intelligent networks have moved from being a cost center issue—where the focus is on reducing network operating costs and increasing network-related productivity—to becoming a platform for revenue generation, business agility, and competitive advantage.
We believe that that the next wave of dramatic Internet growth will come through the confluence of people, process, data, and things, which we refer to as the IoE. We believe that IoE, by bringing “everything” online, will create significant opportunities for businesses, governments and other organizations to obtain greater value from networked connections. IoE is being driven by several factors. Along with the anticipated proliferation in the number of network-connected things, we believe customers are seeing that significant technology trends and advances make it possible to realize more value from connectedness. IoE also reflects the ability to create intelligence—and capture intelligence faster—from these connections, which is why we believe that IoE has the potential to be a pivotal market transition that can offer significant economic and societal benefits on a global basis. Helping our customers take advantage of IoE, in our view, requires enabling them to address several of the other major technology transitions driving the IoE, such as virtualization, application centricity, cloud, and mobility. We believe our customers need a new model for IT that addresses the requirements that these transitions place on IT. We call this model that unifies infrastructure, platform, and applications "Fast IT." By delivering architectures and solutions based on Fast IT, we aim to help our customers reduce complexity, accelerate service deployment, and increase security in a world that is increasingly virtualized, application centric, cloud-based, and mobile.
Virtualization/Application Centricity
We are also focusing on a market transition involving the move toward more programmable, flexible, and virtual networks, sometimes called software defined networking, or SDN. This transition is focused on moving from a hardware-centric approach for networking to a virtualized network environment that is designed to enable flexible, application-driven customization of network infrastructures. We believe the successful products and solutions in this market will combine application-specific integrated circuits (ASICs) with hardware and software elements together to meet customers’ total cost of ownership, quality, security, scalability, and experience requirements. In our view, there is no single architecture that supports all customer requirements in this area.
We believe the promise of SDN is to enable more open and programmable network infrastructure. We are addressing this opportunity with a unique strategy and set of solutions that is designed to address the application demands transition and offers a holistic approach to the future of networking that responds automatically to the needs of applications. We introduced and began shipping our Application Centric Infrastructure (ACI), which delivers centralized application-driven policy automation, management, and visibility of both physical and virtual environments as a single system. ACI is comprised of our Nexus 9000 portfolio of switches, enhanced versions of our NX-OS operating system, and the Application Policy Infrastructure Controller (APIC), which provides a central place to configure, automate, and manage an entire network, based on the needs of applications.
Cloud
Our Intercloud strategy seeks to leverage our application centric infrastructure together with our partners to deliver, we believe, the first global open network of highly secure hybrid cloud environments. We believe that customers and partners view our approach to the cloud as differentiated and unique, recognizing that we offer a solution to federated, private, hybrid, and public clouds that enables them to move their cloud workloads across heterogeneous private and public clouds with the necessary policy, security, and management features. With our InterCloud solution, we aim to build upon the leadership we have established in the private cloud market and as a cloud infrastructure provider.
For a discussion of the risks associated with our strategy, see “Item 1A. Risk Factors,” including the risk factor entitled “We depend upon the development of new products and enhancements to existing products, and if we fail to predict and respond to emerging technological trends and customers’ changing needs, our operating results and market share may suffer.” For information regarding sales of our major products and services, see Note 17 to the Consolidated Financial Statements.
3
Products and Services
Our current offerings fall into several categories:
Switching
Switching is an integral networking technology used in campuses, branch offices, and data centers. Switches are used within buildings in local-area networks (LANs) and across great distances in wide-area networks (WANs). Our switching products offer many forms of connectivity to end users, workstations, IP phones, wireless access points, and servers and also function as aggregators on LANs and WANs. Our switching systems employ several widely used technologies, including Ethernet, Power over Ethernet, Fibre Channel over Ethernet (FCoE), Packet over Synchronous Optical Network, and Multiprotocol Label Switching. Many of our switches are designed to support an integrated set of advanced services, allowing organizations to be more efficient by using one switch for multiple networking functions rather than multiple switches to accomplish the same functions. Key product platforms within our Switching product category, in which we also include storage products, are as follows:
|
Fixed-Configuration Switches
|
Modular Switches
|
Storage
|
||
|
Cisco Catalyst Series:
|
Cisco Catalyst Series:
|
Cisco MDS Series:
|
||
|
• Cisco Catalyst 2960-X Series
|
• Cisco Catalyst 4500-E Series
|
• Cisco MDS 9000
|
||
|
• Cisco Catalyst 3650 Series
|
• Cisco Catalyst 6500-E Series
|
|||
|
• Cisco Catalyst 3850 Series
|
• Cisco Catalyst 6800 Series
|
|||
|
• Cisco Catalyst 4500-X Series
|
||||
|
Cisco Nexus Series:
|
Cisco Nexus Series:
|
|||
|
• Cisco Nexus 2000 Series
|
• Cisco Nexus 7000 Series
|
|||
|
• Cisco Nexus 3000 Series
|
• Cisco Nexus 9000 Series
|
|||
|
• Cisco Nexus 5000 Series
|
||||
|
• Cisco Nexus 6000 Series
|
||||
Fixed-configuration switches
are designed to cover a range of deployments in both large enterprises as well as in small and medium-sized businesses, providing a foundation for converged data, voice, and video services. Our fixed configuration switches range from small, standalone switches to stackable models that function as a single, scalable switching unit.
Modular switches are typically used by enterprise and service provider customers with large-scale network needs. These products are designed to offer customers the flexibility and scalability to deploy numerous, as well as advanced, networking services without degrading overall network performance.
Fixed-configuration and modular switches also include products such as optics modules, which are shared across multiple product platforms.
Our switching portfolio also includes virtual switches and related offerings. These products provide switching functionality for virtual machines and are designed to operate in a complementary fashion with virtual services to optimize security and application behavior.
During fiscal 2014, we continued to see increased market acceptance of switches we introduced in the previous fiscal year, including our Cisco Catalyst 2960-X, Cisco Catalyst 3850 and Cisco Catalyst 6800 Series switches. We announced our application-centric-infrastructure solution, Cisco ACI, in fiscal 2014. Cisco ACI consists of the new Cisco Nexus 9000 Series Switches, a Cisco Application Policy Infrastructure Controller (APIC) and accompanying centralized policy management capability, a Cisco Application Virtual Switch (AVS), integrated physical and virtual infrastructure, and an open ecosystem of network, storage, management, and orchestration vendors. Key characteristics of Cisco ACI include simplified automation by an application-driven policy model, centralized visibility and vigilance with real-time application monitoring, open software flexibility for development and operations teams and ecosystem partner integration capability, and scalable performance in hardware.
Individually, our switching suite of products is designed to offer the performance and features required for nearly any deployment, from traditional small workgroups, wiring closets, and network cores to highly virtualized and converged corporate data centers. Working together with our wireless access solutions, these switches are, in our view, the building blocks of an integrated network that delivers scalable and advanced functionality solutions—protecting, optimizing, and growing as a customer’s business needs evolve.
4
NGN Routing
NGN technology is fundamental to the foundation of the Internet. This category of technologies interconnects public and private wireline and mobile networks for mobile, data, voice, and video applications. Our NGN Routing portfolio of hardware and software solutions consists primarily of physical and virtual routers and routing systems. Our solutions are designed to meet the scale, reliability, and security needs of our customers. In our view, our portfolio is differentiated from those of our competitors through the advanced capabilities, which we sometimes refer to as “intelligence,” that our products provide at each layer of network infrastructure to deliver performance in the transmission of information and media-rich applications.
As to specific products, we offer a broad range of hardware and software solutions, from core network infrastructure and mobile network routing solutions for service providers and enterprises to access routers for branch offices and for telecommuters and consumers at home. Key product areas within our NGN Routing category are as follows:
|
High-End Routers
|
Midrange and Low-End Routers
|
Other NGN Routing
|
||
|
Cisco Aggregation Services Routers (ASRs):
|
Cisco Integrated Services Routers (ISRs):
|
Optical networking products:
|
||
|
• Cisco ASR 901, 902, and 903 Series
|
• Cisco 800 Series ISR
|
Cisco Cloud Services Router 1000V
|
||
|
• Cisco ASR 1000 Series
|
• Cisco 1900 Series ISR
|
Other routing products
|
||
|
• Cisco ASR 5000 and 5500 Series
|
• Cisco 2900 Series ISR
|
|||
|
• Cisco ASR 9000 Series
|
• Cisco 3900 Series ISR
|
|||
|
Cisco Carrier Routing Systems (CRS):
|
• Cisco ISR-AX
|
|||
|
• Cisco CRS-1 Carrier Router
|
||||
|
• Cisco CRS-3 Multishelf System
|
||||
|
• Cisco CRS-X
|
||||
|
• Cisco 7600 Series
|
||||
|
Cisco Network Convergence System (NCS):
|
||||
|
• Cisco NCS 2000 Series
|
||||
|
• Cisco NCS 4000 Series
|
||||
|
• Cisco NCS 6000 Series
|
||||
|
Cisco Quantum Software Suite
|
||||
|
Small cell access routers
|
||||
During fiscal 2014, we continued to add new capabilities, including a new platform in our high-end routers known as the Cisco Network Convergence System (NCS). In fiscal 2014, we also made several enhancements to our Cisco ASR series of products. We also continue to provide enhancements to our NGN Routing portfolio through our architectural approach, which consists of a programmable network at the foundation and a services platform that connects the network to applications and services. Our solutions seek to combine silicon, systems, and software to enable the next-generation IoE and compelling new experiences for consumers, new revenue opportunities for service providers, and new ways to collaborate in the workplace.
5
Service Provider Video
Our end-to-end, digital video distribution systems and digital interactive set-top boxes enable service providers and content originators to deliver entertainment, information, and communication services to consumers and businesses around the world. Key product areas within our Service Provider Video category are as follows:
|
Service Provider Video Infrastructure
|
Video Software and Solutions
|
|
|
Set-top boxes:
|
• Content security systems
|
|
|
• IP set-top boxes
|
• Digital content management products
|
|
|
• Digital cable set-top boxes
|
• Digital headend products
|
|
|
• Digital transport adapters
|
• Digital media network products
|
|
|
• Integration and customization offerings
|
||
|
Cable/Telecommunications Access:
|
• Service provider video software solutions (Videoscape)
|
|
|
• Cable modem termination systems (CMTS)
|
||
|
• Hybrid fiber coaxial (HFC) access network products
|
||
|
• Quadrature amplitude modulation (QAM) products
|
||
|
Cable modems:
|
||
|
• Data modems
|
||
|
• Embedded media terminal adapters
|
||
|
• Wireless gateways
|
||
During fiscal 2014, we continued to leverage technologies obtained through our fiscal 2013 acquisition of NDS Group Limited (“NDS”), a provider of video software and content security solutions. We have included all of our revenue from NDS within the Service Provider Video product category. Specifically, we have integrated NDS products with Cisco Videoscape, our comprehensive content delivery platform designed to enable service providers and media companies to deliver next-generation entertainment experiences.
Collaboration
Our Collaboration portfolio integrates voice, video, data, and mobile applications on fixed and mobile networks across a wide range of devices and related IT equipment—sometimes collectively referred to as "endpoints"—that people use to access networks, such as mobile phones, tablets, desktop and laptop computers, and desktop virtualization clients. Key product areas within our Collaboration category are as follows:
|
Unified Communications
|
Web-Based Collaboration Offerings
|
Cisco TelePresence Systems
|
||
|
• IP phones
|
• Cisco WebEx meeting server
|
• Collaboration desk endpoints
|
||
|
• Call center and messaging products
|
• Cisco WebEx meeting center
|
• Collaboration room endpoints
|
||
|
• Call control
|
• Immersive systems
|
|||
|
• Software-based, IM clients
|
• Cisco TelePresence server and video conferencing infrastructure
|
|||
|
• Communication gateways and unified communication applications and subscriptions
|
• Cisco TelePresence integration solutions
|
|||
We include all of our revenue from WebEx within the Collaboration product category. During fiscal 2014, our collaboration offerings expanded within the Cisco TelePresence Systems collaboration desk endpoints category, including the Cisco Desktop Collaboration DX70 and DX80 offerings which offer high-definition voice and video communications, integrated collaboration, ten-point touchscreen, end-user personalization, and cloud readiness. We also added room-based endpoints with our Cisco TelePresence MX700 and MX800 offerings, which are designed to provide an all-in-one solution for medium to large meeting rooms. Also, within our Cisco TelePresence systems product category, for our enterprise customers we added Cisco Business Edition 7000, a stackable, modular server solution designed to consolidate multiple collaboration applications onto a single integrated platform.
6
Data Center
Our Data Center product category has been our fastest growing major product category for each of the past four fiscal years. The Cisco Unified Computing System (UCS) unites computing, networking, storage, management, and virtualization into a single fabric-based platform designed to simplify operations and provide business agility through rapid deployment and scaling of application infrastructure. UCS is specifically designed for virtualization and automation and enables on-demand provisioning from shared pools of infrastructure across physical and virtual environments.
Key product areas within our Data Center product category are as follows:
|
Cisco Unified Computing System (UCS):
|
|
• Cisco UCS B-Series Blade Servers
|
|
• Cisco UCS C-Series Rack Servers
|
|
• Cisco UCS Fabric Interconnects
|
|
• Cisco UCS Manager and Cisco UCS Central Software
|
|
• Cisco UCS Director
|
|
• Cisco UCS Invicta Series
|
|
Server Access Virtualization:
|
|
• Cisco Nexus 1000V
|
|
• Cisco Nexus 1000V InterCloud
|
During fiscal 2014 we expanded the network management capabilities of our Cisco UCS Central Software offerings, further enhancing Cisco UCS management capabilities to encompass thousands of servers across one or many data centers. Additionally, we continued to invest in data center infrastructure management and automation software within our Cisco UCS Director product offering. We also introduced new UCS blade and rack servers which address large-scale databases, data analytics, and business intelligence, and we also introduced the Cisco UCS Invicta Series, which aims to simplify the data center through the use of flash technology to maximize operational efficiency by improving handling of data-intensive application workloads. During fiscal 2014, Cisco UCS added flash memory to its portfolio of products as a result of our acquisition of WhipTail Technologies, Inc. ("WhipTail"), a provider of high-performance, scalable solid-state memory systems, which occurred in the second quarter of fiscal 2014.
Our fiscal 2014 Data Center product innovations were designed to accelerate execution on our strategy, which is to enable customers to consolidate both physical and virtualized workloads—taking into account customer's unique application requirements—onto a single scalable, centrally managed, and automated system. This strategy has resulted in a portfolio of solutions designed to preserve customer choice, accelerate business initiatives, reduce risk, lower the cost of IT, and represent a comprehensive solution when deployed.
Wireless
Wireless access via wireless fidelity (Wi-Fi) is a fast-growing technology with organizations across the globe investing to provide indoor and outdoor coverage with seamless roaming for voice, video, and data applications. We aim to deliver an optimized user experience over Wi-Fi and leverage the intelligence of the network to solve business problems. Our wireless solutions include wireless access points; standalone, switch-converged, and cloud-managed solutions; and network managed services. Our wireless solutions portfolio is enhanced with security and location-based services via our Mobility Services Engine (MSE) solution. Our offerings provide users with simplified management and mobile device troubleshooting features designed to reduce operational cost and maximize flexibility and reliability. We are also investing in customized chipset development toward the goal of delivering innovative radio frequency (RF) product functionality; our CleanAir proactive spectrum intelligence, our ClientLink solution for mobile devices, and our VideoStream video optimization technology are illustrations of recent investment activity in this area.
Key product areas within our Wireless category are as follows:
|
Cisco Aironet Series
|
|
Access point modules for 3600 Series (802.11ac, 3G, WSSI, LTE/4G) and 3700 Series
|
|
Controllers (standalone and integrated)
|
|
Meraki wireless cloud solutions
|
7
In fiscal 2014, the Connected Mobile Experience (CMX), a Wi-Fi location data analytics platform we introduced in fiscal 2013, continued to experience positive momentum as customers seek new monetization opportunities. Our fiscal 2013 acquisitions of Meraki, Inc. (“Meraki”), a cloud-managed networking company, and ThinkSmart Technologies Limited, a specialist in Wi-Fi data location analytics, in our view bolster our Unified Access platform by providing scalable, easy-to-deploy, on-premise networking solutions that can be centrally managed from the cloud.
Security
With the IoE creating what we believe to be a potentially significant opportunity, security is a significant business concern, and we believe it is a top investment priority of our customers. More people, processes, and devices than ever before are connected to the Internet, causing an escalation of security threats which can result in—where such security threats become actual security breaches—loss of revenue, intellectual property, and reputation. Our security portfolio of products and services is designed to offer a comprehensive solution that collects and shares intelligence with a coordinated focus on threats across the entire attack continuum—before, during, and after an attack. These solutions include network security, web and email security, cloud web security, advanced malware protection, data center security, and network admission control and identity services. Our security solutions and services are designed to protect customers from the network to the cloud to the endpoint, through a network-integrated architecture.
During the first quarter of fiscal 2014, we completed our acquisition of Sourcefire, a provider of intelligent cybersecurity solutions. Sourcefire delivers innovative, highly automated security through continuous awareness, threat detection, and protection across its portfolio, including next-generation intrusion prevention systems, next-generation firewalls, and advanced malware protection. In fiscal 2014 we announced new solutions in advanced malware protection and network security that included integration of our Sourcefire products with products obtained from our fiscal 2013 acquisition of Cognitive Security. We also introduced OpenAppID, an open source application detection solution designed to allow customers to create, share, and implement custom application detection so they can address new application-based threats as quickly as possible.
In the fourth quarter of fiscal 2014, we acquired ThreatGRID, Inc., a leader in dynamic malware analysis and threat intelligence technology. ThreatGRID's private and public cloud technology combines dynamic malware analysis with analytics and actionable indicators with the goal of enabling security teams to proactively defend against and quickly respond to advanced cyber attacks and malware outbreaks. With the ThreatGRID acquisition, we aim to strengthen our advanced threat protection security offering.
Other Products
Our Other Products category primarily consists of certain emerging technologies and other networking products.
Service
In addition to our product offerings, we provide a broad range of service offerings, including technical support services and advanced services.
Technical support services help our customers ensure their products operate efficiently, remain available, and benefit from the most up-to-date system and application software that we have developed. These services help customers protect their network investments, manage risk, and minimize downtime for systems running mission-critical applications. A key example of this is our Cisco Smart Services offering, which
leverages the intelligence from Cisco’s millions of devices and customer connections to protect and optimize network investment for our customers and partners.
Advanced services are part of a comprehensive program that is focused on providing responsive, preventive, and consultative support of our technologies for specific networking needs. The advanced services program supports networking devices, applications, solutions, and complete infrastructures. Our service and support strategy is focused on capitalizing on increased globalization, and we believe this strategy, along with our architectural approach, has the potential to further differentiate us from competitors.
8
Customers and Markets
Many factors influence the IT, collaboration, and networking requirements of our customers. These include the size of the organization, number and types of technology systems, geographic location, and business applications deployed throughout the customer’s network. Our customer base is not limited to any specific industry, geography, or market segment. In each of the past three fiscal years, no single customer has accounted for 10% or more of our revenue. Our customers primarily operate in the following markets: enterprise, service provider, commercial, and public sector.
Enterprise
Enterprise businesses are large regional, national, or global organizations with multiple locations or branch offices and typically employ 1,000 or more employees. Many enterprise businesses have unique IT, collaboration, and networking needs within a multivendor environment. We strive to take advantage of the network-as-a-platform strategy to integrate business processes with technology architectures to assist customer growth. We offer service and support packages, financing, and managed network services, primarily through our service provider partners. We sell these products through a network of third-party application and technology vendors and channel partners, as well as selling directly to these customers.
Service Providers
Service providers offer data, voice, video, and mobile/wireless services to businesses, governments, utilities, and consumers worldwide. They include regional, national, and international wireline carriers, as well as Internet, cable, and wireless providers. We also group media, broadcast, and content providers within our service provider market, as the lines in the telecommunications industry continue to blur between traditional network-based services and content-based and application-based services. Service providers use a variety of our routing and switching, optical, security, video, mobility, and network management products, systems, and services for their own networks. In addition, many service providers use Cisco data center, virtualization, and collaboration technologies to offer managed or Internet-based services to their business customers. Compared with other customers, service providers are more likely to require network design, deployment, and support services because of the scale and complexity of their networks, which requirements are addressed, we believe, by our architectural approach.
Commercial
Generally, we define commercial businesses as companies with fewer than 1,000 employees. The larger, or midmarket, customers within the commercial market are served by a combination of our direct salesforce and our channel partners. These customers typically require the latest advanced technologies that our enterprise customers demand, but with less complexity. Small businesses, or companies with fewer than 100 employees, require information technologies and communication products that are easy to configure, install, and maintain. These smaller companies within the commercial market are primarily served by our channel partners.
Public Sector
Public sector entities include federal governments, state and local governments, as well as educational institution customers. Many public sector entities have unique IT, collaboration, and networking needs within a multivendor environment. We sell to public sector entities through a network of third-party application and technology vendors and channel partners, as well as selling directly to these customers.
Sales Overview
As of the end of fiscal
2014
, our worldwide sales and marketing departments consisted of
24,740
employees, including managers, sales representatives, and technical support personnel. We have field sales offices in 94 countries, and we sell our products and services both directly and through a variety of channels with support from our salesforce. A substantial portion of our products and services is sold through our channel partners, and the remainder is sold through direct sales. Our channel partners include systems integrators, service providers, other resellers, and distributors.
Systems integrators and service providers typically sell directly to end users and often provide system installation, technical support, professional services, and other support services in addition to network equipment sales. Systems integrators also typically integrate our products into an overall solution. Some service providers are also systems integrators.
Distributors hold inventory and typically sell to systems integrators, service providers, and other resellers. We refer to sales through distributors as our two-tier system of sales to the end customer. Revenue from distributors is recognized based on a sell-through method using information provided by them. These distributors are generally given business terms that allow them to return a portion of inventory, receive credits for changes in selling prices, and participate in various cooperative marketing programs.
For information regarding risks related to our channels, see “Item 1A. Risk Factors,” including the risk factors entitled “Disruption of or changes in our distribution model could harm our sales and margins” and “Our inventory management relating to our sales to our two-tier distribution channel is complex, and excess inventory may harm our gross margins.”
9
For information regarding risks relating to our international operations, see “Item 1A. Risk Factors,” including the risk factors entitled “Our operating results may be adversely affected by unfavorable economic and market conditions and the uncertain geopolitical environment”; “Entrance into new or developing markets exposes us to additional competition and will likely increase demands on our service and support operations”; “Due to the global nature of our operations, political or economic changes or other factors in a specific country or region could harm our operating results and financial condition”; “We are exposed to fluctuations in currency exchange rates that could negatively impact our financial results and cash flows”; and “Man-made problems such as computer viruses or terrorism may disrupt our operations and harm our operating results,” among others.
Our service offerings complement our products through a range of consulting, technical, project, quality, and software maintenance services, including 24-hour online and telephone support through technical assistance centers.
Financing Arrangements
We provide financing arrangements for certain qualified customers to build, maintain, and upgrade their networks. We believe customer financing is a competitive factor in obtaining business, particularly in serving customers involved in significant infrastructure projects. Our financing arrangements include the following:
|
Leases:
|
|
• Sales-type
|
|
• Direct financing
|
|
• Operating
|
|
Loans
|
|
Financed service contracts
|
For additional information regarding these financing arrangements, see Note 7 to the Consolidated Financial Statements.
Product Backlog
Our product backlog at
July 26, 2014
, the last day of fiscal
2014
, was approximately
$5.4 billion
, compared with product backlog of approximately
$4.9 billion
at
July 27, 2013
, the last day of fiscal
2013
. The product backlog includes orders confirmed for products scheduled to be shipped within 90 days to customers with approved credit status. Because of the generally short cycle between order and shipment and occasional customer changes in delivery schedules or cancellation of orders (which are made without significant penalty), we do not believe that our product backlog, as of any particular date, is necessarily indicative of actual product revenue for any future period.
Acquisitions, Investments, and Alliances
The markets in which we compete require a wide variety of technologies, products, and capabilities. Our growth strategy is based on the three components of innovation, which we sometimes refer to as our “build, buy, and partner” approach. The foregoing is a way of describing how we strive to innovate: we can internally develop, or build, our own innovative solutions; we can acquire, or buy, companies with innovative technologies; and we can partner with companies to jointly develop and/or resell product technologies and innovations. The combination of technological complexity and rapid change within our markets makes it difficult for a single company to develop all of the technological solutions that it desires to offer within its family of products and services. We work to broaden the range of products and services we deliver to customers in target markets through acquisitions, investments, and alliances. To summarize, we employ the following strategies to address the need for new or enhanced networking and communications products and services:
|
•
|
Developing new technologies and products internally
|
|
•
|
Acquiring all or parts of other companies
|
|
•
|
Entering into joint development efforts with other companies
|
|
•
|
Reselling other companies’ products
|
Acquisitions
We have acquired many companies, and we expect to make future acquisitions. Mergers and acquisitions of high-technology companies are inherently risky, especially if the acquired company has yet to ship a product. No assurance can be given that our previous or future acquisitions will be successful or will not materially adversely affect our financial condition or operating results. Prior acquisitions have resulted in a wide range of outcomes, from successful introduction of new products and technologies to an inability to do so. The risks associated with acquisitions are more fully discussed in “Item 1A. Risk Factors,” including the risk
10
factor entitled “We have made and expect to continue to make acquisitions that could disrupt our operations and harm our operating results.”
Investments in Privately Held Companies
We make investments in privately held companies that develop technology or provide services that are complementary to our products or that provide strategic value. The risks associated with these investments are more fully discussed in “Item 1A. Risk Factors,” including the risk factor entitled “We are exposed to fluctuations in the market values of our portfolio investments and in interest rates; impairment of our investments could harm our earnings.”
Strategic Alliances
We pursue strategic alliances with other companies in areas where collaboration can produce industry advancement and acceleration of new markets. The objectives and goals of a strategic alliance can include one or more of the following: technology exchange, product development, joint sales and marketing, or new market creation. Companies with which we have, or recently had, strategic alliances include the following:
Accenture Ltd; AT&T Inc.; Cap Gemini S.A.; Citrix Systems, Inc.; EMC Corporation; Fujitsu Limited; Intel Corporation; International Business Machines Corporation; Italtel SpA; Johnson Controls Inc.; Microsoft Corporation; NetApp, Inc.; Nokia Siemens Networks; Oracle Corporation; Red Hat, Inc.; SAP AG; Sprint Nextel Corporation; Tata Consultancy Services Ltd.; VCE Company, LLC (“VCE”); VMware, Inc.; Wipro Limited; and others.
Companies with which we have strategic alliances in some areas may be competitors in other areas, and in our view this trend may increase. The risks associated with our strategic alliances are more fully discussed in “Item 1A. Risk Factors,” including the risk factor entitled “If we do not successfully manage our strategic alliances, we may not realize the expected benefits from such alliances, and we may experience increased competition or delays in product development.”
Competition
We compete in the networking and communications equipment markets, providing products and services for transporting data, voice, and video traffic across intranets, extranets, and the Internet. These markets are characterized by rapid change, converging technologies, and a migration to networking and communications solutions that offer relative advantages. These market factors represent both an opportunity and a competitive threat to us. We compete with numerous vendors in each product category. The overall number of our competitors providing niche product solutions may increase. Also, the identity and composition of competitors may change as we increase our activity in our new product markets. As we continue to expand globally, we may see new competition in different geographic regions. In particular, we have experienced price-focused competition from competitors in Asia, especially from China, and we anticipate this will continue.
Our competitors include Alcatel-Lucent; Amazon Web Services LLC; Arista Networks, Inc.; ARRIS Group, Inc.; Aruba Networks, Inc.; Avaya Inc.; Brocade Communications Systems, Inc.; Check Point Software Technologies Ltd.; Citrix Systems, Inc.; Dell Inc.; LM Ericsson Telephone Company; Extreme Networks, Inc.; F5 Networks, Inc.; FireEye, Inc.; Fortinet, Inc.; Hewlett-Packard Company; Huawei Technologies Co., Ltd.; International Business Machines Corporation; Juniper Networks, Inc.; Microsoft Corporation; Motorola Solutions, Inc.; Palo Alto Networks, Inc.; Polycom, Inc.; Riverbed Technology, Inc.; Ruckus Wireless, Inc.; Symantec Corporation; and VMware, Inc.; among others.
Some of these companies compete across many of our product lines, while others are primarily focused in a specific product area. Barriers to entry are relatively low, and new ventures to create products that do or could compete with our products are regularly formed. In addition, some of our competitors may have greater resources, including technical and engineering resources, than we do. As we expand into new markets, we will face competition not only from our existing competitors but also from other competitors, including existing companies with strong technological, marketing, and sales positions in those markets. We also sometimes face competition from resellers and distributors of our products. Companies with which we have strategic alliances in some areas may be competitors in other areas, and in our view this trend may increase. For example, the enterprise data center is undergoing a fundamental transformation arising from the convergence of technologies, including computing, networking, storage, and software, that previously were segregated within the data center. Due to several factors, including the availability of highly scalable and general purpose microprocessors, application-specific integrated circuits offering advanced services, standards-based protocols, cloud computing, and virtualization, the convergence of technologies within the enterprise data center is spanning multiple, previously independent, technology segments. Also, some of our current and potential competitors for enterprise data center business have made acquisitions, or announced new strategic alliances, designed to position them to provide end-to-end technology solutions for the enterprise data center. As a result of all of these developments, we face greater competition in the development and sale of enterprise data center technologies, including competition from entities that are among our long-term strategic alliance partners. Companies that are strategic alliance partners in some areas of our business may acquire or form alliances with our competitors, thereby reducing their business with us.
11
The principal competitive factors in the markets in which we presently compete and may compete in the future include:
|
•
|
The ability to provide a broad range of networking and communications products and services
|
|
•
|
Product performance
|
|
•
|
Price
|
|
•
|
The ability to introduce new products, including products with price-performance advantages
|
|
•
|
The ability to reduce production costs
|
|
•
|
The ability to provide value-added features such as security, reliability, and investment protection
|
|
•
|
Conformance to standards
|
|
•
|
Market presence
|
|
•
|
The ability to provide financing
|
|
•
|
Disruptive technology shifts and new business models
|
We also face competition from customers to which we license or supply technology and suppliers from which we transfer technology. The inherent nature of networking requires interoperability. Therefore, we must cooperate and at the same time compete with many companies. Any inability to effectively manage these complicated relationships with customers, suppliers, and strategic alliance partners could have a material adverse effect on our business, operating results, and financial condition and accordingly affect our chances of success.
Research and Development
We regularly seek to introduce new products and features to address the requirements of our markets. We allocate our research and development budget among our product categories, which consist of Switching, NGN Routing, Service Provider Video, Collaboration, Wireless, Data Center, Security, and Other Product technologies, for this purpose. Our research and development expenditures were $
6.3 billion
,
$5.9 billion
, and
$5.5 billion
in fiscal
2014
,
2013
, and
2012
, respectively. These expenditures are applied generally to all product areas, with specific areas of focus being identified from time to time. Recent areas of increased focus include, but are not limited to, our core routing and switching products, collaboration, and products related to the data center. Our expenditures for research and development costs were expensed as incurred.
The industry in which we compete is subject to rapid technological developments, evolving standards, changes in customer requirements, and new product introductions and enhancements. As a result, our success depends in part upon our ability, on a cost-effective and timely basis, to continue to enhance our existing products and to develop and introduce new products that improve performance and reduce total cost of ownership. To achieve these objectives, our management and engineering personnel work with customers to identify and respond to customer needs, as well as with other innovators of internetworking products, including universities, laboratories, and corporations. We also expect to continue to make acquisitions and investments, where appropriate, to provide us with access to new technologies. We intend to continue developing products that meet key industry standards and to support important protocol standards as they emerge, such as IP Version 6. Nonetheless, there can be no assurance that we will be able to successfully develop products to address new customer requirements and technological changes or that those products will achieve market acceptance.
Manufacturing
We rely on contract manufacturers for all of our manufacturing needs. We presently use a variety of independent third-party companies to provide services related to printed-circuit board assembly, in-circuit test, product repair, and product assembly. Proprietary software on electronically programmable memory chips is used to configure products that meet customer requirements and to maintain quality control and security. The manufacturing process enables us to configure the hardware and software in unique combinations to meet a wide variety of individual customer requirements. The manufacturing process uses automated testing equipment and burn-in procedures, as well as comprehensive inspection, testing, and statistical process controls, which are designed to help ensure the quality and reliability of our products. The manufacturing processes and procedures are generally certified to International Organization for Standardization (ISO) 9001 or ISO 9003 standards.
Our arrangements with contract manufacturers generally provide for quality, cost, and delivery requirements, as well as manufacturing process terms, such as continuity of supply; inventory management; flexibility regarding capacity, quality, and cost management; oversight of manufacturing; and conditions for use of our intellectual property. We have not entered into any significant long-term contracts with any manufacturing service provider. We generally have the option to renew arrangements on an as-needed basis. These arrangements generally do not commit us to purchase any particular amount or any quantities beyond certain amounts covered by orders or forecasts that we submit covering discrete periods of time, defined as less than one year.
12
Patents, Intellectual Property, and Licensing
We seek to establish and maintain our proprietary rights in our technology and products through the use of patents, copyrights, trademarks, and trade secret laws. We have a program to file applications for and obtain patents, copyrights, and trademarks in the United States and in selected foreign countries where we believe filing for such protection is appropriate. We also seek to maintain our trade secrets and confidential information by nondisclosure policies and through the use of appropriate confidentiality agreements. We have obtained a substantial number of patents and trademarks in the United States and in other countries. There can be no assurance, however, that the rights obtained can be successfully enforced against infringing products in every jurisdiction. Although we believe the protection afforded by our patents, copyrights, trademarks, and trade secrets has value, the rapidly changing technology in the networking industry and uncertainties in the legal process make our future success dependent primarily on the innovative skills, technological expertise, and management abilities of our employees rather than on the protection afforded by patent, copyright, trademark, and trade secret laws.
Many of our products are designed to include software or other intellectual property licensed from third parties. While it may be necessary in the future to seek or renew licenses relating to various aspects of our products, we believe, based upon past experience and standard industry practice, that such licenses generally could be obtained on commercially reasonable terms. Nonetheless, there can be no assurance that the necessary licenses would be available on acceptable terms, if at all. Our inability to obtain certain licenses or other rights or to obtain such licenses or rights on favorable terms, or the need to engage in litigation regarding these matters, could have a material adverse effect on our business, operating results, and financial condition. Moreover, inclusion in our products of software or other intellectual property licensed from third parties on a nonexclusive basis can limit our ability to protect our proprietary rights in our products.
The industry in which we compete is characterized by rapidly changing technology, a large number of patents, and frequent claims and related litigation regarding patent and other intellectual property rights. There can be no assurance that our patents and other proprietary rights will not be challenged, invalidated, or circumvented; that others will not assert intellectual property rights to technologies that are relevant to us; or that our rights will give us a competitive advantage. In addition, the laws of some foreign countries may not protect our proprietary rights to the same extent as the laws of the United States. The risks associated with patents and intellectual property are more fully discussed in “Item 1A. Risk Factors,” including the risk factors entitled “Our proprietary rights may prove difficult to enforce,” “We may be found to infringe on intellectual property rights of others,” and “We rely on the availability of third-party licenses.”
Employees
Employees are summarized as follows:
|
|
July 26, 2014
|
|
Employees by geography:
|
|
|
United States
|
36,725
|
|
Rest of world
|
37,317
|
|
Total
|
74,042
|
|
Employees by line item on the Consolidated Statements of Operations:
|
|
|
Cost of sales
(1)
|
16,348
|
|
Research and development
|
25,837
|
|
Sales and marketing
|
24,740
|
|
General and administrative
|
7,117
|
|
Total
|
74,042
|
(1)
Cost of sales includes manufacturing support, services, and training.
We consider the relationships with our employees to be positive. Competition for technical personnel in the industry in which we compete is intense. We believe that our future success depends in part on our continued ability to hire, assimilate, and retain qualified personnel. To date, we believe that we have been successful in recruiting qualified employees, but there is no assurance that we will continue to be successful in the future.
13
Executive Officers of the Registrant
The following table shows the name, age, and position as of August 31, 2014 of each of our executive officers:
|
Name
|
Age
|
Position with the Company
|
||
|
Frank A. Calderoni
|
57
|
Executive Vice President and Chief Financial Officer
|
||
|
John T. Chambers
|
65
|
Chairman, Chief Executive Officer, and Director
|
||
|
Mark Chandler
|
58
|
Senior Vice President, Legal Services, General Counsel and Secretary, and Chief Compliance Officer
|
||
|
Blair Christie
|
42
|
Senior Vice President, Chief Marketing Officer
|
||
|
Wim Elfrink
|
62
|
Executive Vice President, Industry Solutions and Chief Globalisation Officer
|
||
|
Robert W. Lloyd
|
58
|
President, Development and Sales
|
||
|
Gary B. Moore
|
65
|
President and Chief Operating Officer
|
||
|
Pankaj Patel
|
60
|
Executive Vice President and Chief Development Officer, Global Engineering
|
||
|
Charles H. Robbins
|
48
|
Senior Vice President, Worldwide Field Operations
|
||
Mr. Calderoni
joined Cisco in May 2004 as Vice President, Worldwide Sales Finance. In June 2007, he was promoted to Senior Vice President, Customer Solutions Finance. He was appointed to his current position effective in February 2008. From March 2002 until he joined Cisco, Mr. Calderoni served as Senior Vice President and Chief Financial Officer of QLogic Corporation, a supplier of storage networking solutions. Prior to that, he was Senior Vice President, Finance and Administration and Chief Financial Officer of SanDisk Corporation from February 2000 to February 2002. Prior to that, he was employed by IBM Corporation, where he held a number of executive positions. Mr. Calderoni also serves on the Board of Directors of Adobe Systems Incorporated and Nimble Storage, Inc.
Mr. Chambers
has served as Chief Executive Officer since January 1995, as Chairman of the Board of Directors since November 2006, and as a member of the Board of Directors since November 1993. Mr. Chambers also served as President from January 31, 1995 to November 2006. He joined Cisco as Senior Vice President in January 1991 and was promoted to Executive Vice President in June 1994. Mr. Chambers was promoted to President and Chief Executive Officer as of January 31, 1995. Before joining Cisco, he was employed by Wang Laboratories, Inc. for eight years, where, in his last role, he was the Senior Vice President of U.S. Operations.
Mr. Chandler
joined Cisco in July 1996, upon Cisco’s acquisition of StrataCom, Inc., where he served as General Counsel. He served as Cisco’s Managing Attorney for Europe, the Middle East, and Africa from December 1996 until June 1999; as Director, Worldwide Legal Operations from June 1999 until February 2001; and was promoted to Vice President, Worldwide Legal Services in February 2001. In October 2001, he was promoted to Vice President, Legal Services and General Counsel, and in May 2003, he was also appointed Secretary. In February 2006, he was promoted to Senior Vice President, and in May 2012 was appointed Chief Compliance Officer. Before joining StrataCom, he had served as Vice President, Corporate Development and General Counsel of Maxtor Corporation.
Ms. Christie
joined Cisco in August 1999 as part of Cisco’s Investor Relations team. From April 2000 through December 2003, Ms. Christie held a number of managerial positions within Cisco’s Investor Relations function. In January 2004, Ms. Christie was promoted to Vice President, Investor Relations. In June 2006, Ms. Christie was appointed to Vice President, Global Corporate Communications. In January 2008, Ms. Christie was promoted to Senior Vice President, Global Corporate Communications. In January 2011, Ms. Christie was appointed to her current position.
Mr. Elfrink
joined Cisco in 1997 as Vice President of Cisco Services in Europe. In November 2000, he was promoted to Senior Vice President, Cisco Services and took over global responsibility for the function, relocating to San Jose, California. Mr. Elfrink was appointed Chief Globalisation Officer in December 2006 and moved to Bangalore, India to establish Cisco’s Globalisation Centre East. In August 2007, he was named Executive Vice President. In February 2011, Mr. Elfrink was appointed to his current position, in which he
heads three of Cisco’s global initiatives: Cisco’s Industry Solutions Group, the Emerging Countries initiatives, and Cisco’s globalisation strategy.
Mr. Lloyd
joined Cisco in November 1994 as General Manager of Cisco Canada. In October 1998, he was promoted to Vice President, EMEA (Europe, Middle East, and Africa); in February 2001, he was promoted to Senior Vice President, EMEA; and in July 2005, Mr. Lloyd was appointed Senior Vice President, U.S., Canada, and Japan. In April 2009, he was promoted to Executive Vice President, Worldwide Operations. In October 2012, Mr. Lloyd was appointed to his current position.
14
Mr. Moore
joined Cisco in October 2001 as Senior Vice President, Advanced Services. In August 2007, he also assumed responsibility as co-lead of Cisco Services. In May 2010, he was promoted to Executive Vice President, Cisco Services, and in February 2011, he was appointed Executive Vice President and Chief Operating Officer. In October 2012, Mr. Moore was appointed to his current position. Immediately before joining Cisco, Mr. Moore served for approximately two years as chief executive officer of Netigy Corporation, a network consulting company. Prior to that, he was employed by Electronic Data Systems, where he held a number of senior executive positions.
Mr. Patel
joined Cisco in July 1996 upon Cisco’s acquisition of StrataCom, Inc., serving from July 1996 through September 1999 as a Senior Director of Engineering. From November 1999 through January 2003, he served as Senior Vice President of Engineering at Redback Networks Inc., a networking equipment provider later acquired by Ericsson. In January 2003, Mr. Patel rejoined Cisco as Vice President and General Manager, Cable Business Unit, and was promoted to Senior Vice President in July 2005. In January 2006, Mr. Patel was named Senior Vice President and General Manager, Service Provider Business and, additionally, in May 2011 became co-leader of Engineering. In June 2012, Mr. Patel assumed the leadership of Engineering. In August 2012, Mr. Patel was promoted to his current position
.
Mr. Robbins
joined Cisco in December 1997, from which time until March 2002 he held a number of managerial positions within Cisco’s sales organization. Mr. Robbins was promoted to Vice President in March 2002, assuming leadership of Cisco’s U.S. channel sales organization. Additionally, in July 2005 he assumed leadership of Cisco’s Canada channel sales organization. In December 2007, Mr. Robbins was promoted to Senior Vice President, U.S. Commercial, and in August 2009 he was appointed Senior Vice President, U.S. Enterprise, Commercial and Canada. In July 2011, Mr. Robbins was named Senior Vice President, Americas. In October 2012, Mr. Robbins was promoted to his current position.
15
|
Item 1A.
|
Risk Factors
|
Set forth below and elsewhere in this report and in other documents we file with the SEC are descriptions of the risks and uncertainties that could cause our actual results to differ materially from the results contemplated by the forward-looking statements contained in this report.
OUR OPERATING RESULTS MAY FLUCTUATE IN FUTURE PERIODS, WHICH MAY ADVERSELY AFFECT OUR STOCK PRICE
Our operating results have been in the past, and will continue to be, subject to quarterly and annual fluctuations as a result of numerous factors, some of which may contribute to more pronounced fluctuations in an uncertain global economic environment. These factors include:
|
|
•
|
|
Fluctuations in demand for our products and services, especially with respect to telecommunications service providers and Internet businesses, in part due to changes in the global economic environment
|
|
|
•
|
Changes in sales and implementation cycles for our products and reduced visibility into our customers’ spending plans and associated revenue
|
|
|
|
•
|
|
Our ability to maintain appropriate inventory levels and purchase commitments
|
|
|
•
|
|
Price and product competition in the communications and networking industries, which can change rapidly due to technological innovation and different business models from various geographic regions
|
|
|
•
|
|
The overall movement toward industry consolidation among both our competitors and our customers
|
|
|
•
|
|
The introduction and market acceptance of new technologies and products and our success in new and evolving markets, including in our newer product categories such as data center and collaboration and in emerging technologies, as well as the adoption of new standards
|
|
|
•
|
|
New business models for our offerings, such as other-as-a-service (XaaS), where costs are borne up front while revenue is recognized over time
|
|
|
•
|
|
Variations in sales channels, product costs, or mix of products sold
|
|
|
•
|
|
The timing, size, and mix of orders from customers
|
|
|
•
|
|
Manufacturing and customer lead times
|
|
|
•
|
|
Fluctuations in our gross margins, and the factors that contribute to such fluctuations, as described below
|
|
|
•
|
|
The ability of our customers, channel partners, contract manufacturers and suppliers to obtain financing or to fund capital expenditures, especially during a period of global credit market disruption or in the event of customer, channel partner, contract manufacturer or supplier financial problems
|
|
|
•
|
|
Share-based compensation expense
|
|
|
•
|
|
Actual events, circumstances, outcomes, and amounts differing from judgments, assumptions, and estimates used in determining the values of certain assets (including the amounts of related valuation allowances), liabilities, and other items reflected in our Consolidated Financial Statements
|
|
|
•
|
|
How well we execute on our strategy and operating plans and the impact of changes in our business model that could result in significant restructuring charges
|
|
|
•
|
|
Our ability to achieve targeted cost reductions
|
|
|
•
|
|
Benefits anticipated from our investments in engineering, sales and manufacturing activities
|
|
|
•
|
|
Changes in tax laws or accounting rules, or interpretations thereof
|
16
As a consequence, operating results for a particular future period are difficult to predict, and, therefore, prior results are not necessarily indicative of results to be expected in future periods. Any of the foregoing factors, or any other factors discussed elsewhere herein, could have a material adverse effect on our business, results of operations, and financial condition that could adversely affect our stock price.
OUR OPERATING RESULTS MAY BE ADVERSELY AFFECTED BY UNFAVORABLE ECONOMIC AND MARKET CONDITIONS AND THE UNCERTAIN GEOPOLITICAL ENVIRONMENT
Challenging economic conditions worldwide have from time to time contributed, and may continue to contribute, to slowdowns in the communications and networking industries at large, as well as in specific segments and markets in which we operate, resulting in:
|
|
•
|
|
Reduced demand for our products as a result of continued constraints on IT-related capital spending by our customers, particularly service providers, and other customer markets as well
|
|
|
•
|
|
Increased price competition for our products, not only from our competitors but also as a consequence of customers disposing of unutilized products
|
|
|
•
|
|
Risk of excess and obsolete inventories
|
|
|
•
|
|
Risk of supply constraints
|
|
|
•
|
|
Risk of excess facilities and manufacturing capacity
|
|
|
•
|
|
Higher overhead costs as a percentage of revenue and higher interest expense
|
The global macroeconomic environment and recovery from the downturn has been challenging and inconsistent. Instability in the global credit markets, the impact of uncertainty regarding the U.S. federal budget including the effect of the sequestration beginning in 2013, global central bank monetary policy, the instability in the geopolitical environment in many parts of the world and other disruptions may continue to put pressure on global economic conditions. If global economic and market conditions, or economic conditions in key markets, remain uncertain or deteriorate further, we may experience material impacts on our business, operating results, and financial condition.
Our operating results in one or more segments may also be affected by uncertain or changing economic conditions particularly germane to that segment or to particular customer markets within that segment. For example, sales in several of our emerging countries decreased in recent periods, including fiscal 2014, and we expect that this weakness will continue for at least several quarters.
In addition, reports of certain intelligence gathering methods of the U.S. government could affect customers’ perception of the products of IT companies which design and manufacture products in the United States. Trust and confidence in us as an IT supplier is critical to the development and growth of our markets. Impairment of that trust, or foreign regulatory actions taken in response to reports of certain intelligence gathering methods of the U.S. government, could affect the demand for our products from customers outside of the United States and could have an adverse effect on our operating results.
WE HAVE BEEN INVESTING AND EXPECT TO CONTINUE TO INVEST IN KEY GROWTH AREAS AS WELL AS MAINTAINING LEADERSHIP IN ROUTING, SWITCHING AND SERVICES, AND IF THE RETURN ON THESE INVESTMENTS IS LOWER OR DEVELOPS MORE SLOWLY THAN WE EXPECT, OUR OPERATING RESULTS MAY BE HARMED
We expect to realign and dedicate resources into key growth areas, such as data center virtualization, software, security, and cloud, while also focusing on maintaining leadership in routing, switching and services. However, the return on our investments may be lower, or may develop more slowly, than we expect. If we do not achieve the benefits anticipated from these investments (including if our selection of areas for investment does not play out as we expect), or if the achievement of these benefits is delayed, our operating results may be adversely affected.
OUR REVENUE FOR A PARTICULAR PERIOD IS DIFFICULT TO PREDICT, AND A SHORTFALL IN REVENUE MAY HARM OUR OPERATING RESULTS
As a result of a variety of factors discussed in this report, our revenue for a particular quarter is difficult to predict, especially in light of a challenging and inconsistent global macroeconomic environment and related market uncertainty.
Our revenue may grow at a slower rate than in past periods, or decline as it did in fiscal 2014 on a year-over-year basis. Our ability to meet financial expectations could also be adversely affected if the nonlinear sales pattern seen in some of our past quarters
17
recurs in future periods. We have experienced periods of time during which shipments have exceeded net bookings or manufacturing issues have delayed shipments, leading to nonlinearity in shipping patterns. In addition to making it difficult to predict revenue for a particular period, nonlinearity in shipping can increase costs, because irregular shipment patterns result in periods of underutilized capacity and periods in which overtime expenses may be incurred, as well as in potential additional inventory management-related costs. In addition, to the extent that manufacturing issues and any related component shortages result in delayed shipments in the future, and particularly in periods in which our contract manufacturers are operating at higher levels of capacity, it is possible that revenue for a quarter could be adversely affected if such matters occur and are not remediated within the same quarter.
The timing of large orders can also have a significant effect on our business and operating results from quarter to quarter, primarily in the United States and in emerging countries. From time to time, we receive large orders that have a significant effect on our operating results in the period in which the order is recognized as revenue. The timing of such orders is difficult to predict, and the timing of revenue recognition from such orders may affect period to period changes in revenue. As a result, our operating results could vary materially from quarter to quarter based on the receipt of such orders and their ultimate recognition as revenue.
Inventory management remains an area of focus. We have experienced longer than normal manufacturing lead times in the past which have caused some customers to place the same order multiple times within our various sales channels and to cancel the duplicative orders upon receipt of the product, or to place orders with other vendors with shorter manufacturing lead times. Such multiple ordering (along with other factors) or risk of order cancellation may cause difficulty in predicting our revenue and, as a result, could impair our ability to manage parts inventory effectively. In addition, our efforts to improve manufacturing lead-time performance may result in corresponding reductions in order backlog. A decline in backlog levels could result in more variability and less predictability in our quarter-to-quarter revenue and operating results. In addition, when facing component supply-related challenges, we have increased our efforts in procuring components in order to meet customer expectations which in turn contribute to an increase in purchase commitments. Increases in our purchase commitments to shorten lead times could also lead to excess and obsolete inventory charges if the demand for our products is less than our expectations.
We plan our operating expense levels based primarily on forecasted revenue levels. These expenses and the impact of long-term commitments are relatively fixed in the short term. A shortfall in revenue could lead to operating results being below expectations because we may not be able to quickly reduce these fixed expenses in response to short-term business changes.
Any of the above factors could have a material adverse impact on our operations and financial results.
WE EXPECT GROSS MARGIN TO VARY OVER TIME, AND OUR LEVEL OF PRODUCT GROSS MARGIN MAY NOT BE SUSTAINABLE
Our level of product gross margins declined in prior periods, including fiscal 2014, and may continue to decline and be adversely affected by numerous factors, including:
|
|
•
|
|
Changes in customer, geographic, or product mix, including mix of configurations within each product group
|
|
|
•
|
|
Introduction of new products, including products with price-performance advantages, and new business models for our offerings such as XaaS
|
|
|
•
|
|
Our ability to reduce production costs
|
|
|
•
|
|
Entry into new markets or growth in lower margin markets, including markets with different pricing and cost structures, through acquisitions or internal development
|
|
|
•
|
|
Sales discounts
|
|
|
•
|
|
Increases in material, labor or other manufacturing-related costs, which could be significant especially during periods of supply constraints
|
|
|
•
|
|
Excess inventory and inventory holding charges
|
|
|
•
|
|
Obsolescence charges
|
|
|
•
|
|
Changes in shipment volume
|
|
|
•
|
|
The timing of revenue recognition and revenue deferrals
|
18
|
|
•
|
|
Increased cost, loss of cost savings or dilution of savings due to changes in component pricing or charges incurred due to inventory holding periods if parts ordering does not correctly anticipate product demand or if the financial health of either contract manufacturers or suppliers deteriorates
|
|
|
•
|
|
Lower than expected benefits from value engineering
|
|
|
•
|
|
Increased price competition, including competitors from Asia, especially from China
|
|
|
•
|
|
Changes in distribution channels
|
|
|
•
|
|
Increased warranty costs
|
|
|
•
|
|
Increased amortization of purchased intangible assets, especially from acquisitions
|
|
|
•
|
|
How well we execute on our strategy and operating plans
|
Changes in service gross margin may result from various factors such as changes in the mix between technical support services and advanced services, as well as the timing of technical support service contract initiations and renewals and the addition of personnel and other resources to support higher levels of service business in future periods.
SALES TO THE SERVICE PROVIDER MARKET ARE ESPECIALLY VOLATILE, AND WEAKNESS IN SALES ORDERS FROM THIS INDUSTRY MAY HARM OUR OPERATING RESULTS AND FINANCIAL CONDITION
Sales to the service provider market have been characterized by large and sporadic purchases, especially relating to our router sales and sales of certain products in our newer product categories such as Data Center, Collaboration, and Service Provider Video, in addition to longer sales cycles. At various times in the past including fiscal 2014, we experienced significant weakness in sales to service providers, sometimes lasting over extended periods of time as market conditions have fluctuated. We expect that the weakness we experienced in fiscal 2014 will continue for at least several quarters. Sales activity in this industry depends upon the stage of completion of expanding network infrastructures; the availability of funding; and the extent to which service providers are affected by regulatory, economic, and business conditions in the country of operations. Weakness in orders from this industry, including as a result of any slowdown in capital expenditures by service providers (which may be more prevalent during a global economic downturn or periods of economic uncertainty), could have a material adverse effect on our business, operating results, and financial condition. Such slowdowns may continue or recur in future periods. Orders from this industry could decline for many reasons other than the competitiveness of our products and services within their respective markets. For example, in the past, many of our service provider customers have been materially and adversely affected by slowdowns in the general economy, by overcapacity, by changes in the service provider market, by regulatory developments, and by constraints on capital availability, resulting in business failures and substantial reductions in spending and expansion plans. These conditions have materially harmed our business and operating results in the past, and some of these or other conditions in the service provider market could affect our business and operating results in any future period. Finally, service provider customers typically have longer implementation cycles; require a broader range of services, including design services; demand that vendors take on a larger share of risks; often require acceptance provisions, which can lead to a delay in revenue recognition; and expect financing from vendors. All these factors can add further risk to business conducted with service providers.
DISRUPTION OF OR CHANGES IN OUR DISTRIBUTION MODEL COULD HARM OUR SALES AND MARGINS
If we fail to manage distribution of our products and services properly, or if our distributors’ financial condition or operations weaken, our revenue and gross margins could be adversely affected.
A substantial portion of our products and services is sold through our channel partners, and the remainder is sold through direct sales. Our channel partners include systems integrators, service providers, other resellers, and distributors. Systems integrators and service providers typically sell directly to end users and often provide system installation, technical support, professional services, and other support services in addition to network equipment sales. Systems integrators also typically integrate our products into an overall solution, and a number of service providers are also systems integrators. Distributors stock inventory and typically sell to systems integrators, service providers, and other resellers. We refer to sales through distributors as our two-tier system of sales to the end customer. Revenue from distributors is generally recognized based on a sell-through method using information provided by them. These distributors are generally given business terms that allow them to return a portion of inventory, receive credits for changes in selling prices, and participate in various cooperative marketing programs. If sales through indirect channels increase, this may lead to greater difficulty in forecasting the mix of our products and, to a degree, the timing of orders from our customers.
19
Historically, we have seen fluctuations in our gross margins based on changes in the balance of our distribution channels. Although variability to date has not been significant, there can be no assurance that changes in the balance of our distribution model in future periods would not have an adverse effect on our gross margins and profitability.
Some factors could result in disruption of or changes in our distribution model, which could harm our sales and margins, including the following:
|
|
•
|
|
We compete with some of our channel partners, including through our direct sales, which may lead these channel partners to use other suppliers that do not directly sell their own products or otherwise compete with them
|
|
|
•
|
|
Some of our channel partners may demand that we absorb a greater share of the risks that their customers may ask them to bear
|
|
|
•
|
|
Some of our channel partners may have insufficient financial resources and may not be able to withstand changes and challenges in business conditions
|
|
|
•
|
|
Revenue from indirect sales could suffer if our distributors’ financial condition or operations weaken
|
In addition, we depend on our channel partners globally to comply with applicable regulatory requirements. To the extent that they fail to do so, that could have a material adverse effect on our business, operating results, and financial condition. Further, sales of our products outside of agreed territories can result in disruption to our distribution channels.
THE MARKETS IN WHICH WE COMPETE ARE INTENSELY COMPETITIVE, WHICH COULD ADVERSELY AFFECT OUR ACHIEVEMENT OF REVENUE GROWTH
The markets in which we compete are characterized by rapid change, converging technologies, and a migration to networking and communications solutions that offer relative advantages. These market factors represent a competitive threat to us. We compete with numerous vendors in each product category. The overall number of our competitors providing niche product solutions may increase. Also, the identity and composition of competitors may change as we increase our activity in newer product categories such as data center and collaboration and in key growth areas. For example, as products related to network programmability, such as software-defined-networking products, become more prevalent, we expect to face increased competition from companies who develop networking products based on commoditized hardware, referred to as "white box" hardware, to the extent customers decide to purchase those product offerings instead of ours. In addition, the growth in demand for technology delivered as a service enables new competitors to enter the market.
As we continue to expand globally, we may see new competition in different geographic regions. In particular, we have experienced price-focused competition from competitors in Asia, especially from China, and we anticipate this will continue. For information regarding our competitors, see the section entitled “Competition” contained in
Item 1. Busines
s of this report.
Some of our competitors compete across many of our product lines, while others are primarily focused in a specific product area. Barriers to entry are relatively low, and new ventures to create products that do or could compete with our products are regularly formed. In addition, some of our competitors may have greater resources, including technical and engineering resources, than we do. As we expand into new markets, we will face competition not only from our existing competitors but also from other competitors, including existing companies with strong technological, marketing, and sales positions in those markets. We also sometimes face competition from resellers and distributors of our products. Companies with whom we have strategic alliances in some areas may be competitors in other areas, and in our view this trend may increase.
For example, the enterprise data center is undergoing a fundamental transformation arising from the convergence of technologies, including computing, networking, storage, and software, that previously were segregated. Due to several factors, including the availability of highly scalable and general purpose microprocessors, application-specific integrated circuits offering advanced services, standards based protocols, cloud computing and virtualization, the convergence of technologies within the enterprise data center is spanning multiple, previously independent, technology segments. Also, some of our current and potential competitors for enterprise data center business have made acquisitions, or announced new strategic alliances, designed to position them to provide end-to-end technology solutions for the enterprise data center. As a result of all of these developments, we face greater competition in the development and sale of enterprise data center technologies, including competition from entities that are among our long-term strategic alliance partners. Companies that are strategic alliance partners in some areas of our business may acquire or form alliances with our competitors, thereby reducing their business with us.
The principal competitive factors in the markets in which we presently compete and may compete in the future include:
|
|
•
|
|
The ability to provide a broad range of networking and communications products and services
|
20
|
|
•
|
|
Product performance
|
|
|
•
|
|
Price
|
|
|
•
|
|
The ability to introduce new products, including products with price-performance advantages
|
|
|
•
|
|
The ability to reduce production costs
|
|
|
•
|
|
The ability to provide value-added features such as security, reliability, and investment protection
|
|
|
•
|
|
Conformance to standards
|
|
|
•
|
|
Market presence
|
|
|
•
|
|
The ability to provide financing
|
|
|
•
|
|
Disruptive technology shifts and new business models
|
We also face competition from customers to which we license or supply technology and suppliers from which we transfer technology. The inherent nature of networking requires interoperability. As such, we must cooperate and at the same time compete with many companies. Any inability to effectively manage these complicated relationships with customers, suppliers, and strategic alliance partners could have a material adverse effect on our business, operating results, and financial condition and accordingly affect our chances of success.
OUR INVENTORY MANAGEMENT RELATING TO OUR SALES TO OUR TWO-TIER DISTRIBUTION CHANNEL IS COMPLEX, AND EXCESS INVENTORY MAY HARM OUR GROSS MARGINS
We must manage our inventory relating to sales to our distributors effectively, because inventory held by them could affect our results of operations. Our distributors may increase orders during periods of product shortages, cancel orders if their inventory is too high, or delay orders in anticipation of new products. They also may adjust their orders in response to the supply of our products and the products of our competitors that are available to them, and in response to seasonal fluctuations in end-user demand. Revenue to our distributors generally is recognized based on a sell-through method using information provided by them, and they are generally given business terms that allow them to return a portion of inventory, receive credits for changes in selling price, and participate in various cooperative marketing programs. Inventory management remains an area of focus as we balance the need to maintain strategic inventory levels to ensure competitive lead times against the risk of inventory obsolescence because of rapidly changing technology and customer requirements. When facing component supply-related challenges, we have increased our efforts in procuring components in order to meet customer expectations. If we ultimately determine that we have excess inventory, we may have to reduce our prices and write down inventory, which in turn could result in lower gross margins.
SUPPLY CHAIN ISSUES, INCLUDING FINANCIAL PROBLEMS OF CONTRACT MANUFACTURERS OR COMPONENT SUPPLIERS, OR A SHORTAGE OF ADEQUATE COMPONENT SUPPLY OR MANUFACTURING CAPACITY THAT INCREASED OUR COSTS OR CAUSED A DELAY IN OUR ABILITY TO FULFILL ORDERS, COULD HAVE AN ADVERSE IMPACT ON OUR BUSINESS AND OPERATING RESULTS, AND OUR FAILURE TO ESTIMATE CUSTOMER DEMAND PROPERLY MAY RESULT IN EXCESS OR OBSOLETE COMPONENT SUPPLY, WHICH COULD ADVERSELY AFFECT OUR GROSS MARGINS
The fact that we do not own or operate the bulk of our manufacturing facilities and that we are reliant on our extended supply chain could have an adverse impact on the supply of our products and on our business and operating results:
|
|
•
|
|
Any financial problems of either contract manufacturers or component suppliers could either limit supply or increase costs
|
|
|
•
|
|
Reservation of manufacturing capacity at our contract manufacturers by other companies, inside or outside of our industry, could either limit supply or increase costs
|
A reduction or interruption in supply; a significant increase in the price of one or more components; a failure to adequately authorize procurement of inventory by our contract manufacturers; a failure to appropriately cancel, reschedule, or adjust our requirements based on our business needs; or a decrease in demand for our products could materially adversely affect our business, operating results, and financial condition and could materially damage customer relationships. Furthermore, as a result of binding price or purchase commitments with suppliers, we may be obligated to purchase components at prices that are higher than those available
21
in the current market. In the event that we become committed to purchase components at prices in excess of the current market price when the components are actually used, our gross margins could decrease. We have experienced longer than normal lead times in the past. Although we have generally secured additional supply or taken other mitigation actions when significant disruptions have occurred, if similar situations occur in the future, they could have a material adverse effect on our business, results of operations, and financial condition. See the risk factor above entitled “Our revenue for a particular period is difficult to predict, and a shortfall in revenue may harm our operating results.”
Our growth and ability to meet customer demands depend in part on our ability to obtain timely deliveries of parts from our suppliers and contract manufacturers. We have experienced component shortages in the past, including shortages caused by manufacturing process issues, that have affected our operations. We may in the future experience a shortage of certain component parts as a result of our own manufacturing issues, manufacturing issues at our suppliers or contract manufacturers, capacity problems experienced by our suppliers or contract manufacturers, or strong demand in the industry for those parts. Growth in the economy is likely to create greater pressures on us and our suppliers to accurately project overall component demand and component demands within specific product categories and to establish optimal component levels and manufacturing capacity, especially for labor-intensive components, components for which we purchase a substantial portion of the supply, or the re-ramping of manufacturing capacity for highly complex products. During periods of shortages or delays the price of components may increase, or the components may not be available at all, and we may also encounter shortages if we do not accurately anticipate our needs. We may not be able to secure enough components at reasonable prices or of acceptable quality to build new products in a timely manner in the quantities or configurations needed. Accordingly, our revenue and gross margins could suffer until other sources can be developed. Our operating results would also be adversely affected if, anticipating greater demand than actually develops, we commit to the purchase of more components than we need, which is more likely to occur in a period of demand uncertainties such as we are currently experiencing. There can be no assurance that we will not encounter these problems in the future. Although in many cases we use standard parts and components for our products, certain components are presently available only from a single source or limited sources, and a global economic downturn and related market uncertainty could negatively impact the availability of components from one or more of these sources, especially during times such as we have recently seen when there are supplier constraints based on labor and other actions taken during economic downturns. We may not be able to diversify sources in a timely manner, which could harm our ability to deliver products to customers and seriously impact present and future sales.
We believe that we may be faced with the following challenges in the future:
|
|
•
|
|
New markets in which we participate may grow quickly, which may make it difficult to quickly obtain significant component capacity
|
|
|
•
|
|
As we acquire companies and new technologies, we may be dependent, at least initially, on unfamiliar supply chains or relatively small supply partners
|
|
|
•
|
|
We face competition for certain components that are supply-constrained, from existing competitors, and companies in other markets
|
Manufacturing capacity and component supply constraints could continue to be significant issues for us. We purchase components from a variety of suppliers and use several contract manufacturers to provide manufacturing services for our products. During the normal course of business, in order to improve manufacturing lead-time performance and to help ensure adequate component supply, we enter into agreements with contract manufacturers and suppliers that either allow them to procure inventory based upon criteria as defined by us or that establish the parameters defining our requirements. In certain instances, these agreements allow us the option to cancel, reschedule, and adjust our requirements based on our business needs prior to firm orders being placed. When facing component supply-related challenges, we have increased our efforts in procuring components in order to meet customer expectations which in turn contributes to an increase in purchase commitments. Increases in our purchase commitments to shorten lead times could also lead to excess and obsolete inventory charges if the demand for our products is less than our expectations. If we fail to anticipate customer demand properly, an oversupply of parts could result in excess or obsolete components that could adversely affect our gross margins. For additional information regarding our purchase commitments with contract manufacturers and suppliers, see Note 12 to the Consolidated Financial Statements.
WE DEPEND UPON THE DEVELOPMENT OF NEW PRODUCTS AND ENHANCEMENTS TO EXISTING PRODUCTS, AND IF WE FAIL TO PREDICT AND RESPOND TO EMERGING TECHNOLOGICAL TRENDS AND CUSTOMERS’ CHANGING NEEDS, OUR OPERATING RESULTS AND MARKET SHARE MAY SUFFER
The markets for our products are characterized by rapidly changing technology, evolving industry standards, new product introductions, and evolving methods of building and operating networks. Our operating results depend on our ability to develop and introduce new products into existing and emerging markets and to reduce the production costs of existing products. Many of our strategic initiatives and investments are aimed at meeting the requirements that a network capable of multiple-party, collaborative interaction would demand, and the investments we have made and our architectural approach are designed to enable the increased
22
use of the network as the platform for all forms of communications and IT. For example, in fiscal 2009 we launched our Cisco Unified Computing System (UCS), our next-generation enterprise data center platform architected to unite computing, network, storage access and virtualization resources in a single system, which is designed to address the fundamental transformation occurring in the enterprise data center. While our Cisco UCS offering remains a significant focus area for us, several market transitions are also shaping our strategies and investments.
One such market transition we are focusing on is the move towards more programmable, flexible and virtual networks. In our view, this evolution is in its very early stages, and we believe the successful products and solutions in this market will combine ASICs, hardware and software elements together. Other examples include our focus on the IoE market transition, a potentially significant transition in the IT industry, and a transition in cloud where we have announced plans to architect the Cisco Intercloud solution.
The process of developing new technology, including technology related to more programmable, flexible and virtual networks and technology related to other market transitions, including IoE and cloud, is complex and uncertain, and if we fail to accurately predict customers’ changing needs and emerging technological trends our business could be harmed. We must commit significant resources, including the investments we have been making in our priorities to developing new products before knowing whether our investments will result in products the market will accept. In particular, if our model of the evolution of networking does not emerge as we believe it will, or if the industry does not evolve as we believe it will, or if our strategy for addressing this evolution is not successful, many of our strategic initiatives and investments may be of no or limited value. For example, if we do not introduce products related to network programmability, such as software-defined-networking products, in a timely fashion, or if product offerings in this market that ultimately succeed are based on technology, or an approach to technology, that differs from ours, such as, for example, networking products based on “white box” hardware, our business could be harmed. Similarly, our business could be harmed if we fail to develop, or fail to develop in a timely fashion, offerings to address other transitions, or if the offerings addressing these other transitions that ultimately succeed are based on technology, or an approach to technology, different from ours.
Furthermore, we may not execute successfully on our vision or strategy because of challenges with regard to product planning and timing, technical hurdles that we fail to overcome in a timely fashion, or a lack of appropriate resources. This could result in competitors, some of which may also be our strategic alliance partners, providing those solutions before we do and loss of market share, revenue, and earnings. In addition, the growth in demand for technology delivered as a service enables new competitors to enter the market. The success of new products depends on several factors, including proper new product definition, component costs, timely completion and introduction of these products, differentiation of new products from those of our competitors, and market acceptance of these products. There can be no assurance that we will successfully identify new product opportunities, develop and bring new products to market in a timely manner, or achieve market acceptance of our products or that products and technologies developed by others will not render our products or technologies obsolete or noncompetitive. The products and technologies in our other product categories and key growth areas may not prove to have the market success we anticipate, and we may not successfully identify and invest in other emerging or new products.
CHANGES IN INDUSTRY STRUCTURE AND MARKET CONDITIONS COULD LEAD TO CHARGES RELATED TO DISCONTINUANCES OF CERTAIN OF OUR PRODUCTS OR BUSINESSES, ASSET IMPAIRMENTS AND WORKFORCE REDUCTIONS OR RESTRUCTURINGS
In response to changes in industry and market conditions, we may be required to strategically realign our resources and to consider restructuring, disposing of, or otherwise exiting businesses. Any resource realignment, or decision to limit investment in or dispose of or otherwise exit businesses, may result in the recording of special charges, such as inventory and technology-related write-offs, workforce reduction or restructuring costs, charges relating to consolidation of excess facilities, or claims from third parties who were resellers or users of discontinued products. Our estimates with respect to the useful life or ultimate recoverability of our carrying basis of assets, including purchased intangible assets, could change as a result of such assessments and decisions. Although in certain instances our supply agreements allow us the option to cancel, reschedule, and adjust our requirements based on our business needs prior to firm orders being placed, our loss contingencies may include liabilities for contracts that we cannot cancel with contract manufacturers and suppliers. Further, our estimates relating to the liabilities for excess facilities are affected by changes in real estate market conditions. Additionally, we are required to perform goodwill impairment tests on an annual basis and between annual tests in certain circumstances, and future goodwill impairment tests may result in a charge to earnings.
In August 2014, as part of our strategy of continuing to invest in growth, innovation and talent, while also managing costs and driving efficiencies, we announced a restructuring plan that will impact up to 6,000 employees, representing approximately 8 percent of our global workforce. We expect to take action under this plan beginning in the first quarter of fiscal 2015. The implementation of this restructuring plan may be disruptive to our business, and following completion of the restructuring
plan our business may not be more efficient or effective than prior to implementation of the plan. Our restructuring activities, including any related charges and the impact of the related headcount restructurings, could have a material adverse effect on our business, operating results, and financial condition.
23
OVER THE LONG TERM WE INTEND TO INVEST IN ENGINEERING, SALES, SERVICE AND MARKETING ACTIVITIES, AND THESE INVESTMENTS MAY ACHIEVE DELAYED, OR LOWER THAN EXPECTED, BENEFITS WHICH COULD HARM OUR OPERATING RESULTS
While we intend to focus on managing our costs and expenses, over the long term, we also intend to invest in personnel and other resources related to our engineering, sales, service and marketing functions as we realign and dedicate resources on key growth areas, such as data center virtualization, software, security, and cloud, and we also intend to focus on maintaining leadership in routing, switching and services. We are likely to recognize the costs associated with these investments earlier than some of the anticipated benefits, and the return on these investments may be lower, or may develop more slowly, than we expect. If we do not achieve the benefits anticipated from these investments, or if the achievement of these benefits is delayed, our operating results may be adversely affected.
OUR BUSINESS SUBSTANTIALLY DEPENDS UPON THE CONTINUED GROWTH OF THE INTERNET AND INTERNET-BASED SYSTEMS
A substantial portion of our business and revenue depends on growth and evolution of the Internet, including the continued development of the Internet and the anticipated transition to IoE, and on the deployment of our products by customers who depend on such continued growth and evolution. To the extent that an economic slowdown or uncertainty and related reduction in capital spending adversely affect spending on Internet infrastructure, including spending or investment related to IoE, we could experience material harm to our business, operating results, and financial condition.
Because of the rapid introduction of new products and changing customer requirements related to matters such as cost-effectiveness and security, we believe that there could be performance problems with Internet communications in the future, which could receive a high degree of publicity and visibility. Because we are a large supplier of networking products, our business, operating results, and financial condition may be materially adversely affected, regardless of whether or not these problems are due to the performance of our own products. Such an event could also result in a material adverse effect on the market price of our common stock independent of direct effects on our business.
WE HAVE MADE AND EXPECT TO CONTINUE TO MAKE ACQUISITIONS THAT COULD DISRUPT OUR OPERATIONS AND HARM OUR OPERATING RESULTS
Our growth depends upon market growth, our ability to enhance our existing products, and our ability to introduce new products on a timely basis. We intend to continue to address the need to develop new products and enhance existing products through acquisitions of other companies, product lines, technologies, and personnel. Acquisitions involve numerous risks, including the following:
|
|
•
|
|
Difficulties in integrating the operations, systems, technologies, products, and personnel of the acquired companies, particularly companies with large and widespread operations and/or complex products, such as Scientific-Atlanta, WebEx, Starent, Tandberg and NDS Group Limited
|
|
|
•
|
|
Diversion of management’s attention from normal daily operations of the business and the challenges of managing larger and more widespread operations resulting from acquisitions
|
|
|
•
|
|
Potential difficulties in completing projects associated with in-process research and development intangibles
|
|
|
•
|
|
Difficulties in entering markets in which we have no or limited direct prior experience and where competitors in such markets have stronger market positions
|
|
|
•
|
|
Initial dependence on unfamiliar supply chains or relatively small supply partners
|
|
|
•
|
|
Insufficient revenue to offset increased expenses associated with acquisitions
|
|
|
•
|
|
The potential loss of key employees, customers, distributors, vendors and other business partners of the companies we acquire following and continuing after announcement of acquisition plans
|
Acquisitions may also cause us to:
|
|
•
|
|
Issue common stock that would dilute our current shareholders’ percentage ownership
|
|
|
•
|
|
Use a substantial portion of our cash resources, or incur debt, as we did in fiscal 2006 when we issued and sold $6.5 billion in senior unsecured notes to fund our acquisition of Scientific-Atlanta
|
24
|
|
•
|
|
Significantly increase our interest expense, leverage and debt service requirements if we incur additional debt to pay for an acquisition
|
|
|
•
|
|
Assume liabilities
|
|
|
•
|
|
Record goodwill and intangible assets that are subject to impairment testing on a regular basis and potential periodic impairment charges
|
|
|
•
|
|
Incur amortization expenses related to certain intangible assets
|
|
|
•
|
|
Incur tax expenses related to the effect of acquisitions on our intercompany research and development (“R&D”) cost sharing arrangement and legal structure
|
|
|
•
|
|
Incur large and immediate write-offs and restructuring and other related expenses
|
|
|
•
|
|
Become subject to intellectual property or other litigation
|
Mergers and acquisitions of high-technology companies are inherently risky and subject to many factors outside of our control, and no assurance can be given that our previous or future acquisitions will be successful and will not materially adversely affect our business, operating results, or financial condition. Failure to manage and successfully integrate acquisitions could materially harm our business and operating results. Prior acquisitions have resulted in a wide range of outcomes, from successful introduction of new products and technologies to a failure to do so. Even when an acquired company has already developed and marketed products, there can be no assurance that product enhancements will be made in a timely fashion or that pre-acquisition due diligence will have identified all possible issues that might arise with respect to such products.
From time to time, we have made acquisitions that resulted in charges in an individual quarter. These charges may occur in any particular quarter, resulting in variability in our quarterly earnings. In addition, our effective tax rate for future periods is uncertain and could be impacted by mergers and acquisitions. Risks related to new product development also apply to acquisitions. Please see the risk factors above, including the risk factor entitled “We depend upon the development of new products and enhancements to existing products, and if we fail to predict and respond to emerging technological trends and customers’ changing needs, our operating results and market share may suffer” for additional information.
ENTRANCE INTO NEW OR DEVELOPING MARKETS EXPOSES US TO ADDITIONAL COMPETITION AND WILL LIKELY INCREASE DEMANDS ON OUR SERVICE AND SUPPORT OPERATIONS
As we focus on new market opportunities and key growth areas, we will increasingly compete with large telecommunications equipment suppliers as well as startup companies. Several of our competitors may have greater resources, including technical and engineering resources, than we do. Additionally, as customers in these markets complete infrastructure deployments, they may require greater levels of service, support, and financing than we have provided in the past, especially in emerging countries. Demand for these types of service, support, or financing contracts may increase in the future. There can be no assurance that we can provide products, service, support, and financing to effectively compete for these market opportunities.
Further, provision of greater levels of services, support and financing by us may result in a delay in the timing of revenue recognition. In addition, entry into other markets has subjected and will subject us to additional risks, particularly to those markets, including the effects of general market conditions and reduced consumer confidence. For example, as we add direct selling capabilities globally to meet changing customer demands, we will face increased legal and regulatory requirements.
INDUSTRY CONSOLIDATION MAY LEAD TO INCREASED COMPETITION AND MAY HARM OUR OPERATING RESULTS
There has been a trend toward industry consolidation in our markets for several years. We expect this trend to continue as companies attempt to strengthen or hold their market positions in an evolving industry and as companies are acquired or are unable to continue operations. For example, some of our current and potential competitors for enterprise data center business have made acquisitions, or announced new strategic alliances, designed to position them with the ability to provide end-to-end technology solutions for the enterprise data center. Companies that are strategic alliance partners in some areas of our business may acquire or form alliances with our competitors, thereby reducing their business with us. We believe that industry consolidation may result in stronger competitors that are better able to compete as sole-source vendors for customers. This could lead to more variability in our operating results and could have a material adverse effect on our business, operating results, and financial condition. Furthermore, particularly in the service provider market, rapid consolidation will lead to fewer customers, with the effect that loss of a major customer could have a material impact on results not anticipated in a customer marketplace composed of more numerous participants.
25
PRODUCT QUALITY PROBLEMS COULD LEAD TO REDUCED REVENUE, GROSS MARGINS, AND NET INCOME
We produce highly complex products that incorporate leading-edge technology, including both hardware and software. Software typically contains bugs that can unexpectedly interfere with expected operations. There can be no assurance that our pre-shipment testing programs will be adequate to detect all defects, either ones in individual products or ones that could affect numerous shipments, which might interfere with customer satisfaction, reduce sales opportunities, or affect gross margins. From time to time, we have had to replace certain components and provide remediation in response to the discovery of defects or bugs in products that we had shipped. There can be no assurance that such remediation, depending on the product involved, would not have a material impact. An inability to cure a product defect could result in the failure of a product line, temporary or permanent withdrawal from a product or market, damage to our reputation, inventory costs, or product reengineering expenses, any of which could have a material impact on our revenue, margins, and net income. For example, in the second quarter of fiscal 2014, we recorded a pre-tax charge of $655 million related to the expected remediation costs for certain products sold in prior fiscal years containing memory components manufactured by a single supplier between 2005 and 2010.
DUE TO THE GLOBAL NATURE OF OUR OPERATIONS, POLITICAL OR ECONOMIC CHANGES OR OTHER FACTORS IN A SPECIFIC COUNTRY OR REGION COULD HARM OUR OPERATING RESULTS AND FINANCIAL CONDITION
We conduct significant sales and customer support operations in countries around the world. As such, our growth depends in part on our increasing sales into emerging countries. We also depend on non-U.S. operations of our contract manufacturers, component suppliers and distribution partners. Although sales in several of our emerging countries decreased in recent periods, including in fiscal 2014, several of our emerging countries generally have been relatively fast growing, and we have announced plans to expand our commitments and expectations in certain of those countries. We expect that the weakness we experienced in recent periods in several emerging countries will continue for at least several quarters. Our future results could be materially adversely affected by a variety of political, economic or other factors relating to our operations inside and outside the United States, including impacts from the U.S. federal budget including the effect of the sequestration beginning in 2013; global central bank monetary policy; issues related to the political relationship between the United States and other countries which can affect the willingness of customers in those countries to purchase products from companies headquartered in the United States; and the challenging and inconsistent global macroeconomic environment, any or all of which could have a material adverse effect on our operating results and financial condition, including, among others, the following:
|
|
•
|
|
Foreign currency exchange rates
|
|
|
•
|
|
Political or social unrest
|
|
|
•
|
|
Economic instability or weakness or natural disasters in a specific country or region; environmental and trade protection measures and other legal and regulatory requirements, some of which may affect our ability to import our products, to export our products from, or sell our products in various countries
|
|
|
•
|
|
Political considerations that affect service provider and government spending patterns
|
|
|
•
|
|
Health or similar issues, such as a pandemic or epidemic
|
|
|
•
|
|
Difficulties in staffing and managing international operations
|
|
|
•
|
|
Adverse tax consequences, including imposition of withholding or other taxes on our global operations
|
WE ARE EXPOSED TO THE CREDIT RISK OF SOME OF OUR CUSTOMERS AND TO CREDIT EXPOSURES IN WEAKENED MARKETS, WHICH COULD RESULT IN MATERIAL LOSSES
Most of our sales are on an open credit basis, with typical payment terms of 30 days in the United States and, because of local customs or conditions, longer in some markets outside the United States. We monitor individual customer payment capability in granting such open credit arrangements, seek to limit such open credit to amounts we believe the customers can pay, and maintain reserves we believe are adequate to cover exposure for doubtful accounts. Beyond our open credit arrangements, we have also experienced demands for customer financing and facilitation of leasing arrangements. We expect demand for customer financing to continue, and recently we have been experiencing an increase in this demand as the credit markets have been impacted by the challenging and inconsistent global macroeconomic environment, including increased demand from customers in certain emerging countries.
26
We believe customer financing is a competitive factor in obtaining business, particularly in serving customers involved in significant infrastructure projects. Our loan financing arrangements may include not only financing the acquisition of our products and services but also providing additional funds for other costs associated with network installation and integration of our products and services.
Our exposure to the credit risks relating to our financing activities described above may increase if our customers are adversely affected by a global economic downturn or periods of economic uncertainty. Although we have programs in place that are designed to monitor and mitigate the associated risk, including monitoring of particular risks in certain geographic areas, there can be no assurance that such programs will be effective in reducing our credit risks.
In the past, there have been significant bankruptcies among customers both on open credit and with loan or lease financing arrangements, particularly among Internet businesses and service providers, causing us to incur economic or financial losses. There can be no assurance that additional losses will not be incurred. Although these losses have not been material to date, future losses, if incurred, could harm our business and have a material adverse effect on our operating results and financial condition. A portion of our sales is derived through our distributors. These distributors are generally given business terms that allow them to return a portion of inventory, receive credits for changes in selling prices, and participate in various cooperative marketing programs. We maintain estimated accruals and allowances for such business terms. However, distributors tend to have more limited financial resources than other resellers and end-user customers and therefore represent potential sources of increased credit risk, because they may be more likely to lack the reserve resources to meet payment obligations. Additionally, to the degree that turmoil in the credit markets makes it more difficult for some customers to obtain financing, those customers’ ability to pay could be adversely impacted, which in turn could have a material adverse impact on our business, operating results, and financial condition.
WE ARE EXPOSED TO FLUCTUATIONS IN THE MARKET VALUES OF OUR PORTFOLIO INVESTMENTS AND IN INTEREST RATES; IMPAIRMENT OF OUR INVESTMENTS COULD HARM OUR EARNINGS
We maintain an investment portfolio of various holdings, types, and maturities. These securities are generally classified as available-for-sale and, consequently, are recorded on our Consolidated Balance Sheets at fair value with unrealized gains or losses reported as a component of accumulated other comprehensive income, net of tax. Our portfolio includes fixed income securities and equity investments in publicly traded companies, the values of which are subject to market price volatility to the extent unhedged. If such investments suffer market price declines, as we experienced with some of our investments in the past, we may recognize in earnings the decline in the fair value of our investments below their cost basis when the decline is judged to be other than temporary. For information regarding the sensitivity of and risks associated with the market value of portfolio investments and interest rates, refer to the section titled “Quantitative and Qualitative Disclosures About Market Risk.” Our investments in private companies are subject to risk of loss of investment capital. These investments are inherently risky because the markets for the technologies or products they have under development are typically in the early stages and may never materialize. We could lose our entire investment in these companies.
WE ARE EXPOSED TO FLUCTUATIONS IN CURRENCY EXCHANGE RATES THAT COULD NEGATIVELY IMPACT OUR FINANCIAL RESULTS AND CASH FLOWS
Because a significant portion of our business is conducted outside the United States, we face exposure to adverse movements in foreign currency exchange rates. These exposures may change over time as business practices evolve, and they could have a material adverse impact on our financial results and cash flows. Historically, our primary exposures have related to nondollar-denominated sales in Japan, Canada, and Australia and certain nondollar-denominated operating expenses and service cost of sales in Europe, Latin America, and Asia, where we sell primarily in U.S. dollars. Additionally, we have exposures to emerging market currencies, which can have extreme currency volatility. An increase in the value of the dollar could increase the real cost to our customers of our products in those markets outside the United States where we sell in dollars, and a weakened dollar could increase the cost of local operating expenses and procurement of raw materials to the extent that we must purchase components in foreign currencies.
Currently, we enter into foreign exchange forward contracts and options to reduce the short-term impact of foreign currency fluctuations on certain foreign currency receivables, investments, and payables. In addition, we periodically hedge anticipated foreign currency cash flows. Our attempts to hedge against these risks may result in an adverse impact on our net income.
OUR PROPRIETARY RIGHTS MAY PROVE DIFFICULT TO ENFORCE
We generally rely on patents, copyrights, trademarks, and trade secret laws to establish and maintain proprietary rights in our technology and products. Although we have been issued numerous patents and other patent applications are currently pending, there can be no assurance that any of these patents or other proprietary rights will not be challenged, invalidated, or circumvented or that our rights will, in fact, provide competitive advantages to us. Furthermore, many key aspects of networking technology are governed by industrywide standards, which are usable by all market entrants. In addition, there can be no assurance that patents will be issued from pending applications or that claims allowed on any patents will be sufficiently broad to protect our technology. In addition, the laws of some foreign countries may not protect our proprietary rights to the same extent as do the laws of the
27
United States. The outcome of any actions taken in these foreign countries may be different than if such actions were determined under the laws of the United States. Although we are not dependent on any individual patents or group of patents for particular segments of the business for which we compete, if we are unable to protect our proprietary rights to the totality of the features (including aspects of products protected other than by patent rights) in a market, we may find ourselves at a competitive disadvantage to others who need not incur the substantial expense, time, and effort required to create innovative products that have enabled us to be successful.
WE MAY BE FOUND TO INFRINGE ON INTELLECTUAL PROPERTY RIGHTS OF OTHERS
Third parties, including customers, have in the past and may in the future assert claims or initiate litigation related to exclusive patent, copyright, trademark, and other intellectual property rights to technologies and related standards that are relevant to us. These assertions have increased over time as a result of our growth and the general increase in the pace of patent claims assertions, particularly in the United States. Because of the existence of a large number of patents in the networking field, the secrecy of some pending patents, and the rapid rate of issuance of new patents, it is not economically practical or even possible to determine in advance whether a product or any of its components infringes or will infringe on the patent rights of others. The asserted claims and/or initiated litigation can include claims against us or our manufacturers, suppliers, or customers, alleging infringement of their proprietary rights with respect to our existing or future products or components of those products. Regardless of the merit of these claims, they can be time-consuming, result in costly litigation and diversion of technical and management personnel, or require us to develop a non-infringing technology or enter into license agreements. Where claims are made by customers, resistance even to unmeritorious claims could damage customer relationships. There can be no assurance that licenses will be available on acceptable terms and conditions, if at all, or that our indemnification by our suppliers will be adequate to cover our costs if a claim were brought directly against us or our customers. Furthermore, because of the potential for high court awards that are not necessarily predictable, it is not unusual to find even arguably unmeritorious claims settled for significant amounts. If any infringement or other intellectual property claim made against us by any third party is successful, if we are required to indemnify a customer with respect to a claim against the customer, or if we fail to develop non-infringing technology or license the proprietary rights on commercially reasonable terms and conditions, our business, operating results, and financial condition could be materially and adversely affected. For additional information regarding our indemnification obligations, see Note 12(g) to the Consolidated Financial Statements contained in this report.
Our exposure to risks associated with the use of intellectual property may be increased as a result of acquisitions, as we have a lower level of visibility into the development process with respect to such technology or the care taken to safeguard against infringement risks. Further, in the past, third parties have made infringement and similar claims after we have acquired technology that had not been asserted prior to our acquisition.
WE RELY ON THE AVAILABILITY OF THIRD-PARTY LICENSES
Many of our products are designed to include software or other intellectual property licensed from third parties. It may be necessary in the future to seek or renew licenses relating to various aspects of these products. There can be no assurance that the necessary licenses would be available on acceptable terms, if at all. The inability to obtain certain licenses or other rights or to obtain such licenses or rights on favorable terms, or the need to engage in litigation regarding these matters, could have a material adverse effect on our business, operating results, and financial condition. Moreover, the inclusion in our products of software or other intellectual property licensed from third parties on a nonexclusive basis could limit our ability to protect our proprietary rights in our products.
OUR OPERATING RESULTS MAY BE ADVERSELY AFFECTED AND DAMAGE TO OUR REPUTATION MAY OCCUR DUE TO PRODUCTION AND SALE OF COUNTERFEIT VERSIONS OF OUR PRODUCTS
As is the case with leading products around the world, our products are subject to efforts by third parties to produce counterfeit versions of our products. While we work diligently with law enforcement authorities in various countries to block the manufacture of counterfeit goods and to interdict their sale, and to detect counterfeit products in customer networks, and have succeeded in prosecuting counterfeiters and their distributors, resulting in fines, imprisonment and restitution to us, there can be no guarantee that such efforts will succeed. While counterfeiters often aim their sales at customers who might not have otherwise purchased our products due to lack of verifiability of origin and service, such counterfeit sales, to the extent they replace otherwise legitimate sales, could adversely affect our operating results.
OUR OPERATING RESULTS AND FUTURE PROSPECTS COULD BE MATERIALLY HARMED BY UNCERTAINTIES OF REGULATION OF THE INTERNET
Currently, few laws or regulations apply directly to access or commerce on the Internet. We could be materially adversely affected by regulation of the Internet and Internet commerce in any country where we operate. Such regulations could include matters such as voice over the Internet or using IP, encryption technology, sales or other taxes on Internet product or service sales, and access charges for Internet service providers. The adoption of regulation of the Internet and Internet commerce could decrease demand
28
for our products and, at the same time, increase the cost of selling our products, which could have a material adverse effect on our business, operating results, and financial condition.
CHANGES IN TELECOMMUNICATIONS REGULATION AND TARIFFS COULD HARM OUR PROSPECTS AND FUTURE SALES
Changes in telecommunications requirements, or regulatory requirements in other industries in which we operate, in the United States or other countries could affect the sales of our products. In particular, we believe that there may be future changes in U.S. telecommunications regulations that could slow the expansion of the service providers’ network infrastructures and materially adversely affect our business, operating results, and financial condition.
Future changes in tariffs by regulatory agencies or application of tariff requirements to currently untariffed services could affect the sales of our products for certain classes of customers. Additionally, in the United States, our products must comply with various requirements and regulations of the Federal Communications Commission and other regulatory authorities. In countries outside of the United States, our products must meet various requirements of local telecommunications and other industry authorities. Changes in tariffs or failure by us to obtain timely approval of products could have a material adverse effect on our business, operating results, and financial condition.
FAILURE TO RETAIN AND RECRUIT KEY PERSONNEL WOULD HARM OUR ABILITY TO MEET KEY OBJECTIVES
Our success has always depended in large part on our ability to attract and retain highly skilled technical, managerial, sales, and marketing personnel. Competition for these personnel is intense, especially in the Silicon Valley area of Northern California. Stock incentive plans are designed to reward employees for their long-term contributions and provide incentives for them to remain with us. Volatility or lack of positive performance in our stock price or equity incentive awards, or changes to our overall compensation program, including our stock incentive program, resulting from the management of share dilution and share-based compensation expense or otherwise, may also adversely affect our ability to retain key employees. As a result of one or more of these factors, we may increase our hiring in geographic areas outside the United States, which could subject us to additional geopolitical and exchange rate risk. The loss of services of any of our key personnel; the inability to retain and attract qualified personnel in the future; or delays in hiring required personnel, particularly engineering and sales personnel, could make it difficult to meet key objectives, such as timely and effective product introductions. In addition, companies in our industry whose employees accept positions with competitors frequently claim that competitors have engaged in improper hiring practices. We have received these claims in the past and may receive additional claims to this effect in the future.
ADVERSE RESOLUTION OF LITIGATION OR GOVERNMENTAL INVESTIGATIONS MAY HARM OUR OPERATING RESULTS OR FINANCIAL CONDITION
We are a party to lawsuits in the normal course of our business. Litigation can be expensive, lengthy, and disruptive to normal business operations. Moreover, the results of complex legal proceedings are difficult to predict. For example, Brazilian authorities have investigated our Brazilian subsidiary and certain of its current and former employees, as well as a Brazilian importer of our products, and its affiliates and employees, relating to alleged evasion of import taxes and alleged improper transactions involving the subsidiary and the importer. Brazilian tax authorities have assessed claims against our Brazilian subsidiary based on a theory of joint liability with the Brazilian importer for import taxes, interest, and penalties. In the first quarter of fiscal 2013, the Brazilian federal tax authorities asserted an additional claim against our Brazilian subsidiary based on a theory of joint liability with respect to an alleged underpayment of income taxes, social taxes, interest, and penalties by a Brazilian distributor. The asserted claims by Brazilian federal tax authorities are for calendar years 2003 through 2008 and the related asserted claims by the tax authorities from the state of Sao Paulo are for calendar years 2005 through 2007. The total asserted claims by Brazilian state and federal tax authorities aggregate to approximately
$389 million
for the alleged evasion of import and other taxes, approximately
$1.3 billion
for interest, and approximately
$1.7 billion
for various penalties, all determined using an exchange rate as of
July 26, 2014
. We have completed a thorough review of the matters and believe the asserted claims against our Brazilian subsidiary are without merit, and we are defending the claims vigorously. While we believe there is no legal basis for the alleged liability, due to the complexities and uncertainty surrounding the judicial process in Brazil and the nature of the claims asserting joint liability with the importer, we are unable to determine the likelihood of an unfavorable outcome against our Brazilian subsidiary and are unable to reasonably estimate a range of loss, if any. We do not expect a final judicial determination for several years. An unfavorable resolution of lawsuits or governmental investigations could have a material adverse effect on our business, operating results, or financial condition. For additional information regarding certain of the matters in which we are involved, see Item 3, “Legal Proceedings,” contained in Part I of this report.
29
CHANGES IN OUR PROVISION FOR INCOME TAXES OR ADVERSE OUTCOMES RESULTING FROM EXAMINATION OF OUR INCOME TAX RETURNS COULD ADVERSELY AFFECT OUR RESULTS
Our provision for income taxes is subject to volatility and could be adversely affected by earnings being lower than anticipated in countries that have lower tax rates and higher than anticipated in countries that have higher tax rates; by changes in the valuation of our deferred tax assets and liabilities; by expiration of or lapses in the R&D tax credit or domestic manufacturing deduction laws; by expiration of or lapses in tax incentives; by transfer pricing adjustments, including the effect of acquisitions on our intercompany R&D cost sharing arrangement and legal structure; by tax effects of nondeductible compensation; by tax costs related to intercompany realignments; by changes in accounting principles; or by changes in tax laws and regulations, treaties, or interpretations thereof, including possible changes to the taxation of earnings of our foreign subsidiaries, the deductibility of expenses attributable to foreign income, or the foreign tax credit rules. Significant judgment is required to determine the recognition and measurement attribute prescribed in the accounting guidance for uncertainty in income taxes. The Organisation for Economic Co-operation and Development (OECD), an international association of 34 countries including the United States, is contemplating changes to numerous long-standing tax principles. These contemplated changes, if finalized and adopted by countries, will increase tax uncertainty and may adversely affect our provision for income taxes. Further, as a result of certain of our ongoing employment and capital investment actions and commitments, our income in certain countries is subject to reduced tax rates and in some cases is wholly exempt from tax. Our failure to meet these commitments could adversely impact our provision for income taxes. In addition, we are subject to the continuous examination of our income tax returns by the Internal Revenue Service and other tax authorities. We regularly assess the likelihood of adverse outcomes resulting from these examinations to determine the adequacy of our provision for income taxes. There can be no assurance that the outcomes from these continuous examinations will not have an adverse effect on our operating results and financial condition.
OUR BUSINESS AND OPERATIONS ARE ESPECIALLY SUBJECT TO THE RISKS OF EARTHQUAKES, FLOODS, AND OTHER NATURAL CATASTROPHIC EVENTS
Our corporate headquarters, including certain of our research and development operations are located in the Silicon Valley area of Northern California, a region known for seismic activity. Additionally, a certain number of our facilities are located near rivers that have experienced flooding in the past. Also certain of our suppliers and logistics centers are located in regions that have or may be affected by earthquake, tsunami and flooding activity which in the past has disrupted, and in the future could disrupt, the flow of components and delivery of products. A significant natural disaster, such as an earthquake, a hurricane, volcano, or a flood, could have a material adverse impact on our business, operating results, and financial condition.
MAN-MADE PROBLEMS SUCH AS COMPUTER VIRUSES OR TERRORISM MAY DISRUPT OUR OPERATIONS AND HARM OUR OPERATING RESULTS
Despite our implementation of network security measures our servers are vulnerable to computer viruses, break-ins, and similar disruptions from unauthorized tampering with our computer systems. Any such event could have a material adverse effect on our business, operating results, and financial condition. Efforts to limit the ability of malicious third parties to disrupt the operations of the Internet or undermine our own security efforts may meet with resistance. In addition, the continued threat of terrorism and heightened security and military action in response to this threat, or any future acts of terrorism, may cause further disruptions to the economies of the United States and other countries and create further uncertainties or otherwise materially harm our business, operating results, and financial condition. Likewise, events such as widespread blackouts could have similar negative impacts. To the extent that such disruptions or uncertainties result in delays or cancellations of customer orders or the manufacture or shipment of our products, our business, operating results, and financial condition could be materially and adversely affected.
IF WE DO NOT SUCCESSFULLY MANAGE OUR STRATEGIC ALLIANCES, WE MAY NOT REALIZE THE EXPECTED BENEFITS FROM SUCH ALLIANCES AND WE MAY EXPERIENCE INCREASED COMPETITION OR DELAYS IN PRODUCT DEVELOPMENT
We have several strategic alliances with large and complex organizations and other companies with which we work to offer complementary products and services and have established a joint venture to market services associated with our Cisco Unified Computing System products. These arrangements are generally limited to specific projects, the goal of which is generally to facilitate product compatibility and adoption of industry standards. There can be no assurance we will realize the expected benefits from these strategic alliances or from the joint venture. If successful, these relationships may be mutually beneficial and result in industry growth. However, alliances carry an element of risk because, in most cases, we must compete in some business areas with a company with which we have a strategic alliance and, at the same time, cooperate with that company in other business areas. Also, if these companies fail to perform or if these relationships fail to materialize as expected, we could suffer delays in product development or other operational difficulties. Joint ventures can be difficult to manage, given the potentially different interests of joint venture partners.
30
OUR STOCK PRICE MAY BE VOLATILE
Historically, our common stock has experienced substantial price volatility, particularly as a result of variations between our actual financial results and the published expectations of analysts and as a result of announcements by our competitors and us. Furthermore, speculation in the press or investment community about our strategic position, financial condition, results of operations, business, security of our products, or significant transactions can cause changes in our stock price. In addition, the stock market has experienced extreme price and volume fluctuations that have affected the market price of many technology companies, in particular, and that have often been unrelated to the operating performance of these companies. These factors, as well as general economic and political conditions and the announcement of proposed and completed acquisitions or other significant transactions, or any difficulties associated with such transactions, by us or our current or potential competitors, may materially adversely affect the market price of our common stock in the future. Additionally, volatility, lack of positive performance in our stock price or changes to our overall compensation program, including our stock incentive program, may adversely affect our ability to retain key employees, virtually all of whom are compensated, in part, based on the performance of our stock price.
THERE CAN BE NO ASSURANCE THAT OUR OPERATING RESULTS AND FINANCIAL CONDITION WILL NOT BE ADVERSELY AFFECTED BY OUR INCURRENCE OF DEBT
We have senior unsecured notes outstanding in an aggregate principal amount of
$20.8 billion
that mature at specific dates from calendar year 2014 through 2040. We have also established a commercial paper program under which we may issue short-term, unsecured commercial paper notes on a private placement basis up to a maximum aggregate amount outstanding at any time of
$3.0 billion
, and we had no commercial paper notes outstanding under this program as of
July 26, 2014
.
The outstanding senior unsecured notes bear fixed-rate interest payable semiannually, except
$2.35 billion
of the notes which bears interest at a floating rate payable quarterly. The fair value of the long-term debt is subject to market interest rate volatility. The instruments governing the senior unsecured notes contain certain covenants applicable to us and our wholly-owned subsidiaries that may adversely affect our ability to incur certain liens or engage in certain types of sale and leaseback transactions. In addition, we will be required to have available in the United States sufficient cash to service the interest on our debt and repay all of our notes on maturity. There can be no assurance that our incurrence of this debt or any future debt will be a better means of providing liquidity to us than would our use of our existing cash resources, including cash currently held offshore. Further, we cannot be assured that our maintenance of this indebtedness or incurrence of future indebtedness will not adversely affect our operating results or financial condition. In addition, changes by any rating agency to our credit rating can negatively impact the value and liquidity of both our debt and equity securities, as well as the terms upon which we may borrow under our commercial paper program or future debt issuances.
|
Item 1B.
|
Unresolved Staff Comments
|
Not applicable.
|
Item 2.
|
Properties
|
Our corporate headquarters are located at an owned site in San Jose, California, in the United States of America.
The locations of our headquarters by geographic segment are as follows:
|
Americas
|
EMEA
|
APJC
|
||
|
San Jose, California, USA
|
Amsterdam, Netherlands
|
Singapore
|
||
In addition to our headquarters site, we own additional sites in the United States, which include facilities in the surrounding areas of San Jose, California; Research Triangle Park, North Carolina; Richardson, Texas; Lawrenceville, Georgia; and Boston, Massachusetts. We also own land for expansion in some of these locations. In addition, we lease office space in many U.S. locations.
Outside the United States our operations are conducted primarily in leased sites, such as our Globalisation Centre East campus in Bangalore, India. Other significant sites (in addition to the two non-U.S. headquarters locations) are located in Belgium, China, France, Germany, India, Israel, Italy, Japan, Norway and the United Kingdom.
We believe that our existing facilities, including both owned and leased, are in good condition and suitable for the conduct of our business. For additional information regarding obligations under operating leases, see Note 12 to the Consolidated Financial Statements.
31
|
Item 3.
|
Legal Proceedings
|
Brazil
Brazilian authorities have investigated our Brazilian subsidiary and certain of its current and former employees, as well as a Brazilian importer of our products, and its affiliates and employees, relating to alleged evasion of import taxes and alleged improper transactions involving the subsidiary and the importer. Brazilian tax authorities have assessed claims against our Brazilian subsidiary based on a theory of joint liability with the Brazilian importer for import taxes, interest, and penalties. In addition to claims asserted by the Brazilian federal tax authorities in prior fiscal years, tax authorities from the Brazilian state of Sao Paulo have asserted similar claims on the same legal basis in prior fiscal years. In the first quarter of fiscal 2013, the Brazilian federal tax authorities asserted an additional claim against our Brazilian subsidiary based on a theory of joint liability with respect to an alleged underpayment of income taxes, social taxes, interest, and penalties by a Brazilian distributor.
The asserted claims by Brazilian federal tax authorities are for calendar years 2003 through 2008, and the asserted claims by the tax authorities from the state of Sao Paulo are for calendar years 2005 through 2007. The total asserted claims by Brazilian state and federal tax authorities aggregate to approximately
$389 million
for the alleged evasion of import and other taxes, approximately
$1.3 billion
for interest, and approximately
$1.7 billion
for various penalties, all determined using an exchange rate as of
July 26, 2014
. We have completed a thorough review of the matters and believe the asserted claims against our Brazilian subsidiary are without merit, and we are defending the claims vigorously. While we believe there is no legal basis for the alleged liability, due to the complexities and uncertainty surrounding the judicial process in Brazil and the nature of the claims asserting joint liability with the importer, we are unable to determine the likelihood of an unfavorable outcome against our Brazilian subsidiary and are unable to reasonably estimate a range of loss, if any. We do not expect a final judicial determination for several years.
Russia and the Commonwealth of Independent States
At the request of the U.S. Securities and Exchange Commission (SEC)and the U.S. Department of Justice, we are conducting an investigation into allegations which we and those agencies received regarding possible violations of the U.S. Foreign Corrupt Practices Act involving business activities of Cisco's operations in Russia and certain of the Commonwealth of Independent States, and by certain resellers of our products in those countries. We take any such allegations very seriously and are fully cooperating with and sharing the results of our investigation with the SEC and the Department of Justice. While the outcome of our investigation is currently not determinable, we do not expect that it will have a material adverse effect on our consolidated financial position, results of operations, or cash flows. The countries that are the subject of the investigation collectively comprise less than 2% of our revenues.
Rockstar
We and some of our service provider customers are subject to patent claims asserted in December 2013 in the Eastern District of Texas and the District of Delaware by subsidiaries of the Rockstar Consortium ("Rockstar"). Rockstar, whose members include Apple, Microsoft, LM Ericsson, Sony, and Blackberry, purchased a portfolio of patents out of the Nortel Networks’ bankruptcy proceedings (the “Nortel Portfolio”). Rockstar’s subsidiaries allege that some of our NGN Routing, Switching and Collaboration products, as well as video solutions deployed by our service provider customers, infringe some of the patents in the Nortel Portfolio. Rockstar seeks monetary damages. A trial date for one service provider customer has been set for October 2015; no other trial dates have been set. We have various defenses to the patent infringement allegations, and have various offensive claims against Rockstar and some of its consortium members available to us as well, and we will also explore alternative means of resolution. Due to the uncertainty surrounding the litigation process, which involves numerous lawsuits and parties, we are unable to reasonably estimate the ultimate outcome and a range of loss, if any, of these litigations at this time.
In addition, we are subject to legal proceedings, claims, and litigation arising in the ordinary course of business, including intellectual property litigation. While the outcome of these matters is currently not determinable, we do not expect that the ultimate costs to resolve these matters will have a material adverse effect on our consolidated financial position, results of operations, or cash flows. For additional information regarding intellectual property litigation, see “Part I, Item 1A. Risk Factors-We may be found to infringe on intellectual property rights of others” herein.
|
Item 4.
|
Mine Safety Disclosures
|
Not Applicable.
32
|
Item 5.
|
Market for Registrant’s Common Equity, Related Stockholder Matters, and Issuer Purchases of Equity Securities
|
|
(a)
|
Cisco common stock is traded on the NASDAQ Global Select Market under the symbol CSCO. Information regarding quarterly cash dividends declared on Cisco’s common stock during
fiscal 2014
and 2013 may be found in Supplementary Financial Data on page 122 of this report. There were 49,936 registered shareholders as of
September 4, 2014
. The high and low common stock sales prices per share for each period were as follows:
|
|
|
FISCAL 2014
|
FISCAL 2013
|
|||||||||||||
|
Fiscal Quarter
|
High
|
Low
|
High
|
Low
|
|||||||||||
|
First quarter
|
$
|
26.49
|
|
$
|
22.10
|
|
$
|
19.75
|
|
$
|
15.65
|
|
|||
|
Second quarter
|
$
|
24.00
|
|
$
|
20.22
|
|
$
|
21.25
|
|
$
|
16.68
|
|
|||
|
Third quarter
|
$
|
23.64
|
|
$
|
21.27
|
|
$
|
21.98
|
|
$
|
19.98
|
|
|||
|
Fourth quarter
|
$
|
26.08
|
|
$
|
22.43
|
|
$
|
26.15
|
|
$
|
20.29
|
|
|||
|
(b)
|
Not applicable.
|
|
(c)
|
Issuer purchases of equity securities (in millions, except per-share amounts):
|
|
Period
|
Total
Number of
Shares
Purchased
|
Average Price Paid
per Share
|
Total Number of Shares
Purchased as Part of
Publicly Announced
Plans or Programs
|
Approximate Dollar Value of Shares
That May Yet Be Purchased
Under the Plans or Programs
|
|||||||||
|
April 27, 2014 to May 24, 2014
|
4
|
|
$
|
24.38
|
|
4
|
|
$
|
9,965
|
|
|||
|
May 25, 2014 to June 21, 2014
|
17
|
|
$
|
24.74
|
|
17
|
|
$
|
9,550
|
|
|||
|
June 22, 2014 to July 26, 2014
|
40
|
|
$
|
25.34
|
|
40
|
|
$
|
8,555
|
|
|||
|
Total
|
61
|
|
$
|
25.11
|
|
61
|
|
||||||
On September 13, 2001, we announced that our Board of Directors had authorized a stock repurchase program. As of
July 26, 2014
, our Board of Directors had authorized the repurchase of up to
$97 billion
of common stock under this program. During
fiscal 2014
, we repurchased and retired
420 million
shares of our common stock at an average price of
$22.71
per share for an aggregate purchase price of
$9.5 billion
. As of
July 26, 2014
, we had repurchased and retired
4.3 billion
shares of our common stock at an average price of
$20.63
per share for an aggregate purchase price of
$88.4 billion
since inception of the stock repurchase program, and the remaining authorized amount for stock repurchases under this program was
$8.6 billion
with no termination date.
For the majority of restricted stock units granted, the number of shares issued on the date the restricted stock units vest is net of shares withheld to meet applicable tax withholding requirements. Although these withheld shares are not issued or considered common stock repurchases under our stock repurchase program and therefore are not included in the preceding table, they are treated as common stock repurchases in our financial statements as they reduce the number of shares that would have been issued upon vesting (see Note 13 to the Consolidated Financial Statements).
33
Stock Performance Graph
The information contained in this Stock Performance Graph section shall not be deemed to be “soliciting material” or “filed” or incorporated by reference in future filings with the SEC, or subject to the liabilities of Section 18 of the Securities Exchange Act of 1934, except to the extent that Cisco specifically incorporates it by reference into a document filed under the Securities Act of 1933 or the Securities Exchange Act of 1934.
The following graph shows a five-year comparison of the cumulative total shareholder return on Cisco common stock with the cumulative total returns of the S&P Information Technology Index and the S&P 500 Index. The graph tracks the performance of a $100 investment in the Company’s common stock and in each of the indexes (with the reinvestment of all dividends) on the date specified. Shareholder returns over the indicated period are based on historical data and should not be considered indicative of future shareholder returns.
Comparison of 5-Year Cumulative Total Return Among Cisco Systems, Inc.,
the S&P Information Technology Index, and the S&P 500 Index
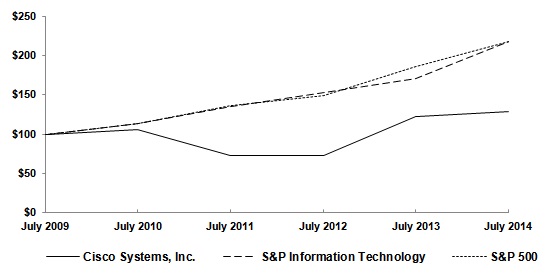
|
July 2009
|
July 2010
|
July 2011
|
July 2012
|
July 2013
|
July 2014
|
||||||||||||||||||
|
Cisco Systems, Inc.
|
$
|
100.00
|
|
$
|
105.44
|
|
$
|
73.52
|
|
$
|
73.36
|
|
$
|
122.82
|
|
$
|
129.01
|
|
|||||
|
S&P Information Technology
|
$
|
100.00
|
|
$
|
113.72
|
|
$
|
135.55
|
|
$
|
153.25
|
|
$
|
170.31
|
|
$
|
218.22
|
|
|||||
|
S&P 500
|
$
|
100.00
|
|
$
|
113.83
|
|
$
|
136.21
|
|
$
|
148.64
|
|
$
|
185.80
|
|
$
|
217.28
|
|
|||||
34
|
Item 6.
|
Selected Financial Data
|
Five Years Ended
July 26, 2014
(in millions, except per-share amounts)
|
Years Ended
|
July 26, 2014
(1)
|
July 27, 2013
(2)
|
July 28, 2012
|
July 30, 2011
(3)
|
July 31, 2010
|
||||||||||||||
|
Revenue
|
$
|
47,142
|
|
$
|
48,607
|
|
$
|
46,061
|
|
$
|
43,218
|
|
$
|
40,040
|
|
||||
|
Net income
|
$
|
7,853
|
|
$
|
9,983
|
|
$
|
8,041
|
|
$
|
6,490
|
|
$
|
7,767
|
|
||||
|
Net income per share—basic
|
$
|
1.50
|
|
$
|
1.87
|
|
$
|
1.50
|
|
$
|
1.17
|
|
$
|
1.36
|
|
||||
|
Net income per share—diluted
|
$
|
1.49
|
|
$
|
1.86
|
|
$
|
1.49
|
|
$
|
1.17
|
|
$
|
1.33
|
|
||||
|
Shares used in per-share calculation—basic
|
5,234
|
|
5,329
|
|
5,370
|
|
5,529
|
|
5,732
|
|
|||||||||
|
Shares used in per-share calculation—diluted
|
5,281
|
|
5,380
|
|
5,404
|
|
5,563
|
|
5,848
|
|
|||||||||
|
Cash dividends declared per common share
|
$
|
0.72
|
|
$
|
0.62
|
|
$
|
0.28
|
|
$
|
0.12
|
|
$
|
—
|
|
||||
|
Net cash provided by operating activities
|
$
|
12,332
|
|
$
|
12,894
|
|
$
|
11,491
|
|
$
|
10,079
|
|
$
|
10,173
|
|
||||
|
|
July 26, 2014
|
July 27, 2013
|
July 28, 2012
|
July 30, 2011
|
July 31, 2010
|
||||||||||||||
|
Cash and cash equivalents and investments
|
$
|
52,074
|
|
$
|
50,610
|
|
$
|
48,716
|
|
$
|
44,585
|
|
$
|
39,861
|
|
||||
|
Total assets
|
$
|
105,134
|
|
$
|
101,191
|
|
$
|
91,759
|
|
$
|
87,095
|
|
$
|
81,130
|
|
||||
|
Debt
|
$
|
20,909
|
|
$
|
16,211
|
|
$
|
16,328
|
|
$
|
16,822
|
|
$
|
15,284
|
|
||||
|
Deferred revenue
|
$
|
14,142
|
|
$
|
13,423
|
|
$
|
12,880
|
|
$
|
12,207
|
|
$
|
11,083
|
|
||||
|
(1)
|
In the second quarter of fiscal 2014, Cisco recorded a pre-tax charge of $655 million to product cost of sales, which corresponds to $526 million, net of tax, for the expected remediation cost for certain products sold in prior fiscal years containing memory components manufactured by a single supplier between 2005 and 2010. See Note 12(f) to the Consolidated Financial Statements.
|
|
(2)
|
In the second quarter of fiscal 2013, the Internal Revenue Service (IRS) and Cisco settled all outstanding items related to its federal income tax returns for fiscal 2002 through fiscal 2007. As a result of the settlement, Cisco recorded a net tax benefit of $794 million. Also during the second quarter of fiscal 2013, the American Taxpayer Relief Act of 2012 reinstated the U.S. federal R&D tax credit, retroactive to January 1, 2012. As a result of the credit, Cisco recognized tax benefits of $184 million in fiscal 2013, of which $72 million related to fiscal 2012 R&D expenses.
|
|
(3)
|
Net income for the year ended July 30, 2011 included restructuring and other charges of $694 million, net of tax. Cisco also incurred restructuring charges in fiscal 2012 through fiscal 2014. See Note 5 to the Consolidated Financial Statements.
|
No other factors materially affected the comparability of the information presented above.
35
|
Item 7.
|
Management’s Discussion and Analysis of Financial Condition and Results of Operations
|
Forward-Looking Statements
This Annual Report on Form 10-K, including this Management’s Discussion and Analysis of Financial Condition and Results of Operations, contains forward-looking statements regarding future events and our future results that are subject to the safe harbors created under the Securities Act of 1933 (the “Securities Act”) and the Securities Exchange Act of 1934 (the “Exchange Act”). All statements other than statements of historical facts are statements that could be deemed forward-looking statements. These statements are based on current expectations, estimates, forecasts, and projections about the industries in which we operate and the beliefs and assumptions of our management. Words such as “expects,” “anticipates,” “targets,” “goals,” “projects,” “intends,” “plans,” “believes,” “seeks,” “estimates,” “continues,” “endeavors,” “strives,” “may,” variations of such words, and similar expressions are intended to identify such forward-looking statements. In addition, any statements that refer to projections of our future financial performance, our anticipated growth and trends in our businesses, and other characterizations of future events or circumstances are forward-looking statements. Readers are cautioned that these forward-looking statements are only predictions and are subject to risks, uncertainties, and assumptions that are difficult to predict, including those under “Part I, Item 1A. Risk Factors,” and elsewhere herein. Therefore, actual results may differ materially and adversely from those expressed in any forward-looking statements. We undertake no obligation to revise or update any forward-looking statements for any reason.
OVERVIEW
We design, manufacture, and sell Internet Protocol (IP) based networking products and services related to the communications and information technology (IT) industry. Our customers include businesses of all sizes, public institutions, telecommunications companies, other service providers and individuals. We connect people, process, data and things with products that transport data, voice, and video within buildings, across campuses, and around the world. We are a key strategic partner to companies that helps them as they seek to make the most of the Internet of Everything (IoE) and connect the unconnected.
A summary of our results is as follows (in millions, except percentages and per-share amounts):
|
Three Months Ended
|
Fiscal Year Ended
|
|||||||||||||||||||||
|
July 26, 2014
|
July 27, 2013
|
Variance
|
July 26, 2014
|
July 27, 2013
|
Variance
|
|||||||||||||||||
|
Revenue
|
$
|
12,357
|
|
$
|
12,417
|
|
(0.5
|
)%
|
$
|
47,142
|
|
$
|
48,607
|
|
(3.0
|
)%
|
||||||
|
Gross margin percentage
|
59.9
|
%
|
59.2
|
%
|
0.7
|
|
pts
|
58.9
|
%
|
60.6
|
%
|
(1.7
|
)
|
pts
|
||||||||
|
Research and development
|
$
|
1,593
|
|
$
|
1,517
|
|
5.0
|
%
|
$
|
6,294
|
|
$
|
5,942
|
|
5.9
|
%
|
||||||
|
Sales and marketing
|
$
|
2,473
|
|
$
|
2,360
|
|
4.8
|
%
|
$
|
9,503
|
|
$
|
9,538
|
|
(0.4
|
)%
|
||||||
|
General and administrative
|
$
|
508
|
|
$
|
590
|
|
(13.9
|
)%
|
$
|
1,934
|
|
$
|
2,264
|
|
(14.6
|
)%
|
||||||
|
Total R&D, sales and marketing, general and administrative
|
$
|
4,574
|
|
$
|
4,467
|
|
2.4
|
%
|
$
|
17,731
|
|
$
|
17,744
|
|
(0.1
|
)%
|
||||||
|
Total as a percentage of revenue
|
37.0
|
%
|
36.0
|
%
|
1.0
|
|
pts
|
37.6
|
%
|
36.5
|
%
|
1.1
|
|
pts
|
||||||||
|
Amortization of purchased intangible assets
|
$
|
68
|
|
$
|
66
|
|
3.0
|
%
|
$
|
275
|
|
$
|
395
|
|
(30.4
|
)%
|
||||||
|
Restructuring and other charges
|
$
|
82
|
|
$
|
—
|
|
NM*
|
$
|
418
|
|
$
|
105
|
|
298.1
|
%
|
|||||||
|
Operating income as a percentage of revenue
|
21.7
|
%
|
22.7
|
%
|
(1.0
|
)
|
pts
|
19.8
|
%
|
23.0
|
%
|
(3.2
|
)
|
pts
|
||||||||
|
Income tax percentage
|
19.1
|
%
|
20.9
|
%
|
(1.8
|
)
|
pts
|
19.2
|
%
|
11.1
|
%
|
8.1
|
|
pts
|
||||||||
|
Net income
|
$
|
2,247
|
|
$
|
2,270
|
|
(1.0
|
)%
|
$
|
7,853
|
|
$
|
9,983
|
|
(21.3
|
)%
|
||||||
|
Net income as a percentage of revenue
|
18.2
|
%
|
18.3
|
%
|
(0.1
|
)
|
pts
|
16.7
|
%
|
20.5
|
%
|
(3.8
|
)
|
pts
|
||||||||
|
Earnings per share—diluted
|
$
|
0.43
|
|
$
|
0.42
|
|
2.4
|
%
|
$
|
1.49
|
|
$
|
1.86
|
|
(19.9
|
)%
|
||||||
* Not meaningful
36
Fiscal 2014 Compared with Fiscal 2013—Financial Performance
Total revenue decreased by
3%
as compared with fiscal 2013. Within the total revenue change, product revenue decreased
5%
and service revenue increased
4%
. Total gross margin decreased by
1.7
percentage points, driven by unfavorable impacts from pricing and mix partially offset by productivity improvements and also due to the $655 million charge to product cost of sales recorded in fiscal 2014 related to the expected cost of remediation of issues with memory components in certain products sold in prior fiscal years. Despite a slight year-over-year decline in absolute dollars, research and development, sales and marketing, and general and administrative expenses, collectively, increased by
1.1
percentage points as a percentage of revenue due to the decline in revenue. Operating income as a percentage of revenue decreased by
3.2
percentage points. Diluted earnings per share decreased by
20%
from the prior year, driven by a
21%
decrease in net income. The decrease in net income in fiscal 2014 compared with fiscal 2013 was also attributable to net tax benefits in fiscal 2013 related to a settlement with the IRS and reinstatement of the U.S. Federal R&D tax credit.
Fiscal 2014 Compared with Fiscal 2013—Business Summary
In
fiscal 2014
, revenue decreased by
$1.5 billion
as compared with fiscal 2013. Revenue from the Americas decreased by
$0.9 billion
, driven by lower product revenue in most countries in this segment including the United States. While we experienced relative stability across Europe, EMEA revenue decreased
$0.2 billion
, led by product revenue declines in Russia as well as various other countries in this segment. Revenue in our APJC segment decreased
$0.4 billion
, led by product revenue declines in Japan and India. The weakness we encountered in emerging countries throughout the world in the later part of fiscal 2013 continued during fiscal 2014. The emerging countries of Brazil, Russia, India, China, and Mexico (“BRICM”), in the aggregate, experienced an
11% product revenue decline,
with declines across all of our customer markets. We believe that the product revenue declines in many of these emerging countries were driven by the impact of economic and geopolitical challenges in these countries. While we saw some improvement in our business momentum in emerging countries in the second and third quarters of fiscal 2014, we experienced a decline in our business momentum in these countries during the fourth quarter of fiscal 2014.
In
fiscal 2014
, product revenue declined across all customer markets, with the most significant decline in the service provider market. Within the service provider market, the largest impacts came from the continued product revenue decline in our Service Provider Video category and the ongoing decline of product revenue in the emerging countries.
From a product category perspective, the product revenue decrease of
5%
year-over-year was driven in large part by the lower product revenue within our core routing and switching product categories. While we saw improvement in business momentum with respect to high-end routers during the second half of fiscal 2014, there was only a limited revenue contribution related to some of our recently introduced products, as product transitions in this area are still in their early stages. The effects of these product transitions, combined with other challenges, led to a decrease in NGN Routing revenue of
7%
. We also experienced a
5%
decrease in revenue from our Switching products. The other major product categories experienced revenue changes ranging from an
18%
decrease in Service Provider Video to a
27%
increase in Data Center. The decrease in revenue from our Service Provider Video products was driven largely by a decrease in revenue from sales of set-top boxes. Partially offsetting the decline in product revenue was an increase in service revenue. Service revenue increased by
4%
, reflecting continued slower growth compared with prior years, which we believe was attributable to the impact of the declines in product revenue in recent periods.
As we continue to focus on investing in growth, innovation, and talent, while managing costs and driving efficiencies, we announced a restructuring plan that will impact up to 6,000 employees, representing approximately 8% of our global workforce. We expect to reinvest substantially all of the cost savings from the restructuring actions in our key growth areas such as data center, software, security, and cloud.
In summary, while we saw some improved business momentum in the second half of fiscal 2014, we experienced many challenges during fiscal 2014 including reduced spending by our service provider customers, weakness in emerging countries, the impact of product transitions, and a conservative approach to IT-related capital spending by customers. We expect that the challenges in the emerging countries, the service provider customer market, and product transitions in Switching and NGN Routing may continue for at least the next several quarters.
37
Fourth Quarter Snapshot
For the fourth quarter of
fiscal 2014
, as compared with the corresponding period in
fiscal 2013
, total revenue was flat. Within the total revenue change, product revenue declined by
2%
and service revenue increased by
5%
. With regard to our geographic segment performance, on a year-over-year basis, revenue in the Americas and in EMEA both decreased by
1%
while we experienced a slight increase by
1%
in our APJC segment. Total gross margin increased by
0.7
percentage points, primarily due to the TiVo patent litigation settlement in the fourth quarter of fiscal 2013. As a percentage of revenue, research and development, sales and marketing, and general and administrative expenses collectively increased by
1.0
percentage points. Operating income as a percentage of revenue decreased by
1.0
percentage points, primarily as a result of higher restructuring and other charges, and also the impact of our revenue decrease. Diluted earnings per share increased by
2%
from the prior year, primarily as a result of a decrease in our diluted share count.
Strategy and Focus Areas
Our strategy is to deliver the integrated architectures, solutions, and outcomes to help our customers grow, manage costs, and mitigate risk. We see our customers, in almost every industry, becoming increasingly reliant on technology—and specifically the network—to meet their business objectives and compete successfully in the market.
Our focus continues to be on capitalizing on market transitions to maintain leadership in our core markets and to enter new markets where the network is foundational. We believe this focus best positions us to become a more relevant and trusted partner to our customers and to expand our share of our customers’ IT spending. We are focused on driving the innovation, speed, agility, and efficiencies in our company required to deliver leading technology solutions for our customers and shareholder value for our investors.
Over the last few years, we have been working to transform our business to move from selling individual products and services to selling products and services integrated into architectures and solutions, as well as to meet customers' business outcomes. As a part of this transformation, we are making changes to how we are organized and how we deliver our technology. We believe these changes enable us to better meet our customers’ requirements and help them stay ahead of market transitions.
For a full discussion of our strategy and focus areas, see Item 1. Business.
Other Key Financial Measures
The following is a summary of our other key financial measures for
fiscal 2014
compared with
fiscal 2013
(in millions, except days sales outstanding in accounts receivable (DSO) and annualized inventory turns):
|
Fiscal 2014
|
Fiscal 2013
|
|||
|
Cash and cash equivalents and investments
|
$52,074
|
$50,610
|
||
|
Cash provided by operating activities
|
$12,332
|
$12,894
|
||
|
Deferred revenue
|
$14,142
|
$13,423
|
||
|
Repurchases of common stock—stock repurchase program
|
$9,539
|
$2,773
|
||
|
Dividends
|
$3,758
|
$3,310
|
||
|
DSO
|
38 days
|
40 days
|
||
|
Inventories
|
$1,591
|
$1,476
|
||
|
Annualized inventory turns
|
12.7
|
13.8
|
||
Our product backlog at the end of
fiscal 2014
was
$5.4 billion
, or
12%
of
fiscal 2014
total revenue, compared with
$4.9 billion
at the end of
fiscal 2013
, or
10%
of
fiscal 2013
total revenue.
38
CRITICAL ACCOUNTING ESTIMATES
The preparation of financial statements and related disclosures in conformity with accounting principles generally accepted in the United States requires us to make judgments, assumptions, and estimates that affect the amounts reported in the Consolidated Financial Statements and accompanying notes. Note 2 to the Consolidated Financial Statements describes the significant accounting policies and methods used in the preparation of the Consolidated Financial Statements. The accounting policies described below are significantly affected by critical accounting estimates. Such accounting policies require significant judgments, assumptions, and estimates used in the preparation of the Consolidated Financial Statements, and actual results could differ materially from the amounts reported based on these policies.
Revenue Recognition
Revenue is recognized when all of the following criteria have been met:
|
•
|
Persuasive evidence of an arrangement exists.
Contracts, Internet commerce agreements, and customer purchase orders are generally used to determine the existence of an arrangement.
|
|
•
|
Delivery has occurred.
Shipping documents and customer acceptance, when applicable, are used to verify delivery.
|
|
•
|
The fee is fixed or determinable.
We assess whether the fee is fixed or determinable based on the payment terms associated with the transaction and whether the sales price is subject to refund or adjustment.
|
|
•
|
Collectibility is reasonably assured.
We assess collectibility based primarily on the creditworthiness of the customer as determined by credit checks and analysis, as well as the customer’s payment history.
|
In instances where final acceptance of the product, system, or solution is specified by the customer, revenue is deferred until all acceptance criteria have been met. When a sale involves multiple deliverables, such as sales of products that include services, the multiple deliverables are evaluated to determine the unit of accounting, and the entire fee from the arrangement is allocated to each unit of accounting based on the relative selling price. Revenue is recognized when the revenue recognition criteria for each unit of accounting are met. For hosting arrangements, we recognize subscription revenue ratably over the subscription period, while usage revenue is recognized based on utilization. Software subscription revenue is deferred and recognized ratably over the subscription term upon delivery of the first product and commencement of the term.
The amount of product and service revenue recognized in a given period is affected by our judgment as to whether an arrangement includes multiple deliverables and, if so, our valuation of the units of accounting for multiple deliverables. According to the accounting guidance prescribed in Accounting Standards Codification (ASC) 605,
Revenue Recognition
, we use vendor-specific objective evidence of selling price (VSOE) for each of those units, when available. We determine VSOE based on our normal pricing and discounting practices for the specific product or service when sold separately. In determining VSOE, we require that a substantial majority of the historical standalone transactions have the selling prices for a product or service fall within a reasonably narrow pricing range, generally evidenced by approximately 80% of such historical standalone transactions falling within plus or minus 15% of the median rates. When VSOE does not exist, we apply the selling price hierarchy to applicable multiple-deliverable arrangements. Under the selling price hierarchy, third-party evidence of selling price (TPE) will be considered if VSOE does not exist, and estimated selling price (ESP) will be used if neither VSOE nor TPE is available. Generally, we are not able to determine TPE because our go-to-market strategy differs from that of others in our markets, and the extent of our proprietary technology varies among comparable products or services from those of our peers. In determining ESP, we apply significant judgment as we weigh a variety of factors, based on the facts and circumstances of the arrangement. We typically arrive at an ESP for a product or service that is not sold separately by considering company-specific factors such as geographies, competitive landscape, internal costs, profitability objectives, pricing practices used to establish bundled pricing, and existing portfolio pricing and discounting.
Some of our sales arrangements have multiple deliverables containing software and related software support components. Such sales arrangements are subject to the accounting guidance in ASC 985-605,
Software-Revenue Recognition
.
As our business and offerings evolve over time, our pricing practices may be required to be modified accordingly, which could result in changes in selling prices, including both VSOE and ESP, in subsequent periods. There were no material impacts during
fiscal 2014
, nor do we currently expect a material impact in the next 12 months on our revenue recognition due to any changes in our VSOE, TPE, or ESP.
Revenue deferrals relate to the timing of revenue recognition for specific transactions based on financing arrangements, service, support, and other factors. Financing arrangements may include sales-type, direct-financing, and operating leases, loans, and guarantees of third-party financing. Our deferred revenue for products was
$4.5 billion
and
$4.0 billion
as of
July 26, 2014
and
July 27, 2013
, respectively. Technical support services revenue is deferred and recognized ratably over the period during which the services are to be performed, which typically is from one to three years. Advanced services revenue is recognized upon delivery or completion of performance. Our deferred revenue for services was
$9.6 billion
and
$9.4 billion
as of
July 26, 2014
and
July 27, 2013
, respectively.
39
We make sales to distributors which we refer to as two-tier systems of sales to the end customer. Revenue from distributors is recognized based on a sell-through method using information provided by them. Our distributors participate in various cooperative marketing and other programs, and we maintain estimated accruals and allowances for these programs. If actual credits received by our distributors under these programs were to deviate significantly from our estimates, which are based on historical experience, our revenue could be adversely affected.
Allowances for Receivables and Sales Returns
The allowances for receivables were as follows (in millions, except percentages):
|
|
July 26, 2014
|
|
July 27, 2013
|
|
||||
|
Allowance for doubtful accounts
|
$
|
265
|
|
$
|
228
|
|
||
|
Percentage of gross accounts receivable
|
4.9
|
%
|
4.0
|
%
|
||||
|
Allowance for credit loss—lease receivables
|
$
|
233
|
|
$
|
238
|
|
||
|
Percentage of gross lease receivables
|
6.2
|
%
|
6.3
|
%
|
||||
|
Allowance for credit loss—loan receivables
|
$
|
98
|
|
$
|
86
|
|
||
|
Percentage of gross loan receivables
|
5.8
|
%
|
5.2
|
%
|
||||
The allowance for doubtful accounts is based on our assessment of the collectibility of customer accounts. We regularly review the adequacy of these allowances by considering internal factors such as historical experience, credit quality and age of the receivable balances as well as external factors such as economic conditions that may affect a customer’s ability to pay and expected default frequency rates, which are published by major third-party credit-rating agencies and are generally updated on a quarterly basis. We also consider the concentration of receivables outstanding with a particular customer in assessing the adequacy of our allowances for doubtful accounts. If a major customer’s creditworthiness deteriorates, if actual defaults are higher than our historical experience, or if other circumstances arise, our estimates of the recoverability of amounts due to us could be overstated, and additional allowances could be required, which could have an adverse impact on our operating results.
The allowance for credit loss on financing receivables is also based on the assessment of collectibility of customer accounts. We regularly review the adequacy of the credit allowances determined either on an individual or a collective basis. When evaluating the financing receivables on an individual basis, we consider historical experience, credit quality and age of receivable balances, and economic conditions that may affect a customer’s ability to pay. When evaluating financing receivables on a collective basis, we use expected default frequency rates published by a major third-party credit-rating agency as well as our own historical loss rate in the event of default, while also systematically giving effect to economic conditions, concentration of risk and correlation. Determining expected default frequency rates and loss factors associated with internal credit risk ratings, as well as assessing factors such as economic conditions, concentration of risk, and correlation, are complex and subjective. Our ongoing consideration of all these factors could result in an increase in our allowance for credit loss in the future, which could adversely affect our operating results. Both accounts receivable and financing receivables are charged off at the point when they are considered uncollectible.
A reserve for future sales returns is established based on historical trends in product return rates. The reserve for future sales returns as of
July 26, 2014
and
July 27, 2013
was
$135 million
and
$119 million
, respectively, and was recorded as a reduction of our accounts receivable. If the actual future returns were to deviate from the historical data on which the reserve had been established, our revenue could be adversely affected.
Inventory Valuation and Liability for Purchase Commitments with Contract Manufacturers and Suppliers
Our inventory balance was
$1.6 billion
and
$1.5 billion
as of
July 26, 2014
and
July 27, 2013
, respectively. Inventory is written down based on excess and obsolete inventories, determined primarily by future demand forecasts. Inventory write-downs are measured as the difference between the cost of the inventory and market, based upon assumptions about future demand, and are charged to the provision for inventory, which is a component of our cost of sales. At the point of the loss recognition, a new, lower cost basis for that inventory is established, and subsequent changes in facts and circumstances do not result in the restoration or increase in that newly established cost basis.
We record a liability for firm, noncancelable, and unconditional purchase commitments with contract manufacturers and suppliers for quantities in excess of our future demand forecasts consistent with the valuation of our excess and obsolete inventory. As of
July 26, 2014
, the liability for these purchase commitments was
$162 million
, compared with
$172 million
as of
July 27, 2013
, and was included in other current liabilities.
40
Our provision for inventory was
$67 million
,
$114 million
, and
$115 million
for
fiscal 2014, 2013, and 2012
, respectively. The provision for the liability related to purchase commitments with contract manufacturers and suppliers was
$124 million
,
$106 million
, and
$151 million
in
fiscal 2014, 2013, and 2012
, respectively. If there were to be a sudden and significant decrease in demand for our products, or if there were a higher incidence of inventory obsolescence because of rapidly changing technology and customer requirements, we could be required to increase our inventory write-downs, and our liability for purchase commitments with contract manufacturers and suppliers, and accordingly our profitability, could be adversely affected. We regularly evaluate our exposure for inventory write-downs and the adequacy of our liability for purchase commitments. Inventory and supply chain management remain areas of focus as we balance the need to maintain supply chain flexibility to help ensure competitive lead times with the risk of inventory obsolescence, particularly in light of current macroeconomic uncertainties and conditions and the resulting potential for changes in future demand forecast.
Loss Contingencies and Product Warranties
We are subject to the possibility of various losses arising in the ordinary course of business. We consider the likelihood of impairment of an asset or the incurrence of a liability, as well as our ability to reasonably estimate the amount of loss, in determining loss contingencies. An estimated loss contingency is accrued when it is probable that an asset has been impaired or a liability has been incurred and the amount of loss can be reasonably estimated. We regularly evaluate information available to us to determine whether such accruals should be made or adjusted and whether new accruals are required.
Third parties, including customers, have in the past and may in the future assert claims or initiate litigation related to exclusive patent, copyright, trademark, and other intellectual property rights to technologies and related standards that are relevant to us. These assertions have increased over time as a result of our growth and the general increase in the pace of patent claims assertions, particularly in the United States. If any infringement or other intellectual property claim made against us by any third party is successful, or if we fail to develop non-infringing technology or license the proprietary rights on commercially reasonable terms and conditions, our business, operating results, and financial condition could be materially and adversely affected.
We have recorded a liability for the expected remediation cost for certain products sold in prior fiscal years containing memory components manufactured by a single supplier between 2005 and 2010. In February 2014, on the basis of the growing number of failures as described in Note 12 (f) to the Consolidated Financial Statements, we decided to expand our approach, which resulted in an additional charge to product cost of sales of $655 million being recorded for the second quarter of fiscal 2014. Estimating this liability is complex and subjective, and if we experience changes in a number of underlying assumptions and estimates such as a change in claims compared with our expectations, or if the cost of servicing these claims is different than expected, our estimated liability may be impacted.
Our liability for product warranties, included in other current liabilities, was
$446 million
as of
July 26, 2014
, compared with
$402 million
as of
July 27, 2013
. Our products are generally covered by a warranty for periods ranging from 90 days to five years, and for some products we provide a limited lifetime warranty. We accrue for warranty costs as part of our cost of sales based on associated material costs, technical support labor costs, and associated overhead. Material cost is estimated based primarily upon historical trends in the volume of product returns within the warranty period and the cost to repair or replace the equipment. Technical support labor cost is estimated based primarily upon historical trends in the rate of customer cases and the cost to support the customer cases within the warranty period. Overhead cost is applied based on estimated time to support warranty activities.
The provision for product warranties during
fiscal 2014, 2013, and 2012
was
$704 million
,
$649 million
, and
$617 million
, respectively. If we experience an increase in warranty claims compared with our historical experience, or if the cost of servicing warranty claims is greater than expected, our profitability could be adversely affected.
Fair Value Measurements
Our fixed income and publicly traded equity securities, collectively, are reflected in the Consolidated Balance Sheets at a fair value of
$45.3 billion
as of
July 26, 2014
, compared with
$42.7 billion
as of
July 27, 2013
. Our fixed income investment portfolio, as of
July 26, 2014
, consisted primarily of high quality investment-grade securities. See Note 8 to the Consolidated Financial Statements.
As described more fully in Note 2 to the Consolidated Financial Statements, a valuation hierarchy is based on the level of independent, objective evidence available regarding the value of the investments. It encompasses three classes of investments: Level 1 consists of securities for which there are quoted prices in active markets for identical securities; Level 2 consists of securities for which observable inputs other than Level 1 inputs are used, such as quoted prices for similar securities in active markets or quoted prices for identical securities in less active markets and model-derived valuations for which the variables are derived from, or corroborated by, observable market data; and Level 3 consists of securities for which there are unobservable inputs to the valuation methodology that are significant to the measurement of the fair value.
41
Our Level 2 securities are valued using quoted market prices for similar instruments or nonbinding market prices that are corroborated by observable market data. We use inputs such as actual trade data, benchmark yields, broker/dealer quotes, and other similar data, which are obtained from independent pricing vendors, quoted market prices, or other sources to determine the ultimate fair value of our assets and liabilities. We use such pricing data as the primary input, to which we have not made any material adjustments during
fiscal 2014 and 2013
, to make our assessments and determinations as to the ultimate valuation of our investment portfolio. We are ultimately responsible for the financial statements and underlying estimates.
The inputs and fair value are reviewed for reasonableness, may be further validated by comparison to publicly available information, and could be adjusted based on market indices or other information that management deems material to its estimate of fair value. The assessment of fair value can be difficult and subjective. However, given the relative reliability of the inputs we use to value our investment portfolio, and because substantially all of our valuation inputs are obtained using quoted market prices for similar or identical assets, we do not believe that the nature of estimates and assumptions affected by levels of subjectivity and judgment was material to the valuation of the investment portfolio as of
July 26, 2014
.
Level 3 assets do not represent a significant portion of our total assets measured at fair value on a recurring basis as of
July 26, 2014
.
Other-than-Temporary Impairments
We recognize an impairment charge when the declines in the fair values of our fixed income or publicly traded equity securities below their cost basis are judged to be other than temporary. The ultimate value realized on these securities, to the extent unhedged, is subject to market price volatility until they are sold.
If the fair value of a debt security is less than its amortized cost, we assess whether the impairment is other than temporary. An impairment is considered other than temporary if (i) we have the intent to sell the security, (ii) it is more likely than not that we will be required to sell the security before recovery of its entire amortized cost basis, or (iii) we do not expect to recover the entire amortized cost of the security. If an impairment is considered other than temporary based on (i) or (ii) described in the prior sentence, the entire difference between the amortized cost and the fair value of the security is recognized in earnings. If an impairment is considered other than temporary based on condition (iii), the amount representing credit loss, defined as the difference between the present value of the cash flows expected to be collected and the amortized cost basis of the debt security, will be recognized in earnings, and the amount relating to all other factors will be recognized in other comprehensive income (OCI). In estimating the amount and timing of cash flows expected to be collected, we consider all available information, including past events, current conditions, the remaining payment terms of the security, the financial condition of the issuer, expected defaults, and the value of underlying collateral.
For publicly traded equity securities, we consider various factors in determining whether we should recognize an impairment charge, including the length of time and extent to which the fair value has been less than our cost basis, the financial condition and near-term prospects of the issuer, and our intent and ability to hold the investment for a period of time sufficient to allow for any anticipated recovery in market value.
For
fiscal 2014
, impairment charges of $11 million on our investments in publicly traded equity securities were recognized in earnings, while there were no such impairment charges in fiscal 2013 and 2012. Our ongoing consideration of all the factors described previously could result in additional impairment charges in the future, which could adversely affect our net income.
We also have investments in privately held companies, some of which are in the startup or development stages. As of
July 26, 2014
, our investments in privately held companies were
$899 million
, compared with
$833 million
as of
July 27, 2013
, and were included in other assets. We monitor these investments for events or circumstances indicative of potential impairment, and we make appropriate reductions in carrying values if we determine that an impairment charge is required, based primarily on the financial condition and near-term prospects of these companies. These investments are inherently risky because the markets for the technologies or products these companies are developing are typically in the early stages and may never materialize. Our impairment charges on investments in privately held companies were $23 million, $33 million, and
$23 million
in
fiscal 2014, 2013, and 2012
, respectively.
Goodwill and Purchased Intangible Asset Impairments
Our methodology for allocating the purchase price relating to purchase acquisitions is determined through established valuation techniques. Goodwill represents a residual value as of the acquisition date, which in most cases results in measuring goodwill as an excess of the purchase consideration transferred plus the fair value of any noncontrolling interest in the acquired company over the fair value of net assets acquired, including contingent consideration. We perform goodwill impairment tests on an annual basis in the fourth fiscal quarter and between annual tests in certain circumstances for each reporting unit. The assessment of fair value for goodwill and purchased intangible assets is based on factors that market participants would use in an orderly transaction in accordance with the new accounting guidance for the fair value measurement of nonfinancial assets.
42
The goodwill recorded in the Consolidated Balance Sheets as of
July 26, 2014
and
July 27, 2013
was
$24.2 billion
and
$21.9 billion
, respectively. The increase in goodwill for
fiscal 2014
was due in large part to our acquisition of Sourcefire, Inc. In response to changes in industry and market conditions, we could be required to strategically realign our resources and consider restructuring, disposing of, or otherwise exiting businesses, which could result in an impairment of goodwill. There was no impairment of goodwill resulting from our annual impairment testing in
fiscal 2014, 2013, and 2012
. For the annual impairment testing in
fiscal 2014
, the excess of the fair value over the carrying value for each of our reporting units was $32.0 billion for the Americas, $22.0 billion for EMEA, and $16.2 billion for APJC. During the fourth quarter of
fiscal 2014
, we performed a sensitivity analysis for goodwill impairment with respect to each of our respective reporting units and determined that a hypothetical 10% decline in the fair value of each reporting unit would not result in an impairment of goodwill for any reporting unit.
We make judgments about the recoverability of purchased intangible assets with finite lives whenever events or changes in circumstances indicate that an impairment may exist. Recoverability of purchased intangible assets with finite lives is measured by comparing the carrying amount of the asset to the future undiscounted cash flows the asset is expected to generate. We review indefinite-lived intangible assets for impairment annually or whenever events or changes in circumstances indicate that the asset might be impaired. If the asset is considered to be impaired, the amount of any impairment is measured as the difference between the carrying value and the fair value of the impaired asset. Assumptions and estimates about future values and remaining useful lives of our purchased intangible assets are complex and subjective. They can be affected by a variety of factors, including external factors such as industry and economic trends, and internal factors such as changes in our business strategy and our internal forecasts. There were no impairment charges related to purchased intangible assets during
fiscal 2014
and
fiscal 2013
. Our impairment charges related to purchased intangible assets were
$12 million
during fiscal
2012
. Our ongoing consideration of all the factors described previously could result in additional impairment charges in the future, which could adversely affect our net income.
Income Taxes
We are subject to income taxes in the United States and numerous foreign jurisdictions. Our effective tax rates differ from the statutory rate, primarily due to the tax impact of state taxes, foreign operations, R&D tax credits, domestic manufacturing deductions, tax audit settlements, nondeductible compensation, international realignments, and transfer pricing adjustments. Our effective tax rate was
19.2%
,
11.1%
, and
20.8%
in
fiscal 2014, 2013, and 2012
, respectively.
Significant judgment is required in evaluating our uncertain tax positions and determining our provision for income taxes. Although we believe our reserves are reasonable, no assurance can be given that the final tax outcome of these matters will not be different from that which is reflected in our historical income tax provisions and accruals. We adjust these reserves in light of changing facts and circumstances, such as the closing of a tax audit or the refinement of an estimate. To the extent that the final tax outcome of these matters is different than the amounts recorded, such differences will impact the provision for income taxes in the period in which such determination is made. The provision for income taxes includes the impact of reserve provisions and changes to reserves that are considered appropriate, as well as the related net interest and penalties.
Significant judgment is also required in determining any valuation allowance recorded against deferred tax assets. In assessing the need for a valuation allowance, we consider all available evidence, including past operating results, estimates of future taxable income, and the feasibility of tax planning strategies. In the event that we change our determination as to the amount of deferred tax assets that can be realized, we will adjust our valuation allowance with a corresponding impact to the provision for income taxes in the period in which such determination is made.
Our provision for income taxes is subject to volatility and could be adversely impacted by earnings being lower than anticipated in countries that have lower tax rates and higher than anticipated in countries that have higher tax rates; by changes in the valuation of our deferred tax assets and liabilities; by expiration of or lapses in the R&D tax credit or domestic manufacturing deduction laws; by expiration of or lapses in tax incentives; by transfer pricing adjustments, including the effect of acquisitions on our intercompany R&D cost-sharing arrangement and legal structure; by tax effects of nondeductible compensation; by tax costs related to intercompany realignments; by changes in accounting principles; or by changes in tax laws and regulations, treaties, or interpretations thereof, including possible changes to the taxation of earnings of our foreign subsidiaries, the deductibility of expenses attributable to foreign income, or the foreign tax credit rules. Significant judgment is required to determine the recognition and measurement attributes prescribed in the accounting guidance for uncertainty in income taxes. The Organisation for Economic Co-operation and Development (OECD), an international association comprised of 34 countries, including the United States, is contemplating changes to numerous long-standing tax principles. These contemplated changes, if finalized and adopted by countries, will increase tax uncertainty and may adversely affect our provision for income taxes. As a result of certain of our ongoing employment and capital investment actions and commitments, our income in certain countries is subject to reduced tax rates and in some cases is wholly exempt from tax. Our failure to meet these commitments could adversely impact our provision for income taxes. In addition, we are subject to the continuous examination of our income tax returns by the IRS and other tax authorities. We regularly assess the likelihood of adverse outcomes resulting from these examinations to determine the adequacy of our provision for income taxes. There can be no assurance that the outcomes from these continuous examinations will not have an adverse impact on our operating results and financial condition.
43
RESULTS OF OPERATIONS
Revenue
The following table presents the breakdown of revenue between product and service (in millions, except percentages):
|
Years Ended
|
July 26, 2014
|
July 27, 2013
|
Variance in Dollars
|
Variance in Percent
|
July 27, 2013
|
July 28, 2012
|
Variance in Dollars
|
Variance in Percent
|
||||||||||||||||||||||
|
Revenue:
|
||||||||||||||||||||||||||||||
|
Product
|
$
|
36,172
|
|
$
|
38,029
|
|
$
|
(1,857
|
)
|
(4.9
|
)%
|
$
|
38,029
|
|
$
|
36,326
|
|
$
|
1,703
|
|
4.7
|
%
|
||||||||
|
Percentage of revenue
|
76.7
|
%
|
78.2
|
%
|
|
|
|
|
78.2
|
%
|
78.9
|
%
|
|
|
|
|
||||||||||||||
|
Service
|
10,970
|
|
10,578
|
|
392
|
|
3.7
|
%
|
10,578
|
|
9,735
|
|
843
|
|
8.7
|
%
|
||||||||||||||
|
Percentage of revenue
|
23.3
|
%
|
21.8
|
%
|
|
|
|
|
21.8
|
%
|
21.1
|
%
|
|
|
|
|
||||||||||||||
|
Total
|
$
|
47,142
|
|
$
|
48,607
|
|
$
|
(1,465
|
)
|
(3.0
|
)%
|
$
|
48,607
|
|
$
|
46,061
|
|
$
|
2,546
|
|
5.5
|
%
|
||||||||
We manage our business primarily on a geographic basis, organized into three geographic segments. Our revenue, which includes product and service for each segment, is summarized in the following table (in millions, except percentages):
|
Years Ended
|
July 26, 2014
|
July 27, 2013
|
Variance in Dollars
|
Variance in Percent
|
July 27, 2013
|
July 28, 2012
|
Variance in Dollars
|
Variance in Percent
|
||||||||||||||||||||||
|
Revenue:
|
|
|
|
|
|
|
|
|
||||||||||||||||||||||
|
Americas
|
$
|
27,781
|
|
$
|
28,639
|
|
$
|
(858
|
)
|
(3.0
|
)%
|
$
|
28,639
|
|
$
|
26,501
|
|
$
|
2,138
|
|
8.1
|
%
|
||||||||
|
Percentage of revenue
|
58.9
|
%
|
58.9
|
%
|
|
|
58.9
|
%
|
57.5
|
%
|
|
|
||||||||||||||||||
|
EMEA
|
12,006
|
|
12,210
|
|
(204
|
)
|
(1.7
|
)%
|
12,210
|
|
12,075
|
|
135
|
|
1.1
|
%
|
||||||||||||||
|
Percentage of revenue
|
25.5
|
%
|
25.1
|
%
|
|
|
25.1
|
%
|
26.2
|
%
|
|
|
||||||||||||||||||
|
APJC
|
7,355
|
|
7,758
|
|
(403
|
)
|
(5.2
|
)%
|
7,758
|
|
7,485
|
|
273
|
|
3.6
|
%
|
||||||||||||||
|
Percentage of revenue
|
15.6
|
%
|
16.0
|
%
|
|
|
16.0
|
%
|
16.3
|
%
|
|
|
||||||||||||||||||
|
Total
|
$
|
47,142
|
|
$
|
48,607
|
|
$
|
(1,465
|
)
|
(3.0
|
)%
|
$
|
48,607
|
|
$
|
46,061
|
|
$
|
2,546
|
|
5.5
|
%
|
||||||||
Fiscal 2014 Compared with Fiscal 2013
For
fiscal 2014
, as compared with
fiscal 2013
, total revenue decreased by
3%
. Product revenue decreased by
5%
, while service revenue increased by
4%
. The decrease in product revenue reflected declines across all geographic segments as well as across all customer markets. Service revenues experienced slower growth in our Americas and APJC geographic segments while we experienced slightly faster growth in the EMEA segment.
Across our geographic segments, product revenue for most of our emerging countries experienced a decline. The emerging countries of BRICM, in the aggregate, experienced an
11% product revenue decline,
with declines across all of our customer markets.
We conduct business globally in numerous currencies. The direct effect of foreign currency fluctuations on revenue has not been material because our revenue is primarily denominated in U.S. dollars. However, if the U.S. dollar strengthens relative to other currencies, such strengthening could have an indirect effect on our revenue to the extent it raises the cost of our products to non-U.S. customers and thereby reduces demand. A weaker U.S. dollar could have the opposite effect. However, the precise indirect effect of currency fluctuations is difficult to measure or predict because our revenue is influenced by many factors in addition to the impact of such currency fluctuations. Our revenue in fiscal 2014 may have been adversely affected by the depreciation of the local currency relative to the U.S. dollar in certain emerging countries, although such indirect effects are difficult to measure, as noted.
In addition to the impact of macroeconomic factors, including a reduced IT spending environment and budget-driven reductions in spending by government entities, revenue by segment in a particular period may be significantly impacted by several factors related to revenue recognition, including the complexity of transactions such as multiple-element arrangements; the mix of financing arrangements provided to our channel partners and customers; and final acceptance of the product, system, or solution, among other factors. In addition, certain customers tend to make large and sporadic purchases, and the revenue related to these transactions may also be affected by the timing of revenue recognition, which in turn would impact the revenue of the relevant segment. As has been the case in certain of our emerging countries from time to time, customers require greater levels of financing arrangements, service, and support, and these activities may occur in future periods, which may also impact the timing of the recognition of revenue.
44
Fiscal 2013 Compared with Fiscal 2012
For
fiscal 2013
, as compared with
fiscal 2012
, total revenue increased by
6%
. Within total revenue growth, product revenue increased by
5%
, while service revenue increased by
9%
. Our product and service revenue totals reflected revenue growth across each of our geographic segments. The revenue increase was primarily due to the following: the solid performance of our Service offerings, our acquisition of NDS at the beginning of fiscal 2013, and increased demand for our Data Center and Wireless products.
Product Revenue by Segment
The following table presents the breakdown of product revenue by segment (in millions, except percentages):
|
Years Ended
|
July 26, 2014
|
July 27, 2013
|
Variance in Dollars
|
Variance in Percent
|
July 27, 2013
|
July 28, 2012
|
Variance in Dollars
|
Variance in Percent
|
||||||||||||||||||||||
|
Product revenue:
|
|
|
|
|
|
|
|
|
||||||||||||||||||||||
|
Americas
|
$
|
20,631
|
|
$
|
21,653
|
|
$
|
(1,022
|
)
|
(4.7
|
)%
|
$
|
21,653
|
|
$
|
20,168
|
|
$
|
1,485
|
|
7.4
|
%
|
||||||||
|
Percentage of product revenue
|
57.0
|
%
|
57.0
|
%
|
|
|
57.0
|
%
|
55.5
|
%
|
|
|
||||||||||||||||||
|
EMEA
|
9,655
|
|
10,049
|
|
(394
|
)
|
(3.9
|
)%
|
10,049
|
|
10,024
|
|
25
|
|
0.2
|
%
|
||||||||||||||
|
Percentage of product revenue
|
26.7
|
%
|
26.4
|
%
|
|
|
26.4
|
%
|
27.6
|
%
|
|
|
||||||||||||||||||
|
APJC
|
5,886
|
|
6,327
|
|
(441
|
)
|
(7.0
|
)%
|
6,327
|
|
6,134
|
|
193
|
|
3.1
|
%
|
||||||||||||||
|
Percentage of product revenue
|
16.3
|
%
|
16.6
|
%
|
|
|
16.6
|
%
|
16.9
|
%
|
|
|
||||||||||||||||||
|
Total
|
$
|
36,172
|
|
$
|
38,029
|
|
$
|
(1,857
|
)
|
(4.9
|
)%
|
$
|
38,029
|
|
$
|
36,326
|
|
$
|
1,703
|
|
4.7
|
%
|
||||||||
Americas
Fiscal 2014 Compared with Fiscal 2013
Product revenue in the Americas segment decreased by
5%
, led by a significant decline in the service provider market and, to a lesser extent, declines in the public sector and commercial markets. Product revenue declined in the U.S. public sector market, led by lower sales to the U.S. federal government.
From a country perspective, product revenue decreased by 5% in the United States, 10% in Canada, and 13% in Brazil, partially offset by an increase of 2% in Mexico.
Fiscal 2013 Compared with Fiscal 2012
For
fiscal 2013
, as compared with
fiscal 2012
, product revenue in the Americas segment increased by
7%
. The increase in product revenue was across most of our customer markets in the Americas segment, led by solid growth in the service provider and commercial markets and, to a lesser degree, growth in the enterprise market. The growth in product revenue in the service provider market was due in large part to our acquisition of NDS at the beginning of fiscal 2013. Within the Americas segment, we experienced a product revenue decline in the public sector market, driven by lower sales to the public sector in the United States. From a country perspective, product revenue increased by 9% in the United States, 13% in Brazil, and 7% in Mexico. During the fourth quarter of fiscal 2013, we experienced some weakness in our business momentum in certain countries within Latin America.
EMEA
Fiscal 2014 Compared with Fiscal 2013
Product revenue in the EMEA segment decreased by
4%
, led by a decline in the service provider market and, to a lesser extent, declines in the enterprise and public sector markets. Product revenue from emerging countries within EMEA decreased by 11%, led by a 24% decrease in Russia. Product revenue for the remainder of EMEA, which is primarily composed of countries in western Europe, declined by 2%.
45
Fiscal 2013 Compared with Fiscal 2012
In
fiscal 2013
, we experienced a continuation of many of the macroeconomic challenges we faced in EMEA in fiscal 2012. While we did see some improvements in most of the European economy as the fiscal year progressed, we continued to see weakness in southern Europe throughout fiscal 2013. For
fiscal 2013
, as compared with
fiscal 2012
, product revenue in the EMEA segment was flat, as growth in the commercial, service provider and public sector markets was offset by a decline in the enterprise market. The growth in product revenue in the service provider market was due to our acquisition of NDS at the beginning of fiscal 2013. From a country perspective, product revenue increased by 1% in the United Kingdom, 11% in Russia, 4% in Switzerland, and 3% in Spain. These increases were offset by product revenue declines of 3% in each of Germany and France and 13% in the Netherlands. Product revenue for Italy was flat year over year.
APJC
Fiscal 2014 Compared with Fiscal 2013
Product revenue in the APJC segment decreased by
7%
, led by declines in the service provider and enterprise markets and, to a lesser extent, a decline in the commercial market. We continued to experience declines in many of the emerging countries within this segment, most notably in India which experienced a year-over-year product revenue decline of 15%. Other countries that contributed to the weakness in this segment included Japan, Australia, and China, which experienced year-over-year product revenue declines of 11%, 7%, and 6%, respectively.
Fiscal 2013 Compared with Fiscal 2012
For
fiscal 2013
, as compared with
fiscal 2012
, product revenue in the APJC segment increased by
3%
. We experienced solid product revenue growth in the commercial and service provider markets and, to a lesser degree, in the public sector market. The growth in product revenue in the service provider market was due primarily to our acquisition of NDS at the beginning of fiscal 2013. From a country perspective, product revenue increased by 3% in Australia, 34% in India, and 10% in South Korea. These increases were partially offset by product revenue declines of 5% in China and 7% in Japan, reflecting certain challenges that we faced in these countries during portions of fiscal 2013, most notably in the fourth quarter of fiscal 2013.
46
Product Revenue by Groups of Similar Products
In addition to the primary view on a geographic basis, we also prepare financial information related to groups of similar products and customer markets for various purposes. Our product categories consist of the following categories (with subcategories in parentheses): Switching (fixed switching, modular switching, and storage); NGN Routing (high-end routers, mid-range and low-end routers, and other NGN Routing products); Service Provider Video (infrastructure, video software and solutions); Collaboration (unified communications, Cisco TelePresence, and conferencing); Data Center; Wireless; Security; and Other Products. The Other Products category consists primarily of
emerging technology products and other networking products.
The following table presents revenue for groups of similar products (in millions, except percentages):
|
Years Ended
|
July 26, 2014
|
July 27, 2013
|
Variance in Dollars
|
Variance in Percent
|
July 27, 2013
|
July 28, 2012
|
Variance in Dollars
|
Variance in Percent
|
||||||||||||||||||||||
|
Product revenue:
|
|
|
|
|
|
|
|
|
||||||||||||||||||||||
|
Switching
|
$
|
14,056
|
|
$
|
14,767
|
|
$
|
(711
|
)
|
(4.8
|
)%
|
$
|
14,767
|
|
$
|
14,634
|
|
$
|
133
|
|
0.9
|
%
|
||||||||
|
Percentage of product revenue
|
38.9
|
%
|
38.8
|
%
|
|
|
|
|
38.8
|
%
|
40.3
|
%
|
|
|
|
|
||||||||||||||
|
NGN Routing
|
7,662
|
|
8,243
|
|
(581
|
)
|
(7.0
|
)%
|
8,243
|
|
8,395
|
|
(152
|
)
|
(1.8
|
)%
|
||||||||||||||
|
Percentage of product revenue
|
21.2
|
%
|
21.7
|
%
|
|
|
|
|
21.7
|
%
|
23.1
|
%
|
|
|
|
|
||||||||||||||
|
Service Provider Video
|
3,969
|
|
4,855
|
|
(886
|
)
|
(18.2
|
)%
|
4,855
|
|
3,869
|
|
986
|
|
25.5
|
%
|
||||||||||||||
|
Percentage of product revenue
|
11.0
|
%
|
12.8
|
%
|
|
|
|
|
12.8
|
%
|
10.7
|
%
|
|
|
|
|
||||||||||||||
|
Collaboration
|
3,734
|
|
3,956
|
|
(222
|
)
|
(5.6
|
)%
|
3,956
|
|
4,194
|
|
(238
|
)
|
(5.7
|
)%
|
||||||||||||||
|
Percentage of product revenue
|
10.3
|
%
|
10.4
|
%
|
|
|
|
|
10.4
|
%
|
11.5
|
%
|
|
|
|
|
||||||||||||||
|
Data Center
|
2,640
|
|
2,074
|
|
566
|
|
27.3
|
%
|
2,074
|
|
1,298
|
|
776
|
|
59.8
|
%
|
||||||||||||||
|
Percentage of product revenue
|
7.3
|
%
|
5.5
|
%
|
|
|
5.5
|
%
|
3.6
|
%
|
|
|
||||||||||||||||||
|
Wireless
|
2,265
|
|
2,228
|
|
37
|
|
1.7
|
%
|
2,228
|
|
1,697
|
|
531
|
|
31.3
|
%
|
||||||||||||||
|
Percentage of product revenue
|
6.3
|
%
|
5.9
|
%
|
|
|
|
|
5.9
|
%
|
4.7
|
%
|
|
|
|
|
||||||||||||||
|
Security
|
1,566
|
|
1,348
|
|
218
|
|
16.2
|
%
|
1,348
|
|
1,341
|
|
7
|
|
0.5
|
%
|
||||||||||||||
|
Percentage of product revenue
|
4.3
|
%
|
3.5
|
%
|
|
|
|
|
3.5
|
%
|
3.7
|
%
|
|
|
|
|
||||||||||||||
|
Other
|
280
|
|
558
|
|
(278
|
)
|
(49.8
|
)%
|
558
|
|
898
|
|
(340
|
)
|
(37.9
|
)%
|
||||||||||||||
|
Percentage of product revenue
|
0.7
|
%
|
1.4
|
%
|
|
|
|
|
1.4
|
%
|
2.4
|
%
|
|
|
|
|
||||||||||||||
|
Total
|
$
|
36,172
|
|
$
|
38,029
|
|
$
|
(1,857
|
)
|
(4.9
|
)%
|
$
|
38,029
|
|
$
|
36,326
|
|
$
|
1,703
|
|
4.7
|
%
|
||||||||
Switching
Fiscal 2014 Compared with Fiscal 2013
Revenue in our Switching product category decreased by
5%
, or
$711 million
, driven by a 12%, or $656 million, decrease in revenue from our modular switches. Revenue from our modular switches decreased due to lower sales of Cisco Catalyst 6000 Series Switches. We also experienced a 3% decrease in sales of storage products within this category. Revenue from our LAN fixed-configuration switches was relatively flat year over year, as lower sales of most of our fixed-configuration Cisco Catalyst Series Switches and fixed-configuration Cisco Nexus Series Switches were offset by the continued adoption of Cisco Catalyst 3850 Series Switches and Cisco Nexus 6000 Series Switches.
47
Fiscal 2013 Compared with Fiscal 2012
Product revenue in our Switching category increased by
1%
, or
$133 million
as higher sales of LAN fixed-configuration switches were partially offset by lower sales of modular switches and storage products. Sales of LAN fixed-configuration switches increased by 4%, or $347 million, while sales of modular switches decreased by 1%, or approximately $76 million. The increase in sales of LAN fixed-configuration switches was primarily due to higher sales of Cisco Nexus Series Switches, partially offset by sales declines in certain of our Cisco Catalyst product families. Sales of modular switches decreased due to lower sales of Cisco Catalyst 6000 Series Switches, partially offset by higher sales in Cisco Nexus 7000 Series Switches. Product revenue in the Switching category was also negatively impacted by a 24% decrease in sales of storage products.
NGN Routing
Fiscal 2014 Compared with Fiscal 2013
The decrease in revenue in our NGN Routing product category of
7%
, or
$581 million
, was driven by a 6%, or $278 million, decrease in revenue from high-end router products; a 9%, or $249 million, decrease in revenue from our midrange and low-end router products; and an 8%, or $54 million, decrease in revenue from other NGN Routing products. Revenue from our high-end products decreased
d
ue to lower sales of Cisco CRS-3 Carrier Routing System products and our legacy high-end router products, partially offset by increased sales of our Cisco Aggregation Services Routers (ASR) edge products. The decrease in revenue from our midrange and low-end router products was driven by lower sales of our Cisco Integrated Services Routers (ISR) products. Revenue from other NGN Routing products decreased due to lower sales of certain optical networking products.
Fiscal 2013 Compared with Fiscal 2012
Sales in our NGN Routing product category decreased by
2%
, or
$152 million
, driven by a 3%, or $141 million, decrease in sales of high-end router products and an 8%, or $58 million, decrease in sales of other NGN Routing products. These decreases were partially offset by a 2%, or $47 million, increase in sales of our midrange and low-end router products. Within the high-end router product category, we experienced lower sales of our Cisco CRS-1 and CRS-3 Carrier Routing System products and our legacy high-end router products, partially offset by continued adoption of our Cisco ASR products. Higher sales in our midrange and low-end router products were driven by the continued adoption of our Cisco ISR platform. The decline in sales of other NGN Routing products was due to decreased sales of certain other routing and optical networking products.
Service Provider Video
Fiscal 2014 Compared with Fiscal 2013
Revenue in our Service Provider Video product category decreased by
18%
, or
$886 million
, with the largest driver of the decline being a 21%, or $812 million, decrease in sales of our Service Provider Video infrastructure products. The revenue decline in Service Provider Video infrastructure products, which includes connected devices products, was due primarily to lower sales of set-top boxes.
Fiscal 2013 Compared with Fiscal 2012
Our Service Provider Video products category grew by
25%
, or
$986 million
, due primarily to the acquisition of NDS at the beginning of fiscal 2013. Higher revenue from our Service Provider Video infrastructure products also contributed to the increase. The increase in sales of our Service Provider Video infrastructure products was primarily due to increased sales of set-top boxes.
Collaboration
Fiscal 2014 Compared with Fiscal 2013
We continue to increase the proportion of recurring revenue in our Collaboration product category. Overall, revenue in our Collaboration product category decreased by
6%
, or
$222 million
, primarily due to decreased revenue from our Cisco TelePresence and Unified Communications products, driven by weakness in endpoint products such as phones. These decreases were partially offset by higher revenue from our conferencing products.
Fiscal 2013 Compared with Fiscal 2012
Sales of Collaboration products decreased by
6%
, or
$238 million
, primarily due to a decline in sales of Cisco TelePresence Systems and, to a lesser degree, a decline in sales of Unified Communications products. Lower public sector spending in the United States, as well as demand weakness in Europe, were significant drivers of the decline in sales of Cisco TelePresence Systems. We also experienced a decline in sales of Unified Communications products, which was due primarily to lower sales of Unified Communications infrastructure products as a result of our sales emphasis on shifting towards products with recurring revenue streams.
48
Data Center
Fiscal 2014 Compared with Fiscal 2013
We continue to experience solid growth in our Data Center product category, which grew by
27%
, or
$566 million
, with sales growth of our Cisco Unified Computing System products across all geographic segments and customer markets. The increase was due in large part to the continued momentum we are experiencing in both data center and cloud environments, as current customers increase their data center build-outs, and as new customers deploy these offerings.
To the extent our data center business grows and further penetrates the market, we expect that, in comparison to what we experienced during the initial rapid growth of this business, the growth rates for our data center product sales will experience more normal seasonality consistent with the overall server market.
Fiscal 2013 Compared with Fiscal 2012
We experienced strong growth in our Data Center product category, which grew by
60%
, or
$776 million
, with strong sales growth of our Cisco Unified Computing System products across all geographic segments and customer markets. The increase was due in large part to the continued momentum we are experiencing with our products for both data center and cloud environments, as current customers increase their data center build-outs and as new customers deploy these offerings.
Wireless
Fiscal 2014 Compared with Fiscal 2013
We continue to increase the proportion of recurring revenue in our Wireless product category. Revenue in our Wireless product category increased by
2%
, or
$37 million
, due to an increase in sales of Meraki products, which we acquired in the second quarter of fiscal 2013, partially offset by lower sales of other wireless products.
Fiscal 2013 Compared with Fiscal 2012
Sales of Wireless products increased by
31%
, or
$531 million
. This increase reflects the continued customer adoption of and migration to the unified access architecture of the Cisco Unified Wireless Network, and also reflects increased sales of new products in this category as well as sales of products related to our acquisition of Meraki.
Security
Fiscal 2014 Compared with Fiscal 2013
We continue to increase the proportion of recurring revenue in our Security product category. Revenue in our Security product category was up
16%
, or
$218 million
, driven primarily by sales of Sourcefire products, which company we acquired in the first quarter of fiscal 2014 and, to a lesser degree, by both higher sales of our high-end firewall products within our network security product portfolio and slightly higher sales of our content security products.
Fiscal 2013 Compared with Fiscal 2012
Sales of Security products were flat as higher sales in high-end firewall products within our network
security product portfolio were offset by lower sales of our content security products.
Other Products
We experienced a year-over-year decrease in revenue in our Other Products category for both fiscal 2014 and 2013, due in large part to the sale of our Linksys product line in the third quarter of fiscal 2013.
49
Service Revenue by Segment
The following table presents the breakdown of service revenue by segment (in millions, except percentages):
|
Years Ended
|
July 26, 2014
|
July 27, 2013
|
Variance in Dollars
|
Variance in Percent
|
July 27, 2013
|
July 28, 2012
|
Variance in Dollars
|
Variance in Percent
|
|||||||||||||||||||||
|
Service revenue:
|
|
|
|
|
|
|
|
|
|||||||||||||||||||||
|
Americas
|
$
|
7,150
|
|
$
|
6,986
|
|
$
|
164
|
|
2.3
|
%
|
$
|
6,986
|
|
$
|
6,333
|
|
$
|
653
|
|
10.3
|
%
|
|||||||
|
Percentage of service revenue
|
65.2
|
%
|
66.1
|
%
|
66.1
|
%
|
65.0
|
%
|
|
|
|||||||||||||||||||
|
EMEA
|
2,351
|
|
2,161
|
|
190
|
|
8.8
|
%
|
2,161
|
|
2,051
|
|
110
|
|
5.4
|
%
|
|||||||||||||
|
Percentage of service revenue
|
21.4
|
%
|
20.4
|
%
|
20.4
|
%
|
21.1
|
%
|
|
|
|||||||||||||||||||
|
APJC
|
1,469
|
|
1,431
|
|
38
|
|
2.7
|
%
|
1,431
|
|
1,351
|
|
80
|
|
5.9
|
%
|
|||||||||||||
|
Percentage of service revenue
|
13.4
|
%
|
13.5
|
%
|
13.5
|
%
|
13.9
|
%
|
|
|
|||||||||||||||||||
|
Total
|
$
|
10,970
|
|
$
|
10,578
|
|
$
|
392
|
|
3.7
|
%
|
$
|
10,578
|
|
$
|
9,735
|
|
$
|
843
|
|
8.7
|
%
|
|||||||
Fiscal 2014 Compared with Fiscal 2013
Service revenue continued to experience slower growth than in prior fiscal years, with varying levels of growth across our geographic segments. Worldwide technical support services revenue increased by 4% while worldwide advanced services revenue experienced 3% growth. Technical support service revenue experienced growth across all geographic segments. Renewals and technical support service contract initiations associated with product sales provided an installed base of equipment being serviced which, in concert with new service offerings, were the primary factors driving the revenue increases. Advanced services revenue, which relates to consulting support services for specific customer network needs, slightly declined in the Americas segment but had solid growth in the EMEA and APJC segments due to growth in subscription revenues.
Fiscal 2013 Compared with Fiscal 2012
Service revenue experienced solid growth across all of our geographic segments. Worldwide technical support services revenue increased by 6%, and worldwide advanced services experienced 16% revenue growth. Technical support service experienced growth across all of our geographic segments, led by growth in our Americas segment. Renewals and technical support service contract initiations associated with product sales provided an installed base of equipment being serviced which, in concert with new service offerings, were the primary factors driving these increases. We experienced revenue growth in advanced services across all geographic segments, led by growth in the Americas segment. Advanced services revenue growth was driven by solid growth in both transaction and subscription revenues.
50
Gross Margin
The following table presents the gross margin for products and services (in millions, except percentages):
|
|
AMOUNT
|
PERCENTAGE
|
||||||||||||||||||
|
Years Ended
|
July 26, 2014
|
July 27, 2013
|
July 28, 2012
|
July 26, 2014
|
July 27, 2013
|
July 28, 2012
|
||||||||||||||
|
Gross margin:
|
||||||||||||||||||||
|
Product
|
$
|
20,531
|
|
$
|
22,488
|
|
$
|
21,821
|
|
56.8
|
%
|
59.1
|
%
|
60.1
|
%
|
|||||
|
Service
|
7,238
|
|
6,952
|
|
6,388
|
|
66.0
|
%
|
65.7
|
%
|
65.6
|
%
|
||||||||
|
Total
|
$
|
27,769
|
|
$
|
29,440
|
|
$
|
28,209
|
|
58.9
|
%
|
60.6
|
%
|
61.2
|
%
|
|||||
Product Gross Margin
Fiscal 2014 Compared with Fiscal 2013
The following table summarizes the key factors that contributed to the change in product gross margin percentage from
fiscal 2013
to
fiscal 2014
:
|
|
Product Gross Margin Percentage
|
||
|
Fiscal 2013
|
59.1
|
%
|
|
|
Product pricing
|
(3.1
|
)%
|
|
|
Supplier component remediation charge
|
(1.8
|
)%
|
|
|
Mix of products sold
|
(0.5
|
)%
|
|
|
Amortization of purchased intangible assets
|
(0.5
|
)%
|
|
|
Productivity
(1)
|
3.0
|
%
|
|
|
TiVo patent litigation settlement
|
0.5
|
%
|
|
|
Acquisition fair value adjustment to inventory and other
|
0.1
|
%
|
|
|
Fiscal 2014
|
56.8
|
%
|
|
(1)
Productivity includes overall manufacturing-related costs, shipment volume, and other items not categorized elsewhere.
Product gross margin decreased by
2.3
percentage points compared with
fiscal 2013
.
The decrease in product gross margin was driven by unfavorable impacts from product pricing, which were driven by typical market factors and impacted each of our geographic segments and customer markets. The decrease was also due, in part, to the charge of $655 million to product cost of sales recorded in fiscal 2014 related to the expected cost of remediation of issues with memory components in certain products sold in prior fiscal years. In addition, the shift in the mix of products sold decreased our product gross margin, primarily as a result of a revenue increase in our relatively lower margin Cisco Unified Computing System products and decreased revenue from our higher margin core products, partially offset by decreased revenue from our relatively lower margin Service Provider Video products. Our product gross margin for fiscal 2014 was also negatively impacted by higher amortization expense of purchased intangible assets. For further explanation of the increase in amortization of purchased intangible assets, see “Amortization of Purchased Intangible Assets” below.
These amounts were partially offset by productivity benefits and the absence of charges related to the TiVo patent litigation settlement which we incurred in the fourth quarter of fiscal 2013. The productivity benefits we experienced in fiscal 2014 were driven by value engineering efforts; favorable component pricing; and continued operational efficiency in manufacturing operations. Value engineering is the process by which production costs are reduced through component redesign, board configuration, test processes, and transformation processes.
Our future gross margins could be impacted by our product mix and could be adversely affected by further growth in sales of products that have lower gross margins, such as Cisco Unified Computing System products. Our gross margins may also be impacted by the geographic mix of our revenue and, as was the case in fiscal 2014, fiscal 2013 and fiscal 2012, may be adversely affected by product pricing attributable to competitive factors. Additionally, our manufacturing-related costs may be negatively impacted by constraints in our supply chain, which in turn could negatively affect gross margin. If any of the preceding factors that in the past have negatively impacted our gross margins arise in future periods, our gross margins could continue to decline.
51
Fiscal 2013 Compared with Fiscal 2012
The following table summarizes the key factors that contributed to the change in product gross margin percentage from fiscal 2012 to
fiscal 2013
:
|
|
Product Gross Margin Percentage
|
||
|
Fiscal 2012
|
60.1
|
%
|
|
|
Product pricing
|
(2.9
|
)%
|
|
|
Mix of products sold
|
(0.7
|
)%
|
|
|
Productivity
|
3.7
|
%
|
|
|
TiVo patent litigation settlement
|
(0.5
|
)%
|
|
|
Amortization of purchased intangible assets
|
(0.5
|
)%
|
|
|
Acquisition fair value adjustment to inventory and other
|
(0.1
|
)%
|
|
|
Fiscal 2013
|
59.1
|
%
|
|
Product gross margin decreased by
1.0
percentage points compared with fiscal 2012. Unfavorable impacts from product pricing contributed to our decreased product gross margin percentage in fiscal 2013. These factors impacted most of our customer markets and all of our geographic segments. Additionally, our product gross margin for fiscal 2013 was negatively impacted by the shift in the mix of products sold, primarily as a result of revenue increases for our relatively lower margin Cisco Unified Computing System products. These impacts were offset by continued productivity improvements. The productivity improvements were in large part due to increased benefits from cost savings, particularly in certain of our Switching and NGN Routing categories in which product transitions have been taking place, and were driven by value engineering efforts, favorable component pricing, and continued operational efficiency in manufacturing operations. Because the preceding factors largely offset each other, the decline in our product gross margin percentage was largely driven by our acquisition of NDS, which resulted in higher amortization expense from purchased intangible assets along with costs resulting from a fair value adjustment to inventory acquired as part of that acquisition. In addition, during fiscal 2013 we incurred charges related to the TiVo patent litigation settlement in the fourth quarter that were included as part of cost of sales. The combined effect of these items was a negative impact to our product gross margin of 1.1 percentage points for fiscal 2013.
Service Gross Margin
Fiscal 2014 Compared with Fiscal 2013
Our service gross margin percentage increased slightly by
0.3
percentage points for
fiscal 2014
, as compared with fiscal 2013. The increase was primarily due to higher sales volume in both advanced services and technical support services. The benefits to gross margin of increased sales volume were partially offset by increased cost impacts such as outside service costs, partner delivery costs, and headcount-related costs.
Our service gross margin normally experiences some fluctuations due to various factors such as the timing of contract initiations in our renewals, our strategic investments in headcount, and the resources we deploy to support the overall service business. Other factors include the mix of service offerings, as the gross margin from our advanced services is typically lower than the gross margin from technical support services.
Fiscal 2013 Compared with Fiscal 2012
Our service gross margin percentage increased slightly by
0.1
percentage points for fiscal 2013, as compared with fiscal 2012. Although we experienced higher sales volume from growth in both advanced services and in technical support services, the resulting benefit to gross margin was offset by increased cost impacts such as headcount-related costs, partner delivery costs, and unfavorable mix. The mix impacts were due to our lower gross margin advanced services business contributing a higher proportion of service revenue for fiscal 2013, as compared with fiscal 2012.
52
Gross Margin by Segment
The following table presents the total gross margin for each segment (in millions, except percentages):
|
|
AMOUNT
|
PERCENTAGE
|
|||||||||||||||||||
|
Years Ended
|
July 26, 2014
|
July 27, 2013
|
July 28, 2012
|
July 26, 2014
|
July 27, 2013
|
July 28, 2012
|
|||||||||||||||
|
Gross margin:
|
|||||||||||||||||||||
|
Americas
|
$
|
17,379
|
|
$
|
17,887
|
|
$
|
16,639
|
|
|
62.6
|
%
|
62.5
|
%
|
62.8
|
%
|
|||||
|
EMEA
|
7,700
|
|
7,876
|
|
7,605
|
|
|
64.1
|
%
|
64.5
|
%
|
63.0
|
%
|
||||||||
|
APJC
|
4,252
|
|
4,637
|
|
4,519
|
|
|
57.8
|
%
|
59.8
|
%
|
60.4
|
%
|
||||||||
|
Segment total
|
29,331
|
|
30,400
|
|
28,763
|
|
|
62.2
|
%
|
62.5
|
%
|
62.4
|
%
|
||||||||
|
Unallocated corporate items
(1)
|
(1,562
|
)
|
(960
|
)
|
(554
|
)
|
|||||||||||||||
|
Total
|
$
|
27,769
|
|
$
|
29,440
|
|
$
|
28,209
|
|
|
58.9
|
%
|
60.6
|
%
|
61.2
|
%
|
|||||
(1)
The unallocated corporate items for the years presented include the effects of amortization and impairments of acquisition-related intangible assets, share-based compensation expense, significant litigation and other contingencies, impacts to cost of sales from purchase accounting adjustments to inventory, charges related to asset impairments and restructurings, and certain other charges. We do not allocate these items to the gross margin for each segment because management does not include such information in measuring the performance of the operating segments.
Fiscal 2014 Compared with Fiscal 2013
The Americas segment experienced a slight gross margin percentage increase due to the impact of productivity improvements in this geographic segment. Partially offsetting this favorable impact to gross margin were negative impacts from pricing and an unfavorable mix. The unfavorable mix impact was driven by revenue increases in our relatively lower margin Cisco Unified Computing System products and lower sales of our higher margin core products, partially offset by decreased revenue from our relatively lower margin Service Provider Video products.
The gross margin percentage decrease in our EMEA segment was due primarily to the unfavorable impacts from pricing, as well as an unfavorable mix impact, partially offset by productivity improvements in this geographic segment. The unfavorable mix impact was driven by an increase in revenue from our lower margin Cisco Unified Computing System products.
Our APJC segment gross margin percentage decreased primarily as a result of unfavorable impacts from pricing, and also as a result of an unfavorable mix. The unfavorable mix impact was driven by an increase in revenue from our lower margin Cisco Unified Computing System products. Partially offsetting these factors were impacts from productivity improvements and higher service gross margin in this geographic segment.
The gross margin percentage for a particular segment may fluctuate, and period-to-period changes in such percentages may or may not be indicative of a trend for that segment. Our product and service gross margins may be impacted by economic downturns or uncertain economic conditions as well as our movement into new market opportunities, and could decline if any of the factors that impact our gross margins are adversely affected in future periods.
Fiscal 2013 Compared with Fiscal 2012
We experienced a gross margin percentage decrease in our Americas and APJC segments, while our EMEA segment experienced a gross margin percentage increase.
The Americas segment experienced a slight gross margin percentage decline due to the unfavorable impacts from pricing, and also due to unfavorable mix impacts, partially offset by productivity improvements.
The gross margin percentage increase in our EMEA segment was primarily the result of productivity improvements from lower overall manufacturing costs and, to a lesser degree, favorable mix impacts and higher service gross margin. Partially offsetting these favorable impacts to gross margin were negative impacts from pricing.
The APJC segment gross margin percentage declined due primarily to the unfavorable impacts from pricing, lower service gross margin, and unfavorable mix impacts. Partially offsetting these factors were productivity improvements, driven in large part by lower overall manufacturing costs and higher volume.
53
Factors That May Impact Revenue and Gross Margin
Product revenue may continue to be affected by factors, including global economic downturns and related market uncertainty, that have resulted in reduced IT-related capital spending in certain segments within our enterprise, service provider, public sector, and commercial markets; changes in the geopolitical environment and global economic conditions; competition, including price-focused competitors from Asia, especially from China; new product introductions; sales cycles and product implementation cycles; changes in the mix of our customers between service provider and enterprise markets; changes in the mix of direct sales and indirect sales; variations in sales channels; and final acceptance criteria of the product, system, or solution as specified by the customer. Sales to the service provider market have been and may be in the future characterized by large and sporadic purchases, especially relating to our router sales and sales of certain products within our Collaboration, Data Center, and Service Provider Video product categories. In addition, service provider customers typically have longer implementation cycles; require a broader range of services, including network design services; and often have acceptance provisions that can lead to a delay in revenue recognition. Certain of our customers in certain emerging countries also tend to make large and sporadic purchases, and the revenue related to these transactions may similarly be affected by the timing of revenue recognition. As we focus on new market opportunities, customers may require greater levels of financing arrangements, service, and support, especially in certain emerging countries, which in turn may result in a delay in the timing of revenue recognition. To improve customer satisfaction, we continue to focus on managing our manufacturing lead-time performance, which may result in corresponding reductions in order backlog. A decline in backlog levels could result in more variability and less predictability in our quarter-to-quarter revenue and operating results.
Product revenue may also be adversely affected by fluctuations in demand for our products, especially with respect to telecommunications service providers and Internet businesses, whether or not driven by any slowdown in capital expenditures in the service provider market; price and product competition in the communications and information technology industry; introduction and market acceptance of new technologies and products; adoption of new networking standards; and financial difficulties experienced by our customers. We may, from time to time, experience manufacturing issues that create a delay in our suppliers’ ability to provide specific components, resulting in delayed shipments. To the extent that manufacturing issues and any related component shortages result in delayed shipments in the future, and particularly in periods when we and our suppliers are operating at higher levels of capacity, it is possible that revenue for a quarter could be adversely affected if such matters are not remediated within the same quarter. For additional factors that may impact product revenue, see “Part I, Item 1A. Risk Factors.”
Our distributors participate in various cooperative marketing and other programs. Increased sales to our distributors generally result in greater difficulty in forecasting the mix of our products and, to a certain degree, the timing of orders from our customers. We recognize revenue for sales to our distributors generally based on a sell-through method using information provided by them, and we maintain estimated accruals and allowances for all cooperative marketing and other programs.
Product gross margin may be adversely affected in the future by changes in the mix of products sold, including periods of increased growth of some of our lower margin products; introduction of new products, including products with price-performance advantages and new business models for our offerings such as XaaS; our ability to reduce production costs; entry into new markets, including markets with different pricing structures and cost structures, as a result of internal development or through acquisitions; changes in distribution channels; price competition, including competitors from Asia, especially those from China; changes in geographic mix of our product revenue; the timing of revenue recognition and revenue deferrals; sales discounts; increases in material or labor costs, including share-based compensation expense; excess inventory and obsolescence charges; warranty costs; changes in shipment volume; loss of cost savings due to changes in component pricing; effects of value engineering; inventory holding charges; and the extent to which we successfully execute on our strategy and operating plans. Additionally, our manufacturing-related costs may be negatively impacted by constraints in our supply chain. Service gross margin may be impacted by various factors such as the change in mix between technical support services and advanced services; the timing of technical support service contract initiations and renewals; share-based compensation expense; and the timing of our strategic investments in headcount and resources to support this business.
54
Research and Development (“R&D”), Sales and Marketing, and General and Administrative (“G&A”) Expenses
R&D, sales and marketing, and G&A expenses are summarized in the following table (in millions, except percentages):
|
Years Ended
|
July 26, 2014
|
July 27, 2013
|
Variance in Dollars
|
Variance in Percent
|
July 27, 2013
|
July 28, 2012
|
Variance in Dollars
|
Variance in Percent
|
||||||||||||||||||||||
|
Research and development
|
$
|
6,294
|
|
$
|
5,942
|
|
$
|
352
|
|
5.9
|
%
|
$
|
5,942
|
|
$
|
5,488
|
|
$
|
454
|
|
8.3
|
%
|
||||||||
|
Percentage of revenue
|
13.4
|
%
|
12.2
|
%
|
12.2
|
%
|
11.9
|
%
|
||||||||||||||||||||||
|
Sales and marketing
|
9,503
|
|
9,538
|
|
(35
|
)
|
(0.4
|
)%
|
9,538
|
|
9,647
|
|
(109
|
)
|
(1.1
|
)%
|
||||||||||||||
|
Percentage of revenue
|
20.2
|
%
|
19.6
|
%
|
19.6
|
%
|
20.9
|
%
|
||||||||||||||||||||||
|
General and administrative
|
1,934
|
|
2,264
|
|
(330
|
)
|
(14.6
|
)%
|
2,264
|
|
2,322
|
|
(58
|
)
|
(2.5
|
)%
|
||||||||||||||
|
Percentage of revenue
|
4.1
|
%
|
4.7
|
%
|
4.7
|
%
|
5.0
|
%
|
||||||||||||||||||||||
|
Total
|
$
|
17,731
|
|
$
|
17,744
|
|
$
|
(13
|
)
|
(0.1
|
)%
|
$
|
17,744
|
|
$
|
17,457
|
|
$
|
287
|
|
1.6
|
%
|
||||||||
|
Percentage of revenue
|
37.6
|
%
|
36.5
|
%
|
36.5
|
%
|
37.9
|
%
|
||||||||||||||||||||||
R&D Expenses
Fiscal 2014 Compared with Fiscal 2013
R&D expenses increased for
fiscal 2014
, as compared with
fiscal 2013
, primarily due to compensation expense recorded in fiscal 2014 in connection with our acquisition of the remaining interest in Insieme Networks, Inc. (“Insieme”). See Note 12 to the Consolidated Financial Statements. Higher share-based compensation expense and higher contracted services also contributed to the increase. These increases were partially offset by reduced variable compensation expense as a result of our financial performance and efficiencies related to our workforce reduction plan announced in August 2013.
We continue to invest in R&D in order to bring a broad range of products to market in a timely fashion. If we believe that we are unable to enter a particular market in a timely manner with internally developed products, we may purchase or license technology from other businesses, or we may partner with or acquire businesses as an alternative to internal R&D.
Fiscal 2013 Compared with Fiscal 2012
The increase in R&D expenses for
fiscal 2013
, as compared with
fiscal 2012
, was primarily due to higher headcount-related expenses attributable in large part to our acquisitions. Partially offsetting these costs was lower share-based compensation expense.
Sales and Marketing Expenses
Fiscal 2014 Compared with Fiscal 2013
Sales and marketing expenses for
fiscal 2014
, as compared with
fiscal 2013
, decreased slightly due to lower advertising expenses, reductions in other discretionary spending, and lower expenses in other areas such as depreciation expense. These decreases were substantially offset by higher share based compensation expense and higher acquisition- related costs.
Fiscal 2013 Compared with Fiscal 2012
For
fiscal 2013
, as compared with
fiscal 2012
, sales and marketing expenses decreased by
$109 million
, primarily due to lower share-based compensation expense and, to a lesser degree, lower discretionary spending and contracted services. These items were partially offset by higher headcount-related expense resulting largely from our acquisitions.
G&A Expenses
Fiscal 2014 Compared with Fiscal 2013
G&A expenses decreased in
fiscal 2014
, as compared with
fiscal 2013
, due to lower contracted services, lower corporate-level expenses, and lower headcount-related expenses. The lower headcount-related expenses were due to efficiencies related to our workforce reduction plan announced in August 2013, and also due to reduced variable compensation expense as a result of our lower financial performance.
55
Fiscal 2013 Compared with Fiscal 2012
G&A expenses decreased in
fiscal 2013
, as compared with
fiscal 2012
, primarily due to the absence in fiscal 2013 of $202 million of impairment charges on real estate held for sale recorded in the fourth quarter of fiscal 2012. Lower share-based compensation expense in fiscal 2013 and a recovery in the market value of property held for sale recorded during fiscal 2013 also contributed to the decrease. These decreases were partially offset by higher headcount-related expenses
resulting in part from our acquisitions
and also by higher corporate-level expenses. Corporate-level expenses, which tend to vary from period to period, included operational infrastructure activities such as IT project implementations, which included investments in our global data center infrastructure, and investments related to operational and financial systems.
Effect of Foreign Currency
In
fiscal 2014
, foreign currency fluctuations, net of hedging, decreased the combined R&D, sales and marketing, and G&A expenses by
$153 million
, or approximately
0.9%
, compared with
fiscal 2013
. In
fiscal 2013
, foreign currency fluctuations, net of hedging, decreased the combined R&D, sales and marketing, and G&A expenses by
$227 million
, or approximately
1.3%
, compared with
fiscal 2012
.
Headcount
Fiscal 2014 Compared with Fiscal 2013
Our headcount decreased by approximately 1,000 employees in
fiscal 2014
.
The decrease
was due to headcount reductions from attrition and from our workforce reduction plan announced in August 2013. These headcount reductions were partially offset by the increase in headcount from targeted hiring in engineering, services, sales, and also by increased headcount from our recent acquisitions.
In August 2014, we announced a restructuring plan that will impact up to
6,000
employees, representing approximately
8%
of our global workforce. We expect to reinvest substantially all of the cost savings from the restructuring actions in our key growth areas such as data center, software, security, and cloud.
Fiscal 2013 Compared with Fiscal 2012
Our headcount increased by 8,410 employees in
fiscal 2013
. The increase was attributable to the headcount from acquisitions, the largest of which was NDS, as well as targeted hiring in engineering and services.
Share-Based Compensation Expense
The following table presents share-based compensation expense (in millions):
|
Years Ended
|
July 26, 2014
|
July 27, 2013
|
July 28, 2012
|
|||||||||
|
Cost of sales—product
|
$
|
45
|
|
$
|
40
|
|
$
|
53
|
|
|||
|
Cost of sales—service
|
150
|
|
138
|
|
156
|
|
||||||
|
Share-based compensation expense in cost of sales
|
195
|
|
178
|
|
209
|
|
||||||
|
Research and development
|
411
|
|
286
|
|
401
|
|
||||||
|
Sales and marketing
|
549
|
|
484
|
|
588
|
|
||||||
|
General and administrative
|
198
|
|
175
|
|
203
|
|
||||||
|
Restructuring and other charges
|
(5
|
)
|
(3
|
)
|
—
|
|
||||||
|
Share-based compensation expense in operating expenses
|
1,153
|
|
942
|
|
1,192
|
|
||||||
|
Total share-based compensation expense
|
$
|
1,348
|
|
$
|
1,120
|
|
$
|
1,401
|
|
|||
The increase in share-based compensation expense for
fiscal 2014
, as compared with
fiscal 2013
, was due primarily to share-based compensation expense attributable to equity awards assumed with respect to our recent acquisitions and higher forfeiture credits in fiscal 2013.
The decrease in share-based compensation expense for
fiscal 2013
, as compared with
fiscal 2012
, was due primarily to a decrease in the aggregate value of share-based awards granted in recent periods, higher forfeiture credits in fiscal 2013, and the effect of stock options awards from prior years becoming fully amortized and replaced with restricted stock units with a lower aggregate value.
56
Amortization of Purchased Intangible Assets
The following table presents the amortization of purchased intangible assets (in millions):
|
Years Ended
|
July 26, 2014
|
July 27, 2013
|
July 28, 2012
|
|||||||||
|
Amortization of purchased intangible assets:
|
||||||||||||
|
Cost of sales
|
$
|
742
|
|
$
|
606
|
|
$
|
424
|
|
|||
|
Operating expenses
|
275
|
|
395
|
|
383
|
|
||||||
|
Total
|
$
|
1,017
|
|
$
|
1,001
|
|
$
|
807
|
|
|||
Amortization of purchased intangible assets increased in both
fiscal 2014
and
fiscal 2013
as compared with the respective prior fiscal years. The increases were primarily due to amortization of purchased intangible assets from our recent acquisitions partially offset by certain purchased intangible assets having become fully amortized.
The fair value of acquired technology and patents, as well as acquired technology under development, is determined at acquisition date primarily using the income approach, which discounts expected future cash flows to present value. The discount rates used in the present value calculations are typically derived from a weighted-average cost of capital analysis and then adjusted to reflect risks inherent in the development lifecycle as appropriate. We consider the pricing model for products related to these acquisitions to be standard within the high-technology communications industry, and the applicable discount rates represent the rates that market participants would use for valuation of such intangible assets.
Restructuring and Other Charges
Fiscal 2014 Plan and Fiscal 2011 Plans
In August 2013, we announced a workforce reduction plan that would impact up to
4,000
employees, or
5%
, of our global workforce. In connection with this Fiscal 2014 Plan, during
fiscal 2014
we incurred within operating expenses restructuring and other charges of approximately
$418 million
which were related primarily to employee severance charges for employees impacted by our workforce reduction plan under the Fiscal 2014 Plan. We have completed the Fiscal 2014 Plan and we do
not expect any remaining charges related to this action
. In
fiscal 2013
and
fiscal 2012
, we incurred within operating expenses net restructuring and other charges of
$105 million
and
$304 million
, respectively, which were related primarily to employee severance charges for employees impacted by our workforce reduction under Fiscal 2011 Plans.
Fiscal 2015 Plan
In August 2014, we announced a restructuring plan that will impact up to
6,000
employees, representing approximately
8%
of our global workforce. We expect to take action under this plan beginning in the first quarter of fiscal 2015. We currently estimate that we will recognize pre-tax charges in an amount not expected to exceed
$700 million
consisting of severance and other one-time termination benefits, and other associated costs.
Operating Income
The following table presents our operating income and our operating income as a percentage of revenue (in millions, except percentages):
|
Years Ended
|
July 26, 2014
|
July 27, 2013
|
July 28, 2012
|
|||||||||
|
Operating income
|
$
|
9,345
|
|
$
|
11,196
|
|
$
|
10,065
|
|
|||
|
Operating income as a percentage of revenue
|
19.8
|
%
|
23.0
|
%
|
21.9
|
%
|
||||||
For
fiscal 2014
, as compared with
fiscal 2013
, operating income decreased by
17%
, and as a percentage of revenue operating income decreased by
3.2
percentage points. The decrease resulted from the following: a decrease in revenue; a gross margin percentage decline, driven in part by the $655 million supplier component remediation charge (or 1.4 percentage points); the
$416 million
compensation expense recorded in fiscal 2014 in connection with our acquisition of the remaining interest in Insieme; and an increase in restructuring and other charges related to the workforce reduction under the Fiscal 2014 Plan.
In fiscal 2013 our results reflected solid execution on delivering profitable growth, as we grew operating income faster than revenue. In fiscal 2013, as compared with fiscal 2012, operating income increased by 11%, and as a percentage of revenue operating income increased by 1.1 percentage points. The increases resulted from the following: revenue growth of 6%; continuing focus on expense management, which resulted in lower sales and marketing and G&A expenses as a percentage of revenue; and lower restructuring and other charges.
57
Interest and Other Income (Loss), Net
Interest Income (Expense), Net
The following table summarizes interest income and interest expense (in millions):
|
Years Ended
|
July 26, 2014
|
July 27, 2013
|
Variance in Dollars
|
July 27, 2013
|
July 28, 2012
|
Variance in Dollars
|
|||||||||||||||||
|
Interest income
|
$
|
691
|
|
$
|
654
|
|
$
|
37
|
|
$
|
654
|
|
$
|
650
|
|
$
|
4
|
|
|||||
|
Interest expense
|
(564
|
)
|
(583
|
)
|
19
|
|
(583
|
)
|
(596
|
)
|
13
|
|
|||||||||||
|
Interest income (expense), net
|
$
|
127
|
|
$
|
71
|
|
$
|
56
|
|
$
|
71
|
|
$
|
54
|
|
$
|
17
|
|
|||||
Fiscal 2014 Compared with Fiscal 2013
Interest income increased in
fiscal 2014
as compared with fiscal 2013 due to the increase in our portfolio of cash, cash equivalents, and fixed income investments.
The decrease in interest expense in
fiscal 2014
as compared with the prior fiscal year was primarily attributable to the favorable impact of incremental interest rate swaps entered into during fiscal 2014 and the fourth quarter of fiscal 2013. This decrease was partially offset by additional interest expense due to the increase in long-term debt in fiscal 2014.
Fiscal 2013 Compared with Fiscal 2012
Interest income increased slightly in fiscal 2013 as compared with prior fiscal year due primarily to increased interest income earned on financing receivables, partially offset by lower interest income from our portfolio of cash, cash equivalents, and fixed income investments as a result of lower average interest rates. The decrease in interest expense in fiscal 2013 as compared with fiscal 2012 was attributable to the favorable impact of interest rate swaps and lower expense on our floating-rate notes as the benchmark London InterBank Offered Rate (LIBOR) decreased.
Other Income (Loss), Net
The components of other income (loss), net, are summarized as follows (in millions):
|
Years Ended
|
July 26, 2014
|
July 27, 2013
|
Variance in Dollars
|
July 27, 2013
|
July 28, 2012
|
Variance in Dollars
|
|||||||||||||||||
|
Gains (losses) on investments, net:
|
|||||||||||||||||||||||
|
Publicly traded equity securities
|
$
|
253
|
|
$
|
17
|
|
$
|
236
|
|
$
|
17
|
|
$
|
43
|
|
$
|
(26
|
)
|
|||||
|
Fixed income securities
|
47
|
|
31
|
|
16
|
|
31
|
|
58
|
|
(27
|
)
|
|||||||||||
|
Total available-for-sale investments
|
300
|
|
48
|
|
252
|
|
48
|
|
101
|
|
(53
|
)
|
|||||||||||
|
Privately held companies
|
(60
|
)
|
(57
|
)
|
(3
|
)
|
(57
|
)
|
(70
|
)
|
13
|
|
|||||||||||
|
Net gains (losses) on investments
|
240
|
|
(9
|
)
|
249
|
|
(9
|
)
|
31
|
|
(40
|
)
|
|||||||||||
|
Other gains (losses), net
|
3
|
|
(31
|
)
|
34
|
|
(31
|
)
|
9
|
|
(40
|
)
|
|||||||||||
|
Other income (loss), net
|
$
|
243
|
|
$
|
(40
|
)
|
$
|
283
|
|
$
|
(40
|
)
|
$
|
40
|
|
$
|
(80
|
)
|
|||||
Fiscal 2014 Compared with Fiscal 2013
The increase in total net gains on available-for-sale investments in
fiscal 2014
compared with
fiscal 2013
was primarily attributable to higher gains on publicly traded equity securities in the current period as a result of market conditions and the timing of sales of these securities.
The change in net losses on investments in privately held companies for the
fiscal 2014
as compared with
fiscal 2013
was primarily due to an increase of $40 million in our proportional share of losses from our VCE joint venture, partially offset by higher realized gains from various investments in privately held companies.
The change in other gains (losses), net in
fiscal 2014
as compared with fiscal 2013 was primarily due to higher gains on equity derivative instruments and lower donation expenses, partially offset by unfavorable foreign exchange impacts in
fiscal 2014
.
Fiscal 2013 Compared with Fiscal 2012
The decrease in net gains on available-for-sale investments in fiscal 2013 compared with fiscal 2012 was attributable to lower gains on fixed income and publicly traded equity securities in fiscal 2013 as a result of market conditions and the timing of sales of these securities. For fiscal 2013 as compared with fiscal 2012, the change in net losses on investments in privately held companies was primarily due to higher realized gains from various private investments, partially offset by an increase of $23 million in our proportional share of losses from our VCE joint venture. The change in other gains (losses), net for fiscal 2013 as compared with fiscal 2012, was primarily due to an increase in donations and less favorable foreign exchange impacts in fiscal 2013.
58
Provision for Income Taxes
Our provision for income taxes is subject to volatility and could be adversely impacted by earnings being lower than anticipated in countries that have lower tax rates, higher than anticipated in countries that have higher tax rates, and expiration of or lapses in tax incentives. Our provision for income taxes does not include provisions for U.S. income taxes and foreign withholding taxes associated with the repatriation of undistributed earnings of certain foreign subsidiaries that we intend to reinvest indefinitely in our foreign subsidiaries. If these earnings were distributed from the foreign subsidiaries to the United States in the form of dividends or otherwise, or if the shares of the relevant foreign subsidiaries were sold or otherwise transferred, we would be subject to additional U.S. income taxes (subject to an adjustment for foreign tax credits) and foreign withholding taxes. Further, as a result of certain of our ongoing employment and capital investment actions and commitments, our income in certain countries is subject to reduced tax rates and in some cases is wholly exempt from tax. Our failure to meet these commitments could adversely impact our provision for income taxes.
Fiscal 2014 Compared with Fiscal 2013
The provision for income taxes resulted in an effective tax rate of
19.2%
for
fiscal 2014
, compared with
11.1%
for
fiscal 2013
. The net
8.1
percentage point increase in the effective tax rate between fiscal years was primarily attributable to a non-recurring net tax benefit of $794 million, or 7.1 percentage points, due to a tax settlement with the IRS in fiscal 2013.
For a full reconciliation of our effective tax rate to the U.S. federal statutory rate of 35% and for further explanation of our provision for income taxes, see Note 16 to the Consolidated Financial Statements.
Fiscal 2013 Compared with Fiscal 2012
The provision for income taxes resulted in an effective tax rate of
11.1%
for fiscal 2013, compared with
20.8%
for fiscal 2012. The net
9.7
percentage point decrease in the effective tax rate between fiscal years was primarily attributable to a net tax benefit of $794 million, or 7.1 percentage points, due to a tax settlement with the IRS and an increase in tax benefits of $144 million, or 1.2 percentage points, due to the retroactive reinstatement of the U.S. federal R&D tax credit in fiscal 2013.
59
LIQUIDITY AND CAPITAL RESOURCES
The following sections discuss the effects of changes in our balance sheet, our capital allocation strategy including stock repurchase program and dividends, our contractual obligations, and certain other commitments and activities on our liquidity and capital resources.
Balance Sheet and Cash Flows
Cash and Cash Equivalents and Investments
The following table summarizes our cash and cash equivalents and investments (in millions):
|
|
July 26, 2014
|
July 27, 2013
|
Increase (Decrease)
|
||||||||
|
Cash and cash equivalents
|
$
|
6,726
|
|
$
|
7,925
|
|
$
|
(1,199
|
)
|
||
|
Fixed income securities
|
43,396
|
|
39,888
|
|
3,508
|
|
|||||
|
Publicly traded equity securities
|
1,952
|
|
2,797
|
|
(845
|
)
|
|||||
|
Total
|
$
|
52,074
|
|
$
|
50,610
|
|
$
|
1,464
|
|
||
The net increase in cash and cash equivalents and investments from fiscal 2013 to fiscal 2014 was primarily the result of cash provided by operating activities of
$12.3 billion
, a net increase in debt of
$4.7 billion
and the issuance of common stock of
$1.9 billion
pursuant to employee stock incentive and purchase plans. These sources of cash were partially offset by the repurchase of common stock of
$9.4 billion
under the stock repurchase program, cash dividends paid of
$3.8 billion
, net cash paid for acquisitions of
$3.0 billion
, and capital expenditures of
$1.3 billion
.
Our total in cash and cash equivalents and investments held by various foreign subsidiaries was
$47.4 billion
and
$40.4 billion
as of
July 26, 2014
and
July 27, 2013
, respectively. Under current tax laws and regulations, if these assets were to be distributed from the foreign subsidiaries to the United States in the form of dividends or otherwise, we would be subject to additional U.S. income taxes (subject to an adjustment for foreign tax credits) and foreign withholding taxes. The balance of cash and cash equivalents and investments available in the United States as of
July 26, 2014
and
July 27, 2013
was
$4.7 billion
and
$10.2 billion
, respectively.
We maintain an investment portfolio of various holdings, types, and maturities. We classify our investments as short-term investments based on their nature and their availability for use in current operations. We believe the overall credit quality of our portfolio is strong, with our cash equivalents and our fixed income investment portfolio consisting primarily of high quality investment-grade securities. We believe that our strong cash and cash equivalents and investments position allows us to use our cash resources for strategic investments to gain access to new technologies, for acquisitions, for customer financing activities, for working capital needs, and for the repurchase of shares of common stock and payment of dividends as discussed below.
Free Cash Flow and Capital Allocation
As part of our capital allocation strategy, we intend to return a minimum of 50% of our free cash flow annually to our shareholders through cash dividends and repurchases of common stock.
We define free cash flow as net cash provided by operating activities less cash used to acquire property and equipment. The following table reconciles our net cash provided by operating activities to free cash flow (in millions):
|
Years Ended
|
July 26, 2014
|
July 27, 2013
|
July 28, 2012
|
||||||||
|
Net cash provided by operating activities
|
$
|
12,332
|
|
$
|
12,894
|
|
$
|
11,491
|
|
||
|
Acquisition of property and equipment
|
(1,275
|
)
|
(1,160
|
)
|
(1,126
|
)
|
|||||
|
Free cash flow
|
$
|
11,057
|
|
$
|
11,734
|
|
$
|
10,365
|
|
||
We expect that cash provided by operating activities may fluctuate in future periods as a result of a number of factors, including fluctuations in our operating results, the rate at which products are shipped during the quarter (which we refer to as shipment linearity), the timing and collection of accounts receivable and financing receivables, inventory and supply chain management, deferred revenue, excess tax benefits resulting from share-based compensation, and the timing and amount of tax and other payments. For additional discussion, see “Part I, Item 1A. Risk Factors” in this report.
We consider free cash flow to be a liquidity measure that provides useful information to management and investors because of our intent to return a stated percentage of free cash flow to shareholders in the form of dividends and stock repurchases. We further regard free cash flow as a useful measure because it reflects cash that can be used to, among other things, invest in our business, make strategic acquisitions, repurchase common stock, and pay dividends on our common stock, after deducting capital investments. A limitation of the utility of free cash flow as a measure of financial performance and liquidity is that the free cash flow does not represent the total increase or decrease in our cash balance for the period. In addition, we have other
60
required uses of cash, including repaying the principal of our outstanding indebtedness. Free cash flow is not a measure calculated in accordance with U.S. generally accepted accounting principles and should not be regarded in isolation or as an alternative for net income provided by operating activities or any other measure calculated in accordance with such principles, and other companies may calculate free cash flow in a different manner than we do.
The following table summarizes the dividends paid and stock repurchases (in millions, except per-share amounts):
|
DIVIDENDS
|
STOCK REPURCHASE PROGRAM
|
TOTAL
|
|||||||||||||||||||||
|
Years Ended
|
Per Share
|
Amount
|
Shares
|
Weighted-Average Price per Share
|
Amount
|
Amount
|
|||||||||||||||||
|
July 26, 2014
|
$
|
0.72
|
|
$
|
3,758
|
|
420
|
|
$
|
22.71
|
|
$
|
9,539
|
|
$
|
13,297
|
|
||||||
|
July 27, 2013
|
$
|
0.62
|
|
$
|
3,310
|
|
128
|
|
$
|
21.63
|
|
$
|
2,773
|
|
$
|
6,083
|
|
||||||
|
July 28, 2012
|
$
|
0.28
|
|
$
|
1,501
|
|
262
|
|
$
|
16.64
|
|
$
|
4,360
|
|
$
|
5,861
|
|
||||||
On
August 26, 2014
, our Board of Directors declared a quarterly dividend of
$0.19
per common share to be paid on
October 22, 2014
to all shareholders of record as of the close of business on
October 2, 2014
. Any future dividends will be subject to the approval of our Board of Directors.
Accounts Receivable, Net
The following table summarizes our accounts receivable, net (in millions), and DSO:
|
|
July 26, 2014
|
July 27, 2013
|
Increase (Decrease)
|
||||||||
|
Accounts receivable, net
|
$
|
5,157
|
|
$
|
5,470
|
|
$
|
(313
|
)
|
||
|
DSO
|
38
|
|
40
|
|
(2
|
)
|
|||||
Our accounts receivable net, as of
July 26, 2014
decreased by approximately
6%
compared with the end of
fiscal 2013
. Our DSO as of
July 26, 2014
was lower by
2
days compared with the end of
fiscal 2013
, primarily due to an improvement in the linearity of shipments.
Inventory Supply Chain
The following table summarizes our inventories and purchase commitments with contract manufacturers and suppliers (in millions, except annualized inventory turns):
|
|
July 26, 2014
|
July 27, 2013
|
Increase (Decrease)
|
||||||||
|
Inventories
|
$
|
1,591
|
|
$
|
1,476
|
|
$
|
115
|
|
||
|
Annualized inventory turns
|
12.7
|
|
13.8
|
|
(1.1
|
)
|
|||||
|
Purchase commitments with contract manufacturers and suppliers
|
$
|
4,169
|
|
$
|
4,033
|
|
$
|
136
|
|
||
Inventory as of
July 26, 2014
increased by
8%
from our inventory balance at the end of
fiscal 2013
, and for the same period purchase commitments with contract manufacturers and suppliers increased
by approximately
3%
. On a combined basis, inventories and purchase commitments with contract manufacturers and suppliers increased by
5%
compared with the end of
fiscal 2013
. We believe our inventory and purchase commitments levels are in line with our current demand forecasts.
Our finished goods consist of distributor inventory and deferred cost of sales and manufactured finished goods. Distributor inventory and deferred cost of sales are related to unrecognized revenue on shipments to distributors and retail partners as well as shipments to customers. Manufactured finished goods consist primarily of build-to-order and build-to-stock products.
We purchase components from a variety of suppliers and use several contract manufacturers to provide manufacturing services for our products. During the normal course of business, in order to manage manufacturing lead times and help ensure adequate component supply, we enter into agreements with contract manufacturers and suppliers that allow them to procure inventory based upon criteria as defined by us or that establish the parameters defining our requirements and our commitment to securing manufacturing capacity. A significant portion of our reported purchase commitments arising from these agreements are firm, noncancelable, and unconditional commitments. In certain instances, these agreements allow us the option to cancel, reschedule, and adjust our requirements based on our business needs prior to firm orders being placed. Our purchase commitments are for short-term product manufacturing requirements as well as for commitments to suppliers to secure manufacturing capacity.
Inventory and supply chain management remain areas of focus as we balance the need to maintain supply chain flexibility to help ensure competitive lead times with the risk of inventory obsolescence because of rapidly changing technology and customer requirements. We believe the amount of our inventory and purchase commitments is appropriate for our revenue levels.
61
Financing Receivables and Guarantees
We measure our net balance sheet exposure position related to our financing receivables and financing guarantees by reducing the total of gross financing receivables and financing guarantees by the associated allowances for credit loss and deferred revenue. As of
July 26, 2014
, our net balance sheet exposure position related to financing receivables and financing guarantees was as follows (in millions):
|
|
FINANCING RECEIVABLES
|
FINANCING GUARANTEES
|
|||||||||||||||||||||||||||||
|
July 26, 2014
|
Lease
Receivables
|
Loan
Receivables
|
Financed Service
Contracts and Other
|
Total
|
Channel Partner
|
End-User Customers
|
Total
|
TOTAL
|
|||||||||||||||||||||||
|
Financing receivables less unearned income
|
$
|
3,527
|
|
$
|
1,683
|
|
$
|
3,210
|
|
$
|
8,420
|
|
$
|
263
|
|
$
|
202
|
|
$
|
465
|
|
$
|
8,885
|
|
|||||||
|
Allowance for credit loss
|
(233
|
)
|
(98
|
)
|
(18
|
)
|
(349
|
)
|
—
|
|
—
|
|
—
|
|
(349
|
)
|
|||||||||||||||
|
Deferred revenue
|
(23
|
)
|
(5
|
)
|
(1,843
|
)
|
(1,871
|
)
|
(127
|
)
|
(166
|
)
|
(293
|
)
|
(2,164
|
)
|
|||||||||||||||
|
Net balance sheet exposure
|
$
|
3,271
|
|
$
|
1,580
|
|
$
|
1,349
|
|
$
|
6,200
|
|
$
|
136
|
|
$
|
36
|
|
$
|
172
|
|
$
|
6,372
|
|
|||||||
Financing Receivables
Financing receivables less unearned income increased by
2%
compared with the end of
fiscal 2013
. The change was primarily due to a
2%
increase in both loan receivables and financed service contracts and other, and also due to
1%
increase in lease receivables. We provide financing to certain end-user customers and channel partners to enable sales of our products, services, and networking solutions. These financing arrangements include leases, financed service contracts, and loans. Arrangements related to leases are generally collateralized by a security interest in the underlying assets. Lease receivables include sales-type and direct-financing leases. We also provide certain qualified customers financing for long-term service contracts, which primarily relate to technical support services and advanced services. Our loan financing arrangements may include not only financing the acquisition of our products and services but also providing additional funds for other costs associated with network installation and integration of our products and services. We expect to continue to expand the use of our financing programs in the near term.
Financing Guarantees
In the normal course of business, third parties may provide financing arrangements to our customers and channel partners under financing programs. The financing arrangements to customers provided by third parties are related to leases and loans and typically have terms of up to three years. In some cases, we provide guarantees to third parties for these lease and loan arrangements. The financing arrangements to channel partners consist of revolving short-term financing provided by third parties, generally with payment terms ranging from 60 to 90 days. In certain instances, these financing arrangements result in a transfer of our receivables to the third party. The receivables are derecognized upon transfer, as these transfers qualify as true sales, and we receive payments for the receivables from the third party based on our standard payment terms. These financing arrangements facilitate the working capital requirements of the channel partners, and in some cases, we guarantee a portion of these arrangements. We could be called upon to make payments under these guarantees in the event of nonpayment by the channel partners or end-user customers. Historically, our payments under these arrangements have been immaterial. Where we provide a guarantee, we defer the revenue associated with the channel partner and end-user financing arrangement in accordance with revenue recognition policies, or we record a liability for the fair value of the guarantees. In either case, the deferred revenue is recognized as revenue when the guarantee is removed.
Deferred Revenue Related to Financing Receivables and Guarantees
The majority of the deferred revenue in the preceding table is related to financed service contracts. The majority of the revenue related to financed service contracts, which primarily relates to technical support services, is deferred as the revenue related to financed service contracts is recognized ratably over the period during which the related services are to be performed. A portion of the revenue related to lease and loan receivables is also deferred and included in deferred product revenue based on revenue recognition criteria not currently having been met.
62
Borrowings
Senior Notes
The following table summarizes the principal amount of our senior notes (in millions):
|
|
Maturity Date
|
July 26, 2014
|
July 27, 2013
|
|||||||
|
Senior notes:
|
||||||||||
|
Floating-rate notes:
|
||||||||||
|
Three-month LIBOR plus 0.25%
|
March 14, 2014
|
$
|
—
|
|
$
|
1,250
|
|
|||
|
Three-month LIBOR plus 0.05%
|
September 3, 2015
|
(1)
|
850
|
|
—
|
|
||||
|
Three-month LIBOR plus 0.28%
|
March 3, 2017
|
(1)
|
1,000
|
|
—
|
|
||||
|
Three-month LIBOR plus 0.50%
|
March 1, 2019
|
(1)
|
500
|
|
—
|
|
||||
|
Fixed-rate notes:
|
||||||||||
|
1.625%
|
March 14, 2014
|
—
|
|
2,000
|
|
|||||
|
2.90%
|
November 17, 2014
|
500
|
|
500
|
|
|||||
|
5.50%
|
February 22, 2016
|
3,000
|
|
3,000
|
|
|||||
|
1.10%
|
March 3, 2017
|
(1)
|
2,400
|
|
—
|
|
||||
|
3.15%
|
March 14, 2017
|
750
|
|
750
|
|
|||||
|
4.95%
|
February 15, 2019
|
2,000
|
|
2,000
|
|
|||||
|
2.125%
|
March 1, 2019
|
(1)
|
1,750
|
|
—
|
|
||||
|
4.45%
|
January 15, 2020
|
2,500
|
|
2,500
|
|
|||||
|
2.90%
|
March 4, 2021
|
(1)
|
500
|
|
—
|
|
||||
|
3.625%
|
March 4, 2024
|
(1)
|
1,000
|
|
—
|
|
||||
|
5.90%
|
February 15, 2039
|
2,000
|
|
2,000
|
|
|||||
|
5.50%
|
January 15, 2040
|
2,000
|
|
2,000
|
|
|||||
|
Total
|
$
|
20,750
|
|
$
|
16,000
|
|
||||
(1)
In March 2014, we issued senior notes with an aggregate principal amount of
$8.0 billion
.
We repaid senior floating-rate and fixed-rate notes upon their maturity in the third quarter of fiscal 2014 for an aggregate principal amount of
$3.3 billion
.
Interest is payable semiannually on each class of the senior fixed-rate notes, each of which is redeemable by us at any time, subject to a make-whole premium. Interest is payable quarterly on the floating-rate notes. We were in compliance with all debt covenants as of
July 26, 2014
.
Other Debt
Other debt as of
July 26, 2014
and
July 27, 2013
includes secured borrowings associated with customer financing arrangements. As of
July 27, 2013
, we also had outstanding notes related to our investment in Insieme. The amount of borrowings outstanding under these arrangements was
$12 million
and $31 million as of
July 26, 2014
and
July 27, 2013
, respectively.
Commercial Paper
In fiscal 2011, we established a short-term debt financing program of up to $3.0 billion through the issuance of commercial paper notes. We use the proceeds from the issuance of commercial paper notes for general corporate purposes. In fiscal 2014, we issued and repaid
$1.0 billion
of indebtedness under commercial paper and had no commercial paper notes outstanding as of each of
July 26, 2014
and
July 27, 2013
.
Credit Facility
On February 17, 2012, we entered into a credit agreement with certain institutional lenders that provides for a $3.0 billion unsecured revolving credit facility that is scheduled to expire on February 17, 2017. Any advances under the credit agreement will accrue interest at rates that are equal to, based on certain conditions, either (i) the higher of the Federal Funds rate plus 0.50%, Bank of America’s “prime rate” as announced from time to time, or one-month LIBOR plus 1.00% or (ii) LIBOR plus a margin that is based on our senior debt credit ratings as published by Standard & Poor’s Financial Services, LLC and Moody’s Investors Service, Inc. The credit agreement requires that we comply with certain covenants, including that we maintain an interest coverage ratio as defined in the agreement. As of
July 26, 2014
, we were in compliance with the required interest coverage ratio and the other covenants, and we had not borrowed any funds under the credit facility.
We may also, upon the agreement of either the existing lenders or additional lenders not currently parties to the agreement, increase the commitments under the credit facility by up to an additional $2.0 billion and/or extend the expiration date of the credit facility by up to two additional years, or up to February 17, 2019.
63
Deferred Revenue
The following table presents the breakdown of deferred revenue (in millions):
|
|
July 26, 2014
|
July 27, 2013
|
Increase (Decrease)
|
||||||||
|
Service
|
$
|
9,640
|
|
$
|
9,403
|
|
$
|
237
|
|
||
|
Product
|
4,502
|
|
4,020
|
|
482
|
|
|||||
|
Total
|
$
|
14,142
|
|
$
|
13,423
|
|
$
|
719
|
|
||
|
Reported as:
|
|||||||||||
|
Current
|
$
|
9,478
|
|
$
|
9,262
|
|
$
|
216
|
|
||
|
Noncurrent
|
4,664
|
|
4,161
|
|
503
|
|
|||||
|
Total
|
$
|
14,142
|
|
$
|
13,423
|
|
$
|
719
|
|
||
The increase in deferred service revenue in
fiscal 2014
reflects the impact of new contract initiations and renewals, partially offset by an increase in customers paying technical support service contracts over time and the impact of ongoing amortization of deferred service revenue. The increase in deferred product revenue was primarily due to increased deferrals related to subscription revenue arrangements and to a lesser extent, due to an increase in shipments not having met revenue recognition criteria as of
July 26, 2014
.
Contractual Obligations
The impact of contractual obligations on our liquidity and capital resources in future periods should be analyzed in conjunction with the factors that impact our cash flows from operations discussed previously. In addition, we plan for and measure our liquidity and capital resources through an annual budgeting process. The following table summarizes our contractual obligations at
July 26, 2014
(in millions):
|
|
PAYMENTS DUE BY PERIOD
|
||||||||||||||||||
|
July 26, 2014
|
Total
|
Less than 1 Year
|
1 to 3 Years
|
3 to 5 Years
|
More than 5 Years
|
||||||||||||||
|
Operating leases
|
$
|
1,239
|
|
$
|
399
|
|
$
|
457
|
|
$
|
196
|
|
$
|
187
|
|
||||
|
Purchase commitments with contract manufacturers and suppliers
|
4,169
|
|
4,169
|
|
—
|
|
—
|
|
—
|
|
|||||||||
|
Other purchase obligations
|
896
|
|
534
|
|
316
|
|
45
|
|
1
|
|
|||||||||
|
Long-term debt
|
20,754
|
|
500
|
|
8,004
|
|
4,250
|
|
8,000
|
|
|||||||||
|
Other long-term liabilities
|
1,379
|
|
—
|
|
505
|
|
55
|
|
819
|
|
|||||||||
|
Total by period
|
$
|
28,437
|
|
$
|
5,602
|
|
$
|
9,282
|
|
$
|
4,546
|
|
$
|
9,007
|
|
||||
|
Other long-term liabilities (uncertainty in the timing of future payments)
|
2,220
|
|
|||||||||||||||||
|
Total
|
$
|
30,657
|
|
||||||||||||||||
Operating Leases
For more information on our operating leases, see Note 12 to the Consolidated Financial Statements.
Purchase Commitments with Contract Manufacturers and Suppliers
We purchase components from a variety of suppliers and use several contract manufacturers to provide manufacturing services for our products. A significant portion of our reported estimated purchase commitments arising from these agreements are firm, noncancelable, and unconditional commitments. We record a liability for firm, noncancelable, and unconditional purchase commitments for quantities in excess of our future demand forecasts consistent with the valuation of our excess and obsolete inventory. See further discussion in “Inventory Supply Chain.” As of
July 26, 2014
, the liability for these purchase commitments was
$162 million
and is recorded in other current liabilities and is not included in the preceding table.
Other Purchase Obligations
Other purchase obligations represent an estimate of all contractual obligations in the ordinary course of business, other than operating leases and commitments with contract manufacturers and suppliers, for which we have not received the goods or services. Purchase orders are not included in the preceding table as they typically represent our authorization to purchase rather than binding contractual purchase obligations.
Long-Term Debt
The amount of long-term debt in the preceding table represents the principal amount of the respective debt instruments. See Note 10 to the Consolidated Financial Statements.
64
Other Long-Term Liabilities
Other long-term liabilities primarily include noncurrent income taxes payable, accrued liabilities for deferred compensation, noncurrent deferred tax liabilities, and certain other long-term liabilities. Due to the uncertainty in the timing of future payments, our noncurrent income taxes payable of approximately
$1,851 million
and noncurrent deferred tax liabilities of
$369 million
were presented as one aggregated amount in the total column on a separate line in the preceding table. Noncurrent income taxes payable include uncertain tax positions (see Note 16 to the Consolidated Financial Statements).
Other Commitments
In connection with our business combinations and asset purchases, we have agreed to pay certain additional amounts contingent upon the achievement of certain agreed-upon technology, development, product, or other milestones or the continued employment with us of certain employees of the acquired entities. See Note 12 to the Consolidated Financial Statements.
Insieme Networks, Inc.
In the third quarter of fiscal 2012, we made an investment in Insieme, an early stage company focused on research and development in the data center market. As set forth in the agreement between Cisco and Insieme, this investment included
$100 million
of funding and a license to certain of our technology. Immediately prior to the call option exercise and acquisition described below, we owned approximately
83%
of Insieme as a result of these investments and have consolidated the results of Insieme in our Consolidated Financial Statements. In connection with this investment, we entered into a put/call option agreement that provided us with the right to purchase the remaining interests in Insieme. In addition, the noncontrolling interest holders could require us to purchase their shares upon the occurrence of certain events.
During the first quarter of fiscal 2014, we exercised our call option and entered into an agreement to purchase the remaining interests in Insieme. The acquisition closed in the second quarter of fiscal 2014, at which time the former noncontrolling interest holders became eligible to receive up to two milestone payments, which will be determined using agreed-upon formulas based primarily on revenue for certain of Insieme’s products. During
fiscal 2014
, we recorded compensation expense of
$416 million
, related to the fair value of the vested portion of amounts that are expected to be earned by the former noncontrolling interest holders. Continued vesting and changes to the fair value of the amounts probable of being earned will result in adjustments to the recorded compensation expense in future periods. Based on the terms of the agreement, we have determined that the maximum amount that could be recorded as compensation expense by us is approximately
$855 million
, net of forfeitures and including the
$416 million
that has been expensed during
fiscal 2014
. The milestone payments, if earned, are expected to be paid primarily during fiscal 2016 and fiscal 2017.
Other Funding Commitments
We also have certain funding commitments primarily related to our investments in privately held companies and venture funds, some of which are based on the achievement of certain agreed-upon milestones, and some of which are required to be funded on demand. The funding commitments were
$255 million
as of
July 26, 2014
, compared with
$263 million
as of
July 27, 2013
.
Off-Balance Sheet Arrangements
We consider our investments in unconsolidated variable interest entities to be off-balance sheet arrangements. In the ordinary course of business, we have investments in privately held companies and provide financing to certain customers. These privately held companies and customers may be considered to be variable interest entities. We evaluate on an ongoing basis our investments in these privately held companies and customer financings, and we have determined that as of
July 26, 2014
there were no material unconsolidated variable interest entities.
VCE is a joint venture that we formed in fiscal 2010 with EMC Corporation (“EMC”), with investments from VMware, Inc. (“VMware”) and Intel Corporation. VCE helps organizations leverage best-in-class technologies and disciplines from Cisco, EMC, and VMware to enable the transformation to cloud computing. As of
July 26, 2014
, our cumulative gross investment in VCE was approximately
$716 million
, inclusive of accrued interest, and our ownership percentage was approximately
35%
. During
fiscal 2014
, we invested approximately
$185 million
in VCE. We account for our investment in VCE under the equity method, and our portion of VCE’s net loss is recognized in other income (loss), net. As of
July 26, 2014
, we have recorded cumulative losses from VCE of
$644 million
since inception. Our carrying value in VCE as of
July 26, 2014
was
$72 million
. Over the next 12 months, as VCE scales its operations, we may make additional investments in VCE and may incur additional losses proportionate with our share ownership.
From time to time, EMC and Cisco may enter into guarantee agreements on behalf of VCE to indemnify third parties, such as customers, for monetary damages. Such guarantees were not material as of
July 26, 2014
.
On an ongoing basis, we reassess our investments in privately held companies and customer financings to determine if they are variable interest entities and if we would be regarded as the primary beneficiary pursuant to the applicable accounting guidance. As a result of this ongoing assessment, we may be required to make additional disclosures or consolidate these entities. Because we may not control these entities, we may not have the ability to influence these events.
65
We provide financing guarantees, which are generally for various third-party financing arrangements extended to our channel partners and end-user customers. We could be called upon to make payments under these guarantees in the event of nonpayment by the channel partners or end-user customers. See the previous discussion of these financing guarantees under “Financing Receivables and Guarantees.”
Securities Lending
We periodically engage in securities lending activities with certain of our available-for-sale investments. These transactions are accounted for as a secured lending of the securities, and the securities are typically loaned only on an overnight basis. The average daily balance of securities lending for
fiscal 2014
and 2013 was
$1.5 billion
and
$0.7 billion
, respectively. We require collateral equal to at least 102% of the fair market value of the loaned security and that the collateral be in the form of cash or liquid, high-quality assets. We engage in these secured lending transactions only with highly creditworthy counterparties, and the associated portfolio custodian has agreed to indemnify us against collateral losses. As of
July 26, 2014
and
July 27, 2013
, we had no outstanding securities lending transactions. We believe these arrangements do not present a material risk or impact to our liquidity requirements.
Liquidity and Capital Resource Requirements
Based on past performance and current expectations, we believe our cash and cash equivalents, investments, cash generated from operations, and ability to access capital markets and committed credit lines will satisfy, through at least the next 12 months, our liquidity requirements, both in total and domestically, including the following: working capital needs, capital expenditures, investment requirements, stock repurchases, cash dividends, contractual obligations, commitments, principal and interest payments on debt, future customer financings, and other liquidity requirements associated with our operations. There are no other transactions, arrangements, or relationships with unconsolidated entities or other persons that are reasonably likely to materially affect the liquidity and the availability of, as well as our requirements for, capital resources.
66
|
Item 7A.
|
Quantitative and Qualitative Disclosures About Market Risk
|
Our financial position is exposed to a variety of risks, including interest rate risk, equity price risk, and foreign currency exchange risk.
Interest Rate Risk
Fixed Income Securities
We maintain an investment portfolio of various holdings, types, and maturities. Our primary objective for holding fixed income securities is to achieve an appropriate investment return consistent with preserving principal and managing risk. At any time, a sharp rise in market interest rates could have a material adverse impact on the fair value of our fixed income investment portfolio. Conversely, declines in interest rates, including the impact from lower credit spreads, could have a material adverse impact on interest income for our investment portfolio. We may utilize derivative instruments designated as hedging instruments to achieve our investment objectives. We had no outstanding hedging instruments for our fixed income securities as of
July 26, 2014
. Our fixed income investments are held for purposes other than trading. Our fixed income investments are not leveraged as of
July 26, 2014
. We monitor our interest rate and credit risks, including our credit exposures to specific rating categories and to individual issuers. As of
July 26, 2014
, approximately
76%
of our fixed income securities balance consisted of U.S. government and U.S. government agency securities. We believe the overall credit quality of our portfolio is strong.
The following tables present the hypothetical fair values of our fixed income securities, including the hedging effects when applicable, as a result of selected potential market decreases and increases in interest rates. The market changes reflect immediate hypothetical parallel shifts in the yield curve of plus or minus 50 basis points (“BPS”), plus 100 BPS, and plus 150 BPS. Due to the low interest rate environment at the end of each of
fiscal 2014
and
fiscal 2013
, we did not believe a parallel shift of minus 100 BPS or minus 150 BPS was relevant. The hypothetical fair values as of
July 26, 2014
and
July 27, 2013
are as follows (in millions):
|
|
VALUATION OF SECURITIES
GIVEN AN INTEREST RATE
DECREASE OF X BASIS POINTS
|
FAIR VALUE
AS OF JULY 26, 2014
|
VALUATION OF SECURITIES
GIVEN AN INTEREST RATE
INCREASE OF X BASIS POINTS
|
||||||||||||||||||
|
|
(150 BPS)
|
(100 BPS)
|
(50 BPS)
|
50 BPS
|
100 BPS
|
150 BPS
|
|||||||||||||||
|
Fixed income securities
|
N/A
|
N/A
|
$
|
43,721
|
|
$43,396
|
$
|
43,071
|
|
$
|
42,747
|
|
$
|
42,422
|
|
||||||
|
|
VALUATION OF SECURITIES
GIVEN AN INTEREST RATE
DECREASE OF X BASIS POINTS
|
FAIR VALUE
AS OF JULY 27, 2013
|
VALUATION OF SECURITIES
GIVEN AN INTEREST RATE
INCREASE OF X BASIS POINTS
|
||||||||||||||||||
|
|
(150 BPS)
|
(100 BPS)
|
(50 BPS)
|
50 BPS
|
100 BPS
|
150 BPS
|
|||||||||||||||
|
Fixed income securities
|
N/A
|
N/A
|
$
|
40,193
|
|
$39,888
|
$
|
39,583
|
|
$
|
39,278
|
|
$
|
38,973
|
|
||||||
Financing Receivables
As of
July 26, 2014
, our financing receivables had a carrying value of
$8.1 billion
, compared with
$7.9 billion
as of
July 27, 2013
. As of
July 26, 2014
, a hypothetical 50 BPS increase or decrease in market interest rates would change the fair value of our financing receivables by a decrease or increase of approximately $0.1 billion, respectively.
Debt
As of
July 26, 2014
, we had
$20.8 billion
in principal amount of senior notes outstanding, which consisted of
$2.4 billion
floating-rate notes and
$18.4 billion
fixed-rate notes. The carrying amount of the senior notes was
$20.9 billion
, and the related fair value based on market prices was
$22.4 billion
. As of
July 26, 2014
, a hypothetical 50 BPS increase or decrease in market interest rates would change the fair value of the fixed-rate debt, excluding the
$10.4 billion
of hedged debt, by a decrease or increase of approximately $0.4 billion, respectively. However, this hypothetical change in interest rates would not impact the interest expense on the fixed-rate debt that is not hedged.
67
Equity Price Risk
The fair value of our equity investments in publicly traded companies is subject to market price volatility. We may hold equity securities for strategic purposes or to diversify our overall investment portfolio. Our equity portfolio consists of securities with characteristics that most closely match the Standard & Poor’s 500 Index or NASDAQ Composite Index. These equity securities are held for purposes other than trading. To manage our exposure to changes in the fair value of certain equity securities, we may enter into equity derivatives designated as hedging instruments.
Publicly Traded Equity Securities
The following tables present the hypothetical fair values of publicly traded equity securities as a result of selected potential decreases and increases in the price of each equity security in the portfolio, excluding hedged equity securities, if any. Potential fluctuations in the price of each equity security in the portfolio of plus or minus 10%, 20%, and 30% were selected based on potential near-term changes in those security prices. The hypothetical fair values as of
July 26, 2014
and
July 27, 2013
are as follows (in millions):
|
|
VALUATION OF
SECURITIES
GIVEN AN X%
DECREASE IN
EACH STOCK’S PRICE
|
FAIR VALUE
AS OF JULY 26, 2014
|
VALUATION OF
SECURITIES
GIVEN AN X%
INCREASE IN
EACH STOCK’S PRICE
|
||||||||||||||||||||||
|
|
(30)%
|
(20)%
|
(10)%
|
10%
|
20%
|
30%
|
|||||||||||||||||||
|
Publicly traded equity securities
|
$
|
1,144
|
|
$
|
1,307
|
|
$
|
1,471
|
|
$1,634
|
$
|
1,797
|
|
$
|
1,961
|
|
$
|
2,124
|
|
||||||
|
|
VALUATION OF
SECURITIES
GIVEN AN X%
DECREASE IN
EACH STOCK’S PRICE
|
FAIR VALUE
AS OF JULY 27, 2013 |
VALUATION OF
SECURITIES
GIVEN AN X%
INCREASE IN
EACH STOCK’S PRICE
|
||||||||||||||||||||||
|
|
(30)%
|
(20)%
|
(10)%
|
10%
|
20%
|
30%
|
|||||||||||||||||||
|
Publicly traded equity securities
|
$
|
1,000
|
|
$
|
1,143
|
|
$
|
1,286
|
|
$1,429
|
$
|
1,572
|
|
$
|
1,715
|
|
$
|
1,858
|
|
||||||
Investments in Privately Held Companies
We have also invested in privately held companies. These investments are recorded in other assets in our Consolidated Balance Sheets and are accounted for using primarily either the cost or the equity method. As of
July 26, 2014
, the total carrying amount of our investments in privately held companies was
$899 million
, compared with
$833 million
at
July 27, 2013
. Some of the privately held companies in which we invested are in the startup or development stages. These investments are inherently risky because the markets for the technologies or products these companies are developing are typically in the early stages and may never materialize. We could lose our entire investment in these companies. Our evaluation of investments in privately held companies is based on the fundamentals of the businesses invested in, including, among other factors, the nature of their technologies and potential for financial return.
68
Foreign Currency Exchange Risk
Our foreign exchange forward and option contracts outstanding at fiscal year-end are summarized in U.S. dollar equivalents as follows (in millions):
|
|
July 26, 2014
|
July 27, 2013
|
|||||||||||||
|
|
Notional Amount
|
Fair Value
|
Notional Amount
|
Fair Value
|
|||||||||||
|
Forward contracts:
|
|||||||||||||||
|
Purchased
|
$
|
2,635
|
|
$
|
(3
|
)
|
$
|
3,472
|
|
$
|
7
|
|
|||
|
Sold
|
$
|
896
|
|
$
|
2
|
|
$
|
1,401
|
|
$
|
(5
|
)
|
|||
|
Option contracts:
|
|||||||||||||||
|
Purchased
|
$
|
494
|
|
$
|
5
|
|
$
|
716
|
|
$
|
23
|
|
|||
|
Sold
|
$
|
466
|
|
$
|
(2
|
)
|
$
|
696
|
|
$
|
(4
|
)
|
|||
We conduct business globally in numerous currencies. The direct effect of foreign currency fluctuations on revenue has not been material because our sales are primarily denominated in U.S. dollars. However, if the U.S. dollar strengthens relative to other currencies, such strengthening could have an indirect effect on our revenue to the extent it raises the cost of our products to non-U.S. customers and thereby reduces demand. A weaker U.S. dollar could have the opposite effect. However, the precise indirect effect of currency fluctuations is difficult to measure or predict because our sales are influenced by many factors in addition to the impact of such currency fluctuations.
Approximately 65% of our operating expenses are U.S.-dollar denominated. In
fiscal 2014
, foreign currency fluctuations, net of hedging, decreased our combined R&D, sales and marketing, and G&A expenses by
$153 million
, or approximately
0.9%
, compared with
fiscal 2013
.In
fiscal 2013
, foreign currency fluctuations, net of hedging, decreased our combined R&D, sales and marketing, and G&A expenses by
$227 million
, or approximately
1.3%
as compared with
fiscal 2012
. To reduce variability in operating expenses and service cost of sales caused by non-U.S.-dollar denominated operating expenses and costs, we hedge certain forecasted foreign currency transactions with currency options and forward contracts. These hedging programs are not designed to provide foreign currency protection over long time horizons. In designing a specific hedging approach, we consider several factors, including offsetting exposures, significance of exposures, costs associated with entering into a particular hedge instrument, and potential effectiveness of the hedge. The gains and losses on foreign exchange contracts mitigate the effect of currency movements on our operating expenses and service cost of sales.
We also enter into foreign exchange forward and option contracts to reduce the short-term effects of foreign currency fluctuations on receivables and payables that are denominated in currencies other than the functional currencies of the entities. The market risks associated with these foreign currency receivables, investments, and payables relate primarily to variances from our forecasted foreign currency transactions and balances. Our forward and option contracts generally have the following maturities:
|
|
Maturities
|
|
|
Forward and option contracts—forecasted transactions related to operating expenses and service cost of sales
|
Up to 18 months
|
|
|
Forward contracts—current assets and liabilities
|
Up to 3 months
|
|
|
Forward contracts—net investments in foreign subsidiaries
|
Up to 6 months
|
|
|
Forward contracts—long-term customer financings
|
Up to 2 years
|
|
We do not enter into foreign exchange forward or option contracts for trading purposes.
69
|
Item 8.
|
Financial Statements and Supplementary Data
|
70
Report of Independent Registered Public Accounting Firm
To the Board of Directors and Shareholders of Cisco Systems, Inc.:
In our opinion, the accompanying consolidated balance sheets and the related consolidated statements of operations, of comprehensive income, of cash flows and of equity present fairly, in all material respects, the financial position of Cisco Systems, Inc. and its subsidiaries at
July 26, 2014
and
July 27, 2013
, and the results of their operations and their cash flows for each of the three years in the period ended
July 26, 2014
in conformity with accounting principles generally accepted in the United States of America. In addition, in our opinion, the financial statement schedule appearing under Item 15(a)(2) presents fairly, in all material respects, the information set forth therein when read in conjunction with the related consolidated financial statements. Also in our opinion, the Company maintained, in all material respects, effective internal control over financial reporting as of
July 26, 2014
, based on criteria established in
Internal Control—Integrated Framework
(1992) issued by the Committee of Sponsoring Organizations of the Treadway Commission (COSO). The Company’s management is responsible for these financial statements and financial statement schedule, for maintaining effective internal control over financial reporting and for its assessment of the effectiveness of internal control over financial reporting, included in the accompanying Management’s Report on Internal Control over Financial Reporting. Our responsibility is to express opinions on these financial statements, on the financial statement schedule, and on the Company’s internal control over financial reporting based on our integrated audits. We conducted our audits in accordance with the standards of the Public Company Accounting Oversight Board (United States). Those standards require that we plan and perform the audits to obtain reasonable assurance about whether the financial statements are free of material misstatement and whether effective internal control over financial reporting was maintained in all material respects. Our audits of the financial statements included examining, on a test basis, evidence supporting the amounts and disclosures in the financial statements, assessing the accounting principles used and significant estimates made by management, and evaluating the overall financial statement presentation. Our audit of internal control over financial reporting included obtaining an understanding of internal control over financial reporting, assessing the risk that a material weakness exists, and testing and evaluating the design and operating effectiveness of internal control based on the assessed risk. Our audits also included performing such other procedures as we considered necessary in the circumstances. We believe that our audits provide a reasonable basis for our opinions.
A company’s internal control over financial reporting is a process designed to provide reasonable assurance regarding the reliability of financial reporting and the preparation of financial statements for external purposes in accordance with generally accepted accounting principles. A company’s internal control over financial reporting includes those policies and procedures that (i) pertain to the maintenance of records that, in reasonable detail, accurately and fairly reflect the transactions and dispositions of the assets of the company; (ii) provide reasonable assurance that transactions are recorded as necessary to permit preparation of financial statements in accordance with generally accepted accounting principles, and that receipts and expenditures of the company are being made only in accordance with authorizations of management and directors of the company; and (iii) provide reasonable assurance regarding prevention or timely detection of unauthorized acquisition, use, or disposition of the company’s assets that could have a material effect on the financial statements.
Because of its inherent limitations, internal control over financial reporting may not prevent or detect misstatements. Also, projections of any evaluation of effectiveness to future periods are subject to the risk that controls may become inadequate because of changes in conditions, or that the degree of compliance with the policies or procedures may deteriorate.
/s/ PricewaterhouseCoopers LLP
San Jose, California
September 9, 2014
71
Reports of Management
Statement of Management’s Responsibility
Cisco’s management has always assumed full accountability for maintaining compliance with our established financial accounting policies and for reporting our results with objectivity and the highest degree of integrity. It is critical for investors and other users of the Consolidated Financial Statements to have confidence that the financial information that we provide is timely, complete, relevant, and accurate. Management is responsible for the fair presentation of Cisco’s Consolidated Financial Statements, prepared in accordance with accounting principles generally accepted in the United States of America, and has full responsibility for their integrity and accuracy.
Management, with oversight by Cisco’s Board of Directors, has established and maintains a strong ethical climate so that our affairs are conducted to the highest standards of personal and corporate conduct. Management also has established an effective system of internal controls. Cisco’s policies and practices reflect corporate governance initiatives that are compliant with the listing requirements of NASDAQ and the corporate governance requirements of the Sarbanes-Oxley Act of 2002.
We are committed to enhancing shareholder value and fully understand and embrace our fiduciary oversight responsibilities. We are dedicated to ensuring that our high standards of financial accounting and reporting, as well as our underlying system of internal controls, are maintained. Our culture demands integrity and we have the highest confidence in our processes, our internal controls and our people, who are objective in their responsibilities and who operate under the highest level of ethical standards.
Management’s Report on Internal Control over Financial Reporting
Management is responsible for establishing and maintaining adequate internal control over financial reporting for Cisco. Internal control over financial reporting is a process designed to provide reasonable assurance regarding the reliability of financial reporting and the preparation of financial statements for external purposes in accordance with generally accepted accounting principles. Internal control over financial reporting includes those policies and procedures that: (i) pertain to the maintenance of records that in reasonable detail accurately and fairly reflect the transactions and dispositions of the assets of the Company; (ii) provide reasonable assurance that transactions are recorded as necessary to permit preparation of financial statements in accordance with generally accepted accounting principles, and that receipts and expenditures of the Company are being made only in accordance with authorizations of management and directors of the Company; and (iii) provide reasonable assurance regarding prevention or timely detection of unauthorized acquisition, use, or disposition of the Company’s assets that could have a material effect on the financial statements.
Because of its inherent limitations, internal control over financial reporting may not prevent or detect misstatements. Also, projections of any evaluation of effectiveness to future periods are subject to the risk that controls may become inadequate because of changes in conditions, or that the degree of compliance with the policies or procedures may deteriorate.
Management (with the participation of the principal executive officer and principal financial officer) conducted an evaluation of the effectiveness of Cisco’s internal control over financial reporting based on the framework in
Internal Control—Integrated Framework
(1992) issued by the Committee of Sponsoring Organizations of the Treadway Commission. Based on this evaluation, management concluded that Cisco’s internal control over financial reporting was effective as of
July 26, 2014
. PricewaterhouseCoopers LLP, an independent registered public accounting firm, has audited the effectiveness of Cisco’s internal control over financial reporting and has issued a report on Cisco’s internal control over financial reporting, which is included in their report on the preceding page.
|
/S/
J
OHN
T.
C
HAMBERS
|
|
/S/
F
RANK
A.
C
ALDERONI
|
|
John T. Chambers
|
|
Frank A. Calderoni
|
|
Chairman and Chief Executive Officer
|
|
Executive Vice President and Chief Financial Officer
|
|
September 9, 2014
|
|
September 9, 2014
|
72
CISCO SYSTEMS, INC.
(in millions, except par value)
|
July 26, 2014
|
July 27, 2013
|
||||||
|
ASSETS
|
|||||||
|
Current assets:
|
|||||||
|
Cash and cash equivalents
|
$
|
6,726
|
|
$
|
7,925
|
|
|
|
Investments
|
45,348
|
|
42,685
|
|
|||
|
Accounts receivable, net of allowance for doubtful accounts of
$265
at July 26, 2014 and $228 at July 27, 2013
|
5,157
|
|
5,470
|
|
|||
|
Inventories
|
1,591
|
|
1,476
|
|
|||
|
Financing receivables, net
|
4,153
|
|
4,037
|
|
|||
|
Deferred tax assets
|
2,808
|
|
2,616
|
|
|||
|
Other current assets
|
1,331
|
|
1,312
|
|
|||
|
Total current assets
|
67,114
|
|
65,521
|
|
|||
|
Property and equipment, net
|
3,252
|
|
3,322
|
|
|||
|
Financing receivables, net
|
3,918
|
|
3,911
|
|
|||
|
Goodwill
|
24,239
|
|
21,919
|
|
|||
|
Purchased intangible assets, net
|
3,280
|
|
3,403
|
|
|||
|
Other assets
|
3,331
|
|
3,115
|
|
|||
|
TOTAL ASSETS
|
$
|
105,134
|
|
$
|
101,191
|
|
|
|
LIABILITIES AND EQUITY
|
|
|
|||||
|
Current liabilities:
|
|
|
|||||
|
Short-term debt
|
$
|
508
|
|
$
|
3,283
|
|
|
|
Accounts payable
|
1,032
|
|
1,029
|
|
|||
|
Income taxes payable
|
159
|
|
192
|
|
|||
|
Accrued compensation
|
3,181
|
|
3,182
|
|
|||
|
Deferred revenue
|
9,478
|
|
9,262
|
|
|||
|
Other current liabilities
|
5,451
|
|
5,048
|
|
|||
|
Total current liabilities
|
19,809
|
|
21,996
|
|
|||
|
Long-term debt
|
20,401
|
|
12,928
|
|
|||
|
Income taxes payable
|
1,851
|
|
1,748
|
|
|||
|
Deferred revenue
|
4,664
|
|
4,161
|
|
|||
|
Other long-term liabilities
|
1,748
|
|
1,230
|
|
|||
|
Total liabilities
|
48,473
|
|
42,063
|
|
|||
|
Commitments and contingencies (Note 12)
|
|
|
|||||
|
Equity:
|
|||||||
|
Cisco shareholders’ equity:
|
|||||||
|
Preferred stock, no par value: 5 shares authorized; none issued and outstanding
|
—
|
|
—
|
|
|||
|
Common stock and additional paid-in capital, $0.001 par value: 20,000 shares authorized; 5,107 and 5,389 shares issued and outstanding at July 26, 2014 and July 27, 2013, respectively
|
41,884
|
|
42,297
|
|
|||
|
Retained earnings
|
14,093
|
|
16,215
|
|
|||
|
Accumulated other comprehensive income
|
677
|
|
608
|
|
|||
|
Total Cisco shareholders’ equity
|
56,654
|
|
59,120
|
|
|||
|
Noncontrolling interests
|
7
|
|
8
|
|
|||
|
Total equity
|
56,661
|
|
59,128
|
|
|||
|
TOTAL LIABILITIES AND EQUITY
|
$
|
105,134
|
|
$
|
101,191
|
|
|
See Notes to Consolidated Financial Statements.
73
CISCO SYSTEMS, INC.
(in millions, except per-share amounts)
|
Years Ended
|
July 26, 2014
|
July 27, 2013
|
July 28, 2012
|
||||||||
|
REVENUE:
|
|||||||||||
|
Product
|
$
|
36,172
|
|
|
$
|
38,029
|
|
$
|
36,326
|
|
|
|
Service
|
10,970
|
|
|
10,578
|
|
9,735
|
|
||||
|
Total revenue
|
47,142
|
|
|
48,607
|
|
46,061
|
|
||||
|
COST OF SALES:
|
|
|
|
||||||||
|
Product
|
15,641
|
|
|
15,541
|
|
14,505
|
|
||||
|
Service
|
3,732
|
|
|
3,626
|
|
3,347
|
|
||||
|
Total cost of sales
|
19,373
|
|
|
19,167
|
|
17,852
|
|
||||
|
GROSS MARGIN
|
27,769
|
|
|
29,440
|
|
28,209
|
|
||||
|
OPERATING EXPENSES:
|
|
|
|
||||||||
|
Research and development
|
6,294
|
|
|
5,942
|
|
5,488
|
|
||||
|
Sales and marketing
|
9,503
|
|
|
9,538
|
|
9,647
|
|
||||
|
General and administrative
|
1,934
|
|
|
2,264
|
|
2,322
|
|
||||
|
Amortization of purchased intangible assets
|
275
|
|
|
395
|
|
383
|
|
||||
|
Restructuring and other charges
|
418
|
|
|
105
|
|
304
|
|
||||
|
Total operating expenses
|
18,424
|
|
|
18,244
|
|
18,144
|
|
||||
|
OPERATING INCOME
|
9,345
|
|
|
11,196
|
|
10,065
|
|
||||
|
Interest income
|
691
|
|
|
654
|
|
650
|
|
||||
|
Interest expense
|
(564
|
)
|
|
(583
|
)
|
(596
|
)
|
||||
|
Other income (loss), net
|
243
|
|
|
(40
|
)
|
40
|
|
||||
|
Interest and other income (loss), net
|
370
|
|
|
31
|
|
94
|
|
||||
|
INCOME BEFORE PROVISION FOR INCOME TAXES
|
9,715
|
|
|
11,227
|
|
10,159
|
|
||||
|
Provision for income taxes
|
1,862
|
|
|
1,244
|
|
2,118
|
|
||||
|
NET INCOME
|
$
|
7,853
|
|
|
$
|
9,983
|
|
$
|
8,041
|
|
|
|
|
|
|
|
|
|||||||
|
Net income per share:
|
|
|
|
|
|||||||
|
Basic
|
$
|
1.50
|
|
|
$
|
1.87
|
|
$
|
1.50
|
|
|
|
Diluted
|
$
|
1.49
|
|
|
$
|
1.86
|
|
$
|
1.49
|
|
|
|
Shares used in per-share calculation:
|
|
|
|
|
|
||||||
|
Basic
|
5,234
|
|
|
5,329
|
|
5,370
|
|
||||
|
Diluted
|
5,281
|
|
|
5,380
|
|
5,404
|
|
||||
|
|
|
|
|
|
|
||||||
|
Cash dividends declared per common share
|
$
|
0.72
|
|
|
$
|
0.62
|
|
$
|
0.28
|
|
|
See Notes to Consolidated Financial Statements.
74
CISCO SYSTEMS, INC.
Consolidated Statements of Comprehensive Income
(in millions)
|
Years Ended
|
July 26, 2014
|
July 27, 2013
|
July 28, 2012
|
||||||||
|
Net income
|
$
|
7,853
|
|
$
|
9,983
|
|
$
|
8,041
|
|
||
|
Available-for-sale investments:
|
|||||||||||
|
Change in net unrealized gains, net of tax benefit (expense) of $(146), $(2), and $6 for fiscal 2014, 2013, and 2012, respectively
|
233
|
|
(6
|
)
|
(31
|
)
|
|||||
|
Net gains reclassified into earnings, net of tax expense of $111, $17, and $36 for fiscal 2014, 2013, and 2012, respectively
|
(189
|
)
|
(31
|
)
|
(65
|
)
|
|||||
|
|
44
|
|
(37
|
)
|
(96
|
)
|
|||||
|
Cash flow hedging instruments:
|
|||||||||||
|
Change in unrealized gains and losses, net of tax benefit (expense) of $0, $(1), and $0 for fiscal 2014, 2013, and 2012, respectively
|
48
|
|
73
|
|
(131
|
)
|
|||||
|
Net (gains) losses reclassified into earnings
|
(68
|
)
|
(12
|
)
|
72
|
|
|||||
|
|
(20
|
)
|
61
|
|
(59
|
)
|
|||||
|
Net change in cumulative translation adjustment and other, net of tax benefit (expense) of $(5), $(1), and $36 for fiscal 2014, 2013, and 2012, respectively
|
44
|
|
(84
|
)
|
(496
|
)
|
|||||
|
Other comprehensive income(loss)
|
68
|
|
(60
|
)
|
(651
|
)
|
|||||
|
Comprehensive income
|
7,921
|
|
9,923
|
|
7,390
|
|
|||||
|
Comprehensive (income) loss attributable to noncontrolling interests
|
1
|
|
7
|
|
18
|
|
|||||
|
Comprehensive income attributable to Cisco Systems, Inc.
|
$
|
7,922
|
|
$
|
9,930
|
|
$
|
7,408
|
|
||
See Notes to Consolidated Financial Statements.
75
CISCO SYSTEMS, INC.
(in millions)
|
Years Ended
|
July 26, 2014
|
July 27, 2013
|
July 28, 2012
|
||||||||
|
Cash flows from operating activities:
|
|||||||||||
|
Net income
|
$
|
7,853
|
|
$
|
9,983
|
|
$
|
8,041
|
|
||
|
Adjustments to reconcile net income to net cash provided by operating activities:
|
|
|
|||||||||
|
Depreciation, amortization, and other
|
2,432
|
|
2,451
|
|
2,208
|
|
|||||
|
Share-based compensation expense
|
1,348
|
|
1,120
|
|
1,401
|
|
|||||
|
Provision for receivables
|
79
|
|
44
|
|
50
|
|
|||||
|
Deferred income taxes
|
(678
|
)
|
(37
|
)
|
(314
|
)
|
|||||
|
Excess tax benefits from share-based compensation
|
(118
|
)
|
(92
|
)
|
(60
|
)
|
|||||
|
(Gains) losses on investments and other, net
|
(299
|
)
|
(91
|
)
|
363
|
|
|||||
|
Change in operating assets and liabilities, net of effects of acquisitions and divestitures:
|
|
|
|||||||||
|
Accounts receivable
|
340
|
|
(1,001
|
)
|
272
|
|
|||||
|
Inventories
|
(109
|
)
|
218
|
|
(287
|
)
|
|||||
|
Financing receivables
|
(119
|
)
|
(723
|
)
|
(846
|
)
|
|||||
|
Other assets
|
33
|
|
(27
|
)
|
(674
|
)
|
|||||
|
Accounts payable
|
(23
|
)
|
164
|
|
(7
|
)
|
|||||
|
Income taxes, net
|
191
|
|
(239
|
)
|
418
|
|
|||||
|
Accrued compensation
|
(42
|
)
|
134
|
|
(101
|
)
|
|||||
|
Deferred revenue
|
659
|
|
598
|
|
727
|
|
|||||
|
Other liabilities
|
785
|
|
392
|
|
300
|
|
|||||
|
Net cash provided by operating activities
|
12,332
|
|
12,894
|
|
11,491
|
|
|||||
|
Cash flows from investing activities:
|
|||||||||||
|
Purchases of investments
|
(36,317
|
)
|
(36,608
|
)
|
(41,782
|
)
|
|||||
|
Proceeds from sales of investments
|
18,193
|
|
14,799
|
|
27,337
|
|
|||||
|
Proceeds from maturities of investments
|
15,660
|
|
17,909
|
|
12,103
|
|
|||||
|
Acquisition of businesses, net of cash and cash equivalents acquired
|
(2,989
|
)
|
(6,766
|
)
|
(375
|
)
|
|||||
|
Purchases of investments in privately held companies
|
(384
|
)
|
(225
|
)
|
(380
|
)
|
|||||
|
Return of investments in privately held companies
|
213
|
|
209
|
|
242
|
|
|||||
|
Acquisition of property and equipment
|
(1,275
|
)
|
(1,160
|
)
|
(1,126
|
)
|
|||||
|
Proceeds from sales of property and equipment
|
232
|
|
141
|
|
50
|
|
|||||
|
Other
|
24
|
|
(67
|
)
|
116
|
|
|||||
|
Net cash used in investing activities
|
(6,643
|
)
|
(11,768
|
)
|
(3,815
|
)
|
|||||
|
Cash flows from financing activities:
|
|||||||||||
|
Issuances of common stock
|
1,907
|
|
3,338
|
|
1,372
|
|
|||||
|
Repurchases of common stock - repurchase program
|
(9,413
|
)
|
(2,773
|
)
|
(4,560
|
)
|
|||||
|
Shares repurchased for tax withholdings on vesting of restricted stock units
|
(430
|
)
|
(330
|
)
|
(200
|
)
|
|||||
|
Short-term borrowings, original maturities less than 90 days, net
|
(2
|
)
|
(20
|
)
|
(557
|
)
|
|||||
|
Issuances of debt
|
8,001
|
|
24
|
|
—
|
|
|||||
|
Repayments of debt
|
(3,276
|
)
|
(16
|
)
|
—
|
|
|||||
|
Excess tax benefits from share-based compensation
|
118
|
|
92
|
|
60
|
|
|||||
|
Dividends paid
|
(3,758
|
)
|
(3,310
|
)
|
(1,501
|
)
|
|||||
|
Other
|
(35
|
)
|
(5
|
)
|
(153
|
)
|
|||||
|
Net cash used in financing activities
|
(6,888
|
)
|
(3,000
|
)
|
(5,539
|
)
|
|||||
|
Net (decrease) increase
in cash and cash equivalents
|
(1,199
|
)
|
(1,874
|
)
|
2,137
|
|
|||||
|
Cash and cash equivalents, beginning of fiscal year
|
7,925
|
|
9,799
|
|
7,662
|
|
|||||
|
Cash and cash equivalents, end of fiscal year
|
$
|
6,726
|
|
$
|
7,925
|
|
$
|
9,799
|
|
||
|
Supplemental cash flow information:
|
|||||||||||
|
Cash paid for interest
|
$
|
682
|
|
|
$
|
682
|
|
$
|
681
|
|
|
|
Cash paid for income taxes, net
|
$
|
2,349
|
|
|
$
|
1,519
|
|
$
|
2,014
|
|
|
See Notes to Consolidated Financial Statements.
76
CISCO SYSTEMS, INC.
Consolidated Statements of Equity
(in millions, except per-share amounts)
|
Shares of
Common
Stock
|
Common Stock
and
Additional
Paid-In Capital
|
Retained
Earnings
|
Accumulated
Other
Comprehensive
Income
|
Total Cisco
Shareholders’
Equity
|
Non-controlling
Interests
|
Total Equity
|
||||||||||||||||||||
|
BALANCE AT JULY 30, 2011
|
5,435
|
|
$
|
38,648
|
|
$
|
7,284
|
|
$
|
1,294
|
|
$
|
47,226
|
|
$
|
33
|
|
$
|
47,259
|
|
||||||
|
Net income
|
8,041
|
|
8,041
|
|
8,041
|
|
||||||||||||||||||||
|
Other comprehensive income (loss)
|
(633
|
)
|
(633
|
)
|
(18
|
)
|
(651
|
)
|
||||||||||||||||||
|
Issuance of common stock
|
137
|
|
1,372
|
|
1,372
|
|
1,372
|
|
||||||||||||||||||
|
Repurchase of common stock
|
(262
|
)
|
(1,890
|
)
|
(2,470
|
)
|
(4,360
|
)
|
(4,360
|
)
|
||||||||||||||||
|
Shares repurchased for tax withholdings on vesting of restricted stock units
|
(12
|
)
|
(200
|
)
|
(200
|
)
|
(200
|
)
|
||||||||||||||||||
|
Cash dividends declared ($0.28 per common share)
|
(1,501
|
)
|
(1,501
|
)
|
(1,501
|
)
|
||||||||||||||||||||
|
Tax effects from employee stock incentive plans
|
(66
|
)
|
(66
|
)
|
(66
|
)
|
||||||||||||||||||||
|
Share-based compensation expense
|
1,401
|
|
1,401
|
|
1,401
|
|
||||||||||||||||||||
|
Purchase acquisitions and other
|
6
|
|
6
|
|
6
|
|
||||||||||||||||||||
|
BALANCE AT JULY 28, 2012
|
5,298
|
|
$
|
39,271
|
|
$
|
11,354
|
|
$
|
661
|
|
$
|
51,286
|
|
$
|
15
|
|
$
|
51,301
|
|
||||||
|
Net income
|
9,983
|
|
9,983
|
|
9,983
|
|
||||||||||||||||||||
|
Other comprehensive income (loss)
|
(53
|
)
|
(53
|
)
|
(7
|
)
|
(60
|
)
|
||||||||||||||||||
|
Issuance of common stock
|
235
|
|
3,338
|
|
3,338
|
|
3,338
|
|
||||||||||||||||||
|
Repurchase of common stock
|
(128
|
)
|
(961
|
)
|
(1,812
|
)
|
(2,773
|
)
|
(2,773
|
)
|
||||||||||||||||
|
Shares repurchased for tax withholdings on vesting of restricted stock units
|
(16
|
)
|
(330
|
)
|
(330
|
)
|
(330
|
)
|
||||||||||||||||||
|
Cash dividends declared ($0.62 per common share)
|
(3,310
|
)
|
(3,310
|
)
|
(3,310
|
)
|
||||||||||||||||||||
|
Tax effects from employee stock incentive plans
|
(204
|
)
|
(204
|
)
|
(204
|
)
|
||||||||||||||||||||
|
Share-based compensation expense
|
1,120
|
|
1,120
|
|
1,120
|
|
||||||||||||||||||||
|
Purchase acquisitions and other
|
63
|
|
63
|
|
63
|
|
||||||||||||||||||||
|
BALANCE AT JULY 27, 2013
|
5,389
|
|
$
|
42,297
|
|
$
|
16,215
|
|
$
|
608
|
|
$
|
59,120
|
|
$
|
8
|
|
$
|
59,128
|
|
||||||
|
Net income
|
7,853
|
|
7,853
|
|
7,853
|
|
||||||||||||||||||||
|
Other comprehensive income (loss)
|
69
|
|
69
|
|
(1
|
)
|
68
|
|
||||||||||||||||||
|
Issuance of common stock
|
156
|
|
1,907
|
|
1,907
|
|
1,907
|
|
||||||||||||||||||
|
Repurchase of common stock
|
(420
|
)
|
(3,322
|
)
|
(6,217
|
)
|
(9,539
|
)
|
(9,539
|
)
|
||||||||||||||||
|
Shares repurchased for tax withholdings on vesting of restricted stock units
|
(18
|
)
|
(430
|
)
|
(430
|
)
|
(430
|
)
|
||||||||||||||||||
|
Cash dividends declared ($0.72 per common share)
|
(3,758
|
)
|
(3,758
|
)
|
(3,758
|
)
|
||||||||||||||||||||
|
Tax effects from employee stock incentive plans
|
35
|
|
35
|
|
35
|
|
||||||||||||||||||||
|
Share-based compensation expense
|
1,348
|
|
1,348
|
|
1,348
|
|
||||||||||||||||||||
|
Purchase acquisitions and other
|
49
|
|
49
|
|
49
|
|
||||||||||||||||||||
|
BALANCE AT JULY 26, 2014
|
5,107
|
|
$
|
41,884
|
|
$
|
14,093
|
|
$
|
677
|
|
$
|
56,654
|
|
$
|
7
|
|
$
|
56,661
|
|
||||||
Supplemental Information
In September 2001, the Company’s Board of Directors authorized a stock repurchase program. As of
July 26, 2014
, the Company’s Board of Directors had authorized an aggregate repurchase of up to
$97 billion
of common stock under this program with no termination date. The stock repurchases since the inception of this program and the related impacts on Cisco shareholders’ equity are summarized in the following table (in millions):
|
Shares of
Common
Stock
|
Common Stock
and Additional
Paid-In Capital
|
Retained
Earnings
|
Total Cisco
Shareholders’
Equity
|
|||||||||||
|
Repurchases of common stock under the repurchase program
|
4,288
|
|
$
|
21,324
|
|
$
|
67,121
|
|
$
|
88,445
|
|
|||
See Notes to Consolidated Financial Statements.
77
Notes to Consolidated Financial Statements
|
1.
|
Basis of Presentation
|
The fiscal year for Cisco Systems, Inc. (the “Company” or “Cisco”) is the 52 or 53 weeks ending on the last Saturday in July.
Fiscal 2014
,
fiscal 2013
, and
fiscal 2012
are each 52-week fiscal years. The Consolidated Financial Statements include the accounts of Cisco and its subsidiaries. All intercompany accounts and transactions have been eliminated. The Company conducts business globally and is primarily managed on a geographic basis in the following three geographic segments: the Americas; Europe, Middle East, and Africa (EMEA); and Asia Pacific, Japan, and China (APJC).
The Company consolidates its investments in a venture fund managed by SOFTBANK Corp. and its affiliates (“SOFTBANK”) as this is a variable interest entity and the Company is the primary beneficiary. The noncontrolling interests attributed to SOFTBANK are presented as a separate component from the Company’s equity in the equity section of the Consolidated Balance Sheets. SOFTBANK’s share of the earnings in the venture fund are not presented separately in the Consolidated Statements of Operations as these amounts are not material for any of the fiscal periods presented.
Certain reclassifications have been made to the amounts for prior years in order to conform to the current year’s presentation. The Company has evaluated subsequent events through the date that the financial statements were issued.
|
2.
|
Summary of Significant Accounting Policies
|
(a) Cash and Cash Equivalents
The Company considers all highly liquid investments purchased with an original or remaining maturity of three months or less at the date of purchase to be cash equivalents. Cash and cash equivalents are maintained with various financial institutions.
(b) Available-for-Sale Investments
The Company classifies its investments in both fixed income securities and publicly traded equity securities as available-for-sale investments. Fixed income securities primarily consist of U.S. government securities, U.S. government agency securities, non-U.S. government and agency securities, corporate debt securities, and U.S. agency mortgage-backed securities. These available-for-sale investments are primarily held in the custody of a major financial institution. A specific identification method is used to determine the cost basis of fixed income and public equity securities sold. These investments are recorded in the Consolidated Balance Sheets at fair value. Unrealized gains and losses on these investments, to the extent the investments are unhedged, are included as a separate component of accumulated other comprehensive income (AOCI), net of tax. The Company classifies its investments as current based on the nature of the investments and their availability for use in current operations.
(c) Other-than-Temporary Impairments on Investments
When the fair value of a debt security is less than its amortized cost, it is deemed impaired, and the Company will assess whether the impairment is other than temporary. An impairment is considered other than temporary if (i) the Company has the intent to sell the security, (ii) it is more likely than not that the Company will be required to sell the security before recovery of the entire amortized cost basis, or (iii) the Company does not expect to recover the entire amortized cost basis of the security. If impairment is considered other than temporary based on condition (i) or (ii) described earlier, the entire difference between the amortized cost and the fair value of the debt security is recognized in earnings. If an impairment is considered other than temporary based on condition (iii), the amount representing credit losses (defined as the difference between the present value of the cash flows expected to be collected and the amortized cost basis of the debt security) will be recognized in earnings, and the amount relating to all other factors will be recognized in other comprehensive income (OCI).
The Company recognizes an impairment charge on publicly traded equity securities when a decline in the fair value of a security below the respective cost basis is judged to be other than temporary. The Company considers various factors in determining whether a decline in the fair value of these investments is other than temporary, including the length of time and extent to which the fair value of the security has been less than the Company’s cost basis, the financial condition and near-term prospects of the issuer, and the Company’s intent and ability to hold the investment for a period of time sufficient to allow for any anticipated recovery in market value.
Investments in privately held companies are included in other assets in the Consolidated Balance Sheets and are primarily accounted for using either the cost or equity method. The Company monitors these investments for impairments and makes reductions in carrying values if the Company determines that an impairment charge is required based primarily on the financial condition and near-term prospects of these companies.
(d) Inventories
Inventories are stated at the lower of cost or market. Cost is computed using standard cost, which approximates actual cost, on a first-in, first-out basis. The Company provides inventory write-downs based on excess and obsolete inventories determined primarily by future demand forecasts. The write-down is measured as the difference between the cost of the inventory and market based upon assumptions about future demand and charged to the provision for inventory, which is a component of cost of sales. At the point of the loss recognition, a new, lower cost basis for that inventory is established, and
78
subsequent changes in facts and circumstances do not result in the restoration or increase in that newly established cost basis. In addition, the Company records a liability for firm, noncancelable, and unconditional purchase commitments with contract manufacturers and suppliers for quantities in excess of the Company’s future demand forecasts consistent with its valuation of excess and obsolete inventory.
(e) Allowance for Doubtful Accounts
The allowance for doubtful accounts is based on the Company’s assessment of the collectibility of customer accounts. The Company regularly reviews the allowance by considering factors such as historical experience, credit quality, age of the accounts receivable balances, economic conditions that may affect a customer’s ability to pay, and expected default frequency rates. Trade receivables are written off at the point when they are considered uncollectible.
(f) Financing Receivables and Guarantees
The Company provides financing arrangements, including leases, financed service contracts, and loans, for certain qualified end-user customers to build, maintain, and upgrade their networks. Lease receivables primarily represent sales-type and direct-financing leases. Leases have on average a
four
-year term and are usually collateralized by a security interest in the underlying assets, while loan receivables generally have terms of up to
three
years. Financed service contracts typically have terms of
one
to
three years
and primarily relate to technical support services.
The Company determines the adequacy of its allowance for credit loss by assessing the risks and losses inherent in its financing receivables by portfolio segment. The portfolio segment is based on the types of financing offered by the Company to its customers: lease receivables, loan receivables, and financed service contracts and other.
The Company assesses the allowance for credit loss related to financing receivables on either an individual or a collective basis. The Company considers various factors in evaluating lease and loan receivables and the earned portion of financed service contracts for possible impairment on an individual basis. These factors include the Company’s historical experience, credit quality and age of the receivable balances, and economic conditions that may affect a customer’s ability to pay. When the evaluation indicates that it is probable that all amounts due pursuant to the contractual terms of the financing agreement, including scheduled interest payments, are unable to be collected, the financing receivable is considered impaired. All such outstanding amounts, including any accrued interest, will be assessed and fully reserved at the customer level. The Company’s internal credit risk ratings are categorized as
1
through
10
, with the lowest credit risk rating representing the highest quality financing receivables. Typically, the Company also considers receivables with a risk rating of
8
or higher to be impaired and will include them in the individual assessment for allowance. The Company evaluates the remainder of its financing receivables portfolio for impairment on a collective basis and records an allowance for credit loss at the portfolio segment level. When evaluating the financing receivables on a collective basis, the Company uses expected default frequency rates published by a major third-party credit-rating agency as well as its own historical loss rate in the event of default, while also systematically giving effect to economic conditions, concentration of risk, and correlation.
Expected default frequency rates are published quarterly by a major third-party credit-rating agency, and the internal credit risk rating is derived by taking into consideration various customer-specific factors and macroeconomic conditions. These factors, which include the strength of the customer’s business and financial performance, the quality of the customer’s banking relationships, the Company’s specific historical experience with the customer, the performance and outlook of the customer’s industry, the customer’s legal and regulatory environment, the potential sovereign risk of the geographic locations in which the customer is operating, and independent third-party evaluations, are updated regularly or when facts and circumstances indicate that an update is deemed necessary.
Financing receivables are written off at the point when they are considered uncollectible, and all outstanding balances, including any previously earned but uncollected interest income, will be reversed and charged against the allowance for credit loss. The Company does not typically have any partially written-off financing receivables.
Outstanding financing receivables that are aged
31
days or more from the contractual payment date are considered past due. The Company does not accrue interest on financing receivables that are considered impaired or more than
90
days past due unless either the receivable has not been collected due to administrative reasons or the receivable is well secured and in the process of collection. Financing receivables may be placed on nonaccrual status earlier if, in management’s opinion, a timely collection of the full principal and interest becomes uncertain. After a financing receivable has been categorized as nonaccrual, interest will be recognized when cash is received. A financing receivable may be returned to accrual status after all of the customer’s delinquent balances of principal and interest have been settled, and the customer remains current for an appropriate period.
The Company facilitates arrangements for third-party financing extended to channel partners, consisting of revolving short-term financing, generally with payment terms ranging from
60
to
90
days. In certain instances, these financing arrangements result in a transfer of the Company’s receivables to the third party. The receivables are derecognized upon transfer, as these transfers qualify as true sales, and the Company receives a payment for the receivables from the third party based on the Company’s standard payment terms. These financing arrangements facilitate the working capital requirements of the channel partners, and, in some cases, the Company guarantees a portion of these arrangements. The Company also provides financing guarantees for third-party financing arrangements extended to end-user customers related to leases and loans, which typically
79
have terms of up to
three
years. The Company could be called upon to make payments under these guarantees in the event of nonpayment by the channel partners or end-user customers. Deferred revenue relating to these financing arrangements is recorded in accordance with revenue recognition policies or for the fair value of the financing guarantees.
(g) Depreciation and Amortization
Property and equipment are stated at cost, less accumulated depreciation or amortization, whenever applicable. Depreciation and amortization expenses for property and equipment were approximately
$1.2 billion
,
$1.2 billion
, and
$1.1 billion
for fiscal 2014, 2013, and 2012, respectively. Depreciation and amortization are computed using the straight-line method, generally over the following periods:
|
Asset Category
|
Period
|
|
|
Buildings
|
25 years
|
|
|
Building improvements
|
10 years
|
|
|
Leasehold improvements
|
Shorter of remaining lease term or up to 10 years
|
|
|
Computer equipment and related software
|
30 to 36 months
|
|
|
Production, engineering, and other equipment
|
Up to 5 years
|
|
|
Operating lease assets
|
Based on lease term
|
|
|
Furniture and fixtures
|
5 years
|
|
(h) Business Combinations
The Company allocates the fair value of the purchase consideration of its acquisitions to the tangible assets, liabilities, and intangible assets acquired, including in-process research and development (IPR&D), based on their estimated fair values. The excess of the fair value of purchase consideration over the fair values of these identifiable assets and liabilities is recorded as goodwill. IPR&D is initially capitalized at fair value as an intangible asset with an indefinite life and assessed for impairment thereafter. When a project underlying reported IPR&D is completed, the corresponding amount of IPR&D is reclassified as an amortizable purchased intangible asset and is amortized over the asset’s estimated useful life. Acquisition-related expenses and restructuring costs are recognized separately from the business combination and are expensed as incurred.
(i) Goodwill and Purchased Intangible Assets
Goodwill is tested for impairment on an annual basis in the fourth fiscal quarter and, when specific circumstances dictate, between annual tests. When impaired, the carrying value of goodwill is written down to fair value. The goodwill impairment test involves a two-step process. The first step, identifying a potential impairment, compares the fair value of a reporting unit with its carrying amount, including goodwill. If the carrying value of the reporting unit exceeds its fair value, the second step would need to be conducted; otherwise, no further steps are necessary as no potential impairment exists. If necessary, the second step to measure the impairment loss would be to compare the implied fair value of the reporting unit goodwill with the carrying amount of that goodwill. Any excess of the reporting unit goodwill carrying value over the respective implied fair value is recognized as an impairment loss. Purchased intangible assets with finite lives are carried at cost, less accumulated amortization. Amortization is computed over the estimated useful lives of the respective assets. See “Long-Lived Assets” for the Company’s policy regarding impairment testing of purchased intangible assets with finite lives. Purchased intangible assets with indefinite lives are assessed for potential impairment annually or when events or circumstances indicate that their carrying amounts might be impaired.
(j) Long-Lived Assets
Long-lived assets that are held and used by the Company are reviewed for impairment whenever events or changes in circumstances indicate that the carrying amount of such assets may not be recoverable. Determination of recoverability of long-lived assets is based on an estimate of the undiscounted future cash flows resulting from the use of the asset and its eventual disposition. Measurement of an impairment loss for long-lived assets that management expects to hold and use is based on the difference between the fair value of the asset and its carrying value. Long-lived assets to be disposed of are reported at the lower of carrying amount or fair value less costs to sell.
(k) Fair Value
Fair value is defined as the price that would be received from selling an asset or paid to transfer a liability in an orderly transaction between market participants at the measurement date. When determining the fair value measurements for assets and liabilities required or permitted to be either recorded or disclosed at fair value, the Company considers the principal or most advantageous market in which it would transact, and it also considers assumptions that market participants would use when pricing the asset or liability.
The accounting guidance for fair value measurement requires an entity to maximize the use of observable inputs and minimize the use of unobservable inputs when measuring fair value. The standard establishes a fair value hierarchy based on the level of independent, objective evidence surrounding the inputs used to measure fair value. A financial instrument’s categorization within the fair value hierarchy is based upon the lowest level of input that is significant to the fair value measurement. The fair value hierarchy is as follows:
Level 1
applies to assets or liabilities for which there are quoted prices in active markets for identical assets or liabilities.
80
Level 2
applies to assets or liabilities for which there are inputs other than quoted prices that are observable for the asset or liability such as quoted prices for similar assets or liabilities in active markets; quoted prices for identical assets or liabilities in markets with insufficient volume or infrequent transactions (less active markets); or model-derived valuations in which significant inputs are observable or can be derived principally from, or corroborated by, observable market data.
Level 3
applies to assets or liabilities for which there are unobservable inputs to the valuation methodology that are significant to the measurement of the fair value of the assets or liabilities.
(l) Derivative Instruments
The Company recognizes derivative instruments as either assets or liabilities and measures those instruments at fair value. The accounting for changes in the fair value of a derivative depends on the intended use of the derivative and the resulting designation. For a derivative instrument designated as a fair value hedge, the gain or loss is recognized in earnings in the period of change together with the offsetting loss or gain on the hedged item attributed to the risk being hedged. For a derivative instrument designated as a cash flow hedge, the effective portion of the derivative’s gain or loss is initially reported as a component of AOCI and subsequently reclassified into earnings when the hedged exposure affects earnings. The ineffective portion of the gain or loss is reported in earnings immediately. For a derivative instrument designated as a net investment hedge of the Company’s foreign operations, the gain or loss is recorded in the cumulative translation adjustment within AOCI together with the offsetting loss or gain of the hedged exposure of the underlying foreign operations. Any ineffective portion of the net investment hedges is reported in earnings during the period of change. For derivative instruments that are not designated as accounting hedges, changes in fair value are recognized in earnings in the period of change. The Company records derivative instruments in the statements of cash flows to operating, investing, or financing activities consistent with the cash flows of the hedged item.
Hedge effectiveness for foreign exchange forward contracts used as cash flow hedges is assessed by comparing the change in the fair value of the hedge contract with the change in the fair value of the forecasted cash flows of the hedged item. Hedge effectiveness for equity forward contracts and foreign exchange net investment hedge forward contracts is assessed by comparing changes in fair value due to changes in spot rates for both the derivative and the hedged item. For foreign exchange option contracts, hedge effectiveness is assessed based on the hedging instrument’s entire change in fair value. Hedge effectiveness for interest rate swaps is assessed by comparing the change in fair value of the swap with the change in the fair value of the hedged item due to changes in the benchmark interest rate.
(m) Foreign Currency Translation
Assets and liabilities of non-U.S. subsidiaries that operate in a local currency environment, where that local currency is the functional currency, are translated to U.S. dollars at exchange rates in effect at the balance sheet date, with the resulting translation adjustments directly recorded to a separate component of AOCI. Income and expense accounts are translated at average exchange rates during the year. Remeasurement adjustments are recorded in other income (loss), net. The effect of foreign currency exchange rates on cash and cash equivalents was not material for any of the fiscal years presented.
(n) Concentrations of Risk
Cash and cash equivalents are maintained with several financial institutions. Deposits held with banks may exceed the amount of insurance provided on such deposits. Generally, these deposits may be redeemed upon demand and are maintained with financial institutions with reputable credit and therefore bear minimal credit risk. The Company seeks to mitigate its credit risks by spreading such risks across multiple counterparties and monitoring the risk profiles of these counterparties.
The Company performs ongoing credit evaluations of its customers and, with the exception of certain financing transactions, does not require collateral from its customers. The Company receives certain of its components from sole suppliers. Additionally, the Company relies on a limited number of contract manufacturers and suppliers to provide manufacturing services for its products. The inability of a contract manufacturer or supplier to fulfill supply requirements of the Company could materially impact future operating results.
(o) Revenue Recognition
The Company recognizes revenue when persuasive evidence of an arrangement exists, delivery has occurred, the fee is fixed or determinable, and collectibility is reasonably assured. In instances where final acceptance of the product, system, or solution is specified by the customer, revenue is deferred until all acceptance criteria have been met. For hosting arrangements, the Company recognizes subscription revenue ratably over the subscription period, while usage revenue is recognized based on utilization. Software subscription revenue is deferred and recognized ratably over the subscription term upon delivery of the first product and commencement of the term. Technical support services revenue is deferred and recognized ratably over the period during which the services are to be performed, which is typically from
one
to
three
years. Advanced services transactional revenue is recognized upon delivery or completion of performance.
The Company uses distributors that stock inventory and typically sell to systems integrators, service providers, and other resellers. The Company refers to this as its two-tier system of sales to the end customer. Revenue from distributors is recognized based on a sell-through method using information provided by them. Distributors and other partners participate in various rebate, cooperative marketing and other programs, and the Company maintains estimated accruals and allowances for these programs. The ending liability for these programs was included in other current liabilities and the balance as of
July 26, 2014
and
July 27, 2013
was
$1.3 billion
and
$1.1 billion
, respectively. The Company accrues for warranty costs, sales returns,
81
and other allowances based on its historical experience. Shipping and handling fees billed to customers are included in revenue, with the associated costs included in cost of sales.
Many of the Company’s products have both software and nonsoftware components that function together to deliver the products’ essential functionality. The Company’s product offerings fall into the following categories: Switching, Next-Generation Network (NGN) Routing, Service Provider Video, Collaboration, Data Center, Wireless, Security, and Other Products. The Company also provides technical support and advanced services. The Company has a broad customer base that encompasses virtually all types of public and private entities, including enterprise businesses, service providers, and commercial customers. The Company and its salesforce are not organized by product divisions, and the Company’s products and services can be sold standalone or together in various combinations across the Company’s geographic segments or customer markets. For example, service provider arrangements are typically larger in scale with longer deployment schedules and involve the delivery of a variety of product technologies, including high-end routing, video and network management software, and other product technologies along with technical support and advanced services. The Company’s enterprise and commercial arrangements are unique for each customer and smaller in scale and may include network infrastructure products such as routers and switches or collaboration technologies such as Unified Communications and Cisco TelePresence systems products along with technical support services.
The Company enters into revenue arrangements that may consist of multiple deliverables of its product and service offerings due to the needs of its customers. For example, a customer may purchase routing products along with a contract for technical support services. This arrangement would consist of multiple elements, with the products delivered in one reporting period and the technical support services delivered across multiple reporting periods. Another customer may purchase networking products along with advanced service offerings, in which all the elements are delivered within the same reporting period. In addition, distributors purchase products or technical support services on a standalone basis for resale to an end user or for purposes of stocking certain products, and these transactions would not result in a multiple-element arrangement.
In many instances, products are sold separately in standalone arrangements as customers may support the products themselves or purchase support on a time-and-materials basis. Advanced services are sometimes sold in standalone engagements such as general consulting, network management, or security advisory projects, and technical support services are sold separately through renewals of annual contracts. The Company determines its vendor-specific objective evidence (VSOE) based on its normal pricing and discounting practices for the specific product or service when sold separately. VSOE determination requires that a substantial majority of the historical standalone transactions have the selling prices for a product or service that fall within a reasonably narrow pricing range, generally evidenced by approximately 80% of such historical standalone transactions falling within plus or minus 15% of the median rates. In addition, the Company considers the geographies in which the products or services are sold, major product and service groups and customer classifications, and other environmental or marketing variables in determining VSOE.
When the Company is not able to establish VSOE for all deliverables in an arrangement with multiple elements, which may be due to the Company infrequently selling each element separately, not pricing products within a narrow range, or only having a limited sales history, such as in the case of certain newly introduced product categories, the Company attempts to determine the selling price of each element based on third-party evidence of selling price (TPE). TPE is determined based on competitor prices for similar deliverables when sold separately. Generally, the Company’s go-to-market strategy differs from that of its peers, and its offerings contain a significant level of differentiation such that the comparable pricing of products with similar functionality cannot be obtained. Furthermore, the Company is unable to reliably determine what similar competitor products’ selling prices are on a standalone basis. Therefore, the Company is typically not able to determine TPE.
When the Company is unable to establish fair value using VSOE or TPE, the Company uses estimated selling prices (ESP) in its allocation of arrangement consideration. The objective of ESP is to determine the price at which the Company would transact a sale if the product or service were regularly sold on a standalone basis. ESP is generally used for new or highly proprietary offerings and solutions or for offerings not priced within a reasonably narrow range. The Company determines ESP for a product or service by considering multiple factors, including, but not limited to, geographies, market conditions, competitive landscape, internal costs, gross margin objectives, and pricing practices. The determination of ESP is made through consultation with and formal approval by the Company’s management, taking into consideration the go-to-market strategy.
The Company regularly reviews VSOE, TPE, and ESP and maintains internal controls over the establishment and updates of these estimates. There were no material impacts during the fiscal year, nor does the Company currently expect a material impact in the near term from changes in VSOE, TPE, or ESP.
The Company’s arrangements with multiple deliverables may have a standalone software deliverable that is subject to the software revenue recognition guidance. In these cases, revenue for the software is generally recognized upon shipment or electronic delivery and granting of the license. The revenue for these multiple-element arrangements is allocated to the software deliverable and the nonsoftware deliverables based on the relative selling prices of all of the deliverables in the arrangement using the hierarchy in the applicable accounting guidance. In the circumstances where the Company cannot
82
determine VSOE or TPE of the selling price for all of the deliverables in the arrangement, including the software deliverable, ESP is used for the purposes of performing this allocation.
(p) Advertising Costs
The Company expenses all advertising costs as incurred. Advertising costs included within sales and marketing expenses were approximately
$196 million
,
$218 million
, and
$218 million
for fiscal 2014, 2013, and 2012, respectively.
(q) Share-Based Compensation Expense
The Company measures and recognizes the compensation expense for all share-based awards made to employees and directors, including employee stock options, stock grants, stock units, and employee stock purchases related to the Employee Stock Purchase Plan (“Employee Stock Purchase Rights”) based on estimated fair values. The fair value of employee stock options is estimated on the date of grant using a lattice-binomial option-pricing model (“Lattice-Binomial Model”) or the Black-Scholes model, and for employee stock purchase rights the Company estimates the fair value using the Black-Scholes model. The fair value for time-based stock awards and stock awards that are contingent upon the achievement of financial performance metrics is based on the grant date share price reduced by the present value of the expected dividend yield prior to vesting. The fair value of market-based stock awards is estimated using an option-pricing model on the date of grant. Share-based compensation expense is reduced for forfeitures.
(r) Software Development Costs
Software development costs, including costs to develop software sold, leased, or otherwise marketed, that are incurred subsequent to the establishment of technological feasibility are capitalized if significant. Costs incurred during the application development stage for internal-use software are capitalized if significant. Capitalized software development costs are amortized using the straight-line amortization method over the estimated useful life of the applicable software. Such software development costs required to be capitalized have not been material to date.
(s) Income Taxes
Income tax expense is based on pretax financial accounting income. Deferred tax assets and liabilities are recognized for the expected tax consequences of temporary differences between the tax bases of assets and liabilities and their reported amounts. Valuation allowances are recorded to reduce deferred tax assets to the amount that will more likely than not be realized.
The Company accounts for uncertainty in income taxes using a two-step approach to recognizing and measuring uncertain tax positions. The first step is to evaluate the tax position for recognition by determining if the weight of available evidence indicates that it is more likely than not that the position will be sustained on audit, including resolution of related appeals or litigation processes, if any. The second step is to measure the tax benefit as the largest amount that is more than 50% likely of being realized upon settlement. The Company classifies the liability for unrecognized tax benefits as current to the extent that the Company anticipates payment (or receipt) of cash within one year. Interest and penalties related to uncertain tax positions are recognized in the provision for income taxes.
(t) Computation of Net Income
per Share
Basic net income per share is computed using the weighted-average number of common shares outstanding during the period. Diluted net income per share is computed using the weighted-average number of common shares and dilutive potential common shares outstanding during the period. Diluted shares outstanding includes the dilutive effect of in-the-money options, unvested restricted stock, and restricted stock units. The dilutive effect of such equity awards is calculated based on the average share price for each fiscal period using the treasury stock method. Under the treasury stock method, the amount the employee must pay for exercising stock options, the amount of compensation cost for future service that the Company has not yet recognized, and the amount of tax benefits that would be recorded in additional paid-in capital when the award becomes deductible are collectively assumed to be used to repurchase shares.
(u) Consolidation of Variable Interest Entities
The Company uses a qualitative approach in assessing the consolidation requirement for variable interest entities. The approach focuses on identifying which enterprise has the power to direct the activities that most significantly impact the variable interest entity’s economic performance and which enterprise has the obligation to absorb losses or the right to receive benefits from the variable interest entity. In the event that the Company is the primary beneficiary of a variable interest entity, the assets, liabilities, and results of operations of the variable interest entity will be included in the Company’s Consolidated Financial Statements.
(v) Use of Estimates
The preparation of financial statements and related disclosures in conformity with accounting principles generally accepted in the United States requires management to make estimates and judgments that affect the amounts reported in the Consolidated Financial Statements and accompanying notes. Estimates are used for the following, among others:
|
▪
|
Revenue recognition
|
|
▪
|
Allowances for accounts receivable, sales returns, and financing receivables
|
|
▪
|
Inventory valuation and liability for purchase commitments with contract manufacturers and suppliers
|
|
▪
|
Loss contingencies and product warranties
|
|
▪
|
Fair value measurements and other-than-temporary impairments
|
83
|
▪
|
Goodwill and purchased intangible asset impairments
|
|
▪
|
Income taxes
|
The actual results experienced by the Company may differ materially from management’s estimates.
(w) New Accounting Updates Recently Adopted
In December 2011, the Financial Accounting Standards Board (FASB) issued an accounting standard update requiring enhanced disclosures about certain financial instruments and derivative instruments that are offset in the statement of financial position or that are subject to enforceable master netting arrangements or similar agreements. This accounting standard became effective for the Company in the first quarter of fiscal 2014. As a result of the application of this accounting standard update, the Company has provided additional disclosures in Note 11.
In July 2012, the FASB issued an accounting standard update intended to simplify how an entity tests indefinite-lived intangible assets other than goodwill for impairment by providing entities with an option to perform a qualitative assessment to determine whether further impairment testing is necessary. This accounting standard update became effective for the Company beginning in the first quarter of fiscal 2014, and its adoption did not have any impact on the Company’s Consolidated Financial Statements.
In February 2013, the FASB issued an accounting standard update to require reclassification adjustments from other comprehensive income to be presented either in the financial statements or in the notes to the financial statements. This accounting standard became effective for the Company in the first quarter of fiscal 2014. As a result of the application of this accounting standard update, the Company has provided additional disclosures in Note 15.
(x) Recent Accounting Standards or Updates Not Yet Effective
In March 2013, the FASB issued an accounting standard update requiring an entity to release into net income the entire amount of a cumulative translation adjustment related to its investment in a foreign entity when as a parent it sells either a part or all of its investment in the foreign entity or no longer holds a controlling financial interest in a subsidiary or group of assets within the foreign entity. This accounting standard update was effective for the Company beginning in the first quarter of fiscal 2015. Upon adoption, the application of this accounting standard update did not have any impact to the Company's Consolidated Financial Statements.
In July 2013, the FASB issued an accounting standard update that provides explicit guidance on the financial statement presentation of an unrecognized tax benefit when a net operating loss carryforward or a tax credit carryforward exists. Under the new standard update, an unrecognized tax benefit, or a portion of an unrecognized tax benefit, is to be presented in the financial statements as a reduction to a deferred tax asset for a net operating loss carryforward or a tax credit carryforward. This accounting standard update was effective for the Company beginning in the first quarter of fiscal 2015 and applied prospectively with early adoption permitted. Upon adoption, the application of this accounting standard update did not have a material impact to the Company's Consolidated Financial Statements.
In April 2014, the FASB issued an accounting standard update that changes the criteria for reporting discontinued operations. This accounting standard update raises the threshold for a disposal transaction to qualify as a discontinued operation and requires additional disclosures about discontinued operations and disposals of individually significant components that do not qualify as discontinued operations. This accounting standard update will be effective for the Company beginning in the first quarter of fiscal 2016. Early adoption is permitted, but only for disposals that have not been reported in financial statements previously issued. The Company is currently evaluating the impact of this accounting standard update on its Consolidated Financial Statements.
In May 2014, the FASB issued an accounting standard update related to revenue from contracts with customers, which will supersede nearly all current U.S. GAAP guidance on this topic and eliminate industry-specific guidance. The underlying principle is to recognize revenues when promised goods or services are transferred to customers in an amount that reflects the consideration that is expected to be received for those goods or services. This accounting standard update will be effective for the Company beginning in the first quarter of fiscal 2018. The new revenue standard may be applied retrospectively to each prior period presented or retrospectively with the cumulative effect recognized as of the date of adoption. Early adoption is not permitted. The Company is currently evaluating the impact of this accounting standard update on its Consolidated Financial Statements.
84
|
3.
|
Business Combinations
|
|
(a)
|
Acquisition Summary
|
The Company completed
eight
business combinations during
fiscal 2014
. A summary of the allocation of the total purchase consideration is presented as follows (in millions):
|
Fiscal 2014
|
Purchase Consideration
|
Net Tangible
Assets Acquired
(Liabilities
Assumed)
|
Purchased Intangible Assets
|
Goodwill
|
|||||||||||
|
Composite Software, Inc.
|
$
|
160
|
|
$
|
(10
|
)
|
$
|
75
|
|
$
|
95
|
|
|||
|
Sourcefire, Inc.
|
2,449
|
|
81
|
|
577
|
|
1,791
|
|
|||||||
|
WhipTail Technologies, Inc.
|
351
|
|
(34
|
)
|
105
|
|
280
|
|
|||||||
|
Tail-f Systems
|
167
|
|
(7
|
)
|
61
|
|
113
|
|
|||||||
|
All others (four in total)
|
54
|
|
(5
|
)
|
20
|
|
39
|
|
|||||||
|
Total acquisitions
|
$
|
3,181
|
|
$
|
25
|
|
$
|
838
|
|
$
|
2,318
|
|
|||
On July 29, 2013, the Company completed its acquisition of privately held Composite Software, Inc. (“Composite Software”), a provider of data virtualization software and services. Composite Software provides technology that connects many types of data from across the network and makes it appear as if the data is in one place. With its acquisition of Composite Software, the Company intends to extend its next-generation services platform by connecting data and infrastructure. Revenue from the Composite Software acquisition has been included in the Company's Service category.
On October 7, 2013, the Company completed its acquisition of Sourcefire, Inc. (“Sourcefire”), a provider of intelligent cybersecurity solutions. Sourcefire delivers innovative, highly automated security through continuous awareness, threat detection, and protection across its portfolio, including next-generation intrusion prevention systems, next-generation firewalls, and advanced malware protection. With the Sourcefire acquisition, the Company aims to accelerate its security strategy of defending, discovering, and remediating advanced threats to provide continuous security solutions to the Company’s customers in more places across the network. Product revenue from the Sourcefire acquisition has been included in the Company's Security product category.
On October 28, 2013, the Company completed its acquisition of privately held WhipTail Technologies, Inc. (“WhipTail”), a provider of high-performance, scalable solid state memory systems. With its WhipTail acquisition, the Company aims to strengthen its Unified Computing System (UCS) strategy and enhance application performance by integrating scalable solid-state memory into the UCS’s fabric computing architecture. Product revenue from the WhipTail acquisition has been included in the Company's Data Center product category.
On July 8, 2014, the Company completed its acquisition of privately held Tail-f Systems ("Tail-f"), a provider of multi-vendor network service orchestration solutions for traditional and virtualized networks. Tail-f's products help customers implement applications, network services, and solutions across networking devices. With the Tail-f acquisition, the Company intends to advance its cloud virtualization strategy.
The total purchase consideration related to the Company’s business combinations completed during
fiscal 2014
consisted of either cash consideration or cash consideration along with vested share-based awards assumed. The total cash and cash equivalents acquired from these business combinations was approximately
$134 million
.
Fiscal 2013
Business Combinations
Allocation of the purchase consideration for business combinations completed in
fiscal 2013
is summarized as follows (in millions):
|
Fiscal 2013
|
Purchase
Consideration
|
Net
Liabilities
Assumed
|
Purchased
Intangible
Assets
|
Goodwill
|
|||||||||||
|
NDS Group Limited
|
$
|
5,005
|
|
$
|
(185
|
)
|
$
|
1,746
|
|
$
|
3,444
|
|
|||
|
Meraki, Inc.
|
974
|
|
(59
|
)
|
289
|
|
744
|
|
|||||||
|
Intucell, Ltd.
|
360
|
|
(23
|
)
|
106
|
|
277
|
|
|||||||
|
Ubiquisys Limited
|
280
|
|
(30
|
)
|
123
|
|
187
|
|
|||||||
|
All others (nine in total)
|
363
|
|
(25
|
)
|
127
|
|
261
|
|
|||||||
|
Total acquisitions
|
$
|
6,982
|
|
$
|
(322
|
)
|
$
|
2,391
|
|
$
|
4,913
|
|
|||
85
Acquisition of NDS Group Limited
On July 30, 2012, the Company completed its acquisition of NDS Group Limited (“NDS”), a provider of video software and content security solutions that enable service providers and media companies to securely deliver and monetize new video entertainment experiences. The acquisition of NDS will be combined with the delivery of Cisco Videoscape, the Company’s comprehensive content delivery platform that enables service providers and media companies to deliver next-generation entertainment experiences. The Company has included revenue from the NDS acquisition, subsequent to the acquisition date, in its Service Provider Video product category.
Under the terms of the acquisition agreement, the Company paid total cash consideration of approximately
$5.0 billion
, which included the repayment of
$993 million
of pre-existing NDS debt to third party creditors at the closing of the acquisition. The following table summarizes the purchase consideration for the NDS acquisition (in millions):
|
Fair Value
|
||||
|
Cash consideration to seller
|
$
|
4,012
|
|
|
|
Repayment of NDS debt to third party creditors
|
993
|
|
||
|
Total purchase consideration
|
$
|
5,005
|
|
|
The payment of the total purchase consideration of approximately
$5.0 billion
shown above, net of cash and cash equivalents acquired, is classified as a use of cash under investing activities in the Consolidated Statements of Cash Flows.
The total purchase allocation for NDS is summarized as follows (in millions):
|
Fair Value
|
||||
|
Cash and cash equivalents
|
$
|
98
|
|
|
|
Accounts receivable, net
|
199
|
|
||
|
Other tangible assets
|
268
|
|
||
|
Goodwill
|
3,444
|
|
||
|
Purchased intangible assets
|
1,746
|
|
||
|
Deferred tax liabilities, net
|
(378
|
)
|
||
|
Liabilities assumed
|
(372
|
)
|
||
|
Total purchase consideration
|
$
|
5,005
|
|
|
Other
Fiscal 2013
Business Combinations
The Company acquired privately held Meraki, Inc. (“Meraki”) in the second quarter of fiscal 2013. Prior to its acquisition, Meraki offered mid-market customers on-premise networking solutions centrally managed from the cloud. With its acquisition of Meraki, the Company intends to address the shift to cloud networking as a key part of the Company’s overall strategy to accelerate the adoption of software-based business models that provide new consumption options for customers and revenue opportunities for partners. The Company has included revenue from the Meraki acquisition, subsequent to the acquisition date, in its Wireless product category.
The Company acquired privately held Intucell, Ltd. (“Intucell”) in the third quarter of fiscal 2013. Prior to its acquisition, Intucell provided advanced self-optimizing network software for mobile carriers. With its acquisition of Intucell, the Company intends to enhance its commitment to global service providers by adding a critical network intelligence layer to manage and optimize spectrum, coverage, and capacity, and ultimately the quality of the mobile experience. The Company has included revenue from the Intucell acquisition, subsequent to the acquisition date, in its NGN Routing product category.
The Company acquired privately held Ubiquisys Limited (“Ubiquisys”) in the fourth quarter of fiscal 2013. Prior to its acquisition, Ubiquisys offered service providers intelligent 3G and long-term evolution (LTE) small-cell technologies for seamless connectivity across mobile networks. With its acquisition of Ubiquisys, the Company intends to strengthen its commitment to global service providers by enabling a comprehensive small-cell solution that supports the transition to next-generation radio access networks. The Company has included revenue from the Ubiquisys acquisition, subsequent to the acquisition date, in its NGN Routing product category.
The total purchase consideration related to the Company’s business combinations completed during
fiscal 2013
consisted of cash consideration, repayment of debt, and vested share-based awards assumed. The total cash and cash equivalents acquired from these business combinations was approximately
$156 million
.
86
Fiscal 2012
Business Combinations
Allocation of the purchase consideration for business combinations completed in
fiscal 2012
is summarized as follows (in millions):
|
Fiscal 2012
|
Purchase
Consideration
|
Net
Liabilities
Assumed
|
Purchased
Intangible
Assets
|
Goodwill
|
|||||||||||
|
Total acquisitions (seven in total)
|
$
|
398
|
|
$
|
(39
|
)
|
$
|
200
|
|
$
|
237
|
|
|||
|
(b)
|
Other Acquisition/Divestiture Information
|
Total transaction costs related to the Company’s business combination activities during
fiscal 2014, 2013, and 2012
were
$7 million
,
$40 million
, and
$15 million
, respectively. These transaction costs were expensed as incurred in general and administrative (G&A) expenses in the Consolidated Statements of Operations.
The Company’s purchase price allocation for business combinations completed during recent periods is preliminary and subject to revision as additional information about fair value of assets and liabilities becomes available. Additional information, which existed as of the acquisition date but at that time was unknown to the Company, may become known to the Company during the remainder of the measurement period, a period not to exceed 12 months from the acquisition date. Adjustments in the purchase price allocation may require a recasting of the amounts allocated to goodwill retroactive to the period in which the acquisition occurred.
The goodwill generated from the Company’s business combinations completed during
fiscal 2014
is primarily related to expected synergies. The goodwill is generally not deductible for income tax purposes.
The Consolidated Financial Statements include the operating results of each business combination from the date of acquisition. Pro forma results of operations for the acquisitions completed during the fiscal years presented have not been presented because the effects of the acquisitions, individually and in the aggregate, were not material to the Company’s financial results.
During the third quarter of
fiscal 2013
, the Company completed the sale of its Linksys product line to a third party. The financial statement impact of the Company’s Linksys product line and its resulting sale were not material for any of the fiscal years presented.
|
(c)
|
Insieme Networks, Inc.
|
In the second quarter of fiscal 2014, the Company acquired the remaining interest in Insieme Networks, Inc. See Note 12.
87
|
4.
|
Goodwill and Purchased Intangible Assets
|
|
(a)
|
Goodwill
|
The following tables present the goodwill allocated to the Company’s reportable segments as of
July 26, 2014
and
July 27, 2013
, as well as the changes to goodwill during
fiscal 2014 and 2013
(in millions):
|
Balance at July 27, 2013
|
Acquisitions
|
Other
|
Balance at July 26, 2014
|
||||||||||||||
|
Americas
|
$
|
13,800
|
|
|
$
|
1,275
|
|
$
|
5
|
|
$
|
15,080
|
|
||||
|
EMEA
|
5,037
|
|
|
681
|
|
(3
|
)
|
5,715
|
|
||||||||
|
APJC
|
3,082
|
|
|
362
|
|
—
|
|
3,444
|
|
||||||||
|
Total
|
$
|
21,919
|
|
|
$
|
2,318
|
|
$
|
2
|
|
$
|
24,239
|
|
||||
|
|
Balance at July 28, 2012
|
NDS Acquisition
|
Other Acquisitions
|
Other
|
Balance at July 27, 2013
|
||||||||||||||
|
Americas
|
$
|
11,755
|
|
$
|
1,230
|
|
$
|
828
|
|
$
|
(13
|
)
|
$
|
13,800
|
|
||||
|
EMEA
|
3,287
|
|
1,327
|
|
411
|
|
12
|
|
5,037
|
|
|||||||||
|
APJC
|
1,956
|
|
887
|
|
230
|
|
9
|
|
3,082
|
|
|||||||||
|
Total
|
$
|
16,998
|
|
$
|
3,444
|
|
$
|
1,469
|
|
$
|
8
|
|
$
|
21,919
|
|
||||
|
(b)
|
Purchased Intangible Assets
|
The following tables present details of the Company’s intangible assets acquired through business combinations completed during
fiscal 2014 and 2013
(in millions, except years):
|
|
FINITE LIVES
|
INDEFINITE
LIVES
|
TOTAL
|
||||||||||||||||||||||
|
|
TECHNOLOGY
|
CUSTOMER
RELATIONSHIPS
|
OTHER
|
IPR&D
|
|||||||||||||||||||||
|
Fiscal 2014
|
Weighted-
Average Useful
Life (in Years)
|
Amount
|
Weighted-
Average Useful
Life (in Years)
|
Amount
|
Weighted-
Average Useful
Life (in Years)
|
Amount
|
Amount
|
Amount
|
|||||||||||||||||
|
Composite Software, Inc.
|
6.0
|
$
|
60
|
|
3.9
|
$
|
14
|
|
0.0
|
$
|
—
|
|
$
|
1
|
|
$
|
75
|
|
|||||||
|
Sourcefire, Inc.
|
7.0
|
400
|
|
5.0
|
129
|
|
3.0
|
26
|
|
22
|
|
577
|
|
||||||||||||
|
WhipTail Technologies, Inc.
|
5.0
|
63
|
|
5.0
|
1
|
|
2.7
|
3
|
|
38
|
|
105
|
|
||||||||||||
|
Tail-f Systems
|
7.0
|
55
|
|
6.8
|
6
|
|
0.0
|
—
|
|
—
|
|
61
|
|
||||||||||||
|
All others (four in total)
|
3.6
|
18
|
|
4.0
|
2
|
|
0.0
|
—
|
|
—
|
|
20
|
|
||||||||||||
|
Total
|
$
|
596
|
|
$
|
152
|
|
$
|
29
|
|
$
|
61
|
|
$
|
838
|
|
||||||||||
|
|
FINITE LIVES
|
INDEFINITE
LIVES
|
TOTAL
|
|||||||||||||||||||||||
|
|
TECHNOLOGY
|
CUSTOMER
RELATIONSHIPS
|
OTHER
|
IPR&D
|
||||||||||||||||||||||
|
Fiscal 2013
|
Weighted-
Average Useful
Life (in Years)
|
Amount
|
Weighted-
Average Useful
Life (in Years)
|
Amount
|
Weighted-
Average Useful
Life (in Years)
|
Amount
|
Amount
|
Amount
|
||||||||||||||||||
|
NDS Group Limited
|
6.4
|
$
|
807
|
|
6.7
|
$
|
818
|
|
7.4
|
|
$
|
27
|
|
$
|
94
|
|
$
|
1,746
|
|
|||||||
|
Meraki, Inc.
|
8.0
|
259
|
|
6.0
|
30
|
|
—
|
|
—
|
|
—
|
|
289
|
|
||||||||||||
|
Intucell, Ltd.
|
5.0
|
59
|
|
5.0
|
11
|
|
—
|
|
—
|
|
36
|
|
106
|
|
||||||||||||
|
Ubiquisys Limited
|
4.0
|
66
|
|
5.0
|
7
|
|
—
|
|
—
|
|
50
|
|
123
|
|
||||||||||||
|
All others (nine in total)
|
4.7
|
95
|
|
5.8
|
17
|
|
5.0
|
|
1
|
|
14
|
|
127
|
|
||||||||||||
|
Total
|
|
$
|
1,286
|
|
|
$
|
883
|
|
|
$
|
28
|
|
$
|
194
|
|
$
|
2,391
|
|
||||||||
88
The following tables present details of the Company’s purchased intangible assets (in millions):
|
July 26, 2014
|
Gross
|
Accumulated Amortization
|
Net
|
|||||||||
|
Purchased intangible assets with finite lives:
|
||||||||||||
|
Technology
|
$
|
4,100
|
|
$
|
(1,976
|
)
|
$
|
2,124
|
|
|||
|
Customer relationships
|
1,706
|
|
(720
|
)
|
986
|
|
||||||
|
Other
|
51
|
|
(13
|
)
|
38
|
|
||||||
|
Total purchased intangible assets with finite lives
|
5,857
|
|
(2,709
|
)
|
3,148
|
|
||||||
|
In-process research and development, with indefinite lives
|
132
|
|
—
|
|
132
|
|
||||||
|
Total
|
$
|
5,989
|
|
$
|
(2,709
|
)
|
$
|
3,280
|
|
|||
|
July 27, 2013
|
Gross
|
Accumulated
Amortization
|
Net
|
|||||||||
|
Purchased intangible assets with finite lives:
|
||||||||||||
|
Technology
|
$
|
3,563
|
|
$
|
(1,366
|
)
|
$
|
2,197
|
|
|||
|
Customer relationships
|
1,566
|
|
(466
|
)
|
1,100
|
|
||||||
|
Other
|
30
|
|
(10
|
)
|
20
|
|
||||||
|
Total purchased intangible assets with finite lives
|
5,159
|
|
(1,842
|
)
|
3,317
|
|
||||||
|
In-process research and development, with indefinite lives
|
86
|
|
—
|
|
86
|
|
||||||
|
Total
|
$
|
5,245
|
|
$
|
(1,842
|
)
|
$
|
3,403
|
|
|||
Purchased intangible assets include intangible assets acquired through business combinations as well as through direct purchases or licenses.
The following table presents the amortization of purchased intangible assets (in millions):
|
Years Ended
|
July 26, 2014
|
July 27, 2013
|
July 28, 2012
|
|||||||||
|
Amortization of purchased intangible assets:
|
||||||||||||
|
Cost of sales
|
$
|
742
|
|
$
|
606
|
|
$
|
424
|
|
|||
|
Operating expenses
|
275
|
|
395
|
|
383
|
|
||||||
|
Total
|
$
|
1,017
|
|
$
|
1,001
|
|
$
|
807
|
|
|||
There were
no
impairment charges related to purchased intangible assets during
fiscal 2014 and 2013
. For
fiscal 2012
, amortization of purchased intangible assets included impairment charges of approximately
$12 million
as a result of declines in estimated fair value resulting from reductions in expected future cash flows associated with certain of the Company’s technology assets.
The estimated future amortization expense of purchased intangible assets with finite lives as of
July 26, 2014
is as follows (in millions):
|
Fiscal Year
|
Amount
|
||
|
2015
|
$
|
979
|
|
|
2016
|
743
|
|
|
|
2017
|
567
|
|
|
|
2018
|
407
|
|
|
|
2019
|
307
|
|
|
|
Thereafter
|
145
|
|
|
|
Total
|
$
|
3,148
|
|
89
|
5.
|
Restructuring and Other Charges
|
Fiscal 2014 Plan and Fiscal 2011 Plans
In August 2013, the Company announced a workforce reduction plan that would impact up to
4,000
employees, or
5%
of the Company’s global workforce. In connection with this restructuring action, the Company incurred charges of
$418 million
during
fiscal 2014
(included as part of the charges discussed below). The Company has completed the Fiscal 2014 restructuring and does
not expect any remaining charges related to this action
.
The Fiscal 2011 Plans consist primarily of the realignment and restructuring of the Company’s business announced in July 2011 and of certain consumer product lines as announced during April 2011. The Company completed the Fiscal 2011 Plans at the end of fiscal 2013. The Company incurred cumulative charges of approximately
$1.1 billion
in connection with these plans.
As part of the Fiscal 2011 Plans, other charges incurred during fiscal 2012 were primarily for the consolidation of excess facilities, as well as an incremental charge related to the sale of the Company’s Juarez, Mexico manufacturing operations, which sale was completed in the first quarter of fiscal 2012.
The following table summarizes the activities related to the restructuring and other charges pursuant to the Company’s Fiscal 2014 Plan and the Fiscal 2011 Plans related to the realignment and restructuring of the Company’s business (in millions):
|
Fiscal 2011 Plans
|
Fiscal 2014 Plan
|
|||||||||||||||||||||||
|
Voluntary Early Retirement
Program
|
Employee
Severance
|
Other
|
Employee
Severance
|
Other
|
Total
|
|||||||||||||||||||
|
Liability as of July 30, 2011
|
$
|
17
|
|
$
|
234
|
|
$
|
11
|
|
$
|
—
|
|
$
|
—
|
|
$
|
262
|
|
||||||
|
Gross charges in fiscal 2012
|
—
|
|
299
|
|
54
|
|
—
|
|
—
|
|
353
|
|
||||||||||||
|
Change in estimate related to fiscal 2011 charges
|
—
|
|
(49
|
)
|
—
|
|
—
|
|
—
|
|
(49
|
)
|
||||||||||||
|
Cash payments
|
(17
|
)
|
(401
|
)
|
(18
|
)
|
—
|
|
—
|
|
(436
|
)
|
||||||||||||
|
Non-cash items
|
—
|
|
—
|
|
(20
|
)
|
—
|
|
—
|
|
(20
|
)
|
||||||||||||
|
Liability as of July 28, 2012
|
—
|
|
83
|
|
27
|
|
—
|
|
—
|
|
110
|
|
||||||||||||
|
Gross charges in fiscal 2013
|
—
|
|
111
|
|
(6
|
)
|
—
|
|
—
|
|
105
|
|
||||||||||||
|
Cash payments
|
—
|
|
(173
|
)
|
(11
|
)
|
—
|
|
—
|
|
(184
|
)
|
||||||||||||
|
Non-cash items
|
—
|
|
—
|
|
(3
|
)
|
—
|
|
—
|
|
(3
|
)
|
||||||||||||
|
Liability as of July 27, 2013
|
—
|
|
21
|
|
7
|
|
—
|
|
—
|
|
28
|
|
||||||||||||
|
Gross charges in fiscal 2014
|
—
|
|
—
|
|
—
|
|
366
|
|
52
|
|
418
|
|
||||||||||||
|
Cash payments
|
—
|
|
(19
|
)
|
(3
|
)
|
(326
|
)
|
(4
|
)
|
(352
|
)
|
||||||||||||
|
Non-cash items
|
—
|
|
(2
|
)
|
(1
|
)
|
—
|
|
(22
|
)
|
(25
|
)
|
||||||||||||
|
Liability as of July 26, 2014
|
$
|
—
|
|
$
|
—
|
|
$
|
3
|
|
$
|
40
|
|
$
|
26
|
|
$
|
69
|
|
||||||
Fiscal 2015 Plan
In August 2014 the Company announced a restructuring plan that will impact up to
6,000
employees, representing approximately
8%
of its global workforce. The Company expects to take action under this plan beginning in the first quarter of fiscal 2015. The Company currently estimates that it will recognize pre-tax charges in an amount not expected to exceed
$700 million
, consisting of severance and other one-time termination benefits and other associated costs. These charges are primarily cash-based. The Company expects that approximately
$250 million
to
$350 million
of these charges will be recognized during the first quarter of fiscal 2015, with the remaining amount to be recognized during the rest of fiscal 2015.
90
|
6.
|
Balance Sheet Details
|
The following tables provide details of selected balance sheet items (in millions):
|
July 26, 2014
|
July 27, 2013
|
|||||||
|
Inventories:
|
||||||||
|
Raw materials
|
$
|
77
|
|
$
|
105
|
|
||
|
Work in process
|
5
|
|
24
|
|
||||
|
Finished goods:
|
||||||||
|
Distributor inventory and deferred cost of sales
|
595
|
|
572
|
|
||||
|
Manufactured finished goods
|
606
|
|
480
|
|
||||
|
Total finished goods
|
1,201
|
|
1,052
|
|
||||
|
Service-related spares
|
273
|
|
256
|
|
||||
|
Demonstration systems
|
35
|
|
39
|
|
||||
|
Total
|
$
|
1,591
|
|
$
|
1,476
|
|
||
|
Property and equipment, net:
|
||||||||
|
Land, buildings, and building and leasehold improvements
|
$
|
4,468
|
|
$
|
4,426
|
|
||
|
Computer equipment and related software
|
1,425
|
|
1,416
|
|
||||
|
Production, engineering, and other equipment
|
5,756
|
|
5,721
|
|
||||
|
Operating lease assets
|
362
|
|
326
|
|
||||
|
Furniture and fixtures
|
509
|
|
497
|
|
||||
|
12,520
|
|
12,386
|
|
|||||
|
Less accumulated depreciation and amortization
|
(9,268
|
)
|
(9,064
|
)
|
||||
|
Total
|
$
|
3,252
|
|
$
|
3,322
|
|
||
|
Other assets:
|
||||||||
|
Deferred tax assets
|
$
|
1,700
|
|
$
|
1,539
|
|
||
|
Investments in privately held companies
|
899
|
|
833
|
|
||||
|
Other
|
732
|
|
743
|
|
||||
|
Total
|
$
|
3,331
|
|
$
|
3,115
|
|
||
|
Deferred revenue:
|
||||||||
|
Service
|
$
|
9,640
|
|
$
|
9,403
|
|
||
|
Product:
|
|
|||||||
|
Unrecognized revenue on product shipments and other deferred revenue
|
3,924
|
|
3,340
|
|
||||
|
Cash receipts related to unrecognized revenue from two-tier distributors
|
578
|
|
680
|
|
||||
|
Total product deferred revenue
|
4,502
|
|
4,020
|
|
||||
|
Total
|
$
|
14,142
|
|
$
|
13,423
|
|
||
|
Reported as:
|
|
|||||||
|
Current
|
$
|
9,478
|
|
$
|
9,262
|
|
||
|
Noncurrent
|
4,664
|
|
4,161
|
|
||||
|
Total
|
$
|
14,142
|
|
$
|
13,423
|
|
||
91
|
7.
|
Financing Receivables and Operating Leases
|
|
(a)
|
Financing Receivables
|
Financing receivables primarily consist of lease receivables, loan receivables, and financed service contracts and other. Lease receivables represent sales-type and direct-financing leases resulting from the sale of the Company’s and complementary third-party products and are typically collateralized by a security interest in the underlying assets. Loan receivables represent financing arrangements related to the sale of the Company’s products and services, which may include additional funding for other costs associated with network installation and integration of the Company’s products and services. Lease receivables consist of arrangements with terms of
four years
on average, while loan receivables generally have terms of up to
three years
. The financed service contracts and other category includes financing receivables related to technical support and advanced services, as well as receivables related to financing of certain indirect costs associated with leases. Revenue related to the technical support services is typically deferred and included in deferred service revenue and is recognized ratably over the period during which the related services are to be performed, which typically ranges from
one
to
three
years.
A summary of the Company's financing receivables is presented as follows (in millions):
|
July 26, 2014
|
Lease
Receivables
|
Loan
Receivables
|
Financed
Service
Contracts and Other
|
Total
|
|||||||||||
|
Gross
|
$
|
3,532
|
|
$
|
1,683
|
|
$
|
3,210
|
|
$
|
8,425
|
|
|||
|
Residual value
|
233
|
|
—
|
|
—
|
|
233
|
|
|||||||
|
Unearned income
|
(238
|
)
|
—
|
|
—
|
|
(238
|
)
|
|||||||
|
Allowance for credit loss
|
(233
|
)
|
(98
|
)
|
(18
|
)
|
(349
|
)
|
|||||||
|
Total, net
|
$
|
3,294
|
|
$
|
1,585
|
|
$
|
3,192
|
|
$
|
8,071
|
|
|||
|
Reported as:
|
|||||||||||||||
|
Current
|
$
|
1,476
|
|
$
|
728
|
|
$
|
1,949
|
|
$
|
4,153
|
|
|||
|
Noncurrent
|
1,818
|
|
857
|
|
1,243
|
|
3,918
|
|
|||||||
|
Total, net
|
$
|
3,294
|
|
$
|
1,585
|
|
$
|
3,192
|
|
$
|
8,071
|
|
|||
|
July 27, 2013
|
Lease
Receivables
|
Loan
Receivables
|
Financed
Service
Contracts and Other
|
Total
|
|||||||||||
|
Gross
|
$
|
3,529
|
|
$
|
1,649
|
|
$
|
3,136
|
|
$
|
8,314
|
|
|||
|
Residual value
|
251
|
|
—
|
|
—
|
|
251
|
|
|||||||
|
Unearned income
|
(273
|
)
|
—
|
|
—
|
|
(273
|
)
|
|||||||
|
Allowance for credit loss
|
(238
|
)
|
(86
|
)
|
(20
|
)
|
(344
|
)
|
|||||||
|
Total, net
|
$
|
3,269
|
|
$
|
1,563
|
|
$
|
3,116
|
|
$
|
7,948
|
|
|||
|
Reported as:
|
|||||||||||||||
|
Current
|
$
|
1,418
|
|
$
|
898
|
|
$
|
1,721
|
|
$
|
4,037
|
|
|||
|
Noncurrent
|
1,851
|
|
665
|
|
1,395
|
|
3,911
|
|
|||||||
|
Total, net
|
$
|
3,269
|
|
$
|
1,563
|
|
$
|
3,116
|
|
$
|
7,948
|
|
|||
As of
July 26, 2014
and
July 27, 2013
, the deferred service revenue related to the financed service contracts and other was
$1,843 million
and
$2,036 million
, respectively.
Future minimum lease payments at
July 26, 2014
are summarized as follows (in millions):
|
Fiscal Year
|
Amount
|
||
|
2015
|
$
|
1,608
|
|
|
2016
|
1,049
|
|
|
|
2017
|
590
|
|
|
|
2018
|
227
|
|
|
|
2019
|
58
|
|
|
|
Total
|
$
|
3,532
|
|
Actual cash collections may differ from the contractual maturities due to early customer buyouts, refinancings, or defaults.
92
|
(b)
|
Credit Quality of Financing Receivables
|
Gross receivables less unearned income categorized by the Company’s internal credit risk rating as of
July 26, 2014
and
July 27, 2013
are summarized as follows (in millions):
|
|
INTERNAL CREDIT RISK RATING
|
||||||||||||||
|
July 26, 2014
|
1 to 4
|
5 to 6
|
7 and Higher
|
Total
|
|||||||||||
|
Lease receivables
|
$
|
1,615
|
|
$
|
1,538
|
|
$
|
141
|
|
$
|
3,294
|
|
|||
|
Loan receivables
|
953
|
|
593
|
|
137
|
|
1,683
|
|
|||||||
|
Financed service contracts and other
|
1,744
|
|
1,367
|
|
99
|
|
3,210
|
|
|||||||
|
Total
|
$
|
4,312
|
|
$
|
3,498
|
|
$
|
377
|
|
$
|
8,187
|
|
|||
|
|
INTERNAL CREDIT RISK RATING
|
||||||||||||||
|
July 27, 2013
|
1 to 4
|
5 to 6
|
7 and Higher
|
Total
|
|||||||||||
|
Lease receivables
|
$
|
1,681
|
|
$
|
1,482
|
|
$
|
93
|
|
$
|
3,256
|
|
|||
|
Loan receivables
|
842
|
|
777
|
|
30
|
|
1,649
|
|
|||||||
|
Financed service contracts and other
|
1,876
|
|
1,141
|
|
119
|
|
3,136
|
|
|||||||
|
Total
|
$
|
4,399
|
|
$
|
3,400
|
|
$
|
242
|
|
$
|
8,041
|
|
|||
The Company determines the adequacy of its allowance for credit loss by assessing the risks and losses inherent in its financing receivables by portfolio segment. The portfolio segment is based on the types of financing offered by the Company to its customers, which consist of the following: lease receivables, loan receivables, and financed service contracts and other.
The Company’s internal credit risk ratings of
1
through
4
correspond to investment-grade ratings, while credit risk ratings of
5
and
6
correspond to non-investment grade ratings. Credit risk ratings of
7
and higher correspond to substandard ratings.
In circumstances when collectibility is not deemed reasonably assured, the associated revenue is deferred in accordance with the Company’s revenue recognition policies, and the related allowance for credit loss, if any, is included in deferred revenue. The Company also records deferred revenue associated with financing receivables when there are remaining performance obligations, as it does for financed service contracts. Total allowances for credit loss and deferred revenue as of
July 26, 2014
and
July 27, 2013
were
$2,220 million
and
$2,453 million
, respectively, and they were associated with total financing receivables before allowance for credit loss of
$8,420 million
and
$8,292 million
as of their respective period ends.
The following tables present the aging analysis of gross receivables less unearned income as of
July 26, 2014
and
July 27, 2013
(in millions):
|
DAYS PAST DUE (INCLUDES BILLED AND UNBILLED)
|
|||||||||||||||||||||||||||||||
|
July 26, 2014
|
31-60
|
61-90
|
91+
|
Total
Past Due
|
Current
|
Total
|
Nonaccrual
Financing
Receivables
|
Impaired
Financing
Receivables
|
|||||||||||||||||||||||
|
Lease receivables
|
$
|
104
|
|
$
|
43
|
|
$
|
165
|
|
$
|
312
|
|
$
|
2,982
|
|
$
|
3,294
|
|
$
|
48
|
|
$
|
41
|
|
|||||||
|
Loan receivables
|
2
|
|
1
|
|
16
|
|
19
|
|
1,664
|
|
1,683
|
|
19
|
|
19
|
|
|||||||||||||||
|
Financed service contracts and other
|
301
|
|
238
|
|
230
|
|
769
|
|
2,441
|
|
3,210
|
|
12
|
|
9
|
|
|||||||||||||||
|
Total
|
$
|
407
|
|
$
|
282
|
|
$
|
411
|
|
$
|
1,100
|
|
$
|
7,087
|
|
$
|
8,187
|
|
$
|
79
|
|
$
|
69
|
|
|||||||
|
DAYS PAST DUE (INCLUDES BILLED AND UNBILLED)
|
|||||||||||||||||||||||||||||||
|
July 27, 2013
|
31-60
|
61-90
|
91+
|
Total
Past Due
|
Current
|
Total
|
Nonaccrual
Financing
Receivables
|
Impaired
Financing
Receivables
|
|||||||||||||||||||||||
|
Lease receivables
|
$
|
85
|
|
$
|
48
|
|
$
|
124
|
|
$
|
257
|
|
$
|
2,999
|
|
$
|
3,256
|
|
$
|
27
|
|
$
|
22
|
|
|||||||
|
Loan receivables
|
6
|
|
3
|
|
11
|
|
20
|
|
1,629
|
|
1,649
|
|
11
|
|
9
|
|
|||||||||||||||
|
Financed service contracts and other
|
75
|
|
48
|
|
392
|
|
515
|
|
2,621
|
|
3,136
|
|
18
|
|
11
|
|
|||||||||||||||
|
Total
|
$
|
166
|
|
$
|
99
|
|
$
|
527
|
|
$
|
792
|
|
$
|
7,249
|
|
$
|
8,041
|
|
$
|
56
|
|
$
|
42
|
|
|||||||
93
Past due financing receivables are those that are
31 days
or more past due according to their contractual payment terms. The data in the preceding tables are presented by contract, and the aging classification of each contract is based on the oldest outstanding receivable, and therefore past due amounts also include unbilled and current receivables within the same contract. The balances of either unbilled or current financing receivables included in the category of 91 days plus past due for financing receivables were
$296 million
and
$406 million
as of
July 26, 2014
and
July 27, 2013
, respectively.
As of
July 26, 2014
, the Company had financing receivables of
$116 million
, net of unbilled or current receivables from the same contract, that were in the category of 91 days plus past due but remained on accrual status. Such balance was
$87 million
as of
July 27, 2013
. A financing receivable may be placed on nonaccrual status earlier if, in management’s opinion, a timely collection of the full principal and interest becomes uncertain.
|
(c)
|
Allowance for Credit Loss Rollforward
|
The allowances for credit loss and the related financing receivables are summarized as follows (in millions):
|
|
CREDIT LOSS ALLOWANCES
|
||||||||||||||
|
|
Lease
Receivables
|
Loan
Receivables
|
Financed Service
Contracts and Other
|
Total
|
|||||||||||
|
Allowance for credit loss as of July 27, 2013
|
$
|
238
|
|
$
|
86
|
|
$
|
20
|
|
$
|
344
|
|
|||
|
Provisions
|
4
|
|
9
|
|
1
|
|
14
|
|
|||||||
|
Recoveries (write-offs), net
|
(11
|
)
|
5
|
|
(3
|
)
|
(9
|
)
|
|||||||
|
Foreign exchange and other
|
2
|
|
(2
|
)
|
—
|
|
—
|
|
|||||||
|
Allowance for credit loss as of July 26, 2014
|
$
|
233
|
|
$
|
98
|
|
$
|
18
|
|
$
|
349
|
|
|||
|
Financing receivables as of July 26, 2014
(1)
|
$
|
3,527
|
|
$
|
1,683
|
|
$
|
3,210
|
|
$
|
8,420
|
|
|||
|
|
CREDIT LOSS ALLOWANCES
|
||||||||||||||
|
|
Lease
Receivables
|
Loan
Receivables
|
Financed Service
Contracts and Other
|
Total
|
|||||||||||
|
Allowance for credit loss as of July 28, 2012
|
$
|
247
|
|
$
|
122
|
|
$
|
11
|
|
$
|
380
|
|
|||
|
Provisions
|
21
|
|
(20
|
)
|
10
|
|
11
|
|
|||||||
|
Recoveries (write-offs), net
|
(30
|
)
|
(15
|
)
|
(1
|
)
|
(46
|
)
|
|||||||
|
Foreign exchange and other
|
—
|
|
(1
|
)
|
—
|
|
(1
|
)
|
|||||||
|
Allowance for credit loss as of July 27, 2013
|
$
|
238
|
|
$
|
86
|
|
$
|
20
|
|
$
|
344
|
|
|||
|
Financing receivables as of July 27, 2013
(1)
|
$
|
3,507
|
|
$
|
1,649
|
|
$
|
3,136
|
|
$
|
8,292
|
|
|||
|
|
CREDIT LOSS ALLOWANCES
|
||||||||||||||
|
|
Lease
Receivables
|
Loan
Receivables
|
Financed Service
Contracts and Other
|
Total
|
|||||||||||
|
Allowance for credit loss as of July 30, 2011
|
$
|
237
|
|
$
|
103
|
|
$
|
27
|
|
$
|
367
|
|
|||
|
Provisions
|
22
|
|
22
|
|
(13
|
)
|
31
|
|
|||||||
|
Recoveries (write-offs), net
|
(2
|
)
|
—
|
|
(1
|
)
|
(3
|
)
|
|||||||
|
Foreign exchange and other
|
(10
|
)
|
(3
|
)
|
(2
|
)
|
(15
|
)
|
|||||||
|
Allowance for credit loss as of July 28, 2012
|
$
|
247
|
|
$
|
122
|
|
$
|
11
|
|
$
|
380
|
|
|||
|
Financing receivables as of July 28, 2012
(1)
|
$
|
3,179
|
|
$
|
1,796
|
|
$
|
2,651
|
|
$
|
7,626
|
|
|||
(1)
Total financing receivables before allowance for credit loss.
94
|
(d)
|
Operating Leases
|
The Company provides financing of certain equipment through operating leases, and the amounts are included in property and equipment in the Consolidated Balance Sheets. Amounts relating to equipment on operating lease assets and the associated accumulated depreciation are summarized as follows (in millions):
|
July 26, 2014
|
July 27, 2013
|
||||||
|
Operating lease assets
|
$
|
362
|
|
$
|
326
|
|
|
|
Accumulated depreciation
|
(202
|
)
|
(203
|
)
|
|||
|
Operating lease assets, net
|
$
|
160
|
|
$
|
123
|
|
|
Minimum future rentals on non-cancelable operating leases at
July 26, 2014
are approximately
$0.2 billion
per year for fiscal 2015,
$0.1 billion
for fiscal 2016, and less than
$0.1 billion
per year for each of fiscal 2017 through fiscal 2019.
|
8.
|
Investments
|
|
(a)
|
Summary of Available-for-Sale Investments
|
The following tables summarize the Company’s available-for-sale investments (in millions):
|
July 26, 2014
|
Amortized
Cost
|
Gross
Unrealized
Gains
|
Gross
Unrealized
Losses
|
Fair
Value
|
|||||||||||
|
Fixed income securities:
|
|||||||||||||||
|
U.S. government securities
|
$
|
31,717
|
|
$
|
29
|
|
$
|
(12
|
)
|
$
|
31,734
|
|
|||
|
U.S. government agency securities
|
1,062
|
|
1
|
|
—
|
|
1,063
|
|
|||||||
|
Non-U.S. government and agency securities
|
860
|
|
2
|
|
(1
|
)
|
861
|
|
|||||||
|
Corporate debt securities
|
9,092
|
|
74
|
|
(7
|
)
|
9,159
|
|
|||||||
|
U.S. agency mortgage-backed securities
|
574
|
|
5
|
|
—
|
|
579
|
|
|||||||
|
Total fixed income securities
|
43,305
|
|
111
|
|
(20
|
)
|
43,396
|
|
|||||||
|
Publicly traded equity securities
|
1,314
|
|
648
|
|
(10
|
)
|
1,952
|
|
|||||||
|
Total
|
$
|
44,619
|
|
$
|
759
|
|
$
|
(30
|
)
|
$
|
45,348
|
|
|||
|
July 27, 2013
|
Amortized
Cost
|
Gross
Unrealized
Gains
|
Gross
Unrealized
Losses
|
Fair
Value
|
|||||||||||
|
Fixed income securities:
|
|||||||||||||||
|
U.S. government securities
|
$
|
27,814
|
|
$
|
22
|
|
$
|
(13
|
)
|
$
|
27,823
|
|
|||
|
U.S. government agency securities
|
3,083
|
|
7
|
|
(1
|
)
|
3,089
|
|
|||||||
|
Non-U.S. government and agency securities
|
1,094
|
|
3
|
|
(2
|
)
|
1,095
|
|
|||||||
|
Corporate debt securities
|
7,876
|
|
55
|
|
(50
|
)
|
7,881
|
|
|||||||
|
Total fixed income securities
|
39,867
|
|
87
|
|
(66
|
)
|
39,888
|
|
|||||||
|
Publicly traded equity securities
|
2,063
|
|
738
|
|
(4
|
)
|
2,797
|
|
|||||||
|
Total
|
$
|
41,930
|
|
$
|
825
|
|
$
|
(70
|
)
|
$
|
42,685
|
|
|||
Non-U.S. government and agency securities include agency and corporate debt securities that are guaranteed by non-U.S. governments.
95
|
(b)
|
Gains and Losses on Available-for-Sale Investments
|
The following table presents the gross realized gains and gross realized losses related to the Company’s available-for-sale investments (in millions):
|
Years Ended
|
July 26, 2014
|
July 27, 2013
|
July 28, 2012
|
||||||||
|
Gross realized gains
|
$
|
341
|
|
$
|
264
|
|
$
|
561
|
|
||
|
Gross realized losses
|
(41
|
)
|
(216
|
)
|
(460
|
)
|
|||||
|
Total
|
$
|
300
|
|
$
|
48
|
|
$
|
101
|
|
||
The following table presents the realized net gains related to the Company’s available-for-sale investments by security type (in millions):
|
Years Ended
|
July 26, 2014
|
July 27, 2013
|
July 28, 2012
|
||||||||
|
Net gains on investments in publicly traded equity securities
|
$
|
253
|
|
$
|
17
|
|
$
|
43
|
|
||
|
Net gains on investments in fixed income securities
|
47
|
|
31
|
|
58
|
|
|||||
|
Total
|
$
|
300
|
|
$
|
48
|
|
$
|
101
|
|
||
For fiscal 2014, the realized net gains related to the Company's available-for-sale investments included impairment charges of
$11 million
. These impairment charges related to publicly traded equity securities and were due to a decline in the fair value of those securities below their cost basis that were determined to be other than temporary. There were
no
impairment charges on available-for-sale investments for
fiscal 2013
and
2012
.
The following tables present the breakdown of the available-for-sale investments with gross unrealized losses and the duration that those losses had been unrealized at
July 26, 2014
and
July 27, 2013
(in millions):
|
|
UNREALIZED LOSSES
LESS THAN 12 MONTHS
|
UNREALIZED LOSSES
12 MONTHS OR GREATER
|
TOTAL
|
||||||||||||||||||||
|
July 26, 2014
|
Fair Value
|
Gross
Unrealized
Losses
|
Fair Value
|
Gross
Unrealized
Losses
|
Fair Value
|
Gross
Unrealized
Losses
|
|||||||||||||||||
|
Fixed income securities:
|
|||||||||||||||||||||||
|
U.S. government securities
|
$
|
7,676
|
|
$
|
(12
|
)
|
$
|
45
|
|
$
|
—
|
|
$
|
7,721
|
|
$
|
(12
|
)
|
|||||
|
Non-U.S. government and agency securities
|
361
|
|
(1
|
)
|
22
|
|
—
|
|
383
|
|
(1
|
)
|
|||||||||||
|
Corporate debt securities
|
1,875
|
|
(3
|
)
|
491
|
|
(4
|
)
|
2,366
|
|
(7
|
)
|
|||||||||||
|
Total fixed income securities
|
9,912
|
|
(16
|
)
|
|
558
|
|
|
(4
|
)
|
|
10,470
|
|
|
(20
|
)
|
|||||||
|
Publicly traded equity securities
|
132
|
|
(10
|
)
|
—
|
|
—
|
|
132
|
|
(10
|
)
|
|||||||||||
|
Total
|
$
|
10,044
|
|
$
|
(26
|
)
|
$
|
558
|
|
$
|
(4
|
)
|
$
|
10,602
|
|
$
|
(30
|
)
|
|||||
|
|
UNREALIZED LOSSES
LESS THAN 12 MONTHS
|
UNREALIZED LOSSES
12 MONTHS OR GREATER
|
TOTAL
|
||||||||||||||||||||
|
July 27, 2013
|
Fair Value
|
Gross
Unrealized
Losses
|
Fair Value
|
Gross
Unrealized
Losses
|
Fair Value
|
Gross
Unrealized
Losses
|
|||||||||||||||||
|
Fixed income securities:
|
|||||||||||||||||||||||
|
U.S. government securities
|
$
|
7,865
|
|
$
|
(13
|
)
|
$
|
—
|
|
$
|
—
|
|
$
|
7,865
|
|
$
|
(13
|
)
|
|||||
|
U.S. government agency securities
|
294
|
|
(1
|
)
|
—
|
|
—
|
|
294
|
|
(1
|
)
|
|||||||||||
|
Non-U.S. government and agency securities
|
432
|
|
(2
|
)
|
—
|
|
—
|
|
432
|
|
(2
|
)
|
|||||||||||
|
Corporate debt securities
|
3,704
|
|
(50
|
)
|
4
|
|
—
|
|
3,708
|
|
(50
|
)
|
|||||||||||
|
Total fixed income securities
|
12,295
|
|
(66
|
)
|
4
|
|
—
|
|
12,299
|
|
(66
|
)
|
|||||||||||
|
Publicly traded equity securities
|
278
|
|
(4
|
)
|
—
|
|
—
|
|
278
|
|
(4
|
)
|
|||||||||||
|
Total
|
$
|
12,573
|
|
$
|
(70
|
)
|
$
|
4
|
|
$
|
—
|
|
$
|
12,577
|
|
$
|
(70
|
)
|
|||||
96
As of
July 26, 2014
, for fixed income securities that were in unrealized loss positions, the Company has determined that (i) it does not have the intent to sell any of these investments, and (ii) it is not more likely than not that it will be required to sell any of these investments before recovery of the entire amortized cost basis. In addition, as of
July 26, 2014
, the Company anticipates that it will recover the entire amortized cost basis of such fixed income securities and has determined that
no
other-than-temporary impairments associated with credit losses were required to be recognized during the year ended
July 26, 2014
.
The Company has evaluated its publicly traded equity securities as of
July 26, 2014
and has determined that there was
no
indication of other-than-temporary impairments in the respective categories of unrealized losses. This determination was based on several factors, which include the length of time and extent to which fair value has been less than the cost basis, the financial condition and near-term prospects of the issuer, and the Company’s intent and ability to hold the publicly traded equity securities for a period of time sufficient to allow for any anticipated recovery in market value.
|
(c)
|
Maturities of Fixed Income Securities
|
The following table summarizes the maturities of the Company’s fixed income securities at
July 26, 2014
(in millions):
|
Amortized Cost
|
Fair Value
|
||||||
|
Less than 1 year
|
$
|
15,444
|
|
$
|
15,457
|
|
|
|
Due in 1 to 2 years
|
13,449
|
|
13,484
|
|
|||
|
Due in 2 to 5 years
|
13,711
|
|
13,743
|
|
|||
|
Due after 5 years
|
701
|
|
712
|
|
|||
|
Total
|
$
|
43,305
|
|
$
|
43,396
|
|
|
Actual maturities may differ from the contractual maturities because borrowers may have the right to call or prepay certain obligations. The remaining contractual principal maturities for mortgage-backed securities were allocated assuming no prepayments.
|
(d)
|
Securities Lending
|
The Company periodically engages in securities lending activities with certain of its available-for-sale investments. These transactions are accounted for as a secured lending of the securities, and the securities are typically loaned only on an overnight basis. The average daily balance of securities lending for fiscal 2014 and 2013 was
$1.5 billion
and
$0.7 billion
, respectively. The Company requires collateral equal to at least
102%
of the fair market value of the loaned security and that the collateral be in the form of cash or liquid, high-quality assets. The Company engages in these secured lending transactions only with highly creditworthy counterparties, and the associated portfolio custodian has agreed to indemnify the Company against collateral losses. The Company did not experience any losses in connection with the secured lending of securities during the periods presented. As of
July 26, 2014
and
July 27, 2013
, the Company had
no
outstanding securities lending transactions.
|
(e)
|
Investments in Privately Held Companies
|
The carrying value of the Company’s investments in privately held companies was included in other assets. For such investments that were accounted for under the equity and cost method as of
July 26, 2014
and
July 27, 2013
, the amounts are summarized in the table below (in millions):
|
July 26, 2014
|
July 27, 2013
|
||||||
|
Equity method investments
|
$
|
630
|
|
$
|
591
|
|
|
|
Cost method investments
|
269
|
|
242
|
|
|||
|
Total
|
$
|
899
|
|
$
|
833
|
|
|
97
Variable Interest Entities
VCE Joint Venture
VCE is a joint venture that the Company formed in fiscal 2010 with EMC Corporation (“EMC”), with investments from VMware, Inc. (“VMware”) and Intel Corporation. VCE helps organizations leverage best-in-class technologies and disciplines from Cisco, EMC, and VMware to enable the transformation to cloud computing.
As of
July 26, 2014
, the Company’s cumulative gross investment in VCE was approximately
$716 million
, inclusive of accrued interest, and its ownership percentage was approximately
35%
. The Company invested
$185 million
in VCE during
fiscal 2014
,
$93 million
during
fiscal 2013
, and
$276 million
during
fiscal 2012
.
For the period presented, the Company accounted for its investment in VCE under the equity method, and its portion of VCE’s net loss is recognized in other income (loss), net. The Company’s share of VCE’s losses, based upon its portion of the overall funding, was approximately
36.8%
for each of the fiscal years ended
July 26, 2014
,
July 27, 2013
, and
July 28, 2012
. As of
July 26, 2014
, the Company had recorded cumulative losses from VCE of
$644 million
since inception, of which losses of
$223 million
,
$183 million
, and
$160 million
were recorded for the fiscal years ended
July 26, 2014
,
July 27, 2013
, and
July 28, 2012
, respectively. The Company’s carrying value in VCE as of
July 26, 2014
was
$72 million
.
Over the next 12 months, as VCE scales its operations, the Company may make additional investments in VCE and may incur additional losses proportionate with the Company’s share ownership.
From time to time, EMC and Cisco may enter into guarantee agreements on behalf of VCE to indemnify third parties, such as customers, for monetary damages. Such guarantees were not material as of
July 26, 2014
.
Other Variable Interest Entities
In the ordinary course of business, the Company has investments in other privately held companies and provides financing to certain customers. These other privately held companies and customers may be considered to be variable interest entities. The Company evaluates on an ongoing basis its investments in these other privately held companies and its customer financings, and has determined that as of
July 26, 2014
there were no other variable interest entities required to be consolidated in the Company’s Consolidated Financial Statements.
|
9.
|
Fair Value
|
|
(a)
|
Assets and Liabilities Measured at Fair Value on a Recurring Basis
|
Assets and liabilities measured at fair value on a recurring basis as of
July 26, 2014
and
July 27, 2013
were as follows (in millions):
|
|
JULY 26, 2014
FAIR VALUE MEASUREMENTS
|
JULY 27, 2013
FAIR VALUE MEASUREMENTS
|
|||||||||||||||||||||||||
|
|
Level 1
|
Level 2
|
Level 3
|
Total
Balance
|
Level 1
|
Level 2
|
Total
Balance
|
||||||||||||||||||||
|
Assets:
|
|||||||||||||||||||||||||||
|
Cash equivalents:
|
|||||||||||||||||||||||||||
|
Money market funds
|
$
|
4,935
|
|
$
|
—
|
|
$
|
—
|
|
$
|
4,935
|
|
$
|
6,045
|
|
$
|
—
|
|
$
|
6,045
|
|
||||||
|
Available-for-sale investments:
|
|
||||||||||||||||||||||||||
|
U.S. government securities
|
—
|
|
31,734
|
|
—
|
|
31,734
|
|
—
|
|
27,823
|
|
27,823
|
|
|||||||||||||
|
U.S. government agency securities
|
—
|
|
1,063
|
|
—
|
|
1,063
|
|
—
|
|
3,089
|
|
3,089
|
|
|||||||||||||
|
Non-U.S. government and agency securities
|
—
|
|
861
|
|
—
|
|
861
|
|
—
|
|
1,095
|
|
1,095
|
|
|||||||||||||
|
Corporate debt securities
|
—
|
|
9,159
|
|
—
|
|
9,159
|
|
—
|
|
7,881
|
|
7,881
|
|
|||||||||||||
|
U.S. agency mortgage-backed securities
|
—
|
|
579
|
|
—
|
|
579
|
|
—
|
|
—
|
|
—
|
|
|||||||||||||
|
Publicly traded equity securities
|
1,952
|
|
—
|
|
—
|
|
1,952
|
|
2,797
|
|
—
|
|
2,797
|
|
|||||||||||||
|
Derivative assets
|
—
|
|
158
|
|
2
|
|
160
|
|
—
|
|
182
|
|
182
|
|
|||||||||||||
|
Total
|
$
|
6,887
|
|
$
|
43,554
|
|
$
|
2
|
|
$
|
50,443
|
|
$
|
8,842
|
|
$
|
40,070
|
|
$
|
48,912
|
|
||||||
|
Liabilities:
|
|||||||||||||||||||||||||||
|
Derivative liabilities
|
$
|
—
|
|
$
|
67
|
|
$
|
—
|
|
$
|
67
|
|
$
|
—
|
|
$
|
171
|
|
$
|
171
|
|
||||||
|
Total
|
$
|
—
|
|
$
|
67
|
|
$
|
—
|
|
$
|
67
|
|
$
|
—
|
|
$
|
171
|
|
$
|
171
|
|
||||||
Level 1 publicly traded equity securities are determined by using quoted prices in active markets for identical assets. Level 2 fixed income securities are priced using quoted market prices for similar instruments or nonbinding market prices that are corroborated by observable market data. The Company uses inputs such as actual trade data, benchmark yields, broker/dealer quotes, and other similar data, which are obtained from quoted market prices, independent pricing vendors, or other sources, to determine the ultimate fair value of these assets and liabilities. The Company uses such pricing data as the primary input to
98
make its assessments and determinations as to the ultimate valuation of its investment portfolio and has not made, during the periods presented, any material adjustments to such inputs. The Company is ultimately responsible for the financial statements and underlying estimates. The Company’s derivative instruments are primarily classified as Level 2, as they are not actively traded and are valued using pricing models that use observable market inputs. The Company did not have any transfers between Level 1 and Level 2 fair value measurements during the periods presented.
Level 3 assets include certain derivative instruments, the values of which are determined based on discounted cash flow models using inputs that the Company could not corroborate with market data.
|
(b)
|
Assets Measured at Fair Value on a Nonrecurring Basis
|
The following table presents the Company’s financial instruments and nonfinancial assets that were measured at fair value on a nonrecurring basis during the indicated periods and the related recognized gains and losses for the periods (in millions):
|
July 26, 2014
|
July 27, 2013
|
July 28, 2012
|
||||||||||||||||||||||
|
|
Net Carrying
Value as of
Year End
|
Total Gains (Losses)
for the
Year Ended
|
Net Carrying
Value as of
Year End
|
Total Gains (Losses)
for the
Year Ended
|
Net Carrying
Value as of
Year End
|
Total Gains (Losses)
for the
Year Ended
|
||||||||||||||||||
|
Assets held for sale
|
$
|
—
|
|
$
|
—
|
|
$
|
1
|
|
$
|
(1
|
)
|
$
|
63
|
|
$
|
(413
|
)
|
||||||
|
Investments in privately held companies (impaired)
|
$
|
28
|
|
(21
|
)
|
$
|
63
|
|
(31
|
)
|
$
|
47
|
|
(23
|
)
|
|||||||||
|
Purchased intangible assets
|
$
|
—
|
|
—
|
|
$
|
—
|
|
—
|
|
$
|
—
|
|
(12
|
)
|
|||||||||
|
Gains (losses) on assets no longer held at end of fiscal year
|
(2
|
)
|
75
|
|
14
|
|
||||||||||||||||||
|
Total gains (losses) for nonrecurring measurements
|
$
|
(23
|
)
|
$
|
43
|
|
$
|
(434
|
)
|
|||||||||||||||
The assets in the preceding table were measured at fair value due to events or circumstances the Company identified as having significant impact on their fair value during the respective periods. To arrive at the valuation of these assets, the Company considers any significant changes in the financial metrics and economic variables and also uses third-party valuation reports to assist in the valuation as necessary. These assets were classified as Level 3 assets because the Company used unobservable inputs to value them.
The assets held for sale represent land and buildings that met the criteria to be classified as held for sale. The fair value of assets held for sale was measured with the assistance of third-party valuation models, which used discounted cash flow techniques as part of their analysis. The fair value measurement was categorized as Level 3 as significant unobservable inputs were used in the valuation report. The impairment charges as a result of the valuations, which represented the difference between the fair value less cost to sell and the carrying amount of the assets held for sale, were included in G&A expenses.
The fair value measurement of the impaired investments was classified as Level 3 because significant unobservable inputs were used in the valuation due to the absence of quoted market prices and inherent lack of liquidity. Significant unobservable inputs, which included financial metrics of comparable private and public companies, financial condition and near-term prospects of the investees, recent financing activities of the investees, and the investees’ capital structure as well as other economic variables, reflected the assumptions market participants would use in pricing these assets. The impairment charges, representing the difference between the net book value and the fair value as a result of the evaluation, were recorded to other income (loss), net.
The fair value of purchased intangible assets measured at fair value on a nonrecurring basis was categorized as Level 3 due to the use of significant unobservable inputs in the valuation. Significant unobservable inputs that were used included expected revenues and net income related to the assets and the expected life of the assets. The difference between the estimated fair value and the carrying value of the assets was recorded as an impairment charge. There was no impairment charge related to purchased intangible assets during the fiscal years ended
July 26, 2014
and
July 27, 2013
. For the fiscal year ended
July 28, 2012
, such impairment charges were recorded in cost of sales and operating expenses as appropriate. See Note 4.
|
(c)
|
Other Fair Value Disclosures
|
The carrying value of the Company’s investments in privately held companies that were accounted for under the cost method was
$269 million
and
$242 million
as of
July 26, 2014
and
July 27, 2013
, respectively. It was not practicable to estimate the fair value of this portfolio.
The fair value of the Company’s short-term loan receivables and financed service contracts approximates their carrying value due to their short duration. The aggregate carrying value of the Company’s long-term loan receivables and financed service contracts and other as of
July 26, 2014
and
July 27, 2013
was
$2.1 billion
. The estimated fair value of the Company’s long-
99
term loan receivables and financed service contracts and other approximates their carrying value. The Company uses significant unobservable inputs in determining discounted cash flows to estimate the fair value of its long-term loan receivables and financed service contracts, and therefore they are categorized as Level 3.
As of
July 26, 2014
and
July 27, 2013
, the estimated fair value of the short-term debt approximates its carrying value due to the short maturities. As of
July 26, 2014
, the fair value of the Company’s senior notes and other long-term debt was
$22.4 billion
with a carrying amount of
$20.9 billion
. This compares to a fair value of
$17.6 billion
and a carrying amount of
$16.2 billion
as of
July 27, 2013
. The fair value of the senior notes and other long-term debt was determined based on observable market prices in a less active market and was categorized as Level 2 in the fair value hierarchy.
|
10.
|
Borrowings
|
|
(a)
|
|
The following table summarizes the Company’s short-term debt (in millions, except percentages):
|
|
July 26, 2014
|
July 27, 2013
|
|||||||||||
|
|
Amount
|
Effective Rate
|
Amount
|
Effective Rate
|
|||||||||
|
Current portion of long-term debt
|
$
|
500
|
|
3.11
|
%
|
$
|
3,273
|
|
0.63
|
%
|
|||
|
Other notes and borrowings
|
8
|
|
2.67
|
%
|
10
|
|
2.52
|
%
|
|||||
|
Total short-term debt
|
$
|
508
|
|
$
|
3,283
|
|
|
||||||
In fiscal 2011, the Company established a short-term debt financing program of up to
$3.0 billion
through the issuance of commercial paper notes. The Company uses the proceeds from the issuance of commercial paper notes for general corporate purposes. In the third quarter of fiscal 2014, the Company issued and repaid
$1.0 billion
of indebtedness under commercial paper and had
no
commercial paper notes outstanding as of each of
July 26, 2014
and
July 27, 2013
.
The effective interest rate on the current portion of long-term debt includes the impact of interest rate swaps, as discussed further in "(b) Long-Term Debt." The Company repaid senior floating-rate and fixed-rate notes upon their maturity in the third quarter of fiscal 2014 for an aggregate principal amount of
$3.3 billion
. Other notes and borrowings consist of the short-term portion of secured borrowings associated with customer financing arrangements. These notes and credit facilities were subject to various terms and foreign currency market interest rates pursuant to individual financial arrangements between the financing institution and the applicable foreign subsidiary.
100
|
(b)
|
Long-Term Debt
|
The following table summarizes the Company’s long-term debt (in millions, except percentages):
|
|
July 26, 2014
|
July 27, 2013
|
|||||||||||
|
|
Maturity Date
|
Amount
|
Effective Rate
|
Amount
|
Effective Rate
|
||||||||
|
Senior notes:
|
|||||||||||||
|
Floating-rate notes:
|
|||||||||||||
|
Three-month LIBOR plus 0.25%
|
March 14, 2014
|
$
|
—
|
|
—
|
$
|
1,250
|
|
0.62%
|
||||
|
Three-month LIBOR plus 0.05%
|
September 3, 2015
|
(1)
|
850
|
|
0.35%
|
—
|
|
—
|
|||||
|
Three-month LIBOR plus 0.28%
|
March 3, 2017
|
(1)
|
1,000
|
|
0.56%
|
—
|
|
—
|
|||||
|
Three-month LIBOR plus 0.50%
|
March 1, 2019
|
(1)
|
500
|
|
0.78%
|
—
|
|
—
|
|||||
|
Fixed-rate notes:
|
|||||||||||||
|
1.625%
|
March 14, 2014
|
—
|
|
—
|
2,000
|
|
0.64%
|
||||||
|
2.90%
|
November 17, 2014
|
500
|
|
3.11%
|
500
|
|
3.11%
|
||||||
|
5.50%
|
February 22, 2016
|
3,000
|
|
3.04%
|
3,000
|
|
3.07%
|
||||||
|
1.10%
|
March 3, 2017
|
(1)
|
2,400
|
|
0.56%
|
—
|
|
—
|
|||||
|
3.15%
|
March 14, 2017
|
750
|
|
0.79%
|
750
|
|
0.84%
|
||||||
|
4.95%
|
February 15, 2019
|
2,000
|
|
4.69%
|
2,000
|
|
4.70%
|
||||||
|
2.125%
|
March 1, 2019
|
(1)
|
1,750
|
|
0.77%
|
—
|
|
—
|
|||||
|
4.45%
|
January 15, 2020
|
2,500
|
|
2.98%
|
2,500
|
|
4.15%
|
||||||
|
2.90%
|
March 4, 2021
|
(1)
|
500
|
|
0.93%
|
—
|
|
—
|
|||||
|
3.625%
|
March 4, 2024
|
(1)
|
1,000
|
|
1.05%
|
—
|
|
—
|
|||||
|
5.90%
|
February 15, 2039
|
2,000
|
|
6.11%
|
2,000
|
|
6.11%
|
||||||
|
5.50%
|
January 15, 2040
|
2,000
|
|
5.67%
|
2,000
|
|
5.67%
|
||||||
|
Other long-term debt
|
4
|
|
2.39%
|
21
|
|
1.46%
|
|||||||
|
Total
|
20,754
|
|
16,021
|
|
|||||||||
|
Unaccreted discount
|
(63
|
)
|
(65
|
)
|
|||||||||
|
Hedge accounting fair value adjustments
|
210
|
|
245
|
|
|||||||||
|
Total
|
$
|
20,901
|
|
$
|
16,201
|
|
|||||||
|
Reported as:
|
|||||||||||||
|
Current portion of long-term debt
|
$
|
500
|
|
$
|
3,273
|
|
|||||||
|
Long-term debt
|
20,401
|
|
12,928
|
|
|||||||||
|
Total
|
$
|
20,901
|
|
$
|
16,201
|
|
|||||||
(1)
In March 2014, the Company issued senior notes for an aggregate principal amount of
$8.0 billion
.
To achieve its interest rate risk management objectives, the Company entered into interest rate swaps with an aggregate notional amount of
$10.4 billion
designated as fair value hedges of certain of its fixed-rate senior notes. In effect, these swaps convert the fixed interest rates of the fixed-rate notes to floating interest rates based on the London InterBank Offered Rate (LIBOR). The gains and losses related to changes in the fair value of the interest rate swaps substantially offset changes in the fair value of the hedged portion of the underlying debt that are attributable to the changes in market interest rates. For additional information, see Note 11.
The effective rates for the fixed-rate debt include the interest on the notes, the accretion of the discount, and, if applicable, adjustments related to hedging. Interest is payable semiannually on each class of the senior fixed-rate notes and payable quarterly on the floating-rate notes. Each of the senior fixed-rate notes is redeemable by the Company at any time, subject to a make-whole premium.
The senior notes rank at par with the commercial paper notes that may be issued in the future pursuant to the Company’s short-term debt financing program, as discussed above under “(a) Short-Term Debt.” As of
July 26, 2014
, the Company was in compliance with all debt covenants.
101
As of
July 26, 2014
, future principal payments for long-term debt, including the current portion, are summarized as follows (in millions):
|
Fiscal Year
|
Amount
|
||
|
2015
|
$
|
500
|
|
|
2016
|
3,853
|
|
|
|
2017
|
4,151
|
|
|
|
2018
|
—
|
|
|
|
2019
|
4,250
|
|
|
|
Thereafter
|
8,000
|
|
|
|
Total
|
$
|
20,754
|
|
|
(c)
|
Credit Facility
|
On February 17, 2012, the Company entered into a credit agreement with certain institutional lenders that provides for a
$3.0 billion
unsecured revolving credit facility that is scheduled to expire on
February 17, 2017
. Any advances under the credit agreement will accrue interest at rates that are equal to, based on certain conditions, either (i) the higher of the Federal Funds rate plus
0.50%
, Bank of America’s “prime rate” as announced from time to time, or one-month LIBOR plus
1.00%
or (ii) LIBOR plus a margin that is based on the Company’s senior debt credit ratings as published by Standard & Poor’s Financial Services, LLC and Moody’s Investors Service, Inc. The credit agreement requires the Company to comply with certain covenants, including that it maintain an interest coverage ratio as defined in the agreement. As of
July 26, 2014
, the Company was in compliance with the required interest coverage ratio and the other covenants, and the Company had not borrowed any funds under the credit facility.
The Company may also, upon the agreement of either the existing lenders or additional lenders not currently parties to the agreement, increase the commitments under the credit facility by up to an additional
$2.0 billion
and/or extend the expiration date of the credit facility by up to two additional years, or up to
February 17, 2019
.
|
11.
|
Derivative Instruments
|
|
(a)
|
Summary of Derivative Instruments
|
The Company uses derivative instruments primarily to manage exposures to foreign currency exchange rate, interest rate, and equity price risks. The Company’s primary objective in holding derivatives is to reduce the volatility of earnings and cash flows associated with changes in foreign currency exchange rates, interest rates, and equity prices. The Company’s derivatives expose it to credit risk to the extent that the counterparties may be unable to meet the terms of the agreement. The Company does, however, seek to mitigate such risks by limiting its counterparties to major financial institutions. In addition, the potential risk of loss with any one counterparty resulting from this type of credit risk is monitored. Management does not expect material losses as a result of defaults by counterparties.
The fair values of the Company’s derivative instruments and the line items on the Consolidated Balance Sheets to which they were recorded are summarized as follows (in millions):
|
|
DERIVATIVE ASSETS
|
DERIVATIVE LIABILITIES
|
|||||||||||||||||
|
|
Balance Sheet Line Item
|
July 26, 2014
|
July 27, 2013
|
Balance Sheet Line Item
|
July 26, 2014
|
July 27, 2013
|
|||||||||||||
|
Derivatives designated as hedging instruments:
|
|||||||||||||||||||
|
Foreign currency derivatives
|
Other current assets
|
$
|
7
|
|
$
|
33
|
|
Other current liabilities
|
$
|
6
|
|
$
|
7
|
|
|||||
|
Interest rate derivatives
|
Other assets
|
148
|
|
147
|
|
Other long-term liabilities
|
3
|
|
2
|
|
|||||||||
|
Equity derivatives
|
Other current assets
|
—
|
|
—
|
|
Other current liabilities
|
56
|
|
155
|
|
|||||||||
|
Total
|
155
|
|
180
|
|
65
|
|
164
|
|
|||||||||||
|
Derivatives not designated as hedging instruments:
|
|||||||||||||||||||
|
Foreign currency derivatives
|
Other current assets
|
3
|
|
2
|
|
Other current liabilities
|
2
|
|
7
|
|
|||||||||
|
Equity derivatives
|
Other assets
|
2
|
|
—
|
|
Other long-term liabilities
|
—
|
|
—
|
|
|||||||||
|
Total
|
5
|
|
2
|
|
2
|
|
7
|
|
|||||||||||
|
Total
|
$
|
160
|
|
$
|
182
|
|
$
|
67
|
|
$
|
171
|
|
|||||||
102
The effects of the Company’s cash flow and net investment hedging instruments on other comprehensive income (OCI) and the Consolidated Statements of Operations are summarized as follows (in millions):
|
GAINS (LOSSES) RECOGNIZED
IN OCI ON DERIVATIVES FOR
THE YEARS ENDED (EFFECTIVE PORTION)
|
GAINS (LOSSES) RECLASSIFIED FROM
AOCI INTO INCOME FOR
THE YEARS ENDED (EFFECTIVE PORTION)
|
|||||||||||||||||||||||||
|
July 26, 2014
|
July 27, 2013
|
July 28, 2012
|
Line Item in Statements of Operations
|
July 26, 2014
|
July 27, 2013
|
July 28, 2012
|
||||||||||||||||||||
|
Derivatives designated as cash flow hedging instruments:
|
||||||||||||||||||||||||||
|
Foreign currency derivatives
|
$
|
48
|
|
$
|
73
|
|
$
|
(131
|
)
|
Operating expenses
|
$
|
55
|
|
$
|
10
|
|
$
|
(59
|
)
|
|||||||
|
Cost of sales
—
service
|
13
|
|
2
|
|
(14
|
)
|
||||||||||||||||||||
|
Interest rate derivatives
|
—
|
|
—
|
|
—
|
|
Interest expense
|
—
|
|
—
|
|
1
|
|
|||||||||||||
|
Total
|
$
|
48
|
|
$
|
73
|
|
$
|
(131
|
)
|
$
|
68
|
|
$
|
12
|
|
$
|
(72
|
)
|
||||||||
|
Derivatives designated as net investment hedging instruments:
|
||||||||||||||||||||||||||
|
Foreign currency derivatives
|
$
|
(15
|
)
|
$
|
(1
|
)
|
$
|
23
|
|
Other income (loss), net
|
$
|
—
|
|
$
|
—
|
|
$
|
—
|
|
|||||||
As of
July 26, 2014
, the Company estimates that approximately
$0.2 million
of net derivative losses related to its cash flow hedges included in accumulated other comprehensive income (AOCI) will be reclassified into earnings within the next 12 months.
The effect on the Consolidated Statements of Operations of derivative instruments designated as fair value hedges and the underlying hedged items is summarized as follows (in millions):
|
|
|
GAINS (LOSSES) ON
DERIVATIVE
INSTRUMENTS FOR THE
YEARS ENDED
|
GAINS (LOSSES)
RELATED TO HEDGED
ITEMS FOR THE YEARS
ENDED
|
|||||||||||||||||||||||
|
Derivatives Designated as Fair Value Hedging Instruments
|
Line Item in Statements of Operations
|
July 26, 2014
|
July 27, 2013
|
July 28, 2012
|
July 26, 2014
|
July 27, 2013
|
July 28, 2012
|
|||||||||||||||||||
|
Equity derivatives
|
Other income (loss), net
|
$
|
(72
|
)
|
$
|
(155
|
)
|
$
|
(4
|
)
|
$
|
72
|
|
$
|
155
|
|
$
|
4
|
|
|||||||
|
Interest rate derivatives
|
Interest expense
|
(2
|
)
|
(78
|
)
|
78
|
|
—
|
|
78
|
|
(80
|
)
|
|||||||||||||
|
Total
|
$
|
(74
|
)
|
$
|
(233
|
)
|
$
|
74
|
|
$
|
72
|
|
$
|
233
|
|
$
|
(76
|
)
|
||||||||
The effect on the Consolidated Statements of Operations of derivative instruments not designated as hedges is summarized as follows (in millions):
|
|
|
GAINS (LOSSES) FOR THE
YEARS ENDED
|
||||||||||||
|
Derivatives Not Designated as Hedging Instruments
|
Line Item in Statements of Operations
|
July 26, 2014
|
July 27, 2013
|
July 28, 2012
|
||||||||||
|
Foreign currency derivatives
|
Other income (loss), net
|
$
|
23
|
|
$
|
(74
|
)
|
$
|
(206
|
)
|
||||
|
Total return swaps—deferred compensation
|
Cost of sales—product
|
—
|
|
—
|
|
4
|
|
|||||||
|
Total return swaps—deferred compensation
|
Operating expenses
|
47
|
|
61
|
|
3
|
|
|||||||
|
Equity derivatives
|
Other income (loss), net
|
34
|
|
—
|
|
6
|
|
|||||||
|
Total
|
$
|
104
|
|
$
|
(13
|
)
|
$
|
(193
|
)
|
|||||
The notional amounts of the Company’s outstanding derivatives are summarized as follows (in millions):
103
|
July 26, 2014
|
July 27, 2013
|
||||||
|
Derivatives designated as hedging instruments:
|
|||||||
|
Foreign currency derivatives—cash flow hedges
|
$
|
1,618
|
|
$
|
1,885
|
|
|
|
Interest rate derivatives
|
10,400
|
|
5,250
|
|
|||
|
Net investment hedging instruments
|
345
|
|
662
|
|
|||
|
Equity derivatives
|
238
|
|
1,098
|
|
|||
|
Derivatives not designated as hedging instruments:
|
|||||||
|
Foreign currency derivatives
|
2,528
|
|
3,739
|
|
|||
|
Total return swaps—deferred compensation
|
428
|
|
358
|
|
|||
|
Total
|
$
|
15,557
|
|
$
|
12,992
|
|
|
|
(b)
|
Offsetting of Derivative Instruments
|
The Company presents its derivative instruments at gross fair values in the Consolidated Balance Sheets. However, the Company’s master netting and other similar arrangements with the respective counterparties allow for net settlement under certain conditions, which are designed to reduce credit risk by permitting net settlement with the same counterparty. To further limit credit risk, the Company also enters into collateral security arrangements related to certain derivative instruments whereby cash is posted as collateral between the counterparties based on the fair market value of the derivative instrument. Information related to these offsetting arrangements is summarized as follows (in millions):
|
OFFSETTING OF DERIVATIVE ASSETS
|
|||||||||||||||||||||||
|
|
Gross Amounts Offset in Consolidated Balance Sheets
|
Gross Amounts Not Offset in the Consolidated Balance Sheets, but with Legal Rights to Offset
|
|||||||||||||||||||||
|
July 26, 2014
|
Gross Amount of Recognized Assets
|
Gross Amounts Offset in Consolidated Balance Sheets
|
Net Amount Presented on Consolidated Balance Sheets
|
Gross Derivative Amounts with Legal Rights to Offset
|
Cash Collateral Received
|
Net Amount
|
|||||||||||||||||
|
Derivatives
|
$
|
160
|
|
$
|
—
|
|
$
|
160
|
|
$
|
(39
|
)
|
$
|
(60
|
)
|
$
|
61
|
|
|||||
|
OFFSETTING OF DERIVATIVE LIABILITIES
|
|||||||||||||||||||||||
|
|
Gross Amounts Offset in Consolidated Balance Sheets
|
Gross Amounts Not Offset in the Consolidated Balance Sheets, but with Legal Rights to Offset
|
|||||||||||||||||||||
|
July 26, 2014
|
Gross Amount of Recognized Liabilities
|
Gross Amounts Offset in Consolidated Balance Sheets
|
Net Amount Presented on Consolidated Balance Sheets
|
Gross Derivative Amounts with Legal Rights to Offset
|
Cash Collateral Pledged
|
Net Amount
|
|||||||||||||||||
|
Derivatives
|
$
|
67
|
|
$
|
—
|
|
$
|
67
|
|
$
|
(39
|
)
|
$
|
(1
|
)
|
$
|
27
|
|
|||||
|
OFFSETTING OF DERIVATIVE ASSETS
|
|||||||||||||||||||||||
|
|
Gross Amounts Offset in Consolidated Balance Sheets
|
Gross Amounts Not Offset in the Consolidated Balance Sheets, but with Legal Rights to Offset
|
|||||||||||||||||||||
|
July 27, 2013
|
Gross Amount of Recognized Assets
|
Gross Amounts Offset in Consolidated Balance Sheets
|
Net Amount Presented on Consolidated Balance Sheets
|
Gross Derivative Amounts with Legal Rights to Offset
|
Cash Collateral Received
|
Net Amount
|
|||||||||||||||||
|
Derivatives
|
$
|
182
|
|
$
|
—
|
|
$
|
182
|
|
$
|
(120
|
)
|
$
|
—
|
|
$
|
62
|
|
|||||
|
OFFSETTING OF DERIVATIVE LIABILITIES
|
|||||||||||||||||||||||
|
|
Gross Amounts Offset in Consolidated Balance Sheets
|
Gross Amounts Not Offset in the Consolidated Balance Sheets, but with Legal Rights to Offset
|
|||||||||||||||||||||
|
July 27, 2013
|
Gross Amount of Recognized Liabilities
|
Gross Amounts Offset in Consolidated Balance Sheets
|
Net Amount Presented on Consolidated Balance Sheets
|
Gross Derivative Amounts with Legal Rights to Offset
|
Cash Collateral Pledged
|
Net Amount
|
|||||||||||||||||
|
Derivatives
|
$
|
171
|
|
$
|
—
|
|
$
|
171
|
|
$
|
(120
|
)
|
$
|
—
|
|
$
|
51
|
|
|||||
104
|
(c)
|
Foreign Currency Exchange Risk
|
The Company conducts business globally in numerous currencies. Therefore, it is exposed to adverse movements in foreign currency exchange rates. To limit the exposure related to foreign currency changes, the Company enters into foreign currency contracts. The Company does not enter into such contracts for trading purposes.
The Company hedges forecasted foreign currency transactions related to certain operating expenses and service cost of sales with currency options and forward contracts. These currency options and forward contracts, designated as cash flow hedges, generally have maturities of less than
18 months
. The Company assesses effectiveness based on changes in total fair value of the derivatives. The effective portion of the derivative instrument’s gain or loss is initially reported as a component of AOCI and subsequently reclassified into earnings when the hedged exposure affects earnings. The ineffective portion, if any, of the gain or loss is reported in earnings immediately. During the fiscal years presented, the Company did not discontinue any cash flow hedges for which it was probable that a forecasted transaction would not occur.
The Company enters into foreign exchange forward and option contracts to reduce the short-term effects of foreign currency fluctuations on assets and liabilities such as foreign currency receivables, including long-term customer financings, investments, and payables. These derivatives are not designated as hedging instruments. Gains and losses on the contracts are included in other income (loss), net, and substantially offset foreign exchange gains and losses from the remeasurement of intercompany balances or other current assets, investments, or liabilities denominated in currencies other than the functional currency of the reporting entity.
The Company hedges certain net investments in its foreign operations with forward contracts to reduce the effects of foreign currency fluctuations on the Company’s net investment in those foreign subsidiaries. These derivative instruments generally have maturities of up to
six months
.
|
(d)
|
Interest Rate Risk
|
Interest Rate Derivatives, Investments
The Company’s primary objective for holding fixed income securities is to achieve an appropriate investment return consistent with preserving principal and managing risk. To realize these objectives, the Company may utilize interest rate swaps or other derivatives designated as fair value or cash flow hedges. As of
July 26, 2014
and
July 27, 2013
, the Company did not have any outstanding interest rate derivatives related to its fixed income securities.
Interest Rate Derivatives Designated as Fair Value Hedge, Long-Term Debt
In
fiscal 2014 and 2013
, the Company entered into interest rate swaps designated as fair value hedges related to fixed-rate senior notes that are due on various dates from 2017 through 2024. In the previous periods, the Company entered into interest rate swaps designated as fair value hedges related to fixed-rate senior notes that are due in 2016 and 2017. Under these interest rate swaps, the Company receives fixed-rate interest payments and makes interest payments based on LIBOR plus a fixed number of basis points. The effect of such swaps is to convert the fixed interest rates of the senior fixed-rate notes to floating interest rates based on LIBOR. The gains and losses related to changes in the fair value of the interest rate swaps are included in interest expense and substantially offset changes in the fair value of the hedged portion of the underlying debt that are attributable to the changes in market interest rates. The fair value of the interest rate swaps was reflected in other assets and other long-term liabilities.
|
(e)
|
Equity Price Risk
|
The Company may hold equity securities for strategic purposes or to diversify its overall investment portfolio. The publicly traded equity securities in the Company’s portfolio are subject to price risk. To manage its exposure to changes in the fair value of certain equity securities, the Company has entered into equity derivatives that are designated as fair value hedges. The changes in the value of the hedging instruments are included in other income (loss), net, and offset the change in the fair value of the underlying hedged investment. In addition, the Company periodically enters into equity derivatives that are not designated as accounting hedges. The changes in the fair value of these derivatives are also included in other income (loss), net.
The Company is also exposed to variability in compensation charges related to certain deferred compensation obligations to employees. Although not designated as accounting hedges, the Company utilizes derivatives such as total return swaps to economically hedge this exposure.
|
(f)
|
Hedge Effectiveness
|
For the fiscal years presented, amounts excluded from the assessment of hedge effectiveness were not material for fair value, cash flow, and net investment hedges. In addition, hedge ineffectiveness for fair value, cash flow, and net investment hedges was not material for any of the fiscal years presented.
105
|
(g)
|
Collateral and Credit-Risk-Related Contingent Features
|
For certain derivative instruments, the Company and its counterparties have entered into arrangements requiring the party that is in a liability position from a mark-to-market standpoint to post cash collateral to the other party. See further discussion under "(b) Offsetting of Derivative Instruments" above.
In addition, certain derivative instruments are executed under agreements that have provisions requiring the Company and the counterparty to maintain a specified credit rating from certain credit-rating agencies. Under such agreements, if the Company’s or the counterparty’s credit rating falls below a specified credit rating, either party has the right to request collateral on the derivatives’ net liability position. The fair market value of these derivatives that are in a net liability position as of
July 26, 2014
was
$3 million
. There was
no
such balance as of
July 27, 2013
.
|
12.
|
Commitments and Contingencies
|
|
(a)
|
Operating Leases
|
The Company leases office space in many U.S. locations. Outside the United States, larger leased sites include sites in China, France, Germany, India, Israel, Italy, Japan, Netherlands, Norway, and the United Kingdom. The Company also leases equipment and vehicles. Future minimum lease payments under all noncancelable operating leases with an initial term in excess of one year as of
July 26, 2014
are as follows (in millions):
|
Fiscal Year
|
Amount
|
||
|
2015
|
$
|
399
|
|
|
2016
|
277
|
|
|
|
2017
|
180
|
|
|
|
2018
|
131
|
|
|
|
2019
|
65
|
|
|
|
Thereafter
|
187
|
|
|
|
Total
|
$
|
1,239
|
|
Rent expense for office space and equipment totaled
$413 million
,
$416 million
, and
$404 million
in
fiscal 2014, 2013, and 2012
, respectively.
|
(b)
|
Purchase Commitments with Contract Manufacturers and Suppliers
|
The Company purchases components from a variety of suppliers and uses several contract manufacturers to provide manufacturing services for its products. During the normal course of business, in order to manage manufacturing lead times and help ensure adequate component supply, the Company enters into agreements with contract manufacturers and suppliers that either allow them to procure inventory based upon criteria as defined by the Company or establish the parameters defining the Company’s requirements. A significant portion of the Company’s reported purchase commitments arising from these agreements consists of firm, noncancelable, and unconditional commitments. In certain instances, these agreements allow the Company the option to cancel, reschedule, and adjust the Company’s requirements based on its business needs prior to firm orders being placed. As of
July 26, 2014
and
July 27, 2013
, the Company had total purchase commitments for inventory of
$4,169 million
and
$4,033 million
, respectively.
The Company records a liability for firm, noncancelable, and unconditional purchase commitments for quantities in excess of its future demand forecasts consistent with the valuation of the Company’s excess and obsolete inventory. As of
July 26, 2014
and
July 27, 2013
, the liability for these purchase commitments was
$162 million
and
$172 million
, respectively, and was included in other current liabilities.
|
(c)
|
Other Commitments
|
In connection with the Company’s business combinations, the Company has agreed to pay certain additional amounts contingent upon the achievement of certain agreed-upon technology, development, product, or other milestones or upon the continued employment with the Company of certain employees of the acquired entities.
The following table summarizes the compensation expense related to acquisitions (in millions):
|
July 26, 2014
|
July 27, 2013
|
July 28, 2012
|
|||||||||
|
Compensation expense related to acquisitions
|
$
|
607
|
|
$
|
123
|
|
$
|
50
|
|
||
106
As of
July 26, 2014
, the Company estimated that future cash compensation expense of up to
$574 million
may be required to be recognized pursuant to the applicable business combination agreements, which included the remaining potential compensation expense related to Insieme Networks, Inc., as more fully discussed immediately below.
Insieme Networks, Inc.
In the third quarter of fiscal 2012, the Company made an investment in Insieme Networks, Inc. ("Insieme"), an early stage company focused on research and development in the data center market. As set forth in the agreement between the Company and Insieme, this investment included
$100 million
of funding and a license to certain of the Company’s technology. Immediately prior to the call option exercise and acquisition described below, the Company owned approximately
83%
of Insieme as a result of these investments and consolidated the results of Insieme in its Consolidated Financial Statements. In connection with this investment, the Company and Insieme entered into a put/call option agreement that provided the Company with the right to purchase the remaining interests in Insieme. In addition, the noncontrolling interest holders could require the Company to purchase their shares upon the occurrence of certain events.
During the first quarter of fiscal 2014, the Company exercised its call option and entered into an agreement to purchase the remaining interests in Insieme. The acquisition closed in the second quarter of fiscal 2014, at which time the former noncontrolling interest holders became eligible to receive up to two milestone payments, which will be determined using agreed-upon formulas based primarily on revenue for certain of Insieme’s products. During
fiscal 2014
, the Company recorded compensation expense of
$416 million
related to the fair value of the vested portion of amounts that are expected to be earned by the former noncontrolling interest holders. Continued vesting and changes to the fair value of the amounts probable of being earned will result in adjustments to the recorded compensation expense in future periods. Based on the terms of the agreement, the Company has determined that the maximum amount that could be recorded as compensation expense by the Company is approximately
$855 million
, net of forfeitures and including the
$416 million
that has been expensed in
fiscal 2014
. The milestone payments, if earned, are expected to be paid primarily during fiscal 2016 and fiscal 2017.
The Company also has certain funding commitments, primarily related to its investments in privately held companies and venture funds, some of which are based on the achievement of certain agreed-upon milestones, and some of which are required to be funded on demand. The funding commitments were
$255 million
and
$263 million
as of
July 26, 2014
and
July 27, 2013
, respectively.
|
(d)
|
Product Warranties
|
The following table summarizes the activity related to the product warranty liability (in millions):
|
July 26, 2014
|
July 27, 2013
|
July 28, 2012
|
|||||||||
|
Balance at beginning of fiscal year
|
$
|
402
|
|
$
|
373
|
|
$
|
340
|
|
||
|
Provision for warranties issued
|
704
|
|
649
|
|
617
|
|
|||||
|
Payments
|
(660
|
)
|
(620
|
)
|
(584
|
)
|
|||||
|
Balance at end of fiscal year
|
$
|
446
|
|
$
|
402
|
|
$
|
373
|
|
||
The Company accrues for warranty costs as part of its cost of sales based on associated material product costs, labor costs for technical support staff, and associated overhead. The Company’s products are generally covered by a warranty for periods ranging from
90 days
to
five years
, and for some products the Company provides a limited lifetime warranty.
|
(e)
|
Financing and Other Guarantees
|
In the ordinary course of business, the Company provides financing guarantees for various third-party financing arrangements extended to channel partners and end-user customers. Payments under these financing guarantee arrangements were not material for the periods presented.
Channel Partner Financing Guarantees
The Company facilitates arrangements for third-party financing extended to channel partners, consisting of revolving short-term financing, generally with payment terms ranging from
60
to
90 days
. These financing arrangements facilitate the working capital requirements of the channel partners, and, in some cases, the Company guarantees a portion of these arrangements. The volume of channel partner financing was
$24.6 billion
,
$23.8 billion
, and
$21.3 billion
for
fiscal 2014, 2013, and 2012
, respectively. The balance of the channel partner financing subject to guarantees was
$1.2 billion
and
$1.4 billion
as of
July 26, 2014
and
July 27, 2013
, respectively.
End-User Financing Guarantees
The Company also provides financing guarantees for third-party financing arrangements extended to end-user customers related to leases and loans, which typically have terms of up to
three years
. The volume of financing provided by third parties for leases and loans as to which the Company had provided guarantees was
$129 million
for
fiscal 2014
,
$185 million
for
fiscal 2013
, and
$227 million
for
fiscal 2012
.
107
Financing Guarantee Summary
The aggregate amounts of financing guarantees outstanding at
July 26, 2014
and
July 27, 2013
, representing the total maximum potential future payments under financing arrangements with third parties along with the related deferred revenue, are summarized in the following table (in millions):
|
July 26, 2014
|
July 27, 2013
|
||||||
|
Maximum potential future payments relating to financing guarantees:
|
|||||||
|
Channel partner
|
$
|
263
|
|
$
|
438
|
|
|
|
End user
|
202
|
|
237
|
|
|||
|
Total
|
$
|
465
|
|
$
|
675
|
|
|
|
Deferred revenue associated with financing guarantees:
|
|||||||
|
Channel partner
|
$
|
(127
|
)
|
$
|
(225
|
)
|
|
|
End user
|
(166
|
)
|
(191
|
)
|
|||
|
Total
|
$
|
(293
|
)
|
$
|
(416
|
)
|
|
|
Maximum potential future payments relating to financing guarantees, net of associated deferred revenue
|
$
|
172
|
|
$
|
259
|
|
|
Other Guarantees
The Company’s other guarantee arrangements as of
July 26, 2014
and
July 27, 2013
that were subject to recognition and disclosure requirements were not material.
|
(f)
|
Supplier Component Remediation Liability
|
The Company has recorded in other current liabilities a liability for the expected remediation cost for certain products sold in prior fiscal years containing memory components manufactured by a single supplier between 2005 and 2010. These components are widely used across the industry and are included in a number of the Company's products. Defects in some of these components have caused products to fail after a power cycle event. Defect rates due to this issue have been and are expected to be low. However, recently the Company has seen a small number of its customers experience a growing number of failures in their networks as a result of this component problem. Although the majority of these products are beyond the Company's warranty terms, the Company is proactively working with customers on mitigation. Prior to the second quarter of fiscal 2014, the Company had a liability of
$63 million
related to this issue for expected remediation costs based on the intended approach at that time. In February 2014, on the basis of the growing number of failures described above, the Company decided to expand its approach, which resulted in an additional charge to product cost of sales of
$655 million
being recorded for the second quarter of fiscal 2014. As of
July 26, 2014
, the remaining supplier component remediation liability was
$670 million
.
|
(g)
|
Indemnifications
|
In the normal course of business, the Company indemnifies other parties, including customers, lessors, and parties to other transactions with the Company, with respect to certain matters. The Company has agreed to hold such parties harmless against losses arising from a breach of representations or covenants or out of intellectual property infringement or other claims made against certain parties. These agreements may limit the time within which an indemnification claim can be made and the amount of the claim.
The Company has an obligation to indemnify certain expenses pursuant to such agreements in a case involving certain of the Company’s service provider customers that are subject to patent infringement claims asserted by Sprint Communications Company, L.P. (“Sprint”) in the United States District Court for the District of Kansas filed on December 19, 2011 (including one case that was later transferred to the District of Delaware). Sprint alleges that the service providers infringe Sprint’s patents by offering Voice over Internet Protocol-based telephone services utilizing products provided by the Company and other manufacturers. Sprint is seeking monetary damages. Trial dates have been set for the first half of calendar year 2015. The parties intend to conduct a mediation later this calendar year, and the Company may be asked to participate. The mediation could result in a resolution of the case for some or all of the Company's service provider customers. The Company believes that the service providers have strong defenses and that its products do not infringe the patents subject to the claims. Due to the uncertainty surrounding the litigation process, which involves numerous defendants, the Company is unable to reasonably estimate the ultimate outcome of this litigation at this time. Should the plaintiff prevail in litigation, mediation, or settlement, the Company may have an obligation to indemnify its service provider customers for damages, mediation awards, or settlement amounts arising from their use of Cisco products.
In addition, the Company has entered into indemnification agreements with its officers and directors, and the Company’s Amended and Restated Bylaws contain similar indemnification obligations to the Company’s agents.
108
It is not possible to determine the maximum potential amount under these indemnification agreements due to the Company’s limited history with prior indemnification claims and the unique facts and circumstances involved in each particular agreement. Historically, payments made by the Company under these agreements have not had a material effect on the Company’s operating results, financial position, or cash flows.
|
(h)
|
Legal Proceedings
|
Brazil
Brazilian authorities have investigated the Company’s Brazilian subsidiary and certain of its current and former employees, as well as a Brazilian importer of the Company’s products, and its affiliates and employees, relating to alleged evasion of import taxes and alleged improper transactions involving the subsidiary and the importer. Brazilian tax authorities have assessed claims against the Company’s Brazilian subsidiary based on a theory of joint liability with the Brazilian importer for import taxes, interest, and penalties. In addition to claims asserted by the Brazilian federal tax authorities in prior fiscal years, tax authorities from the Brazilian state of Sao Paulo have asserted similar claims on the same legal basis in prior fiscal years. In the first quarter of fiscal 2013, the Brazilian federal tax authorities asserted an additional claim against the Company’s Brazilian subsidiary based on a theory of joint liability with respect to an alleged underpayment of income taxes, social taxes, interest, and penalties by a Brazilian distributor.
The asserted claims by Brazilian federal tax authorities are for calendar years 2003 through 2008, and the asserted claims by the tax authorities from the state of Sao Paulo are for calendar years 2005 through 2007. The total asserted claims by Brazilian state and federal tax authorities aggregate to approximately
$389 million
for the alleged evasion of import and other taxes, approximately
$1.3 billion
for interest, and approximately
$1.7 billion
for various penalties, all determined using an exchange rate as of
July 26, 2014
. The Company has completed a thorough review of the matters and believes the asserted claims against the Company’s Brazilian subsidiary are without merit, and the Company is defending the claims vigorously. While the Company believes there is no legal basis for the alleged liability, due to the complexities and uncertainty surrounding the judicial process in Brazil and the nature of the claims asserting joint liability with the importer, the Company is unable to determine the likelihood of an unfavorable outcome against its Brazilian subsidiary and is unable to reasonably estimate a range of loss, if any. The Company does not expect a final judicial determination for several years.
Russia and the Commonwealth of Independent States
At the request of the U.S. Securities and Exchange Commission (SEC) and the U.S. Department of Justice, the Company is conducting an investigation into allegations which the Company and those agencies received regarding possible violations of the U.S. Foreign Corrupt Practices Act involving business activities of the Company's operations in Russia and certain of the Commonwealth of Independent States, and by certain resellers of the Company’s products in those countries. The Company takes any such allegations very seriously and is fully cooperating with and sharing the results of its investigation with the SEC and the Department of Justice. While the outcome of the Company's investigation is currently not determinable, the Company does not expect that it will have a material adverse effect on its consolidated financial position, results of operations, or cash flows. The countries that are the subject of the investigation collectively comprise less than
2%
of the Company’s revenues.
Rockstar
The Company and some of its service provider customers are subject to patent claims asserted in December 2013 in the Eastern District of Texas and the District of Delaware by subsidiaries of the Rockstar Consortium ("Rockstar"). Rockstar, whose members include Apple, Microsoft, LM Ericsson, Sony, and Blackberry, purchased a portfolio of patents out of the Nortel Networks’ bankruptcy proceedings (the “Nortel Portfolio”). Rockstar’s subsidiaries allege that some of the Company’s NGN Routing, Switching and Collaboration products, as well as video solutions deployed by its service provider customers, infringe some of the patents in the Nortel Portfolio. Rockstar seeks monetary damages. A trial date for one service provider customer has been set for October 2015; no other trial dates have been set. The Company has various defenses to the patent infringement allegations, and has various offensive claims against Rockstar and some of its consortium members available to it as well, and the Company will also explore alternative means of resolution. Due to the uncertainty surrounding the litigation process, which involves numerous lawsuits and parties, the Company is unable to reasonably estimate the ultimate outcome and a range of loss, if any, of these litigations at this time.
In addition, the Company is subject to legal proceedings, claims, and litigation arising in the ordinary course of business, including intellectual property litigation. While the outcome of these matters is currently not determinable, the Company does not expect that the ultimate costs to resolve these matters will have a material adverse effect on its consolidated financial position, results of operations, or cash flows.
109
|
13.
|
Shareholders’ Equity
|
|
(a)
|
Cash Dividends on Shares of Common Stock
|
During
fiscal 2014
, the Company declared and paid cash dividends of
$0.72
per common share, or
$3.8 billion
, on the Company’s outstanding common stock. During
fiscal 2013
, the Company declared and paid cash dividends of
$0.62
per common share, or
$3.3 billion
, on the Company’s outstanding common stock.
On
August 26, 2014
, the Company’s Board of Directors declared a quarterly dividend of
$0.19
per common share to be paid on
October 22, 2014
to all shareholders of record as of the close of business on
October 2, 2014
. Any future dividends will be subject to the approval of the Company’s Board of Directors.
|
(b)
|
Stock Repurchase Program
|
In September 2001, the Company’s Board of Directors authorized a stock repurchase program. As of
July 26, 2014
, the Company’s Board of Directors had authorized an aggregate repurchase of up to
$97 billion
of common stock under this program, and the remaining authorized repurchase amount was
$8.6 billion
, with no termination date. A summary of the stock repurchase activity under the stock repurchase program, reported based on the trade date, is summarized as follows (in millions, except per-share amounts):
|
Shares
Repurchased
|
Weighted-
Average Price
per Share
|
Amount
Repurchased
|
||||||||
|
Cumulative balance at July 28, 2012
|
3,740
|
|
$
|
20.36
|
|
$
|
76,133
|
|
||
|
Repurchase of common stock under the stock repurchase program
(1)
|
128
|
|
21.63
|
|
2,773
|
|
||||
|
Cumulative balance at July 27, 2013
|
3,868
|
|
20.40
|
|
78,906
|
|
||||
|
Repurchase of common stock under the stock repurchase program
(1)
|
420
|
|
22.71
|
|
9,539
|
|
||||
|
Cumulative balance at July 26, 2014
|
4,288
|
|
$
|
20.63
|
|
$
|
88,445
|
|
||
(1)
Includes stock repurchases of
$126 million
, which were pending settlement as of
July 26, 2014
. There were
no
stock repurchases pending settlement as of
July 27, 2013
.
The purchase price for the shares of the Company’s stock repurchased is reflected as a reduction to shareholders’ equity. The Company is required to allocate the purchase price of the repurchased shares as (i) a reduction to retained earnings and (ii) a reduction of common stock and additional paid-in capital. Issuance of common stock and the tax benefit related to employee stock incentive plans are recorded as an increase to common stock and additional paid-in capital.
|
(c)
|
Restricted Stock Unit Withholdings
|
For the years ended
July 26, 2014
and
July 27, 2013
, the Company repurchased approximately
18 million
and
16 million
shares, or
$430 million
and
$330 million
, of common stock, respectively, in settlement of employee tax withholding obligations due upon the vesting of restricted stock or stock units.
|
(d)
|
Preferred Stock
|
Under the terms of the Company’s Articles of Incorporation, the Board of Directors may determine the rights, preferences, and terms of the Company’s authorized but unissued shares of preferred stock.
|
14.
|
Employee Benefit Plans
|
|
(a)
|
Employee Stock Incentive Plans
|
Stock Incentive Plan Program Description
As of
July 26, 2014
, the Company had
four
stock incentive plans: the 2005 Stock Incentive Plan (the “2005 Plan”); the 1996 Stock Incentive Plan (the “1996 Plan”); the Cisco Systems, Inc. SA Acquisition Long-Term Incentive Plan (the “SA Acquisition Plan”); and the Cisco Systems, Inc. WebEx Acquisition Long-Term Incentive Plan (the “WebEx Acquisition Plan”). In addition, the Company has, in connection with the acquisitions of various companies, assumed the share-based awards granted under stock incentive plans of the acquired companies or issued share-based awards in replacement thereof. Share-based awards are designed to reward employees for their long-term contributions to the Company and provide incentives for them to remain with the Company. The number and frequency of share-based awards are based on competitive practices, operating results of the Company, government regulations, and other factors. Since the inception of the stock incentive plans, the Company has granted share-based awards to a significant percentage of its employees, and the majority has been granted to employees below the vice president level. The Company’s primary stock incentive plans are summarized as follows:
2005 Plan
As of
July 26, 2014
, the maximum number of shares issuable under the 2005 Plan over its term was
694 million
shares, plus the number of any shares underlying awards outstanding on November 15, 2007 under the 1996 Plan, the SA Acquisition Plan, and the WebEx Acquisition Plan that are forfeited or are terminated for any other reason before being
110
exercised or settled. If any awards granted under the 2005 Plan are forfeited or are terminated for any other reason before being exercised or settled, the unexercised or unsettled shares underlying the awards will again be available under the 2005 Plan. Starting November 19, 2013, shares withheld by the Company from an award other than a stock option or stock appreciation right to satisfy withholding tax liabilities resulting from such award will again be available for issuance, based on the fungible share ratio in effect on the date of grant.
Pursuant to an amendment approved by the Company’s shareholders on November 12, 2009, the number of shares available for issuance under the 2005 Plan is reduced by
1.5
shares for each share awarded as a stock grant or a stock unit, and any shares underlying awards outstanding under the 1996 Plan, the SA Acquisition Plan, and the WebEx Acquisition Plan that expire unexercised at the end of their maximum terms become available for reissuance under the 2005 Plan. The 2005 Plan permits the granting of stock options, restricted stock, and restricted stock units (RSUs), the vesting of which may be performance-based or market-based along with the requisite service requirement, and stock appreciation rights to employees (including employee directors and officers), consultants of the Company and its subsidiaries and affiliates, and non-employee directors of the Company. Stock options and stock appreciation rights granted under the 2005 Plan have an exercise price of at least
100%
of the fair market value of the underlying stock on the grant date and prior to November 12, 2009 have an expiration date no later than
nine years
from the grant date. The expiration date for stock options and stock appreciation rights granted subsequent to the amendment approved on November 12, 2009 shall be no later than
10 years
from the grant date.
The stock options will generally become exercisable for
20%
or
25%
of the option shares one year from the date of grant and then ratably over the following
48 months
or
36 months
, respectively. Time-based stock grants and time-based RSUs will generally vest with respect to
20%
or
25%
of the shares or share units covered by the grant on each of the first through fifth or fourth anniversaries of the date of the grant, respectively. Performance-based and market-based RSUs typically vest at the end of the
three
-year requisite service period or earlier if the award recipient meets certain retirement eligibility conditions. The Compensation and Management Development Committee of the Board of Directors has the discretion to use different vesting schedules. Stock appreciation rights may be awarded in combination with stock options or stock grants, and such awards shall provide that the stock appreciation rights will not be exercisable unless the related stock options or stock grants are forfeited. Stock grants may be awarded in combination with non-statutory stock options, and such awards may provide that the stock grants will be forfeited in the event that the related non-statutory stock options are exercised.
1996 Plan
The 1996 Plan expired on December 31, 2006, and the Company can no longer make equity awards under the 1996 Plan. The maximum number of shares issuable over the term of the 1996 Plan was
2.5 billion
shares. Stock options granted under the 1996 Plan have an exercise price of at least
100%
of the fair market value of the underlying stock on the grant date and expire no later than
nine
years from the grant date. The stock options generally became exercisable for
20%
or
25%
of the option shares one year from the date of grant and then ratably over the following
48 months
or
36 months
, respectively.
Certain other grants utilized a 60-month ratable vesting schedule. In addition, the Board of Directors, or other committees administering the 1996 Plan, had the discretion to use a different vesting schedule and did so from time to time.
Acquisition Plans
In connection with the Company’s acquisitions of Scientific-Atlanta, Inc. (“Scientific-Atlanta”) and WebEx Communications, Inc. (“WebEx”), the Company adopted the SA Acquisition Plan and the WebEx Acquisition Plan, respectively, each effective upon completion of the applicable acquisition. These plans constitute assumptions, amendments, restatements, and renamings of the 2003 Long-Term Incentive Plan of Scientific-Atlanta and the WebEx Communications, Inc. Amended and Restated 2000 Stock Incentive Plan, respectively. The plans permit the grant of stock options, stock, stock units, and stock appreciation rights to certain employees of the Company and its subsidiaries and affiliates who had been employed by Scientific-Atlanta or its subsidiaries or WebEx or its subsidiaries, as applicable. As a result of the shareholder approval of the amendment and extension of the 2005 Plan, as of November 15, 2007, the Company will no longer make stock option grants or direct share issuances under either the SA Acquisition Plan or the WebEx Acquisition Plan.
|
(b)
|
Employee Stock Purchase Plan
|
The Company has an Employee Stock Purchase Plan, which includes its subplan named the International Employee Stock Purchase Plan (together, the “Purchase Plan”), under which
471.4 million
shares of the Company’s common stock have been reserved for issuance as of
July 26, 2014
. Eligible employees are offered shares through a
24-month offering period, which consists of four consecutive 6-month purchase periods
. Employees may purchase a limited number of shares of the Company’s stock at a discount of up to
15%
of the lesser of the market value at the beginning of the offering period or the end of each 6-month purchase period. The Purchase Plan is scheduled to terminate on
January 3, 2020
. The Company issued
27 million
,
36 million
, and
35 million
shares under the Purchase Plan in
fiscal 2014, 2013, and 2012
, respectively. As of
July 26, 2014
,
25 million
shares were available for issuance under the Purchase Plan.
111
|
(c)
|
Summary of Share-Based Compensation Expense
|
Share-based compensation expense consists primarily of expenses for stock options, stock purchase rights, restricted stock, and restricted stock units granted to employees. The following table summarizes share-based compensation expense (in millions):
|
Years Ended
|
July 26, 2014
|
July 27, 2013
|
July 28, 2012
|
||||||||
|
Cost of sales—product
|
$
|
45
|
|
$
|
40
|
|
$
|
53
|
|
||
|
Cost of sales—service
|
150
|
|
138
|
|
156
|
|
|||||
|
Share-based compensation expense in cost of sales
|
195
|
|
178
|
|
209
|
|
|||||
|
Research and development
|
411
|
|
286
|
|
401
|
|
|||||
|
Sales and marketing
|
549
|
|
484
|
|
588
|
|
|||||
|
General and administrative
|
198
|
|
175
|
|
203
|
|
|||||
|
Restructuring and other charges
|
(5
|
)
|
(3
|
)
|
—
|
|
|||||
|
Share-based compensation expense in operating expenses
|
1,153
|
|
942
|
|
1,192
|
|
|||||
|
Total share-based compensation expense
|
$
|
1,348
|
|
$
|
1,120
|
|
$
|
1,401
|
|
||
|
Income tax benefit for share-based compensation
|
$
|
324
|
|
$
|
285
|
|
$
|
335
|
|
||
As of
July 26, 2014
, the total compensation cost related to unvested share-based awards not yet recognized was
$2.4 billion
, which is expected to be recognized over approximately
2.3
years on a weighted-average basis.
|
(d)
|
Share-Based Awards Available for Grant
|
A summary of share-based awards available for grant is as follows (in millions):
|
Years Ended
|
July 26, 2014
|
July 27, 2013
|
July 28, 2012
|
|||||
|
Balance at beginning of fiscal year
|
228
|
|
218
|
|
255
|
|
||
|
Restricted stock, stock units, and other share-based awards granted
|
(98
|
)
|
(102
|
)
|
(95
|
)
|
||
|
Share-based awards canceled/forfeited/expired
|
36
|
|
115
|
|
64
|
|
||
|
Additional shares reserved
|
135
|
|
—
|
|
—
|
|
||
|
Shares withheld for taxes and not issued
|
6
|
|
—
|
|
—
|
|
||
|
Other
|
3
|
|
(3
|
)
|
(6
|
)
|
||
|
Balance at end of fiscal year
|
310
|
|
228
|
|
218
|
|
||
As reflected in the preceding table, for each share awarded as restricted stock or subject to a restricted stock unit award under the 2005 Plan, an equivalent of
1.5
shares was deducted from the available share-based award balance. For restricted stock units that were awarded with vesting contingent upon the achievement of future financial performance or market-based metrics, the maximum awards that can be achieved upon full vesting of such awards were reflected in the preceding table.
112
|
(e)
|
Restricted Stock and Stock Unit Awards
|
A summary of the restricted stock and stock unit activity, which includes time-based and performance-based or market-based restricted stock units, is as follows (in millions, except per-share amounts):
|
Restricted Stock/
Stock Units
|
Weighted-Average
Grant Date Fair
Value per Share
|
Aggregated Fair
Market Value
|
||||||||
|
UNVESTED BALANCE AT JULY 30, 2011
|
116
|
|
$
|
21.50
|
|
|||||
|
Granted and assumed
|
65
|
|
17.45
|
|
||||||
|
Vested
|
(35
|
)
|
21.94
|
|
$
|
580
|
|
|||
|
Canceled/forfeited
|
(18
|
)
|
20.38
|
|
||||||
|
UNVESTED BALANCE AT JULY 28, 2012
|
128
|
|
19.46
|
|
||||||
|
Granted and assumed
|
72
|
|
18.52
|
|
||||||
|
Vested
|
(46
|
)
|
20.17
|
|
$
|
932
|
|
|||
|
Canceled/forfeited
|
(11
|
)
|
18.91
|
|
||||||
|
UNVESTED BALANCE AT JULY 27, 2013
|
143
|
|
18.80
|
|
||||||
|
Granted and assumed
|
72
|
|
20.85
|
|
||||||
|
Vested
|
(53
|
)
|
19.55
|
|
$
|
1,229
|
|
|||
|
Canceled/forfeited
|
(13
|
)
|
18.61
|
|
||||||
|
UNVESTED BALANCE AT JULY 26, 2014
|
149
|
|
$
|
19.54
|
|
|||||
|
(f)
|
Stock Option Awards
|
A summary of the stock option activity is as follows (in millions, except per-share amounts):
|
|
STOCK OPTIONS OUTSTANDING
|
|||||
|
|
Number
Outstanding
|
Weighted-Average
Exercise Price per Share
|
||||
|
BALANCE AT JULY 30, 2011
|
621
|
|
$
|
21.79
|
|
|
|
Assumed from acquisitions
|
1
|
|
2.08
|
|
||
|
Exercised
|
(66
|
)
|
13.51
|
|
||
|
Canceled/forfeited/expired
|
(36
|
)
|
23.40
|
|
||
|
BALANCE AT JULY 28, 2012
|
520
|
|
22.68
|
|
||
|
Assumed from acquisitions
|
10
|
|
0.77
|
|
||
|
Exercised
|
(154
|
)
|
18.51
|
|
||
|
Canceled/forfeited/expired
|
(100
|
)
|
22.18
|
|
||
|
BALANCE AT JULY 27, 2013
|
276
|
|
24.44
|
|
||
|
Assumed from acquisitions
|
6
|
|
3.60
|
|
||
|
Exercised
|
(78
|
)
|
18.30
|
|
||
|
Canceled/forfeited/expired
|
(17
|
)
|
27.53
|
|
||
|
BALANCE AT JULY 26, 2014
|
187
|
|
$
|
26.03
|
|
|
The total pretax intrinsic value of stock options exercised during
fiscal 2014, 2013, and 2012
was
$458 million
,
$661 million
, and
$333 million
, respectively.
113
The following table summarizes significant ranges of outstanding and exercisable stock options as of
July 26, 2014
(in millions, except years and share prices):
The aggregate intrinsic value in the preceding table represents the total pretax intrinsic value, based on the Company’s closing stock price of
$25.97
as of July 25, 2014, that would have been received by the option holders had those option holders exercised their stock options as of that date. The total number of in-the-money stock options exercisable as of
July 26, 2014
was
94 million
. As of
July 27, 2013
,
271 million
outstanding stock options were exercisable and the weighted-average exercise price was
$24.84
.
|
|
STOCK OPTIONS OUTSTANDING
|
STOCK OPTIONS EXERCISABLE
|
||||||||||||||||||||||
|
Range of Exercise Prices
|
Number
Outstanding
|
Weighted-
Average
Remaining
Contractual
Life
(in Years)
|
Weighted-
Average
Exercise
Price per
Share
|
Aggregate
Intrinsic
Value
|
Number
Exercisable
|
Weighted-
Average
Exercise
Price per
Share
|
Aggregate
Intrinsic
Value
|
|||||||||||||||||
|
$ 0.01 – 15.00
|
8
|
|
5.2
|
$
|
4.00
|
|
$
|
172
|
|
4
|
|
$
|
5.54
|
|
$
|
85
|
|
|||||||
|
15.01 – 18.00
|
11
|
|
0.3
|
17.79
|
|
93
|
|
11
|
|
17.79
|
|
93
|
|
|||||||||||
|
18.01 – 20.00
|
3
|
|
0.7
|
19.38
|
|
20
|
|
3
|
|
19.38
|
|
20
|
|
|||||||||||
|
20.01 – 25.00
|
62
|
|
1.2
|
22.86
|
|
192
|
|
62
|
|
22.86
|
|
192
|
|
|||||||||||
|
25.01 – 30.00
|
27
|
|
1.9
|
26.59
|
|
4
|
|
27
|
|
26.59
|
|
4
|
|
|||||||||||
|
30.01 – 35.00
|
76
|
|
2.0
|
32.16
|
|
—
|
|
76
|
|
32.16
|
|
—
|
|
|||||||||||
|
Total
|
187
|
|
1.7
|
$
|
26.03
|
|
$
|
481
|
|
183
|
|
$
|
26.50
|
|
$
|
394
|
|
|||||||
|
(g)
|
Valuation of Employee Share-Based Awards
|
Time-based restricted stock units and performance-based restricted stock units (PRSUs) that are based on the Company’s financial performance metrics or non-financial operating goals are valued using the market value of the Company’s common stock on the date of grant, discounted for the present value of expected dividends. On the date of grant, the Company estimated the fair value of the total shareholder return (TSR) component of the PRSUs using a Monte Carlo simulation model. The assumptions for the valuation of time-based RSUs and PRSUs are summarized as follows:
|
|
RESTRICTED STOCK UNITS
|
||||||||||
|
Years Ended
|
July 26, 2014
|
|
July 27, 2013
|
|
July 28, 2012
|
||||||
|
Number of shares granted (in millions)
|
56
|
|
|
64
|
|
|
62
|
|
|||
|
Grant date fair value per share
|
$
|
20.61
|
|
|
$
|
18.39
|
|
|
$
|
17.26
|
|
|
Weighted-average assumptions/inputs:
|
|||||||||||
|
Expected dividend yield
|
3.1
|
%
|
|
3.0
|
%
|
|
1.5
|
%
|
|||
|
Range of risk-free interest rates
|
0.0%
–
1.7%
|
|
|
0.0% – 1.1%
|
|
|
0.0% – 1.1%
|
|
|||
|
PERFORMANCE RESTRICTED STOCK UNITS
|
|||||||||||
|
Years Ended
|
July 26, 2014
|
July 27, 2013
|
July 28, 2012
|
||||||||
|
Number of shares granted (in millions)
|
7
|
|
4
|
|
2
|
|
|||||
|
Grant date fair value per share
|
$
|
21.90
|
|
$
|
19.73
|
|
$
|
22.17
|
|
||
|
Weighted-average assumptions/inputs:
|
|||||||||||
|
Expected dividend yield
|
3.0
|
%
|
2.9
|
%
|
1.3
|
%
|
|||||
|
Range of risk-free interest rates
|
0.0%
–
1.7%
|
|
0.1% – 0.7%
|
|
0.0% – 0.9%
|
|
|||||
|
Range of expected volatilities for index
|
14.2% – 70.5%
|
|
18.3% – 78.3%
|
|
19.8% – 60.8%
|
|
|||||
The PRSUs granted during
fiscal 2014, 2013, and 2012
are contingent on the achievement of the Company’s financial performance metrics, its comparative market-based returns, or the achievement of non-financial operating goals. For the awards based on financial performance metrics or its comparative market-based returns, generally
50%
of the PRSUs are earned based on the average of annual operating cash flow and earnings per share goals established at the beginning of each fiscal year over a three-year performance period. Generally, the remaining
50%
of the PRSUs are earned based on the Company’s TSR measured against the benchmark TSR of a peer group over the same period. Each PRSU recipient could vest in
0%
to
150%
of the target shares granted contingent on the achievement of the Company's financial performance metrics or its comparative market-based returns, and
0%
or
100%
of the target shares granted contingent on the achievement of non-financial operating goals.
114
The assumptions for the valuation of employee stock purchase rights are summarized as follows:
|
|
EMPLOYEE STOCK PURCHASE RIGHTS
|
||||||||||
|
Years Ended
|
July 26, 2014
|
July 27, 2013
|
July 28, 2012
|
||||||||
|
Weighted-average assumptions:
|
|||||||||||
|
Expected volatility
|
25.1
|
%
|
28.7
|
%
|
27.2
|
%
|
|||||
|
Risk-free interest rate
|
0.1
|
%
|
0.4
|
%
|
0.2
|
%
|
|||||
|
Expected dividend
|
2.8
|
%
|
1.5
|
%
|
1.5
|
%
|
|||||
|
Expected life (in years)
|
0.8
|
|
1.8
|
|
0.8
|
|
|||||
|
Weighted-average estimated grant date fair value per share
|
$
|
5.54
|
|
$
|
4.68
|
|
$
|
3.81
|
|
||
The valuation of employee stock purchase rights and the related assumptions are for the employee stock purchases made during the respective fiscal years.
The Company uses third-party analyses to assist in developing the assumptions used in, as well as calibrating, its lattice-binomial and Black-Scholes models. The Company is responsible for determining the assumptions used in estimating the fair value of its share-based payment awards.
The Company used the implied volatility for traded options (with contract terms corresponding to the expected life of the employee stock purchase rights) on the Company’s stock as the expected volatility assumption required in the Black-Scholes model. The implied volatility is more representative of future stock price trends than historical volatility. The risk-free interest rate assumption is based upon observed interest rates appropriate for the term of the Company’s employee stock purchase rights. The dividend yield assumption is based on the history and expectation of dividend payouts at the grant date.
|
(h)
|
Employee 401(k) Plans
|
The Company sponsors the Cisco Systems, Inc. 401(k) Plan (the “Plan”) to provide retirement benefits for its employees. As allowed under Section 401(k) of the Internal Revenue Code, the Plan provides for tax-deferred salary contributions and after-tax contributions for eligible employees. The Plan allows employees to contribute from
1%
to
75%
of their annual compensation to the Plan on a pretax and after-tax basis including Roth contributions. Employee contributions are limited to a maximum annual amount as set periodically by the Internal Revenue Code. The Company matches pretax employee contributions up to
100%
of the first
4.5%
of eligible earnings that are contributed by employees. Therefore, the maximum matching contribution that the Company may allocate to each participant’s account will not exceed
$11,700
for the 2014 calendar year due to the
$260,000
annual limit on eligible earnings imposed by the Internal Revenue Code. All matching contributions vest immediately. The Company’s matching contributions to the Plan totaled
$236 million
,
$234 million
, and
$231 million
in
fiscal 2014, 2013, and 2012
, respectively.
The Plan allows employees who meet the age requirements and reach the Plan contribution limits to make a catch-up contribution not to exceed the lesser of
75%
of their eligible compensation or the limit set forth in the Internal Revenue Code. The catch-up contributions are not eligible for matching contributions. In addition, the Plan provides for discretionary profit-sharing contributions as determined by the Board of Directors. Such contributions to the Plan are allocated among eligible participants in the proportion of their salaries to the total salaries of all participants. There were no discretionary profit-sharing contributions made in
fiscal 2014, 2013, and 2012
.
The Company also sponsors other 401(k) plans that arose from acquisitions of other companies. The Company’s contributions to these plans were not material to the Company on either an individual or aggregate basis for any of the fiscal years presented.
|
(i)
|
Deferred Compensation Plans
|
The Cisco Systems, Inc. Deferred Compensation Plan (the “Deferred Compensation Plan”), a nonqualified deferred compensation plan, became effective in 2007. As required by applicable law, participation in the Deferred Compensation Plan is limited to a select group of the Company’s management employees. Under the Deferred Compensation Plan, which is an unfunded and unsecured deferred compensation arrangement, a participant may elect to defer base salary, bonus, and/or commissions, pursuant to such rules as may be established by the Company, up to the maximum percentages for each deferral election as described in the plan. The Company may also, at its discretion, make a matching contribution to the employee under the Deferred Compensation Plan. A matching contribution equal to
4.5%
of eligible compensation in excess of the Internal Revenue Code limit for qualified plans for calendar year 2014 that is deferred by participants under the Deferred Compensation Plan (with a
$1.5 million
cap on eligible compensation) will be made to eligible participants’ accounts at the end of calendar year 2014. The deferred compensation liability under the Deferred Compensation Plan, together with a deferred compensation plan assumed from Scientific-Atlanta, was approximately
$509 million
and
$441 million
as of
July 26, 2014
and
July 27, 2013
, respectively, and was recorded primarily in other long-term liabilities.
115
|
15.
|
Comprehensive Income
|
The components of AOCI, net of tax, and the other comprehensive income (loss), excluding noncontrolling interest are summarized as follows (in millions):
|
Net Unrealized Gains on Investments
|
Net Unrealized Gains (Losses) Cash Flow Hedging Instruments
|
Cumulative Translation Adjustment and Other
|
Accumulated Other Comprehensive Income
|
||||||||||||
|
BALANCE AT JULY 30, 2011
|
$
|
487
|
|
$
|
6
|
|
$
|
801
|
|
$
|
1,294
|
|
|||
|
Other comprehensive income (loss) before reclassifications attributable to Cisco Systems, Inc.
|
(19
|
)
|
(131
|
)
|
(532
|
)
|
(682
|
)
|
|||||||
|
(Gains) losses reclassified out of other comprehensive income
|
(101
|
)
|
72
|
|
—
|
|
(29
|
)
|
|||||||
|
Tax benefit (expense)
|
42
|
|
—
|
|
36
|
|
78
|
|
|||||||
|
BALANCE AT JULY 28, 2012
|
409
|
|
(53
|
)
|
305
|
|
661
|
|
|||||||
|
Other comprehensive income (loss) before reclassifications attributable to Cisco Systems, Inc.
|
3
|
|
74
|
|
(83
|
)
|
(6
|
)
|
|||||||
|
(Gains) losses reclassified out of other comprehensive income
|
(48
|
)
|
(12
|
)
|
—
|
|
(60
|
)
|
|||||||
|
Tax benefit (expense)
|
15
|
|
(1
|
)
|
(1
|
)
|
13
|
|
|||||||
|
BALANCE AT JULY 27, 2013
|
379
|
|
8
|
|
221
|
|
608
|
|
|||||||
|
Other comprehensive income (loss) before reclassifications attributable to Cisco Systems, Inc.
|
380
|
|
48
|
|
49
|
|
477
|
|
|||||||
|
(Gains) losses reclassified out of other comprehensive income
|
(300
|
)
|
(68
|
)
|
—
|
|
(368
|
)
|
|||||||
|
Tax benefit (expense)
|
(35
|
)
|
—
|
|
(5
|
)
|
(40
|
)
|
|||||||
|
BALANCE AT JULY 26, 2014
|
$
|
424
|
|
$
|
(12
|
)
|
$
|
265
|
|
$
|
677
|
|
|||
The net gains (losses) reclassified out of other comprehensive income into the Consolidated Statements of Operations, with line item location, during each period were as follows (in millions):
|
July 26, 2014
|
July 27, 2013
|
July 28, 2012
|
||||||||||||
|
Comprehensive Income Components
|
Income Before Taxes
|
Line Item in Statements of Operations
|
||||||||||||
|
Net unrealized gains on available-for-sale investments
|
||||||||||||||
|
$
|
300
|
|
$
|
48
|
|
$
|
101
|
|
Other income (loss), net
|
|||||
|
Net unrealized gains and losses on cash flow hedging instruments:
|
||||||||||||||
|
Foreign currency derivatives
|
55
|
|
10
|
|
(59
|
)
|
Operating expenses
|
|||||||
|
Foreign currency derivatives
|
13
|
|
2
|
|
(14
|
)
|
Cost of sales—service
|
|||||||
|
Interest rate derivatives
|
—
|
|
—
|
|
1
|
|
Interest expense
|
|||||||
|
68
|
|
12
|
|
(72
|
)
|
|||||||||
|
Total amounts reclassified out of other comprehensive income
|
$
|
368
|
|
$
|
60
|
|
$
|
29
|
|
|||||
116
|
16.
|
Income Taxes
|
|
(a)
|
Provision for Income Taxes
|
The provision for income taxes consists of the following (in millions):
|
Years Ended
|
July 26, 2014
|
July 27, 2013
|
July 28, 2012
|
||||||||
|
Federal:
|
|||||||||||
|
Current
|
$
|
1,672
|
|
$
|
601
|
|
$
|
1,836
|
|
||
|
Deferred
|
(383
|
)
|
152
|
|
(270
|
)
|
|||||
|
1,289
|
|
753
|
|
1,566
|
|
||||||
|
State:
|
|||||||||||
|
Current
|
176
|
|
81
|
|
119
|
|
|||||
|
Deferred
|
(64
|
)
|
48
|
|
(53
|
)
|
|||||
|
112
|
|
129
|
|
66
|
|
||||||
|
Foreign:
|
|||||||||||
|
Current
|
692
|
|
599
|
|
477
|
|
|||||
|
Deferred
|
(231
|
)
|
(237
|
)
|
9
|
|
|||||
|
461
|
|
362
|
|
486
|
|
||||||
|
Total
|
$
|
1,862
|
|
$
|
1,244
|
|
$
|
2,118
|
|
||
Income before provision for income taxes consists of the following (in millions):
|
Years Ended
|
July 26, 2014
|
July 27, 2013
|
July 28, 2012
|
||||||||
|
United States
|
$
|
2,734
|
|
$
|
3,716
|
|
$
|
3,235
|
|
||
|
International
|
6,981
|
|
7,511
|
|
6,924
|
|
|||||
|
Total
|
$
|
9,715
|
|
$
|
11,227
|
|
$
|
10,159
|
|
||
The items accounting for the difference between income taxes computed at the federal statutory rate and the provision for income taxes consist of the following:
|
Years Ended
|
July 26, 2014
|
July 27, 2013
|
July 28, 2012
|
|||||
|
Federal statutory rate
|
35.0
|
%
|
35.0
|
%
|
35.0
|
%
|
||
|
Effect of:
|
||||||||
|
State taxes, net of federal tax benefit
|
0.5
|
|
0.8
|
|
0.4
|
|
||
|
Foreign income at other than U.S. rates
|
(16.4
|
)
|
(16.4
|
)
|
(15.6
|
)
|
||
|
Tax credits
|
(0.7
|
)
|
(1.6
|
)
|
(0.4
|
)
|
||
|
Domestic manufacturing deduction
|
(0.9
|
)
|
(1.0
|
)
|
(1.1
|
)
|
||
|
Nondeductible compensation
|
3.3
|
|
1.3
|
|
1.8
|
|
||
|
Tax audit settlement
|
—
|
|
(7.1
|
)
|
—
|
|
||
|
Other, net
|
(1.6
|
)
|
0.1
|
|
0.7
|
|
||
|
Total
|
19.2
|
%
|
|
11.1
|
%
|
20.8
|
%
|
|
During fiscal 2013, the Internal Revenue Service (IRS) and the Company settled all outstanding items related to the audit of the Company’s federal income tax returns for the fiscal years ended July 27, 2002 through July 28, 2007. As a result of the settlement, the Company recognized a net benefit to the provision for income taxes of
$794 million
. In addition, the American Taxpayer Relief Act reinstated the U.S. federal R&D credit through December 2013, retroactive to January 1, 2012. As a result, the tax provision in fiscal 2013 included a tax benefit of
$184 million
related to the U.S. federal R&D tax credit, of which
$72 million
was attributable to fiscal 2012.
U.S. income taxes and foreign withholding taxes associated with the repatriation of earnings of foreign subsidiaries were not provided for on a cumulative total of
$52.7 billion
of undistributed earnings for certain foreign subsidiaries as of the end of fiscal 2014. The Company intends to reinvest these earnings indefinitely in its foreign subsidiaries. If these earnings were distributed to the United States in the form of dividends or otherwise, or if the shares of the relevant foreign subsidiaries were sold or otherwise transferred, the Company would be subject to additional U.S. income taxes (subject to an adjustment for
117
foreign tax credits) and foreign withholding taxes. Determination of the amount of unrecognized deferred income tax liability related to these earnings is not practicable.
As a result of certain employment and capital investment actions, the Company’s income in certain foreign countries is subject to reduced tax rates and in some cases is wholly exempt from taxes. A portion of these tax incentives will expire at the end of fiscal 2015, and the majority of the remaining balance will expire at the end of fiscal 2025. The gross income tax benefit attributable to tax incentives was estimated to be
$1.3 billion
(
$0.25
per diluted share) in fiscal 2014, of which approximately
$0.5 billion
(
$0.10
per diluted share) is based on tax incentives that will expire at the end of fiscal 2015. As of the end of fiscal 2013 and fiscal 2012, the gross income tax benefits attributable to tax incentives were estimated to be
$1.4 billion
and
$1.3 billion
(
$0.26
and
$0.24
per diluted share) for each of the respective years. The gross income tax benefits were partially offset by accruals of U.S. income taxes on undistributed earnings.
Unrecognized Tax Benefits
The aggregate changes in the balance of gross unrecognized tax benefits were as follows (in millions):
|
Years Ended
|
July 26, 2014
|
July 27, 2013
|
July 28, 2012
|
||||||||
|
Beginning balance
|
$
|
1,775
|
|
$
|
2,819
|
|
$
|
2,948
|
|
||
|
Additions based on tax positions related to the current year
|
262
|
|
138
|
|
155
|
|
|||||
|
Additions for tax positions of prior years
|
64
|
|
187
|
|
54
|
|
|||||
|
Reductions for tax positions of prior years
|
(13
|
)
|
(1,027
|
)
|
(226
|
)
|
|||||
|
Settlements
|
(17
|
)
|
(199
|
)
|
(41
|
)
|
|||||
|
Lapse of statute of limitations
|
(133
|
)
|
(143
|
)
|
(71
|
)
|
|||||
|
Ending balance
|
$
|
1,938
|
|
$
|
1,775
|
|
$
|
2,819
|
|
||
As of July 26, 2014,
$1.7 billion
of the unrecognized tax benefits would affect the effective tax rate if realized. During fiscal 2014 the Company recognized
$29 million
of net interest expense and
$8 million
of penalties. During fiscal 2013, the Company recognized
$115 million
of net interest expense and
$2 million
of penalties. During fiscal 2012, the Company recognized
$146 million
of net interest expense and
$21 million
of penalties. The Company’s total accrual for interest and penalties was
$304 million
,
$268 million
, and
$381 million
as of the end of fiscal 2014, 2013, and 2012, respectively. The Company is no longer subject to U.S. federal income tax audit for returns covering tax years through fiscal 2007. With limited exceptions, the Company is no longer subject to foreign, state, or local income tax audits for returns covering tax years through fiscal 2002.
The Company regularly engages in discussions and negotiations with tax authorities regarding tax matters in various jurisdictions. The Company believes it is reasonably possible that certain federal, foreign, and state tax matters may be concluded in the next 12 months. Specific positions that may be resolved include issues involving transfer pricing and various other matters. The Company estimates that the unrecognized tax benefits at
July 26, 2014
could be reduced by approximately
$300 million
in the next 12 months.
|
(b)
|
Deferred Tax Assets and Liabilities
|
The following table presents the breakdown between current and noncurrent net deferred tax assets (in millions):
|
July 26, 2014
|
July 27, 2013
|
||||||
|
Deferred tax assets—current
|
$
|
2,808
|
|
$
|
2,616
|
|
|
|
Deferred tax liabilities—current
|
(134
|
)
|
(114
|
)
|
|||
|
Deferred tax assets—noncurrent
|
1,700
|
|
1,539
|
|
|||
|
Deferred tax liabilities—noncurrent
|
(369
|
)
|
(399
|
)
|
|||
|
Total net deferred tax assets
|
$
|
4,005
|
|
$
|
3,642
|
|
|
118
The components of the deferred tax assets and liabilities are as follows (in millions):
|
July 26, 2014
|
July 27, 2013
|
||||||
|
ASSETS
|
|||||||
|
Allowance for doubtful accounts and returns
|
$
|
464
|
|
$
|
390
|
|
|
|
Sales-type and direct-financing leases
|
231
|
|
167
|
|
|||
|
Inventory write-downs and capitalization
|
307
|
|
216
|
|
|||
|
Investment provisions
|
212
|
|
214
|
|
|||
|
IPR&D, goodwill, and purchased intangible assets
|
135
|
|
123
|
|
|||
|
Deferred revenue
|
1,689
|
|
1,624
|
|
|||
|
Credits and net operating loss carryforwards
|
796
|
|
681
|
|
|||
|
Share-based compensation expense
|
661
|
|
783
|
|
|||
|
Accrued compensation
|
496
|
|
486
|
|
|||
|
Other
|
676
|
|
560
|
|
|||
|
Gross deferred tax assets
|
5,667
|
|
5,244
|
|
|||
|
Valuation allowance
|
(114
|
)
|
(98
|
)
|
|||
|
Total deferred tax assets
|
5,553
|
|
5,146
|
|
|||
|
LIABILITIES
|
|||||||
|
Purchased intangible assets
|
(1,229
|
)
|
(1,101
|
)
|
|||
|
Depreciation
|
(48
|
)
|
(169
|
)
|
|||
|
Unrealized gains on investments
|
(245
|
)
|
(211
|
)
|
|||
|
Other
|
(26
|
)
|
(23
|
)
|
|||
|
Total deferred tax liabilities
|
(1,548
|
)
|
(1,504
|
)
|
|||
|
Total net deferred tax assets
|
$
|
4,005
|
|
$
|
3,642
|
|
|
As of
July 26, 2014
, the Company’s federal, state, and foreign net operating loss carryforwards for income tax purposes were
$233 million
,
$658 million
, and
$699 million
, respectively. A significant amount of the federal net operating loss carryforwards relates to acquisitions and, as a result, is limited in the amount that can be recognized in any one year. If not utilized, the federal net operating loss will begin to expire in fiscal
2018
, and the foreign and state net operating loss carryforwards will begin to expire in fiscal
2015
. The Company has provided a valuation allowance of
$71 million
for deferred tax assets related to foreign net operating losses that are not expected to be realized.
As of July 26, 2014, the Company’s federal, state, and foreign tax credit carryforwards for income tax purposes were approximately
$8 million
,
$710 million
, and
$13 million
, respectively. The federal and foreign tax credit carryforwards will begin to expire in fiscal
2014
and
2027
, respectively. The majority of state tax credits can be carried forward indefinitely; however, the Company has provided a valuation allowance of
$43 million
for deferred tax assets related to state tax credits that are not expected to be realized.
|
17.
|
Segment Information and Major Customers
|
|
(a)
|
Revenue and Gross Margin by Segment
|
The Company conducts business globally and is primarily managed on a geographic basis consisting of
three
segments: the Americas, EMEA, and APJC. The Company’s management makes financial decisions and allocates resources based on the information it receives from its internal management system. Sales are attributed to a segment based on the ordering location of the customer. The Company does not allocate research and development, sales and marketing, or general and administrative expenses to its segments in this internal management system because management does not include the information in its measurement of the performance of the operating segments. In addition, the Company does not allocate amortization and impairment of acquisition-related intangible assets, share-based compensation expense, significant litigation and other contingencies, impacts to cost of sales from purchase accounting adjustments to inventory, charges related to asset impairments and restructurings, and certain other charges to the gross margin for each segment because management does not include this information in its measurement of the performance of the operating segments.
119
Summarized financial information by segment for
fiscal 2014, 2013, and 2012
, based on the Company’s internal management system and as utilized by the Company’s Chief Operating Decision Maker (“CODM”), is as follows (in millions):
|
Years Ended
|
July 26, 2014
|
July 27, 2013
|
July 28, 2012
|
||||||||
|
Revenue:
|
|||||||||||
|
Americas
|
$
|
27,781
|
|
$
|
28,639
|
|
$
|
26,501
|
|
||
|
EMEA
|
12,006
|
|
12,210
|
|
12,075
|
|
|||||
|
APJC
|
7,355
|
|
7,758
|
|
7,485
|
|
|||||
|
Total
|
$
|
47,142
|
|
$
|
48,607
|
|
$
|
46,061
|
|
||
|
Gross margin:
|
|||||||||||
|
Americas
|
$
|
17,379
|
|
$
|
17,887
|
|
$
|
16,639
|
|
||
|
EMEA
|
7,700
|
|
7,876
|
|
7,605
|
|
|||||
|
APJC
|
4,252
|
|
4,637
|
|
4,519
|
|
|||||
|
Segment total
|
29,331
|
|
30,400
|
|
28,763
|
|
|||||
|
Unallocated corporate items
|
(1,562
|
)
|
(960
|
)
|
(554
|
)
|
|||||
|
Total
|
$
|
27,769
|
|
$
|
29,440
|
|
$
|
28,209
|
|
||
Revenue in the United States was
$24.3 billion
,
$24.6 billion
, and
$22.6 billion
for
fiscal 2014, 2013, and 2012
, respectively.
|
(b)
|
Revenue for Groups of Similar Products and Services
|
The Company designs, manufactures, and sells Internet Protocol (IP)-based networking and other products related to the communications and IT industry and provides services associated with these products and their use. The Company groups its products and technologies into the following categories: Switching, NGN Routing, Service Provider Video, Collaboration, Data Center, Wireless, Security, and Other Products. These products, primarily integrated by Cisco IOS Software, link geographically dispersed local-area networks (LANs), metropolitan-area networks (MANs), and wide-area networks (WANs).
The following table presents revenue for groups of similar products and services (in millions):
|
Years Ended
|
July 26, 2014
|
July 27, 2013
|
July 28, 2012
|
||||||||
|
Revenue:
|
|||||||||||
|
Switching
|
$
|
14,056
|
|
$
|
14,767
|
|
$
|
14,634
|
|
||
|
NGN Routing
|
7,662
|
|
8,243
|
|
8,395
|
|
|||||
|
Service Provider Video
|
3,969
|
|
4,855
|
|
3,869
|
|
|||||
|
Collaboration
|
3,734
|
|
3,956
|
|
4,194
|
|
|||||
|
Data Center
|
2,640
|
|
2,074
|
|
1,298
|
|
|||||
|
Wireless
|
2,265
|
|
2,228
|
|
1,697
|
|
|||||
|
Security
|
1,566
|
|
1,348
|
|
1,341
|
|
|||||
|
Other
|
280
|
|
558
|
|
898
|
|
|||||
|
Product
|
36,172
|
|
38,029
|
|
36,326
|
|
|||||
|
Service
|
10,970
|
|
10,578
|
|
9,735
|
|
|||||
|
Total
|
$
|
47,142
|
|
$
|
48,607
|
|
$
|
46,061
|
|
||
The Company has made certain reclassifications to the product revenue amounts for prior years to conform to the current year’s presentation.
120
|
(c)
|
Additional Segment Information
|
The majority of the Company’s assets, excluding cash and cash equivalents and investments, as of
July 26, 2014
and
July 27, 2013
were attributable to its U.S. operations. The Company’s total cash and cash equivalents and investments held by various foreign subsidiaries were
$47.4 billion
and
$40.4 billion
as of
July 26, 2014
and
July 27, 2013
, respectively, and the remaining
$4.7 billion
and
$10.2 billion
at the respective fiscal year ends were available in the United States. In
fiscal 2014, 2013, and 2012
,
no
single customer accounted for
10%
or more of the Company’s revenue.
Property and equipment information is based on the physical location of the assets. The following table presents property and equipment information for geographic areas (in millions):
|
July 26, 2014
|
July 27, 2013
|
July 28, 2012
|
|||||||||
|
Property and equipment, net:
|
|||||||||||
|
United States
|
$
|
2,697
|
|
$
|
2,780
|
|
$
|
2,842
|
|
||
|
International
|
555
|
|
542
|
|
560
|
|
|||||
|
Total
|
$
|
3,252
|
|
$
|
3,322
|
|
$
|
3,402
|
|
||
|
18.
|
Net Income per Share
|
The following table presents the calculation of basic and diluted net income per share (in millions, except per-share amounts):
|
Years Ended
|
July 26, 2014
|
July 27, 2013
|
July 28, 2012
|
||||||||
|
Net income
|
$
|
7,853
|
|
$
|
9,983
|
|
$
|
8,041
|
|
||
|
Weighted-average shares—basic
|
5,234
|
|
5,329
|
|
5,370
|
|
|||||
|
Effect of dilutive potential common shares
|
47
|
|
51
|
|
34
|
|
|||||
|
Weighted-average shares—diluted
|
5,281
|
|
5,380
|
|
5,404
|
|
|||||
|
Net income per share—basic
|
$
|
1.50
|
|
$
|
1.87
|
|
$
|
1.50
|
|
||
|
Net income per share—diluted
|
$
|
1.49
|
|
$
|
1.86
|
|
$
|
1.49
|
|
||
|
Antidilutive employee share-based awards, excluded
|
254
|
|
407
|
|
591
|
|
|||||
Employee equity share options, unvested shares, and similar equity instruments granted by the Company are treated as potential common shares outstanding in computing diluted earnings per share. Diluted shares outstanding include the dilutive effect of in-the-money options, unvested restricted stock, and restricted stock units. The dilutive effect of such equity awards is calculated based on the average share price for each fiscal period using the treasury stock method. Under the treasury stock method, the amount the employee must pay for exercising stock options, the amount of compensation cost for future service that the Company has not yet recognized, and the amount of tax benefits that would be recorded in additional paid-in capital when the award becomes deductible are collectively assumed to be used to repurchase shares.
121
Supplementary Financial Data (Unaudited)
(in millions, except per-share amounts)
|
Quarters Ended
|
July 26, 2014
|
April 26, 2014
|
January 25, 2014
(1)
|
October 26, 2013
|
|||||||||||
|
Revenue
|
$
|
12,357
|
|
$
|
11,545
|
|
$
|
11,155
|
|
$
|
12,085
|
|
|||
|
Gross margin
|
$
|
7,405
|
|
$
|
7,006
|
|
$
|
5,951
|
|
$
|
7,407
|
|
|||
|
Operating income
|
$
|
2,681
|
|
$
|
2,542
|
|
$
|
1,667
|
|
$
|
2,455
|
|
|||
|
Net income
|
$
|
2,247
|
|
$
|
2,181
|
|
$
|
1,429
|
|
$
|
1,996
|
|
|||
|
Net income per share - basic
|
$
|
0.44
|
|
$
|
0.42
|
|
$
|
0.27
|
|
$
|
0.37
|
|
|||
|
Net income per share - diluted
|
$
|
0.43
|
|
$
|
0.42
|
|
$
|
0.27
|
|
$
|
0.37
|
|
|||
|
Cash dividends declared per common share
|
$
|
0.19
|
|
$
|
0.19
|
|
$
|
0.17
|
|
$
|
0.17
|
|
|||
|
Cash and cash equivalents and investments
|
$
|
52,074
|
|
$
|
50,469
|
|
$
|
47,065
|
|
$
|
48,201
|
|
|||
|
Quarters Ended
|
July 27, 2013
|
April 27, 2013
|
January 26, 2013
(2)
|
October 27, 2012
|
|||||||||||
|
Revenue
|
$
|
12,417
|
|
$
|
12,216
|
|
$
|
12,098
|
|
$
|
11,876
|
|
|||
|
Gross margin
|
$
|
7,347
|
|
$
|
7,511
|
|
$
|
7,343
|
|
$
|
7,239
|
|
|||
|
Operating income
|
$
|
2,814
|
|
$
|
2,942
|
|
$
|
2,789
|
|
$
|
2,651
|
|
|||
|
Net income
|
$
|
2,270
|
|
$
|
2,478
|
|
$
|
3,143
|
|
$
|
2,092
|
|
|||
|
Net income per share - basic
|
$
|
0.42
|
|
$
|
0.47
|
|
$
|
0.59
|
|
$
|
0.39
|
|
|||
|
Net income per share - diluted
|
$
|
0.42
|
|
$
|
0.46
|
|
$
|
0.59
|
|
$
|
0.39
|
|
|||
|
Cash dividends declared per common share
|
$
|
0.17
|
|
$
|
0.17
|
|
$
|
0.14
|
|
$
|
0.14
|
|
|||
|
Cash and cash equivalents and investments
|
$
|
50,610
|
|
$
|
47,388
|
|
$
|
46,376
|
|
$
|
45,000
|
|
|||
|
(1)
|
In the second quarter of fiscal 2014, the Company recorded a pre-tax charge of
$655 million
to product cost of sales, which corresponds to
$526 million
, net of tax, for the expected remediation cost for certain products sold in prior fiscal years containing memory components manufactured by a single supplier between 2005 and 2010. See Note 12(f) to the Consolidated Financial Statements.
|
|
(2)
|
In the second quarter of fiscal 2013, the IRS and the Company settled all outstanding items related to the Company’s federal income tax returns for the fiscal years ended July 27, 2002 through July 28, 2007. As a result of the settlement, the Company recorded a net tax benefit of
$794 million
. Also during the three months ended January 26, 2013, the American Taxpayer Relief Act of 2012 reinstated the U.S. federal R&D tax credit, retroactive to January 1, 2012. As a result of the credit, the Company recognized tax benefits of
$184 million
in fiscal 2013, of which
$72 million
related to fiscal 2012 R&D expenses.
|
|
Item 9.
|
Changes in and Disagreements with Accountants on Accounting and Financial Disclosures
|
None.
|
Item 9A.
|
Controls and Procedures
|
Evaluation of Disclosure Controls and Procedures
Based on our management’s evaluation (with the participation of our principal executive officer and principal financial officer), as of the end of the period covered by this report, our principal executive officer and principal financial officer have concluded that our disclosure controls and procedures (as defined in Rules 13a-15(e) and 15d-15(e) under the Securities Exchange Act of 1934, as amended, (the “Exchange Act”)) are effective to ensure that information required to be disclosed by us in reports that we file or submit under the Exchange Act is recorded, processed, summarized and reported within the time periods specified in Securities and Exchange Commission rules and forms and is accumulated and communicated to our management, including our principal executive officer and principal financial officer, as appropriate to allow timely decisions regarding required disclosure.
122
Internal Control over Financial Reporting
Management’s report on our internal control over financial reporting and the report of our independent registered public accounting firm on our internal control over financial reporting are set forth, respectively, on page 72 under the caption “Management’s Report on Internal Control Over Financial Reporting” and on page 71 of this report.
There was no change in our internal control over financial reporting during our fourth quarter of fiscal
2014
that has materially affected, or is reasonably likely to materially affect, our internal control over financial reporting.
|
Item 9B.
|
Other Information
|
None.
|
Item 10.
|
Directors, Executive Officers and Corporate Governance
|
The information required by this item relating to our directors and nominees is included under the captions “Proposal No. 1: Election of Directors—General,” “—Business Experience and Qualifications of Nominees,” and “—Board Meetings and Committees—Nomination and Governance Committee” in our Proxy Statement related to the 2014 Annual Meeting of Shareholders and is incorporated herein by reference.
The information required by this item regarding our Audit Committee is included under the caption “Proposal No. 1: Election of Directors—Board Committees and Meetings” in our Proxy Statement related to the 2014 Annual Meeting of Shareholders and is incorporated herein by reference.
Pursuant to General Instruction G(3) of Form 10-K, the information required by this item relating to our executive officers is included under the caption “Executive Officers of the Registrant” in Part I of this report.
The information required by this item regarding compliance with Section 16(a) of the Securities Act of 1934 is included under the caption “Ownership of Securities—Section 16(a) Beneficial Ownership Reporting Compliance” in our Proxy Statement related to the 2014 Annual Meeting of Shareholders and is incorporated herein by reference.
We have adopted a code of ethics that applies to our principal executive officer and all members of our finance department, including the principal financial officer and principal accounting officer. This code of ethics, which consists of the “Special Ethics Obligations for Employees with Financial Reporting Responsibilities” section of our Code of Business Conduct that applies to employees generally, is posted on our website. The Internet address for our website is
www.cisco.com
, and the code of ethics may be found from our main webpage by clicking first on “About Cisco” and then on “Corporate Governance” under “Investor Relations,” next on “Code of Business Conduct” under “Corporate Governance,” and finally on “Special Ethics Obligations for Employees with Financial Reporting Responsibilities.”
We intend to satisfy any disclosure requirement under Item 5.05 of Form 8-K regarding an amendment to, or waiver from, a provision of this code of ethics by posting such information on our website, on the webpage found by clicking through to “Code of Business Conduct” as specified above.
|
Item 11.
|
Executive Compensation
|
The information appearing under the headings “Proposal No. 1: Election of Directors—Director Compensation” and “Executive Compensation and Related Information” in our Proxy Statement related to the 2014 Annual Meeting of Shareholders is incorporated herein by reference.
|
Item 12.
|
Security Ownership of Certain Beneficial Owners and Management and Related Stockholder Matters
|
The information required by this item relating to security ownership of certain beneficial owners and management is included under the caption “Ownership of Securities,” and the information required by this item relating to securities authorized for issuance under equity compensation plans is included under the caption “Ownership of Securities— Equity Compensation Plan Information,” in each case in our Proxy Statement related to the
2014
Annual Meeting of Shareholders, and is incorporated herein by reference.
|
Item 13.
|
Certain Relationships and Related Transactions, and Director Independence
|
The information required by this item relating to review, approval or ratification of transactions with related persons is included under the caption “Certain Relationships and Related Transactions,” and the information required by this item relating to director independence is included under the caption “Proposal No. 1: Election of Directors—Independent Directors,” in each case in our Proxy Statement related to the
2014
Annual Meeting of Shareholders, and is incorporated herein by reference.
123
|
Item 14.
|
Principal Accountant Fees and Services
|
The information required by this item is included under the captions “Proposal No. 4: Ratification of Independent Registered Public Accounting Firm—Principal Accountant Fees and Services” and “Policy on Audit Committee Pre-Approval of Audit and Permissible Non-Audit Services of Independent Registered Public Accounting Firm” in our Proxy Statement related to the
2014
Annual Meeting of Shareholders, and is incorporated herein by reference.
|
Item 15.
|
Exhibits and Financial Statement Schedules
|
|
(a)
|
1. Financial Statements
|
See the “Index to Consolidated Financial Statements” on page 70 of this report.
|
2.
|
Financial Statement Schedule
|
See “Schedule II—Valuation and Qualifying Accounts” (below) within Item 15 of this report.
|
3.
|
Exhibits
|
See the “Index to Exhibits” immediately following the signature page of this report.
SCHEDULE II
VALUATION AND QUALIFYING ACCOUNTS
(in millions)
|
|
Allowances For
|
||||||
|
|
Financing
Receivables
|
Accounts
Receivable
|
|||||
|
Year ended July 28, 2012:
|
|||||||
|
Balance at beginning of fiscal year
|
$
|
367
|
|
$
|
204
|
|
|
|
Provisions
|
31
|
|
19
|
|
|||
|
Recoveries (write-offs), net
|
(3
|
)
|
(16
|
)
|
|||
|
Foreign exchange and other
|
(15
|
)
|
—
|
|
|||
|
Balance at end of fiscal year
|
$
|
380
|
|
$
|
207
|
|
|
|
Year ended July 27, 2013:
|
|||||||
|
Balance at beginning of fiscal year
|
$
|
380
|
|
$
|
207
|
|
|
|
Provisions
|
11
|
|
33
|
|
|||
|
Recoveries (write-offs), net
|
(46
|
)
|
(12
|
)
|
|||
|
Foreign exchange and other
|
(1
|
)
|
—
|
|
|||
|
Balance at end of fiscal year
|
$
|
344
|
|
$
|
228
|
|
|
|
Year ended July 26, 2014:
|
|||||||
|
Balance at beginning of fiscal year
|
$
|
344
|
|
$
|
228
|
|
|
|
Provisions
|
14
|
|
65
|
|
|||
|
Recoveries (write-offs), net
|
(9
|
)
|
(28
|
)
|
|||
|
Balance at end of fiscal year
|
$
|
349
|
|
$
|
265
|
|
|
Foreign exchange and other includes the impact of foreign exchange and certain immaterial reclassifications.
124
SIGNATURES
Pursuant to the requirements of Section 13 or 15(d) of the Securities Exchange Act of 1934, the registrant has duly caused this Report on Form 10-K to be signed on its behalf by the undersigned, thereunto duly authorized.
|
September 9, 2014
|
|
|
CISCO SYSTEMS, INC.
|
|
|
|
|
|
/S/
J
OHN
T.
C
HAMBERS
|
|
|
|
|
John T. Chambers
|
||
|
|
|
Chairman and Chief Executive Officer
|
||
POWER OF ATTORNEY
KNOW ALL PERSONS BY THESE PRESENTS, that each person whose signature appears below constitutes and appoints John T. Chambers and Frank A. Calderoni, jointly and severally, his attorney-in-fact, each with the full power of substitution, for such person, in any and all capacities, to sign any and all amendments to this Annual Report on Form 10-K, and to file the same, with all exhibits thereto and other documents in connection therewith, with the Securities and Exchange Commission, granting unto said attorney-in-fact and agent full power and authority to do and perform each and every act and thing requisite and necessary to be done in connection therewith, as fully to all intents and purposes as he might do or could do in person hereby ratifying and confirming all that each of said attorneys-in-fact and agents, or his substitute, may do or cause to be done by virtue hereof.
Pursuant to the requirements of the Securities Exchange Act of 1934, this Report on Form 10-K has been signed below by the following persons on behalf of the registrant and in the capacities and on the dates indicated.
|
Signature
|
Title
|
Date
|
|
/S/
J
OHN
T.
C
HAMBERS
|
Chairman, Chief Executive Officer and Director
|
September 9, 2014
|
|
John T. Chambers
|
(Principal Executive Officer)
|
|
|
/S/
F
RANK
A.
C
ALDERONI
|
Executive Vice President and Chief Financial Officer
|
September 9, 2014
|
|
Frank A. Calderoni
|
(Principal Financial Officer)
|
|
|
/S/
P
RAT
S.
B
HATT
|
Senior Vice President, Corporate Controller and
|
September 9, 2014
|
|
Prat S. Bhatt
|
Chief Accounting Officer
|
|
|
(Principal Accounting Officer)
|
||
|
/S/
C
AROL
A.
B
ARTZ
|
Lead Independent Director
|
September 9, 2014
|
|
Carol A. Bartz
|
||
|
/S/
M
ARC
B
ENIOFF
|
Director
|
September 9, 2014
|
|
Marc Benioff
|
||
|
Director
|
||
|
M. Michele Burns
|
||
125
|
Signature
|
Title
|
Date
|
|
/S/
M
ICHAEL
D.
C
APELLAS
|
Director
|
September 9, 2014
|
|
Michael D. Capellas
|
||
|
/S/
B
RIAN
L.
H
ALLA
|
Director
|
September 9, 2014
|
|
Brian L. Halla
|
||
|
/S/ JOHN L. HENNESSY
|
Director
|
September 9, 2014
|
|
Dr. John L. Hennessy
|
||
|
/S/
K
RISTINA
M.
J
OHNSON
|
Director
|
September 9, 2014
|
|
Dr. Kristina M. Johnson
|
||
|
/S/
R
ODERICK
C.
M
CGEARY
|
Director
|
September 9, 2014
|
|
Roderick C. McGeary
|
||
|
/S/
A
RUN
S
ARIN
|
Director
|
September 9, 2014
|
|
Arun Sarin
|
||
|
/S/
S
TEVEN
M.
W
EST
|
Director
|
September 9, 2014
|
|
Steven M. West
|
||
126
INDEX TO EXHIBITS
|
Exhibit
Number
|
Exhibit Description
|
Incorporated by Reference
|
Filed
Herewith
|
|||||||||
|
|
|
Form
|
File No.
|
Exhibit
|
Filing Date
|
|
||||||
|
3.1
|
Restated Articles of Incorporation of Cisco Systems, Inc., as currently in effect
|
S-3
|
333-56004
|
4.1
|
2/21/2001
|
|||||||
|
3.2
|
Amended and Restated Bylaws of Cisco Systems, Inc., as currently in effect
|
8-K
|
000-18225
|
3.1
|
10/4/2012
|
|||||||
|
4.1
|
Indenture, dated February 22, 2006, between Cisco Systems, Inc. and Deutsche Bank Trust Company Americas, as trustee
|
8-K
|
000-18225
|
4.1
|
2/22/2006
|
|||||||
|
4.2
|
Indenture, dated February 17, 2009, between Cisco Systems, Inc. and the Bank of New York Mellon Trust Company, N.A., as trustee
|
8-K
|
000-18225
|
4.1
|
2/17/2009
|
|||||||
|
4.3
|
Indenture, dated November 17, 2009, between Cisco Systems, Inc. and the Bank of New York Mellon Trust Company, N.A., as trustee
|
8-K
|
000-18225
|
4.1
|
11/17/2009
|
|||||||
|
4.4
|
Indenture, dated March 16, 2011, between Cisco Systems, Inc. and the Bank of New York Mellon Trust Company, N.A., as trustee
|
8-K
|
000-18225
|
4.1
|
3/16/2011
|
|||||||
|
4.5
|
Indenture, dated March 3, 2014, between the Company and The Bank of New York Mellon Trust Company, N.A., as trustee
|
8-K
|
000-18225
|
4.1
|
3/3/2014
|
|||||||
|
4.6
|
Forms of Global Note for the registrant’s 5.50% Senior Notes due 2016
|
8-K
|
000-18225
|
4.1
|
2/22/2006
|
|||||||
|
4.7
|
Forms of Global Note for the registrant’s 4.95% Senior Notes due 2019 and 5.90% Senior Notes due 2039
|
8-K
|
000-18225
|
4.1
|
2/17/2009
|
|||||||
|
4.8
|
Forms of Global Note for the registrant’s 2.90% Senior Notes due 2014, 4.45% Senior Notes due 2020, and 5.50% Senior Notes due 2040
|
8-K
|
000-18225
|
4.1
|
11/17/2009
|
|||||||
|
4.9
|
Forms of Global Note for the Company’s 3.150% Senior Notes due 2017
|
8-K
|
000-18225
|
4.1
|
3/16/2011
|
|||||||
|
4.10
|
Form of Officer’s Certificate setting forth the terms of the Fixed and Floating Rate Notes issued in March 2014
|
8-K
|
000-18225
|
4.2
|
3/3/2014
|
|||||||
|
10.1*
|
Cisco Systems, Inc. 2005 Stock Incentive Plan (including related form agreements)
|
8-K
|
000-18225
|
10.1
|
11/20/2013
|
|||||||
|
10.2*
|
Cisco Systems, Inc. Amended and Restated 1996 Stock Incentive Plan (including related form agreements)
|
10-K
|
000-18225
|
10.2
|
9/21/2010
|
|||||||
|
10.3*
|
Cisco Systems, Inc. SA Acquisition Long-Term Incentive Plan (amends and restates the 2003 Long-Term Incentive Plan of Scientific-Atlanta) (including related form agreements)
|
10-K
|
000-18225
|
10.4
|
9/18/2007
|
|||||||
|
10.4*
|
Cisco Systems, Inc. WebEx Acquisition Long-Term Incentive Plan. (amends and restates the WebEx Communications, Inc. Amended and Restated 2000 Stock Incentive Plan) (including related form agreements)
|
10-K
|
000-18225
|
10.5
|
9/18/2007
|
|||||||
|
10.5*
|
Cisco Systems, Inc. Employee Stock Purchase Plan
|
8-K
|
000-18225
|
10.2
|
11/12/2009
|
|||||||
|
10.6*
|
Cisco Systems, Inc. Deferred Compensation Plan, as amended
|
10-K
|
000-18225
|
10.7
|
9/10/2013
|
|||||||
127
|
Exhibit
Number
|
Exhibit Description
|
Incorporated by Reference
|
Filed
Herewith
|
|||||||||
|
|
|
Form
|
File No.
|
Exhibit
|
Filing Date
|
|
||||||
|
10.7*
|
Cisco Systems, Inc. Executive Incentive Plan
|
8-K
|
000-18225
|
10.1
|
11/16/2012
|
|||||||
|
10.8*
|
Form of Executive Officer Indemnification Agreement
|
10-K
|
000-18225
|
10.7
|
9/20/2004
|
|||||||
|
10.9*
|
Form of Director Indemnification Agreement
|
10-K
|
000-18225
|
10.8
|
9/20/2004
|
|||||||
|
10.10*
|
Relocation Agreement between Cisco Systems, Inc. and Charles Robbins
|
10-Q
|
000-18225
|
10.2
|
11/22/2013
|
|||||||
|
10.11
|
Credit Agreement dated as of February 17, 2012, by and among Cisco Systems, Inc. and Lenders party thereto, and Bank of America, N.A., as administration agent, swing line lender and an L/C issuer
|
8-K
|
000-18225
|
10.1
|
2/17/2012
|
|||||||
|
10.12
|
Form of Commercial Paper Dealer Agreement
|
10-Q
|
000-18225
|
10.1
|
2/23/2011
|
|||||||
|
10.13
|
Commercial Paper Issuing and Paying Agent Agreement dated January 31, 2011 between the Registrant and Bank of America, N.A.
|
10-Q
|
000-18225
|
10.2
|
2/23/2011
|
|||||||
|
21.1
|
Subsidiaries of the Registrant
|
X
|
||||||||||
|
23.1
|
Consent of Independent Registered Public Accounting Firm
|
X
|
||||||||||
|
24.1
|
Power of Attorney (included on page 125 of this Annual Report on Form 10-K)
|
X
|
||||||||||
|
31.1
|
Rule 13a–14(a)/15d–14(a) Certification of Principal Executive Officer
|
X
|
||||||||||
|
31.2
|
Rule 13a–14(a)/15d–14(a) Certification of Principal Financial Officer
|
X
|
||||||||||
|
32.1
|
Section 1350 Certification of Principal Executive Officer
|
X
|
||||||||||
|
32.2
|
Section 1350 Certification of Principal Financial Officer
|
X
|
||||||||||
|
101.INS
|
XBRL Instance Document
|
X
|
||||||||||
|
101.SCH
|
XBRL Taxonomy Extension Schema Document
|
X
|
||||||||||
|
101.CAL
|
XBRL Taxonomy Extension Calculation Linkbase Document
|
X
|
||||||||||
|
101.DEF
|
XBRL Taxonomy Extension Definition Linkbase Document
|
X
|
||||||||||
|
101.LAB
|
XBRL Taxonomy Extension Label Linkbase Document
|
X
|
||||||||||
|
101.PRE
|
XBRL Taxonomy Extension Presentation Linkbase Document
|
X
|
||||||||||
|
*
|
Indicates a management contract or compensatory plan or arrangement.
|
128
TABLE OF CONTENTS
Part IItem 1. BusinessItem 1A. Risk FactorsItem 1. BusinesItem 1B. Unresolved Staff CommentsItem 2. PropertiesItem 3. Legal ProceedingsItem 4. Mine Safety DisclosuresPart IIItem 5. Market For Registrant S Common Equity, Related Stockholder Matters, and Issuer Purchases Of Equity SecuritiesItem 6. Selected Financial DataItem 7. Management S Discussion and Analysis Of Financial Condition and Results Of OperationsItem 7A. Quantitative and Qualitative Disclosures About Market RiskItem 8. Financial Statements and Supplementary DataItem 9. Changes in and Disagreements with Accountants on Accounting and Financial DisclosuresItem 9A. Controls and ProceduresItem 9B. Other InformationPart IIIItem 10. Directors, Executive Officers and Corporate GovernanceItem 11. Executive CompensationItem 12. Security Ownership Of Certain Beneficial Owners and Management and Related Stockholder MattersItem 13. Certain Relationships and Related Transactions, and Director IndependenceItem 14. Principal Accountant Fees and ServicesPart IVItem 15. Exhibits and Financial Statement Schedules