UNITED STATES
SECURITIES AND EXCHANGE COMMISSION
Washington, D.C. 20549
Form 20-F
(Mark One)
|
|
☐
|
REGISTRATION STATEMENT PURSUANT TO SECTION 12(b) OR (g) OF THE SECURITIES EXCHANGE ACT OF 1934
|
OR
|
|
☒
|
ANNUAL REPORT PURSUANT TO SECTION 13 OR 15(d) OF THE SECURITIES EXCHANGE ACT OF 1934
|
For the fiscal year ended December 31, 2016
OR
|
|
☐
|
TRANSITION REPORT PURSUANT TO SECTION 13 OR 15(d) OF THE SECURITIES EXCHANGE ACT OF 1934
|
For the transition period from ______ to ______
OR
|
|
☐
|
SHELL COMPANY REPORT PURSUANT TO SECTION 13 or 15(d) OF THE SECURITIES EXCHANGE ACT OF 1934
|
Date of event requiring this shell company report………………………………….
Commission File Number 001-35464

CAESARSTONE LTD.
(Exact Name of Registrant as specified in its charter)
(Exact Name of Registrant as specified in its charter)
ISRAEL
(Jurisdiction of incorporation or organization)
Kibbutz Sdot-Yam
MP Menashe, 3780400
Israel
(Address of principal executive offices)
Raanan Zilberman
Chief Executive Officer
Caesarstone Ltd.
MP Menashe, 3780400
Israel
Telephone: +972 (4) 636-4555
Facsimile : +972 (4) 636-4400
(Name, telephone, email and/or facsimile number and address of company contact person)
Chief Executive Officer
Caesarstone Ltd.
MP Menashe, 3780400
Israel
Telephone: +972 (4) 636-4555
Facsimile : +972 (4) 636-4400
(Name, telephone, email and/or facsimile number and address of company contact person)
Securities registered or to be registered pursuant to Section 12(b) of the Securities Act of 1933:
|
Title of each class
|
Name of each exchange on which registered
|
|
Ordinary Shares, par value NIS 0.04 per share
|
The NASDAQ Stock Market LLC
|
Securities registered or to be registered pursuant to Section 12(g) of the Act:
None
Securities for which there is a reporting obligation pursuant to Section 15(d) of the Act:
None
Indicate the number of outstanding shares of each of the issuer’s classes of capital or common stock as of December 31,
2016:
34,321,573
ordinary shares, NIS 0.04 par value per share
Indicate by check mark if the registrant is a well-known seasoned issuer, as defined in Rule 405 of the Securities Act:
Yes
x
No
o
If this report is an annual or transition report, indicate by check mark if the registrant is not required to file reports pursuant to Section 13 or 15(d) of the Securities Exchange Act of 1934:
Yes
o
No
x
Indicate by check mark whether the registrant (1) has filed all reports required to be filed by Section 13 or 15(d) of the Exchange Act during the preceding 12 months (or for such shorter period that the registrant was required to file such reports), and (2) has been subject to such filing requirements for the past 90 days:
Yes
x
No
o
Indicate by check mark whether the registrant has submitted electronically and posted on its corporate website, if any, every Interactive Data File required to be submitted and posted pursuant to Rule 405 of Regulation S-T (section 229.405 of this chapter), and (2) has been subject to such filing requirements for the past 90 days:
Yes
x
No
o
Indicate by check mark whether the registrant is a large accelerated filer, an accelerated filer, or a non-accelerated filer. See definition of “accelerated filer and large accelerated filer” in Rule 12b-2 of the Exchange Act (Check one):
|
Large accelerated filer
x
|
Accelerated filer
o
|
Non-accelerated filer
o
|
Indicate by check mark which basis of accounting the registrant has used to prepare the financial statements included in this filing:
|
U.S. GAAP
x
|
International Financial Reporting Standards as issued
|
Other
o
|
|
by the International Accounting Standards Board
o
|
If “Other” has been checked in response to the previous question, indicate by check mark which financial statement item the registrant has elected to follow:
Item 17
o
Item 18
o
If this is an annual report, indicate by check mark whether the registrant is a shell company (as defined in Rule 12b-2 of the Exchange Act):
Yes
o
No
x
ii
PRELIMINARY NOTES
Introduction
As used herein, and unless the context suggests otherwise, the terms “Caesarstone,” “Company,” “we,” “us” or “ours” refer to Caesarstone Ltd. and its consolidated subsidiaries. In this document, references to “NIS” or “shekels” are to New Israeli Shekels, and references to “dollars,” “USD” or “$” refer to U.S. dollars.
Our reporting currency is the United States (“
U.S.
”) dollar. Our functional currency through June 30, 2012 was the NIS. For the periods in which our functional currency was the NIS, our consolidated financial statements were translated into U.S. dollars using the current rate method as follows: assets and liabilities were reflected using the exchange rate at the balance sheet date; revenues and expenses were reflected at the average exchange rate for the relevant period; and equity accounts were reflected using the exchange rate at the relevant transaction date. Translation gains and losses were reported as a component of shareholders’ equity. Starting on July 1, 2012, our functional currency became the U.S. dollar. The functional currency of each of our non-U.S. subsidiaries is the local currency in which it operates. These subsidiaries’ financial statements are translated into the U.S. dollar, the parent company’s functional currency, using the current rate method.
Other financial data appearing in this annual report that is not included in our consolidated financial statements and that relate to transactions that occurred prior to December 31, 2016 are reflected using the exchange rate on the relevant transaction date. With respect to all future transactions, U.S. dollar translations of NIS amounts presented in this annual report are translated at the rate of $1.00 = NIS 3.845, the representative exchange rate published by the Bank of Israel as of December 31, 2016.
Market and Industry Data and Forecasts
This annual report includes data, forecasts and information obtained from industry publications and surveys and other information available to us. Some data is also based on our good faith estimates, which are derived from management’s knowledge of the industry and independent sources. Forecasts and other metrics included in this annual report to describe the countertop industry are inherently uncertain and speculative in nature and actual results for any period may materially differ. We have not independently verified any of the data from third-party sources, nor have we ascertained the underlying assumptions relied upon therein. While we are not aware of any misstatements regarding the industry data presented herein, estimates and forecasts involve uncertainties and risks and are subject to change based on various factors, including those discussed under the headings “—Forward-Looking Statements” and “ITEM 3: Key Information—Risk Factors” in this annual report.
Unless otherwise noted in this annual report, Freedonia Custom Research, Inc. (“
Freedonia
”) is the source for third-party industry data and forecasts. The Freedonia report, dated February 20, 2017 (“
Freedonia Report
”) represents data, research opinion or viewpoints developed independently on our behalf and does not constitute a specific guide to action. The Freedonia Report includes figures related to global countertop demand in total, by region and by material that are different from figures included in the previous custom reports provided to us by Freedonia for the years ended 2010, 2012 and 2014. Specifically, the 2017 Freedonia Report contains higher quartz global penetration and lower laminate share for each of those years. The 2017 Freedonia Report also indicates that Asia demand increased and Europe demand decreased relative to previous custom reports. Quartz penetration in each of our four main markets (and our market share in those markets, accordingly) remained the same as published in previous years. In preparing the report, Freedonia used various sources, including publically available third-party financial statements; government statistical reports; press releases; industry magazines; and interviews with manufacturers of related products (including us), manufacturers of competitive products, distributors of related products, and government and trade associations. Growth rates in the Freedonia Report are based on many variables, such as currency exchange rates, raw material costs and pricing of competitive products, and such variables are subject to wide fluctuations over time. The Freedonia Report speaks as of its final publication date (and not as of the date of this filing), and the opinions and forecasts expressed in the Freedonia Report are subject to change by Freedonia without notice. We have inquired of Freedonia, and been informed that as of the date of this filing, there has been no change in the Freedonia Report, and Freedonia has not reviewed such report from the date of its publication by Freedonia.
iii
Special Note Regarding Forward-Looking Statements
This annual report contains forward-looking statements within the meaning of Section 27A of the Securities Act of 1933, as amended (“
Securities Act
”), Section 21E of the Securities Exchange Act of 1934, as amended (“
Exchange Act
”), and the safe harbor provisions of the U.S. Private Securities Litigation Reform Act of 1995, that are based on our management’s beliefs and assumptions and on information currently available to our management. Forward-looking statements include information concerning our possible or assumed future results of operations, business strategies, financing plans, competitive position, industry environment, potential growth opportunities, potential market opportunities and the effects of competition. Forward-looking statements include all statements that are not historical facts and can be identified by terms such as “anticipates,” “believes,” “could,” “seeks,” “estimates,” “expects,” “intends,” “may,” “plans,” “potential,” “predicts,” “projects,” “should,” “will,” “would” or similar expressions that convey uncertainty of future events or outcomes and the negatives of those terms. These statements may be found in several sections of this annual report, including, but not limited to “ITEM 3: Key Information—Risk Factors,” “ITEM 4: Information on Caesarstone,” “ITEM 5: Operating and Financial Review and Prospects,” “ITEM 10: Additional Information—Taxation—United States Federal Income Taxation—Passive foreign investment company considerations.” These statements include, but are not limited to, statements regarding:
| • |
our ability to respond to new market developments;
|
| • |
our intent to penetrate further our existing markets and penetrate new markets;
|
| • |
our belief in the sufficiency of our cash flows to meet our needs for the next year;
|
| • |
our plans to invest in developing, manufacturing and offering innovative products;
|
| • |
our ability to effectively utilize our new production lines in the United States and our plans to increase our manufacturing capacity in response to a potential growing demand for our products;
|
| • |
our plans to promote and strengthen our brand internationally;
|
| • |
our plans to invest in research and development for the development of new quartz products;
|
| • |
our ability to effectively promote the increase of quartz penetration in our existing markets and new markets to generate growth;
|
| • |
our ability to successfully compete with other quartz surfaces manufacturers, suppliers and distributors, and with suppliers and distributors of other materials used in countertops;
|
| • |
our ability to acquire third-party distributors, manufacturers of quartz surfaces products or other products and services;
|
| • |
our plans to continue to expand our international presence;• our expectations regarding future prices of quartz, polyester and pigments;
|
| • |
future foreign exchange rates, particularly the NIS, Australian dollar, Canadian dollar and the euro;
|
| • |
our expectations regarding our future product mix;
|
| • |
our expectations regarding the outcome of litigation or other legal proceedings in which we are involved, and our ability to use our insurance policy to cover damages; and
|
| • |
our expectations regarding regulatory matters applicable to us.
|
The preceding list is not intended to be an exhaustive list of all of our forward-looking statements. Forward-looking statements reflect our current views with respect to future events and are based on assumptions and are subject to risks and uncertainties, including those described in “ITEM 3.D. Key Information—Risk Factors.”
You should not put undue reliance on any forward-looking statements. Actual results could differ materially from those anticipated in these forward-looking statements as a result of various factors described in this annual report, including factors beyond our ability to control or predict. Although we believe that the expectations reflected in the forward-looking statements are reasonable, we cannot guarantee that future results, levels of activity, performance and events and circumstances reflected in the forward-looking statements will be achieved or will occur. Any forward-looking statement made in this annual report speaks only as of the date hereof. Except as required by law, we undertake no obligation to update publicly any forward-looking statements for any reason after the date of this annual report, to conform these statements to actual results or to changes in our expectations.
iv
TABLE OF CONTENTS
|
1
|
||||
|
1
|
||||
|
1
|
||||
|
1
|
||||
|
1
|
||||
|
6
|
||||
|
6
|
||||
|
6
|
||||
|
32
|
||||
|
32
|
||||
|
33
|
||||
|
44
|
||||
|
44
|
||||
|
45
|
||||
|
45
|
||||
|
45
|
||||
|
60
|
||||
|
62
|
||||
|
62
|
||||
|
62
|
||||
|
63
|
||||
|
64
|
||||
|
64
|
||||
|
68
|
||||
|
73
|
||||
|
86
|
||||
|
87
|
||||
|
88
|
||||
|
88
|
||||
|
91
|
||||
|
97
|
||||
|
97
|
||||
|
97
|
||||
|
103
|
||||
|
103
|
||||
|
103
|
||||
|
104
|
||||
|
104
|
||||
|
104
|
||||
|
104
|
||||
|
104
|
||||
|
104
|
||||
|
104
|
||||
|
104
|
||||
|
109
|
||||
|
109
|
||||
|
110
|
||||
|
119
|
||||
|
119
|
||||
|
119
|
||||
|
120
|
||||
|
120
|
||||
|
122
|
||||
v
|
123
|
||
|
123
|
||
|
123
|
||
|
123
|
||
|
124
|
||
|
124
|
||
|
124
|
||
|
125
|
||
|
125
|
||
|
125
|
||
|
126
|
||
|
126
|
||
|
126
|
||
|
126
|
||
|
126
|
||
|
126
|
||
|
126
|
Not applicable.
Not applicable.
A.
S
elected Financial Data
You should read the following selected consolidated financial data in conjunction with “ITEM 5: Operating and Financial Review and Prospects” and our consolidated financial statements and the related notes included elsewhere in this annual report. The consolidated income statement data for the years ended December 31, 2016, 2015 and 2014 and the consolidated balance sheet data as of December 31, 2016 and 2015 are derived from our audited consolidated financial statements included in “ITEM 18: Financial Statements,” which have been prepared in accordance with generally accepted accounting principles in the United States (“
U.S. GAAP
”). The consolidated income statement data for the years ended December 31, 2013 and 2012 and the consolidated balance sheet data as of December 31, 2014, 2013 and 2012 have been derived from our audited consolidated financial statements which are not included in this annual report. The information presented below under the caption “Other Financial Data” and “Dividends declared per share” contains information that is not derived from our financial statements.
|
2016
|
2015
|
2014
|
2013
|
2012
|
||||||||||||||||
|
Consolidated Income Statement Data:
|
||||||||||||||||||||
|
Revenues
|
$
|
538,543
|
$
|
499,515
|
$
|
447,402
|
$
|
356,554
|
$
|
296,564
|
||||||||||
|
Cost of revenues
|
326,057
|
299,290
|
257,751
|
194,436
|
169,169
|
|||||||||||||||
|
Gross profit
|
212,486
|
200,225
|
189,651
|
162,118
|
127,395
|
|||||||||||||||
|
Operating expenses:
|
||||||||||||||||||||
|
Research and development, net (1)
|
3,290
|
3,052
|
2,628
|
2,002
|
2,100
|
|||||||||||||||
|
Marketing and selling
|
70,343
|
59,521
|
55,870
|
51,209
|
46,911
|
|||||||||||||||
|
General and administrative
|
40,181
|
36,612
|
36,111
|
32,904
|
28,423
|
|||||||||||||||
|
Legal settlements and loss contingencies, net
|
5,868
|
4,654
|
-
|
-
|
-
|
|||||||||||||||
|
Total operating expenses
|
119,682
|
103,839
|
94,609
|
86,115
|
77,434
|
|||||||||||||||
|
Operating income
|
92,804
|
96,386
|
95,042
|
76,003
|
49,961
|
|||||||||||||||
|
Finance expenses, net
|
3,318
|
3,085
|
1,045
|
1,314
|
2,773
|
|||||||||||||||
|
Income before taxes on income
|
89,486
|
93,301
|
93,997
|
74,689
|
47,188
|
|||||||||||||||
|
Taxes on income
|
13,003
|
13,843
|
13,738
|
10,336
|
6,821
|
|||||||||||||||
|
Net income
|
$
|
76,483
|
$
|
79,458
|
$
|
80,259
|
$
|
64,353
|
$
|
40,367
|
||||||||||
|
Net income attributable to non-controlling
interest
|
1,887
|
1,692
|
1,820
|
1,009
|
735
|
|||||||||||||||
|
Net income attributable to controlling
interest
|
74,596
|
77,766
|
78,439
|
63,344
|
39,632
|
|||||||||||||||
|
Basic net income per ordinary share*
|
2.08
|
2.21
|
2.25
|
1.83
|
1.21
|
|||||||||||||||
|
Diluted net income per ordinary share*
|
2.08
|
2.19
|
2.22
|
1.80
|
1.21
|
|||||||||||||||
|
Weighted average number of ordinary shares used in computing basic income per share
|
34,706
|
35,253
|
34,932
|
34,667
|
32,642
|
|||||||||||||||
|
Weighted average number of ordinary shares used in computing diluted income per share
|
34,764
|
35,464
|
35,394
|
35,210
|
32,700
|
|||||||||||||||
|
Dividends declared per share
|
|
|||||||||||||||||||
|
Shekels**
|
—
|
NIS | — | NIS |
—
|
NIS |
—
|
NIS |
3.78
|
|||||||||||
|
Dollars**
|
—
|
$ | — |
$
|
0.57
|
$
|
0.58
|
$
|
1.02
|
|||||||||||
1
| At December 31, | ||||||||||||||||||||
|
2016
|
2015
|
2014
|
2013
|
2012
|
||||||||||||||||
| (in thousands ) | ||||||||||||||||||||
|
Consolidated Balance Sheet Data:
|
||||||||||||||||||||
|
Cash, cash equivalents and short term bank deposits
|
$
|
106,270
|
$
|
62,807
|
$
|
54,327
|
$
|
92,248
|
$
|
72,733
|
||||||||||
|
Working capital (2)
|
216,963
|
168,841
|
124,306
|
145,702
|
117,712
|
|||||||||||||||
|
Total assets
|
584,700
|
529,742
|
439,000
|
377,556
|
321,049
|
|||||||||||||||
|
Total liabilities
|
134,108
|
120,680
|
109,274
|
104,333
|
90,026
|
|||||||||||||||
|
Redeemable non-controlling interest
|
12,939
|
8,841
|
8,715
|
7,624
|
7,106
|
|||||||||||||||
|
Shareholders’ equity
|
437,653
|
400,221
|
321,011
|
265,599
|
223,917
|
|||||||||||||||
| Year ended December 31, | ||||||||||||||||||||
|
2016
|
2015
|
2014
|
2013
|
2012
|
||||||||||||||||
| (in thousands ) | ||||||||||||||||||||
|
Other Financial Data:
|
||||||||||||||||||||
|
Adjusted EBITDA (3)
|
$
|
130,260
|
$
|
125,667
|
$
|
116,553
|
$
|
91,711
|
$
|
69,445
|
||||||||||
|
Adjusted net income attributable to controlling
interest (3)
|
81,184
|
83,682
|
82,498
|
63,959
|
44,008
|
|||||||||||||||
|
Capital expenditures
|
22,943
|
76,495
|
86,373
|
27,372
|
13,481
|
|||||||||||||||
|
Depreciation and amortization
|
28,254
|
22,334
|
17,176
|
14,994
|
14,368
|
|||||||||||||||
*See also note 15 to our financial statements included elsewhere in this report.
* * Prior to 2013, the Company declared and paid its dividends in NIS. Conversion to U.S. dollar appears herein for reporting purposes. Starting in 2013, dividends were declared and paid in U.S. dollar. Therefore, no conversion is required.
| (1) |
Research and development expenses are presented net of grants that we received from the National Authority of Technological Innovation (formerly the Office of the Chief Scientist) (“
OCS
”) of the Ministry of Economy and Industry of the State of Israel between 2009 and 2013.
|
| (2) |
Working capital is defined as total current assets minus total current liabilities.
|
| (3) |
The tables below reconcile net income to adjusted EBITDA and net income attributable to controlling interest to adjusted net income attributable to controlling interest for the periods presented and are unaudited.
|
2
We use certain non-GAAP financial measures to evaluate our performance in conjunction with other performance metrics. The following are examples of how we use such non-GAAP measures:
| · |
Our annual budget is based in part on these non-GAAP measures.
|
| · |
Our management and board of directors use these non-GAAP measures to evaluate our operational performance and to compare it against our work plan and budget.
|
Our non-GAAP financial measures, adjusted EBITDA and adjusted net income attributable to controlling interest, have no standardized meaning and accordingly have limitations in their usefulness to investors. We provide such non-GAAP data because management believes that such data provide useful information to investors. However, investors are cautioned that, unlike financial measures prepared in accordance with U.S. GAAP, non-GAAP measures may not be comparable with similar measures used by other companies. These non-GAAP financial measures are presented solely to permit investors to more fully understand how management and our board assesses our performance. The limitations of these non-GAAP financial measures as performance measures are that they provide a view of our results of operations without reflecting all events during a period and may not provide a comparable view of our performance to other companies in our industry.
Investors should consider non-GAAP financial measures in addition to, and not as replacements for, or superior to, measures of financial performance prepared in accordance with GAAP.
In arriving at our presentation of non-GAAP financial measures, we exclude items that either have a non-recurring impact on our income statement or which, in the judgment of our management, are items that, either as a result of their nature or size, could, were they not singled out, potentially cause investors to extrapolate future performance from an improper base. In addition, we also exclude share-based compensation expenses to facilitate a better understanding of our operating performance, since these expenses are non-cash and accordingly do not affect our business operations. While not all inclusive, examples of these items include:
| · |
amortization of purchased intangible assets;
|
| · |
legal settlements (both gain or loss) and loss contingencies, due to the difficulty in predicting future events, their timing and size;
|
| · |
material items related to business combination activities important to understanding our on-going performance;
|
| · |
excess cost of acquired inventory;
|
| · |
expenses related to our share based compensation;
|
| · |
significant one-time offering costs;
|
| · |
material tax and other awards or settlements, both amounts paid and received; and
|
| · |
tax effects of the foregoing items.
|
3
| Year ended December 31, | ||||||||||||||||||||
|
2016
|
2015
|
2014
|
2013
|
2012
|
||||||||||||||||
| (in thousands) | ||||||||||||||||||||
|
Reconciliation of Net Income to Adjusted EBITDA:
|
||||||||||||||||||||
|
Net income
|
$
|
76,483
|
$
|
79,458
|
$
|
80,259
|
$
|
64,353
|
$
|
40,367
|
||||||||||
|
Finance expenses, net
|
3,318
|
3,085
|
1,045
|
1,314
|
2,773
|
|||||||||||||||
|
Taxes on income
|
13,003
|
13,843
|
13,738
|
10,336
|
6,821
|
|||||||||||||||
|
Depreciation and amortization
|
28,254
|
22,334
|
17,176
|
14,994
|
14,368
|
|||||||||||||||
|
Legal settlements and loss contingencies, net (a)
|
5,868
|
4,654
|
—
|
—
|
—
|
|||||||||||||||
|
Compensation paid by a shareholder (b)
|
266
|
—
|
—
|
—
|
—
|
|||||||||||||||
|
Excess cost of acquired inventory(c)
|
—
|
—
|
231
|
188
|
885
|
|||||||||||||||
|
Share-based compensation expense(d)
|
3,068
|
2,293
|
2,642
|
2,514
|
3,007
|
|||||||||||||||
|
Inventory–change of estimate (e)
|
—
|
—
|
—
|
(3,458
|
)
|
—
|
||||||||||||||
|
Follow–on expenses (f)
|
—
|
—
|
657
|
1,470
|
—
|
|||||||||||||||
|
IPO bonus(g)
|
—
|
—
|
—
|
—
|
1,970
|
|||||||||||||||
|
Caesarstone USA contingent consideration adjustment(h)
|
—
|
—
|
—
|
—
|
255
|
|||||||||||||||
|
Litigation gain(i)
|
—
|
—
|
—
|
—
|
(1,001
|
)
|
||||||||||||||
|
Provision for employee fringe benefits (j)
|
—
|
—
|
939
|
—
|
—
|
|||||||||||||||
|
Settlement with tax authorities (k)
|
—
|
—
|
(134
|
)
|
—
|
—
|
||||||||||||||
|
Adjusted EBITDA
|
$
|
130,260
|
$
|
125,667
|
$
|
116,553
|
$
|
91,711
|
$
|
69,445
|
||||||||||
| (a) |
Consists of legal settlements expenses and loss contingencies, net, related to silicosis claims
.
Reference to “silicosis claims” in this report includes claims for alleged bodily injuries, including silicosis and other illnesses, alleged to be associated with silica dust.
|
(b) One-time bonus paid by a shareholder to our employees in Israel other than officers.
| (c) |
Consists of charges to cost of goods sold for the difference between the higher carrying cost of the inventory of two of our subsidiaries, Caesarstone USA’s inventory at the time of its acquisition and inventory that was purchased from its sub-distributors, and Caesarstone Australia Pty Limited’s inventory that was purchased from its distributor, and the standard cost of our inventory, which adversely impacts our gross margins until such inventory is sold. The majority of the acquired inventory from Caesarstone USA was sold in 2011, and the majority of the inventory purchased from the Australian distributor was sold in 2012.
|
| (d) |
Share-based compensation consists primarily of changes in the value of share-based rights granted in January 2009 to our former chief executive officer, as well as changes in the value of share-based rights granted in March 2008 to the former chief executive officer of Caesarstone Australia Pty Limited. In 2012, share-based compensation consists primarily of expenses related to stock options granted to our employees as well as changes in the value of share-based rights granted in January 2009 to our former chief executive officer. In 2013, share-based compensation consists of expenses related to stock options granted to our employees. In 2014, share-based compensation consists of expenses related to stock options granted to our employees as well as expenses related to share-based bonus rights granted during 2014. In 2015 and 2016, share-based compensation consists of expenses related to stock options and restricted stock units granted to our employees as well as expenses related to share-based bonus rights granted during 2014.
|
| (e) |
Relates to a change in estimate for the value of inventory following the implementation of our new ERP system in April 2013.
|
| (f) |
In 2013, follow-on expenses consist of direct expenses related to a follow-on offering that closed in April 2013, including a bonus paid by our former shareholder, Tene Investment Fund (“
Tene
”), to certain of our employees that under U.S. GAAP we are required to expense against paid-in capital. In 2014, follow-on expenses consist of direct expenses related to a follow-on offering that closed in June 2014.
|
| (g) |
Consists of the payment of $1.72 million to certain of our employees and $0.25 million to our chairman of the board of directors for their contribution to the completion of our initial public offering (“
IPO
”).
|
| (h) |
Relates to the change in fair value of the contingent consideration that was part of the consideration transferred in connection with the acquisition of Caesarstone USA, Inc. (“
Caesarstone USA
”).
|
| (i) |
Consists of a settlement agreement with the former chief executive officer of Caesarstone Australia Pty Limited related to litigation that had been commenced in 2010. Pursuant to the settlement, he transferred to us the ownership of all his shares in Caesarstone Australia Pty Limited received in connection with his employment. We did not make any payments in connection with such transfer or other payments to the former chief executive officer. As a result of the settlement, we reversed the liability provision in connection with the litigation and the adjustment is presented net of the related litigation expenses incurred in connection with the settlement.
|
| (j) |
Relates to an adjustment of provision for taxable employee fringe benefits as a result of a settlement with the Israel Tax Authority and with the Israeli National Insurance Institute (“
NII
”).
|
| (k) |
Relates to a refund of Israeli value added tax (“
VAT
”) associated with a bad debt from 2007.
|
4
| Year ended December 31, | ||||||||||||||||||||
|
2016
|
2015
|
2014
|
2013
|
2012
|
||||||||||||||||
| (in thousands ) | ||||||||||||||||||||
|
Reconciliation of Net Income Attributable to Controlling Interest
to Adjusted Net Income Attributable to Controlling Interest:
|
||||||||||||||||||||
|
Net income attributable to controlling interest
|
$
|
74,596
|
$
|
77,766
|
$
|
78,439
|
$
|
63,344
|
$
|
39,632
|
||||||||||
|
Legal settlements and loss contingencies, net (a)
|
5,868
|
4,654
|
—
|
—
|
—
|
|||||||||||||||
|
Compensation paid by a shareholder (b)
|
266
|
—
|
—
|
—
|
—
|
|||||||||||||||
|
Excess cost of acquired inventory(c)
|
—
|
—
|
231
|
188
|
885
|
|||||||||||||||
|
Litigation gain(d)
|
—
|
—
|
—
|
—
|
(1,001
|
)
|
||||||||||||||
|
Inventory – change of estimate(e)
|
—
|
—
|
—
|
(3,458
|
)
|
—
|
||||||||||||||
|
Follow-on expenses(f)
|
—
|
—
|
657
|
1,470
|
—
|
|||||||||||||||
|
IPO bonus(g)
|
—
|
—
|
—
|
—
|
1,970
|
|||||||||||||||
|
Caesarstone USA contingent consideration adjustment(h)
|
—
|
—
|
—
|
—
|
255
|
|||||||||||||||
|
Share-based compensation expense(i)
|
3,068
|
2,293
|
2,642
|
2,514
|
3,007
|
|||||||||||||||
|
Provision for employee fringe benefits (j)
|
—
|
—
|
939
|
—
|
—
|
|||||||||||||||
|
Settlement with tax authorities (k)
|
—
|
—
|
(134
|
) |
—
|
—
|
||||||||||||||
|
Tax adjustment (l)
|
(1,158
|
)
|
—
|
342
|
—
|
—
|
||||||||||||||
|
Total adjustments before tax
|
8,044
|
6,947
|
4,677
|
714
|
5,116
|
|||||||||||||||
|
Less tax on above adjustments
|
1,456
|
1,031
|
618
|
99
|
740
|
|||||||||||||||
|
Total adjustments after tax
|
6,588
|
5,916
|
4,059
|
615
|
4,376
|
|||||||||||||||
|
Adjusted net income attributable to controlling interest
|
$
|
81,184
|
$
|
83,682
|
$
|
82,498
|
$
|
63,959
|
$
|
44,008
|
||||||||||
| (a) |
Consists of legal settlements expenses and loss contingencies, net, related to silicosis claims.
|
| (b) |
One-time bonus paid by a shareholder to our employees in Israel other than officers.
|
| (c) |
Consists of charges to cost of goods sold for the difference between the higher carrying cost of the inventory of two of our subsidiaries, Caesarstone USA’s inventory at the time of its acquisition and inventory that was purchased from its distributor, and Caesarstone Australia Pty Limited’s inventory that was purchased from its distributor, and the standard cost of our inventory, which adversely impacts our gross margins until such inventory is sold. The majority of the acquired inventory from Caesarstone USA was sold in 2011, and the majority of the inventory purchased from the Australian distributor was sold in 2012.
|
| (d) |
Consists of a settlement agreement with the former chief executive officer of Caesarstone Australia Pty Limited related to litigation that had been commenced in 2010. Pursuant to the settlement, he transferred to us the ownership of all his shares in Caesarstone Australia Pty Limited received in connection with his employment. We did not make any payments in connection with such transfer or other payments to the former chief executive officer. As a result of the settlement, we reversed the liability provision in connection with the litigation and the adjustment is presented net of the related litigation expenses incurred in connection with the settlement.
|
| (e) |
Relates to a change in estimate for the value of inventory following the implementation of our new ERP system in April 2013.
|
| (f) |
In 2013, follow-on expenses consist of direct expenses related to a follow-on offering that closed in April 2013, including a bonus paid by our former shareholder, Tene, to certain of our employees that under U.S. GAAP we are required to expense against paid-in capital. In 2014, follow-on expenses consist of direct expenses related to a follow-on offering that closed in June 2014.
|
| (g) |
Consists of the payment of $1.72 million to certain of our employees and $0.25 million to our chairman of the board of directors for their contribution to the completion of our IPO.
|
| (h) |
Relates to the change in fair value of the contingent consideration that was part of the consideration transferred in connection with the acquisition of Caesarstone USA.
|
| (i) |
Share-based compensation consists primarily of changes in the value of share-based rights granted in January 2009 to our former chief executive officer, as well as changes in the value of share-based rights granted in March 2008 to the former chief executive officer of Caesarstone Australia Pty Limited. In 2012, share-based compensation consists primarily of expenses related to stock options granted to our employees as well as changes in the value of share-based rights granted in January 2009 to our former chief executive officer. In 2013, share-based compensation consists of expenses related to stock options granted to our employees. In 2014, share-based compensation consists of expenses related to stock options granted to our employees as well as expenses related to share-based bonus rights granted during 2014. In 2015 and 2016, share-based compensation consists of expenses related to stock options and restricted stock units granted to our employees as well as expenses related to share-based bonus rights granted during 2014.
|
| (j) |
Relates to an adjustment of provision for taxable employee fringe benefits as a result of a settlement with the Israel Tax Authority and with the NII.
|
| (k) |
Relates to a refund of Israeli VAT associated with a bad debt from 2007.
|
| (l) |
Relates to an adjustment in taxes as a result of a tax settlement we reached with Israeli tax authorities.
|
5
Not applicable.
Not applicable.
Our business faces significant risks. You should carefully consider all of the information set forth in this annual report and in our other filings with the United States Securities and Exchange Commission (“
SEC
”), including the following risk factors which we face and which are faced by our industry. Our business, financial condition and results of operations could be materially and adversely affected by any of these risks. In that event, the trading price of our ordinary shares would likely decline and you might lose all or part of your investment. This report also contains forward-looking statements that involve risks and uncertainties. Our results could materially differ from those anticipated in these forward-looking statements, as a result of certain factors including the risks described below and elsewhere in this report and our other SEC filings. See also “Special Note Regarding Forward-Looking Statements” on page iv of this annual report.
Risks related to our business and industry
Downturns in the home renovation and remodeling and new residential construction sectors or the economy generally and a lack of availability of consumer credit could materially and adversely impact end-consumers and lower demand for our products, which could cause our revenues and net income to decrease.
Our products are primarily used as countertops in residential kitchens. As a result, our sales depend significantly on home renovation and remodeling spending, as well as new residential construction spending
.
We believe that in each of our key existing markets, the United States, Australia (unless stated otherwise, reference to Australia in this report includes Australia and New Zealand), Canada and Israel, approximately 60 to 70% of our business is generated from home renovation and remodeling and approximately 25 to 35% is driven by new residential construction. Our products are also used in commercial applications. As a result, our business is mainly affected by trends in the home renovation and remodeling and new residential construction sectors. For example, in 2012 renovation and remodeling spending in Australia declined 10.6% and housing completions dropped by 5.8% (according to the Housing Industry Association). As such, our revenues in Australia in 2012 grew by only 0.8% compared to 2011, which is our lowest annual growth rate in Australia since we commenced direct distribution in 2008. In 2015, housing conditions in the United States were significantly less favorable than in 2014; renovation and remodeling spending grew 5.4% in 2015 compared to 6.1% in 2014 (according to the Joint Center for Housing Studies, Harvard University) and housing completions grew 9.5% in 2015 compared to 15.7% in 2014 (according to NAHB, the National Association of Home Builders), which, among other things, slowed down our annual revenue growth rate in the United States from 41.5% in 2014 to 20.3% in 2015. Spending on home renovation and remodeling and new residential construction depends significantly on the availability of consumer credit, as well as other factors such as interest rates, consumer confidence, government programs and unemployment. Such factors also affect spending on commercial projects. Any of these factors could result in a tightening of lending standards by financial institutions and reduce the ability of consumers to finance renovation and remodeling expenditures or home purchases. Consumers’ ability to access financing varies across our operating markets. If the housing market is negatively impacted as a result of an economic downturn or if other significant economic negative trends occur, we may be unable to grow our business and our revenues and net income may be materially and adversely affected.
Our revenues are subject to significant geographic concentration and any disruption to sales within one of our key existing markets could materially and adversely impact our results of operations and prospects.
Our sales are subject to significant geographic concentration. In 2016, sales in the United States, Australia, Canada and Israel accounted for 41.3%, 24.3%, 15.9% and 7.9% of our revenues, respectively. Each country has different characteristics and our results of operations could be materially and adversely impacted by a range of factors, including spending on home renovation and remodeling and new residential construction in the region (as discussed above), local competitive changes, changes in consumers’ quartz surface or countertop preferences and regulatory changes that specifically impact these markets, as well as by our performance in each of these markets. Sales in our main markets could be materially and adversely impacted by other general economic conditions, including increases in imports from Asian manufacturers into such markets, especially the United States, Australia and Canada. Stronger local currencies could make lower-priced imported goods more competitive than our products. Although we face different challenges and risks in each of the markets in which we operate, due to the existence of a high level of geographic concentration, should an adverse event occur in any of these jurisdictions, our results of operations and prospects could be impacted disproportionately.
6
We face intense competitive pressures from manufacturers of quartz or other surface materials, including certain competitors with greater resources and capital, which could materially and adversely affect our results of operations and financial condition.
Our quartz surface products compete with a number of other surface materials such as granite, laminate, marble, manufactured solid surface, concrete, stainless steel, wood and ceramic. Large surfaces made of ceramic, a durable material with sizes similar to our products’ sizes, are manufactured using a relatively new technology. We compete with manufacturers of these surface materials and with manufacturers of quartz surfaces, some of which also manufacture these other surface materials, which may provide them a competitive advantage. Our ability to maintain or grow our market share, revenue and profits is dependent on a range of factors. These factors include brand awareness and brand position, product quality, product differentiation and breadth of product offerings, slab width and length, new product development and time to market, technological innovation, popular home interior design trends, pricing, availability of inventory on demand, distribution coverage and customer service. Since we seek to position our products as a premium alternative to other surface materials, including other quartz surfaces, the perception among end-consumers and other stakeholders of the quality and leadership of our products is a key competitive differentiator.
If we are unable to anticipate or react quickly to changes in consumer preferences in these areas, we may lose market share and our results of operations may suffer. If consumers in specific markets or globally do not place as much value on branded quartz surfaces or prefer other brands, or quartz surfaces market becomes a commodity market, or if we are unable to compete with lower-priced products perceived as comparable to ours our market share may be reduced and our financial results may be materially and adversely impacted.
In addition, to maintain our price levels, margins, competitive position and increase demand for our quartz surface products, we must continue to develop and introduce new product designs supported by proprietary manufacturing knowledge or otherwise differentiated from our competitors' products that meet consumer preferences. Some of our competitors may have been able to adapt more quickly to changes in consumer preferences and demand, devote greater resources to creating innovative designs, successfully copying our designs and technologies and establishing brand recognition, manufacture more versatile slab sizes, have more diversified product offerings involving materials in addition to quartz surfaces, implement processes to lower costs, acquire complementary businesses, and expand more rapidly or adopt more aggressive pricing policies than we do and may be better at attracting distributors, retailers or contractors. The development of a new surface material that decreases consumers’ demand for quartz products may also result in a loss of market share and our results of operations may suffer. For example, ceramic surfaces have been offered in different markets as countertops in recent years and may in the future become a strong competitor of quartz surface products; however, it is not yet known if they will pose such a threat.
We have invested considerable resources to position our quartz surface products as premium branded products. Due to our products’ high quality and positioning, we generally set our prices—especially for our differentiated products—at a higher level than alternate surfaces and quartz surfaces provided by other manufacturers. Manufacturers located in the Asia-Pacific region and in Europe market quartz surface products at lower price points, including quartz surface products which imitate our products and designs. Even if we seek to lower the prices that we charge for our products in certain markets, we may be unable to achieve the low labor and energy costs as some of our competitors in order to maintain current margins on our products. Some of these competitors have developed know-how and technical capabilities to manufacture products similar to our products and other competitors may do so in the future. We have also experienced instances of our competitors marketing products with similar appearances and similar model names to some of our products. Competition of this nature may increase in the markets in which we operate and may develop in new markets. Even if these competitors are unable to compete with us in all markets in which we sell our products, the introduction of similar products at lower price points may result in lowering or eliminating the value that distributors and end-consumers place on our premium brand and products.
Silicosis and other bodily injury claims may have a material adverse effect on our business, operating results and financial condition.
Since 2008 and through March 1, 2017, 110 bodily injury lawsuits related to exposure to silica dust were filed against us in Israel directly or that have named us as third-party defendants by fabricators or their employees in Israel, by the injureds’ successors, by the State of Israel, by the Israeli National Insurance Institute (NII) or by others. Out of these lawsuits, as of March 1, 2017, we were party to 85 pending bodily injury lawsuits related to 85 allegedly injured persons in Israel. The lawsuits filed against us by the NII are subrogation claims providing for reimbursement of its payments related to damages paid or that will be paid to plaintiffs if we are found liable for the plaintiffs’ damages. One of the lawsuits was filed in the Central District Court in Israel with a motion for its recognition as a class action. As noted elsewhere in this report, reference to “silicosis claims” in this report includes claims for alleged bodily injuries, including silicosis and other illnesses, alleged to be associated with silica dust.
7
As of March 1, 2017, we had also received six pre-litigation letters threatening to file claims against us on behalf of certain fabricators and their employees in Israel. In 2016, we and other 11 respondents in Australia also received a pre-litigation notice from a fabricator. We were party to one lawsuit filed in the United States against us and 26 additional defendants, which was dismissed with respect to us.
The plaintiffs in such lawsuits claim that they contracted illnesses, including silicosis, through exposure to silica particles during cutting, polishing, sawing, grinding, breaking, crushing, drilling, sanding or sculpting our products. Silicosis is an occupational lung disease that is progressive and sometimes fatal, and is characterized by scarring of the lungs and damage to the breathing function. Inhalation of dust containing fine silica particles as a result of poorly protected and controlled, or unprotected and uncontrolled, exposure, while working in different occupations, including among other things, processing quartz and other materials that contain silica, can cause silicosis and other diseases. Silica comprises approximately 90% of engineered stones such as our products, and smaller concentrations of silica are present in natural stones. Therefore, in some of the lawsuits it is claimed that fabrication of engineered stones creates higher exposure to silica dust, and, accordingly, creates a higher risk of silicosis. In some of the lawsuits, such claims are supported by expert opinions or certain articles published by scientists.
Most of the claims asserted against us do not specify a total amount of damages sought and the plaintiffs’ future damages, if any, is intended to be determined at trial.
Although we intend to vigorously contest the pending claims, we cannot provide any assurance that we will be successful. As of December 31, 2016, we estimated that our total exposure with respect to all 87 then-pending lawsuits in Israel was approximately $17.7 million, although the actual outcome of such lawsuits may vary significantly from such estimate. We believe that we have $7.5 million of coverage under our product liability insurance, and accordingly, our net exposure with respect to such pending claims is estimated to be $10.2 million. We cannot make an estimate with respect to threatened claims of which we have received pre-litigation demands. Currently, only one lawsuit has been resolved by Israeli courts in a judgment and without settlement between the parties. Such judgment was later cancelled by the Supreme Court (except with respect to our distributor's liability, that is still subject to an appeal), following out of court settlements between some of the parties.
Any pending or future litigation is subject to significant uncertainty. Our estimated total net exposure with respect to pending claims is subject to change for a variety of reasons, including an unpredictable adverse development in the pending cases. We cannot estimate the number of potential claimants that may file claims against us in Israel or in other jurisdictions in the future or the nature of their claims. In addition, punitive damages may be awarded in certain jurisdictions, even though they are rare in Israel. We may be also subject to putative class action lawsuits in the future in Israel and abroad and we cannot be certain whether such claims will succeed in being certified or on their merits.
Any uninsured damages to which we are subject in existing or future potential litigation, the cost of defending any uninsured claims, compliance costs, and the loss of business from fabricators who no longer find it practical to fabricate our products, may have a materially adverse impact on our revenues and profits. Moreover, because Israeli law and the laws of several other jurisdictions recognize joint and several liability among co-defendants in civil suits, and because insurers of fabricators’ employers in Israel denied insurance coverage for such fabricators with respect to silicosis-related claims due to alleged silicosis exclusions in employment liability policies (similar exclusions may exist in other jurisdictions), even if we are found only partially liable to a plaintiff’s damages, the plaintiff may seek to collect all his damages from us, requiring us to collect separately from our co-defendants their allocated portion of the damages and there can be no assurance that we will succeed in such collection.
Consistent with the experience of other companies involved in silica-related litigation, there may be an increase in the number of asserted claims against us. Such claims could be asserted by claimants in different jurisdictions, including Israel, the United States, Canada, Australia and other markets where our products are distributed and sold and could result in significant legal expenses and damages. Although we believe that claimants in any future silica-related claims involving us should be limited to persons involved in the fabrication of our products and those in the immediate vicinity of fabrication activities, claimants may potentially also include our employees or end consumers, seeking compensation for bodily or emotional/non-physical damages.
8
Should there be significant increase in the number of claims against us in Israel and abroad, our management could expend significant time addressing such claims.
Fifteen employees of ours, out of which 13 are currently employed in our plants in Israel, have been banned by occupational physicians from working in a workplace with dust due to diagnose or suspected diagnose of silicosis or other lung diseases, and any expenses not covered by the NII which we may incur in this respect are not covered by our employer liability insurance. For more information related to silicosis claims made against us, see “ITEM 8.A: Financial Information— Legal Proceedings—Claims related to alleged silicosis injuries.”
Insurance Coverage
We currently have limited product liability insurance policies which apply to us and our subsidiaries and cover claims related to bodily injuries caused by hazardous dust, subject to certain terms and limitations. In recent years, we have been able to obtain such insurance only on less favorable terms than previously. If we are unable to renew our product liability insurances at all or in part from our current insurers or from others, or if we cannot obtain insurance on as favorable terms as previously, our insurance is terminated early, our insurance coverage is decreased, our insurance coverage inadequately covers damages for which we are found liable, or we become subject to silicosis-related claims excluded by our product liability insurance policy or by our employer liability insurance policy, we may incur significant legal expenses and become liable for damages, in each case, that are not covered by insurance. Such events might have a materially adverse effect on our business and results of operations.
Our product liability insurer notified us that it denied the insurance coverage with respect to some or all of the damages sought in the putative class action lawsuit
. We intend to vigorously contest such denial.
As of December 31, 2016, our insurance receivables totaled $7.5 million. Although we believe that it is probable that such receivables will be paid to us when such payments are due, if our insurers become insolvent in the future or for other reason do not pay such amounts in full or on a timely basis, such failure could have a material adverse effect on our financial results and cash flow. See also Note 10 to our financial statements included elsewhere in this report
.
For more information on our insurance coverage, see “ITEM 8.A: Financial Information— Legal Proceedings—Claims related to alleged silicosis injuries.”
Regulatory changes relating to hazards associated with exposure to silica dust in the engineered quartz surfaces
We may be required to make additional expenses to enhance our compliance with current and future laws, regulations or standards, Distributors and fabricators working with our products may also face engineering and compliance costs related to the fabrication of our products and similar products, which could cause them to resort to fabricating alternative products that do not carry the same risks associated with silica dust generated from the fabrication of our products.
In February 2015, the U.S. Occupational Safety and Health Administration (“
OSHA
”) and the U.S. National Institute for Occupational Safety and Health published a hazard alert identifying exposure to silica as a health hazard to workers involved in manufacturing, finishing and installing natural and manufactured (engineered) stone countertop products, both in fabrication shops and during in-home finishing and installation. Effective June 2016, OSHA lowered the permissible exposure limit to silica dust. Such change applies to fabricators in the U.S starting from June 23, 2017 and to our plant in Richmond Hill starting from June 23, 2018. In addition, in December 2015, the Israeli Ministry of Economy and Industry (“
IMEI
”) proposed a new law, aimed at improving the health protection and safety of persons engaged in fabrication of engineered quartz surfaces by imposing obligations to obtain permits for engineered stone fabrication and marketing. Under the proposed law, if accepted by the Israeli parliament, fabricators and sellers of quartz surfaces would be required to obtain licenses periodically, which may be issued subject to meeting certain requirements to be set by the IMEI. Such regulatory changes, if made and not effectively enforced or executed, or, if they impose a burden on the operations of fabricators and distributors, may materially and adversely impact our business in Israel, increase the market share of surfaces made from other materials and materially harm our financial results.
Similar regulatory changes may be made in other jurisdiction and cause changes to our industry that may not be favorable to us.
9
Our results of operations may be materially and adversely affected by fluctuations in currency exchange rates, and we may not have adequately hedged against them.
We conduct business in multiple countries, which exposes us to risks associated with fluctuations in currency exchange rates between the U.S. dollar (our functional currency since July 1, 2012) and other currencies in which we conduct business. In 2016, 43% of our revenues were denominated in U.S. dollars, 24.3% in Australian dollars, 15.9% in Canadian dollars, 8.9% in Euros and 7.9% in NIS. In 2016, the majority of our expenses were denominated in U.S. dollars, NIS and Euros, and a smaller proportion in Australian and Canadian dollars. As a result, weakening of the Australian and Canadian dollars and strengthening of the NIS and, to a lesser extent, the Euro against the U.S. dollar presents a significant risk to us and may impact our business significantly. For example, in 2016, the Australian dollar depreciated 1.3% against the U.S. dollar compared to 2015 on an annual average basis, which resulted in our operating income decreasing by $0.3 million, or 0.1% of our revenues in 2016, compared to 2015. In 2016, the Canadian dollar depreciated 3.7% against the U.S. dollar compared to 2015 on an annual average basis, which resulted in our operating income decreasing by $1.5 million, or 0.3% of our revenues in 2016, compared to 2015. We translate sales and other results denominated in foreign currency into U.S. dollars for our financial statements. During periods of a strengthening dollar, our reported international sales (and earnings, assuming the U.S. dollar strengthens equally against all other relevant currencies) would be reduced.
Although we currently engage in derivatives transactions, such as forward and option contracts, to minimize our currency risk, we do not hedge all of the exposure. We have been using a dynamic hedging strategy to hedge our cash flow exposures. This strategy involves consistent hedging of exchange rate risk in variable ratios ranging to up to 100% of the exposure over rolling 12 months. As of December 31, 2016, our average hedging ratio was approximately 43% out of our expected currencies exposure for 2017. Therefore, future currency exchange rate fluctuations against which we have not adequately hedged could materially and adversely affect our profitability. Moreover, our currency derivatives, except for our U.S. dollar/NIS forward contracts, are currently not designated as hedging accounting instruments under Accounting Standards Codification (“
ASC
”) 815, Derivatives and Hedging. Hedging results are charged to finance expenses, net, and therefore, do not offset the impact of currency fluctuations on our operating income. As an exception, starting from the middle of May 2014, our U.S. dollar/NIS forward contracts are charged to operating expenses. See “ITEM 11: Quantitative and Qualitative Disclosures About Market Risk.”
Changes in the prices of our raw materials have increased our costs and decreased our margins and net income in the past and may increase our costs and decrease our margins in the future.
In 2016, raw materials accounted for approximately 44% of our cost of goods sold. The cost of raw materials consists of the purchase prices of such materials and costs related to the logistics of delivering the materials to our manufacturing facilities.
Our raw materials costs are also impacted by changes in foreign currency exchange rates, mainly the euro as it relates to polyester and other raw materials purchased from Europe.
Quartz, which includes quartz, quartzite and other dry minerals (together referred to in this annual report as “quartz” unless otherwise specifically stated), is the main raw material component used in our products. Quartz accounted for approximately 37% of our raw materials cost in 2016. Our cost of sales and overall results of operations may be impacted significantly by fluctuations in quartz prices. For example, if our cost of quartz were to rise by 10%, we would experience a decrease of approximately 0.9% in our gross profit margin. In particular, from 2013 to 2015, we experienced selective price increases from our Turkish quartz suppliers, such that the average cost of quartz supplied to our facilities in Israel increased by approximately 3% and 4% in 2013 and 2014, respectively. For cost of quartz in 2016 and prior years, see “ITEM 5.A: Operating Results and Financial Review and Prospects—Operating Results— Cost of revenues and gross profit margin.” Any future increases in quartz prices could also have a materially adverse impact on our margins and net income.
Polyester, which acts as a binding agent in our products, accounted for approximately 32% of our raw materials costs in 2016. Accordingly, our cost of sales and overall results of operations may be impacted significantly by fluctuations in polyester prices. For example, if the cost of polyester was to rise by 10%, we would experience a decrease of approximately 0.8% in our gross profit margin. The cost of polyester we incur is a function of, among other things, manufacturing capacity, demand and the price of crude oil. Our cost of polyester fluctuated significantly over the years. In particular, in 2010, average polyester cost increased by approximately 9%, despite an approximately 20% increase of the cost denominated in euro, given a stronger NIS (our functional currency during this period) compared to the euro. We acquire polyester on a purchase order basis based on our projected needs for the subsequent one to three months. In recent weeks, we have been experiencing major pressure from our polyester suppliers to increase prices even during a period covered by purchase orders. For cost of polyester in 2016 and prior years, see “ITEM 5.A: Operating Results and Financial Review and Prospects—Operating Results— Cost of revenues and gross profit margin.”
10
Pigments are also used to manufacture our products. Although pigments account for a significantly lower percentage of our raw material costs than polyester, we encountered in the past and may experience in the future fluctuations in pigment prices. Such prices fluctuations may also may have a materially adverse impact our margins and net income. For cost of pigments in 2016 and prior years, see “ITEM 5.A: Operating Results and Financial Review and Prospects—Operating Results— Cost of revenues and gross profit margin.”
We have found that increases in prices may be difficult to pass on to our customers. If we are unable to pass on to our customers increases in raw materials prices, specifically in quartz, polyester and pigments, our margins and net income may be materially and adversely impacted.
The extent of our liability for environmental, health and safety, product liability and other matters may be difficult or impossible to estimate, and could negatively impact our financial condition and results of operations.
Our manufacturing facilities and operations in Israel and our manufacturing facility in the United States are subject to numerous Israeli and U.S. laws and regulations. For information on our facilities, see “ITEM 4.D: Information on Caesarstone—Property, Plants and Equipment.” Laws and regulations in both countries deal with environmental, health and safety, and other matters, as detailed in “ITEM 4.B: Information on Caesarstone—Business Overview—Environmental and Other Regulatory Matters.” Liability under these laws and regulations involves inherent uncertainties. Violations of environmental, health and safety laws and regulations may lead to civil and criminal sanctions against us, our directors, officers or employees. In some cases, liability under such laws and regulations may compel the installation of additional controls and subject us to substantial penalties, injunctive orders and facility shutdowns. If our operations are enjoined because of failure to comply with such regulations, the decrease in production could materially adversely affect our results of operations. Violations of environmental laws could also result in obligations to investigate or remediate potential contamination, third-party property damage or personal injury claims resulting from potential migration of contaminants off-site. We have identified in the past and may identify in the future compliance risks related to environmental and health and safety regulation standards. Preparation and implementation of mitigation plans for such risks may take time and during such time we may not be in full compliance with applicable laws and standards.
In addition, the operation of our manufacturing facilities in Israel and in the United States is subject to applicable permits, standards, licenses and approvals, such as business licenses for all our facilities, poisons permits and fire regulation authorities approvals in Israel, and air quality permit in Richmond Hill. As further described in “ITEM 4.B: Information on Caesarstone—Business Overview—Environmental and Other Regulatory Matters”, if we are unable to obtain, extend or maintain the business license for any of our plants in Israel, we would be required to cease operations at such location, which would materially adversely affect our results of operations. The business license for our Bar- Lev plant is currently in effect until March 15, 2017. We expect such business license to be extended by the municipal authorities for a specified term and we intend to seek subsequent extensions on an ongoing basis. We are also seeking to obtain building permits with respect to improvements and additions made to our manufacturing facilities in Israel. Our ability to obtain necessary permits and approvals for our manufacturing facilities may be subject to additional costs and possible delays beyond our initial projections. In addition, to demonstrate compliance with underlying permits licenses or approvals, we are required to perform a considerable amount of monitoring, record-keeping and reporting.
Generally, non-compliance with permits, licenses and approvals, their absence or incomplete documentation of our compliance status may result in the imposition of fines, penalties, orders and injunctions, and may also lead to operations stoppages. We may not have been, or may not be, at all times, in complete compliance with such requirements and we may incur material costs or liabilities in connection with such violations, or in connection with remediation at our sites, or third-party sites where it has been alleged that we have liability. We may also incur unexpected interruptions to our operations, administrative injunctions requiring operation stoppages, fines and other orders and penalties or be unable to renew our permits to operate our manufacturing facilities and expand the buildings at our manufacturing facilities to accommodate capacity increases.
11
From time to time, we face compliance issues related to our two manufacturing facilities in Israel. In December 2016, the Israeli Department of Labor Supervision at the Ministry of Labor, Social Affairs and Social Services (“
IMLSS
”) issued safety orders applicable to our Sdot-Yam plant instructing us to stop production in certain manufacturing processes in that plant and warning about the potential issuance of safety orders with respect to our Bar- Lev plant. Such orders, if they remained effective, would have led to the cessation of most of our production in Israel. The orders were issued as a result of alleged unprotected exposure of our employees to silica dust, styrene and acetone beyond permitted levels set forth in the applicable standards. Following IMLSS’s inspection of our facilities, it rescinded the orders. We are committed to control the level of exposure of our employees to silica dust, styrene and acetone and ensure such exposure is within the permitted levels set forth in applicable standards. Our employees use personal protection measures in areas at our plants where the level of dust and other hazardous materials is higher than the maximal permitted level. We cannot assure you that new safety orders or similar enforcement measures will not be issued in the future, and that we will succeed to have such orders rescinded. See “ITEM 4.B: Information on Caesarstone—Business Overview—Environmental and Other Regulatory Matters” for additional information on compliance with environmental, health and safety and other relevant regulations relating to our facilities, including with respect to our compliance with styrene ambient air standards, dust emission occupational health standards, the maintenance of poison permits, the disposal of waste water and the disposal of our sludge waste, in each case, at our Israeli facilities.
New environmental laws and regulations, new interpretations of existing laws and regulations, increased governmental enforcement of laws and regulations or other developments in Israel and in the United States could require us to make additional unforeseen expenditures. The requirements to be met, as well as the technology and length of time available to meet those requirements, continue to develop and change. These expenditures or costs for environmental compliance could have a materially adverse effect on our business’s results of operations, financial condition and profitability. The range of reasonably possible losses from our exposure to environmental liabilities in excess of amounts accrued to date cannot be reasonably estimated at this time.
In addition, due to the nature of some of our production facilities and manufacturing processes, we and our officers and directors could be subject to claims, fines, orders and injunctions due to workplace accidents involving our employees. If our employees do not follow and we do not successfully enforce the safety procedures established in our facilities, our employees may be subject to work related injuries. Although we maintain workers’ compensation insurance, it may not provide adequate coverage against potential liabilities.
Other than as described above, we cannot predict whether we may become liable under environmental and health and safety statutes, rules, regulations and case law of the countries in which we operate. The amount of any such liability in the future or its impact on our business operation otherwise could be significant and may adversely impact our financial condition and results of operations.
A key element of our strategy is to expand our sales in certain markets, such as the United States and Canada, which will require a substantial effort to build awareness and develop the quartz surface market and will also depend on our implementation of our go-to market strategy. Failure to expand such sales would have a materially adverse effect on our future growth and prospects.
A key element of our strategy is to grow our business by expanding sales of our products in certain existing markets that we believe have high growth potential, as well as in selected new markets. In particular, we intend to focus our growth efforts on the United States and Canada. In 2016, according to Freedonia, engineered quartz surfaces represented only 14% of the total countertops by volume installed in the United States. We face several challenges in creating demand for our products in the United States, Canada or other markets, including driving consumers’ desire to use quartz surfaces for their kitchen countertops and other interior settings. If the market for quartz surfaces does not develop as we expect or develops more slowly than we expect, our future growth, business, prospects, financial condition and operating results will be harmed. We may also seek to expand into additional markets in the future. Our success will depend, in large part, upon consumer acceptance and adoption of our products in these markets. Consumer tastes and preferences differ in the markets into which we are expanding as compared to those in which we already have substantial sales.
Our future growth and prospects in these markets also depend on the level of our execution, our go-to market strategy and its implementation. In connection with our growth strategy, Caesarstone USA and Caesarstone Canada Inc. (“
Caesarstone Canada
”)
entered into exclusive agreements with IKEA in May 2013 and October 2014, respectively. Caesarstone USA is also party to an agreement with Lowe’s Companies Inc. (“
Lowe’s
”). For more information, see “—Cooperation with large retailers could introduce uncertainty into our sales volumes, and our agreements with them may not be extended beyond their current terms, thus materially and adversely affecting our financial results. Additionally, our reliance on third-party suppliers to provide installation and fabrication services to large retailers could impair our relationship with our customers, which could materially harm our business and results of operations”.
12
We may also enter into similar agreements with other third parties. As part of our strategy to expand into selected new markets, in the first quarter of 2017, we started selling and distributing our products in the United Kingdom (“
U.K.
”) directly through our U.K. subsidiary, Caesarstone (UK) Ltd.
Cooperation with large retailers could introduce volatility into our sales volumes, and our agreements with them may not be extended beyond their current terms, thus having a materially adverse effect on our financial results. Additionally, our reliance on third-party suppliers to provide installation and fabrication services to large retailers could impair our relationship with our customers, which could materially harm our business and results of operations.
Caesarstone USA and Caesarstone Canada have exclusive agreements with IKEA, under which we serve as the exclusive non-laminate countertop vendors for IKEA in the U.S. and Canada, respectively. Pursuant to the agreements, we supply, fabricate and install countertops, primarily from our quartz surfaces, which are marketed by IKEA without a brand name. We also supply, fabricate and install solid surface countertop, which we source from a third party. These agreements have been extended until the end of 2017. We believe that it is likely that the IKEA agreements will be extended, however, there is no assurance that such renewal will be made at similar terms or at all. In case that they are not renewed, with the cessation of our sales through IKEA U.S. and IKEA Canada, our revenue in the U.S. and Canada would significantly decrease.
Additionally, Caesarstone USA entered into an agreement with Lowe’s, under which Caesarstone USA fabricates and installs an overlay solution made of our products designed to be installed over existing countertops on a non-exclusive, purchase order basis to Lowe’s. We have commenced offering our products and related services in several Lowe’s stores in the United States in the first quarter of 2017. Our agreement with Lowe’s is effective until May 5, 2017 and is automatically renewed on a year-to-year basis thereafter, unless terminated earlier in accordance with its terms. There is no assurance that this agreement will be renewed or that Lowe’s will issue any specific amount of purchase orders under this agreement. Our sales to any retailers, including IKEA and Lowe’s, may be affected, among other things, by their sales and promotional events, the timing and scope of which is determined exclusively by the retailers and can impact our sales volume. Accordingly, our sales through IKEA in the U.S. and Canada have been, and may continue to be, volatile, and we may not be able to maintain or increase such sales.
To fulfill our obligations under our contracts with IKEA and Lowe’s, we have entered into arrangements with third parties for the supply of solid surface materials and fabrication and installation services to IKEA and Lowe’s and we may enter into such agreements with other third parties, in addition to or in lieu of the existing ones. The success of these third-party relationships may impact our supply of countertops, inventory levels, quality and service level standards and ability to manage the installation and fabrication of countertops to meet customers’ demands and at reasonable prices. If we are unable to successfully manage the installation and fabrication services performed for us by these third-party fabricators and installers, we may experience relatively high waste of our products used by fabricators for such works, and end-consumers may voice complaints with respect to supply time, quality and service level of the fabrication and installation, including defects and damages. Such risks related to the fabrication and installation services provided by us could expose us to warranty-related damages, which if not covered back-to-back by the fabricators engaged by us, could have a materially adverse effect on our financial results, reputation and brand position and lead to the termination of our agreements with IKEA or Lowe’s. Our gross profit margins on our sales through IKEA are significantly lower than our average gross profit margins, mainly due to the inclusion of fabrication and installation services, which are sourced from third parties and generate minor margins. However, because our marketing and sales efforts associated with such large retailers are lower than the efforts to sell in other segments of the market, our operating margins on our products and services sold to IKEA are similar to other segments. Although there is no assurance and actual results may vary, we expect our margins related to our sales through Lowe's U.S. to be similar over time.
13
Any difficulties with, damage to, interruptions of, or inefficiencies in our manufacturing could impair or delay our output of products and harm our relationships with our customers and suppliers. If we are unable to continue to manufacture our existing products globally as planned, and to increase our manufacturing capacity at our U.S. plant, our results of operations and future prospects will suffer.
Any difficulties with or interruptions of our manufacturing operations could delay our output of products and harm our relationships with our customers. Currently, we manufacture all of our products at our two facilities in Israel and our facility in the U.S. Since opening our facilities in the U.S. in 2015, we have experienced certain inefficiencies due to challenges related to the ramp up of the plant, such as building an experienced workforce, processes’ implementation, engineering optimization and other factors. Such inefficiencies include lower than expected throughput, yield and, as a result, higher than expected manufacturing cost per square meter produced. We believe that the performance of the plant will gradually improve. If we are unable to timely improve the performance of our Richmond-Hill facility, such inefficiencies will continue, we may experience disruptions in our operations and may be unable to meet demand for our products, which could have a negative impact on our business and financial results. In addition, if we are missing capacity to fulfill the demand for our products, we may be required to outsource certain parts of our manufacturing, which may lead to increased costs and affect the quality of our products and our reputation. Due to the specialized nature of our manufacturing equipment and the quartz surface industry, we have had so far limited ability to outsource any part of our manufacturing to third parties. Our manufacturing production lines are comprised mainly of machinery from Breton S.p.A. (“
Breton
”), a manufacturer of lines for the production of engineered stone slabs, from which we have purchased the majority of our production lines. Pursuant to our agreement with Breton, dated October 18, 2012, we acquired and installed our fifth production line at our Bar-Lev manufacturing facility. That agreement also included an option to purchase an additional line, which we subsequently exercised in 2013 in connection with our acquisition of the first production line for our facility in Georgia, United States. We entered into an agreement with Breton for the acquisition of our second production line for the same facility on June 5, 2014. We depend on Breton for certain spare parts for our production line equipment and new production lines, which we may decide to acquire in order to increase our manufacturing capacity to meet the growing demand for our product, and anticipate we will continue to do so in the future. Inability or delays in obtaining machinery or specialty machine components and spare parts from Breton could prevent or delay our output of products and any future production line expansion plans.
Damage to our manufacturing facilities or products caused by human error or negligence, software or hardware failures, physical or electronic security breaches, power loss or other failures or circumstances beyond our control, including acts of God, fire, explosion, flood, war, insurrection or civil disorder, acts of, or authorized by, any government, terrorism, accident, labor trouble or shortage, or inability to obtain materials, equipment or transportation could interrupt or delay our manufacturing or other operations. We may also encounter difficulties or interruptions as a result of the application of enhanced manufacturing technologies or changes to production lines to improve our throughput or to upgrade or repair our existing manufacturing lines.
Labor disputes or enforcement actions by environmental and health and safety authorities could result in a full or partial work stoppage or strikes by employees, as the case may be, that could delay or interrupt our output of products.
Our insurance policies have limited coverage in case of significant damage to our manufacturing facilities and may not fully compensate us for the cost of replacement and any loss from business interruptions. As a result, we may not be adequately insured to cover losses in the case of significant damage to our manufacturing facilities. Any damage to our facilities or interruption in manufacturing, whether due to limitations in manufacturing capacity or arising from factors outside of our control, could result in delays or failure in meeting contractual obligations and could have a materially adverse effect on our relationships with our distributors and customers, and on our financial results.
If demand for our products continues to grow, we may need to further expand our manufacturing facility in the United States or elsewhere. If we fail to achieve this further expansion, we may be unable to grow our business and revenue, maintain our competitive position or improve our profitability.
During 2015, we expanded our production capacity to meet anticipated demand through the construction of a new manufacturing facility with capacity for two production lines in our U.S. facility in Richmond Hill, Georgia. The first production line in this facility became operational in the second quarter of 2015 and the second production line became operational in the fourth quarter of 2015. Our investment related to the U.S. facility was approximately $135 million in total. In addition to this investment, we have started initial steps towards establishing an additional facility in Richmond Hill to accommodate additional manufacturing capacity in the future as needed to satisfy potential demand
.
Although we have experience running existing manufacturing facilities for our quartz surfaces in Israel, our Richmond Hill facility is our first manufacturing facility outside of Israel and we have been facing challenges in effectively ramping up its production. Although we believe that we will significantly improve the efficiency and throughput of our plant in the U.S, we cannot assure you that we will be able to successfully manage manufacturing facilities in the U.S., or elsewhere, in a timely or profitable manner. Our ability to successfully operate our current U.S facility and any additional facility we may establish in the U.S. or elsewhere in the future will greatly depend on our ability to hire, train and retain an adequate number of employees, in particular employees with the appropriate level of knowledge, background and skills. Should we be unable to hire and retain such employees, and an adequate number of them, our business and financial results could be negatively impacted. Moreover, if we are unable to establish and/or operate these facilities or successfully transfer or continue to transfer our manufacturing processes in a timely and cost-effective manner, or at all, then we may experience disruptions in our operations and be unable to meet demand for our products, which could have a negative impact on our business and financial results.
14
To increase our manufacturing capacity, in our U.S. facility or elsewhere, we depend on third-party construction companies to assist in the design, construction and validation of our new facilities, as well as on machinery and equipment suppliers. Actual costs related to the establishment of such additional facilities, as well as the timing of completing the construction, may be materially different from what we are estimating. In addition, we may need to obtain a number of permits and regulatory approvals with respect to any additional facility and production lines operation. Delays in receiving these approvals could impair our profit margins in these facilities, thus materially and adversely affecting our business and results of operations. Moreover, to meet our future capacity expansion timeline, we are dependent on certain capital equipment manufacturers, third party contractors and machinery suppliers, such as Breton. Breton’s lines include technological improvements and specifications that may not be currently available at other relevant machinery suppliers. If Breton ceases its operations, at all or in part, or does not have sufficient capacity, it could materially delay or prevent our ability to complete the establishment of additional production lines.
In addition, we believe that any such new investment will cause temporary inefficiencies that will adversely impact our margins. In 2016 and 2015, our margins were adversely impacted by temporary inefficiencies in the performance of the first two production lines in our U.S. facility and by the higher costs we incurred relative to the revenue we have generated from these lines. We believe that our efficiency in our U.S. facility will improve over time.
If we are missing capacity to fulfill the demand for our products, we may be required to outsource certain parts of our manufacturing, which may lead to increased costs and affect the quality of our products and our reputation. Conversely, if the demand for our products decreases or if we do not produce the number of products that we expect to produce after the expansion projects are complete and operational, due to our fixed operational expenses our financial condition and results of operations may be negatively impacted.
We may encounter significant delays in manufacturing if we are required to change the suppliers for the raw materials used in the production of our products.
Our principal raw materials are quartz, polyester and pigments. We acquire quartz from quartz manufacturers from Turkey, India, Israel and a number of European countries. We do not have long-term supply contracts with our suppliers of quartz and execute purchase orders from time to time. In 2016, approximately 68% of our quartz was imported from four suppliers in Turkey and we expect a similar level in 2017. We acquire polyester mainly from two suppliers, on a purchase order basis, based on our projected needs for the subsequent one to three months. Such suppliers are unwilling to agree to preset prices for periods longer than a quarter, and their prices may be volatile. We acquire other raw materials used in our products from a limited number of suppliers on a purchase order basis.
We cannot be certain that any of our current suppliers will continue to provide us with the quantities of raw materials that we require or satisfy our anticipated specifications and quality requirements. We may also experience a shortage of such materials if, for example, demand for our products increases. For instance, in recent years, there have been significant tensions between Turkey and the State of Israel that have raised questions as to whether commercial arrangements between companies in these countries would be adversely impacted to a material extent. If tensions between Turkey and Israel worsen, our Turkish suppliers may not provide us with quartz shipments. We expect our agreements with Turkish quartz suppliers with respect to prices and quantities to remain unchanged through the end of 2017. However, if they fail to perform in accordance with these arrangements, we may not be successful in enforcing them.
If we are unable to agree upon prices with suppliers of our raw materials, or effectively enforce the terms of any verbal or written agreements or understandings which we may have with any of them, our suppliers could cease supplying us with the raw materials required for our products. If our supply of quartz, polyester and other raw materials is adversely impacted to a material extent or if, for any other reason, any of our suppliers does not perform in accordance with our agreements with them, if any, or ceases supplying us with the relevant material, for any reason, we would need to locate and qualify alternate suppliers. This could result in substantial delays in manufacturing, increase our costs, negatively impact the quality of our products or require us to adjust our products and our manufacturing processes. Any such delays in or disruptions to the manufacturing process could materially and adversely impact our reputation, revenues and results of operations as well as other business aspects, such as our ability to serve our customers and meet their order requests.
For more information with regards to suppliers of raw materials used in our products, see “ITEM 4.B: Information on Caesarstone—Business Overview—Raw materials and Service Provider Relationships.”
15
We continuously explore opportunities for additional growth and business expansion, and may pursue a wider product offering, including introducing new products and materials. Such new initiatives may be unsuccessful, and may divert management’s attention and negatively affect our margins and results of operations.
Our competitive advantage is due, in part, to our ability to develop and introduce innovative new and improved products and strengthen our brand. To maintain such advantage, strengthen our position in the market and grow our business, we may introduce new surface materials, introduce quartz surfaces designated for certain market segments under Caesarstone or another brand, and diversify our existing products offering through complementary products, such as sinks. Introducing new products involves uncertainties, such as gauging changing consumer preferences, developing, manufacturing, marketing and selling new technologies, products and materials, and entering into new market segments. Even if we decide to introduce new products and enter new markets, whether through cooperation with third party manufacturers or manufacturing at our own facilities, we may not be successful in capturing the market share dominated by competitors in this area, offer innovative alternatives ahead of the competition or maintain the strength of our brand. Such new initiatives may require increased time and resources from our management, result in higher than expected expenses and have a material adverse effect on our margins and results of operation.
Our operating results may suffer due to our failure to manage our international operations effectively or due to regulatory changes in international jurisdictions where we operate.
Our products are sold in over 50 countries throughout the world, our raw materials, equipment and machinery are acquired in different countries and our products are manufactured in Israel and the United States. We are therefore subject to risks associated with having international operations. In 2016, 92.1% of our revenues were derived from sales outside Israel. We anticipate that sales from operations outside of Israel will continue to represent a significant portion of our total sales. Our sales, purchases and operations outside of Israel are subject to risks and uncertainties, including:
| • |
fluctuations in exchange rates;
|
| • |
fluctuations in land and sea transportation costs, as well as delays in transportation and other time-to-market delays, including as a result of strikes;
|
| • |
unpredictability of foreign currency exchange controls;
|
| • |
compliance with unexpected changes in regulatory requirements;
|
| • |
compliance with a variety of regulations and laws in each of the jurisdictions we operate, where we purchase raw materials, equipment or machinery or where our products are sold;
|
| • |
difficulties in collecting accounts receivable and longer collection periods;
|
| • |
changes in tax laws and interpretation of those laws; and
|
| • |
difficulties enforcing intellectual property and contractual rights in certain jurisdictions.
|
In addition, certain jurisdictions could impose taxes, tariffs, quotas, custom duties, trade barriers and other similar restrictions on our sales, purchases and exports.
Changes in laws, regulations or governmental policies in jurisdictions in which we operate or where our products are sold may impact our business. We may depend on distributors and agents outside of Israel for compliance and adherence to local laws and regulations. If we are found to be in violation of the Foreign Corrupt Practices Act (“
FCPA
”), the U.K. Bribery Act or other anti-bribery laws (either due to acts or inadvertence of our employees, or due to the acts or inadvertence of others), we could suffer criminal or civil penalties or other sanctions, which could have a materially adverse effect on our business.
16
Significant political or regulatory developments, such as those
stemming from the recent change of the presidential administration in the U.S. or the U.K.’s “Brexit” referendum could have a materially adverse effect on us. In the United States, the new presidential administration
expressed support for and may implement greater restrictions on free trade and increases tariffs on goods imported into the United States, as well as a comprehensive tax reform, including in corporate and income taxation. While we cannot predict whether quotas, duties, tariffs, taxes or other similar restrictions will be imposed by the United States or other countries upon the import or export of our products in the future, given our significant sales, distribution, import and manufacturing operations in the U.S., changes in U.S. political, regulatory and economic conditions or in its policies governing international trade and foreign manufacturing and investment in the U.S. could materially and adversely affect our business.
In the United Kingdom, a recent referendum was held in which voters approved an exit from the European Union (“
E.U
.”), commonly referred to as ”Brexit.”
On February 8, 2017, the U.K.’s House of Commons approved a bill authorizing the government to start exit talks with the E.U.
The impact on us from Brexit will depend, in part, on the outcome of tariff, trade, regulatory and other negotiations. Brexit could also lead to legal uncertainty and potentially divergent national laws and regulations as the U.K. determines which E.U. laws to replace or replicate, any of which could materially and adversely affect our business, financial condition, operating results and cash flows.
Separately, our business operations could be interrupted and negatively affected by economic changes, geopolitical regional conflicts, terrorist activity, political unrest, civil strife, acts of war, strikes and other economic or political uncertainties. For example, a residential construction strike in Toronto in May 2016 affected our ability to timely supply our products in part of Canada and could have had further negative effect on our operations if it persisted. All of these risks could also result in increased costs or decreased revenues, either of which could have a materially adverse effect our profitability.
As we continue to expand our business globally, we may have difficulty anticipating and effectively managing these and other risks that our global operations may face, which may materially and adversely affect our business outside of Israel and our financial condition and results of operations.
The steps that we have taken to protect our brand, technology and other intellectual property may not be adequate, and we may not succeed in preventing others from appropriating our intellectual property.
We believe that our trademarks (registered and unregistered) are important to our brand, success and competitive position. We anticipate that, as the quartz surface market becomes increasingly competitive, maintaining and enhancing our brand, proprietary technology and other intellectual property may become more important, difficult and expensive. In the past, some of our trademark applications for certain classes of applications of our products have been rejected or opposed in certain markets and may be rejected for certain application classes in the future, in all or parts of our markets, including without limitation, for flooring and wall cladding. We have in the past, are currently, and may in the future be, subject to opposition proceedings with respect to applications for registration of our intellectual property, including but not limited to our trademarks. These barriers to registering our brand names and trademarks in various countries may restrict our ability to promote and maintain a cohesive brand throughout our key markets, which could materially harm our competitive position and materially and adversely impact our results of operations. Additionally, if we are unsuccessful in challenging a third party’s products on the basis of trademark infringement, continued sales of such products could materially and adversely affect our sales and our brand and result in the shift of consumer preference away from our products.
We have obtained patents for certain of our technologies and products, and have several pending patent applications that were filed in various jurisdictions, including the United States, Europe, Australia, Canada, China and Israel. There can be no assurance that new or pending applications will be approved in a timely manner or at all, or that such patents will effectively protect our intellectual property. There can be no assurance that we will develop patentable intellectual property in the future, and we have chosen and may further choose not to pursue patents for innovations that are material to our business.
17
Despite our efforts to execute confidentiality agreements with our employees and managers, our know-how and trade secrets could be disclosed to third parties, which could cause us to lose any competitive advantage resulting from such know-how or trade secrets, as well as related intellectual property protections in certain cases.
The actions we take to establish and protect our intellectual property may not be adequate to prevent unlawful copy and use of our technology by third parties or imitation of our products and the offering of them under our trademarks by others. These actions may also not be adequate to prevent others, including our competitors, from obtaining intellectual property rights overcoming ours, and limiting or blocking the production and sales of our existing or future products and applying certain technologies. Our competitors may seek to limit our marketing and offering of products relying on their alleged intellectual property rights.
We may face significant expenses and liability in connection with the protection of our intellectual property rights outside the United States. The laws of certain foreign countries may not protect intellectual property rights to the same extent as the laws of the United States. For example, historically, China has not protected intellectual property rights to the same extent as the United States, and infringement of intellectual property rights continues to pose a serious risk to doing business in China.
Third parties have claimed, and may from time to time claim, that our current or future products infringe their patent or other intellectual property rights. Under such circumstances, we may be required to expend significant resources in order to contest such claims and, in the event that we do not prevail, we may be required to seek a license for certain technologies, develop non-infringing technologies or stop the sale of some of our products. In addition, any future intellectual property litigation, regardless of its outcome, may be expensive, divert the efforts of our personnel and disrupt or damage relationships with our customers.
For more information, see “ITEM 4.B: Information on Caesarstone—Business Overview—Intellectual Property”.
Our directors and executive officers who are members of Kibbutz Sdot-Yam and Tene may have conflicts of interest with respect to matters involving the
Company.
Kibbutz Sdot-Yam, or the Kibbutz, which beneficially owned 33.3% of our shares as of March 1, 2017, entered into a voting agreement with
Tene Investment in Projects 2016 Limited P
artnership (“
Tene
”) following which both the Kibbutz and Tene are deemed the Company’s controlling shareholders under the Israeli Companies Law. The Kibbutz and Tene also agreed to use their best efforts to prevent any dilutive transactions that would reduce the Kibbutz’s holdings in us below 26% on a fully diluted basis and to cause that at least four directors on behalf of the parties are elected to our board of directors. For more information, see “ITEM 7.A. Major Shareholders and Related Party Transactions—Major Shareholders.” One member of our board of directors and a number of our key employees are members of the Kibbutz. Certain of these individuals also serve in different positions in the Kibbutz, including business manager of the Kibbutz. Such individuals have fiduciary duties to both us and Kibbutz Sdot-Yam. As a result, our directors and executive officers who are members of the Kibbutz may have real or apparent conflicts of interest on matters affecting both us and the Kibbutz and, in some circumstances, such individuals may have interests adverse to us. For example, in the annual general meeting of our shareholders held in December 2015, the Kibbutz opposed the independent nominees our board of directors proposed to nominate to the board and suggested two alternative nominees identified by the Kibbutz as independent. In addition, two members of our board of directors, including the chairman of the board of directors, also serve as partners in Tene. Since these individuals have fiduciary duties to both us and Tene, there may be real or apparent conflicts of interest in this respect as well. See “ITEM 6.A: Directors, Senior Management and Employees—Directors and Senior Management.”
Consolidation in our industry may increase the competitive pressures to which we are subject and may enhance our competitors’ manufacturing, sales and marketing capabilities.
Due to the highly fragmented nature of the quartz surface market, consolidation may occur and a smaller number of large companies may take leading market positions. We believe we would encounter strong competition from any such larger companies following their consolidation. Larger companies are likely to benefit from economies of scale associated with quartz surface manufacturing that are becoming important to remain competitive in an increasingly global quartz surface market. Such economies of scale will be increasingly important as the quartz surface market matures in the future. In addition, larger companies may have significantly greater resources than we do to penetrate markets, in particular, by investing significant sums in raising awareness for their brand among end-consumers in order to drive sales of their products, as well as by operating manufacturing facilities closer to customers and end-consumers in various regions worldwide. If we are unable to grow our business organically or undertake our own acquisitions, we may lose market share, which could have a materially adverse effect on our business, financial condition and results of operations.
18
We have experienced quarterly fluctuations in revenues and net income as a result of seasonal factors and building construction cycles, which are hard to predict with certainty.
Our results of operations are impacted by seasonal factors, including construction and renovation cycles. We believe that the third quarter of the year exhibits higher sales volumes than other quarters because demand for quartz surface products is generally higher during the summer months in the northern hemisphere when the weather is more favorable for new construction and renovation projects, as well as due to efforts to complete such projects before the beginning of the new school year. Conversely, the first quarter is impacted by a slowdown in new construction and renovation projects during the winter months as a result of adverse weather conditions in the northern hemisphere, and, depending on the date of the spring holiday in Israel in a particular year, the first or second quarter is impacted by a reduction in sales in Israel due to such holiday. Similarly, sales during the first quarter in Australia are negatively impacted by fewer construction and renovation projects due to public holidays. In the third quarter of 2016, we generated 23.4% more revenue and a 63.1% higher adjusted EBITDA than the first quarter of 2016. Adverse weather in a particular quarter or a prolonged winter period can also impact our quarterly results. Our future results of operations may experience substantial fluctuations from period to period as a consequence of such adverse weather. Increased or unexpected quarterly fluctuations in our results of operations may increase the volatility of our share price and cause declines in our share price even if they do not reflect a change in the overall performance of our business.
Our limited resources and significant competition for business combination or acquisition opportunities may make it difficult for us to complete a combination or acquisition, and any combination or acquisition that we complete may disrupt our business and fail to achieve our intended objectives.
While we believe there are a number of target businesses we might consider acquiring, including, in certain instances, our distributors, manufacturers of quartz surfaces and other surfaces like ceramic, we may be unable to persuade those targets of the benefits of a combination or acquisition. Our ability to compete with respect to a combination with or acquisition of certain larger target businesses will be determined by, among other factors, our available financial resources. This inherent competitive limitation may give others an advantage in pursuing such combinations or acquisitions.
Any combination or acquisition that we effect will be accompanied by a number of risks, including the difficulty of integrating the operations and personnel of the acquired business, the potential disruption of our ongoing business, the potential distraction of management, expenses related to the acquisition and potential unknown liabilities associated with acquired businesses. In connection with any acquisition, we may encounter liabilities in the future associated with its business that we did not experience prior to the acquisition or that were unknown at the time of acquisition that could have a materially adverse impact on our results of operations. Any inability to integrate completed combinations or acquisitions in an efficient and timely manner could have a materially adverse impact on our results of operations. In addition, we may not recognize the expected synergies or benefits in connection with a future combination or acquisition. If we are not successful in completing combinations or acquisitions that we pursue in the future, we may incur substantial expenses and devote significant management time and resources without a successful result. Acquisitions which may include the expansion of our business into new products, like ceramic, and new applications, could distract our management attention, impose high expenses and investments and expose our business to additional risks. Such acquisitions carry further risks associated with the entry into new business lines in which we do not have previous experience, and there can be no assurance that any such business expansion would be successful. In addition, future combinations or acquisitions could require the use of substantial portions of our available cash or result in dilutive issuances of securities.
We are subject to litigation, disputes or other proceedings, which could result in unexpected expenses and time and resources that could have a materially adverse impact on our results of operation, profit margins, financial condition and liquidity.
We are currently involved in several legal disputes, including against Kfar Giladi Quarries Agricultural Cooperative Society Ltd. and our former south African agent, World of Marble and Granite, as further detailed in “ITEM 8.A: Financial Information—Consolidated Financial Statements and Other Financial Information—Legal Proceedings.” In addition, from time to time, we are involved in other legal proceedings and claims in the ordinary course of business related to a range of matters, including contract law, intellectual property rights, employment, product liability and warranty claims and claims related to modification and adjustment or replacement of product surfaces sold.
19
The outcome of litigation and other legal matters is always uncertain,
and the actual outcome of any such proceedings may materially differ from estimates
.
An adverse ruling in these proceedings could have a materially adverse effect on us. If we are unsuccessful in defending such claims or elect to settle any of these claims, we could incur material costs and could be required to pay varying amounts of monetary damages, some of which may be significant, and/or incur other penalties or sanctions, some or all of which may not be covered by insurance. Although we maintain product liability insurance, we cannot be certain that our coverage, if applicable, will be adequate for liabilities actually incurred or that insurance will continue to be available to us on economically reasonable terms, or at all. These material costs could have a materially adverse effect on our business, results of operations and financial condition.
Our distributors’ actions may have a materially adverse effect on our business and results of operations.
Our results of operations may be further impacted by the actions of our re-sellers in the United States.
Sales to third-party distributors accounted for 9.9% of our revenues in 2016. In our indirect markets, we depend on the success of the selling and marketing efforts of our third-party distributors, and any disruption in our distribution network could materially impair our ability to sell our products or market our brand, which could materially and adversely affect our business and results of operations. As we have limited control over these distributors, their actions could also materially harm our brand and company reputation in the marketplace.
In the majority of our distribution arrangements, we operate on the basis of an initial agreement or general terms of sale or, in certain cases, without any agreement, in writing or at all. The lack of a written agreement with many of our distributors may lead to ambiguities, costs and challenges in enforcing terms of such arrangements, including where we wish to terminate early due to the distributor’s failure to meet annual sales targets. We have experienced difficulties, including litigation, in connection with the termination of certain of our distributors due to disputes regarding their terms of engagement. See “ITEM 8.A: Financial Information—Consolidated Financial Statements and Other Financial Information—Legal proceedings.” Additionally, we may be unable to distribute our products through another distributor within the territory during the period in which we must give prior termination notice, or to identify and retain new distributors upon termination, which may materially and adversely impact our market share, results of operations, relationships with our customers and end-consumers and brand reputation. Because some of our distributors operate on nonexclusive terms, distributors may also distribute competitors’ quartz surfaces or other surface materials, which may cause us to lose market share.
In the U.S., we supply our products in part to sellers who in turn re-sell them to fabricators, contractors, developers and builders. Certain actions by such third parties may also materially harm our brand and reputation.
The termination of arrangements with distributors and re-sellers may lead to litigation, resulting in significant legal fees for us and detracting our management’s effort, time and resources. In addition, our distributors worldwide, and our re-sellers in the U.S., generally disclose to us sales volumes and other information on a monthly or quarterly basis. An inaccurate sales report, the revision of a sales report on which we have already relied or our failure to understand correctly the information in a sales report could cause significant, unexpected volatility in our sales to a distributor or a re-seller during a particular period, including due to accumulated excess inventory, and may impact our ability to make plans regarding our supply chain. Any of these events could materially and adversely affect or cause unexpected fluctuations in our results of operations.
Disruptions to our information technology systems due to cyber-attacks or our failure to upgrade and adjust our information technology systems globally, may materially impair our operations, hinder our growth and materially and adversely affect our business and results of operations.
We believe that an appropriate information technology (“
IT
”) infrastructure is important in order to support our daily operations and the growth of our business. If we experience difficulties in implementing new or upgraded information systems or experience significant system failures, or if we are unable to successfully modify our management information systems or respond to changes in our business needs, we may not be able to effectively manage our business, and we may fail to meet our reporting obligations.
20
Additionally, if our current back-up storage arrangements and our disaster recovery plan are not operated as planned, we may not be able to effectively recover our information system in the event of a crisis, which may materially and adversely affect our business and
results of operations.
We can provide no assurance that our current IT system, the IT systems of our distributors or re-sellers or the IT systems of online paying agents that we use, are fully protected against third-party intrusions, viruses, hacker attacks, information or data theft or other similar threats.
With respect to our internal systems, we have experienced and expect to continue to experience actual or attempted cyber-attacks of our IT networks; none of these actual or attempted cyber-attacks has had a material impact on our operations or financial condition. However, a cyber-attack that bypasses our IT security systems or those of our distributors, re-sellers or online paying agents, causing an IT security breach, could lead to a material disruption of our information systems, the loss of business information and loss of service to our customers.
Additionally, we have access to sensitive customer information in the ordinary course of business. If a significant data breach occurred, our reputation may be materially and adversely affected, confidence among our customers may be diminished, or we may be subject to legal claims, any of which may contribute to the loss of customers and have a material adverse effect on us.
In addition, the continued worldwide threat of terrorism and heightened security in response to such threat may cause further disruptions and create further uncertainties or may otherwise materially harm our business. To the extent that such disruptions or uncertainties result in delays or cancellations of customer orders or the manufacture or shipment of our products, or in theft, destruction, loss, misappropriation or release of our confidential data or our intellectual property, our business and results of operations could be materially and adversely affected.
We may have exposure to greater-than-anticipated tax liabilities.
We have entered into transfer pricing arrangements that establish transfer prices for our inter-company operations. However, our transfer pricing procedures are not binding on the applicable taxing authorities. The amount of income tax that we pay could be materially and adversely affected by earnings being lower than anticipated in jurisdictions where we have lower statutory rates and higher than anticipated in jurisdictions where we have higher statutory rates. From 2015 onward, our U.S. manufacturing operations also carry inter-company transactions at transfer prices and arrangements set by us. We cannot be certain that tax authorities will not disfavor our inter-company arrangements and transfer prices in the relevant jurisdictions. Taxing authorities outside of Israel could challenge our allocation of income between us and our subsidiaries and contend that a larger portion of our income is subject to tax in their jurisdictions, which may have higher tax rates than the rates applicable to such income in Israel. Any adjustment in one country while not followed by counter-adjustment in the other country may lead naturally to double taxation for the group. Any change to the allocation of our income as a result of review by such taxing authorities could have a negative effect on our operating results and financial condition.
Our facilities in Israel receive different tax benefits as “Preferred Enterprises” under the Israeli Law for the Encouragement of Capital Investments, 1959 (“
Investment Law
”), with our production lines qualifying to receive different grants and/or reduced company tax rates. Therefore, some of our production lines also receive tax benefits based on our revenues and the allocation of those revenues between the two facilities in Israel. As a result, the Israeli taxing authorities could challenge our allocation of income between these two facilities and contend that a larger portion of our income is subject to higher tax rates. In Israel, there are no tax benefits to production outside of the country. As such, our portion of taxable income in Israel that relates to the U.S. manufacturing facility will have no tax benefits. The ITA could challenge the allocation of income related to production in Israel and income related to production outside of Israel, which may result in significantly higher taxes. There are currently no legal regulations governing this allocation and certain of the ITA’s internal guidelines have ambiguities. Moreover, we may lose all of our tax benefits in Israel in the event that our manufacturing operations outside of Israel exceed certain production levels (currently set at 50% of the overall production and subject to future changes by the ITA). We do not foresee such circumstances as probable in the coming years.
The determination of our worldwide provision for income taxes and other tax liabilities requires significant judgment, and there are many transactions and calculations where the ultimate tax determination is uncertain. We have applied the guidance in ASC 740, “Income Taxes” in determining our accrued liability for unrecognized tax benefits, which totaled approximately $1.3 million as of December 31, 2016. Although we believe our estimates are reasonable, the ultimate outcome may differ from the amounts recorded in our financial statements and may materially affect our financial results in the period or periods for which such determination is made.
21
We are entitled to a property tax abatement with respect to our U.S. manufacturing facility for ten years at 100% and an additional five years at 50%, subject to our satisfaction of certain qualifying terms with respect to headcount, average salaries paid to our employees and total capital investment amount in our U.S. manufacturing facility. The tax abatement is granted pursuant to bond purchase loan agreements we entered into with the Development Authority of Bryan County. If we do not meet the qualifying terms of the bond, we will bear the applicable property tax, which will be recognized in our operating costs and which would materially and adversely impact our projected margins and results of operations. See “ITEM 4.D: Information on Caesarstone- Property, Plants and Equipment.”
We depend on our senior management team and other skilled and experienced personnel to operate our business effectively, and the loss of any of these individuals could materially and adversely affect our business and our future financial condition or results of operations.
We are dependent on the skills and experience of our senior management team and other skilled and experienced personnel. These individuals possess strategic, managerial, sales, marketing, operational, manufacturing, logistical, financial and administrative skills that are important to the operation of our business.
We have experienced and may continue to experience employee and management turnover. T
he loss of any of these individuals and the inability to attract, retain and maintain additional personnel, each could prevent us from implementing our business strategy and could materially and adversely affect our business and our future financial condition or results of operations. We do not carry key man insurance with respect to any of our executive officers or other employees. We cannot assure you that we will be able to retain all of our existing senior management personnel and key personnel or to attract additional qualified personnel when needed.
Risks related to our relationship with Kibbutz Sdot-Yam
Our headquarters and one of our two manufacturing facilities in Israel are located on lands leased by Kibbutz Sdot-Yam from the Israel Lands Administration and the Edmond Benjamin de Rothschild Caesarea Development Corporation Ltd. If we are unable to continue to lease such lands from Kibbutz Sdot-Yam, our business and future business prospects may suffer.
One of our manufacturing facilities, our headquarters and our research and development facilities are located on lands leased by the Kibbutz pursuant to two lease agreements between the Kibbutz and the Israel Lands Administration (“
ILA
”), and an additional lease agreement between the Kibbutz and the Edmond Benjamin de Rothschild Caesarea Development Corporation Ltd. (“
Caesarea Development Corporation
”). Pursuant to these underlying lease agreements with the ILA and with the Caesarea Development Corporation, each of the ILA and the Caesarea Development Corporation may terminate their respective lease in certain circumstances, including if Kibbutz Sdot-Yam commences proceedings to disband or liquidate, or in the event that Kibbutz Sdot-Yam ceases to be organized as a “kibbutz” as defined in the lease (meaning, a registered cooperative society classified as a kibbutz). If either of the leases is terminated, we may be unable to use the land where our headquarters and one of our two manufacturing facilities are located, which would materially and adversely affect our business.
The first lease agreement between Kibbutz Sdot-Yam and the ILA has been extended through 2060. The second agreement between Kibbutz Sdot-Yam and the ILA expired in late 2009, and in February 2017, the District Court approved a settlement pursuant to which the Kibbutz and the ILA will enter into a new lease agreement for a period of 49 years, with an option to renew for additional 49 years. As of the date of this report, the parties are in the process of finalizing the terms of the lease agreement. Previous agreements between Kibbutz Sdot-Yam and the ILA with respect to this property contained restrictions with respect to the use of the property by the Kibbutz. We cannot assure you that our current use of the property and the rights granted to us by Kibbutz Sdot-Yam pursuant to the land use agreement will not provide the ILA with the right to terminate the rights of Kibbutz Sdot-Yam to the property.
The lease agreement between Kibbutz Sdot-Yam and the Caesarea Development Corporation permit Kibbutz Sdot-Yam to use the property for the community needs of Kibbutz Sdot-Yam and is in effect until year 2037. Caesarea Development Corporation charges Kibbutz Sdot-Yam based on the use of the relevant portion of the property for industrial purposes, and thus, has provided recognition to Kibbutz Sdot-Yam’s use of such portion of the property for industrial purposes.
If the rights of Kibbutz Sdot-Yam to use the properties described above terminate, we may be unable to maintain our operations on these lands, which would have a materially adverse effect on our operations. For more information on these agreements, see “ITEM 7.B: Major Shareholders and Related Party Transactions—Related Party Transactions.”
22
Pursuant to certain agreements between us and Kibbutz Sdot-Yam, we depend on Kibbutz Sdot-Yam with respect to leasing the buildings and areas of our manufacturing facilities in Israel, acquiring new land as well as building additional facilities should we need them.
Our Bar-Lev facility is leased from Kibbutz Sdot-Yam. On June 6, 2007, we have entered into a long-term lease agreement with the ILA, to use the premises for an initial period of 49 years as of February 6, 2005, with an option to renew for an additional term of 49 years as of the end of the initial period. On March 31, 2011, we entered into a land purchase and leaseback agreement with Kibbutz Sdot- Yam, pursuant to which, effective as of September 1, 2012, Kibbutz Sdot-Yam acquired from us our rights in the lands and facilities of the site in consideration for NIS 43.7 million ($10.9 million). The land purchase and leaseback agreement was simultaneously executed with a land use agreement pursuant to which Kibbutz Sdot-Yam permits us to use the site for a period of ten years with an automatic renewal for an additional ten years unless we provide Kibbutz Sdot-Yam two years’ advance notice that we do not wish to renew the lease.
Our Sdot-Yam facility, located in Kibbutz Sdot-Yam, is also leased from the Kibbutz, pursuant to a land use agreement with Kibbutz Sdot-Yam that became effective in March 2012 and for a period of 20 years. We may not terminate the operation of either of the two production lines at our Sdot-Yam facility as long as we continue to operate production lines elsewhere in Israel. Additionally, our headquarters must remain at Kibbutz Sdot-Yam. As a result of these restrictions, our ability to reorganize our manufacturing operations and headquarters in Israel is limited.
Pursuant to the land use agreements between us and Kibbutz Sdot-Yam, with respect to both our Sdot-Yam and Bar-Lev manufacturing facilities, subject to certain exceptions, if we need additional facilities on the land that we are permitted to use under such land use agreements, then, subject to obtaining the permits required by law, Kibbutz Sdot-Yam will build such facilities for us by using the proceeds of a loan that we will make to Kibbutz Sdot-Yam, which loan shall be repaid to us by off-setting the additional monthly payment that we would pay for such new facilities and, if not fully repaid during the lease term, upon termination thereof. As a result, we depend on Kibbutz Sdot-Yam to build such facilities in a timely manner. While Kibbutz Sdot-Yam is responsible under the agreement for obtaining various licenses, permits, approvals and authorizations necessary for our use of the property, with respect to our use of property in Sdot- Yam, we have waived any monetary recourse against the Kibbutz for failure to receive such licenses, permits, approvals and authorizations.
Pursuant to additional agreements with Kibbutz Sdot-Yam, we also rely on the Kibbutz if we wish to acquire or lease any additional lands, whether on the grounds of our Bar-Lev manufacturing facility, or elsewhere in Israel, for the purpose of establishing new manufacturing facilities or production lines. We may also incur greater costs associated with the purchase of additional land or the construction of additional facilities by the Kibbutz than we could obtain from a third-party.
If we are unable to renew our existing lease agreements with the Kibbutz in the future, we may be required to move our Israeli facilities and headquarters to an alternate location. In addition, the Kibbutz may not be able to in a timely manner purchase additional land or build additional facilities that we may require due to increased demand for our products, or obtain the necessary licenses or permits for existing or current property. This could result in increased costs, substantial delays and disruptions to the manufacturing process, which could materially and adversely impact our reputation, revenues and results of operations as well as other business aspects, such as our ability to serve our customers and meet the existing or increased demand for our products. We may also suffer losses to the extent we have waived monetary recourse against the Kibbutz for failure to obtain licenses and permits for some of our currently leased property. For more information with respect to our agreements with Kibbutz Sdot-Yam, see “ITEM 7.B: Major Shareholders and Related Party Transactions—Related Party Transactions”.
Regulators and other third parties may question whether our agreements with Kibbutz Sdot-Yam are no less favorable to us than if they had been negotiated with unaffiliated third parties.
Our headquarters, research and development facilities and our two manufacturing facilities in Israel are located on lands leased by Kibbutz Sdot-Yam. We have entered into certain agreements with Kibbutz Sdot-Yam pursuant to which Kibbutz Sdot-Yam provides us with, among other things, a portion of our labor force, electricity, maintenance, security and other services. We believe that such services are rendered to us in the normal course of business and they represent terms no less favorable than those that would have been obtained from an unaffiliated third party. Nevertheless, a determination with respect to such matters requires subjective judgments regarding valuations, and regulators and other third parties may question whether our agreements with Kibbutz Sdot-Yam are in the ordinary course of our business and are no less favorable to us than if they had been negotiated with unaffiliated third parties. As a result, the tax treatment for these transactions may also be called into question, which could have a materially adverse impact on our operating results and financial condition. See “ITEM 7.B: Major Shareholders and Related Party Transactions—Related Party Transactions.”
23
Under Israeli law, our board, audit committee and shareholders may be required to reapprove certain of our agreements with Kibbutz Sdot-Yam every three years, and their failure to do so may expose us to liability and cause significant disruption to our business.
The Companies Law requires that the authorized corporate organs of a public company approve every three years any extraordinary transaction in which a controlling shareholder has a personal interest and that has a term of more than three years, unless a company’s audit committee determines, solely with respect to agreements that do not involve compensation to a controlling shareholder or his or her relatives, in connection with services rendered by any of them to the company or their employment with the company, that a longer term is reasonable under the circumstances. Our implementation of this requirement with respect to the agreements entered into between us and Kibbutz Sdot-Yam may be challenged by regulators and other third parties.
Our audit committee has determined that the terms of all the agreements entered into between us and Kibbutz Sdot-Yam are reasonable under the relevant circumstances, except for the manpower agreement entered into between Kibbutz Sdot-Yam and us on January 1, 2011, as it relates to office holders, and the services agreement entered into between Kibbutz Sdot-Yam and us on July 20, 2011 (as amended). See “ITEM 7.B: Major Shareholders and Related Party Transactions—Related Party Transactions.” Our manpower agreement, as it relates to office holders, and our services agreement, each with Kibbutz Sdot-Yam, have been reapproved by our shareholders in 2015 under the Companies Law requirements and are subject to re-approval in 2018.
If our audit committee, board and shareholders do not re-approve the manpower agreement and the services agreement in accordance with the Companies Law, or if it is determined that re-approval of our other agreements with Kibbutz Sdot-Yam is required every three years and the re-approval is not obtained, we will be required to terminate such agreements, which may be considered a breach under the terms of such agreements, and could expose us to damage claims and legal fees, and cause significant disruption to our business. In addition, we would be required to find suitable replacements for the services provided to us by Kibbutz Sdot-Yam under the manpower agreement and the service agreement, which may take time, and we can provide no assurance that we can obtain the same or better terms with a third party than those we have agreed to with Kibbutz Sdot-Yam.
Risks related to our ordinary shares
We cannot provide any assurance regarding the amount or timing of dividend payments.
Prior to our IPO, our controlling shareholders, at that time, received periodic dividends. In connection with our IPO, we determined not to pay any dividends until at least March 21, 2013, one year following such offering. We distributed a dividend in the amount of $20.1 million in December 2013 and in the amount of $20.0 million in December 2014. We currently expect that payments of dividends will be made from time to time based on the recommendation of our board of directors, after taking into account legal limitations, growth plans and contractual limitations under our credit agreements, and other factors that our board of directors may deem relevant. At this time, we do not have a declared dividend policy, although we may adopt one in the future, and we cannot provide assurances regarding the amount or timing of any dividend payments and may decide not to pay dividends in the future.
The price of our ordinary shares may be volatile.
Our ordinary shares were first offered publicly in our IPO in March 2012, at a price of $11.00 per share. In April 2013 and June 2014, pursuant to follow-on offerings, our shareholders registered and sold additional amounts of our ordinary shares at a price of $23.25 and $45.50 per share, respectively. Since the pricing of our June 2014 offering, our ordinary shares have traded as high as $72.01 per share and as low as $26.7 per share through March 1, 2017.
24
The market price of our ordinary shares could be highly volatile and may fluctuate substantially as a result of many factors, including (i) actual or anticipated fluctuations in our results of operations; (ii) variance in our financial performance from the expectations of market analysts; (iii) announcements by us or our competitors of significant business developments, changes in distributor relationships, acquisitions or expansion plans; (iv) changes in the prices of our raw materials or the products we sell; (v) our involvement in litigation; (vi) our sale of ordinary shares or other securities in the future; (vii) market conditions in our industry; (viii) changes in key personnel; (ix) the trading volume of our ordinary shares; (x) changes in the estimation of the future size and growth rate of our markets; (xi)changes in our board of directors, including director resignations; (xii) actions of investors and shareholders, including short seller reports and proxy contests; and (xiii) general economic and market conditions.
Although our ordinary shares are listed on the Nasdaq Global Select Market, an active trading market on the Nasdaq Global Select Market may not be sustained. If an active market for our ordinary shares is not sustained, it may be difficult or even impossible to sell ordinary shares in the United States. In addition, the stock markets have experienced extreme price and volume fluctuations. Broad market and industry factors may materially harm the market price of our ordinary shares, regardless of our business performance. Additionally, effective October 2016, our ordinary shares were randomly selected by The N
ASDAQ
Stock Market for inclusion in its “Tick Size Pilot Program.” The program will last for two years and imposes wider minimum quoting and/or trading increments, or “tick sizes,” for certain securities with market capitalization under a certain level. Under the program,
our ordinary shares began trading in five-cent rather than one-cent increments. The change to five-cent increments may result in greater fluctuations in the market price of our ordinary shares and could result in higher trading costs for investors.
In the past, following periods of volatility in the market price of a company’s securities, securities class action litigation has often been instituted against that company.
On August 25, 2015, we became subject to a putative securities class action claim in the U.S. District Court for the Southern District of New York related to losses allegedly suffered as a result of the decline in the market price of our ordinary shares. We have recently entered into an agreement in principal with the lead plaintiffs to settle the case, subject to finalizing definitive documentation and court approval. Our insurance carriers agreed to pay the settlement amount and related expenses
.
See “ITEM 8: Financial Information Legal Proceedings”.
If equity research analysts do not publish research or reports about our business or if analysts, including short sellers, issue unfavorable commentary or downgrade our ordinary shares, the price of our ordinary shares could decline.
The trading market for our ordinary shares relies in part on the research and reports that equity research analysts publish about us and our business. The price of our ordinary shares could decline if one or more securities analysts downgrade our ordinary shares or if one or more of those analysts issue other unfavorable commentary or cease publishing reports about us or our business.
The market price for our common stock has been in the past, and may be in the future, materially and adversely affected by allegations made in reports issued by short sellers regarding our business model, our management and our financial accounting.
The substantial share ownership position of Kibbutz Sdot-Yam and Tene will limit your ability to influence corporate matters.
As of March 1, 2017, Kibbutz Sdot-Yam and Tene beneficially owned 33.3% of our outstanding ordinary shares. As a result of this concentration of share ownership and their voting agreement described above, Kibbutz Sdot-Yam and Tene are considered controlling shareholders under the Israeli Companies Law, and, acting on their own or together, will continue to have significant voting power on all matters submitted to our shareholders for approval. These matters include:
| • |
the composition of our board of directors (other than external directors);
|
| • |
approving or rejecting a merger, consolidation or other business combination; and
|
| • |
amending our articles of association, which govern the rights attached to our ordinary shares.
|
This concentration of ownership of our ordinary shares could delay or prevent proxy contests initiated by other shareholders, mergers, tender offers, open-market purchase programs or other purchases of shares of our ordinary shares that might otherwise give you the opportunity to realize a premium over then-prevailing market price of our ordinary shares. The interests of Kibbutz Sdot-Yam or Tene may not always coincide with the interests of our other shareholders. This concentration of ownership may also lead to proxy contests. For example, prior to the voting arrangement between Tene and the Kibbutz, in connection with our annual general meeting of shareholders held in December 2015, Kibbutz Sdot-Yam issued a proxy to our shareholders, in which it opposed the independent nominees our board of directors proposed to nominate to the board and suggested two alternative nominees. Such initiatives, which may not coincide with the interests of our other shareholders, result in us incurring unexpected costs and could divert our management's time and attention. This concentration of ownership may also materially and adversely affect our share price.
25
As a foreign private issuer whose shares are listed on the Nasdaq Global Select Market, we may follow certain home country corporate governance practices instead of certain Nasdaq requirements.
As a foreign private issuer whose shares are listed on the Nasdaq Global Select Market, we are permitted to follow certain home country corporate governance practices instead of certain requirements of the rules of Nasdaq. As permitted under the Israeli Companies Law, our articles of association provide that the quorum for any ordinary meeting of shareholders shall be the presence of at least two shareholders present in person, by proxy or by a voting instrument, who hold at least 25% of the voting power of our shares instead of 33 1/3% of the issued share capital required under Nasdaq requirements. At an adjourned meeting, any number of shareholders constitutes a quorum.
In the future, we may also choose to follow Israeli corporate governance practices instead of Nasdaq requirements with regard to, among other things, the composition of our board of directors, compensation of officers and director nomination procedures. In addition, we may choose to follow Israeli corporate governance practice instead of Nasdaq requirements with respect to shareholder approval for certain dilutive events (such as for issuances that will result in a change of control of the company, certain transactions other than a public offering involving issuances of a 20% or more interest in the company and certain acquisitions of the stock or assets of another company) and for the adoption of, and material changes to, equity incentive plans. Accordingly, our shareholders may not be afforded the same protection as provided under Nasdaq corporate governance rules. Following our home country governance practices, as opposed to the requirements that would otherwise apply to a U.S. company listed on the Nasdaq Global Select Market, may provide less protection than is accorded to investors of domestic issuers. See “ITEM 16G: Corporate Governance.”
As a foreign private issuer, we are not subject to the provisions of Regulation FD or U.S. proxy rules and are exempt from filing certain Exchange Act reports.
As a foreign private issuer, we are exempt from the rules and regulations under the Exchange Act related to the furnishing and content of proxy statements, and our officers, directors and principal shareholders are exempt from the reporting and short-swing profit recovery provisions contained in Section 16 of the Exchange Act. In addition, we are not required under the Exchange Act to file annual and current reports and financial statements with the SEC as frequently or as promptly as U.S. domestic companies whose securities are registered under the Exchange Act, we are permitted to disclose limited compensation information for our executive officers on an individual basis and we are generally exempt from filing quarterly reports with the SEC under the Exchange Act. Moreover, we are not required to comply with Regulation FD, which restricts the selective disclosure of material nonpublic information to, among others, broker-dealers and holders of a company’s securities under circumstances in which it is reasonably foreseeable that the holder will trade in the company’s securities on the basis of the information. These exemptions and leniencies reduce the frequency and scope of information and protections to which you may otherwise have been eligible in relation to a U.S. domestic issuer.
We would lose our foreign private issuer status if (a) a majority of our outstanding voting securities were either directly or indirectly owned of record by residents of the United States and (b)(i) a majority of our executive officers or directors were United States citizens or residents, (ii) more than 50 percent of our assets were located in the United States or (iii) our business were administered principally in the United States. Our loss of foreign private issuer status would make U.S. regulatory provisions mandatory. The regulatory and compliance costs to us under U.S. securities laws as a U.S. domestic issuer may be significantly higher. If we are not a foreign private issuer, we will be required to file periodic reports and registration statements on U.S. domestic issuer forms with the SEC, which are more detailed and extensive than the forms available to a foreign private issuer. We would also be required to follow U.S. proxy disclosure requirements, including the requirement to disclose, under U.S. law, more detailed information about the compensation of our senior executive officers on an individual basis. We may also be required to modify certain of our policies to comply with accepted governance practices associated with U.S. domestic issuers. Such conversion and modifications will involve additional costs. In addition, we would lose our ability to rely upon exemptions from certain corporate governance requirements on U.S. stock exchanges that are available to foreign private issuers.
26
Our United States shareholders may suffer materially adverse tax consequences if we are characterized as a passive foreign investment company.
Generally, if for any taxable year, 75% or more of our gross income is passive income, or at least 50% of our assets are held for the production of, or produce, passive income, we would be characterized as a passive foreign investment company for United States federal income tax purposes. There can be no assurance that we will not be considered a passive foreign investment company for any taxable year. If we are characterized as a passive foreign investment company, our U.S. shareholders may suffer materially adverse tax consequences, including having gains realized on the sale of our ordinary shares treated as ordinary income, rather than capital gain, the loss of the preferential rate applicable to dividends received on our ordinary shares by individuals who are U.S. holders, and having interest charges apply to distributions by us and the proceeds of share sales. See “ITEM 10.E: Additional Information—Taxation—United States Federal Income Taxation—Passive foreign investment company considerations.”
The market price of our ordinary shares could be negatively affected by future sales of our ordinary shares.
As of March 1, 2017, we had 34,321,573 ordinary shares outstanding. This included approximately 11,440,000 ordinary shares, or 33.3% of our outstanding ordinary shares, beneficially owned by Kibbutz Sdot-Yam and Tene, which can be resold into the public markets in accordance with the restrictions of Rule 144, including volume limitations, applicable to resales by affiliates or holders of restricted securities.
Sales by us or by Kibbutz Sdot-Yam, Tene or other large shareholders of a substantial number of our ordinary shares in the public market, or the perception that these sales might occur, could cause the market price of our ordinary shares to decline or could materially impair our ability to raise capital through a future sale of, or pay for acquisitions using, our equity securities.
Kibbutz Sdot-Yam and Tene may require us to effect a registered offering of up to an additional 11,440,000 shares under the Securities Act for resale into the public markets. All shares sold pursuant to an offering covered by such registration statement or statements will be freely transferable. See “ITEM 7.B: Major Shareholders and Related Party Transactions—Related Party Transactions—Registration rights agreement.”
In addition to these registration rights, as of March 1, 2017, 1,193,604 ordinary shares were reserved for issuance under our 2011 Incentive Compensation Plan (“
2011 plan
”) of which options to purchase 1,096,704 ordinary shares were outstanding, with a weighted average exercise price of $33.88 per share, and 96,900 restricted stock units (“
RSUs
”) were outstanding. To the extent they are covered by our registration statements on Form S-8, these shares may be freely sold in the public market upon issuance, except for shares held by affiliates who have certain restrictions on their ability to sell.
Risks relating to our incorporation and location in Israel
If we fail to comply with Israeli law restrictions concerning employment of Jewish employees on Saturdays and Jewish holidays, we and our office holders may be exposed to administrative and criminal liabilities and our operational and financial results may be materially and adversely impacted.
We are subject to the Israeli Hours of Work and Rest Law, 1951 (“
Rest Law
”), which prohibits the employment of Jewish employees on Saturdays and Jewish holidays, unless a permit is obtained from the IMEI. Employment of Jewish employees on such days without a permit constitutes a violation of the Rest Law. In January 2016, we received a permit from the IMEI to employ Jewish employees on Saturdays and Jewish holidays in connection with most of the production machinery in our Sdot-Yam facility, effective until December 31, 2017. There is no assurance that we will be able to obtain such permit in the future, and if we do not, we will be required to either refrain from operating our Sdot-Yam facility on Saturdays and Jewish holidays, or employ non-Jewish employees. Prior to obtaining such permit, in our Sdot-Yam facility, from the fourth quarter of 2015, our Jewish and non-Jewish employees worked only six days a week, not including Saturdays. In our Bar-Lev facility, our Jewish employees do not work on Saturdays, while our non-Jewish employees are employed on such days.
27
If we are deemed to be in violation of the Rest Law, we and our officers may be exposed to administrative and criminal liabilities, including fines, and our operational and financial results could be materially and adversely impacted. If we fail to obtain a permit in the future or if we are unable to employ only non-Jewish employees on Saturdays and Jewish holidays, we may be required to halt operations of our manufacturing facilities in Israel during such days, have less production capacity and as a result experience a materially adverse effect on our revenues and profitability.
Conditions in Israel could materially and adversely affect our business.
We are incorporated under Israeli law and our principal offices and two of our manufacturing facilities (Sdot- Yam and Bar-Lev) are located in Israel. Accordingly, political, economic and military conditions in Israel directly affect our business. Since the establishment of the State of Israel in 1948, a number of armed conflicts have occurred between Israel and its neighboring countries. Although Israel has entered into various agreements with Egypt, Jordan and the Palestinian Authority, there has been an increase in unrest and terrorist activity, which began in September 2000 and is continuing today with varying levels of severity. These conflicts involved missile strikes against civilian targets in various parts of Israel including most recently, central Israel, and negatively affected business conditions in Israel as well as home starts and the building industry in Israel.
Our facilities in the Bar-Lev Industrial Park are located in northern Israel and are in range of rockets that were fired during 2006 from Lebanon into Israel. In the armed conflict between Israel and Hamas in Gaza Strip in July and August 2014, rockets from Gaza Strip reached the area of our Sdot-Yam plant. In the event that our facilities are damaged as a result of hostile action or hostilities otherwise disrupt the ongoing operation of our facilities, our ability to deliver products to customers could be materially and adversely affected. In addition, our commercial insurance in Israel does not cover losses that may occur as a result of acts of war; however, losses as a result of terrorist attacks are covered by our insurance for damages of up to $20 million to our facilities, as are losses due to a disruption to the ongoing operations, if such damages are not covered by the Israeli government. Although the Israeli government currently covers the reinstatement value of direct damages that are caused by terrorist attacks or acts of war, we cannot assure you that this government coverage will be maintained and will be adequate in the event we submit a claim. Even if insurance is maintained and adequate, we cannot assure you that it will reduce or prevent any losses that may occur as a result of such actions or will be exercised in a timely manner to meet our contractual obligations with customers and vendors.
In addition, recent popular uprisings in various countries in the Middle East and North Africa have affected the political stability of those countries. Such instability may lead to deterioration in the political and trade relationships that exist between the State of Israel and these countries, such as Turkey, from which we import a significant amount of our raw materials. Moreover, some countries around the world restrict doing business with Israel and Israeli companies, and additional countries may impose restrictions on doing business with Israel and Israeli companies if hostilities in Israel or political instability in the region continues or increases. These restrictions may limit materially our ability to obtain raw materials from these countries or sell our products to companies and customers in these countries. In addition, there have been increased efforts by activists to cause companies and consumers to boycott Israeli goods. Such efforts, particularly if they become more widespread, may materially and adversely impact our ability to sell our products out of Israel.
Any hostilities involving Israel or the interruption or curtailment of trade between Israel and its present trading partners, or a significant downturn in the economic or financial condition of Israel, could materially and adversely affect our operations and product development, cause our revenues to decrease and materially harm the share price of publicly traded companies with operations in Israel, such as us.
Our operations may be disrupted by the obligations of personnel to perform military service.
As of December 31, 2016, we had 1,434 employees worldwide of whom 700 were based in Israel. Our employees in Israel, generally males, including executive officers, may be called upon to perform up to 54 days in each three-year period until they reach the age of 40. In the case of officers and certain reservists with specific military professions, the duty may extend up to 84 days in each three-year period and continue until they reach the age of 45 (and in some cases, up to 49). In emergency circumstances, these employees and executives could be called to immediate and prolonged active duty. In response to increased tension and hostilities, there have been occasional call-ups of military reservists, including in connection with the mid-2006 war in Lebanon and the conflicts with Hamas that occurred in December 2008, November 2012 and summer 2014, and it is possible that there will be additional call-ups in the future. Our operations could be disrupted by the absence of a significant number of our employees related to military service or the absence for extended periods of one or more of our key employees for military service. Such disruption could materially and adversely affect our business and results of operations. Additionally, the absence of a significant number of the employees of our Israeli suppliers and contract manufacturers related to military service or the absence for extended periods of one or more of their key employees for military service may disrupt their operations, in which event our ability to deliver products to customers may be materially and adversely affected.
28
Our operations may be affected by negative economic conditions or labor unrest in Israel.
General strikes or work stoppages, including at Israeli sea ports, have occurred periodically or have been threatened in the past by Israeli trade unions due to labor disputes. These general strikes or work stoppages may have a materially adverse effect on the Israeli economy and on our business, including our ability to deliver products to our customers and to receive raw materials from our suppliers in a timely manner. These general strikes or work stoppages, in Israel or in other countries where we, our subsidiaries, suppliers and distributors operate, may prevent us from shipping raw materials and equipment required for our production and shipping our products by sea or otherwise to our customers, which could have a materially adverse effect on our results of operations.
Since none of our employees work under any collective bargaining agreements, extension orders issued by the IMEI apply to us and affect matters such as cost of living adjustments to salaries, length of working hours and work week, recuperation pay, travel expenses, and pension rights. Any labor disputes over such matters could result in a work stoppage or strikes by employees that could delay or interrupt our output of products. Any strike, work stoppages or interruption in manufacturing could result in a failure to meet contractual obligations or in delays, including in our ability to manufacture and deliver products to our customers in a timely manner, and could have a materially adverse effect on our relationships with our distributors and on our financial results.
In 2014, some of our employees in Israel acted to form a workers’ union represented by the Histadrut, the Israeli workers’ union association. Following objections from other employees to the formation of a workers’ union, the Histadrut filed a claim in an Israeli court, in which the Histadrut argued that such objections were directed by our management in an attempt to deprive our employees of their right to unionize. The Histadrut applied for the grant of a declaratory order to prevent us from resisting our employees’ efforts to unionize and such temporary order was granted by the court with our consent. In addition, the Histadrut applied to impose on us damages for seeking to disrupt our employees’ initiations to unionize. On June 3, 2015, it was resolved by the court, with the parties' consent, to dismiss the Histadrut's claim.
If a union of our employees is formed in the future, we may enter into a collective agreement with our employees, which may increase our costs and limit our managerial freedom, and if we are unable to reach a collective agreement, we may become subject to strikes and work stoppages, all of which may materially and adversely affect our business.
The tax benefits that are available to us require us to continue to meet various conditions and may be terminated or reduced in the future, which could increase our costs and taxes.
Some of our Israeli facilities have been granted “Approved Enterprise” status by the Investment Center in the Israeli Ministry of Economy and Industry (“
Investment Center
”) or have the status of a “Beneficiary Enterprise” or “Preferred Enterprise” which provides us with investment grants (in respect of certain Approved Enterprise programs) and makes us eligible for tax benefits under the Investment Law.
In order to remain eligible for the tax benefits of an “Approved Enterprise”, a “Beneficiary Enterprise” and/or a “Preferred Enterprise” we must continue to meet certain conditions stipulated in the Investment Law and its regulations, as amended, and in certificates of approval issued by the Investment Center (in respect of Approved Enterprise programs), which may include, among other things, selling more than 25% of our products to markets of over 14 million residents in a specific tax year, making specified investments in fixed assets and equipment, financing a percentage of those investments with our capital contributions, filing certain reports with the Investment Center, complying with provisions regarding intellectual property and the criteria set forth in the specific certificate of approval issued by the Investment Center or the ITA. If we do not meet these requirements, the tax benefits could be canceled and we could be required to refund any tax benefits and investment grants that we received in the past. Further, in the future, these tax benefits may be reduced or discontinued. If these tax benefits are cancelled, our Israeli taxable income would be subject to regular Israeli corporate tax rates. The standard corporate tax rate for Israeli companies was 25% in 2013, 26.5% in 2014 and 2015, 25% in 2016 and will decrease to 24% and 23% in 2017 and 2018, respectively.
29
Effective January 1, 2011, the Investment Law was amended (“
Amendment No. 68
”). Under Amendment No. 68, the criteria for receiving tax benefits were revised. In the future, we may not be eligible to receive additional tax benefits under this law. The termination or reduction of these tax benefits would increase our tax liability, which would reduce our profits. Additionally, if we increase our activities outside of Israel through acquisitions, for example, our expanded activities might not be eligible to be included in future Israeli tax benefit programs. We may lose all of our tax benefits in Israel in the event that our manufacturing operations outside of Israel exceed certain production levels (currently set at 50% of the overall production and subject to future changes by the ITA). We do not foresee such circumstances as probable in the coming years. Those tax rates between 2014 and 2016 were 16% for the portion of our income related to the Sdot-Yam manufacturing facility and 9% for the portion of our income related to the Bar-Lev manufacturing facility. From 2017 onward, the tax rate for the portion of our income related to the Bar-Lev manufacturing facility will be reduced to 7.5% and Sdot-Yam tax rate will remain unchanged.
Finally, in the event of a distribution of a dividend from the tax-exempt income described above, we will be subject to tax at the corporate tax rate applicable to our Approved Enterprise’s and Beneficiary Enterprise’s income on the amount distributed in accordance with the effective corporate tax rate that would have been applied had we not relied on the exemption—tax rate of no more than 25%. In addition to the reduced tax rate, a distribution of income attributed to an “Approved Enterprise” and a “Beneficiary Enterprise” will be subject to 15% withholding tax. As for a “Preferred Enterprise,” dividends are subject to 20% withholding tax from 2014 (or a reduced rate under an applicable double tax treaty). However, because we announced our election to apply the provisions of Amendment No. 68 prior to July 30, 2015, we will be entitled to distribute exempt income generated by any Approved/Beneficiary Enterprise to our Israeli corporate shareholders tax free (See “ITEM 10.E: Additional Information—Taxation—Israeli tax considerations and government programs—Law for the Encouragement of Capital Investments, 1959”).
In November 2012, amendment No. 69 to the Investment Law (“
Trapped Earnings Law
”) came into effect. The amendment provides temporary, partial, relief from corporate taxation on distributions of dividends from exempt income for companies that elect the “relief option” through November 2013. The Trapped Earnings Law allows a company to qualify a portion of its exempt income (“
Elected Earnings
”) for a reduced tax rate ranging between 6% and 17.5%, instead of corporate tax rate of up to 25%. We decided not to use the relief option. As such, our exempt income may be subject to an argument by the ITA, as described below.
The amendment to the Investment Law stipulated that investments in subsidiaries, including in the form of acquisitions of subsidiaries from an unrelated party, may also be considered as a deemed dividend distribution event, increasing the risk of triggering a deemed dividend distribution event and potential tax exposure. The ITA’s interpretation is that this provision applies retroactively to investments and acquisitions made prior to the amendment.
It may be difficult to enforce a U.S. judgment against us, our officers and directors in Israel or the United States, or to assert U.S. securities laws claims in Israel or serve process on our officers and directors.
We are incorporated in Israel. Other than two directors, none of our directors, or our independent registered public accounting firm, is a resident of the United States. Other than one executive officer, none of our executive officers is resident in the United States. The majority of our assets and the assets of these persons are located outside the United States. Therefore, it may be difficult for an investor, or any other person or entity, to enforce a U.S. court judgment based upon the civil liability provisions of the U.S. federal securities laws against us or any of these persons in a U.S. or Israeli court, or to effect service of process upon these persons in the United States. Additionally, it may be difficult for an investor, or any other person or entity, to assert U.S. securities law claims in original actions instituted in Israel. Israeli courts may refuse to hear a claim based on a violation of U.S. securities laws on the grounds that Israel is not the most appropriate forum in which to bring such a claim. Even if an Israeli court agrees to hear a claim, it may determine that Israeli law and not U.S. law is applicable to the claim. If U.S. law is found to be applicable, the content of applicable U.S. law must be proved as a fact, which can be a time-consuming and costly process. Certain matters of procedure will also be governed by Israeli law. There is little binding case law in Israel addressing the matters described above.
30
Your rights and responsibilities as our shareholder will be governed by Israeli law which may differ in some respects from the rights and responsibilities of shareholders of United States corporations.
Since we are incorporated under Israeli law, the rights and responsibilities of our shareholders are governed by our articles of association and Israeli law. These rights and responsibilities differ in some respects from the rights and responsibilities of shareholders in U.S.-based corporations. In particular, a shareholder of an Israeli company has a duty to act in good faith and in a customary manner in exercising its rights and performing its obligations towards the company and other shareholders and to refrain from abusing its power in the company, including, among other things, in voting at the general meeting of shareholders on certain matters, such as an amendment to the company’s articles of association, an increase of the company’s authorized share capital, a merger of the company and approval of related party transactions that require shareholder approval. A shareholder also has a general duty to refrain from discriminating against other shareholders. In addition, a controlling shareholder or a shareholder who knows that it possesses the power to determine the outcome of a shareholders’ vote or to appoint or prevent the appointment of an office holder in the company or has another power with respect to the company, has a duty to act in fairness towards the company. However, Israeli law does not define the substance of this duty of fairness. See “ITEM 6.C: Directors, Senior Management and Employees—Board Practices— Board Practices—Fiduciary duties and approval of specified related party transactions under Israeli law—Duties of shareholders.” Additionally, the parameters and implications of the provisions that govern shareholder behavior have not been clearly determined by the Israeli courts. These provisions may be interpreted to impose additional obligations and liabilities on our shareholders that are not typically imposed on shareholders of United States corporations.
Provisions of Israeli law may delay, prevent or make undesirable a merger transaction, or an acquisition of all or a significant portion of our shares.
Israeli corporate law regulates mergers by mandating certain procedures and voting requirements, and requires that a tender offer be effected when more than a specified percentage of shares in a company are purchased. Further, Israeli tax considerations may make potential transactions undesirable to us or to some of our shareholders whose country of residence does not have a tax treaty with Israel granting tax relief to such shareholders from Israeli tax. With respect to mergers, Israeli tax law allows for tax deferral in certain circumstances but makes the deferral contingent on the fulfillment of numerous conditions, including a holding period of two years from the date of the transaction during which certain sales and dispositions of shares of the participating companies are restricted. Moreover, with respect to certain share swap transactions, the tax deferral is limited in time, and when such time expires, the tax becomes payable even if no actual disposition of the shares has occurred. See “ITEM 10.B: Additional Information—Memorandum and Articles of Association—Acquisitions under Israeli law.”
Under Israeli law, our two external directors have terms of office of three years. These directors have been elected by our shareholders to serve for an additional three-year term to commence March 21, 2015.
These provisions of Israeli law could have the effect of delaying or preventing a change in control and may make it more difficult for a third party to acquire us or our shareholders to elect different individuals to our board of directors, even if doing so would be beneficial to our shareholders, and may limit the price that investors may be willing to pay in the future for our ordinary shares.
If we are considered a “monopoly” under Israeli law, we could be subject to certain restrictions that may limit our ability to freely conduct our business to which our competitors may not be subject.
Under the Israeli Restrictive Trade Practices Law, 1988, (“
Israeli Antitrust Law
”), a company that supplies more than 50% of any asset or service in Israel or, in some cases, in a specific geographical area in Israel is deemed to be a monopoly. The determination of monopoly status depends on an analysis of the relevant product or service market but it does not require a positive declaration, and the status is achieved by virtue of such market share threshold being crossed.
Depending on the analysis and the definition of the relevant product market in which we operate, we may be deemed to be a “monopoly” under Israeli law. Under the Israeli Antitrust Law, a monopoly is prohibited from participating in certain business practices, including unreasonably refusing to provide the relevant product or service, or abuse of market power by means of discriminating between similar transactions or charging what are considered to be unfair prices, and from engaging in certain other practices, such prohibitions are designed to protect the Israeli market against unfair competition. The Israeli Antitrust Commissioner may determine that a company that is a monopoly has abused its position in the market, it may subsequently order such company to change its conduct in matters that may materially and adversely affect the public, including imposing business restrictions on a company determined to be a monopoly and giving instructions with respect to the prices charged by the monopoly. If we are indeed deemed to be a monopoly and the Commissioner finds that we have abused our position in the market by taking anti-competitive actions and using anti-competitive practices, such as those described above, it would serve as
prima facie
evidence in private actions and class actions against us alleging that we have engaged in anti-competitive behavior. Furthermore, the Commissioner may order us to take or refrain from taking certain actions, which could limit our ability to freely conduct our business.
31
To date, the Commissioner has not made any such determination. We do not believe we are a monopoly or that our operations constitute a violation of the provisions of the Israeli Antitrust Law even if we were found to be a monopoly under the Israeli Antitrust Law, but we cannot guarantee this to be the case.
Sales in Israel accounted for 7.9% of our revenues in 2016. We have a significant market position in certain other jurisdictions outside of Israel and cannot assure you that we are not, or will not become, subject to the laws relating to the use of dominant product positions in particular countries, which laws could limit our business practices and our ability to consummate acquisitions.
Our History
Caesarstone Ltd. was founded in 1987 and incorporated in 1989 in the State of Israel. On June 9, 2016, we changed our name from Caesarstone Sdot Yam Ltd. to Caesarstone Ltd. We are a leading manufacturer of high quality engineered quartz surfaces sold under our premium Caesarstone brand. Caesarstone is a pioneer in the engineered quartz surfaces industry. Our products consist of engineered quartz slabs that are currently sold in over 50 countries through a combination of direct sales in certain markets performed by our subsidiaries and indirectly through a network of independent distributors in other markets. Our products accounted for approximately 8% of global engineered quartz by volume in 2016. In 2008, 2010 and 2011, we acquired the businesses of our former Australian, Canadian and American distributors, respectively, and established such businesses within our own subsidiaries in such countries. We now generate a substantial portion of our revenues in the United States, Australia and Canada from direct distribution of our products. Our products are primarily used as kitchen countertops. Other applications include vanity tops, wall panels, back splashes, floor tiles, stair and other interior surfaces that are used in a variety of residential and non-residential applications. Because of their hardness and non-porous characteristics, our products offers superior levels of scratch, stain and heat resistance, making them extremely durable and ideal for kitchen and other applications relative to competing products such as granite, manufactured solid surfaces and laminate. Through our innovative design and manufacturing processes we are able to offer a wide variety of colors, styles, designs and textures.
In March 2012, we listed our shares on the Nasdaq Global Select Market. We are a company limited by shares organized under the laws of the State of Israel. We are registered with the Israeli Registrar of Companies in Jerusalem. Our registration number is 51-143950-7. Our principal executive offices are located at Kibbutz Sdot-Yam, MP Menashe, 3780400, Israel, and our telephone number is +972 (4) 636-4555. We have irrevocably appointed Caesarstone USA as our agent for service of process in any action against us in any United States federal or state court. The address of Caesarstone USA is 9275 Corbin Avenue, Northridge, California, 91324. For more information about us, our website is
www.caesarstone.com
. The information contained therein or connected thereto shall not be deemed to be incorporated by reference in this annual report.
Principal Capital Expenditures
Our capital expenditures for fiscal years 2016, 2015 and 2014 amounted to $22.9 million, $76.5 million, and $86.4 million, respectively. The majority of our investment activities have historically been related to the purchase of manufacturing equipment and components for our production lines, and in 2014 and 2015 the construction of a new manufacturing facility with two production lines in the United States. In order to support our overall business expansion, we will continue to invest in manufacturing equipment and components for our production lines and in further expanding manufacturing capacity as we may require, subject to growth in the demand for our products. Moreover, we may spend additional amounts of cash on acquisitions from time to time, if and when such opportunities arise. In 2015, we completed the vast majority of our investment in the two production lines of the U.S. manufacturing facility with the remainder of the investment completed in 2016, the total of which amounted to approximately $135 million. Given the fact that the timing of our next capacity expansion in the U.S. facility or elsewhere is not determined yet, we anticipate that our capital expenditures in 2017 will remain significantly lower than the amounts invested in 2015 and 2014.
32
The global countertop industry generated approximately $95 billion in sales to end consumers in 2016 based on average installed price, which includes fabrication, installation and other related costs. Sales to end-consumers include sales to end-consumers of countertops as opposed to sales at the wholesale level from manufacturers to fabricators and distributors. The following charts show the global countertop market by region and by material, based on sales to end-users in 2016:
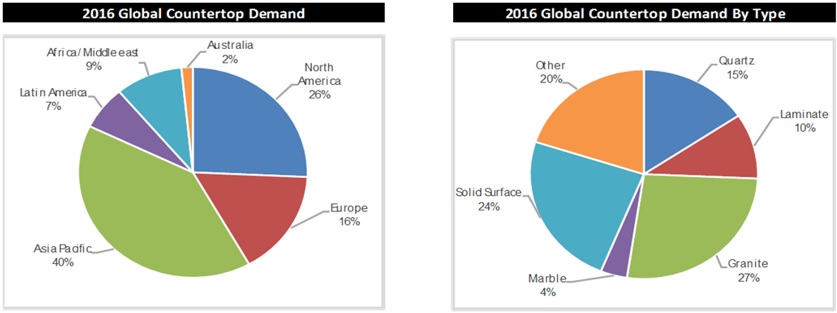
We are a leading manufacturer of high-quality engineered quartz surfaces sold under our premium Caesarstone brand. Although the use of quartz is relatively new, it is the fastest growing material in the countertop industry and continues to take market share from other materials, such as granite, manufactured solid surfaces and laminate. Between 1999 and 2016, global engineered quartz sales to end-consumers grew at a compound annual growth rate of 17.9% compared to a 4.9% compound annual growth rate in total global countertop sales to end-consumers during the same period. In recent years, quartz penetration rate, by volume, increased in our key markets, as detailed in the following chart:
Quartz penetration in our key markets
|
For the year ended December 31,
|
||||||||||||||||
|
2016
|
2014
|
2012
|
2010
|
|||||||||||||
|
United States
|
14
|
%
|
8
|
%
|
6
|
%
|
5
|
%
|
||||||||
|
Australia (not including New Zealand)
|
45
|
%
|
39
|
%
|
35
|
%
|
32
|
%
|
||||||||
|
Canada
|
24
|
%
|
18
|
%
|
12
|
%
|
9
|
%
|
||||||||
|
Israel
|
87
|
%
|
86
|
%
|
85
|
%
|
82
|
%
|
||||||||
Our products consist of engineered quartz slabs that are currently sold in over 50 countries through a combination of direct sales in certain markets and indirectly through a network of independent distributors in other markets. In 2011, we acquired our former U.S. distributor and now generate the substantial majority of our revenues in the United States from direct distribution of our products. Our products are primarily used as kitchen countertops in the renovation and remodeling and residential construction end markets. Other applications for engineered quartz include vanity tops, wall panels, back splashes, floor tiles, stairs and other interior surfaces that are used in a variety of residential and non-residential applications. High quality engineered quartz offers hardness, non-porous characteristics, superior scratch, stains and heat resistance, making it durable and ideal for kitchen and other applications relative to competing products such as granite, manufactured solid surfaces and laminate. Through our design and manufacturing processes we are able to offer a wide variety of colors, styles, designs and textures. In 2016, our products accounted for approximately 8% of global engineered quartz by volume and we captured approximately 13%, 52%, 39% and 85% of the countertop market share in the United States, Australia (not including sales to New Zealand), Canada and Israel, by volume, respectively.
33
From 2005 to 2007, our revenue grew at a compound annual growth rate of 37.9%, and during the more challenging global economic environment from 2007 to 2009, at a compound annual growth rate of 11.5%. From 2009 to 2016, our revenue grew at a compound annual growth rate of 18.7%. In 2016, we generated revenue of $538.5 million, net income attributable to controlling interest of $74.6 million, adjusted EBITDA of $130.3 million and adjusted net income attributable to controlling interest of $81.2 million. See “ITEM 3.A: Key Information—Selected Financial Data” for a description of how we define adjusted EBITDA and adjusted net income attributable to controlling interest and reconciliations of net income to adjusted EBITDA and net income attributable to controlling interest to adjusted net income attributable to controlling interest.
*
Global countertop demand in total, by region and by material are based on Freedonia February 20, 2017 report, which included revisions of such data for 2010, 2012 and 2014 previously provided by Freedonia. In general, for each of these three years, data related to quartz global penetration were increased by Freedonia and data related to laminate global penetration were decreased. Also, countertop demand in Asia was increased by Freedonia and Europe decreased for each of these three years. Quartz penetration in each of our four main markets (and our market share in those markets, accordingly) remained the same as published by Freedonia in each of these three years.
Our Products
Our products to date are generally marketed under the Caesarstone brand. The substantial majority of our products are installed as countertops in residential kitchens. Other applications of our products include vanity tops, wall panels, back splashes, floor tiles, stairs and other interior surfaces. Our engineered quartz slabs measure 120 inches long by 56 1/2 inches wide and 130 inches long by 65 inches wide with a thickness of 1/2 of an inch, 3/4 of an inch or 1 1/4 inches. Engineered quartz surfaces are typically comprised of approximately 90% natural crushed quartz and approximately 10% polyester and pigments. Our products’ composition gives them superior strength and resistance levels to heat, scratches, cracks and chips. Polyester, which acts as a binding agent in our products, make our products non-porous and highly resistant to stains. Pigments act as a dyeing agent to vary our products’ colors and patterns.
We engineer our products with a wide range of colors, finishes, textures, thicknesses and physical properties, which help us meet the different functional and aesthetic demands of end-consumers. We offer a wide spectrum of design options in the engineered quartz surface industry with different colors, textures and finishes, designed to appeal to end-consumers’ preferences. Our designs range from fine-grained patterns to coarse-grained color blends with a variegated visual texture. Through offering new designs, we capitalize on Caesarstone’s brand name and foster our position as a leading innovator in the engineered quartz surface industry.
Our product offerings include four collections, each of which is designed to have a distinct aesthetic appeal. We use a multi-tiered pricing model across our products and within each product collection ranging from lower price points to higher price points. Each product collection is designed, branded and marketed with the goal of reinforcing our products’ premium quality.
We introduced our original product collection, Classico, in 1987, and today, this collection accounts for the majority of our sales. Within this product collection, we offer over 80 different colors, with four textures and three thicknesses generally available for each of the collection’s colors. We have since introduced additional product collections, and currently have four collections: Classico, Concetto, Motivo, and Supernatural, which are marketed as specialty high-end product collections. The Concetto product collection, launched in 2003, features engineered quartz surfaces with hand-incorporated semi-precious stones. We launched our Motivo product collection in 2009, which features a range of patterned textures that can be customized. In 2012, we launched new products under our Supernatural collection, whose design was inspired by natural stone and which are manufactured using proprietary technology. We regularly introduce new colors and designs to our product collections based on consumer trends.
34
A key focus of our product development is a commitment to substantiating our claim of our products’ superior quality, strength and durability. Our products undergo regular tests for durability and strength internally by our laboratory operations group and by external accreditation organizations. We are accredited by organizations overseeing safety and environment performance, such as the NSF International
for sanitation and food safety
and GREENGUARD Indoor Air Quality. Our products support green building projects and allow contractors to receive Leadership in Energy and Design (LEED) points for projects incorporating our products.
Distribution
Our four largest markets based on sales are currently the United States, Australia, Canada and Israel. In 2016, sales of our products in these markets accounted for 41.3%, 24.3%, 15.9% and 7.9% of our revenues, respectively. Total sales in these markets accounted for 89.5% of our revenues in 2016. For a breakdown of revenues by geographic market for the last three fiscal years, see “ITEM 5.A: Operating Results and Financial Review and Prospects—Operating Results.”
Direct Markets
We currently have direct sales channels in the United States, Australia, Canada, Israel, Singapore and the United Kingdom. Our direct sales channels allow us to maintain greater control over our entire sales channel within a market. As a result, we gain greater insight into market trends, receive feedback more readily from end-consumers, architects and designers regarding new developments in tastes and preferences, and have greater control over inventory management. Our subsidiaries’ warehouses in each of these countries maintain inventories of our products and are connected to each subsidiary’s sales department. We supply our products primarily to fabricators, who in turn resell them to contractors, developers, builders and consumers, who are generally advised by architects and designers to use Caesarstone products for a project. In the U.S. and Canada, in certain market channels such as IKEA and Lowe’s, we also provide, together with our products, fabrication and installation services, which we source from third party fabricators. We believe that our supply of a fabricated and installed countertop made of Caesarstone is a competitive advantage in such channels, which enables us to better control our products’ prices as well as to promote a full solution to our customers.
In Israel, where our headquarters and manufacturing operations are located, we distribute our products directly to several local distributors who in turn sell them to fabricators. This arrangement minimizes our financial exposure to end-consumers and provides us with significant depth of coverage in the Israeli market. Although we sell our products to distributors in this market, we consider this a direct market due to the warranty we provide to end-consumers, as well as our fabricator technical and health and safety instruction programs and our local sales and marketing activities. In the United States, Australia, Canada and Singapore we have established direct distribution channels with distribution locations in major urban centers complemented by arrangements with various third parties sub-distributors or stone suppliers in certain areas of the United States. As of 2016, in Australia, Canada and the United States, the adoption rate of the engineered quartz surfaces was approximately 45%, 24% and 14%, respectively, of the overall countertop market by volume, and we have captured approximately 52%, 39% and 13% of countertop market share in Australia, Canada and the United States, respectively.
Our subsidiaries in the United States and Canada entered into agreements with IKEA in May 2013 and in October 2014, respectively. These agreements have been extended and are currently in effect through December 31, 2017, unless terminated earlier in accordance with their terms. We believe that it is likely that the IKEA agreements will be extended, however there is no assurance that such renewal will be made at similar terms or at all. Pursuant to these agreements, we provide quartz and solid surfaces countertops to IKEA customers in the United States and Canada, which we source, fabricate and install. Such countertops are then marketed by IKEA without a brand name in the United States and Canada. We have engaged several third-parties fabricators to provide us with the fabrication and installation services designated for IKEA customers. In addition, starting from the first quarter of 2017, we provide an overlay solution, made of our products, for existing countertops to Lowe’s. Similar to IKEA, in addition to our products, we provide also fabrication and installation services through third party fabricators. We offer this solution in certain Lowe’s stores in the United States and expect to gradually increase the number of Lowe's stores we serve.
In 2016, we terminated our engagement with our U.K. distributor, and starting in January 2017 we have been selling and distributing our products in the U.K. directly through our U.K. subsidiary, Caesarstone (UK) Ltd.
35
Indirect Markets
We distribute our products in other territories in which we do not have a direct sales channel through third-party distributors, who generally distribute our products to fabricators on an exclusive or non-exclusive basis in a specific country or region. Fabricators sell our products to contractors, developers, builders and consumers. In some cases, our distributors operate their own fabrication facilities. Additionally, our distributors may sell to sub-distributors located within the territory who in turn sell to fabricators.
In most cases, we engage one distributor to serve a country or region. Today, we sell our products in over 45 countries through third-party distributors, and over 50 countries in total. Sales to third-party distributors accounted for 9.9% of our revenues in 2016. This strategy often allows us to accelerate our penetration into multiple new markets. Our distributors typically have prior stone surface experience and close relationships with fabricators, builders and contractors within their respective territory. Some of our distributors are also fabricators.
We work closely with our distributors to assist them in preparing and executing a marketing strategy and comprehensive business plan. Ultimately, however, our distributors are responsible for the sales and marketing of our products and providing technical support to their customers within their respective territories. To assist our distributors in the promotion of our brand in these markets, we provide our distributors with marketing materials and in certain cases, monetary participation in marketing activities. Our distributors devote significant effort and resources to generating and maintaining demand for our products along all levels of the product supply chain in their territory. To this end, distributors use our marketing products and strategies to develop relationships with local builders, contractors, developers, architects and designers. Certain distributors, as well as sub-distributors, do not engage in brand promotion activities and their activities are limited to sales promotion, warehousing and distributing to fabricators or other customers.
We do not control the pricing terms of our distributors’ or sub-distributors’ sales to fabricators. As a result, prices for our products for fabricators may vary.
Sales and Marketing
Sales
For our direct sales, we manufacture engineered quartz slabs based upon our rolling projections of the demand for our products, and for our indirect sales, we manufacture our products on a purchase order basis
In recent years, our sales department, responsible for our global sales to third parties, which is based in Israel, has focused on penetrating new markets, as well as further developing our key growth indirect sales markets. We have developed a comprehensive methodology for evaluating and entering new markets. In particular, we analyze several factors within a market, including existing demand for stone products, supported by stone installation capabilities, gross domestic product per capita, the competitive landscape and the economic growth rate. We focus our efforts on those markets that we believe offer significant growth opportunity for our products. Potential distributors are evaluated based on their experience in the surface products industry, logistics and distribution capabilities and suitability to market our products. In recent years, we significantly increased the number of countries where we conduct indirect sales by appointing distributors in several new countries on an exclusive or non-exclusive basis, including Belgium, Russia, and countries in Eastern Europe. We intend to continue to penetrate new markets in collaboration with distributors.
In recent years, we have also significantly increased our revenues within our existing key direct markets in the United States, Australia, Canada and Israel. We believe our products still have significant growth opportunities in the United States, Australia and Canada. In addition, in 2016 we established a direct sales channel in the United Kingdom. We intend to continue to invest resources to further strengthen and increase our penetration in our existing markets. We are also exploring alternative sales channels and methodologies to further enhance our presence in each market.
36
Marketing
We position our engineered quartz surfaces as premium branded products in terms of their designs, quality and pricing. Through our marketing, we seek to convey our products’ ability to elevate the overall quality of an entire kitchen or other interior setting. Our marketing strategy is to deliver this message every time our customers (including end-customers), fabricators, architects and designers come in contact with our brand. We also aim to communicate our position as a design-oriented global leader in engineered quartz surface innovation and technology.
The goal of our marketing activities is to drive marketing and sales efforts through our subsidiaries and our distributors, while creating demand for our products from end-consumers, fabricators, contractors, architects and designers, which we refer to as a “push-and-pull demand strategy.” We believe that the combination of both pushing our products through all levels of the product supply chain while generating demand from end-consumers differentiates us from our competitors in the engineered quartz and surface material industries.
We believe that by localizing our marketing activities at the distributor level (including in our direct markets), we increase the global exposure of our brand while tailoring marketing activities to the individual needs, tastes and preferences of a particular country. As such, marketing activities across our markets differ as we aim to promote sales among those who have the greatest influence on public perception in each market.
We and our distributors implement a multi-channel marketing strategy in each of our territories and market not only to our direct customers, but to the entire product supply chain, including fabricators, developers, contractors, kitchen retailers, builders, architects and designers. We use multiple marketing channels, including advertisements in home interior magazines and websites, the placement of our display stands and sample books in kitchen retails stores and our company website. Through our “Caesarstone University” program we educate fabricators about our products and their capabilities and installation methods through manuals and seminars. As a result, our markets benefit from highly trained fabricators with a comprehensive understanding of our products and the ability to install our products in a variety of applications.
Our marketing materials are developed by our global marketing department in Israel and are used by our distributors and subsidiaries globally. These materials may be slightly adjusted in their respective local markets, which helps in combining the special needs of each market and the global consistency of the Caesarstone brand. We offer our distributors a refund of a small percentage of their total purchases from us to buy our marketing materials, such as product brochures, promotional packages, print and online advertising materials, sample books, exhibition infrastructure, signage and stationary and display stands. This provides our distributors with significant flexibility to choose the best marketing strategy to implement in their particular territory. Occasionally, our local marketing departments in the United States, Australia and Canada develop their own tactical marketing materials in accordance with our global brand guidelines, in addition to using our marketing materials, due to the size and particular characteristics of these territories. In 2016, we spent $25.6 million on direct advertising and promotional activities.
Our websites are a key part of our marketing strategy. We operate a global company website that serves as an international website for our distributors. Certain of our third-party distributors and our Australian subsidiary maintain their own websites, which are in accordance with our brand guidelines and linked to our website. Our websites enable fabricators and end-consumers to view currently available designs, photo galleries of installations of our products in a wide range of settings, and read product success stories, which feature high profile individuals’ and designers’ use of our products, as well as instructions with respect to the correct usage of our products. We also conduct marketing activity in the social media arena mainly to increase our brand awareness among end-consumers, architects and designers.
We also seek to increase awareness of our brand and products through a range of other methods, such as home design shows, design competitions, media campaigns and through our products’ use in high profile projects and iconic buildings. In recent years, we have collaborated with renowned designers, who created exhibitions and particles from our products. Our design initiatives attracted press coverage around the world.
Research and Development
Our research and development department is located in Israel. The department is comprised of 16 employees and works closely with employees from other departments, all of whom have extensive experience in engineered quartz surface manufacturing, polymer science, engineering, product design and engineered quartz surface applications. In 2016, research and development costs accounted for approximately 0.6% of our total revenues.
37
The strategic mission of our research and development team is to develop and maintain innovative and leading technologies and top quality designs, develop new and innovative products according to our marketing department’s roadmap, increase the cost-effectiveness of our manufacturing processes and raw materials, and generate and protect company intellectual property in order to enhance our position in the engineered quartz surface industry. We also study and evaluate consumer trends by attending industry exhibitions and hosting international design workshops with market and design specialists from various regions.
In 2012, we launched the Supernatural collection. These products are designed to reflect our interpretation of natural stone. In 2013, we introduced seven new colors under our Classico and Supernatural collections. In 2014, we introduced eight additional new colors under our Classico and Supernatural collections, including our Calacatta Nuvo, which is our interpretation of natural calacatta stone, and other products inspired by natural granite and marble, all of which were the result of new proprietary technologies developed by our research and development department. In 2015, we launched five new products under our Supernatural collection and four new colors under our Classico collection. In 2016, we launched two new products under our Supernatural collection and seven new products under our Classico collection.
Customer Service
We believe that our ability to provide outstanding customer service is a strong competitive differentiator. Our relationships with our customers are established and maintained through the coordinated efforts of our sales, marketing, production and customer service personnel. In our indirect markets, we provide all of our distributors a limited direct manufacturing defect warranty and our distributors are responsible for providing warranty coverage to end-customers. The warranties provided by our distributors vary in term with a three-year warranty provided in Europe and warranties lasting up to 20 years in other regions. In our direct markets, the warranty period also varies. We provide end-consumers with limited lifetime warranties in the United States and Canada, a ten-year limited warranty in Australia, and a three-year limited warranty in Israel. For end-consumers, warranty issues on our products are addressed by our local distributor. In our direct markets, following an end-consumer call, our technicians are sent to the product site within a short time. We train our distributors to handle local warranty issues through our “Caesarstone University” program. The Caesarstone University program includes readily accessible resources and tools regarding the fabrication, installation, care and maintenance of our products. We believe our comprehensive global customer service capabilities and the sharing of our service related know-how differentiate our company from our competitors.
Raw Materials and Service Provider Relationships
Quartz, pigment and polyester are the primary raw materials used in the production of our products. We acquire our raw materials from third-party suppliers. Suppliers ship our raw materials to our manufacturing facilities in Israel primarily by sea. For our U.S. facility, the supply sources are primarily domestic, except for quartz, which is mostly imported. Our raw materials are generally inspected at the suppliers’ facilities and upon arrival at our manufacturing facilities in Israel and the U.S. We believe our strict raw material quality control procedures differentiate our products from those of our competitors because they limit the number of product defects and contribute to the superior quality and appearance of our products. The cost of our raw materials consists of the purchase prices of such materials and costs related to the logistics of delivering the materials to our manufacturing facilities. Our raw materials costs are also impacted by changes in foreign currency exchange rates.
Quartz, which includes quartz, quartzite and other dry minerals, is the main raw material component used in our products. Raw quartz must be processed into finer grades of sand and powder before we use it in our manufacturing process. We purchase quartz from our quartz suppliers already processed by them. We acquire quartz from suppliers primarily in Turkey, Israel, Belgium, India, Spain and Portugal. In 2015, we started to acquire limited quantities of quartz from the United States for our manufacturing operations in our plant at Richmond Hill, Georgia. We require supplies of particular grades and shades of quartz for our products. In 2016, approximately 68% of our quartz, including mainly quartzite and other minerals, all of which are used across all of our products, was imported from four suppliers in Turkey, out of which approximately 39% was acquired from Mikroman Madencilik San ve TIC.LTD.STI (“
Mikroman
”), which constitutes approximately 27% of our total quartz, and approximately 36% was acquired from Polat Maden Sanayi ve Ticaret A.S (“
Polat
”), which constitutes approximately 25% of our total quartz. Our current supply arrangement with Polat for 2017 is set forth in a letter agreement, and our current supply arrangement with Mikroman for 2017 is set forth in a draft letter agreement which is being finalized as of the date of this report. We expect our arrangements with Mikroman and Polat with respect to prices and quantities to remain unchanged through the end of 2017.
38
Similar to our arrangements with Mikroman and Polat described above, we typically transact business with our quartz suppliers on an annual framework basis, under which we execute purchase orders from time to time. Quartz imported from Turkey, Europe and Israel for our U.S. manufacturing facility entails higher transportation costs. In 2017, we intend to continue to acquire quartz for our U.S. manufacturing facility mainly from the same sources we use for our Israeli facilities, but expect a slight increase in our domestic supply compared to 2016.
In most cases, we acquire polyester mainly from two suppliers, on a purchase order basis, based on our projected needs for the subsequent one to three months. Currently, suppliers are unwilling to agree to preset prices for periods longer than a quarter and suppliers' prices may vary during a quarter as well.
Pigments for our production in Israel are purchased from Israel and suppliers abroad. Pigments for our U.S. production are primarily purchased from the U.S.
Our strategy is to maintain, whenever practicable, multiple sources for the purchase of our raw materials to achieve competitive pricing, provide flexibility and protect against supply disruption.
See “ITEM 3.D. Key Information—Risk Factors—
We may encounter significant delays in manufacturing if we are required to change the suppliers for the raw materials used in the production of our products.” For our cost of quartz, polyester and pigments in 2016 and prior years, see “ITEM 5.A: Operating Results and Financial Review and Prospects—Operating Results— Cost of revenues and gross profit margin.”
Manufacturing and Facilities
Our products are manufactured at our three manufacturing facilities located in Kibbutz Sdot-Yam in central Israel, Bar-Lev Industrial Park in northern Israel and Richmond-Hill, Georgia in the U.S. We completed our Bar-Lev manufacturing facility in 2005, which included our third production line, and we established our fourth production line at this facility in 2007 and our fifth production line at this facility in 2013. We completed our U.S. manufacturing facility in 2015, where we began to operate our sixth production line in the second quarter of 2015 and our seventh line in the fourth quarter of 2015. Finished slabs are shipped from our facilities in Israel to distributors and customers worldwide and from our U.S facility to customers in North America. In addition, we have taken initial steps towards establishing our second building in the State of Georgia, to accommodate additional manufacturing capacity if we decided to build it in the future as needed to satisfy potential demand. For further discussion of our facilities, see “ITEM 4.D: Information on Caesarstone—Property, plants, and equipment.”
The manufacturing process for our products involves blending approximately 90% natural crushed quartz with approximately 10% polyester and pigments. Using machinery acquired primarily from Breton, the leading supplier of engineered stone manufacturing equipment, together with our proprietary manufacturing enhancements, this mixture is compacted into slabs by a vacuum and vibration process. The slabs are then moved to a curing kiln where the cross-linking of the polyester is completed. Lastly, the slabs are gauged, calibrated and polished to enhance shine.
We maintain strict quality control and safety standards for our products and manufacturing process. As a result, we believe that utilizing in-house manufacturing facilities are the most effective way to ensure that our end-consumers receive high quality products. Our manufacturing facilities have several safety certifications from third-party organizations, including an OHSAS 18001 safety certification from the International Quality Network for superior manufacturing safety operations.
Seasonality
For a discussion of seasonality, please refer to “ITEM 5.A: Operating and Financial Review and Prospects—Operating Results—Quarterly results of operations and seasonality.”
Competition
We believe that we compete principally based upon product quality, new product development, brand awareness and position, pricing, customer service and breadth of product offerings. We believe that we differentiate ourselves from competitors on the basis of our premium brand, our signature product designs, our ability to offer our products in major markets globally, our focus on the quality of our product offerings, our customer service oriented culture, our high involvement in the product supply chain and our leading distribution partners.
39
The dominant surface materials used by end-consumers in each market vary. Our engineered quartz surface products compete with a number of other surface materials such as granite, laminate, marble, manufactured solid surface, concrete, stainless steel, wood and ceramic large slabs, a new countertop surface material entrant. The manufacturers of these products consist of a number of regional and global competitors. Some of our competitors may have greater resources than we have, and may adapt to changes in consumer preferences and demand more quickly, expand their materials offering, devote greater resources to design innovation and establishing brand recognition, manufacture more versatile slab sizes and implement processes to lower costs.
The engineered quartz surface market is highly fragmented and is also served by a number of regional and global competitors. We also face competition from low-cost manufacturers from Asia, especially from China, and from Europe. Large multinational companies have also invested in their engineered quartz surface production capabilities. For more information, see “ITEM 3.D. Key Information—Risk Factors—We face intense competitive pressures from manufacturers of quartz or other surface materials, including certain competitors with greater resources and capital, which could materially and adversely affect our results of operations and financial condition.”
Information Technology Systems
We believe that an appropriate information technology infrastructure is important in order to support our daily operations and the growth of our business.
Our ERP software provides us with accessible quality data and allows us to accurately enter, price and configure valid products in a made-to-order, demand-driven manufacturing environment. Carefully maintained infrastructure is critical, given that our products can be built in a number of combinations of sizes, colors, textures and finishes, and our production control software enables us to carefully monitor the quality of our slabs. Given our global expansion, we implemented a global ERP based on an Oracle platform, in 2013 and 2014.
Intellectual Property
Our Caesarstone brand is central to our business strategy, and we believe that maintaining and enhancing the Caesarstone brand is critical to expanding our business.
We have obtained trademark registrations in certain jurisdictions that we consider material to the marketing of our products, all of which are used under the trade mark Caesarstone, including CAESARSTONE®, CONCETTO®, and our Caesarstone logo. We have obtained trademark registrations for additional marks that we use to identify certain product collections, including MOTIVO®, as well as other marks used for certain of our products. While we expect our applications to mature into registrations, we cannot be certain that we will obtain such registrations. In many of our markets we also have trademarks, including registered and unregistered marks, on the colors and models of our products. We believe that our trademarks are important to our brand, success and competitive position. In the past, some of our trademark applications for certain classes of our products’ applications have been rejected or opposed in certain markets and may be rejected for certain classes in the future, in all or parts of our markets, including without limitation, for flooring and wall cladding. We are currently subject to opposition proceedings with respect to applications for registration of our trademark Caesarstone™ in certain jurisdictions.
To protect our know-how and trade secrets, we customarily require our employees and managers to execute confidentiality agreements or otherwise agree to keep our proprietary information confidential. Typically, our employment contracts also include clauses requiring these employees to assign to us all inventions and intellectual property rights they develop in the course of their employment and agree not to disclose our confidential information.
In addition to confidentiality agreements, we seek patent protection for some of our latest technologies. We have obtained patents for certain of our technologies and have pending patent applications that were filed in various jurisdictions, including the United States, Europe, Australia, Canada, China and Israel, which relate to our manufacturing technology and certain products. No patent application of ours is material to the overall conduct of our business. There can be no assurance that pending applications will be approved in a timely manner or at all, or that such patents will effectively protect our intellectual property. There can be no assurance that we will develop patentable intellectual property in the future, and we have chosen and may further choose not to pursue patents for innovations that are material to our business.
40
Environmental and Other Regulatory Matters
Environmental and Health and Safety Regulations
Our manufacturing facilities and operations in Israel and our manufacturing facility in the State of Georgia, United States, whose two production lines became operational in 2015, are subject to numerous Israeli and U.S. environmental and workers' health and safety laws and regulations. Applicable U.S. laws and regulations include federal, state and local laws and regulations, including Georgia state laws. Laws and regulations in both countries deal with pollution and the protection of the environment, setting standards for emissions, discharges into the environment or to water, soil and water contamination, product specifications, generation, the treatment, import, purchase, use, storage and transport of hazardous materials, and the storage, treatment and disposal and remediation of solid and hazardous waste, including sludge, and protection of workers’ health and safety. Violations of environmental, health and safety laws, regulations and permit conditions may lead to, among other things, civil and criminal sanctions, injunctive orders as well as permit revocations and facility shutdowns as further described in “ITEM 3.D: Key Information- Risk Factors- The extent of our liability exposure for environmental, health and safety, product liability and other matters may be difficult or impossible to estimate, and could negatively impact our financial condition and results of operations”.
In addition to being subject to regulatory and legal requirements, our manufacturing facilities in Israel and in the United States operate under applicable permits, licenses and approvals with terms and conditions containing a significant number of prescriptive limits and performance standards. Business licenses for our facilities in Israel contain conditions related to a number of requirements, including with respect to dust emissions, air quality, the disposal of effluents and process sludge, and the handling of waste, chemicals and hazardous materials. In addition, we operate in Israel under poison permits that regulate our use of poisons and hazardous materials. Our current poison permits are valid until January 7, 2018 for our Bar- Lev facility and February 7, 2018 for our Sdot- Yam facility. Our facility in the United States is required to obtain and follow General Permit for Storm Water Discharges Associated with Industrial Activity of the Georgia Environmental Protection Division (GEPD), air quality permit from GEDP and other requirements and regulations including among others specific limitations on emission levels of hazardous substances, such as styrene and silica dust. Each of these permits and licenses require a significant amount of monitoring, record-keeping and reporting in order for us to demonstrate compliance therewith.
From time to time, we face environmental and health and safety compliance issues related to our two manufacturing facilities in Israel.
| • |
Bar-Lev business license.
The business license for our Bar-Lev plant is effective until March 15, 2017. Renewal of the business license is subject to approval by certain authorities, including the Israeli Ministry of Environmental Protection (“
IMEP
”) and the IMLSS, which have been obtained as of the date of this report. Accordingly, we expect such license to be extended by the municipal authorities. The business license for our Sdot-Yam plant is effective for an unlimited term.
|
| • |
Styrene gas emissions.
The IMEP requires us to comply with the applicable obligations under the law and regulations related to styrene gas emission at both of our manufacturing facilities in Israel.
|
| - |
Bar-Lev. We installed and implemented systems which we believe reduce the amount of styrene emissions as required and presented to IMEP a plan to further improve our control of styrene emission at our Bar-Lev facility and comply with the styrene gas emission standards. We intend to continue monitoring, and, if necessary, applying corrective measures to control the styrene emissions at our facilities.
|
| - |
Sdot- Yam. At a hearing held in January 2014 the IMEP recommended an investigation to examine its allegations that, based on IMEP’s samplings, we exceeded the ambient air standards. In a further hearing held in December 2015, the IMEP indicated that it intends to conduct unannounced inspections of our facilities. If the IMEP decides that we do not fully comply with the styrene emission standards, our business license may be revoked, our facilities’ operation may be limited or could be shut down and we could become subject to civil and criminal sanctions. During 2016, we implemented additional engineering solutions and enhanced safety practices in both of our facilities to improve compliance with the styrene gas emission standards. In November 2016, the IMEP visited our Sdot-Yam facility and provided us with a summary of its findings with respect to our Sdot-Yam facility. We are in discussions with the IMEP and intend to continue monitoring, and, if necessary, applying corrective measures to control the styrene emissions at our facilities.
|
41
| • |
Waste water disposal.
We currently dispose of our waste water from our Bar-Lev and Sdot-Yam manufacturing facilities in a treatment plant pursuant to permits obtained from the IMEP both of which are currently effective until December 31, 2017. If we are unable to extend our permits or the treatment plant does not obtain a renewal of its permit, we may need to use alternative treatment facilities and adjust to their standards and requirements, which may result in additional expenses.
|
| • |
Dust emissions.
|
| o |
With respect to dust emissions both into the environment and inside our manufacturing facilities in Israel, we are implementing measures in order to achieve compliance with dust emission environmental standards and meet the health and safety standards with respect to permissible exposure limits.
|
| o |
On December 25, 2016, the IMLSS issued safety orders instructing us to stop production in certain manufacturing processes of the two production lines at our Sdot-Yam facility. The orders alleged deviations from permitted ambient levels of silica dust, styrene and acetone in the facility. Simultaneously, the IMLSS issued a warning of pending safety orders seeking the suspensions of our Bar-Lev facility. As the orders were based on outdated monitoring results, the MLSS granted us with additional time to obtain updated monitoring results, and, on January 29, 2017, upon receiving satisfactory results reflecting significant improvement, the IMLSS rescinded the orders. Going forward, we will seek to continue reducing the level of exposure of our employees to silica dust, styrene and acetone, while we enforce our employees' use of personal protection equipment.
|
| • |
Sludge waste disposal
|
| o |
In 2014, the IMEP analyzed our sludge waste and determined to classify our sludge as “solid industrial waste.” Such classification resulted in higher charges imposed on us in connection with the sludge disposal. In 2016, the IMEP changed the classification of our sludge to “industrial waste,” which reduced the charges related to sludge disposal, although we are still incurring higher charges compared to that we incurred prior to the classification change made in 2014.
|
In addition, our inability to maintain each of the poison permits of our facilities in Israel as described above, or to renew them could negatively impact our financial condition and result of operations. Failing to comply with such poison permits conditions may also expose us and our officers to criminal liability. Failing to extend such poison permits would prevent us from operating our plants.
Other Regulation
We are subject to the Israeli Rest Law, which, among other things, prohibits the employment of Jewish employees on Saturdays and Jewish holidays, unless a permit is obtained from the IMEI. In January 2016, we received a permit from the IMEI to employ Jewish employees on Saturdays and Jewish holidays in connection with most of the production machinery in our Sdot-Yam facility, effective until December 31, 2017. Currently, in our Bar-Lev facility, our Jewish employees do not work on Saturdays, while our non-Jewish employees are employed on such days.
If we are deemed to be in violation of the Rest Law, we and our officers may be exposed to administrative and criminal liabilities, including fines, and our operational and financial results could be materially and adversely impacted. For more information, see “Item 3.D. Risk Factors—Risks relating to our incorporation and location in Israel—If we fail to comply with Israeli law restrictions concerning employment of Jewish employees on Saturdays and Jewish holidays, we and our office holders may be exposed to administrative and criminal liabilities and our operational and financial results may be materially and adversely impacted.”
For information on other regulation applicable, or potentially applicable, to us, see the following risks factors in “ITEM 3.D. Key Information—Risk Factors”:
| · |
“Risks related to our business and industry—We may have exposure to greater-than-anticipated tax liabilities.”
|
| · |
“Risks related to our incorporation and location in Israel—Our operations may be disrupted by the obligations of personnel to perform military service.”
|
42
| · |
“Risks related to our incorporation and location in Israel—The tax benefits that are available to us require us to continue to meet various conditions and may be terminated or reduced in the future, which could increase our costs and taxes.”
|
| · |
“Risks related to our incorporation and location in Israel—If we are considered a ‘monopoly’ under Israeli law, we could be subject to certain restrictions that may limit our ability to freely conduct our business to which our competitors may not be subject.
|
Legal Proceedings
See “ITEM 8.A: Financial Information—Consolidated Financial Statements and Other Financial Information—Legal Proceedings.”
The legal name of our company is Caesarstone Ltd. On June 9, 2016, the Israeli Register of Companies approved to change our name from Caesarstone Sdot-Yam Ltd. to Caesarstone Ltd.
Caesarstone was organized under the laws of the State of Israel. We have five wholly-owned subsidiaries: Caesarstone Australia PTY Limited, which is incorporated in Australia, Caesarstone South East Asia PTE LTD, which is incorporated in Singapore, Caesarstone (UK) Ltd. which is incorporated in the United Kingdom, Caesarstone USA, Inc. and Caesarstone Technologies USA, Inc. (which is wholly-owned by Caesarstone USA, Inc.), both of which are incorporated in the United States.
We hold a 55% ownership interest in Caesarstone Canada, a joint venture we established in 2010 with our former distributor in Eastern Canada, Ciot, which operates fabrication facilities and is also a significant customer of Caesarstone Canada. The approval of both shareholders is required for certain corporate actions by the joint venture, including reducing the selling price of the joint venture’s products below a certain level. Unless we and Ciot otherwise agree, at the end of each financial year Caesarstone Canada is obligated to distribute 30% of its distributable profits (net profits, the distribution of which will not cause certain events such as insolvency, breach of bank covenants or missing future cash flows or budget, as determined by the board of Caesarstone Canada). As of the date of this report, a total amount of $539 thousand was distributed on the account of Caesarstone Canada's years of operation through the end of 2015.
In connection with the formation of the joint venture, we granted Ciot a put option and Ciot granted us a call option for its interest, each exercisable any time between July 1, 2012 and July 1, 2023. Exercise of the put option requires six months prior notice. Exercise of the call option does not require prior notice. The purchase prices of each option is to be calculated based on the 45% interest out of corporate value of Caesarstone Canada. Corporate value calculated according to a formula that evaluates the number of slabs sold by Caesarstone Canada and the price per slab and adjustments related to changes in price per slab for Caesarstone Canada Inc. The put option may only be exercised for at least $5 million plus an additional amount equal to interest at a yearly rate of 3.75%. The exercise of the put or call option would result in an increase in our ownership interest from 55% to 100%.
43
Our manufacturing facilities are located on the following properties in Israel and the United States:
|
Properties
|
Issuer’s rights
|
Location
|
Purpose
|
Size
|
||||
|
Kibbutz Sdot-Yam(1)
|
Land Use Agreement
|
Caesarea, Central Israel
|
Headquarters, manufacturing facility, research and development center
|
30,344 square meters of facility and 60,870 square meters of un-covered yard *
|
||||
|
Bar-Lev Industrial Park manufacturing facility (2)
|
Land Use Agreement
|
Carmiel, Northern Israel
|
Manufacturing facility
|
22,844 square meters of facility and 53,261 square meters of un-covered yard**
|
||||
|
Belfast Industrial Center(3,4)
|
Ownership
|
Richmond Hill, Georgia, United States
|
Manufacturing facility
|
26,400 square meters of facility and 401,110 square meters of un-covered yard (excluding 56,089 square meters of wetland)
|
* Square-meter figures with respect to properties in Israel are based on data measured by the relevant municipalities used for local tax purposes
** Square-meter figures based on data used by Israeli municipalities for local tax purpose is adjusted to reflect the property leased from Kibbutz Sdot-Yam as agreed between us and the Kibbutz during year 2014.
| (1) |
Leased pursuant to a land use agreement with Kibbutz Sdot-Yam entered into in March 2012 with a term of 20 years, which replaced the former land use agreement. Starting from September 2014 we use an additional 9,000 square meters pursuant to Kibbutz Sdot-Yam’s consent under terms materially similar to the land use agreement. However, we have the right to return such additional office space and premises to Kibbutz Sdot-Yam at any time upon 90 days’ prior written notice. In September 2016, we exercised our right to return to the Kibbutz an additional office space of approximately 400 square meters which we used since January 2014 under terms materially similar to the land use agreement. The lands on which these facilities are located are held by the ILA and leased or subleased by Kibbutz Sdot-Yam pursuant to agreements described in “ITEM 7.B: Major Shareholders and Related Party Transactions—Related Party Transactions—Relationship and agreements with Kibbutz Sdot-Yam—Land use agreement.”
|
| (2) |
Leased pursuant to a land use agreement with Kibbutz Sdot- Yam entered into in March 2011, with a term of 10 years commencing in September 2012, which will be automatically renewed, unless we give two years prior notice, for an additional 10- year term. This agreement was executed simultaneously with the land purchase and leaseback agreement we entered into with Kibbutz Sdot- Yam, according to which Kibbutz Sdot- Yam acquired from us our rights in the lands and facilities of the Bar-Lev industrial center, under a long term lease agreement we entered into with the ILA on June 6, 2007 to use the premises for an initial period of 49 years as of February 6, 2005, with an option to renew for an additional term of 49 years as of the end of the initial period. For more information, see “ITEM 7.B: Major Shareholders and Related Party Transactions—Related Party Transactions—Relationship and agreements with Kibbutz Sdot-Yam—Land purchase agreement and leaseback.”
|
| (3) |
On September 17, 2013, we entered into a purchase agreement for the purchase of approximately 45 acres of land in Richmond Hill, the State of Georgia, United States, comprising approximately 36.6 acres of upland and approximately 9 acres of wetland for our new U.S. manufacturing facility, the construction of which was completed in 2015. On June 22, 2015, we exercised a purchase option in the agreement and acquired approximately 19.4 acres of land, comprising approximately 18.0 acres of upland. On November 25, 2015, we entered into a new purchase agreement for the purchase of approximately 54.9 acres of additional land situated adjacent to the previously purchased land, comprising approximately 51.1 acres of upland.
|
| (4) |
In December 2014, we entered into a bond purchase loan agreement, were issued a taxable revenue bond on December 1, 2014, and executed a corresponding lease agreement. Pursuant to these agreements, the Development Authority of Bryan County, an instrumentality of the State of Georgia and a public corporation (“
DABC
”), has acquired legal title of our facility in Richmond Hill, in the State of Georgia, U.S., and in consideration leased such facilities back to us. In addition, the facility was pledged by DABC in favor of us and DABC has committed to re-convey title to the facility to us upon the maturity of the bond or at any time at our request, upon our payment of $100 to DABC. Therefore, we consider such facilities to be owned by us. This arrangement was structured to grant us property tax abatement for ten years at 100% and additional five years at 50%, subject to our satisfying certain qualifying conditions with respect to headcount, average salaries paid to our employees and the total capital investment amount in our U.S. plant. In December 2015 we entered into an additional bond purchase loan agreement with the Development Authority of Bryan County, and were issued a second taxable revenue bond on December 22, 2015, to cover additional funds and assets which were utilized in the framework of establishing our U.S. facility.
|
Various environmental issues may affect our utilization of the above-mentioned facilities. For a further discussion, see “Item 4.B. Information on the Company—Business Overview—Environmental and Other Regulatory Matters—Environmental and Health and Safety Regulations” above.
44
Not applicable.
The following discussion and analysis of our financial condition and results of operations should be read in conjunction with our financial information presented in “ITEM 3: Key Information,” our audited consolidated balance sheets as of December 31, 2016 and 2015, the related consolidated income statements and cash flow statements for each of the three years ended December 31, 2016, 2015, and 2014, and related notes and the information contained elsewhere in this annual report. Our financial statements have been prepared in accordance with U.S. generally accepted accounting principles. See “ITEM 3.D: Risk Factors” and “Special Note Regarding Forward Looking Statements.”
Company overview
We are a leading manufacturer of high-quality engineered quartz surfaces sold under our premium Caesarstone brand. The substantial majority of our quartz surfaces are used as countertops in residential kitchens and sold primarily into the renovation and remodeling end markets. Other applications for our products include vanity tops, wall panels, back splashes, floor tiles, stairs and other interior surfaces that are used in a variety of residential and commercial applications.
Founded in 1987, Caesarstone is a pioneer in the engineered quartz surface industry. We have grown to become the largest provider of quartz surfaces in Australia, Canada, Israel, France and South Africa, and have significant market share in the United States and Singapore. Our products accounted for approximately 8% of global engineered quartz by volume in 2016. Our sales in the United States, Australia, Canada and Israel, our four largest markets, accounted for 41.3%, 24.3%, 15.9% and 7.9% of our revenues in 2016, respectively. We believe that our revenues will continue to be highly concentrated among a relatively small number of geographic regions for the foreseeable future. For further information with respect to our geographic concentration, see “ITEM 3.D: Key Information—Risk Factors—Our revenues are subject to significant geographic concentration and any disruption to sales within one of our key existing markets could materially and adversely impact our results of operations and prospects.”
We have direct sales channels in the United States, Australia, Canada, Israel, Singapore and, as of January 1, 2017, the United Kingdom. We generate the majority of our revenues in the United States from direct distribution of our products throughout the country. In Australia, we generate the substantial majority of our business from direct distribution. In Israel, we distribute our products directly to several local distributors who in turn sell primarily to fabricators. We sell our products in Canada through a joint venture in which we hold a 55% interest. We also sell our products directly in Singapore, and the United Kingdom. In our remaining markets, we distribute our products through third-party distributors. In each of our markets, fabricators typically sell our products to end consumers, contractors, developers and builders who are generally advised by architects and designers regarding the use of our products. Our strategy is to generate demand from all levels in our product supply chain.
We experienced annual compound revenue growth of 9.7% between 2014 and 2016, driven mainly by the continued quartz penetration, improvement in housing conditions (increased remodeling spending and residential unit completions) in our top three markets, increased portion of innovative products within our offering and market share gains in Canada, partly due to the partnership with IKEA. Our growth rate in 2016 compared to 2015 slowed down to 7.8%, impacted mostly by a 0.3% decline in the United States compared to 20.3% growth in 2015 from 2014, partly due to decline in revenue from IKEA, which was negatively impacted by the temporary changes in IKEA promotional events. From 2014 to 2016, our gross profit margins decreased from 42.4% to 39.5%, adjusted EBITDA margins decreased from 26.1% to 24.2%, and adjusted net income decreased from 18.4 to 15.1% over the same period. We attribute the decrease in margins mainly to the inefficiencies in our Richmond Hill facility which opened in 2015 and to negative exchange rates fluctuations.
45
Our strategy is to continue to be a global market leader of surfaces and quartz surface products, in particular. We continue to invest in developing our premium brand worldwide and to further expand our differentiated product offering. We intend to continue to expand our sales network by further penetrating our existing markets as well as entering new markets. We believe that a significant portion of our future growth will come from continued penetration of our U.S. market, particularly with the additional manufacturing capacity in our U.S. facility, which began operations during 2015—as well as from our markets in Australia and Canada. We believe our expansion into new markets that exhibit an existing demand for stone products and stone installation capabilities will contribute to our future growth in the long term. We believe there may be consolidation in the quartz surface industry in the future and to remain competitive in the long term, we will need to grow our business both organically and through the acquisition of third-party distributors, manufacturers and/or raw material suppliers and/or the expansion of our product offering.
Factors impacting our results of operations
We consider the following factors to be important in analyzing our results of operations:
| • |
Our sales are impacted by home renovation and remodeling and new residential construction, and to a lesser extent, commercial construction. We estimate that approximately 60% of our revenue is related to renovation and remodeling activities in the United States, Australia and Canada, while 25% to 35% is related to new residential construction. Renovation and remodeling spending increased single digit in each of these markets in both 2015 and 2016. Housing completions increased by higher rates compared to renovation spending in 2015 but dropped in Australia and Canada during 2016. In 2015, our revenues increased by 11.6% with a major negative exchange rate impact. On a constant currency basis our revenue increased by 22.1% and occurred in all regions. The growth was primarily driven by continued demand in the United States, the Company's largest market, with Canada and Australia delivering the highest growth rates on a constant currency basis. In 2016, our revenues increased by 7.8%. On a constant currency basis, revenues increased by 8.4%.The growth was primarily in Canada and Australia, delivering 25.4% and 19.0% constant currency growth, respectively. Revenues in the United States declined 0.3% despite strong quartz penetration and positive housing environment, reflecting single digit core growth and decline in our revenues from IKEA.
|
| • |
Our gross profit margins have decreased from a level of 42.4% in 2014 to 40.1% in 2015 and 39.5% in 2016, despite lower raw material costs and a significant improvement in product offering and scale benefits. This margin erosion mainly reflects inefficiencies in our Richmond-Hill facility and unfavorable exchange rates fluctuations.
|
| • |
Our operating income margins were 17.2% in 2016, 19.3% in 2015 and 21.2% in 2014. The continuing decrease is mainly related to the gross margin erosion mentioned above and to the introduction of legal settlement and loss contingencies expense related to silicosis claims.
|
| • |
In 2005, we commenced operations with a third manufacturing line at a new manufacturing facility in the Bar-Lev Industrial Park in northern Israel. We subsequently established a fourth production line in 2007 with the addition of a second production line at our Bar-Lev manufacturing facility. The operation of the fifth production line in the Bar-Lev manufacturing facility included two phases and was completed in the second quarter of 2014. The first production line in the new U.S. facility started operations in the second quarter of 2015 and the second production line started operations in the fourth quarter of 2015. Our investments related to the fifth production line at our Bar-Lev manufacturing facility during 2013 and 2014 was $25 million and the investment related to the new manufacturing facility in the United States was approximately $135 million, mostly during 2014 and 2015.
|
46
| • |
As an increasing portion of our products are sold through direct channels, our revenues and results of operations exhibit some quarterly fluctuations as a result of seasonal influences which impact construction and renovation cycles. Due to the fact that certain of our operating costs are fixed, the impact on our adjusted EBITDA, adjusted net income and net income of a change in revenues is magnified. We believe that the third quarter tends to exhibit higher sales volumes than other quarters because demand for quartz surface products is generally higher during the summer months in the northern hemisphere with the effort to complete new construction and renovation projects before the new school year. Conversely, the first quarter is impacted by the winter slowdown in the northern hemisphere in the construction industry and depending on the date of the spring holiday in Israel in a particular year, the first or second quarter is impacted by a reduction in sales in Israel due to such holiday. Similarly, sales in Australia during the first quarter are negatively impacted by fewer construction and renovation projects. The fourth quarter is susceptible to being impacted from the onset of winter in the northern hemisphere.
|
| • |
We conduct business in multiple countries in North America, South America, Europe, Asia-Pacific, Australia and the Middle East and as a result, we are exposed to risks associated with fluctuations in currency exchange rates between the U.S. dollar and certain other currencies in which we conduct business. A significant portion of our revenues is generated in U.S dollar, and to a lesser extent the Australian dollar, the Canadian dollar, the euro and the new Israeli shekel. In 2016, 43.0% of our revenues were denominated in U.S. dollars, 24.3% in Australian dollars, 15.9% in Canadian dollars, 8.9% in euros and 7.9% in NIS. As a result, devaluations of the Australian dollars, and to a lesser extent, the Canadian dollar relative to the U.S. dollar may unfavorably impact our profitability. Our expenses are largely denominated in U.S. dollars, NIS and euro, with a smaller portion in Canadian dollars and Australian dollars. As a result, appreciation of the NIS, and to a lesser extent, the euro relative to the U.S. dollar may unfavorably affect our profitability. We attempt to limit our exposure to foreign currency fluctuations through forward and option contracts, which, except for U.S. dollar/NIS forward contracts, are not designated as hedging accounting instruments under ASC 815, Derivatives and Hedging. As of December 31, 2016, we had outstanding contracts with a notional amount of $187 million. These transactions were for a period of up to 12 months. The fair value of these foreign currency derivative contracts was $2.0 million, which is included in current assets and current liabilities, at December 31, 2016. For further discussion of our foreign currency derivative contracts, see “ITEM 11: Quantitative and Qualitative Disclosures About Market Risk.”
|
Components of statements of income
Revenues
We derive our revenues from sales of quartz surfaces, mostly to fabricators in our direct markets and to third-party distributors in our indirect markets. In the United States, Australia, Canada, Singapore the initial purchasers of our products are primarily fabricators. In Israel, the purchasers are local distributors who in turn sell to fabricators. In the United States, we also sell our products to a small number of sub-distributors, stone resellers as well as to IKEA. We consider Israel to be a direct market due to the warranty we provide to end-consumers, our local fabricator technical instruction programs and our local sales and marketing activities. The purchasers of our products in our other markets are our third-party distributors who in turn sell to sub-distributors and fabricators. Our direct sales accounted for 90.1%, 89.5% and 88.2% for the years ended December 31, 2016, 2015 and 2014, respectively.
We recognize revenues upon sales to an initial purchaser when persuasive evidence of an agreement exists, delivery of the product has occurred, the fee is fixed or determinable and collection is probable. Delivery occurs when title is transferred under the applicable international commerce terms, or Incoterms, to the purchaser.
The warranties that we provide vary by market. In our indirect markets, we provide all of our distributors with a limited direct manufacturing defect warranty. In all of our indirect markets, distributors are responsible for providing warranty coverage to end-customers. In Australia, Canada, the United States and Singapore we provide end-consumers with a limited warranty on our products for interior countertop applications. In Israel, we typically provide end-consumers with a direct limited manufacturing defect warranty on our products. Based on historical experience, warranty issues are generally identified within one and a half years after the shipment of the product and a significant portion of defects are identified before installation. We record a reserve on account of possible warranty claims, which increases our cost of revenues. Historically, warranty claims expenses have been low, accounting for approximately 0.2% of our total goods sold in 2016.
47
The following table sets forth the geographic breakdown of our revenues during the periods indicated:
|
Year ended December 31,
|
||||||||||||||||||||||||
|
2016
|
2015
|
2014
|
||||||||||||||||||||||
|
Geographical Region
|
% of total
revenues
|
Revenues in
thousands of USD |
% of total
revenues
|
Revenues in
thousands of USD |
% of total
revenues |
Revenues in
thousands of USD |
||||||||||||||||||
|
United States
|
41.3
|
%
|
$
|
222,597
|
44.7
|
%
|
$
|
223,341
|
41.5
|
%
|
$
|
185,583
|
||||||||||||
|
Australia (incl. New Zealand)
|
24.3
|
130,910
|
22.1
|
110,290
|
24.0
|
107,539
|
||||||||||||||||||
|
Canada
|
15.9
|
85,740
|
14.2
|
70,739
|
12.9
|
57,898
|
||||||||||||||||||
|
Israel
|
7.9
|
42,545
|
7.9
|
39,645
|
9.2
|
41,286
|
||||||||||||||||||
|
Europe
|
4.8
|
25,606
|
4.8
|
23,949
|
5.2
|
23,109
|
||||||||||||||||||
|
Rest of world
|
5.8
|
31,145
|
6.3
|
31,551
|
7.2
|
31,987
|
||||||||||||||||||
|
Total
|
100.0
|
%
|
$
|
538,543
|
100.0
|
%
|
$
|
499,515
|
100.0
|
%
|
$
|
447,402
|
||||||||||||
In 2016, U.S. revenues decreased by 0.3%, reflecting a single-digit core growth rate, offset with lower sales in IKEA related to temporary changes of their promotional events that started in 2015 and impacted 2016 as well. In 2015, U.S. revenues increased by 20.3%, mainly reflecting a single-digit growth rate in IKEA business, following temporary cancellation of their relevant quarterly promotional events, which generate a significant portion of our sales through IKEA. Growth rate was also affected by a significantly milder U.S. housing market improvement. Revenues in Australia grew by 18.7% in 2016, following a 2.6% growth in 2015. On a constant currency basis, revenues in Australia grew by 19% and 24.0% in 2016 and 2015, respectively, leveraging continued quartz penetration and improved mix of differentiated products within our total product offering. In 2015 constant currency growth was stronger than 2016 reflecting a better housing environment and price increases to partially offset the exchange rate deterioration. In Canada, revenues grew 21.2% in 2016, representing a 25.4% increase on a constant-currency basis compared to 22.2% growth, 41.2% on a constant-currency basis in 2015. Our growth rate in Canada was the strongest among all regions in both years, with a decrease between 2015 and 2016 primarily related to a lesser IKEA ramp-up impact and a softer housing market in 2016. According to Statistics Canada, renovation and remodeling in Canada was estimated to have grown only 0.8% in 2016, in contrast with 3.1% growth in 2015. Furthermore, residential completions declined 3.5% in 2016 after a 7.2% increase in 2015. Revenues in Israel increased by 7.3% compared to a decline of 4.0% in 2015. On a constant-currency basis, revenues grew by 6.3% in 2016 compared with 5.3% growth in 2015. The rate of revenue growth in Israel is generally less than other regions given the significant and longer standing penetration of quartz and our large countertop market share. Revenues in Europe grew by 6.9% and 3.6% in 2016 and 2015, respectively. On a constant-currency basis, growth in Europe 2016 was 7.1% compared to 23.6% in 2015. Our revenue performance in Europe was negatively impacted in the second half of 2016 by the advance notice termination given to our previous distributor in the United Kingdom as part of our early preparations to commence direct distribution in this market. Our revenues for the rest of the world declined by 1.3% in 2016 and by 1.4% in 2015. On a constant-currency-basis, revenues declined by 1.0% in 2016, compared to 13.9% growth in 2015.
We did not have any customer in 2016, 2015 and 2014 that accounted for more than 10% of our revenues.
Some of our initial engagements with distributors are pursuant to an agreement or terms of sale, as applicable, granting that distributor one year of exclusivity in consideration for meeting minimum sales targets. After the initial one-year period, we may enter into a distribution agreement for a multi-year period. However, in the majority of cases, we continue to operate on the basis of an agreement or terms of sale, or without any operative agreement. Some distributors operate on nonexclusive terms of sale agreements or entirely without agreements but rather on a purchase order basis. In all cases, we only supply our products to distributors upon the receipt of a purchase order from the distributor.
Cost of revenues and gross profit margin
Approximately 44% of our cost of revenues is raw material costs. The cost of our raw materials consists of the purchase prices of such materials and costs related to the logistics of delivering the materials to our manufacturing facilities. Our raw materials costs are also impacted by changes in foreign exchange rates. Our principal raw materials, quartz and polyester, jointly accounted for approximately 69% of our total raw material cost in 2016. The balance of our cost of revenues consists primarily of manufacturing costs and related overhead. Cost of revenues in our direct distribution channels also includes the cost of delivery from our manufacturing facilities to our warehouses, warehouse operational costs, as well as additional delivery costs associated with the shipment of our products to customer sites in certain markets. In the U.S. and Canada we also incur fabrication and installation costs related mainly to IKEA. In the case of our indirect distribution channels, we bear the cost of delivery to the Israeli seaport and our distributors bear the cost of delivery from the seaport to their warehouses.
48
Quartz is one of our principal raw materials. Our products incorporate a number of types of quartz, including quartzite, quartz and other dry minerals. In 2016, approximately 68% of our total quartz was from four suppliers in Turkey, with the major part acquired from Mikroman and Polat.
Quartz accounted for approximately 37% of our raw materials cost in 2016. Accordingly, our cost of sales and overall results of operations are impacted significantly by fluctuations in quartz prices. In 2015, the average cost of quartz decreased by approximately 1.5% despite some selective price increases from our Turkish quartz suppliers. This reduction was related to an approximately 16% devaluation of the euro compared to the U.S. dollar in 2015 on an annual average basis, which affected the cost of purchasing quartz from non-Turkish European suppliers. Quartz imported for our U.S. manufacturing facility involves higher transportation costs, therefore our total average quartz costs increased by approximately 1.3% in 2015. In 2016 the average cost of quartz decreased by 1.3% as a result of lower transportation cost, given the drop in oil prices. Any future increases in quartz costs may adversely impact our margins and net income.
Given the significance of polyester costs relative to our total raw material expenditures, our cost of sales and overall results of operations are impacted significantly by fluctuations in their prices, which generally correlate with oil prices. In 2015, average polyester costs decreased by approximately 27% from 2014, of which approximately 12% was due to a change in our costs denominated in euros, and the rest related to an approximately 16% weakening of the euro compared to the U.S. dollar on an average annual basis. In 2016 average polyester costs decreased by approximately 12%, of which only 0.3% were related to devaluation of the Euro compared to the U.S. dollar. Any future increases in polyester costs may adversely impact our margins and net income.
We are exposed to fluctuations in the prices of pigments, although to a lesser extent than with polyester. For example, the cost of titanium dioxide, our principal white pigmentation agent, decreased continuously by approximately 20% and 3% in 2015 and 2016, respectively.
The gross profit margins on sales in our direct markets are generally higher than in our indirect markets in which we use third-party distributors, due to the elimination of the third-party distributor’s margin. In many markets, our expansion strategy is to work with third-party distributors who we believe will be able to increase sales more rapidly in their market than if we distributed our products directly. However, in several markets we distribute directly, including the United States, Australia, Canada and, as of January 1, 2017, in the United Kingdom. In the future, we intend to evaluate other potential markets to distribute directly.
Research and development, net
Our research and development expenses consist primarily of salaries and related personnel costs, as well as costs for subcontractor services and costs of materials consumed in connection with the design and development of our products. We expense all of our research and development costs as incurred.
Marketing and selling
Marketing and selling expenses consist primarily of compensation and associated costs for personnel engaged in sales, marketing, distribution and advertising and promotional expenses. Between 2014 and 2015, our absolute spending increased but decreased as a percentage of revenues. In 2016, we increased our sales and marketing expenses further both in absolute spending and as a percentage of revenues. This was mainly attributed increased marketing and sales spending in the U.S., partly labor cost increase aimed to strengthen our U.S. marketing and sales organization and other direct marketing spending in the same region to drive revenue growth.
General and administrative
General and administrative expenses consist primarily of compensation and associated costs for personnel engaged in finance, human resources, information technology, legal and other administrative activities, as well as fees for legal and accounting services. See “—Other factors impacting our results of operations—Agreements with Kibbutz Sdot-Yam” and “ITEM 7: Major Shareholders and Related Party Transactions—Related Party Transactions.”
49
Legal settlements and loss contingencies, net
Legal settlements and loss contingencies, net were first recorded in 2015 and consist of expenses related to settlements expenses and estimated exposure not covered by the Company's insurance applicable to individual silicosis claims. In 2016, we recorded additional $5.9 million related to silicosis claims.
Finance expenses, net
Finance expenses, net, consist primarily of, bank and credit card fees, borrowing costs, losses on derivative instruments and exchange rate differences arising from changes in the value of monetary assets and monetary liabilities stated in currencies other than the functional currency of each entity. These expenses are partially offset by interest income on our cash balances and gains on derivative instruments. Our bank interest expenses have decreased since 2011 as we paid our commercial debt, while our bank charges and credit card fees increased due to our increased business volume. Interest income increased in 2012 and 2013 as we accumulated cash generated by our March 2012 IPO and on-going cash flow and decreased in 2015 and 2014 given our reduced deposit balances, our increased capital expenditures and the 2014 and 2013 dividend payouts. In 2016 interest income increased as we accumulated more cash despite a $39.4 million share repurchase. However, the main reason for the year-over-year reduction in finance expenses between 2013 and 2014 was higher net income related to the impact of exchange rates on our derivatives and net monetary assets and liabilities re-valuation, given that unfavorable exchange rate fluctuations were higher in 2014 than in 2013. In 2015 and 2016, net gains related to exchange rate fluctuation were minimal.
Corporate taxes
As we operate in a number of countries, our income is subject to taxation in different jurisdictions with a range of tax rates. Our effective tax rate was 14.5% in 2016, 14.8% in 2015 and 14.6% in 2014.
The standard corporate tax rate for Israeli companies was 26.5% in 2014 and 2015 and decreased to 25% in 2016. Our non-Israeli subsidiaries are taxed according to the tax laws in their respective countries of organization.
Effective January 1, 2011, with the enactment of Amendment No. 68 to the Israeli Tax Law, both of our Israeli facilities operate under a consolidated “Preferred Enterprise” status. The “Preferred Enterprise” status provides the portion related to the Bar-Lev manufacturing facility with the potential to be eligible for grants of up to 20% of the investment value in approved assets and a reduced flat corporate tax rate, which applies to the industrial enterprise’s entire preferred income, of 9% in the three years of 2014 through 2016. For the portion related to the Sdot-Yam facility, this status provides us with a reduced flat corporate tax rate, which applies to the industrial enterprise’s entire preferred income, which was 16% during the same period.
For more information about the tax benefits available to us as an Approved Enterprise or as a Beneficiary Enterprise or as Preferred Enterprise, see “ITEM 10.E: Additional Information—Taxation—Israeli tax considerations and government programs.”
Net income attributable to non-controlling interest
In October 2010, we closed a transaction for the establishment of a joint venture with our former third-party distributor in Eastern Canada, Canadian Quartz Holdings Inc. (“
Ciot
”). Ciot acquired a 45% ownership interest in the new subsidiary, Caesarstone Canada Inc., and 45% of Caesarstone Canada Inc.’s net income is attributed to Ciot.
Other factors impacting our results of operations
Payment of compensation and grant of options upon the pricing of the IPO
Following our IPO in March 2012, we granted certain of our key employees, including our executive officers, options to purchase 1,505,200 ordinary shares with an exercise price equal to the IPO price per share of $11.00 and additional options to purchase 40,000 ordinary shares with an exercise price of $15.84. During 2015 we granted options to purchase 360,000 of our ordinary shares to our former CEO vesting through December 31, 2018 and with an exercise price of $41.37, and options to purchase 424,000 of our ordinary shares to certain other employees vesting through April 1, 2020 and with an average exercise price of $34.99. In addition, during 2015 we granted also 55,100 RSUSs to certain other employees with a weighted average fair value of $35.04 and vesting through April 1, 2020. In 2016, we granted certain of our key employees and executive officers options to purchase 38,000 of our ordinary shares at a weighted average exercise price of $36.08 per share. In addition, during 2016 we granted our key employees and executive officers 3,200 RSUs at a weighted average fair value of $36.70 per share. We recorded share-based compensation expenses related to the above grants of $3.5 million in 2016, $2.6 million in 2015 and $1.2 million in 2014, and expect to record $4.2 million over a weighted average period of 1.2 years.
50
Agreements with Kibbutz Sdot-Yam
We are party to a series of agreements with our largest shareholder, Kibbutz Sdot-Yam, which govern different aspects of our relationship. Pursuant to these agreements, in consideration for using facilities leased to us or for services provided by Kibbutz Sdot-Yam, we paid to the Kibbutz an aggregate of $9.7 million in 2016, $11.1 million in 2015 and $12.2 million in 2014 (excluding VAT). The decrease in the amount paid in 2016 compared to 2015 is mainly as a result of certain services previously received from the Kibbutz and in 2016 received from other third parties. Interest expense related to an agreement related to our use of the facilities of the Bar-Lev Industrial Center.
For more information on these agreements, see “ITEM 7.B: Major Shareholders and Related Party Transactions—Related Party Transactions.”
Comparison of period-to-period results of operations
The following table sets forth our results of operations as a percentage of revenues for the periods indicated:
|
Year ended December 31,
|
||||||||||||||||||||||||
|
2016
|
2015
|
2014
|
||||||||||||||||||||||
|
Amount
|
% of Revenue
|
Amount
|
% of Revenue
|
Amount
|
% of Revenue
|
|||||||||||||||||||
|
(in thousands of U.S. dollars)
|
||||||||||||||||||||||||
|
Consolidated Income Statement Data:
|
||||||||||||||||||||||||
|
Revenues:
|
$
|
538,543
|
100.0
|
%
|
$
|
499,515
|
100.0
|
%
|
$
|
447,402
|
100.0
|
%
|
||||||||||||
|
Cost of revenues
|
326,057
|
60.5
|
299,290
|
59.9
|
257,751
|
57.6
|
||||||||||||||||||
|
Gross profit
|
212,486
|
39.5
|
200,225
|
40.1
|
189,651
|
42.4
|
||||||||||||||||||
|
Operating expenses:
|
||||||||||||||||||||||||
|
Research and development, net
|
3,290
|
0.6
|
3,052
|
0.6
|
2,628
|
0.6
|
||||||||||||||||||
|
Marketing and selling
|
70,343
|
13.1
|
59,521
|
11.9
|
55,870
|
12.5
|
||||||||||||||||||
|
General and administrative
|
40,181
|
7.5
|
36,612
|
7.4
|
36,111
|
8.1
|
||||||||||||||||||
|
Legal settlements and loss contingencies, net
|
5,868
|
1.1
|
4,654
|
0.9
|
—
|
—
|
||||||||||||||||||
|
Total operating expenses
|
119,682
|
22.2
|
103,839
|
20.8
|
94,609
|
21.2
|
||||||||||||||||||
|
Operating income
|
92,804
|
17.3
|
96,386
|
19.3
|
95,042
|
21.2
|
||||||||||||||||||
|
Finance expenses, net
|
3,318
|
0.6
|
3,085
|
0.6
|
1,045
|
0.2
|
||||||||||||||||||
|
Income before taxes on income
|
89,486
|
16.7
|
93,301
|
18.7
|
93,997
|
21.0
|
||||||||||||||||||
|
Taxes on income
|
13,003
|
2.4
|
13,843
|
2.8
|
13,738
|
3.1
|
||||||||||||||||||
|
Net income
|
$
|
76,483
|
14.3
|
%
|
$
|
79,458
|
15.9
|
%
|
$
|
80,259
|
17.9
|
%
|
||||||||||||
|
Net income attributable to non-controlling interest
|
1,887
|
|
0.4
|
1,692
|
|
0.3
|
1,820
|
0.4
|
||||||||||||||||
|
Net income attributable to controlling interest
|
$
|
74,596
|
13.9
|
%
|
$
|
77,766
|
15.6
|
%
|
$
|
78,439
|
17.5
|
%
|
||||||||||||
Year ended December 31, 2016 compared to year ended December 31, 2015
Revenues
Revenues increased by $39.0 million, or 7.8%, to $538.5 million in 2016 from $499.5 million in 2015. The increase in revenues resulted mainly from a 7.3% increase in volume of sales contributing approximately $34 million to revenues. Increased average selling prices related to a higher portion of differentiated products contributed approximately $6 million to revenues. These factors were partially offset by unfavorable exchange rates, primarily related to the weakening of the Canadian and the Australian dollar against the U.S. dollar. On a constant currency basis, revenues grew by $41.7 million in 2016, representing 8.4% growth compared to 2015. The growth was primarily driven by double-digit growth in Canada and Australia, which grew on a constant currency basis by 25.4% and 19.0% respectively. Growth in Canada and Australia was primarily driven by continued quartz penetration and improved product offerings and was achieved despite weakening housing environment. The growth rate in Canada also benefited from the ramp-up of the IKEA business in the first six months of 2016. In the United States, our revenue dropped 0.3% compared to 2015. This reduction was a result of a single digit core growth along with revenue drop from IKEA business.
51
Cost of revenues and gross profit margins
Cost of revenues increased by $26.8 million, or 8.9%, to $326.1 million in 2016 from $299.3 million in 2015, primarily due to increased sales volumes and higher spending in our new manufacturing facility in Richmond-Hill.
Gross profit increased from $200.2 million in 2015 to $212.5 million in 2016, with a decrease in gross margin of 60 basis points. The margin decrease was driven primarily by inefficiencies related to our production in Richmond-Hill plant which impacted gross margin by approximately 260 basis points. Further, negative exchange rates fluctuations and higher revenue component from fabrication and installation, which generate lower margin, reduced gross margin by 30 basis points each. These factors were partially offset by lower raw material costs, mainly polyester, which increased gross margin by approximately 150 basis points. Increased efficiencies in our production in Israel and the higher portion of differentiated product increased approximately 50 basis points each.
Operating expenses
Research and development, net.
Research and development expenses increased by $0.2 million, or 7.7%, to $3.3 million in 2016 from $3.1 million in 2015. The increase was mainly driven by accelerated development activities.
Marketing and selling.
Marketing and selling expenses increased by $10.8 million, or 18.2%, to $70.3 million in 2016 from $59.5 million in 2015. This increase resulted primarily from our increased marketing and selling activities in the U.S., where we added approximately 20% to our workforce and engaged in intensive marketing activities to resume our growth in this region.
General and administrative.
General and administrative expenses increased by $3.6 million, or 9.7%, to $40.2 million in 2016 from $36.6 million in 2015. This increase was driven primarily by the appointment of a new executive management team in the U.S. and an increase in our legal expenses.
Legal settlements and loss contingencies, net.
Legal settlements and loss contingencies expenses were $5.9 million in 2016, related to silicosis claims. This compared with $4.7 million in 2015, when we initially provided for silicosis claims.
Finance expenses, net
Finance expenses, net increased by $0.2 million, or 7.6%, to $3.3 million in 2016 from $3.1 million in 2015. Most of the increase resulted from increased credit card and bank fees associated with our increased activities and the additional interest expenses related to our increased credit line utilization by Caeserstone Canada Inc.. Finance income related to interest gains on deposits increased by approximately $0.1 million as our cash balances increased.
Taxes on income
Taxes on income decreased by $0.8 million to $13.0 million in 2016 from $13.8 million in 2015. Our effective tax rate was 14.5% in 2016 compared with 14.8% in 2015. Higher taxable income outside of Israel, where tax rates are higher, was offset by a favorable tax audit settlement with the Israeli tax authority related to 2012 through 2014.
Net income attributable to non-controlling interest
Net income attributable to non-controlling interest increased by $0.2 million from $1.7 million in 2015 to $1.9 million in 2016. This increase was due to higher income generated by Caesarstone Canada Inc. in 2016 compared to 2015 given its revenue growth.
52
Year ended December 31, 2015 compared to year ended December 31, 2014
Revenues
Revenues increased by $52.1 million, or 11.6%, to $499.5 million in 2015 from $447.4 million in 2014. The increase in revenues resulted from an approximate 15% increase in volume of sales, which contributed approximately $65 million to revenues, most notably in Canada, the United States and Europe. Higher average selling prices and growth in the business from IKEA, mainly in Canada added approximately $7 million to revenues. Higher average selling prices were attributable to the introduction of new differentiated products, including the new Calacatta and Statuario designs, increased portion of the Supernatural collection, and selective regional price increases related to exchange rates trends. These factors were partially offset by unfavorable exchange rates which lowered revenues by approximately $47 million, primarily related to the weakening of the Australian and the Canadian dollar against the U.S. dollar. On a constant currency basis, revenues grew by $99.0 million in 2015, representing 22.1% growth compared to 2014. Our revenues on a constant currency basis showed double-digit growth in all regions except Israel, our most mature market, which grew 5.3%. The growth was primarily driven by continued demand in the United States, the Company's largest market, which grew by 20.3%. Canada and Australia delivered the highest growth rates on a constant currency basis, growing 41.2% and 24.0%. Growth in Canada was primarily driven by our collaboration with IKEA, continued quartz penetration and improved product offerings. Growth in Australia leveraged continued quartz penetration, improved product offering, price increases to partially offset erosion of the Australian dollar, and a positive-trending housing market.
Cost of revenues and gross profit margins
Cost of revenues increased by $41.5 million, or 16.1%, to $299.3 million in 2015 from $257.8 million in 2014, primarily due to increased sales volumes. Other notable drivers were start-up costs associated with the new manufacturing facility in Richmond-Hill and, to a lesser extent, the IKEA installation and fabrication component. Also contributing to the increased cost of revenues were the elevated production levels of our differentiated Supernatural collection, which, despite incurring a premium in price from consumers and higher margins, carries higher manufacturing costs. The increased cost of revenues was partially offset by the weakening of all currencies against the U.S. dollar and the reduced cost of polyester.
Gross profit increased from $189.7 million in 2014 to $200.2 million in 2015, with gross margin decreasing by 230 basis points in 2015. The margin decrease was driven primarily by start-up costs and inefficiencies related to the ramp-up of our production lines in the U.S. manufacturing facility, which eroded gross margin by approximately 350 basis points and a negative exchange rate impact, which lowered margin by approximately 200 basis points. These factors were partially offset by higher average selling prices related to differentiated product mix, which raised gross margin by approximately 200 basis points and reduced raw material costs benefiting gross margin by approximately 150 basis points.
Operating expenses
Research and development, net.
Research and development expenses increased by $0.4 million, or 16.1%, to $3.1 million in 2015 from $2.6 million in 2014. The increase was mainly driven by accelerated development activities.
Marketing and selling.
Marketing and selling expenses increased by $3.7 million, or 6.5%, to $59.5 million in 2015 from $55.9 million in 2014. This increase resulted primarily from a $4.1 million increase in advertising and promotional activities in 2015, most notably in the United States, offset by approximately $0.7 million lower expenses of our marketing and selling activities in Australia and Canada related to exchange rates erosion of the Australian and Canadian dollar.
General and administrative.
General and administrative expenses increased by $0.5 million, or 1.4%, to $36.6 million in 2015 from $36.1 million in 2014. This increase was driven primarily by general and administrative costs related to our new U.S. manufacturing facility and to new share-based compensation programs commenced during 2015. These increases were partially offset by a decrease in expenses by our subsidiaries, mainly due to exchange rates fluctuations.
Legal settlements and loss contingencies, net.
Legal settlements and loss contingencies, recorded initially in 2015, amounted to an expense of $4.7 million. This amount comprised of settlements and estimated exposure related to our individual silicosis claims, partially offset by insurance receivables in connection with the same claims.
Finance expenses, net
Finance expenses, net increased by $2.0 million, or 195.2%, to $3.1 million in 2015 from $1.0 million in 2014. This increase was mostly related to the increase of our business volume and lower interest income.
53
Taxes on income
Taxes on income increased by $0.1 million to $13.8 million in 2015 from $13.7 million in 2014. The effective tax rate increased slightly from 14.6% of income before taxes in 2014 to 14.8% in 2015 reflecting a higher portion of the North American business offset by a lower effective tax rate in Israel due to income allocation between production facilities. The commencement of production in the U.S. did not have an impact on the effective tax rates in 2015 given its low utilization during 2015.
Net income attributable to non-controlling interest
Net income attributable to non-controlling interest decreased by $0.1 million from $1.8 million in 2014 to $1.7 million in 2015. This decrease was due to a 13.4% weakening of the Canadian dollar relative to the U.S. dollar on an annual average basis, which eroded the income generated by Caesarstone Canada Inc. in 2015 compared to 2014 despite its revenue growth.
Quarterly results of operations and seasonality
The following table presents our unaudited condensed consolidated quarterly results of operations for the eight quarters in the period from January 1, 2015 to December 31, 2016. We also present reconciliations of net income to adjusted EBITDA and net income attributable to controlling interest to adjusted net income attributable to controlling interest for the same periods. This information should be read in conjunction with our consolidated financial statements and related notes included elsewhere in this annual report. For more information on our use of non-GAAP financial measures, see “ITEM 3.A. Key Information—Selected Financial Data.” We have prepared the unaudited condensed consolidated quarterly financial information for the quarters presented below on the same basis as our audited consolidated financial statements. The historical quarterly results presented below are not necessarily indicative of the results that may be expected for any future quarters or periods.
|
Three months ended
|
||||||||||||||||||||||||||||||||
|
Dec. 31, 2016
|
Sept. 30, 2016
|
June 30, 2016
|
Mar. 31, 2016
|
Dec. 31, 2015
|
Sept. 30, 2015
|
June 30, 2015
|
Mar. 31, 2015
|
|||||||||||||||||||||||||
|
(in thousands)
|
||||||||||||||||||||||||||||||||
|
Consolidated Income Statement Data:
|
||||||||||||||||||||||||||||||||
|
Revenues:
|
$
|
134,975
|
$
|
144,306
|
$
|
142,348
|
$
|
116,914
|
$
|
127,361
|
$
|
136,816
|
$
|
127,527
|
$
|
107,811
|
||||||||||||||||
|
Revenues as a percentage of annual revenue
|
25.1
|
%
|
26.8
|
%
|
26.4
|
%
|
21.7
|
%
|
25.5
|
%
|
27.4
|
%
|
25.5
|
%
|
21.6
|
%
|
||||||||||||||||
|
Gross profit
|
$
|
51,433
|
$
|
58,461
|
$
|
59,974
|
$
|
42,618
|
$
|
48,218
|
$
|
54,087
|
$
|
52,606
|
$
|
45,314
|
||||||||||||||||
|
Operating income
|
19,108
|
28,175
|
31,286
|
14,235
|
22,643
|
24,718
|
28,280
|
20,745
|
||||||||||||||||||||||||
|
Net income
|
15,316
|
22,773
|
26,284
|
12,110
|
19,392
|
20,419
|
23,265
|
16,382
|
||||||||||||||||||||||||
|
Other financial data:
|
||||||||||||||||||||||||||||||||
|
Adjusted EBITDA
|
$
|
29,969
|
$
|
37,521
|
$
|
39,767
|
$
|
23,003
|
$
|
30,432
|
$
|
36,212
|
$
|
33,511
|
$
|
25,514
|
||||||||||||||||
|
Adjusted EBITDA as a percentage of annual adjusted EBITDA
|
23.0
|
%
|
28.8
|
%
|
30.5
|
%
|
17.7
|
%
|
24.2
|
%
|
28.8
|
%
|
26.7
|
%
|
20.3
|
%
|
||||||||||||||||
|
Adjusted net income attributable to controlling interest
|
$
|
18,147
|
$
|
24,255
|
$
|
25,448
|
$
|
13,334
|
$
|
19,687
|
$
|
24,404
|
$
|
23,154
|
$
|
16,437
|
||||||||||||||||
|
Adjusted net income attributable to controlling interest as a percentage of annual adjusted net income
|
22.4
|
%
|
29.9
|
%
|
31.3
|
%
|
16.4
|
%
|
23.5
|
%
|
29.2
|
%
|
27.7
|
%
|
19.6
|
%
|
||||||||||||||||
54
|
Three months ended
|
||||||||||||||||||||||||||||||||
|
Dec. 31, 2016
|
Sept. 30, 2016
|
June 30, 2016
|
Mar. 31, 2016
|
Dec. 31, 2015
|
Sept. 30, 2015
|
June 30, 2015
|
Mar. 31, 2015
|
|||||||||||||||||||||||||
|
(in thousands of U.S. dollars)
|
||||||||||||||||||||||||||||||||
|
Reconciliation of Net Income to Adjusted EBITDA:
|
||||||||||||||||||||||||||||||||
|
Net income
|
$
|
15,316
|
$
|
22,773
|
$
|
26,284
|
$
|
12,110
|
$
|
19,392
|
$
|
20,419
|
$
|
23,265
|
$
|
16,382
|
||||||||||||||||
|
Finance expenses (income), net
|
1,001
|
1,120
|
1,442
|
(245
|
)
|
688
|
106
|
399
|
1,892
|
|||||||||||||||||||||||
|
Taxes on income
|
2,790
|
4,282
|
3,560
|
2,370
|
2,563
|
4,193
|
4,616
|
2,471
|
||||||||||||||||||||||||
|
Depreciation and amortization
|
7,211
|
7,074
|
7,064
|
6,905
|
6,706
|
6,030
|
4,917
|
4,681
|
||||||||||||||||||||||||
|
Legal settlements and loss contingencies (a)
|
3,115
|
1,020
|
1,000
|
733
|
(65
|
)
|
4,719
|
—
|
—
|
|||||||||||||||||||||||
|
Compensation paid by a shareholder (b)
|
—
|
266
|
—
|
—
|
—
|
—
|
—
|
—
|
||||||||||||||||||||||||
|
Share-based compensation
expense (c)
|
535
|
986
|
417
|
1,130
|
1,146
|
745
|
314
|
88
|
||||||||||||||||||||||||
|
Adjusted EBITDA
|
$
|
29,969
|
$
|
37,521
|
$
|
39,767
|
$
|
23,003
|
$
|
30,430
|
$
|
36,212
|
$
|
33,511
|
$
|
25,514
|
||||||||||||||||
|
Three months ended
|
||||||||||||||||||||||||||||||||
|
Dec. 31, 2016
|
Sept. 30, 2016
|
June 30, 2016
|
Mar. 31, 2016
|
Dec. 31, 2015
|
Sept. 30, 2015
|
June 30, 2015
|
Mar. 31, 2015
|
|||||||||||||||||||||||||
|
(as a % of revenue)
|
||||||||||||||||||||||||||||||||
|
Consolidated Income Statement Data:
|
||||||||||||||||||||||||||||||||
|
Revenues:
|
100.0
|
%
|
100.0
|
%
|
100.0
|
%
|
100.0
|
%
|
100.0
|
%
|
100.0
|
%
|
100.0
|
%
|
100.0
|
%
|
||||||||||||||||
|
Gross profit
|
38.1
|
40.5
|
42.1
|
36.5
|
37.9
|
39.5
|
41.3
|
42.0
|
||||||||||||||||||||||||
|
Operating income
|
14.2
|
19.5
|
22.0
|
12.2
|
17.8
|
18.1
|
22.2
|
19.2
|
||||||||||||||||||||||||
|
Net income
|
11.3
|
15.8
|
18.5
|
10.4
|
15.2
|
14.9
|
18.2
|
15.2
|
||||||||||||||||||||||||
| (a) |
Consists of legal settlements expenses and loss contingencies, net, related to silicosis claims.
|
| (b) |
Consists of a one-time bonus paid by a shareholder to Company's employees in Israel, other than officers.
|
| (c) |
Share-based compensation includes expenses related to stock options and restricted stock units granted to employees of the Company. In addition, it includes expenses for phantom awards granted and related payroll expenses as a result of exercises.
|
|
Three months ended
|
||||||||||||||||||||||||||||||||
|
Dec. 31, 2016
|
Sept. 30, 2016
|
June 30, 2016
|
Mar. 31, 2016
|
Dec. 31, 2015
|
Sept. 30, 2015
|
June 30, 2015
|
Mar. 31, 2015
|
|||||||||||||||||||||||||
|
(in thousands of U.S. dollars)
|
||||||||||||||||||||||||||||||||
|
Reconciliation of Net Income Attributable to Controlling Interest to Adjusted Net Income Attributable to Controlling Interest:
|
||||||||||||||||||||||||||||||||
|
Net income attributable to controlling interest
|
$
|
15,068
|
$
|
22,343
|
$
|
25,409
|
$
|
11,776
|
$
|
18,710
|
$
|
19,806
|
$
|
22,889
|
$
|
16,361
|
||||||||||||||||
|
Legal settlements and loss contingencies (a)
|
3,115
|
1,020
|
1,000
|
733
|
(65
|
)
|
4,719
|
|||||||||||||||||||||||||
|
Compensation paid by a shareholder (b)
|
—
|
266
|
—
|
—
|
—
|
—
|
—
|
—
|
||||||||||||||||||||||||
|
Share-based compensation expense(c)
|
535
|
986
|
417
|
1,130
|
1,146
|
745
|
314
|
88
|
||||||||||||||||||||||||
|
Tax adjustments (d)
|
—
|
—
|
(1,158
|
)
|
—
|
—
|
—
|
—
|
—
|
|||||||||||||||||||||||
|
Total adjustments before tax
|
3,650
|
2,272
|
259
|
1,863
|
1,081
|
5,464
|
314
|
88
|
||||||||||||||||||||||||
|
Less tax on above adjustments
|
571
|
360
|
220
|
305
|
103
|
866
|
49
|
12
|
||||||||||||||||||||||||
|
Total adjustments after tax
|
3,079
|
1,912
|
39
|
1,558
|
979
|
4,598
|
265
|
76
|
||||||||||||||||||||||||
|
Adjusted net income attributable to controlling interest
|
18,147
|
24,255
|
25,448
|
13,334
|
19,687
|
24,404
|
23,154
|
16,437
|
||||||||||||||||||||||||
|
Adjusted diluted EPS
|
$
|
0.53
|
$
|
0.70
|
$
|
0.73
|
$
|
0.38
|
$
|
0.55
|
$
|
0.69
|
$
|
0.65
|
$
|
0.46
|
||||||||||||||||
| (a) |
Consists of legal settlements expenses and loss contingencies, net, related to silicosis claims.
|
| (b) |
Consists of a one-time bonus paid by a shareholder to Company's employees in Israel, other than officers.
|
| (c) |
Share-based compensation includes expenses related to stock options and restricted stock units granted to employees of the Company. In addition, it includes expenses for phantom awards granted and related payroll expenses as a result of exercises.
|
| (d) |
Tax adjusment as a result of tax settlement with the Israeli tax authorities.
|
Our results of operations are impacted by seasonal factors, including construction and renovation cycles. We believe that the third quarter of the year exhibits higher sales volumes than other quarters because demand for quartz surface products is generally higher during the summer months in the northern hemisphere, when the weather is more favorable for new construction and renovation projects, as well as the impact of efforts to complete such projects before the beginning of the new school year. Conversely, the first quarter is impacted by a slowdown in new construction and renovation projects during the winter months as a result of adverse weather conditions in the northern hemisphere and, depending on the date of the spring holiday in Israel in a particular year, the first or second quarter is impacted by a reduction in sales in Israel due to such holiday. Similarly, sales in Australia during the first quarter are negatively impacted due to fewer construction and renovation projects.
55
We expect that seasonal factors will have a greater impact on our revenue, adjusted EBITDA and adjusted net income attributable to controlling interest in the future as we continue to increase direct distribution as a percentage of our total revenues in the future. This is because we generate higher average selling prices in the markets in which we have direct distribution channels and, therefore, our revenues are more greatly impacted by changes in demand in these markets. At the same time, our fixed costs have also increased as a result of our larger portion of direct distribution and, therefore, the impact of seasonal fluctuations on our revenues on our profit margins, adjusted EBITDA and adjusted net income will likely be magnified in future periods.
In 2016, sales volume increased by 14.5% from the first quarter to the second quarter and by 2.6% from the second quarter to the third quarter. 2016 fourth quarter volume was 8.3% below that of the third quarter. In 2015, sales volume increased by 13.7% from the first quarter to the second quarter and by 9.4% from the second quarter to the third quarter. 2015 fourth quarter volume was 4.6% below that of the third quarter.
Application of critical accounting policies and estimates
Our accounting policies affecting our financial condition and results of operations are more fully described in our consolidated financial statements for the years ended December 31, 2016, 2015 and 2014, included in this annual report. The preparation of our financial statements requires management to make judgments, estimates and assumptions that affect the amounts reflected in the consolidated financial statements and accompanying notes, and related disclosure of contingent assets and liabilities. We base our estimates upon various factors, including past experience, where applicable, external sources and on other assumptions that we believe are reasonable under the circumstances, the results of which form the basis for making judgments about the carrying values of assets and liabilities that are not readily apparent from other sources. Actual results may differ from these estimates under different assumptions or conditions, and could have a materially adverse effect on our reported results.
In many cases, the accounting treatment of a particular transaction, event or activity is specifically dictated by accounting principles and does not require management’s judgment in its application, while in other cases, management’s judgment is required in the selection of the most appropriate alternative among the available accounting principles, that allow different accounting treatment for similar transactions.
We believe that the accounting policies discussed below are critical to our financial results and to the understanding of our past and future performance as these policies relate to the more significant areas involving management’s estimates and assumptions. We consider an accounting estimate to be critical if: (1) it requires us to make assumptions because information was not available at the time or it included matters that were highly uncertain at the time we were making our estimate; and (2) changes in the estimate or different estimates that we could have selected may have had a material impact on our financial condition or results of operations.
Revenue recognition
We derive our revenues from sales of quartz surfaces mostly through a combination of direct sales in certain markets and indirectly through a network of distributors in other markets.
Revenues are recognized in accordance with ASC 605, "Revenue Recognition" (ASC 605) when delivery has occurred, persuasive evidence of an agreement exists, the fee is fixed and determinable, collectability is probable and no further obligations exist.
Our products that are sold through agreements with exclusive distributors are non-exchangeable, non-refundable, non-returnable and without any rights of price protection or stock rotation. Accordingly, we consider all the distributors to be end-consumers.
For certain revenue transactions with a specific customer, we are responsible also for the fabrication and installation of its products. We recognize such revenues upon receipt of acceptance evidence from the end consumer which occurs upon completion of the installation.
Although, in general, we do not grant rights of return, there are certain instances where such rights are granted. We maintain a provision for returns in accordance with ASC 605, which is estimated, based primarily on historical experience as well as management judgment, and is recorded through a reduction of revenue.
56
Allowance for doubtful accounts
Our trade receivables are derived from sales to customers located mainly in the United States, Australia, Canada, Israel and Europe. We perform ongoing credit evaluations of our customers and to date have not experienced any material losses. In certain circumstances, we may require letters of credit or prepayments. We maintain an allowance for doubtful accounts for estimated losses from the inability of our customers to make required payments that we have determined to be doubtful of collection. We determine the adequacy of this allowance by regularly reviewing our accounts receivable and evaluating individual customers’ receivables, considering customers’ financial condition, credit history and other current economic conditions. If a customer’s financial condition were to deteriorate which might impact its ability to make payment, then additional allowances may be required. Provisions for doubtful accounts are recorded in general and administrative expenses. Our allowance for doubtful accounts was $1.3 million, $1.2 million and $2.2 million as of December 31, 2016, 2015 and 2014, respectively.
Inventory valuation
The majority of our inventory consists of finished goods and of raw materials. Inventories are valued at the lower of cost or market, with cost of finished goods determined on the basis of direct manufacturing costs plus allocable indirect costs representing allocable operating overhead expenses and manufacturing costs and cost of raw materials determined using the “standard cost” method which approximates actual cost on a weighted average basis. We assess the valuation of our inventory on a quarterly basis and periodically write down the value for different finished goods and raw material categories based on their quality classes and aging. If we consider specific inventory to be obsolete, we write such inventory down to zero. Inventory provisions are provided to cover risks arising from slow-moving items, discontinued products, excess inventories and market prices lower than cost. The process for evaluating these write-offs often requires us to make subjective judgments and estimates concerning prices at which such inventory will be able to be sold in the normal course of business. Accelerating the disposal process or incorrect estimates of future sales potential may cause actual results to differ from the estimates at the time such inventory is disposed of or sold. Inventory provision was $10.2 million, $9.0 million and$7.7 million as of December 31, 2016, 2015 and 2014, respectively.
Goodwill and other long-lived assets
The purchase price of an acquired business is allocated between intangible assets and the net tangible assets of the acquired business with the residual of the purchase price recorded as goodwill. The determination of the value of the intangible assets acquired involves certain judgments and estimates. These judgments can include, but are not limited to, the cash flows that an asset is expected to generate in the future and the appropriate weighted average cost of capital.
At December 31, 2016, our goodwill totaled $35.7 million and our identifiable intangible assets, net totaled $4.5 million.
We assess the impairment of goodwill of our reporting unit annually
during the fourth quarter of each fiscal year
, or more often if events or changes in circumstances indicate that the carrying value may not be recoverable. Goodwill is tested for impairment at the reporting unit level by first performing a qualitative assessment to determine whether it is more likely than not that, the fair value of the reporting unit is less than its carrying value. If the reporting unit does not pass the qualitative assessment, then the reporting unit's carrying value is compared to its fair value.
We have only one reporting unit because all our components have similar economic characteristic, and we determine its fair value based on our market capitalization.
As of December 31, 2016, 2015 and 2014, no impairment losses had been identified.
We also evaluate the carrying value of all long-lived assets, such as property and equipment and intangibles, for impairment whenever events or changes in circumstances indicate that the carrying value of an asset may not be recoverable. We will record an impairment loss when the carrying value of the underlying asset group exceeds its estimated fair value. In determining whether long-lived assets are recoverable, our estimate of undiscounted future cash flows over the estimated life of an asset is based upon our experience, historical operations of the asset, an estimate of future asset profitability and economic conditions. The future estimates of asset profitability and economic conditions require estimating such factors as sales growth, inflation and the overall economics of the countertop industry. Our estimates are subject to variability as future results can be difficult to predict. If a long-lived asset is found to be non-recoverable, we record an impairment charge equal to the difference between the asset’s carrying value and fair value. As of December 31, 2016, 2015 and 2014, no impairment losses had been identified.
57
Fair value measurements
The performance of fair value measurements is an integral part of the preparation of financial statements in accordance with generally accepted accounting principles. Fair value is defined as the price that would be received to sell the asset or paid to transfer the liability in an orderly transaction between market participants to sell or transfer such an asset or liability. Selection of the appropriate valuation techniques, as well as determination of assumptions, risks and estimates used by market participants in pricing the asset or liability requires significant judgment. Although we believe that the inputs used in our evaluation techniques are reasonable, a change in one or more of the inputs could result in an increase or decrease in the fair value for example, of certain assets and certain liabilities and could have an impact on both our consolidated balance sheets and consolidated statements of income.
Accounting for contingencies
We are involved in various product liability, commercial, environmental claims and other legal proceedings that arise from time to time in the course of business. We record accruals for these types of contingencies to the extent that we conclude their occurrence is probable and that the related liabilities are estimable. When accruing these costs, we will recognize an accrual in the amount within a range of loss that is the best estimate within the range. When no amount within the range is a better estimate than any other amount, we accrue for the minimum amount within the range. We record anticipated recoveries under the applicable insurance policies, in the amounts that are covered and we believe their collectability is probable. Legal costs are expensed as incurred.
For unasserted claims or assessments, we followed the accounting guidance in ASC 450-20-50-6, 450-20-25-2 and 450-20-55-2 in which we must first determine that the probability that an assertion will be made is likely, then, a determination as to the likelihood of an unfavorable outcome and the ability to reasonably estimate the potential loss is made.
We review the adequacy of the accruals on a periodic basis and may determine to alter our reserves at any time in the future if we believe it would be appropriate to do so. As such, accruals are based on management’s judgment as to the probability of losses and, where applicable, accruals may materially differ from settlements or other agreements made with regards to such contingencies.
See Note 10 to our financial statements included elsewhere in this annual report and “ITEM 8.A: Financial Information—Consolidated Financial Statements and Other Financial Information—Legal Proceedings” for further information regarding legal matters.
Income taxes
We account for income taxes in accordance with ASC 740, “Income Taxes”, which requires that deferred tax assets and liabilities be recognized using enacted tax rates for the effect of temporary differences between the financial reporting and tax basis of recorded assets and liabilities. ASC 740 also requires that deferred tax assets be reduced by a valuation allowance if it is more likely than not that some portion or all of the deferred tax asset will not be realized. We have recorded a valuation allowance to reduce our subsidiaries’ deferred tax assets to the amount that we believe is more likely than not to be realized. Our assumptions regarding future realization may change due to future operating performance and other factors.
ASC 740 requires that companies recognize in their consolidated financial statements the impact of a tax position if that position is not more likely than not of being sustained on audit based on the technical merits of the position. ASC 740 also provides guidance on de-recognition, classification, interest and penalties, accounting in interim periods and disclosure. We accrue interest and penalties related to unrecognized tax benefits in our tax expenses.
We establish reserves for tax-related uncertainties based on estimates of whether, and the extent to which, additional taxes will be due. These reserves are established when we believe that certain positions might be challenged despite our belief that our tax return positions are in accordance with applicable tax laws. As part of the determination of our tax liability, management exercises considerable judgment in evaluating tax positions taken by us in determining the income tax provision and establishes reserves for tax contingencies in accordance with ASC 740 guidelines. We adjust these reserves in light of changing facts and circumstances, such as the closing of a tax audit, new tax legislation, or the change of an estimate based on new information. To the extent that the final tax outcome of these matters is different from the amounts recorded, such differences will affect the provision for income taxes in the period in which such determination is made. The provision for income taxes includes the effect of reserve provisions and changes to reserves that are considered appropriate, as well as the related net interest and penalties.
58
We file income tax returns in Australia, Canada, Israel, Singapore and the United States. The Israeli tax authorities audited our income tax returns for the fiscal years leading up to and including 2014. We are currently being examined by the IRS in the United States for income tax return filed for the fiscal year 2015 and may be further subject to examination for any subsequent years. Management’s judgment is required in determining our provision for income taxes in each of the jurisdictions in which we operate. The provision for income tax is calculated based on our assumptions as to our entitlement to various benefits under the applicable tax laws in the jurisdictions in which we operate. The entitlement to such benefits depends upon our compliance with the terms and conditions set out in these laws. Although we believe that our estimates are reasonable and that we have considered future taxable income and ongoing prudent and feasible tax strategies in estimating our tax outcome, there is no assurance that the final tax outcome will not be different than those which are reflected in our historical income tax provisions and accruals. Such differences could have a material effect on our income tax provision, net income and cash balances in the period in which such determination is made.
Share-based compensation
We measure and recognize stock-based compensation expense based on the fair value measurement for all share-based payment awards made to our employees, including employee stock options and restricted stock awards (RSUs), over the service period for awards expected to vest.
Stock-based compensation expense associated with employee stock options in 2016, 2015, and 2014 was $3.5 million, $2.8 million and $1.2 million, respectively.
Under ASC 718, we estimate the value of employee stock options as of date of grant using a Black & Scholes-based option valuation model. The determination of fair value of stock option awards on the date of grant is affected by several factors including our stock price, our stock price volatility, the risk-free interest rate, expected dividends and employee stock option exercise behaviors. If such factors change and we employ different assumptions for future grants, our compensation expense may differ significantly from the amounts that we have recorded in the past. In addition, our compensation expense is affected by our estimate of the number of awards that will ultimately vest. The RSUs are measured at the grant date based on the market value of our common stock. See Note 2u to the financial statements included elsewhere in this report.
Phantom share-based payment
We have made share-based awards in the past that are considered liability awards and have required the measurement and recognition of compensation expense based on estimates of fair values in accordance with ASC 718. We determined the fair value of each award at the end of each fiscal quarter and recognized any change in value in our income statement. The determination of the fair value of these awards requires the use of subjective assumptions based on the binominal option pricing model.
During 2014, we granted several of our employees a right to a bonus payment based on an increase in our ordinary share value (“
phantom award
”) under which the employees are entitled to receive in cash or shares, in our discretion, the difference between exercise price, subject to adjustments for dividend distributions made until the actual payment of the bonus and the value of our ordinary shares with such bonus right vesting over a four-year period on an annual basis.
According to ASC 718-10, “instruments that are required to be cash-settled (such as cash-settled stock appreciation rights) or require cash settlement on the occurrence of a contingent event that is considered probable” should be treated as a liability. As such, in this case, the share-based compensation is accounted for as a liability award. According to ASC 718-10, in connection with the measurement of the liability settlement, the value of the award should be measured each reporting date until settlement. The fair value of the phantom award was calculated using the Binominal option pricing model which resulted in a decrease of $0.4 million in the related liability.
See Note 2u to the financial statements included elsewhere in this report.
59
Our primary capital requirements have been to fund production capacity expansions, as well as investments in and acquisitions of third-party distributors, such as our acquisition of the business of our former Australian distributor, our investment in and acquisition of Caesarstone USA, formerly known as U.S. Quartz Products, Inc and the construction of our new manufacturing facility in the United States. Our other capital requirements have been to fund our working capital needs, operating costs, meet required debt payments and to pay dividends on our capital stock.
Capital resources have primarily consisted of cash flows from operations, cash generated from the March 2012 IPO, proceeds from the land purchase agreement and leaseback in connection with our Bar-Lev facility and borrowings under our credit facilities. Our working capital requirements are affected by several factors, including demand for our products, raw material costs and shipping costs.
Our inventory strategy is to maintain sufficient inventory levels to meet anticipated customer demand for our products. Our inventory is significantly impacted by sales in the United States, Australia and Canada, our largest markets, due to the 40-60 days required to ship our products to these locations from Israel. We continue to focus on meeting market demand for our products while improving our inventory efficiency over the long term by implementing procedures to improve our production planning process.
We minimize working capital requirements through our distribution network that allows sales and marketing activities to be provided by third-party distributors. We believe that, based on our current business plan, our cash, cash equivalents and short term bank deposits on hand, cash from operations and borrowings available to us under our revolving credit line and short-term facilities, we will be able to meet our capital expenditure and working capital requirements, and liquidity needs for at least the next twelve months. We may require additional capital to meet our longer term liquidity and future growth requirements. Continued instability in the capital markets could adversely affect our ability to obtain additional capital to grow our business and would affect the cost and terms of such capital.
Cash flows
The following table presents the major components of net cash flows used in and provided by operating, investing and financing activities for the periods presented:
|
As of December 31,
|
||||||||||||
|
2016
|
2015
|
2014
|
||||||||||
|
(in thousands of U.S. dollars
)
|
||||||||||||
|
Net cash provided by operating activities
|
$
|
101,519
|
$
|
85,661
|
$
|
76,024
|
||||||
|
Net cash used in investing activities
|
(23,313
|
)
|
(65,736
|
)
|
(27,726
|
)
|
||||||
|
Net cash provided by (used in) financing activities
|
(35,616
|
)
|
2,149
|
(26,671
|
)
|
|||||||
Cash provided by operating activities
Operating activities consist primarily of net income adjusted for certain non-cash items. Adjustments to net income for non-cash items include depreciation and amortization, share-based compensation and deferred taxes. In addition, operating cash flows are impacted by changes in operating assets and liabilities, principally inventories, accounts receivable, prepaid expenses and other assets, accounts payable and accrued expenses.
Cash provided by operating activities increased by $15.9 million from $85.7 million in 2015 to $101.5 million in 2016, despite a decrease in net income by $3 million, mainly as a result of an inventory increase of $5.4 million during 2016 compared to $15.3 million in 2015 and a trade payable increase of $1.4 million during 2016 compared to a decrease of $8.7 million during 2015. Cash provided by operating activities increased by $9.6 million in 2015, from $76.0 million in 2014 despite a slight decrease of $0.8 million in net income, mainly as a result of an inventory increase of $15.3 million during 2015 compared to $22.3 million in 2014 and non- cash expenses in connection with our provision for settled claims and loss contingencies.
60
Cash used in investing activities
In 2016, 2015 and 2014, our capital expenditures in cash totaled $22.9 million, $76.5 million, and $86.4 million, respectively. Capital expenditures from 2015 and 2014 related primarily to our capacity expansion projects, with the majority invested in the new U.S. production facility and a much smaller portion in 2014 going toward the completion of the fifth production line at our Bar-Lev facility in Israel. Net cash used in investing activities for the years ended December 31, 2016, 2015 and 2014 were $23.3 million, $65.7 million, and $27.7 million, respectively. In 2016, our cash used in investing activities was $23.3 million, consisting principally of $22.9 million of capital expenditures. In 2015, our cash used in investing activities was $65.7 million, consisting principally of $76.5 million of capital expenditures offset by $10.7 million of bank deposits converted to cash. In 2014, our cash used in investing activities was $27.7 million, consisting principally of $86.4 million of capital expenditures offset by $58.0 million of bank deposits converted to cash.
The majority of our investment activities have historically been related to the purchase of manufacturing equipment and components for our production lines, as well as acquisitions of businesses, including our former Australian distributor and our Caesarstone USA acquisition. In order to support our overall business expansion, we will continue to invest in manufacturing equipment and components for our production lines. Moreover, we may spend additional amounts of cash on acquisitions from time to time, if and when such opportunities arise.
Cash provided by (used in) financing activities
Net cash used in financing activities for 2016 was $35.6 million, which included a $39.4 million purchase of treasure shares, $1.1 million of repayment of a financial leaseback arrangement related to our Bar-Lev facility and a dividend paid by our subsidiary, Caesarstone Canada Inc. in the amount of $0.2 million to CIOT offset by $5.1 million of bank credit increase. Net cash used in financing activities for 2015 was $2.1 million, which included a $3.2 million of bank credit increase offset by $1.1 million of repayment of a financing leaseback arrangement related to our Bar-Lev facility. Net cash used in financing activities for 2014 was $26.7 million, which included a $20.0 million dividend to our shareholders in December 2014, $5.5 million of net loan repayments and $1.2 million of repayment of a financing leaseback arrangement related to our Bar-Lev facility.
Credit facilities
As of December 31, 2016, we had debt from commercial banks in the total amount of $8.5 million. Our long-term debt consists only of financing the lease-back related to the Bar-Lev sale and lease-back transaction with the Kibbutz. We also received a loan on January 17, 2011, in the amount of CAD 4.0 million ($4.1 million) to Caesarstone Canada Inc. by its shareholders, Ciot and us, on a pro rata basis. The loan bears an interest rate until repayment at a per annum rate equal to the Bank of Canada’s prime business rate plus 0.25%, with the interest accrued on the loan paid on a quarterly basis. The loan balance as of December 31, 2016 was $1.3 million (reflects the portion of the loan received from Ciot), which was included in related party and other loan line item.
As of December 31, 2016, we had short-term credit lines with total availability of $12.1 million, consisting of $0.2 million from Israeli banks, none of which were utilized (not including bank guarantees issued in the amount of $1.1 million), and $11.9 million from Canadian banks, out of which $8.5 million were utilized. Our revolving credit lines from Israeli banks and Canadian banks are subject to annual renewal.
Our credit facilities and services provided by banks in Israel are secured with a “Negative floating pledge,” whereby we committed not to pledge or charge and not to undertake to pledge or charge our general floating assets.
Capital expenditures
Our capital expenditures have included the expansion of our manufacturing capacity and capabilities, and investment and improvements in our information technology systems. In 2016, 2015, and 2014, our capital expenditures were $22.9 million, $76.5 million, and $86.4 million, respectively. We anticipate that we will continue to invest in capacity expansions in the next few years. Our investments related to the new U.S. manufacturing facility with its first two production lines was approximately $135 million, substantially all of which was invested through December 31, 2015. Both lines became operational during 2015. After completion of first phase implementation of a new global ERP system in Israel and Canada in 2013, we completed in 2014 the roll-out of the ERP system in the United States and Australia. The total investment in the new ERP system was $2.9 million.
Land purchase agreement and leaseback
Pursuant to a land purchase agreement entered into on March 31, 2011, which became effective upon our IPO, Kibbutz Sdot-Yam acquired from us our rights in the lands and facilities of the Bar-Lev Industrial Park in consideration for NIS 43.7 million (approximately $11.4 million). The carrying value of the Bar-Lev land at the time of closing this transaction was NIS 39.0 million (approximately $10.9 million). The land purchase agreement was executed simultaneously with the execution of a land use agreement.
61
Pursuant to the land use agreement, Kibbutz Sdot-Yam permits us to use the Bar-Lev land for a period of ten years commencing on September 2012, that will be automatically renewed, unless we give two years’ prior notice, for a ten-year term in consideration for an annual fee of NIS 4.1 million (approximately $1.1 million) to be linked to increases in the Israeli consumer price index. The fee is subject to adjustment following January 1, 2021 and every three years thereafter at the option of Kibbutz Sdot-Yam if Kibbutz Sdot-Yam chooses to obtain an appraisal that supports such an increase. The appraiser would be mutually agreed upon or, in the absence of agreement, will be chosen by Kibbutz Sdot-Yam from a list of assessors recommended at that time by Bank Leumi.
Our equipment that resides within the premises is considered integral equipment (as defined in ASC 360-20-15-4) due to the significant costs involved in relocating such equipment. Since we did not sell this equipment to Kibbutz Sdot-Yam as part of the transaction, the transaction is considered a partial sale and leaseback of real estate. As a result, the transaction does not qualify for “sale lease-back” accounting as defined under the relevant provisions of ASC 360-20, and we recorded the entire amount to be received as consideration as a liability while the land and building remained on our balance sheet until the end of the lease term under the provisions of ASC 840-40. As the amount to be paid under the sale-leaseback agreement accreted using our incremental borrowing rate would not cover the anticipated depreciated cost of the building and land at the end of the lease the entire amount paid will be accreted to the anticipated book value of the land and building at the end of the lease term using the effective interest method.
Our research and development department is located in Israel and is comprised of 15 employees with extensive experience in engineered quartz surface manufacturing, polymer science, engineering, product design and engineered quartz surface applications. In 2016, research and development costs accounted for approximately 0.6% of our total revenues.
We have begun to pursue a strategy of seeking patent protection for some of our technologies. We have obtained patents for certain of our technologies and have pending patent applications that were filed in various jurisdictions, including the United States, Europe, Australia, China and Israel, which relate to our manufacturing technology and certain products. We act to protect other innovative proprietary technologies developed by us by implementing confidentiality protection measures without pursuing patent registration. No patent application is material to the overall conduct of our business.
Research and development expenses, net, were $3.3 million, $3.1 million and $2.6 million in 2016, 2015 and 2014, respectively.
For a description of our research and development policies, see “ITEM 4.B: Information on Caesarstone—Business Overview—Research and development.”
Other than as disclosed elsewhere in this annual report, we are not aware of any trends, uncertainties, demands, commitments or events for the period from January 1, 2016 to December 31, 2016 that are reasonably likely to have a materially adverse effect on our net revenues, income, profitability, liquidity or capital resources, or that caused the disclosed financial information to be not necessarily indicative of future operating results or financial condition.
We do not currently engage in off-balance sheet financing arrangements. In addition, we do not have any interest in entities referred to as variable interest entities, which includes special purpose entities and other structured finance entities.
62
Our significant contractual obligations and commitments as of December 31, 2016 are summarized in the following table:
|
2017
|
2018
|
2019
|
2020
|
2021
|
2022 and
thereafter
|
Other
|
Total
(unaudited)
|
|||||||||||||||||||||||||
|
(in thousands of U.S. dollars)
|
||||||||||||||||||||||||||||||||
|
Sale-leaseback
|
$
|
1,089
|
$
|
1,089
|
$
|
1,089
|
$
|
1,089
|
$
|
1,089
|
$
|
635
|
—
|
$
|
6,080
|
|||||||||||||||||
|
Operating lease obligations
|
12,800
|
11,671
|
10,015
|
7,626
|
6,803
|
$
|
44,777
|
—
|
93,692
|
|||||||||||||||||||||||
|
Purchase
obligations(1)
|
19,619
|
206
|
—
|
—
|
—
|
—
|
—
|
19,825
|
||||||||||||||||||||||||
|
Accrued severance pay, net(2)
|
—
|
—
|
—
|
—
|
—
|
—
|
862
|
862
|
||||||||||||||||||||||||
|
Uncertain tax positions(3)
|
—
|
—
|
—
|
—
|
—
|
—
|
1,284
|
1,284
|
||||||||||||||||||||||||
|
Total
|
$
|
33,508
|
$
|
12,966
|
$
|
11,104
|
$
|
8,715
|
$
|
7,892
|
$
|
45,412
|
$
|
2,146
|
$
|
121,743
|
||||||||||||||||
| (1) |
Consists of enforceable and legally binding purchase obligations to suppliers. Does not include purchase obligations to Microgil, our former third-party quartz processor in Israel. See “ITEM 8.A: Financial Information—Consolidated Financial Statements and Other Financial Information—Legal Proceedings.”
|
| (2) |
Severance pay relates to accrued severance obligations to our Israeli employees as required under Israeli labor law. These obligations are payable only upon termination, retirement or death of the relevant employee and there is no obligation if the employee voluntarily resigns. See also Note 2q to our consolidated financial statements included elsewhere in this annual report for further information regarding accrued severance pay.
|
| (3) |
Uncertain income tax positions under ASC 740 guidelines for accounting for uncertain tax positions are due upon settlement and we are unable to reasonably estimate the ultimate amounts or timing of settlement. See Note 11 to our consolidated financial statements included elsewhere in this annual report for further information regarding our liability under ASC 740.
|
63
A. Directors and Senior Management
Our directors and executive officers, their ages and positions as of March 1, 2017, are as follows:
|
Name
|
Age
|
Position
|
||||
|
Officers
|
||||||
|
Raanan Zilberman
(7)
|
56
|
Chief Executive Officer
|
||||
|
Yair Averbuch
|
56
|
Chief Financial Officer
|
||||
|
David Cullen
|
57
|
Managing Director, Caesarstone Australia
|
||||
|
Daniel Clifford
|
59
|
President, Caesarstone USA
|
||||
|
Ken Williams
|
55
|
President, Caesarstone Canada
|
||||
|
Michal Baumwald Oron
|
43
|
Vice President, Business Development and General Counsel
|
||||
|
Eli Feiglin
|
50
|
Vice President, Marketing
|
||||
|
Shmuel Moran
|
62
|
Vice President, Operations
|
||||
|
Erez Margalit
|
49
|
Vice President, Research and Development
|
||||
|
Lilach Gilboa
|
44
|
Vice President, Human Resources
|
||||
|
Directors
|
||||||
|
Dr. Ariel Halperin
(4)
|
62
|
Chairman
|
||||
|
Irit Ben-Dov
(1)(2)(3)(5)(6)
|
47
|
Director
|
||||
|
Dr. Ofer Borovsky
(1)(2)(3)(5)(6)
|
63
|
Director
|
||||
|
Roger Abravanel
(4)
|
71
|
Director
|
||||
|
Dori Brown
(4)
|
46
|
Director
|
||||
|
Eric D. Herschmann
(5)
|
54
|
Director
|
||||
|
Ronald Kaplan
(5)
|
66
|
Director
|
||||
|
Ofer Tsimchi
(1)(2)(3)(5)
|
58
|
Director
|
||||
|
Amit Ben Zvi
|
65
|
Director
|
||||
| (1) |
Member of our audit committee.
|
| (2) |
Member of our compensation committee.
|
| (3) |
Member of our nominating committee.
|
| (4) |
Member of our strategy committee.
|
| (5) |
Independent under the Nasdaq rules.
|
| (6) |
External director under the Israeli Companies Law.
|
(7) Mr. Zilberman joined us as our Chief Executive Officer effective February 26, 2017.
64
Executive Officers
Raanan Zilberman
has served as our Chief Executive Officer since February 26, 2017. Prior to joining us, from 2013 to 2016, Mr. Zilberman served as Chief Executive Officer of Eden Springs - Hydra Dutch, a Swiss-based leading provider of water and coffee services with a network of 160 branches and 30 water plants across 18 countries. From 2008 to 2013, Mr. Zilberman served as Chief Executive Officer of Eden Springs, and from 2005 to 2007 as Chief Executive Officer of Danone Springs a J.V between Eden Group and Danone Group. Prior to that, from 2002 to 2004 Mr. Zilberman served as President of Vishay Transducers, a subsidiary of Vishay Intertechnology Inc., with operation sites in the USA, Europe and Asia, and from 2000 to 2002 as Chief Executive Officer & President of Tedea-Huntleigh, a multinational company listed on the Tel Aviv Stock Exchange Ltd, that engages in production and marketing of electromechanical sensors. From 1997 to 1999, Mr. Zilberman served as Chief Operating Officer of Tadiran Appliances, a former subsidiary of Carrier and United Technologies, which manufactures air conditioners and refrigerators. Mr Zilberman currently serves on the board of Vishay Intertechnology, a NYSE & Fortune 1000 company. Mr. Zilberman holds a B.Sc. degree in Industrial Engineering from Ben Gurion University, Israel and an executive M.B.A from the Racanati Business School at Tel Aviv University, Israel.
Yair Averbuch
has served as our Chief Financial Officer since April 2010. Prior to joining us, from September 2005 to April 2010, Mr. Averbuch served as Chief Financial Officer and Chief Administrative Officer for the Israeli operations of Applied Materials, Inc., a semiconductor capital equipment company (Nasdaq: AMAT). From 1997 to 2005, Mr. Averbuch served as a business unit controller of various Applied Materials’ Product Business Groups. From 1995 to 1997, Mr. Averbuch served as Chief Financial Officer of Orbot Instruments Ltd., an Israeli provider of diagnostic and control tools to semiconductor manufacturers, acquired by Applied Materials in 1997. Mr. Averbuch holds a B.A., M.A. and M.B.A. in Business Administration and Economics, each from Hebrew University, Jerusalem.
David Cullen
has served as our Chief Executive Officer for Caesarstone Australia since April 2010. Prior to joining us, from January 2009 to March 2010, Mr. Cullen served as General Manager in Australia of Komatsu Ltd., a Japanese manufacturer of industrial and mining equipment. From January 2006 to November 2008, he served as Chief Executive Officer of Global Food Equipment Pty Ltd., an Australian importer and distributor of commercial food equipment. From 2004 to 2006, he served as Chief Executive Officer of White International Pty Ltd., an Australian supplier of industrial and residential pump products. From 2003 to 2004, Mr. Cullen served as Chief Executive Officer of Daisytek Australia Pty Ltd, a subsidiary of Daisytek International Corporation. From 1996 to 2002, he served as Chief Executive Officer of Tech Pacific Australia Pty Ltd., the largest distributor of IT equipment in the Asia-Pacific region. Mr. Cullen has held various other management positions in other companies since 1985. Mr. Cullen holds a Bachelor of Commerce degree from the University of New South Wales.
Daniel Clifford
has served as our President, Caesarstone USA since February 2016. Mr. Clifford previously served as President, Caesarstone Canada from January 2015 to February 2016. Prior to joining us, Mr. Clifford served as President and Chief Executive Officer of the Vermont Castings Group from March 2010 to July 2013, and as Group President and Chief Commercial Officer for Rexnord Industries from 2004 to 2008. Previously, Mr. Clifford was the President and Chief Executive Officer of the Eureka Company from 2002 to 2004 and held several management positions with Whirlpool Corporation, including VP Sales and Marketing, North America, VP Global Brand Marketing and VP and General Manager, Whirlpool Canada. Mr. Clifford holds an honours degree in Social Sciences from McMaster University in Ontario, Canada.
Ken Williams
has served as our President of Caesarstone Canada since March 2016. Prior to joining us, from February 1999 to March 2016, Mr. Williams held various senior executive level leadership positions, including Executive Vice President of Sales and Marketing, in a number of Masco Corporation divisions, a global company involved in the design, manufacture and distribution of branded home improvement and building products. Previously, Mr. Williams held general management positions and leadership roles at Fortune Brands, the Redhill Company Ltd. and Thorn Stevenson Kellogg Management Consultants. Mr. Williams holds a Bachelor of Business Administration Degree from Trent University in Ontario, Canada.
Michal Baumwald Oron
has served as our General Counsel since September 2009 and since January 2013, also as our Vice President Business Development. Prior to joining us, from August 2004 to June 2009, Ms. Baumwald Oron served as Secretary and General Counsel of Tefron Ltd., an Israeli manufacturer of intimate apparel and activewear that was listed on the New York Stock Exchange and is currently listed on the Tel Aviv Stock Exchange, and from May 2003 to August 2004, Ms. Baumwald Oron served as the legal counsel of Tefron. From 2001 to May 2003, Ms. Baumwald Oron managed a private legal practice, and from October 1998 to December 2000, she practiced law at a private commercial law firm in Tel-Aviv, Israel. From 1995 to October 1998, Ms. Baumwald Oron served as legal counsel in the Israel Defense Forces. Ms. Baumwald Oron holds an LL.B. from Tel-Aviv University, Israel and an LL.M. from Bar-Ilan University, Israel, and was admitted to the Israeli Bar in 1996.
65
Eli Feiglin
has served as our Vice President Marketing since December 2009. Prior to joining us, Mr. Feiglin served as Vice President Marketing of Jafora-Tabori Ltd., a manufacturer and marketer of soft drinks, from 2005 to December 2009. From 2004 to 2005, Mr. Feiglin served as Chief Executive Officer of Comutech Ltd., a distributor of Siemens AG mobile handsets in Israel. From 1999 to 2004, Mr. Feiglin served as Marketing Manager of Pelephone Ltd., a cellular communications provider in Israel, and from 1996 to 1999, Mr. Feiglin served as Category Manager of Osem (Nestle Israel), a food manufacturer and distributor. From 1992 to 1996, Mr. Feiglin served as Project Manager of POC Strategic Consulting Ltd., a strategy and marketing consulting company. Mr. Feiglin holds a B.A. in Management and Economics and an M.B.A., each from Tel-Aviv University, Israel.
Shmuel Moran
has served as our Vice President of Operations since January 1, 2016. Mr. Moran served as our Special Projects Manager from December 1, 2014 to December 31, 2015. Prior to joining us, Mr. Moran served as General Manager and Corporate VP for IMI Israel (Israeli Military Industries Ltd.), from October 2009 to November 2014. Mr. Moran holds a B.Sc. in Electronics and an M.B.A. from Tel Aviv University.
Erez Margalit
has served as our Vice President Research and Development since August 2013 and joined us in December 2010 as our R&D Engineering Manager. Prior to joining us, from 2008 to October 2010, Mr. Margalit served as Director of Equipment, Reliability and Services of Fab1 and Fab2 of Tower Semiconductor Ltd., a manufacturer of microelectronic devices. From 2001 to 2008, Mr. Margalit served as Technical Manager for several departments in Tower Semiconductor Ltd. Mr. Margalit has specialized in designing, developing and implementing unique industry machinery for unique applications. Mr. Margalit holds a degree in Electronics (Practical Engineer) from Emek Izrael College.
Lilach Gilboa
has served as our Vice President Human Resources and member of our management since August 2007. From 2002 through July 2007, Ms. Gilboa served as our Manager of Human Resources. Prior to joining us, from 1998 to 2000, Ms. Gilboa served as Recruitment Manager in the operations department of ECI Telecom Ltd., an Israeli manufacturer of network infrastructure equipment, and from 2000 to 2002, Ms. Gilboa served as Manager of Human Resources in the IT department at the same company. Ms. Gilboa holds a B.A. in Behavior Science and Human Resources from The College of Management Academic Studies, Israel and an M.A. in Organizational Sociology from Tel-Aviv University, Israel.
Directors
Dr. Ariel Halperin
has served as our Chairman of the Board of Directors since December 2016. Dr. Halperin previously served as our director from December 2006 to May 2013. He has served as the senior managing partner of Tene Investment Funds since 2004 and as a founding partner in Tenram Investments Ltd. since 2000. From 1992 to 2000, Dr. Halperin led negotiations related to the Kibbutzim Creditors Agreement serving as trustee for the Israeli government, Israeli banks and the Kibbutzim. Dr. Halperin currently serves as a director of several Tene Investment Funds' portfolio companies, including Hanita Coatings Ltd., Ricor Cryogenic & Vacuum Systems L.P., Qnergy Ltd., Gadot Chemical Terminals (1985) Ltd. and Merhav Agro Ltd. Dr. Halperin holds a B.A. in Mathematics and Economics and Ph.D. in Economics from The Hebrew University of Jerusalem in Israel and a Post-Doctorate in Economics from the Massachusetts Institute of Technology in Cambridge, Massachusetts.
Irit Ben-Dov
has served as our external director under the Companies Law since March 2012. Since February 2015 Ms. Ben-Dov has served as the VP Finance and CFO of Amiad Water Systems Ltd. (traded on the Alternative Investment Market of the London Stock Exchange), an Israeli manufacturer which specializes in developing and marketing environmentally-friendly filtration solutions for industrial, municipal, and agricultural use. Since November 2013 to February 2015 Ms. Ben-Dov has served as the VP of Business and Finance of Baccara-Geva, an Israeli manufacturer of pneumatics, automation and control solutions. From January 2012 to October 2013, Ms. Ben-Dov has served as the Chief Financial Officer of Plassim Group, an Israeli manufacturer of plastic pipes and fittings. From January 2011 to December 2011, Ms. Ben-Dov served as the Chief Financial Officer of Dynasec Ltd., a risk management and regulatory compliance software start-up company. From November 2003 to June 2010, Ms. Ben-Dov served as Chief Financial Officer of Maytronics Ltd., an Israeli public company. From 2001 to 2003, Ms. Ben-Dov served as an accountant at Ernst & Young, Israel. Ms. Ben-Dov currently serves as an external director and chairperson of the audit committee of Palram Industries Ltd., an Israeli public company. Ms. Ben-Dov holds a B.A. in Statistics from Haifa University, Israel and an M.B.A. from Derbi University, Israel. Ms. Ben-Dov is an Israeli Certified Public Accountant.
66
Dr. Ofer Borovsky
has served as our external director under the Companies Law since March 2012. Since May 2005, Dr. Borovsky has served as the Joint Chief Financial Officer of Plasson Industries Ltd., an Israeli public company traded on the Tel Aviv Stock Exchange and Plasson Ltd., a private Israeli company. From 2004 to 2007, Dr. Borovsky served as a marketing consultant to R.M.C. Ltd., a fish food producer and marketing company. From 2004 to 2009, Dr. Borovsky served as a member of the Financial Committee of Granot Ltd., an Israeli cooperative association. From 2005 to 2008, he served as the chairman of the Investment Committee at Yaniv Pension Fund. From 2000 to 2004, Dr. Borovsky served as treasurer of Plasson Industries Ltd., Plasson Ltd. and Kibbutz Maagan Michael and its corporations. From 1990 to 2000, Dr. Borovsky served as marketing manager for the Kibbutz Maagan Michael fish industry and Mag Noy Ltd., an ornamental fish export company, and from 1985 to 1990, he served as treasurer of Plasson Industries Ltd. and Kibbutz Maagan Michael and its corporations. Mr. Borovsky currently serves as an external director of Gan Shmuel Foods Ltd., an Israeli public company traded on the Tel Aviv Stock Exchange and as a director of Plasson Industries Ltd. and Plasson Ltd. Dr. Borovsky holds a B.A. in Business Administration and Economics from Rupin College, Israel, an M.B.A. from Manchester University, United Kingdom and D.B.A. from the Business School Lausanne in Lausanne, Switzerland.
Roger Abravanel
has served as our director since December 2016.
Mr. Abravanel retired from McKinsey & Company, which he joined in 1972 and where he had become a principal in 1979 and a director in 1984. Mr. Abravanel has provided consulting services to Israeli and Italian private and venture capital funds throughout his career. Mr. Abravanel served as a director of COFIDE—Gruppo De Benedetti SpA. from 2008 until 2013, as a director of Luxottica Group SpA. from 2006 to 2014, and as a director of Admiral Group plc from 2012 until 2015. Mr. Abravanel currently serves as a director of Teva Pharmaceutical Industries Ltd. and Banca Nazionale del Lavoro (a subsidiary of BNP Paribas), and as Chairman of INSEAD’s Advisory Group in Italy. Mr. Abravanel received a B.Sc. degree in chemical engineering from the Polytechnic University in Milan in 1968 and an M.B.A. from INSEAD (with distinction) in 1972.
Dori Brown
has served as our director since December 2016. Mr. Brown previously served as our director from December 2006 to March 2012. Mr. Brown joined Tenram Investment Ltd. as an associate in 2001 and became a partner in 2003. Mr. Brown is one of the founding partners of Tene Investment Funds and has acted as managing partner since 2004. Mr. Brown currently serves as a director of several Tene Investment Funds' portfolio companies, including Hanita Coatings Ltd, Chromagen Agricultural Cooperative Ltd. and Field Produce Ltd. Mr.
Brown holds an LL.B. degree from Bar Ilan University, Israel.
Eric D. Herschmann
has served as our director since December 2016. Mr. Herschmann served as
the President and Chief Operating Officer of Southern Union Co., since May 2008 until 2012. Mr. Herschmann has been a Partner in the law firm of Kasowitz, Benson, Torres & Friedman LLP since joining it in 1996 and has been its national lead litigation counsel since 1999. Mr. Herschmann served as an Interim General Counsel of Southern Union Co., from January 2005 to October 2007 and its Senior Executive Vice President from 2005 to 2008. He served as legal counsel of the audit department of Citibank, N.A., where he managed a team of investigators supporting CitiCorp. on a global basis. From 1987 to 1993, Mr. Herschmann was an Assistant District Attorney and Senior Litigation Counsel for the New York County District Attorney's Office. He served as Vice Chairman of Southern Union Company, the General Partner of Panhandle Eastern Pipe Line Co LP since 2009 until 2012. He earned a B.A. degree from Yeshiva University in 1984 and a Law Degree in 1987 from Benjamin N. Cardozo School of Law, where he served as editor of the International Law Journal and member of the Moot Court Board.
Ronald Kaplan
has served as our director since December 2015. Mr. Kaplan has served as chairman of the board of directors of Trex Company, Inc. (NYSE: TREX) since August 2015. From May 2010 to August 2015, Mr. Kaplan served as Chairman, President and Chief Executive Officer of Trex Company, Inc. From January 2008 to May 2010, Mr. Kaplan served as a director and President and Chief Executive Officer of Trex Company, Inc. From February 2006 through December 2007, Mr. Kaplan served as Chief Executive Officer of Continental Global Group, Inc. For 26 years prior to this, Mr. Kaplan was employed by Harsco Corporation (NYSE: HSC), an international industrial services and products company, at which he served in a number of capacities, including as senior vice president, operations, and, from 1994 through 2005, as President of Harsco Corporation’s Gas Technologies Group, which manufactures containment and control equipment for the global gas industry. Mr. Kaplan received a B.A. in economics from Alfred University and a M.B.A. from the Wharton School of Business, University of Pennsylvania.
67
Ofer Tsimchi
has served as our director since December 2014. He is a managing partner of Danbar Group Ltd., which he co-founded in 2006. Mr. Tsimchi served as the Executive Chairman of the Board of Polysack Plastic Industries Ltd. from 2008 to 2011. Mr. Tismchi has been a director of Redhill Biopharma since 2011, Maabarot Products Ltd. since 2014, and Kidron Industrial Materials ltd since 2003. From 2003 until 2005, he served as director and Chief Executive Officer of Kidron Industrial Holdings Ltd. Group. From 2002 until 2003, Mr. Tismchi was a Business Development Manager of ProSeed Capital Fund. From 2000 until 2001, Mr. Tismchi acted as the Chief Executive Officer of Insider Financial Services Ltd. From 1997 until 2000, Mr. Tsimchi served as the Chief Executive Officer of Inbar Moulded Fiberglass and from 1993 until 1997 as its Vice President of Marketing and Sales. He was the Community Director and Secretary of Kibbutz Hamadia from 1990 until 1993. Mr. Tsimchi holds a B.Sc. in Economics and Agriculture from the Hebrew University, Israel.
Amit Ben Zvi
has served as our director since December 2015. Mr. Ben Zvi served as the business manager of Kibbutz Sdot-Yam since May 2015. From 2010 to 2014, Mr. Ben Zvi served as our safety health environment and quality manager. From 2004 to 2010, Mr. Ben Zvi served as the Chief Executive Officer of the Sdot-Yam Business, Maintenance and Management Cooperative Agricultural Society Ltd. From 1999 to 2004, Mr. Ben Zvi served as our vice president, operations. From 1995 to 1998, Mr. Ben Zvi served as vice president, operations of Ram-On Investments and Holdings (1999) Ltd. (formerly Polyram). From 1991 to 1995, Mr. Ben Zvi served as a regional service manager at Amnir Recycling Ltd. Mr. Ben Zvi holds a B.Sc. in Industrial Management from Tel Aviv University and an M.B.A. with a concentration in finance from the Ruppin Academic Center, Israel.
The aggregate compensation paid by us and our subsidiaries to our current executive officers, including stock-based compensation, for the year ended December 31, 2016, was $7.6 million. This amount includes $0.5 million set aside or accrued to provide pension, severance, retirement or similar benefits or expenses. This amount also includes payments made to our former chief executive officer, Mr. Yos Shiran, through his resignation effective August 2016 and the notice and adjustment periods he was entitled to thereafter and bonus payout in accordance with the shareholder approval received on December 6, 2016.
CEO Compensation
Pursuant to a services agreement we entered into with our appointed Chief Executive Officer, Raanan Zilberman, in consideration for services provided by Mr. Zilberman, starting from February 26, 2017, the date Mr. Zilberman joined Caesarstone, we pay Mr. Zilberman a monthly fee of $69,000, as well as provide benefits that are customary for senior executives in Israel, including a car allowance.
Mr. Zilberman is also entitled to an annual bonus equal to 2.0% of the increase in our annual adjusted EBITDA beyond the Threshold Amount, as defined below. In any event, the annual cash bonus will not exceed the lower of: (i) $1,170,000 for each calendar year, and (ii) 2.5% of our net profit for the year the annual cash bonus is paid. “Threshold Amount” shall mean $110 million, and if we will complete an acquisition in Israel or outside of Israel, as of the date of the acquisition, $110 million in addition to the EBITDA of the Acquired Israeli or Foreign Company, provided that the EBITDA of the Acquired Israeli or Foreign Company is positive. “EBITDA of Acquired Israeli or Foreign Company” shall mean (i) with respect to an acquisition or a merger completed by us or any of our subsidiaries in Israel or outside of Israel no later than June 30 of a calendar year, the EBITDA of such acquired Israeli or foreign company in accordance with the audited financial statements of the acquired company for the fiscal year preceding the year of completion of the acquisition or merger, as shall be approved by our independent auditor in accordance with the accounting standards implemented by us in our financial statements, and (ii) with respect to an acquisition or a merger completed by us following June 30 of a calendar year, the EBITDA of the acquired Israeli or foreign company during the twelve (12) months period preceding the closing date of the acquisition or merger, as applicable, and as shall be determined by the accounting firm that performed the due diligence investigation of the acquired company in accordance with the accounting standards implemented by us in our financial statements. In a calendar year in which we shall complete an acquisition or merger in Israel or outside of Israel, the annual cash bonus shall be calculated in accordance with the Threshold Amount immediately prior to the consummation of the acquisition or merger for the period prior to the acquisition or merger and the updated Threshold Amount immediately after to the consummation of the acquisition or merger for the period following the acquisition or merger. An acquisition or merger shall include the acquisition of assets or operations in Israel or outside of Israel. In the event of the acquisition of assets or operations, the EBITDA of Acquired Israeli or Foreign Company shall be calculated by the independent auditor of the Company in accordance with the accounting standards implemented by the Company in its financial statements.
68
Mr. Zilberman received 300,000 options to purchase ordinary shares of the Company and 20,000 RSUs each representing a right to receive one ordinary share of the Company, in accordance with, and subject to, all terms and conditions of the applicable Company’s incentive plan and the Company's customary option agreement. The grant date of the options and RSUs is February 26, 2017, the date Mr. Zilberman joined Caesarstone. The exercise price of the options is $30.65, which is the closing price of our ordinary shares as traded on NASDAQ at the date of approval of the grant by our shareholders, which took place on December 6, 2016. The options and RSUs have been granted in accordance with, and subject to, all terms and conditions of the applicable Company’s incentive plan and the Company's customary option agreement. The options and RSUs shall be subject to a vesting schedule over a period of four (4) years, such that 25% of the options shall vest upon the lapse of each 12 months following the date Mr. Zilberman joined the Company, provided, however, that upon the lapse of his prior notice period, the amount of options and RSUs which is equal to 75,000 and 5,000, respectively, multiplied by a fraction, the numerator of which shall be the period elapsed as of the last date a portion of the options has vested and the denominator of which shall be a twelve (12) months period, shall be accelerated and automatically be vested.
We and Mr. Zilberman may each terminate the agreement (other than for cause) with a three (3) months prior written notice. Upon termination by us (not for cause), he shall be entitled, in addition to the prior notice period, to an adjustment period of six (6) months. Upon termination by Mr. Zilberman, subject to him completing a twelve (12) months engagement period with us, he shall be entitled in addition to the prior notice period, to an adjustment period of three (3) months.
Director Compensation
As approved at our 2014 and 2015 annual general meetings of shareholders, each of our directors is entitled to the payment of annual fee of NIS 120,000 (approximately $31,000), and payment of NIS 3,350 (approximately $860) per meeting for participating in meetings of the board and committees of the board. The annual fee shall not exceed the maximum annual fee of an expert external director set forth in the Companies Regulations (Rules regarding Compensation and Expenses of External Directors) 5760-2000 as adjusted by the Companies Regulations (Relief for Public Companies with Shares Listed for Trading on a Stock Market Outside of Israel), 5760-2000. The compensation awarded for participating in resolutions adopted without an actual convening (meaning, unanimous written resolutions) and for participating through media communication will be reduced as follows: (1) for resolutions that will be adopted without an actual convening, the participation compensation will be reduced by 50%; and (2) for participation through media communication, the participation compensation will be reduced by 60%. The participation compensation and the annual fee is inclusive of all expenses incurred by our directors in connection with their participation in a meeting held at our offices or at the director’s residence area, or with regard to resolutions resolved by written consent or teleconference, provided that with respect to independent directors residing outside of Israel (other than chairman of the board and external directors), their travel and lodging expenses related to their participation and physical attendance at any board or board committee meeting will be borne by us.
In addition, our directors are entitled to reimbursement for travelling expenses when travelling abroad on our behalf and other expenses incurred in the performance of their duties and services to us.
On December 6, 2016, our shareholders approved that Mr. Roger Abravanel is entitled to an annual fee of US$ 100,000 and a per meeting fee US$ 2,500 for participation in meetings of the board and committees of the board. Mr. Abravanel’s annual fee was considered also in light of our intention to have him serve as chairman of our strategy committee established by our board of directors. Our shareholders further approved that Mr. Ronald Kaplan and Mr. Eric D. Herchmann shall be entitled to an annual fee of US$ 75,000 and a per meeting fee of US$ 2,500 for participation in meetings of the board and committees of the board. The participating fees of Mr. Abravanel, Kaplan and Herschmann for meetings held through media communication shall be reduced by 50% and for meetings by written consent shall be reduced by 75%.
For a discussion of the compensation granted to our five most highly compensated office holders during or with respect to 2016, see “Individual Covered Executive Compensation” below, and for a discussion of the compensation paid to our directors during or with respect to 2016, see “Compensation of Directors” below.
69
Individual Covered Executive Compensation
The table below reflects the compensation granted to our five most highly compensated office holders (as defined in the Companies Law) during or with respect to the year ended December 31, 2016, including our former chief executive officer, Mr. Yosef Shiran. We refer to the five individuals for whom disclosure is provided herein as our “Covered Executives.” For purposes of the table below, “compensation” includes amounts accrued or paid in connection with salary cost, consultancy fees, bonuses, equity-based compensation, retirement or termination payments, benefits and perquisites such as car, phone and social benefits and any undertaking to provide such compensation. All amounts reported in the table are in terms of cost to the Company, as recognized in our financial statements for the year ended December 31, 2016, plus compensation paid to such Covered Executives following the end of the year in respect of services provided during the year. Each of the Covered Executives was covered by our D&O liability insurance policy and was entitled to indemnification and exculpation in accordance with applicable law and our articles of association.
|
Name and Principal Position
(1)
|
Salary
(2)
|
Bonus
(3)
|
Equity-Based
Compensation (4) |
All
other compensation (5) |
Total
|
|||||||||||||||
|
USD
|
||||||||||||||||||||
|
Yosef Shiran
(6)
|
402,099
|
2,058,545
|
386,351
|
36,842
|
2,883,837
|
|||||||||||||||
|
David Cullen
|
282,479
|
109,562
|
186,259
|
8,818
|
587,118
|
|||||||||||||||
|
Daniel Clifford
|
314,350
|
72,335
|
181,609
|
2,050
|
570,344
|
|||||||||||||||
|
Yair Averbuch
|
240,491
|
19,430
|
265,794
|
37,776
|
563,491
|
|||||||||||||||
|
Ken Williams
|
189,766
|
93,467
|
178,527
|
9,314
|
471,074
|
|||||||||||||||
| (1) |
All Covered Executives are employed by Caesarstone on a full time (100%) basis.
|
| (2) |
Salary includes the Covered Executive’s gross salary plus payment of social benefits made by us on behalf of such Covered Executive. Such benefits may include, to the extent applicable to the Covered Executive, payments, contributions and/or allocations for
savings funds (such as managers’ life insurance policy), education funds (referred to in Hebrew as “keren hishtalmut”), pension, severance, risk insurances (e.g., life, or work disability insurance), payments for social security and tax gross-up payments, vacation, medical insurance and benefits, convalescence or recreation pay and other benefits and perquisites consistent with our policies.
|
| (3) |
Represents annual bonuses granted to the Covered Executive based on formulas set forth in the respective resolutions of the Company's Compensation Committee and the Board of Directors.
|
| (4) |
Represents the equity-based and phantom share based compensation expenses recorded in the Company's consolidated financial statements for the year ended December 31, 2016, based on the option's or phantom award’s fair value, calculated in accordance with accounting guidance for equity-based compensation. For a discussion of the assumptions used in reaching this valuation, see Note 2u to our consolidated financial statements.
|
| (5) |
Includes mainly leased car and mobile phone expenses.
|
(6) Mr. Shiran resigned as CEO effective August 2016.
Employment and consulting agreements with executive officers
We have entered into written employment or service agreements with each of our executive officers.
70
Employment agreements
We have entered into written employment or services agreements with each of our office holders who is not a director. These agreements each contain customary provisions regarding non-competition, confidentiality of information and assignment of inventions. The non-competition provision generally applies for a period of six months following termination of employment. The enforceability of covenants not to compete in Israel and the United States is subject to limitations. In addition, we are required to provide notice of between two and six months prior to terminating the employment of certain of our senior executive officers other than in the case of a termination for cause. The terms of engagement of our chief executive officer are described above.
Indemnification agreements
Our articles of association permit us to exculpate, indemnify and insure our directors and office holders to the fullest extent permitted by law, subject to limited exceptions. We have entered into agreements with each of our current directors and office holders exculpating them from a breach of their duty of care to us to the fullest extent permitted by law, subject to limited exceptions, and undertaking to indemnify them to the fullest extent permitted by law, including with respect to liabilities resulting from our IPO to the extent that these liabilities are not covered by insurance. See “ITEM 6.C: Directors, Senior Management and Employees—Board Practices—Exculpation, insurance and indemnification of office holders.”
Directors’ service contracts
There are no arrangements or understandings between us and any of our subsidiaries, on the one hand, and any of our directors, on the other hand, providing for benefits upon termination of their employment or service as directors of our company or any of our subsidiaries, other than our undertaking to provide Yonatan Melamed, the former chairman of our board of directors, with a vehicle for additional three months following the termination of his service as chairman in December 2016.
Equity incentive plan
We adopted the 2011 Incentive Compensation Plan in July 2011. We provide stock-based compensation under the 2011 plan to our directors, executive officers, employees and consultants, and those of our affiliates. The 2011 plan is intended to further our success by increasing the ownership interest of certain of our and our subsidiaries employees, directors and consultants and to enhance our and our subsidiaries ability to attract and retain employees, directors and consultants. In 2012, we granted to certain of our key employees and our executive officers, options to purchase 1,545,200 of our ordinary shares at a weighted average exercise price of $11.13 per share. Following dividend distributions equal to $0.58 and $0.57 per share made by us in November 2013 and December 2014, respectively and under an adjustment mechanism of the exercise price set forth in the 2011 plan, the current weighted average exercise price is $10.09. In 2015, we granted our former Chief Executive Officer options to purchase 360,000 of our ordinary shares at exercise price of $41.37. We also granted certain of our key employees and executive officers options to purchase 424,000 of our ordinary shares at a weighted average exercise price of $34.99 per share. In addition, during 2015 we granted our key employees and executive officers 55,100 RSUs at a weighted average fair value of $35.04 per share. In 2016, we granted certain of our key employees and executive officers options to purchase 38,000 of our ordinary shares at a weighted average exercise price of $36.08 per share. In addition, during 2016 we granted our key employees and executive officers 3,200 RSUs at a weighted average fair value of $36.70 per share. As of March 1, 2017, we had 34,321,573 ordinary shares that were outstanding.
On December 3, 2015, our shareholders resolved to amend the 2011 plan to increase the aggregate number of shares authorized for issuance under the 2011 plan by 900,000 ordinary shares.
As of March 1, 2017, the number of ordinary shares allocated under the 2011 plan was 2,395,581 ordinary shares. Considering the number of options and RSUs already granted, as of March 1, 2017, 1,021,977 ordinary shares remained available for future option or RSU grants under the 2011 plan.
The number of shares subject to the 2011 plan is also subject to adjustment if particular capital changes affect our share capital. Ordinary shares subject to outstanding awards under the 2011 plan that are subsequently forfeited or terminated for any other reason before being exercised will again be available for grant under the 2011 plan. A share option is the right to purchase a specified number of ordinary shares in the future at a specified exercise price and subject to the other terms and conditions specified in the option award agreement and the 2011 plan. The exercise price of each option granted under the 2011 plan will be determined by our compensation committee. The exercise price of any share options granted under the 2011 plan may be paid in cash, ordinary shares already owned by the option holder or any other method that may be approved by our compensation committee, such as a cashless broker-assisted exercise that complies with applicable laws. A restricted stock unit is the right to receive a specified number of ordinary shares in the future subject to the terms and conditions specified in the award agreement and the 2011 plan.
71
Our compensation committee may also grant, or recommend that our board of directors grant, other forms of equity incentive awards under the 2011 plan, such as stock appreciation rights, dividend equivalents and other forms of equity-based compensation.
Israeli participants in the 2011 plan may be granted stock options and restricted stock units subject to Section 102 of the Israeli Income Tax Ordinance. Section 102 of the Israeli Income Tax Ordinance, allows employees, directors and officers, who are not controlling shareholders and are considered Israeli residents to receive favorable tax treatment for compensation in the form of shares or options. Our non-employees service providers and controlling shareholders may only be granted options under another section of the Tax Ordinance, which does not provide for similar tax benefits. Section 102 includes two alternatives for tax treatment involving the issuance of options or shares to a trustee for the benefit of the grantees and also includes an additional alternative for the issuance of options or shares directly to the grantee. The most favorable tax treatment for the grantees is under Section 102(b)(2) of the Tax Ordinance, the issuance to a trustee under the “capital gain track.” However, under this track we are not allowed to deduct an expense with respect to the issuance of the options or shares. Any stock options granted under the 2011 plan to participants in the United States will be either “incentive stock options,” which may be eligible for special tax treatment under the Internal Revenue Code of 1986, or options other than incentive stock options (referred to as “nonqualified stock options”), as determined by our compensation committee and stated in the option agreement.
Our compensation committee administers the 2011 plan. Our board of directors may, subject to any legal limitations, exercise any powers or duties of the compensation committee concerning the 2011 plan. The compensation committee selects which of our and our subsidiaries’ and affiliates’ eligible employees, directors and/or consultants shall receive options, restricted stock units or other awards under the 2011 plan and determines, or recommends to our board of directors, the number of ordinary shares covered by those awards, the terms under which such awards may be exercised (however, options generally may not be exercised later than 10 years from the grant date of an option) or may be settled or paid, and the other terms and conditions of such awards under the 2011 plan. Holders of equity incentive awards may not transfer those awards, unless they die or the compensation committee determines otherwise.
If we undergo a change of control, as defined in the 2011 plan, subject to any contrary law or rule, or the terms of any award agreement in effect before the change of control, (a) the compensation committee may, in its discretion, accelerate the vesting, exercisability and payment, as applicable, of outstanding options and other awards; and (b) the compensation committee, in its discretion, may adjust outstanding awards by substituting ordinary shares or other securities of any successor or another party to the change of control transaction, or cash out outstanding options and other awards, in any such case, generally based on the consideration received by our shareholders in the transaction.
Subject to particular limitations specified in the 2011 plan and under applicable law, our board of directors may amend or terminate the 2011 plan, and the compensation committee may amend awards outstanding under the 2011 plan. The 2011 plan will continue in effect until all ordinary shares available under the 2011 plan are delivered and all restrictions on those shares have lapsed, unless the 2011 plan is terminated earlier by our board of directors. No awards may be granted under the 2011 plan on or after the tenth anniversary of the date of adoption of the plan.
In 2014, our Board approved phantom awards to several of our key employees. Each award entitles its owner to receive the intrinsic value of the difference between the share price at the time of such options grant and the share price at the time of the option's exercise. A total of 136,000 phantom awards have been granted with a weighted exercise price of $46.65. Following a dividend distribution equal to $0.57 per share made by us in December 2014 and under an adjustment mechanism of the exercise price set forth in the phantom agreements, the current weighted average exercise price is $46.08. The phantom awards vest over a four-year period starting on the date of grant, and their value may be paid by us at our election, subject to the board decision, either in cash or by our ordinary shares. Similar terms of the 2011 plan, as described above, apply to the phantom award. The cost of such grant will be treated as a liability award and, therefore, will be subject to quarterly fluctuations associated with our share price.
72
On October 27, 2015, our board of directors approved the grant of stock options and RSUs as a partial replacement for the previously granted phantom awards. Accordingly, as of December 31, 2016, 21,250 phantom awards remained outstanding.
The fair value of the remaining phantom awards granted under the 2011 plan using a binomial model is estimated to be approximately $0.1 million and $0.5 million as of December 31, 2016 and 2015, respectively, and there was $0 of total unrecognized compensation cost related to the phantom awards.
Grant of stock options to Chief Executive Officer
On December 6, 2016, our shareholders approved a grant to Mr. Zilberman of 300,000 options to purchase ordinary shares of the Company and 20,000 RSUs. See “ITEM 6.B: Directors, Senior Management and Employees—Compensation of Officers and Directors—CEO Compensation.”
Corporate governance practices
As a foreign private issuer, we are permitted to follow Israeli corporate governance practices instead of Nasdaq corporate governance rules, provided that we disclose which requirements we are not following and the equivalent Israeli requirement. We rely on this “foreign private issuer exemption” with respect to the following item:
| • |
As permitted under the Companies Law, pursuant to our articles of association, the quorum required for any meeting of shareholders consists of at least two shareholders present in person, by proxy or by other voting instrument in accordance with the Companies Law, who hold at least 25% of the voting power of our shares, instead of 33 1/3% of the issued share capital required under the Nasdaq requirements. At an adjourned meeting, any number of shareholders constitutes a quorum for the business for which the original meeting was called.
|
Otherwise, we comply with Nasdaq corporate governance rules generally applicable to U.S. domestic companies listed on Nasdaq. We may in the future decide to use the foreign private issuer exemption with respect to some or all of the other Nasdaq Global Select Market corporate governance rules. We also comply with Israeli corporate governance requirements under the Companies Law applicable to public companies.
Board of directors and officers
As of the date of this report, our board of directors consists of nine directors, six of whom are independent under the Nasdaq rules, including Ms. Ben-Dov and Dr. Borovsky, who serve as our external directors and whose appointment fulfills the requirements of the Companies Law for the company to have two external directors (see “—External directors”). Specifically, our board of directors has determined that Ofer Tsimchi, Ofer Borovsky, Irit Ben-Dov, Ronald Kaplan,
Roger Abravanel and Eric D. Herschmann,
meet the independence standards under the rules of Nasdaq. In reaching this conclusion, the board of directors determined, following the recommendation of our nomination committee, that none of these directors has a relationship that would preclude a finding of independence and any relationships that these directors have with us do not impair their independence.
Under our articles of association, the number of directors on our board of directors must be no less than seven and no more than 11 and must include at least two external directors. The minimum and maximum number of directors may be changed, at any time and from time to time, by a simple majority vote of our shareholders at a shareholders’ meeting.
Each director holds office until the annual general meeting of our shareholders in the subsequent year unless the tenure of such director expires earlier pursuant to the Companies Law or unless he or she is removed from office as described below, except our external directors, who have a term of office of three years under Israeli law (see “—External directors—Election and dismissal of external directors”).
73
The directors who are serving in office shall be entitled to act even if a vacancy occurs on the board of directors. However, should the number of directors, at the time in question, become less than the minimum set forth in our articles of association, the remaining director(s) would be entitled to act for the purpose of filling the vacancies or to convene a general meeting, but not for any other purpose.
Any director who retires from his or her office would be qualified to be re-elected subject to any limitation affecting such director’s appointment as a director under the Companies Law. See “—External directors” for a description of the provisions relating to the reelection of external directors.
A general meeting of our shareholders may remove a director from office prior to the expiry of his or her term in office (“
Removed Director
”) by a simple majority vote (except for External Directors, who may be dismissed only as set forth under the Companies Law), provided that the Removed Director is given a reasonable opportunity to state his or her case before the general meeting. If a director is removed from office as set forth above, the general meeting shall be entitled, in the same session, to elect another director in his or her stead in accordance with the maximum number of directors permitted by our articles of association as stated above. Should it fail to do so, the board of directors shall be entitled to do so. Any director who is appointed in this manner shall serve in office for the period remaining of the term in office of the director who was removed and shall be qualified to be re-elected.
Any amendment of our articles of association regarding the election of directors, as described above, require a simple majority vote. See “—External directors” for a description of the procedure for the election of external directors.
In addition, under the Companies Law, our board of directors must determine the minimum number of directors who are required to have financial and accounting expertise. Under applicable regulations, a “director with financial and accounting expertise” is a director who, by reason of his or her education, professional experience and skill, has a high level of proficiency in and understanding of business accounting matters and financial statements so that he or she is able to fully understand our financial statements and initiate debate regarding the manner in which the financial information is presented. The determination of whether a director possesses financial and accounting expertise is made by the board of directors. In determining the number of directors required to have such expertise, the board of directors must consider, among other things, the type and size of the company and the scope and complexity of its operations. Our board of directors has determined that we require at least one director with the requisite financial and accounting expertise and that each of Dr. Ofer Borovsky and Ms. Irit Ben-Dov has such expertise.
There are no family relationships among any of our office holders (including directors).
Alternate directors
Our articles of association provide, subject to the limitations under the Companies Law, that any director may, by written notice to us, appoint another person who is qualified to serve as a director to serve as an alternate director. The appointment of an alternate director shall be subject to the consent of the board of directors. The alternate director will be regarded as a director. Under the Companies Law, a person who is not qualified to be appointed as a director, a person who is already serving as a director or a person who is already serving as an alternate director for another director, may not be appointed as an alternate director. Nevertheless, a director who is already serving as a director may be appointed as an alternate director for a member of a committee of the board of directors so long as he or she is not already serving as a member of such committee, and if the alternate director is to replace an external director, he or she is required to be an external director and to have either “financial and accounting expertise” or “professional expertise,” depending on the qualifications of the external director he or she is replacing. A person who does not have the requisite “financial and accounting experience” or the “professional expertise,” depending on the qualifications of the external director he or she is replacing, may not be appointed as an alternate director for an external director. A person who is not qualified to be appointed as an independent director, pursuant to the Companies Law, may not be appointed as an alternate director of an independent director.
External directors
Qualifications of external directors
Under the Companies Law, companies incorporated under the laws of the State of Israel that are “public companies,” including companies with shares listed on the Nasdaq Global Select Market, are required to appoint at least two external directors who meet the qualification requirements under the Companies Law. Such external directors are not required to be Israeli residents in case the company is listed on a foreign stock exchange (such as us). Appointment of external directors is made by a special majority resolution of the general meeting of our shareholders. At a shareholders’ meeting held on December 3, 2014, each of Dr. Ofer Borovsky and Ms. Irit Ben-Dov was re-elected to serve as external directors of the Company for an additional three-year term commencing on March 21, 2015.
74
A person may not be appointed as an external director if the person is a relative of a controlling shareholder or if on the date of the person’s appointment or within the preceding two years the person or his or her relatives, partners, employers or anyone to whom that person is subordinate, whether directly or indirectly, or entities under the person’s control have or had any affiliation with any of (each an “Affiliated Party”): (1) us; (2) any person or entity controlling us on the date of such appointment; (3) any relative of a controlling shareholder; or (4) any entity controlled, on the date of such appointment or within the preceding two years, by us or by our controlling shareholder. If there is no controlling shareholder or any shareholder holding 25% or more of voting rights in the company, a person may not serve as an external director if the person has any affiliation to the chairman of the board of directors, the general manager (chief executive officer), any shareholder holding 5% or more of the company’s shares or voting rights or the senior financial officer as of the date of the person’s appointment.
The term “controlling shareholder” means a shareholder with the ability to direct the activities of the company, other than by virtue of being an office holder. A shareholder is presumed to have “control” of the company and thus to be a controlling shareholder of the company if the shareholder holds 50% or more of the “means of control” of the company. “Means of control” is defined as (1) the right to vote at a general meeting of a company or a corresponding body of another corporation; or (2) the right to appoint directors of the corporation or its general manager.
The term “affiliation” includes:
| • |
an employment relationship;
|
| • |
a business or professional relationship maintained on a regular basis;
|
| • |
control; and
|
| • |
service as an office holder, excluding service as a director in a private company prior to the first offering of its shares to the public if such director was appointed as a director of the private company in order to serve as an external director following the initial public offering.
|
The term “relative” is defined as a spouse, sibling, parent, grandparent, descendant, spouse’s descendant, sibling and parent and the spouse of each of the foregoing.
The term “office holder” is defined as a general manager, chief business manager, deputy general manager, vice general manager, or any other person assuming the responsibilities of any of the foregoing positions, without regard to such person’s title, and a director or manager directly subordinate to the general manager.
A person may not serve as an external director if that person or that person’s relative, partner, employer, a person to whom such person is subordinate (directly or indirectly) or any entity under such person’s control has a business or professional relationship with any entity that has an affiliation with any Affiliated Party, even if such relationship is intermittent (excluding insignificant relationships). Additionally, any person who has received compensation intermittently (excluding insignificant relationships) other than compensation permitted under the Companies Law may not continue to serve as an external director.
No person can serve as an external director if the person’s position or other affairs create, or may create, a conflict of interest with the person’s responsibilities as a director or may otherwise interfere with the person’s ability to serve as a director or if such a person is an employee of the Israel Securities Authority or of an Israeli stock exchange. If at the time an external director is appointed all current members of the board of directors, who are not controlling shareholders or relatives of controlling shareholders, are of the same gender, then the external director to be appointed must be of the other gender. In addition, a person who is a director of a company may not be elected as an external director of another company if, at that time, a director of the other company is acting as an external director of the first company.
75
The Companies Law provides that an external director must either meet certain professional qualifications or have financial and accounting expertise, and that at least one external director must have financial and accounting expertise. However, if at least one of our other directors (1) meets the independence requirements of the Exchange Act, (2) meets the Nasdaq requirements for membership on the audit committee and (3) has financial and accounting expertise as defined in the Companies Law and applicable regulations, then neither of our external directors is required to possess financial and accounting expertise as long as both possess other requisite professional qualifications as required under the Companies Law and regulations promulgated thereunder.
The regulations promulgated under the Companies Law define an external director with requisite professional qualifications as a director who satisfies one of the following requirements: (1) the director holds an academic degree in either economics, business administration, accounting, law or public administration, (2) the director either holds an academic degree in any other field or has completed another form of higher education in the company’s primary field of business or in an area which is relevant to his or her office as an external director in the company, or (3) the director has at least five years of experience serving in any one of the following, or at least five years of cumulative experience serving in two or more of the following capacities: (a) a senior business management position in a company with a substantial scope of business, (b) a senior position in the company’s primary field of business or (c) a senior position in public administration.
Under the Companies Law, until the lapse of a two-year period from the date that an external director has ceased to act as an external director (and until the lapse of a one-year period, with respect to such external director spouse or children) certain prohibitions apply to the ability of the company and its controlling shareholders, including any corporations controlled by a controlling shareholder to grant such former external director or his or her spouse or children any benefits (directly or indirectly).
Election and dismissal of external directors
Under Israeli law, external directors are elected by a majority vote at a shareholders’ meeting, provided that either:
| • |
the majority of the shares that are voted at the meeting in favor of the election of the external director, excluding abstentions, include at least a majority of the votes of shareholders who are not controlling shareholders or have a personal interest in the appointment (excluding a personal interest that did not result from the shareholder’s relationship with the controlling shareholder); or
|
| • |
the total number of shares held by the shareholders mentioned in the paragraph above that are voted against the election of the external director does not exceed two percent of the aggregate voting rights in the company.
|
Under Israeli law, the initial term of an external director of an Israeli public company is three years. The external director may be reelected, subject to certain circumstances and conditions, to two additional terms of three years, each if:
| • |
his/her service for each such additional term is recommended by one or more shareholders holding at least 1% of the company’s voting rights and is approved at a shareholders’ meeting by a disinterested majority, where the total number of shares held by non-controlling, disinterested shareholders voting for such reelection exceeds 2% of the aggregate voting rights in the company, subject to additional restrictions set forth in the Companies Law with respect to the affiliation of the external director nominee, as described above;
|
| • |
the external director proposed his or her own nomination, and such nomination was approved in accordance with the requirements described in the paragraph above; or
|
| • |
his/her service for each such additional term is recommended by the board of directors and is approved at a meeting of shareholders by the same majority required for the initial election of an external director (as described above).
|
The term of office for external directors for Israeli companies traded on certain foreign stock exchanges, including the Nasdaq Global Select Market, may be further extended, indefinitely, in increments of additional three-year terms, in each case provided that: (i) both the audit committee and the board of directors confirm that, in light of the expertise and contribution of the external director, the extension of such external director’s term would be in the interest of the company; (ii) the appointment to the additional term is subject to the reelection provision described above; and (iii) the term during which the nominee served as an external director and the board of directors’ and audit committee’s reasoning for the extension of such term were presented before the general meeting of shareholders prior to the approval of the extension.
76
An external director may be removed by the same special majority of the shareholders required for his or her election, if he or she ceases to meet the statutory qualifications for appointment or if he or she violates his or her fiduciary duty to the company. An external director may also be removed by order of an Israeli court if the court finds that the external director is permanently unable to exercise his or her office, has ceased to meet the statutory qualifications for his or her appointment, has violated his or her fiduciary duty to the company, or has been convicted by a court outside Israel of certain offenses detailed in the Companies Law.
If the vacancy of an external directorship causes a company to have fewer than two external directors, the company’s board of directors is required under the Companies Law to call a special general meeting of the company’s shareholders as soon as possible to appoint such number of new external directors so that the company thereafter has two external directors.
Additional provisions
Under the Companies Law, each committee authorized to exercise any of the powers of the board of directors must include only directors and is required to include at least one external director and each of the audit and compensation committees are required to include all of the external directors.
An external director is entitled to compensation and reimbursement of expenses in accordance with regulations promulgated under the Companies Law and is prohibited from receiving any other compensation, directly or indirectly, in connection with serving as an external director except for certain exculpation, indemnification and insurance provided by the company, as specifically allowed by the Companies Law.
Audit committee
Our audit committee consists of Ms. Irit Ben-Dov, Dr. Ofer Borovsky and Mr. Ofer Tsimchi. Ms. Ben-Dov serves as the chairperson of the audit committee.
Companies Law requirements
Under the Companies Law, the board of directors of any public company must also appoint an audit committee comprised of at least three directors, including all of the external directors. The audit committee may not include:
| • |
the chairman of the board of directors;
|
| • |
a controlling shareholder or a relative of a controlling shareholder; and
|
| • |
any director employed by, or providing services on an ongoing basis to, the company, a controlling shareholder of the company or an entity controlled by a controlling shareholder of the company or any director who derives most of his or her income from the controlling shareholder.
|
According to the Companies Law, the majority of the members of the audit committee, as well as the majority of members present at audit committee meetings, are required to be “independent” (as defined below) and the chairman of the audit committee is required to be an external director. Any persons disqualified from serving as a member of the audit committee may not be present at the audit committee meetings, unless the chairman of the audit committee has determined that such person is required to be present at the meeting or if such person qualifies under one of the exemptions of the Companies Law. Without derogating from the aforementioned, under the Companies Law, a company’s general counsel and a company’s secretary, which are not a controlling shareholder or relative thereof, may be present at an audit committee meeting if the committee has requested their presence.
The term “independent director” is defined under the Companies Law as an external director or a director who meets the following conditions and who is appointed or classified as such according to the Companies Law: (1) the conditions for his or her appointment as an external director (as described above) are satisfied and the audit committee approves the director having met such conditions and (2) he or she has not served as a director of the company for over nine consecutive years with any interruption of up to two years of his or her service not being deemed a disruption to the continuity of his or her service.
77
Under the regulations promulgated under the Companies Law, an audit committee of companies such as ours may deem a director which qualifies as an independent director, among others, under the Nasdaq listing rules, to be an independent director within the meaning of the Companies Law, provided that such director complies with the Companies Law requirements for external directors with respect to a lack of affiliation with a controlling shareholder, its relatives and entities under its control or his or her relative’s control, excluding the company itself or any of its subsidiaries. In addition, companies such as ours may extend the term of office of an independent director who has served for more than nine years for additional periods of three years each if such director continues to comply with the Companies Law requirements for external director’s lack of affiliation as described above.
Nasdaq requirements
Under the Nasdaq rules, we are required to maintain an audit committee consisting of at least three independent directors, all of whom are financially literate and one of whom has accounting or related financial management expertise.
All members of our audit committee meet the requirements for financial literacy under the applicable rules of the SEC and the Nasdaq rules. Our board of directors has determined that each of Dr. Borovsky and Ms. Irit Ben-Dov qualifies as an “audit committee financial expert,” as defined by applicable rules of the SEC and has the requisite financial experience as defined by Nasdaq rules.
Each of the members of the audit committee is “independent” under the relevant Nasdaq rules and as defined in Rule 10A-3(b)(1) under the Exchange Act, which is different from the general test for independence of members of the board.
Approval of transactions with related parties
The approval of the audit committee is required to effect specified actions and transactions with office holders and controlling shareholders and their relatives, or in which they have a personal interest. See “—Fiduciary duties and approval of specified related party transactions under Israeli law.” For the purpose of approving transactions with controlling shareholders, the term “controlling shareholder” also includes any shareholder that holds 25% or more of the voting rights of the company if the company has no shareholder that owns more than 50% of its voting rights. For purposes of determining the holding percentage stated above, two or more shareholders who have a personal interest in a transaction that is brought for the company’s approval are deemed as joint holders. The audit committee may not approve an action or a transaction with a controlling shareholder or with an office holder unless at the time of approval the audit committee meets the composition requirements under the Companies Law and provided such transaction is in the interest of the Company.
Audit committee role
Our board of directors has adopted an audit committee charter setting forth the responsibilities of the audit committee consistent with the rules of the SEC and Nasdaq rules, which include, among other responsibilities:
| • |
retaining and terminating our independent auditors, subject to board of directors and shareholder ratification;
|
| • |
pre-approval of audit and non-audit services to be provided by the independent auditors;
|
| • |
reviewing with management and our independent directors our quarterly and annual financial reports prior to their submission to the SEC; and
|
| • |
approval of certain transactions with office holders and controlling shareholders and other related-party transactions.
|
Additionally, under the Companies Law, the role of the audit committee includes the identification of irregularities in our business management, among other things, by consulting with the internal auditor or our independent auditors and suggesting an appropriate course of action to the board of directors. In addition, the audit committee or the board of directors, as set forth in the articles of association of the company, is required to approve the yearly or periodic work plan proposed by the internal auditor. The audit committee is required to assess the company’s internal audit system and the performance of its internal auditor. The Companies Law also requires that the audit committee assess the scope of the work and compensation of the company’s external auditor. In addition, the audit committee is required to determine whether certain related party actions and transactions are “material” or “extraordinary” for the purpose of the requisite approval procedures under the Companies Law, whether certain transactions with a controlling shareholder will be subject to a competitive procedure (regardless of whether or not such transactions are deemed extraordinary transactions) and to set forth the approval process for transactions that are “non-negligible” (meaning, transactions with a controlling shareholder that are classified by the audit committee as non-negligible, even though they are not deemed extraordinary transactions), as well as determining which types of transactions would require the approval of the audit committee, optionally based on criteria which may be determined annually in advance by the audit committee. The audit committee charter states that in fulfilling its role the committee is entitled to demand from us any document, file, report or any other information that is required for the fulfillment of its roles and duties and to interview any of our employees or any employees of our subsidiaries in order to receive more details about his or her line of work or other issues that are connected to the roles and duties of the audit committee. Following Amendment 27, a company whose audit committee’s composition meets the requirements set for the composition of a compensation committee (as further detailed below) may have one committee acting as both audit and compensation committee.
78
Nominating Committee
We have a nominating committee comprised of three of our directors, Ms. Irit Ben-Dov, Dr. Ofer Borovsky and Mr. Ofer Tsimchi, each of whom has been determined by our board of directors to be independent under the applicable Nasdaq rules. Our board of directors has adopted a nominating committee charter setting forth the responsibilities of the committee which include, among other responsibilities:
| • |
conduct of the appropriate and necessary inquiries into the backgrounds and qualifications of possible candidates to serve as directors;
|
| • |
review and recommend to the board any nominees for election as directors, including nominees recommended by shareholders, and consideration of the performance of incumbent directors whose terms are expiring in determining whether to nominate them to stand for re-election;
|
| • |
review and recommend to the board regarding board member qualifications, board composition and structure, and recommend if necessary, measures to be taken so that the board reflects the appropriate balance of knowledge, experience, skills, expertise and diversity required for the board; and
|
| • |
perform such other activities and functions as are required by applicable law, stock exchange rules or provisions in our articles of association, or as are otherwise necessary and advisable, in its or the board’s discretion, for the efficient discharge of its duties.
|
Compensation Committee
We have a compensation committee consisting of three of our directors, Dr. Ofer Borovsky, Ms. Irit Ben-Dov and Mr. Ofer Tsimchi, each of whom has been determined by our board of directors to be independent under the applicable Nasdaq rules. Dr. Ofer Borovsky serves as the Chairman of the compensation committee. Our board has adopted a compensation committee charter setting forth the responsibilities of the committee which include, among other responsibilities:
| • |
reviewing and recommending overall compensation policies with respect to our Chief Executive Officer and other office holders;
|
| • |
reviewing and approving corporate goals and objectives relevant to the compensation of our Chief Executive Officer and other office holders including evaluating their performance in light of such goals and objectives and determining their compensation based on such evaluation;
|
| • |
reviewing and approving the granting of options and other incentive awards; and
|
| • |
reviewing, evaluating and making recommendations regarding the compensation and benefits for our non-employee directors.
|
The compensation committee is also authorized to retain and terminate compensation consultants, legal counsel or other advisors to the committee and to approve the engagement of any such consultant, counsel or advisor, to the extent it deems necessary or appropriate.
79
Pursuant to the Companies Law, Israeli public companies are required to appoint a compensation committee comprised of at least three directors, including all of the external directors, who must also constitute a majority of its members. All other members of the compensation committee, who are not external directors, must be directors who receive compensation that is in compliance with regulations promulgated under the Companies Law. In addition, the chairperson of the compensation committee must be an external director. The Companies Law further stipulates that directors who are not qualified to serve on the audit committee, as described above, may not serve on the compensation committee either and that, similar to the audit committee, generally, any person who is not entitled to be a member of the compensation committee may not attend the compensation committee’s meetings.
The responsibilities of the compensation committee under the Companies Law include: (i) making recommendations to the board of directors with respect to the approval of the compensation policy and any extensions thereto; (ii) periodically reviewing the implementation of the compensation policy and providing the board of directors with recommendations with respect to any amendments or updates thereto; (iii) reviewing and resolving whether or not to approve arrangements with respect to the terms of office and employment of office holders; and (iv) resolving whether or not to exempt a transaction with a candidate for chief executive officer from shareholder approval.
Pursuant to the Companies Law, the compensation policy recommended by the compensation committee needs to be approved by the board of directors and the company’s shareholders by a simple majority, provided that (i) such majority includes at least a majority of the shareholders who are not controlling shareholders and who do not have a personal interest in the matter, present and voting (abstentions are disregarded), or (ii) the non-controlling shareholders or shareholders who do not have a personal interest in the matter who were present and voted against the policy, holds two percent or less of the voting power of the company. However, under the Companies Law, if shareholders of the company do not approve the compensation policy, the compensation committee and board of directors may override the shareholders’ decision if each of the compensation committee and board of directors provide detailed reasons for their decision. In addition, pursuant the Companies Law, the compensation policy must be approved, at least once every three years, by the shareholders of the company and the company’s board of directors, after considering the recommendations of the compensation committee.
On December 6, 2016, our shareholders have adopted a new compensation policy (“
Compensation Policy
”), following its approval by our board of directors (per the recommendation of our compensation committee).
Our Compensation Policy includes, among other things, provisions relating to the grant of a base salary, benefits and perquisites, cash bonuses, equity-based compensation and retirement and termination of service arrangements for our executive officers. The Compensation Policy provides, among other things, that: (i) such equity-based compensation is intended to be in a form of share options and/or other equity based awards, such as RSUs and share-based compensation, in accordance with the Company’s equity incentive plan in place as may be updated from time to time; (ii) all equity-based incentives granted to executive officers shall be subject to vesting periods in order to promote long-term retention of the awarded executive officers. Unless determined otherwise in a specific award agreement approved by the compensation committee and the board of directors, grants to executive officers will vest gradually over a period of between three to four years; and (iii) all other terms of the equity awards shall be in accordance with our incentive plans and other related practices and policies. The board of directors may, following approval by the compensation committee, extend the period of time for which an award is to remain exercisable and make provisions with respect to the acceleration of the vesting period of any executive officer’s awards, including, without limitation, in connection with a corporate transaction involving a change of control, subject to any additional approval as may be required by the Companies Law. The Compensation Policy also provides that the equity-based compensation shall be granted from time to time and be individually determined and awarded according to the performance, educational background, prior business experience, qualifications, role and the personal responsibilities of the executive officer. The fair market value of the equity-based compensation for the executive officers will be determined according to acceptable valuation practices at the time of grant.
In addition, pursuant to our articles of association, resolutions of the board of directors will be passed by a special majority of the directors if specifically required so by the Compensation Policy. Our Compensation Policy currently does not contain such a requirement.
80
Strategy Committee
In February 2017, we have established a strategy committee comprised of three of our directors, Mr. Roger Abravanel, Dr. Ariel Halperin and Mr. Dori Brown. Mr. Roger Abravanel serves as the chairman of the strategy committee. The strategy committee will maintain an on-going, cooperative, interactive strategic planning process with our management, including the identification, setting and maintenance of strategic goals and expectations as well as the review of potential acquisitions, joint ventures, and strategic alliances. References to our strategy and strategic planning are intended to focus on our medium and long term initiatives versus day to day operations.
Compensation of Directors and Executive Officers
Directors
. Under the Companies Law, the compensation of our directors requires the approval of our compensation committee, the subsequent approval of the board of directors and, unless exempted under the regulations promulgated under the Companies Law, the approval of the shareholders at a general meeting. If the compensation of our directors is inconsistent with our compensation policy, then, provided that those provisions that must be included in the compensation policy according to the Companies Law have been considered by the compensation committee and board of directors, shareholder approval will also be required, as follows:
| • |
at least a majority of the shares held by all shareholders who are not controlling shareholders and do not have a personal interest in such matter, present and voting at such meeting, are voted in favor of the compensation package, excluding abstentions; or
|
| • |
the total number of shares of non-controlling shareholders and shareholders who do not have a personal interest in such matter voting against the compensation package does not exceed 2% of the aggregate voting rights in the company.
|
Executive Officers other than the Chief Executive Officer
. The Companies Law requires the compensation of a public company’s executive officers (other than the chief executive officer) to be approved by, first, the compensation committee; second by the company’s board of directors and third, if such compensation arrangement is inconsistent with the company’s stated compensation policy, the company’s shareholders (by a special majority vote as discussed above with respect to the approval of director compensation). However, if the shareholders of the company do not approve a compensation arrangement with an executive officer that is inconsistent with the company’s stated compensation policy, the compensation committee and board of directors may override the shareholders’ decision if each of the compensation committee and the board of directors provide detailed reasons for their decision after reconsidering the compensation arrangement, while taking into consideration that the shareholders of the company did not approve the compensation arrangement.
Chief Executive Officer
. The compensation of a public company’s chief executive officer requires the approval of first, the company’s compensation committee; second, the company’s board of directors; and third, the company’s shareholders (by a special majority vote as discussed above with respect to the approval of director compensation). However, if the shareholders of the company do not approve the compensation arrangement with the chief executive officer, the compensation committee and board of directors may override the shareholders’ decision if each of the compensation committee and the board of directors provide a detailed report for their decision. In addition, our Compensation Policy provides that a grant of any compensation to our Chief Executive Officer shall be subject to the approvals required under the Israeli Companies Law.
The compensation committee and board of directors approval should be in accordance with the company’s stated compensation policy; however, in special circumstances, they may approve compensation terms of a chief executive officer that are inconsistent with such policy provided that they have considered those provisions that must be included in the compensation policy according to the Companies Law and that shareholder approval was obtained (by a special majority vote as discussed above with respect to the approval of director compensation). The compensation committee may waive the shareholder approval requirement with regards to the approval of the engagement terms of a candidate for the chief executive officer position, if they determine that the compensation arrangement is consistent with the company’s stated compensation policy, the chief executive officer did not have a business relationship with the company or a controlling shareholder of the company and that having the engagement transaction subject to a shareholder vote would impede the company’s ability to employ the chief executive officer candidate.
81
Notwithstanding the above, the amendment of existing compensation terms of executive officers (including the chief executive officer and excluding officers who are also directors), requires only the approval of the compensation committee, provided that the committee determines that the amendment is not material in relation to the existing terms.
Internal auditor
Under the Companies Law, the board of directors of a public company must appoint an internal auditor based on the recommendation of the audit committee. The role of the internal auditor is, among other things, to examine whether a company’s actions comply with applicable law and orderly business procedure. Under the Companies Law, the internal auditor may not be an interested party or an office holder or a relative of an interested party or of an office holder, nor may the internal auditor be the company’s independent auditor or the representative of the same.
An “interested party” is defined in the Companies Law as (i) a holder of 5% or more of the issued share capital or voting power in a company, (ii) any person or entity who has the right to designate one or more directors or to designate the chief executive officer of the company, or (iii) any person who serves as a director or as a chief executive officer of the company. Our internal auditor is Mr. Ofer Orlitzky of Leon, Orlitzky and Co.
Fiduciary duties and approval of specified related party transactions under Israeli law
Fiduciary duties of office holders
The Companies Law imposes a duty of care and a duty of loyalty on all office holders of a company.
The duty of care of an office holder is based on the duty of care set forth in connection with the tort of negligence under the Israeli Torts Ordinance (New Version) 5728-1968. The duty of care requires an office holder to act with the degree of proficiency with which a reasonable office holder in the same position would have acted under the same circumstances. The duty of care includes, among other things, a duty to use reasonable means, in light of the circumstances, to obtain:
| • |
information on the business advisability of a given action brought for his or her approval or performed by virtue of his or her position; and
|
| • |
all other important information pertaining to such action.
|
The duty of loyalty incumbent on an office holder requires him or her to act in good faith and for the benefit of the company, and includes, among other things, the duty to:
| • |
refrain from any act involving a conflict of interest between the performance of his or her duties in the company and his or her other duties or personal affairs;
|
| • |
refrain from any activity that is competitive with the business of the company;
|
| • |
refrain from exploiting any business opportunity of the company for the purpose of gaining a personal advantage for himself or herself or others; and
|
| • |
disclose to the company any information or documents relating to the company’s affairs which the office holder received as a result of his or her position as an office holder.
|
We may approve an act specified above which would otherwise constitute a breach of the office holder’s duty of loyalty, provided that the office holder acted in good faith, the act or its approval does not harm the company, and the office holder discloses his or her personal interest, including any related material information or document, a sufficient time before the approval of such act. Any such approval is subject to the terms of the Companies Law, setting forth, among other things, the organs of the company entitled to provide such approval, and the methods of obtaining such approval.
Disclosure of personal interest of an office holder and approval of related party transactions
The Companies Law requires that an office holder promptly disclose to the company any personal interest that he or she may have and all related material information or documents relating to any existing or proposed transaction by the company. An interested office holder’s disclosure must be made promptly and in any event no later than the first meeting of the board of directors at which the transaction is considered. An office holder is not obliged to disclose such information if the personal interest of the office holder derives solely from the personal interest of his or her relative in a transaction that is not considered as an extraordinary transaction.
82
Under the Companies Law, once an office holder has complied with the above disclosure requirement, a company may approve a transaction between the company and the office holder or a third party in which the office holder has a personal interest, pursuant to the certain procedures as set forth in the Companies Law. However, a company may not approve a transaction or action that is not to the company’s benefit.
Under the Companies Law, unless the articles of association of a company provide otherwise, a transaction with an office holder or with a third party in which the office holder has a personal interest, which is not an extraordinary transaction, requires the approval by the board of directors. Our articles of association provide that such a transaction, which is not an extraordinary transaction, shall be approved by the board of directors or a committee of the board of directors or any other entity (which has no personal interest in the transaction) authorized by the board of directors. If the transaction considered is an extraordinary transaction with an office holder or a third party in which the office holder has a personal interest, then audit committee approval is required prior to approval by the board of directors. For the approval of compensation arrangements with directors and executive officers, see “— Compensation of Directors and Executive Officers.”
Any person who has a personal interest in the approval of a transaction that is brought before a meeting of the board of directors or the audit committee or the compensation committee may not be present at the meeting or vote on the matter. However, if the chairman of the board of directors, the chairman of the audit committee or the chairman of the compensation committee, as applicable, has determined that the presence of an office holder with a personal interest is required, such office holder may be present at the meeting for the purpose of presenting the matter. Notwithstanding the foregoing, a director who has a personal interest may be present at the meeting of the audit committee or the board of directors and vote on the matter if a majority of the directors or members of the audit committee, as applicable, have a personal interest in the approval of such transaction. If a majority of the directors at a board of directors meeting have a personal interest in the transaction, such transaction also requires approval of the shareholders of the company.
A “personal interest” is defined under the Companies Law as the personal interest of a person in an action or in a transaction of the company, including the personal interest of such person’s relative or the interest of any other corporate body in which the person and/or such person’s relative is a director or general manager, a holder of 5% or more of the issued and outstanding share capital of the company or its voting rights, or has the right to appoint at least one director or the general manager, but excluding a personal interest stemming solely from the fact of holding shares in the company. A personal interest also includes (1) a personal interest of a person who votes according to a proxy of another person, including in the event that the other person has no personal interest, and (2) a personal interest of a person who gave a proxy to another person to vote on his or her behalf regardless of whether the discretion of how to vote lies with the person voting or not.
An “extraordinary transaction” is defined under the Companies Law as any of the following:
| • |
a transaction other than in the ordinary course of business;
|
| • |
a transaction that is not on market terms; or
|
| • |
a transaction that may have a material impact on the company’s profitability, assets or liabilities.
|
Disclosure of personal interests of a controlling shareholder and approval of transactions
The Companies Law also requires that a controlling shareholder promptly disclose to the company any personal interest that he or she may have and all related material information or documents relating to any existing or proposed transaction by the company. A controlling shareholder’s disclosure must be made promptly and in any event no later than the first meeting of the board of directors at which the transaction is considered. See “—Audit committee—Approval of transactions with related parties” for the definition of a controlling shareholder. Extraordinary transactions with a controlling shareholder or in which a controlling shareholder has a personal interest, including a private placement in which a controlling shareholder has a personal interest, and the terms of engagement of the company, directly or indirectly, with a controlling shareholder or a controlling shareholder’s relative (including through a corporation controlled by a controlling shareholder), regarding the company’s receipt of services from the controlling shareholder, and if such controlling shareholder is also an office holder or an employee of the company, regarding his or her terms of service or employment, require the approval of each of (i) the audit committee or the compensation committee with respect to the terms of the engagement of the company, (ii) the board of directors and (iii) the shareholders, in that order. In addition, the shareholder approval must fulfill one of the following requirements:
| • |
a majority of the shares held by shareholders who have no personal interest in the transaction and are voting at the meeting must be voted in favor of approving the transaction, excluding abstentions; or
|
| • |
the shares voted by shareholders who have no personal interest in the transaction who vote against the transaction represent no more than 2% of the voting rights in the company.
|
83
In addition, any extraordinary transaction with a controlling shareholder or in which a controlling shareholder has a personal interest with a term of more than three years requires the approval described above, every three years; however, transactions not involving the receipt of services or compensation can be approved for a longer term, provided that the audit committee determines that such longer term is reasonable under the circumstances.
The Companies Law requires that every shareholder that participates, in person, by proxy or by voting instrument in a vote regarding a transaction with a controlling shareholder, must indicate in advance or in the ballot whether or not that shareholder has a personal interest in the vote in question. Failure to so indicate will result in the invalidation of that shareholder’s vote.
Duties of shareholders
Under the Companies Law, a shareholder has a duty to refrain from abusing its power in the company and to act in good faith and in an acceptable manner in exercising its rights and performing its obligations to the company and to other shareholders, including, among other things, when voting at meetings of shareholders on the following matters:
| • |
an amendment to the articles of association;
|
| • |
an increase in the company’s authorized share capital;
|
| • |
a merger; and
|
| • |
the approval of related party transactions and acts of office holders that require shareholder approval.
|
A shareholder also has a general duty to refrain from discriminating against other shareholders.
The remedies generally available upon a breach of contract will also apply to a breach of the shareholder duties mentioned above, and in the event of discrimination against other shareholders, additional remedies are available to the injured shareholder.
In addition, any controlling shareholder, any shareholder that knows that its vote can determine the outcome of a shareholder vote and any shareholder that, under a company’s articles of association, has the power to appoint or prevent the appointment of an office holder, or any other power with respect to a company, is under a duty to act with fairness towards the company. The Companies Law does not describe the substance of this duty except to state that the remedies generally available upon a breach of contract will also apply in the event of a breach of the duty to act with fairness, taking the shareholder’s position in the company into account.
Approval of private placements
Under the Companies Law and the regulations promulgated thereunder, a private placement of securities does not require approval at a general meeting of the shareholders of a company; provided however, that in special circumstances, such as a private placement completed in lieu of a special tender offer (see “ITEM 10.B: Additional Information—Memorandum and Articles of Association—Acquisitions under Israeli law”) or a private placement which qualifies as a related party transaction (see “—Fiduciary duties and approval of specified related party transactions under Israeli law”), approval at a general meeting of the shareholders of a company is required.
84
Exculpation, insurance and indemnification of office holders
Under the Companies Law, a company may not exculpate an office holder from liability for a breach of the duty of loyalty. An Israeli company may exculpate an office holder in advance from liability to the company, in whole or in part, for damages caused to the company as a result of a breach of duty of care but only if a provision authorizing such exculpation is included in its articles of association. Our articles of association include such a provision. The company may not exculpate in advance a director from liability arising out of a prohibited dividend or distribution to shareholders.
Under the Companies Law and the Securities Law, 5738—1968 (“
Securities Law
”) a company may indemnify an office holder in respect of the following liabilities, payments and expenses incurred for acts performed by him as an office holder, either in advance of an event or following an event, provided its articles of association include a provision authorizing such indemnification:
| • |
a monetary liability incurred by or imposed on him or her in favor of another person pursuant to a judgment, including a settlement or arbitrator’s award approved by a court. However, if an undertaking to indemnify an office holder with respect to such liability is provided in advance, then such undertaking must be limited to certain events, which, in the opinion of the board of directors, can be foreseen based on the company’s activities when the undertaking to indemnify is given, and to an amount or according to criteria determined by the board of directors as reasonable under the circumstances, and such undertaking shall detail the foreseen events described above and amount or criteria;
|
| • |
reasonable litigation expenses, including reasonable attorneys’ fees, incurred by the office holder as a result of an investigation or proceeding instituted against him or her by an authority authorized to conduct such investigation or proceeding, provided that (i) no indictment was filed against such office holder as a result of such investigation or proceeding; and (ii) no financial liability, was imposed upon him or her as a substitute for the criminal proceeding as a result of such investigation or proceeding or, if such financial liability was imposed, it was imposed with respect to an offense that does not require proof of criminal intent or in connection with a monetary sanction;
|
| • |
a monetary liability imposed on him or her in favor of an injured party at an Administrative Procedure (as defined below) pursuant to Section 52(54)(a)(1)(a) of the Securities Law;
|
| • |
expenses incurred by an office holder in connection with an Administrative Procedure under the Securities Law, including reasonable litigation expenses and reasonable attorneys’ fees; and
|
| • |
reasonable litigation expenses, including attorneys’ fees, incurred by the office holder or imposed by a court in proceedings instituted against him or her by the company, on its behalf, or by a third party, or in connection with criminal proceedings in which the office holder was acquitted, or as a result of a conviction for an offense that does not require proof of criminal intent.
|
An “Administrative Procedure” is defined as a procedure pursuant to chapters H3 (Monetary Sanction by the Israeli Securities Authority), H4 (Administrative Enforcement Procedures of the Administrative Enforcement Committee) or I1 (Arrangement to prevent Procedures or Interruption of procedures subject to conditions) to the Securities Law.
Under the Companies Law and the Securities Law, a company may insure an office holder against the following liabilities incurred for acts performed by him or her as an office holder if and to the extent provided in the company’s articles of association:
| • |
a breach of a fiduciary duty to the company, provided that the office holder acted in good faith and had a reasonable basis to believe that the act would not harm the company;
|
| • |
a breach of duty of care to the company or to a third party, to the extent such a breach arises out of the negligent conduct of the office holder;
|
| • |
a monetary liability imposed on the office holder in favor of a third party;
|
| • |
a monetary liability imposed on the office holder in favor of an injured party at an Administrative Procedure pursuant to Section 52(54)(a)(1)(a) of the Securities Law; and
|
| • |
expenses incurred by an office holder in connection with an Administrative Procedure, including reasonable litigation expenses and reasonable attorneys’ fees.
|
85
Under the Companies Law, a company may not indemnify, exculpate or insure an office holder against any of the following:
| • |
a breach of fiduciary duty, except for indemnification and insurance for a breach of the fiduciary duty to the company to the extent that the office holder acted in good faith and had a reasonable basis to believe that the act would not prejudice the company;
|
| • |
a breach of duty of care committed intentionally or recklessly, excluding a breach arising out of the negligent conduct of the office holder;
|
| • |
an act or omission committed with intent to derive illegal personal benefit; or
|
| • |
a fine or forfeit levied against the office holder.
|
Under the Companies Law, exculpation, indemnification and insurance of office holders must be approved by the compensation committee and the board of directors and, with respect to directors or controlling shareholders, their relatives and third parties in which such controlling shareholders have a personal interest, also by the shareholders.
Our articles of association permit us to exculpate, indemnify and insure our office holders to the fullest extent permitted or to be permitted by law. Our office holders are currently covered by a directors and officers’ liability insurance policy. We have agreements with each of our current office holders exculpating them from a breach of their duty of care to us to the fullest extent permitted by law, subject to limited exceptions, and undertaking to indemnify them to the fullest extent permitted by law, subject to limited exceptions, including with respect to liabilities resulting from our IPO to the extent that these liabilities are not covered by insurance. This indemnification is limited to events determined as foreseeable by the board of directors based on our activities, and to an amount or according to criteria determined by the board of directors as reasonable under the circumstances. As of March 2013 the maximum aggregate amount of indemnification that we may pay to our office holders based on such indemnification agreement is the greater of (1) with respect to indemnification in connection with a public offering of our securities, the gross proceeds raised by us and any selling shareholder in such public offering, and (2) with respect to all permitted indemnification, including in connection with a public offering of our securities, an amount equal to the greater of 50% of our shareholders’ equity on a consolidated basis, based on our most recent financial statements made publicly available before the date on which the indemnification payment was made, and $30 million. Such indemnification amounts are in addition to any insurance amounts. Each office holder who previously received an indemnification letter from us and agreed to receive this new letter of indemnification, gave his approval to the termination of all previous letters of indemnification that we have provided to him or her in the past, if any; however, in the opinion of the SEC, indemnification of office holders for liabilities arising under the Securities Act is against public policy and therefore unenforceable.
We previously entered into letters of indemnification with some former office holders that currently remain in effect, and pursuant to which we undertook to indemnify them with respect to certain liabilities and expenses then permitted under the Companies Law, which are similar to those described above. These letters of indemnification are limited to foreseeable events that were determined by the board of directors and indemnity payments are limited to a maximum amount of $2.0 million for one series of related events for each office holder.
As of December 31, 2016, we had 1,434 employees, of whom 700 were based in Israel, including 61 individuals who provide services to us through our manpower agreement with Kibbutz Sdot-Yam and with whom we do not have employment relationships, 476 employees in the United States, including 175 employees in our Richmond Hill facility, 105 employees in Australia, 122 in Canada, 23 in Asia and 8 in the United Kingdom. The following table shows the breakdown of our global workforce by category of activity as of December 31 for the past three fiscal years:
|
As of December 31,
|
||||||||||||
|
Department
|
2016
|
2015
|
2014
|
|||||||||
|
Manufacturing and operations
|
905
|
802
|
659
|
|||||||||
|
Research and development
|
15
|
15
|
14
|
|||||||||
|
Sales, marketing, service and support
|
375
|
325
|
318
|
|||||||||
|
Management and administration
|
139
|
140
|
117
|
|||||||||
|
Total
|
1,434
|
1,282
|
1,108
|
|||||||||
The growth in the size of our global workforce by 152 employees in 2016 is related primarily to the expansion of our sales and distribution operations in North America and our increased manufacturing capacity. The growth in the size of our global workforce by 174 employees in 2015 is related primarily to capacity expansion in our manufacturing facility in the United States, and to a lesser extent, to the expansion of our sales and distribution operations in North America. The growth in the size of our global workforce by 122 employees in 2014 is related mainly to demand brought on by our additional manufacturing capacity in Israel and in the United States, as well as to the expansion of our sales and distribution operations in North America.
Israeli labor laws (applicable to our Israeli employees) govern the length of the workday, minimum wages for employees, procedures for hiring and dismissing employees, determination of severance pay, annual leave, sick days, advance notice of termination of employment, equal opportunity and anti-discrimination laws and other conditions of employment. Subject to certain exceptions, Israeli law generally requires severance pay upon the retirement, death or dismissal of an employee, and requires us and our employees to make payments to the NII, which is similar to the U.S. Social Security Administration. Our employees have pension plans in accordance with the applicable Israeli legal requirements.
86
None of our employees work under any collective bargaining agreements. Extension orders issued by the Israeli Ministry of Economy and Industry apply to us and affect matters such as cost of living adjustments to salaries, length of working hours and week, recuperation pay, travel expenses, and pension rights. We have never experienced labor-related work stoppages or strikes and, while there can be no assurance that we will not experience any, we believe that our relations with our employees are satisfactory.
Beneficial Ownership of Executive Officers and Directors
The following table sets forth certain information regarding the beneficial ownership of our ordinary shares as of March 1, 2017, of each of our directors and executive officers.
|
Name of Beneficial Owner
|
Number of Shares
Beneficially Held
(1)
|
Percent of
Class
|
||||||
|
Executive Officers
|
||||||||
|
Raanan Zilberman
(2)
|
—
|
—
|
||||||
|
Yair Averbuch
|
*
|
*
|
||||||
|
David Cullen
|
*
|
*
|
||||||
|
Daniel Clifford
|
*
|
*
|
||||||
|
Ken Williams
|
*
|
*
|
||||||
|
Michal Baumwald Oron
|
*
|
*
|
||||||
|
Eli Feiglin
|
*
|
*
|
||||||
|
Shmuel Moran
|
*
|
*
|
||||||
|
Erez Margalit
|
*
|
*
|
||||||
|
Lilach Gilboa
|
*
|
*
|
||||||
|
Directors
|
||||||||
|
Dr. Ariel Halperin
|
—
|
—
|
||||||
|
Irit Ben- Dov
|
—
|
—
|
||||||
|
Dr. Ofer Borovsky
|
—
|
—
|
||||||
|
Roger Abravanel
|
—
|
—
|
||||||
|
Dori Brown
|
—
|
—
|
||||||
|
Eric D. Herschmann
|
—
|
—
|
||||||
|
Ronald Kaplan
|
—
|
—
|
||||||
|
Ofer Tsimchi
|
—
|
—
|
||||||
|
Amit Ben Zvi
|
—
|
—
|
||||||
|
—
|
—
|
|||||||
|
All current directors and executive officers as a group (
19
persons)
|
433,500
|
1.2
|
%
|
|||||
| * |
Less than one percent of the outstanding ordinary shares.
|
(1) As used in this table, “beneficial ownership” means the sole or shared power to vote or direct the voting or to dispose or direct the disposition of any security. For purposes of this table, a person is deemed to be the beneficial owner of securities that can be acquired within 60 days from March 1, 2017, through the exercise of any option or warrant. Ordinary shares subject to options that are currently exercisable or exercisable within 60 days, or other awards that are convertible into our ordinary shares within 60 days, are deemed outstanding for computing the ownership percentage of the person holding such options or other agreements, but are not deemed outstanding for computing the ownership percentage of any other person. The amounts and percentages are based upon 34,321,573 ordinary shares outstanding as of March 1, 2017.
(2) Raanan Zilberman joined us as the Company’s Chief Executive Officer on March 1, 2017.
All of our shareholders, including the shareholders listed above, have the same voting rights attached to their ordinary shares. See “ITEM 10.B: Additional Information—Memorandum and Articles of Association —Voting.”
Our directors and executive officers hold, in the aggregate, options and RSUs exercisable for 753,500 ordinary shares (including 47,500 RSUs), as of March 1, 2017. The options have a weighted average exercise price of $34.76 per share and the RSUs have a weighted average fair value of $33.14 and have expiration dates generally seven years after the grant date of the option.
87
The following table sets forth certain information regarding the beneficial ownership of our outstanding ordinary shares as of the date indicated below, by each person who we know beneficially owns 5.0% or more of the outstanding ordinary shares. For information on the beneficial ownership of each of our directors and executive officers individually and as a group, see “ITEM 6.E: Directors, Senior Management and Employees—Share Ownership.”
Beneficial ownership of ordinary shares is determined in accordance with the rules of the SEC and generally includes any ordinary shares over which a person exercises sole or shared voting or investment power, or the right to receive the economic benefit of ownership. For purposes of the table below, we deem shares subject to options or other agreements that are currently exercisable or exercisable within 60 days of March 1, 2017, to be outstanding and to be beneficially owned by the person holding the options for the purposes of computing the percentage ownership of that person but we do not treat them as outstanding for the purpose of computing the percentage ownership of any other person. The amounts and percentages are based upon 34,321,573 ordinary shares outstanding as of March 1, 2017.
All of our shareholders, including the shareholders listed below, have the same voting rights attached to their ordinary shares. See “ITEM 10.B: Additional Information—Memorandum and Articles of Association —Voting.”
A description of any material relationship that our principal shareholders have had with us or any of our predecessors or affiliates within the past three years is included below under “—Related Party Transactions.”
|
Name of Beneficial Owner
|
Number of
Shares Beneficially Owned |
Percentage of
Shares Beneficially Held |
||||||
|
Mifalei Sdot-Yam Agricultural Cooperative Society Ltd.
(1)(3)
|
11,440,000
|
33.3
|
%
|
|||||
|
Tene Investment in Projects 2016, L.P.
(2)(3)
|
11,440,000
|
33.3
|
%
|
|||||
|
Baron Capital Group, Inc.
(4)
|
2,991,314
|
8.1
|
%
|
|||||
|
Joho Capital L.L.C.
(5)
|
2,572,130
|
7.5
|
%
|
|||||
|
Vaughan Nelson Investment Management
(6)
|
1,822,817
|
5.3
|
%
|
|||||
(1) Based on a Schedule 13D/A filed by Mifalei Sdot-Yam Agricultural Cooperative Society Ltd.
("
Mifalei Sdot-Yam
")
on October 26, 2016, Mifalei Sdot-Yam is controlled by Sdot Yam Business, Holding and Management – agricultural cooperative society Ltd., which is turn controlled by Kibbutz Sdot-Yam.
Mifalei Sdot-Yam holds voting and dispositive power over 11,440,000 ordinary shares, including shared voting power, over 11,440,000 ordinary shares and sole dispositive power over 10,440,000 ordinary shares
. No individual member of Mifalei Sdot-Yam has dispositive power or casting vote over the ordinary shares. The Economic Council elected by the members of Kibbutz Sdot-Yam manages the economic activities and strategy of Kibbutz Sdot-Yam. The Economic Council takes its decisions by majority vote and currently has eleven members, including Amit Ben-Zvi (substitute Chairman), who is a director on our board
.
The address of Kibbutz Sdot-Yam is MP Menashe 3780400, Israel. Our board of directors operates independently from the Economic Council.
88
Kibbutz Sdot-Yam is a communal society, referred to in Hebrew as a “kibbutz” (plural “kibbutzim”) with approximately 460 members and an additional 350 residents located in Israel on the Mediterranean coast between Tel Aviv and Haifa. Established in 1940, Kibbutz Sdot-Yam is a largely self-governed community of members who share certain social ideals and professional interests on a communal basis. Initially, the social idea behind the formation of the kibbutzim in Israel was to create a communal society in which all members share equally in all of the society’s resources and which provides for the needs of the community. Over the years, the structure of the kibbutzim has evolved, and today there are a number of different economic and social arrangements adopted by various kibbutzim.
Today, each member of Kibbutz Sdot-Yam continues to own an equal part of the assets of the Kibbutz. The members of Kibbutz Sdot-Yam are engaged in a number of economic activities, including agriculture, industrial operations and outdoor venue operations. A number of Kibbutz members are engaged in professions outside the Kibbutz. The Kibbutz is the owner and operator of several private companies. The Kibbutz community holds in common all land, buildings and production assets of these companies.
Some of the members of Kibbutz Sdot-Yam work in one of the production activities of Kibbutz Sdot-Yam, according to the requirements of Kibbutz Sdot-Yam and the career objectives of the individual concerned. Other members work outside of Kibbutz Sdot-Yam in businesses owned by other entities. Each member receives income based on the position the member holds and his or her economic contribution to the community, as well as on the size and composition of his or her family. Each member’s income depends on the income of Kibbutz Sdot-Yam from its economic activities. Each member has a personal pension fund that is funded by Kibbutz Sdot-Yam, and all accommodation, educational, health and old age care services, as well as social and municipal services, are provided either by or through Kibbutz Sdot-Yam and are subsidized by Kibbutz Sdot-Yam.
The elected Economic Council is the key economic decision-making body of Kibbutz Sdot-Yam. Kibbutz Sdot-Yam also has a General Secretary (chairman) and other senior officers, all of whom are elected by the members of Kibbutz Sdot-Yam at its General Meeting for terms of seven years. A meeting of the members of the Kibbutz may remove a member of the Economic Council by simple majority vote.
As of December 31, 2016, 61 of our employees, or 4.3% of our total workforce, are also members of Kibbutz Sdot-Yam.
(2) Based on a Schedule 13D/A filed on October 26, 2016, Tene Investment in Projects 2016, L.P. (“
Tene
”
) has voting and dispositive power over 3,000,000 ordinary shares, consisting of (i) 1,000,000 ordinary shares, which it directly owns, and (ii) 2,000,000 ordinary shares underlying an immediately exercisable call option (“
Call Option
”)
from Mifalei Sdot-Yam, which it directly owns pursuant to the Shareholders’ Agreement (as defined below) with Mifalei Sdot-Yam.
Pursuant to the Shareholders’ Agreement, Tene also shares voting power over 10,440,000 Ordinary Shares beneficially owned by Mifalei Sdot Yam. Dr. Ariel Halperin is the sole director of
Tene Growth Capital III (G.P.) Company Ltd. (“
Tene III
”), which is the general partner of Tene Growth Capital 3 (Fund 3 G.P.) Projects, L.P (“
Tene III Projects
”), which is the general partner of Tene. Dr. Halperin is also a member of our board of directors. Each of Dr. Halperin, Tene III and Tene III Projects may thus be deemed to share voting power over the 11,440,000 ordinary shares and dispositive power over the 3,000,000 ordinary shares, in each case, beneficially owned by Tene.
89
(3) On October 13, 2016, based on approval from the Israeli Antitrust Commission, Mifalei Sdot-Yam and Tene entered into the shareholders’ agreement (“
Shareholders’ Agreement
”), the terms of which were memorialized in a term sheet signed by Mifalei Sdot-Yam and Tene on September 5, 2016. Pursuant to the Shareholders’ Agreement:
| · |
The parties agreed to vote at general meetings of our shareholders in the same manner, following discussions intended to reach an agreement on any matters proposed to be voted upon, with Tene determining the manner in which both parties will vote if no agreement is reached, except with respect to certain carved-out matters, with respect to which Mifalei Sdot-Yam will determine the manner in which both parties will vote if no agreement is reached.
|
| · |
The parties agreed to use their best efforts to prevent any dilutive transactions that would reduce Mifalei Sdot-Yam’s holdings in us below 26% on a fully diluted basis, provided that such agreement will not apply as of the date on which the percentage of Mifalei Sdot-Yam’s holdings decreases below 26% of our outstanding shares on a fully diluted basis, for any reason whatsoever, or if Mifalei Sdot-Yam receives a satisfactory written certification from the Israel Land Authority permitting Mifalei Sdot-Yam’s holdings in us to decrease below 26%. Subject to certain exceptions, Mifalei Sdot-Yam will also continue to hold at least 6,850,000 of our ordinary shares for the five-year term of the Shareholders’ Agreement, and in no case fewer than the number of ordinary shares that would permit Tene to exercise the Call Option in full.
|
| · |
The parties agreed to use their best efforts to cause that at least four directors be elected to our board (one identified by Mifalei Sdot-Yam, two identified by Tene and another identified by Mifalei Sdot-Yam with Tene’s consent), provided that the parties will not propose a resolution at a general meeting of our shareholders that will contradict a recommendation of our board on elections.
|
| · |
The parties granted each other certain tag-along rights with respect to their dispositions of ordinary shares.
|
(4) Based on a Schedule 13G/A filed with the SEC on February 14, 2017 by Baron Capital Group, Inc., as of December 31, 2016, BAMCO, Inc. holds shared voting power over
2,425,000
shares and shared dispositive power over
2,786,500 shares
; Baron Capital Group, Inc. holds shared voting power over
2,629,814
shares and shared dispositive power over
2,991,314
shares; Baron Capital Management, Inc. holds shared voting and dispositive power over
204,814
shares; and Ronald Baron holds shared voting power over
2,629,814
shares and shared dispositive power over
2,991,314
shares. BAMCO, Inc. and Baron Capital Management, Inc. are subsidiaries of Baron Capital Group, Inc. and Ronald Baron owns a controlling interest in Baron Capital Group, Inc. The address of each holder is 767 Fifth Avenue, 49th Floor, New York, New York 10153.
(5) Based on Schedule 13G/A filed with the SEC on February 13, 2017, as of December 31, 2016, Joho Capital L.L.C. and Robert Karr share voting and dispositive power of 2,016,668 ordinary shares. The address of both Joho Capital L.L.C. and Mr. Karr is 55 East 59th Street, 15th Floor, New York, NY 10022.
(6) Based on Schedule 13G/A filed with the SEC on February 13, 2017, as of December 31, 2016, each of Vaughan Nelson Investment Management, L.P. and its general partner Vaughan Nelson Investment Management, Inc. has sole voting power of 1,612,800 ordinary shares, sole dispositive power of 1,707,175 ordinary shares and shared dispositive power over 115,642 ordinary shares. The address of Vaughan Nelson Investment Management, L.P. and Vaughan Nelson Investment Management, Inc. is 600 Travis Street, Suite 6300, Houston, Texas 77002.
Changes in Ownership
Prior to our IPO in March 2012, Kibbutz Sdot-Yam owned 18,715,000, or 70.1% of our ordinary shares. After the IPO, due to our issuance of ordinary shares, the Kibbutz’s ownership in our ordinary shares decreased to 56.1%. As a result of two subsequent public offerings of ordinary shares completed in 2013 and 2014, the Kibbutz sold 6,325,000 of the 17,765,000 ordinary company shares it owned, decreasing its ownership percentage to 32.8% after those offerings. Pursuant to the Shareholders’ Agreement, effective October 13, 2016, the Kibbutz sold Tene 1,000,000 of its 11,440,000 ordinary shares and granted Tene the Call Option to purchase 2,000,000 ordinary shares. T
he parties also agreed to vote at general meetings of the shareholders of the Company together, such that they share voting power over 11,440,000 ordinary shares. As a result, as of March 1, 2017, the Kibbutz and Tene each beneficially owned 33.3% of our ordinary shares.
As of December 31, 2016, FMR, LLC had sold all 3,528,659 ordinary shares, or
10.3% of our ordinary shares, which it had previously beneficially owned.
90
Registered Holders
Based on a review of the information provided to us by our transfer agent, as of March 1, 2017, there were three registered holders of our ordinary shares, one of which (Cede & Co., the nominee of the Depositary Trust Company) is a United States registered holder, holding approximately 66.7% of our outstanding ordinary shares.
Related Party Transactions Policy
On May 25, 2014, our audit committee adopted a policy, which lays out the procedures for approving transactions with our controlling shareholders, currently Kibbutz Sdot-Yam and Tene, and certain of our office holders and other related persons. Pursuant to this policy, as required by the Companies Law, for each transaction with our controlling shareholder or transactions in which our controlling shareholder has a personal interest as well as transactions with our office holders or transactions in which our office holders have a personal interest, our audit committee is required to determine whether such transaction is an extraordinary transaction and, with respect to controlling shareholder transactions only, whether it is a negligible transaction. Subject to our audit committee’s determination, negligible transactions and non-extraordinary transactions are subject to a competitive procedure comprised of obtaining two third-party quotes for such transaction and additional requirements as required by the Companies Law. An extraordinary transaction, which is not negligible, is subject, generally, to a tender in addition to the approvals required by the Companies Law. In addition, this policy determines certain transactions with our controlling shareholder as negligible and non-extraordinary transactions which are ongoing transactions but are required to be approved on an annual basis. Pursuant to this policy, we have, and may in the future, engage in transactions with our controlling shareholder and officeholders including with respect to services consumed by us for our operational needs as well as contribute donations to associations in which our controlling shareholder or shareholders has or have a personal interest.
Relationship and agreements with Kibbutz Sdot-Yam
We have entered into certain agreements with Kibbutz Sdot-Yam pursuant to which Kibbutz Sdot-Yam provides us with, among other things, a portion of our labor force, electricity, maintenance, and other services.
Pursuant to certain of these agreements, in consideration for using facilities licensed to us or for services provided by Kibbutz Sdot-Yam, we paid the Kibbutz an aggregate of $9.7 million in 2016, $11.1 million in 2015 and $12.2 million in 2014 (excluding VAT), as set forth in more detail below. The decrease in the amount paid in 2016 is mainly as a result of certain services previously received from the Kibbutz and in 2016 received from other third parties. We believe that these services are rendered to us in the ordinary course of our business and that they represent terms no less favorable than those that would have been obtained from an unaffiliated third party. Nevertheless, a determination with respect to such matters requires subjective judgments regarding valuations, and regulators and other third parties may question whether our agreements with Kibbutz Sdot-Yam are no less favorable to us than if they had been negotiated with unaffiliated third parties. As described below, in March 2012, in connection with the closing of our IPO, certain of our agreements with Kibbutz Sdot-Yam terminated and a new set of agreements became effective.
Under the Companies Law, our audit committee, board of directors and shareholders are required to approve every three years any extraordinary transaction in which a controlling shareholder has a personal interest and that has a term of more than three years, unless the company’s audit committee, constituted in accordance with the Companies Law, determines, solely with respect to agreements that do not involve compensation to a controlling shareholder or his or her relatives, in connection with services rendered by any of them to the company or their employment with the company, that a longer term is reasonable under the circumstances. Our audit committee has determined that the term of all the agreements entered into between us and Kibbutz Sdot-Yam are reasonable under the relevant circumstances, except for part of our manpower agreement entered into between Kibbutz Sdot-Yam and us on January 1, 2011, as amended on July 30, 2015, as it relates to office holders, and the services agreement entered into between Kibbutz Sdot-Yam and us on July 20, 2011, as amended on February 13, 2012 and July 30, 2015.
References below to VAT are to the Israeli value added tax the rate for which is as of the date of this filing is 17%.
91
Land use agreement
Land leased to Kibbutz Sdot-Yam by the ILA and the Caesarea Development Corporation
Our headquarters and research and development facilities, as well as one of our two manufacturing facilities, are located on the grounds at Kibbutz Sdot-Yam and include 30,344 square meter of facility and 60,870 square meter of un-covered yard. The headquarters and facilities are located on lands title to which is held by the ILA, and which are leased or subleased to Kibbutz Sdot-Yam pursuant to the following agreements: (i) a 49-year lease from the ILA signed in July 1978 that commenced in 1962 and expired in 2011 and has been extended pursuant to an option in the agreement for an additional 49 years, and (ii) a new agreement entered into in April 2014 between Kibbutz Sdot-Yam and the Caesarea Development Corporation pursuant to which Kibbutz Sdot-Yam leases the relevant premises (including such premises which are leased by the Kibbutz to us) from the Caesarea Development Corporation until year 2037. Additionally, Kibbutz Sdot-Yam has been negotiating the renewal of a long-term lease agreement with the ILA which expired in 2009. After a series of discussions with the ILA to renew this expired agreement, on February 21, 2017, the District Court approved a settlement between the parties, pursuant to which the Kibbutz is entitled to a new lease agreement for a period of 49 years, with an option to renew for additional 49 years. As of the date of this report, the parties are in the process of finalizing the terms of the lease agreement. To date, the expiration of this lease agreement has not had any impact on our ability to use the facilities located on the property subject to the leases. The ILA may terminate its leases with Kibbutz Sdot-Yam in certain circumstances, including if Kibbutz Sdot-Yam commences proceedings to disband or liquidate or in the event that Kibbutz Sdot-Yam ceases to be a “kibbutz” as defined in the lease (meaning, a registered cooperative society classified as a kibbutz). The ILA may, from time to time, change its regulations governing the lease agreements, and these changes could affect the terms of the land use agreement, as amended, including the provisions governing its termination.
Kibbutz Sdot-Yam currently permits us to use the land and facilities pursuant to a land use agreement which became effective in March 2012 and expires in 20 years thereafter. Under the land use agreement, Kibbutz Sdot-Yam agreed to permit us to use approximately 100,000 square meters of land leased to the Kibbutz, consisting both of facilities and unbuilt areas, in consideration for an annual fee of NIS12.9 million ($3.5 million) in 2013 and thereafter, plus VAT, and beginning in 2013, adjusted every six months based on any increase of the Israeli consumer price index compared to the index as of January 2011. The annual fee may be adjusted after January 1, 2021 or after January 1, 2018 if the Kibbutz is required to pay significantly higher lease fees to the ILA or Caesarea Development Corporation, and every three years thereafter if Kibbutz Sdot-Yam chooses to obtain an appraisal. The appraiser will be mutually agreed upon or, in the absence of agreement, will be chosen by Kibbutz Sdot-Yam out of the list of appraisers recommended at that time by Bank Leumi Le-Israel B.M. (“
Bank Leumi
”). Every addition or deletion of space is accounted for based on the original rates mentioned above.
In addition, in the land use agreement, we have waived any claims for payment of NIS 18.0 million ($4.6 million) from Kibbutz Sdot-Yam with respect to prior investments in infrastructure on Kibbutz Sdot-Yam’s lands used by us under the prior land use agreement.
Starting from January 1, 2014 and through September 2016, we made use as needed of additional office space in Kibbutz Sdot-Yam of approximately 400 square meters, for an annual payment of NIS 77,956 (approximately $20,000) in 2014, NIS 116,643 (approximately $30,000) in 2015 and 2016. Such additional area was used by us as long as we needed it under terms materially similar to the land use agreement. In September 2016, we exercised our right to return such premises to the Kibbutz. Starting from September 2014, we use an additional approximately 9,000 square meters based on our needs and Kibbutz Sdot-Yam’s consent under terms materially similar to the land use agreement, for an additional monthly fee of NIS 10,000 (approximately $2,570) which is not based on the original rates. However, we have the right to return these premises to Kibbutz Sdot-Yam earlier, following a 90-day prior written notice.
Under the land use agreement, we may not terminate the operation of either of our two production lines at our plant in Kibbutz Sdot-Yam as long as we continue to operate production lines elsewhere in Israel, and our headquarters must remain at Kibbutz Sdot-Yam. Furthermore, we may not decrease or return to Kibbutz Sdot-Yam any part of the land underlying the land use agreement, except upon one year’s advance written notice with regards to a certain unbuilt area, subject to certain conditions. In addition, subject to limitations, we may be able to sublease lands. Kibbutz Sdot-Yam will have three months to accept or reject a request for sublease, in its sole discretion, provided that if it does not respond within such three-month period, then we will be entitled to sublease such lands to a person approved in advance by Kibbutz Sdot-Yam. In such event, we will continue to be liable to Kibbutz Sdot-Yam with respect to such lands. Pursuant to the land use agreement, subject to certain exceptions, if we need additional facilities on the land that we are permitted to use in Kibbutz Sdot-Yam, subject to obtaining the permits required by law, Kibbutz Sdot-Yam will build such facilities for us by using the proceeds of a loan that we will make to Kibbutz Sdot-Yam, which loan shall be repaid to us by off-setting the monthly additional payment that we would pay for such new facilities and, if not fully repaid during the lease term, upon termination thereof.
92
We have committed to fund the cost of the construction, up to a maximum of NIS 3.3 million ($0.8 million) plus VAT, required to change the access road leading to Kibbutz Sdot-Yam and our facilities, such that the entrance to our facilities will be separated from the entrance into Kibbutz Sdot-Yam. In addition, we committed to pay NIS 200,000 (approximately $51,000) plus VAT to cover the cost of paving an area of land leased from Kibbutz Sdot-Yam with such payment deducted in monthly installments over a four-year period beginning in 2013 from the lease payments to be made to Kibbutz Sdot-Yam under the land use agreement related to our Sdot-Yam facility.
While Kibbutz Sdot-Yam is responsible under the agreement for obtaining various licenses, permits, approvals and authorizations necessary for use of the property, we have waived any monetary recourse against Kibbutz Sdot-Yam for failure to receive such licenses, permits, approvals and authorizations.
Pursuant to an agreement dated January 4, 2012, for the settlement of reimbursement for building expenses incurred by us from January 2012, an annual amount of NIS 82,900 (approximately $24,000) will be deducted from the land use fees until year 2020.
Pursuant to these land use agreements, we paid to Kibbutz Sdot-Yam an aggregate of $3.3 million in 2016, $3.6 million in 2015 and $3.9 million in 2014.
93
Land purchase and leaseback agreement
Pursuant to a land purchase and leaseback agreement, dated as of March 31, 2011, as amended on February 13, 2012, between Kibbutz Sdot-Yam and us, Kibbutz Sdot-Yam acquired from us in September 2012 our rights in the lands and facilities of the Bar-Lev Industrial Center in consideration for approximately NIS 43.7 million ($10.9 million). Pursuant to the land purchase and leaseback agreement, we were required to obtain certain third-party consents from, among others, the Israeli Tax Authorities and from the Israeli Investment Center. All such consents have been obtained. The land purchase and leaseback agreement was executed simultaneously with the execution of a land use agreement. Pursuant to the land use agreement, Kibbutz Sdot-Yam permits us to use the Bar-Lev land for a period of 10 years commencing in September 2012 that will be automatically renewed unless we give two years prior notice, for an additional 10-year term in consideration for an annual fee of NIS 4.1 million ($1.1 million) to be linked to the increase of the Israeli consumer price index. The fee is subject to adjustment following January 1, 2021 and every three years thereafter at the option of Kibbutz Sdot-Yam if the Kibbutz obtains an appraisal that supports such an increase. The appraiser will be mutually agreed upon or, in the absence of agreement, will be chosen by Kibbutz Sdot-Yam from a list of assessors recommended at that time by Bank Leumi.
Under the land use agreement, we may not decrease or return to Kibbutz Sdot-Yam any part of the land underlying the land use agreement; however, subject to several limitations, we may be able to sublease such lands to a person approved in advance by Kibbutz Sdot-Yam. We may assign our right under the land use agreement pursuant to a merger with a third party and to any corporation under our control. In such event, we will continue to be liable to Kibbutz Sdot-Yam with respect to such lands. In addition, subject to certain exceptions, if we need additional facilities on the land that we are permitted to use by Kibbutz Sdot-Yam, subject to obtaining the permits required by law, Kibbutz Sdot-Yam will build such facilities for us by using the proceeds of a loan that we will make to Kibbutz Sdot-Yam, which loan shall be repaid to us by off-setting the monthly additional payment that we would pay for such new facilities and, if not fully repaid during the lease term, upon termination thereof.
94
Agreement for Arranging for Additional Accord
Pursuant to the Agreement For Arranging For Additional Accord, dated as of July 20, 2011, if we wish to acquire or lease any additional lands, whether on the grounds of our Bar-Lev manufacturing facility, or elsewhere in Israel, for the purpose of establishing new manufacturing facilities or production lines: (i) Kibbutz Sdot-Yam will purchase the land and build the required facilities’ structure on such land at its own expense in accordance with our needs; (ii) we will perform any necessary building adjustments at our expense; and (iii) Kibbutz Sdot-Yam will lease the land and the facility to us under a long-term lease agreement with terms to be negotiated in accordance with the then prevailing market price. In addition, under this agreement, Kibbutz Sdot-Yam has agreed not to compete with us as long as it holds more than 10% of our shares. The agreement terminates on October 20, 2017.
Agreement for Additional Land on the Grounds Near Our Bar-Lev Manufacturing
Facility
Pursuant to the Agreement For Arranging For Additional Accord, we entered into the Agreement For Additional Land, in August 2013, pursuant to which Kibbutz Sdot-Yam acquired additional land of approximately 12,800 square meters on the grounds near our Bar-Lev manufacturing facility, which we required in connection with the construction of the fifth production line at our Bar-Lev manufacturing facility and leased it to us for a monthly fee of approximately NIS 70,000 (approximately $18,000), in accordance with the terms of the Agreement For Arranging For Additional Accord. Under the agreement, Kibbutz Sdot-Yam committed to (i) acquire the long-term leasing rights of the Additional Bar-Lev Land from the ILA, (ii) perform preparation work and construction, in conjunction with the administrative body of Bar-Lev industrial park and other contractors according to our plans, (iii) build a warehouse according our plans, and (iv) obtain all permits and approvals required for performing the preparation work of the Additional Bar-Lev Land and for the building of the warehouse. The warehouse in Bar-Lev will be situated both on the current and new land. The financing of the building of the warehouse is to be made through a loan that will be granted by us to Kibbutz Sdot-Yam, in the amount of the total cost related to the building of the warehouse, and such loan, including principle and interest, shall be repaid by setoff of the lease due to Kibbutz Sdot-Yam by us for our use of the warehouse. The principal amount of the loan will bear interest at a rate of 5.3% a year. On November 30, 2015 the land preparation work had been completed and the holding of the Additional Bar-Lev Land was delivered to us. The construction of the warehouse has not started yet.
Pursuant to the land purchase and leaseback agreement and agreement for additional land in connection with our Bar-Lev facility, we paid to Kibbutz Sdot-Yam an aggregate of $1.3 million in 2016, $1.1 million in 2015 and $1.1 million in 2014.
Manpower agreement
In March 2001, we entered into a manpower agreement with Kibbutz Sdot-Yam, which was amended in December 2006. Pursuant to the agreement, Kibbutz Sdot-Yam agreed to provide us with labor services staffed by Kibbutz members, candidates for Kibbutz membership and Kibbutz residents (each a “
Kibbutz Appointee
”). This agreement was replaced by a new manpower agreement, signed on July 20, 2011, with a term of 10 years from January 1, 2011 that will be automatically renewed, unless one of the parties gives six months’ prior notice, for additional one-year periods. Our audit committee has determined that the term of the manpower agreement with Kibbutz Sdot-Yam is reasonable under the relevant circumstances except as it relates to office holders. Accordingly, under the Companies Law, the manpower agreement, with respect to office holders, is subject to re-approval by our audit committee, board of directors and general meeting every three years. On July 30, 2015, following the approval of our audit committee, compensation committee and board of directors, our shareholders approved an addendum to the Manpower Agreement between us and Kibbutz Sdot-Yam, with respect to the engagement of office holders affiliated with Kibbutz Sdot-Yam, for an additional three-year term as of the date of approval by the shareholders.
Under the manpower agreement and addendum thereto (“
manpower agreement
”), Kibbutz Sdot-Yam provides us with labor services staffed by Kibbutz Appointees. The consideration to be paid for each Kibbutz Appointee is based on our total cost of employment for a non-Kibbutz Appointee employee performing a similar role. The number of Kibbutz Appointees may change in accordance with our needs. Under the manpower agreement, we will notify Kibbutz Sdot-Yam of any roles that require staffing, and if the Kibbutz offers candidates with skills similar to other candidates, we will give preference to the hiring of the relevant Kibbutz members. Kibbutz Sdot-Yam is entitled under the manpower agreement, at its sole discretion, to discontinue the engagement of any Kibbutz Appointee of manpower services through his or her employment by Kibbutz Sdot-Yam and require such appointee to become employed directly by us.
Under the manpower agreement, we will contribute monetarily to assist with the implementation of a professional reserve plan to encourage young Kibbutz members to obtain the necessary education for future employment with us. We will provide up to NIS 250,000 (approximately $64,000) per annum for this plan linked to changes in the Israeli consumer price index plus VAT. We will also implement a policy that prioritizes the hiring of such young Kibbutz members as our employees upon their graduation. Office holders who are Kibbutz Appointees have all benefits then provided to our other office holders, including without limitation, directors’ and officers’ liability insurance, and Company's indemnification and exemption undertaking
.
Pursuant to the manpower agreement, we paid to Kibbutz Sdot-Yam an aggregate of $3.3 million in 2016, $3.4 million in 2015 and $3.9 million in 2014. As of December 31, 2016, we engaged 61 Kibbutz Appointees on a permanent basis.
95
Services agreement
On July 20, 2011, we entered into a services agreement with Kibbutz Sdot-Yam, as amended on February 13, 2012 (“
original services agreement
”). Pursuant to the agreement, the Kibbutz provided us with various services related to our operational needs. The original services agreement also outlined the distribution mechanism between us and Kibbutz Sdot-Yam, for certain expenses and payments due to local authorities, such as taxes and fees in connection with our business facilities. The agreement expired on March 21, 2015.
On July 30, 2015, following the approval of our audit committee and the board, our shareholders approved an amended services agreement (“
amended services agreement
”). Under the amended services agreement, Kibbutz Sdot-Yam will continue to provide us with various services it provides in the ordinary course of our business, for a period of three years commencing as of the date of approval by the shareholders. The amended services agreement grants Kibbutz Sdot-Yam a right of first refusal with respect to such services following a review procedure that we are entitled to conduct once a year. Under this review procedure, we may seek independent third-party proposals through a competitive bidding process, in order to verify that the Kibbutz’s services are provided at market terms. The amount that we pay Kibbutz Sdot-Yam under the amended services agreement depends on the scope of services we will receive and is based on rates specified in such agreement which were determined based on market terms, taking into account the added value of consuming services from Kibbutz Sdot-Yam, considering its physical proximity to our manufacturing plant in Sdot-Yam and its expertise. The amounts we pay for the services are subject to certain adjustments for increases in the Israeli consumer price index. In addition, the amended services agreement grants Kibbutz Sdot-Yam the right to adjust the rates of the metal workshop services and the meals it provides to our employees once a year, in the event that raw material prices related to such services significantly increase during the term of the agreement. In such case, we are entitled to conduct a review procedure with respect to such services, in which the Kibbutz shall have the right of first refusal to provide the services on terms identical to the best terms offered to us by a third party bidder. Each party may terminate such agreement upon a material breach, following a 30-day prior notice, or upon liquidation of the other party, following a 45-days’ prior notice. Pursuant to the original services agreement and the amended services agreement, we paid to Kibbutz Sdot-Yam an aggregate of $1.4 million in 2016, $1.8 million in 2015 and $2.1 million in 2014.
From time to time, we enter into additional arrangements in the ordinary course of business, at market prices and on market terms, with Kibbutz Sdot-Yam, which are not material,
in accordance with related party transaction procedures adopted by our audit committee and the board
.
Special grant from Kibbutz Sdot- Yam
On February 9, 2016, our board of directors approved, following the approval of our audit committee
in accordance with the Israeli Companies Regulations (Relieves for Transactions with Interested Parties) of 2000 (
“
Regulations
”),
the acceptance of a special grant from Kibbutz Sdot- Yam by a waiver of lease payments due to the Kibbutz in the amount of NIS 1 million (approximately $266,000) (“
Grant
”). The Grant was made in favor of our employees (other than employees who are members of the Kibbutz, executive officers and directors), based on principles set by the Kibbutz for its distribution. Our audit committee and the board of directors
determined that the Grant complies with the terms of Section 1(2) of the Regulations as an extraordinary transaction solely for our benefit.
Registration Rights Agreement
Pursuant to a registration rights agreement (“
Registration Rights Agreement
”), entered into on July 21, 2011, as amended on February 13, 2012, following our IPO in March 2012, Kibbutz Sdot-Yam has the right to request that we file a registration statement registering its shares, provided that the value of the shares to be registered is not less than $5.0 million, net of any underwriting discount or commission and provided further that we are not required to file more than two registration statements in any 12-month period. Kibbutz Sdot-Yam may also request that we file a registration statement on a Form F-3, if we are eligible to use such form, provided that the net value of the shares to be registered is not less than $1.0 million and provided further that we are not required to file more than two registration statements on a Form F-3 in any 12-month period. Kibbutz Sdot-Yam also has piggyback registration rights, which provide it with the right to register its shares in the event of an offering of securities by us. To the extent that the underwriters limit the number of shares that can be included in a registration statement, we have discretion to register those shares we choose first, followed by the shares of Kibbutz Sdot-Yam.
96
Pursuant to the
Shareholders’ Agreement between
Kibbutz Sdot-Yam and Tene effective October 13, 2016, Kibbutz Sdot-Yam
agreed to assign Tene its rights under the Registration Rights Agreement to
demand that we file a registration statement on a Form F-3, per the terms detailed above, and its piggyback registration rights. Such assignment is subject to the terms of the registration rights agreement. Under the terms of the Shareholders’ Agreement,
Kibbutz Sdot- Yam did not agree to assign to Tene its right to demand registration of shares on Form F-1 or Form S-1 under the Registration Rights Agreement
.
Pursuant to the Registration Rights Agreement, we registered 2,300,000 of our ordinary shares held by Kibbutz Sdot-Yam. These registration rights terminate upon the earlier of seven years following the date of our IPO or the date that a holder of registration rights can sell its shares freely under Rule 144 without restrictions on volume. In April 2013, Tene and Kibbutz Sdot-Yam sold 8,422,859 of our ordinary shares. In June 2014, Kibbutz Sdot-Yam sold 6,325,000 of the then-17,765,000 ordinary Company shares it owned.
Agreements with directors and officers
Employment agreements
See “ITEM 6.B: Directors, Senior Management and Employees—Compensation of Officers and Directors—Employment and consulting agreements with executive officers”.
Indemnification agreements
See “ITEM 6.C: Directors, Senior Management and Employees—Board Practices—Exculpation, insurance and indemnification of office holders.”
Not applicable.
Consolidated Financial Statements
For our audited consolidated financial statements for the year ended December 31, 2016, please see pages F-4 to F-70 of this report.
Legal Proceedings
Arbitration proceeding with Microgil Agricultural Cooperative Society Ltd
.
In November 2011, Kfar Giladi and Microgil, an entity we believe is controlled by Kfar Giladi, initiated arbitration proceedings against us that commenced in April 2012. We refer to Kfar Giladi and Microgil as the “claimants.” In April 2012, the claimants filed a claim against us in arbitration for NIS 232.8 million ($60.5 million) for alleged damages incurred by them in connection with a breach of the Processing Agreement by us. In August 2012, we filed a counter claim against the claimants in the arbitration for NIS 76.6 million ($19.9 million) for damages incurred by us in connection with Microgil’s malfunctioning operations, Microgil’s breach of the Processing Agreement and the understanding between the parties regarding the Processing Agreement after it was terminated, inventory which was not returned to us and was unaccounted for, excess payments which were paid to the claimants, an unpaid loan that was granted by us to the claimants, and the adverse impact on the valuation in our IPO caused by their actions.
The arbitration arises out of a dispute related to the Processing Agreement that we entered into with Kfar Giladi (which subsequently assigned it to Microgil) in June 2006 pursuant to which Kfar Giladi committed to establish a production facility at its own expense within 21 months of the date of the Processing Agreement to process quartz for us and for other potential customers. Pursuant to the Processing Agreement, we committed to pay fixed prices for quartz processing services related to agreed-upon quantities of quartz over a period of ten years from the date set for the claimants to commence operating the production facility. We estimate that the total amount of such payments would have been approximately $55 million. It is our position that the production facility established by the claimants was not operational until approximately two years after the date required by the Processing Agreement. As a result, we were unable to purchase the minimum quantities set forth in the Processing Agreement and we therefore acquired the quantities of ground quartz that we needed from other quartz suppliers.
97
It is our position that the Processing Agreement was terminated by us following its breach by the claimants. We contend that our purchases of ground quartz from Microgil in 2010 and 2011 were made pursuant to new understandings reached between the parties and not pursuant to the Processing Agreement. The claimants allege that the Processing Agreement was still in effect and that we did not meet our contractual commitments under the Processing Agreement to order the minimum annual quantity. In addition, once production began, we contend that the claimants failed to consistently deliver the required quantity and quality of ground quartz as agreed by the parties. In January 2012, Microgil notified us that it had closed its production facility as a result of our breach of the Processing Agreement.
We also contend that the claimants are responsible for not returning to us unprocessed quartz that we provided to them, including quartz that is currently in the claimants’ possession and additional quartz that is unaccounted for. Each party has various other claims against the other.
In November 2015, the claimants filed a motion to require us to deposit a bond in the amount of NIS 100 million (approximately $25.6 million) and asking for an injunction to prevent the disposition of assets, plants and equipment valued at no less than NIS 149.2 million (approximately $38.2 million), in order to ensure their ability to collect the compensation they may be eligible to receive as a result of the arbitration. On May 3, 2016, the motion was dismissed. The arbitration is currently in the final summation phase. The arbitrator’s judgment is expected to be published by September 19, 2017. We believe that we have strong defenses and counterclaims. We have not recorded any provision in relation to this lawsuit.
Claim by former South African distributor
In December 2007, we terminated our agency agreement with our former South African agent, WOMAG, on the basis that it had breached the agreement. In the same month, we filed a claim for NIS 1.0 million ($0.3 million) in the Israeli District Court in Haifa based on such breach. WOMAG contested jurisdiction of the Israeli District Court, but subsequent appellate courts have dismissed WOMAG’s contest. In January 2008, WOMAG filed suit in South Africa seeking €15.7 million ($17.1 million). In September 2013, the South African court determined that since a proceeding on the same facts was pending before another court (
lis alibis pendens
), the South African court would stay the matter until the conclusion of the Israeli action.
In December 2013, the magistrate’s court in Israel held that we were not entitled to terminate the agreement with WOMAG as it was not breached by WOMAG. The Israeli District Court subsequently dismissed our appeal of the decision of the magistrate’s court. As a result, the decision of the Israeli magistrate’s court stands and the finding that the agreement was terminated unlawfully is binding in the South African proceedings. Following the Israeli District Court’s decision, we have agreed with WOMAG to submit the South African matter to arbitration, for which hearings commenced in South Africa in September 2016. The arbitration is divided into two stages. Both stages relate to the quantum of damages payable to us; the first stage in respect of the assumptions underlying the computation of WOMAG’s claim and the second in respect of the calculation itself. After both phases, if any of the parties is not satisfied with the arbitrator’s decision, that party may lodge an appeal to a panel of three arbitrators to be appointed by the parties.
In October 2015, WOMAG amended its claim, seeking a reduced amount of €7.1 million ($7.7 million) and ZAR 43.7 million (South Africa RAND) ($2.8 million). In June 2016, WOMAG further amended its claim, seeking a reduced amount of €6.2 million ($6.5 million) and ZAR 51.2 million (South Africa RAND) ($3.7 million) plus interest on any capital sum awarded.
The expected timeframe for resolution of the claim currently cannot be estimated with precision. While we expect that the arbitration phase will end in 2017, with the possibility of appeals thereafter in 2018, quantum of any compensation that may be required to be paid by us, will be determined after merits have been finalized and expected to be concluded in 2019. Although we believe we submitted vigorous defenses against WOMAG’s claims and intend to vigorously defend in any appeal, we believe that we recorded an adequate reserve for this claim.
98
Claims related to alleged silicosis and other injuries
Overview
We are subject to a number of claims in Israel by fabricators, their employees or the NII, alleging that fabricators contracted illnesses, including silicosis, through exposure to silica particles during cutting, polishing, sawing, grinding, breaking, crushing, drilling, sanding or sculpting our products. Silicosis is an occupational lung disease that
is progressive
and sometimes fatal, and is characterized by scarring of the lungs and damage to the breathing function. Inhalation of dust containing fine silica particles as a result of poorly protected and controlled, or unprotected and uncontrolled, exposure while working in different occupations, including among other things, processing quartz, granite, marble and other materials and working with quartz can cause silicosis and other diseases. Silica comprises approximately 90% of engineered stones, including our products, and smaller concentrations of silica are present in natural stones. Therefore, in some of the lawsuits it is claimed that fabrication of engineered stones creates higher exposure to silica dust, and, accordingly, creates a higher risk of silicosis.
Individual Claims
Since 2008 and through March 1, 2017, 110 claims were filed against us in Israel with respect to alleged bodily injuries caused to 107 fabricators as a result of their exposure to silica dust during the fabrication of our products: one claim was filed in 2008, two in 2009, four in 2010, seven in 2011, seven in 2012, eight in 2013, 28 in 2014 (representing 29 injured persons), 19 in 2015 (representing 16 injured persons), 31 in 2016 (representing 30 injured persons and include one lawsuit filed by NII with respect to a settled lawsuit) and 3 in 2017 through March 1, 2017. We were named by these lawsuits directly or as third-party defendants by fabricators or their employees in Israel, by the injured successors, by the State of Israel, by the NII or by others.
As of March 1, 2017, we were party to 85 pending bodily injury lawsuits in Israel out of these claims. Such pending lawsuits were filed with respect to 85 persons alleged to be injured and include lawsuits filed by the NII for subrogation of compensation paid or to be paid by the NII to certain injured persons, one lawsuit where the claimant applied for class certification, and one appeal that was filed in connection with a judgment granted in one of the lawsuits, as further detailed below.
As of March 1, 2017, three lawsuits that were filed against us in Israel since 2008 have been dismissed, five lawsuits have been settled between us, the claimants, their employer, if any, and the State of Israel, and 16 lawsuits were settled between us and other defendants and the claimants but are still pending between us and the distributors.
We have received one pre litigation notice in Australia, as further detailed below. We have also received six demand letters on behalf of certain other fabricators in Israel or their employees alleging that they contracted illnesses as a result of fabricating our products. Each of the claims in Israel named other defendants, such as fabricators that employed the plaintiffs, the State of Israel – the Labor Supervision Department, distributors of our products and insurance companies and insurance brokers. Various arguments are raised in the claims, including, among others, product liability arguments and failure to provide warnings regarding the risks associated with silica dust generated by the fabrication of our products.
Most of the claims in Israel do not specify a total amount of damages sought, as the plaintiff’s future damages are intended to be determined at trial. A claim filed with the Magistrate’s Court in Israel is limited to a maximum of NIS 2.5 million (approximately $650,000) plus any fees, and among the 85 pending claims filed against us as of March 1, 2017 in Israel, 60 claims were filed in the Magistrate’s Court. A claim filed in the District Court in Israel is not subject to such limitation. As a result, there is uncertainty regarding the total amount of damages that may ultimately be claimed.
In November 2015 we entered into an agreement with the State of Israel, with the consent of our insurance carriers, under which we agreed with the State to cooperate, subject to certain terms, with respect to the management of the individual claims that have been filed and claims that may be submitted during a certain time period (other than NII claims) and on the apportionment between us of the total liability of us and the State, if found, in such claims. The initial term of this agreement expired and we expect it to be renewed. We are also seeking to enter into agreements with most of our distributors in Israel with respect to their participation in compensation to claimants.
99
Israeli law, as well as the law of other jurisdictions, recognizes joint and several liability among co-defendants in civil suits. In cases where co-defendants are found liable the plaintiff is entitled to collect all damages from only one of the liable defendants. Thus, even if we are found only partially liable for a plaintiff’s damages, the plaintiff may seek to collect all their damages from us, requiring us to collect separately from our co-defendants their allocated portion of the damages. If defendants are insolvent or we are unsuccessful in collecting their portion of the damages for any other reason (for instance, if they are not insured), we may incur damages beyond the damages for which we are liable.
Class Action Claim
A lawsuit by a single plaintiff and a motion for its class certification were filed against us in April 2014 in the Central District Court in Israel. The plaintiff claims to be the owner of a fabrication plant and to have contracted silicosis as a result of fabricating our products. In connection therewith, the plaintiff claims that we did not provide adequate warnings regarding the risks and protection measures required with respect to fabrication of our products, which he claims to be greater than the risk associated with the fabrication of natural stones, and that we intentionally or negligently hid and did not warn about the high risk and irreversible damages that may occur to the persons processing our products and misled the fabricators in Israel by comparing the hazards related to the fabrication of our products to those associated with the fabrication of natural stones. The plaintiff claims that we did not act as a reasonable manufacturer, violated applicable laws and Israeli standards, committed an assault, acted negligently and are liable under the Israeli Law for Liability for Defective Products, 1980. The plaintiff also claims that our products are a “dangerous item” under the Israeli Tort Ordinance, 5728-1968 and, therefore, the plaintiff claims that the burden of proof falls on us to prove that there was no carelessness for which we are liable in connection with our products. The plaintiff claims that by our wrongful conduct we violated the plaintiff’s freedom to choose whether to be exposed to the risks associated with the fabrication of our products.
The plaintiff alleges that, if the lawsuit is recognized as a class action, the claim against us is estimated to be NIS 216 million (approximately $56 million), calculated by claiming damages of NIS 18,000 ($4,668) for each individual who worked in fabrication workshops in Israel in fabrication or administrative roles and who have been exposed to dust generated by the fabrication of our products. The plaintiff claims that there are 12,000 such individuals who worked at 400 fabrication workshops in Israel, each of which employed 10 fabricators and five administrative persons, with one rotation during the relevant period. In addition, such claim includes an unstated sum in compensation for special and general damages, such as medical disability, functional disability, pain and suffering, medical expenses, medical and nursing assistance, which will require proof and quantification for each injured person in the purported class action. The plaintiff seeks, among other things, to compel us to notify the alleged group (and potential members of the group) and each individual about the risks, recommending that they undertake a medical examination and assert their rights.
Our Probable Risks Related to Outstanding Claims
We intend to vigorously contest the pending claims against us, although there can be no assurance that we will succeed in these claims and it is probable that we will be liable for damages in connection with such lawsuits. As of December 31, 2016, we estimated that our total exposure with respect to all 87 then-pending lawsuits in Israel was approximately $17.7 million, although the actual outcome of such lawsuits may vary significantly from such estimate. As of today, only one claim has been resolved by an Israeli District Court in a judgment without settlement, imposing liability of 40% on the self-employed plaintiff and apportioning the remaining 60% liability between the State of Israel and us, with 55% attributed to us and 45% attributed to the State of Israel. This judgment was appealed to the Supreme Court, and cancelled with the parties' consent (other than with respect to the distributor's related liability), following their out-of-court agreements, as further detailed below. The settlements we entered into so far were in the range of the applicable provision we accrued.
December 2013 Judgment
In December 2013, a judgment was entered by the Central District Court of Israel in one of the lawsuits, according to which we were found to be comparatively liable for 33% of the plaintiff’s total damages. The remaining liability was imposed on the plaintiff at 40%, as contributory negligence, and on the State of Israel at 27%. The total damages of the plaintiff were found by the court to be NIS 5.3 million ($1.4 million). Since the plaintiff received payments from the NII, such payments were subtracted from the total damages. However, under Israeli law, under certain condition a plaintiff may be awarded as compensation from third party injurers, other than his employer, at least 25% of the damages claimed even if the payments that the plaintiff received from the NII equal or exceed the actual damages of the plaintiff after deducting his contributory liability. Accordingly, and as the contributory liability of the plaintiff was found to be at 40% in the above claim, the court awarded the plaintiff additional compensation of approximately NIS 800,000 (approximately $0.2 million) plus legal fees and expenses, which reflected 25% of the plaintiff actual damages, after deducting the plaintiff’s contributory negligence and the amount of NIS 3.3 million ($0.8 million) to which the claimant is entitled from the NII. After giving effect to the State of Israel’s comparative responsibility, the total liability imposed on us in this case was NIS 436,669 ($0.1 million) plus the claimant’s legal expenses. Such amount was fully paid by our insurer in January 2014 (apart from our deductible). We, as well as the State of Israel and the plaintiff, appealed the judgment to the Israeli Supreme Court. The Supreme Court accepted the request of the parties (other than the distributor) to cancel all the findings made by the District Court, except for its decision not to impose liability on the distributor, which is subject to a further hearing at and resolution by the Supreme Court. As part of the cancellation of the District Court’s judgment, out-of-court settlements were reached between us and the State of Israel (as described above) and between us and the plaintiff.
100
Claim by Former Employee
One of the fabricators who filed a claim against us was employed by us in the past and claimed that his illness was, in part, the result of his employment with us. Although there can be no assurance that we will succeed in such claim, we believe that his illness is not related to his employment by us. We are not currently subject to any other claim from our employees related to silicosis; however we may be subject to such claims in the future. Our employers’ liability insurance policy excludes silicosis claims by our employees, and to the extent we become subject to any such claims, we may face claims in excess of the portion covered by the NII.
Australian Claim
In March 2016, we received a notice of claim from a fabricator seeking damages arising from fabrication of engineered stones made of quartz, manufactured and supplied by us and several other manufacturers and suppliers. The claimant alleges that as result of exposure to crystalline silica he suffers with silicosis and another lung disease. There are 11 other respondents to the claim including other manufacturers, suppliers and fabricators’ employers. The notice of claim is part of the required pre litigation procedures mandated by Queensland (Australian) legislation. It is a procedure required before litigation can commence. The claimant has yet to fully particularise his claim including the quantum sought. We intend to vigorously contest this claim.
In Australia, any liability that we may have, would be limited to the extent of our liability only and we would not bear liability for additional damages to which other defendants are found liable in the event they are insolvent. Due to the early stage of these proceedings and the lack of particularization by the claimant, we cannot estimate the probability of loss related to such pre-litigation claim.
Insurance
We currently have global product liability insurance, which applies, subject to certain terms and limitations, to claims that may be submitted against us worldwide during the insurance policy term. This policy covers claims that are beyond $5 million per year in Israel, up to an amount of $35 million per claim and per year, plus litigation costs. Our global product liability insurance policy is effective until September 30, 2017. This insurance policy includes a deductible of $125,000 per claim. The policy covers only illnesses diagnosed after February 2010. Although we will seek to renew our product liability insurance to cover silicosis related claims, there is no assurance that we will be successful in its renewal. In addition to the global product liability policy, we have regional product liability insurance policies in the U.S., Australia and Canada covering our activities, each up to $20 million per claim or per year, each in its relevant local currency, subject to certain terms and limitations, with relatively low deductibles.
We believe that our current insurance covers the pending individual product liability claims; however, our insurer
notified us that it denied the insurance coverage with respect to some or all of the damages sought
with respect to the putative class action claim. Although, it is our position that such class action is covered by our product liability insurance, but subject to the coverage amount limit, there is no certainty whether our insurance would also cover the class action. In addition, the amount claimed in the class action exceeds our insurance coverage by a material amount. Our employer liability insurance excludes silicosis damages and, therefore, in case that we are found liable for any of our employees’ illness with silicosis, we will have to bear compensation for such damages, after the deduction of payments made by the NII to an employee of ours, which might have an adverse effect on our business and results of operations.
101
Claim by the Israel Ministry of the Protection of the Environment related to alleged violation of the Clean Air Law, 5768-2008
In December 2013, we completed the installation of a system in our Bar-Lev manufacturing facility to reduce styrene emission, following which we have better control of the styrene emission in our Bar-Lev manufacturing facility, and presented to IMEP a plan to further improve our control of styrene emission and comply with the styrene gas emission standards. With respect to our Sdot-Yam manufacturing facility, in January 2014 the IMEP summoned us to a hearing to address allegations that, based on the IMEP’s procurement of several gas emission samplings, we exceeded the air ambient standards. Following the hearing, and although the IMEP acknowledged that we were in the process of installing measures to comply with the styrene gas emission standards, the IMEP recommended an investigation to look into allegations that we exceeded the threshold of styrene air ambient standards during 2013. In 2014, we implemented measures to correct the styrene air ambient standards which we believed helped to remediate excessive emission of styrene gas. In 2015, we continued to control styrene emission levels through strict maintenance and compliance with work processes. However, at a hearing held in December 2015, the IMEP indicated its intent to conduct unannounced inspections of our Sdot-Yam facility. The IMEP has indicated that it would conduct such inspections of our Bar-Lev facility as well. If the IMEP decides that we do not fully comply with the styrene emission standards, our business license may be revoked, our facilities’ operation may be limited or shut down and we may become subject to civil and criminal sanctions. Throughout 2016 we installed additional engineering solutions and enhanced safety practices in our facilities to improve compliance with the styrene gas emission standards. In November 2016, the IMEP visited our Sdot-Yam facility and provided us with a summary report of its findings. We are in discussions with the IMEP and intend to continue monitoring, and, if necessary, applying corrective measures to control the styrene emissions at our facilities. If the Company is not fully compliant with the styrene emission standards, Company’s business license may be revoked, facilities may be shut down and the Company may be subject to civil and criminal sanctions.
Securities Class Action Claim
On August 25, 2015, a purported purchaser of our ordinary shares filed a proposed class action in the United States District Court for the Southern District of New York asserting, among other things, that we and two of our officers violated Sections 10(b) and 20(a) of the Exchange Act, and Rule 10b–5 promulgated under the Exchange Act, by allegedly making false and misleading statements about our business. The complaint seeks an unspecified amount of damages on behalf of purchasers of our securities between March 25, 2013 and August 18, 2015. On January 15, 2016, the court-appointed lead plaintiffs filed an amended complaint that asserted similar claims, but that seeks damages on behalf of purchasers of our securities between February 12, 2014 and August 18, 2015.
On February 26, 2016, we filed a motion to dismiss the amended complaint. On July 20, 2016, the court issued an opinion granting in part our motion to dismiss.
On January 30, 2017, the company entered into an agreement in principle with the lead plaintiffs to settle the case. The settlement is subject to the completion of definitive documentation and approval of the court. The Company’s insurance carriers have agreed to pay the settlement amount and the related expenses
.
General
From time to time, we are involved in other legal proceedings and claims in the ordinary course of business related to a range of matters, including environmental, contract, employment claims, product liability and warranty claims, and claims related to modification and adjustment or replacement of product surfaces sold. While the outcome of these other claims cannot be predicted with certainty, we do not believe that any such claims will have a materially adverse effect on us, either individually or in the aggregate. See Note 10 of the notes to the financial statements included elsewhere in this annual report.
Dividends
On December 23, 2014, we paid a dividend of $20.0 million to our shareholders. On December 11, 2013, we paid a dividend to our shareholders of $20.1 million. Previously, on April 4, 2012, we paid a special dividend of $26.4 million to our prior shareholders (Kibbutz Sdot-Yam and Tene) following the closing of our IPO in March 2012, and an additional dividend of $0.8 million to our preferred shareholders. We paid dividends equating to $14.0 million in fiscal year 2010 and $6.9 million in fiscal year 2011. All dividends prior to the 2013 one were denominated in NIS and have been translated into U.S. dollars at the applicable exchange rate prevailing on the date each dividend was distributed. We currently expect that payments of dividends will be made from time to time based on the recommendation of our board of directors, after taking into account legal limitations, growth plans and other factors that our board of directors may deem relevant. We do not have a declared dividend policy although we may adopt one in the future.
102
Under Israeli law, we may declare and pay dividends only if, upon the determination of our board of directors, there is no reasonable concern that the distribution will prevent us from meeting the terms of our existing and foreseeable obligations as they become due. The distribution of dividends is further limited by Israeli law to the greater of retained earnings and earnings generated over the two most recent years. In the event that we do not have retained earnings or earnings generated over the two most recent years legally available for distribution, we may seek the approval of the court to distribute a dividend. The court may approve our request if it is convinced that there is no reasonable concern that a payment of a dividend will prevent us from satisfying our existing and foreseeable obligations as they become due.
To the extent we declare a dividend, we do not intend to distribute dividends from earnings related to our Approved/Beneficiary Enterprise programs. The taxable income exemption provided under the Approved/Beneficiary Enterprise program is valid exclusively for undistributed earnings, and as a result, a distribution of earnings related to our Approved/Beneficiary Enterprise programs would subject us to additional tax payments upon a distribution of these earnings as dividends.
The payment of dividends may be subject to Israeli withholding taxes. See “ITEM 10.E: Additional Information—Taxation—Israeli tax considerations and government programs—Taxation of our shareholders—Dividends”.
Since the date of our audited financial statements included elsewhere in this annual report, there have not been any significant changes in our financial position.
Not applicable, except for Items 9.A.4 and 9.C, which are detailed below.
Our ordinary shares have been trading on the Nasdaq Global Select Market under the symbol “CSTE” since March 2012. The following table sets forth the high and low sales prices for our ordinary shares as reported by the Nasdaq Global Select Market, in U.S. dollars, for the periods indicated below:
|
Nasdaq Global Select Market
|
||||||||
|
Annual
|
High
|
Low
|
||||||
|
(price per ordinary share in U.S. dollars
)
|
||||||||
|
2016
|
43.50
|
26.35
|
||||||
|
2015
|
72.01
|
28.92
|
||||||
|
2014
|
63.92
|
42.25
|
||||||
|
2013
|
52.45
|
16.15
|
||||||
|
2012 (beginning on March 22, 2012)
|
17.39
|
10.08
|
||||||
|
Nasdaq Global Select Market
|
||||||||
|
Quarterly
|
High
|
Low
|
||||||
|
(price per ordinary share in U.S. dollars
)
|
||||||||
|
First Quarter 2017 (through March 1, 2017)
|
35.40
|
28.20
|
||||||
|
Fourth Quarter 2016
|
38.56
|
26.35
|
||||||
|
Third Quarter 2016
|
43.50
|
32.77
|
||||||
|
Second Quarter 2016
|
40.57
|
31.90
|
||||||
|
First Quarter 2016
|
43.22
|
27.31
|
||||||
|
Fourth Quarter 2015
|
43.52
|
30.81
|
||||||
|
Third Quarter 2015
|
72.01
|
28.92
|
||||||
|
Second Quarter 2015
|
69.30
|
55.74
|
||||||
|
First Quarter 2015
|
66.27
|
55.95
|
||||||
103
| Nasdaq Global Select Market | ||||||||
|
Most Recent Six Months
|
High
|
Low
|
||||||
|
(price per ordinary share in U.S. dollars)
|
||||||||
|
March 2017 (through March 1, 2017)
|
34.95
|
33.45
|
||||||
|
February 2017
|
35.40
|
29.85
|
||||||
|
January 2017
|
30.48
|
28.02
|
||||||
|
December 2016
|
32.45
|
26.35
|
||||||
|
November 2016
|
35.35
|
26.45
|
||||||
|
October 2016
|
38.56
|
35.00
|
||||||
|
September 2016
|
41.69
|
35.71
|
||||||
b. Plan of Distrib
ution
Not applicable.
See “—Offer and Listing Details” above.
Not applicable.
Not applicable.
Not applicable.
Not applicable.
Our authorized share capital consists of 200,000,000 ordinary shares, par value NIS 0.04 per share, of which 35,424,669 are issued and 34,321,573 are outstanding as of March 1, 2017.
Our ordinary shares are not redeemable and do not have preemptive rights. The ownership or voting of ordinary shares by non-residents of Israel is not restricted in any way by our articles of association or the laws of the State of Israel, except for anti-terror legislation and except that citizens of countries which are in a state of war with Israel may not be recognized as owners of ordinary shares.
Voting
Holders of our ordinary shares have one vote for each ordinary share held on all matters submitted to a vote of shareholders at a shareholder meeting. Shareholders may vote at shareholder meetings either in person, by proxy or, with respect to certain resolutions, by a voting instrument.
104
Israeli law does not allow public companies to adopt shareholder resolutions by means of written consent in lieu of a shareholder meeting. Shareholder voting rights may be affected by the grant of any special voting rights to the holders of a class of shares with preferential rights that may be authorized in the future.
Transfer of shares
Fully paid ordinary shares are issued in registered form and may be freely transferred under our articles of association unless the transfer is restricted or prohibited by another instrument, Israeli law or the rules of a stock exchange on which the shares are traded.
Election of directors
Our ordinary shares do not have cumulative voting rights for the election of directors. Rather, under our articles of association our directors are elected by the holders of a simple majority of our ordinary shares at a general shareholder meeting (excluding abstentions). See “ITEM 6.C: Directors, Senior Management and Employees—Board Practices—Board of directors and officers.” As a result, the holders of our ordinary shares that represent more than 50% of the voting power represented at a shareholder meeting and voting thereon (excluding abstentions) have the power to elect any or all of our directors whose positions are being filled at that meeting, subject to the special approval requirements for external directors described under “ITEM 6.C: Directors, Senior Management and Employees—Board Practices—External Directors.”
Dividend and liquidation rights
Under Israeli law, we may declare and pay dividends only if, upon the determination of our board of directors, there is no reasonable concern that the distribution will not prevent us from being able to meet the terms of our existing and foreseeable obligations as they become due. Under the Companies Law, the distribution amount is further limited to the greater of retained earnings or earnings generated over the two most recent years legally available for distribution. In the event that we do not have retained earnings or earnings generated over the two most recent years legally available for distribution, we may seek the approval of the court in order to distribute a dividend. The court may approve our request if it is convinced that there is no reasonable concern that the payment of a dividend will prevent us from satisfying our existing and foreseeable obligations as they become due.
In the event of our liquidation, after satisfaction of liabilities to creditors, our assets will be distributed to the holders of ordinary shares on a pro-rata basis. Dividend and liquidation rights may be affected by the grant of preferential dividend or distribution rights to the holders of a class of shares with preferential rights that may be authorized in the future.
Shareholder meetings
We are required to convene an annual general meeting of our shareholders once every calendar year within a period of not more than 15 months following the preceding annual general meeting. Our board of directors may convene a special general meeting of our shareholders and is required to do so at the request of two directors or one quarter of the members of our board of directors, or at the request of one or more holders of 5% or more of our share capital and 1% of our voting power, or the holder or holders of 5% or more of our voting power. All shareholder meetings require prior notice of at least 14 days and, in certain cases, 35 days. The chairman of our board of directors presides over our general meetings. However, if there is no such chairman or if at any meeting the chairman is not present within 15 minutes after the appointed time, or is unwilling to act as chairman, then the board members present at the meeting shall choose one of the board members as chairman of the meeting and if they shall not do so then the shareholders present shall choose a board member, or if no board member is present or if all the board members present decline to take the chair, they shall choose any other person present to be chairman of the meeting. Subject to the provisions of the Companies Law and the regulations promulgated thereunder, shareholders entitled to participate and vote at general meetings are the shareholders of record on a date to be decided by the board of directors, which may be between four and 40 days prior to the date of the meeting, depending on the type of meeting and whether written proxies are being used.
Quorum
Pursuant to our articles of association, the quorum required for a meeting of shareholders consists of at least two shareholders present in person, by proxy or by a voting instrument, who hold at least 25% of our voting power. A meeting adjourned for lack of a quorum generally is adjourned one week thereafter at the same time and place, or to such other day, time and place, as our board of directors may indicate in the invitation to the meeting or in the notice of the meeting to the shareholders. Pursuant to the Companies Law, at the reconvened meeting, the meeting will take place with whatever number of participants are present, unless the meeting was called pursuant to a request by our shareholders, in which case the quorum required is the number of shareholders required to call the meeting as described under “—Shareholder meetings.”
105
Resolutions
Under the Companies Law, unless otherwise provided in the articles of association or applicable law, all resolutions of the shareholders require a simple majority of the voting rights represented at the meeting, in person, by proxy or, with respect to certain resolutions, by a voting instrument, and voting on the resolution (excluding abstentions). A resolution for the voluntary winding up of the company requires the approval by the holders of 75% of the voting rights represented at the meeting, in person, by proxy and voting on the resolution (excluding abstentions).
Access to corporate records
Under the Companies Law, all shareholders generally have the right to review minutes of our general meetings, our shareholder register and register of significant shareholders (as defined in the Companies Law), our articles of association, our financial statements, other documents as provided in the Companies Law, and any document we are required by law to file publicly with the Israeli Companies Registrar or with the Israel Securities Authority. Any shareholder who specifies the purpose of its request may request to review any document in our possession that relates to: (i) any action or transaction with a related party which requires shareholder approval under the Companies Law; or (ii) the approval, by the board of directors, of an action in which an office holder has a personal interest. We may deny a request to review a document if we determine that the request was not made in good faith, that the document contains a commercial secret or a patent or that the document’s disclosure may otherwise impair our interests.
Acquisitions under Israeli law
Full tender offer
A person wishing to acquire shares of an Israeli public company and who would as a result hold over 90% of the target company’s issued and outstanding share capital or that of a certain class of shares is required by the Companies Law to make a tender offer to all of the company’s shareholders or the shareholders who holds shares of the same class for the purchase of all of the issued and outstanding shares of the company or of the same class, as applicable.
If the shareholders who do not respond to or accept the offer hold less than 5% of the issued and outstanding share capital of the company or of the applicable class of the shares, and more than half of the shareholders who do not have a personal interest in the offer accept the offer, all of the shares that the acquirer offered to purchase will be transferred to the acquirer by operation of law. However, a tender offer will be accepted if the shareholders who do not accept it hold less than 2% of the issued and outstanding share capital of the company or of the applicable class of the shares.
Upon a successful completion of such a full tender offer, any shareholder that was an offeree in such tender offer, whether such shareholder accepted the tender offer or not, may, within six months from the date of acceptance of the tender offer, petition the Israeli court to determine whether the tender offer was for less than fair value and that the fair value should be paid as determined by the court. However, under certain conditions, the offeror may determine in the terms of the tender offer that an offeree who accepted the offer will not be entitled to petition the Israeli court as described above.
If the shareholders who did not respond or accept the tender offer hold at least 5% of the issued and outstanding share capital of the company or of the applicable class, the acquirer may not acquire shares of the company that will increase its holdings to more than 90% of the company’s issued and outstanding share capital or of the applicable class from shareholders who accepted the tender offer.
The description above regarding a full tender offer shall also apply, with necessary changes, when a full tender offer is accepted and the offeror has also offered to acquire all of the company’s securities.
106
Special tender offer
The Companies Law provides that an acquisition of shares of an Israeli public company must be made by means of a special tender offer if as a result of the acquisition the purchaser would become a holder of at least 25% of the voting rights in the company. This rule does not apply if there is already another holder of at least 25% of the voting rights in the company.
Similarly, the Companies Law provides that an acquisition of shares in a public company must be made by means of a special tender offer if as a result of the acquisition the purchaser would become a holder of more than 45% of the voting rights in the company, if there is no other shareholder of the company who holds more than 45% of the voting rights in the company.
These requirements do not apply if the acquisition (i) occurs in the context of a private offering, on the condition that the shareholders’ meeting approved the acquisition as a private offering whose purpose is to give the acquirer at least 25% of the voting rights in the company if there is no person who holds at least 25% of the voting rights in the company, or as a private offering whose purpose is to give the acquirer 45% of the voting rights in the company, if there is no person who holds 45% of the voting rights in the company; (ii) was from a shareholder holding at least 25% of the voting rights in the company and resulted in the acquirer becoming a holder of at least 25% of the voting rights in the company; or (iii) was from a holder of more than 45% of the voting rights in the company and resulted in the acquirer becoming a holder of more than 45% of the voting rights in the company.
The special tender offer may be consummated only if (i) at least 5% of the voting power attached to the company’s outstanding shares will be acquired by the offeror and (ii) the special tender offer is accepted by a majority of the votes of those offerees who gave notice of their position in respect of the offer; in counting the votes of offerees, the votes of a holder of control in the offeror, a person who has personal interest in acceptance of the special tender offer, a holder of at least 25% of the voting rights in the company, or any person acting on their or on the offeror’s behalf, including their relatives or companies under their control, are not taken into account.
In the event that a special tender offer is made, a company’s board of directors is required to express its opinion on the advisability of the offer or shall abstain from expressing any opinion if it is unable to do so, provided that it gives the reasons for its abstention. In addition, the board of directors must disclose any personal interest each of member of the board of directors have in the offer or stems therefrom.
An office holder in a target company who, in his or her capacity as an office holder, performs an action the purpose of which is to cause the failure of an existing or foreseeable special tender offer or is to impair the chances of its acceptance, is liable to the potential purchaser and shareholders for damages resulting from his acts, unless such office holder acted in good faith and had reasonable grounds to believe he or she was acting for the benefit of the company. However, office holders of the target company may negotiate with the potential purchaser in order to improve the terms of the special tender offer, and may further negotiate with third parties in order to obtain a competing offer.
If a special tender offer was accepted by a majority of the shareholders who announced their stand on such offer, then shareholders who did not respond to the special offer or had objected to the special tender offer may accept the offer within four days of the last day set for the acceptance of the offer.
In the event that a special tender offer is accepted, then the purchaser or any person or entity controlling it and any corporation controlled by them shall refrain from making a subsequent tender offer for the purchase of shares of the target company and may not execute a merger with the target company for a period of one year from the date of the offer, unless the purchaser or such person or entity undertook to effect such an offer or merger in the initial special tender offer.
Merger
The Companies Law permits merger transactions if approved by each party’s board of directors and, unless certain requirements described under the Companies Law are met, a majority of each party’s shareholders, by a majority of each party’s shares that are voted on the proposed merger at a shareholders’ meeting.
The board of directors of a merging company is required pursuant to the Companies Law to discuss and determine whether in its opinion there exists a reasonable concern that as a result of a proposed merger, the surviving company will not be able to satisfy its obligations towards its creditors, taking into account the financial condition of the merging companies. If the board of directors has determined that such a concern exists, it may not approve a proposed merger. Following the approval of the board of directors of each of the merging companies, the boards of directors must jointly prepare a merger proposal for submission to the Israeli Registrar of Companies.
107
For purposes of the shareholder vote, unless a court rules otherwise, the merger will not be deemed approved if a majority of the shares voting at the shareholders meeting (excluding abstentions) that are held by parties other than the other party to the merger, any person who holds 25% or more of the means of control (See “ITEM 6.C: Directors, Senior Management and Employees—Board Practices—Audit committee—Approval of transactions with related parties” for a definition of means of control) of the other party to the merger or any one on their behalf including their relatives (See “ITEM 6.C: Directors, Senior Management and Employees—Board Practices—External directors—Qualifications of external directors” for a definition of relatives) or corporations controlled by any of them, vote against the merger.
In addition, if the non-surviving entity of the merger has more than one class of shares, the merger must be approved by each class of shareholders.
If the transaction would have been approved but for the separate approval of each class of shares or the exclusion of the votes of certain shareholders as provided above, a court may still rule that the company has approved the merger upon the request of holders of at least 25% of the voting rights of a company, if the court holds that the merger is fair and reasonable, taking into account the appraisal of the merging companies’ value and the consideration offered to the shareholders.
Under the Companies Law, each merging company must send a copy of the proposed merger plan to its secured creditors. Unsecured creditors are entitled to receive notice of the merger, as provided by the regulations promulgated under the Companies Law. Upon the request of a creditor of either party to the proposed merger, the court may delay or prevent the merger if it concludes that there exists a reasonable concern that, as a result of the merger, the surviving company will be unable to satisfy the obligations of the target company. The court may also give instructions in order to secure the rights of creditors.
In addition, a merger may not be completed unless at least 50 days have passed from the date that a proposal for approval of the merger was filed with the Israeli Registrar of Companies and 30 days from the date that shareholder approval of both merging companies was obtained.
Anti-takeover measures
The Companies Law allows us to create and issue shares having rights different from those attached to our ordinary shares, including shares providing certain preferred or additional rights to voting, distributions or other matters and shares having preemptive rights. We do not have any authorized or issued shares other than ordinary shares. In the future, if we do create and issue a class of shares other than ordinary shares, such class of shares, depending on the specific rights that may be attached to them, may delay or prevent a takeover or otherwise prevent our shareholders from realizing a potential premium over the market value of their ordinary shares. The authorization of a new class of shares will require an amendment to our articles of association which requires the prior approval of a majority of our shares represented and voting at a general meeting. Shareholders voting at such a meeting will be subject to the restrictions under the Companies Law described in “—Voting.”
Tax law
Israeli tax law treats some acquisitions, such as stock-for-stock swaps between an Israeli company and a foreign company, less favorably than U.S. tax law. For example, Israeli tax law may subject a shareholder who exchanges ordinary shares in an Israeli company for shares in a non-Israeli corporation to immediate taxation unless such shareholder receives an advanced ruling from the Israeli Tax Authority for different tax treatment. See “ITEM 10.E: Additional Information—Taxation—Israeli tax considerations and government programs—Taxation of our shareholders—Capital gains”.
108
Changes in capital
Our articles of association enable us to increase or reduce our share capital. Any such changes are subject to the provisions of the Companies Law and must be approved by a resolution duly passed by our shareholders at a general or special meeting by voting on such change.
Establishment
We were incorporated under the laws of the State of Israel on December 31, 1989. Our predecessor commenced operations in 1987. We are registered with the Israeli Registrar of Companies in Jerusalem. Our registration number is 51-143950-7. Our purpose as set forth in Article 5 of our articles of association is to engage in any lawful business.
Transfer agent and registrar
The transfer agent and registrar for our ordinary shares is American Stock Transfer & Trust Company. Its address is 6201 15th Avenue, Brooklyn, New York 11219, and its telephone number is (800) 937-5449.
Listing
Our ordinary shares are listed on the Nasdaq Global Select Market under the symbol “CSTE.”
Summaries of the following material contracts and amendments to these contracts are included in this annual report in the places indicated:
|
Material Contract
|
Location in This Annual Report
|
|
Agreements with Kibbutz Sdot-Yam
|
“ITEM 7: Major Shareholders and Related Party Transactions—Related Party Transactions—Relationship and agreements with Kibbutz Sdot-Yam.”
|
|
Agreements with Breton S.p.A. (Italy)
|
“ITEM 3: Key Information—Risk Factors
—
If demand for our products continues to grow, we may need to further expand our manufacturing facility in the United States or elsewhere. If we fail to achieve this further expansion, we may be unable to grow our business and revenue, maintain our competitive position or improve our profitability.”
|
|
Form of Indemnification Agreement
|
“ITEM 6: Directors, Senior Management and Employees—Board Practices—Exculpation, insurance and indemnification of officer holders.”
|
|
Registration Rights Agreement, as extended by the Extension of Registration Rights Agreement
|
“ITEM 7: Major Shareholders and Related Party Transactions—Related Party Transactions—Registration Rights Agreement.”
|
In 1998, Israeli currency control regulations were liberalized significantly, so that Israeli residents generally may freely deal in foreign currency and foreign assets, and non-residents may freely deal in Israeli currency and Israeli assets. There are currently no Israeli currency control restrictions on remittances of dividends on the ordinary shares or the proceeds from the sale of the shares provided that all taxes were paid or withheld; however, legislation remains in effect pursuant to which currency controls can be imposed by administrative action at any time.
Non-residents of Israel may freely hold and trade our securities. Neither our memorandum of association nor our articles of association nor the laws of the State of Israel restrict in any way the ownership or voting of ordinary shares by non-residents, except that such restrictions may exist with respect to citizens of countries which are in a state of war with Israel. Israeli residents are allowed to purchase our ordinary shares.
109
The following description is not intended to constitute a complete analysis of all tax consequences relating to the acquisition, ownership and disposition of our ordinary shares. You should consult your own tax advisor concerning the tax consequences of your particular situation, as well as any tax consequences that may arise under the laws of any state, local, foreign or other taxing jurisdiction.
Israeli tax considerations and government programs
The following is a brief summary of the material Israeli tax laws applicable to us, and certain Israeli Government programs benefiting us. This section also contains a discussion of material Israeli tax consequences concerning the ownership of and disposition of our ordinary shares. This summary does not discuss all aspects of Israeli tax law that may be relevant to a particular investor in light of his or her personal investment circumstances or to some types of investors, such as traders in securities, who are subject to special treatment under Israeli law. Because some parts of this discussion are based on new tax legislation that has not yet been subject to judicial or administrative interpretation, we cannot assure you that the Israeli governmental and tax authorities or the Israeli courts will accept the views expressed below. The discussion below is subject to amendment under Israeli law or changes to the applicable judicial or administrative interpretations of Israeli law, which could affect the tax consequences described below.
The discussion below does not cover all possible tax considerations. Potential investors are urged to consult their own tax advisors as to the Israeli or other tax consequences of the purchase, ownership and disposition of our ordinary shares, including in particular, the effect of any foreign, state or local taxes.
General corporate tax structure in Israel
Israeli companies are generally subject to corporate tax, which rate has been fluctuating during the last few years. Corporate tax rate was 25% in 2012 and 2013, 26.5% in 2014 and 2015, and 25% in 2016. The corporate tax rate reduced to 24% in 2017 and will be further reduced to 23% in 2018 and thereafter. However, the effective corporate tax rate payable by a company that derives income from an Approved Enterprise, a Beneficiary Enterprise or a Preferred Enterprise (as discussed below) may be considerably less. Capital gains generated by an Israeli company are subject to tax at the prevailing corporate tax rate.
Foreign Exchange Regulations:
Commencing in taxable year 2014, we had elected and were permitted by the ITA to measure our taxable income and file our tax return under the Israeli Income Foreign Tax Regulations. Under the Foreign Exchange Regulations, an Israeli company must calculate its tax liability in U.S. dollars according to certain orders. The tax liability, as calculated in U.S. dollars, is translated into NIS based on the exchange rate as of December 31 of each year.
Law for the Encouragement of Industry (Taxes), 1969
The Law for the Encouragement of Industry (Taxes), 1969, generally referred to as the “Encouragement of Industry Law,” provides several tax benefits for “Industrial Companies.” Pursuant to the Encouragement of Industry Law, a company qualifies as an Industrial Company if it is a resident of Israel and at least 90% of its gross income in any tax year (exclusive of income from certain defense loans) is generated from an “Industrial Enterprise” that it owns. An Industrial Enterprise is defined as an enterprise whose principal activity, in a given tax year, is industrial manufacturing.
An Industrial Company is entitled to certain tax benefits, including: (i) a deduction of the cost of purchases of patents, know-how and certain other intangible property rights (other than goodwill) used for the development or promotion of the Industrial Enterprise over a period of eight years, beginning from the year in which such rights were first used, (ii) the right to elect to file consolidated tax returns, under certain conditions, with additional Israeli Industrial Companies controlled by it, and (iii) the right to deduct expenses related to public offerings in equal amounts over a period of three years beginning from the year of the offering.
110
Eligibility for benefits under the Encouragement of Industry Law is not contingent upon the approval of any governmental authority.
There is no assurance that we qualify or will continue to qualify as an Industrial Company or that the benefits described above will be available in the future.
Law for the Encouragement of Capital Investments, 1959
The Israeli Investment Law provides different benefits to “Approved Enterprise”, “Beneficiary Enterprise” and “Preferred Enterprise”.
The Investment Law provides certain incentives for capital investment in a production facility (or other eligible assets). Generally, an investment program that is implemented in accordance with the provisions of the Investment Law, is entitled to benefits. These benefits may include cash grants from the Israeli government and tax benefits, based upon, among other things, the geographic location in Israel of the facility in which the investment is made. In order to qualify for these incentives, an Approved Enterprise, a Beneficiary Enterprise or a Preferred Enterprise is required to comply with the requirements of the Investment Law.
The Investment Law has been amended several times over the recent years, with the three most significant changes effective as of April 1, 2005 (“
2005 Amendment
”), as of January 1, 2011 (“
2011 Amendment
”) and as of January 1, 2017 (the “
2017 Amendment
”). Pursuant to the 2005 Amendment, tax benefits granted in accordance with the provisions of the Investment Law prior to its revision by the 2005 Amendment remain in force but any benefits granted subsequently are subject to the provisions of the amended Investment Law. Similarly, the 2011 Amendment introduced new benefits instead of the benefits granted in accordance with the provisions of the Investment Law prior to the 2011 Amendment. However, companies entitled to benefits under the Investment Law as in effect up to January 1, 2011 were entitled to choose to continue to enjoy such benefits, provided that certain conditions are met, or elect instead, irrevocably, to forego such benefits and elect the benefits of the 2011 Amendment. The 2017 Amendment introduces new benefits for Technological Enterprises, alongside the existing tax benefits.
The following discussion is a summary of the Investment Law following its most recent amendments:
The Preferred Enterprise Regime—the 2011 Amendment
In December 2010, the Israeli parliament, or the Knesset, approved the Economic Policy Law for the years 2011 and 2012, which among others things, amended the Investment Law. Amendment No. 68 to the Investment Law, effective as of January 1, 2011, changes the benefit alternatives under the Investment Law.
Eligible companies under Amendment No. 68 can receive benefits as a “Preferred Enterprise.” In order to receive benefits as a Preferred Enterprise, Amendment No. 68 states, among other requirements, that a company must meet certain conditions including owning an industrial enterprise that meets the “Competitive Enterprise” conditions as described by the Investment Law. The benefits granted to a Preferred Enterprise are determined depending on the location of the Preferred Enterprise within Israel.
Qualified enterprises located in specific locations within Israel are eligible for grants and/or loans simultaneously with tax benefits. Grants and/or loans are approved by the Israeli Investment Center.
Amendment No. 68 imposes a reduced flat corporate tax rate which is not program-dependent and applies to the industrial enterprise’s entire preferred income. The reduced flat corporate tax rates for qualified industrial enterprises are as follows:
| 1. |
In 2011-2012, the reduced tax rate is 10% or 15% depending on the Preferred Enterprise’s location in Israel.
|
| 2. |
In 2013-2014, the reduced tax rate will be 7% or 12.5% depending on the Preferred Enterprise’s location in Israel.
|
| 3. |
In 2015 and onwards, the reduced tax rate will be 6% or 12% depending on the Preferred Enterprise’s location in Israel.
|
| 4. |
Subsequently, on August 5, 2013, the 2014 and onwards tax bracket was increased by the Knesset to 9% or 16% depending on the Preferred Enterprise’s location in Israel.
|
111
The tax benefits under Amendment No. 68 also include accelerated depreciation and amortization for tax purposes.
A company that pays a dividend out of income generated from the Preferred Enterprise is required to withhold tax on such distribution at a rate of 15% (or a reduced rate under an applicable double tax treaty). Subsequently, such rate was raised to 20% effective 2014 and onwards, based on the August 5, 2013 Knesset decision. Upon a distribution of a dividend to an Israeli company, no withholding tax is remitted.
We have examined the effect of the implementation of Amendment No. 68 on our financial statements and announced the election of the provisions of Amendment No. 68 on April 11, 2011. Therefore, we are entitled to tax benefits under Amendment No. 68 beginning in year 2011. Once announced, the election of the provisions of Amendment No. 68 cannot be rescinded and all previous Tracks that were effective under the Grant Tracks (Approved Enterprise) and the Tax Benefits Track (Beneficiary Enterprise) expired at the end of 2010. Since we announced the election prior to July 30, 2015, we will be entitled to distribute exempt income generated by the Approved/Beneficiary Enterprise to our Israeli corporate shareholders tax free.
Under Amendment No. 68 and from January, 1, 2011, our facilities have “Preferred Enterprise” status, which entitles us to tax benefits at a flat reduced corporate tax rate that will apply to the industrial enterprise’s entire preferred. Those tax rates between 2014 and 2016 were 16% for the income portion related to the Kibbutz Sdot-Yam facility and 9% for the income portion related to the Bar-Lev manufacturing facility. From 2017 onwards, tax rate for the income portion related to Bar-Lev will be reduced to 7.5% and Sdot-Yam tax rate will remain unchanged. In addition, the Bar-Lev manufacturing facility is eligible to receive a grant of up to 20% on capital investments, subject to the approval of the Investment Center.
In November 2012, Amendment No. 69 to the Investment Law (“
Trapped Earnings Law
”) was passed. This amendment provides temporary, partial, relief from taxation on a distribution of dividends from exempt income for companies that elect the “relief option” through November 2013. The Trapped Earnings Law allows a company to qualify a portion of its exempt income (“
Elected Earnings
”) for a reduced tax rate ranging between 6% to 17.5% (“
relief option
”). While the reduced tax is payable within 30 days of election, an electing company is not required to actually distribute the Elected Earnings within a certain period of time. The applicable rate is based on a linear formula involving the portion of Elected Earnings to exempt income and the applicable tax rate prescribed according to the Investment Law. A company electing to qualify its exempt income must undertake to make designated investments in productive fixed assets, research and development in Israel, or wages of new employees during a period of five years starting the year which the company applied the Trapped Earnings Law (“
Designated Investment
”). The Designated Investment amount is defined by a formula that considers the portion of Elected Earnings to the exempt income and the applicable tax rate prescribed according to the Investment Law.
In addition to the reduced tax rate, a distribution of Elected Earnings would be subject to a 15% withholding tax and from 2014 and onwards 20%. We have examined the effect of the Trapped Earnings Law on our financial statements and decided to not elect the “relief option” to not apply the Trapped Earnings Law.
There can be no assurance that we will comply with the conditions required to remain eligible for benefits under the Investment Law in the future or that we will be entitled to any additional benefits thereunder. The benefits available to Beneficiary, Approved and Preferred Enterprises are conditioned upon terms stipulated in the Investment Law and regulations, in the case of the “Grants Track” (under the Investment Law before and after Amendment No. 68), also to the criteria set forth in the applicable certificate of approval. If we do not fulfill these conditions in whole or in part, the benefits can be reduced or canceled and we may be required to refund the amount of the benefits, linked to the Israeli consumer price index, with interest.
The New Technological Enterprise Incentives Regime—the 2017 Amendment
The 2017 Amendment to the Investment Law, became effective on January 1, 2017, provided that regulations are promulgated no later than March 31, 2017 to implement the “Nexus Principles” based on OECD guidelines recently published as part of the Base Erosion and Profit Shifting (BEPS) project.
The new incentives regime will apply to “Preferred Technological Enterprises” that meet certain conditions, including: (1) the R&D expenses in the three years preceding the tax year were at least 7% of the company's turnover or exceeded NIS 75 million (approximately $19 million); and (2) one of the following: (a) at least 20% of the workforce (or at least 200 employees) are employed in R&D; (b) a venture capital investment approximately equivalent to at least $2 million was previously made in the company and the company did not change its line of business; (c) growth in sales by an average of 25% over the three years preceding the tax year, provided that the turnover was at least NIS 10 million (approximately $2.5 million), in the tax year and in the preceding three years; or (d) growth in workforce by an average of 25% over the three years preceding the tax year, provided that the company employed at least 50 employees, in the tax year and in the preceding three years.
112
A “Special Preferred Technological Enterprise” is an enterprise that meets conditions 1 and 2 above, and in addition has total annual consolidated revenues above NIS 10 billion (approximately $2.5 billion).
Preferred Technological Enterprises will be subject to a corporate tax rate of 12% on their income that qualifies as “Preferred Technology Income”, as defined in the Investment Law. The tax rate is further reduced to 7.5% for a Preferred Technology Enterprise located in development zone A. In addition, a Preferred Technology Company will enjoy a reduced corporate tax rate of 12% on capital gain derived from the sale of certain “Benefitted Intangible Assets” (as defined in the Investment Law) to a related foreign company if the Benefitted Intangible Assets were acquired from a foreign company on or after January 1, 2017 for at least NIS 200 million (approximately $50 million), and the sale receives prior approval from the National Authority for Technological Innovation
(previously known as the Israeli Office of the Chief Scientist)
(“OCS”). Special Preferred Technological Enterprises will be subject to 6% on “Preferred Technology Income” regardless of the company’s geographic location within Israel. In addition, a Special Preferred Technology Enterprise will enjoy a reduced corporate tax rate of 6% on capital gain derived from the sale of certain “Benefitted Intangible Assets” to a related foreign company if the Benefitted Intangible Assets were either developed by an Israeli company or acquired from a foreign company on or after January 1, 2017, and the sale received prior approval from NATI. A Special Preferred Technology Enterprise that acquires Benefitted Intangible Assets from a foreign company for more than NIS 500 million (approximately $125 million), will be eligible for these benefits for at least ten years, subject to certain approvals as specified in the Investment Law.
Dividends distributed by a Preferred Technology Enterprise or a Special Preferred Technology Enterprise, paid out of Preferred Technology Income, are subject to withholding tax at source at the rate of 20%, and if distributed to a foreign company and other conditions are met, the withholding tax rate will be 4% (or a lower rate under a tax treaty, if applicable, subject to the receipt in advance of a valid certificate from the ITA allowing for a reduced tax rate).We are currently in the process of reviewing criteria for the tax rate of a “Special Preferred Technological Enterprise;” however, only after the regulations concerning the nexus approach are promulgated we will be able to assess the effect of the new law on our financial results
We are currently in the process of reviewing criteria for the tax rate of a “Special Preferred Technological Enterprise;” however, only after the regulations concerning the nexus approach are promulgated we will be able to assess the effect of the new law on our financial results.
The Encouragement of Industrial Research and Development Law, 5744-1984
The Israeli law under which the OCS of the Ministry of Economy and Industry of the State of Israel grants are made, limits our ability to manufacture products, or transfer technologies developed using these grants outside of Israel. If we were to seek approval to manufacture products, to consummate a merger or acquisition transaction with a non-Israeli third party or to transfer technologies developed using these grants outside of Israel, we could be subject to additional royalty requirements or be required to pay certain redemption fees. If we were to violate these restrictions, we could be required to refund any grants previously received, together with interest and penalties, and may be subject to criminal charges. We believe that our planned construction of a new production facility in the United States will not subject us to any royalty payment obligations or require us to refund any grants because our OCS grants financed our development of a product that has not been commercialized and will not be manufactured at the U.S. production facility. In addition, based on OCS statements, we believe that our OCS funding is exempted from royalty payment obligations. During 2013, and 2012, we recognized OCS grants of $0.01 million, and $0.3 million, respectively. Our relevant program with the OCS ended in 2013.
Taxation of our shareholders
Capital gains
Capital gains tax is imposed on the disposal of capital assets by an Israeli resident and on the disposal of such assets by a non-Israeli resident if those assets are either (i) located in Israel; (ii) shares or rights to shares in an Israeli resident company, or (iii) represent, directly or indirectly, rights to assets located in Israel unless a tax treaty between Israel and the seller’s country of residence provides otherwise. The Israeli Income Tax Ordinance distinguishes between “Real Capital Gain” and “Inflationary Surplus.” The Real Capital Gain on the disposition of a capital asset is the amount of total capital gain in excess of Inflationary Surplus. Inflationary Surplus is computed, generally, on the basis of the increase in the Israeli Consumer Price Index between the date of purchase and the date of disposal of the capital asset.
113
Real Capital Gain generated by a company is generally subject to tax at the corporate tax rate (24% in 2011, 25% in 2012 and 2013, 26.5% in 2014 and 2015, 25% in 2016, 24% in 2017 and 23% in 2018 and thereafter). As of January 1, 2012, the Real Capital Gain accrued by individuals on the sale of our securities is taxed at the rate of 25%. However, if the individual shareholder is a “Controlling Shareholder” (meaning, a person who holds, directly or indirectly, alone or together with another, 10% or more of one of the Israeli resident company’s “means of control” (including, among other rights, the right to company profits, voting rights, the right to the company’s liquidation proceeds and the right to appoint a company director) at the time of sale or at any time during the preceding 12 month period, such gain will be taxed at the rate of 30%.
Individual and corporate shareholders dealing in securities in Israel are taxed at the tax rates applicable to business income (a corporate tax rate for a corporation and a marginal tax rate of up to 48% for an individual in 2016).
Notwithstanding the foregoing, capital gains generated from the sale of securities publicly traded on the Tel Aviv Stock Exchange or on a recognized stock exchange outside of Israel, by a non-Israeli shareholder may be exempt under the Israeli Income Tax Ordinance from Israeli taxes provided that all the following conditions are met: (i) the securities were purchased upon or after the registration of the securities on a recognized stock exchange (this requirement generally does not apply to shares purchased on or after January 1, 2009), (ii) the seller of the securities does not have a permanent establishment in Israel to which the generated capital gain is attributed and (iii) with respect to securities listed on a recognized stock exchange outside of Israel, such shareholders are not subject to the Israeli Income Tax Law (Inflationary Adjustments) 5745‑1985. However, non-Israeli corporation will not be entitled to the foregoing exemptions if Israeli residents (a) have a controlling interest of more than 25% in such non-Israeli corporation, or (b) are the beneficiaries of or are entitled to 25% or more of the revenues or profits of such non-Israeli corporation, whether directly or indirectly. Such exemption is not applicable to a person whose gains from selling or otherwise disposing of the shares are deemed to be business income.
In addition, the sale of the securities may be exempt from Israeli capital gain tax under the provisions of an applicable tax treaty. For example, the Convention between the Government of the United States of America and the Government of Israel with respect to Taxes on Income ( “Israel-U.S.A. Double Tax Treaty”) exempts U.S. residents from Israeli capital gains tax in connection with such sale, provided that (i) the U.S. resident owned, directly or indirectly, less than 10% of the Israeli resident company’s voting power at any time within the 12-month period preceding such sale; (ii) the seller, if an individual, has been present in Israel for less than 183 days (in the aggregate) during the taxable year; and (iii) the capital gain from the sale was not generated through a permanent establishment of the U.S. resident in Israel.
The purchaser of the securities, the stockbrokers who effected the transaction or the financial institution holding the traded securities through which payment to the seller is made are obligated to withhold Israeli tax at source from such payment. Shareholders may be required to demonstrate that they are exempt from tax on their capital gains in order to avoid withholding at source at the time of sale. Specifically, in transactions involving a sale of all of the shares of an Israeli resident company, in the form of a merger or otherwise, the ITA may require from shareholders who are not liable for Israeli tax to sign declarations in forms specified by this authority or obtain a specific exemption from the ITA to confirm their status as non-Israeli resident.
A detailed return, including a computation of the tax due, must be filed and an advance payment must be paid on January 31 and June 30 of each tax year for sales of securities traded on a stock exchange made within the previous six months. However, if all tax due was withheld at the source according to applicable provisions of the Israeli Income Tax Ordinance and the regulations promulgated thereunder, the return does not need to be filed provided that (i) such income was not generated from business conducted in Israel by the taxpayer, and (ii) the taxpayer has no other taxable sources of income in Israel with respect to which a tax return is required to be filed and an advance payment does not need to be made. Capital gains are also reportable on an annual income tax return.
114
Dividends
Israeli residents who are individuals are generally subject to Israeli income tax for dividends paid on shares (other than bonus shares or share dividends) at 25%, or 30% if the recipient of such dividend is a Controlling Shareholder at the time of distribution or at any time during the preceding 12-month period. However, dividends distributed from taxable income accrued from Preferred Enterprise are subject to withholding tax at the rate of 20%. An average rate will be set in case the dividend is distributed from mixed types of income (regular and preferred income).
Israeli resident corporations are generally exempt from Israeli corporate tax for dividends paid on shares of Israeli resident corporations.
Non-Israeli resident (either an individual or a corporation) is generally subject to an Israeli income tax on the receipt of dividends at the rate of 25% or 30% (if the dividend recipient is a Controlling Shareholder at the time of distribution or at any time during the preceding 12-month period) or 20% if the dividend is distributed from income attributed to Preferred Enterprise. Such dividends are generally subject to Israeli withholding tax at a rate of 25% so long as the shares are registered with a Nominee Company (whether the recipient is a Controlling Shareholder or not), and 20% if the dividend is distributed from income attributed to a Preferred Enterprise. Such rates may be reduced by the application of the provisions of applicable double tax treaties (subject to the receipt in advance of a valid certificate from the ITA allowing for a reduced tax rate). For example, under the Israel-U.S.A. Double Tax Treaty the following rate will apply to dividends distributed by an Israeli resident company to a U.S. resident (for purposes of the Israel-U.S.A. Double Tax Treaty): if (A) the U.S. resident is a corporation which held during the portion of the taxable year preceding the date of payment of the dividend and during the whole of its prior taxable year (if any), at least 10% of the outstanding shares of the voting stock of the Israeli resident paying company and (B) not more than 25% of the gross income of the Israeli resident paying company for such prior taxable year (if any) consists of certain type of interest or dividends then the tax rate is 12.5%. The aforementioned rates will not apply if the dividend income was generated through a permanent establishment of the U.S. resident in Israel.
If the dividend is attributable partly to income derived from a Preferred Enterprise, and partly to other sources of income, the withholding rate will be a blended rate reflecting the relative portions of the two types of income.
Our company is obligated to withhold tax, upon the distribution of a dividend attributed to a Preferred Enterprise’s income from the amount distributed at the following rates: (i) Israeli resident corporations – 0%, (ii) Israeli resident individuals –20% and (iii) non-Israeli residents – 20%, unless a reduced tax rate is provided under the provisions of an applicable double tax treaty (subject to the receipt in advance of a valid certificate from the ITA allowing for a reduced tax rate). If the dividend is distributed from income not attributed to the Preferred Enterprise, the following withholding tax rates will apply: (a) for securities registered and held by a Nominee Company: (i) Israeli resident corporations – 0%, (ii) Israeli resident individuals – 25% and (iii) non-Israeli residents – 25%, unless a reduced tax rate is provided under the provisions of an applicable double tax treaty (subject to the receipt in advance of a valid certificate from the ITA allowing for a reduced tax rate); (b) in all other cases: (i) Israeli resident corporations – 0%, (ii) Israeli resident individuals – 25% or 30% (if the dividend recipient is a Controlling Shareholder at the time of the distribution or at any time during the preceding 12 month period), and (iii) non-Israeli residents – 25% as referred to above with respect to Israeli resident individuals, unless a reduced tax rate is provided under the provisions of an applicable double tax treaty (subject to the receipt in advance of a valid certificate from the ITA allowing for a reduced tax rate).
Estate and gift tax
Israeli law presently does not impose estate or gift taxes.
Excess Tax
As of 2013, individual holders who are subject to tax in Israel (whether any such individual is an Israeli resident or non-Israeli resident) and who have taxable income that exceeds a certain threshold in a tax year (NIS 811,560 for 2013-2014, NIS 810,720 for 2015, NIS 803,520 for 2016 and NIS 640,000 for 2017 and thereafter, linked to the Israeli Consumer Price Index), will be subject to an additional tax at the rate of 2% in 2013-2016, and 3% in 2017 and thereafter, on his or her taxable income for such tax year that is in excess of such amount. For this purpose, taxable income includes taxable capital gains from the sale of securities and taxable income from interest and dividends, subject to the provisions of an applicable double tax treaty.
115
United States federal income taxation
The following is a description of the material United States federal income tax consequences to a U.S. Holder (as defined below) of the acquisition, ownership and disposition of our ordinary shares. This description addresses only the United States federal income tax consequences to holders that hold such ordinary shares as capital assets for United States federal income tax purposes. This description does not address tax considerations applicable to holders that may be subject to special tax rules, including, without limitation:
| • |
banks, financial institutions or insurance companies;
|
| • |
real estate investment trusts, regulated investment companies or grantor trusts;
|
•
dealers or traders in securities, commodities or currencies;
| • |
tax-exempt entities;
|
| • |
certain former citizens or long-term residents of the United States;
|
| • |
persons that received our shares as compensation for the performance of services;
|
| • |
persons that will hold our shares as part of a “hedging,” “integrated” or “conversion” transaction or as a position in a “straddle” for United States federal income tax purposes;
|
| • |
partnerships (including entities classified as partnerships for United States federal income tax purposes) or other pass-through entities, or holders that will hold our shares through such an entity;
|
| • |
S-corporations;
|
| • |
holders that acquire ordinary shares as a result of holding or owning our preferred shares;
|
| • |
U.S. Holders (as defined below) whose “functional currency” is not the U.S. Dollar; or
|
| • |
holders that own directly, indirectly or through attribution 10.0% or more of the voting power or value of our shares.
|
Moreover, this description does not address the United States federal estate, gift or alternative minimum tax consequences, or any state, local or foreign tax consequences, of the acquisition, ownership and disposition of our ordinary shares.
This description is based on the United States Internal Revenue Code of 1986, as amended (the “Code”), existing, proposed and temporary United States Treasury Regulations and judicial and administrative interpretations thereof, in each case as in effect and available on the date hereof. All of the foregoing are subject to change, which change could apply retroactively and could affect the tax consequences described below. There can be no assurances that the U.S. Internal Revenue Service will not take a different position concerning the tax consequences of the acquisition, ownership and disposition of our ordinary shares or that such a position could not be sustained.
For purposes of this description, a “U.S. Holder” is a beneficial owner of our ordinary shares that, for United States federal income tax purposes, is:
| • |
an individual holder that is a citizen or resident of the United States;
|
| • |
a corporation (or other entity treated as a corporation for United States federal income tax purposes) created or organized in or under the laws of the United States or any state thereof, including the District of Columbia;
|
| • |
an estate the income of which is subject to United States federal income taxation regardless of its source; or
|
| • |
a trust if such trust has validly elected to be treated as a United States person for United States federal income tax purposes or if (1) a court within the United States is able to exercise primary supervision over its administration and (2) one or more United States persons have the authority to control all of the substantial decisions of such trust.
|
If a partnership (or any other entity treated as a partnership for United States federal income tax purposes) holds our ordinary shares, the tax treatment of a partner in such partnership will generally depend on the status of the partner and the activities of the partnership. Such a partner or partnership should consult its tax advisor as to its tax consequences.
116
You should consult your tax advisor with respect to the United States federal, state, local and foreign tax consequences of acquiring, owning and disposing of our ordinary shares.
Distributions
Subject to the discussion below under “Passive foreign investment company considerations,” if you are a U.S. Holder, the gross amount of any distribution made to you with respect to our ordinary shares before reduction for any Israeli taxes withheld therefrom, other than pro rata distributions of our ordinary shares to all our shareholders, generally will be includible in your income as dividend income to the extent such distribution is paid out of our current or accumulated earnings and profits as determined under United States federal income tax principles. Subject to the discussion below under “Passive foreign investment company considerations,” non-corporate U.S. Holders may qualify for the lower rates of taxation with respect to dividends on ordinary shares applicable to long-term capital gains (meaning, gains from the sale of capital assets held for more than one year) provided that certain conditions are met, including certain holding period requirements and the absence of certain risk reduction transactions. However, such dividends will not be eligible for the dividends received deduction generally allowed to corporate U.S. Holders. Subject to the discussion below under “Passive foreign investment company considerations,” to the extent that the amount of any distribution by us exceeds our current and accumulated earnings and profits as determined under United States federal income tax principles, it will be treated first as a tax-free return of your adjusted tax basis in our ordinary shares and thereafter as capital gain. We do not expect to maintain calculations of our earnings and profits under United States federal income tax principles and, therefore, U.S. Holders should expect that the entire amount of any distribution generally will be reported as dividend income.
Dividends paid to U.S. Holders with respect to our ordinary shares will be treated as foreign source income, which may be relevant in calculating your foreign tax credit limitation. Subject to certain conditions and limitations, Israeli tax withheld on dividends may be deducted from your taxable income or credited against your United States federal income tax liability. The limitation on foreign taxes eligible for credit is calculated separately with respect to specific classes of income. For this purpose, dividends that we distribute generally should constitute “passive category income,” or, in the case of certain U.S. Holders, “general category income.” A foreign tax credit for foreign taxes imposed on distributions may be denied if you do not satisfy certain minimum holding period requirements. In addition, for periods in which we are a “United Stated-owned foreign corporation”, a portion of dividends paid by us may be treated as U.S. source solely for purposes of the foreign tax credit. We would be treated as a United States-owned foreign corporation if 50% or more of the total value or total voting power of our stock is owned, directly, indirectly or by attribution, by United States persons. To the extent any portion of our dividends is treated as U.S. source income pursuant to this rule, the ability of a U.S. Holder to claim a foreign tax credit for any Israeli withholding taxes payable in respect of our dividends may be limited. A U.S. Holder entitled to benefits under the United States-Israel Tax Treaty may, however, elect to treat any dividends as foreign source income for foreign tax credit purposes if the dividend income is separated from other income items for purposes of calculating the U.S. Holder’s foreign tax credit. The rules relating to the determination of the foreign tax credit are complex, and you should consult your tax advisor to determine whether and to what extent you will be entitled to this credit.
Future distributions with respect to our ordinary shares may be paid in U.S. dollars or NIS. If a distribution is denominated in NIS, the amount of such distribution will equal the U.S. dollar value of the NIS received, calculated by reference to the exchange rate in effect on the date that distribution is received, whether or not the U.S. Holder in fact converts any NIS received into U.S. dollars at that time. If the distribution is converted into U.S. dollars on the date of receipt, a U.S. Holder generally will not be required to recognize foreign currency gain or loss in respect of the distribution. A U.S. Holder may have foreign currency gain or loss if the distribution is converted into U.S. dollars after the date of receipt. Any gains or losses resulting from the conversion of NIS into U.S. dollars will be treated as ordinary income or loss, as the case may be, of the U.S. Holder and will be U.S.-source.
117
Sale, exchange or other disposition of ordinary shares
Subject to the discussion below under “Passive foreign investment company considerations,” U.S. Holders generally will recognize gain or loss on the sale, exchange or other disposition of our ordinary shares equal to the difference between the amount realized on such sale, exchange or other disposition and such holder’s adjusted tax basis in our ordinary shares, and such gain or loss will be capital gain or loss. The adjusted tax basis in an ordinary share generally will be equal to the cost of such ordinary
share. If you are a non-corporate U.S. Holder, capital gain from the sale, exchange or other disposition of ordinary shares is generally eligible for a preferential rate of taxation applicable to capital gains, if your holding period for such ordinary shares exceeds one year (meaning, such gain is long-term capital gain). The deductibility of capital losses for United States federal income tax purposes is subject to limitations under the Code. Any such gain or loss that a U.S. Holder recognizes generally will be treated as U.S. source income or loss for foreign tax credit limitation purposes.
Passive foreign investment company considerations
If we were to be classified as a “passive foreign investment company,” or PFIC, in any taxable year, a U.S. Holder would be subject to special rules generally intended to reduce or eliminate any benefits from the deferral of United States federal income tax that a U.S. Holder could derive from investing in a non-U.S. company that does not distribute all of its earnings on a current basis.
A non-U.S. corporation will be classified as a PFIC for United States federal income tax purposes in any taxable year in which, after applying certain look-through rules, either:
| • |
at least 75% of its gross income is “passive income”; or
|
| • |
at least 50% of the average value of its gross assets is attributable to assets that produce “passive income” or are held for the production of passive income.
|
Passive income for this purpose generally includes dividends, interest, royalties, rents, gains from commodities and securities transactions, the excess of gains over losses from the disposition of assets which produce passive income, and includes amounts derived by reason of the temporary investment of funds raised in offerings of our ordinary shares. If a non-U.S. corporation owns at least 25% by value of the stock of another corporation, the non-U.S. corporation is treated for purposes of the PFIC tests as owning its proportionate share of the assets of the other corporation and as receiving directly its proportionate share of the other corporation’s income. If we are classified as a PFIC in any year with respect to which a U.S. Holder owns our ordinary shares, we will continue to be treated as a PFIC with respect to such U.S. Holder in all succeeding years during which the U.S. Holder owns our ordinary shares, regardless of whether we continue to meet the tests described above.
Based on the composition of our income, the composition and estimated fair market value of our assets and the nature of our business, we do not believe we were a PFIC for the taxable year ended December 31, 2016 and do not expect that we will be classified as a PFIC for the taxable year ending December 31, 2017. However, because PFIC status is based on our income, assets and activities for the entire taxable year, it is not possible to determine whether we will be characterized as a PFIC for the 2017 taxable year until after the close of the taxable year. Moreover, we must determine our PFIC status annually based on tests which are factual in nature, and our status in future years will depend on our income, assets and activities in those years. Furthermore, because the value of our gross assets is likely to be determined in large part by reference to our market capitalization, a decline in the value of our ordinary shares may result in our becoming a PFIC. There can be no assurance that we will not be considered a PFIC for any taxable year. If we were a PFIC then unless you make one of the elections described below, a special tax regime will apply to both (a) any “excess distribution” by us to you (generally, your ratable portion of distributions in any year which are greater than 125% of the average annual distribution received by you in the shorter of the three preceding years or your holding period for our ordinary shares) and (b) any gain realized on the sale or other disposition of the ordinary shares.
Under this regime, any excess distribution and realized gain will be treated as ordinary income and will be subject to tax as if (a) the excess distribution or gain had been realized ratably over your holding period, (b) the amount deemed realized in each year had been subject to tax in each year of that holding period at the highest marginal rate for such year (other than income allocated to the current period or any taxable period before we became a PFIC, which will be subject to tax at the U.S. Holder’s regular ordinary income rate for the current year and will not be subject to the interest charge discussed below), and (c) the interest charge generally applicable to underpayments of tax had been imposed on the taxes deemed to have been payable in those years. In addition, dividend distributions made to you will not qualify for the lower rates of taxation applicable to long-term capital gains discussed above under “Distributions.” Certain elections may be available that would result in an alternative treatment (such as mark-to-market treatment) of our ordinary shares. We do not intend to provide the information necessary for U.S. Holders to make qualified electing fund elections if we are classified as a PFIC. U.S. Holders should consult their tax advisors to determine whether any of these elections would be available and if so, what the consequences of the alternative treatments would be in their particular circumstances.
118
If we are determined to be a PFIC, the general tax treatment for U.S. Holders described in this paragraph would apply to indirect distributions and gains deemed to be realized by U.S. Holders in respect of any of our subsidiaries that also may be determined to be PFICs.
If a U.S. Holder owns ordinary shares during any year in which we are classified as a PFIC and the U.S. Holder recognizes gain on a disposition of our ordinary shares or receives distributions with respect to our ordinary shares, the U.S. Holder generally will be required to file an IRS Form 8621 with respect to the company, generally with the U.S. Holder’s federal income tax return for that year. If our company were a PFIC for a given taxable year, then you should consult your tax advisor concerning your annual filing requirements.
U.S. Holders should consult their tax advisors regarding whether we are a PFIC and the potential application of the PFIC rules.
Backup withholding tax and information reporting requirements
United States backup withholding tax and information reporting requirements may apply to certain payments to certain holders of stock. Information reporting generally will apply to payments of dividends on, and to proceeds from the sale or redemption of, our ordinary shares made within the United States, or by a U.S. payor or U.S. middleman, to a holder of our ordinary shares, other than an exempt recipient (including a payee that is not a United States person that provides an appropriate certification and certain other persons). A payor will be required to withhold backup withholding tax from any payments of dividends on, or the proceeds from the sale or redemption of, ordinary shares within the United States, or by a U.S. payor or U.S. middleman, to a holder, other than an exempt recipient, if such holder fails to furnish its correct taxpayer identification number or otherwise fails to comply with, or establish an exemption from, such backup withholding tax requirements. Any amounts withheld under the backup withholding rules will be allowed as a credit against the beneficial owner’s United States federal income tax liability, if any, and any excess amounts withheld under the backup withholding rules may be refunded, provided that the required information is timely furnished to the U.S. Internal Revenue Service.
3.8% Medicare Tax on “Net Investment Income
”
Certain U.S. Holders who are individuals, estates or trusts are required to pay an additional 3.8% tax on, among other things, dividends and capital gains from the sale or other disposition of shares of common stock.
Foreign asset reporting
Certain U.S. Holders who are individuals are required to report information relating to an interest in our ordinary shares, subject to certain exceptions (including an exception for shares held in accounts maintained by U.S. financial institutions). U.S. Holders are urged to consult their tax advisors regarding their information reporting obligations, if any, with respect to their ownership and disposition of our ordinary shares.
The above description is not intended to constitute a complete analysis of all tax consequences relating to the acquisition, ownership and disposition of our ordinary shares. You should consult your tax advisor concerning the tax consequences of your particular situation.
Not applicable.
Not applicable.
We are currently subject to the informational requirements of the Exchange Act applicable to foreign private issuers and fulfill the obligations of these requirements by filing reports with the SEC. As a foreign private issuer, we are exempt from the rules under the Exchange Act relating to the furnishing and content of proxy statements, and our officers, directors and principal shareholders are exempt from the reporting and short-swing profit recovery provisions contained in Section 16 of the Exchange Act. In addition, we are not required under the Exchange Act to file periodic reports and financial statements with the SEC as frequently or as promptly as U.S. companies whose securities are registered under the Exchange Act. However, we intend to file with the SEC, within 120 days after the end of each subsequent fiscal year, an annual report on Form 20-F containing financial statements which will be examined and reported on, with an opinion expressed, by an independent public accounting firm. We also intend to furnish with the SEC reports on Form 6-K containing unaudited quarterly financial information.
119
You may read and copy any document we file with the SEC without charge at the SEC’s public reference room at 100 F Street, N.E., Room 1580, Washington, D.C. 20549. You may also obtain copies of the documents at prescribed rates by writing to the Public Reference Section of the SEC at 100 F Street, N.E., Room 1580, Washington, D.C. 20549. Please call the SEC at 1-800-SEC-0330 for further information on the public reference room. The SEC also maintains an Internet site that contains reports and other information regarding issuers that file electronically with the SEC. Our filings with the SEC are also available to the public through this website at http://www.sec.gov. As permitted under Nasdaq Rule 5250(d)(1)(C), we will post our annual reports filed with the SEC on our website at we will post our annual reports filed with the SEC on our website at http://www.caesarstone.com. The information contained on our website is not part of this or any other report filed with or furnished to the SEC. We will also furnish hard copies of such reports to our shareholders free of charge upon written request.
Not applicable.
Since July 1, 2012, our functional currency has been the U.S. dollar. We conduct business in a large number of countries and, as a result, we are exposed to foreign currency fluctuations. The majority of our revenues are denominated in U.S. dollars, Australian dollars and Canadian dollars. Sales in Australian dollars accounted for 24.3%, 22.1%, and 24.0%, of our revenues in 2016, 2015 and 2014, respectively. Sales in Canadian dollars accounted for 15.9%, 14.2% and 12.9% of our revenues in 2016, 2015 and 2014, respectively. As a result, devaluation of the Australian dollar, and to a lesser extent, the Canadian dollar, relative to the U.S. dollar could reduce our profitability significantly. Our expenses are largely denominated in U.S. dollars, NIS and euros, and a smaller proportion in Canadian and Australian dollars. As a result, a revaluation of the NIS, or to a lesser extent, the euro, relative to the U.S. dollar could reduce our profitability significantly.
The following table presents information about the year over year percentage changes in the average exchange rates of the principal currencies that impact our results of operations:
|
Australian
dollar against U.S. dollar |
Canadian
dollar against U.S. dollar |
NIS against
U.S. dollar |
Euro against
U.S. dollar |
|||||||||||||
|
2014
|
(6.7
|
)%
|
(6.7
|
)%
|
1.1
|
%
|
0.0
|
%
|
||||||||
|
2015
|
(16.6
|
)%
|
(13.5
|
)%
|
(8.1
|
)%
|
(16.5
|
)%
|
||||||||
|
2016
|
(1.3
|
)%
|
(3.7
|
)%
|
(1.1
|
)%
|
(0.3
|
)%
|
||||||||
Assuming a 10% decrease in the Australian dollar relative to the U.S. dollar and assuming no other changes, our operating income would have decreased by $10.7 million in 2016.
Assuming a 10% decrease in the Canadian dollar relative to the U.S. dollar and assuming no other changes, our operating income would have decreased by $5.9 million in 2016.
An appreciation of NIS relative to the U.S. dollar, would increase our revenues generated in Israel. However, our operating costs denominated in U.S. dollars would increase to a greater extent, resulting in lower operating income. As a result, assuming a 10% appreciation in NIS relative to the U.S. dollar and assuming no other changes, our operating income, as reported in U.S. dollars, would decrease by $5.2 million in 2016.
An appreciation of the euro relative to the U.S. dollar, would increase our revenues generated in Europe and some other countries. However, our operating costs denominated in U.S. dollars would increase to a greater extent, resulting in lower operating income. Assuming a 10% increase in the euro relative to the U.S. dollar and assuming no other changes, our operating income would have decreased by $1.4 in 2016.
120
Our exposure related to exchange rate changes on our net asset position denominated in currencies other than the U.S. dollar varies with changes in our net asset position. Net asset position refers to financial assets, such as trade receivables and cash, less financial liabilities, such as loans and accounts payable. The impact of any such transaction gains or losses is reflected in finance expenses, net. Our most significant exposure as of December 31, 2016, relates to a potential change in the exchange rate of the Australian dollar and NIS and to a lesser extent to the euro, the Canadian dollar and the British pound relative to the U.S. dollar. Assuming a 10% decrease in the Australian dollar relative to the U.S. dollar, and assuming no other change, our finance expenses, net would have increased by $2.8 million. Assuming a 10% decrease in the NIS, euro, Canadian dollar and British pound relative to the U.S. dollar, and assuming no other changes, our finance expenses, net would have decreased by $1.2 million, $1.0 million, $0.5 million and $0.3 million, respectively.
We use forward contracts to manage currency risk with respect to those currencies in which we generate revenues or incur expenses. Beginning in July 2012, when we changed our functional currency to the U.S. dollar, we have used Australian/U.S. dollar, Euro/U.S. dollar and U.S. dollar/Canadian dollar forward contracts along with U.S. dollar/NIS and Euro/U.S. dollar options. Prior to July 2012, we used Australian dollar/NIS, Euro/NIS and Canadian dollar/NIS forward contracts. The derivatives instruments partially offset the impact of foreign currency fluctuations. We may in the future use derivative instruments to a greater extent or engage in other transactions or invest in market risk sensitive instruments if we determine that it is necessary to offset these risks. Currency instruments other than our U.S. dollar/NIS forward contracts are not designated as hedging accounting instruments under ASC 815, Derivatives and Hedging. Therefore, we have been incurring financial loss or income as a result of these derivatives.
As of December 31, 2016, we had the following foreign currency hedge portfolio (U.S. dollar in thousands):
|
USD/NIS
|
USD/CAD
|
AUD/USD | TOTAL | ||||||||||||||
|
Buy forward contracts
Notional
|
—
|
21,411
|
—
|
21,411
|
|||||||||||||
|
Fair value
|
—
|
880
|
—
|
880
|
|||||||||||||
|
Average rate
|
—
|
1.30
|
—
|
—
|
|||||||||||||
|
Sell forward contracts
Notional
|
13,303
|
—
|
37,497
|
50,800
|
|||||||||||||
|
Fair value
|
28
|
—
|
1,311
|
1,339
|
|||||||||||||
|
Average rate
|
3.84
|
—
|
0.75
|
||||||||||||||
|
Buy put options
Notional
|
36,800
|
—
|
—
|
36,800
|
|||||||||||||
|
Fair value
|
251
|
—
|
—
|
251
|
|||||||||||||
|
Average rate
|
3.75
|
—
|
—
|
||||||||||||||
|
Sell call options
Notional
|
35,762
|
—
|
—
|
35,762
|
|||||||||||||
|
Fair value
|
(436
|
)
|
—
|
—
|
(436
|
)
|
|||||||||||
|
Average rate
|
3.86
|
—
|
—
|
||||||||||||||
|
Total notional value
|
85,865
|
21,411
|
37,497
|
186,966
|
|||||||||||||
|
Total fair value
|
$
|
(157
|
)
|
$
|
$880
|
$
|
1,311
|
$
|
2,034
|
||||||||
For the year ended December 31, 2016, net embedded gains on our foreign currency open derivatives transactions were $2.0 million. For the year ended December 31, 2015, net embedded gains on our foreign currency open derivative transactions were $0.6 million. For the year ended December 31, 2014, net embedded losses on our foreign currency open derivative transactions were $0.4 million.
For the year ended December 31, 2016, our finance income generated from derivatives including the impact of the foreign exchange rate derivatives fair value measurement were $1.3 million. For the year ended December 31, 2015, our finance income generated from derivatives including the impact of the foreign exchange rate revaluation were $0.5 million. For the year ended December 31, 2014, our finance income generated from derivatives including the impact of the foreign exchange rate revaluation were $0.6 million.
121
Interest rates
We had cash and short-term bank deposits totaling $106.3 million at December 31, 2016. Our cash, cash equivalents and short term bank deposits are held for working capital and other purposes. We do not enter into investments for trading or speculative purposes. Due to the short-term nature of the investments in cash equivalents and our relatively low debt balances, we do not believe that changes in interest rates will have a material impact on our financial position and results of operations and, therefore, we believe that a sensitivity analysis would not be material to investors. However, declines in interest rates will reduce future investment income.
Inflation
Inflationary factors such as increases in the cost of our labor may adversely affect our operating results. Although we do not believe that inflation has had a material impact on our financial position or results of operations to date, a high rate of inflation in the future may have an adverse effect on our ability to maintain current levels of gross profit margins and operating expenses as a percentage of revenues if the selling prices of our products do not increase in line with increases in costs.
Not applicable.
122
None.
Initial Public Offering
The effective date of the registration statement (File no. 333-179556) for our IPO of ordinary shares, par value NIS 0.04, was March 21, 2012. The offering commenced on March 6, 2012 and was closed on March 27, 2012. We issued a total of 7,659,000 ordinary shares with aggregate proceeds of $84.2 million (including the over-allotment option granted to the underwriters) at a price per share of $11.00. Under the terms of the offering, we incurred aggregate underwriting discounts of $5.5 million (including the over-allotment option), resulting in net proceeds of $78.8 million. We also incurred expenses of $3.4 million in connection with the offering. J.P. Morgan Securities LLC, Barclays Capital Inc. and Credit Suisse Securities (USA) LLC were joint bookrunning managers for the offering, and Robert W. Baird & Co. Incorporated and Stifel, Nicolaus & Company, Incorporated were co-managers for the offering.
From the effective date of the registration statement and until December 31, 2012, we used a total of $27.2 million of the net proceeds to pay special dividends to our existing shareholders. See “ITEM 8.A: Financial Information—Consolidated Statements and Other Financial Information—Dividends.” We used $6.5 million of the net proceeds to pay the balance of the acquisition price for the remaining 75% equity interest in our U.S. distributor, Caesarstone USA, in which we acquired a 25% interest in January 2007. We acquired the remaining interest in May 2011 and the balance of the purchase price was payable following the closing of our IPO.
We used the remaining balance of the net proceeds to expand our production capacity during 2013 and 2015. See “ITEM 4: Information on Caesarstone—History and Development of Caesarstone—Principal Capital Expenditures.” We may choose to expand our production capacity by several means, including an acquisition, and the funds required may be greater or less.
None of the net proceeds of the offering was paid directly or indirectly to any director, officer, general partner of ours or to their associates, persons owning ten percent or more of any class of our equity securities, or to any of our affiliates.
(a)
Disclosure Controls and Procedures
. Our management, including our Chief Executive Officer and Chief Financial Officer, has evaluated the effectiveness of our disclosure controls and procedures (as such term is defined in Rules 13a-15(e) and 15d-15(e) under the Exchange Act) as of December 31, 2016. Based on such evaluation, our Chief Executive Officer and Chief Financial Officer have concluded that, as of December 31, 2016, our disclosure controls and procedures were effective such that the information required to be disclosed by us in reports that we file or submit under the Exchange Act is recorded, processed, summarized and reported within the time periods specified in SEC rules and forms, and is accumulated and communicated to our management, including our Chief Executive Officer and Chief Financial Officer, as appropriate to allow timely decisions regarding required disclosure.
123
(b)
Management’s Annual Report on Internal Control Over Financial Reporting
. Our management, under the supervision of our Chief Executive Officer and Chief Financial Officer, is responsible for establishing and maintaining adequate internal control over financial reporting as defined in Rules 13a-15(f) and 15d-15(f) under the Exchange Act. Our internal control over financial reporting is a process to provide reasonable assurance regarding the reliability of financial reporting and the preparation of financial statements for external purposes in accordance with generally accepted accounting principles. Our internal control over financial reporting includes those policies and procedures that:
| • |
pertain to the maintenance of records that, in reasonable detail, accurately and fairly reflect the transactions and dispositions of our assets;
|
| • |
provide reasonable assurance that transactions are recorded as necessary to permit preparation of financial statements in accordance with generally accepted accounting principles, and that our receipts and expenditures are being made only in accordance with authorizations of our management and directors; and
|
| • |
provide reasonable assurance regarding prevention or timely detection of unauthorized acquisition, use or disposition of our assets that could have a material effect on the financial statements.
|
Our management, including our Chief Executive Officer and Chief Financial Officer, assessed the effectiveness of our internal control over financial reporting as of December 31, 2016. In making this assessment, our management used the criteria established in
Internal Control—Integrated Framework (2013)
issued by the Committee of Sponsoring Organizations of the Treadway Commission. Our management has concluded, based on its assessment, that our internal control over financial reporting was effective as of December 31, 2016 to provide reasonable assurance regarding the reliability of financial reporting and the preparation of consolidated financial statements for external reporting purposes in accordance with generally accepted accounting principles.
(c)
Attestation report of the registered public accounting firm
. Our independent registered public accounting firm has audited the consolidated financial statements included in this annual report on Form 20-F, and as part of its audit, has issued its audit report on the effectiveness of our internal control over financial reporting. This report is included in pages F-2 and F-3 of this annual report on Form 20-F and is incorporated herein by reference.
(d)
Changes in Internal Control Over Financial Reporting
. During the period covered by this report, no changes in our internal control over financial reporting (as such term is defined in Rules 13a-15(f) and 15d-15(f) under the Exchange Act) have occurred that have materially affected, or are reasonably likely to materially affect, our internal control over financial reporting.
Our board of directors has determined that each of Ofer Borovsky and Irit Ben-Dov qualifies as an “audit committee financial expert,” as defined by the rules of the SEC, and has the requisite financial experience required by the Nasdaq rules. In addition, Dr. Borovsky and Ms. Ben-Dov are independent as such term is defined in Rule 10A-3(b)(1) under the Exchange Act and under Nasdaq rules.
The Company has adopted a code of ethics (“
Code of Ethics
”) that applies to the Company’s chief executive officer, and all senior financial officers, including the Company’s chief financial officer, the controller and persons performing similar functions. The Company has also adopted a separate code of conduct that applies to the Company’s directors, officers and employees, which was most recently amended in August 2016. We have posted these codes on our corporate website at
http://ir.caesarstone.com/governance.cfm
. Information contained on, or that can be accessed through, our website does not constitute a part of this annual report and is not incorporated by reference herein.
124
Waivers of our Code of Ethics may only be granted by the board of directors. Any amendments to this Code of Ethics or any waiver that is granted, and the basis for granting the waiver, will be publicly communicated as appropriate. Under Item 16B of Form 20-F, if a waiver or amendment of the Code of Ethics applies to our principal executive officer, principal financial officer, principal accounting officer, controller and other persons performing similar functions and relates to standards promoting any of the values described in Item 16B(b) of Form 20-F, we will disclose such waiver or amendment (i) on our website within five business days following the date of amendment or waiver in accordance with the requirements of Instruction 4 to Item 16B or (ii) through the filing of a Form 6-K. We granted no waivers under our Code of Ethics in 2016.
ITEM 16C: Principal Accountant Fees and Services
Fees Paid to the Auditors
The following table sets forth, for each of the years indicated, the fees billed by our independent registered public accounting firm.
|
Year ended December 31,
|
||||||||
|
2016
|
2015
|
|||||||
|
(in thousands of U.S. dollars)
|
||||||||
|
Audit fees(1)
|
$
|
798
|
$
|
685
|
||||
|
Audit-related fees(2)
|
137
|
73
|
||||||
|
Tax fees(3)
|
134
|
151
|
||||||
|
All other fees(4)
|
17
|
30
|
||||||
|
Total
|
$
|
1,086
|
$
|
939
|
||||
| (1) |
“Audit fees” include fees for services performed by our independent public accounting firm in connection with the integrated audit of our annual audit consolidated financial statements for 2016 and 2015, and its internal control over financial reporting as of December 31, 2016, certain procedures regarding our quarterly financial results submitted on Form 6-K, fees related to public offering, and consultation concerning financial accounting and reporting standards.
|
| (2) |
“Audit-related fees relate to assurance and associated services that are traditionally performed by the independent auditor.
|
| (3) |
“Tax fees” include fees for professional services rendered by our independent registered public accounting firm for tax compliance and tax advice and tax planning services on actual or contemplated transactions.
|
| (4) |
“Other fees” include fees for services rendered by our independent registered public accounting firm with respect to government incentives, due diligence investigations and other matters.
|
Audit Committee’s Pre-Approval Policies and Procedures
Our audit committee has adopted a pre-approval policy for the engagement of our independent accountant to perform certain audit and non-audit services. Pursuant to this policy, which is designed to assure that such engagements do not impair the independence of our auditors, the audit committee pre-approves annually a catalog of specific audit and non-audit services in the categories of audit service, audit-related service and tax services that may be performed by our independent accountants.
Not applicable.
The following table
is a summary of the shares repurchased by us during 2016:
|
|
Total number of shares
purchased during the month |
Average price paid per
share (U.S. dollars) |
Total number of
shares purchased
as part of publicly
announced plans or programs
(1) |
Approximate
dollar value of securities remaining that may be purchased (in millions ) |
||||||||||||
|
February 9 – February 29, 2016
|
104,500
|
$
|
33.8
|
104,500
|
$
|
36.5
|
||||||||||
|
March 1 – March 31, 2016
|
194,407
|
$
|
36.1
|
194,407
|
$
|
29.5
|
||||||||||
|
April 1 – April 30, 2016
|
197,900
|
$
|
35.3
|
197,900
|
$
|
22.5
|
||||||||||
|
May 1 – May 31, 2016
|
138,541
|
$
|
37.4
|
138,541
|
$
|
17.3
|
||||||||||
|
June 1 – June 30, 2016
|
193,735
|
$
|
36.4
|
193,735
|
$
|
10.3
|
||||||||||
|
July 1 – July 31, 2016
|
241,063
|
$
|
35.0
|
241,063
|
$
|
1.8
|
||||||||||
|
August 1 – August 8, 2016
|
32,950
|
$
|
37.3
|
32,950
|
$
|
0.6
|
||||||||||
|
Total
|
1,103,096
|
$
|
35.7
|
1,103,096
|
$
|
0.6
|
||||||||||
| (1) |
As previously announced, on February 9, 2016, our board of directors approved a program for us to repurchase up to $40.0 million of our outstanding ordinary shares. Share repurchases took place in open market transactions or in privately negotiated transactions and were made from time to time depending on market conditions, share price, trading volume and other factors. Under the program, we repurchased a total of 1,103,096 ordinary shares at an average price of $35.8 and for a total amount of $39.4 million. The repurchase program expired on August 8, 2016.
|
125
None.
As a foreign private issuer, we are permitted under Nasdaq Rule 5615(a)(3) to follow Israeli corporate governance practices instead of the Nasdaq corporate governance rules, provided we disclose which requirements we are not following and the equivalent Israeli requirement. We must also provide the Nasdaq Global Select Market with a letter from outside counsel in our home country, Israel, certifying that our corporate governance practices are not prohibited by Israeli law.
We rely on this “foreign private issuer exemption” and follow the requirements of Israeli law with respect to the quorum requirement for meetings of our shareholders, which are different from the requirements of Rule 5620(c). Under our articles of association, the quorum required for an ordinary meeting of shareholders consists of at least two shareholders present in person, by proxy or by written ballot, who hold or represent between them at least 25% of the voting power of our shares, instead of 33 1/3% of the issued share capital provided by under the Nasdaq rules. At an adjourned meeting, any number of shareholders constitutes a quorum. This quorum requirement is based on the default requirement set forth in the Companies Law. We submitted a letter to the Nasdaq Global Select Market from our outside counsel in connection with this item prior to our IPO in March 2012.
Otherwise, we comply with the Nasdaq corporate governance rules requiring that listed companies have a majority of independent directors and maintain a compensation and nominating committee composed entirely of independent directors. We are also subject to Israeli corporate governance requirements applicable to companies incorporated in Israel whose securities are listed for trading on a stock exchange outside of Israel.
We may in the future provide the Nasdaq Global Select Market with an additional letter or letters notifying the organization that we are following our home country practices, consistent with the Companies Law and practices, in lieu of other requirements of Nasdaq Rule 5600.
Not applicable.
Not applicable.
See Financial Statements included at the end of this report.
See exhibit index incorporated herein by reference.
126
SIGNATURES
The registrant certifies that it meets all of the requirements for filing on Form 20-F and has duly caused and authorized the undersigned to sign this annual report on its behalf.
|
Caesarstone Ltd.
|
|||
|
By:
|
/s/ Raanan Zilberman
|
||
|
Raanan Zilberman
|
|||
|
Chief Executive Officer
|
|||
|
Date: March 13, 2017
|
|||
127
ANNUAL REPORT ON FORM 20-F
INDEX OF EXHIBITS
|
Number
|
Description
|
|
|
1.1
|
Articles of Association of the Registrant, as amended on February
21, 2014 (4)
|
|
|
1.2
|
Memorandum of Association of the Registrant (2)
∞
|
|
|
4.1
|
Land Purchase Agreement and Leaseback, by and between Kibbutz Sdot-Yam and the Registrant, dated March 31, 2011 (3)
∞
|
|
|
4.2
|
Addendum, dated February 13, 2012 to the Land Purchase Agreement and Leaseback, by and between Kibbutz Sdot-Yam and the Registrant, dated March 31, 2011 (3)
∞
|
|
|
4.3
|
Agreement by and between Mikroman Madencilik San ve TIC.LTD.STI and the Registrant, dated September 27, 2010 (1)
∞
|
|
|
4.4
|
Summary of draft
letter
agreement between the Registrant and Mikroman Madencilik San ve TIC.LTD.STI for 2017
*
|
|
|
4.5
|
2011 Incentive Compensation Plan, as amended (6)
|
|
|
4.6
|
Form of Indemnification Agreement (3)
|
|
|
4.7
|
Land Use Agreement, by and between Kibbutz Sdot-Yam and the Registrant, dated July 20, 2011 (3)
∞
|
|
|
4.8
|
Addendum, dated February 13, 2012, to the Land Use Agreement, by and between Kibbutz Sdot-Yam and the Registrant, dated July 20, 2011 (3)
∞
|
|
|
4.9
|
Manpower Agreement, by and between Kibbutz Sdot-Yam and the Registrant, dated July 20, 2011 (3)
∞
|
|
|
4.10
|
Addendum, dated July 2015, to the Manpower Agreement, by and between Kibbutz Sdot-Yam and the Registrant, dated July 20, 2011 (6)
∞
|
|
|
4.11
|
Services Agreement, by and between Kibbutz Sdot-Yam and the Registrant, dated July 2015 (6)
∞
|
|
|
4.12
|
Agreement for Arranging Additional Accord, by and between Kibbutz Sdot-Yam and the Registrant, dated July 20, 2011 (3)
∞
|
|
|
4.13
|
Addendum, dated February 13, 2012 to the Agreement for Arranging Additional Accord, by and between Kibbutz Sdot-Yam and the Registrant, dated July 20, 2011 (3)
∞
|
|
|
4.14
|
Registration Rights Agreement, by and among the Registrant, Kibbutz Sdot-Yam, Tene Quartz Surfaces Investments Limited Partnership and Tene Quartz Surfaces Investments (Parallel) Limited Partnership, dated July 21, 2011 (3)
|
|
|
4.15
|
Extension of Registration Rights Agreement, by and among the Registrant, Kibbutz Sdot-Yam, Tene Quartz Surfaces Investments Limited Partnership and Tene Quartz Surfaces Investments (Parallel) Limited Partnership, dated February 13, 2012 (3)
|
|
|
4.16
|
Reimbursement Agreement, dated January 4, 2012, by and between the Registrant and Kibbutz Sdot-Yam (3)
∞
|
|
|
4.17
|
Compensation Policy of Caesarstone Ltd.
|
|
|
4.18
|
Agreement for the Supply of Bretonstone Slab Plants, dated October 18, 2012 (5)*
|
|
|
4.19
|
USA Plant Exercise Notice, dated November 6, 2013, pursuant to the Agreement for the Supply of Bretonstone Slab Plants, dated October 18, 2012 (5)*
|
|
|
4.20
|
Addendum, dated February 12, 2014, to the Agreement for the Supply of Bretonstone Slab Plants, dated October 18, 2012 and to the USA Plant Exercise Notice, dated November 6, 2013 (5)*
|
|
|
4.21
|
Agreement for the Supply of Bretonstone Slab Plants, dated June 5, 2014 (5)*
|
|
|
4.22
|
Agreement between the Registrant and Polat Maden Sanayi ve Ticaret A.S. for 2017*
|
128
|
8.1
|
List of Subsidiaries of the Registrant
|
|
|
12.1
|
Certification of Principal Executive Officer required by Rule 13a-14(a) and Rule 15d-14(a) (Section 302 Certifications)
|
|
|
12.2
|
Certification of Principal Financial Officer required by Rule 13a-14(a) and Rule 15d-14(a) (Section 302 Certifications)
|
|
|
13.1
|
Certification of Principal Executive Officer and Principal Financial Officer required by Rule 13a-14(b) and Rule 15d-14(b) (Section 906 Certifications), furnished herewith
|
|
|
15.1
|
Consent of Kost Forer Gabbay & Kasierer (a member of Ernst & Young Global)
|
|
|
15.2
|
Consent of Grant Thornton Audit Pty Ltd.
|
|
|
15.3
|
Consent of Freedonia Custom Research, Inc.
|
|
|
101.INS
|
XBRL Instance Document
|
|
|
101.SCH
|
XBRL Taxonomy Extension Schema Document
|
|
|
101.PRE
|
XBRL Taxonomy Presentation Linkbase Document
|
|
|
101.CAL
|
XBRL Taxonomy Calculation Linkbase Document
|
|
|
101.LAB
|
XBRL Taxonomy Label Linkbase Document
|
|
|
101.DEF
|
XBRL Taxonomy Extension Definition Linkbase Document
|
| (1) |
Previously filed with the Securities and Exchange Commission on March 19, 2012 pursuant to a registration statement on Form F-1/A (File No. 333-179556) and incorporated by reference herein.
|
| (2) |
Previously filed with the Securities and Exchange Commission on March 6, 2012 pursuant to a registration statement on Form F-1/A (File No. 333-179556) and incorporated by reference herein.
|
| (3) |
Previously filed with the Securities and Exchange Commission on February 16, 2012 pursuant to a registration statement on Form F-1 (File No. 333-179556) and incorporated by reference herein.
|
| (4) |
Previously filed with the Securities and Exchange Commission on May 13, 2014 pursuant to an annual report on Form 20-F and incorporated by reference herein.
|
| (5) |
Previously filed with the Securities and Exchange Commission on March 12, 2015 pursuant to an annual report on Form 20-F and incorporated by reference herein.
|
| (6) |
Previously filed with the Securities and Exchange Commission on March 7, 2016 pursuant to an annual report on Form 20-F and incorporated by reference herein.
|
| * |
Portions of this exhibit were omitted and a complete copy of each agreement has been provided separately to the Securities and Exchange Commission pursuant to the Company’s application requesting confidential treatment under Rule 24b-2 under the Exchange Act.
|
∞
English translation of original Hebrew document
129
CAESARSTONE LTD. (FORMERLY CAESARSTONE SDOT-YAM LTD.) AND ITS SUBSIDIARIES
CONSOLIDATED FINANCIAL STATEMENTS
AS OF DECEMBER 31, 2016
INDEX
|
Page
|
|
|
F-2 - F-3
|
|
|
F-4 - F-5
|
|
|
F-6
|
|
|
F-7
|
|
|
F-8
|
|
|
F-9 - F-10
|
|
|
F-11 - F-67
|
|
| Reports of Grant Thornton Audit Pty Ltd. | F- 68 - F- 70 |
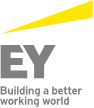
To the Board of Directors and Shareholders of
CAESARSTONE LTD. (FORMERLY CAESARSTONE SDOT-YAM LTD.)
We have audited the accompanying consolidated balance sheets of Caesarstone Ltd. and subsidiaries (the "Company") as of December 31, 2016 and 2015 and the related consolidated statements of income, comprehensive income, shareholders' equity and cash flows for each of the three years in the period ended December 31, 2016. These financial statements are the responsibility of the Company's management. Our responsibility is to express an opinion on these financial statements based on our audits. We did not audit the financial statements of Caesarstone Australia Pty Ltd., a wholly-owned subsidiary, which statements reflect total assets constituting 10% in 2016 and 10% in 2015 and total revenues constituting 24% in 2016, 22% in 2015 and 24% in 2014 of the related consolidated totals. Those statements were audited by other auditors whose report has been furnished to us, and our opinion, insofar as it relates to the amounts included for Caesarstone Australia Pty Limited, is based solely on the report of the other auditors.
We conducted our audits in accordance with the standards of the Public Company Accounting Oversight Board (United States). Those standards require that we plan and perform the audit to obtain reasonable assurance about whether the financial statements are free of material misstatement. An audit includes examining, on a test basis, evidence supporting the amounts and disclosures in the financial statements. An audit also includes assessing the accounting principles used and significant estimates made by management, as well as evaluating the overall financial statement presentation. We believe that our audits and the report of the other auditor provide a reasonable basis for our opinion.
In our opinion, based on our audits and the report of the other auditor, the consolidated financial statements referred to above present fairly, in all material respects, the consolidated financial position of the Company and subsidiaries at December 31, 2016 and 2015 and the consolidated results of their operations and their cash flows for each of the three years in the period ended December 31, 2016, in conformity with U.S. generally accepted accounting principles.
We also have audited, in accordance with the standards of the Public Company Accounting Oversight Board (United States), the Company's internal control over financial reporting as of December 31, 2016, based on criteria established in Internal Control-Integrated Framework issued by the Committee of Sponsoring Organizations of the Treadway Commission (2013 framework), and our report dated March 13, 2017, expressed an unqualified opinion thereon.
|
Tel-Aviv, Israel
|
/s/ Kost Forer Gabbay & Kasierer
|
|
|
March 13, 2017
|
KOST FORER GABBAY & KASIERER
|
|
| A Member of Ernst & Young Global |
F - 2
REPORT OF INDEPENDENT REGISTERED PUBLIC ACCOUNTING FIRM
To the Board of Directors and Shareholders of
CAESARSTONE LTD. (FORMERLY CAESARSTONE SDOT-YAM LTD.)
We have audited Caesarstone Ltd. and subsidiaries internal control over financial reporting as of December 31, 2016, based on criteria established in Internal Control-Integrated Framework issued by the Committee of Sponsoring Organizations of the Treadway Commission (2013 framework) (the COSO criteria). Caesarstone Ltd.'s management is responsible for maintaining effective internal control over financial reporting, and for its assessment of the effectiveness of internal control over financial reporting included in the accompanying management's annual report on internal control over financial reporting. Our responsibility is to express an opinion on the Company's internal control over financial reporting based on our audit. We did not examine the effectiveness of internal control over financial reporting of Caesarstone Australia Pty Ltd. a wholly owned subsidiary, whose financial statements reflect total assets and revenues constituting 10% and 24%, respectively, of the related consolidated financial statement amounts as of and for the year ended December 31, 2016. The effectiveness of Caesarstone Australia Pty Ltd.'s internal control over financial reporting was audited by other auditors whose report has been furnished to us, and our opinion, insofar as it relates to the effectiveness of Caesarstone Australia Pty Ltd.'s internal control over financial reporting, is based solely on the report of the other auditors.
We conducted our audit in accordance with the standards of the Public Company Accounting Oversight Board (United States). Those standards require that we plan and perform the audit to obtain reasonable assurance about whether effective internal control over financial reporting was maintained in all material respects. Our audit included obtaining an understanding of internal control over financial reporting, assessing the risk that a material weakness exists, testing and evaluating the design and operating effectiveness of internal control based on the assessed risk, and performing such other procedures, as we considered necessary in the circumstances. We believe that our audit provides a reasonable basis for our opinion.
A company's internal control over financial reporting is a process designed to provide reasonable assurance regarding the reliability of financial reporting and the preparation of financial statements for external purposes in accordance with generally accepted accounting principles. A company's internal control over financial reporting includes those policies and procedures that (1) pertain to the maintenance of records that, in reasonable detail, accurately and fairly reflect the transactions and dispositions of the assets of the company; (2) provide reasonable assurance that transactions are recorded as necessary to permit preparation of financial statements in accordance with generally accepted accounting principles, and that receipts and expenditures of the company are being made only in accordance with authorizations of management and directors of the company; and (3) provide reasonable assurance regarding prevention or timely detection of unauthorized acquisition, use or disposition of the company's assets that could have a material effect on the financial statements.
Because of its inherent limitations, internal control over financial reporting may not prevent or detect misstatements. Also, projections of any evaluation of effectiveness to future periods are subject to the risk that controls may become inadequate because of changes in conditions, or that the degree of compliance with the policies or procedures may deteriorate.
In our opinion, based on our audit and the report of the other auditors, Caesarstone Ltd. maintained, in all material respects, effective internal control over financial reporting as of December 31, 2016, based on the COSO criteria.
We have also audited, in accordance with the standards of the Public Company Accounting Oversight Board (United States) the consolidated balance sheets of Caesarstone Ltd. (the "Company") and subsidiaries as of December 31, 2016 and 2015 and the related consolidated statements of income, comprehensive income, shareholders' equity and cash flows for each of the three years in the period ended December 31, 2016 of Caesarstone Ltd. and subsidiaries and our report dated March 13, 2017 expressed an unqualified opinion thereon.
|
Tel-Aviv, Israel
|
/s/ Kost Forer Gabbay & Kasierer
|
|
|
March 13, 2017
|
KOST FORER GABBAY & KASIERER
A Member of Ernst & Young Global
|
F - 3
CAESARSTONE LTD. (FORMERLY CAESARSTONE SDOT-YAM LTD.)
AND ITS SUBSIDIARIES
U.S. dollars in thousands
|
December 31,
|
|||||||||||
|
Note
|
2016
|
2015
|
|||||||||
|
ASSETS
|
|||||||||||
|
Current assets:
|
|||||||||||
|
Cash and cash equivalents
|
$
|
106,270
|
$
|
62,747
|
|||||||
|
Short-term bank deposits
|
-
|
60
|
|||||||||
|
Trade receivables (net of allowance for doubtful accounts of $1,283 and $1,221 at December 31, 2016 and 2015, respectively)
|
63,072
|
59,185
|
|||||||||
|
Other accounts receivable and prepaid expenses
|
3
|
39,484
|
32,230
|
||||||||
|
Inventories
|
4
|
101,474
|
95,479
|
||||||||
|
Total
current assets
|
310,300
|
249,701
|
|||||||||
|
Long-term assets:
|
|||||||||||
|
Severance pay fund
|
3,403
|
3,296
|
|||||||||
|
Other long-term receivables
|
10
|
5,068
|
6,616
|
||||||||
|
Long-term deposits and prepaid expenses
|
2,909
|
1,987
|
|||||||||
|
Property, plant and equipment, net
|
5
|
222,818
|
225,438
|
||||||||
|
Other intangibles assets
|
6
|
4,546
|
6,883
|
||||||||
|
Goodwill
|
7
|
35,656
|
35,821
|
||||||||
|
Total
assets
|
$
|
584,700
|
$
|
529,742
|
|||||||
The accompanying notes are an integral part of the consolidated financial statements
F - 4
CAESARSTONE LTD. (FORMERLY CAESARSTONE SDOT-YAM LTD.)
AND ITS SUBSIDIARIES
CONSOLIDATED BALANCE SHEETS
U.S. dollars in thousands (except share data)
|
December 31,
|
||||||||||||
|
Note
|
2016
|
2015
|
||||||||||
|
LIABILITIES AND EQUITY
|
||||||||||||
|
Current liabilities:
|
||||||||||||
|
Short-term bank credit
|
8
|
$
|
8,540
|
$
|
3,241
|
|||||||
|
Trade payables
|
48,633
|
46,382
|
||||||||||
|
Related party and other loan
|
13
|
3,099
|
3,251
|
|||||||||
|
Accrued expenses and other liabilities
|
9
|
33,065
|
27,986
|
|||||||||
|
Total
current liabilities
|
93,337
|
80,860
|
||||||||||
|
Long-term liabilities:
|
||||||||||||
|
Long-term loan and financing leaseback from a related party
|
13
|
8,070
|
8,472
|
|||||||||
|
Accrued severance pay
|
4,265
|
4,309
|
||||||||||
|
Long-term warranty provision
|
988
|
934
|
||||||||||
|
Phantom share based payment
|
2(u)
|
|
-
|
148
|
||||||||
|
Legal settlements and loss contingencies long term
|
10
|
12,527
|
11,190
|
|||||||||
|
Deferred tax liabilities, net
|
11
|
14,921
|
14,767
|
|||||||||
|
Total
long-term liabilities
|
40,771
|
39,820
|
||||||||||
|
Redeemable non-controlling interest
|
2(v)
|
12,939
|
8,841
|
|||||||||
|
Commitments and contingent liabilities
|
10
|
|||||||||||
|
Equity:
|
12
|
|||||||||||
|
Share capital-
|
||||||||||||
|
Ordinary shares of NIS 0.04 par value - 200,000,000 shares authorized at December 31, 2016
and 2015; 35,424,669 and 35,294,755 issued at December 31, 2016 and 2015; 34,321,573
and 35,294,755 shares outstanding at December 31, 2016 and 2015, respectively
|
371
|
370
|
||||||||||
|
Additional paid-in capital
|
146,536
|
142,765
|
||||||||||
|
Accumulated other comprehensive loss, net
|
(1,150
|
)
|
(1,892
|
)
|
||||||||
|
Retained earnings
|
331,326
|
258,978
|
||||||||||
|
Treasury shares at cost – 1,103,096 and 0 ordinary shares at December 31, 2016 and 2015, respectively
|
(39,430
|
)
|
-
|
|||||||||
|
Total equity
|
437,653
|
400,221
|
||||||||||
|
Total liabilities and equity
|
$
|
584,700
|
$
|
529,742
|
||||||||
The accompanying notes are an integral part of the consolidated financial statements
F - 5
CAESARSTONE LTD. (FORMERLY CAESARSTONE SDOT-YAM LTD.)
AND ITS SUBSIDIARIES
U.S. dollars in thousands (except per share data)
|
Year ended
December 31,
|
||||||||||||
|
2016
|
2015
|
2014
|
||||||||||
|
Revenues
|
$
|
538,543
|
$
|
499,515
|
$
|
447,402
|
||||||
|
Cost of revenues
|
326,057
|
299,290
|
257,751
|
|||||||||
|
Gross profit
|
212,486
|
200,225
|
189,651
|
|||||||||
|
Operating expenses:
|
||||||||||||
|
Research and development
|
3,290
|
3,052
|
2,628
|
|||||||||
|
Marketing and selling
|
70,343
|
59,521
|
55,870
|
|||||||||
|
General and administrative
|
40,181
|
36,612
|
36,111
|
|||||||||
|
Legal settlements and loss contingencies, net
|
5,868
|
4,654
|
-
|
|||||||||
|
Total operating expenses
|
119,682
|
103,839
|
94,609
|
|||||||||
|
Operating income
|
92,804
|
96,386
|
95,042
|
|||||||||
|
Finance expenses, net
|
3,318
|
3,085
|
1,045
|
|||||||||
|
Income before taxes on income
|
89,486
|
93,301
|
93,997
|
|||||||||
|
Taxes on income
|
13,003
|
13,843
|
13,738
|
|||||||||
|
Net income
|
$
|
76,483
|
$
|
79,458
|
$
|
80,259
|
||||||
|
Net income attributable to non-controlling interest
|
1,887
|
1,692
|
1,820
|
|||||||||
|
Net income attributable to controlling interest
|
$
|
74,596
|
$
|
77,766
|
$
|
78,439
|
||||||
|
Basic net income per share of ordinary shares
|
2.
08
|
2.21
|
2.25
|
|||||||||
|
Diluted net income per share of ordinary shares
|
2.
08
|
2.19
|
2.22
|
|||||||||
|
Weighted average number of ordinary shares used in computing basic income per share (in thousands)
|
34,706
|
35,253
|
34,932
|
|||||||||
|
Weighted average number of ordinary shares used in computing diluted income per share (in thousands)
|
34,764
|
35,464
|
35,394
|
|||||||||
The accompanying notes are an integral part of the consolidated financial statements.
F - 6
CAESARSTONE LTD. (FORMERLY CAESARSTONE SDOT-YAM LTD.)
AND ITS SUBSIDIARIES
U.S. dollars in thousands
|
Year ended
December 31,
|
||||||||||||
|
2016
|
2015
|
2014
|
||||||||||
|
Net income
|
$
|
76,483
|
$
|
79,458
|
$
|
80,259
|
||||||
|
Other comprehensive income (loss) before tax:
|
||||||||||||
|
Foreign currency translation adjustments
|
1,100
|
(5,023
|
)
|
(4,227
|
)
|
|||||||
|
Unrealized income (loss) on foreign currency cash flow hedge
|
9
|
1,590
|
(1,562
|
)
|
||||||||
|
Income tax benefit (expense) related to components of other comprehensive income
|
(161
|
)
|
509
|
846
|
||||||||
|
Total other comprehensive income (loss), net of tax
|
948
|
(2,924
|
)
|
(4,943
|
)
|
|||||||
|
Comprehensive income
|
77,431
|
76,534
|
75,316
|
|||||||||
|
Less: comprehensive income attributable to non-controlling interest
|
(2,093
|
)
|
(126
|
)
|
(1,091
|
)
|
||||||
|
Comprehensive income attributable to controlling interest
|
$
|
75,338
|
$
|
76,408
|
$
|
74,225
|
||||||
The accompanying notes are an integral part of the consolidated financial statements
F - 7
CAESARSTONE LTD. (FORMERLY CAESARSTONE SDOT-YAM LTD.) AND ITS SUBSIDIARIES
U.S. dollars in thousands (except share data)
|
Common Stock
|
||||||||||||||||||||||||||||
|
Shares
|
Amount
|
Additional paid-in
capital
|
Retained
earnings
|
Accumulated other
comprehensive income
(loss), net(1)
|
Treasury
shares
|
Total
equity
|
||||||||||||||||||||||
|
Balance as of January 1, 2014
|
34,739,315
|
364
|
138,757
|
122,798
|
3,680
|
-
|
265,599
|
|||||||||||||||||||||
|
Other comprehensive loss
|
-
|
-
|
-
|
-
|
(4,214
|
)
|
-
|
(4,214
|
)
|
|||||||||||||||||||
|
Net income
|
-
|
-
|
-
|
78,439
|
-
|
-
|
78,439
|
|||||||||||||||||||||
|
Equity-based compensation expense related to employees
|
-
|
-
|
1,212
|
-
|
-
|
-
|
1,212
|
|||||||||||||||||||||
|
Cashless exercise of options
|
392,812
|
5
|
(5
|
)
|
-
|
-
|
-
|
-
|
||||||||||||||||||||
|
Dividend
|
-
|
-
|
-
|
(20,025
|
)
|
-
|
-
|
(20,025
|
)
|
|||||||||||||||||||
|
Balance as of December 31, 2014
|
35,132,127
|
369
|
139,964
|
181,212
|
(534
|
)
|
-
|
321,011
|
||||||||||||||||||||
|
Other comprehensive loss
|
-
|
-
|
-
|
-
|
(1,358
|
)
|
-
|
(1,358
|
)
|
|||||||||||||||||||
|
Net income
|
-
|
-
|
-
|
77,766
|
-
|
-
|
77,766
|
|||||||||||||||||||||
|
Equity-based compensation expense related to employees
|
-
|
-
|
2,802
|
-
|
-
|
-
|
2,802
|
|||||||||||||||||||||
|
Cashless exercise of options
|
162,628
|
1
|
(1
|
)
|
-
|
-
|
-
|
-
|
||||||||||||||||||||
|
Balance as of December 31, 2015
|
35,294,755
|
370
|
142,765
|
258,978
|
(1,892
|
)
|
-
|
400,221
|
||||||||||||||||||||
|
Other comprehensive income
|
-
|
-
|
-
|
-
|
742
|
-
|
742
|
|||||||||||||||||||||
|
Net income
|
-
|
-
|
-
|
74,596
|
-
|
-
|
74,596
|
|||||||||||||||||||||
|
Equity-based compensation expense related to employees (2)
|
-
|
-
|
3,506
|
-
|
-
|
-
|
3,506
|
|||||||||||||||||||||
|
Compensation paid by a shareholder (3)
|
-
|
-
|
266
|
-
|
-
|
-
|
266
|
|||||||||||||||||||||
|
Purchase of treasury shares
|
(1,103,096
|
)
|
-
|
-
|
-
|
-
|
(39,430
|
)
|
(39,430
|
)
|
||||||||||||||||||
|
Adjustment to redemption value of the non-controlling interest
|
-
|
-
|
-
|
(2,248
|
)
|
-
|
-
|
(2,248
|
)
|
|||||||||||||||||||
|
Cashless exercise of options
|
129,914
|
1
|
(1
|
)
|
-
|
-
|
-
|
-
|
||||||||||||||||||||
|
Balance as of December 31, 2016
|
34,321,573
|
$
|
371
|
$
|
146,536
|
$
|
331,326
|
$
|
(1,150
|
)
|
$
|
(39,430
|
)
|
$
|
437,653
|
|||||||||||||
| (1) |
Accumulated other comprehensive income (loss), net, comprised of foreign currency translation and hedging transactions.
|
| (2) |
See also Note
12.
|
| (3) |
A bonus paid by the Company's shareholder to its employees.
|
The accompanying notes are an integral part of the consolidated financial statements
F - 8
CAESARSTONE LTD. (FORMERLY CAESARSTONE SDOT-YAM LTD.)
AND ITS SUBSIDIARIES
U.S. dollars in thousands
|
Year ended
December 31,
|
||||||||||||
|
2016
|
2015
|
2014
|
||||||||||
|
Cash flows from operating activities:
|
||||||||||||
|
Net income
|
$
|
76,483
|
$
|
79,458
|
$
|
80,259
|
||||||
|
Adjustments required to reconcile net income to net cash provided by operating activities:
|
||||||||||||
|
Depreciation and amortization
|
28,254
|
22,334
|
17,176
|
|||||||||
|
Share-based compensation expense
|
3,068
|
2,293
|
2,642
|
|||||||||
|
Accrued severance pay, net
|
(150
|
)
|
540
|
(26
|
)
|
|||||||
|
Changes in deferred tax, net
|
(963
|
)
|
7,051
|
(2,580
|
)
|
|||||||
|
Capital loss from sale of property, plant and equipment
|
32
|
-
|
-
|
|||||||||
|
Compensation paid by a shareholder
|
266
|
-
|
-
|
|||||||||
|
Increase in trade receivables
|
(4,184
|
)
|
(2,968
|
)
|
(3,913
|
)
|
||||||
|
Decrease (increase) in other accounts receivable and prepaid expenses
|
(5,617
|
)
|
(3,069
|
)
|
1,393
|
|||||||
|
Increase in inventories
|
(5,376
|
)
|
(15,267
|
)
|
(22,345
|
)
|
||||||
|
Increase (decrease) in trade payables
|
1,424
|
(8,659
|
)
|
1,811
|
||||||||
|
Increase (decrease) in warranty provision
|
100
|
(447
|
)
|
(4
|
)
|
|||||||
|
Legal settlements and loss contingencies, net
|
5,868
|
4,654
|
-
|
|||||||||
|
Increase (decrease) in accrued expenses and other liabilities including related party
|
2,314
|
(259
|
)
|
1,611
|
||||||||
|
Net cash provided by operating activities
|
101,519
|
85,661
|
76,024
|
|||||||||
|
Cash flows from investing activities:
|
||||||||||||
|
Redemption of short-term deposits
|
60
|
11,987
|
57,953
|
|||||||||
|
Acquisition of the business of Prema Asia Marketing PTE Ltd. (see also Note 1(b))
|
-
|
-
|
(150
|
)
|
||||||||
|
Purchase of property, plant and equipment
|
(22,943
|
)
|
(76,495
|
)
|
(86,373
|
)
|
||||||
|
Proceeds from sale of property, plant and equipment
|
22
|
-
|
-
|
|||||||||
|
Decrease (increase) in long-term deposits
|
(452
|
)
|
(1,228
|
)
|
844
|
|||||||
|
Net cash used in investing activities
|
(23,313
|
)
|
(65,736
|
)
|
(27,726
|
)
|
||||||
The accompanying notes are an integral part of the consolidated financial statements
.
F - 9
CAESARSTONE LTD. (FORMERLY CAESARSTONE SDOT-YAM LTD.)
AND ITS SUBSIDIARIES
CONSOLIDATED STATEMENTS OF CASH FLOWS
U.S. dollars in thousands
|
Year ended
December 31,
|
||||||||||||
|
2016
|
2015
|
2014
|
||||||||||
|
Cash flows from financing activities:
|
||||||||||||
|
Dividends paid
|
$
|
(*) (243
|
)
|
$
|
-
|
$
|
(20,025
|
)
|
||||
|
Short-term bank credit and loans, net
|
5,157
|
3,241
|
(5,454
|
)
|
||||||||
|
Purchase of treasury shares
|
(39,430
|
)
|
-
|
-
|
||||||||
|
Repayment of a financing leaseback
|
(1,100
|
)
|
(1,092
|
)
|
(1,192
|
)
|
||||||
|
Net cash provided by (used in) financing activities
|
(35,616
|
)
|
2,149
|
(26,671
|
)
|
|||||||
|
Effect of exchange rate differences on cash and cash equivalents
|
933
|
(1,607
|
)
|
(1,595
|
)
|
|||||||
|
Increase in cash and cash equivalents
|
43,523
|
20,467
|
20,032
|
|||||||||
|
Cash and cash equivalents at beginning of year
|
62,747
|
42,280
|
22,248
|
|||||||||
|
Cash and cash equivalents at end of year
|
$
|
106,270
|
$
|
62,747
|
$
|
42,280
|
||||||
|
Cash received (paid) during the year for:
|
||||||||||||
|
Interest paid
|
$
|
(210
|
)
|
$
|
(180
|
)
|
$
|
(141
|
)
|
|||
|
Interest received
|
$
|
153
|
$
|
45
|
$
|
46
|
||||||
|
Tax paid
|
$
|
(17,684
|
)
|
$
|
(16,372
|
)
|
$
|
(16,744
|
)
|
|||
|
Non cash activity during the year for:
|
||||||||||||
|
Changes in trade payables balances related to purchase of property, plant and equipment
|
$
|
(403
|
)
|
$
|
(4,389
|
)
|
$
|
6,992
|
||||
(*) In 2016, dividend payment made by Company's subsidiary Caesarstone Canada Inc. and reflects the amount paid to the non-controlling interest holders.
The accompanying notes are an integral part of the consolidated financial statements.
F - 10
CAESARSTONE LTD. (FORMERLY CAESARSTONE SDOT-YAM LTD.)
AND ITS SUBSIDIARIES
U.S. dollars in thousands (except share data)
| NOTE 1:- |
GENERAL
|
| a. |
General:
|
Caesarstone Ltd. (formerly Caesarstone Sdot-Yam Ltd.), incorporated under the laws of the State of Israel, was founded in 1987. On June 9, 2016, the Company changed its name from Caesarstone Sdot-Yam Ltd. to Caesarstone Ltd.
Caesarstone Ltd. and its subsidiaries (collectively, the "Company" or "Caesarstone") manufacture high quality engineered quartz surfaces sold under the Company's premium Caesarstone brand. The Company's products consist of engineered quartz slabs that are currently sold in over 50 countries through a combination of direct sales in certain markets and indirectly through a network of independent distributors in other markets. The Company's products are primarily used as kitchen countertops in the renovation and remodeling end markets and in the new buildings construction market. Other applications include vanity tops, wall panels, back splashes, floor tiles, stairs and other interior surfaces that are used in a variety of residential and non-residential applications.
The Company has subsidiaries in Australia, Singapore, Canada and the United States which are engaged in the marketing and selling of the Company's products in different geographic areas. In January 2017, the Company commenced direct marketing and sales operations in the United Kingdom through its subsidiary Caesarstone (UK) Ltd. In addition, the Company has a subsidiary in the United States, Caesarstone Technologies USA, Inc., which is engaged in the manufacturing of the Company's products.
| b. |
Acquisition of the business of Prema Asia Marketing PTE Ltd. ("Prema"):
|
The Company entered into an agreement on October 1, 2011 pursuant to which it acquired the operations for the distribution of Caesarstone's products in Singapore from the Company's former distributor in Singapore. Under the terms of the agreement, the Company paid approximately $500 upon closing, $300 based on a formula that includes the number of slabs sold in Singapore during 2011 out which $150 was paid in 2012 and additional $150 was paid in 2014.
| c. |
Major suppliers:
|
In 2016, the Company acquired approximately 68% of its quartz consumption from Turkey, of which approximately 39% was supplied by Mikroman Madencilik San ve TIC.LTD.STI ("Mikroman"), constituting approximately 27% of Company's total quartz, and approximately 36% was supplied by Polat Maden Sanayi ve Ticaret A.Ş. (“Polat”), constituting approximately 25% of Company’s total quartz. If Mikroman or Polat cease supplying the Company with quartz or if the Company's supply of quartz generally from Turkey is adversely impacted, the Company's other suppliers may be unable to meet the Company's quartz requirements. In that case, the Company would need to locate and qualify alternate suppliers, which could take time, increase costs and require adjustments to the appearance of the Company's products. As a result, the Company may experience a delay in manufacturing, which could materially and adversely impact the Company's results of operations.
F - 11
CAESARSTONE LTD. (FORMERLY CAESARSTONE SDOT-YAM LTD.)
AND ITS SUBSIDIARIES
NOTES TO THE CONSOLIDATED FINANCIAL STATEMENTS
U.S. dollars in thousands (except share data)
| NOTE 2:- |
SIGNIFICANT ACCOUNTING POLICIES
|
The consolidated financial statements have been prepared in accordance with U.S. generally accepted accounting principles ("U.S. GAAP").
| a. |
Use of estimates:
|
The preparation of financial statements in conformity with U.S. GAAP requires management to make estimates, judgments and assumptions that affect the amounts reported in the financial statements and accompanying notes. Actual results could differ from those estimates. The Company's management believes that the estimates, judgment and assumptions used are reasonable based upon information available at the time they were made.
| b. |
Financial statements in U.S. dollars:
|
The Company's revenues are generated in U.S. dollars (USD), Australian dollars, Canadian dollars, Euros and New Israeli Shekels (NIS). In addition, most of the Company's costs are incurred in USD, NIS, Euros, Canadian dollars, Australian dollars and Singapore dollars.
The Company's management believes that the USD is the primary currency of the economic environment in which the Company operates. Thus, the functional and reporting currency of the Company is the USD.
The functional currency of the majority of the Company's foreign subsidiaries is the local currency in which it operates.
Accordingly, monetary accounts maintained in currencies other than the USD are re-measured into dollars in accordance with Accounting Standards Codification ("ASC") 830, "Foreign Currency Matters" (ASC 830). All transaction gains and losses resulting from the re-measurement of monetary balance sheet items denominated in non-USD currencies are reflected in the statements of operations as financial income or expenses as appropriate.
The financial statements of the Company's subsidiaries of which the functional currency is not the USD have been translated into USD. All amounts on the balance sheets have been translated into the USD using the exchange rates in effect on the relevant balance sheet dates. All amounts in the statements of operations have been translated into the USD using the monthly average exchange rate in accordance with ASC 830. The resulting translation adjustments are reported as a component of accumulated other comprehensive income (loss), net in shareholders' equity.
| c. |
Principles of consolidation:
|
The consolidated financial statements include the accounts of the Company and its wholly and majority-owned subsidiaries. Inter-company transactions and balances, including profit from inter-company sales not yet realized outside of the Company, have been eliminated upon consolidation.
F - 12
CAESARSTONE LTD. (FORMERLY CAESARSTONE SDOT-YAM LTD.)
AND ITS SUBSIDIARIES
NOTES TO THE CONSOLIDATED FINANCIAL STATEMENTS
U.S. dollars in thousands (except share data)
| NOTE 2:- |
SIGNIFICANT ACCOUNTING POLICIES
(Cont.)
|
| d. |
Cash equivalents:
|
Cash equivalents are short-term highly liquid investments that are readily convertible to cash with original maturities of three months or less at the date acquired.
| e. |
Short-term bank deposits:
|
Short-term bank deposits are deposits with original maturities of more than three months but less than one year. Short-term bank deposits are presented at their cost, which approximates their fair value.
| f. |
Derivatives:
|
ASC 815, "Derivative and Hedging" ("ASC 815"), requires companies to recognize all of their derivative instruments as either assets or liabilities in the statement of financial position at fair value.
For those derivative instruments that are designated and qualify as hedging instruments, a company must designate the hedging instrument, based upon the exposure being hedged, as a fair value hedge, cash flow hedge or a hedge of a net investment in a foreign operation.
Derivative instruments designated as hedging instruments
:
For derivative instruments that are designated and qualify as a cash flow hedge (i.e., hedging the exposure to variability in expected future cash flows that is attributable to a particular risk), the effective portion of the gain or loss on the derivative instrument is reported as a component of other comprehensive income and reclassified into earnings in the same period during which the hedged transaction affects earnings.
The remaining gain or loss on the derivative instrument in excess of the cumulative change in the present value of future cash flows of the hedged item, if any, is recognized in current earnings during the period of change. For derivative instruments not designated as hedging instruments, the gain or loss is recognized in current earnings during the period of change.
To hedge against the risk of overall changes in cash flows resulting from foreign currency salary and other recurring payments during the periods, the Company has instituted a foreign currency cash flow hedging program. The Company hedges portions of its forecasted salary expenses denominated in NIS.
These forward contracts are designated as cash flow hedges, as defined by ASC 815, and are all effective, as their critical terms match the underlying transactions being hedged.
As of December 31, 2016 and 2015, the unrealized gain recorded in accumulated other comprehensive income (loss) from the Company's currency forward NIS transactions were $28 and $20, respectively. At December 31, 2016 and 2015, the notional amounts of foreign exchange forward contracts which the Company entered into were $13,303 and $749, respectively.
F - 13
CAESARSTONE LTD. (FORMERLY CAESARSTONE SDOT-YAM LTD.)
AND ITS SUBSIDIARIES
NOTES TO THE CONSOLIDATED FINANCIAL STATEMENTS
U.S. dollars in thousands (except share data)
| NOTE 2:- |
SIGNIFICANT ACCOUNTING POLICIES (Cont.)
|
| f. |
Derivatives (Cont.):
|
Derivative instruments not designated as hedging instruments
:
In addition to the derivatives that are designated as hedges as discussed above, the Company enters into certain foreign exchange forward and options contracts to
limit its exposure to foreign currencies
. Gains and losses related to such derivative instruments are recorded in financial expenses, net. At December 31, 2016 and 2015, the notional amount of foreign exchange forward and option contracts into which the Company entered was $131,470 and $186,217, respectively. The foreign exchange forward and options contracts will expire at various times through December, 2017.
The following tables present fair value amounts of, and gains and losses recorded in relation to, the Company's derivative instruments and related hedged items:
|
|
Balance Sheet
|
Fair Value of Derivative Instruments
|
|||||||||
|
|
Year ended December 31,
|
||||||||||
|
|
2016
|
2015
|
|||||||||
|
|
|||||||||||
|
Derivative Assets:
|
|||||||||||
|
|
|||||||||||
|
Derivatives not designated as hedging instruments:
|
|
||||||||||
|
Foreign exchange option and forward contracts
|
Other accounts receivable
and prepaid expenses
|
$
|
2,539
|
$
|
2,040
|
||||||
|
Derivatives designated as hedging instruments:
|
|||||||||||
|
Foreign exchange forward contracts
|
Other accounts receivable
and prepaid expenses
|
$
|
31
|
$
|
20
|
||||||
|
Total
|
$
|
2,570
|
$
|
2,060
|
|||||||
|
|
|||||||||||
|
Derivative Liabilities
|
|||||||||||
|
|
|||||||||||
|
Derivatives not designated as hedging instruments:
|
|||||||||||
|
Foreign exchange option and forward contracts
|
Other accounts payable and
accrued expenses
|
$
|
(533
|
)
|
$
|
(1,421
|
)
|
||||
|
|
|||||||||||
|
Derivatives designated as hedging instruments:
|
|||||||||||
|
Foreign exchange forward contracts
|
Other accounts payable and
accrued expenses
|
$
|
(3
|
)
|
$
|
-
|
|||||
|
|
|||||||||||
|
Total
|
$
|
(536
|
)
|
$
|
(1,421
|
)
|
|||||
F - 14
CAESARSTONE LTD. (FORMERLY CAESARSTONE SDOT-YAM LTD.)
AND ITS SUBSIDIARIES
NOTES TO THE CONSOLIDATED FINANCIAL STATEMENTS
U.S. dollars in thousands (except share data)
| NOTE 2:- |
SIGNIFICANT ACCOUNTING POLICIES (Cont.)
|
| f. |
Derivatives (Cont.):
|
|
|
Gain Recognized in
Other Comprehensive
Income (loss), net
|
Gain (loss) Recognized in
Statements of Operations
|
|||||||||||||||
|
|
Year ended
December 31,
|
Statements of Income
|
Year ended
December 31,
|
||||||||||||||
|
|
2016
|
2015
|
Item
|
2016
|
2015
|
||||||||||||
|
|
|
||||||||||||||||
|
Derivatives designated as hedging instruments
:
|
|
||||||||||||||||
|
Foreign exchange forward contract
|
$
|
28
|
$
|
20
|
Cost of revenues and Operating expenses
|
$
|
111
|
$
|
(1,364
|
)
|
|||||||
|
|
|
||||||||||||||||
|
Derivatives not designated as hedging instruments:
|
|
||||||||||||||||
|
Foreign exchange forward and options contracts
|
-
|
-
|
Financial expenses, net
|
1,261
|
3,242
|
||||||||||||
|
|
|
||||||||||||||||
|
Total
|
$
|
28
|
$
|
20
|
|
$
|
1,372
|
$
|
1,878
|
||||||||
|
|
|
||||||||||||||||
| g. |
Inventories:
|
Inventories are stated at the lower of cost or market value. The Company periodically evaluates the quantities on hand relative to historical and projected sales volumes, current and historical selling prices and contractual obligations to maintain certain levels of parts. Based on these evaluations, inventory provision are provided to cover risks arising from slow-moving items, discontinued products, excess inventories, market prices lower than cost and adjusted revenue forecasts.
Cost is determined as follows:
Raw Materials
- Cost is determined on a standard cost basis
which approximates actual costs on a weighted average basis.
Work-in-progress and finished products - are based on standard cost (which approximates actual cost on a weighted average basis) which includes raw materials cost, labor and manufacturing overhead.
Finished goods are stated at the lower of cost or market.
F - 15
CAESARSTONE LTD. (FORMERLY CAESARSTONE SDOT-YAM LTD.)
AND ITS SUBSIDIARIES
NOTES TO THE CONSOLIDATED FINANCIAL STATEMENTS
U.S. dollars in thousands (except share data)
| NOTE 2:- |
SIGNIFICANT ACCOUNTING POLICIES (Cont.)
|
| g. |
Inventories (Cont.):
|
The following table provides the details of the change in the Company's provision for inventory:
|
December 31,
|
||||||||
|
2016
|
2015
|
|||||||
|
Inventory provision, beginning of year
|
$
|
8,985
|
$
|
7,724
|
||||
|
Increase in inventory provision
|
4,168
|
1,708
|
||||||
|
Write off
|
(2,970
|
)
|
(447
|
)
|
||||
|
Inventory provision, end of year
|
$
|
10,183
|
$
|
8,985
|
||||
| h. |
Property, plant and equipment, net:
|
| 1. |
Property, plant and equipment are stated at cost, net of accumulated depreciation and investment grants.
|
| 2. |
Costs recorded prior to a production line completion are reflected as construction in progress, which are recorded to land, building and machinery assets at the date of purchase. Construction in progress includes direct expenditures for the construction of the production line and is stated at cost. Capitalized costs include costs incurred under the construction contract: advisory, consulting and direct internal costs (including labor) and operating costs incurred during the construction and installation phase.
|
| 3. |
Depreciation is calculated by the straight-line method over the estimated useful life of the assets at the following annual rates:
|
|
%
|
|||
|
Machinery and manufacturing equipment
|
4-33
|
||
|
Office equipment and furniture
|
7-33
|
||
|
Motor vehicles
|
10-30
|
||
|
Buildings
|
4-5
|
||
|
Leasehold improvements
|
Over the shorter of the term of
the lease or the life of the asset
|
F - 16
CAESARSTONE LTD. (FORMERLY CAESARSTONE SDOT-YAM LTD.)
AND ITS SUBSIDIARIES
NOTES TO THE CONSOLIDATED FINANCIAL STATEMENTS
U.S. dollars in thousands (except share data)
| NOTE 2:- |
SIGNIFICANT ACCOUNTING POLICIES (Cont.)
|
| h. |
Property, plant and equipment, net (Cont.):
|
The Company has accounted for its assets that are under a capital lease arrangement in accordance with ASC 840 "Leases" ("ASC 840"). Accordingly, assets under a capital lease are stated as assets of the Company on the basis of ordinary purchase prices (without the financing component), and depreciated according to the shorter of the lease term and the usual depreciation rates applicable to such assets.
Lease payments payable in forthcoming years, net of the interest component included in them, are included in liabilities. The interest in respect of such amounts is accrued on a current basis and is charged to earnings.
| i. |
Impairment of long-lived assets:
|
The Company's long-lived assets, tangible and finite-lived intangible assets (other than goodwill), are reviewed for impairment in accordance with ASC 360 "Property, Plant and Equipment" ("ASC 360") whenever events or changes in circumstances indicate that the carrying amount of an asset may not be recoverable. Recoverability of assets to be held and used is measured by a comparison of the carrying amount of an asset to the future undiscounted cash flows expected to be generated by the asset. If such assets are considered to be impaired, the impairment to be recognized is measured by the amount by which the carrying amount of the assets exceeds the fair value of the assets. Assets to be disposed of are reported at the lower of the carrying amount or fair value less costs to sell. No impairment losses were identified during any period presented.
In addition to the recoverability assessment, the Company routinely reviews the remaining estimated useful lives of property and equipment and finite-lived intangible assets. If the Company reduces the estimated useful life assumption for any asset, the remaining unamortized balance would be amortized or depreciated over the revised estimated useful life.
| j. |
Goodwill and other intangibles assets:
|
Goodwill represents the excess of the cost of businesses acquired over the fair value of the net assets acquired in the acquisition. Under ASC 350, "Intangibles-Goodwill and Other" ("ASC 350") goodwill is not amortized but instead is tested for impairment at least annually (or more frequently if impairment indicators arise).
F - 17
CAESARSTONE LTD. (FORMERLY CAESARSTONE SDOT-YAM LTD.)
AND ITS SUBSIDIARIES
NOTES TO THE CONSOLIDATED FINANCIAL STATEMENTS
U.S. dollars in thousands (except share data)
| NOTE 2:- |
SIGNIFICANT ACCOUNTING POLICIES (Cont.)
|
| j. |
Goodwill and other intangibles assets (Cont.):
|
In the evaluation of goodwill for impairment, the Company has the option to perform a qualitative assessment to determine whether further impairment testing is necessary or to perform a quantitative assessment by comparing the fair value of a reporting unit to its carrying amount, including goodwill. Under the qualitative assessment, an entity is not required to calculate the fair value of a reporting unit unless the entity determines that it is more likely than not that its fair value is less than its carrying amount. If under the quantitative assessment the fair value of a reporting unit is less than its carrying amount, then the amount of the impairment loss, if any, must be measured under step two of the impairment analysis. In the first phase of impairment testing, goodwill attributable to the reporting units is tested for impairment by comparing the fair value of each reporting unit with its carrying value. If the carrying value of the reporting unit exceeds its fair value, the second phase is then performed. The second phase of the goodwill impairment test compares the implied fair value of the reporting unit's goodwill with the carrying amount of that goodwill. If the carrying amount of the reporting unit's goodwill exceeds the implied fair value of that goodwill, an impairment loss is recognized in an amount equal to that excess.
The Company performs an annual goodwill impairment test during the fourth quarter of each fiscal year, or more frequently, if impairment indicators are present. The Company operates in one operating segment. Each of the Company's subsidiaries could be considered to be reporting units; however, the Company concluded that all of the Company's components should be aggregated and deemed as a single reporting unit for the purpose of performing the goodwill impairment test in accordance with ASC 350-20-35-35, since they have similar economic characteristics.
Goodwill was tested for impairment by comparing its fair value with its carrying value. As required by ASC 820, "Fair Value Measurements", the Company applies assumptions that market place participants would consider in determining the fair value of reporting unit. No impairment of goodwill was identified during any period presented.
Acquired intangible assets other than goodwill are amortized over their weighted average amortization period unless they are determined to be indefinite. Acquired intangible assets are carried at cost, less accumulated amortization. For intangible assets purchased in a business combination, the estimated fair values of the assets received are used to establish the carrying value. The fair value of acquired intangible assets is determined using common techniques, and the Company employs assumptions developed using the perspective of a market participant.
F - 18
CAESARSTONE LTD. (FORMERLY CAESARSTONE SDOT-YAM LTD.)
AND ITS SUBSIDIARIES
NOTES TO THE CONSOLIDATED FINANCIAL STATEMENTS
U.S. dollars in thousands (except share data)
| NOTE 2:- |
SIGNIFICANT ACCOUNTING POLICIES (Cont.)
|
| k. |
Warranty
:
|
The Company generally provides a standard warranty of between three and ten years for its products, depending on the type of product and the country in which the Company does business. The Company records a provision for the estimated cost to repair or replace products under warranty at the time of sale. Factors that affect the Company's warranty reserve include the number of units sold, historical and anticipated rates of warranty repairs and the cost per repair.
The following table provides the details of the change in the Company's warranty accrual:
|
2016
|
2015
|
|||||||
|
January 1,
|
$
|
2,173
|
$
|
2,620
|
||||
|
Charged to costs and expenses relating to new sales
|
1,325
|
1,091
|
||||||
|
Costs of product warranty claims
|
(1,225
|
)
|
(1,195
|
)
|
||||
|
Foreign currency translation adjustments
|
2
|
(343
|
)
|
|||||
|
December 31,
|
$
|
2,275
|
$
|
2,173
|
||||
| l. |
Revenue recognition:
|
The Company derives its revenues from sales of quartz surfaces mostly through a combination of direct sales in certain markets and indirectly through a network of distributors in other markets.
Revenues are recognized in accordance with ASC 605, "Revenue Recognition" (ASC 605) when delivery has occurred, persuasive evidence of an agreement exists, the fee is fixed and determinable, collectability is probable and no further obligations exist.
The Company's products that are sold through agreements with exclusive distributors are non-exchangeable, non-refundable, non-returnable and without any rights of price protection or stock rotation. Accordingly, the Company considers all the distributors to be end-consumers.
For certain revenue transactions with a specific customer, the Company is responsible also for the fabrication and installation of its products. The Company recognizes such revenues upon receipt of acceptance evidence from the end consumer which occurs upon completion of the installation.
Although, in general, the Company does not grant rights of return, there are certain instances where such rights are granted. The Company maintains a provision for returns in accordance with ASC 605, which is estimated, based primarily on historical experience as well as management judgment, and is recorded through a reduction of revenue.
F - 19
CAESARSTONE LTD. (FORMERLY CAESARSTONE SDOT-YAM LTD.)
AND ITS SUBSIDIARIES
NOTES TO THE CONSOLIDATED FINANCIAL STATEMENTS
U.S. dollars in thousands (except share data)
| NOTE 2:- |
SIGNIFICANT ACCOUNTING POLICIES (Cont.)
|
| m. |
Research and development costs:
|
Research and development costs are charged to the statement of income as incurred.
| n. |
Income taxes:
|
The Company and its subsidiaries account for income taxes in accordance with ASC 740, "Income Taxes" (ASC 740). This statement prescribes the use of the liability method whereby deferred tax asset and liability account balances are determined based on differences between financial reporting and tax bases of assets and liabilities and are measured using the enacted tax rates and laws that will be in effect when the differences are expected to reverse.
Deferred tax liabilities and assets are classified as current or noncurrent based on the classification of the related asset or liability for financial reporting purposes, or according to the expected reversal dates of the specific temporary differences if not related to an asset or liability for financial reporting.
The Company accounts for its uncertain tax positions in accordance with ASC 740-10. ASC 740-10 contains a two-step approach to recognizing and measuring uncertain tax positions accounted for in accordance with ASC 740. The first step is to evaluate the tax position taken or expected to be taken in a tax return by determining if the weight of available evidence indicates that it is more likely than not that, on an evaluation of the technical merits, the tax position will be sustained on audit, including resolution of any related appeals or litigation processes. The second step is to measure the tax benefit as the largest amount that is more than 50% likely to be realized upon ultimate settlement.
| o. |
Advertising expenses:
|
Advertising costs are expensed as incurred. Advertising expenses for the years ended December 31, 2016, 2015 and 2014 were $25,582, $22,380 and $18,557, respectively.
| p. |
Concentrations of credit risk:
|
Financial instruments that potentially subject the Company to concentrations of credit risk consist principally of cash and cash equivalents, short-term bank deposits and trade receivables. The Company's cash and cash equivalents are invested primarily in USD, mainly with major banks in Israel.
F - 20
CAESARSTONE LTD. (FORMERLY CAESARSTONE SDOT-YAM LTD.)
AND ITS SUBSIDIARIES
NOTES TO THE CONSOLIDATED FINANCIAL STATEMENTS
U.S. dollars in thousands (except share data)
| NOTE 2:- |
SIGNIFICANT ACCOUNTING POLICIES (Cont.)
|
| p. |
Concentrations of credit risk (cont.):
|
The Company's trade receivables are derived from sales to customers located mainly in the United States, Australia, Canada, Israel and Europe. The Company performs ongoing credit evaluations of its customers and to date has not experienced any substantial losses. In certain circumstances, the Company requires letters of credit or prepayments. An allowance for doubtful accounts is provided with respect to specific receivables that the Company has determined to be doubtful of collection. For those receivables not specifically reviewed, provisions are recorded at a specific rate, based upon the age of the receivable, the collection history, current economic trends and management estimates.
No customer represented 10% or more of the Company's total revenue during the years ended December 31, 2016, 2015 and 2014.
The following table provides the detail of the change in the Company's allowance for doubtful accounts:
|
2016
|
2015
|
|||||||
|
January 1,
|
$
|
1,221
|
$
|
2,225
|
||||
|
Charges to expenses
|
172
|
(340
|
)
|
|||||
|
Write offs
|
(116
|
)
|
(524
|
)
|
||||
|
Foreign currency translation adjustments
|
6
|
(140
|
)
|
|||||
|
December 31,
|
$
|
1,283
|
$
|
1,221
|
||||
| q. |
Severance pay:
|
The Company's liability for severance pay, with respect to its Israeli employees, is calculated pursuant to Israeli severance pay law and employee agreements based on the most recent salary of the employees. The Company's liability for all of its Israeli employees is provided for by monthly deposits with insurance policies and by an accrual. The value of these policies is recorded as an asset on the Company's balance sheet.
The deposited funds include profits or losses accumulated up to the balance sheet date. The deposited funds may be withdrawn only upon the fulfillment of the obligations pursuant to Israeli severance pay law or labor agreements.
Some agreements with employees specifically state, in accordance with section 14 of the Severance Pay Law, 1963, that the Company's contributions for severance pay shall be instead of severance compensation and that upon release of the policy to the employee, no additional calculations shall be conducted between the parties regarding the matter of severance pay and no additional payments shall be made by the Company to the employee.
F - 21
CAESARSTONE LTD. (FORMERLY CAESARSTONE SDOT-YAM LTD.)
AND ITS SUBSIDIARIES
NOTES TO THE CONSOLIDATED FINANCIAL STATEMENTS
U.S. dollars in thousands (except share data)
| NOTE 2:- |
SIGNIFICANT ACCOUNTING POLICIES (Cont.)
|
| q. |
Severance pay (Cont.):
|
Further, since the Company has signed agreements with its employees under section 14, the related obligation and amounts deposited on behalf of such obligation are not stated on the balance sheet, as they are legally released from obligation to employees once the deposit amounts have been paid.
Severance pay expenses for the years ended December 31, 2016, 2015 and 2014 amounted to approximately $284, $499 and $455, respectively.
| r. |
Fair value of financial instruments:
|
Fair value is defined as the price that would be received to sell an asset or paid to transfer a liability (i.e., the "exit price") in an orderly transaction between market participants at the measurement date.
In determining fair value, the Company uses various valuation approaches. ASC 820 establishes a hierarchy for inputs used in measuring fair value that maximizes the use of observable inputs and minimizes the use of unobservable inputs by requiring that the most observable inputs be used when available. Observable inputs are inputs that market participants would use in pricing the asset or liability developed based on market data obtained from sources independent of the Company. Unobservable inputs are inputs that reflect the Company's assumptions about the assumptions market participants would use in pricing the asset or liability developed based on the best information available in the circumstances.
The hierarchy is broken down into three levels based on the inputs as follows:
| Level 1- |
Quoted prices in active markets for identical assets or liabilities.
|
| Level 2- |
Valuations based on one or more quoted prices in markets that are not active or for which all significant inputs are observable, either directly or indirectly.
|
| Level 3- |
Valuations based on inputs that are unobservable and significant to the overall fair value measurement.
|
F - 22
CAESARSTONE LTD. (FORMERLY CAESARSTONE SDOT-YAM LTD.)
AND ITS SUBSIDIARIES
NOTES TO THE CONSOLIDATED FINANCIAL STATEMENTS
U.S. dollars in thousands (except share data)
| NOTE 2:- |
SIGNIFICANT ACCOUNTING POLICIES (Cont.)
|
| r. |
Fair value of financial instruments (Cont.):
|
Foreign currency derivative contracts are classified within Level 2 as the valuation inputs are based on quoted prices and market observable data of similar instruments.
The following table presents the Company's assets and (liabilities) measured at fair value on a recurring basis at December 31, 2016 and 2015:
|
December 31, 2016
|
||||||||||||||||
|
Level 1
|
Level 2
|
Level 3
|
Total
|
|||||||||||||
|
Derivatives:
|
||||||||||||||||
|
Foreign currencies derivative assets
|
$
|
-
|
$
|
2,570
|
$
|
-
|
$
|
2,570
|
||||||||
|
Foreign currencies derivative liabilities
|
$
|
-
|
$
|
(536
|
)
|
$
|
-
|
$
|
(536
|
)
|
||||||
|
Total
|
$
|
-
|
$
|
2,034
|
$
|
-
|
$
|
2,034
|
||||||||
|
December 31, 2015
|
||||||||||||||||
|
Level 1
|
Level 2
|
Level 3
|
Total
|
|||||||||||||
|
Derivatives:
|
||||||||||||||||
|
Foreign currencies derivative assets
|
$
|
-
|
$
|
2,060
|
$
|
-
|
$
|
2,060
|
||||||||
|
Foreign currencies derivative liabilities
|
$
|
-
|
$
|
(1,421
|
)
|
$
|
-
|
$
|
(1,421
|
)
|
||||||
|
Total
|
$
|
-
|
$
|
639
|
$
|
-
|
$
|
639
|
||||||||
The carrying amounts of financial instruments not measured at fair value, including cash and cash equivalents, short-term bank deposits, trade receivables, trade payables and short term loans, approximate their fair value due to the short-term maturities of such instruments. The carrying amount of long-term loans approximates their fair value.
| s. |
Basic and diluted net income per share:
|
Basic net income per share ("Basic EPS") is computed by dividing net income attributable to controlling interest as adjusted (See also Note 15b) by the weighted average number of ordinary shares outstanding during the period.
F - 23
CAESARSTONE LTD. (FORMERLY CAESARSTONE SDOT-YAM LTD.)
AND ITS SUBSIDIARIES
NOTES TO THE CONSOLIDATED FINANCIAL STATEMENTS
U.S. dollars in thousands (except share data)
| NOTE 2:- |
SIGNIFICANT ACCOUNTING POLICIES (Cont.)
|
| s. |
Basic and diluted net income per share (Cont.):
|
Diluted net income per share ("Diluted EPS") gives effect to all dilutive potential ordinary shares outstanding during the period. The computation of Diluted EPS does not assume conversion, exercise or contingent exercise of securities that would have an anti-dilutive effect on earnings. The dilutive effect of outstanding stock options is computed using the treasury stock method. For the years ended December 31, 2016 and 2015 there were 804,000 and 786,900 outstanding stock options, respectively, that were excluded from the computation of Diluted EPS, that would have had an anti dilutive effect if included. For the year ended December 31, 2014 no outstanding options were excluded from the computation of Diluted EPS.
| t. |
Comprehensive income and accumulated other comprehensive income:
|
Comprehensive income consists of two components, net income and other comprehensive income ("OCI"). OCI refers to revenue, expenses, and gains and losses that under U.S. GAAP are recorded as an element of shareholders' equity but are excluded from net income. Company's OCI consists of foreign currency translation adjustments from those subsidiaries not using the USD as their functional currency and net deferred gains and losses on certain derivative instruments accounted for as cash flow hedges.
The total accumulated other comprehensive income ("AOCI"), net was comprised as follows:
|
December 31,
|
||||||||
|
2016
|
2015
|
|||||||
|
Accumulated gains on derivative instruments
|
$
|
28
|
$
|
20
|
||||
|
Accumulated foreign currency translation differences
|
(1,178
|
)
|
(1,912
|
)
|
||||
|
Total accumulated other comprehensive loss, net
|
$
|
(1,150
|
)
|
$
|
(1,892
|
)
|
||
F - 24
CAESARSTONE LTD. (FORMERLY CAESARSTONE SDOT-YAM LTD.)
AND ITS SUBSIDIARIES
NOTES TO THE CONSOLIDATED FINANCIAL STATEMENTS
U.S. dollars in thousands (except share data)
| NOTE 2:- |
SIGNIFICANT ACCOUNTING POLICIES (Cont.)
|
| t. |
Comprehensive income and accumulated other comprehensive income (Cont.):
|
The following table summarizes the changes in AOCI, net of taxes for the year ended:
|
Unrealized
gains (losses)
on derivative
instruments
|
Accumulated
foreign currency
translation
differences
|
Total
|
||||||||||
|
Balance at December 31, 2014
|
$
|
(1,334
|
)
|
$
|
800
|
$
|
(534
|
)
|
||||
|
Other comprehensive income (loss) before reclassifications
|
(10
|
)
|
(2,712
|
)
|
(2,722
|
)
|
||||||
|
Amounts reclassified from AOCI
|
1,364
|
-
|
1,364
|
|||||||||
|
Net current period OCI
|
1,354
|
(2,712
|
)
|
(1,358
|
)
|
|||||||
|
Balance at December 31, 2015
|
$
|
20
|
$
|
(1,912
|
)
|
$
|
(1,892
|
)
|
||||
|
Other comprehensive income (loss) before reclassifications
|
119
|
734
|
853
|
|||||||||
|
Amounts reclassified from AOCI
|
(111
|
)
|
-
|
(111
|
)
|
|||||||
|
Net current period OCI
|
8
|
734
|
742
|
|||||||||
|
Balance at December 31, 2016
|
$
|
28
|
$
|
(1,178
|
)
|
$
|
(1,150
|
)
|
||||
F - 25
CAESARSTONE LTD. (FORMERLY CAESARSTONE SDOT-YAM LTD.)
AND ITS SUBSIDIARIES
NOTES TO THE CONSOLIDATED FINANCIAL STATEMENTS
U.S. dollars in thousands (except share data)
| NOTE 2:- |
SIGNIFICANT ACCOUNTING POLICIES (Cont.)
|
| t. |
Comprehensive income and accumulated other comprehensive income (Cont.):
|
The following table shows the amounts reclassified from AOCI into the Consolidated Statements of Operations, and the associated financial statement line item, for 2016 and 2015:
|
December 31,
|
||||||||
|
Affected line item in the consolidated statements of income
|
2016
|
2015
|
||||||
|
Cost of revenues
|
$
|
(90
|
)
|
$
|
1,105
|
|||
|
Research and development
|
(2
|
)
|
27
|
|||||
|
Marketing and selling
|
(9
|
)
|
109
|
|||||
|
General and administrative
|
(10
|
)
|
123
|
|||||
|
Total (gain) loss
|
$
|
(111
|
)
|
$
|
1,364
|
|||
| u. |
Accounting for stock-based compensation:
|
|
1.
|
Equity share based payment:
|
|
The Company accounts for stock-based compensation in accordance with ASC 718, "Compensation-Stock Compensation" ("ASC 718"). ASC 718 requires companies to estimate the fair value of equity-based payment awards on the date of grant using an option-pricing model.
|
|
The Company accounts for employees' share-based payment awards classified as equity awards using the grant-date fair value method. The fair value of share-based payment transactions is recognized as an expense over the requisite service period, net of estimated forfeitures. The Company estimates forfeitures based on historical experience and anticipated future conditions. The Company elected to recognize compensation expense for an award that has a graded vesting schedule using the accelerated method.
|
F - 26
CAESARSTONE LTD. (FORMERLY CAESARSTONE SDOT-YAM LTD.)
AND ITS SUBSIDIARIES
NOTES TO THE CONSOLIDATED FINANCIAL STATEMENTS
U.S. dollars in thousands (except share data)
| NOTE 2:- |
SIGNIFICANT ACCOUNTING POLICIES (Cont.)
|
| u. |
Accounting for stock-based compensation (Cont.):
|
| 1. |
Equity share based payment (Cont.):
|
The exercise price of each option is generally Company's stock price on the date of the grant. Options generally become exercisable over approximately three to four-year period, subject to the continued employment of the employee. All options expire after 7 years from the date of grant. In addition, commencing in 2015 the Company granted certain of its employees and officers with restricted stock units ("RSUs"). RSUs vest over an approximate four year period of employment from the grant date. RSUs fair value is measured at the grant date based on the market value of Company's common stock. RSUs that are cancelled or forfeited become available for future grants.
In 2016 and 2015, the Company estimated the fair value of stock options granted using the Black-Scholes option pricing model with the following
weighted average assumptions:
|
December 31,
|
||||||||
|
2016
|
2015
|
|||||||
|
Dividend yield
|
0
|
%
|
0
|
%
|
||||
|
Expected volatility
|
40.9
|
%
|
41.1
|
%
|
||||
|
Risk-free interest rate
|
1.1
|
%
|
1.2
|
%
|
||||
|
Expected life (in years)
|
4.78
|
3.98
|
||||||
The Company used volatility data in accordance with ASC 718. Commencing 2016 volatility calculation was based on Company's historical data. For grants made until 2015, the computation of historical volatility was derived from a combination of Company's historical volatility and comparable companies' historical volatility for similar contractual terms.
The computation of risk free interest rate is based on the rate available on the date of grant of a zero-coupon U.S. government bond with a remaining term equal to the expected term of the option.
The expected term of options granted is calculated using the simplified method (being the average between the vesting periods and the contractual life of the options). The Company currently uses the simplified method as adequate historical experience is not available to provide a reasonable estimate.
The dividend yield is zero, due to a dividend adjustment mechanism with respect to the exercise price upon payment of a dividend.
F - 27
CAESARSTONE LTD. (FORMERLY CAESARSTONE SDOT-YAM LTD.)
AND ITS SUBSIDIARIES
NOTES TO THE CONSOLIDATED FINANCIAL STATEMENTS
U.S. dollars in thousands (except share data)
| NOTE 2:- |
SIGNIFICANT ACCOUNTING POLICIES (Cont.)
|
| u. |
Accounting for stock-based compensation (Cont.):
|
| 2. |
Phantom share based payment:
|
During 2014, the Company granted several of its employees a right to a bonus payment based on an increase in the Company's share value (the "phantom award") under which the employees are entitled to receive in cash or shares the difference between exercise price, subject to adjustments for dividend distributions made until the actual payment of the bonus and the value of the Company's ordinary shares with such bonus right vesting over a four-year period on an annual basis.
According to ASC 718-10, "instruments that are required to be cash-settled (e.g., cash-settled stock appreciation rights) or require cash settlement on the occurrence of a contingent event that is considered probable" should be treated as a liability. As such, in this case the share-based compensation is accounted for as a liability award. According to ASC 718-10, in connection with the measurement of the liability settlement, the value of the award should be measured each reporting date until settlement. The fair value of the phantom award was calculated using the Binominal option pricing model.
On October 27, 2015, the Company's board of directors approved the grant of stock options and RSUs as a partial replacement for the phantom awards previously granted during 2014.
A change in the terms or conditions of the phantom awards is accounted for as a modification under ASC 718. On the date of modification, the amounts previously recorded as a share-based compensation liability are reclassified and recorded as a component of equity by a credit to additional paid-in capital. The Company reclassified during the year ended December 31, 2015 an amount of approximately $195 pursuant to the modification. Any incremental fair value, if any, of the modified award over the fair value of the original award immediately before its terms are modified is recognized over the remaining requisite service period.
F - 28
CAESARSTONE LTD. (FORMERLY CAESARSTONE SDOT-YAM LTD.)
AND ITS SUBSIDIARIES
NOTES TO THE CONSOLIDATED FINANCIAL STATEMENTS
U.S. dollars in thousands (except share data)
| NOTE 2:- |
SIGNIFICANT ACCOUNTING POLICIES (Cont.)
|
| u. |
Accounting for stock-based compensation (Cont.):
|
| 2. |
Phantom share based payment (Cont.):
|
The Company estimated the fair value of the remaining phantom awards, using the binominal option pricing model with the following
weighted average assumptions:
|
December 31,
|
||||||||
|
2016
|
2015
|
|||||||
|
Dividend yield
|
0
|
%
|
0
|
%
|
||||
|
Expected volatility
|
46.9
|
%
|
39.2
|
%
|
||||
|
Risk-free interest rate
|
1.8
|
%
|
1.8
|
%
|
||||
|
Expected life (in years)
|
4.3
|
5.2
|
||||||
As of December 31, 2016 and 2015, the Phantom liability balance was $100 and $538, respectively. As of December 31, 2016, compensation cost related to the phantom award was fully recognized.
| v. |
Redeemable non-controlling interest:
|
The Company is party to a put and call arrangement with respect to the remaining 45% non-controlling interest in Caesarstone Canada, Inc. Due to the existing put and call arrangements, the non-controlling interest is considered to be redeemable and is recorded on the balance sheet as a redeemable non-controlling interest outside of permanent equity. The redeemable non-controlling interest is recognized at the higher of: i) the accumulated earnings associated with the non-controlling interest, or ii) the redemption value as of the balance sheet date.
The following table provides a reconciliation of the redeemable non-controlling interest:
|
December 31,
|
||||||||||||
|
2016
|
2015
|
2014
|
||||||||||
|
Beginning of the year
|
$
|
8,841
|
$
|
8,715
|
$
|
7,624
|
||||||
|
Net income attributable to non-controlling interest
|
1,887
|
1,692
|
1,820
|
|||||||||
|
Dividend paid (*)
|
(243
|
)
|
-
|
-
|
||||||||
|
Adjustment to redemption value
|
2,248
|
-
|
-
|
|||||||||
|
Foreign currency translation adjustments
|
206
|
(1,566
|
)
|
(729
|
)
|
|||||||
|
Redeemable non-controlling interest - end of the year
|
$
|
12,939
|
$
|
8,841
|
$
|
8,715
|
||||||
(*) In 2016 dividend payment was made by Company's subsidiary Caesarstone Canada Inc. and reflects the amount paid to the non-controlling interest holders.
F - 29
CAESARSTONE LTD. (FORMERLY CAESARSTONE SDOT-YAM LTD.)
AND ITS SUBSIDIARIES
NOTES TO THE CONSOLIDATED FINANCIAL STATEMENTS
U.S. dollars in thousands (except share data)
| NOTE 2:- |
SIGNIFICANT ACCOUNTING POLICIES (Cont.)
|
| w. |
Capitalized software costs:
|
The Company follows the accounting guidance specified in ASC 350-40, "Internal-Use Software". The Company capitalizes costs incurred in the acquisition or development of software for internal use, including the costs of the software, materials, and consultants incurred in developing internal-use computer software, once final selection of the software is made. Costs incurred prior to the final selection of software and costs not qualifying for capitalization are charged to expense. Capitalized software costs are amortized on a straight-line basis over it's useful life.
| x. |
Contingencies:
|
The Company is involved in various product liability, commercial, government investigations, environmental claims and other legal proceedings that arise from time to time in the course of business. The Company records accruals for these types of contingencies to the extent that the Company concludes their occurrence is probable and that the related liabilities are estimable. When accruing these costs, the Company will recognize an accrual in the amount within a range of loss that is the best estimate within the range. When no amount within the range is a better estimate than any other amount, the Company accrues for the minimum amount within the range. The Company records anticipated recoveries under existing insurance contracts that are probable of occurring at the amount that is expected to be collected. Legal costs are expensed as incurred. For unasserted claims or assessments, the Company followed the accounting guidance in ASC 450-20-50-6, 450-20-25-2 and 450-20-55-2 in which the Company must first determine that the probability that an assertion will be made is likely, then, a determination as to the likelihood of an unfavorable outcome and the ability to reasonably estimate the potential loss is made.
| y. |
Treasury shares:
|
During the year ended December 31, 2016, the Company repurchased its common stock pursuant to a board-authorized share repurchase program through open market purchases The repurchases of common shares are accounted for as treasury shares, and resulted in a reduction of stockholders' equity. The Company presents the cost to repurchase treasury shares as a separate component of shareholders' equity.
F - 30
CAESARSTONE LTD. (FORMERLY CAESARSTONE SDOT-YAM LTD.)
AND ITS SUBSIDIARIES
NOTES TO THE CONSOLIDATED FINANCIAL STATEMENTS
U.S. dollars in thousands (except share data)
| NOTE 2:- |
SIGNIFICANT ACCOUNTING POLICIES (Cont.)
|
| z. |
Impact of recently issued accounting standards:
|
| 1. |
In May 2014, the FASB issued ASU No. 2014-09 related to revenue recognition. This new standard will replace all current GAAP guidance on this topic and eliminate all industry-specific guidance. Under the new standard, revenue is recognized when a customer obtains control of promised goods or services and is recognized in an amount that reflects the consideration which the entity expects to receive in exchange for those goods or services. In addition, the standard requires disclosure of the nature, amount, timing, and uncertainty of revenue and cash flows arising from contracts with customers. The FASB has recently issued several amendments to the standard, including clarification on accounting for licenses of intellectual property and identifying performance obligations.
|
The guidance permits two methods of adoption: retrospectively to each prior reporting period presented (full retrospective method), or retrospectively with the cumulative effect of initially applying the guidance recognized at the date of initial application (the modified retrospective method).
The new standard will be effective for the Company beginning January 1, 2018, and early adoption is permitted. The Company currently anticipate adoption of the new standard effective January 1, 2018.
While the Company is continuing to assess all potential impacts of the standard, the Company currently does not believe the new standard will have a material impact on its financial statements. The Company expects to adopt the new standard using the modified retrospective method.
| 2. |
In July 2015, the FASB issued ASU No. 2015-11, "Inventory (Topic 330), Simplifying the Measurement of Inventory". Under this ASU, the measurement principle for inventory will change from lower of cost or market value to lower of cost and net realizable value. The ASU defines net realizable value as the estimated selling price in the ordinary course of business, less reasonably predictable costs of completion, disposal, and transportation. The ASU is applicable to inventory that is accounted for under the first-in, first-out method and is effective for reporting periods after December 15, 2016, with early adoption permitted. The Company is evaluating the impact of adopting this new accounting guidance on its consolidated financial statements.
|
| 3. |
In November 2015, the FASB issued
ASU No. 2015-17
related to balance sheet classification of deferred taxes. The new guidance requires that deferred tax assets and liabilities be classified as noncurrent in a classified statement of financial position. The new standard is effective for fiscal years, and interim periods within those fiscal years, beginning after December 15, 2016. Early adoption is permitted. The adoption of this standard is not expected to have a material impact on Company's consolidated financial statements.
|
F - 31
CAESARSTONE LTD. (FORMERLY CAESARSTONE SDOT-YAM LTD.)
AND ITS SUBSIDIARIES
NOTES TO THE CONSOLIDATED FINANCIAL STATEMENTS
U.S. dollars in thousands (except share data)
| NOTE 2:- |
SIGNIFICANT ACCOUNTING POLICIES (Cont.)
|
| z. |
Impact of recently issued accounting standards (Cont.):
|
| 4. |
In February 2016, the FASB issued ASU No. 2016-02, Leases (Topic 842) that will supersede current guidance related to accounting for leases. The guidance is intended to increase transparency and comparability among organizations by recognizing lease assets and lease liabilities on the balance sheet and disclosing key information about leasing arrangements. The standard will be effective for the first interim period within annual periods beginning after December 15, 2018, with early adoption permitted. The standard is required to be adopted using the modified retrospective approach. The Company is evaluating the impact that adopting this guidance will have on its consolidated financial statements.
|
| 5. |
In August 2016, the FASB issued ASU No. 2016-15 which amends the guidance on the classification of certain cash receipts and payments in the statement of cash flows. This ASU is effective for annual and interim reporting periods beginning after December 15, 2017 and is applied retrospectively. Early adoption is permitted including adoption in an interim period. The Company is currently evaluating the impact that this guidance will have on its financial condition and results of operations.
|
| 6. |
In March 2016, the FASB issued ASU No. 2016-09, "Improvements to Employee Share-Based Payment Accounting." This ASU affects entities that issue share-based payment awards to their employees. The ASU is designed to simplify several aspects of accounting for share-based payment award transactions, which include the income tax consequences, classification of awards as either equity or liabilities, classification on the statement of cash flows and forfeiture rate calculations. The Company will adopt this ASU on its effective date of January 1, 2017. The adoption of this ASU is not expected to have a material impact on the Company's consolidated financial statements.
|
| 7. |
In June 2016, the FASB issued ASU 2016-13 amending how entities will measure credit losses for most financial assets and certain other instruments that are not measured at fair value through net income. The guidance requires the application of a current expected credit loss model which is a new impairment model based on expected losses. Under this model, an entity recognizes an allowance for expected credit losses based on historical experience, current conditions and forecasted information rather than the current methodology of delaying recognition of credit losses until it is probable a loss has been incurred. This ASU is effective for interim and annual reporting periods beginning after December 15, 2019 with early adoption permitted for annual reporting periods beginning after December 15, 2018. We are currently evaluating the impact of the new guidance on our consolidated financial statements and related disclosures.
|
F - 32
CAESARSTONE LTD. (FORMERLY CAESARSTONE SDOT-YAM LTD.)
AND ITS SUBSIDIARIES
NOTES TO THE CONSOLIDATED FINANCIAL STATEMENTS
U.S. dollars in thousands (except share data)
| NOTE 2:- |
SIGNIFICANT ACCOUNTING POLICIES (Cont.)
|
| z. |
Impact of recently issued accounting standards (Cont.):
|
| 8. |
In January 2017, the FASB issued ASU 2017-04, Intangibles-Goodwill and Other (Topic 350) Simplifying the Test for Goodwill Impairment. With ASU 2017-04, an entity will no longer determine goodwill impairment by calculating the implied fair value of goodwill by assigning the fair value of a reporting unit to all of its assets and liabilities as if that reporting unit had been acquired in a business combination. Instead, an entity will compare the fair value of a reporting unit with its carrying amount and recognize an impairment charge for the amount by which the carrying amount exceeds the reporting unit's fair value. ASU 2017-04 is effective for annual or any interim goodwill impairment tests in fiscal years beginning after December 15, 2019. ASU 2017-04 is not expected to have a material impact to the Company's consolidated financial position, results of operations or cash flows.
|
| NOTE 3:- |
OTHER ACCOUNTS RECEIVABLE AND PREPAID EXPENSES
|
|
December 31,
|
||||||||
|
2016
|
2015
|
|||||||
|
Prepaid expenses
|
$
|
3,101
|
$
|
1,760
|
||||
|
Government authorities
|
13,991
|
10,888
|
||||||
|
Deferred tax assets
|
11,409
|
10,820
|
||||||
|
Advances to suppliers
|
2,831
|
2,976
|
||||||
|
Derivatives
|
2,570
|
2,060
|
||||||
|
Other receivables (see also note 10)
|
5,582
|
3,726
|
||||||
|
$
|
39,484
|
$
|
32,230
|
|||||
| NOTE 4:- |
INVENTORIES
|
|
December 31,
|
||||||||
|
2016
|
2015
|
|||||||
|
Raw materials
|
$
|
24,306
|
$
|
24,218
|
||||
|
Work-in-progress
|
1,348
|
1,422
|
||||||
|
Finished goods
|
75,820
|
69,839
|
||||||
|
$
|
101,474
|
$
|
95,479
|
|||||
F - 33
CAESARSTONE LTD. (FORMERLY CAESARSTONE SDOT-YAM LTD.)
AND ITS SUBSIDIARIES
NOTES TO THE CONSOLIDATED FINANCIAL STATEMENTS
U.S. dollars in thousands (except share data)
| NOTE 5:- |
PROPERTY, PLANT AND EQUIPMENT, NET
|
|
December 31,
|
||||||||
|
2016
|
2015
|
|||||||
|
Cost:
|
||||||||
|
Machinery and manufacturing equipment, net (1)
|
$
|
231,914
|
$
|
218,610
|
||||
|
Office equipment and furniture
|
14,828
|
12,757
|
||||||
|
Motor vehicles
|
1,043
|
855
|
||||||
|
Buildings and leasehold improvements
|
106,422
|
99,607
|
||||||
|
Prepaid expenses related to operating lease (2)
|
939
|
939
|
||||||
|
355,146
|
332,768
|
|||||||
|
Accumulated depreciation
|
132,328
|
107,330
|
||||||
|
Depreciated cost
|
$
|
222,818
|
$
|
225,438
|
||||
| (1) |
|
| (2) |
Until 2012, the Company leased land from the Israel Lands Administration ("ILA") for its Bar-Lev manufacturing facility. The lease term started on February 6, 2005. The lease is for an initial non-cancellable term of 49 years, with a renewal option of an additional 49 years. The Company analyzed the conditions set forth in ASC 840-10 and classified the land as an operating lease (since the land is not transferred to the Company at the end of the lease nor is there any option to buy the land from the ILA at any point). All payments on account of the initial term were paid in advance (based on discounted values) at the beginning of the lease, and included in the minimum lease payments to be amortized. The prepaid expenses are amortized through the term of the lease, based on the straight-line method (including the bargain renewal option term). See also note 13(d).
|
Depreciation expense were $25,929, $19,243 and $13,974 for the years ended December 31, 2016, 2015 and 2014, respectively.
F - 34
CAESARSTONE LTD. (FORMERLY CAESARSTONE SDOT-YAM LTD.)
AND ITS SUBSIDIARIES
NOTES TO THE CONSOLIDATED FINANCIAL STATEMENTS
U.S. dollars in thousands (except share data)
| NOTE 6:- |
OTHER
INTANGIBLES
ASSETS
|
|
December 31,
|
||||||||
|
2016
|
2015
|
|||||||
|
Original amounts:
|
||||||||
|
Non-compete agreement
|
$
|
1,462
|
$
|
1,453
|
||||
|
Distribution relationships
|
1,584
|
1,594
|
||||||
|
Customer relationships
|
6,006
|
5,910
|
||||||
|
Distribution agreement
|
14,606
|
14,606
|
||||||
|
23,658
|
23,563
|
|||||||
|
Accumulated amortization:
|
||||||||
|
Non-compete agreement
|
(1,455
|
)
|
(1,434
|
)
|
||||
|
Distribution relationships
|
(1,392
|
)
|
(1,305
|
)
|
||||
|
Customer relationships
|
(5,395
|
)
|
(4,962
|
)
|
||||
|
Distribution agreement
|
(10,870
|
)
|
(8,979
|
)
|
||||
|
(19,112
|
)
|
(16,680
|
)
|
|||||
|
Total other intangibles assets
|
$
|
4,546
|
$
|
6,883
|
||||
| (1) |
Amortization expense amounted to $2,325, $3,091 and $3,202 for the years ended December 31, 2016, 2015 and 2014, respectively.
|
| (2) |
Estimated amortization expenses for the following years as of December 31, 2016:
|
|
2017
|
$
|
2,305
|
||
|
2018
|
2,241
|
|||
|
$
|
4,546
|
| NOTE 7:- |
GOODWILL
|
The changes in the carrying amount of goodwill for the years ended December 31, 2016 and 2015 are as follows:
|
Balance as of December 31, 2014
|
$
|
37,960
|
||
|
Foreign currency translation adjustments
|
(2,139
|
)
|
||
|
Balance as of December 31, 2015
|
$
|
35,821
|
||
|
Foreign currency translation adjustments
|
(165
|
)
|
||
|
Balance as of December 31, 2016
|
$
|
35,656
|
F - 35
CAESARSTONE LTD. (FORMERLY CAESARSTONE SDOT-YAM LTD.)
AND ITS SUBSIDIARIES
NOTES TO THE CONSOLIDATED FINANCIAL STATEMENTS
U.S. dollars in thousands (except share data)
| NOTE 8:- |
SHORT-TERM BANK CREDIT
|
| a. |
Short-term bank credit and loans are classified as follows:
|
|
Weighted average interest
|
|||||||||||||||||
|
Currency
|
December 31,
|
December 31,
|
|||||||||||||||
|
2016
|
2015
|
2016
|
2015
|
||||||||||||||
| % | |||||||||||||||||
|
Short-term bank credit
|
CAD
|
2.95
|
3.04
|
$
|
8,540
|
$
|
3,241
|
||||||||||
| b. |
As of December 31, 2016 and 2015, the Company had short-term and revolving credit lines of approximately $13,542 and $11,785 (out of which $8,540 and $3,241 respectively were utilized as presented in the table above), respectively, from Israeli and Canadian banks. The Company's current credit lines, if not extended, will expire in December 2017 in Israeli banks and in July 2017 in Canadian bank.
|
| NOTE 9:- |
ACCRUED EXPENSES AND OTHER LIABILITIES
|
|
December 31,
|
||||||||
|
2016
|
2015
|
|||||||
|
Employees and payroll accruals
|
$
|
12,251
|
$
|
10,438
|
||||
|
Accrued expenses
|
7,005
|
7,138
|
||||||
|
Advances from customers
|
1,022
|
574
|
||||||
|
Taxes payable
|
3,091
|
2,647
|
||||||
|
Warranty provision
|
1,287
|
1,239
|
||||||
|
Derivatives
|
536
|
1,421
|
||||||
|
Phantom share based payment
|
100
|
390
|
||||||
|
Legal settlements and loss contingencies (see also note 10)
|
7,355
|
3,647
|
||||||
|
Other
|
418
|
492
|
||||||
|
$
|
33,065
|
$
|
27,986
|
|||||
F - 36
CAESARSTONE LTD. (FORMERLY CAESARSTONE SDOT-YAM LTD.)
AND ITS SUBSIDIARIES
NOTES TO THE CONSOLIDATED FINANCIAL STATEMENTS
U.S. dollars in thousands (except share data)
| NOTE 10:- |
COMMITMENTS AND CONTINGENT LIABILITIES
|
| a. |
Legal proceedings and contingencies:
|
Claim by former South African distributor
In December 2007, the Company terminated its agency agreement with its former South African agent, World of Marble and Granite (“WOMAG”), on the basis that WOMAG had breached the agreement. In the same month, the Company filed a claim for NIS 1.0 million (approximately $257) in the Israeli District Court in Haifa based on such breach. WOMAG has contested jurisdiction of the Israeli District Court, but subsequent appellate courts have dismissed WOMAG’s claims. In January 2008, WOMAG filed suit in South Africa seeking Euro 15.7 million (approximately $17,060). In September 2013, the South African Court determined that since a proceeding on the same facts was pending before another court (lis alibis pendens), the South African Court will stay the matter until the conclusion of the Israeli action. In December 2013, the magistrate’s court in Israel held that the Company was not entitled to terminate the agreement with WOMAG as it was not breached by WOMAG. In October 2015, WOMAG amended its claim, seeking a reduced amount of approximately Euro 7.1 million (approximately $7,727) and approximately South Africa RAND 43.7 million (approximately $2,808). In June 2016, WOMAG further amended its claim, seeking a reduced amount of Euro 6.2 million (approximately $6,520) and South Africa RAND 51.2 million (approximately $3,700). As the district court dismissed the Company’s appeal of the decision of the magistrate’s court, the Company has agreed with WOMAG to submit the matter to arbitration, for which hearings commenced in South Africa in September 2016. The arbitration is divided into two stages. Both stages relate to the quantum of damages payable to the Company; the first stage in respect of the assumptions underlying the computation of WOMAG’s claim and the second in respect of the calculation itself. After both phases, if any of the parties is not satisfied with the arbitrator’s decision, that party may lodge an appeal to a panel of three arbitrators to be appointed by the parties. The expected timeframe for resolution of the claim currently cannot be estimated with precision. While the Company expects that the arbitration phase will end in 2017, with the possibility of appeals thereafter in 2018, quantum of any compensation that may be required to be paid by the Company, will be determined after merits have been finalized and expected to be concluded in 2019. Although the Company believes that it submitted vigorous defenses against WOMAG’s claims and intends to vigorously defend in any appeal, the Company believes that it recorded an adequate reserve for this claim.
Bodily injury claims related to exposure to silica dust
Overview
The Company is subject to a number of claims in Israel mainly by fabricators, their employees or the National Insurance Institute ("NII") alleging that fabricators contracted illnesses, including silicosis, through exposure to silica particles during cutting, polishing, sawing, grinding, breaking, crushing, drilling, sanding or sculpting Company's products.
F - 37
CAESARSTONE LTD. (FORMERLY CAESARSTONE SDOT-YAM LTD.)
AND ITS SUBSIDIARIES
NOTES TO THE CONSOLIDATED FINANCIAL STATEMENTS
U.S. dollars in thousands (except share data)
| NOTE 10:- |
COMMITMENTS AND CONTINGENT LIABILITIES (Cont.)
|
| a. |
Legal proceedings and contingencies (Cont.):
|
Bodily injury claims related to exposure to silica dust (Cont.):
Silicosis and other bodily Injury Claims
As of December 31, 2016, the Company is subject to 87 pending claims of bodily injury claims (out of which 86 are individual claims and one claim with a motion to be recognized as a class action) that have been in Israel since 2008 against the Company directly, or that have named the Company as third-party defendant by fabricators or their employees in Israel, by the injured's successors, by the NII or by others (see also table below). In addition the Company's subsidiary in Australia is subject to an individual pre-litigation notice of bodily injury from a fabricator.
As of December 31, 2016, the Company has 6 pending pre-litigation demand letters on behalf of certain fabricators in Israel.
Each of the claims named other defendants, such as fabricators that employed the plaintiffs, the Israeli Ministry of Industry, Trade and Employment, distributors of the Company's products, insurance companies and insurance brokers.
Various arguments are raised in the claims, including among others product liability arguments and failure to provide warnings regarding the risks associated with silica dust generated by the fabrication of the Company's products. Most of the claims do not specify a total amount of damages sought, as the plaintiff’s future damages will be determined at trial. A claim filed with the Magistrates court in Israel is limited to a maximum of NIS 2.5 million (approximately $650) plus any fees, and among the 87 pending claims filed against the Company in Israel, 61 claims were filed in the Magistrates court. A claim filed in the District court is not subject to such limitation. As a result, there is uncertainty regarding the total amount of damages that may ultimately be claimed. As of December 31, 2016 each claim for which a reserve was accrued was litigated in the Israeli court. Such claims may be subject or referred to mediation, settled by the parties or resolved by a court decision and may also be appealed. Although the time frame for the resolution for each claim may significantly vary, the Company also based in on its legal advisors recorded the related reserve as short or long term liability.
During 2015, the Company reassessed the expected outcome of the individual bodily injury claims following Company's consent to several settlements. In addition the Company entered into an agreement with the State of Israel, with the approval of its insurance carriers, related to individual bodily injury claims (not including the claim seeking class action status). Under the agreement, without admitting any liability, the Company and the State of Israel have agreed to cooperate in dealing with the claims. The agreement was initially signed in November 2015 for a period of one year and currently the Company is in the process of renewing it.
F - 38
CAESARSTONE LTD. (FORMERLY CAESARSTONE SDOT-YAM LTD.)
AND ITS SUBSIDIARIES
NOTES TO THE CONSOLIDATED FINANCIAL STATEMENTS
U.S. dollars in thousands (except share data)
| NOTE 10:- |
COMMITMENTS AND CONTINGENT LIABILITIES (Cont.)
|
| a. |
Legal proceedings and contingencies (Cont.):
|
Bodily injury claims related to exposure to silica dust (Cont.):
Silicosis and other bodily Injury Claims (Cont.):
If either the Company or the State of Israel is found liable for damages, the Company has agreed to an apportionment of those damages. Based on the above, the Company assessed, based also on its legal advisors’ opinion, that contingent losses related to the individual bodily injury claims in Israel are probable, pursuant to ASC 450, an accrual has been recorded for the loss contingencies related to such outstanding individual claims.
In April 27, 2014, a lawsuit by a single plaintiff and a motion for the recognition of this lawsuit as a class action was filed against the Company in the Central District Court in Israel. The plaintiff alleges that, if the lawsuit is recognized as a class action, the claim against the Company is estimated to be NIS 216 million (approximately $56,180). In addition, the claim includes an unstated sum in compensation for special and general damages. The Company intends to vigorously contest recognition of the lawsuit as a class action and to defend the lawsuit on its merits.
The Company updated its provision in 2016 to reflect all outstanding claims, taking into consideration new claims filed, settlements reached and other new information available.
In order to reasonably estimate the losses for bodily injury claims reflected in the table below, the Company performed a case-by-case analysis of the relevant facts with its legal advisors that were reasonably available to it related to the claims filed, including, among other things, the specific known or estimated health condition of the claimants, their ages, salaries and other factors that might have an impact on the final outcome of such claims. The Company will continue to regularly monitor changes in facts for each claim and will update its best estimate if required. Accordingly, the reserve for the bodily injury claims as of December 31, 2016 and 2015 totaled to $17,682 and $14,837 respectively, of which $5,155 and $3,647 is reported in accrued expenses and other liabilities and $12,527 and $11,190 is reported in long-term liabilities. The Company can not estimate the number of claimants that may file claims in the future or the nature of their claims in order to conclude probability or the range of loss. The Company currently does not expect to incur additional material losses with respect to the outstanding bodily injury claims, that might have a material impact on its financial position, results of operations and cash flows.
F - 39
CAESARSTONE LTD. (FORMERLY CAESARSTONE SDOT-YAM LTD.)
AND ITS SUBSIDIARIES
NOTES TO THE CONSOLIDATED FINANCIAL STATEMENTS
U.S. dollars in thousands (except share data)
| NOTE 10:- |
COMMITMENTS AND CONTINGENT LIABILITIES (Cont.)
|
| a. |
Legal proceedings and contingencies (Cont.):
|
Bodily injury claims related to exposure to silica dust (Cont.):
Silicosis and other bodily Injury Claims (Cont.):
A summary of bodily injury claims activity follows:
|
2016
|
2015
|
2014
|
||||||||||
|
Outstanding claims, January 1
|
70
|
56
|
28
|
|||||||||
|
New claims
|
31
|
16
|
29
|
|||||||||
|
Settled and dismissed claims
|
(14
|
)
|
(2
|
)
|
(1
|
)
|
||||||
|
Outstanding claims, December 31 (*)
|
87
|
70
|
56
|
|||||||||
(*) Not including the pre-litigation notice received by Company's subsidiary in Australia.
The Company maintains insurance for product liability claims, including for bodily injury claims related to exposure to silica dust. The Company has purchased insurance policies for the period from 2008-and to date from several insurance carriers that provide coverage for product liability losses, subject to certain terms and conditions, and the related defense costs up to a certain limit per case and per policy year.
The available limits of these policies as it relates to the claims reflected in the table above, exceed the recorded insurance receivable balance. Commencing April 2014, the Company’s Israeli insurance policies have significant per claim deductibles. Commencing April 2015, the first layer of insurance in Israel, of $5 million was not renewed. Since that time, the Company’s insurance covers claims in Israel in excess of $5 million per year up to an amount of $35 million per claim or per period. Those policies include a significant deductible per claim and cover only illnesses diagnosed after February 2010. However, with respect to the claim which was required to be recognized as a class action, Company's insurer has denied coverage for this claim.
The Company records insurance receivables for the amounts that are covered by insurance less deductibles. During 2016 and 2015, as in prior years, Company's insurance carriers made payments to all settled product liability claims. The Company paid the deductible amounts for the settled claims per policy.
F - 40
CAESARSTONE LTD. (FORMERLY CAESARSTONE SDOT-YAM LTD.)
AND ITS SUBSIDIARIES
NOTES TO THE CONSOLIDATED FINANCIAL STATEMENTS
U.S. dollars in thousands (except share data)
| NOTE 10:- |
COMMITMENTS AND CONTINGENT LIABILITIES (Cont.)
|
| a. |
Legal proceedings and contingencies (Cont.):
|
Bodily injury claims related to exposure to silica dust (Cont.):
Silicosis and other bodily Injury Claims (Cont.):
The collectability of the Company's insurance receivables is regularly evaluated and the amounts recorded are probable of collection. This conclusion is based on analysis of the terms of the underlying insurance policies, experience in successfully recovering individual product liability claims from Company's insurers, the insurance carrier was party to the agreement with the State of Israel and the financial ability of the insurance carriers to pay the claims and the relevant facts and applicable law.
As of December 31, 2016 and 2015, the insurance receivable totaled to $7,509 and $10,183 respectively, of which $2,441 and $3,567 is reported in the other accounts receivable and prepaid expenses and $5,068 and $6,616 is in other long-term receivables.
In 2016 and 2015, the difference between the provision for claims and related insurance receivables was recorded in the legal settlements and loss contingencies in the amount of $5,868 and $4,654, respectively, which reflects the deductible amounts for claims covered by insurance policies,claims not covered and the impact of settlements.
December
2013 Judgment
In December 2013, a judgment was entered by the Central District Court of Israel in one of the lawsuits, according to which the Company was found to be comparatively liable for 33% of the plaintiff's total damages. The remaining liability was imposed on the plaintiff at 40%, as contributory negligence, and on the Israeli Ministry of Industry at 27%. The total damages of the plaintiff (before the reduction of contributory damages) were found by the court to be NIS 5.3 million (approximately $1,400). The total liability imposed on the Company in this case was NIS 436,669 (approximately $112) plus the claimant's legal expenses. Such amount was fully paid by Company's insurer in January 2014 (apart from Company's deductible). The Company, as well as the Israeli Ministry of Industry and the plaintiff, appealed the judgment to the Israeli Supreme Court.
During 2015, the Supreme Court accepted the request of the parties (other than the distributor) to cancel all the findings made by the District Court, except for its decision not to impose liability on the distributor, which will be subject to a further hearing at the Supreme Court. As part of the cancelation of the District Court's judgment, out of court settlements were reached between the parties.
F - 41
CAESARSTONE LTD. (FORMERLY CAESARSTONE SDOT-YAM LTD.)
AND ITS SUBSIDIARIES
NOTES TO THE CONSOLIDATED FINANCIAL STATEMENTS
U.S. dollars in thousands (except share data)
| NOTE 10:- |
COMMITMENTS AND CONTINGENT LIABILITIES (Cont.)
|
| a. |
Legal proceedings and contingencies (Cont.):
|
Arbitration
proceeding
with Microgil Agricultural Cooperative Society Ltd
.
In November 2011, Kfar Giladi and Microgil (the "claimants"), initiated arbitration proceedings against the Company that commenced in April 2012. The claimants filed a claim against the Company in arbitration for NIS 232.8 million ($60.5 million) for alleged damages and losses incurred by them in connection with a breach of Processing Agreement by the Company. In August 2012, the Company filed a claim against the claimants in arbitration for NIS 76.6 million ($19.9 million) for damages incurred by the Company in connection with claimants malfunctioning operations, breach of the agreement and the understanding between the parties regarding the agreement after it was terminated, inventory which was not returned to the Company and was unaccounted for and an unpaid loan, which was granted by the Company to the claimants.
The arbitration arises out of a dispute related to the Processing Agreement that the Company entered into with the claimants in June 2006 pursuant to which the claimants committed to establish a production facility at their own expense within 21 months of the date of the Processing Agreement to process quartz for the Company and for other potential customers. Pursuant to the Processing Agreement, the Company committed to pay fixed prices for quartz processing services related to agreed-upon quantities of quartz over a period of ten years from the date set for the claimants to commence operating the production facility. The Company estimates that the total amount of such payments would have been approximately $55,000. It is Company's position that the production facility established by the claimants was not operational until approximately two years after the date required by the Processing Agreement. As a result, the Company was unable to purchase the minimum quantities set forth in the Processing Agreement and therefore acquired the quantities of ground quartz needed from other quartz suppliers.
In January 2012, claimants notified that they had closed their production facility as a result of Company's breach of the Processing Agreement. It is Company’s position that the Processing Agreement was terminated by the Company following it’s breach by the claimants. The Company contends that the purchases of ground quartz in 2010 and 2011 were made pursuant to new understandings reached between the parties and not pursuant to the Processing Agreement. The claimants alleged that the Processing Agreement was still in effect and that the Company did not meet the contractual commitments under the Processing Agreement to order the minimum annual quantity. In addition, once production began, the Company contends that the claimants failed to consistently deliver the required quantity and quality of ground quartz as agreed by the parties.
F - 42
CAESARSTONE LTD. (FORMERLY CAESARSTONE SDOT-YAM LTD.)
AND ITS SUBSIDIARIES
NOTES TO THE CONSOLIDATED FINANCIAL STATEMENTS
U.S. dollars in thousands (except share data)
| NOTE 10:- |
COMMITMENTS AND CONTINGENT LIABILITIES (Cont.)
|
| a. |
Legal proceedings and contingencies (Cont.):
|
Arbitration
proceeding
with Microgil Agricultural Cooperative Society Ltd
. (Cont.)
The Company also contends that the claimants are responsible for not returning unprocessed quartz that the Company provided to them, including quartz that is currently in the claimants' possession and additional quartz that is unaccounted for.
In November 2015, the claimants filed a motion to require the Company to deposit a bond in the amount of NIS 100 million (approximately $25.6 million) and asking for an injunction to prevent the disposition of assets, plants and equipment valued at no less than NIS 149.2 million (approximately $38.2 million), in order to ensure their ability to collect the compensation they may be eligible to receive as a result of the arbitration. On May 3, 2016, the motion was dismissed.
The arbitration is currently in the final summation phase. The arbitrator’s judgment is expected to be published by September 19, 2017. The Company believes that it has strong claims and have submitted vigorous defenses with respect to the claims made against it. Accordingly, the Company estimates that the loss is only reasonably possible in accordance with ASC 450.
The Company is unable to estimate the loss, or range of loss, that is reasonably possible with respect to these proceedings for the following reasons: (1) There have been no recent settlement discussions in which settlement amounts have been discussed. (2) The parties are primarily disputing the facts of the case, and the determination of such disputes is difficult to estimate. (3) These proceedings are characterized by specific features, and it is difficult to apply the results of other cases and the Company's experience in other claims to the proceedings at hand. (4) The arbitrator has broader discretion than a judge mainly because he is not bound by evidence rules.
Claim by the Israel Ministry of the Protection of the Environment ("IMPE")
The Company has been required by the IMPE to comply with the applicable requirements under the law and regulations related to styrene gas emission at both of its plants in Israel. In December 2013, the Company completed the installation of a system in its Bar-Lev manufacturing facility to reduce styrene emission and following which the Company has better control of the styrene emission in the Bar-Lev manufacturing facility and the Company presented to IMPE a plan to further improve its control of styrene emission and comply with the styrene gas emission standards With respect to the Sdot-Yam manufacturing facility the IMPE has summoned the Company in January 2014 to a hearing to address allegations that, based on the IMPE's procurement of several gas emission samplings, the Company exceeded the air ambient standards. Following the hearing, and although the IMPE acknowledged that the Company was in the process of installing measures to comply with the styrene gas emission standards, the IMPE decided to recommend the conducting of investigation with respect to the allegation that the Company exceeded from the threshold of styrene air ambient standards during 2013. During 2014, the Company applied measures to correct the styrene air ambient standards which the Company believe should conclusively solve any exceeded emission of styrene gas. Throughout 2016, the Company continued to control styren emission levels through strict maintenance and compliance with work processes.
F - 43
CAESARSTONE LTD. (FORMERLY CAESARSTONE SDOT-YAM LTD.)
AND ITS SUBSIDIARIES
NOTES TO THE CONSOLIDATED FINANCIAL STATEMENTS
U.S. dollars in thousands (except share data)
| NOTE 10:- |
COMMITMENTS AND CONTINGENT LIABILITIES (Cont.)
|
| a. |
Legal proceedings and contingencies (Cont.):
|
Claim by the Israel Ministry of the Protection of the Environment (Cont.):
In November 2016, the IMPE visited Company's Sdot-Yam facility and provided it with a summary report of its findings. The Company is in discussions with the IMPE and intend to continue monitoring, and, if necessary, applying corrective measures to control the styrene emissions at its facilities. If the Company is not fully complied with the styrene emission standards, Company's business license may be revoked, facilities may be shutdown and the Company may be subject to civil and criminal sanctions.
Other
Regulation
The Company is subject to the Israeli Hours of Work and Rest Law, 1951 ("Rest Law"), which forbids the employment of Jewish employees on Saturdays and Jewish holidays, unless a permit is obtained from the Israeli Ministry of Economy and Industry. Company's employees, including Jewish and other employees, work in three shifts a day of an average length of eight hours each, seven days a week. On September 20, 2014, an inspection of the Israeli Ministry of Economy and Industry in the Bar-Lev manufacturing facility has found three Jewish employees employed on a Saturday. Following this inspection the Company was summoned to a hearing by the Israeli Ministry of Economy and Industry. On January 24, 2016, the Company received a permit to from the Israeli Ministry of Economy and Industry to employ Jewish employees on Saturdays and Jewish holidays in Sdot-Yam facility, effective until December 31, 2017. If the Company is deemed to be in violation of the Rest Law, the Company and its officers may be exposed to administrative and criminal liabilities, including fines.
F - 44
CAESARSTONE LTD. (FORMERLY CAESARSTONE SDOT-YAM LTD.)
AND ITS SUBSIDIARIES
NOTES TO THE CONSOLIDATED FINANCIAL STATEMENTS
U.S. dollars in thousands (except share data)
| NOTE 10:- |
COMMITMENTS AND CONTINGENT LIABILITIES (Cont.)
|
| a. |
Legal proceedings and contingencies (Cont.):
|
Securities Class Action Claim
On August 25, 2015, a purported purchaser of Company’s ordinary shares filed a proposed class action in the United States District Court for the Southern District of New York asserting, among other things, that the Company and two of its officers violated Sections 10(b) and 20(a) of the Exchange Act, and Rule 10b–5 promulgated under the Exchange Act, by allegedly making false and misleading statements about the Company’s business. The complaint seeks an unspecified amount of damages on behalf of purchasers of Company’s securities between March 25, 2013 and August 18, 2015. On January 15, 2016, the plaintiff filed an amended complaint that asserted similar claims, but that seeks damages on behalf of purchasers of the Company’s securities between February 12, 2014 and August 18, 2015. On February 26, 2016, the Company filed a motion to dismiss the amended complaint. Expenses incurred as a result of this claim will be covered under the Company’s directors and officers liability insurance policy, subject to deductible and to coverage terms and limits. On January 30, 2017, the Company reached an agreement in principle with the lead plaintiffs to settle the litigation, to be paid by the Company’s insurance carrier into a settlement fund for distribution to the plaintiff class. The settlement is subject to the completion of definitive documentation and approval of the court. The Company’s insurance carriers have agreed to pay the settlement amount and the related expenses. The Company recorded in its 2016 results, provision for such settlement amount and the related receivable in the same amount.
General
From time to time, the Company is involved in other legal proceedings and claims in the ordinary course of business related to a range of matters. While the outcome of these other claims cannot be predicted with certainty, the Company's management does not believe that any such claims or all of them together will have a material effect on the Company's consolidated financial statements.
F - 45
CAESARSTONE LTD. (FORMERLY CAESARSTONE SDOT-YAM LTD.)
AND ITS SUBSIDIARIES
NOTES TO THE CONSOLIDATED FINANCIAL STATEMENTS
U.S. dollars in thousands (except share data)
| NOTE 10:- |
COMMITMENTS AND CONTINGENT LIABILITIES (Cont.)
|
| b. |
Operating lease commitments:
|
The land and certain of the Company's facilities and vehicles are leased under operating lease agreements. Future minimum lease commitments under non-cancellable operating leases for the specified periods ending after December 31, 2016 are as follows:
|
2017
|
$
|
13,889
|
||
|
2018
|
12,760
|
|||
|
2019
|
11,104
|
|||
|
2020
|
8,715
|
|||
|
2021
|
7,892
|
|||
|
2022 and thereafter
|
45,412
|
|||
|
Total
|
$
|
99,772
|
Lease expenses for the years ended December 31, 2016, 2015 and 2014 were approximately $13,479, $12,109 and $11,545, respectively.
| c. |
Purchase obligation:
|
The Company's significant contractual obligations and commitments as of December 31, 2016 are summarized in the following table:
|
2017 (1)
|
$
|
19,619
|
||
|
2018 and thereafter
|
206
|
|||
|
$
|
19,825
|
| (1) |
Consists of purchase obligations to certain suppliers.
|
| d. |
Pledges and guarantees:
|
| 1. |
As of December 31, 2016, the Company had outstanding guarantees and letters of credit with various expiration dates in a principal amount of approximately $2,319, related to facilities, vehicle leases and other miscellaneous guarantees.
|
| 2. |
Company's credit facilities provided by banks in Israel are secured with a "Negative floating pledge", whereby the Company committed not to pledge or charge and not to undertake to pledge or charge its general floating assets.
|
| 3. |
To secure the Company's liabilities to a bank in Canada, Caesarstone Canada Inc. has provided a security interest on certain of its inventory and other tangible and intangible assets.
|
F - 46
CAESARSTONE LTD. (FORMERLY CAESARSTONE SDOT-YAM LTD.)
AND ITS SUBSIDIARIES
NOTES TO THE CONSOLIDATED FINANCIAL STATEMENTS
U.S. dollars in thousands (except share data)
| NOTE 11:- |
TAXES ON INCOME
|
| a. |
Israeli taxation:
|
| 1. |
Corporate tax rate:
|
The corporate tax rate in Israel was 25% in 2016 and 26.5% in 2015 and 2014.
On December 31, 2016, the Israeli Parliament's Plenum approved by a second and third reading the Bill for Amending the Income Tax Ordinance (No. 217) (Reduction of Corporate Tax Rate) which consists of the reduction of the corporate tax rate for development area A (relates to Company's manufacturing plant in Bar-Lev industrial zone) from 9% to 7.5%, effective January, 2017 (tax rate for Company's manufacturing plant in Sdot-Yam will remain unchanged at 16%). In addition starting January, 2017, the regular tax rate in Israel was reduced to 24% and is expected to be further reduced to 23% commencing in 2018.
| 2. |
Foreign Exchange Regulations:
|
Commencing in taxable year 2014, the Company has elected to measure its taxable income and file its tax return under the Israeli Income Foreign Tax Regulations. Under the Foreign Exchange Regulations, an Israeli company must calculate its tax liability in U.S. Dollars according to certain orders and then translated into NIS according to the exchange rate as of December 31st of each year. For taxable years up to 2013, the Company measured its taxable income and filed its tax returns in NIS.
| 3. |
Tax benefits under Israel's Law for the Encouragement of Industry (Taxes), 1969:
|
The Company is an "Industrial Company," as defined by the Law for the Encouragement of Industry (Taxes), 1969, and as such, the Company is entitled to certain tax benefits, primarily amortization of costs relating to know-how and patents over eight years, accelerated depreciation and the right to deduct public issuance expenses for tax purposes.
| 4. |
Tax benefits under the Law for the Encouragement of Capital Investments, 1959:
|
According to the Law for the Encouragement of Capital Investments, 1959 (the "Encouragement Law"), the Company is entitled to various tax benefits by virtue of the "Preferred Enterprise" status granted to its enterprises, in accordance with the Encouragement Law.
F - 47
CAESARSTONE LTD. (FORMERLY CAESARSTONE SDOT-YAM LTD.)
AND ITS SUBSIDIARIES
NOTES TO THE CONSOLIDATED FINANCIAL STATEMENTS
U.S. dollars in thousands (except share data)
| NOTE 11:- |
TAXES ON INCOME (Cont.)
|
| a. |
Israeli taxation (Cont.):
|
The Company chose to be taxed according to the "Preferred Enterprise" track under Amendment No. 68 to the Encouragement Law (the "Amendment No. 68"). In order to implement Amendment No. 68 and to be taxed under the "Preferred Enterprise" track, the Company waived the tax benefits of the previous tracks -"Approved Enterprise" and "Beneficiary Enterprise" - under the Encouragement Law, starting from the 2011 tax year.
The principal benefits by virtue of the Encouragement Law are the following:
Tax benefits and reduced tax rates under the Preferred Enterprise track:
In order to receive benefits as a "Preferred Enterprise," Amendment No. 68 states certain conditions must be met. The basic condition for receiving the benefits under Amendment No. 68 is that the enterprise contributes to the country's economic growth and is a competitive factor for the gross domestic product (a "competitive enterprise"). In order to comply with this condition, the Encouragement Law prescribes various requirements. As for industrial enterprises, in each tax year, one of the following conditions must be met:
| 1. |
Its main field of activity is biotechnology or nanotechnology as approved by the Head of the Administration of Industrial Research and Development.
|
| 2. |
The industrial enterprise's sales revenues in a specific market during the tax year do not exceed 75% of its total sales for that tax year. A "market" is defined as a separate country or customs territory.
|
| 3. |
At least 25% of the industrial enterprise's overall revenues during the tax year were generated from the enterprise's sales in a specific market with a population of at least 14 million starting from 2012 tax year.
|
The tax rate on preferred income form a Preferred Enterprise in 2014 and onwards was 16% (relates to Company's manufacturing plant in Sdot-Yam) and in development area A - 9%. In 2017, the tax rate on preferred income from a Preferred Enterprise will be 16% and in development area A – 7.5% (relates to Company's manufacturing plant in Bar-Lev industrial zone).
Amendment No. 68 also prescribes that any dividends distributed to individuals or foreign residents from the preferred enterprise's earnings as above will be subject to tax at a rate of 20% from 2014 and onwards (or a reduced rate under an applicable double tax treaty). Upon a distribution of a dividend to an Israeli company, no withholding tax is remitted.
Since the Company chose to apply the provisions of Amendment No. 68, by submitting the waiver form before June 30, 2015, the Company is eligible to distribute taxed earnings derived from a Beneficiary Enterprise and/or Approved Enterprise to an Israeli company without being subject to withholding tax.
F - 48
CAESARSTONE LTD. (FORMERLY CAESARSTONE SDOT-YAM LTD.)
AND ITS SUBSIDIARIES
NOTES TO THE CONSOLIDATED FINANCIAL STATEMENTS
U.S. dollars in thousands (except share data)
| NOTE 11:- |
TAXES ON INCOME (Cont.)
|
| a. |
Israeli taxation (Cont.):
|
In development area A, in addition to the tax benefits, as mentioned above, some of the Company's facilities are eligible for grants at rate of 20% and/or loans, subject to an approval of the Israeli Investment Center.
Accelerated depreciation:
The Company is eligible for a deduction of accelerated depreciation on machinery and equipment used by the Approved Enterprise or the Beneficiary Enterprise or the Preferred Enterprise at a rate of 200% (or 400% for buildings) from the first year of the asset's operation.
Conditions for entitlement to benefits:
The above mentioned benefits are contingent upon the fulfillment of the conditions stipulated by the Encouragement Law, regulations published thereunder and the letters of approval for the investments in the Preferred Enterprises, as discussed above. Non-compliance with the conditions may cancel all or part of the benefits and require a refund of the amount of the benefits, including interest. The Company's management believes that the Company is meeting the aforementioned conditions.
Of the Company's retained earnings as of December 31, 2016, approximately $20,122 is tax-exempt earnings attributable to its Approved Enterprise programs and $15,724 is tax-exempt earnings attributable to its Beneficiary Enterprise program. The tax-exempt income attributable to the Approved and Beneficiary Enterprises cannot be distributed to shareholders without subjecting the Company to taxes. If dividends are distributed out of tax-exempt profits, the Company will then become liable for tax at the rate applicable to its profits from the Approved Enterprise in the year in which the income was earned, as if it was not under the "Alternative benefits track" (taxed at the rate of no more than 25% as of December 31, 2016). Under the Encouragement Law, tax-exempt income generated under the Beneficiary Enterprise status or the Approved Enterprise status will be taxed, among other things, upon a dividend distribution or complete liquidation in accordance with the Encouragement Law. The Company's policy is not to distribute such dividends from tax-exempt income derived from Approved/Beneficiary Enterprises.
As of December 31, 2016, if the income attributed to the Approved Enterprise would have been distributed as a dividend, the Company would have incurred a tax liability of approximately $5,030. If income attributed to the Beneficiary Enterprise would have been distributed as a dividend, including upon liquidation, the Company would have incurred a tax liability of approximately $3,931. These amounts would be recorded as an income tax expense in the period in which the Company decides to declare the dividend.
F - 49
CAESARSTONE LTD. (FORMERLY CAESARSTONE SDOT-YAM LTD.)
AND ITS SUBSIDIARIES
NOTES TO THE CONSOLIDATED FINANCIAL STATEMENTS
U.S. dollars in thousands (except share data)
| NOTE 11:- |
TAXES ON INCOME (Cont.)
|
| b. |
Non-Israeli subsidiaries taxation:
|
Non-Israeli subsidiaries are taxed based on tax laws in their countries of residence.
Statutory tax rates for Non-Israeli subsidiaries are as follows:
Company incorporated in United States - 40% tax rate.
Company incorporated in Australia - 30% tax rate.
Company incorporated in Singapore - 17% tax rate.
Company incorporated in Canada – 26.6% tax rate.
Company incorporated in United Kingdom – 20% tax rate.
Israeli income taxes and foreign withholding taxes were not provided for undistributed earnings of the Company's foreign subsidiaries (excluding the Company's subsidiary in Canada). The Company intends to reinvest these earnings indefinitely in the foreign subsidiaries. Accordingly, no deferred income taxes have been provided. If these earnings were distributed to Israel in the form of dividends or otherwise, the Company would be subject to additional Israeli income taxes (subject to an adjustment for foreign tax credits) and foreign withholding taxes.
| c. |
Deferred income taxes:
|
Deferred income taxes reflect the net tax effects of temporary differences between the carrying amounts of assets and liabilities for financial reporting purposes and the amounts used for income tax purposes. Significant components of the Company's deferred tax assets and liabilities are as follows:
|
December 31,
|
||||||||
|
2016
|
2015
|
|||||||
|
Deferred tax assets (liability):
|
||||||||
|
Intangible assets
|
$
|
474
|
$
|
502
|
||||
|
Other temporary differences (1)
|
6,644
|
4,449
|
||||||
|
Temporary differences related to inventory (2)
|
6,917
|
3,544
|
||||||
|
Phantom award
|
10
|
21
|
||||||
|
Carryforward losses, deductions and credits
|
-
|
4,515
|
||||||
|
Less-valuation allowance
|
(390
|
)
|
(310
|
)
|
||||
|
Total net deferred tax assets
|
13,655
|
12,721
|
||||||
|
Deferred tax liabilities
|
||||||||
|
Property and equipment
|
(14,654
|
)
|
(13,734
|
)
|
||||
|
Intangible assets
|
(1,949
|
)
|
(2,877
|
)
|
||||
|
Other temporary differences
|
(120
|
)
|
(141
|
)
|
||||
|
Total deferred tax liabilities
|
(16,723
|
)
|
(16,752
|
)
|
||||
|
Deferred tax liability, net
|
$
|
(3,068
|
)
|
$
|
(4,031
|
)
|
||
| (1) |
Deriving mainly from provision for bad debts, labor related and warranty provision. The increase mainly related to provision for loss contingencies and settlement with the Israeli tax authorities.
|
| (2) |
Deriving mainly from the provision for slow moving inventory and IRS section 263(a).
|
F - 50
CAESARSTONE LTD. (FORMERLY CAESARSTONE SDOT-YAM LTD.)
AND ITS SUBSIDIARIES
NOTES TO THE CONSOLIDATED FINANCIAL STATEMENTS
U.S. dollars in thousands (except share data)
| NOTE 11:- |
TAXES ON INCOME (Cont.)
|
| c. |
Deferred income taxes (Cont.):
|
In assessing the realizability of deferred tax assets, management considers whether it is more likely than not that some portion or all of the deferred tax assets will not be realized. The ultimate realization of deferred tax assets is dependent upon the generation of future taxable income during the periods in which those temporary differences become deductible. Management considers the schedule of reversal of deferred tax liabilities, projected future taxable income and tax planning strategies in making this assessment.
| d. |
A reconciliation of the Company's effective tax rate to the statutory tax rate in Israel is as follows:
|
|
Year ended
December 31,
|
||||||||||||
|
2016
|
2015
|
2014
|
||||||||||
|
Income before taxes on income
|
$
|
89,486
|
$
|
93,301
|
$
|
93,997
|
||||||
|
Statutory tax rate in Israel
|
25
|
%
|
26.5
|
%
|
26.5
|
%
|
||||||
|
Income taxes at statutory rate
|
$
|
22,372
|
$
|
24,725
|
$
|
24,909
|
||||||
|
Increase (decrease) in tax expenses resulting from:
|
||||||||||||
|
Tax benefit arising from reduced rate as an "Preferred Enterprise"
|
(11,904
|
)
|
(13,232
|
)
|
(12,482
|
)
|
||||||
|
Non-deductible expenses, net
|
1,560
|
1,073
|
856
|
|||||||||
|
Increase (decrease) in taxes from prior years
|
44
|
(513
|
)
|
(629
|
)
|
|||||||
|
Increase (decrease)in taxes resulting from tax settlement with tax authorities
|
(151
|
)
|
-
|
343
|
||||||||
|
Tax adjustment in respect of foreign subsidiaries' different tax rates
|
1,320
|
693
|
634
|
|||||||||
|
Uncertain tax position
|
(158
|
)
|
1,034
|
146
|
||||||||
|
Changes in valuation allowance
|
52
|
(21
|
)
|
(66
|
)
|
|||||||
|
Others
|
(132
|
)
|
84
|
27
|
||||||||
|
Income tax expense
|
$
|
13,003
|
$
|
13,843
|
$
|
13,738
|
||||||
|
Effective tax rate
|
15
|
%
|
15
|
%
|
15
|
%
|
||||||
|
Per share amounts (basic) of the tax benefit resulting from an "Preferred Enterprise"
|
$
|
(0.34
|
)
|
$
|
(0.38
|
)
|
$
|
(0.36
|
)
|
|||
|
Per share amounts (diluted) of the tax benefit resulting from an "Preferred Enterprise"
|
$
|
(0.34
|
)
|
$
|
(0.37
|
)
|
$
|
(0.35
|
)
|
|||
F - 51
CAESARSTONE LTD. (FORMERLY CAESARSTONE SDOT-YAM LTD.)
AND ITS SUBSIDIARIES
NOTES TO THE CONSOLIDATED FINANCIAL STATEMENTS
U.S. dollars in thousands (except share data)
| NOTE 11:- |
TAXES ON INCOME (Cont.)
|
| e. |
Income before taxes on income is comprised as follows:
|
|
Year ended
December 31,
|
||||||||||||
|
2016
|
2015
|
2014
|
||||||||||
|
Domestic
|
$
|
75,729
|
$
|
81,020
|
$
|
82,670
|
||||||
|
Foreign
|
13,757
|
12,281
|
11,327
|
|||||||||
|
$
|
89,486
|
$
|
93,301
|
$
|
93,997
|
|||||||
| f. |
Tax expenses on income are comprised as follows:
|
|
Year ended
December 31,
|
||||||||||||
|
2016
|
2015
|
2014
|
||||||||||
|
Current taxes
|
$
|
13,966
|
$
|
6,792
|
$
|
16,318
|
||||||
|
Deferred taxes
|
(963
|
)
|
7,051
|
(2,580
|
)
|
|||||||
|
$
|
13,003
|
$
|
13,843
|
$
|
13,738
|
|||||||
|
Domestic
|
$
|
8,319
|
$
|
9,892
|
$
|
9,646
|
||||||
|
Foreign
|
4,684
|
3,951
|
4,092
|
|||||||||
|
$
|
13,003
|
$
|
13,843
|
$
|
13,738
|
|||||||
| g. |
Tax assessments:
|
The Company operates in multiple jurisdictions throughout the world, and its tax returns are periodically audited or subject to review by both domestic and foreign authorities. The associated tax filings remain subject to examination by applicable tax authorities for a certain length of time following the tax year to which those filings relate. The following describes the open tax years, by major tax jurisdiction, as of December 31, 2016:
Israel 2015-present
Australia 2012-present
Canada 2010-present
United States 2014-present
Singapore 2011-present
England 2016-present
F - 52
CAESARSTONE LTD. (FORMERLY CAESARSTONE SDOT-YAM LTD.)
AND ITS SUBSIDIARIES
NOTES TO THE CONSOLIDATED FINANCIAL STATEMENTS
U.S. dollars in thousands (except share data)
| NOTE 11:- |
TAXES ON INCOME (Cont.)
|
| h. |
Uncertain tax positions:
|
The balances at December 31, 2016 and 2015 include a liability for unrecognized tax benefits of $1,284 and $1,442, respectively, for tax positions which are uncertain of being sustained.
The Company had approximately $0 and $37 accrued for interest payments as of December 31, 2016 and 2015, respectively.
A reconciliation of the beginning and ending balances of unrecognized tax benefits is as follows:
|
Gross tax liabilities at January 1, 2014
|
$
|
1,395
|
||
|
Increase in tax positions for current year
|
146
|
|||
|
Increase (decrease) of tax position of prior years
|
(1,076
|
)
|
||
|
Foreign currency adjustments
|
(48
|
)
|
||
|
Gross tax liabilities at December 31, 2014
|
417
|
|||
|
Increase in tax positions for current year
|
493
|
|||
|
Increase in tax position of prior years
|
541
|
|||
|
Foreign currency adjustments
|
(9
|
)
|
||
|
Gross tax liabilities at December 31, 2015
|
1,442
|
|||
|
Increase in tax positions for current year
|
594
|
|||
|
Increase of tax position of prior years
|
270
|
|||
|
Decrease related to settlement with the tax authorities
|
(1,022
|
)
|
||
|
Gross tax liabilities at December 31, 2016
|
$
|
1,284
|
||
The Company believe that an adequate provision has been made for any adjustments that may result from tax examinations. However, the outcome of tax audits cannot be predicted with certainty. If any issues addressed in the Company's tax audits are resolved in a manner not consistent with management's expectations, The Company could be required to adjust the provision for income taxes in the period such resolution occurs. The Company does not expect uncertain tax positions to change significantly over the next 12 months, except in the case of settlements with tax authorities, the likelihood and timing of which is difficult to estimate.
F - 53
CAESARSTONE LTD. (FORMERLY CAESARSTONE SDOT-YAM LTD.)
AND ITS SUBSIDIARIES
NOTES TO THE CONSOLIDATED FINANCIAL STATEMENTS
U.S. dollars in thousands (except share data)
| NOTE 12:- |
SHAREHOLDERS' EQUITY
|
| a. |
The Company's share capital consisted of the following as of December 31, 2016 and 2015:
|
|
Authorized
|
Outstanding
|
|||||||||||||||
|
December 31,
|
December 31,
|
|||||||||||||||
|
2016
|
2015
|
2016
|
2015
|
|||||||||||||
|
Shares of NIS 0.04 par value:
|
||||||||||||||||
|
Ordinary shares
|
200,000,000
|
200,000,000
|
34,321,573
|
35,294,755
|
||||||||||||
| b. |
Ordinary shares-ordinary shares confer on their holders voting rights and the right to receive dividends.
|
| c. |
Dividends:
|
The Company paid dividends in the amount of $20,025 in 2014, out of non-tax exempt profit under the Approved Enterprise or beneficiary enterprise.
| d. |
Repurchase of shares:
|
On February 9, 2016 the Company's Board of Directors approved a share repurchase plan authorizing the repurchase of up to $40,000 of the Company's outstanding ordinary shares which was complete on August 3, 2016.
Following the authorization the Company repurchased 1,103,096 ordinary shares at an average price of $35.74 per share (excluding broker and transaction fees). The Company recorded shares repurchased at cost as part of its equity statement.
| e. |
Compensation plan:
|
On January 1, 2011, the Board of Directors adopted the Caesarstone Ltd 2011 Incentive Compensation Plan pursuant to which non-employee directors, officers, employees and consultants
may receive stock options and RSUs exercisable for ordinary shares, if certain conditions are met.
In December 2015, Company's Board of Directors approved an amendment to the 2011 Incentive Compensation Plan increasing the number of ordinary shares that may be granted under such plan by 900,000 shares.
As of December 31, 2016, there were 882,204 options and restricted stock units (RSUs) outstanding under the plan and 1,333,377 shares available or reserved for future issuance under the plan.
As of December 31, 2016, there was $4,165 of total unrecognized compensation cost related to non-vested share-based compensation arrangements granted to employees under the Company's stock option plan. That cost is expected to be recognized over a weighted-average period of 1.24 years.
F - 54
CAESARSTONE LTD. (FORMERLY CAESARSTONE SDOT-YAM LTD.)
AND ITS SUBSIDIARIES
NOTES TO THE CONSOLIDATED FINANCIAL STATEMENTS
U.S. dollars in thousands (except share data)
| NOTE 12:- |
SHAREHOLDERS' EQUITY (Cont.)
|
| e. |
Compensation plan (Cont.):
|
The following is a summary of activities relating to the Company's stock options granted to employees under the Company's plan during the year ended December 31, 2016:
|
Number
of
options
|
Weighted
average
exercise
price
|
Aggregate
intrinsic
value
|
||||||||||
|
Outstanding - beginning of the year
|
985,485
|
$
|
32.28
|
|||||||||
|
Granted
|
38,000
|
36.08
|
||||||||||
|
Exercised
|
(178,771
|
)
|
9.85
|
|||||||||
|
Forfeited
|
(18,010
|
)
|
34.60
|
|||||||||
|
Outstanding - end of the year
|
826,704
|
$
|
37.26
|
$
|
330
|
|||||||
|
Options exercisable at the end of the year
|
202,704
|
$
|
38.32
|
$
|
330
|
|||||||
|
Vested and expected to vest
|
826,704
|
$
|
37.26
|
$
|
330
|
|||||||
The weighted average fair value of options granted during 2016 was $13.18 per option. The intrinsic value of options exercised during 2016 was $1,761.
The intrinsic value of exercisable options (the difference between the Company's closing share price on the last trading day in fiscal 2016 and the average exercise price of in-the-money options, multiplied by the number of in-the-money options) included above represents the amount that would have been received by the option holders had all option holders exercised their options on December 31, 2016. This amount changes based on the fair market value of the Company's ordinary shares.
The following is a summary of activities relating to the Company's RSUs granted to employees under the Company's plan during the year ended December 31, 2016:
|
Number
of
RSUs
|
Weighted
average
fair value
|
Aggregate
intrinsic
value
|
||||||||||
|
Outstanding - beginning of the year
|
55,100
|
$
|
35.04
|
|||||||||
|
Granted
|
3,200
|
36.7
|
||||||||||
|
Exercised
|
-
|
-
|
||||||||||
|
Forfeited
|
(2,800
|
)
|
34.60
|
|||||||||
|
Outstanding - end of the year
|
55,500
|
$
|
35.16
|
$
|
1,590
|
|||||||
|
RSUs exercisable at the end of the year
|
-
|
$
|
-
|
$
|
-
|
|||||||
|
Vested and expected to vest
|
55,500
|
$
|
35.16
|
$
|
1,590
|
|||||||
F - 55
CAESARSTONE LTD. (FORMERLY CAESARSTONE SDOT-YAM LTD.)
AND ITS SUBSIDIARIES
NOTES TO THE CONSOLIDATED FINANCIAL STATEMENTS
U.S. dollars in thousands (except share data)
| NOTE 12:- |
SHAREHOLDERS' EQUITY (Cont.)
|
| e. |
Compensation plan (Cont.):
|
The awards outstanding as of December 31, 2016 have been separated into ranges of exercise price, as follows:
|
Awards outstanding
|
Awards exercisable
|
|||||||||||||||||||||||||
|
Exercise price
|
Number
of
options
|
Weighted
average
remaining
contractual
life (years)
|
Weighted
average
exercise
price
per share
|
Number
of
options
|
Weighted
average
remaining
contractual
life (years)
|
Weighted
average
exercise
price
|
||||||||||||||||||||
|
$
|
0.01 (RSUs | ) |
55,500
|
5.85
|
$
|
0.01
|
-
|
-
|
-
|
|||||||||||||||||
|
$
|
9.85
|
2,704
|
2.22
|
$
|
9.85
|
2,704
|
2.22
|
9.85
|
||||||||||||||||||
|
$
|
14.69
|
20,000
|
2.85
|
$
|
14.69
|
20,000
|
2.85
|
14.69
|
||||||||||||||||||
|
$
|
31.68-36.71
|
424,000
|
5.86
|
$
|
34.73
|
-
|
-
|
-
|
||||||||||||||||||
|
$
|
41.37-42.96
|
380,000
|
5.72
|
$
|
41.45
|
180,000
|
3.15
|
41.37
|
||||||||||||||||||
|
882,204
|
202,704
|
|||||||||||||||||||||||||
Compensation expenses related to options and RSUs granted were recorded in the consolidated statements of operations, as follows:
|
December 31,
|
||||||||
|
2016
|
2015
|
|||||||
|
Cost of revenues
|
$
|
452
|
$
|
121
|
||||
|
Research
and development expenses
|
183
|
96
|
||||||
|
Selling and marketing expenses
|
727
|
259
|
||||||
|
General and administrative expenses
|
2,144
|
2,131
|
||||||
|
Total
|
$
|
3,506
|
$
|
2,607
|
||||
F - 56
CAESARSTONE LTD. (FORMERLY CAESARSTONE SDOT-YAM LTD.)
AND ITS SUBSIDIARIES
NOTES TO THE CONSOLIDATED FINANCIAL STATEMENTS
U.S. dollars in thousands (except share data)
| NOTE 13:- |
TRANSACTIONS WITH RELATED PARTIES AND OTHER LOAN
|
The Company's controlling shareholder, Kibbutz Sdot-Yam ("the Kibbutz"), established Caesarstone in 1987 and has an ownership interest in the Company of approximately 30.4%, as of December 31, 2016.
On September 5, 2016, Kibbutz Sdot-Yam entered into a term sheet with Tene Investment in Projects 2016 Limited P
artnership (“Tene”)
, pursuant to which the parties agreed to vote at general meetings of the shareholders of the Company in the same manner, following discussions intended to reach an agreement on any matters proposed to be voted upon, with Tene determining the manner in which both parties shall vote if no agreement is reached, except with respect to certain carved-out matters, with respect to which, Mifalei Sdot-Yam will determine the manner in which both parties shall vote if no agreement is reached. The term sheet provides for the sale of 1,000,000 ordinary shares by Kibbutz Sdot-Yam to Tene as well as a call option conferring upon Tene for a period of five years the right to purchase from Mifalei Sdot-Yam up to 2,000,000 ordinary shares.
As a result, together with the Kibbutz, Tene beneficially owns 11,440,000 ordinary shares.
The Company is party to a series of agreements with the Kibbutz that govern different aspects of the Company's relationship and are described below.
| a. |
Manpower Agreement with Kibbutz:
|
On July 2011, the Company entered into a manpower agreement with Kibbutz Sdot-Yam for a term of 10 years that will be automatically renewed, unless one of the parties gives six months' prior notice, for additional one-year periods.
On July 30, 2015, following the approval of Company's audit committee, compensation committee and board of directors, Company's shareholders approved an addendum to the Manpower Agreement by and between Kibbutz Sdot-Yam and the Company, with respect to the engagement of office holders affiliated with Kibbutz Sdot-Yam, for an additional three-year term as of the date of the shareholders' approval.
Under the manpower agreement and its addendum, Kibbutz Sdot-Yam will provide the Company with labor services staffed by Kibbutz members, candidates for Kibbutz membership and Kibbutz residents ("Kibbutz Appointees"). The consideration to be paid for each Kibbutz Appointee will be based on the Company's total cost of employment for a non-Kibbutz Appointee employee performing a similar role. The number of Kibbutz Appointees may change in accordance with the Company's needs. Under the manpower agreement, the Company will notify Kibbutz Sdot-Yam of any roles that require staffing, and if the Kibbutz offers candidates with skills similar to other candidates, the Company will give preference to hiring of the relevant Kibbutz members. Kibbutz Sdot-Yam is entitled under this agreement, at its sole discretion, to discontinue the engagement of any Kibbutz Appointee of manpower services through his or her employment by Kibbutz Sdot-Yam and require such appointee to become employed directly by the Company.
F - 57
CAESARSTONE LTD. (FORMERLY CAESARSTONE SDOT-YAM LTD.)
AND ITS SUBSIDIARIES
NOTES TO THE CONSOLIDATED FINANCIAL STATEMENTS
U.S. dollars in thousands (except share data)
| NOTE 13:- |
TRANSACTIONS WITH RELATED PARTIES AND OTHER LOAN (Cont.)
|
Manpower Agreement with Kibbutz (Cont.):
The Company will contribute monetarily to assist with the implementation of a professional reserve plan to encourage young Kibbutz members to obtain the necessary education for future employment with the Company. The Company will provide up to NIS 250,000 ($64) per annum for this plan linked to changes in the Israeli consumer price index plus VAT. The Company will also implement a policy that prioritizes the hiring of such young Kibbutz members as the Company's employees upon their graduation. The manpower agreement and addendum also includes Kibbutz Sdot-Yam's obligation to customary liability, insurance, indemnification and confidentiality and intellectual property provisions. Office holders who are Kibbutz Appointees shall have all benefits applicable to Company's other office holders, including without limitation, directors' and officers' liability insurance, and Company's indemnification and exemption undertaking.
Manpower service net fees paid were $3,145, $3,425 and $3,939 for the years ended December 31, 2016, 2015 and 2014, respectively.
| b. |
Services from the Kibbutz:
|
On July 20, 2011 the Company signed a service agreement with the Kibbutz that was further amended on February 13, 2012 (the "original services agreement"). Pursuant to the agreement, the Kibbutz provided various services related to Company's operational needs. The original services agreement also outlined the distribution mechanism between the Company and Kibbutz Sdot-Yam, for certain expenses and payments due to local authorities, such as taxes and fees in connection with Company's business facilities. The agreement expired on March 21, 2015.
On July 30, 2015, following the approval of the audit committee and the board, Company's shareholders approved an amended services agreement (the "amended services agreement"). Under the amended services agreement, Kibbutz Sdot-Yam will continue to provide various services it provides in the ordinary course of Company's business, for a period of three years commencing as of the date of approval by the shareholders. The amended services agreement grants Kibbutz Sdot-Yam a right of first refusal with respect to such services following a review procedure that the Company is entitled to conduct once a year. Under this review procedure, the Company may seek independent third-party proposals through a competitive bidding process, in order to verify that the Kibbutz's services are provided at market terms. The amount that the Company pays to Kibbutz Sdot-Yam under the amended services agreement depends on the scope of services the Company will receive and is based on rates specified in such agreement which were determined based on market terms, taking into account the added value of consuming services from Kibbutz Sdot-Yam, considering its physical proximity to Company's manufacturing plant in Sdot-Yam and its expertise.
F - 58
CAESARSTONE LTD. (FORMERLY CAESARSTONE SDOT-YAM LTD.)
AND ITS SUBSIDIARIES
NOTES TO THE CONSOLIDATED FINANCIAL STATEMENTS
U.S. dollars in thousands (except share data)
| NOTE 13:- |
TRANSACTIONS WITH RELATED PARTIES AND OTHER LOAN (Cont.)
|
| b. |
Services from the Kibbutz (Cont.):
|
The amounts the Company pays for the services are subject to certain adjustments for increases in the Israeli consumer price index. In addition, the amended services agreement grants Kibbutz Sdot-Yam the right to adjust the rates of the metal workshop services and the meals it provides to Company's employees once a year, in the event that raw material prices related to such services significantly increase during the term of the agreement. In such case, the Company is entitled to conduct a review procedure with respect to such services, in which the Kibbutz shall have the right of first refusal to provide the services on terms identical to the best terms offered to the Company by a third party bidder. Each party may terminate such agreement upon a material breach, following a 30-day prior notice, or upon liquidation of the other party, following a 45-days' prior notice.
The Company's net service fees paid to the Kibbutz pursuant to the original and amended services agreements were $1,413 ,$1,806 and $ 2,118 for the years ended December 31, 2016, 2015 and 2014, respectively.
| c. |
Land Use Agreement with the Kibbutz:
|
The Company's principal offices and research and development facilities, as well as one of its two manufacturing facilities, are located on the grounds of the Kibbutz and include buildings spaces of approximately 30,344 square meters and unbuilt areas of approximately 60,870 square meters.
The Company signed a land use agreement with the Kibbutz, which has a term of 20 years commencing on April 1, 2012. Under the land use agreement, Kibbutz Sdot-Yam permits the Company to use approximately 100,000 square meters of land, consisting of facilities and unbuilt areas, in consideration for an annual fee of NIS 12.9 million (approximately $3,500) in 2013, (this amount does not include approximately NIS 62,000 (approximately $18) for an additional area that the Company has leased on the grounds of Kibbutz Sdot-Yam due to the Company's needs and Kibbutz Sdot-Yam's consent under the same terms as the land use agreement), plus VAT, adjusted every six months based on any increase of the Israeli consumer price index compared to the index as of January 2011.
The annual fee may be adjusted after January 1, 2021 (or after January 1, 2018 if the Kibbutz is required to pay significantly higher lease fees to the Israeli land authorities or Caesarea Development Corporation Ltd.) and every three years thereafter, if Kibbutz Sdot-Yam chooses to obtain an appraisal. The appraiser will be mutually agreed upon or, in the absence of agreement, will be chosen by Kibbutz Sdot-Yam out of the list of appraisers recommended at that time by Bank Leumi Le-Israel ("Bank Leumi").
F - 59
CAESARSTONE LTD. (FORMERLY CAESARSTONE SDOT-YAM LTD.)
AND ITS SUBSIDIARIES
NOTES TO THE CONSOLIDATED FINANCIAL STATEMENTS
U.S. dollars in thousands (except share data)
| NOTE 13:- |
TRANSACTIONS WITH RELATED PARTIES AND OTHER LOAN (Cont.)
|
| c. |
Land Use Agreement with the Kibbutz (Cont.):
|
Under the land use agreement, the Company may not terminate the operation of either of its two production lines at its plant in Kibbutz Sdot-Yam as long as the Company continues to operate production lines elsewhere in Israel, and its headquarters must remain at Kibbutz Sdot-Yam. The Company may also not decrease or return to Kibbutz Sdot-Yam any part of the land underlying the land use agreement; however, it may submit a written request to Kibbutz Sdot-Yam to return certain lands. Kibbutz Sdot-Yam will have three months to accept or reject such request, in its sole discretion, provided that if it does not respond within such three-month period, the Company will be entitled to sublease such lands to a person approved in advance by Kibbutz Sdot-Yam. In such event, the Company will continue to be liable to Kibbutz Sdot-Yam with respect to such lands.
Pursuant to the land use agreement, if the Company needs additional facilities on the land that the Company is permitted to use in Kibbutz Sdot-Yam, subject to obtaining the permits required by law, Kibbutz Sdot-Yam will build such facilities for the Company, by using the proceeds of a loan that the Company will make to Kibbutz Sdot-Yam, which loan shall be repaid to the Company by off-setting the monthly additional payment that the Company will pay for such new facilities and, if not fully repaid during the land use agreement term, upon termination thereof.
Starting from January 1, 2014 and until September 30, 2016 the Company used an additional office space in Kibbutz Sdot-Yam of approximately 400 square meters, for an annual payment of NIS 116,643 (approximately $30) in 2015 and 2016. Such additional land was used by the Company under the same terms as the land use agreement, and the Company returned such land to the Kibbutz in September 2016. Starting from September 2014, the Company uses an additional approximately 9,000 square meters based on its needs and Kibbutz Sdot-Yam’s consent under the same terms as the land use agreement, for an additional monthly fee of NIS 10,000 (approximately $3) which is not based on the original rates. However, the Company has the right to return these premises to Kibbutz Sdot-Yam earlier, following a 90-day prior written notice.
In addition, the Company has committed to fund the cost of construction, up to a maximum of NIS 3.3 million (approximately $800) plus VAT, required to change the access road leading to Kibbutz Sdot-Yam and its facilities, such that the entrance of the Company's facilities will be separated from the entrance into Kibbutz Sdot-Yam. In addition, the Company has committed to pay NIS 200,000 (approximately $51) plus VAT to cover the cost of paving an area of land leased from Kibbutz Sdot-Yam with such payment to be deducted in monthly installments over a four-year period beginning in 2013 from the lease payments to be made to Kibbutz Sdot-Yam under the land use agreement related to the Company's Sdot-Yam facility.
F - 60
CAESARSTONE LTD. (FORMERLY CAESARSTONE SDOT-YAM LTD.)
AND ITS SUBSIDIARIES
NOTES TO THE CONSOLIDATED FINANCIAL STATEMENTS
U.S. dollars in thousands (except share data)
| NOTE 13:- |
TRANSACTIONS WITH RELATED PARTIES AND OTHER LOAN (Cont.)
|
| c. |
Land Use Agreement with the Kibbutz (Cont.):
|
Pursuant to agreement for arranging for additional accord between the Company and Kibbutz Sdot-Yam dated July 20, 2011, if the Company wishes to acquire or lease any additional lands, whether on the grounds of the Company's Bar-Lev manufacturing facility, or elsewhere in Israel, for the purpose of establishing new plants or production lines: (i) Kibbutz Sdot-Yam will purchase the land and build the required facilities' structure on such land at its own expense in accordance with the Company's needs; (ii) the Company will perform any necessary building adjustments at the Company's expense; and (iii) Kibbutz Sdot-Yam will lease the land and the facility to the Company under a long-term lease agreement with terms to be negotiated in accordance with the then prevailing market price. In addition, under this agreement, Kibbutz Sdot-Yam has agreed not to compete with the Company as long as it holds more than 10% of the Company's shares. This agreement terminates on October 20, 2017.
Pursuant to the above agreement, the Company has entered into an agreement with Kibbutz Sdot-Yam dated August 6, 2013, under which Kibbutz Sdot-Yam acquired additional land of approximately 12,800 square meters on the grounds near the Company's Bar-Lev facility, which the Company required in connection with the construction of the fifth production line at the Company's Bar-Lev manufacturing facility, leased it to the Company for a monthly fee of approximately NIS 65,000 (approximately $17).
Under the agreement, Kibbutz Sdot-Yam committed to (i) acquire the long-term leasing rights of the Additional Bar-Lev Land from the ILA, (ii) perform preparation work and construction, in conjunction with the administrative body of Bar-Lev industrial park and other contractors according to Company's plans, (iii) build a warehouse according Company's plans, and (iv) obtain all permits and approvals required for performing the preparation work of the Additional Bar-Lev Land and for the building of the warehouse. The warehouse in Bar-Lev will be situated both on the current and new land. The finance of the building of the warehouse will be made through a loan that will be granted by the Company to Kibbutz Sdot-Yam, in the amount of the total cost related to the building of the warehouse and such loan, including principle and interest, shall be repaid by setoff of the lease due to Kibbutz Sdot Yam by the Company for its use of the warehouse. The principle amount of such loan will bear an interest at a rate of 5.3% a year. On November 30, 2015 the land preparation work had been completed and the holding of the Additional Bar-Lev Land was delivered to the Company. As of December 31, 2016, the construction of the warehouse has not started yet.
Pursuant to an agreement dated January 4, 2012, for the settlement of reimbursement for building expenses incurred by the Company from January 2012, NIS 82,900 (approximately $24) and NIS 43,000 (approximately $12) will not be included in the land use fees until the year 2020 and was not included for the years until 2015, respectively.
The Company's payments pursuant to the land use agreement totaled $3,325, $3,564 and $3,847 for the years ended December 31, 2016, 2015 and 2014, respectively
F - 61
CAESARSTONE LTD. (FORMERLY CAESARSTONE SDOT-YAM LTD.)
AND ITS SUBSIDIARIES
NOTES TO THE CONSOLIDATED FINANCIAL STATEMENTS
U.S. dollars in thousands (except share data)
| NOTE 13:- |
TRANSACTIONS WITH RELATED PARTIES AND OTHER LOAN (Cont.)
|
| d. |
Land Purchase Agreement and Leaseback:
|
Pursuant to a land purchase and leaseback agreement, dated as of March 31, 2011, as amended on February 13, 2012, between the Company and Kibbutz Sdot-Yam, the Company completed the selling of the rights in the lands and facilities of the Bar-Lev Industrial Center (the "Bar-Lev Grounds") to Kibbutz Sdot-Yam in consideration for NIS 43.7 million (approximately $10,900). The land purchase agreement was executed simultaneously with the execution of a land use agreement. Pursuant to the land use agreement, Kibbutz Sdot-Yam will permit the Company to use the Bar-Lev Grounds for a period of 10 years commencing on September 2012 that will be automatically renewed, unless the Company gives two years prior notice, for a ten-year term in consideration for an annual fee of NIS 4.1 million (approximately $1,100) to be linked to increases in the Israeli consumer price index. The fee is subject to adjustment following January 1, 2021 and every three years thereafter at the option of Kibbutz Sdot-Yam if Kibbutz Sdot-Yam chooses to obtain an appraisal that supports such an increase. The appraiser would be mutually agreed upon or, in the absence of agreement, will be chosen by Kibbutz Sdot-Yam from a list of assessors recommended at that time by Bank Leumi.
The Company's equipment that resides within the premises is considered integral equipment (as defined in ASC 360-20-15-4) due to the significant costs involved in relocating such equipment. Since the Company did not sell this equipment to Kibbutz Sdot-Yam as part of the transaction, the transaction is considered a partial sale and leaseback of real estate. As a result, the transaction does not qualify for "sale lease-back" accounting (as it is a failed sale from an accounting perspective) and the Company recorded the entire amount received as consideration as a liability while the land and building will remain on its books until the end of the lease term under the provisions of ASC 840-40. If amounts to be paid under the arrangement were to be accreted as a liability based on the Company's incremental borrowing rate, the resulting liability would not cover the anticipated depreciated cost of the building and land at the end of the lease (thereby creating a built-in loss).
The entire amount that was paid was accreted to the full anticipated book value of the land and building at the end of the lease term using a higher effective interest rate that will equalize the amounts paid to the full anticipated book value of the land and building at the end of the lease. As of December 31, 2016, the Company's liability as a result of this transaction is in the amount of $9,260.
F - 62
CAESARSTONE LTD. (FORMERLY CAESARSTONE SDOT-YAM LTD.)
AND ITS SUBSIDIARIES
NOTES TO THE CONSOLIDATED FINANCIAL STATEMENTS
U.S. dollars in thousands (except share data)
| NOTE 13:- |
TRANSACTIONS WITH RELATED PARTIES AND OTHER LOAN (Cont.)
|
| d. |
Land Purchase Agreement and Leaseback (Cont.):
|
The financing leaseback from related party
mature as follows, as of December 31, 2016:
|
2017
|
$
|
563
|
||
|
2018
|
597
|
|||
|
2019
|
634
|
|||
|
2020
|
672
|
|||
|
2021
|
713
|
|||
|
2022 and thereafter
|
6,081
|
|||
|
$
|
9,260
|
The balance at December 31, 2016 and 2015, includes $628 and $905 of deferred tax assets on the Company liability and a $827 and $1,065 deferred tax liability on the buildings depreciation during the next years due to temporary differences between the carrying amounts of the property and the liability for financial reporting purposes and the amounts used for income tax purposes.
The Company's payments pursuant to the land purchase agreement and leaseback totaled $1,098, $1,092 and $1,192 for the years ended December 31, 2016, 2015 and 2014, respectively.
| e. |
Bonus paid:
|
During 2016, the Company recorded a compensation expense in the amount of $266 in the statements of income. Such compensation expense relates to a bonus paid by the Kibbutz to Company's employees.
| f. | Details on transactions and balances with related parties and other loan: |
| 1. |
The Company has, from time to time, entered into transactions with its shareholders (the Kibbutz). The following table summarizes such transactions:
|
|
Year ended December 31,
|
||||||||||||
|
2016
|
2015
|
2014
|
||||||||||
|
Cost of revenues
|
$
|
6,004
|
$
|
7,638
|
$
|
9,073
|
||||||
|
Research and development
|
$
|
176
|
$
|
180
|
$
|
123
|
||||||
|
Selling and marketing
|
$
|
855
|
$
|
691
|
$
|
373
|
||||||
|
General and administrative
|
$
|
1,683
|
$
|
1,828
|
$
|
2,538
|
||||||
|
Finance expenses, net
|
$
|
569
|
$
|
597
|
$
|
685
|
||||||
F - 63
CAESARSTONE LTD. (FORMERLY CAESARSTONE SDOT-YAM LTD.)
AND ITS SUBSIDIARIES
NOTES TO THE CONSOLIDATED FINANCIAL STATEMENTS
U.S. dollars in thousands (except share data)
| NOTE 13:- |
TRANSACTIONS WITH RELATED PARTIES AND OTHER LOAN (Cont.)
|
| f. | Details on transactions and balances with related parties and other loan (Cont.): |
| 2. |
Balances with related party and other loan:
|
|
December 31,
|
||||||||
|
2016
|
2015
|
|||||||
|
Related party and other loan (1,2)
|
$
|
3,099
|
$
|
3,251
|
||||
|
Long-term loan and financing leaseback from a related party (2)
|
$
|
8,070
|
$
|
8,472
|
||||
| (1) |
On January 17, 2011 a loan of 4 million Canadian dollars was made to Caesarstone Canada Inc. by its shareholders, CIOT and the Company, on a pro rata basis. The loan bears interest until repayment at a per annum rate equal to Bank of Canada's prime business rate plus 0.25%. The interest accrued on the loan is payable on a quarterly basis. As of December 31, 2016 the loan was classified to short term related party and other loan balance.
|
| (2) |
In September, 2012, a financing leaseback of $10.9 million related to Bar-Lev transaction was granted to the Company by Kibbutz Sdot-Yam. The financing leaseback bears interest until repayment at a per annum rate equal to 6.09% and is subject to adjustment for increases in the Israeli consumer price index.
|
F - 64
CAESARSTONE LTD. (FORMERLY CAESARSTONE SDOT-YAM LTD.)
AND ITS SUBSIDIARIES
NOTES TO THE CONSOLIDATED FINANCIAL STATEMENTS
U.S. dollars in thousands (except share data)
| NOTE 14:- |
MAJOR CUSTOMER AND GEOGRAPHIC INFORMATION
|
| a. |
The Company manages its business on the basis of one reportable segment. The data is presented in accordance with Accounting Standard Codification 280, "Segments Reporting" ("ASC 280"). The following is a summary of revenue and long-lived assets by geographic area. Revenues are attributed to geographic areas based on the location of end customers.
|
The following table presents total revenues for the years ended December 31, 2016, 2015 and 2014, respectively:
|
Year ended
December 31,
|
||||||||||||
|
2016
|
2015
|
2014
|
||||||||||
|
USA
|
$
|
222,597
|
$
|
223,341
|
$
|
185,583
|
||||||
|
Australia (including New Zealand)
|
130,910
|
110,290
|
107,539
|
|||||||||
|
Canada
|
85,740
|
70,739
|
57,898
|
|||||||||
|
Israel
|
42,545
|
39,645
|
41,286
|
|||||||||
|
Europe
|
25,606
|
23,949
|
23,109
|
|||||||||
|
Rest of World
|
31,145
|
31,551
|
31,987
|
|||||||||
|
$
|
538,543
|
$
|
499,515
|
$
|
447,402
|
|||||||
| b. |
The following table presents total long-lived assets as of December 31, 2016 and 2015:
|
|
December 31,
|
||||||||
|
2016
|
2015
|
|||||||
|
Israel
|
$
|
90,924
|
$
|
88,658
|
||||
|
Australia
|
1,971
|
1,657
|
||||||
|
USA
|
128,099
|
133,481
|
||||||
|
Canada
|
1,660
|
1,548
|
||||||
|
Rest of World
|
164
|
94
|
||||||
|
$
|
222,818
|
$
|
225,438
|
|||||
F - 65
CAESARSTONE LTD. (FORMERLY CAESARSTONE SDOT-YAM LTD.)
AND ITS SUBSIDIARIES
NOTES TO THE CONSOLIDATED FINANCIAL STATEMENTS
U.S. dollars in thousands (except share data)
| NOTE 15:- |
SELECTED SUPPLEMENTARY STATEMENTS OF INCOME DATA
|
| a. |
Finance expense, net:
|
|
Year ended
December 31,
|
||||||||||||
|
2016
|
2015
|
2014
|
||||||||||
|
Finance expenses:
|
||||||||||||
|
Interest in respect of short-term loans and bank fees
|
3,285
|
2,792
|
3,038
|
|||||||||
|
Interest in respect of loans to related parties
|
610
|
640
|
732
|
|||||||||
|
Changes in derivatives fair value
|
-
|
-
|
2,710
|
|||||||||
|
Foreign exchange transactions losses
|
970
|
2,972
|
-
|
|||||||||
|
4,865
|
6,404
|
6,480
|
||||||||||
|
Finance income:
|
||||||||||||
|
Changes in derivatives fair value
|
1,395
|
1,060
|
-
|
|||||||||
|
Interest in respect of cash and cash equivalent and short-term bank deposits
|
152
|
77
|
403
|
|||||||||
|
Foreign exchange transactions gains
|
-
|
2,182
|
5,032
|
|||||||||
|
1,547
|
3,319
|
5,435
|
||||||||||
|
Finance expenses, net
|
$
|
3,318
|
$
|
3,085
|
$
|
1,045
|
||||||
| b. |
Net earnings per share:
|
The following table sets forth the computation of basic and diluted net earnings per share:
Numerator
:
|
Year ended
December 31,
|
||||||||||||
|
2016
|
2015
|
2014
|
||||||||||
|
Net income attributable to controlling interest, as reported
|
$
|
74,596
|
$
|
77,766
|
$
|
78,439
|
||||||
|
Adjustment to redemption value of non-controlling interest
|
(2,248
|
)
|
-
|
-
|
||||||||
|
Numerator for basic and diluted net income per share
|
$
|
72,348
|
$
|
77,766
|
$
|
78,439
|
||||||
F - 66
CAESARSNE LTD. (FORMERLY CAESARSTONE SDOT-YAM LTD.)
AND ITS SUBSIDIARIES
NOTES TO THE CONSOLIDATED FINANCIAL STATEMENTS
U.S. dollars in thousands (except per share data)
| NOTE 15:- |
SELECTED SUPPLEMENTARY STATEMENTS OF INCOME DATA (Cont.)
|
| b. |
Net earnings per share (Cont.):
|
Denominator
:
|
Year ended
December 31,
|
||||||||||||
|
2016
|
2015
|
2014
|
||||||||||
|
Denominator for basic income per share
|
34,706
|
35,253
|
34,932
|
|||||||||
|
Effect of dilutive stock based awards
|
58
|
211
|
462
|
|||||||||
|
Denominator for diluted income per share
|
34,764
|
35,464
|
35,394
|
|||||||||
Earnings Per Share
:
|
Year ended
December 31,
|
||||||||||||
|
2016
|
2015
|
2014
|
||||||||||
|
Basic earnings per share
|
$
|
2.08
|
$
|
2.21
|
$
|
2.25
|
||||||
|
Diluted earnings per share
|
$
|
2.08
|
$
|
2.19
|
$
|
2.22
|
||||||
F - 67

|
The Rialto, Level 30
525 Collins St
Melbourne Victoria 3000
Correspondence to:
GPO Box 4736
Melbourne Victoria 3001
T +61 3 8320 2222
F +61 3 8320 2200
E info.vic@au.gt.com
W www.GrantThornton.com.au
|
We have audited the internal control over financial reporting of Caesarstone Australia Pty Ltd (the “Company”) as of December 31, 2016, based on criteria established in the 2013
Internal Control—Integrated Framework
issued by the Committee of Sponsoring Organizations of the Treadway Commission (COSO). The Company’s management is responsible for maintaining effective internal control over financial reporting and for its assessment of the effectiveness of internal control over financial reporting, included in the accompanying Management’s Report on Internal Control over Financial Reporting. Our responsibility is to express an opinion on the Company’s internal control over financial reporting based on our audit.
We conducted our audit in accordance with the standards of the Public Company Accounting Oversight Board (United States). Those standards require that we plan and perform the audit to obtain reasonable assurance about whether effective internal control over financial reporting was maintained in all material respects. Our audit included obtaining an understanding of internal control over financial reporting, assessing the risk that a material weakness exists, testing and evaluating the design and operating effectiveness of internal control based on the assessed risk, and performing such other procedures as we considered necessary in the circumstances. We believe that our audit provides a reasonable basis for our opinion.
A company’s internal control over financial reporting is a process designed to provide reasonable assurance regarding the reliability of financial reporting and the preparation of financial statements for external purposes in accordance with generally accepted accounting principles. A company’s internal control over financial reporting includes those policies and procedures that (1) pertain to the maintenance of records that, in reasonable detail, accurately and fairly reflect the transactions and dispositions of the assets of the company; (2) provide reasonable assurance that transactions are recorded as necessary to permit preparation of financial statements in accordance with generally accepted accounting principles, and that receipts and expenditures of the company are being made only in accordance with authorizations of management and directors of the company; and (3) provide reasonable assurance regarding prevention or timely detection of unauthorized acquisition, use, or disposition of the company’s assets that could have a material effect on the financial statements.
F - 68

Because of its inherent limitations, internal control over financial reporting may not prevent or detect misstatements. Also, projections of any evaluation of effectiveness to future periods are subject to the risk that controls may become inadequate because of changes in conditions, or that the degree of compliance with the policies or procedures may deteriorate.
In our opinion, the Company maintained, in all material respects, effective internal control over financial reporting as of December 31, 2016, based on criteria established in the 2013
Internal Control—Integrated Framework
issued by COSO.
We also have audited, in accordance with the standards of the Public Company Accounting Oversight Board (United States), the financial statements of the Company as of and for the year ended December 31, 2016, and our report dated March 13, 2017
expressed an unqualified opinion on those financial statements.
/s/GRANT THORNTON AUDIT PTY LTD
Melbourne, Victoria
March 13, 2017
F - 69
|
REPORT OF INDEPENDENT REGISTERED PUBLIC ACCOUNTING FIRM
Board of Directors and Shareholders
Caesarstone Australia Pty Ltd
|
The Rialto, Level 30
525 Collins St
Melbourne Victoria 3000
Correspondence to:
GPO Box 4736
Melbourne Victoria 3001
T +61 3 8320 2222
F +61 3 8320 2200
E info.vic@au.gt.com
W www.GrantThornton.com.au
|
We have audited the accompanying
balance sheets of Caesarstone Australia Pty Ltd (the “Company”) as of December 31, 2016 and 2015, and the related statements of income, comprehensive income, changes in shareholders’ equity, and cash flows for each of the three years in the period ended December 31, 2016 (not presented herein). These financial statements are the responsibility of the Company’s management. Our responsibility is to express an opinion on these financial statements based on our audits.
We conducted our audits in accordance with the standards of the Public Company Accounting Oversight Board (United States). Those standards require that we plan and perform the audit to obtain reasonable assurance about whether the financial statements are free of material misstatement. An audit includes examining, on a test basis, evidence supporting the amounts and disclosures in the financial statements. An audit also includes assessing the accounting principles used and significant estimates made by management, as well as evaluating the overall financial statement presentation. We believe that our audits provide a reasonable basis for our opinion.
In our opinion, the financial statements referred to above present fairly, in all material respects, the financial position of Caesarstone Australia Pty Ltd
as of December 31, 2016 and 2015, and the results of its operations and its cash flows for each of the three years in the period ended December 31, 2016 in conformity with accounting principles generally accepted in the United States of America.
We also have audited, in accordance with the standards of the Public Company Accounting Oversight Board (United States), the Company’s internal control over financial reporting as of December 31, 2016, based on criteria established in the 2013
Internal Control—Integrated Framework
issued by the Committee of Sponsoring Organizations of the Treadway Commission (COSO), and our report dated March 13, 2017 expressed an unqualified opinion thereon.
/s/GRANT THORNTON AUDIT PTY LTD
Melbourne, Victoria
March 13, 2017
Melbourne, Victoria
March 13, 2017
F - 70
TABLE OF CONTENTS
Item 17 O Item 18 OItem 4A: Unresolved Staff CommentsItem 5: Operating and Financial Review and ProspectsItem 7: Major Shareholders and Related Party Tra NsactionsItem 8: Financial Inform AtionItem 9: The O Ffer and ListingItem 10: A Dditional InformationItem 12: Description Of S Ecurities Other Than Equity SecuritiesItem 16C: Principal Accountant Fees and ServicesNote 1:- GeneralNote 2:- Significant Accounting PoliciesNote 2:- Significant Accounting Policies (cont.)Note 3:- Other Accounts Receivable and Prepaid ExpensesNote 4:- InventoriesNote 5:- Property, Plant and Equipment, NetNote 6:- Other Intangibles AssetsNote 7:- GoodwillNote 8:- Short-term Bank CreditNote 9:- Accrued Expenses and Other LiabilitiesNote 10:- Commitments and Contingent LiabilitiesNote 10:- Commitments and Contingent Liabilities (cont.)Note 11:- Taxes on IncomeNote 11:- Taxes on Income (cont.)Note 12:- Shareholders' EquityNote 12:- Shareholders' Equity (cont.)Note 13:- Transactions with Related Parties and Other LoanNote 13:- Transactions with Related Parties and Other Loan (cont.)Note 14:- Major Customer and Geographic InformationNote 15:- Selected Supplementary Statements Of Income DataNote 15:- Selected Supplementary Statements Of Income Data (cont.)