UNITED STATES
SECURITIES AND EXCHANGE COMMISSION
Washington, D.C. 20549
FORM 10-K
|
(Mark One)
|
|
|
x
|
ANNUAL REPORT PURSUANT TO SECTION 13 OR 15(d) OF THE SECURITIES EXCHANGE ACT OF 1934
|
For the fiscal year ended
December 31, 2019
OR
|
☐
|
TRANSITION REPORT PURSUANT TO SECTION 13 OR 15(d) OF THE SECURITIES EXCHANGE ACT OF 1934
|
For the transition period from _________ to _________
Commission File Number: 001-38984
CASTLE BIOSCIENCES, INC.
(Exact name of registrant as specified in its charter)
|
Delaware
|
77-0701774
|
|
|
(State or other jurisdiction of incorporation or organization)
|
(I.R.S. Employer Identification No.)
|
|
|
820 S. Friendswood Drive, Suite 201, Friendswood, Texas
|
77546
|
|
|
(Address of principal executive offices)
|
(Zip Code)
|
|
(866) 788-9007
(Registrant’s telephone number, including area code)
Securities registered pursuant to Section 12(b) of the Act:
|
Title of each class
|
Trading Symbol(s)
|
Name of each exchange on which registered
|
|
Common Stock, $0.001 par value per share
|
CSTL
|
The Nasdaq Global Market
|
Indicate by check mark if the registrant is a well-known seasoned issuer, as defined in Rule 405 of the Securities Act. Yes
¨
No
x
Indicate by check mark if the registrant is not required to file reports pursuant to Section 13 or Section 15(d) of the Act. Yes
¨
No
x
Indicate by check mark whether the registrant (1) has filed all reports required to be filed by Section 13 or 15(d) of the Securities Exchange Act of 1934 during the preceding 12 months (or for such shorter period that the registrant was required to file such reports), and (2) has been subject to such filing requirements for the past 90 days. Yes
x
No
¨
Indicate by check mark whether the registrant has submitted electronically every Interactive Data File required to be submitted pursuant to Rule 405 of Regulation S-T (§232.405 of this chapter) during the preceding 12 months (or for such shorter period that the registrant was required to submit such files). Yes
x
No
¨
Indicate by check mark whether the registrant is a large accelerated filer, an accelerated filer, a non-accelerated filer, a smaller reporting company, or an emerging growth company. See the definitions of ‘‘large accelerated filer,’’ ‘‘accelerated filer,’’ ‘‘smaller reporting company,’’ and ‘‘emerging growth company’’ in Rule 12b-2 of the Exchange Act.
|
Large accelerated filer
|
¨
|
Accelerated filer
|
¨
|
|
Non-accelerated filer
|
x
|
Smaller reporting company
|
x
|
|
Emerging growth company
|
x
|
||
If an emerging growth company, indicate by check mark if the registrant has elected not to use the extended transition period for complying with any new or revised financial accounting standards provided pursuant to Section 13(a) of the Exchange Act.
☐
Indicate by check mark whether the registrant is a shell company (as defined in Rule 12b-2 of the Exchange Act).
Yes
¨
No
x
The registrant’s common stock was not publicly traded as of the last business day of the registrant’s most recently completed second fiscal quarter.
As of
February 28, 2020
, there were
17,192,351
shares of common stock, par value $0.001 per share, issued and outstanding.
DOCUMENTS INCORPORATED BY REFERENCE
Portions of the registrant’s definitive proxy statement to be filed with the Securities and Exchange Commission, or SEC, subsequent to the date hereof pursuant to Regulation 14A in connection with the registrant’s 2020 Annual Meeting of Stockholders, are incorporated by reference into Part III of this Annual Report on Form 10-K. We intend to file such proxy statement with the SEC not later than 120 days after the conclusion of the registrant’s fiscal year ended December 31, 2019.
Table of Contents
|
Page
|
||
|
Item 1.
|
||
|
Item 1A.
|
||
|
Item 1B.
|
||
|
Item 2.
|
||
|
Item 3.
|
||
|
Item 4.
|
||
|
Item 5.
|
||
|
Item 6.
|
||
|
Item 7.
|
||
|
Item 7A.
|
||
|
Item 8.
|
||
|
Item 9.
|
||
|
Item 9A
|
||
|
Item 9B.
|
||
|
Item 10.
|
||
|
Item 11.
|
||
|
Item 12.
|
||
|
Item 13.
|
||
|
Item 14.
|
||
|
Item 15.
|
||
|
Item 16.
|
||
1
SPECIAL NOTE REGARDING FORWARD-LOOKING STATEMENTS
This Annual Report on Form 10-K contains forward-looking statements. The forward-looking statements are contained principally in the sections entitled “Risk Factors,” “Management’s Discussion and Analysis of Financial Condition and Results of Operations” and “Business.” These statements relate to future events or to our future financial performance and involve known and unknown risks, uncertainties and other factors which may cause our actual results, performance or achievements to be materially different from any future results, performance or achievements expressed or implied by the forward-looking statements. Forward-looking statements include, but are not limited to, statements about:
|
•
|
estimates of our addressable market, future revenue, expenses, capital requirements and our needs for additional financing;
|
|
•
|
expectations with respect to reimbursement for our products, including third-party payor reimbursement and coverage decisions;
|
|
•
|
anticipated cost, timing and success of our products in development, and our plans to research, develop and commercialize new tests;
|
|
•
|
our ability to obtain funding for our operations, including funding necessary to complete the expansion of our operations and development of our product candidates;
|
|
•
|
the implementation of our business model and strategic plans for our products, technologies and businesses;
|
|
•
|
our ability to manage and grow our business by expanding our sales to existing customers or introducing our products to new customers;
|
|
•
|
our ability to develop and maintain sales and marketing capabilities;
|
|
•
|
regulatory developments in the United States and foreign countries;
|
|
•
|
the performance of our third-party suppliers;
|
|
•
|
the success of competing diagnostic products that are or become available;
|
|
•
|
our ability to attract and retain key personnel;
|
|
•
|
our expectations regarding the period during which we qualify as an emerging growth company under the Jumpstart Our Business Startups Act, as amended, or the JOBS Act, enacted in April 2012; and
|
|
•
|
our expectations regarding our ability to obtain and maintain intellectual property protection for our products and our ability to operate our business without infringing on the intellectual property rights of others.
|
In some cases, you can identify these statements by terms such as “anticipate,” “believe,” “could,” “estimate,” “expects,” “intend,” “may,” “plan,” “potential,” “project,” “should,” “will,” “would” or the negative of those terms, and similar expressions that convey uncertainty of future events or outcomes. These forward-looking statements reflect our management’s beliefs and views with respect to future events and are based on estimates and assumptions as of the date of this Annual Report on Form 10-K and are subject to risks and uncertainties. In addition, statements that “we believe” and similar statements reflect our beliefs and opinions on the relevant subject. These statements are based upon information available to us as of the date of this Annual Report on Form 10-K, and while we believe such information forms a reasonable basis for such statements, such information may be limited or incomplete, and our statements should not be read to indicate that we have conducted an exhaustive inquiry into, or review of, all potentially available relevant information. These statements are inherently uncertain and investors are cautioned not to unduly rely upon these statements. We discuss many of the risks associated with the forward-looking statements in this Annual Report on Form 10-K in greater detail under the heading “Risk Factors.” Moreover, we operate in a very competitive and rapidly changing environment. New risks emerge from time to time. It is not possible for our management to predict all risks, nor can we assess the impact of all factors on our business or the extent to which any factor, or combination of factors, may cause actual results to differ materially from those contained in any forward-looking statements we may make. Given these uncertainties, you should not place undue reliance on these forward-looking statements.
2
PART I
Item 1. Business.
As used in this Annual Report on Form 10-K, unless the context indicates or otherwise requires, “Castle Biosciences,” “the Company,” “we,” “us,” and “our” refer to Castle Biosciences, Inc., a Delaware Corporation.
Overview
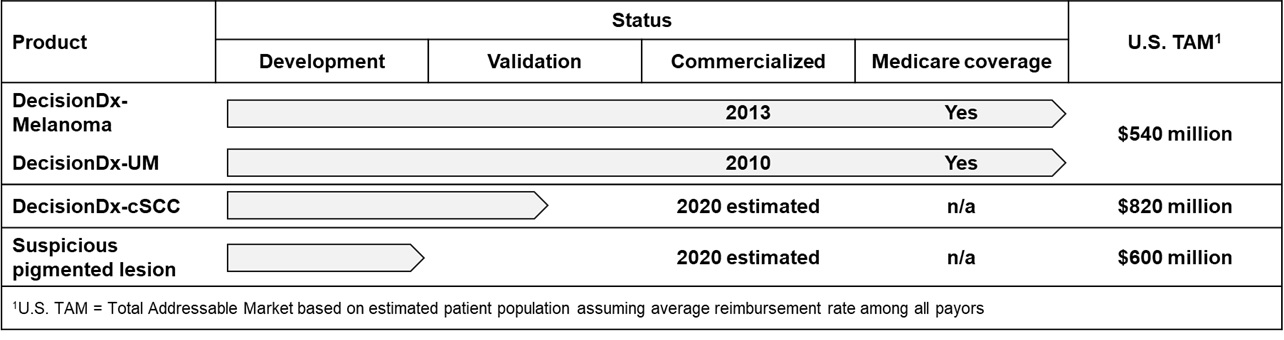
We are a commercial-stage dermatological cancer company focused on providing physicians and their patients with personalized, clinically actionable genomic information to make more accurate treatment decisions. We believe that the traditional approach to developing a treatment plan for certain cancers using clinical and pathology factors alone can be improved by incorporating personalized genomic information. Our non-invasive genomic products utilize proprietary algorithms to provide an assessment of a patient’s specific risk of metastasis or recurrence of their cancer, allowing physicians to identify patients who are likely to benefit from an escalation of care as well as those who may avoid unnecessary medical and surgical interventions. Our lead product, DecisionDx-Melanoma, is a proprietary multi-gene expression profile, or GEP, test that predicts the risk of metastasis or recurrence for patients diagnosed with invasive cutaneous melanoma, a deadly skin cancer. We also market DecisionDx-UM, which is a proprietary GEP test that predicts the risk of metastasis for patients with uveal melanoma, a rare eye cancer. Based on the substantial clinical evidence that we have developed, we have received Medicare coverage for both of our products, which represents approximately 50% of our addressable patient population. We also have two proprietary products in late-stage development that address cutaneous squamous cell carcinoma, or SCC, and suspicious pigmented lesions, which are indications with high clinical need in dermatological cancer.
Skin cancer is the most commonly diagnosed cancer in the United States. There are more than 5.5 million new cases of skin cancer diagnosed annually, compared with 1.6 million new cases for all other cancers combined. DecisionDx-Melanoma targets more than an estimated 130,000 patients diagnosed with invasive cutaneous melanoma each year, which we believe is underreported. In addition, our two late-stage proprietary products in development target approximately 200,000 patients diagnosed with SCC with high-risk features and approximately 300,000 patients with suspicious pigmented lesions without a definitive diagnosis of skin cancer. We estimate that the total addressable U.S. market for these three indications is approximately $2.0 billion.
Healthcare providers, predominately dermatologists and surgeons who treat melanoma patients, make nearly all treatment decisions for patients diagnosed with skin cancers based upon their expected risk of metastasis or recurrence. Historically these treatment decisions have been based solely on clinical and pathology factors, such as tumor depth or width, ulceration status, nerve invasion and evidence of metastasis to the sentinel lymph node, or SLN. Physicians use these factors to group, or stage, patients into stage-related populations. The average risk of metastasis within a population then guides treatment decisions for all patients within a respective population. However, an individual patient’s risk of metastasis can be significantly different from these stage-related population averages, thereby resulting in some patients receiving unnecessary medical and surgical interventions and some patients being undertreated. This treatment paradigm has led to suboptimal patient care and unnecessary costs to the healthcare system.
We believe that incorporating the genomics of each individual patient’s tumor biology to inform their specific risk of metastasis can aid the decision-making process for their treatment plan, help optimize patient outcomes and reduce healthcare costs. The genomics of cutaneous melanoma and other skin cancers are highly complex because, unlike some other types of cancer, the presence or absence of a single gene or a limited number of genes has not been shown to accurately predict the risk of metastasis or recurrence. Rather, we believe that risk of metastasis or recurrence of skin cancer requires the analysis of gene expression profiles occurring at the RNA level through the application of artificial intelligence, deep learning and proprietary techniques to identify clinically relevant genomic patterns. Once identified, we then undertake extensive clinical validation and clinical utility studies to develop products that address key unmet medical needs for patients and physicians.
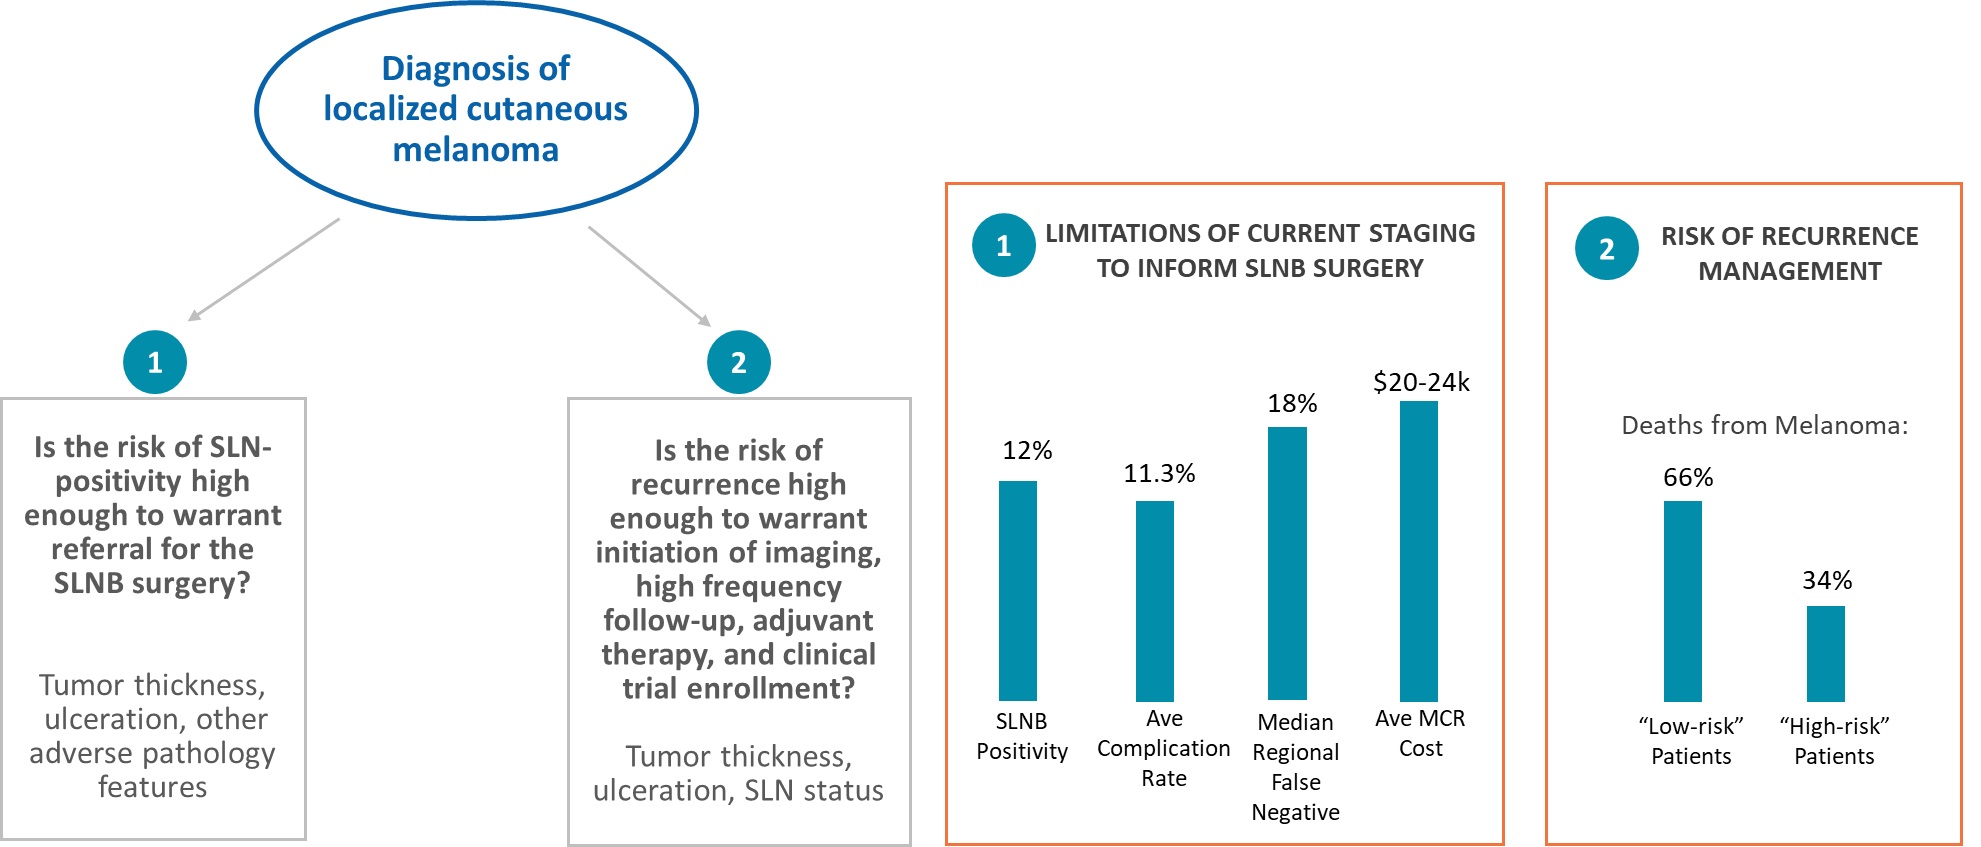
In cutaneous melanoma, nearly every treatment plan decision is based upon a patient’s risk of metastasis and the traditional clinical and pathology factors that are used to estimate population-based rates of metastasis can be inaccurate predictors of an individual patient’s risk. A primary tumor diagnostic biopsy is used to identify most of these factors, such as tumor thickness and ulceration status. These factors then assist physicians in their decision of whether to discuss or recommend a second procedure, the invasive sentinel lymph node biopsy, or SLNB, surgery which can provide additional prognostic information.
However, the clinical and pathology factors that lead to a recommendation to perform the SLNB surgery have limitations in that they are not very predictive when it comes to the likelihood that the patient will have an SLN-positive biopsy result, meaning that melanoma cells are found in their lymph nodes. In fact, approximately 88% of patients who undergo the SLNB surgery are found to have an SLN-negative biopsy result, and these patients remain either as Stage I, the lowest risk group, or as Stage II, the next lowest risk group. Furthermore, despite being classified as low risk, two out of three patients who develop metastatic disease and die from the primary melanoma tumor received an SLN-negative biopsy result and were classified as Stage I or II
3
following SLNB surgery. The significant diagnostic discordance that exists between the clinical and pathologic factors and likelihood of both an SLN-positive biopsy result and the risk of metastasis or recurrence has led to an opportunity to improve care by adding personalized genomic information.
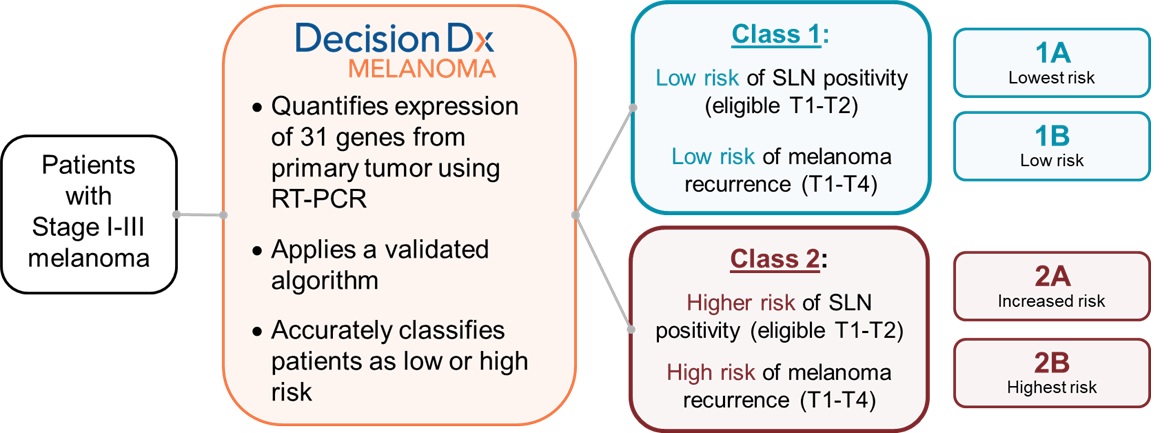
We developed our proprietary, non-invasive genomic DecisionDx-Melanoma product to address this diagnostic discordance in patients with Stage I-III cutaneous melanoma. The product interrogates the biology of a patient’s tumor by analyzing the gene expression profile of 31 genes, a process made possible by our proprietary algorithm, developed using machine learning techniques. DecisionDx-Melanoma reports the risk of metastasis or recurrence for a patient’s melanoma into two classes and two subclasses, ranging from Class 1A, the lowest risk group, through Class 2B, the highest risk group, based on the genomics of the patient’s tumor. Physicians and patients use this additional tumor-specific genomic information, along with traditional staging criteria, to make better-informed decisions about how to manage the disease.
We have published 22 peer-reviewed studies to support the two current clinically actionable uses of DecisionDx-Melanoma. The first use immediately following diagnosis is based upon a patient’s likelihood of having an SLN-negative biopsy result so that physicians and their patients can discuss the risk and benefit of undergoing the SLNB surgery. Data from our 1,421 patient prospective study showed that the 1,065 patients with a melanoma less than or equal to 2.0 mm thick, defined as T1-T2 melanoma, and who received a DecisionDx-Melanoma Class 1A test result, had only a 4.6% likelihood of an SLN-positive biopsy result. This is clinically relevant because current guidelines do not recommend offering the SLNB surgery if the likelihood of an SLN-positive biopsy result is 5% or less. Therefore, all patients with a T1-T2 melanoma and a DecisionDx-Melanoma Class 1A test result, which represented approximately 70% of all T1-T2 patients in our study, could avoid the SLNB surgery based on current guidelines. We recently reported data supporting these findings from a second, prospective multi-center study of 1,166 patients. The second use of our product is to inform the appropriate treatment plan, regardless of the decision to undergo or avoid the SLNB surgery. The aggregate data from all of our published long-term archival population showed a 99.6% negative predictive value, or NPV, for melanoma-specific survival at five years for patients who received a DecisionDx-Melanoma Class 1A test result; meaning that at the five-year mark, 99.6% of patients with a Class 1A test result did not die from their melanoma. We have also demonstrated, in all four of our clinical impact studies, that physicians changed their treatment plans approximately 50% of the time after receiving our test results, showing that DecisionDx-Melanoma can significantly change the way physicians treat their patients. For contextual purposes, note that for patients who undergo the SLNB surgery, only 12% are SLNB positive, while the remaining 88% are SLNB negative. This means that only 12% would have a change in management.
We also market DecisionDx-UM, a genomic test for use in identifying patients diagnosed with uveal melanoma who are at a low risk of metastasis. Uveal melanoma is a rare but deadly disease with approximately 1,600 patients diagnosed in the United States annually. Similar to DecisionDx-Melanoma, this product also uses a proprietary algorithm developed using machine learning techniques to interrogate the biology of a patient’s tumor by analyzing the gene expression profile of 15 genes of a patient’s tumor. Because approximately 30% of uveal melanoma patients go on to metastasize within three years, prior to the availability of DecisionDx-UM in 2010, once the primary eye tumor was treated, nearly all patients were managed under an aggressive metastatic surveillance treatment plan. We have an expansive, peer-reviewed publication dataset with 16 studies documenting the validity and utility of DecisionDx-UM. The first prospective, multi-center study reported a 98% NPV at five years for metastatic-free survival for patients who received a Class 1A test result. Based upon this and additional clinical validity data, two clinical impact studies we conducted reported that over 90% of post-diagnostic management decisions align with the DecisionDx-UM results.
We are developing additional products targeting the challenges faced by physicians in treating their patients’ skin cancer, with two products in late stage development. One of our product candidates, DecisionDx-SCC, is a proprietary GEP test designed to predict the risk of metastasis in patients diagnosed with SCC. Approximately one million patients are diagnosed with SCC in the United States each year. We estimate that approximately 200,000 of those patients are identified as having high-risk disease meaning that they have one or more high-risk features associated with their SCC. The available clinical and pathology staging or risk systems result in many patients receiving unnecessary adjuvant interventions or, for those who may benefit from adjuvant interventions, being placed in “watchful waiting” regimens. Our recently presented validation study analysis shows that significant improvements relative to available high-risk features and staging systems could be possible. Based on the timing and results of our planned and ongoing clinical validation studies, we intend to commercially launch this product in the second half of 2020.
We are also developing a proprietary GEP test designed to assist physicians in the diagnosis of suspicious pigmented lesions. Of the approximately two million pigmented lesion skin biopsies performed for the diagnosis of melanoma annually in the United States, we estimate that approximately 300,000 cannot be confidently confirmed as melanoma or benign lesion through the use of histopathology alone. Based on the timing and results of our planned and ongoing clinical studies, we intend to commercially launch this product in the second half of 2020.
4
We have built a commercial organization that focuses on providing solutions to dermatologists, including Mohs surgeons, dermatological pathologists and surgeons who care for patients with skin cancer. Our focus on dermatologic cancers has provided us with unique insights into the challenges faced by these physicians that have enabled us to drive adoption of DecisionDx-Melanoma, as well as to identify opportunities for additional products to address unmet clinical needs in dermatologic cancer. We have processed over 60,000 clinical samples since commercial launch, with total proprietary GEP report volume increasing from less than 4,000 in 2015 to more than 17,000 in 2019. Our annual revenue increased from
$22.8 million
in 2018 to
$51.9 million
in 2019. During 2019, we also expanded our commercial and medical affairs organizations from the low 20s to the low 50s in externally facing employees, including expansion of our outside sales territories from 14 in January 2019 to 23 in February 2019 to 32 in December 2019 with the additional expansion coming from our inside sales support and our medical affairs group, to further educate physicians, which we believe drives adoption of our products. We will continue to develop evidence, including performance and utility data, to substantiate the value of our marketed products, which we believe is important for physicians as they adopt our products for multiple uses. We will also continue to evaluate our mix of outside sales territories, inside sales support, marketing and medical affairs and adjust our investments based upon these evaluations.

Our Competitive Advantages
We are focused on providing actionable genomic information to physicians and their patients. We believe our key competitive advantages are due in part to the following factors:
|
•
|
Development of our products required our machine learning expertise and our proprietary algorithm, which are complex and difficult to replicate.
We develop our products using our machine-learning expertise to analyze clinical specimens with associated long-term outcomes data to identify genomic patterns in tumor biology that we believe will accurately predict the risk of metastasis and recurrence. We then validate these genomic patterns, by refining and locking down algorithms to enable additional studies to validate the accuracy of our tests and subsequently document the clinically actionable changes made by physicians when they incorporate our test results into their treatment plan decisions.
|
|
•
|
We have demonstrated the ability to provide clinically actionable information despite the complex genomics of skin cancer.
In the diagnosis and prognosis of cancer, there is significant current interest in DNA driver mutations as being a predictor of the behavior of cancers. We believe that while the behavior of some cancers may be elucidated by DNA analysis and the response to certain targeted therapies, the majority of skin cancer behavior will best be understood at the gene expression level. Specifically, while DNA mutations of a specific gene are important for tumor
|
5
behavior, the impact of other genes, epigenetic changes to the gene and the non-tumor environment which cannot be discerned by the mutation that a gene carries are critical to the understanding of tumor behavior. We believe that focusing on the expression of the gene or how the gene behaves will be more accurate than the mutation of the gene itself.
|
•
|
Our growing database of tumor samples and associated long-term outcomes data enables us to improve our current products and accelerate development of new products.
The development and validation of accurate tests is a complex process that requires access to tumor tissue specimens and long-term outcomes data. Such data is not readily available for skin cancer, which creates a barrier to rapid test development and validation. However, over the past ten years we created a sample bank comprised of over 55,000 samples, including 5,900 well-annotated samples that we have used in our clinical studies to date. We have been able to use this sample bank to expand the clinical use of our products, evaluate improvements in new proprietary genomic algorithm approaches and develop new products.
|
|
•
|
We have generated, and will continue to generate, robust clinical validity and utility data supporting the use of our products.
For example, DecisionDx-Melanoma has been studied in more than 5,700 patient samples, including 22 published studies since 2015. We also are making significant investments in further clinical studies to continue to support DecisionDx-Melanoma, DecisionDx-UM and our pipeline products. This growing set of data is significant in educating physicians and patients about the value of our products and supporting reimbursement of our products by third-party payors.
|
|
•
|
We have established relationships with physicians that allow us to optimize our interactions, increase adoption of our current products and identify areas of unmet clinical need to efficiently launch additional products.
We have published rigorous clinical data, which allows our sales and medical affairs representatives to have substantive, in depth dialogues with physicians. Through these established relationships we have been able to integrate our products into physicians’ workflows and identify further educational programs, which we believe drives adoption of our products. We can also leverage these relationships to identify areas of significant unmet medical need and efficiently launch additional skin cancer products.
|
|
•
|
We have experience in navigating the reimbursement landscape.
In the molecular diagnostics industry securing reimbursement for new tests is a long, complex and uncertain process. We have developed significant expertise in securing reimbursement for our products.
|
Our Strategy
We intend to build upon our position as a leading provider of genomic information for dermatological cancers. To realize this objective, we plan to:
|
•
|
Expand adoption of our currently marketed products and educate physicians and their patients on the need for our products to make a more informed treatment plan decision.
We believe that cancer treatment plans will be most effective if decisions are personalized for each patient based on the biology of their specific tumor, instead of a one-size-fits-all approach. We will continue to educate physicians and their patients on the diagnostic discordance that leads to over- and under-treatment.
|
|
•
|
Continue to generate evidence supporting the clinical utility and validity of our products.
We have conducted extensive clinical utility and validity studies to support the adoption of, and reimbursement for, our products. In order to maintain our competitive advantage and increase sales of our products, we will continue to generate additional clinical data to support the use of our products.
|
|
•
|
Execute planned expansion of our commercial channel.
We plan to increase sales of our products by adding new physicians to our customer base as well as increasing orders by physicians already using our products. We increased the number of sales and medical affairs representatives in the first quarter of 2019 with a second expansion occurring in December 2019. We will evaluate the needs of our customers through 2020 and may make additional commercial investments to better support the educational needs of our customers with our currently marketed products as well as support the launch of additional products.
|
|
•
|
Expand coverage and reimbursement for our products.
We plan to increase dialogue with third-party payors to highlight our clinical utility and patient outcomes data. We believe these data will validate the benefit of our products for patients and will persuade more third-party payors to provide coverage and reimbursement. Additionally, we will continue to emphasize our ability to reduce overall cost to the healthcare system by appropriately classifying high-risk patients and removing the need for unnecessary invasive products for low-risk patients.
|
|
•
|
Utilize our development expertise and commercial channel insight to provide additional solutions.
We are continuing to develop products that address the challenges facing physicians, including genomic tests for patients with
|
6
SCC with high-risk factors and suspicious pigmented lesions, addressing an aggregate of approximately 500,000 additional potential patients.
Dermatologic Cancer Market Overview
Skin cancer is the uncontrolled growth of abnormal skin cells. There are six types of pre-cancers and skin cancers that result in a total annual incidence of 5.5 million patients. The three most common forms of skin cancers are basal cell carcinomas, SCC and cutaneous melanoma. Cutaneous squamous cell carcinoma, or SCC, the second most common form of skin cancer, is an uncontrolled growth of abnormal cells arising from the squamous cells in the epidermis, the skin’s outermost layer. Melanoma, an aggressive form of skin cancer, originates in the pigment-producing melanocytes in the basal layer of the epidermis. We do not, at this time, have an active focus on basal cell carcinomas.
Pre-cancers include suspicious pigmented lesions, which are unusual-looking lesions that may be melanoma, and actinic keratosis, also known as a solar keratosis.

Cutaneous Melanoma
Melanoma tumors originate in the pigment-producing melanocytes in the basal layer of the epidermis. Approximately half of all melanomas are diagnosed prior to expanding into the dermis and are classified as in situ or non-invasive melanomas and DecisionDx-Melanoma is not used in this population. Worldwide statistics suggest that there were nearly 300,000 new cases of melanoma diagnosed worldwide with the U.S. Surveillance, Epidemiology, and End Results, or SEER, database estimating that approximately 96,000 invasive cutaneous melanomas were diagnosed in the United States in 2019. However, multiple recent publications show that diagnosis of melanoma is underreported by between 30% and 72%. Using the mean of the underreporting of these four studies, we estimate the 2020 annual incidence to be 130,000, representing an estimated 2020 U.S. total addressable market, or TAM, of $540 million. According to these publications, underreporting reflects the fact that the majority of diagnoses are made by community-based dermatologists and dermatopathologists rather than institutional-based specialists who more typically have tumor registry support. Based on currently available data, we estimate the targetable clinician base is between 11,000 and 15,000.
Additionally, the incidence of melanoma has steadily increased annually over the last several decades, with an estimated 53% growth in the United States over the last ten years.
After a diagnosis of invasive cutaneous melanoma, healthcare providers have traditionally used clinical and pathology factors from the initial biopsy to estimate the patient’s risk of metastasis. This estimation process, or staging, is used to determine nearly all treatment decisions. Invasive melanoma is staged as Stage I through Stage IV. Tumors characterized as Stage I have invaded the dermis but are thin, with less than or equal to 2.0 mm invasion into the dermis if not ulcerated or less than or equal to 1.0 mm invasion into the dermis if ulcerated. Stage I tumors have the lowest population risk of metastasis and death from melanoma. Stage II tumors, though localized, are thicker than 2.0 mm if not ulcerated or greater than 1.0 mm if ulcerated. Stage III tumors have evidence of regional metastasis, such as palpable metastasis at the regional lymph node basin, in-transit or satellite disease, or melanoma cell(s) in the SLN but without evidence of distant metastatic spread. Stage IV tumors are those in which distant metastasis, such as to the lung or brain, has been detected.
All patients who are diagnosed with an invasive cutaneous melanoma will undergo a wide local excision procedure with the surgical margins determined by the depth of the tumor. The invasive SLNB surgery is recommended to be considered for
7
patients with melanomas greater than or equal to 0.8 mm thick or with the presence of an adverse pathologic feature such as the presence of ulceration, high mitotic rate, and transected base. It is believed that tumors with these anatomic based features have a likelihood of an SLN-positive biopsy result 5% or more of the time. If the SLNB surgery is performed, then the wide local excision is performed at that time. As noted in the prior paragraph, an SLN-positive biopsy result, meaning that at least one melanoma cell was seen in the SLN tissue, leads to re-staging the patient as Stage III. Guideline committees do not recommend an SLNB if the likelihood of a positive SLN result is <5%. They recommend discussion and considering an SLNB if the likelihood of a positive SLN falls between 5% and 10% and recommend discussing and offering if the likelihood is >10%. Guideline committees have selected the 5% threshold due to a combination of some studies showing a regional false negative rate of the SLNB surgery at 5% (meaning that 5% of the time, or more, the guideline committees expect a patient with an SLN-negative biopsy result will subsequently develop lymph node metastasis) as well as matching to the reported surgical complication rate. However, the published literature documents a median false negative rate of 18% and an 11% surgical complication rate.
Cutaneous Squamous Cell Carcinoma
Cutaneous squamous cell carcinoma, the second most common form of skin cancer, is an uncontrolled growth of abnormal cells arising from the squamous cells in the epidermis, the skin’s outermost layer. Approximately one million patients are diagnosed with SCC each year in the United States and incidence has doubled over the last three decades. Worldwide data on SCC is inconsistently reported but the incidence outside the United States is estimated to be greater than two million diagnoses annually.
Until recently, SCC was considered a benign skin cancer. However, due to the rate of increased incidence, more patients are now estimated to die annually from SCC in the United States (approximately 15,000 patients) than from cutaneous melanoma. Similar to melanoma, treatment plan decisions are based upon a patient’s estimated risk of recurrence or metastasis. However, unlike melanoma, the estimates are based upon small patient cohorts and our research shows that most clinicians rely upon individual clinical and pathologic features rather than a staging “group” for guiding treatment plan decisions. Our DecisionDx-SCC test is being developed for use in the estimated 200,000 patients who present with one or more high risk features, representing an estimated U.S. TAM of $820 million.
Suspicious Pigmented Lesions
Suspicious pigmented lesions are unusual-looking lesions that may be melanoma. There are approximately two million skin biopsies performed specifically for the diagnosis of melanoma in the United States. Approximately 15% of these biopsies are classified as indeterminate, in which case a pathologist cannot make a definitive diagnosis as to whether the biopsy is benign or malignant. Using a lower target reimbursement rate, we estimate the U.S. TAM at $600 million.
Uveal Melanoma Market Overview
The incidence of uveal melanoma has remained relatively constant over time with approximately 1,600 — 1,700 patients diagnosed per year in the United States, representing an estimated U.S. TAM of $7.0 million. Uveal melanomas arise from the three tissues comprising the uveal tract and vary by location with approximately 90% occurring in choroid, 5% in the ciliary body and 5% in the iris. Uveal melanoma may also be referred to as ocular melanoma.
Significant Limitations of Current Clinical and Pathology Staging Systems for Skin Cancer
The dermatologic skin cancer market has significant unmet clinical needs, as clinical and pathology staging systems have traditionally applied a population-wide approach to estimate an individual patient’s risk of metastasis and have not incorporated the genomics of a patient’s tumor biology. This is unlike the diagnostic process applied to other solid tumors, such as breast and prostate cancer, where the broader use of genomics to understand tumor biology has led to individualized patient treatment plans. Not incorporating tumor biology leads to a discordance between the estimated and actual risk of metastasis, which results in over- and under-treatment as well as increased healthcare costs.
Cutaneous Melanoma
The clinical and pathology staging system for invasive cutaneous melanoma is based upon the anatomic findings of the melanoma; that is what the pathologist can see under the microscope from an initial tumor biopsy and what the physician can feel or see during a clinical exam or upon imaging. While this staging system provides population-based risk of metastasis estimates it does not evaluate nor incorporate the biology of the patient’s primary tumor.
Importantly, while it was formerly believed that the SLNB surgery improved melanoma specific survival, the landmark, prospective, randomized multi-center study conducted by the National Cancer Institute, the MSLT-I study, showed that death from melanoma was the same in patients who were randomized to the SLNB surgery or observation, indicating that the SLNB surgery is prognostic, and not therapeutic, as it relates to the risk of death from melanoma. On average, 12% of patients undergoing the SLNB surgery will have an SLN-positive biopsy result and 88% will not. The invasive SLNB surgery carries
8
significant healthcare burden. For instance, the overall complication rate of SLNB was shown to be 11.3% in a systematic review of 21 articles representing 9,047 patients. A separate review reported that the regional false negative rate of the SLNB surgery ranged from 5% to 21%, with a median rate of 18%. Regional false negative rate is defined as the rate that metastasis to the regional lymph node in patients with a negative sentinel lymph node biopsy surgical result.
Both the complication and false negative rates are above the recommended 5% and 10% thresholds proposed by guideline committees. Further, the SLNB surgery requires the use of general anesthesia and nearly half of the surgeries are performed in an in-patient setting, leading to an average reimbursed cost of $20,000 to $24,000. Finally, the 88% SLN-negative rate carries significant patient and healthcare system implications. This means that 88% of the time, patients undergoing an SLNB will have no change in their treatment plan and no change in their staging but are still exposed to the complications from the surgery, including general anesthesia risks, cost and a median false negative rate of 18%. Thus, while it is true that patients who are SLN positive, or re-staged to Stage III, have a higher population-based rate of metastasis and death from melanoma, the SLNB surgery does not improve melanoma-specific survival, carries risk of complications, a high false negative rate and significant costs.
In addition to the significant clinical issues involved in only using the traditional clinical and pathology factors to determine SLNB eligibility, a discordance exists between an individual’s stage and their risk of metastasis or death from melanoma. Based on data from SEER and the American Joint Committee on Cancer, or AJCC, of the patients diagnosed with Stage I, II or III cutaneous melanoma, 80% of melanomas are classified as the lowest risk, Stage I, and 12% are classified as next lowest risk, Stage II. However, these data show that patients with melanomas that are initially diagnosed as Stage I or II represent 60% of all deaths in patients initially diagnosed as Stage I, II or III. Furthermore, while patients with Stage III melanoma are at a higher population risk of metastasis and death from melanoma, the five-year melanoma-specific survival rate for these patients is 77%. The limitations of the current staging system not only result in unnecessary SLNB surgeries for certain low-risk patients, but we believe also leads to overtreatment with adjuvant immune-oncology and targeted therapies for certain patients with Stage III melanoma.
In summary, the risk of metastasis determines the treatment plans in newly diagnosed patients, including the recommendation for the SLNB surgery, decisions around the initiation of advanced imaging for active surveillance, frequency and specialty for clinical follow-up, initiation of adjuvant therapy and discussion of clinical trial enrollment opportunities. The graphic below summarizes the limitations of solely relying upon risk of metastasis based upon clinical and pathology features alone as it relates to SLNB surgery and the subsequent treatment plan decisions.
Cutaneous Squamous Cell Carcinoma
Identifying high risk SCC presents challenges for physicians. Unlike in cutaneous melanoma, where longitudinal databases were developed in an attempt to align population-based risk of metastasis with clinical and pathology factors, the same level of effort has not been given to SCC. As recently as four years ago, there were as many as three SCC staging systems in the United States, each with widely divergent classifications for high- and low-risk patients. For example, a 2014 study compared the AJCC version 7 and National Comprehensive Cancer Network, or NCCN, systems to assess concordance between the AJCC and NCCN systems. The AJCC system classified 82% as low risk while the NCCN system classified 13% as low risk. As such, this level of discordance results in the risk assessment staging systems minimally impacting treatment plans, with patients frequently being over- and under-treated.
9
Today, in addition to NCCN high-risk criteria, there are two principal staging systems for SCC: the AJCC version 8 (which is limited to head and neck SCC) and the Brigham Women’s Hospital, or BWH, version. All three systems rely upon a combination of clinical or pathology factors to stage or classify risk of metastasis. In general, NCCN identifies the majority of patients who do go on to metastasize, but it suffers from the lowest PPV of the three systems. Our initial clinical validation study of 321 patients was focused on patients with one or more high-risk features. Within this study, NCCN demonstrated a sensitivity of 96% while PPV was 7% and NPV was 90.5%. The low PPV means that 93 out of 100 NCCN high risk SCC’s did not actually metastasize. AJCC and BWH demonstrated a sensitivity of 38.5% and 25%, respectively, PPV of 33% and 35%, respectively and NPV of 88% and 86%, respectively. If one relies just upon NCCN, the low PPV means that developing an adjuvant treatment plan that includes radiation, or chemotherapy or complete lymph surgical dissection, or a combination of these, for a high-risk patient may be appropriate for the one out of fourteen high-risk patients who will metastasize but not for the remaining thirteen patients who would not have metastasized. For AJCC and BWH, the PPV does improve but it also means that two out of three patients would be recommended for an adjuvant treatment plan who will not benefit. These accuracy metrics have created significant discordance in the approach to managing patients with high-risk features, from one of the spectrum being intervention for all high-risk patients to “watch and wait” for all high-risk patients. The end result is an unacceptable clinical discordance in the approach to treatment plans and significant over- and under-treatment for a diagnosis that leads to the most skin cancer deaths in the United States.
Suspicious Pigmented Lesions
A pigmented lesion biopsy that is difficult to diagnose may lead to an indeterminate diagnosis, in which case the treating physician generally leans towards making a conservative decision and assume that the lesion is melanoma. A definitive diagnosis of invasive cutaneous melanoma results in a treatment plan that involves wider margins for the definitive wide local excision surgery, consideration of the SLNB surgery and post-diagnosis management plans, including frequent, high intensity surveillance using advanced imaging, frequent clinical visits and encouragement to enroll in clinical studies. If the indeterminate lesion was benign, then the recommendation in the majority of cases would be no additional intervention. Thus, the tendency of physicians to treat an indeterminate diagnosis as melanoma leads to significant over-treatment decisions, complications and increased healthcare costs.
Uveal Melanoma
Approximately 97% of patients with uveal melanoma have no evidence of metastatic disease at the time of diagnosis and the success rate for definitive treatment of the primary tumor surpasses 90%. However, within three years, approximately 30% of all patients will experience metastases. Prior to commercial availability of DecisionDx-UM, other clinical staging and molecular diagnostic tests existed for uveal melanoma, but the lack of prospective studies, coupled with low accuracy, resulted in these tests primarily being used for research purposes rather than for clinical management of patients in the United States. As a result, nearly all U.S. centers grouped patients into a single, high-risk treatment plan that included frequent, high intensity surveillance using advanced imaging, frequent clinical visits and encouragement to enroll in clinical studies.
Our Solution
We use the gene expression profile of an individual patient’s tumor biology to inform specific prognosis of metastasis or recurrence and aid the decision-making process of the treating physician and their patient to help optimize health outcomes and reduce healthcare costs. Due to the biological complexity of skin cancers, developing accurate products takes scientific diligence, stringent clinical protocols, machine learning expertise, proprietary algorithms and significant investments of time and capital. In addition, the underlying tissue samples and associated outcomes data required to develop and validate these products are difficult to obtain. Once successfully developed and validated, commercial success requires the generation of ongoing evidence such as clinical use documentation to support appropriate physician adoption, reimbursement success and guideline inclusion.
We have commercially launched DecisionDx-Melanoma, a proprietary GEP test designed to identify the risk of metastasis or recurrence in patients diagnosed with cutaneous melanoma, and DecisionDx-UM, a proprietary GEP test designed to identify the risk of metastasis in patients diagnosed with uveal melanoma. Multiple studies for both products have been published since completion of the initial clinical validation studies and have confirmed the accuracy of our products. Also, multiple clinical impact studies have demonstrated a significant impact on physician decisions to alter their treatment plan when the results of our test are considered in concert with the traditional clinical and pathology factors. Both of our currently marketed proprietary products are reimbursed by Medicare under positive coverage policies. In addition, we have received widespread positive private payor coverage and positive guideline inclusion for DecisionDx-UM, our first melanoma test. Since commercial launch, we have processed more than 60,000 clinical patient samples.
10

Our products are designed to provide the following benefits:
|
•
|
Better Information for Physicians.
We provide physicians and their patients with a report that contains clinically actionable information to inform the treatment plan for each individual patient. Our reports are updated as new clinical data is generated that may enable additional clinical decisions to be made. Based on four studies that we have conducted on clinical actionability, based on our test reports, physicians changed a patient’s treatment in more than 50% of cases, indicating physician confidence in the evidence underlying our reports.
|
|
•
|
Better Patient Care.
The clinical evidence shows that our products are accurate predictors of a patient’s specific risk of metastasis or recurrence of their cancer based upon the gene expression profile of their tumor, independent of available clinical and pathology factors. Physicians use this information to identify patients who are likely to benefit from an escalation of care as well as those who may avoid unnecessary treatments, such as medical and surgical interventions.
|
|
•
|
Reduced Healthcare Costs for Payors.
We believe our products have the potential to reduce overall healthcare costs by enabling physicians and their patients to avoid unnecessary medical and surgical interventions, including the SLNB surgery. As an example, without DecisionDx-Melanoma, 88% of patients who receive the SLNB surgery, which has an average in-patient reimbursed cost of $20,000 to $24,000, are found to be SLN-negative and remain classified as low risk. If all patients eligible for the SLNB surgery were tested and their test results were acted upon, we estimate the potential savings to the U.S. healthcare system could be up to $250 million, after considering the cost of DecisionDx-Melanoma.
|
Our Products
We currently market two proprietary products, DecisionDx-Melanoma and DecisionDx-UM, and have two active proprietary products in development, which we believe support an estimated total addressable market of $2.0 billion in the United States. We have received positive local coverage determinations, or LCDs, providing Medicare coverage for both of our commercial products. These LCDs facilitate reimbursement from Medicare, which represents approximately 50% of the addressable patient population. We also have third-party payor coverage for over 100 million lives for DecisionDx-UM and over 14 million lives for DecisionDx-Melanoma.
11
DecisionDx-Melanoma

Overview
We developed and market DecisionDx-Melanoma to healthcare providers for use with patients diagnosed with invasive cutaneous melanoma. Without the use of DecisionDx-Melanoma, these patients are classified in low- and high-risk categories based on population-wide clinical and pathology features, which impact a physician’s treatment plan recommendations, including whether or not to offer the invasive SLNB surgery, frequency and use of clinical imaging and follow-up frequency, adjuvant therapy and clinical trial enrollment. Unfortunately, these clinical and pathology features do not incorporate the genomics of an individual patient’s tumor biology, which often leads to a misclassification of a patient’s risk of metastasis or recurrence.
To address this need for a more accurate predictor of metastatic risk, we discovered, developed and completed validation for DecisionDx-Melanoma. This product is designed to help physicians identify high-risk patients with Stage I and II melanomas based on biological information, or expression, from 31 genes within their tumor tissue. DecisionDx-Melanoma does not change a physician’s standard diagnostic workflow for suspicious pigmented lesions, which includes performing the initial biopsy procedure and placing the biopsied tissue in formalin. The dermatopathologist then embeds the specimen in a paraffin block, cuts sections that are stained for viewing under a microscope and makes a diagnosis of invasive melanoma. We then extract and purify RNA from sections of the remaining specimen to run our test. We report test results in two classes and two subclasses. Class 1A represents the lowest risk group, Class 1B represents a low risk group, Class 2A represents an increased risk group and Class 2B represents the highest risk group.
Clinical Validation
We have published 11 clinical validation studies of DecisionDx-Melanoma, which we believe is the largest clinical validation program of the metastatic risk of cutaneous melanoma ever conducted. Based on our published data, we have shown that DecisionDx-Melanoma is an accurate independent predictor of the risk of metastasis or recurrence, showing an aggregate melanoma-specific five-year survival rate of 99% for patients who receive the Class 1A test result.
12
Our first study, published in January 2015, analyzed 104 patients with Stage I, II and III melanoma from an independent cohort with long term outcomes data. This study reported a five-year disease-free survival rate of 98% for patients with Stage I and II melanoma who received a Class 1 test result. In addition, the study also reported that only 2% of patients with a Class 1 test result were SLN-positive.
Our January 2019 study published in the Journal of the American Academy of Dermatology reviewed data on 690 patients with Stage I, II and III melanoma from all three previously published long-term archival publications, and enabled analysis of clinically important subgroups. Overall, the study reported a five-year melanoma specific survival rate of 99% for patients with Stage I, II or III melanoma who received a Class 1A test result.
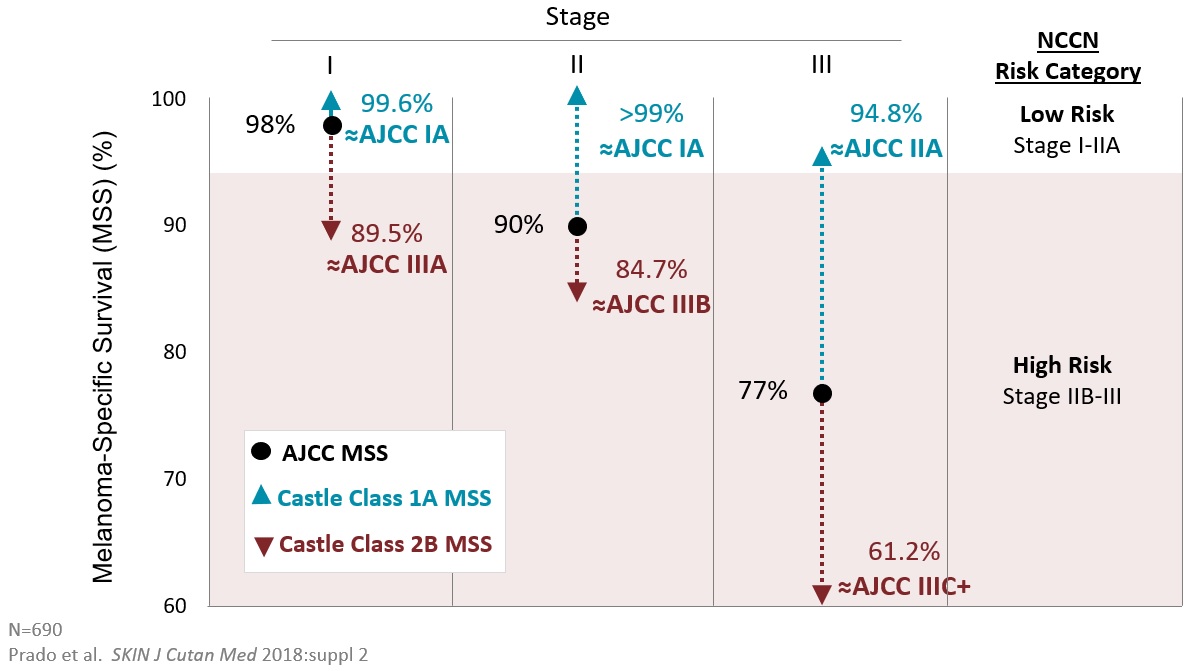
Our long-term outcomes study data shows that we can provide a more specific individual risk of metastasis and death from melanoma that is distinct from the AJCC stage approach that limits prediction to clinical and pathology factors. The only endpoint reported by the AJCC is death from melanoma. For patients diagnosed with Stage I melanoma, DecisionDx-Melanoma predominantly identifies patients with a risk of death from melanoma that is similar to a patient with Stage IIIA melanoma, with the remaining group having a 99.6% likelihood of being alive from melanoma at five years. For patients with an intermediate risk Stage II melanoma, DecisionDx-Melanoma can distinguish between patients who have a very low risk of death from melanoma (>99% likelihood of being alive at 5-years) from those who have a higher risk of death from melanoma that is similar to a patient with Stage IIIA/IIIB melanoma. For patients with a Stage III melanoma, DecisionDx-Melanoma can identify patients who have a likelihood of death from melanoma similar to a patient with Stage IIA melanoma, with the remainder having a risk similar to a patient with Stage IIIC melanoma.
The ability of DecisionDx-Melanoma to improve the risk of recurrence or risk of death from melanoma accuracy of these patient populations is clinically significant as NCCN guidelines recommend that the duration and frequency of follow-up and intensity of cross-sectional imaging be based on a patient’s individual conditional probability of recurrence. The NCCN guideline cut-point for these decisions is between Stage I-IIA versus Stage IIB-III. For example, the chart below demonstrates that a patient with a Stage I melanoma but a DecisionDx-Melanoma Class 2B test result has a melanoma specific survival rate of 89.5%, which is a higher risk than if the patient had a Stage IIIA melanoma. Today, patients with a Stage III melanoma are recommended to have an increased follow-up schedule, undergo routine cross-sectional imaging, consider initiation of adjuvant therapy, such as an anti-PD1 inhibitor, and consider enrollment in a clinical trial. None of these options would be considered in a patient with a Stage I melanoma in the absence of a DecisionDx-Melanoma test result.
13
The first prospective, multi-center study of 322 patients with Stage I, II and III melanoma was published in August 2017. This interim analysis reported a recurrence free survival rate of 97% and overall survival rate of 99% for patients with Stage I, II and III melanoma who received a Class 1 test result.
The most recent, independent, prospective, multi-center study of 86 patients with Stage IB and II melanoma was published in February 2019 in the Journal of The European Academy of Dermatology and Venereology. This study reported a recurrence free survival rate of 100% for patients with Stage IB and II melanoma who received a DecisionDx-Melanoma Class 1 test result.
The most recent, independent, prospective, single-center study of 159 patients with Stage I, II and II melanoma was published in March 2019 in Cancer Medicine. Of patients who recurred, the median time to recurrence was 13 months. Of patients who did not recur, the median follow-up time was 45 months. This study reported that the DecisionDx-Melanoma test was an independent predictor of recurrence (p=0.0001) and the most significant predictor of recurrence with a hazard ratio of 9.2 compared to hazard ratio of 3.5 for SLNB status and 1.2 for Breslow thickness. The DecisionDx-Melanoma test was also an independent predictor for distant metastasis and the most significant with a hazard ratio of 19.0 compared to 3.75 for SLNB status (Breslow thickness was not statistically independent). NPV for Class 1 for distant metastasis-free survival was 99%.
When evaluating DecisionDx-Melanoma, one of the most important criteria is whether the test adds new information that is independent of the traditional clinical and pathology factors. The formal statistical method used to evaluate independence is the Cox multivariate analysis. Outputs of the Cox multivariate analysis include statistical significance, measured by p-value, as well as the power of the result, measured by Hazard Ratio, or HR. A p-value of less than 0.05 indicates statistical significance and thus independence. If statistical significance is reached, then the HR indicates the power of the result, with a higher HR indicating greater outcome prediction. For example, an HR of nine means that patients with a high-risk test result are nine times more likely to experience metastasis or death than a low-risk test result. The table below shows the Cox multivariate analysis of the disease-free survival, melanoma-specific survival and recurrence free survival from the four performance studies noted above.

14
The American Academy of Dermatology and other organizations use the Strength of Recommendation Taxonomy, or SORT, system to evaluate prognostic tests such as DecisionDx-Melanoma. The SORT system ranks evidence of clinical validity as levels 1, 2 or 3, and assigns a strength of recommendation as levels A, B or C. A SORT level 1A is the highest level and 3C is the lowest. For SORT ranking, “a systematic review or meta-analysis of good quality studies” or “a prospective study with good follow-up” represents a level 1 for good quality evidence of clinical validity. For SORT strength of recommendation, “consistent, good quality evidence” represents a level A recommendation. A meta-analysis was recently completed and presented at the 2019 Annual Meeting of the American Academy of Dermatology. This meta-analysis reviewed multiple peer-reviewed published clinical validation studies of DecisionDx-Melanoma, including prospective studies. The meta-analysis and the prospective studies satisfied the level 1 ranking of good quality studies and the consistency of DecisionDx-Melanoma data across these studies satisfied the level A strength of recommendation. Thus, the authors concluded that DecisionDx-Melanoma achieved a 1A level of evidence of clinical validity and strength of recommendation under the SORT system. Furthermore, as shown below, the multi-variate analysis for recurrence-free survival found DecisionDx-Melanoma to be the strongest predictor of risk of recurrence compared to the evaluable clinical and pathology factors.

In addition, we conducted a prospective, multi-center study of 1,421 patients, which was published in Future Oncology in January 2019 which focused on the performance of DecisionDx-Melanoma to predict metastasis to the SLN. This study found that patients with a Class 1A test result with melanomas less than or equal to 2.0 mm thick, which represents 86% of all melanomas, have a 95% probability for an SLN-negative biopsy result. Analyzing this data by age shows that patients 65 years of age or older have a 98% NPV, those between 64 and 55 years of age have a 95% NPV and patients under 55 years of age have a 92% NPV. For physicians and patients evaluating whether to use DecisionDx-Melanoma to guide decision-making on the SLNB surgery, the impact on melanoma specific survival is an important consideration if the SLN status is not known. To address this, we analyzed the long-term outcome data from our Gastman 2019 publication and showed that patients of all ages with a melanoma less than or equal to 2.0 mm thick and a Class 1A test result have a five-year melanoma specific survival rate of 99.6%, while similar patients 55 years or older had a melanoma specific survival rate of 99.3%. This study showed that use of DecisionDx-Melanoma for patients with melanomas of less than or equal to 2.0 mm thick could potentially result in 74% less SLNB surgeries.
15
Clinical Utility
We completed and published four consecutive studies between September 2016 and March 2018 documenting how DecisionDx-Melanoma impacts treatment plan decisions. Based on the results of our DecisionDx-Melanoma test reports, physicians changed their treatment plan recommendations approximately 50% of the time. This change in the management of patient treatment plan recommendations compares favorably to leading molecular diagnostic tests as well as to the SLNB surgery, which only changes clinical decision-making approximately 12% of the time.
|
Study
|
Design
|
# of Patients
|
% Change in Management
|
|
Berger et al. CMRO 2016
|
Prospectively tested cohort, multi-center. Retrospective pre test / post test management.
|
156
|
53%
|
|
Dillon et al. SKIN J Cutan Med 2018
|
Prospective, multi-center: pre test / post test management.
|
247
|
49%
|
|
Farberg et al. J Drugs Derm 2017
|
169 physician impact study: patient vignettes with pre test / post test management.
|
n/a
|
47-50%
|
|
Schuitevoerder et al. J Drugs Derm 2018
|
Prospectively tested cohort, single center. Retrospective pre test / post test management; and modeling of prospective cohort.
|
91
|
52%
|
These studies illustrate how physicians use DecisionDx-Melanoma to inform the treatment pathway for patients who have been diagnosed with invasive cutaneous melanoma. Our DecisionDx-Melanoma test informs two initial treatment decisions: (1) to determine whether to offer and recommend the SLNB surgery to patients with melanomas less than or equal to 2.0 mm thick, and (2) following this decision, to guide the appropriate post-SLNB surgery treatment plan for their patients, including decision-making regarding advanced imaging, frequency of clinical visits, referral to medical oncology, adjuvant therapy, clinical trial enrollment, and watchful waiting.

Health Economics
We believe that the use of DecisionDx-Melanoma can reduce the number of SLNB surgeries, which has an average in-person reimbursed cost of between $20,000 and $24,000, thereby reducing overall cost of patient treatment for invasive cutaneous melanoma. If all patients eligible for the SLNB surgery were tested and their test results were acted upon, we estimate the potential savings to the U.S. healthcare system could be up to $250 million, after considering the cost of DecisionDx-Melanoma.
In addition, DecisionDx-Melanoma can be used to make more informed decisions on advanced imaging, frequency of clinical visits, referral to medical oncology, adjuvant therapy initiation and clinical trial enrollment. In some cases, the DecisionDx-Melanoma test result may guide an appropriate reduction in these decisions based upon a low risk of metastasis and in others it will guide an appropriate increase with the end result being improved use of healthcare resources.
16
Summary of Our DecisionDx-Melanoma Studies
The table below summarizes the DecisionDx-Melanoma clinical studies that have been published to date:
|
Study
|
Peer-Reviewed Publications
(Methods)
|
Main Findings
|
|||
|
Clinical Validity
|
|||||
|
Guidance of sentinel lymph node biopsy decisions in patients with T1-T2 melanoma using gene expression profiling
|
Future Oncology, January 2019
(SLNB rate: multicenter;
prospective; n=1421
Survival analysis:
retrospective; n=690)
|
•
|
Patients with T1/T2 melanomas and a Class 1A result had a SLN positive rate <5% while Class 2B patients had a rate above 10%. This is clinically significant as national guidelines do not recommend a SLNB if the risk is <5% and do recommend it if the risk is >10%.
|
||
|
•
|
Melanoma-specific survival (MSS) was 99.6% for patients with Class 1A, T1/T2 tumors who would avoid a SLNB.
|
||||
|
Prospective validation of the prognostic 31-gene expression profiling test in primary cutaneous melanoma
|
Cancer Medicine, March 2019 (single center; prospective; n=159 stage I-III melanomas)
|
•
|
Median follow-up of 45 months for recurrence-free cases.
|
||
|
•
|
DecisionDx-Melanoma Class 1 was an independent predictor of recurrence (p=0.0001) and the most significant predictor of recurrence with a hazard ratio of 9.2. DecisionDx-Melanoma Class 1 was also an independent predictor of recurrence (p=0.009) and the most significant predictor of distant metastasis with a hazard ratio of 19.0.
|
||||
|
•
|
NPV for Class 1 for distant metastasis free survival was 99%.
|
||||
|
•
|
Of 29 recurrences, 10 (34%) occurred in SLN positive cases while 23 (79%) occurred in Class 2. Of the 10 recurrences in SLN positive cases, 9 were Class 2.
|
||||
|
Early outcome of a 31-GEP test in 86 AJCC stage IB-II melanoma patients. A prospective multicentre cohort study
|
Journal of the European Academy of Dermatology and Venereology, February 2019 (Multicenter; prospective; n=86 stage IB-II melanomas)
|
•
|
DecisionDx-Melanoma Class 1 was an independent predictor of recurrence (p=0.01) and the most significant predictor of recurrence with a hazard ratio of 18.82. AJCC stage and age were not independent of DecisionDx-Melanoma Class 1.
|
||
|
•
|
NPV for Class 1 for RFS was 100%.
|
||||
|
•
|
All recurrences occurred in Class 2 patients.
|
||||
|
Identification of patients at risk for metastasis using a prognostic 31-gene expression profile in subpopulations of melanoma patients with favorable outcomes by standard criteria
|
Journal of the American Academy of Dermatology, January 2019
(Multicenter; archival; n=690 stage I-III melanomas)
|
•
|
DecisionDx-Melanoma Class 1A was an independent predictor of RFS, DMFS and MSS in the entire cohort and the most significant predictor with hazard ratios of 2.92, 2.89 and 9.02 for RFS, DMFS and MSS, respectively.
|
||
|
•
|
Subpopulation analysis of patients with Stage I-IIA melanoma showed that DecisionDx-Melanoma Class 1A was the only independent predictor of RFS, DMFS and MSS for all three endpoints compared to tumor thickness, ulceration status, and mitotic rate. Tumor thickness was an independent predictor for RFS but DecisionDx-Melanoma Class 1A was 499% greater than tumor thickness for this endpoint.
|
||||
|
•
|
Subpopulation analysis of patients with melanomas <1.0mm showed that DecisionDx-Melanoma Class 1A was an independent predictor or RFS and the most significant predictor with a hazard ratio of 9.34 which was over 200% greater than SLNB status.
|
||||
|
•
|
NPV for Class 1A for MSS was 99%.
|
||||
|
Estimation of Prognosis in Invasive Cutaneous Melanoma: An Independent Study of the Accuracy of a GEP Profile Test
|
Dermatologic Surgery,
December 2018 (Independent; single center; prospective; n=256 stage I/II melanomas)
|
•
|
Patients with a DecisionDx-Melanoma Class 2 result were 22 times more likely to metastasize compared to a Class 1 result. Multi-variate statistical analysis for independence was not reported.
|
||
|
•
|
NPV for Class 1 for recurrence was 99%.
|
||||
|
Interim analysis of survival in a prospective, multi-center registry cohort of cutaneous melanoma patients tested with a prognostic 31-GEP test
|
Journal of Hematology and Oncology, August 2017 (Multicenter; prospective; n=322 stage I-III melanomas)
|
•
|
DecisionDx-Melanoma Class 1 was an independent predictor of RFS and the most significant predictor with a hazard ratio of 7.15 and 290% greater than the nearest predictor, SLNB.
|
||
|
•
|
NPV for Class 1 was 98-99% for RFS, DMFS and OS.
|
||||
|
•
|
Of 12 distant metastatic events, 10 occurred in the Class 2 group compared to 6 in the SLN positive group.
|
||||
17
|
Study
|
Peer-Reviewed Publications
(Methods)
|
Main Findings
|
|||
|
Development of a prognostic genetic signature to predict the metastatic risk associated with cutaneous melanoma
|
Clinical Cancer Research, January 2015
(Multicenter; archival; n=268 stage I-IV melanomas)
|
•
|
DecisionDx-Melanoma Class 1 was an independent predictor of disease-free survival, DFS, and the most significant predictor with a hazard ratio of 9.55 compared to 5.40 for AJCC stage.
|
||
|
•
|
5-year DFS rate for Class 1 (97%) was significantly better than for Class 2 (31%; p<0.0001) and 98% for patients with Stage I or II melanomas.
|
||||
|
•
|
SLN positivity rate was 2% in patients with a Class 1 result.
|
||||
|
Identification of high-risk cutaneous melanoma tumors is improved when combining the online American Joint Committee on Cancer Individualized Melanoma Patient Outcome Prediction Tool with a 31-GEP based classification
|
Journal of the American Academy of Dermatology, May 2016
(Multicenter; archival; n=205 stage I-II melanomas)
|
•
|
DecisionDx-Melanoma Class 1 was an independent predictor of RFS, DMFS and OS compared to the AJCC Individualized Melanoma Patient Outcome Prediction Tool and was 163% or greater than AJCC for all outcomes.
|
||
|
•
|
Adding the DecisionDx-Melanoma Class 1 result to AJCC staging improved sensitivity for identifying recurrence, distant metastasis or death by up to 22% compared to AJCC staging alone.
|
||||
|
•
|
21% of cases had discordant risk prediction from DecisionDx-Melanoma Class 1 and AJCC tools, with the DecisionDx-Melanoma providing the more accurate prognosis for the majority of cases
|
||||
|
Gene expression profiling for molecular staging of cutaneous melanoma in patients undergoing sentinel lymph node biopsy
|
Journal of the American Academy of Dermatology, May 2015
(Multicenter; archival; n=217 stage I-III melanomas all of whom underwent SLNB)
|
•
|
DecisionDx-Melanoma Class 1 was an independent predictor of RFS, DMFS and OS with hazard ratios of 4.9, 3.9 and 4.7, respectively, and was 185% - 392% greater than SLNB.
|
||
|
•
|
DecisionDx-Melanoma Class 1 NPV for distant metastasis was 82% compared to 67% for SLNB.
|
||||
|
•
|
DecisionDx-Melanoma Class 1 sensitivity was 85%, 84% and 85% compared to SLNB sensitivity of 35%, 38% and 29% for the endpoints of DFS, DMFS and OS.
|
||||
|
Performance of a prognostic 31-GEP in an independent cohort of 523 cutaneous melanoma patients
|
BMC Cancer, February 2018
(Multicenter; archival; n=523 stage I-III melanomas)
|
•
|
DecisionDx-Melanoma Class 1A was an independent predictor of RFS and DMFS with hazard ratios of 3.8 and 5.3, respectively, and was between 146% and 408% greater than SLNB and tumor thickness.
|
||
|
•
|
NPV for MSS for Class 1A patients was 100% for Stage I, 100% for Stage II, 94% for Stage IIIA and 91% for Stage IIIB-C patients.
|
||||
|
Performance of a 31-GEP test in cutaneous melanomas of the head and neck
|
Head & Neck, January 2019
(Multicenter; archival; n=157 melanomas of the head and neck region)
|
•
|
DecisionDx-Melanoma Class 1 was an independent predictor of RFS, DMFS, OS and MSS with hazard ratios of 2.8, 2.8, 4.1 and 6.8, respectively compared to AJCC stage.
|
||
|
•
|
NPV for Class 1A for MSS was 98%.
|
||||
|
Clinical Utility
|
|||||
|
Prospective, Multicenter Clinical Impact Evaluation of a 31-GEP Test for Management of Melanoma Patients
|
SKIN: The Journal of Cutaneous Medicine, March 2018
(Multicenter, prospective; pre-test post-test methodology; n=247 patients)
|
•
|
Post-test management plans changed by 49% compared to pre-test plans; 85% of Class 2 patients and 36% of Class 1 patients having a change in management (p<0.001).
|
||
|
•
|
Significant changes for imaging (p<0.001), request for laboratory work (p=0.04) and frequency of office visits (p<0.001).
|
||||
|
Clinical impact of a 31-GEP test for cutaneous melanoma in 156 prospectively and consecutively tested patients
|
Current Medical Research and Opinion, September 2016 (Multicenter; retrospective chart review, pre-test post-test methodology; n=156 patients)
|
•
|
Post-test management plans were recorded in 53% of patients, with 77% of Class 2 patients and 37% of Class 1 patients (p<0.0001) having a change in management.
|
||
|
•
|
94% of patient management changes were concordant with the risk indicated by the GEP test result (p<0.0001).
|
||||
|
Impact of a 31-gene Expression Profiling Test for Cutaneous Melanoma on Dermatologists’ Clinical Management Decisions
|
Journal of Drugs in Dermatology, May 2017 (Intended use pre-test post-test vignette methodology; n=170 participating dermatologists)
|
•
|
Risk appropriate management recommendations for implementing SLNB and imaging were more likely to be made following incorporation of DecisionDx-Melanoma test results (p<0.05).
|
||
|
•
|
Dermatologists changed their tumor thickness inflection point for implementing SLNB, oncology referral and imaging from 1.0mm to 0.7mm following a Class 2 DecisionDx-Melanoma test result.
|
||||
18
|
Study
|
Peer-Reviewed Publications
(Methods)
|
Main Findings
|
|||
|
Impact of Genetic Expression Profile on Decision-Making in Clinically Node Negative Melanoma Patients After Surgical staging
|
Journal of Drugs in Dermatology, February 2018 (Single center, prospective study at Oregon Health and Science Center; n=91 patients)
|
•
|
DecisionDx-Melanoma test results were significantly associated with management of patients with Stage I or II melanoma by Dermatology (most often Class 1) or Surgical Oncology (most often Class 2) (p<0.05).
|
||
|
•
|
Decision-tree model derived from the treatment and clinical data found that DecisionDx-Melanoma class result accounted for 52% of management changes whereas AJCC stage accounted for 48%.
|
||||
|
Factors affecting dermatologists’ use of a 31-gene expression profiling test as an adjunct for predicting metastatic risk in cutaneous melanoma
|
Journal of Drugs in Dermatology, May,2018
(Intended use pre-test post-test vignette methodology; n=181 participating dermatologists)
|
•
|
The DecisionDx-Melanoma result had a significant impact on the likelihood that SLNB would be recommended for a patient with a T1b tumor.
|
||
|
•
|
The presence of ulceration increased the proportion of respondents who would recommend the test (p<0.001).
|
||||
|
Management decisions made by physician assistants and nurse practitioners in cutaneous malignant melanoma patients: impact of a 31-GEP test
|
Journal of Drugs in Dermatology, November 2018
(Intended use pre-test post-test vignette methodology; n=164 participating nurse practitioners and physician assistants)
|
•
|
DecisionDx-Melanoma Class 1 results led to a significant decrease in the proportion of PA/NPs who would recommend SLNB, imaging or quarterly follow-up intervals, while Class 2 results led to significant increases in each (p<0.01 for 5 of 6 patient vignettes included in clinical impact survey).
|
||
|
Establishing an evidence-based decision point for clinical use of the 31-gene expression profile test in cutaneous melanoma
|
SKIN: The Journal of Cutaneous Medicine, July 2019 (Multi-center, multi-cohort, multiple endpoint, prospective and archival methodology; n=1,037, 437, 8,944 and 160 patients)
|
•
|
Evidence-based analysis of four datasets demonstrated that a Breslow thickness of ≥ 0.3 is an appropriate cut-point for the second use of DecisionDx-Melanoma.
|
||
|
•
|
A fitted Loess regression curve of cumulative recurrence rates plotted at 0.1mm Breslow thickness showed significant separation occurred between 0.2 and 0.3mm for both RFS and DMFS rates for tumors < 0.3mm versus ≥ 0.3 and 1.0mm (p < 0.0001 for RFS and p = 0.0008 for DMFS). Frequency of non-Class 1A melanomas from a large dermatopathology practice was 16% in 437 consecutively tested melanomas between 0.3 and 1.0mm and 11% for 8,944 consecutively tested melanomas from May 2018 through April 2019.
|
||||
|
•
|
Analysis of two multi-center clinical use studies found a clinically significant and relevant change in management in 25% of patients tested in the 0.3 to 1.0mm group.
|
||||
|
Level of Evidence Review for a Gene Expression Profile Test for Cutaneous Melanoma
|
Am J Clin Dermatol 2019 (Level of evidence review of 7 studies using AJCC, NCCN and AAD criteria. n.b. two 2019 prospective were not included due to study censor date)
|
•
|
Level of evidence ranking using AJCC criteria was I/II.
|
||
|
•
|
Level of evidence ranking using NCCN criteria was I-IIIB (n.b. in December 2019, NCCN updated guidelines showing that DecisionDx-Melanoma met level IIB).
|
||||
|
•
|
Level of evidence ranking using AAD criteria was IIA.
|
||||
|
Appropriate Use Criteria for the Integration of Diagnostic and Prognostic Gene Expression Profile Assays into the Management of Cutaneous Malignant Melanoma: An Expert Panel Consensus-Based Modified Delphi Process Assessment
|
SKIN: The Journal of Cutaneous Medicine, September 2019 (Systematic literature review (censor date 2018) by expert consensus panel using Strength of Recommendation Taxonomy (SORT) methodology followed by modified Delphi technique for ACE recommendations)
|
•
|
Eight clinical use recommendation received SORT strength ranking of A or B, including use in SLN biopsy eligible patients with T1 or T2 melanomas and guiding subsequent treatment recommendation in patients with T1, T2 and T3 melanomas.
|
||
|
Integrating Skin Cancer-
Related Technologies into
Clinical Practice
|
Dermatol Clinics 2017 (using Oxford Centre for Evidence-Based Medicine criteria, the eleven member Melanoma Evolving Diagnostic Technologies Integration Group reviewed 49 articles published between Jan 1, 2012 and June 15, 2015 and using a modified Delphi technique developed an algorithm to effectively integrate technologies into melanoma diagnosis and early management)
|
•
|
Algorithm recommended the use of DecisionDx-Melanoma to guide SLNB discussions and subsequent follow-up management.
|
||
|
Analytical Validity
|
|||||
|
Analytic validity of DecisionDx-Melanoma, a proprietary GEP test, for determining metastatic risk in melanoma patients
|
Diagnostic Pathology, February 2018
(Inter-assay, inter-instrument, and inter-observer analysis; technical reliability in clinically tested melanoma specimens)
|
•
|
Inter-assay concordance on 168 specimens was 99% and matched probability scores were significantly correlated (R2 = 0.96); inter-instrument concordance was 95% and matched probability scores were correlated (R2=0.99; p < 0.001).
|
||
|
•
|
A technical success rate of 98% was achieved for the test in 7,023 clinical cases.
|
||||
19
In the fourth quarter of 2019, we received notification that the American Medical Association’s, or the AMA’s, Current Procedural Terminology Editorial Panel accepted Castle’s application for a Category I Multianalyte Assays with Algorithmic Analyses, or MAAA, Current Procedural Terminology, or CPT, code for its DecisionDx-Melanoma test. The CPT Editorial Panel is an independent group of expert volunteers representing various sectors of the health care industry. Its role is to ensure that code changes undergo evidence-based review and meet specific criteria. The code will be effective on January 1, 2021. With this acceptance, both of our proprietary MAAA tests, DecisionDx-UM and DecisionDx-Melanoma, have met the criteria required for a Category I MAAA CPT code.
The NCCN Guidelines for Cutaneous Melanoma were updated in December 2019 with a positive shift in the inclusion language indicating that the DecisionDx-Melanoma test may provide information that is an adjunct to AJCC staging, with a category 2A level of evidence recommendation.
DecisionDx-UM

Overview
At the time of diagnosis nearly all patients with uveal melanoma have no evidence of metastasis yet approximately 30% of uveal melanoma goes on to metastasize within three years and nearly 50% of uveal melanoma goes on to metastasize, overall. Traditional clinical staging and molecular diagnostic tests exist for uveal melanoma, but the lack of prospective studies of these tests, coupled with low accuracy, has resulted in these tests primarily being used for research purposes rather than for clinical management of patients in the United States. As a result, nearly all U.S. centers group patients into a single, high-risk treatment plan that included frequent, high intensity surveillance using advanced imaging, frequent clinical visits and encouragement to enroll in clinical studies.
DecisionDx-UM is a proprietary GEP test that helps healthcare providers predict the risk of metastasis in patients with uveal melanoma. We licensed the intellectual property for DecisionDx-UM from The Washington University in St. Louis, Missouri, or WUSTL, completed analytical validation and began marketing DecisionDx-UM in late 2009 for use in patients diagnosed with uveal melanoma without evidence of metastatic disease. DecisionDx-UM identifies which patients are at low risk for progression of their disease so that their physicians can appropriately de-escalate the level of care provided. In 2019, DecisionDx-UM was delivered to more than 1,500 patients, representing approximately 92% of the patients diagnosed in the United States annually.
Sixteen peer-reviewed publications supporting the clinical validity and utility of DecisionDx-UM have been conducted.
The Kaplan-Meier plot from the initial prospective, multi-center Collaborative Ocular Oncology Group, or COOG, study found a 97% NPV for risk of metastasis. This study also compared DecisionDx-UM to the traditional clinical and pathology factors as well as chromosome 3 status, which is an alternative molecular test to predict the risk of metastasis in uveal melanoma. As is shown in the Cox multivariate analysis, the only statistically significant factor in predicting a likelihood of metastasis was DecisionDx-UM.

20
The data from the COOG study, as well as the consistency shown from the additional clinical validity studies, has supported wide-spread adoption of DecisionDx-UM with more than 90% of the ocular oncology institutions in the United States ordering this test.
DecisionDx-UM has been used to guide treatment plan decisions regarding the intensity of a patient’s surveillance and management plan as well as clinical trial enrollment.

Summary of Our DecisionDx-UM Studies
The table below summarizes the DecisionDx-UM clinical studies that have been published to date:
|
Study
|
Peer-Reviewed Publications
(Methods)
|
Main Findings
|
|||
|
Clinical Validity
|
|||||
|
Collaborative Ocular Oncology Group report number 1: prospective validation of a multi-gene prognostic assay in uveal melanoma
|
Ophthalmology, August 2012 (Multicenter, prospective, n=446)
|
•
|
DecisionDx-UM Class 1 was the only significant predictor of MFS (p<0.0001) in multivariate analysis, compared to patient age, ciliary body involvement, tumor thickness, tumor diameter, cell type, and chromosome 3 status.
|
||
|
•
|
NPV for Class 1 for MFS was 99%
|
||||
|
•
|
MFS rates as 50-months were 97% for Class 1 and 20% for Class 2 patients (p<0.0001).
|
||||
|
Do largest basal tumor diameter and the American Joint Committee on Cancer’s cancer staging influence prognostication by gene expression profiling in choroidal melanoma
|
American Journal of Ophthalmology, November 2018
(Two-centers, retrospective, consecutively tested patients; n=293)
|
•
|
NPV for Class 1A for MFS was 99%.
|
||
|
•
|
Three-year MFS rates were 99% for Class 1A, 90% for Class 1B, and 60% for Class 2 patients.
|
||||
|
•
|
DecisionDx-UM was a significant predictor of metastasis in multivariate analysis (p=0.001) with increasing largest basal diameter.
|
||||
|
Clinical performance and management outcomes with DecisionDx-UM in a prospective multi-center study
|
Journal of Oncology, June 2016
(Multicenter, prospective; n=70)
|
•
|
NPV for Class 1 for MFS was 95%
|
||
|
•
|
Three-year MFS rates were 100% for Class 1 and 63% for Class 2 patients (p=0.003).
|
||||
|
•
|
DecisionDx-UM was the most significant predictor of metastasis in multivariate analysis (p=0.016) compared to age, largest basal diameter, ciliary body involvement, and tumor thickness.
|
||||
|
Uveal melanoma: molecular pattern, clinical features, and radiation response
|
American Journal of Ophthalmology, August 2012
(Single-center, retrospective; n=197)
|
•
|
5-year disease specific survival, or DFS, rates were 93% for Class 1 patients and 38% for Class 2 patients (p<0.0001).
|
||
|
•
|
DecisionDx-UM Class 1 was the only significant predictor of DFS (p<0.0001) in multivariate analysis compared with cell type, age of patient at radiation, and pretreatment ultrasound measurement.
|
||||
|
•
|
DecisionDx-UM Class 1 was the only significant predictor disease-specific mortality (p<0.0001) in multivariate analysis with cell type, age of patient at radiation, and pretreatment ultrasound measurement.
|
||||
|
An accurate, clinically feasible multi-gene expression assay for predicting metastasis in uveal melanoma
|
Journal of Molecular Diagnostics, July 2010
(Single-center, prospective (outcomes); n=172)
|
•
|
MFS rates were significantly different between Class 1 and Class 2 patients (p<0.0001).
|
||
21
|
Study
|
Peer-Reviewed Publications
(Methods)
|
Main Findings
|
|||
|
Uveal melanoma: from lesion size and cell type to molecular class
|
Canadian Journal of Ophthalmology, June 2012
(Independent, meta-analysis)
|
•
|
DecisionDx-UM had the strongest predictive value for UM metastasis and mortality.
|
||
|
Gene expression profiling and PRAME status versus tumor-node-metastasis staging for prognostication in uveal melanoma
|
American Journal of Ophthalmology, November 2018
(Single-center, retrospective consecutively tested patients; n=240)
|
•
|
DecisionDx-UM was the most significant predictor of metastasis in multivariate analysis (p<0.0001) with PRAME status, TNM stage, and gender.
|
||
|
•
|
DecisionDx-UM was the most significant predictor of metastasis in multivariate analysis (p<0.0001) with PRAME status, largest basal diameter, tumor thickness, ciliary body involvement, and gender.
|
||||
|
Prognostic implications of tumor diameter in association with gene expression profile for uveal melanoma
|
JAMA Ophthalmology, July 2016
(Independent, retrospective, two centers, n=580 patients)
|
•
|
NPV for Class 1 of MSS was 96%.
|
||
|
•
|
DecisionDx-UM was the most significant predictor of metastasis (p<0.001) in multivariate analysis compared to age, sex, tumor thickness, largest basal diameter, ciliary body involvement, and cell type.
|
||||
|
Driver mutations in uveal melanoma: Associations with gene expression profile and patient outcomes
|
JAMA Ophthalmology, July 2016
(Independent, retrospective, single center, n=81 patients)
|
•
|
DecisionDx-UM was the most significant predictor of metastasis (p<0.001) in multivariate analysis compared to age, sex, ciliary body involvement, cell type, extraocular extension, largest basal diameter, tumor thickness, and mutational status.
|
||
|
•
|
DecisionDx-UM was the most significant predictor of melanoma-specific death (p<0.001) compared to age, sex, ciliary body involvement, cell type, extraocular extension, largest basal diameter, tumor thickness, and mutational status.
|
||||
|
Independent prognostic significance of gene expression profile class and largest basal diameter of posterior uveal melanomas
|
American Journal of Ophthalmology, February 2016
(Single-center, prospective; n=299)
|
•
|
DecisionDx-UM was the most significant prognostic factor for UM mortality (p=0.0019) in multivariate analysis.
|
||
|
•
|
NPV for Class 1 for DFS was 95%.
|
||||
|
•
|
Five-year disease-specific survival rates were 92% for Class 1 patients and 55% for Class 2 patients (p=0.005).
|
||||
|
Sufficiency of FNAB aspirates of posterior uveal melanoma for cytologic versus GEP classification in 159 patients, and relative prognostic significance of these classifications
|
Graefes Archives in Clinical Experimental Ophthalmology, January 2014
(Prospective; n=159)
|
•
|
NPV for Class 1 for DFS was 95%.
|
||
|
•
|
Five-year disease-specific survival rates were 92% for Class 1 patients and 55% for Class patients (p=0.005).
|
||||
|
Clinical Utility
|
|||||
|
Clinical performance and management outcomes with the DecisionDx-UM GEP test in a prospective multi-center study
|
Journal of Oncology, June 2016
(Multi-center, prospective; n=70)
|
•
|
81% of Class 1 patients were prescribed low-intensity surveillance schedules (annual metastatic screening) compared to 0% of Class 2 patients.
|
||
|
•
|
100% of Class 2 patients were prescribed high intensity surveillance schedules (quarterly-biannual metastatic screening) compared to 19% of Class 1 patients (p<0.001).
|
||||
|
Current clinical practice: differential Management of Uveal Melanoma in the Era of Molecular Tumor Analyses
|
Clinical Ophthalmology, December 2014
(Multi-center, chart review, pre-test post-test methodology; n=88)
|
•
|
100% of Medicare-eligible Class 1 patients had low-intensity surveillance schedules.
|
||
|
•
|
100% of Medicare-eligible Class 2 patients had high-intensity surveillance schedules (p<0.0001).
|
||||
|
Risk-stratified systemic surveillance in uveal melanoma
|
British Journal of Opthalmology, January 2019
(Single-center, chart review; n= 107 consecutively diagnosed patients; 68 with GEP testing)
|
•
|
100% of metastases occurred in the Class 2 group.
|
||
|
•
|
The only significant predictor of intensity of the surveillance protocol was high risk Class 2 (p<0.01 for all analyses).
|
||||
22
|
Study
|
Peer-Reviewed Publications
(Methods)
|
Main Findings
|
|||
|
Analytical Validity
|
|||||
|
Gene Expression Profiling in Uveal Melanoma: Technical Reliability and Correlation and Correlation of Molecular Class with Pathologic Characteristics. Diagnostic Pathology
|
Diagnostic Pathology, August 2017
(Technical reliability studies and technical success in clinical testing (n=5,516))
|
•
|
Intra-assay, inter-assay (short-term and long-term), and inter-laboratory concordance experiments demonstrated 100% Class concordance and a high degree of correlation between discriminant scores.
|
||
|
•
|
Inter-instrument/operator concordance was 96% between Class 1 and 2.
|
||||
|
•
|
96.3% technical success was achieved on fine-needle aspiration biopsy (FNAB) and formalin-fixed paraffin-embedded (FFPE) specimens in clinical testing.
|
||||
|
An Accurate, Clinically Feasible Multi-Gene Expression Assay for Predicting Metastasis in Uveal Melanoma
|
Journal of Molecular Diagnostics, July 2010
(Technical reliability studies)
|
•
|
Technical success was 95% in 609 samples.
|
||
|
•
|
DecisionDx-UM was successful in 50/51 FNABs that had insufficient quantity for cytology.
|
||||
|
•
|
100% Class concordance in tissue from FNABs and matched fresh-frozen tumor slices.
|
||||
|
•
|
31/32 (97%) Class concordance in multiple tumor sections from 7 tumors.
|
||||
The current NCCN Guidelines for Uveal Melanoma (last updated June 2019) incorporate DecisionDx-UM as the first risk of distant metastasis predictor to guide systemic imaging.
Additional Ancillary Products
We also offer two next generation sequencing panels to complement our proprietary cutaneous and uveal melanoma products. When the U.S. Food and Drug Administration, or FDA, approved adjuvant BRAF/MEK inhibitor therapy for patients diagnosed with Stage III cutaneous melanoma, either at the time of diagnosis or subsequent progression, physicians ordering our tests requested tests to provide information on these specific genes. In order to provide a more complete product offering to physicians, we offer a 3-gene test to confirm BRAF, NRAS and KIT status to inform drug therapy decisions. This 3-gene panel can be ordered at the same time as, or after, DecisionDx-Melanoma. For uveal melanoma, we offer a 7-gene panel that can also be ordered at the same time or subsequent to DecisionDx-UM. We also offer a proprietary GEP test for PRAME status of patients diagnosed with uveal melanoma, DecisionDx-PRAME.
Development Engine and Pipeline
We identify areas of significant unmet medical needs in the treatment of skin cancer and leverage our expertise in cancer genomics and data analytics to develop clinically actionable products. We focus first on previously unanswered medical questions, which we often identify as the result of the in-depth conversations our sales and medical affairs representatives have with physicians. We leverage our deep understanding of skin cancer clinical treatment pathways to identify areas of unmet medical need where better information can improve, and potentially transform, patient outcomes. Next, our team of scientists and laboratory technologists use the latest genomic methods to discover gene expression profiles, RNA, which are likely to impact treatment pathway decisions. Our bioinformatics team works collaboratively with our scientists to build proprietary algorithms based on machine-learning techniques to predict the risk of metastasis or recurrence based on the genomics of each individual patient’s tumor biology.
Once we have generated a product candidate that we believe will address an unmet medical need, we work to validate the product candidate through extensive testing of patient tissue samples combined with clinical outcomes data. We use both our extensive data bank of patient tumor samples and clinical outcomes data to run development and validation studies and conduct clinical studies to collect new samples in additional diseases. We publish our data regularly to drive adoption, reimbursement and guideline inclusion.
We have gained expertise in developing proprietary algorithms, conducting clinical studies and using the necessary instrumentation required for efficiently developing our pipeline products. We have used these development principles to explore multiple potential solutions and have identified two principal areas to expand our pipeline: tests for patients with SCC and patients with suspicious pigmented lesions.
23
DecisionDx-SCC

The current treatment pathway for patients identified as having high-risk SCC suffers from a low PPV for risk of metastasis or recurrence. As a result, many patients categorized as high risk received adjuvant therapy and other unnecessary medical and surgical interventions even though they would not have gone on to metastasize. Conversely, there are also many patients categorized as high risk who are placed in “watchful waiting” who could benefit from adjuvant therapy. To address this clinical need in SCC, we are developing DecisionDx-SCC, a proprietary GEP test designed to be used in patients with one or more high risk features and provide a better PPV while maintaining similar NPV. We believe this product candidate will enable more informed clinical decisions regarding adjuvant intervention and other management decisions. We have ongoing multi-center studies involving more than 75 U.S. centers. Our development analysis has identified a proprietary gene expression profile algorithm that exhibits significant differential expression between non-recurrent and recurrent cases. Data from our initial validation study was presented at the American Society of Dermatologic Surgery in October 2019. We have ongoing studies and based upon our current progress we intend to commercially launch DecisionDx-SCC in the second half of 2020.
DecisionDx for Suspicious Pigmented Lesions
A biopsy of a pigmented lesion may lead to an indeterminate diagnosis, in which case the treating physician generally leans towards making a conservative decision and assumes that the lesion is melanoma. To address this clinical need, we are developing a proprietary GEP test designed to be used as an adjunct to histopathology when the distinction between a benign lesion and melanoma is uncertain. Our analysis has identified several gene expression profile algorithms that we believe may be used to confirm whether a specimen is melanoma or benign lesion.
Based on the timing and results of our ongoing clinical studies, we intend to commercially launch this product in the second half of 2020.
Our Commercial Channel
Sales and Marketing
Our sales and marketing efforts are currently focused on the United States skin cancer market. We employ a direct sales and marketing strategy to educate dermatologists, surgeons and other physicians on the clinical and economic benefits of our products. Our sales approach is highly technical, and our team is trained to articulate the scientific and clinical evidence behind our products and how they influence the clinical care pathway and ultimately improve patient outcomes. Our sales force is focused on educating and informing the entire patient care team, which consists of treating clinicians, nurses, laboratory and pathology personnel, and finance administrators, on the appropriate use and value of our test.
In December 2018, our customer-facing commercial and medical affairs group was staffed in the low 20s. We successfully executed two expansions (in the first quarter of 2019 and in December 2019) and now total in the low 50s. Our customer-facing team is focused on leading high clinical impact discussions with the treating clinician’s areas of interest, including clinical utility, patient outcomes, and supporting evidence. We saw significant promotion responsiveness in 2019.
We increased our outside sales territories from 14 to 23 in the first quarter of 2019 and also added supporting inside sales associates, medical affairs and marketing staff. We believed that this increase in customer-facing personnel would increase the adoption of our products as we would be able educate more physicians on the clinical benefits of our products. We did see the promotion responsiveness that we anticipated and conducted a second expansion in December 2019 such that our outside sales territories now total 32. Based upon current knowledge, we believe that an optimally efficient dermatology salesforce to support our DecisionDx-Melanoma test ranges between 35 and 45 individuals. However, we will also continue to evaluate our mix of outside sales territories, inside sales support, marketing and medical affairs in the context of our DecisionDx-Melanoma test and our near-term pipeline product and adjust our investments based upon these evaluations.
DecisionDx-UM addresses a small cancer market, and patients are managed by a small group of ocular oncology surgeons, generally ophthalmology or retina trained specialists. We serve these patients and their physicians by providing highly technical interactions that focus on optimizing the appropriate use of our proprietary and ancillary products.
Medical Affairs
We also deploy an experienced medical affairs group to assist education of treating physicians and key opinion leaders, to identify and engage sites for our sponsored clinical studies and to evaluate collaborative study opportunities. Our medical affairs strategy complements our sales and marketing and clinical research operations efforts.
24
Our Laboratory Report
We design our test reports with input from physicians to provide an easy to read risk classification and present specific actionable information to enable improved treatment decisions between patients and their physicians. We update our test reports as new data become available that may impact physicians’ treatment decisions based on the use of our tests. For example, the most recent update to our DecisionDx-Melanoma report incorporates data from our prospective multicenter 1,421 patient study showing how our tests can predict the likelihood of a patient experiencing an SLN-positive result from the SLNB surgery.
The image below is an example of a current clinical report for DecisionDx-Melanoma:

Reimbursement
The primary source of revenue for our products is reimbursement from third-party payors, which includes government payors, such as Medicare, and commercial payors, such as insurance companies. Achieving broad coverage and reimbursement of our current products by third-party payors and continued Medicare coverage are key components of our financial success. De novo coverage by government and third-party payors for our pipeline tests will be important over time.
Government Payors
Medicare coverage is limited to items and services that are within the scope of a Medicare benefit category and that are reasonable and necessary for the diagnosis or treatment of an illness or injury. LCDs are made through an evidence-based process by Medicare Administrative Contractors, or MACs, with opportunities for public participation.
Palmetto GBA, or Palmetto, issued a final LCD for DecisionDx-Melanoma, which became effective on December 3, 2018. Noridian Healthcare Solutions, LLC, or Noridian, adopted the same coverage policy as Palmetto on that date, and subsequently issued a final LCD on February 10, 2019. This LCD provides for coverage for patients who are eligible for the SLNB surgery with cutaneous melanoma tumors of 2.0 mm in thickness or less, and patients with clinically negative SLN basins who are being considered for the SLNB surgery to determine eligibility for adjuvant therapy. Melanomas less than or equal to 2.0 mm thick represent 86% of all melanomas. The median age at diagnosis is 63 years old, therefore the Medicare eligible population represents close to 50% of the addressable market.
On August 22, 2019, Palmetto GBA, a Medicare Administrative Contractor, posted a draft LCD that, if finalized, would result in expanded Medicare coverage for our DecisionDx-Melanoma test. We expect that Palmetto GBA will finalize and implement the draft LCD after a public comment period that opened on October 7, 2019 and closed on November 21, 2019. Based upon our analysis from the close of the public comment period to issuance of the final LCD for other MolDX LCDs, we estimate that this expanded LCD may be final in the second half of 2020. However, there is no assurance that the timing of our LCD will match the recent experience of other MolDX LCDs.
25
Separately, Palmetto issued a final LCD for DecisionDx-UM, which became effective in July 2017, and Noridian issued a similar LCD that became effective in September 2017. The Noridian LCD provides for coverage to determine metastatic risk in connection with the management of a patient’s newly diagnosed uveal melanoma and to guide surveillance and referral to medical oncology for those patients. Similar to cutaneous melanoma the median age at diagnosis for uveal melanoma is estimated at 58-62 years old, therefore the Medicare eligible population represents close to 45% of the addressable market.
On May 17, 2019, the Centers for Medicare & Medicaid Services, or CMS, determined that DecisionDx-UM meets the criteria for “existing advanced diagnostic laboratory test” status, also referred to as “existing ADLT” status. This means that beginning in 2021, the DecisionDx-UM Medicare rate will be set annually based upon the median private payor rate for the first half of the second preceding calendar year. Specifically, the median private payor rate from January 1 to June 30, 2019 will be used to set the Medicare rate for the calendar year 2021. We successfully submitted this data in January 2020. Note that our rate for 2020 will be set by Noridian, our local MAC.
Also, on May 17, 2019, CMS determined that DecisionDx-Melanoma meets the criteria for “new ADLT” status. This means that from July 1, 2019 through March 31, 2020 the Medicare reimbursement rate will equal the initial list price of $7,193.00, subject to the possible recoupment provision described below. The rate for April 1, 2020 through December 31, 2021 will be calculated based upon the median private payor rate from July 1, 2019 to November 30, 2019. We successfully submitted this data in December 2019. Note that for DecisionDx-Melanoma tests reported for July 1, 2019 through March 31, 2020, CMS has the right to recoup the difference between the actual list and 130% of the weighted median if the original list price was greater than 130% of the weighted median of private payor rates.
However, based on the data we collected and submitted to CMS during the data collection period ended November 30, 2019, the original list price amount was not greater than 130% of the weighted median of private payor rates. Therefore, we expect no recoupment to apply under this provision. Beginning in 2022,
the rate will be set annually based upon the median private payor rate for the first half of the second preceding calendar year. For example, the rate for 2022 will be set using median private payor rate data from January 1, 2020 to June 30, 2020.
Commercial Third-Party Payors
We are actively engaged in efforts to achieve broad coverage and reimbursement for our current and future products, followed by contracting with commercial payors. Achieving positive coverage reduces the need for appeals and reduces failures to collect from the patient’s commercial payor. Even with positive coverage decisions, we still experience delays in time to payment. Achieving in-network contracts with third-party payors can shorten the time required to receive payments. Implementing our strategy includes our managed care and medical affairs teams educating third-party payors regarding our strong clinical utility and outcomes data, which we believe validates the value of our products and will persuade more third-party payors to provide value-based reimbursement.
We have broad positive policy coverage for our DecisionDx-UM test, we have executed contracts with certain commercial payors and anticipate increases in contracting in 2020 and 2021. We also have positive policy recommendations from many third-party technical assessment review groups.
We began, following the Medicare LCD, engaging commercial third-party payors for positive coverage and saw some positive coverage policies in the second half of 2019. With the continued evidence development, we anticipate additional positive coverage policies occurring in 2020 and beyond.
Dependence on Third-Party Payors
We receive a substantial portion of our revenue from a small number of third-party payors, primarily Medicare, BlueCross BlueShield affiliates and Medicare Advantage plans. Our revenue from patients covered by Medicare, Medicare Advantage plans, United Healthcare and BlueCross BlueShield plans, as a percentage of total revenue, was
49%
,
29%
,
6%
and
6%
, respectively, for the year ended December 31, 2019. BlueCross BlueShield plans and Medicare Advantage plans represent an aggregation of multiple payors making independent reimbursement decisions; however, these plans often base reimbursement decisions on common guidelines which can influence multiple plans simultaneously.
Competition
We are focused on providing high value diagnostic and prognostic solutions for dermatological cancers. We believe, today, that there is limited existing competition for our products that provide evidence-based genomic solutions to physicians and their patients.
We believe the principal competitive factors in our target markets include:
|
•
|
Proprietary, disciplined approach to genomic analysis including the use of proprietary deep learning, machine learning and other techniques to identify and optimize gene selection and algorithmic approaches to answer the clinically important questions with accuracy tests. This involves the ability to design and efficiently conduct the right clinical studies at the right time;
|
26
|
•
|
Research and development investments to document the quality, quantity, consistency and strength of the clinical validity data, the impact our products have on clinical use, and demonstration of net health outcome improvement that reduce health system costs;
|
|
•
|
Maintaining a strong reputation with the treating physician by providing consistent, transparent, clinically relevant information that will improve the appropriate management of their patients;
|
|
•
|
Ease of use in accessing our products, reimbursement support for the physician and their patient and laboratory reports that clearly communicate the clinically relevant data points;
|
|
•
|
Demonstrated ability to work with, and secure coverage and reimbursement from, governmental and commercial payors;
|
|
•
|
Ability to efficiently commercialize pipeline products to the same customer base as our current products.
|
We believe we compete favorably on the factors described above.
Today, our principal competition for DecisionDx-Melanoma is existing traditional clinical and pathology staging criteria. While some clinical and pathology criteria have changed over time, this approach has been the standard of care in the United States for many years, and physicians may be unwilling to accept the validity of the published data and adopt our test until it has become incorporated into national guidelines. In December 2019, we did see positive improvements in the NCCN guidelines as it related to our DecisionDx-Melanoma test. However, it is too early to understand the impact on physician adoption and commercial payer coverage. In addition, we may, in the near future, face competition from a limited number of companies who are working in this disease space such as Neracare and SkylineDx.
DecisionDx-UM competes with a subsidiary of LabCorp and several academic laboratories all of which have had tests available for several years. To date, our data has demonstrated that DecisionDx-UM is clinically and statistically superior to these products.
We are unaware of late-stage work being performed to develop and validate a product that would compete with our pipeline product for SCC. We believe that the primary competitor for our SCC product, if we are successful in validating a clinically useful product, will initially be existing traditional clinical and pathology staging criteria.
We are aware of competitors that would likely compete with our pipeline product for suspicious pigmented lesions such as Myriad Genetics. If we are successful in validating a clinically useful product, then we expect to compete favorably with them.
Laboratory Operations
The Laboratory Developed Tests, or LDTs, that we commercialize are conducted in our CAP accredited, CLIA-certified facility in Phoenix, Arizona which we moved into in April 2016. We are, in the first half of 2020, doubling our footprint to 23,400 square feet. We perform all laboratory procedures involved in our tests from receiving a requisition form to issuance of the final test result in this facility. Our prior capacity plan analysis indicated that we could process up to 60,000 proprietary GEP test orders annually, with a single shift. We performed more than 17,000 proprietary GEP tests in 2019. We are able to provide our proprietary DecisionDx-Melanoma and DecisionDx-UM products for patients in all fifty states including those that require specific, additional, out-of-state lab licenses or qualifications such as New York, California, Pennsylvania, Maryland, and Rhode Island. Upon receipt, orders and samples are processed through an automated laboratory information management system which, in addition to tracking sample chain of custody, initiates and tracks accessioning, sample eligibility, technical data generation, algorithmic analysis and results reporting. The majority of samples are received as paraffin embedded sections from a formalin fixed tissue specimen.
The laboratory facility houses all functions related to quality control and assurance, licensing, accreditation and regulatory compliance. Our quality management program ensures the quality of our laboratory services and products through continuous monitoring of a broad range of key performance indicators including technical, customer service and cybersecurity metrics. Through this program, we promote a philosophy of continuous improvement based upon adherence to validated standards. Our Phoenix facility also house our clinical research operations and local information technology support.
Raw Materials and Suppliers
We procure reagents, equipment, chips/cards and other materials used to perform our tests from sole suppliers such as ThermoFisher Scientific, Inc., and Qiagen, Inc. Some of these items are unique to these suppliers and vendors. While we have developed alternate sourcing strategies for these materials and vendors and while we have experienced no business interruption due to an inability to source these materials, we cannot be certain whether these strategies will be effective or whether alternative sources will be available when we need them. If these suppliers can no longer provide us with the materials we need to perform our test services, they do not meet our quality specifications, or we cannot obtain acceptable substitute materials, our business would be negatively affected.
27
License Agreement with The Washington University
In November 2009, we entered into a license agreement, or the License Agreement, with WUSTL to license certain patent rights and technical information from WUSTL for the development of melanoma products, or the Products, and services, or the Services. The rights licensed under this agreement are used in DecisionDx-UM only.
Under the License Agreement, we obtain an exclusive, worldwide, royalty-bearing license to certain patent rights owned by WUSTL, or the Patent Rights, and a non-exclusive, worldwide license to certain technical information and research property owned by WUSTL, with the right to grant sublicenses under certain conditions, to develop the Products and Services. WUSTL retains the right to use the Patent Rights for research purposes.
The Patent Rights that we license pursuant to the License Agreement have been generated through the use of U.S. government funding and are therefore subject to certain federal regulations. See “Risk Factors—Risks Related to Intellectual Property—
Our in-licensed intellectual property has been discovered through government funded programs and thus may be subject to federal regulations such as “march-in” rights, certain reporting requirements and a preference for U.S.-based companies, and compliance with such regulations may limit our exclusive rights, and limit our ability to contract with non-U.S. manufacturers.”
Under the License Agreement, we are required to use best efforts to carry out the activities under an agreed-upon development plan, or the Development Plan, and meet any and all milestones set forth in the Development Plan. We are required to make milestone payments to WUSTL upon successful completion of development and commercialization milestones as set forth in the Development Plan. For each Product or Service that receives FDA approval, premarket approval or premarket notification, we are obligated to make a milestone payment to WUSTL in the mid-four digits. For the issuance of the first U.S. patent and the first foreign patent, we are obligated to make aggregate milestone payments to WUSTL in the low-five digits.
Under the License Agreement, we were obligated to pay WUSTL an initial license issue fee in the low-five digits. We are also obligated to make royalty payments to WUSTL equal to (i) a percentage in the mid-single digits of our and any of our affiliates’ or sub-licensees’ net sales of Products and (ii) a percentage in the low-single digits of our and any of our affiliates’ or sub-licensees’ revenue from Services. We are also obligated to make royalty payments to WUSTL in the low-to-mid single digit percentage of net sales, with minimum royalty payments to WUSTL every six-month period following the first commercial sale.
The term of the License Agreement will continue for ten years following the last-to-expire valid claim relating to the Patent Rights, unless terminated earlier. WUSTL may terminate the License Agreement upon written notice in the event of (i) our material breach if such breach remains uncured for 90 days, (ii) the exercise of certain rights by us with respect to the Patent Rights and/or the licensed technical information outside the scope of the License Agreement, or (iii) for certain insolvency-related events. We may terminate the License Agreement without cause upon written notice to WUSTL and payment of any amount due to WUSTL under the License Agreement.
Intellectual Property
Our core technology for our products is related to methods and devices for analysis of genetic expression. Using this technology, we are able to provide a more accurate prediction of a patient’s metastatic risk as compared to other methods. We have secured and continue to pursue intellectual property rights globally, including through patent protection covering analysis of metastasis in cutaneous melanoma, as well as treatment of cutaneous squamous cell carcinoma. We also rely on trademarks, trade secrets, know-how, continuing technological innovation and potential in-licensing opportunities to develop and maintain our proprietary position. For more information, please see “Risk Factors—Risks Related to Intellectual Property.”
28
Patents and Patent Applications
We have developed a global patent portfolio that as of the date of this Annual Report on Form 10-K, is comprised of 16 issued patents, including five issued U.S. patents, and nine pending patent applications, including three U.S. applications. Our patent portfolio consists of three owned patent families and an exclusively in-licensed portfolio from WUSTL, which includes six pending and issued patents or patent applications across two families. This global patent portfolio has filing dates ranging from 2009 to 2018, and therefore are projected to expire between 2029 and 2038, subject to any patent term extension or patent term adjustment that might be available in a particular jurisdiction. The owned and licensed families contain issued patents and pending applications that relate to devices, systems, and methods for macromolecular analysis, and reflect our active and ongoing research programs. The commercial foci of these patent families are discussed below.
|
Commercial Focus
|
Number of Issued Patents
and Pending Patent
Applications
|
||
|
Methods for predicting risk of metastasis in cutaneous melanoma
|
16
|
|
|
|
Compositions and methods for detecting cancer metastasis
|
4
|
|
|
|
Methods of diagnosing and treating patients with cutaneous squamous cell carcinoma
|
2
|
|
|
|
Method for predicting risk of metastasis
|
2
|
|
|
|
Method of predicting risk for recurrence for soft tissue sarcoma
|
1
|
|
|
Individual patents extend for varying periods depending on the date of filing of the patent application or the date of patent issuance and the legal term of patents in the countries in which they are obtained. Generally, patents issued for regularly filed applications in the United States are granted a term of 20 years from the earliest effective non-provisional filing date. In addition, in certain instances, a patent term can be extended to recapture a period due to delay by the United States Patent and Trademark Office, or USPTO in issuing the patent as well as a portion of the term effectively lost as a result of the FDA regulatory review period. However, as to the FDA component, the restoration period cannot be longer than five years and the total patent term including the restoration period must not exceed 14 years following FDA approval. The duration of foreign patents varies in accordance with provisions of applicable local law, but typically is also 20 years from the earliest effective non-provisional filing date. However, the actual protection afforded by a patent varies on a product-by-product basis, from country to country, and depends upon many factors, including the type of patent, the scope of its coverage, the availability of regulatory-related extensions, the availability of legal remedies in a particular country and the validity and enforceability of the patent.
Trademarks and Trade Secrets
As of the date of this Annual Report on Form 10-K, our U.S. trademark portfolio contained seven trademark registrations.
We rely upon trade secrets, know-how, continuing technological innovation and potential in-licensing opportunities to develop and maintain our competitive position. We seek to protect our intellectual property and proprietary technology, in part, by entering into confidentiality agreements and intellectual property assignment agreements with our employees, consultants, corporate partners and, as applicable, our advisors. These agreements are designed to protect our proprietary information and, in the case of the invention assignment agreements, to grant us ownership of technologies that are developed through a relationship with an employee or a third party. These agreements may be breached, and we may not have adequate remedies for any breach. We additionally seek to preserve the integrity and confidentiality of our data and trade secrets, such as our proprietary algorithms, by maintaining the physical security of our premises and physical and electronic security of our information technology systems. While we have confidence in these individuals, organizations and systems, agreements or security measures may be breached, and we may not have adequate remedies for any breach. In addition, our trade secrets may otherwise become known or be independently discovered by competitors. To the extent that our commercial partners, collaborators, employees and consultants use intellectual property owned by others in their work for us, disputes may arise as to the rights in related or resulting know-how and inventions.
Government Regulation and Product Approval
Regulations
Clinical Laboratory Improvement Amendments of 1988
As a clinical reference laboratory, we are required to hold certain federal, state and local licenses, certifications and permits to conduct our business. Under CLIA, we are required to hold a certificate applicable to the type of laboratory tests we perform and to comply with standards applicable to our operations, including test processes, personnel, facilities administration, equipment maintenance, recordkeeping, quality systems and proficiency testing. We must maintain CLIA compliance and certification to be eligible to bill for diagnostic services provided to Medicare beneficiaries.
29
To renew our CLIA certificate, we are subject to survey and inspection every two years to assess compliance with program standards. Because we are a College of American Pathologists, or CAP, accredited laboratory, CMS does not perform this survey and inspection and relies on our CAP survey and inspection. We may also be subject to additional unannounced inspections. The regulatory and compliance standards applicable to the testing we perform may change over time, and any such changes could have a material effect on our business.
Penalties for non-compliance with CLIA requirements include suspension, limitation or revocation of the laboratory’s CLIA certificate, as well as directed plan of correction, state on-site monitoring, civil money penalties, civil injunctive suit or criminal penalties.
State Laboratory Licensing
In addition to federal certification requirements of laboratories under CLIA, CLIA provides that states may adopt laboratory regulations and licensure requirements that are more stringent than those under federal law. Such laws, among other things, establish standards for the day-to-day operation of a clinical reference laboratory, including the training and skills required of personnel and quality control. We currently provide laboratory services in all 50 states and maintain out-of-state laboratory licenses in New York, California, Maryland, Pennsylvania and Rhode Island.
Multiple states require the licensure of out-of-state laboratories that accept specimens from those states. Because we receive specimens from New York, our clinical reference laboratory is required to be licensed by New York, under New York laws and regulations. New York law also mandates proficiency testing for laboratories licensed under New York state law, regardless of whether such laboratories are located in New York. If a laboratory is out of compliance with New York statutory or regulatory standards, the New York Department of Health, or NYSDOH, may suspend, limit, revoke or annul the laboratory’s New York license, censure the holder of the license, or assess civil money penalties. We have received written approval from NYSDOH to offer our proprietary DecisionDx-Melanoma DecisionDx-UM and DecisionDx-PRAME products in New York. If we were to be found out of compliance with New York laboratory requirements, we could be subject to such sanctions, which could harm our business.
Federal Oversight of Laboratory Developed Tests
The laws and regulations governing the marketing of diagnostic products are evolving, extremely complex, and in many instances, there are no significant regulatory or judicial interpretations of these laws and regulations. Clinical laboratory tests are regulated under CLIA, as administered by CMS, as well as by applicable state laws. In addition, the Federal Food, Drug and Cosmetic Act, or FDCA, defines a medical device to include any instrument, apparatus, implement, machine, contrivance, implant, in vitro reagent, or other similar or related article, including a component part, or accessory, intended for use in the diagnosis of disease or other conditions, or in the cure, mitigation, treatment, or prevention of disease, in man or other animals. Our in vitro testing products are considered by the FDA to be subject to regulation as medical devices. Among other things, pursuant to the FDCA and its implementing regulations, the FDA regulates the research, testing, manufacturing, safety, labeling, storage, recordkeeping, pre-market clearance or approval, marketing and promotion, and sales and distribution of medical devices in the United States to ensure that medical products distributed domestically are safe and effective for their intended uses. In addition, the FDA regulates the export of medical devices manufactured in the United States to international markets.
Although the FDA has statutory authority to assure that medical devices are safe and effective for their intended uses, the FDA has generally exercised its enforcement discretion and not enforced applicable regulations with respect to in vitro diagnostics that are designed, manufactured, and used within a single laboratory for use only in that laboratory. These tests are referred to as LDTs. As a result, we believe our diagnostic services are currently subject to the FDA’s enforcement discretion and are not subject to the FDA’s oversight. However, reagents, instruments, software or components provided by third parties and used to perform LDTs may be subject to regulation.
In recent years, FDA has stated its intention to modify its enforcement discretion policy with respect to LDTs. For example, on July 31, 2014, the FDA notified Congress of its intent to modify, in a risk-based manner, its policy of enforcement discretion with respect to LDTs. On October 3, 2014, the FDA issued two draft guidance documents entitled “Framework for Regulatory Oversight of Laboratory Developed Tests (LDTs),” or the Framework Guidance, and “FDA Notification and Medical Device Reporting for Laboratory Developed Tests (LDTs),” or the Reporting Guidance. The Framework Guidance states that FDA intends to modify its policy of enforcement discretion with respect to LDTs in a risk-based manner consistent with the classification of medical devices generally in Classes I through III. The Reporting Guidance would further enable FDA to collect information regarding the LDTs currently being offered for clinical use through a notification process, as well as to enforce its regulations for reporting safety issues and collecting information on any known or suspected adverse events related to the use of an LDT.
Although the FDA halted finalization of the guidance in November 2016 to allow for further public discussion on an appropriate oversight approach to LDTs and to give congressional authorizing committees the opportunity to develop a
30
legislative solution, the FDA could ultimately modify its current approach to LDTs in a way that would subject our products marketed as LDTs to the enforcement of regulatory requirements.
Medical Device Regulatory Framework
Although we currently market our proprietary testing products as LDTs, which are currently subject to enforcement discretion, we could be subject to more onerous FDA compliance obligations in the future. Specifically, if the FDA begins to actively regulate LDTs, then, unless an exemption applies, each new or significantly modified medical device we seek to commercially distribute in the United States will require either a premarket notification to the FDA requesting permission for commercial distribution under Section 510(k) of the FDCA, also referred to as a 510(k) clearance, or approval from the FDA of a premarket approval, or PMA, application. Both the 510(k) clearance and PMA processes can be resource intensive, expensive, and lengthy, and require payment of significant user fees.
Device Classification
Under the FDCA, medical devices are classified into one of three classes-Class I, Class II or Class III depending on the degree of risk associated with each medical device and the extent of control needed to provide reasonable assurances with respect to safety and effectiveness.
Class I includes devices with the lowest risk to the patient and are those for which safety and effectiveness can be reasonably assured by adherence to a set of FDA regulations, referred to as the General Controls for Medical Devices, which require compliance with the applicable portions of the FDA’s Quality System Regulation, facility registration and product listing, reporting of adverse events and malfunctions, and appropriate, truthful and non-misleading labeling and promotional materials. Some Class I devices also require premarket clearance by the FDA through the 510(k) premarket notification process described below. Most Class I products are exempt from the premarket notification requirements.
Class II devices are those that are subject to the General Controls, and Special Controls as deemed necessary by the FDA to ensure the safety and effectiveness of the device. These Special Controls can include performance standards, patient registries, FDA guidance documents and post-market surveillance. Most Class II devices are subject to premarket review and clearance by the FDA. Premarket review and clearance by the FDA for Class II devices is accomplished through the 510(k) premarket notification process.
Class III devices include devices deemed by the FDA to pose the greatest risk such as life-supporting or life-sustaining devices, or implantable devices, in addition to those deemed novel and not substantially equivalent following the 510(k) process. The safety and effectiveness of Class III devices cannot be reasonably assured solely by the General Controls and Special Controls described above. Therefore, these devices are subject to the PMA application process, which is generally more costly and time-consuming than the 510(k) process. Through the PMA application process, the applicant must submit data and information demonstrating reasonable assurance of the safety and effectiveness of the device for its intended use to the FDA’s satisfaction. Accordingly, a PMA typically includes, but is not limited to, extensive technical information regarding device design and development, pre-clinical and clinical trial data, manufacturing information, labeling and financial disclosure information for the clinical investigators in device studies. The PMA application must provide valid scientific evidence that demonstrates to the FDA’s satisfaction a reasonable assurance of the safety and effectiveness of the device for its intended use.
The Investigational Device Process
In the United States, absent certain limited exceptions, human clinical trials intended to support medical device clearance or approval require an investigational device exemption, or IDE, application. Some types of studies deemed to present “non-significant risk” are deemed to have an approved IDE once certain requirements are addressed and Institutional Review Board, or IRB, approval is obtained. If the device presents a “significant risk” to human health, as defined by the FDA, the sponsor must submit an IDE application to the FDA and obtain IDE approval prior to commencing the human clinical trials. The IDE application must be supported by appropriate data, such as animal and laboratory testing results, showing that it is safe to test the device in humans and that the testing protocol is scientifically sound. Generally, clinical trials for a significant risk device may begin once the IDE application is approved by the FDA and the study protocol and informed consent are approved by appropriate IRBs at the clinical trial sites. Submission of an IDE will note necessarily result in the ability to commence clinical trials, and although the FDA’s approval of an IDE allows clinical testing to go forward for a specified number of subjects, it does not bind the FDA to accept the results of the trial as sufficient to prove the product’s safety and efficacy, even if the trial meets its intended success criteria.
All clinical trials must be conducted in accordance with the FDA’s IDE regulations that govern investigational device labeling, prohibit promotion and specify an array of recordkeeping, reporting and monitoring responsibilities of study sponsors and study investigators. Clinical trials must further comply with the FDA’s good clinical practice regulations for IRB approval and for informed consent and other human subject protections. Required records and reports are subject to inspection by the FDA. The results of clinical testing may be unfavorable, or, even if the intended safety and efficacy success criteria are achieved, may not
31
be considered sufficient for the FDA to grant marketing approval or clearance of a product. The commencement or completion of any clinical trial may be delayed or halted, or be inadequate to support approval of a PMA application, for numerous reasons.
The 510(k) Clearance Process
Under the 510(k) clearance process, the manufacturer must submit to the FDA a premarket notification, demonstrating that the device is “substantially equivalent” to a legally marketed predicate device. A predicate device is a legally marketed device that is not subject to a PMA, i.e., a device that was legally marketed prior to May 28, 1976 (pre-amendments device) and for which a PMA is not required, a device that has been reclassified from Class III to Class II or I, or a device that was previously found substantially equivalent through the 510(k) process. To be “substantially equivalent,” the proposed device must have the same intended use as the predicate device, and either have the same technological characteristics as the predicate device or have different technological characteristics and not raise different questions of safety or effectiveness than the predicate device. Clinical data is sometimes required to support substantial equivalence.
After a 510(k) premarket notification is submitted, the FDA determines whether to accept it for substantive review. If it lacks necessary information for substantive review, the FDA will refuse to accept the 510(k) notification. If it is accepted for filing, the FDA begins a substantive review. By statute, the FDA is required to complete its review of a 510(k) notification within 90 days of receiving the 510(k) notification. As a practical matter, clearance often takes longer, and clearance is never assured. Although many 510(k) premarket notifications are cleared without clinical data, the FDA may require further information, including clinical data, to make a determination regarding substantial equivalence, which may significantly prolong the review process. If the FDA agrees that the device is substantially equivalent, it will grant clearance to commercially market the device.
If the FDA determines that the device is not “substantially equivalent” to a predicate device, or if the device is automatically classified into Class III, the device sponsor must then fulfill the much more rigorous premarketing requirements of the PMA approval process, or seek reclassification of the device through the de novo process. The de novo classification process is an alternate pathway to classify medical devices that are automatically classified into Class III, but which are low to moderate risk. A manufacturer can submit a petition for direct de novo review if the manufacturer is unable to identify an appropriate predicate device and the new device or new use of the device presents a moderate or low risk. De novo classification may also be available after receipt of a “not substantially equivalent” letter following submission of a 510(k) to FDA.
After a device receives 510(k) clearance, any modification that could significantly affect its safety or effectiveness, or that would constitute a new or major change in its intended use, will require a new 510(k) clearance or, depending on the modification, could require a PMA application. The FDA requires each manufacturer to determine whether the proposed change requires a new submission in the first instance, but the FDA can review any such decision and disagree with a manufacturer’s determination. Many minor modifications are accomplished by a letter-to-file in which the manufacture documents the change in an internal letter-to-file. The letter-to-file is in lieu of submitting a new 510(k) to obtain clearance for such change. The FDA can always review these letters to file in an inspection. If the FDA disagrees with a manufacturer’s determination regarding whether a new premarket submission is required for the modification of an existing 510(k)-cleared device, the FDA can require the manufacturer to cease marketing and/or recall the modified device until 510(k) clearance or approval of a PMA application is obtained. In addition, in these circumstances, the FDA can impose significant regulatory fines or penalties for failure to submit the requisite application(s).
The PMA Approval Process
Following receipt of a PMA application, the FDA conducts an administrative review to determine whether the application is sufficiently complete to permit a substantive review. If it is not, the agency will refuse to file the PMA. If it is, the FDA will accept the application for filing and begin the review. The FDA has 180 days to review a filed PMA application, although the review of an application more often occurs over a significantly longer period of time. During this review period, the FDA may request additional information or clarification of information already provided, and the FDA may issue a major deficiency letter to the applicant, requesting the applicant’s response to deficiencies communicated by the FDA.
Before approving or denying a PMA, an FDA advisory committee may review the PMA at a public meeting and provide the FDA with the committee’s recommendation on whether the FDA should approve the submission, approve it with specific conditions, or not approve it. The FDA is not bound by the recommendations of an advisory committee, but it considers such recommendations carefully when making decisions.
Prior to approval of a PMA, the FDA may conduct inspections of the clinical trial data and clinical trial sites, as well as inspections of the manufacturing facility and processes. Overall, the FDA review of a PMA application generally takes between one and three years but may take significantly longer. The FDA can delay, limit or deny approval of a PMA application for many reasons, including:
|
•
|
the device may not be shown safe or effective to the FDA’s satisfaction;
|
|
•
|
the data from pre-clinical studies and/or clinical trials may be found unreliable or insufficient to support approval;
|
32
|
•
|
the manufacturing process or facilities may not meet applicable requirements; and
|
|
•
|
changes in FDA approval policies or adoption of new regulations may require additional data.
|
If the FDA evaluation of a PMA is favorable, the FDA will issue either an approval letter, or an approvable letter, the latter of which usually contains a number of conditions that must be met in order to secure final approval of the PMA. When and if those conditions have been fulfilled to the satisfaction of the FDA, the agency will issue a PMA approval letter authorizing commercial marketing of the device, subject to the conditions of approval and the limitations established in the approval letter. If the FDA’s evaluation of a PMA application or manufacturing facilities is not favorable, the FDA will deny approval of the PMA or issue a not approvable letter. The FDA also may determine that additional tests or clinical trials are necessary, in which case the PMA approval may be delayed for several months or years while the trials are conducted and data is submitted in an amendment to the PMA, or the PMA is withdrawn and resubmitted when the data are available. The PMA process can be expensive, uncertain and lengthy and a number of devices for which the FDA approval has been sought by other companies have never been approved by the FDA for marketing.
New PMA applications or PMA supplements are required for modification to the manufacturing process, equipment or facility, quality control procedures, sterilization, packaging, expiration date, labeling, device specifications, ingredients, materials or design of a device that has been approved through the PMA process. PMA supplements often require submission of the same type of information as an initial PMA application, except that the supplement is limited to information needed to support any changes from the device covered by the approved PMA application and may or may not require as extensive technical or clinical data or the convening of an advisory panel, depending on the nature of the proposed change.
In approving a PMA application, as a condition of approval, the FDA may also require some form of post-approval study or post-market surveillance, whereby the applicant conducts a follow-up study or follows certain patient groups for a number of years and makes periodic reports to the FDA on the clinical status of those patients when necessary to protect the public health or to provide additional or longer term safety and effectiveness data for the device. The FDA may also approve a PMA application with other post-approval conditions intended to ensure the safety and effectiveness of the device, such as, among other things, restrictions on labeling, promotion, sale, distribution and use. New PMA applications or PMA supplements may also be required for modifications to any approved diagnostic tests, including modifications to our manufacturing processes, device labeling and device design, based on the findings of post-approval studies.
Federal and State Physician Self-Referral Prohibitions
We are subject to the federal physician self-referral prohibitions, commonly known as the Stark Law, and to comparable state laws. Together these restrictions generally prohibit us from billing a patient or any governmental or private payer for certain designated health services, including clinical laboratory services, when the physician ordering the service, or any member of such physician’s immediate family, has a financial interest, such as an ownership or investment interest in or compensation arrangement with us, unless the arrangement meets an exception to the prohibition.
Sanctions for a Stark Law violation include the following:
|
•
|
denial of payment for the services provided in violation of the prohibition;
|
|
•
|
refunds of amounts collected by an entity in violation of the Stark Law;
|
|
•
|
a civil penalty for each bill or claim for a service arising out of the prohibited referral;
|
|
•
|
the imposition of up to three times the amounts for each item or service wrongfully claimed;
|
|
•
|
possible exclusion from federal healthcare programs, including Medicare and Medicaid; and
|
|
•
|
a civil penalty for each arrangement or scheme that the parties know (or should know) has the principal purpose of circumventing the Stark Law’s prohibition.
|
These prohibitions apply regardless of any intent by the parties to induce or reward referrals or the reasons for the financial relationship and the referral. In addition, knowing violations of the Stark Law may also serve as the basis for liability under the federal False Claims Act, or the FCA, which can result in additional civil and criminal penalties.
Federal and State Anti-Kickback Laws
The federal Anti-Kickback Statute, or the AKS, makes it a felony for a person or entity, including a clinical laboratory, to knowingly and willfully offer, pay, solicit or receive any remuneration, directly or indirectly, overtly or covertly, in cash or in kind, in order to induce business that is reimbursable under any federal health care program. A violation of the AKS may result in imprisonment for up to ten years and fines for each violation and administrative civil money penalties, including an additional amount of up to three times the amount of the remuneration paid. Convictions under the AKS result in mandatory exclusion from federal health care programs for a minimum of five years. In addition, The U.S. Department of Health and
33
Human Services, or HHS, has the authority to impose civil assessments and fines and to exclude health care providers and others engaged in prohibited activities from Medicare, Medicaid and other federal health care programs. In addition, the government may assert that a claim that includes items or services resulting from a violation of the AKS constitutes a false or fraudulent claim under the FCA, which is discussed in greater detail below. Additionally, a person or entity does not need to have actual knowledge of the statute or specific intent to violate it in order to have committed a violation.
Although the AKS applies only to items and services reimbursable under any federal health care program, a number of states have passed statutes substantially similar to the AKS that apply to all payors. Penalties of such state laws include imprisonment and significant monetary fines.
Federal and state law enforcement authorities scrutinize arrangements between health care providers and potential referral sources to ensure that the arrangements are not designed as a mechanism to induce patient care referrals or induce the purchase or prescribing of particular products or services. Generally, courts have taken a broad interpretation of the scope of the AKS, holding that the statute may be violated if merely one purpose of a payment arrangement is to induce referrals or purchases.
In addition to statutory exceptions to the AKS, regulations provide for a number of safe harbors. If an arrangement meets the provisions of a safe harbor, it is deemed not to violate the AKS. An arrangement must fully comply with each element of an applicable safe harbor in order to qualify for protection.
Failure to meet the requirements of the safe harbor, however, does not render an arrangement illegal. Rather, the government may evaluate such arrangements on a case-by-case basis, taking into account all facts and circumstances.
Other Federal and State Health Care Laws
In addition to the requirements discussed above, several other health care fraud and abuse laws could have an effect on our business. For example, provisions of the Social Security Act permit Medicare and Medicaid to exclude an entity that charges the federal health care programs substantially in excess of its usual charges for its services. The terms “usual charge” and “substantially in excess” are subject to varying interpretations.
The FCA prohibits, among other things, a person from knowingly presenting, or causing to be presented, a false or fraudulent claim for payment or approval and from, making, using, or causing to be made or used, a false record or statement material to a false or fraudulent claim in order to secure payment or retaining an overpayment by the federal government. In addition to actions initiated by the government itself, the statute authorizes actions to be brought on behalf of the federal government by a private party having knowledge of the alleged fraud. Because the complaint is initially filed under seal, the action may be pending for some time before the defendant is even aware of the action. If the government intervenes and is ultimately successful in obtaining redress in the matter or if the plaintiff succeeds in obtaining redress without the government’s involvement, then the plaintiff will receive a percentage of the recovery. Finally, the Social Security Act includes its own provisions that prohibit the filing of false claims or submitting false statements in order to obtain payment. Several states have enacted comparable false claims laws which may be broader in scope and apply regardless of payor.
The civil monetary penalties statute imposes penalties against any person or entity that, among other things, is determined to have presented or caused to be presented a claim to a federal health program that the person knows or should know is for an item or service that was not provided as claimed or is false or fraudulent. A person who offers or provides to a Medicare or Medicaid beneficiary any remuneration, including waivers of co-payments and deductible amounts (or any part thereof), that the person knows or should know is likely to influence the beneficiary’s selection of a particular provider, practitioner or supplier of Medicare or Medicaid payable items or services may be liable under the civil monetary penalties statute. Moreover, in certain cases, providers who routinely waive copayments and deductibles for Medicare and Medicaid beneficiaries, for example, in connection with patient assistance programs, can also be held liable under the AKS and False Claims Act. One of the statutory exceptions to the prohibition is non-routine, unadvertised waivers of copayments or deductible amounts based on individualized determinations of financial need or exhaustion of reasonable collection efforts. The Office of Inspector General of HHS, or OIG, emphasizes, however, that this exception should only be used occasionally to address special financial needs of a particular patient. Although this prohibition applies only to federal healthcare program beneficiaries, applicable state laws related to, among other things, unlawful schemes to defraud, excessive fees for services, tortious interference with patient contracts and statutory or common law fraud, may also be implicated for similar practices offered to patients covered by commercial payor.
The federal Health Insurance Portability and Accountability Act of 1996, or HIPAA, created new federal criminal statutes that prohibit, among other actions, knowingly and willfully executing, or attempting to execute, a scheme to defraud any healthcare benefit program, including private third-party payors, and knowingly and willfully falsifying, concealing or covering up a material fact or making any materially false, fictitious or fraudulent statement in connection with the delivery of or payment for healthcare benefits, items or services. Like the AKS, a person or entity does not need to have actual knowledge of the statute or specific intent to violate it in order to have committed a violation.
34
The Physician Payments Sunshine Act, enacted as part of the ACA, as amended among other things, also imposed annual reporting requirements on manufacturers of certain devices, drugs and biologics for certain payments and transfers of value by them and in some cases their distributors to physicians and teaching hospitals, and certain other healthcare professionals as of January 1, 2022; as well as ownership and investment interests held by physicians and their immediate family members. Any failure to comply with these reporting requirements could result in significant fines and penalties. Because we manufacture our own LDTs solely for use by or within our own laboratory, we believe that we are exempt from these reporting requirements. We cannot assure you, however, that the government will agree with our determination, and a determination that we have violated these laws and regulations, or a public announcement that we are being investigated for possible violations, could adversely affect our business, prospects, results of operations or financial condition.
State equivalents of each of the above federal laws, such as anti-kickback and false claims laws, that may impose similar or more prohibitive restrictions, and may apply to items or services reimbursed by non-governmental third-party payors, including private insurers.
If our operations are found to be in violation of any of the fraud and abuse laws described above or any other laws that apply to us, we may be subject to penalties, including potentially significant criminal, civil and administrative penalties, damages, fines, disgorgement, imprisonment, exclusion from participation in government healthcare programs, contractual damages, reputational harm, integrity oversight and reporting obligations, diminished profits and future earnings, and the curtailment or restructuring of our operations.
International Regulations
Many countries in which we may offer any of our testing products in the future have anti-kickback regulations prohibiting providers from offering, paying, soliciting or receiving remuneration, directly or indirectly, in order to induce business that is reimbursable under any national health care program. In situations involving physicians employed by state-funded institutions or national health care agencies, violation of the local anti-kickback law may also constitute a violation of the U.S. Foreign Corrupt Practices Act, or FCPA.
The FCPA prohibits any U.S. individual, business entity or employee of a U.S. business entity to offer or provide, directly or through a third party, including any potential distributors we may rely on in certain markets, anything of value to a foreign government official with corrupt intent to influence an award or continuation of business or to gain an unfair advantage, whether or not such conduct violates local laws. In addition, it is illegal for a company that reports to the SEC to have false or inaccurate books or records or to fail to maintain a system of internal accounting controls. We will also be required to maintain accurate information and control over sales and distributors’ activities that may fall within the purview of the FCPA, its books and records provisions and its anti-bribery provisions.
The standard of intent and knowledge in the Anti-Bribery cases is minimal-intent and knowledge are usually inferred from that fact that bribery took place. The accounting provisions do not require intent. Violations of the FCPA’s anti-bribery provisions for corporations and other business entities are subject to a fine of up to $2 million and officers, directors, stockholders, employees, and agents are subject to a fine of up to $100,000 and imprisonment for up to five years. Other countries, including the United Kingdom and other OECD Anti-Bribery Convention members, have similar anti-corruption regulations, such as the United Kingdom Anti-Bribery Act.
When marketing our testing products outside of the United States, we may be subject to foreign regulatory requirements governing human clinical testing, prohibitions on the import of tissue necessary for us to perform our testing products or restrictions on the export of tissue imposed by countries outside of the United States or the import of tissue into the United States, and marketing approval. These requirements vary by jurisdiction, differ from those in the United States and may in some cases require us to perform additional pre-clinical or clinical testing. In many countries outside of the United States, coverage, pricing and reimbursement approvals are also required.
Privacy and Security Laws
Health Insurance Portability and Accountability Act
Under HIPAA, as amended by the Health Information Technology for Economic and Clinical Health Act, or HITECH, HHS has issued regulations to protect the privacy and provide for the security of protected health information, or PHI, used or disclosed by certain entities including health care providers, such as us. HIPAA also regulates standardization of data content, codes and formats used in certain health care transactions and standardization of identifiers for health plans and providers. Penalties for violations of HIPAA and HITECH laws and regulations include significant civil and criminal penalties.
Three standards have been promulgated under HIPAA’s and HITECH’s regulations: the Standards for Privacy of Individually Identifiable Health Information, which restrict the use and disclosure of certain individually identifiable health information, the Standards for Electronic Transactions, which establish standards for common healthcare transactions, such as claims information, plan eligibility, payment information and the use of electronic signatures, and the Security Standards for the
35
Protection of Electronic Protected Health Information, which require covered entities and business associates to implement and maintain certain security measures to safeguard certain electronic health information, including the adoption of administrative, physical and technical safeguards to protect such information.
The HIPAA privacy regulations cover the use and disclosure of PHI by covered entities as well as business associates, which are defined to include subcontractors that create, receive, maintain, or transmit PHI on behalf of a business associate. They also set forth certain rights that an individual has with respect to his or her PHI maintained by a covered entity, including the right to access or amend certain records containing PHI, or to request restrictions on the use or disclosure of PHI. The HIPAA security regulations establish requirements for safeguarding the confidentiality, integrity, and availability of PHI that is electronically transmitted or electronically stored. HITECH, among other things, established certain health information security breach notification requirements. A covered entity must notify any individual whose PHI is breached according to the specifications set forth in the breach notification rule. The HIPAA privacy and security regulations establish a uniform federal “floor” and do not preempt state laws that are more stringent or provide individuals with greater rights with respect to the privacy or security of, and access to, their records containing PHI or insofar as such state laws apply to personal information that is broader in scope than PHI.
Individuals (or their personal representatives, as applicable) have the right to access test reports directly from laboratories and to direct that copies of those reports be transmitted to persons or entities designated by the individual.
HIPAA authorizes state attorneys general to file suit on behalf of their residents for violations. Courts are able to award damages, costs and attorneys’ fees related to violations of HIPAA in such cases. While HIPAA does not create a private right of action allowing individuals to file suit against us in civil court for violations of HIPAA, its standards have been used as the basis for duty of care cases in state civil suits such as those for negligence or recklessness in the misuse or breach of PHI. In addition, HIPAA mandates that the Secretary of HHS conduct periodic compliance audits of HIPAA covered entities, such as us, and their business associates for compliance with the HIPAA privacy and security standards. It also tasks HHS with establishing a methodology whereby harmed individuals who were the victims of breaches of unsecured PHI may receive a percentage of the civil monetary penalty paid by the violator.
As a covered entity with downstream vendors and subcontractors and, in certain instances, as a business associate of other covered entities with whom we have entered into a business associate agreement, we have certain obligations under HIPAA regarding the use and disclosure of any PHI that may be provided to us. HIPAA and HITECH impose civil and criminal penalties against covered entities and business associates for noncompliance with privacy and security requirements. Further, various states, such as California and Massachusetts, have implemented similar privacy laws and regulations that impose restrictive requirements regulating the use and disclosure of health information and other personally identifiable information.
Numerous other federal, state and foreign laws, including consumer protection laws and regulations, govern the collection, dissemination, use, access to, confidentiality and security of patient health information. We intend to continue to comprehensively protect all personal information and to comply with all applicable laws regarding the protection of such information.
Reimbursement for Clinical Laboratory Services
We generate revenue on our products from several sources, including third-party payors, laboratory services intermediaries, and self-paying individuals. Depending on the billing arrangement and applicable law, we must bill various third-party payors, such as insurance companies, Medicare, Medicaid, and patients, all of which have different billing requirements. Compliance with applicable laws and regulations as well as internal compliance policies and procedures adds further complexity to the billing process. CMS establishes new procedures and continuously evaluates and implements changes to the reimbursement process for billing the Medicare program.
To receive reimbursement from third-party payors, we bill our tests using a variety of CPT codes, as defined by the AMA. For many of the genetic tests we conduct, there may not be an appropriate CPT code for some of the genes in a panel, in which case the test may be billed under a miscellaneous code for an unlisted molecular pathology procedure. Because these miscellaneous codes do not describe a specific service, the third-party payor claim may need to be examined to determine the service that was provided, whether the service was appropriate and medically necessary and whether payment should be rendered. This process can require a letter of medical necessity from the ordering physician and it can result in a delay in processing the claim, a lower reimbursement amount, or denial of the claim.
With the evolution of genetic testing, we have seen individual third-party payors’ medical coverage policies around the CPT codes we bill and their associated payment rates change over time, resulting in changes to our reimbursement revenues. We believe all of our products provide significant clinical value and reduction in downstream healthcare spend, as evidenced in research studies and clinical publications, which we believe will continue to support and drive third-party payor reimbursement.
36
Under Medicare, payment for our laboratory tests are generally made under the
Clinical Laboratory Fee Schedule, or
CLFS, with payment amounts assigned to specific procedure billing codes. In April 2014, Congress passed the Protecting Access to Medicare Act (PAMA), which included substantial changes to the way in which clinical laboratory services will be paid under Medicare. Under PAMA, laboratories that receive the majority of their Medicare revenue from payments made under the CLFS or the Physician Fee Schedule are required to report to CMS, beginning in 2017 and every three years thereafter (or annually for ADLTs), private payor payment rates and volumes for their tests. Laboratories that fail to report the required payment information may be subject to substantial civil monetary penalties. As required under PAMA, CMS will use the rates and volumes reported by laboratories to develop Medicare payment rates for laboratory tests equal to the volume-weighted median of the private payor payment rates for the tests. On June 23, 2016, CMS published the final rule implementing the reporting and rate-setting requirements under PAMA.
As set forth under PAMA, for tests furnished on or after January 1, 2018, Medicare payments for clinical diagnostic laboratory tests will be paid based upon these reported private payor rates. For clinical diagnostic laboratory tests that are assigned a new or substantially revised CPT code, initial payment rates will be assigned by the gap-fill methodology, as under prior law. Initial payment rates for new ADLTs will be based on the actual list charge for the laboratory test.
The payment rates calculated under PAMA became effective on January 1, 2018. Any reductions to payment rates resulting from the new methodology are limited to 10% per test per year in each of the years 2018 through 2020 and to 15% per test per year in each of the years 2021 through 2023.
On May 17, 2019, CMS determined that DecisionDx-UM meets the criteria for “existing ADLT” status. This means that beginning in 2021, the DecisionDx-UM Medicare rate will be set annually based upon the median private payor rate for the first half of the second preceding calendar year. Specifically, the median private payor rate from January 1 to June 30, 2019 will be used to set the Medicare rate for the calendar year 2021. We successfully submitted this data in January 2020. Note that our rate for 2020 will be set by Noridian, our local MAC.
Also, on May 17, 2019, CMS determined that DecisionDx-Melanoma meets the criteria for “new ADLT” status. This means that from July 1, 2019 through March 31, 2020 the Medicare reimbursement rate will equal the initial list price of $7,193.00, subject to the possible recoupment provision described below. The rate for April 1, 2020 through December 31, 2021 will be calculated based upon the median private payor rate from July 1, 2019 to November 30, 2019. We successfully submitted this data in December 2019. Note that for DecisionDx-Melanoma tests reported for July 1, 2019 through March 31, 2020, CMS has the right to recoup the difference between the actual list and 130% of the weighted median if the original list price was greater than 130% of the weighted median of private payor rates.
However, based on the data we collected and submitted to CMS during the data collection period ended November 30, 2019, the original list price amount was not greater than 130% of the weighted median of private payor rates. Therefore, we expect no recoupment to apply under this provision. Beginning in 2022,
the rate will be set annually based upon the median private payor rate for the first half of the second preceding calendar year. For example, the rate for 2022 will be set using median private payor rate data from January 1, 2020 to June 30, 2020.
PAMA also authorizes the adoption of new, temporary billing codes and/or unique test identifiers for FDA-cleared or approved tests as well as ADLTs. The AMA’s CPT Editorial Panel has approved a proposal to create a new section of billing codes to facilitate implementation of this section of PAMA. These proprietary laboratory analyses codes may be requested by a clinical laboratory or manufacturer to specifically identify their test. If approved, the codes are issued by the AMA on a quarterly basis. Our DecisionDx-UM test was granted a Category I MAAA CPT code and was effective January 1, 2020. Our DecisionDx-Melanoma test was granted a Category I MAAA CPT code that will be effective January 1, 2021.
Healthcare Reform
In March 2010, the Patient Protection and Affordable Care Act of 2010, as amended by the Health Care and Education Reconciliation Act of 2010, collectively the ACA, was enacted in the U.S. The ACA made a number of substantial changes to the way healthcare is financed both by governmental and private insurers. There remain judicial and Congressional challenges to certain aspects of the ACA, as well as efforts by the current administration to repeal or replace certain aspects of the ACA. For example, the ACA required each medical device manufacturer to pay a sales tax equal to 2.3% of the price for which such manufacturer sells its medical devices. However, the 2020 federal spending package permanently eliminated, effective January 1, 2020, the ACA-mandated medical device tax and “Cadillac” tax on high-cost employer-sponsored health coverage and, effective January 1, 2021, also eliminates the health insurer tax. The ACA also contains a number of other provisions, including provisions governing enrollment in federal and state healthcare programs, reimbursement matters and fraud and abuse, which we expect will impact our industry and our operations in ways that we cannot currently predict.
On December 14, 2018, a U.S. District Court Judge in the Northern District of Texas, or Texas District Court Judge, ruled that the entire ACA is invalid based primarily on the fact that the Tax Cuts and Jobs Act of 2017, or the TCJA, repealed the tax-based shared responsibility payment imposed by the ACA, on certain individuals who fail to maintain qualifying health coverage for all or part of a year, which is commonly referred to as the “individual mandate”. Additionally, on December 18,
37
2019, the U.S. Court of Appeals for the 5th Circuit ruled that the individual mandate was unconstitutional and remanded the case back to the District Court to determine whether the remaining provisions of the ACA are invalid as well. On March 2, 2020, the United States Supreme Court granted the petitions for writs of certiorari to review this case and has allotted one hour for oral arguments. It is unclear when such oral arguments are to be held and when a decision is expected to be made. It is also unclear how such litigation and other efforts to repeal and replace the ACA will impact the ACA.
Employees
As of December 31, 2019, we had 135 employees, of whom 133 were full-time employees. Our employees are not represented by labor unions or covered by collective bargaining agreements. We consider our relationship with our employees to be good.
Corporate and Other Information
We were incorporated in Delaware in September 2007. Our principal executive offices are located at 820 S. Friendswood Drive, Suite 201, Friendswood, Texas 77456 and our telephone number is (866) 788-9007. Our corporate website address is www.CastleBiosciences.com. Information contained on or accessible through our website is not considered part of this Annual Report on Form 10-K or our other filings with the SEC. Our Annual Reports on Form 10-K, Quarterly Reports on Form 10-Q, Current Reports on Form 8-K and amendments to such reports filed or furnished pursuant to Section 13(a) and 15(d) of the Securities Exchange Act of 1934, as amended, or the Exchange Act, are available free of charge on our website as soon as reasonably practicable after we electronically file such material with, or furnish it to, the SEC.
This Annual Report on Form 10-K contains references to our trademarks and to trademarks belonging to other entities. Solely for convenience, trademarks and trade names referred to in this Annual Report on Form 10-K, including logos, artwork and other visual displays, may appear without the ® or TM symbols, but such references are not intended to indicate, in any way, that their respective owners will not assert, to the fullest extent under applicable law, their rights thereto. We do not intend our use or display of other companies’ trade names or trademarks to imply a relationship with, or endorsement or sponsorship of us by, any other companies.
38
Item 1A. Risk Factors.
You should consider carefully the risks described below, as well as the other information in this Annual Report on Form 10‑K, before deciding whether to purchase, hold or sell shares of our common stock. The occurrence of any of the following risks could harm our business, financial condition, results of operations and/or growth prospects or cause our actual results to differ materially from those contained in forward-looking statements we have made in this report and those we may make from time to time. You should consider all of the factors described as well as the other information in the 10-K, including our financial statements and the related notes and “Management’s Discussion and Analysis of Financial Condition and Results of Operations” when evaluating our business. If any of the following risks actually occur, our business, financial condition, results of operations and future growth prospects could be materially and adversely affected. In these circumstances, the market price of our common stock could decline and you may lose all or part of your investments. Additional risks and uncertainties not presently known to us or that we currently deem immaterial also may impair our business operations.
Risks Related to Our Financial Condition
Our reliance upon a small number of third-party payors for a significant portion of our revenue may materially adversely affect our financial condition and results of operations.
We receive a substantial portion of our revenue from a small number of third-party payors, primarily Medicare and United Healthcare. Our revenue for our test reports provided for patients covered by Medicare and United Healthcare as a percentage of total revenue, was
49%
and
6%
, respectively, for the year ended December 31, 2019, and
36%
and
12%
, respectively, for the year ended December 31, 2018. In addition, our current accounts receivable balances for Medicare and United Healthcare, as a percentage of our total current accounts receivable, were
7%
and
9%
, respectively, as of December 31, 2019, and
54%
and
7%
, respectively, as of December 31, 2018. There were no long-term accounts receivable balances for Medicare and United Healthcare as of December 31, 2019, but long-term accounts receivable for Medicare and United Healthcare as a percentage of total long-term accounts receivable were and
0%
and
15%
, respectively, as of December 31, 2018. If our largest current payors were to significantly reduce, or cease to pay, the amount they reimburse for our products, or if they do not reach favorable coverage and reimbursement decisions for our products, or attempt to recover amounts they had already paid, it could have a material adverse effect on our business, financial condition and results of operations and cause significant fluctuations in our results of operations.
Due to how we recognize revenue, our quarterly revenues may not reflect our underlying business.
We have concluded that our contracts include variable consideration because the amounts paid by Medicare or commercial health insurance carriers may be paid at less than our standard rates or not paid at all, with such differences considered implicit price concessions. Variable consideration attributable to these price concessions is measured at the expected value using the ‘‘most likely amount’’ method under Accounting Standards Codification Topic 606,
Revenue from Contracts with Customers
, or ASC 606. The amounts are determined by historical average collection rates by test type and payor category taking into consideration the range of possible outcomes, the predictive value of our past experiences, the time period of when uncertainties expect to be resolved and the amount of consideration that is susceptible to factors outside of our influence, such as the judgment and actions of third parties. Such variable consideration is included in the transaction price only to the extent it is probable that a significant reversal in the amount of cumulative revenue recognized will not occur when the uncertainties with respect to the amount are resolved. Variable consideration may be constrained and excluded from the transaction price in situations where there is no contractually agreed upon reimbursement coverage or in the absence of a predictable pattern and history of collectability with a payor. Variable consideration for Medicare claims is deemed to be fully constrained when the payment of such claims is subject to approval by an Administrative Law Judge, or ALJ, at an appeal hearing, due to factors outside our influence (i.e., judgment or actions of third parties) and the uncertainty of the amount to be received is not expected to be resolved for a long period of time. Variable consideration is evaluated each reporting period and adjustments are recorded as increases or decreases in revenues. As a result of the timing and amount of adjustments for variable consideration, our operating results and comparisons of such results on a period-to-period basis may be difficult to understand and may not be meaningful. In addition, these fluctuations in revenue may make it difficult for us, for research analysts and for investors to accurately forecast our revenue and operating results. If our revenue or operating results fall below expectations, the price of our common stock would likely decline.
We have incurred significant losses since inception, and we may never achieve or sustain profitability.
Since our inception, we have had a history of net losses. As of
December 31, 2019
, we had a cash balance of approximately
$98.8 million
and an accumulated deficit of approximately
$52.2 million
. We cannot predict if we will achieve sustained profitability in the near future or at all. We expect that our losses will continue for the foreseeable future as we plan to invest significant additional funds toward the expansion of our commercial organization, the conduct of clinical utility and validity studies to support adoption of our products and the development or acquisition of additional products. As a public company, we
39
will also incur significant legal, accounting and other expenses that we did not incur as a private company. These increased expenses will make it harder for us to achieve and sustain future profitability. We may also incur significant losses in the future for a number of reasons, many of which are beyond our control, including the other risks described in this Annual Report on Form 10‑K, adoption of our products, coverage of and reimbursement rates for our products from third-party payors, and future research and development activities. Our failure to achieve and sustain profitability in the future could cause the market price of our common stock to decline.
We are an early, commercial-stage company and have a limited operating history, which may make it difficult to evaluate our current business and predict our future performance.
We are an early commercial-stage company and have a limited operating history. Our limited operating history may make it difficult to evaluate our current business and this makes predictions about our future success or viability subject to significant uncertainty. In particular, we intend to use a portion of our working capital to increase our headcount, including through the expansion of our sales and marketing and research and development teams, which will increase our operating costs in a manner not historically reflected in our financial statements. In combination with our other anticipated increased operating expenses in connection with becoming a public company, these anticipated changes in our operating expenses may make it difficult to evaluate our current business, assess our future performance relative to prior performance and accurately predict our future performance.
We will continue to encounter risks and difficulties frequently experienced by early commercial-stage companies, including those associated with increasing the size of our organization and the prioritization of our commercial, research and business development activities. If we do not address these risks successfully, our business could suffer.
Changes in financial accounting standards or practices may cause adverse, unexpected financial reporting fluctuations and affect our reported operating results.
Accounting principles generally accepted in the United States of America are subject to interpretation by the Financial Accounting Standards Board, the SEC, and various bodies formed to promulgate and interpret appropriate accounting principles. A change in accounting standards or practices can have a significant effect on our reported results and may even affect our reporting of transactions completed before the change is effective. New accounting pronouncements and varying interpretations of accounting pronouncements have occurred and may occur in the future. Changes to existing rules or the questioning of current practices may adversely affect our reported financial results or the way we conduct our business.
Our quarterly and annual operating results and cash flows may fluctuate in the future, which could cause the market price of our stock to decline substantially.
Numerous factors, many of which are outside our control, may cause or contribute to significant fluctuations in our quarterly and annual operating results. These fluctuations may make financial planning and forecasting uncertain. In addition, these fluctuations may result in unanticipated decreases in our available cash, which could negatively affect our business and prospects. In addition, one or more of such factors may cause our revenue or operating expenses in one period to be disproportionately higher or lower relative to the others. As a result, comparing our operating results on a period-to-period basis may be difficult to understand and may not be meaningful. You should not rely on our past results as indicative of our future performance.
In addition, a significant portion of our operating expense is relatively fixed in nature, and planned expenditures are based in part on expectations regarding future revenue. Accordingly, unexpected revenue shortfalls could decrease our gross margins and cause significant changes in our operating results from quarter to quarter. If this occurs, the trading price of our stock could fall substantially.
This variability and unpredictability caused by factors such as those described above could also result in our failing to meet the expectations of industry or financial analysts or investors for any period. If our revenue or operating results fall below the expectations of analysts or investors or below any guidance we may provide, or if the guidance we provide is below the expectations of analysts or investors, the price of our common stock could decline substantially. Such a stock price decline could occur even when we have met any previously publicly stated guidance we may provide.
We previously identified material weaknesses in our internal control over financial reporting. If our internal control over financial reporting is not effective, we may not be able to accurately report our financial results or file our periodic reports in a timely manner, which may cause adverse effects on our business and may cause investors to lose confidence in our reported financial information and may lead to a decline in our stock price.
Effective internal control over financial reporting is necessary for us to provide reliable financial reports in a timely manner. In connection with the audits of our financial statements for the years ended December 31, 2018 and 2017, we concluded that
40
there were material weaknesses in our internal control over financial reporting. However, as of December 31, 2019, we concluded that these material weaknesses have been remediated.
A material weakness is a deficiency, or a combination of deficiencies, in internal control over financial reporting, such that there is a reasonable possibility that a material misstatement of the annual or interim financial statements will not be prevented or detected on a timely basis.
These material weaknesses related to a lack of (i) appropriately designed and implemented controls over the review and approval of manual journal entries and the related supporting journal entry calculations, (ii) personnel with appropriate knowledge, experience and training commensurate with accounting and reporting requirements and (iii) appropriately designed and implemented controls to evaluate variable consideration and the related constraint in accordance with ASC 606, and resulted in certain material corrections to the financial statements.
To remediate these weaknesses, we hired a full-time director of SEC reporting and technical accounting and another full-time accounting resource, both certified public accountants with active licenses, to augment our accounting staff and to provide more resources for complex accounting matters and financial reporting.
We also commenced development of a new information technology tool designed to improve the efficiency of our processes with respect to revenue recognition under ASC 606 and hired a full-time financial analyst to support our revenue accounting and related activities under ASC 606. Further, we selected a third party to assist us with formalizing our internal control documentation and implementation of enhancements to our internal control over financial reporting.
If we identify any future significant deficiencies or material weaknesses, the accuracy and timing of our financial reporting may be adversely affected, a material misstatement in our financial statements could occur, we may be unable to maintain compliance with securities law requirements regarding timely filing of periodic reports, which may adversely affect our business and our stock price may decline as a result.
Nevertheless, we will be required to expend significant time and resources to further improve our internal controls over financial reporting, including by further expanding our finance and accounting staff to meet the demands that are placed upon us as a public company, including the requirements of the Sarbanes-Oxley Act of 2002, or Sarbanes-Oxley. If we fail to adequately staff our accounting and finance function, or fail to maintain adequate internal control over financial reporting, any new or recurring material weaknesses could prevent our management from concluding our internal control over financial reporting is effective and impair our ability to prevent material misstatements in our financial statements, which could cause our business to suffer.
The terms of our credit facility place restrictions on our operating and financial flexibility, and failure to comply with covenants or to satisfy certain conditions of the agreement governing the credit facility may result in acceleration of our repayment obligations and foreclosure on our pledged assets, which could significantly harm our liquidity, financial condition, operating results, business and prospects and cause the price of our securities to decline.
Our loan and security agreement, or 2018 LSA, which we amended in June 2019, February 2020 and March 2020, with Oxford and SVB, is secured by a lien covering substantially all of our assets, excluding intellectual property. The 2018 LSA provides for a five-year $25.0 million term-loan facility, all of which has been disbursed to us.
The 2018 LSA requires us to achieve certain revenue levels tested quarterly on a trailing three-month basis. As of the most recently tested quarter, we were in compliance with this covenant. However, there can be no assurance of our ability to maintain compliance with the revenue covenant as of any future date. For example, prior to the amendment of the 2018 LSA in June 2019, our projections indicated that we were at risk of noncompliance with the financial covenant existing under the 2018 LSA prior to such amendment. Among other things, the June 2019 amendment revised our financial covenant to be more aligned with our revenue projections after taking into account the impact of ASC 606 on our revenue recognition following our early adoption of ASC 606. Our ability to amend the 2018 LSA in the future is subject to the approval of Oxford and SVB. Accordingly, should we seek to further amend the 2018 LSA, there can be no assurance that any such amendment would be available on terms acceptable to us, if at all.
The 2018 LSA also requires us to comply with a number of other covenants (affirmative and negative), including restrictive covenants that limit our ability to: incur additional indebtedness; encumber the collateral securing the loan; acquire, own or make investments; repurchase or redeem any class of stock or other equity interest; declare or pay any cash dividend or make a cash distribution on any class of stock or other equity interest; transfer a material portion of our assets; maintain certain levels of cash balances in third-party deposit accounts, acquire other businesses; and merge or consolidate with or into any other organization or otherwise suffer a change in control, in each case subject to exceptions. In February 2020, in connection with an amendment to the 2018 LSA, our lenders agreed to provide a waiver of an event of default by us that resulted from us maintaining a cash balance in a third-party deposit account beyond the maximum level permitted. Such amendment
also
41
provided a modification to increase the maximum balance permitted for this deposit account.
While we were able to obtain a waiver and amendment in this instance, there can be no assurance that the lenders would agree to provide any future waivers or amendments if another event of default were to occur as result of noncompliance with this or any other covenant under the 2018 LSA.
In addition to other specified events of default, and subject to limited exceptions, the lenders could declare an event of default upon the occurrence of any event that they interpret as having a material impairment in their lien on the collateral under the agreement, a material adverse change in our business, operations or condition (financial or otherwise) or a material impairment in the prospect of repayment of our obligations under the agreement. If we default under the credit facility, the lenders may accelerate all of our repayment obligations and, if we are unable to access funds to meet those obligations or to renegotiate our agreement, the lenders could take control of our pledged assets and we would have to immediately cease operations. During the continuance of an event of default, the then-applicable interest rate on the then-outstanding principal balance will increase by 5.0%. Upon an event of default, the lenders could also require us to repay the loan immediately, together with a prepayment charge of up to 2.5% of the then-outstanding principal balance, together with other fees. If we were to renegotiate the agreement under such circumstances, the terms may be significantly less favorable to us. If we were liquidated, the lenders’ right to repayment would be senior to the rights of our stockholders to receive any proceeds from the liquidation. Any declaration by the lenders of an event of default could significantly harm our liquidity, financial condition, operating results, business, and prospects and cause the price of our securities to decline.
We may incur additional indebtedness in the future. The debt instruments governing such indebtedness may contain provisions that are as, or more, restrictive than the provisions governing our existing indebtedness. If we are unable to repay, refinance or restructure our indebtedness when payment is due, the lenders could proceed against the collateral or force us into bankruptcy or liquidation.
If we are unable to meet the applicable debt covenants, the lenders could accelerate all of our repayment obligations under the 2018 LSA and we would need to seek additional or alternate financing or modify our operational plans. If we seek additional financing to fund our business activities in the future, there can be no assurance that additional funding will be available to us on commercially reasonable terms or at all.
We may need to raise additional capital to fund our existing operations, commercialize new products or expand our operations.
We believe our existing cash and cash equivalents and anticipated cash generated from sales of our products will be sufficient to fund our operating expenses for the foreseeable future. If our available cash balances and anticipated cash generated from sales of our products are insufficient to satisfy our liquidity requirements including because of lower demand for our products, lower than currently expected rates of reimbursement from third-party payors or other risks described in this Annual Report on Form 10-K, we may finance our cash needs through a combination of equity offerings, debt financings, collaborations, strategic alliances and marketing, distribution or licensing arrangements. We do not currently have any committed external source of funds. In addition, we may seek additional capital due to favorable market conditions or strategic considerations, even if we believe we have sufficient funds for our current or future operating plans.
We may consider raising additional capital in the future to expand our business, to pursue strategic investments, to take advantage of financing opportunities or for other reasons, including to:
|
•
|
increase our sales and marketing efforts for DecisionDx-Melanoma and address competitive developments;
|
|
•
|
fund ongoing development of our pipeline products, including for SCC and suspicious pigmented lesions, in addition to other programs in development;
|
|
•
|
expand our laboratory testing facility and related testing capacity;
|
|
•
|
expand our technologies into other types of skin cancer management and detection products;
|
|
•
|
acquire, license or invest in technologies;
|
|
•
|
acquire or invest in complementary businesses or assets; and
|
|
•
|
finance capital expenditures and general and administrative expenses.
|
Our present and future funding requirements will depend on many factors, including:
|
•
|
our ability to achieve revenue growth;
|
|
•
|
our rate of progress in establishing payor coverage and reimbursement arrangements with third-party payors;
|
42
|
•
|
our rate of progress in, and cost of the sales, marketing, coverage and reimbursement activities associated with, establishing adoption of DecisionDx-Melanoma, among our other products;
|
|
•
|
the cost of expanding our laboratory operations and offerings, including our sales, marketing, coverage and reimbursement efforts;
|
|
•
|
our rate of progress in, and cost of research and development activities associated with, diagnostic products in research and early development;
|
|
•
|
the potential cost of, and delays in, the development of new products as a result of changes in regulatory oversight applicable to our products; and
|
|
•
|
the effect of competing technological and market developments.
|
To the extent that we raise additional capital through the sale of equity or convertible debt securities, your ownership interest will be diluted, and the terms of these securities may include liquidation or other preferences that adversely affect your rights as a common stockholder. Debt financing and preferred equity financing, if available, may involve agreements that include covenants limiting or restricting our ability to take specific actions, such as incurring additional debt, making acquisitions or capital expenditures or declaring dividends.
If we raise additional funds through collaborations, strategic alliances or marketing, distribution or licensing arrangements with third parties, we may have to relinquish valuable rights to our technologies, future revenue streams, research programs or products, or grant licenses on terms that may not be favorable to us. If we are unable to raise additional funds through equity or debt financings or other arrangements when needed, we may be required to delay, limit, reduce or terminate our commercialization, research and development efforts or grant rights to third parties to market and/or develop products that we would otherwise prefer to market and develop ourselves.
Risks Related to Our Business
Our revenue currently depends primarily on sales of DecisionDx-Melanoma, and we will need to generate sufficient revenue from this and other products to grow our business.
Most of our revenue in 2019 and 2018 was derived from the sale of our lead product, DecisionDx-Melanoma. While we also derive revenue from DecisionDx-UM, we expect that the majority of our revenue for the foreseeable future will be derived from sales of DecisionDx-Melanoma. Further, we believe that our long-term commercial success will depend on our ability to develop and market additional products, such as our pipeline products for SCC and suspicious pigmented lesions. Our ability to derive revenue from DecisionDx-Melanoma, DecisionDx-UM and any future products that we commercialize is uncertain and depends on favorable coverage and reimbursement policies from government payors, like Medicare, and from private payors, like insurance companies. Without positive coverage policies, our products may not be reimbursed and we may not be able to recognize revenue. If we are unable to increase sales and expand coverage and reimbursement for
DecisionDx-Melanoma, develop and commercialize other products, and successfully obtain coverage and adequate reimbursement for such products, our revenue and our ability to achieve and sustain profitability would be impaired, and the market price of our stock could decline substantially.
Billing for our products is complex and requires substantial time and resources to collect payment.
Billing for clinical laboratory testing services is complex, time-consuming and expensive. Depending on the billing arrangement and applicable law, we bill various payors, including Medicare, Medicaid, private insurance companies, private healthcare institutions, and patients, all of which have different billing requirements. We generally bill third-party payors for products and pursue reimbursement on a case-by-case basis where pricing contracts are not in place. To the extent laws or contracts require us to bill patient co-payments or co-insurance, we must also comply with these requirements. We may also face increased risk in our collection efforts, including potential write-offs of accounts receivable and long collection cycles, which could adversely affect our business, results of operations and financial condition.
Several factors make the billing process complex, including:
|
•
|
differences between the billing rates and reimbursement rates for our products;
|
|
•
|
compliance with complex federal and state regulations related to billing government healthcare programs, including Medicare, Medicaid and TRICARE;
|
|
•
|
risk of government audits related to billing;
|
|
•
|
disputes among payors as to which party is responsible for payment;
|
43
|
•
|
differences in coverage and information and billing requirements among payors, including the need for prior authorization and/or advanced notification;
|
|
•
|
the effect of patient co-payments or co-insurance and our ability to collect such payments from patients;
|
|
•
|
changes to billing codes used for our products;
|
|
•
|
changes to requirements related to our current or future clinical studies, including our registry studies, which can affect eligibility for payment;
|
|
•
|
ongoing monitoring provisions of LCDs for our products, which can affect the circumstances under which a claim would be considered medically necessary;
|
|
•
|
incorrect or missing billing information; and
|
|
•
|
the resources required to manage the billing and claims appeals process.
|
We use standard industry billing codes, known as CPT codes, to bill for our products. If these codes were to change, there is a risk of an error being made in the claim adjudication process. Such errors can occur with claims submission, third-party transmission or in the processing of the claim by the payor. Claim adjudication errors may result in a delay in payment processing or a reduction in the amount of the payment we receive.
As we introduce new products, we may need to add new codes to our billing process as well as our financial reporting systems. Failure or delays in effecting these changes in external billing and internal systems and processes could negatively affect our collection rates, revenue and cost of collecting.
Additionally, our billing activities require us to implement compliance procedures and oversight, train and monitor our employees, and undertake internal audits to evaluate compliance with applicable laws and regulations as well as internal compliance policies and procedures. When payors deny our claims, we may challenge the reason, low payment amount or payment denials. Payors also conduct external audits to evaluate payments, which add further complexity to the billing process. If the payor makes an overpayment determination, there is a risk that we may be required to return all or some portion of prior payments we have received.
Additionally, the Patient Protection and Affordable Care Act of 2010, as amended by the Health Care and Education Reconciliation Act of 2010, collectively the ACA, requires providers and suppliers to report and return any overpayments received from government payors under the Medicare and Medicaid programs within 60 days of identification. Failure to identify and return such overpayments exposes the provider or supplier to liability under federal false claims laws. These billing complexities, and the related uncertainty in obtaining payment for our products, could negatively affect our revenue and cash flow, our ability to achieve profitability, and the consistency and comparability of our results of operations.
We rely on third parties for tumor sample collection, preparation and delivery. Any defects in sample collection or preparation by such third parties and any delays in delivery of such samples could cause errors in our test reports and delay our ability to deliver test reports in a timely manner, which could significantly harm our business.
The tumor tissue samples that we test are biopsied, preserved, prepared and delivered to us by third parties, including dermatopathologists and laboratory facilities. As such, we rely on these third parties to prepare, label and deliver the tissue samples that we test in compliance with applicable laws and guidelines, and in a timely manner. Therefore, the accuracy and correctness of the test reports that we deliver are dependent on proper chain of custody and appropriate methods of sample collection or preparation utilized by these third parties, and our ability to timely deliver reports is dependent upon the ability of these third parties to provide these samples to us in a timely manner. Any errors in any part of the sample collection or preparation process could cause us to deliver incorrect test reports, potentially resulting in harm to patients whose physicians implement a change in treatment decisions based upon our test report. If we are unable to timely deliver test reports, physicians may be less likely to recommend and order our products. The occurrence of any of the foregoing could significantly harm our reputation and our results of operations, causing significant harm to our business.
We rely on our database of tumor samples for the development and improvement of our products. Depletion or loss of our tumor samples could significantly harm our business.
The development and validation of accurate products is a complex process that requires access to tumor tissue specimens and long-term outcomes data. Our research and development efforts to improve our existing products and develop new products may require the depletion of our existing database of tumor samples. If our tumor samples are lost or destroyed, or substantially depleted before we are able to generate meaningful data, we may be unable to improve our existing products, continue the development of pipeline products or validate product candidates. While we have historically been able to create and maintain a large sample bank to expand the clinical use of our products and develop new products, we may be unable to do so in the
44
future. If we were unable to maintain or replenish our sample bank, we may be unable to improve our products or develop new products.
If our sole laboratory facility becomes damaged or inoperable or we are required to vacate our existing facility, our ability to conduct our laboratory analysis and pursue our research and development efforts may be jeopardized.
We currently perform all of our testing and store our database of tumor samples at a single laboratory facility in Phoenix, Arizona. Our facility and equipment could be harmed or rendered inoperable by natural or man-made disasters, including war, fire, earthquake, power loss, communications failure, terrorism, burglary, public health crises or other events, which may make it difficult or impossible for us to perform our testing services for some period of time or to receive and store samples. The inability to perform tests or to reduce the backlog of sample analysis that could develop if our facility becomes inoperable, for even a short period of time, may result in the loss of revenue, loss of customers or harm to our reputation, and we may be unable to regain that revenue, those customers or repair our reputation in the future. Furthermore, integral parties in our supply chain are operating from single sites, increasing their vulnerability to natural disasters and man-made disasters or other sudden, unforeseen and severe adverse events.
In addition, the loss of our tumor samples due to such events could limit or prevent our ability to conduct research and development analysis on existing tests as well as tests in active pipeline development.
While we have a business continuity plan in place, our facility and the equipment we use to perform our testing and research and development could be unavailable or costly and time-consuming to repair or replace. It would be difficult, time-consuming and expensive to rebuild our facility, to locate and qualify a new facility, replace certain pieces of equipment or license or transfer our proprietary technology to a third-party, particularly in light of licensure and accreditation requirements. Even in the unlikely event that we are able to find a third party with such qualifications to enable us to resume our operations, we may be unable to negotiate commercially reasonable terms.
We carry insurance for damage to our property and the disruption of our business, but this insurance may not cover all of the risks associated with damage or disruption to our business, may not provide coverage in amounts sufficient to cover our potential losses and may not continue to be available to us on acceptable terms, if at all.
Our current or future products may not achieve or maintain significant commercial market acceptance.
We believe our commercial success is dependent upon our ability to continue to successfully market and sell our products, to continue to expand our current relationships and develop new relationships with healthcare providers, to expand and maintain coverage for our products, and to develop and commercialize new products. Our ability to achieve and maintain commercial market acceptance of our existing and future products will depend on a number of factors, including:
|
•
|
our ability to increase awareness of our products through successful clinical utility and validity studies;
|
|
•
|
the rate of adoption of our products by physicians and other healthcare providers;
|
|
•
|
our ability to achieve guideline inclusion for our products;
|
|
•
|
the timeliness with which we can provide our clinical reports to the ordering physician;
|
|
•
|
the timing and scope of any regulatory approval for our products, if such approvals become required, and maintaining ongoing compliance with regulatory requirements;
|
|
•
|
our ability to obtain and maintain positive coverage decisions for our products from government and commercial payors;
|
|
•
|
our ability to obtain and maintain adequate reimbursement from third-party payors, including Medicare, Medicare Advantage plans, United Healthcare and BlueCross BlueShield plans, which accounted for an aggregate of approximately 90% and 83% of our total revenue for the years ended December 31, 2019 and 2018, respectively;
|
|
•
|
the impact of our investments in research and development and commercial growth;
|
|
•
|
negative publicity regarding our or our competitors’ products resulting from scientific publications, or defects or errors in the products; and
|
|
•
|
our ability to further validate our products through clinical research and accompanying publications.
|
We cannot assure you that we will be successful in addressing each of these factors or other factors that might affect the market acceptance of our products. If we are unsuccessful in achieving and maintaining market acceptance of our products, our business and results of operations will suffer.
45
New product development involves a lengthy and complex process, and we may be unable to develop and commercialize, or receive reimbursement for, on a timely basis, or at all, new products.
We continually seek to develop new product offerings, which requires us to devote considerable resources to research and development. For example, before we can commercialize our pipeline products for SCC and suspicious pigmented lesions, we will need to expend significant resources in order to conduct substantial research and development, including clinical utility and validity studies, and further develop and scale our laboratory processes and infrastructure to accommodate additional products.
Our product development process takes time and involves a high degree of risk, and such development efforts may fail for many reasons, including failure of the product to perform as expected, failure to successfully complete analytic and clinical validation, or failure to demonstrate the clinical utility of the product.
As we develop new products, we will have to make significant investments in research and development, marketing, selling, coverage and reimbursement activities. Typically, few research and development projects result in a commercialized product, and there can be no assurance that we will be able to successfully develop new products that can be commercialized. At any point, we may abandon development of a product or we may be required to expend considerable resources conducting research, which would adversely affect the timing for generating potential revenue from a new product and our ability to invest in other products in our pipeline. If a clinical validation study fails to demonstrate the prospectively defined endpoints of the study or if we fail to sufficiently demonstrate analytical validity or clinical utility, we might choose to abandon the development of the product, which could harm our business. In addition, competitors may develop and commercialize competing products or technologies faster than us or at a lower cost.
We may experience limits on our revenue if we are unable to increase and support adoption of our products by physicians and other healthcare providers.
Physicians and other healthcare providers may be unwilling to adopt our products due to their reliance on existing traditional clinical and pathology staging criteria and our ability to generate revenue from our products would be significantly impaired if we were unable to educate physicians, healthcare providers, patients and third-party payors about the benefits and advantages of our products. We will need to continue to educate physicians and pathologists about the benefits and cost-effectiveness of our products through published papers, presentations at scientific conferences, one-on-one marketing efforts by our sales force and one-on-one education by our medical affairs team. However, physicians and other healthcare providers may be reluctant to adopt our products in circumstances where our products are not incorporated into the current standard of care or practice guidelines. For example, while clinical utility of DecisionDx-Melanoma has been demonstrated in peer reviewed publications, the SLNB surgery is the most widely used staging tool for determining a cutaneous melanoma patient’s metastatic risk. Whether healthcare providers adopt DecisionDx-Melanoma as a complementary or triage diagnostic method relative to the SLNB surgery will depend on our ability to increase awareness of DecisionDx-Melanoma and its clinical validation.
In addition, our testing services are performed by our certified laboratory located in Phoenix, Arizona, under the Clinical Laboratory Improvement Amendments of 1988, or CLIA, rather than by local laboratory or pathology practices. Accordingly, it may be difficult for us to collect samples from pathologists, and pathologists may be reluctant to support our testing services.
We rely on limited or sole suppliers for some of the reagents, equipment, chips and other materials used by our products, and we may not be able to find replacements or transition to alternative suppliers.
We rely on limited or sole suppliers for certain reagents and other materials and components that we use for our products. Some of these items are unique to these suppliers and vendors. While we have developed alternate sourcing strategies for these materials and vendors, we cannot be certain whether these strategies will be effective or the alternative sources will be available when we need them. If these suppliers can no longer provide us with the materials we need, if the materials do not meet our quality specifications or are otherwise unusable, if we cannot obtain acceptable substitute materials, or if we elect to change suppliers, an interruption in laboratory operations could occur, we may not be able to deliver patient reports on a timely basis, or at all, and we may incur higher one-time switching costs. Any such interruption may significantly affect our future revenue, cause us to incur higher costs, and harm our customer relationships and reputation. In addition, in order to mitigate these risks, we maintain inventories of these supplies at higher levels than would be the case if multiple sources of supply were available. If our testing volume decreases or we switch suppliers, we may hold excess supplies with expiration dates that occur before use which would adversely affect our losses and cash flow position. As we introduce any new products, we may experience supply issues as we ramp test volume. If we should encounter delays or difficulties in securing, reconfiguring or revalidating the equipment, reagents or other materials we require for our products, our business, financial condition, results of operations and reputation could be adversely affected.
46
If our products do not meet the expectations of physicians and patients, our operating results, reputation and business could suffer.
Our success depends on physician and patient confidence that we can provide reliable, high-quality information that will improve treatment outcomes, lower healthcare costs and enable better patient care. We believe that patients, physicians and other healthcare providers are likely to be particularly sensitive to defects and errors in our products, including if our products fail to accurately predict risk of metastasis with high accuracy from samples, and there can be no guarantee that our products will meet their expectations. As a result, the failure of our products to perform as expected could significantly impair our operating results and our reputation, including if we become subject to legal claims arising from any defects or errors in our products or reports.
If we are unable to compete successfully, our business will suffer and we may be unable to increase or sustain our revenue or achieve profitability.
We face competition from companies and academic institutions that have either developed or may seek to develop products intended to compete with our products. Potential competitors within the broader genomics profiling space based on tissue sample collection include laboratory companies such as Laboratory Corporation of America and Myriad Genetics, and other companies which have strong infrastructures capable of supporting the commercialization of diagnostic services.
In addition, competitors may develop their own versions of our solutions in countries where we do not have patents or where our intellectual property rights are not recognized and compete with us in those countries, including encouraging the use of their solutions by physicians in other countries.
Some potential competitors may have longer operating histories, larger customer bases, greater brand recognition and market penetration, substantially greater financial, technological and research and development resources and selling and marketing capabilities, and more experience dealing with third-party payors. As a result, they may be able to respond more quickly to changes in customer requirements, devote greater resources to the development, promotion and sale of their products than we do or sell their products at prices designed to win significant levels of market share. We may not be able to compete effectively against these organizations. Increased competition and cost-saving initiatives on the part of governmental entities and other third-party payors are likely to result in pricing pressures, which could harm our sales, profitability or ability to gain market share. In addition, competitors may be acquired by, receive investments from or enter into other commercial relationships with larger, well-established and well-financed companies. Certain potential competitors may be able to secure key inputs from vendors on more favorable terms, devote greater resources to marketing and promotional campaigns, adopt more aggressive pricing policies and devote substantially more resources to test development than we can. In addition, companies or governments that control access to testing through umbrella contracts or regional preferences could promote our competitors or prevent us from performing certain services. If we are unable to compete successfully against current and future competitors, our business will suffer and we may be unable to increase market acceptance and sales of our products, which could prevent us from increasing our revenue or achieving profitability and could cause our stock price to decline. As we add new tests and services, we will face many of these same competitive risks for these new tests.
The sizes of the markets for our current and future products have not been established with precision and may be smaller than we estimate.
Our estimates of the total addressable markets for DecisionDx-Melanoma, DecisionDx-UM and our products in development are based on a number of internal and third-party estimates, including, without limitation, the annual rate of patients with the applicable form of skin cancer, the list price of our products relative to the reimbursement we expect to receive from third-party payors and the assumed prices at which we can sell our products in markets that have not been established. For example, we estimate that the total addressable market for DecisionDx-Melanoma is approximately $540 million, which is based, in part, on our review of multiple recent publications which show that diagnosis of melanoma is underreported by 30% to 40%. While we believe our assumptions and the data underlying our estimates are reasonable, these assumptions and estimates may not be correct and the conditions supporting our assumptions or estimates may change at any time, thereby reducing the predictive accuracy of these underlying factors. As a result, our estimates of the annual total addressable market for our current or future products may prove to be incorrect. If the actual number of patients who would benefit from our products, the price at which we can sell future products, or the annual total addressable market for our products is smaller than we have estimated, it may impair our sales growth and have an adverse impact on our business.
The diagnostic testing industry is subject to rapid change, which could make our current or future products obsolete.
Our industry is characterized by rapid changes, including technological and scientific breakthroughs, frequent new product introductions and enhancements and evolving industry standards, all of which could make our current products and the other products we are developing obsolete. Our future success will depend on our ability to keep pace with the evolving needs of
47
physicians and patients on a timely and cost-effective basis and to pursue new market opportunities that develop as a result of scientific and technological advances. In recent years, there have been numerous advances in technologies relating to the diagnosis and treatment of cancer. There have also been advances in methods used to analyze very large amounts of molecular information. We must continuously enhance our existing products and develop new products to keep pace with evolving standards of care. If we do not update our products to reflect new scientific knowledge about cancer biology, information about new cancer therapies or relevant clinical studies, our products could become obsolete and sales of our current products and any new products we develop could decline or fail to grow as expected.
Risks Related to Reimbursement and Government Regulation
We currently have limited reimbursement coverage for our lead product, DecisionDx-Melanoma, and if third-party payors, including government and commercial payors, do not provide sufficient coverage of, or adequate reimbursement for, our products, our commercial success will be negatively affected.
Our revenue depends on achieving broad coverage and adequate reimbursement for our products from third-party payors, including both government and commercial third-party payors. If third-party payors do not provide coverage of, or do not provide adequate reimbursement for, a substantial portion of the list price of our products, we may need to seek additional payment from the patient beyond any co-payments and deductibles, which may adversely affect demand for our products. Coverage determinations by a third-party payor may depend on a number of factors, including, but not limited to, a third-party payor’s determination of whether our products are appropriate, medically necessary or cost-effective. If we are unable to provide third-party payors with sufficient evidence of the clinical utility and validity of our products, they may not provide coverage, or may provide limited coverage, which will adversely affect our revenues and our ability to succeed. To the extent that more competitors enter our markets, the availability of coverage and the reimbursement rate for our products may decrease as we encounter pricing pressure from these competitors.
Since each third-party payor makes its own decision as to whether to establish a policy to cover our products, enter into a contract with us and set the amount it will reimburse for a product, these negotiations are a time-consuming and costly process, and they do not guarantee that the third-party payor will provide coverage or adequate reimbursement for our products. In addition, the determinations by a third-party payor whether to cover our products and the amount it will reimburse for them are often made on an indication-by-indication basis.
In cases where there is no coverage policy or we do not have a contracted rate for reimbursement as a participating provider, the patient is typically responsible for a greater share of the cost of the product, which may result in further delay of our revenue, increase our collection costs or decrease the likelihood of collection.
Our claims for reimbursement from third-party payors may be denied upon submission, and we may need to take additional steps to receive payment, such as appealing the denials. Such appeals and other processes are time-consuming and expensive, and may not result in payment. Third-party payors may perform audits of historically paid claims and attempt to recoup funds years after the funds were initially distributed if the third-party payors believe the funds were paid in error or determine that our products were medically unnecessary. If a third-party payor audits our claims and issues a negative audit finding, and we are not able to overturn the audit findings through appeal, the recoupment may result in a material adverse effect on our revenue. Additionally, in some cases commercial third-party payors for whom we are not a participating provider may elect at any time to review claims previously paid and determine the amount they paid was too much. In these situations, the third-party payor will typically notify us of their decision and then offset whatever amount they determine they overpaid against amounts they owe us on current claims. We cannot predict when, or how often, a third-party payor might engage in these reviews and we may not be able to dispute these retroactive adjustments.
Under ASC 606, we recognize revenue at the amount we expect to be entitled, subject to a constraint for variable consideration, in the period in which our tests are delivered to the treating physician. We have determined that our contracts contain variable consideration under ASC 606 because the amounts paid by third-party payors may be paid at less than our standard rates or not paid at all, with such differences considered implicit price concessions. Variable consideration is recognized only to the extent it is probable that a significant reversal of revenue will not occur in future periods when the uncertainties are resolved. We consider variable consideration to be fully constrained (and therefore not recognized) for Medicare claims when the payment of such claims is subject to approval by an ALJ at an appeal hearing, due to the level of uncertainty and timing of the outcome.
Variable consideration is evaluated each reporting period and adjustments are recorded as increases or decreases in revenues. Due to the outcome of ALJ hearings, potential future changes in insurance coverage policies, contractual rates and other trends in the reimbursement of our tests, our revenues may fluctuate significantly from period to period.
48
Although we are an in-network participating provider with some commercial third-party payors, including several Blue Cross Blue Shield plans, and certain large, national commercial third-party payors, including Aetna, other commercial third-party payors have issued non-coverage policies that currently categorize DecisionDx-UM and DecisionDx-Melanoma as experimental or investigational. If we are not successful in obtaining coverage from third-party payors, in reversing existing non-coverage policies, or if other third-party payors issue similar non-coverage policies, this could have a material adverse effect on our business and operations.
Palmetto, the MAC responsible for administering MolDX, the program that assesses molecular diagnostic technologies, issued a final LCD for DecisionDx-Melanoma, which became effective on December 3, 2018. This LCD provides for coverage of DecisionDx-Melanoma for certain SLNB-eligible patients with cutaneous melanoma tumors with clinically negative sentinel node basins who are being considered for SLNB to determine eligibility for adjuvant therapy. Similarly, Palmetto issued a final LCD for DecisionDx-UM effective July 10, 2017. This LCD provides for coverage of DecisionDx-UM to determine metastatic risk in connection with the management of a patient’s newly diagnosed uveal melanoma and to guide surveillance and referral to medical oncology for those patients. We worked with Palmetto to obtain these positive coverage decisions through the submission of a detailed dossier of analytical and clinical data to substantiate that the tests meet Medicare’s medical necessity requirements. Per their joint operating agreement, Noridian, the MAC responsible for administering claims for laboratory services performed in Arizona, has adopted the same coverage policy as Palmetto for DecisionDx-UM and DecisionDx-Melanoma. This coverage process is lengthy, time-consuming, has changed over time, may change in the future and requires significant dedication of resources, and as we develop new products, we may be unsuccessful in receiving LCD determinations for those products or in maintaining our current LCDs. On a periodic basis, CMS requests bids for its MAC services, and MAC jurisdictions have changed in the past. A change in our MAC, or future changes in the MolDX program, the elimination of the program, or a change in the administrator of that program, may affect our ability to obtain Medicare coverage and reimbursement for products for which we have coverage, for products for which we do not yet have coverage, or for any products we may launch in the future, or delay payments for our tests.
Under Medicare, payment for products like ours is generally made under the CLFS, with payment amounts assigned to specific procedure billing codes. In April 2014, Congress passed the Protecting Access to Medicare Act of 2014, or PAMA, which included substantial changes to the way in which clinical laboratory services are paid under Medicare. Under PAMA, certain laboratories were required to report to CMS, beginning in 2017 and every three years thereafter (or annually for advanced diagnostic laboratory tests, or ADLTs), commercial third-party payor payment rates and volumes for each test they perform. CMS uses this data to calculate a weighted median payment rate for each test, which will be used to establish revised Medicare
CLFS
reimbursement rates for the test. Laboratories that fail to report the required payment information may be subject to substantial civil monetary penalties. We bill Medicare for our products, and therefore we are subject to reporting requirements under PAMA.
On May 17, 2019, the Centers for Medicare & Medicaid Services, or CMS, determined that DecisionDx-UM meets the criteria for “existing advanced diagnostic laboratory test” status, also referred to as “existing ADLT” status. This means that beginning in 2021,
the
DecisionDx-UM Medicare rate will be set annually based upon the median private payor rate for the first half of the second preceding calendar year. Specifically, the median private payor rate from January 1 to June 30, 2019 will be used to set the Medicare rate for the calendar year 2021. Note that our rate for 2020 will be set by Noridian, our local MAC.
Also, on May 17, 2019, CMS determined that DecisionDx-Melanoma meets the criteria for “new ADLT” status. This means that from July 1, 2019 through March 31, 2020 the Medicare reimbursement rate will equal the initial list price of $7,193.00, subject to the possible recoupment provision described below. The rate for April 1, 2020 through December 31, 2021 will be calculated based upon the median private payor rate from July 1, 2019 to November 30, 2019. Note that for DecisionDx-Melanoma tests reported for July 1, 2019 through March 31, 2020, CMS has the right to recoup the difference between the actual list and 130% of the weighted median if the original list price was greater than 130% of the weighted median of private payor
rates
. Beginning in 2022, the rate will be set annually based upon the median private payor rate for the first half of the second preceding calendar year. For example, the rate for 2022 will be set using median private payor rate data from January 1, 2020 to June 30, 2020.
If we are unable to obtain and maintain adequate reimbursement rates from commercial third-party payors, this may adversely affect our Medicare rate. It is unclear what impact new pricing structures, such as those adopted under PAMA, may have on our business, financial condition, results of operations or cash flows.
The U.S. federal government continues to show significant interest in pursuing health care reform and reducing health care costs. Similarly, commercial third-party payors may seek to reduce costs by limiting coverage or reducing reimbursement for our products. Any government-adopted reform measures or changes to commercial third-party payor coverage and
49
reimbursement policies could cause significant pressure on the pricing of, and reimbursement for, health care products and services, including our products, which could decrease demand for our products, and adversely affect our sales and revenue.
In addition, some third-party payors have implemented, or are in the process of implementing, laboratory benefit management programs, often using third-party benefit managers to manage these programs. The stated goals of these programs are to help improve the quality of outpatient laboratory services, support evidence-based guidelines for patient care and lower costs. The impact on laboratories, such as ours, of active laboratory benefit management by third parties is unclear, and we expect that it could have a negative impact on our revenue in the short term. It is possible that third-party payors will resist reimbursement for the products that we offer, in favor of less expensive products, may require pre-approval for our products or may impose additional pricing pressure on and substantial administrative burden for reimbursement for our products.
We expect to continue to focus substantial resources on increasing coverage and reimbursement for our current products and any future products we may develop. We believe it may take several years to achieve broad coverage and adequate contracted reimbursement with a majority of third-party payors for our products.
However, we cannot predict whether, under what circumstances, or at what payment levels third-party payors will cover and reimburse our products. If we fail to establish and maintain broad adoption of, and coverage and reimbursement for, our products, our ability to generate revenue could be harmed and our future prospects and our business could suffer.
Our products are currently marketed as laboratory developed tests, and any changes in regulations or the U.S. Food and Drug Administration’s enforcement discretion for laboratory developed tests, or violations of regulations by us, could adversely affect our business, prospects, results of operations or financial condition.
The diagnostics industry is highly regulated, and we cannot assure you that the regulatory environment in which we operate will not change significantly and adversely in the future. In many instances, there are no significant regulatory or judicial interpretations of these laws and regulations. Although the FDA has statutory authority to assure that medical devices are safe and effective for their intended uses, the FDA has generally exercised its enforcement discretion and not enforced applicable regulations with respect to in vitro diagnostics that are designed, manufactured and used within a single laboratory. These tests are referred to as laboratory developed tests, or LDTs. We currently market our products as LDTs.
The FDA has adopted a policy of enforcement discretion with respect to LDTs whereby the FDA does not actively require premarket review of LDTs or otherwise impose its requirements applicable to other medical devices on LDTs. However, the FDA has stated its intention to modify its enforcement discretion policy with respect to LDTs. The FDA could ultimately modify its current approach to LDTs in a way that would subject our products marketed as LDTs to the enforcement of additional regulatory requirements. Moreover, legislative measures have recently been proposed in Congress that, if ultimately enacted, could provide the FDA with additional authority to require premarket review of and regulate LDTs. If and when such changes to the regulatory framework occur, we could for the first time be subject to enforcement of regulatory requirements as a device manufacturer such as registration and listing requirements, medical device reporting requirements and the requirements of the FDA’s Quality System Regulation. We may be required to conduct clinical trials prior to continuing to sell our existing products or launching any other products we may develop. This may increase the cost of conducting, or otherwise harm, our business.
Moreover, even if the FDA does not modify its policy of enforcement discretion, the FDA may disagree that we are marketing our LDTs within the scope of its policy of enforcement discretion and may impose significant regulatory requirements. While we believe that we are currently in material compliance with applicable laws and regulations as historically enforced by the FDA, we cannot assure you that the FDA will agree with our determination. A determination that we have violated these laws and regulations, or a public announcement that we are being investigated for possible violations, could adversely affect our business, prospects, results of operations or financial condition.
If the FDA begins to actively regulate our diagnostic products, we may be required to obtain premarket clearance under Section 510(k) of the U.S. Federal Food, Drug and Cosmetic Act, or FDCA, or a premarket approval, or PMA. The process for submitting a 510(k) premarket notification and receiving FDA clearance usually takes from three to 12 months, but it can take significantly longer and clearance is never guaranteed. The process for submitting and obtaining FDA approval of a PMA is much more costly, lengthy and uncertain. It generally takes from one to three years or even longer, and approval is not guaranteed. PMA approval typically requires extensive clinical data and can be significantly longer, more expensive and more uncertain than the 510(k) clearance process. Despite the time, effort and expense expended, there can be no assurance that a particular device ultimately will be cleared or approved by the FDA through either the 510(k) clearance process or the PMA process on a timely basis, or at all. Moreover, there can be no assurance that any cleared or approved labeling claims will be consistent with our current claims or adequate to support continued adoption of and reimbursement for our products. If premarket review is required for some or all of our products, the FDA may require that we stop selling our products pending
50
clearance or approval, which would negatively impact our business. Even if our products are allowed to remain on the market prior to clearance or approval, demand or reimbursement for our products may decline if there is uncertainty about our products, if we are required to label our products as investigational by the FDA, or if the FDA limits the labeling claims we are permitted to make for our products. As a result, we could experience significantly increased development costs and a delay in generating additional revenue from our products, or from other products now in development.
If the FDA imposes significant changes to the regulation of LDTs it could reduce our revenues or increase our costs and adversely affect our business, prospects, results of operations or financial condition.
We conduct business in a heavily regulated industry, and failure to comply with federal, state and foreign laboratory licensing requirements and the applicable requirements of the FDA or any other regulatory authority, could cause us to lose the ability to perform our tests, experience disruptions to our business, or become subject to administrative or judicial sanctions.
The diagnostics industry is highly regulated, and the laws and regulations governing the marketing of diagnostic tests are extremely complex. Areas of the regulatory environment that may affect our ability to conduct business include, without limitation:
|
•
|
federal and state laws applicable to test ordering, documentation of tests ordered, billing practices and claims payment and/or regulatory agencies enforcing those laws and regulations;
|
|
•
|
federal and state fraud and abuse laws;
|
|
•
|
federal and state laboratory anti-mark-up laws;
|
|
•
|
coverage and reimbursement levels by Medicare, Medicaid, other governmental payors and private insurers;
|
|
•
|
restrictions on coverage of and reimbursement for tests;
|
|
•
|
federal and state laws governing laboratory testing, including CLIA, and state licensing laws;
|
|
•
|
federal and state laws and enforcement policies governing the development, use and distribution of diagnostic medical devices, including LDTs;
|
|
•
|
federal, state and local laws governing the handling and disposal of medical and hazardous waste;
|
|
•
|
federal and state Occupational Safety and Health Administration rules and regulations; and
|
|
•
|
the Health Insurance Portability and Accountability Act of 1996, or HIPAA, and similar state data privacy laws.
|
In particular, the FDCA defines a medical device to include any instrument, apparatus, implement, machine, contrivance, implant, in vitro reagent, or other similar or related article, including a component, part, or accessory, intended for use in the diagnosis of disease or other conditions, or in the cure, mitigation, treatment, or prevention of disease, in man or other animals. Our products are considered by the FDA to be subject to regulation as medical devices, and marketed under FDA’s policy of enforcement discretion for LDTs. Among other things, pursuant to the FDCA and its implementing regulations, the FDA regulates the research, testing, manufacturing, safety, labeling, storage, recordkeeping, premarket clearance or approval, marketing and promotion, and sales and distribution of medical devices in the United States to ensure that medical products distributed domestically are safe and effective for their intended uses. In addition, the FDA regulates the import and export of medical devices manufactured between the United States and international markets.
We are also subject to CLIA, a federal law that regulates clinical laboratories that perform testing on specimens derived from humans for the purpose of providing information for the diagnosis, prevention or treatment of disease. CLIA regulations establish specific standards with respect to personnel qualifications, facility administration, proficiency testing, quality control, quality assurance and inspections. Any testing subject to CLIA regulation must be performed in a CLIA certified or accredited lab. CLIA certification or accreditation is also required in order for us to be eligible to bill state and federal healthcare programs, as well as commercial third-party payors, for our products. We have a current CLIA accreditation under the College of American Pathologists, or CAP, program to conduct our tests at our clinical reference laboratory in Phoenix, Arizona.
To maintain our CLIA accreditation, we have elected to be subject to survey and inspection every two years by CAP. Moreover, CLIA inspectors may make random inspections of our laboratory from time to time.
In addition, certain states require our laboratory to be licensed in such states in order to test specimens from those states. Accordingly, our laboratory is also licensed by California, Maryland, New York, Pennsylvania and Rhode Island. Other states may have similar requirements or may adopt similar requirements in the future.
51
Although we have obtained licenses from states where we believe we are required to be licensed, we may become aware of other states that require out-of-state laboratories to obtain licensure in order to accept specimens from the state, and it is possible that other states currently have such requirements or will have such requirements in the future.
In order to test specimens from New York, LDTs must be approved by the New York State Department of Health, or NYSDOH, on a test-by-test basis before they are offered. Our laboratory director must also be separately qualified to be a laboratory director in New York. DecisionDx-UM, DecisionDx-PRAME and DecisionDx-Melanoma have each been approved and our laboratory director has been qualified by NYSDOH. We are subject to periodic inspection by the NYSDOH and are required to demonstrate ongoing compliance with NYSDOH regulations and standards. To the extent NYSDOH identified any non-compliance and we are unable to remedy such non-compliance, the State of New York could withdraw approval for our products. We will need to seek NYSDOH approval of any future LDTs we develop and want to offer for clinical testing to New York residents, and there can be no assurance that we will be able to obtain such approval.
We may also be subject to regulation in foreign jurisdictions as we seek to expand international utilization of our products or such jurisdictions adopt new licensure requirements, which may require review of our products in order to offer them or may have other limitations such as restrictions on the transport of human tissue samples necessary for us to perform our tests that may limit our ability to make our products available outside of the United States. Complying with licensure requirements in new jurisdictions may be expensive, time-consuming and subject us to significant and unanticipated delays.
CAP maintains a clinical laboratory accreditation program. While not required for the operation of a CLIA-certified laboratory, many private insurers require CAP accreditation as a condition to contracting with clinical laboratories to cover their tests. In addition, some countries outside the United States require CAP accreditation as a condition to permitting clinical laboratories to test samples taken from their citizens. CAP accredited laboratories are surveyed for compliance with CAP standards every two years in order to maintain accreditation. Failure to maintain CAP accreditation could have a material adverse effect on the sales of our products and the results of our operations. Our most recent CAP inspection occurred in the fourth quarter of 2018 and our CLIA accreditation certificate expires on December 20, 2020.
Failure to comply with applicable clinical laboratory licensure requirements may result in a range of enforcement actions, including suspension, limitation or revocation of our CLIA accreditation and/or state licenses, imposition of a directed plan of action, onsite monitoring, civil monetary penalties, criminal sanctions and revocation of the laboratory’s approval to receive Medicare and Medicaid payment for its services, as well as significant adverse publicity. Any sanction imposed under CLIA, its implementing regulations, or state or foreign laws or regulations governing clinical laboratory licensure or our failure to renew our CLIA accreditation, or a state or foreign license, could have a material adverse effect on our business, financial condition and results of operations. Even if we were able to bring our laboratory back into compliance, we could incur significant expenses and potentially lose revenue in doing so.
The FDA may modify its enforcement discretion policy with respect to LDTs in a risk-based manner, and we may become subject to extensive regulatory requirements and may be required to conduct additional clinical trials prior to continuing to sell our existing tests or launching any other tests we may develop, which may increase the cost of conducting, or otherwise harm, our business.
If the FDA changes or ends its policy of enforcement discretion with respect to LDTs, and our products become subject to the FDA’s requirements for premarket review of medical devices, we may be required to cease commercial sales of our products and conduct clinical trials prior to making submissions to the FDA to obtain premarket clearance or approval. If we are required to conduct such clinical trials, delays in the commencement or completion of clinical trials could significantly increase our product development costs and delay commercialization of any currently marketed testing that we may be required to cease selling or the commercialization of any future tests that we may develop. Many of the factors that may cause or lead to a delay in the commencement or completion of clinical trials may also ultimately lead to delay or denial of regulatory clearance or approval. The commencement of clinical trials may be delayed due to insufficient patient enrollment, which is a function of many factors, including the size of the patient population, the nature of the protocol, the proximity of patients to clinical sites and the eligibility criteria for the clinical trial.
The FDA requires medical device manufacturers to comply with, among other things, current good manufacturing practices for medical devices, known as the Quality System Regulation, which requires manufacturers to follow elaborate design, testing, control, documentation and other quality assurance procedures during the manufacturing process; the medical device reporting regulation, which requires that manufacturers report to the FDA if their device may have caused or contributed to a death or serious injury or malfunctioned in a way that would likely cause or contribute to a death or serious injury if it were to recur; labeling regulations, including the FDA’s general prohibition against promoting products for unapproved or ‘‘off-label’’ uses; and the reports of corrections and removals regulation, which requires manufacturers to report to the FDA if a device correction
52
or removal was initiated to reduce a risk to health posed by the device or to remedy a violation of the FDCA caused by the device which may present a risk to health.
Even if we were able to obtain FDA clearance or approval for one or more of our products, if required, a diagnostic test may be subject to limitations on the indications for which it may be marketed or to other regulatory conditions. In addition, such clearance or approval may contain requirements for costly post-market testing and surveillance to monitor the safety or efficacy of the test.
In addition, the FDA’s and other regulatory authorities’ policies may change and additional government regulations may be enacted that could prevent, limit or delay regulatory approvals. If we are slow or unable to adapt to changes in existing requirements or the adoption of new requirements or policies, or if we are not able to maintain regulatory compliance, we may lose any marketing authorization that we may have obtained and we may not achieve or sustain profitability, which would adversely affect our business, prospects, financial condition and results of operations.
Interim, topline and preliminary data from our clinical studies that we announce or publish from time to time may change as more data become available and are subject to audit and verification procedures that could result in material changes in the final data.
From time to time, we may publicly disclose preliminary or topline or data from our clinical studies, which is based on a preliminary analysis of then-available data, and the results and related findings and conclusions are subject to change following a more comprehensive review of the data related to the particular study. We also make assumptions, estimations, calculations and conclusions as part of our analyses of data, and we may not have received or had the opportunity to fully and carefully evaluate all data. As a result, the topline results that we report may differ from future results of the same studies, or different conclusions or considerations may qualify such results, once additional data have been received and fully evaluated. Topline data also remain subject to audit and verification procedures that may result in the final data being materially different from the preliminary data we previously published. As a result, topline data should be viewed with caution until the final data are available. From time to time, we may also disclose interim data from our clinical studies. Interim data from clinical studies that we may complete are subject to the risk that one or more of the clinical outcomes may materially change as more patient data become available. Adverse differences between preliminary or interim data and final data could significantly harm our reputation and marketing efforts.
Further, others, including healthcare providers or payors, may not accept or agree with our assumptions, estimates, calculations, conclusions or analyses or may interpret or weigh the importance of data differently, which could impact the value of the particular program, the approvability or commercialization of the particular product candidate or product and our company in general. In addition, the information we choose to publicly disclose regarding a particular study is based on what is typically extensive information, and you or others may not agree with what we determine is the material or otherwise appropriate information to include in our disclosure, and any information we determine not to disclose may ultimately be deemed significant with respect to future decisions, conclusions, views, activities or otherwise regarding our business. If the topline or interim data that we report differ from actual results, or if others, including healthcare providers or payors, disagree with the conclusions reached, our ability to commercialize, our product candidates may be harmed, which could harm our business, operating results, prospects or financial condition.
Changes in health care policy could increase our costs, decrease our revenues and impact sales of and reimbursement for our products.
In March 2010, the ACA became law. This law substantially changed the way health care is financed by both government and commercial third-party payors, and significantly impacted our industry. The ACA contains a number of provisions that are expected to impact our business and operations, some of which in ways we cannot currently predict, including those governing enrollment in state and federal health care programs, reimbursement changes and fraud and abuse, which impact existing state and federal health care programs and will result in the development of new programs. Among other things, the ACA required medical device manufacturers to pay a sales tax equal to 2.3% of the price for which such manufacturer sells its medical devices, and began to apply to sales of taxable medical devices after December 31, 2012, but was suspended in 2016. Further, the
2020 federal spending package permanently eliminated, effective January 1, 2020, the medical device tax and “Cadillac” tax on high-cost employer-sponsored health coverage and, effective January 1, 2021, also eliminates the health insurer tax.
Since 2016 there have been efforts to repeal all or part of the ACA, and the current administration and the U.S. Congress have taken action to roll back certain provisions of the ACA. The current administration and the U.S. Congress may take further action regarding the ACA, including, but not limited to, repeal or replacement.
53
Additionally, on December 14, 2018, a Texas U.S. District Court Judge ruled that the ACA is unconstitutional in its entirety because the tax penalty on certain individuals who fail to maintain qualifying health coverage for all or part of a year, commonly referred to as the ‘‘individual mandate,’’ was repealed by Congress as part of the Tax Cuts and Jobs Act of 2017, or the TCJA.
Additionally, on December 18, 2019, the U.S. Court of Appeals for the 5th Circuit ruled that the individual mandate was unconstitutional and remanded the case back to the District Court to determine whether the remaining provisions of the ACA are invalid as well. On March 2, 2020, the United States Supreme Court granted the petitions for writs of certiorari to review this case and has allotted one hour for oral arguments. It is unclear when such oral arguments are to be held and when a decision is expected to be made.
It is also unclear how such litigation and other efforts to repeal and replace the ACA will impact the ACA and our business.
On August 2, 2011, the Budget Control Act of 2011 was signed into law, which, among other things, reduced Medicare payments to providers by 2% per fiscal year, effective on April 1, 2013 and, due to subsequent legislative amendments to the statute, will remain in effect through 2029, unless additional Congressional action is taken.
We anticipate there will continue to be proposals by legislators at both the federal and state levels, regulators and commercial third-party payors to reduce costs while expanding individual healthcare benefits. Certain of these changes could impose additional limitations on the prices we will be able to charge for our products, the coverage of or the amounts of reimbursement available for our products from third-party payors, including government and commercial payors.
We are subject to numerous federal and state healthcare statutes and regulations, and complying with laws pertaining to our business is an expensive and time-consuming process. If we are unable to comply, or have not fully complied, with such laws, we could face substantial penalties and a material adverse effect to our business and operations.
Physicians, other healthcare providers and third-party payors play a primary role in the recommendation of our products. Our arrangements with healthcare providers, third-party payors and customers may expose us to broadly applicable fraud and abuse and other healthcare laws and regulations that affect the business and financial arrangements and relationships through which we market and sell our products. The laws that affect our ability to operate include, but are not limited to:
|
•
|
the federal Anti-Kickback Statute, or the AKS, which prohibits, among other things, any person or entity from knowingly and willfully soliciting, receiving, offering or paying any remuneration, directly or indirectly, overtly or covertly, in cash or in kind, to induce or reward either the referral of an individual for, or the purchase, order or recommendation of an item or service reimbursable, in whole or in part, under a federal healthcare program, such as the Medicare and Medicaid programs. The term ‘‘remuneration’’ has been broadly interpreted to include anything of value, such as specimen collection materials or test kits. There are a number of statutory exceptions and regulatory safe harbors protecting some common activities from prosecution, however these are drawn narrowly. Additionally, a person or entity does not need to have actual knowledge of the statute or specific intent to violate it in order to have committed a violation. Violations are subject to civil and criminal fines and monetary penalties of up to $100,000 for each violation, plus up to three times the remuneration involved, imprisonment of up to ten years and exclusion from government healthcare programs. In addition, the ACA codified case law that a claim including items or services resulting from a violation of the AKS constitutes a false or fraudulent claim for purposes of the federal False Claims Act, or the FCA;
|
|
•
|
the Stark Law, which prohibits a physician from making a referral for certain designated health services covered by the Medicare or Medicaid program, including laboratory and pathology services, if the physician or an immediate family member of the physician has a financial relationship with the entity providing the designated health services and prohibits that entity from billing, presenting or causing to be presented a claim for the designated health services furnished pursuant to the prohibited referral, unless an exception applies. Sanctions for violating the Stark Law include denial of payment, civil monetary penalties and exclusion from the federal health care programs. Failure to refund amounts received as a result of a prohibited referral on a timely basis may constitute a false or fraudulent claim and may result in civil penalties and additional penalties under the FCA;
|
|
•
|
federal civil and criminal false claims laws and civil monetary penalty laws, such as the FCA, which can be enforced by private citizens through civil qui tam actions, prohibits individuals or entities from, among other things, knowingly presenting, or causing to be presented through distribution of template medical necessity language or other coverage and reimbursement information, false, fictitious or fraudulent claims for payment or approval by the federal government, including federal health care programs, such as Medicare and Medicaid, and knowingly making, using or causing to be made or used a false record or statement material to a false or fraudulent claim, or knowingly making a false statement to improperly avoid, decrease or conceal an obligation to pay money to the federal government. In addition, a claim including items or services resulting from a violation of the AKS constitutes a false or fraudulent
|
54
claim for purposes of the FCA. Private individuals can bring False Claims Act ‘‘qui tam’’ actions, on behalf of the government and such individuals, commonly known as ‘‘whistleblowers,’’ may share in amounts paid by the entity to the government in fines or settlement. When an entity is determined to have violated the federal civil False Claims Act, the government may impose civil fines and penalties, plus treble damages, and exclude the entity from participation in Medicare, Medicaid and other federal healthcare programs;
|
•
|
HIPAA, which, among other things, imposes criminal liability for executing or attempting to execute a scheme to defraud any healthcare benefit program, including private third-party payors, knowingly and willfully embezzling or stealing from a healthcare benefit program, willfully obstructing a criminal investigation of a healthcare offense, and knowingly and willfully falsifying, concealing or covering up a material fact or making any materially false, fictitious or fraudulent statement or representation, in connection with the delivery of or payment for healthcare benefits, items or services. Like the AKS, a person or entity does not need to have actual knowledge of the statute or specific intent to violate it in order to have committed a violation;
|
|
•
|
HIPAA, as amended by the Health Information Technology for Economic and Clinical Health Act, or HITECH, and their implementing regulations, which imposes privacy, security and breach reporting obligations with respect to individually identifiable health information upon entities subject to the law, such as health plans, healthcare clearinghouses and certain healthcare providers, known as covered entities, and their respective business associates, individuals or entities that perform services for them that involve individually identifiable health information. Failure to comply with the HIPAA privacy and security standards can result in civil monetary penalties, and, in certain circumstances, criminal penalties. HITECH also created new tiers of civil monetary penalties, amended HIPAA to make civil and criminal penalties directly applicable to business associates, and gave state attorneys general new authority to file civil actions for damages or injunctions in U.S. federal courts to enforce HIPAA and seek attorneys’ fees and costs associated with pursuing federal civil actions;
|
|
•
|
state laws that prohibit other specified practices, such as billing physicians for tests that they order or providing tests at no or discounted cost to induce physician or patient adoption; insurance fraud laws; waiving coinsurance, copayments, deductibles, and other amounts owed by patients; billing a state Medicaid program at a price that is higher than what is charged to one or more other third-party payors employing, exercising control over or splitting professional fees with licensed professionals in violation of state laws prohibiting fee splitting or the corporate practice of medicine and other professions; and
|
|
•
|
federal and state consumer protection and unfair competition laws, which broadly regulate marketplace activities and activities that potentially harm consumers;
|
|
•
|
the federal transparency requirements under the Physician Payments Sunshine Act, created under the ACA, which requires, among other things, certain manufacturers of drugs, devices, biologics and medical supplies reimbursed under Medicare, Medicaid, or the Children’s Health Insurance Program to annually report to CMS information related to payments and other transfers of value provided to physicians, certain other healthcare professionals, and teaching hospitals and physician ownership and investment interests, including such ownership and investment interests held by a physician’s immediate family members. Failure to submit required information may result in civil monetary penalties for all payments, transfers of value or ownership or investment interests that are not timely, accurately, and completely reported in an annual submission, and may result in liability under other federal laws or regulations. We believe that we are exempt from these reporting requirements. We cannot assure you, however, that our regulators, principally the federal government, will agree with our determination, and a determination that we have violated these laws and regulations, or a public announcement that we are being investigated for possible violations, could adversely affect our business;
|
|
•
|
the prohibition on reassignment of Medicare claims, which, subject to certain exceptions, precludes the reassignment of Medicare claims to any other part;
|
|
•
|
state and foreign law equivalents of each of the above federal laws, such as anti-kickback and false claims laws, that may impose similar or more prohibitive restrictions, and may apply to items or services reimbursed by any non-governmental third-party payors, including private insurers; and
|
|
•
|
federal, state and foreign laws that govern the privacy and security of health information or personally identifiable information in certain circumstances, including state health information privacy and data breach notification laws which govern the collection, use, disclosure, and protection of health-related and other personal information, many of which differ from each other in significant ways and often are not pre-empted by HIPAA, thus complicating compliance efforts.
|
55
As a clinical laboratory, our business practices may face additional scrutiny from government regulatory agencies such as the Department of Justice, the U.S. Department of Health and Human Services Office of Inspector General, or OIG, and CMS. Certain arrangements between clinical laboratories and referring physicians have been identified in fraud alerts issued by the OIG as implicating the AKS. The OIG has stated that it is particularly concerned about these types of arrangements because the choice of laboratory, as well as the decision to order laboratory tests, typically are made or strongly influenced by the physician, with little or no input from patients. Moreover, the provision of payments or other items of value by a clinical laboratory to a referral source could be prohibited under the Stark Law unless the arrangement meets all criteria of an applicable exception. The government has been active in enforcement of these laws as they apply to clinical laboratories.
We have entered into consulting and scientific advisory board arrangements, speaking arrangements and clinical research agreements with physicians and other healthcare providers, including some who could influence the use of our products. Because of the complex and far-reaching nature of these laws, regulatory agencies may view these transactions as prohibited arrangements that must be restructured, or discontinued, or for which we could be subject to other significant penalties. We could be adversely affected if regulatory agencies interpret our financial relationships with providers who may influence the ordering of and use of our products to be in violation of applicable laws.
The scope and enforcement of each of these laws is uncertain and subject to rapid change in the current environment of healthcare reform. Federal and state enforcement bodies have recently increased their scrutiny of interactions between healthcare companies, healthcare providers and other third parties, including charitable foundations, which has led to a number of investigations, prosecutions, convictions and settlements in the healthcare industry. It is possible that governmental authorities may conclude that our business practices, including our consulting arrangements with physicians, as well as our financial assistance programs, do not comply with current or future statutes, regulations, agency guidance or case law involving applicable healthcare laws. Responding to investigations can be time and resource-consuming and can divert management’s attention from the business. Any such investigation or settlement could increase our costs or otherwise have an adverse effect on our business.
Ensuring that our business arrangements with third parties comply with applicable healthcare laws and regulations is costly. If our operations are found to be in violation of any of these laws or any other current or future governmental laws and regulations that may apply to us, we may be subject to significant civil, criminal and administrative penalties, damages, fines, disgorgement, individual imprisonment, exclusion from government funded healthcare programs, such as Medicare and Medicaid, contractual damages, reputational harm, diminished profits and future earnings, additional reporting obligations and oversight if we become subject to a corporate integrity agreement or other agreement to resolve allegations of non-compliance with these laws, and the curtailment or restructuring of our operations, any of which could substantially disrupt our operations. If any of the physicians or other healthcare providers or entities with whom we do business is found to be not in compliance with applicable laws, they may be subject to criminal, civil or administrative sanctions, including exclusions from government funded healthcare programs.
We are subject to certain U.S. anti-corruption, anti-money laundering, export control, sanctions, and other trade laws and regulations and may become subject to their similar foreign equivalents. We can face serious consequences for violations.
U.S. and foreign anti-corruption, anti-money laundering, export control, sanctions, and other trade laws and regulations, or collectively, Trade Laws, prohibit, among other things, companies and their employees, agents, legal counsel, accountants, consultants, contractors, and other partners from authorizing, promising, offering, providing, soliciting, or receiving, directly or indirectly, corrupt or improper payments or anything else of value to or from recipients in the public or private sector. Violations of Trade Laws can result in substantial criminal fines and civil penalties, imprisonment, the loss of trade privileges, debarment, tax reassessments, breach of contract and fraud litigation, reputational harm, and other consequences. We have direct or indirect interactions with officials and employees of government agencies or government-affiliated hospitals, universities, and other organizations. We also expect that we may engage in non-U.S. activities over time. We expect to rely on third-party suppliers and/or third parties to obtain necessary permits, licenses, and patent registrations. We can be held liable for the corrupt or other illegal activities of our personnel, agents, or partners, even if we do not explicitly authorize or have prior knowledge of such activities. Any violations of the laws and regulations described above may result in substantial civil and criminal fines and penalties, imprisonment, the loss of export or import privileges, debarment, tax reassessments, breach of contract and fraud litigation, reputational harm and other consequences.
56
Our collection, use and disclosure of individually identifiable information, including health and/or employee information, is subject to state, federal and foreign privacy and security regulations, and our failure to comply with those regulations or to adequately secure the information we hold could result in significant liability or reputational harm.
We and any potential collaborators are subject to federal, state, and foreign data protection laws and regulations (i.e., laws and regulations that address privacy and data security). In the United States, numerous federal and state laws and regulations, including federal health information privacy laws, state data breach notification laws, state health information privacy laws, and federal and state consumer protection laws (e.g., Section 5 of the Federal Trade Commission Act), that govern the collection, use, disclosure, and protection of health-related and other personal information could apply to our operations or the operations of our collaborators.
In the ordinary course of our business, we collect and store sensitive data, including protected health information, or PHI, personally identifiable information, or PII, credit card and other financial information, intellectual property and proprietary business information owned or controlled by ourselves or our customers, payors and other parties. We manage and maintain our applications and data utilizing a combination of on-site systems, managed data centers, and cloud-based data centers. We utilize external security and infrastructure vendors to manage parts of our data centers.
The secure processing, storage, maintenance and transmission of this critical information is vital to our operations and business strategy, and we devote significant resources to protecting such information. Although we take measures to protect sensitive data from unauthorized access, use or disclosure, our information technology and infrastructure may be vulnerable to attacks by hackers or viruses or breached due to employee error, malfeasance, or other malicious or inadvertent disruptions. Any such breach or interruption could compromise our networks and the information stored there could be accessed by unauthorized parties, publicly disclosed, lost, or stolen. Any such access, breach, or other loss of information could result in legal claims or proceedings, and liability under federal or state laws that protect the privacy of personal information, such as HIPAA, as amended by HITECH, and regulatory penalties. Notice of breaches must be made to affected individuals, the Secretary of the Department of Health and Human Services, and for extensive breaches, notice may need to be made to the media or State Attorneys General. Such a notice could harm our reputation and our ability to compete. Although we have implemented security measures and a formal, dedicated enterprise security program to prevent unauthorized access to patient data, such data is currently accessible through multiple channels, and there is no guarantee we can protect our data from breach. Unauthorized access, loss or dissemination could also disrupt our operations (including our ability to conduct our analyses, provide test results, bill payers or patients, process claims and appeals, provide customer assistance, conduct research and development activities, collect, process, and prepare company financial information, provide information about our products and other patient and physician education and outreach efforts through our website, and manage the administrative aspects of our business) and damage our reputation, any of which could adversely affect our business. In addition, we may obtain health information from third parties that are also subject to privacy and security requirements under HIPAA, as amended by HITECH.
Further, various states, such as California and Massachusetts, have implemented similar privacy laws and regulations, such as the California Confidentiality of Medical Information Act, that impose restrictive requirements regulating the use and disclosure of health information and other personally identifiable information. These laws and regulations are not necessarily preempted by HIPAA, particularly if a state affords greater protection to individuals than HIPAA. Where state laws are more protective, we have to comply with the stricter provisions. In addition to fines and penalties imposed upon violators, some of these state laws also afford private rights of action to individuals who believe their personal information has been misused. California’s patient privacy laws, for example, provide for penalties of up to $250,000 and permit injured parties to sue for damages. The interplay of federal and state laws may be subject to varying interpretations by courts and government agencies, creating complex compliance issues for us and our clients and potentially exposing us to additional expense, adverse publicity and liability. Further, as regulatory focus on privacy issues continues to increase and laws and regulations concerning the protection of personal information expand and become more complex, these potential risks to our business could intensify. Changes in laws or regulations associated with the enhanced protection of certain types of sensitive data, such PHI or PII along with increased customer demands for enhanced data security infrastructure, could greatly increase our cost of providing our services, decrease demand for our services, reduce our revenue and/or subject us to additional liabilities.
Compliance with U.S. and international data protection laws and regulations could require us to take on more onerous obligations in our contracts, restrict our ability to collect, use and disclose data, or in some cases, impact our ability to operate in certain jurisdictions. Failure to comply with U.S. and international data protection laws and regulations could result in government enforcement actions (which could include civil, criminal, and administrative penalties), private litigation, and/or adverse publicity and could negatively affect our operating results and business. Claims that we have violated individuals’
57
privacy rights, failed to comply with data protection laws, or breached our contractual obligations, even if we are not found liable, could be expensive and time-consuming to defend and could result in adverse publicity that could harm our business.
Ethical, legal and social concerns related to the use of genetic information could reduce demand for our products.
Genetic testing has raised ethical, legal, and social issues regarding privacy and the appropriate uses of the resulting information. Governmental authorities have, through the Genetic Information Nondisclosure Act of 2008, and could further, for social or other purposes, limit or regulate the use of genetic information or genetic testing or prohibit testing for genetic predisposition to certain conditions, particularly for those that have no known cure. Ethical and social concerns may also influence governmental authorities to deny or delay the issuance of patents for technology relevant to our business. While we do not currently perform genetic tests for genetic predisposition to certain conditions, these concerns may lead patients to refuse to use, or clinicians to be reluctant to order, our genomic tests or genetic tests for somatic mutations even if permissible. These and other ethical, legal and social concerns may limit market acceptance of our products or reduce the potential markets for our products, either of which could have an adverse effect on our business, financial condition, or results of operations.
Risks Related to Intellectual Property
If we are unable to obtain and maintain sufficient intellectual property protection for our technology, or if the scope of the intellectual property protection obtained is not sufficiently broad, our competitors could develop and commercialize diagnostic tests similar or identical to ours, and our ability to successfully commercialize our products may be impaired.
We rely on patent protection as well as trademark, copyright, trade secret and other intellectual property rights protection as well as nondisclosure, confidentiality and other contractual restrictions to protect our brands and proprietary tests and technologies, all of which provide limited protection and may not adequately protect our rights or permit us to gain or keep any competitive advantage. If we fail to protect our intellectual property, third parties may be able to compete more effectively against us. In addition, we may incur substantial litigation costs in our attempts to recover or restrict use of our intellectual property.
As is the case with other life science companies, our success depends in large part on our ability to obtain and maintain protection of the intellectual property we may own solely or jointly with others or in-license from others, particularly patents, in the United States and other countries with respect to our products and technologies. We apply for patents covering our products and technologies and uses thereof, as we deem appropriate. However, obtaining and enforcing life sciences patents is costly, time-consuming and complex, and we may fail to apply for patents on important tests, services and technologies in a timely fashion or at all, or we may fail to apply for patents in potentially relevant jurisdictions. We may not be able to file and prosecute all necessary or desirable patent applications, or maintain, enforce and license any patents that may issue from such patent applications, at a reasonable cost or in a timely manner. It is also possible that we will fail to identify patentable aspects of our research and development output before it is too late to obtain patent protection.
We may not have the right to control the preparation, filing and prosecution of patent applications, or to maintain the rights to patents licensed from or to third parties. Therefore, these patents and applications may not be prosecuted and enforced in a manner consistent with the best interests of our business.
Our patent portfolio includes five issued U.S. patents and three pending U.S. patent applications, with foreign counterparts. It is possible that none of our pending patent applications will result in issued patents in a timely fashion or at all, and even if patents are granted, they may not provide a basis for intellectual property protection of commercially viable tests or services, may not provide us with any competitive advantages, or may be challenged and invalidated by third parties. It is possible that others will design around our future patented technologies. We may not be successful in defending any such challenges made against our patents or patent applications. Any successful third-party challenge to our patents could result in the unenforceability or invalidity of such patents and increased competition to our business. Even if our patents are held valid and enforceable, they may still be found insufficient to provide protection against competing products and services sufficient to achieve our business objectives. We may have to challenge the patents or patent applications of third parties, such as to counter infringement or unauthorized use. In addition, in an infringement proceeding, a court may decide that a patent of ours is invalid or unenforceable, or may refuse to enjoin the other party from using the technology at issue on the grounds that our patents do not cover the technology in question. Even if we prevail against an infringer in a U.S. district court or foreign trial-level court, there is always the risk that the infringer will file an appeal and the initial court judgment will be overturned at the appeals court and/or that an adverse decision will be issued by the appeals court relating to the validity or enforceability of our patents. The outcome of patent litigation or other proceeding can be uncertain, and any attempt by us to enforce our patent rights against others or to challenge the patent rights of others may not be successful, or, if successful, may take substantial time and result in substantial cost, and may divert our efforts and attention from other aspects of our business.
58
The patent positions of life sciences companies can be highly uncertain and involve complex legal and factual questions for which important legal principles remain unresolved. No consistent policy regarding the breadth of claims allowed in such companies’ patents has emerged to date in the United States or elsewhere. Courts frequently render opinions in the life sciences field that may affect the patentability of certain inventions or discoveries, including opinions that may affect the patentability of methods for analyzing or comparing DNA sequences.
In particular, the patent positions of companies engaged in the development and commercialization of genomic diagnostic tests are particularly uncertain. Various courts, including the U.S. Supreme Court, have rendered decisions that affect the scope of patentability of certain inventions or discoveries relating to certain diagnostic tests and related methods. These decisions state, among other things, that a patent claim that recites an abstract idea, natural phenomenon or law of nature (for example, the relationship between particular genetic variants and cancer) are not themselves patentable. Precisely what constitutes a law of nature is uncertain, and it is possible that certain aspects of genetic diagnostics tests would be considered natural laws. Accordingly, the evolving case law in the United States may adversely affect our ability to obtain patents and may facilitate third-party challenges to any owned or licensed patents. The laws of some foreign countries do not protect intellectual property rights to the same extent as the laws of the United States, and we may encounter difficulties in protecting and defending such rights in foreign jurisdictions. The legal systems of many other countries do not favor the enforcement of patents and other intellectual property protection, particularly those relating to life science technologies, which could make it difficult for us to stop the infringement of our patents in such countries. Proceedings to enforce our patent rights in foreign jurisdictions could result in substantial cost and divert our efforts and attention from other aspects of our business.
To the extent our intellectual property offers inadequate protection, or is found to be invalid or unenforceable, we would be exposed to a greater risk of direct competition, and our competitive position could be adversely affected, as could our business. Both the patent application process and the process of managing patent disputes can be time-consuming and expensive. Moreover, if a third party has intellectual property rights that cover the practice of our technology, we may not be able to fully exercise or extract value from our intellectual property rights. The following examples are illustrative:
|
•
|
others may be able to develop and/or practice technology that is similar to our technology or aspects of our technology, but that are not covered by the claims of the patents that we own or control, assuming such patents have issued or do issue;
|
|
•
|
we or our licensors or any future strategic partners might not have been the first to conceive or reduce to practice the inventions covered by the issued patents or pending patent applications that we own or have exclusively licensed;
|
|
•
|
we or our licensors or any future strategic partners might not have been the first to file patent applications covering certain of our inventions;
|
|
•
|
others may independently develop similar or alternative technologies or duplicate any of our technologies without infringing our intellectual property rights;
|
|
•
|
it is possible that our pending patent applications will not lead to issued patents;
|
|
•
|
issued patents that we own or have exclusively licensed may not provide us with any competitive advantage, or may be held invalid or unenforceable, as a result of legal challenges by our competitors;
|
|
•
|
our competitors might conduct research and development activities in countries where we do not have patent rights and then use the information learned from such activities to develop competitive tests for sale in our major commercial markets;
|
|
•
|
third parties performing manufacturing or testing for us using our products or technologies could use the intellectual property of others without obtaining a proper license;
|
|
•
|
parties may assert an ownership interest in our intellectual property and, if successful, such disputes may preclude us from exercising exclusive rights over that intellectual property;
|
|
•
|
we may not develop or in-license additional proprietary technologies that are patentable;
|
|
•
|
we may not be able to obtain and maintain necessary licenses on commercially reasonable terms, or at all; and
|
|
•
|
the patents of others may have an adverse effect on our business.
|
Should any of these events occur, they could significantly harm our business and results of operations.
59
Changes in patent law in the United States and other jurisdictions could diminish the value of patents in general, thereby impairing our ability to protect our products.
As is the case with other life sciences companies, our success is heavily dependent on intellectual property, particularly patents relating to our research programs and products. Obtaining and enforcing patents in the life sciences industry involves both technological and legal complexity and is therefore costly, time consuming and inherently uncertain. Changes in either the patent laws or interpretation of the patent laws in the United States or the USPTO rules and regulations could increase these uncertainties and costs. Recent patent reform legislation in the United States and other countries, including the Leahy-Smith America Invents Act, or the AIA, signed into law on September 16, 2011, could increase those uncertainties and costs surrounding the prosecution of our patent applications and the enforcement or defense of our issued patents. The AIA includes a number of significant changes to U.S. patent law. These include provisions that affect the way patent applications are prosecuted, redefine prior art and provide more efficient and cost-effective avenues for competitors to challenge the validity of patents. These include allowing third-party submission of prior art to the USPTO during patent prosecution and additional procedures to attack the validity of a patent in USPTO administered post-grant proceedings, including post-grant review,
inter partes
review, and derivation proceedings. For applications filed after March 15, 2013 that do not claim the benefit of applications filed before that date, the AIA transitioned the United States from a first to invent system to a first-inventor-to-file system in which, assuming that the other statutory requirements are met, the first inventor to file a patent application will be entitled to the patent on an invention regardless of whether a third party was the first to invent the claimed invention. The AIA and its implementation could increase the uncertainties and costs surrounding the prosecution of our patent applications, our ability to obtain future patents, and the enforcement or defense of our issued patents, all of which could have a material adverse effect on our business, financial condition, results of operations and prospects.
The U.S. Supreme Court has ruled on several patent cases in recent years, either narrowing the scope of patent protection available in certain circumstances or weakening the rights of patent owners in certain situations.
Depending on future actions by the U.S. Congress, the U.S. courts, the USPTO and the relevant law-making bodies in other countries, the laws and regulations governing patents could change in unpredictable ways that would weaken our ability to obtain new patents or to enforce our existing patents and patents that we might obtain in the future.
Our in-licensed intellectual property has been discovered through government funded programs and thus may be subject to federal regulations such as ‘‘march-in’’ rights, certain reporting requirements and a preference for U.S.-based companies, and compliance with such regulations may limit our exclusive rights, and limit our ability to contract with non-U.S. manufacturers.
Intellectual property rights that have been in-licensed pursuant to our license agreement, or the License Agreement, with WUSTL have been generated through the use of U.S. government funding, and are therefore subject to certain federal regulations. As a result, the United States federal government may retain certain rights to intellectual property embodied in our current or future product candidates under the Bayh-Dole Act. These federal government rights include a ‘‘nonexclusive, nontransferable, irrevocable, paid-up license’’ to use inventions for any governmental purpose. The Bayh-Dole Act also provides federal agencies with ‘‘march-in rights.’’ March-in rights allow the government, in specified circumstances, to require the contractor or successors in title to the patent to grant a ‘‘nonexclusive, partially exclusive, or exclusive license’’ to a ‘‘responsible applicant or applicants’’ if it determines that (1) adequate steps have not been taken to commercialize the invention, (2) government action is necessary to meet public health or safety needs or (3) government action is necessary to meet requirements for public use under federal regulations. If the patent owner refuses to do so, the government may grant the license itself.
The U.S. government also has the right to take title to these inventions if the licensor fails to disclose the invention to the government or fails to file an application to register the intellectual property within specified time limits. Intellectual property generated under a government funded program is also subject to certain reporting requirements, compliance with which may require us to expend substantial resources. In addition, the U.S. government requires that any products embodying any of these inventions or produced through the use of any of these inventions be manufactured substantially in the United States, and the License Agreement requires that we comply with this requirement. This preference for U.S. industry may be waived by the federal agency that provided the funding if the owner or assignee of the intellectual property can show that reasonable but unsuccessful efforts have been made to grant licenses on similar terms to potential licensees that would be likely to manufacture substantially in the United States or that under the circumstances domestic manufacture is not commercially feasible. This preference for U.S. industry may limit our ability to contract with non-U.S. product manufacturers for products covered by such intellectual property. To the extent any of our owned or future in-licensed intellectual property is also generated through the use of U.S. government funding, the provisions of the Bayh-Dole Act may similarly apply.
60
Issued patents covering our products and related technologies could be found invalid or unenforceable if challenged.
The issuance of a patent is not conclusive as to its inventorship, scope, validity or enforceability. Some of our patents or patent applications (including licensed patents) have been, are being or may be challenged at a future point in time in an opposition, nullification, derivation, reexamination,
inter partes
review, post-grant review or interference action in court or before patent offices or similar proceedings for a given period after allowance or grant, during which time third parties can raise objections against such grant. In the course of such proceedings, which may continue for a protracted period of time, the patent owner may be compelled to limit the scope of the allowed or granted claims thus attacked, or may lose the allowed or granted claims altogether. Any successful third-party challenge to our patents in this or any other proceeding could result in the unenforceability or invalidity of such patents, which may lead to increased competition to our business, which could harm our business. In addition, if the breadth or strength of protection provided by our patents and patent applications is threatened, regardless of the outcome, it could dissuade companies from collaborating with us to license, develop or commercialize current or future diagnostic tests.
We may not be aware of all third-party intellectual property rights potentially relating to our products. Publications of discoveries in the scientific literature often lag behind the actual discoveries, and patent applications in the United States and other jurisdictions are typically not published until approximately 18 months after filing or, in some cases (
e.g
., U.S. applications for which a request not to publish has been filed), not until such patent applications issue as patents. We might not have been the first to make the inventions covered by each of our pending patent applications and we might not have been the first to file patent applications for these inventions. To determine the priority of these inventions, we have and may have to participate in interference proceedings, derivation proceedings or other post-grant proceedings declared by the USPTO that could result in substantial cost to us. The outcome of such proceedings is uncertain. We can give no assurance that all of the potentially relevant art relating to our patents and patent applications has been found; overlooked prior art could be used by a third party to challenge the validity, enforceability and scope of our patents or prevent a patent from issuing from a pending patent application. As a result, we may not be able to obtain or maintain protection for certain inventions. No assurance can be given that other patent applications will not have priority over our patent applications. In addition, changes to the patent laws of the United States allow for various post-grant opposition proceedings that have not been extensively tested, and their outcome is therefore uncertain. Therefore, the validity, enforceability and scope of our patents in the United States and other countries cannot be predicted with certainty and, as a result, any patents that we own or license may not provide sufficient protection against our competitors. Furthermore, if third parties bring these proceedings against our patents, we could experience significant costs and management distraction.
Our commercial success depends significantly on our ability to operate without infringing upon the intellectual property rights of third parties.
The life sciences industry is subject to rapid technological change and substantial litigation regarding patent and other intellectual property rights. Our potential competitors in both the United States and abroad, may have substantially greater resources and are likely to make substantial investments in patent portfolios and competing technologies, and may apply for or obtain patents that could prevent, limit or otherwise interfere with our ability to make, use and sell our products. Numerous third-party patents exist in fields relating to our products and technologies, and it is difficult for industry participants, including us, to identify all third-party patent rights relevant to our products and technologies. Moreover, because some patent applications are maintained as confidential for a certain period of time, we cannot be certain that third parties have not filed patent applications that cover our products and technologies.
Patents could be issued to third parties that we may ultimately be found to infringe. Third parties may have or obtain valid and enforceable patents or proprietary rights that could block us from using our technology. Our failure to obtain or maintain a license to any technology that we require may materially harm our business, financial condition and results of operations. Furthermore, we would be exposed to a threat of litigation.
From time to time, we may be party to, or threatened with, litigation or other proceedings with third parties, including non-practicing entities, who allege that our products, components of our products, and/or proprietary technologies infringe, misappropriate or otherwise violate their intellectual property rights. The types of situations in which we may become a party to such litigation or proceedings include:
|
•
|
we may initiate litigation or other proceedings against third parties seeking to invalidate the patents held by those third parties or to obtain a judgment that our products or technologies do not infringe those third parties’ patents;
|
|
•
|
we may participate at substantial cost in International Trade Commission proceedings to abate importation of products that would compete unfairly with our products or technologies;
|
61
|
•
|
if a competitor files patent applications that claim technology also claimed by us or our licensors, we or our licensors may be required to participate in interference, derivation or opposition proceedings to determine the priority of invention, which could jeopardize our patent rights and potentially provide a third party with a dominant patent position;
|
|
•
|
if third parties initiate litigation claiming that our products or technologies infringe their patent or other intellectual property rights, we will need to defend against such proceedings;
|
|
•
|
if third parties initiate litigation or other proceedings seeking to invalidate patents owned by or licensed to us or to obtain a declaratory judgment that their products, services, or technologies do not infringe our patents or patents licensed to us, we will need to defend against such proceedings;
|
|
•
|
we may be subject to ownership disputes relating to intellectual property, including disputes arising from conflicting obligations of consultants or others who are involved in developing our products and technologies; and
|
|
•
|
if a license to necessary technology is terminated, the licensor may initiate litigation claiming that our products or technologies infringe or misappropriate its patent or other intellectual property rights and/or that we breached our obligations under the license agreement, and we would need to defend against such proceedings.
|
These lawsuits and proceedings, regardless of merit, are time-consuming and expensive to initiate, maintain, defend or settle, and could divert the time and attention of managerial and technical personnel, which could materially adversely affect our business. Any such claim could also force us to do one or more of the following:
|
•
|
incur substantial monetary liability for infringement or other violations of intellectual property rights, which we may have to pay if a court decides that the diagnostic test or technology at issue infringes or violates the third party’s rights, and if the court finds that the infringement was willful, we could be ordered to pay treble damages and the third party’s attorneys’ fees;
|
|
•
|
stop manufacturing, offering for sale, selling, using, importing, exporting or licensing the diagnostic test or technology incorporating the allegedly infringing technology or stop incorporating the allegedly infringing technology into such test or technology;
|
|
•
|
obtain from the owner of the infringed intellectual property right a license, which may require us to pay substantial upfront fees or royalties to sell or use the relevant technology and which may not be available on commercially reasonable terms, or at all;
|
|
•
|
redesign our products and technologies so they do not infringe or violate the third party’s intellectual property rights, which may not be possible or may require substantial monetary expenditures and time;
|
|
•
|
enter into cross-licenses with applicable third party, which could weaken our overall intellectual property position;
|
|
•
|
lose the opportunity to license our technology to others or to collect royalty payments based upon successful protection and assertion of our intellectual property against others;
|
|
•
|
find alternative suppliers for non-infringing technologies, which could be costly and create significant delay; or
|
|
•
|
relinquish rights associated with one or more of our patent claims, if our claims are held invalid or otherwise unenforceable.
|
Third parties may be able to sustain the costs of complex intellectual property litigation more effectively than we can because they have substantially greater resources. In addition, intellectual property litigation, regardless of its outcome, may cause negative publicity, adversely impact our business, cause delays, or prohibit us from marketing or otherwise commercializing our products and technologies. Any uncertainties resulting from the initiation and continuation of any litigation could have a material adverse effect on our ability to raise additional funds or otherwise have a material adverse effect on our business, results of operation, financial condition or cash flows.
Furthermore, because of the substantial amount of discovery required in connection with intellectual property litigation, there is a risk that some of our confidential information could be compromised by disclosure during this type of litigation. There could also be public announcements of the results of hearings, motions or other interim proceedings or developments, which could have a material adverse effect on the price of our common stock. If securities analysts or investors perceive these results to be negative, it could have a material adverse effect on the price of our common stock. The occurrence of any of these events may have a material adverse effect on our business, results of operation, financial condition or cash flows.
62
We depend on information technology systems that we license from third parties. Any failure of such systems or loss of licenses to the software that comprises an essential element of such systems could significantly harm our business.
We depend on information technology systems for significant elements of our operations, such as our laboratory information management systems, including test validation, specimen tracking and quality control, our bioinformatics analytical software systems and our test report generating systems. Essential elements of these systems depend on software that we license from third parties. If we are unable to maintain the licenses to this software or our software providers discontinue or alter the programs on which we rely, it could render our test reports unreliable or hinder our ability to generate accurate test reports, among other things. Any of the foregoing could have a material adverse effect on our competitive position, business, financial conditions, results of operations and prospects.
We rely on licenses from third parties, and if we lose these licenses or are not able to obtain licenses to third-party technology on reasonable grounds or at all, then we may not be able to continue to commercialize existing diagnostic tests, be subjected to future litigation and may not be able to commercialize new diagnostic tests in the future.
We are party to certain royalty-bearing license agreements that grant us rights to use certain intellectual property, including patents and patent applications, in certain specified fields of use. Although we intend to develop products and technologies through our own internal research, we may need to obtain additional licenses from others to advance our research, development and commercialization activities. Our license agreements impose, and we expect that future license agreements will impose, various development, diligence, commercialization and other obligations on us.
In the future, we may identify third-party technology we may need, including to develop or commercialize new diagnostic tests or services. In return for the use of a third party’s technology, we may agree to pay the licensor royalties based on sales of our solutions. Royalties are a component of the cost of our products or services and affect our margins. We may also need to negotiate licenses to patents or patent applications before or after introducing a commercialized test. The in-licensing and acquisition of third-party intellectual property rights is a competitive area, and a number of more established companies are also pursuing strategies to in-license or acquire third-party intellectual property rights for technologies that we may consider attractive or necessary.
These established companies may have a competitive advantage over us due to their size, cash resources and greater clinical development and commercialization capabilities. Furthermore, companies that perceive us to be a competitor may be unwilling to assign or license rights to us. In addition, we expect that competition for the in-licensing or acquisition of third-party intellectual property rights for technologies that are attractive to us may increase in the future, which may mean fewer suitable opportunities for us as well as higher acquisition or licensing costs. We may not be able to obtain necessary or strategic licenses to patents or patent applications, and our business may suffer if we are unable to enter into these licenses on acceptable terms or at all, if any necessary licenses are subsequently terminated, if the licensors fail to abide by the terms of the licenses or fail to prevent infringement by third parties, or if the licensed patents or other rights are found to be invalid or unenforceable.
In spite of our efforts, our licensors might conclude that we have materially breached our obligations under such license agreements and might therefore terminate the license agreements, thereby removing or limiting our ability to develop and commercialize tests and technology covered by these license agreements. If these in-licenses are terminated, or if the underlying patents fail to provide the intended exclusivity, competitors or other third parties might have the freedom to seek regulatory approval of, and to market, tests identical to ours and we may be required to cease our development and commercialization activities. For example, we license certain intellectual property from WUSTL that is incorporated into DecisionDx-UM. In 2019, we provided more than 1,500 test reports for DecisionDx-UM. If this license agreement were terminated, we would be unable to continue to issue test reports and thus sales of DecisionDx-UM. Any of the foregoing could have a material adverse effect on our competitive position, business, financial conditions, results of operations and prospects.
Moreover, disputes may arise with respect to any one of our licensing agreements, including:
|
•
|
the scope of rights granted under the license agreement and other interpretation-related issues;
|
|
•
|
the extent to which our products, technology and processes infringe on intellectual property of the licensor that is not subject to the licensing agreement;
|
|
•
|
the sublicensing of patent and other rights under our collaborative development relationships;
|
|
•
|
our diligence obligations under the license agreement and what activities satisfy those diligence obligations;
|
|
•
|
the inventorship and ownership of inventions and know-how resulting from the joint creation or use of intellectual property by our licensors and us and our partners; and
|
|
•
|
the priority of invention of patented technology.
|
63
If we do not prevail in such disputes, we may lose any of such license agreements.
In addition, the agreements under which we currently license intellectual property or technology from third parties are complex, and certain provisions in such agreements may be susceptible to multiple interpretations.
The resolution of any contract interpretation disagreement that may arise could narrow what we believe to be the scope of our rights to the relevant intellectual property or technology, or increase what we believe to be our financial or other obligations under the relevant agreement, either of which could have a material adverse effect on our business, financial condition, results of operations and prospects. Moreover, if disputes over intellectual property that we have licensed prevent or impair our ability to maintain our current licensing arrangements on commercially acceptable terms, we may be unable to successfully develop and commercialize the affected diagnostic tests, which could have a material adverse effect on our business, financial conditions, results of operations and prospects.
Our failure to maintain such licenses could have a material adverse effect on our business, financial condition and results of operations. Any of these licenses could be terminated, such as if either party fails to abide by the terms of the license, or if the licensor fails to prevent infringement by third parties or if the licensed patents or other rights are found to be invalid or unenforceable. Absent the license agreements, we may infringe patents subject to those agreements, and if the license agreements are terminated, we may be subject to litigation by the licensor. Litigation could result in substantial costs and be a distraction to management. If we do not prevail, we may be required to pay damages, including treble damages, attorneys’ fees, costs and expenses, royalties or, be enjoined from selling our products or services, including DecisionDx-UM and DecisionDx-Melanoma, which could adversely affect our ability to offer our products or services, our ability to continue operations and our financial condition.
We may not be able to protect our intellectual property rights throughout the world.
Filing, prosecuting and defending patents on our products in all countries throughout the world would be prohibitively expensive. The requirements for patentability may differ in certain countries, particularly developing countries, and the breadth of patent claims allowed can be inconsistent. In addition, the laws of some foreign countries do not protect intellectual property rights to the same extent as the laws of the United States, and we may encounter difficulties in protecting and defending such rights in foreign jurisdictions. Consequently, we may not be able to prevent third parties from practicing our inventions in all countries outside the United States, or from selling or importing products made using our inventions in and into the United States or other jurisdictions. Competitors may use our technologies in jurisdictions where we have not obtained patent protection to develop their own tests or products and may also export infringing tests or products to territories where we have patent protection, but enforcement is not as strong as in the United States. These products may compete with our products. Our patents or other intellectual property rights may not be effective or sufficient to prevent them from competing.
Many companies have encountered significant problems in protecting and defending intellectual property rights in foreign jurisdictions. The legal systems of many other countries do not favor the enforcement of patents and other intellectual property protection, particularly those relating to life science technologies, which could make it difficult for us to stop the infringement of our patents in such countries. We do not have patent rights in certain foreign countries in which a market may exist. Moreover, in foreign jurisdictions where we do have patent rights, proceedings to enforce our patent rights could result in substantial cost and divert our efforts and attention from other aspects of our business, could put our patents at risk of being invalidated or interpreted narrowly and our patent applications at risk of not issuing, and could provoke third parties to assert claims against us. We may not prevail in any lawsuits that we initiate and the damages or other remedies awarded, if any, may not be commercially meaningful. Accordingly, our efforts to enforce our intellectual property rights around the world may be inadequate to obtain a significant commercial advantage from the intellectual property that we develop or license. We may not be able to stop a competitor from marketing and selling in foreign countries tests, products and services that are the same as or similar to our products and technologies, in which case our competitive position in the international market would be harmed.
If we are unable to protect the confidentiality of our trade secrets, the value of our technology could be materially adversely affected and our business could be harmed.
In addition to pursuing patents on our technology, we also rely on trade secrets, including unpatented know-how, technology and other proprietary information, to maintain our competitive position. We take steps to protect our trade secrets, in part, by entering into agreements, including confidentiality agreements, non-disclosure agreements and intellectual property assignment agreements, with our employees, consultants, academic institutions, corporate partners and, when needed, our advisers. However, we cannot be certain that such agreements have been entered into with all relevant parties, and we cannot be certain that our trade secrets and other confidential proprietary information will not be disclosed or that competitors will not otherwise gain access to our trade secrets or independently develop substantially equivalent information and techniques. For example, any of these parties may breach the agreements and disclose our proprietary information, including our trade secrets, and, once
64
disclosed, we are likely to lose trade secret protection and may not be able to obtain adequate remedies for such breaches. Such agreements may not be enforceable or may not provide meaningful protection for our trade secrets or other proprietary information in the event of unauthorized use or disclosure or other breaches of the agreements, and we may not be able to prevent such unauthorized disclosure. If we are required to assert our rights against such party, it could result in significant cost and distraction.
Monitoring unauthorized disclosure is difficult, and we do not know whether the steps we have taken to prevent such disclosure are, or will be, adequate. If we were to enforce a claim that a third party had illegally obtained and was using our trade secrets, it would be expensive and time-consuming, and the outcome would be unpredictable. In addition, courts outside the United States may be less willing to protect trade secrets.
We also seek to preserve the integrity and confidentiality of our confidential proprietary information by maintaining physical security of our premises and physical and electronic security of our information technology systems, but it is possible that these security measures could be breached. If any of our confidential proprietary information were to be lawfully obtained or independently developed by a competitor, absent patent protection, we would have no right to prevent such competitor from using that technology or information to compete with us, which could harm our competitive position.
We may be subject to claims that our employees, consultants or independent contractors have wrongfully used or disclosed confidential information of third parties.
We do and may employ individuals who previously worked with universities or other companies, including potential competitors. We could in the future be subject to claims that we or our employees, consultants, or independent contractors have inadvertently or otherwise used or disclosed alleged trade secrets or other confidential information of current or former employers or competitors. Although we try to ensure that our employees, consultants and independent contractors do not use the intellectual property, proprietary information, know-how or trade secrets of others in their work for us, we may become subject to claims that we caused an individual to breach the terms of his or her non-competition or non-solicitation agreement, or that we or these individuals have, inadvertently or otherwise, used or disclosed the alleged trade secrets or other proprietary information of a current or former employer or competitor. Although, we are currently not subject to any such claims.
While we may litigate to defend ourselves against these claims, even if we are successful, litigation could result in substantial costs and could be a distraction to management and other employees. If our defenses to these claims fail, in addition to requiring us to pay monetary damages, a court could prohibit us from using technologies or features that are essential to our products, if such technologies or features are found to incorporate or be derived from the trade secrets or other proprietary information of the current or former employers. Therefore, we could be required to obtain a license from such third-party employer to commercialize our products or technology. Such a license may not be available on commercially reasonable terms or at all.
Moreover, any such litigation or the threat thereof may adversely affect our reputation, our ability to form strategic alliances or sublicense our rights to collaborators, engage with scientific advisors or hire employees or consultants, each of which would have an adverse effect on our business, results of operations and financial condition.
If our trademarks and trade names are not adequately protected, then we may not be able to build name recognition in our markets of interest and our business may be adversely affected.
We have not yet registered certain of our trademarks in all of our potential markets, although we have registered, among others, DecisionDx, DecisionDx-UM and DecisionDx-Melanoma in the United States. Our current or future registered or unregistered trademarks or trade names may be challenged, infringed, circumvented or declared generic or descriptive determined to be infringing on other marks. We may not be able to protect our rights to these trademarks and trade names or may be forced to stop using these names, which we need for name recognition by potential partners or customers in our markets of interest. During trademark registration proceedings, we may receive rejections. Although we would be given an opportunity to respond to those rejections, we may be unable to overcome such rejections. In addition, in the USPTO and in comparable agencies in many foreign jurisdictions, third parties are given an opportunity to oppose pending trademark applications and to seek to cancel registered trademarks. Opposition or cancellation proceedings may be filed against our trademarks, and our trademarks may not survive such proceedings. In addition, third parties have used trademarks similar and identical to our trademarks in foreign jurisdictions, and have filed or may in the future file for registration of such trademarks. If they succeed in registering or developing common law rights in such trademarks, and if we are not successful in challenging such third-party rights, we may not be able to use these trademarks to market our products in those countries. If we are unable to establish name recognition based on our trademarks and trade names, we may not be able to compete effectively and our business may be adversely affected. We may license our trademarks and trade names to third parties, such as distributors. Although these license agreements may provide guidelines for how our trademarks and trade names may be used, a breach of these agreements or
65
misuse of our trademarks and tradenames by our licensees may jeopardize our rights in or diminish the goodwill associated with our trademarks and trade names.
We may be subject to claims challenging the inventorship of our patents and other intellectual property.
We or our licensors may be subject to claims that former employees, collaborators or other third parties have an interest in our owned or in-licensed patents, trade secrets or other intellectual property as an inventor or co-inventor. For example, we or our licensors may have inventorship disputes arise from conflicting obligations of employees, consultants or others who are involved in developing our products. Litigation may be necessary to defend against these and other claims challenging inventorship or our or our licensors’ ownership of our owned or in-licensed patents, trade secrets or other intellectual property. If we or our licensors fail in defending any such claims, in addition to paying monetary damages, we may lose valuable intellectual property rights, such as exclusive ownership of, right to use, or right to exclude others from using, intellectual property that is important to our products. Even if we are successful in defending against such claims, litigation could result in substantial costs and be a distraction to management and other employees. Any of the foregoing could have a material adverse effect on our business, financial condition, results of operations and prospects.
In addition, while it is our policy to require our employees and contractors who may be involved in the development of intellectual property to execute agreements assigning such intellectual property to us, we may be unsuccessful in executing such an agreement with each party who in fact develops intellectual property that we regard as our own. Our assignment agreements may not be self-executing or may be breached, and we may be forced to bring claims against third parties, or defend claims they may bring against us, to determine the ownership of what we regard as our intellectual property.
Obtaining and maintaining our patent protection depends on compliance with various required procedures, document submissions, fee payments and other requirements imposed by governmental patent agencies, and our patent protection could be reduced or eliminated for non-compliance with these requirements.
Periodic maintenance fees, renewal fees, annuity fees and various other governmental fees on patents and/or applications must be paid to the USPTO and various governmental patent agencies outside of the United States at several stages over the lifetime of the patents and/or applications. We have systems in place to remind us to pay these fees, and we employ an outside firm and rely on our outside counsel to pay these fees due to non-U.S. patent agencies. The USPTO and various non-U.S. governmental patent agencies require compliance with a number of procedural, documentary, fee payment and other similar provisions during the patent application process. We employ reputable law firms and other professionals to help us comply, and in many cases, an inadvertent lapse can be cured by payment of a late fee or by other means in accordance with the applicable rules. However, there are situations in which non-compliance can result in abandonment or lapse of the patent or patent application, resulting in partial or complete loss of patent rights in the relevant jurisdiction, such as failure to respond to official actions within prescribed time limits, non-payment of fees and failure to properly legalize and submit formal documents. If we, or our licensors, fail to maintain the patents and patent applications covering our products and technologies, potential competitors may be able to enter the market without infringing our patents and this circumstance would have a material adverse effect on our business.
Patent terms may be inadequate to protect our competitive position on our products for an adequate amount of time.
Patents have a limited lifespan, and the protection patents afford is limited. In the United States, if all maintenance fees are timely paid, the natural expiration of a patent is generally 20 years from its earliest U.S. non-provisional filing date. Various extensions may be available, but the term of a patent, and the protection it affords, is limited. Even if patents covering our products are obtained, once the patent term has expired, we may be open to competition from competitive tests or products. Given the amount of time required for the development, testing and regulatory review of potential new tests or products, patents protecting such tests or products might expire before or shortly after such tests or products are commercialized. As a result, our owned and licensed patent portfolio may not provide us with sufficient rights to exclude others from commercializing tests or other products similar or identical to ours.
Risks Related to Employee Matters and Managing Growth and Other Risks Related to Our Business
We are highly dependent on the services of our key personnel.
We are highly dependent on the services of our key personnel, including Derek J. Maetzold, our President and Chief Executive Officer. Although we have entered into agreements with them regarding their employment, they are not for a specific term and each of may terminate their employment with us at any time,
though we are not aware of any present intention of any of these individuals to leave us, except as follows.
As previously disclosed, in November 2019, Federico A. Monzon, M.D., our Chief Medical Officer, notified us of his intention to resign effective on or about April 1, 2020. Dr. Monzon has delayed his resignation and we now expect that he will remain as our Chief Medical Officer in a reduced capacity during the next few
66
months, but there can be no assurance of any continuation of his services. We have commenced a search for Dr. Monzon’s replacement but have not yet appointed a successor.
Our research and development programs and laboratory operations depend on our ability to attract and retain highly skilled scientists and technicians. We may not be able to attract or retain qualified scientists and technicians in the future due to the competition for qualified personnel among life science businesses, particularly near our sole laboratory facility located in Phoenix, Arizona. We also face competition from universities and public and private research institutions in recruiting and retaining highly qualified scientific personnel. We may have difficulties locating, recruiting or retaining qualified salespeople. Recruiting and retention difficulties can limit our ability to support our research and development and sales programs. All of our employees are at-will, which means that either we or the employee may terminate their employment at any time.
Our employees, clinical investigators, consultants, speakers, vendors and any current or potential commercial partners may engage in misconduct or other improper activities, including non-compliance with regulatory standards and requirements and insider trading.
We are exposed to the risk of fraud or other misconduct by our employees, clinical study investigators, consultants, speakers, vendors and any potential commercial partners. Misconduct by these parties could include intentional, reckless and/or negligent conduct or disclosure of unauthorized activities to us that violates: federal laws and regulations or those of comparable foreign regulatory authorities, including those laws that require the reporting of true, complete and accurate information; manufacturing standards; federal and state health and data privacy, security, fraud and abuse, government price reporting, transparency reporting requirements, and other healthcare laws and regulations in the United States and abroad; sexual harassment and other workplace misconduct; or laws that require the true, complete and accurate reporting of financial information or data. Such misconduct could also involve the improper use of information obtained in the course of clinical studies, which could result in regulatory sanctions and cause serious harm to our reputation. We have adopted a code of conduct applicable to all of our employees, as well as a disclosure program and other applicable policies and procedures, but it is not always possible to identify and deter employee misconduct, and the precautions we take to detect and prevent this activity may not be effective in controlling unknown or unmanaged risks or losses or in protecting us from governmental investigations or other actions or lawsuits stemming from a failure to comply with these laws or regulations. If any such actions are instituted against us, and we are not successful in defending ourselves or asserting our rights, those actions could have a significant impact on our business, including the imposition of significant civil, criminal and administrative penalties, damages, fines, disgorgement, individual imprisonment, exclusion from government funded healthcare programs, such as Medicare, Medicaid and other federal healthcare programs, contractual damages, reputational harm, diminished profits and future earnings, additional integrity reporting and oversight obligations, and the curtailment or restructuring of our operations, any of which could adversely affect our ability to operate our business and our results of operations.
We may be unable to manage our future growth effectively, which could make it difficult to execute our business strategy.
We have experienced significant revenue growth in a short period of time. We may not achieve similar growth rates in future periods. You should not rely on our operating results for any prior periods as an indication of our future operating performance. To effectively manage our anticipated future growth, we must continue to maintain and enhance our financial, accounting, laboratory operations, customer support and sales administration systems, processes and controls. Failure to effectively manage our anticipated growth could lead us to over-invest or under-invest in development, operational and administrative infrastructure, result in weaknesses in our infrastructure, systems, or internal controls, give rise to operational mistakes, losses, loss of customers, productivity or business opportunities, and result in loss of employees and reduced productivity of remaining employees.
We also anticipate further growth in our business operations. This future growth could create strain on our organizational, administrative and operational infrastructure, including laboratory operations, quality control, customer service and sales organization management. We expect to increase headcount and to hire more specialized personnel in the future as we grow our business. We will need to continue to hire, train and manage additional qualified scientists, laboratory personnel, client and account services personnel, and sales and marketing staff and improve and maintain our technology to properly manage our growth. If our new hires perform poorly, if we are unsuccessful in hiring, training, managing and integrating these new employees or if we are not successful in retaining our existing employees, our business may be harmed.
In addition, our anticipated growth could require significant capital expenditures and might divert financial resources from other projects such as the development of new diagnostic tests and services. As we commercialize additional diagnostic tests, we may need to incorporate new equipment, implement new technology systems, or hire new personnel with different qualifications. Failure to manage this growth or transition could result in turnaround time delays, higher costs, declining quality, deteriorating customer service, and slower responses to competitive challenges. A failure in any one of these areas could make
67
it difficult for us to meet market expectations for our products, and could damage our reputation and the prospects for our business.
We may not be able to maintain the quality or expected turnaround times of our products, or satisfy customer demand as it grows. Our ability to manage our growth properly will require us to continue to improve our operational, financial and management controls, as well as our reporting systems and procedures. The time and resources required to implement these new systems and procedures is uncertain, and failure to complete this in a timely and efficient manner could adversely affect our operations. If our management is unable to effectively manage our anticipated growth, our expenses may increase more than expected, our revenue could decline or grow more slowly than expected and we may be unable to implement our business strategy. The quality of our products and services may suffer, which could negatively affect our reputation and harm our ability to retain and attract customers.
U.S. federal income tax reform could adversely affect us.
On December 22, 2017, the U.S. government enacted the TCJA that significantly revises the Internal Revenue Code of 1986, as amended, or the Code. The TCJA, among other things, contains significant changes to corporate taxation, including reduction of the corporate tax rate from a top marginal rate of 35% to a flat rate of 21%, limitation of the tax deduction for interest expense to 30% of adjusted earnings (except for certain small businesses), limitation of the deduction for net operating losses generated after December 31, 2017 to 80% of current year taxable income and elimination of net operating loss carrybacks, one time taxation of offshore earnings at reduced rates regardless of whether they are repatriated, elimination of U.S. tax on foreign earnings (subject to certain important exceptions), immediate deductions for certain new investments instead of deductions for depreciation expense over time, and modifying or repealing many business deductions and credits. We do not expect the TCJA to have a material impact to our current projection of minimal cash taxes for the near future.
However, we continue to examine the impact that the TCJA may have on our business in the longer term. Accordingly, notwithstanding the reduction in the corporate income tax rate, the overall impact of the TCJA is uncertain and our business and financial condition could be adversely affected. In addition, it is uncertain if and to what extent various states will conform to the TCJA. The impact of the TCJA on holders of our common stock is also uncertain and could be adverse. We urge investors to consult with their legal and tax advisors with respect to the TCJA and the potential tax consequences of investing in or holding our common stock.
Our ability to use net operating losses to offset future taxable income may be subject to limitations.
At December 31, 2019, we had federal net operating loss carryforwards of approximately
$57.4 million
, of which
$43.5 million
will begin to expire in 2028 if not utilized to offset taxable income, and
$13.9 million
may be carried forward indefinitely.
Under the TCJA, federal net operating losses incurred in 2018 and in future years may be carried forward indefinitely, but the deductibility of such federal net operating losses is limited. It is uncertain if and to what extent various states will conform to the TCJA. In addition, under Sections 382 and 383 of the Code, and corresponding provisions of state law, if a corporation undergoes an ‘‘ownership change’’ (which is generally defined as a greater than 50% change (by value) in its equity ownership over a three-year period), the corporation’s ability to use its pre-change net operating loss carryforwards and other pre-change tax attributes to offset its post-change income or taxes may be limited. We have experienced an ownership change in the past and we may also experience additional ownership changes in the future as a result of subsequent shifts in our stock ownership, some of which may be outside of our control. If an ownership change occurs and our ability to use our net operating loss carryforwards is materially limited, it would harm our future operating results by effectively increasing our future tax obligations.
Our business could be negatively impacted by cyber security threats.
We are increasingly dependent upon information technology systems, infrastructure and data to operate our business. In the ordinary course of business, we collect, store and transmit confidential information (including but not limited to intellectual property, proprietary business information and personal information). It is critical that we do so in a secure manner to maintain the confidentiality and integrity of such confidential information. We also have outsourced elements of our operations to third parties, and as a result we manage a number of third-party contractors who have access to our confidential information.
Despite the implementation of security measures, given their size and complexity and the increasing amounts of confidential information that they maintain, our internal information technology systems and those of our contractors and consultants are potentially vulnerable to breakdown or other damage or interruption from service interruptions, system malfunction, natural disasters, terrorism, war, public health crises and telecommunication and electrical failures, as well as security breaches from inadvertent or intentional actions by our employees, contractors, consultants, business partners, and/or other third parties, or from cyber-attacks by malicious third parties (including the deployment of harmful malware, ransomware, denial-of-service attacks, social engineering and other means to affect service reliability and threaten the confidentiality, integrity and availability
68
of information), which may compromise our system infrastructure or lead to data leakage. To the extent that any disruption or security breach were to result in a loss of, or damage to, our data or applications, or inappropriate disclosure of confidential or proprietary information, we could incur liability and reputational damage and the further development and commercialization of our products could be delayed.
While we have not experienced any such system failure, accident or security breach to date, we cannot assure you that our data protection efforts and our investment in information technology will prevent significant breakdowns, data leakages, breaches in our systems or other cyber incidents that could have a material adverse effect upon our reputation, business, operations or financial condition. For example, we maintain a tumor specimen database comprised of over 55,000 samples some of which were used to develop and validate DecisionDx-Melanoma, some of which are currently being used to improve on the test and some of which will be used in the future. If we were to lose this database, our ability to further validate, improve and therefore maintain and grow sales of DecisionDx-Melanoma could be significant impaired.
Furthermore, significant disruptions of our internal information technology systems or security breaches could result in the loss, misappropriation, and/or unauthorized access, use, or disclosure of, or the prevention of access to, confidential information (including trade secrets or other intellectual property, proprietary business information, and personal information), which could result in financial, legal, business, and reputational harm to us. For example, any such event that leads to unauthorized access, use, or disclosure of personal information, including personal information related to our patient samples or employees, could harm our reputation directly, compel us to comply with federal and/or state breach notification laws and foreign law equivalents, subject us to mandatory corrective action, and otherwise subject us to liability under laws and regulations that protect the privacy and security of personal information, which could result in significant legal and financial exposure and reputational damages that could potentially have an adverse effect on our business.
Product or professional liability lawsuits against us could cause us to incur substantial liabilities and could limit our commercialization of our products.
We face an inherent risk of product and professional liability exposure related to our products. The marketing, sale and use of our products could lead to the filing of product liability claims were someone to allege that our products identified or reported inaccurate or incomplete information, or otherwise failed to perform as designed. We may also be subject to liability for errors in, a misunderstanding of or inappropriate reliance upon, the information we provide in the ordinary course of our business activities.
If we cannot successfully defend ourselves against claims that our products caused injury or otherwise failed to function properly, we could incur substantial liabilities. Regardless of merit or eventual outcome, product liability claims may result in:
|
•
|
decreased demand for our current tests any tests that we may develop, and the inability to commercialize such tests;
|
|
•
|
injury to our reputation and significant negative media attention;
|
|
•
|
reluctance of experts willing to conduct our clinical studies;
|
|
•
|
initiation of investigations by regulators;
|
|
•
|
significant costs to defend the related litigation and diversion of management’s time and our resources;
|
|
•
|
substantial monetary awards to study subjects or patients;
|
|
•
|
product recalls, withdrawals or labeling, or marketing or promotional restrictions; and
|
|
•
|
loss of revenue.
|
We currently carry product liability insurance. However, the amount of this insurance may not be adequate to cover all liabilities that we may incur. Insurance coverage is increasingly expensive. We may not be able to maintain insurance coverage at a reasonable cost or in an amount adequate to satisfy any liability that may arise.
International expansion of our business exposes us to business, regulatory, political, operational, financial, and economic risks associated with doing business outside of the United States.
We currently do not accept orders from customers outside of the United States, but our long-term business strategy incorporates potential international expansion. Doing business internationally involves a number of risks, including:
|
•
|
multiple, conflicting and changing laws and regulations such as privacy regulations, tax laws, export and import restrictions, economic sanctions and embargoes, employment laws, regulatory requirements and other governmental approvals, permits and licenses;
|
|
•
|
limits in our ability to penetrate international markets if we are not able to perform tests locally;
|
69
|
•
|
logistics and regulations associated with shipping tissue samples, including infrastructure conditions and transportation delays;
|
|
•
|
difficulties in staffing and managing foreign operations;
|
|
•
|
failure to obtain regulatory approvals for the commercialization of our products in various countries;
|
|
•
|
complexities and difficulties in obtaining intellectual property protection and enforcing our intellectual property;
|
|
•
|
complexities associated with managing multiple payor reimbursement regimes, government payors, or patient self-pay systems;
|
|
•
|
financial risks, such as longer payment cycles, difficulty collecting accounts receivable, the impact of local and regional financial crises on demand and payment for our products and exposure to foreign currency exchange rate fluctuations;
|
|
•
|
natural disasters, political and economic instability, including wars, terrorism, and political unrest, outbreak of disease, boycotts, curtailment of trade and other business restrictions; and
|
|
•
|
regulatory and compliance risks that relate to maintaining accurate information and control over sales and distributors’ activities that may fall within the purview of the U.S. Foreign Corrupt Practices Act, or FCPA, its books and records provisions, or its anti-bribery provisions.
|
Any of these factors could significantly harm our future international expansion and operations and, consequently, our revenue and results of operations.
Requirements associated with being a public company will increase our costs significantly, as well as divert significant company resources and management attention.
We are subject to the reporting requirements of the Exchange Act or the other rules and regulations of the SEC and any securities exchange relating to public companies. Sarbanes-Oxley, as well as rules subsequently adopted by the SEC and The Nasdaq Stock Market LLC, or Nasdaq, to implement provisions of Sarbanes-Oxley, impose significant requirements on public companies, including requiring establishment and maintenance of effective disclosure and financial controls and changes in corporate governance practices. Further, pursuant to the Dodd-Frank Wall Street Reform and Consumer Protection Act of 2010, the SEC has adopted additional rules and regulations in these areas, such as mandatory ‘‘say on pay’’ voting requirements that will apply to us when we cease to be an emerging growth company. Stockholder activism, the current political environment and the current high level of government intervention and regulatory reform may lead to substantial new regulations and disclosure obligations, which may lead to additional compliance costs and impact the manner in which we operate our business in ways we cannot currently anticipate. Compliance with the various reporting and other requirements applicable to public companies requires considerable time and attention of management. We cannot assure you that we will satisfy our obligations as a public company on a timely basis.
We expect the rules and regulations applicable to public companies to substantially increase our legal and financial compliance costs and to make some activities more time-consuming and costly. If these requirements divert the attention of our management and personnel from other business concerns, they could have a material adverse effect on our business, financial condition and results of operations. The increased costs will decrease our net income or increase our net loss, and may require us to reduce costs in other areas of our business or increase the prices of our products. In addition, as a public company, it may be more difficult or more costly for us to obtain certain types of insurance, including directors’ and officers’ liability insurance, and we may be forced to accept reduced policy limits and coverage or incur substantially higher costs to obtain the same or similar coverage. The impact of these events could also make it more difficult for us to attract and retain qualified personnel to serve on our board of directors, our board committees or as executive officers.
If we fail to comply with environmental, health and safety laws and regulations, we could become subject to fines or penalties or incur costs that could have a material adverse effect on the success of our business.
We, and the third parties with whom we share our facilities, are subject to numerous environmental, health and safety laws and regulations, including those governing laboratory procedures and the handling, use, storage, treatment and disposal of hazardous materials and wastes. Each of our operations involve the use of hazardous and flammable materials, including chemicals and biological and radioactive materials. Our operations also produce hazardous waste. We generally contract with third parties for the disposal of these materials and wastes. We cannot eliminate the risk of contamination or injury from these materials. We could be held liable for any resulting damages in the event of contamination or injury resulting from the use of hazardous materials by us or the third parties with whom we share our facilities, and any liability could exceed our resources. We also could incur significant costs associated with civil or criminal fines and penalties.
70
Although we maintain workers’ compensation insurance to cover us for costs and expenses we may incur due to injuries to our employees resulting from the use of hazardous materials, this insurance may not provide adequate coverage against potential liabilities. We do not maintain insurance for environmental liability or toxic tort claims that may be asserted against us in connection with our storage or disposal of biological, hazardous or radioactive materials.
In addition, we may incur substantial costs in order to comply with current or future environmental, health and safety laws and regulations. These current or future laws and regulations may impair our research and development. Failure to comply with these laws and regulations also may result in substantial fines, penalties or other sanctions.
Our business could be adversely affected by natural disasters, public health epidemics and other events beyond our control.
Although we maintain crisis management plans, our business operations are subject to interruption by natural disasters and catastrophic events beyond our control, including, but not limited to, earthquakes, floods, fires, tornadoes and public health issues and epidemics. Further, outbreaks of epidemic diseases, such as coronavirus, or the fear of such events, could provoke responses, including government-imposed travel restrictions that could impede the mobility and effectiveness of our sales force. In particular, as the coronavirus outbreak has recently spread to the United States, it may disrupt our operations or those of our suppliers and service providers. The ultimate impact of the coronavirus outbreak or any other health epidemic is highly uncertain and subject to change. We do not yet know the full extent of any potential delays or impacts on our business that may be attributable to the coronavirus outbreak. However, these effects could have a material impact on our operations.
Risks Related to Ownership of Our Common Stock
The stock price of our common stock may be volatile or may decline regardless of our operating performance, and you may lose all or part of your investment.
The market price of our common stock may fluctuate significantly in response to numerous factors, many of which are beyond our control, including:
|
•
|
our operating performance and the performance of other similar companies;
|
|
•
|
our success in marketing and selling our products;
|
|
•
|
reimbursement determinations by third-party payors and reimbursement rates for our products;
|
|
•
|
changes in our projected operating results that we provide to the public, our failure to meet these projections or changes in recommendations by securities analysts that elect to follow our common stock;
|
|
•
|
regulatory or legal developments in the United States and other countries;
|
|
•
|
the level of expenses related to product development and clinical studies for our products;
|
|
•
|
our ability to achieve product development goals in the timeframe we announce;
|
|
•
|
announcements of clinical study results, regulatory developments, acquisitions, strategic alliances or significant agreements by us or by our competitors;
|
|
•
|
the success or failure of our efforts to acquire, license or develop additional tests;
|
|
•
|
recruitment or departure of key personnel;
|
|
•
|
the economy as a whole and market conditions in our industry;
|
|
•
|
trading activity by a limited number of stockholders who together beneficially own a significant percentage of our outstanding common stock;
|
|
•
|
the size of our market float; and
|
|
•
|
any other factors discussed in this Annual Report on Form 10-K.
|
In addition, the stock market in general, and diagnostic and life sciences companies in particular, have experienced extreme price and volume fluctuations that have often been unrelated or disproportionate to the operating performance of these companies. Broad market and industry factors may negatively affect the market price of our securities, regardless of our actual operating performance. In the past, stockholders have filed securities class action litigation following periods of market volatility. If we were to become involved in securities litigation, it could subject us to substantial costs, divert resources and the attention of management from our business and adversely affect our business.
71
If there are substantial sales of shares of our common stock, the price of our common stock could decline.
The price of our common stock could decline if there are substantial sales of our common stock, particularly sales by our directors, executive officers and significant stockholders, or if there is a large number of shares of our common stock available for sale and the market perceives that sales will occur. As of
February 28, 2020
, we had
17,192,351
shares of common stock outstanding. Shares held by directors, executive officers and other affiliates are subject to volume limitations under Rule 144 under the Securities Act of 1933, as amended, or the Securities Act.
Certain of our stockholders have rights, subject to some conditions, to require us to file registration statements covering their shares or to include their shares in registration statements that we may file for ourselves or our stockholders. We have registered shares of common stock that we have issued and may issue under our employee equity incentive plans. As a result, these shares will be able to be sold freely in the public market upon issuance.
The market price of the shares of our common stock could decline as a result of the sale of a substantial number of our shares of common stock in the public market or the perception in the market that the holders of a large number of shares intend to sell their shares.
We have broad discretion in the use of working capital and may not use it effectively or in ways that increase our share price.
We cannot specify with any certainty the particular uses of working capital, but we currently expect such uses will include: funding selling and marketing activities, including expansion of our sales force to support the ongoing commercialization of current and future products; research and development related to the continued support of our current products as well as the development of our product pipeline; and other general corporate purposes, including the additional costs associated with being a public company. The failure by our management to apply our working capital effectively could adversely affect our business and financial condition. Pending its use, we may invest working capital in a manner that does not produce income or that loses value. These investments may not yield a favorable return to our investors.
If securities or industry analysts do not publish research or publish inaccurate or unfavorable research about our business, our stock price and trading volume could decline.
The trading market for our common stock depends in part on the research and reports that securities or industry analysts publish about us or our business. If one or more of the analysts who cover us downgrade our common stock or publish inaccurate or unfavorable research about our business, our common stock price would likely decline. If one or more of these analysts cease coverage of us or fail to publish reports on us regularly, demand for our common stock could decrease, which might cause our common stock price and trading volume to decline.
Our disclosure controls and procedures may not prevent or detect all errors or acts of fraud.
We are subject to the periodic reporting requirements of the Exchange Act. We designed our disclosure controls and procedures to reasonably assure that information we must disclose in reports we file or submit under the Exchange Act is accumulated and communicated to management, and recorded, processed, summarized and reported within the time periods specified in the rules and forms of the SEC. We believe that any disclosure controls and procedures or internal controls and procedures, no matter how well-conceived and operated, can provide only reasonable, not absolute, assurance that the objectives of the control system are met.
These inherent limitations include the realities that judgments in decision-making can be faulty, and that breakdowns can occur because of simple error or mistake. For example, our directors or executive officers could inadvertently fail to disclose a new relationship or arrangement causing us to fail to make any related party transaction disclosures. Additionally, controls can be circumvented by the individual acts of some persons, by collusion of two or more people or by an unauthorized override of the controls. Accordingly, because of the inherent limitations in our control system, misstatements due to error or fraud may occur and not be detected. In addition, we do not have a risk management program or processes or procedures for identifying and addressing risks to our business in other areas.
We are an emerging growth company and a smaller reporting company and we cannot be certain if the reduced reporting requirements applicable to emerging growth companies will make our common stock less attractive to investors.
We are an emerging growth company as defined in the JOBS ACT, and we intend to take advantage of some of the exemptions from reporting requirements that are applicable to other public companies that are not emerging growth companies, including:
|
•
|
being permitted to provide only two years of audited financial statements, in addition to any required unaudited interim financial statements, with correspondingly reduced ‘‘Management’s Discussion and Analysis of Financial Condition and Results of Operations’’ disclosure;
|
72
|
•
|
not being required to comply with the auditor attestation requirements in the assessment of our internal control over financial reporting;
|
|
•
|
not being required to comply with any requirement that may be adopted by the Public Company Accounting Oversight Board regarding mandatory audit firm rotation or a supplement to the auditor’s report providing additional information about the audit and the financial statements;
|
|
•
|
reduced disclosure obligations regarding executive compensation; and
|
|
•
|
not being required to hold a non-binding advisory vote on executive compensation or obtain stockholder approval of any golden parachute payments not previously approved.
|
In addition, as an emerging growth company the JOBS Act allows us to delay adoption of new or revised accounting pronouncements applicable to public companies until such pronouncements are made applicable to private companies. We have elected to use this extended transition period under the JOBS Act. We may take advantage of these reporting exemptions until we are no longer an emerging growth company. We will remain an emerging growth company until the earlier of (1) December 31, 2024, (2) the last day of the fiscal year (a) in which we have total annual gross revenue of at least $1.07 billion or (b) in which we are deemed to be a ‘‘large accelerated filer’’ as defined in Rule 12b-2 under the Exchange Act, which means the market value of our common stock that is held by non-affiliates exceeds $700 million as of the prior June 30
th
, and (3) the date on which we have issued more than $1.0 billion in non-convertible debt during the prior three-year period.
We are also a smaller reporting company as defined in the Exchange Act. We may continue to be a smaller reporting company even after we are no longer an emerging growth company. We may take advantage of certain of the scaled disclosures available to smaller reporting companies and will be able to take advantage of these scaled disclosures for so long as our voting and non-voting common stock held by non-affiliates is less than $250.0 million measured on the last business day of our second fiscal quarter, or our annual revenue is less than $100.0 million during the most recently completed fiscal year and our voting and non-voting common stock held by non-affiliates is less than $700.0 million measured on the last business day of our second fiscal quarter.
We cannot predict if investors will find our common stock less attractive because we will rely on these exemptions. If some investors find our common stock less attractive as a result, there may be a less active trading market for our common stock and our stock price may be more volatile.
We do not intend to pay dividends for the foreseeable future.
We have never declared nor paid cash dividends on our capital stock. We currently intend to retain any future earnings to finance the operation and expansion of our business, and we do not expect to declare or pay any dividends in the foreseeable future. In addition, the terms of the 2018 LSA precludes us from paying dividends without prior consent. Consequently, stockholders must rely on sales of their common stock after price appreciation, which may never occur, as the only way to realize any future gains on their investment.
The concentration of our stock ownership will likely limit your ability to influence corporate matters, including the ability to influence the outcome of director elections and other matters requiring stockholder approval.
Based upon shares outstanding as of
February 28, 2020
, our executive officers, directors and the known holders of more than 5% of our outstanding common stock, in the aggregate, beneficially owned approximately 48% of our common stock. As a result, these stockholders, acting together, will have significant influence over all matters that require approval by our stockholders, including the election of directors and approval of significant corporate transactions. Corporate actions might be taken even if other stockholders oppose them. This concentration of ownership might also have the effect of delaying or preventing a change of control of our company that other stockholders may view as beneficial.
Delaware law and provisions in our amended and restated certificate of incorporation and amended and restated bylaws could make a merger, tender offer or proxy contest difficult, thereby depressing the trading price of our common stock.
Provisions of our amended and restated certificate of incorporation and amended and restated bylaws may delay or discourage transactions involving an actual or potential change in our control or change in our management, including transactions in which stockholders might otherwise receive a premium for their shares or transactions that our stockholders might otherwise deem to be in their best interests. Therefore, these provisions could adversely affect the price of our common stock. Among other things, our amended and restated certificate of incorporation and amended and restated bylaws:
|
•
|
permit our board of directors to issue up to 10,000,000 shares of preferred stock, with any rights, preferences and privileges as they may designate (including the right to approve an acquisition or other change in our control);
|
73
|
•
|
provide that the authorized number of directors may be changed only by resolution of the board of directors;
|
|
•
|
provide that the board of directors or any individual director may only be removed with cause and the affirmative vote of the holders of at least 66-2/3% of the voting power of all of our then outstanding common stock;
|
|
•
|
provide that all vacancies, including newly created directorships, may, except as otherwise required by law, be filled by the affirmative vote of a majority of directors then in office, even if less than a quorum;
|
|
•
|
divide our board of directors into three classes;
|
|
•
|
require that any action to be taken by our stockholders must be effected at a duly called annual or special meeting of stockholders and not be taken by written consent;
|
|
•
|
provide that stockholders seeking to present proposals before a meeting of stockholders or to nominate candidates for election as directors at a meeting of stockholders must provide notice in writing in a timely manner and also specify requirements as to the form and content of a stockholder’s notice;
|
|
•
|
do not provide for cumulative voting rights (therefore allowing the holders of a majority of the shares of common stock entitled to vote in any election of directors to elect all of the directors standing for election, if they should so choose);
|
|
•
|
provide that special meetings of our stockholders may be called only by the chairman of the board, our Chief Executive Officer or by the board of directors pursuant to a resolution adopted by a majority of the total number of authorized directors;
|
|
•
|
provide that, unless we consent in writing to the selection of an alternative forum, the Court of Chancery of the State of Delaware (or, if and only if the Court of Chancery of the State of Delaware lacks subject matter jurisdiction, any state court located within the State of Delaware or, if and only if all such state courts lack subject matter jurisdiction, the federal district court for the District of Delaware) will be the sole and exclusive forum for the following types of actions or proceedings under Delaware statutory or common law: (i) any derivative action or proceeding brought on our behalf; (ii) any action or proceeding asserting a claim of breach of a fiduciary duty owed by any of our current or former directors, officers or other employees to us or our stockholders; (iii) any action or proceeding asserting a claim against us or any of our current or former directors, officers or other employees, arising out of or pursuant to any provision of the Delaware General Corporation Law, our certificate of incorporation or our bylaws; (iv) any action or proceeding to interpret, apply, enforce or determine the validity of our certificate of incorporation or our bylaws; (v) any action or proceeding as to which the Delaware General Corporation Law confers jurisdiction to the Court of Chancery of the State of Delaware; and (vi) any action asserting a claim against us or any of our directors, officers or other employees governed by the internal affairs doctrine, in all cases to the fullest extent permitted by law and subject to the court’s having personal jurisdiction over the indispensable parties named as defendants; provided these provisions of our amended and restated certificate of incorporation and amended and restated bylaws will not apply to suits brought to enforce a duty or liability created by the Exchange Act or any other claim for which the federal courts have exclusive jurisdiction; and
|
|
•
|
provide that unless we consent in writing to the selection of an alternative forum, the federal district courts of the United States of America shall be the exclusive forum for the resolution of any complaint asserting a cause of action arising under the Securities Act, subject to and contingent upon a final adjudication in the State of Delaware of the enforceability of such exclusive forum provision.
|
The amendment of any of these provisions, with the exception of the ability of our board of directors to issue shares of preferred stock and designate any rights, preferences and privileges thereto, would require approval by the holders of at least 66-2/3% of our then-outstanding common stock.
In addition, as a Delaware corporation, we are subject to Section 203 of the Delaware General Corporation Law. These provisions may prohibit large stockholders, in particular those owning 15% or more of our outstanding voting stock, from merging or combining with us for a certain period of time. A Delaware corporation may opt out of this provision by express provision in its original certificate of incorporation or by amendment to its certificate of incorporation or bylaws approved by its stockholders. However, we have not opted out of this provision.
These and other provisions in our amended and restated certificate of incorporation, amended and restated bylaws and Delaware law could make it more difficult for stockholders or potential acquirors to obtain control of our board of directors or initiate actions that are opposed by our then-current board of directors, including delay or impede a merger, tender offer or
74
proxy contest involving our company. The existence of these provisions could negatively affect the price of our common stock and limit opportunities for you to realize value in a corporate transaction.
Our amended and restated certificate of incorporation provides that the Court of Chancery of the State of Delaware is the exclusive forum for certain disputes between us and our stockholders, which could limit our stockholders’ ability to obtain a favorable judicial forum for disputes with us or our directors, officers or employees.
Our amended and restated certificate of incorporation provides that, unless we consent in writing to the selection of an alternative forum, the Court of Chancery of the State of Delaware (or, if and only if the Court of Chancery of the State of Delaware lacks subject matter jurisdiction, any state court located within the State of Delaware or, if and only if all such state courts lack subject matter jurisdiction, the federal district court for the District of Delaware) will be the sole and exclusive forum for the following types of actions or proceedings under Delaware statutory or common law: (i) any derivative action or proceeding brought on our behalf; (ii) any action or proceeding asserting a claim of breach of a fiduciary duty owed by any of our current or former directors, officers or other employees to us or our stockholders; (iii) any action or proceeding asserting a claim against us or any of our current or former directors, officers or other employees arising out of or pursuant to any provision of the Delaware General Corporation Law, our amended and restated certificate of incorporation or amended and restated bylaws; (iv) any action or proceeding to interpret, apply, enforce or determine the validity of our amended and restated certificate of incorporation or our amended and restated bylaws; (v) any action or proceeding as to which the Delaware General Corporation Law confers jurisdiction to the Court of Chancery of the State of Delaware; and (vi) any action asserting a claim against us or any of our directors, officers or other employees that is governed by the internal affairs doctrine, in all cases to the fullest extent permitted by law and subject to the court’s having personal jurisdiction over the indispensable parties named as defendants; provided these provisions would not apply to suits brought to enforce a duty or liability created by the Exchange Act, or any other claim for which the federal courts have exclusive jurisdiction. In addition, our amended and restated certificate of incorporation and amended and restated bylaws provide that unless we consent in writing to the selection of an alternative forum, the federal district courts of the United States of America shall be the exclusive forum for the resolution of any complaint asserting a cause of action arising under the Securities Act, subject to and contingent upon a final adjudication in the State of Delaware of the enforceability of such exclusive forum provision.
These choice of forum provisions may limit a stockholder’s ability to bring a claim in a judicial forum that it finds favorable for disputes with us or our directors, officers or other employees and may discourage these types of lawsuits. Furthermore, the enforceability of similar choice of forum provisions in other companies’ certificates of incorporation has been challenged in legal proceedings, and it is possible that a court could find these types of provisions to be inapplicable or unenforceable. If a court were to find the choice of forum provisions contained in our amended and restated certificate of incorporation to be inapplicable or unenforceable in an action, we may incur additional costs associated with resolving such action in other jurisdictions.
Item 1B. Unresolved Staff Comments.
None.
Item 2. Properties.
We currently lease approximately 4,195 square feet of office space in Friendswood, Texas under an agreement that expires June 30, 2020, which we have the option to renew for an additional one-year period commencing on July 1, 2020. We have entered into an agreement to lease approximately 21,760 square feet of new office space in Friendswood, Texas to replace the existing Friendswood office space. This lease is expected commence on or prior to August 1, 2020 and has a 60-month term, with an option to renew for one additional five-year period. We also lease approximately 23,400 square feet of laboratory space in Phoenix, Arizona under an agreement that expires July 31, 2027, with two optional renewal periods of five years each. We believe our existing facilities, together with the new Friendswood, Texas office space, will be sufficient for our needs for the foreseeable future.
Item 3. Legal Proceedings.
From time to time, we may be involved in legal proceedings arising in the ordinary course of business. We believe there is no threatened litigation or litigation pending that could have, individually or in the aggregate, a material adverse effect on our financial position, results of operations or cash flows.
Item 4. Mine Safety Disclosures.
Not applicable.
75
PART II
Item 5. Market for Registrant’s Common Equity, Related Stockholder Matters and Issuer Purchases of Equity Securities.
Market Information
Our Common Stock, par value $0.001 per share, began trading on the NASDAQ Global Market under the symbol “CSTL” on July 25, 2019. Prior to that date, there was no public trading market for our common stock.
Holders of Record
As of
February 28, 2020
, there were approximately 161 stockholders of record of our common stock, which does not include shares held in street name.
Dividend Policy
We have never declared or paid cash dividends on our capital stock. We currently intend to retain all available funds and any future earnings for use in the operation of our business and do not anticipate paying any dividends on our common stock in the foreseeable future. Any future determination to declare dividends will be made at the discretion of our board of directors and will depend on, among other factors, our financial condition, operating results, capital requirements, contractual restrictions, general business conditions and other factors that our board of directors may deem relevant. In addition, the terms of the 2018 LSA, with Silicon Valley Bank, or SVB, and Oxford Finance LLC, or Oxford, prohibit us from paying dividends on our common stock without prior consent.
Securities Authorized for Issuance Under Our Equity Compensation Plans
Information regarding securities authorized for issuance under our equity compensation plans is incorporated herein by reference to Item 12, “Security Ownership of Certain Beneficial Owners and Management and Related Stockholder Matters” of Part III of this Annual Report on Form 10-K.
Performance Graph
Not required for smaller reporting companies.
Recent Sales of Unregistered Equity Securities
In November 2019, we issued an aggregate of 51,238 shares of our common stock to SVB Financial Group upon the net exercise of certain warrants to purchase an aggregate of 67,250 shares of common stock at a weighted-average exercise price of $6.77 per share. Additionally, we paid an aggregate of $77 in cash to SVB Financial Group for the value of fractional shares computed in connection with such net exercises. In accordance with the terms of the warrants, the net exercises were based on the fair market value of our common stock on the business day immediately prior to the date of delivery of the exercise notices, in each case $28.42 per share, and did not result in any cash proceeds to us.
The issuances of these shares of common stock were deemed to be exempt from registration under the Securities Act of 1933, as amended, or the Securities Act in reliance on Section 4(a)(2) (or Regulation D promulgated thereunder) in that the issuance of securities was to an accredited investor and did not involve a public offering. The recipient of securities in each of these transactions acquired the securities for investment only and not with a view to or for sale in connection with any distribution thereof and appropriate legends were affixed to the securities issued in these transactions. The recipient of the securities in these transactions was an accredited investor under Rule 501 of Regulation D.
The foregoing disclosure excludes any transactions during the twelve months ended December 31, 2019 that were previously reported on a Quarterly Report on Form 10-Q or a Current Report on Form 8-K of the Company.
Use of Proceeds from IPO of Common Stock
On July 29, 2019, we completed the initial public offering of our common stock, or the IPO, pursuant to which we issued and sold 4,600,000 shares of our common stock, including 600,000 shares associated with the full exercise of the underwriters’ option to purchase additional shares, at a price to the public of $16.00 per share.
The offer and sale of all of the shares of our common stock in the IPO were registered under the Securities Act pursuant to our Registration Statements on Form S-1, as amended (File Nos. 333-232369 and 333-232796), which were declared or became effective on July 24, 2019. SVB Leerink LLC and Robert W. Baird & Co. Incorporated acted as joint book-running managers for the IPO and as representatives of the underwriters. Canaccord Genuity LLC and BTIG, LLC acted as co-managers for the IPO.
76
We received gross proceeds from the IPO of $73.6 million, or net proceeds of $65.9 million after deducting $5.2 million in underwriting discounts and commissions and $2.5 million of offering expenses. None of the underwriting discounts and commissions or offering expenses were incurred or paid, directly or indirectly, to any of our directors or officers or their associates or to persons owning 10% or more of our common stock or to any of our affiliates.
There has been no material change in our planned use of the net proceeds from the initial public offering or IPO as described in the final prospectus filed with the SEC on July 26, 2019 relating to our Registration Statements on Form S-1 (File Nos. 333-232369 and 333-232796).
Since the effective date of our registration statement through December 31, 2019, we have not used any of the net proceeds from the IPO. Pending such uses, we have invested, and plan to continue to invest, the balance of the net proceeds from the IPO in cash and cash equivalent securities or highly liquid investment securities.
Purchases of Equity Securities by the Issuer and Affiliated Purchasers
None.
Item 6. Selected Financial Data.
Not required for smaller reporting companies.
Item 7. Management’s Discussion and Analysis of Financial Condition and Results of Operations.
You should read the following discussion and analysis of financial condition and results of operations together with our financial statements and related notes included elsewhere in this Annual Report on Form 10-K. This discussion and other parts of this Annual Report on Form 10-K contain forward-looking statements that involve risk and uncertainties, such as statements of our plans, objectives, expectations and intentions. Our actual results could differ materially from those discussed in these forward-looking statements. Factors that could cause or contribute to such differences include, but are not limited to, those discussed in the section titled “Risk Factors.”
Overview
We are a commercial-stage dermatological cancer company focused on providing physicians and their patients with personalized, clinically actionable genomic information to make more accurate treatment decisions. We believe that the traditional approach to developing a treatment plan for certain cancers using clinical and pathology factors alone is inadequate and can be improved by incorporating personalized genomic information. Our non-invasive products utilize proprietary algorithms to provide an assessment of a patient’s specific risk of metastasis or recurrence of their cancer, allowing physicians to identify patients who are likely to benefit from an escalation of care as well as those who may avoid unnecessary medical and surgical interventions. Our lead product, DecisionDx-Melanoma, is a GEP test that predicts the risk of metastasis or recurrence for patients diagnosed with invasive cutaneous melanoma, a deadly skin cancer. We estimate more than 130,000 patients are diagnosed with invasive cutaneous melanoma each year in the United States. We launched DecisionDx-Melanoma in May 2013. We also market DecisionDx-UM, which is a proprietary GEP test that predicts the risk of metastasis for patients with uveal melanoma, a rare eye cancer. We launched DecisionDx-UM in January 2010. Based on the substantial clinical evidence that we have developed, we have received Medicare coverage for both of our products, which represents approximately 50% of our addressable patient population.
We also have two late-stage proprietary products in development that address SCC and suspicious pigmented lesions which are indications with high clinical need in dermatological cancer. These indications are areas of high clinical need in dermatological cancer and, together, represent an additional addressable market of approximately 500,000 patients in the United States.
We have processed over 60,000 clinical samples since commercial launch and our annual revenue increased from $
22.8
million in 2018 to $
51.9
million in 2019. For the year ended December 31, 2019, year-over-year growth in new ordering clinicians for our DecisionDx-Melanoma test was 24.3%. Additionally, total ordering clinicians in 2019 for DecisionDx-Melanoma increased 32% to 3,927, year-over-year.
77
The numbers of DecisionDx-Melanoma and DecisionDx-UM test reports delivered by us during the years ended December 31, 2019 and 2018 are presented in the table below:
|
|
DecisionDx-
Melanoma
|
DecisionDx-UM
|
Total
|
|||||
|
Q1 2019
|
3,232
|
|
360
|
|
3,592
|
|
||
|
Q2 2019
|
3,691
|
|
376
|
|
4,067
|
|
||
|
Q3 2019
|
4,126
|
|
356
|
|
4,482
|
|
||
|
Q4 2019
|
4,480
|
|
434
|
|
4,914
|
|
||
|
For the year ended December 31, 2019
|
15,529
|
|
1,526
|
|
17,055
|
|
||
|
Q1 2018
|
2,727
|
|
322
|
|
3,049
|
|
||
|
Q2 2018
|
2,899
|
|
382
|
|
3,281
|
|
||
|
Q3 2018
|
3,136
|
|
324
|
|
3,460
|
|
||
|
Q4 2018
|
3,270
|
|
385
|
|
3,655
|
|
||
|
For the year ended December 31, 2018
|
12,032
|
|
1,413
|
|
13,445
|
|
||
For additional information on the metrics we disclose, refer to “Information about certain metrics
” below.
Since our inception in 2008, we have devoted substantially all of our resources to organizing and staffing our company, business planning, raising capital, discovering product candidates, conducting clinical study activities to generate evidence demonstrating the clinical validity, clinical utility, economic benefits, and patient outcomes of our products, and commercialization activities for those products. We currently market two proprietary GEP products and generate substantially all of our revenue from those activities.
On July 29, 2019, we completed the IPO. In connection with the IPO, we issued and sold
4,600,000
shares of our common stock, including 600,000 shares associated with the full exercise of the underwriters’ option to purchase additional shares, at a price to the public of
$16.00
per share. We received approximately
$65.9 million
in net proceeds, after deducting underwriting discounts and commissions and other offering expenses payable by us.
Prior to the IPO, we financed our operations primarily through private placements of preferred stock, revenue generated from sales of our products, bank debt and convertible notes.
The principal focus of our current commercial efforts is to distribute our molecular diagnostic testing products through our direct sales force in the U.S. The number of test reports we generate is a key indicator that we use to assess our business. A test report is generated when we receive a sample in our laboratory, the relevant information relating to that test is entered into our Laboratory Information Management System, the genomic profile of the sample is performed and a report providing the results of that profile is sent to the physician who ordered the test.
We bill third-party payors and patients for the tests we perform. The majority of our revenue collections is paid by third-party insurers, including Medicare. We have received LCDs, which provide coverage for our tests that meet certain criteria for Medicare and Medicare Advantage beneficiaries, representing approximately 60 million covered lives. As it relates to DecisionDx-UM, we have contracts or have received positive medical policy decisions from additional payors representing approximately 83 million covered lives. A ‘‘covered life’’ means a subscriber, or a dependent of a subscriber, who is insured under an insurance policy for such an insurance carrier.
On May 17, 2019, CMS determined that DecisionDx-UM meets the criteria for
existing ADLT status.
This means that beginning in 2021, the DecisionDx-UM Medicare rate will be set annually based upon the median private payor rate for the first half of the second preceding calendar year. Specifically, the median private payor rate from January 1 to June 30, 2019 will be used to set the Medicare rate for the calendar year 2021. We successfully submitted this data in January 2020. Note that our rate for 2020 will be set by Noridian, our local MAC.
Also, on May 17, 2019, CMS determined that DecisionDx-Melanoma meets the criteria for ‘‘new ADLT’’ status. This means that from July 1, 2019 through March 31, 2020 the Medicare reimbursement rate will equal the initial list price of $7,193.00
, subject to the possible recoupment provision described below
. The rate for April 1, 2020 through December 31, 2021 will be calculated based upon the median private payor rate from July 1, 2019 to November 30, 2019. We successfully submitted this data in December 2019. Note that for DecisionDx-Melanoma tests reported for July 1, 2019 through March 31, 2020, CMS has the right to recoup the difference between the actual list and 130% of the weighted median if the original list price was greater than 130% of the weighted median or private payor rates. However, b
ased on the data we collected and submitted to CMS during the data collection period ended November 30, 2019, the original list price amount was not greater than 130% of the
78
weighted median of private payor rates. Therefore, we expect no recoupment to apply under this provision. Beginning in 2022, the rate will be set annually based upon the median private payor rate for the first half of the second preceding calendar year. For example, the rate for 2022 will be set using median private payor rate data from January 1, 2020 to June 30, 2020.
Since our inception, we have incurred significant operating losses and negative cash flows. For the year ended December 31, 2018, our net loss was $6.4 million, our net cash used in operating activities was $12.3 million and we had an accumulated deficit of $57.5 million as of December 31, 2018. For the year ended December 31, 2019, our net income was
$5.3 million
(which includes the benefit of a
$5.2 million
non-cash debt extinguishment gain), our net cash provided by operating activities was
$7.0 million
and we had an accumulated deficit of
$52.2 million
as of December 31, 2019. We also have substantial indebtedness, the terms of which require us to meet a quarterly three-month trailing revenue covenant.
Our ability to generate revenue sufficient to achieve and sustain profitability will depend heavily on the successful commercialization of our currently marketed products and the products we plan to launch in the future. We anticipate that a substantial portion of our capital resources and efforts in the foreseeable future will be focused on the commercialization of our existing products, the development of our future product candidates, and the commercialization of our product candidates.
Although we generated positive operating income during the year ended December 31, 2019, we expect to incur significant additional expenses and operating losses during the next two years as we invest in growing our commercial and research and development efforts. We believe that our existing cash and cash equivalents and anticipated cash generated from sales of our products will be sufficient to fund our operating expenses for the foreseeable future. However, we have based these estimates on assumptions that may prove to be wrong, and we could utilize our available capital resources sooner than we expect.
Our net income (losses) may fluctuate significantly from period to period, depending on the timing of our planned development activities, the growth of our sales and marketing activities and the timing of revenue recognition under ASC 606. We expect our expenses will increase substantially over time as we:
|
•
|
execute clinical studies to generate evidence supporting our current and future product candidates;
|
|
•
|
execute our commercialization strategy for our current and future products;
|
|
•
|
continue our ongoing and planned development of new products;
|
|
•
|
seek to discover and develop additional product candidates;
|
|
•
|
hire additional scientific and research and development staff; and
|
|
•
|
add additional operational, financial and management information systems and personnel.
|
Furthermore, we expect to incur additional costs associated with operating as a public company, including significant legal, accounting, investor relations and other expenses that we did not incur as a private company.
Factors affecting our performance
We believe there are several important factors that have impacted and that we expect will impact our operating performance and results of operations, including:
|
•
|
Report volume.
We believe that the number of reports we deliver to physicians is an important indicator of growth of adoption among the healthcare provider community. Our revenue and costs are affected by the volume of testing and mix of customers. Our performance depends on our ability to retain and broaden adoption with existing prescribing physicians, as well as attract new physicians.
|
|
•
|
Reimbursement.
We believe that expanding reimbursement is an important indicator of the value of our products. Payors require extensive evidence of clinical utility, clinical validity, patient outcomes and health economic benefits in order to provide reimbursement for diagnostic products. Our revenue depends on our ability to demonstrate the value of our products to these payors.
|
|
•
|
Gross margin.
We believe that our gross margin is an important indicator of the operating performance of our business. Higher gross margins reflect the average selling price of our tests, as well as the operating efficiency of our laboratory operations.
|
|
•
|
New product development.
A significant aspect of our business is our investment in research and development activities, including activities related to the development of new products. In addition to the development of new product candidates, we believe these studies are critical to gaining physician adoption of new products and driving favorable coverage decisions by payors for such products.
|
79
Information about certain metrics
The following provides additional information about certain metrics we have disclosed in this Management’s Discussion and Analysis of Financial Condition and Results of Operation.
Test reports delivered for DecisionDx-Melanoma and DecisionDx-UM represents the number of completed test reports delivered by us during the reporting period indicated. The period in which a test report is delivered does not necessarily correspond with the period the related revenue, if any, is recognized, due to the timing and amount of adjustments for variable consideration under ASC 606. We use this metric to evaluate the growth in adoption of our tests and to measure against our internal performance objectives. We believe this metric is useful to investors in evaluating the volume of our business activity from period to period that may not be discernible from our reported revenues under ASC 606.
New ordering clinicians for DecisionDx-Melanoma represents the number of clinicians who ordered the DecisionDx-Melanoma test for the first time during the reporting period specified. We believe this metric is useful in evaluating the effectiveness of our sales and marketing efforts in establishing new relationships with clinicians and increasing the adoption of our DecisionDx-Melanoma test. We also believe this metric provides useful information to investors in assessing our ability to expand the use of the DecisionDx-Melanoma test. Since this metric is based upon the reporting period in which an order is placed, it does not necessarily correspond to the reporting period in which a test report was delivered or in which any revenue was recognized.
Total ordering clinicians for DecisionDx-Melanoma represents the total number of clinicians who ordered the DecisionDx-Melanoma test during the reporting period specified. The total ordering clinicians metric allows us to assess our sales and marketing efforts in both establishing new clinician relationships as well as maintaining existing ones. We believe that this metric provides useful information to investors in assessing our ability to both expand the use of the DecisionDx-Melanoma test with new clinicians and maintain existing clinician relationships. Since this metric is based upon the reporting period in which an order is placed, it does not necessarily correspond to the reporting period in which a test report was delivered or in which any revenue was recognized.
Components of the Results of Operations
Net Revenues
We generate revenues from the sale of our products, primarily from the sale of DecisionDx-Melanoma and DecisionDx-UM. We bill third-party payors and patients for the tests we perform.
Under ASC 606, we recognize revenue at the amount we expect to be entitled, subject to a constraint for variable consideration, in the period in which our tests are delivered to the treating physicians. We have determined that our contracts contain variable consideration under ASC 606 because the amounts paid by third-party payors may be paid at less than our standard rates or not paid at all, with such differences considered implicit price concessions. Variable consideration is recognized only to the extent it is probable that a significant reversal of revenue will not occur in future periods when the uncertainties are resolved. We consider variable consideration to be fully constrained (and therefore not recognized) for Medicare claims when the payment of such claims is subject to approval by an ALJ at an appeal hearing, due to the level of uncertainty and timing of the outcome. Variable consideration is evaluated each reporting period and adjustments are recorded as increases or decreases in revenues. Importantly, we expect to recognize any revenue adjudicated by the ALJ in the reporting period in which we are notified of the ALJ hearing outcome and it is determined that such decision will not be appealed. Due to ALJ hearings, potential future changes in insurance coverage policies, contractual rates, and other trends in the reimbursement of our tests, our revenues may fluctuate significantly from period to period.
Our ability to increase our revenues will depend on our ability to further penetrate our target market, and, in particular, generate sales through our direct sales force, develop and commercialize additional tests, obtain reimbursement from additional third-party payors and increase our reimbursement rate for tests performed. In the near term, our financial performance will be highly dependent on reimbursement for DecisionDx-Melanoma. The use of DecisionDx-Melanoma is not yet broadly covered under positive coverage policies, although many third-party payors have begun to reimburse for this test.
Cost of Sales
The components of our cost of sales are material and service costs, personnel costs, which includes stock-based compensation expense, equipment and infrastructure expenses associated with testing samples, electronic medical records, order and delivery systems, shipping charges to transport samples, third-party test fees, and allocated overhead including rent, information technology costs, equipment depreciation and utilities. Costs associated with performing tests are recorded when the test is
80
processed regardless of whether and when revenues are recognized with respect to that test. As a result, our cost of sales as a percentage of revenues may vary significantly from period to period because we do not recognize all revenues in the period in which the associated costs are incurred. We expect cost of sales in absolute dollars to increase as the number of tests we perform increases.
Gross margin, calculated as net revenue minus cost of sales, is a key indicator we use to assess our business. For example, in 2016, we transitioned the performance of our genomic tests to our own dedicated clinical lab from a third-party contract lab. This transition increased the gross margin from our genomic tests while also increasing our level of control of the performance of our tests and laboratory quality metrics.
Research and Development
Research and development expenses include costs incurred to develop our genomic tests, collect clinical samples and conduct clinical studies to develop and support our products. These costs consist of personnel costs, including stock-based compensation expense, prototype materials, laboratory supplies, consulting costs, regulatory costs, electronic medical records set up costs, costs associated with setting up and conducting clinical studies and allocated overhead, including rent, information technology, equipment depreciation and utilities. We expense all research and development costs in the periods in which they are incurred. We expect our research and development expenses to increase in absolute dollars as we continue to invest in research and development activities related to developing enhanced and new products.
Selling, General and Administrative
Selling, general and administrative, or SG&A, expenses include executive, selling and marketing, legal, finance and accounting, human resources, billing and client services. These expenses consist of personnel costs, including stock-based compensation expense, direct marketing expenses, audit and legal expenses, consulting costs, training and medical education activities, payor outreach programs and allocated overhead, including rent, information technology, equipment depreciation, and utilities. In the near term, we expect increases in SG&A expenses related to compliance with the rules and regulations of the SEC and Nasdaq, investor relations activities, and additional insurance expenses. Other administrative and professional services expenses within SG&A are expected to increase with the scale of our business, but selling and marketing-related expenses are expected to increase significantly, consistent with our growth strategy.
Interest Income
Interest income consists primarily of interest earned on cash and cash equivalents in interest-bearing accounts.
Interest Expense
Interest expense is attributable to borrowings under our term debt, revolving line of credit and the convertible promissory notes issued in January and February of 2019, or the Q1 2019 Notes, and also includes the amortization of debt discount and issuance costs.
Gain on Extinguishment of Debt
The gain on extinguishment of debt is associated with the settlement of the Q1 2019 Notes in connection with the IPO.
Other Expense, Net
Other expense, net reflects changes in the fair value of (i) a convertible promissory note we issued to an investor in July 2019, or the July 2019 Note, (ii) our convertible preferred stock warrant liability and (iii) the embedded derivative associated with the Q1 2019 Notes.
Income Tax Expense
Our financial statements do not reflect any federal or state income tax benefits attributable to the net losses we have incurred, due to the uncertainty of realizing a benefit from those items. As of December 31, 2019, we had federal net operating loss carryforwards of
$57.4 million
, of which
$43.5 million
will begin to expire in 2028 if not utilized to offset taxable income, and
$13.9 million
may be carried forward indefinitely. Also, as of December 31, 2019, we had state net operating loss carryforwards of
$42.2 million
, which begin to expire in 2028 if not utilized to offset state taxable income.
81
Results of Operations
Comparison of the years ended December 31, 2019 and 2018
The following table summarizes our results of operations for the periods indicated (in thousands, except percentages):
|
|
Years Ended December 31,
|
Increase (Decrease)
|
||||||||||||
|
|
2019
|
2018
|
||||||||||||
|
Net revenues
|
$
|
51,865
|
|
$
|
22,786
|
|
$
|
29,079
|
|
127.6
|
%
|
|||
|
Cost of sales
|
7,310
|
|
5,297
|
|
2,013
|
|
38.0
|
%
|
||||||
|
Gross margin
|
44,555
|
|
17,489
|
|
27,066
|
|
154.8
|
%
|
||||||
|
Operating expenses:
|
||||||||||||||
|
Research and development
|
7,385
|
|
4,854
|
|
2,531
|
|
52.1
|
%
|
||||||
|
Selling, general and administrative
|
29,842
|
|
16,471
|
|
13,371
|
|
81.2
|
%
|
||||||
|
Total operating expenses
|
37,227
|
|
21,325
|
|
15,902
|
|
74.6
|
%
|
||||||
|
Operating income (loss)
|
7,328
|
|
(3,836
|
)
|
11,164
|
|
291.0
|
%
|
||||||
|
Interest income
|
312
|
|
24
|
|
288
|
|
1,200.0
|
%
|
||||||
|
Interest expense
|
(4,571
|
)
|
(2,274
|
)
|
(2,297
|
)
|
(101.0
|
)%
|
||||||
|
Gain on extinguishment of debt
|
5,213
|
|
—
|
|
5,213
|
|
N/A
|
|
||||||
|
Other expense, net
|
(2,933
|
)
|
(272
|
)
|
(2,661
|
)
|
(978.3
|
)%
|
||||||
|
Income (loss) before income taxes
|
5,349
|
|
(6,358
|
)
|
11,707
|
|
184.1
|
%
|
||||||
|
Income tax expense
|
72
|
|
9
|
|
63
|
|
700.0
|
%
|
||||||
|
Net income (loss)
|
$
|
5,277
|
|
$
|
(6,367
|
)
|
$
|
11,644
|
|
182.9
|
%
|
|||
Net Revenues
Net revenues increased by
$29.1 million
, or
127.6%
, to
$51.9 million
due to a combination of increased test volume and higher per-unit revenues. Approximately 94% of the increase is attributable to DecisionDx-Melanoma test revenues with the remainder primarily attributable to DecisionDx-UM. For the year ended December 31, 2019, we experienced an increase in DecisionDx-Melanoma and DecisionDx-UM test volume of 26.9%, compared to the year ended December 31, 2018. Our 2019 per-unit revenues also benefited from the attainment of “new ADLT” status for our DecisionDx-Melanoma test, effective July 1, 2019, which resulted in a higher Medicare reimbursement rate for the test, as described above. Revenues for the year ended December 31, 2019 were also positively impacted by the full-year effect of our final LCD for DecisionDx-Melanoma. The LCD was issued by Palmetto, effective December 3, 2018, and provided for payment of covered claims submitted for reimbursement beginning in February 2018. For the years ended December 31, 2019 and 2018, we recorded net positive revenue adjustments of
$2.5 million
and
$0.3 million
, respectively, related to tests delivered in previous periods, associated with changes in estimated variable consideration. The additional positive revenue adjustments in the current year primarily relate to recognition of revenue for certain tests delivered in prior periods for which no revenue was recognizable originally, but was recognized upon cash collection of payments for the tests in the current-year period.
Cost of Sales
Cost of sales for the year ended December 31, 2019 increased by
$2.0 million
, or
38.0%
, compared to the year ended December 30, 2018, primarily due to increased costs of supplies and services, attributable to the higher activity levels, as well as higher personnel costs due to additional headcount in our laboratory testing operations. Our gross margin percentage was
85.9%
for the year ended December 31, 2019, compared to
76.8%
for the same period in 2018, with the improvement principally a result of the increased operating leverage on the higher revenues. Due to the nature of our business, a significant portion of our cost of sales expenses represent fixed costs associated with our testing operations. Accordingly, our cost of sales expense will not necessarily increase or decrease commensurately with the change in net revenues from period to period.
Research and Development
Research and development expenses increased by
$2.5 million
, or
52.1%
, for the year ended December 31, 2019, compared to the year ended December 31, 2018, primarily associated with increases in personnel costs.
82
Selling, General and Administrative
SG&A expense increased by
$13.4 million
, or
81.2%
, for the year ended December 31, 2019 compared to the year ended December 31, 2018. Approximately 52% of the increase is attributable to higher personnel costs, particularly due to increased headcount, which includes salaries, bonuses, benefits and stock-based compensation. In early 2019, we expanded our sales organization from 14 territories to 23 territories and implemented an additional expansion to 32 territories beginning in December 2019. The higher personnel costs also reflect expanded headcount in our administrative support functions. The remainder of the increase was primarily associated with higher professional fees (principally attributable to reimbursement and accounting), increased travel costs, increased spending for events and conferences, higher insurance expense and other general increases.
Interest Income
Interest income increased by
$0.3 million
for the year ended December 31, 2019, compared to the year ended December 31, 2018, as a result of higher interest-bearing balances of cash and cash equivalents. The higher cash and cash equivalents were primarily attributable to proceeds from the IPO and the issuance of convertible promissory notes during 2019.
Interest Expense
Interest expense increased by
$2.3 million
, or
101.0%
, for the year ended December 31, 2019 compared to the year ended December 31, 2018. The effect of the issuance of the Q1 2019 Notes in January and February 2019 added $1.7 million in interest expense for the year ended December 31, 2019 and consisted of the accrual of the contractual 8% interest plus the amortization of issuance costs and debt discount. The remainder of the increase is due to a combination of higher average outstanding balances and higher interest rates on our variable-rate debt under our banking credit facility. Average outstanding bank debt balances were approximately $4.6 million higher during the year ended December 31, 2019 compared to the year ended December 31, 2018 and average interest rates increased by approximately 0.6% from the same period in 2018.
Gain on Extinguishment of Debt
We recorded a non-cash extinguishment gain related to the Q1 2019 Notes totaling
$5.2 million
during the year ended December 31, 2019, which was associated with the conversion of the Q1 2019 Notes into shares of common stock in connection with the IPO and was considered an extinguishment for accounting purposes. This gain resulted from certain accounting requirements associated with the extinguishment of debt with a beneficial conversion feature. See Note 7 to the financial statements for additional information.
Other Expense, Net
Other expense, net for the year ended December 31, 2019 consisted of losses associated with changes in fair value of the July 2019 Note, the liability for convertible preferred stock warrants and the embedded derivative associated with the Q1 2019 Notes of $2.1 million, $0.6 million and $0.2 million, respectively. The activity for the year ended December 31, 2018 consists entirely of changes in fair value of the liability for the convertible preferred stock warrants. These liabilities were adjusted to their current fair values each period, but effective with the IPO, the July 2019 Note and Q1 2019 Notes automatically converted into shares of common stock and we reclassified our liability for convertible preferred stock warrants to stockholders’ equity. Accordingly, no further changes in fair value for these items will be reflected in periods after the IPO date.
Income Tax Expense
We recorded minimal income tax expense in both the years ended December 31, 2019 and 2018, because the income tax expense (benefit) of net income (loss) in both periods was largely offset by changes in the valuation allowance on net deferred tax assets, as we have determined that it is more likely than not that these benefits will not be realized.
Liquidity and Capital Resources
Since our inception, we have incurred significant operating losses and negative cash flows. For the year ended December 31, 2018, our net loss was $6.4 million, our net cash used in operating activities was $12.3 million and we had an accumulated deficit of $57.5 million as of December 31, 2018. For the year ended December 31, 2019, we reported net income of
$5.3 million
(which includes the benefit of a
$5.2 million
non-cash debt extinguishment gain), our net cash provided by operating activities was
$7.0 million
and we had an accumulated deficit of
$52.2 million
as of December 31, 2019. We also have substantial indebtedness, the terms of which require us to meet a three-month trailing revenue covenant, which is currently tested quarterly. As of December 31, 2019 and 2018, we are in compliance with this covenant.
At the time of the issuance of our financial statements for the years ended December 31, 2018 and 2017, management’s projections, including consideration of certain revenue recognition policies, indicated potential non-compliance with the then-
83
effective revenue covenant during the 12 months following the date of issuance of those financial statements. Subsequently, in June 2019, we entered into an amendment to our 2018 LSA, or the First Amendment, which, among other changes
, modified the revenue covenant from a trailing six-month calculation to a trailing three-month calculation with revised revenue targets tested monthly.
In February and March 2020, we entered into amendments of the 2018 LSA that, among other things, changed the covenant from being tested monthly to quarterly testing and established revenue targets for the year ending December 31, 2020. M
anagement expects to be in compliance with the covenant for at least the next 12 months.
Prior to the IPO, we had raised aggregate cash proceeds of $46.6 million from the sale of our convertible preferred stock, in various private placements beginning in 2008, which we have used to fund our operations. In addition, we have obtained financing through term debt, a revolving line of credit and convertible promissory notes, which are discussed further below.
Initial Public Offering
In connection with the closing of the IPO on July 29, 2019, we issued and sold
4,600,000
shares of our common stock, including 600,000 shares associated with the full exercise of the underwriters’ option to purchase additional shares, at a price to the public of
$16.00
per share. We received approximately
$65.9 million
in net proceeds, after deducting underwriting discounts and commissions and other offering expenses payable by us.
Funding Requirements
Our primary uses of capital are, and we expect will continue to be, compensation and related expenses, clinical research and development services, laboratory and related supplies, legal and other regulatory expenses and general administrative costs. We anticipate that a substantial portion of our capital resources and efforts in the foreseeable future will be focused on the commercialization of our existing products, the development of our future product candidates the potential commercialization of our product candidates, should their development be successful, and general administrative costs.
We have two product candidates in the late stage development that we plan to launch commercially in the second half of 2020. The successful development of other product candidates is highly uncertain. At this time, we cannot reasonably estimate or know the nature, timing and estimated costs of the efforts that will be necessary to complete the clinical development of all our product candidates. We are also unable to predict when, if ever, revenue will commence from sales of our product candidates. This is due to the numerous risks and uncertainties associated with developing genomic tests, including, among others, the uncertainty of:
|
•
|
successful commencement and completion of clinical study protocols;
|
|
•
|
successful identification and acquisition of tissue samples;
|
|
•
|
the development and validation of genomic classifiers; and
|
|
•
|
acceptance of new genomic tests by physicians, patients and third-party payors.
|
A change in the outcome of any of these variables with respect to the development of any of our product candidates would significantly change the costs and timing associated with the development of that product candidate.
We will also incur costs as a public company that we have not previously incurred or have previously incurred at lower rates, including increased costs and expenses for fees to members of our board of directors, increased personnel costs, increased director and officer insurance premiums, audit and legal fees, investor relations fees and expenses for compliance with public-company reporting requirements under the Exchange Act and rules implemented by the SEC and Nasdaq.
As of December 31, 2019 and December 31, 2018, we had cash and cash equivalents of
$98.8 million
and
$4.5 million
, respectively. In the first quarter of 2019, we received net proceeds of $11.7 million from the sale of the Q1 2019 Notes. In July 2019, we received net proceeds of $9.2 million from the issuance of the July 2019 Note and $65.9 million in net proceeds from the IPO. We believe that our existing cash and cash equivalents and anticipated cash generated from sales of our products, will be sufficient to fund our operating expenses for the foreseeable future. We have based these estimates on assumptions that may prove to be wrong, and we could utilize our available capital resources sooner than we expect. Because of the numerous risks and uncertainties associated with research, development and commercialization of product candidates, we are unable to estimate the exact amount of our working capital requirements. Our future funding requirements will depend on and could increase significantly as a result of many factors, including those listed above.
Until such time, if ever, as we can generate revenue sufficient to achieve and sustain profitability, we expect to finance our operations through our cash on hand and, to the extent necessary, a combination of equity and debt financings, which may not be available to us when needed, on terms that we deem to be favorable or at all. We do not currently have any committed
84
external source of funds. To the extent that we raise additional capital through the sale of equity or convertible debt securities, the ownership interest of our stockholders will be diluted, and the terms of these securities may include liquidation or other preferences that adversely affect the rights of common stockholders. Debt financing and preferred equity financing, if available, may involve agreements that include covenants limiting or restricting our ability to take specific actions, such as incurring additional debt, making acquisitions or capital expenditures or declaring dividends. If we are unable to raise additional funds through equity or debt financings or other arrangements when needed, we may be required to delay, limit, reduce or terminate our product discovery and development activities or future commercialization efforts.
Long-Term Debt
Our long-term debt consists of term debt and a revolving line of credit and are presented in the table below (in thousands):
|
Years Ended December 31,
|
|||||||
|
|
2019
|
2018
|
|||||
|
Term debt
|
$
|
26,688
|
|
$
|
21,350
|
|
|
|
Revolving line of credit
|
—
|
|
5,000
|
|
|||
|
Total principal amount
|
26,688
|
|
26,350
|
|
|||
|
Unamortized discount and issuance costs
|
(1,566
|
)
|
(1,850
|
)
|
|||
|
Total long-term debt
|
25,122
|
|
24,500
|
|
|||
|
Less: Current portion of long-term debt
|
(5,833
|
)
|
—
|
|
|||
|
Long-term debt, less current portion
|
$
|
19,289
|
|
$
|
24,500
|
|
|
Term Debt
On November 30, 2018, we entered into the 2018 LSA with Oxford as collateral agent, and Oxford and SVB as equal syndicated lenders, or the Lenders. The 2018 LSA replaced the 2017 Loan and Security Agreement and provided for a $20.0 million term loan, or the 2018 Term Loan, and a credit line of up to $5.0 million (discussed in the ‘‘Revolving Line of Credit’’ section below), prior to amendment of the 2018 LSA on June 13, 2019, as discussed below. Our obligations under the 2018 LSA are secured by substantially all of our assets, excluding intellectual property and subject to certain other exceptions and limitations. We have the right to prepay the 2018 Term Loan in whole or in part at any time, subject to a prepayment fee of 2.50% if prepaid on or prior to November 30, 2019, 1.50% if prepaid after November 30, 2019 and on or prior to November 30, 2020, and 0.75% thereafter. Upon prepayment, we are also obligated to pay a non-refundable early termination fee of $496,785. Amounts prepaid or repaid under the 2018 Term Loan may not be reborrowed. Initially, the 2018 LSA contained a financial covenant that requires us to achieve a monthly trailing six-month revenue target each month throughout the term of the agreement, but the covenant amended on June 13, 2019 and changed to a monthly trailing three-month revenue target, as discussed further below. As of December 31, 2019 and December 31, 2018, we were in compliance with this covenant.
On June 13, 2019, we entered into the First Amendment, which, among other things, (i) eliminated the $5.0 million revolving line and increased the 2018 Term Loan by $5.0 million and (ii) amended the financial covenant to require us to achieve a monthly trailing three-month revenue target each month throughout the term of the agreement. The revenue targets were amended primarily to align with a more current reflection of our revenue projections after taking into account the impact of ASC 606 on our revenue recognition following our early adoption of ASC 606.
The First Amendment was accounted for as a modification of the 2018 LSA, and therefore no extinguishment gain or loss was recognized.
For each month through December 31, 2019, the trailing three-month revenue requirements were calculated as a percentage of our previously approved applicable monthly revenue projections.
In February 2020, we entered into an amendment of the 2018 LSA, or the Second Amendment, that, among other things, change the covenant from being tested monthly to quarterly testing. In March 2020, we entered into an amendment of the 2018 LSA, or the Third Amendment, with the Lenders to establish revenue targets for the year ending December 31, 2020. Such
requirements, for the quarterly periods from January to December 2020, are equal to generally increasing dollar amounts, in millions, in the low double digits. For quarterly periods ending after December 31, 2020, the trailing three-month revenue requirements will be determined by the Lenders upon receipt and review of our quarterly financial projections for the year, subject to certain specified criteria regarding minimum requirements. Revenues, if any, that we recognize as a result of an ALJ appeal process from consolidated claims initiatives for DecisionDx-Melanoma do not count toward the minimum revenue requirements. We were in compliance with this covenant as of the most recently tested quarter.
In addition, the 2018 LSA contains customary conditions of borrowing, events of default and covenants, including covenants that restrict our ability to dispose of assets, merge with or acquire other entities, incur indebtedness and make distributions to
85
holders of our capital stock. Should an event of default occur, including the occurrence of a material adverse change, we could be liable for immediate repay
ment of all obligations under the 2018 LSA. The Second Amendment included a waiver, by the Lenders, of an event of default by us attributable to maintaining a balance in a certain third-party deposit account, beyond the maximum level permitted, without obtaining a control agreement for such deposit account in favor of the collateral agent, Oxford. In addition to the waiver, the Second Amendment also provided a modification to increase the maximum balance permitted for this deposit account. We are currently in compliance with this provision of the 2018 LSA.
While we were able to obtain a waiver and amendment in this instance, there can be no assurance that the Lenders would agree to provide any future waivers or amendments if another event of default were to occur as result of noncompliance with this or any other covenant under the 2018 LSA.
Should we seek to further amend the terms of the 2018 LSA, the consent of Oxford and SVB would be required, and there can be no assurance that any such amendment would be available on terms acceptable to us, if at all.
The 2018 Term Loan bears interest at a floating rate equal to the greater of (1) 8.55% and (2) the 30-day U.S. LIBOR rate as reported in The Wall Street Journal on the last business day of the month that precedes the month in which the interest will accrue, plus 6.48%. The applicable interest rate on the 2018 Term Loan was
8.55%
as of December 31, 2019 and
8.98%
as of December 31, 2018, respectively. Interest on the 2018 Term Loan is payable monthly in arrears. We are permitted to make interest-only payments on the 2018 Term Loan through May 31, 2020. The principal is required to be repaid in 30 equal monthly installments beginning on June 1, 2020. All unpaid principal and accrued and unpaid interest are due on November 1, 2022, or the 2018 Term Loan Maturity Date. We are also obligated to make an additional final payment of 6.75% of the aggregate original principal amount, or $1,687,500 as of December 31, 2019, upon any prepayment or on the 2018 Term Loan Maturity Date. The final payment amount is being amortized as additional interest expense using the effective interest method of the term of the debt.
The 2018 Term Loan was fully funded on November 30, 2018 and the 2018 Revolving Line (defined and discussed below) was fully drawn upon on November 30, 2018. Proceeds from the 2018 LSA were used to repay all outstanding obligations under the 2017 LSA and to provide working capital. As a condition of the loan, we issued Series F preferred stock warrants to the Lenders with an aggregate initial fair value of $158,000. In accordance with ASC 480-10,
Distinguishing Liabilities from Equity
, the warrants were liability-classified as the underlying to the warrant was a puttable security. The initial recognition of the warrant liability created a discount to the debt, which is being amortized over the debt term using the effective interest method. The 2018 LSA was accounted for as a modification of the previous lending arrangement with SVB and Oxford, and therefore no extinguishment gain or loss was recognized.
Revolving Line of Credit
Under the 2018 LSA, we had a $5.0 million revolving line of credit, or the 2018 Revolving Line, contingent on our satisfaction of borrowing base eligibility requirements. The 2018 Revolving Line bore interest at a floating per annum rate equal to the greater of (1) 6.25% and (2) 5.48% above the U.S. LIBOR rate. The applicable interest rate on the 2018 Revolving Line at December 31, 2018 was 7.98%. The 2018 Revolving Line was to be due in full no later than November 30, 2020, but was eliminated in connection with the First Amendment.
Q1 2019 Convertible Promissory Notes
In January and February 2019, we issued $11,770,000 principal amount of unsecured convertible promissory notes of which $4,756,000 was with related parties (executive officers, members of our board of directors or entities affiliated with them). The Q1 2019 Notes bear simple interest at a rate of 8% per annum. Originally, the Q1 2019 Notes had a maturity date of January 31, 2020, but on July 3, 2019 we entered into an amendment with the holders of the Q1 2019 Notes to extend the maturity date to June 30, 2020.
Such amendment was treated as a modification of the existing debt and therefore no extinguishment gain or loss was recognized in connection with the amendment.
Prior to the actual conversion of the Q1 2019 Notes on July 29, 2019 (discussed below), on or before the maturity date, the entire outstanding principal amount of and accrued interest on the Q1 2019 Notes, or the Conversion Amount, was automatically convertible into shares of our equity securities issued and sold in a single or series of related transactions, with the principal purpose of raising capital, in which we sell shares of such equity securities for aggregate gross proceeds of at least $10.0 million, or the Next Equity Financing. The number of shares of such equity securities issuable in the Next Equity Financing was equal to the quotient of the Conversion Amount as of the closing date of the Next Equity Financing divided by a per share price that is equal to 80% of the lowest per share purchase price of the equity securities sold in the Next Equity Financing. If the Q1 2019 Notes had not been repaid or converted prior to the maturity date, then, at the request of the holders of a majority of the then-outstanding principal amount of and accrued interest on the Q1 2019 Notes, then the Conversion Amount as of the maturity date would have converted into shares of our Series F redeemable convertible preferred stock, or any
86
senior equity security issued by us after the first issuance of the Q1 2019 Notes, in each case at a conversion price equal to the price at which such security was last sold (which was $5.8208 for shares of our Series F redeemable convertible preferred stock). If we had undergone a change of control while the Q1 2019 Notes were outstanding, we would have been required to repurchase each note from each holder at a repurchase price equal to two times the principal amount of such note, plus any accrued and unpaid interest on such note as of the date of such repurchase.
As discussed further in Note 7 to the financial statements appearing elsewhere in this Annual Report on Form 10-K, the Q1 2019 Notes contained a beneficial conversion feature and an embedded derivative, both of which created a significant debt discount that was being amortized over the life of the debt (that is, through June 30, 2020) using the effective interest method, which resulted in increases in non-cash interest expense in each succeeding reporting period until the Q1 2019 Notes were converted into shares of common stock on July 29, 2019.
Extinguishment Gain
The closing of the IPO on July 29, 2019 was considered to be the Next Equity Financing under the terms of the Q1 2019 Notes. Accordingly, on July 29, 2019, the Conversion Amount of the Q1 2019 Notes as of such date converted into 954,074 shares of common stock based on a price of $12.80 per share, or 80% of the IPO price of $16.00 per share. Based on applicable accounting guidance, the conversion of the Q1 2019 notes was considered an extinguishment for accounting purposes, which resulted in a gain of $5.2 million. The gain resulted from certain accounting requirements associated with the extinguishment of debt with a beneficial conversion feature. See Note 7 to the financial statements for additional information.
July 2019 Convertible Promissory Note
On July 12, 2019, we issued an unsecured convertible promissory note having a principal amount of $10,000,000 and our net proceeds, after deducting issuance costs, was
$9.2 million
. In connection with the issuance of the July 2019 Note, we also issued to the purchaser a warrant to purchase 209,243 shares of common stock at an exercise price of approximately $0.001 per share, which expires on July 12, 2026. The July 2019 Note bore simple interest at a rate of 8% per annum and had an original maturity date of June 30, 2020. As a result of the IPO, the outstanding principal amount plus accrued interest on the July 2019 Note converted into 707,032 shares of common stock on July 29, 2019, based on a price derived from a valuation calculated pursuant to the terms of the July 2019 Note. As discussed further in Note 7 to the financial statements, we accounted for the July 2019 Note at fair value and recognized a loss of
$2.1 million
during the year ended December 31, 2019, which represents the excess of the fair value of the shares issued upon conversion of the July 2019 Note over the net proceeds received.
Operating Leases
We have entered into various operating leases, which are primarily associated with our laboratory facilities and office space. Total future minimum payment obligations under our operating leases as of
December 31, 2019
totaled approximately
$6.4 million
. The leases expire on various dates through 2027 and provide certain options to renew for additional periods. Refer to Note 9 to the financial statements for additional information on our leasing arrangements.
Cash Flows
As of December 31, 2019 and December 31, 2018, we had cash and cash equivalents of
$98.8 million
and
$4.5 million
, respectively. The following table summarizes our sources and uses of cash and cash equivalents for each of the periods presented (in thousands):
|
|
Years Ended December 31,
|
|||||||
|
|
2019
|
2018
|
||||||
|
Net cash provided by (used in) operating activities
|
$
|
7,015
|
|
$
|
(12,295
|
)
|
||
|
Net cash used in investing activities
|
(937
|
)
|
(277
|
)
|
||||
|
Net cash provided by financing activities
|
88,288
|
|
15,839
|
|
||||
|
Net increase in cash and cash equivalents
|
$
|
94,366
|
|
$
|
3,267
|
|
||
Operating Activities
Net cash provided by operating activities was
$7.0 million
for the year ended December 31, 2019 and was primarily attributable to net income of
$5.3 million
and net non-cash charges of $1.7 million (consisting of
$2.1 million
of fair value option adjustments,
$1.9 million
in amortization of debt discount and issuance costs, stock compensation expense of
$1.2 million
,
87
preferred stock warrant fair value adjustments of
$0.6 million
, and $1.1 million of other items, partially offset by
$5.2 million
of a debt extinguishment gain).
Net cash used in operating activities was
$12.3 million
for the year ended December 31, 2018 and was primarily attributable to the net loss of
$6.4 million
and increases in accounts receivable of
$8.4 million
, partially offset by increases in accrued compensation of
$1.3 million
and non-cash charges of $0.9 million.
Investing Activities
Net cash used in investing activities for the years ended December 31, 2019 and 2018 consisted entirely of purchases of property and equipment.
Financing Activities
Net cash provided by financing activities was
$88.3 million
for the year ended December 31, 2019 and consisted primarily of
$65.9 million
of proceeds from our IPO (net of underwriting discounts, commissions and issuance costs),
$11.7 million
of net proceeds from the issuance of the Q1 2019 Notes,
$9.2 million
of net proceeds from the issuance of the July 2019 Note,
$1.8 million
of net proceeds associated with an increase in the 2018 Term Loan in connection with an amendment to the 2018 LSA and
$1.2 million
of proceeds from the exercise of stock options, partially offset by principal repayments of
$1.8 million
on our line of credit.
Net cash provided by financing activities was
$15.8 million
for the year ended December 31, 2018 and consisted primarily of
$10.4 million
attributable to proceeds received from the issuance of preferred stock and preferred stock warrants, $4.4 million from the issuance of term debt and preferred stock warrants in connection with the 2018 LSA and
$1.0 million
in proceeds from our line of credit.
Contractual Obligations and Commitments
Not required for smaller reporting companies.
Off-Balance Sheet Arrangements
We do not currently have, nor did we have any off-balance sheet arrangements, as defined in the rules and regulations of the SEC, during the periods presented.
Critical Accounting Policies and Significant Judgments and Estimates
Our financial statements are prepared in accordance with U.S. GAAP. The preparation of our financial statements and related disclosures requires us to make estimates and judgments that affect the reported amounts of assets, liabilities, costs and expenses, and the disclosure of contingent assets and liabilities in our financial statements. We base our estimates on historical experience, known trends and events and various other factors that we believe are reasonable under the circumstances, the results of which form the basis for making judgments about the carrying values of assets and liabilities that are not readily apparent from other sources. We evaluate our estimates and assumptions on an ongoing basis. Our actual results may differ from these estimates under different assumptions or conditions.
While our significant accounting policies are described in more detail in Note 2 to our audited financial statements, we believe that the following accounting policies are those most critical to the judgments and estimates used in the preparation of our financial statements.
Revenue Recognition
We recognize revenue in accordance with ASC 606.
In accordance with ASC 606, we follow a five-step process to recognize revenues: (1) identify the contract with the customer; (2) identify the performance obligations; (3) determine the transaction price; (4) allocate the transaction price to the performance obligation; and (5) recognize revenues when the performance obligations are satisfied.
All of our revenues from contracts with customers are associated with the provision of diagnostic and prognostic cancer test reports. Our revenues are primarily derived from DecisionDx-Melanoma, for cutaneous melanoma, and we also have revenues attributable to DecisionDx-UM, for uveal melanoma.
We have determined that we have a contract with the patient when the treating physician orders the test. Our contracts generally contain a single performance obligation, which is the delivery of the test report, and we satisfy our performance obligation at the point in time when we deliver the test report to the treating physician, at which point we can bill for the report. The amount
88
of revenue recognized reflects the amount of consideration we expect to receive, or the transaction price, and considers the effects of variable consideration, which is discussed further below.
Once we satisfy our performance obligations and bill for the test report, the timing of the collection of payments may vary based on the payment practices of the third-party payor and the existence of contractually established reimbursement rates. Most of the payments for our test reports are made by third-party payors, including Medicare and commercial health insurance carriers. Certain contracts contain a contractual commitment of a reimbursement rate that differs from our list prices. However, absent a contractually committed reimbursement rate with a commercial carrier or governmental program, our diagnostic tests may or may not be covered by these entities’ existing reimbursement policies. In addition, patients do not enter into direct agreements with us that commit them to pay any portion of the cost of the tests in the event that their insurance provider declines to reimburse us. We may pursue, on a case-by-case basis, reimbursement from such patients in the form of co-payments and co-insurance, in accordance with the contractual obligations that we have with the insurance carrier or health plan. These situations may result in a delay in the collection of payments.
The Medicare claims that are covered by policy under an LCD are generally paid at the established rate by our Medicare contractor within 30 days from receipt. As the LCD currently only covers a portion of the DecisionDx-Melanoma test reports, we provide for patients covered by Medicare, we intend to attempt to expand this LCD coverage policy in the future. Medicare claims that were either submitted to Medicare prior to the LCD’s effective date or that are not otherwise covered by the terms of the LCD, but that may meet the definition of being reasonable and necessary pursuant to Section 1862(a)(1)(A) of the Social Security Act, are generally appealed by us. If our appeal is successful at the first level (termed “redetermination”), second level (termed “reconsideration”) or third level of appeal (de novo hearing with an ALJ), payment may be made for all or a portion of the claim.
We have concluded that our contracts include variable consideration because the amounts paid by Medicare or commercial health insurance carriers may be paid at less than our standard rates or not paid at all, with such differences considered implicit price concessions. Variable consideration attributable to these price concessions is measured at the expected value using the “most likely amount” method under ASC 606. The amounts are determined by historical average collection rates by test type and payor category taking into consideration the range of possible outcomes, the predictive value of our past experiences, the time period of when uncertainties expect to be resolved and the amount of consideration that is susceptible to factors outside of our influence, such as the judgment and actions of third parties. Such variable consideration is included in the transaction price only to the extent it is probable that a significant reversal in the amount of cumulative revenue recognized will not occur when the uncertainties with respect to the amount are resolved. Variable consideration may be constrained and excluded from the transaction price in situations where there is no contractually agreed upon reimbursement coverage or in the absence of a predictable pattern and history of collectability with a payor. Variable consideration for Medicare claims is deemed to be fully constrained when the payment of such claims is subject to approval by an ALJ at an appeal hearing, due to factors outside our influence (i.e., judgment or actions of third parties) and the uncertainty of the amount to be received is not expected to be resolved for a long period of time. Variable consideration is evaluated each reporting period and adjustments are recorded as increases or decreases in revenues. Included in revenues for the years ended December 31, 2019 and 2018 were $2.5 million and $0.3 million, respectively, of revenue increases associated with changes in estimated variable consideration related to performance obligations satisfied in previous periods.
Because our contracts with customers have an expected duration of one year or less, we have elected the practical expedient in ASC 606 to not disclose information about our remaining performance obligations. Any incremental costs to obtain contracts are recorded as SG&A expense as incurred due to the short duration of our contracts. Contract balances consisted solely of accounts receivable (both current and noncurrent) as of December 31, 2019 and 2018.
DecisionDx-Melanoma Claims Consolidation
In June 2017, we submitted to the Office of Medicare Hearings and Appeals, or OMHA, a formal request to participate in a program to consolidate and adjudicate large volumes of claim disputes at an accelerated rate. The program consolidates outstanding claim appeals pending at the ALJ level and uses a statistical-sampling approach where multiple ALJs will determine reimbursement results for a sample of claims which are then extrapolated to the universe of claims. Our consolidated appeal includes 2,698 DecisionDx-Melanoma claims dating from 2013 through spring 2017. The judges who will review the sample sets have been identified and the hearings were held in April 2019 with a supplemental hearing in May 2019. No formal ruling has been issued to date. In accordance with ASC 606, we have not recognized (fully constrained the variable consideration) any revenues attributable to these claims in our financial statements pending the outcome of this matter. We expect to recognize any revenue adjudicated by the ALJ in the reporting period in which we are notified of the ALJ hearing outcome
and it is determined that such decision will not be appealed.
89
Stock-Based Compensation
Stock-based compensation expense for equity instruments issued to employees and non-employees, including the purchase rights issued under our 2019 Employee Stock Purchase Plan, or ESPP, is measured based on the grant-date fair value of the awards. The fair value of each employee stock option is estimated on the date of grant using the Black-Scholes option-pricing valuation model and on the offering date for the ESPP. We recognize compensation costs on a straight-line basis for all employee stock-based compensation awards over the requisite service period of the awards, which is generally the awards’ vesting period, which is typically four years for options and the two-year offering period for the ESPP. Forfeitures are accounted for as they occur.
Following is a description of the significant assumptions used in the option pricing model:
|
•
|
Expected term
. The expected term is the period of time that granted options are expected to be outstanding. For stock options, we have set the expected term using the simplified method based on the weighted average of both the period to vesting and the period to maturity for each option, as we have concluded that our stock option exercise history does not provide a reasonable basis upon which to estimate the expected term. For the ESPP, the expected term is the period of time from the offering date to the purchase date.
|
|
•
|
Expected volatility
. Because of the limited period of time our stock has been traded in an active market, we calculate volatility by using the historical stock prices of a group of similar companies looking back over the estimated life of the option or the ESPP purchase right and averaging the volatilities of these companies.
|
|
•
|
Risk-free interest rate
. We base the risk-free interest rate used in the Black-Scholes valuation model on the market yield in effect at the time of option grant and at the offering date for ESPP provided from the Federal Reserve Board’s Statistical Releases and historical publications from the Treasury constant maturities rates for the equivalent remaining terms.
|
|
•
|
Dividend yield
. We have not paid, and do not have plans to pay, cash dividends. Therefore, we use an expected dividend yield of zero in the Black-Scholes option valuation model.
|
Prior to our IPO, the estimated fair value of our common stock had been determined by our board of directors as of the date of each award grant, with input from management, considering our most recently available third-party valuations of common stock and our board of directors’ assessment of additional objective and subjective factors that it believed were relevant and which may have changed from the date of the most recent valuation through the date of the grant, which intended all options granted to be exercisable at price per share not less than the per share fair value of our common stock underlying those options on the grant date. Subsequent to our IPO, the fair value of our common stock is the closing selling price per share of our common stock as reported on the Nasdaq Global Market on the date of grant or other relevant determination date.
The following table sets forth the assumptions used to determine the fair value of stock options:
|
Years Ended December 31,
|
||||
|
2019
|
2018
|
|||
|
Average expected term
|
6 years
|
6 years
|
||
|
Expected stock price volatility
|
56.74% - 60.17%
|
57.77% - 58.29%
|
||
|
Risk-free interest rate
|
1.63% - 2.47%
|
2.77% - 3.13%
|
||
|
Dividend yield
|
—%
|
—%
|
||
The following table sets forth assumptions used to determine the fair value of the purchase rights issued under the ESPP:
|
Years Ended December 31,
|
||||
|
2019
|
2018
|
|||
|
Average expected term
|
1.2 years
|
Not applicable
|
||
|
Expected stock price volatility
|
61.12% - 68.89%
|
Not applicable
|
||
|
Risk-free interest rate
|
1.56% - 1.80%
|
Not applicable
|
||
|
Dividend yield
|
—%
|
Not applicable
|
||
Recent Accounting Pronouncements
Refer to Note 2, ‘‘Summary of Significant Accounting Policies,’’ in the accompanying notes to our financial statements included in this Annual Report on Form 10-K for a discussion of recent accounting pronouncements.
90
JOBS Act Accounting Election
We are an emerging growth company within the meaning of the JOBS Act. Section 107(b) of the JOBS Act provides that an emerging growth company can leverage the extended transition period, provided in Section 102(b) of the JOBS Act, for complying with new or revised accounting standards. Thus, an emerging growth company can delay the adoption of new or revised accounting standards that have different effective dates for public and private companies until those standards apply to private companies. We have elected to use this extended transition period and, as a result, our financial statements may not be comparable to companies that comply with public company effective dates. We also intend to rely on other exemptions provided by the JOBS Act, including without limitation, not being required to comply with the auditor attestation requirements of Section 404(b) of Sarbanes-Oxley.
We will remain an emerging growth company until the earliest of (1) December 31, 2024, (2) the last day of the fiscal year (a) in which we have total annual gross revenue of at least $1.07 billion or (b) in which we are deemed to be a ‘‘large accelerated filer’’ as defined in Rule 12b-2 under the Exchange Act, which would occur if the market value of our common stock held by non-affiliates exceeded $700.0 million as of the prior June 30
th
, and (3) the date on which we have issued more than $1.0 billion in non-convertible debt securities during the prior three-year period.
Item 7A. Qualitative and Quantitative Disclosures About Market Risk.
As a smaller reporting company, we are not required to provide the information required by this Item.
Item 8. Financial Statements and Supplementary Data.
The financial statements and supplementary data required by this item are included after the Signature page of this Annual Report on Form 10-K beginning on page
F-1
.
Item 9. Changes in and Disagreements With Accountants on Accounting and Financial Disclosure.
None.
Item 9A. Controls and Procedures.
Evaluation of Disclosure Controls and Procedures
We maintain “disclosure controls and procedures,” as defined in Rules 13a-15(e) and 15d-15(e) under the Exchange Act, that are designed to ensure that information required to be disclosed in the reports that we file or submit under the Exchange Act is (1) recorded, processed, summarized and reported, within the time periods specified in the SEC’s rules and forms and (2) accumulated and communicated to our management, including our principal executive officer and principal financial officer, to allow timely decisions regarding required disclosure. Management recognizes that any controls and procedures, no matter how well designed and operated, can provide only reasonable assurance of achieving their objectives and management necessarily applies its judgment in evaluating the cost-benefit relationship of possible controls and procedures.
Our management, with the participation of our Chief Executive Officer and Chief Financial Officer, evaluated the effectiveness of our disclosure controls and procedures as of
December 31, 2019
. Based upon the evaluation, our Chief Executive Officer and Chief Financial Officer concluded that, as of such date, our disclosure controls and procedures were effective at the reasonable assurance level of December 31, 2019.
Remediation of Material Weaknesses in Internal Control over Financial Reporting
As previously disclosed, in connection with the audit of our financial statements as of and for each of the years ended December 31, 2018 and 2017, we identified material weaknesses in our internal control over financial reporting related to a lack of (i) appropriately designed and implemented controls over the review and approval of manual journal entries and the related supporting journal entry calculations, (ii) personnel with appropriate knowledge, experience and training commensurate with accounting and reporting requirements and (iii) appropriately designed and implemented controls to evaluate variable consideration and the related constraint in accordance with ASC 606, and resulted in certain material corrections to the financial statements.
To improve our internal control over financial reporting and address these material weaknesses, during the year ended December 31, 2019, we:
|
•
|
Hired a full-time director of SEC reporting and technical accounting, a certified public accountant with an active license, with public company reporting experience to provide oversight and technical expertise with respect to
|
91
financial reporting and technical accounting matters. Further, we have added an additional full-time accounting resource, also a certified public accountant with an active license, to assist with financial reporting and technical accounting activities. Additionally, we hired a full-time financial analyst to support our revenue accounting and related activities under ASC 606;
|
•
|
Began enhancement of our information technology tools to improve the efficiency of our processes with respect to revenue recognition under ASC 606;
|
|
•
|
Engaged a third-party consultant to assist us with formalizing our internal control documentation and implementation of enhancements to our internal control over financial reporting; and
|
|
•
|
Designed and implemented a new process control and review procedure with respect to manual journal entries.
|
In connection with its review of disclosure controls and procedures as of December 31, 2019, management concluded that the previously identified material weaknesses have been remediated.
Management’s Report on Internal Control over Financial Reporting
This Annual Report on Form 10-K does not include a report of management’s assessment regarding internal control over financial reporting or an attestation report of our registered public accounting firm due to a transition period established by rules of the SEC for newly public companies.
Changes in Internal Control over Financial Reporting
Except for the changes in connection with the remediation of the previously identified material weaknesses discussed above, there have been no other changes in our internal control over financial reporting (as defined in Rules 13a-15(f) or 15d-15(f) of the Exchange Act) that occurred during the fourth quarter of 2019 that have materially affected, or are reasonably likely to materially affect, the Company’s internal control over financial reporting.
Item 9B. Other Information.
None.
92
PART III
Item 10. Directors, Executive Officers and Corporate Governance.
The information required by this item and not set forth below will be contained in our definitive proxy statement to be filed with the Securities and Exchange Commission in connection with our 2020 Annual Meeting of Stockholders, or the Proxy Statement, which is expected to be filed not later than 120 days after the end of our fiscal year ended December 31, 2019, and is incorporated herein by reference.
We have adopted a written Code of Business Conduct and Ethics, or Ethics Code, that applies to all officers, directors and employees, including our principal executive officer, principal financial officer, principal accounting officer or controller, or persons performing similar functions. The Ethics Code is available on our website at www.CastleBiosciences.com. If we make any substantive amendments to the Ethics Code or grant any waiver from a provision of the Ethics Code to any executive officer or director, we will promptly disclose the nature of the amendment or waiver on our website or in a Current Report on Form 8-K.
Item 11. Executive Compensation.
The information required by this item will be set forth in the Proxy Statement and is incorporated herein by reference.
Item 12. Security Ownership of Certain Beneficial Owners and Management and Related Stockholder Matters.
The information required by this item will be set forth in the Proxy Statement and is incorporated herein by reference.
Item 13. Certain Relationships and Related Transactions, and Director Independence.
The information required by this item will be set forth in the Proxy Statement and is incorporated herein by reference.
Item 14. Principal Accounting Fees and Services.
The information required by this item will be set forth in the Proxy Statement and is incorporated herein by reference.
93
PART IV
Item 15. Exhibits, Financial Statement Schedules.
(a)(1) Financial Statements.
The financial statements and supplementary data required by this item are included after the Signature page of this Annual Report on Form 10-K beginning on page
F-1
.
(a)(2) Financial Statement Schedules.
All schedules have been omitted because they are not required or because the required information is given in the Financial Statements or Notes thereto.
(a)(3) Exhibits.
The exhibits listed in the Exhibit Index below are filed or incorporated by reference as part of this Annual Report.
Exhibit Index
|
Exhibit Number
|
Description of document
|
|
|
3.1
|
||
|
3.2
|
||
|
4.1*
|
||
|
4.2
|
||
|
4.3
|
||
|
4.4
|
||
|
4.5
|
||
|
4.6
|
||
|
4.7
|
||
|
4.8
|
||
|
4.9
|
||
|
4.10
|
||
|
10.1+
|
||
|
10.2+
|
||
94
|
Exhibit Number
|
Description of document
|
|
|
10.3+
|
||
|
10.4+
|
||
|
10.5+
|
||
|
10.6+
|
||
|
10.7+
|
||
|
10.8+
|
||
|
10.9+
|
||
|
10.10+
|
||
|
10.11+
|
||
|
10.12+
|
||
|
10.13+
|
||
|
10.14
|
||
|
10.15*
|
||
|
10.16
|
||
|
10.17
|
||
|
10.18
|
||
|
10.19
|
||
|
10.20#
|
||
|
10.21#
|
||
95
|
Exhibit Number
|
Description of document
|
|
|
10.22#
|
||
|
10.23+
|
||
|
23.1*
|
||
|
31.1*
|
||
|
31.2*
|
||
|
32.1**
|
||
|
32.2**
|
||
|
101.INS*
|
XBRL Instance Document.
|
|
|
101.SCH*
|
XBRL Taxonomy Extension Schema Document.
|
|
|
101.CAL*
|
XBRL Taxonomy Extension Calculation Linkbase Document.
|
|
|
101.DEF*
|
XBRL Taxonomy Extension Definition Linkbase Document.
|
|
|
101.LAB*
|
XBRL Taxonomy Extension Label Linkbase Document.
|
|
|
101.PRE*
|
XBRL Taxonomy Extension Presentation Linkbase Document.
|
|
_____________________________________
|
*
|
Filed herewith
|
|
**
|
Furnished herewith.
|
|
+
|
Indicates management contract or compensatory plan.
|
|
#
|
Certain portions of this exhibit (indicated by “[***]”) have been omitted as we have determined (i) the omitted information is not material and (ii) the omitted information would likely cause harm to us if publicly disclosed.
|
Item 16. Form 10-K Summary.
None.
96
SIGNATURES
Pursuant to the requirements of Section 13 or 15(d) of the Securities Exchange Act of 1934, the Registrant has duly caused this report to be signed on its behalf by the undersigned, thereunto duly authorized, on
March 10, 2020
.
|
|
CASTLE BIOSCIENCES, INC.
|
|||
|
|
|
|
||
|
By:
|
/s/ Derek J. Maetzold
|
|||
|
|
Derek J. Maetzold
President and Chief Executive Officer
(Principal Executive Officer)
|
|||
Pursuant to the requirements of the Securities Exchange Act of 1934, this report has been signed below by the following persons on behalf of the Registrant and in the capacity and on the dates indicated.
|
SIGNATURE
|
TITLE
|
DATE
|
||
|
/s/ Derek J. Maetzold
|
President, Chief Executive Officer and Director
|
March 10, 2020
|
||
|
(Derek J. Maetzold)
|
(
Principal Executive Officer
)
|
|||
|
/s/ Frank Stokes
|
Chief Financial Officer
|
March 10, 2020
|
||
|
(Frank Stokes)
|
(
Principal Financial and Accounting Officer
)
|
|||
|
/s/ Daniel M. Bradbury
|
Chairman of the Board of Directors
|
March 10, 2020
|
||
|
(Daniel M. Bradbury)
|
||||
|
/s/ Bonnie H. Anderson
|
Member of the Board of Directors
|
March 10, 2020
|
||
|
(Bonnie H. Anderson)
|
||||
|
/s/ Mara G. Aspinall
|
Member of the Board of Directors
|
March 10, 2020
|
||
|
(Mara G. Aspinall)
|
||||
|
/s/ G. Bradley Cole
|
Member of the Board of Directors
|
March 10, 2020
|
||
|
(G. Bradley Cole)
|
||||
|
/s/ Joseph C. Cook III
|
Member of the Board of Directors
|
March 10, 2020
|
||
|
(Joseph C. Cook III)
|
||||
|
/s/ David Kabakoff, Ph.D.
|
Member of the Board of Directors
|
March 10, 2020
|
||
|
(David Kabakoff, Ph.D.)
|
||||
97
INDEX TO FINANCIAL STATEMENTS
F-1
Report of Independent Registered Public Accounting Firm
To the Stockholders and Board of Directors
Castle Biosciences, Inc.:
Opinion on the Financial Statements
We have audited the accompanying balance sheets of Castle Biosciences, Inc. (the Company) as of December 31, 2019 and 2018, the related statements of operations and comprehensive income (loss), convertible preferred stock and stockholders’ equity (deficit), and cash flows for each of the years in the two-year period ended December 31, 2019, and the related notes (collectively, the financial statements). In our opinion, the financial statements present fairly, in all material respects, the financial position of the Company as of December 31, 2019 and 2018, and the results of its operations and its cash flows for each of the years in the two-year period ended December 31, 2019, in conformity with U.S. generally accepted accounting principles.
Basis for Opinion
These financial statements are the responsibility of the Company’s management. Our responsibility is to express an opinion on these financial statements based on our audits. We are a public accounting firm registered with the Public Company Accounting Oversight Board (United States) (PCAOB) and are required to be independent with respect to the Company in accordance with the U.S. federal securities laws and the applicable rules and regulations of the Securities and Exchange Commission and the PCAOB.
We conducted our audits in accordance with the standards of the PCAOB. Those standards require that we plan and perform the audit to obtain reasonable assurance about whether the financial statements are free of material misstatement, whether due to error or fraud. Our audits included performing procedures to assess the risks of material misstatement of the financial statements, whether due to error or fraud, and performing procedures that respond to those risks. Such procedures included examining, on a test basis, evidence regarding the amounts and disclosures in the financial statements. Our audits also included evaluating the accounting principles used and significant estimates made by management, as well as evaluating the overall presentation of the financial statements. We believe that our audits provide a reasonable basis for our opinion.
/s/ KPMG LLP
We have served as the Company’s auditor since 2018.
San Diego, California
March 10, 2020
F-2
|
CASTLE BIOSCIENCES, INC.
BALANCE SHEETS
(in thousands, except share and per share data)
|
|||||||
|
December 31,
|
|||||||
|
2019
|
2018
|
||||||
|
ASSETS
|
|||||||
|
Current Assets
|
|
|
|
|
|||
|
Cash and cash equivalents
|
$
|
98,845
|
|
$
|
4,479
|
|
|
|
Accounts receivable, net
|
14,648
|
|
12,090
|
|
|||
|
Inventory
|
1,237
|
|
882
|
|
|||
|
Prepaid expenses and other current assets
|
1,951
|
|
675
|
|
|||
|
Total current assets
|
116,681
|
|
18,126
|
|
|||
|
Long-term accounts receivable, net
|
870
|
|
2,532
|
|
|||
|
Property and equipment, net
|
2,060
|
|
1,529
|
|
|||
|
Intangible assets, net
|
—
|
|
4
|
|
|||
|
Other assets – long-term
|
135
|
|
214
|
|
|||
|
Total assets
|
$
|
119,746
|
|
$
|
22,405
|
|
|
|
LIABILITIES, CONVERTIBLE PREFERRED STOCK AND
STOCKHOLDERS’ EQUITY (DEFICIT)
|
|||||||
|
Current Liabilities
|
|||||||
|
Accounts payable
|
$
|
1,865
|
|
$
|
1,451
|
|
|
|
Accrued compensation
|
5,779
|
|
4,571
|
|
|||
|
Other accrued liabilities
|
1,812
|
|
715
|
|
|||
|
Current portion of long-term debt
|
5,833
|
|
—
|
|
|||
|
Total current liabilities
|
15,289
|
|
6,737
|
|
|||
|
Long-term debt
|
19,289
|
|
24,500
|
|
|||
|
Preferred stock warrant liability
|
—
|
|
1,194
|
|
|||
|
Deferred rent liability
|
55
|
|
44
|
|
|||
|
Total liabilities
|
34,633
|
|
32,475
|
|
|||
|
Commitments and Contingencies (Note 11)
|
|
|
|
|
|||
|
Convertible Preferred Stock
|
|||||||
|
Convertible preferred stock Series C, $0.001 par value, zero and 503,056 shares authorized as of December 31, 2019 and 2018, respectively; zero and 503,056 shares issued and outstanding as of December 31, 2019 and 2018, respectively; $0 and $2,417 aggregate liquidation preference as of December 31, 2019 and 2018, respectively.
|
—
|
|
1,501
|
|
|||
|
Redeemable convertible preferred stock Series A, B, D, E-1, E-2, E-2A, E-3 and F, $0.001 par value, zero and 9,640,493 shares authorized as of December 31, 2019 and 2018, respectively; zero and 9,456,775 shares issued and outstanding as of December 31, 2019 and 2018, respectively; $0 and $57,570 aggregate liquidation preference as of December 31, 2019 and 2018, respectively.
|
—
|
|
44,995
|
|
|||
|
Stockholders’ Equity (Deficit)
|
|||||||
|
Common stock, $0.001 par value; 200,000,000 and 15,102,000 shares authorized as of December 31, 2019 and 2018, respectively; 17,130,907 and 1,916,224 shares issued and outstanding as of December 31, 2019 and 2018, respectively.
|
17
|
|
2
|
|
|||
|
Preferred stock, $0.001 par value; 10,000,000 and zero shares authorized as of December 31, 2019 and 2018, respectively; no shares issued and outstanding as of December 31, 2019 and 2018.
|
—
|
|
—
|
|
|||
|
Additional paid-in capital
|
137,308
|
|
921
|
|
|||
|
Accumulated deficit
|
(52,212
|
)
|
(57,489
|
)
|
|||
|
Total stockholders’ equity (deficit)
|
85,113
|
|
(56,566
|
)
|
|||
|
Total liabilities, convertible preferred stock and stockholders’ equity (deficit)
|
$
|
119,746
|
|
$
|
22,405
|
|
|
The accompanying notes are an integral part of these financial statements.
F-3
|
CASTLE BIOSCIENCES, INC.
STATEMENTS OF OPERATIONS AND COMPREHENSIVE INCOME (LOSS)
(in thousands, except per share data)
|
||||||||
|
Years Ended December 31,
|
||||||||
|
2019
|
2018
|
|||||||
|
NET REVENUES
|
$
|
51,865
|
|
$
|
22,786
|
|
||
|
COST OF SALES
|
7,310
|
|
5,297
|
|
||||
|
Gross margin
|
44,555
|
|
17,489
|
|
||||
|
OPERATING EXPENSES
|
||||||||
|
Research and development
|
7,385
|
|
4,854
|
|
||||
|
Selling, general and administrative
|
29,842
|
|
16,471
|
|
||||
|
Total operating expenses
|
37,227
|
|
21,325
|
|
||||
|
Operating income (loss)
|
7,328
|
|
(3,836
|
)
|
||||
|
Interest income
|
312
|
|
24
|
|
||||
|
Interest expense
|
(4,571
|
)
|
(2,274
|
)
|
||||
|
Gain on extinguishment of debt (Note 7)
|
5,213
|
|
—
|
|
||||
|
Other expense, net
|
(2,933
|
)
|
(272
|
)
|
||||
|
Income (loss) before income taxes
|
5,349
|
|
(6,358
|
)
|
||||
|
Income tax expense
|
72
|
|
9
|
|
||||
|
Net income (loss) and comprehensive income (loss)
|
5,277
|
|
(6,367
|
)
|
||||
|
Convertible preferred stock cumulative dividends
|
2,156
|
|
3,577
|
|
||||
|
Accretion of redeemable convertible preferred stock to redemption value
|
130
|
|
219
|
|
||||
|
Net income (loss) and comprehensive income (loss) attributable to common stockholders
|
$
|
2,991
|
|
$
|
(10,163
|
)
|
||
|
Earnings (loss) per share attributable to common stockholders:
|
||||||||
|
Basic
|
$
|
0.35
|
|
$
|
(5.33
|
)
|
||
|
Diluted
|
$
|
(0.21
|
)
|
$
|
(5.33
|
)
|
||
|
Weighted-average shares outstanding:
|
||||||||
|
Basic
|
8,584
|
|
1,906
|
|
||||
|
Diluted
|
8,658
|
|
1,906
|
|
||||
The accompanying notes are an integral part of these financial statements.
F-4
|
CASTLE BIOSCIENCES, INC.
STATEMENTS OF CONVERTIBLE PREFERRED STOCK AND STOCKHOLDERS’ EQUITY (DEFICIT)
(in thousands, except shares)
|
||||||||||||||||||||||||||||||||||||||||
|
Convertible
Preferred
Stock Series C
|
Redeemable
Convertible
Preferred Stock
Series A, B, D, E-1,
E-2, E-2A, E-3 and F
|
Common Stock
|
Preferred Stock
|
Additional
Paid-in
Capital
|
Accumulated
Deficit
|
Total
Stockholders’
Equity (Deficit)
|
||||||||||||||||||||||||||||||||||
|
Shares
|
Amount
|
Shares
|
Amount
|
Shares
|
Amount
|
Shares
|
Amount
|
|||||||||||||||||||||||||||||||||
|
BALANCE, JANUARY 1, 2018
|
503,056
|
|
$
|
1,501
|
|
7,611,010
|
|
$
|
34,538
|
|
1,896,469
|
|
$
|
2
|
|
—
|
|
$
|
—
|
|
$
|
809
|
|
$
|
(51,122
|
)
|
$
|
(50,311
|
)
|
|||||||||||
|
Stock compensation expense
|
—
|
|
—
|
|
—
|
|
—
|
|
—
|
|
—
|
|
—
|
|
—
|
|
294
|
|
—
|
|
294
|
|
||||||||||||||||||
|
Exercise of common stock options
|
—
|
|
—
|
|
—
|
|
—
|
|
19,755
|
|
—
|
|
—
|
|
—
|
|
38
|
|
—
|
|
38
|
|
||||||||||||||||||
|
Issuance of Series F redeemable convertible preferred stock
|
—
|
|
—
|
|
1,809,564
|
|
9,990
|
|
—
|
|
—
|
|
—
|
|
—
|
|
—
|
|
—
|
|
—
|
|
||||||||||||||||||
|
Accretion of redeemable convertible preferred stock to redemption value:
|
||||||||||||||||||||||||||||||||||||||||
|
Series E-1
|
—
|
|
—
|
|
—
|
|
4
|
|
—
|
|
—
|
|
—
|
|
—
|
|
(4
|
)
|
—
|
|
(4
|
)
|
||||||||||||||||||
|
Series E-2A
|
—
|
|
—
|
|
—
|
|
1
|
|
—
|
|
—
|
|
—
|
|
—
|
|
(1
|
)
|
—
|
|
(1
|
)
|
||||||||||||||||||
|
Series E-3
|
—
|
|
—
|
|
—
|
|
12
|
|
—
|
|
—
|
|
—
|
|
—
|
|
(12
|
)
|
—
|
|
(12
|
)
|
||||||||||||||||||
|
Series F
|
—
|
|
—
|
|
—
|
|
203
|
|
—
|
|
—
|
|
—
|
|
—
|
|
(203
|
)
|
—
|
|
(203
|
)
|
||||||||||||||||||
|
Exercise of redeemable convertible preferred stock warrants:
|
||||||||||||||||||||||||||||||||||||||||
|
Series E-1
|
—
|
|
—
|
|
3,250
|
|
15
|
|
—
|
|
—
|
|
—
|
|
—
|
|
—
|
|
—
|
|
—
|
|
||||||||||||||||||
|
Series F
|
—
|
|
—
|
|
32,951
|
|
232
|
|
—
|
|
—
|
|
—
|
|
—
|
|
—
|
|
—
|
|
—
|
|
||||||||||||||||||
|
Net loss
|
—
|
|
—
|
|
—
|
|
—
|
|
—
|
|
—
|
|
—
|
|
—
|
|
—
|
|
(6,367
|
)
|
(6,367
|
)
|
||||||||||||||||||
|
BALANCE, DECEMBER 31, 2018
|
503,056
|
|
$
|
1,501
|
|
9,456,775
|
|
$
|
44,995
|
|
1,916,224
|
|
$
|
2
|
|
—
|
|
$
|
—
|
|
$
|
921
|
|
$
|
(57,489
|
)
|
$
|
(56,566
|
)
|
|||||||||||
|
Stock compensation expense
|
—
|
|
—
|
|
—
|
|
—
|
|
—
|
|
—
|
|
—
|
|
—
|
|
1,249
|
|
—
|
|
1,249
|
|
||||||||||||||||||
|
Exercise of common stock options
|
—
|
|
—
|
|
—
|
|
—
|
|
693,140
|
|
1
|
|
—
|
|
—
|
|
1,174
|
|
—
|
|
1,175
|
|
||||||||||||||||||
|
Exercise of common stock warrants
|
—
|
|
—
|
|
—
|
|
—
|
|
51,238
|
|
—
|
|
—
|
|
—
|
|
—
|
|
—
|
|
—
|
|
||||||||||||||||||
|
Accretion of redeemable convertible preferred stock to redemption value:
|
||||||||||||||||||||||||||||||||||||||||
|
Series E-1
|
—
|
|
—
|
|
—
|
|
2
|
|
—
|
|
—
|
|
—
|
|
—
|
|
(2
|
)
|
—
|
|
(2
|
)
|
||||||||||||||||||
|
Series E-3
|
—
|
|
—
|
|
—
|
|
7
|
|
—
|
|
—
|
|
—
|
|
—
|
|
(7
|
)
|
—
|
|
(7
|
)
|
||||||||||||||||||
|
Series F
|
—
|
|
—
|
|
—
|
|
121
|
|
—
|
|
—
|
|
—
|
|
—
|
|
(121
|
)
|
—
|
|
(121
|
)
|
||||||||||||||||||
|
Exercise of redeemable convertible preferred stock warrants:
|
||||||||||||||||||||||||||||||||||||||||
|
Series E-1
|
—
|
|
—
|
|
12,999
|
|
107
|
|
—
|
|
—
|
|
—
|
|
—
|
|
—
|
|
—
|
|
—
|
|
||||||||||||||||||
|
Series F
|
—
|
|
—
|
|
1,054
|
|
10
|
|
—
|
|
—
|
|
—
|
|
—
|
|
—
|
|
—
|
|
—
|
|
||||||||||||||||||
|
Recognition of beneficial conversion feature on convertible promissory notes
|
—
|
|
—
|
|
—
|
|
—
|
|
—
|
|
—
|
|
—
|
|
—
|
|
8,378
|
|
—
|
|
8,378
|
|
||||||||||||||||||
|
Extinguishment of beneficial conversion feature on convertible promissory notes
|
—
|
|
—
|
|
—
|
|
—
|
|
—
|
|
—
|
|
—
|
|
—
|
|
(15,265
|
)
|
—
|
|
(15,265
|
)
|
||||||||||||||||||
F-5
|
CASTLE BIOSCIENCES, INC.
STATEMENTS OF CONVERTIBLE PREFERRED STOCK AND STOCKHOLDERS’ EQUITY (DEFICIT) (Continued)
(in thousands, except shares)
|
||||||||||||||||||||||||||||||||||||||||
|
Convertible
Preferred
Stock Series C
|
Redeemable
Convertible
Preferred Stock
Series A, B, D, E-1,
E-2, E-2A, E-3 and F
|
Common Stock
|
Preferred Stock
|
Additional
Paid-in
Capital
|
Accumulated
Deficit
|
Total
Stockholders’
Equity (Deficit)
|
||||||||||||||||||||||||||||||||||
|
Shares
|
Amount
|
Shares
|
Amount
|
Shares
|
Amount
|
Shares
|
Amount
|
|||||||||||||||||||||||||||||||||
|
Initial public offering of common stock, net of underwriting discounts, commissions and offering costs
|
—
|
|
—
|
|
—
|
|
—
|
|
4,600,000
|
|
5
|
|
—
|
|
—
|
|
65,926
|
|
—
|
|
65,931
|
|
||||||||||||||||||
|
Conversion of convertible promissory notes
|
—
|
|
—
|
|
—
|
|
—
|
|
1,661,106
|
|
1
|
|
—
|
|
—
|
|
26,576
|
|
—
|
|
26,577
|
|
||||||||||||||||||
|
Conversion of convertible preferred stock
|
(503,056
|
)
|
(1,501
|
)
|
(9,470,828
|
)
|
(45,242
|
)
|
8,181,992
|
|
8
|
|
—
|
|
—
|
|
46,735
|
|
—
|
|
46,743
|
|
||||||||||||||||||
|
Reclassification of preferred stock warrant liability and net exercise of certain warrants in connection with initial public offering
|
—
|
|
—
|
|
—
|
|
—
|
|
27,207
|
|
—
|
|
—
|
|
—
|
|
1,744
|
|
—
|
|
1,744
|
|
||||||||||||||||||
|
Net income
|
—
|
|
—
|
|
—
|
|
—
|
|
—
|
|
—
|
|
—
|
|
—
|
|
—
|
|
5,277
|
|
5,277
|
|
||||||||||||||||||
|
BALANCE, DECEMBER 31, 2019
|
—
|
|
$
|
—
|
|
—
|
|
$
|
—
|
|
17,130,907
|
|
$
|
17
|
|
—
|
|
$
|
—
|
|
$
|
137,308
|
|
$
|
(52,212
|
)
|
$
|
85,113
|
|
|||||||||||
The accompanying notes are an integral part of these financial statements.
F-6
|
CASTLE BIOSCIENCES, INC.
STATEMENTS OF CASH FLOWS
(in thousands)
|
|||||||
|
|
Years Ended December 31,
|
||||||
|
|
2019
|
2018
|
|||||
|
OPERATING ACTIVITIES
|
|
|
|
||||
|
Net income (loss)
|
$
|
5,277
|
|
$
|
(6,367
|
)
|
|
|
Adjustments to reconcile net income (loss) to net cash provided by (used in) operating activities:
|
|||||||
|
Depreciation
|
354
|
|
287
|
|
|||
|
Stock compensation expense
|
1,249
|
|
294
|
|
|||
|
Amortization of intangibles
|
4
|
|
36
|
|
|||
|
Amortization of debt discounts and issuance costs
|
1,925
|
|
566
|
|
|||
|
Other non-cash interest
|
442
|
|
—
|
|
|||
|
Gain on extinguishment of debt
|
(5,213
|
)
|
—
|
|
|||
|
Change in fair value of preferred stock warrant liability
|
619
|
|
272
|
|
|||
|
Change in fair value of embedded derivative
|
237
|
|
—
|
|
|||
|
Change in fair value of convertible promissory note accounted for under the fair value option
|
2,077
|
|
—
|
|
|||
|
Other
|
—
|
|
(24
|
)
|
|||
|
Change in operating assets and liabilities:
|
|||||||
|
Accounts receivable
|
(896
|
)
|
(8,408
|
)
|
|||
|
Prepaid expenses and other current assets
|
(1,276
|
)
|
(160
|
)
|
|||
|
Inventory
|
(355
|
)
|
(578
|
)
|
|||
|
Other assets
|
(85
|
)
|
14
|
|
|||
|
Accounts payable
|
557
|
|
197
|
|
|||
|
Accrued compensation
|
1,208
|
|
1,347
|
|
|||
|
Other accrued liabilities
|
879
|
|
201
|
|
|||
|
Deferred rent liability
|
12
|
|
28
|
|
|||
|
Net cash provided by (used in) operating activities
|
7,015
|
|
(12,295
|
)
|
|||
|
INVESTING ACTIVITES
|
|||||||
|
Purchases of property and equipment
|
(937
|
)
|
(277
|
)
|
|||
|
Net cash used in investing activities
|
(937
|
)
|
(277
|
)
|
|||
|
FINANCING ACTIVITIES
|
|||||||
|
Proceeds from initial public offering of common stock, net of underwriting discounts, commissions and issuance costs
|
65,931
|
|
—
|
|
|||
|
Proceeds from issuance of preferred stock and preferred stock warrants (including exercised warrants)
|
49
|
|
10,383
|
|
|||
|
Proceeds from issuance of term debt and preferred stock warrants, net of issuance costs
|
—
|
|
4,418
|
|
|||
|
Proceeds from issuance of convertible promissory notes (including $4,756 from related parties), net of issuance costs
|
11,695
|
|
—
|
|
|||
|
Proceeds from issuance of convertible promissory note and common stock warrant, net of issuance costs
|
9,236
|
|
—
|
|
|||
|
Proceeds from issuance of term debt, net of issuance costs
|
1,776
|
|
—
|
|
|||
|
Proceeds from line of credit
|
—
|
|
1,000
|
|
|||
|
Repayments on line of credit
|
(1,791
|
)
|
—
|
|
|||
|
Proceeds from exercise of common stock options
|
1,174
|
|
38
|
|
|||
|
Proceeds from contributions to the employee stock purchase plan
|
218
|
|
—
|
|
|||
|
Net cash provided by financing activities
|
88,288
|
|
15,839
|
|
|||
|
NET CHANGE IN CASH AND CASH EQUIVALENTS
|
94,366
|
|
3,267
|
|
|||
|
Beginning of period
|
4,479
|
|
1,212
|
|
|||
|
End of period
|
$
|
98,845
|
|
$
|
4,479
|
|
|
F-7
|
CASTLE BIOSCIENCES, INC.
STATEMENTS OF CASH FLOWS (Continued)
(in thousands)
|
|||||||
|
|
Years Ended December 31,
|
||||||
|
|
2019
|
2018
|
|||||
|
SUPPLEMENTAL DISCLOSURE OF CASH PAID (REFUNDED) FOR:
|
|||||||
|
Interest
|
$
|
2,206
|
|
$
|
1,635
|
|
|
|
Income taxes
|
$
|
(150
|
)
|
$
|
160
|
|
|
|
DISCLOSURE OF NON-CASH INVESTING AND FINANCING
ACTIVITIES:
|
|||||||
|
Accrued capital expenditures
|
$
|
7
|
|
$
|
58
|
|
|
|
Initial public offering costs incurred but not paid
|
$
|
—
|
|
$
|
91
|
|
|
|
Issuance of common stock upon conversion of convertible preferred stock
|
$
|
46,743
|
|
$
|
—
|
|
|
|
Conversion of preferred stock warrants to common stock warrants
|
$
|
1,745
|
|
$
|
—
|
|
|
|
Issuance of common stock upon conversion of convertible promissory notes
|
$
|
26,578
|
|
$
|
—
|
|
|
|
Cashless exercise of common stock warrants
|
$
|
455
|
|
$
|
—
|
|
|
The accompanying notes are an integral part of these financial statements.
F-8
1. Organization and Description of Business
Castle Biosciences, Inc. (the ‘‘Company’’) was incorporated in the state of Delaware on September 12, 2007. The Company is a commercial-stage dermatological cancer company focused on providing physicians and their patients with personalized, clinically actionable genomic information to make more accurate treatment decisions. The Company is based in Friendswood, Texas (a suburb of Houston, Texas) and its laboratory operations are conducted at the Company’s facility located in Phoenix, Arizona.
On July 11, 2019, the Company effected a 1-for-1.219 reverse stock split of its common stock. The par value and the authorized number of shares of common stock were not affected by the reverse stock split. The reverse stock split resulted in an adjustment to the Series A, B, C, D, E-1, E-2, E-2A, E-3, and F preferred stock conversion prices to reflect a proportional decrease in the number of shares of common stock to be issued upon conversion. The accompanying financial statements and notes to the financial statements give retroactive effect to the reverse stock split for all periods presented.
On July 29, 2019, the Company completed the initial public offering of its common stock (the “IPO”). In the IPO, the Company issued and sold
4,600,000
shares of its common stock, including
600,000
shares sold pursuant to the full exercise of the underwriters’ option to purchase additional shares, at a price to the public of
$16.00
per share. The Company received approximately
$65.9 million
in net proceeds, after deducting underwriting discounts and commissions and other offering expenses payable by the Company. In connection with the IPO, on July 29, 2019 all convertible preferred stock and all convertible promissory notes converted into shares of common stock and all outstanding warrants to purchase shares of convertible preferred stock became exercisable for shares of common stock.
Liquidity and Capital Resources
The Company has incurred significant operating losses since its inception. As of
December 31, 2019
, the Company had an accumulated deficit of
$52.2 million
and cash and cash equivalents totaling
$98.8 million
. The Company also has substantial indebtedness, the terms of which require it to meet a three-month trailing revenue covenant tested quarterly (previously a six-month trailing revenue covenant and tested monthly, as described below). At the time of issuance of the Company’s financial statements as of
December 31, 2018
and
2017
and for each of the years then ended, the Company disclosed that substantial doubt was raised about the Company’s ability to continue as a going concern, because its projections indicated potential non-compliance with this covenant during the next 12 months. Subsequently, as discussed in Note 8, “Long-Term Debt,” on June 13, 2019, the Company entered into an amendment to its debt agreement, which among other changes, modified the revenue covenant from a trailing six-month calculation to a trailing three-month calculation with revised revenue targets tested monthly. In February and March 2020, the Company entered into amendments of the 2018 LSA with the Lenders that, among other things, changed the covenant from being tested monthly to quarterly testing and established revenue targets for the year ending December 31, 2020. Management now expects to be in compliance with the covenant during the next 12 months. The Company intends to fund planned operations for the next 12 months using its cash on hand, including net cash proceeds from the IPO, and collections from test report sales.
2. Summary of Significant Accounting Policies
Basis of Presentation
The Company’s financial statements have been prepared in conformity with accounting principles generally accepted in the United States of America (‘‘U.S. GAAP’’). The Company has no subsidiaries and all operations are conducted by the Company.
Use of Estimates
The preparation of financial statements in conformity with U.S. GAAP requires management to make estimates and assumptions that affect the reported amounts of assets and liabilities and disclosure of contingent assets and liabilities as of the date of the financial statements and the reported amounts of revenues and expenses during the reporting period. Significant items subject to such estimates include revenue recognition, the determination of fair value of the Company’s preferred stock warrants and convertible debt embedded derivatives, the valuation of stock options, assessing future tax exposure and the realization of deferred tax assets, the useful lives and recoverability of property and equipment, and contingent liabilities. The Company bases these estimates on historical and anticipated results, trends, and various other assumptions that the Company believes are reasonable under the circumstances, including assumptions as to future events. These estimates form the basis for making judgments about the carrying values of assets and liabilities and recorded revenues and expenses that are not readily apparent from other sources. Actual results could differ from those estimates and assumptions.
F-9
Operating Segments
Operating segments are identified as components of an enterprise about which separate discrete financial information is available for evaluation by the chief operating decision maker, or decision-making group, in making decisions on how to allocate resources and assess performance. The Company views its operations and manages its business as
one
operating segment. All revenues are attributable to U.S.-based operations and all assets are held in the United States.
Cash and Cash Equivalents including Concentrations of Credit Risk
Cash equivalents consist of short-term, highly liquid investments with original maturities of three months or less. Cash equivalents consist primarily of amounts invested in money market accounts. A majority of the Company’s cash and cash equivalents are deposited with a single financial institution. Deposits in this institution may exceed the amount of insurance provided on such deposits by the Federal Deposit Insurance Corporation for U.S. institutions. The Company has not experienced any losses on its deposits of cash and cash equivalents. Management believes that the Company is not exposed to significant credit risk due to the financial position of the depository institutions in which those deposits are held.
Revenue Recognition
Revenue is recognized in accordance with Financial Accounting Standards Board (‘‘FASB’’) Accounting Standards Codification (‘‘ASC’’) Topic 606,
Revenue from Contracts with Customers
(‘‘ASC 606’’). In accordance with ASC 606, the Company follows a five-step process to recognize revenues: (1) identify the contract with the customer, (2) identify the performance obligations, (3) determine the transaction price, (4) allocate the transaction price to the performance obligations and (5) recognize revenues when the performance obligations are satisfied.
All of the Company’s revenues from contracts with customers are associated with the provision of diagnostic and prognostic cancer testing services. Most of the Company’s revenues are attributable to DecisionDx-Melanoma for cutaneous melanoma. The Company also provides a test for uveal melanoma, DecisionDx-UM. Information on the disaggregation of revenues by the Company’s significant third-party payors is included under
Payor Concentration
below. The Company has determined that it has a contract with the patient when the treating clinician orders the test. The Company’s contracts generally contain a single performance obligation, which is the delivery of the test report, and the Company satisfies its performance obligation at a point in time upon the delivery of the test report to the treating physician, at which point the Company can bill for the report. The amount of revenue recognized reflects the amount of consideration to which the Company expects to be entitled (the ‘‘transaction price’’) and considers the effects of variable consideration, which is discussed further below.
Once the Company satisfies its performance obligations and bills for the service, the timing of the collection of payments may vary based on the payment practices of the third-party payor and the existence of contractually established reimbursement rates. Most of the payments for the Company’s services are made by third-party payors, including Medicare and commercial health insurance carriers. Certain contracts contain a contractual commitment of a reimbursement rate that differs from the Company’s list prices. However, absent a contractually committed reimbursement rate with a commercial carrier or governmental program, the Company’s diagnostic tests may or may not be covered by these entities’ existing reimbursement policies. In addition, patients do not enter into direct agreements with the Company that commit them to pay any portion of the cost of the tests in the event that their insurance provider declines to reimburse the Company. The Company may pursue, on a case-by-case basis, reimbursement from such patients in the form of co-payments and co-insurance, in accordance with the contractual obligations that the Company has with the insurance carrier or health plan. These situations may result in a delay in the collection of payments.
The Medicare claims that are covered by policy under a Local Coverage Determination (‘‘LCD’’) are generally paid at the established rate by the Company’s Medicare contractor within
30 days
from receipt. Medicare claims that were either submitted to Medicare prior to the LCD coverage commencement date or are not covered by the terms of the LCD but meet the definition of being medically reasonable and necessary pursuant to the controlling Section 1862(a)(1)(A) of the Social Security Act are generally appealed and may ultimately be paid at the first (termed ‘‘redetermination’’), second (termed ‘‘reconsideration’’) or third level of appeal (de novo hearing with an Administrative Law Judge (“ALJ”)). A successful appeal at any of these levels results in payment.
In the absence of LCD coverage or contractually established reimbursements rates, the Company has concluded that its contracts include variable consideration because the amounts paid by Medicare or commercial health insurance carriers may be paid at less than the Company’s standard rates or not paid at all, with such differences considered implicit price concessions. Variable consideration attributable to these price concessions is measured at the expected value using the ‘‘most likely amount’’ method under ASC 606. The amounts are determined by historical average collection rates by test type and payor category taking into consideration the range of possible outcomes, the predictive value of the Company’s past experiences, the time period of when uncertainties expect to be resolved and the amount of consideration that is susceptible to factors outside of the
F-10
Company’s influence, such as the judgment and actions of third parties. Such variable consideration is included in the transaction price only to the extent it is probable that a significant reversal in the amount of cumulative revenue recognized will not occur when the uncertainties with respect to the amount are resolved. Variable consideration may be constrained and excluded from the transaction price in situations where there is no contractually agreed upon reimbursement coverage or in the absence of a predictable pattern and history of collectability with a payor. Variable consideration for Medicare claims is deemed to be fully constrained when the payment of such claims is subject to approval by an ALJ at an appeal hearing, due to factors outside the Company’s influence (i.e., judgment or actions of third parties) and the uncertainty of the amount to be received is not expected to be resolved for a long period of time. Variable consideration is evaluated each reporting period and adjustments are recorded as increases or decreases in revenues. Included in revenues for the years ended
December 31, 2019
and
2018
were
$2,493,000
and
$343,000
, respectively, of revenue increases associated with changes in estimated variable consideration related to performance obligations satisfied in previous periods. These amounts include (i) adjustments for actual collections versus estimated amounts and (ii) cash collections and the related recognition of revenue in current period for tests delivered in prior periods due to the release of the constraint on variable consideration.
Because the Company’s contracts with customers have an expected duration of one year or less, the Company has elected the practical expedient in ASC 606 to not disclose information about its remaining performance obligations. Any incremental costs to obtain contracts are recorded as selling, general and administrative expense as incurred due to the short duration of the Company’s contracts. Contract balances consisted solely of accounts receivable (both current and noncurrent) as of
December 31, 2019
and
2018
.
DecisionDx-Melanoma Claims Consolidation
In June 2017, the Company submitted to the Office of Medicare Hearings and Appeals (‘‘OMHA’’) a formal request to participate in a program that OMHA developed with the intent of providing appellants a means to have large volumes of claim disputes adjudicated at an accelerated rate. The program consolidates outstanding claims at the ALJ level and uses a statistical-sampling approach where five ALJ’s will determine reimbursement results for a sample of claims which are then extrapolated to the universe of claims. The consolidation includes
2,698
DecisionDx-Melanoma claims dating from 2013 through spring 2017. The judges who will review the sample sets have been identified and the hearings were held in April 2019 with a supplemental hearing in May 2019. No formal ruling has been issued to date. In accordance with ASC 606, the Company has not recognized (fully constrained the variable consideration) any revenues attributable to these claims in its financial statements pending the outcome of this matter. The Company expects to recognize any revenue adjudicated by the ALJ in the periodic reporting period in which the Company is notified of the ALJ hearing outcome and it is determined that such decision will not be appealed.
Payor Concentration
The Company relies upon reimbursements from third-party government payors (primarily Medicare) and private-payor insurance companies to collect accounts receivable related to sales of its diagnostic tests.
The Company’s significant third-party payors and their related revenues as a percentage of total revenues and accounts receivable balances are as follows:
|
|
Percentage of Revenues
|
Percentage of
Accounts Receivable
(current)
|
Percentage of
Accounts Receivable
(non-current)
|
||||||||||||||
|
|
Year Ended December 31,
|
As of December 31,
|
As of December 31,
|
||||||||||||||
|
|
2019
|
2018
|
2019
|
2018
|
2019
|
2018
|
|||||||||||
|
Medicare
|
49
|
%
|
36
|
%
|
7
|
%
|
54
|
%
|
—
|
%
|
—
|
%
|
|||||
|
Medicare Advantage plans
|
29
|
%
|
17
|
%
|
41
|
%
|
9
|
%
|
18
|
%
|
18
|
%
|
|||||
|
United Healthcare
|
6
|
%
|
12
|
%
|
9
|
%
|
7
|
%
|
—
|
%
|
15
|
%
|
|||||
|
BlueCross BlueShield plans
|
6
|
%
|
18
|
%
|
25
|
%
|
18
|
%
|
46
|
%
|
41
|
%
|
|||||
Accounts Receivable and Allowance for Doubtful Accounts
The Company classifies accounts receivable balances that are expected to be paid more than one year from the balance sheet date as non-current assets. The estimated timing of payment utilized as a basis for classification as non-current is determined by analyses of historical payor-specific payment experience, adjusted for known factors that are expected to change the timing of future payments.
F-11
The Company accrues an allowance for doubtful accounts against its accounts receivable when it is probable that an account is not collectible, based on write off history, credit risk of specific accounts, aging analysis and other information available on specific accounts. The Company generally does not perform evaluations of customers’ financial condition and generally does not require collateral. Accounts receivable are written off when all efforts to collect the balance have been exhausted. Historically, the Company’s bad debt expense has not been significant. The allowance for doubtful accounts was
zero
as of
December 31, 2019
and
2018
. Adjustments for implicit price concessions attributable to variable consideration, as discussed above, are incorporated into the measurement of the accounts receivable balances and are not part of the allowance for doubtful accounts.
Inventory
The Company carries an inventory of test supplies in the Phoenix, Arizona laboratory. The inventory is carried at the lower of weighted average cost and net realizable value and expensed through cost of sales as the supplies are used.
Property and Equipment
Property and equipment are stated at cost less accumulated depreciation and amortization. Depreciation is computed using the straight-line method over the estimated useful lives of the assets, generally between
five
and
ten years
. Leasehold improvements are amortized using the straight-line method over the shorter of the estimated useful life of the asset or the term of the lease. The Company’s leasehold improvements primarily relate to its office and laboratory in Phoenix, Arizona, and are generally being amortized through the end of the lease term in July 2027. Maintenance and repairs are charged to expense as incurred, and material improvements are capitalized. When assets are retired or otherwise disposed of, the cost and accumulated depreciation are removed from the balance sheet and any resulting gain or loss is reflected in the statements of operations and comprehensive loss in the period realized.
Patent Rights Licenses
The Company capitalizes the purchase of material licenses that grant interest in and to certain patent rights owned primarily by research and education institutions. These costs are amortized using the straight-line method over the shorter of the period of expected commercial benefit or the life of the underlying patent. Amortization of patent license costs is charged to research and development expense.
Long-Lived Assets
The Company reviews long-lived assets for impairment whenever events or changes in circumstances indicate that the carrying amount of the assets may not be recoverable. An impairment loss is recognized when the total of estimated future undiscounted cash flows, expected to result from the use of the asset and its eventual disposition, are less than the carrying amount. Impairment, if any, would be calculated based on the excess of the carrying amount of the long-lived asset over the long-lived asset’s fair value. There were
no
impairment charges recognized for the years ended December 31, 2019 and 2018.
Fair Value of Financial Instruments
The carrying amount of the Company’s long-term debt approximates fair value due to its variable market interest rate and management’s opinion that current rates and terms that would be available to the Company with the same maturity and security structure would be essentially equivalent to that of the Company’s long-term debt. This estimated fair value is a ‘‘Level 3’’ fair value measurement, as defined in Note 10.
Deferred Rent
The Company has negotiated certain landlord/tenant incentives, rent holidays and escalations in the base price of rent payments under operating leases. The Company recognizes these incentives, rent holidays and rent escalations on a straight-line basis over the lease term. Deferred rent balances are classified as current or non-current in the accompanying balance sheets based upon the period when reversal of the liability is expected to occur.
Cost of Sales
Cost of sales is expensed as incurred and includes direct labor costs, equipment, supplies, materials and infrastructure expenses associated with testing tissue samples, third-party lab processing and service costs, third-party collection costs, and shipping charges to transport samples.
Research and Development
Research and development costs are charged to operations as incurred. Advance payments for goods and services that will be used in future research and development activities are expensed when the activity has been performed or when the goods have
F-12
been received rather than when the payment is made. Upfront and milestone payments due to third parties that perform research and development services on behalf of the Company will be expensed as services are rendered or when the milestone is achieved.
Research and development costs include, but are not limited to, payroll and personnel-related expenses, stock-based compensation expense, materials, laboratory supplies, and consulting costs.
Selling, General and Administrative Expenses
Selling, general and administrative (“SG&A”) expenses are attributable to sales, marketing, executive, finance and accounting, legal and human resources functions. These expenses consist of personnel costs (including salaries, employee benefit costs, bonuses and equity-based compensation expenses), customer services expenses, direct marketing expenses, educational and promotional expenses, market research, audit and legal expenses, and consulting. The Company expenses all SG&A costs as incurred.
Accrued Compensation
The Company accrues for liabilities under discretionary employee and executive bonus plans. These estimated compensation liabilities are based on progress against corporate objectives approved by the Board of Directors, compensation levels of eligible individuals, and target bonus percentage levels. The Board of Directors reviews and evaluates the performance against these objectives and ultimately determines what discretionary payments are made. The Company also accrues for liabilities under employee sales incentive bonus plans with accruals based on performance achieved to date compared to established targets. As of
December 31, 2019
and
2018
, the Company accrued approximately
$4,785,000
and
$3,197,000
, respectively, for liabilities associated with these bonus plans. These amounts are classified as current or noncurrent accrued liabilities in the balance sheets based on the expected timing of payment.
Retirement Plan
The Company has an Internal Revenue Code (“IRC”) Section 401(k) profit sharing plan (the “Plan”) for eligible employees. The Plan is funded by employee contributions and provides for discretionary contributions in the form of matching and/or profit-sharing contributions. For the years ended December 31, 2019 and 2018, the Company provided a discretionary matching contribution of
$434,000
and
$338,000
, respectively.
Income Taxes
The Company recognizes deferred tax assets and liabilities for the future tax consequences attributable to differences between the financial statement carrying amounts of existing assets and liabilities and their respective tax bases. Deferred tax assets and liabilities are measured using statutory tax rates expected to apply to taxable income in the years in which those temporary differences are expected to be recovered or settled. The effect on deferred tax assets and liabilities of a change in tax rates is recognized in the period that includes the statutory enactment date. Valuation allowances are established to reduce deferred tax assets when it is more likely than not that some portion or all of the deferred tax assets will not be realized.
Tax benefits are recognized only for tax positions that are more likely than not to be sustained upon examination by tax authorities. The amount recognized is measured as the largest amount of benefit that is greater than 50% likely to be realized upon settlement. A liability for unrecognized tax benefits is recorded for any tax benefits claimed in the Company’s tax returns that do not meet these recognition and measurement standards.
The Company’s policy for recording interest and penalties associated with uncertain tax positions is to record such items as a component of tax expense. No material amounts of tax-related interest or penalties were recorded during the years ended December 31, 2019 and 2018.
Stock-Based Compensation
Stock-based compensation expense for equity instruments issued to employees is measured based on the grant-date fair value of the awards. The fair value of employee stock options and offerings under the 2019 Employee Stock Purchase Plan (the “ESPP”) are estimated on the date of grant using the Black-Scholes option-pricing valuation model. The Company recognizes compensation costs on a straight-line basis for all employee stock-based compensation awards over the requisite service period of the awards. For options, the requisite service period is generally the awards’ vesting period (typically
four years
). For the ESPP, the requisite service period is generally the period of time from the offering date to the purchase date. Forfeitures are accounted for as they occur.
F-13
Deferred Offering Costs
Deferred offering costs consist primarily of legal and accounting fees, which are direct and incremental costs related to the IPO. Deferred offering costs of
$2,517,000
, along with
$5,152,000
in underwriting discounts and commissions,
were offset against the gross IPO proceeds of
$73,600,000
for the year ended December 31, 2019. As of
December 31, 2018
, the Company had incurred
$91,000
in deferred offering costs, which are reported as other assets - long-term on the balance sheet.
Comprehensive Income (Loss)
Comprehensive income (loss) is defined as a change in equity during a period from transactions and other events and circumstances from non-owner sources. The Company’s comprehensive income (loss) was the same as its reported net income (loss) for all periods presented.
Accounting Pronouncements Yet to be Adopted
In February 2016, the FASB issued ASU No. 2016-02,
Leases (Topic 842)
(“ASU 2016-02”), which supersedes FASB ASC Topic 840,
Leases (Topic 840),
and provides principles for the recognition, measurement, presentation and disclosure of leases for both lessees and lessors. The new standard requires lessees to apply a dual approach, classifying leases as either finance or operating leases based on the principle of whether or not the lease is effectively a financed purchase by the lessee. This classification will determine whether lease expense is recognized based on an effective interest method for finance leases or on a straight-line basis over the term of the lease for operating leases. A lessee is also required to record a right-of-use asset and a lease liability for all leases with a term of greater than 12 months regardless of classification. Leases with a term of 12 months or less will be accounted for similar to existing guidance for operating leases. For companies that are not emerging growth companies (‘‘EGCs’’), ASU 2016-02 is effective for fiscal years beginning after December 15, 2018. For EGCs, the ASU was to be effective for fiscal years beginning after December 15, 2019. However, in November 2019, the FASB issued ASU 2019-10,
Financial Instruments—Credit Losses (Topic 326), Derivatives and Hedging (Topic 815) and Leases (Topic 842): Effective Dates
(“ASU 2019-10”), which included a one-year deferral of the effective date of ASU 2016-02 for certain entities. As a result, the ASU is now effective for EGCs for fiscal years beginning after December 15, 2020, and interim periods within fiscal years beginning after December 15, 2021. The Company expects to adopt the new standard in the fourth quarter of 2021 using the modified retrospective method, under which the Company will apply Topic 842 to existing and new leases as of January 1, 2021, but prior periods will not be restated and will continue to be reported under Topic 840 guidance in effect during those periods. The Company anticipates that the adoption will not have a material impact on its statements of operations and comprehensive income (loss) or its statements of cash flows but expects to recognize right-of-use assets and liabilities for lease obligations associated with its operating leases.
In June 2016, the FASB issued ASU No. 2016-13,
Financial Instruments—Credit Losses
(“ASU 2016-13”), which requires the measurement of expected credit losses for financial instruments carried at amortized cost, such as accounts receivable, held at the reporting date based on historical experience, current conditions and reasonable forecasts. The main objective of this ASU is to provide financial statement users with more decision-useful information about the expected credit losses on financial instruments and other commitments to extend credit held by a reporting entity at each reporting date. In November 2018, the FASB issued ASU No. 2018-19,
Codification Improvements to Topic 326, Financing Instruments—Credit Losses
, which included an amendment of the effective date for nonpublic entities. For non-EGCs, ASU 2016-13 is effective for fiscal years beginning after December 15, 2019. For EGCs, the standard was to be effective for fiscal years beginning after December 15, 2021. However, in November 2019, the FASB issued ASU 2019-10, which included a one-year deferral of the effective date of ASU 2016-13 for certain entities. As a result, ASU is now effective for EGCs for fiscal years beginning after December 15, 2022, including interim periods within those fiscal years. The Company does not currently believe the adoption of this standard will have a significant impact on its financial statements, given its history of minimal bad debt expense relating to trade accounts receivable.
In December 2019, the FASB issued ASU No. 2019-12,
Income Taxes (Topic 740): Simplifying the Accounting for Income Taxes
(“ASU 2019-12”), which eliminates certain exceptions to the general principles in Topic 740 and simplifies other areas of the existing guidance. For non-EGCs, ASU 2019-12 is effective for fiscal years beginning after December 15, 2020, and interim periods within those fiscal years. For EGCs, the standard is effective for fiscal years beginning after December 15, 2021, and interim periods within fiscal years beginning after December 15, 2022. Early adoption is permitted. The Company is currently evaluating the impact of ASU 2019-12 on its financial statements.
3. Earnings (Loss) Per Share
Basic earnings (loss) per share is computed by dividing net income (loss) attributable to common stockholders for the period by the weighted-average number of common shares outstanding during the period. The weighted-average number of common
F-14
shares outstanding includes shares associated with the July 2019 Warrant (as defined in Note 7), which are deemed to have been issued for purposes of calculating basic and diluted earnings (loss) per share, due to the nominal exercise price. On July 29, 2019, the Company completed the IPO, in which it issued and sold
4,600,000
shares of common stock. Also on that date, all of the Company’s outstanding convertible preferred stock and convertible promissory notes automatically converted into
8,181,992
and
1,661,106
shares, respectively, of common stock and certain outstanding warrants to purchase Series F convertible redeemable preferred stock were net exercised for an aggregate of
27,207
shares of common stock. These shares are included in the Company’s weighted-average number of common shares outstanding starting on that date.
Diluted earnings (loss) per share reflects the additional dilution from potential issuances of common stock, such as stock issuable pursuant to the exercise of stock options, as well as from the possible conversion of the Company’s convertible preferred stock, convertible promissory notes and exercise of outstanding warrants. The treasury stock and if-converted methods are used to calculate the potential dilutive effect of these common stock equivalents. However, potentially dilutive shares are excluded from the computation of diluted loss per share when their effect is antidilutive.
The following table shows the computation of basic and diluted earnings (loss) per share for the
years ended December 31, 2019
and
2018
(in thousands, except per share data):
|
|
Years Ended December 31,
|
|||||||
|
|
2019
|
2018
|
||||||
|
|
||||||||
|
Numerator:
|
||||||||
|
Net income (loss) attributable to common stockholders
|
$
|
2,991
|
|
$
|
(10,163
|
)
|
||
|
Assumed conversion of convertible promissory notes
(1)
:
|
|
|
|
|
||||
|
Subtract: Extinguishment gain
|
(5,213
|
)
|
—
|
|
||||
|
Add: Interest expense and change in fair value of embedded derivative
|
420
|
|
—
|
|
||||
|
Numerator for diluted loss per share
|
$
|
(1,802
|
)
|
$
|
(10,163
|
)
|
||
|
Denominator:
|
|
|
|
|
||||
|
Weighted-average common shares outstanding, basic
|
8,584
|
|
1,906
|
|
||||
|
Assumed conversion of convertible promissory notes
(1)
|
74
|
|
—
|
|
||||
|
Weighted-average common shares outstanding, diluted
|
8,658
|
|
1,906
|
|
||||
|
Earnings (loss) per share attributable to common stockholders:
|
||||||||
|
Basic
|
$
|
0.35
|
|
$
|
(5.33
|
)
|
||
|
Diluted
|
$
|
(0.21
|
)
|
$
|
(5.33
|
)
|
||
|
(1)
|
For the year ended December 31, 2019
, reflects the assumed conversion of the Q1 2019 Notes (as defined in Note 7) into shares of common stock beginning July 1, 2019, in accordance with the requirements in ASC 260,
Earnings per Share
, for contingently issuable shares due to the contingency not being met until the third quarter of 2019.
The July 2019 Note (as defined in Note 7), was excluded from the computation of diluted earnings (loss) per share prior to its conversion on July 29, 2019 in connection with the IPO, as disclosed below.
|
For the year ended December 31, 2019, the computation of diluted loss per share excludes the assumed conversions of the convertible preferred stock, assumed conversion of the July 2019 Note (in each case, for the time prior to their actual conversions), assumed exercise of all stock options, assumed issuance of shares under the ESPP, and the assumed exercise of all common stock warrants because to include them would be antidilutive. Due to the Company reporting a net loss attributable to common stockholders for the year ended December 31, 2018, all potentially dilutive securities are antidilutive and are excluded from the computations of diluted loss per share for those periods.
F-15
The table below provides the weighted-average number of potential common shares associated with outstanding securities not included in the Company’s calculation of diluted earnings (loss) per share for the
years ended December 31, 2019
and
2018
because to do so would be antidilutive (in thousands):
|
Years Ended December 31,
|
||||||
|
2019
|
2018
|
|||||
|
Convertible preferred stock
|
4,679
|
|
7,845
|
|
||
|
Convertible promissory note
(1)
|
33
|
|
—
|
|
||
|
Stock options
|
1,820
|
|
1,429
|
|
||
|
Common stock warrants
|
41
|
|
—
|
|
||
|
Preferred stock warrants
|
80
|
|
132
|
|
||
|
Employee stock purchase plan
|
24
|
|
—
|
|
||
|
Total
|
6,677
|
|
9,406
|
|
||
|
(1)
|
Associated with the July 2019 Note.
|
4. Property and Equipment, Net
Property and equipment, net consisted of the following (in thousands):
|
As of December 31,
|
|||||||
|
|
2019
|
2018
|
|||||
|
Lab equipment
|
$
|
1,563
|
|
$
|
1,153
|
|
|
|
Computer equipment
|
887
|
|
629
|
|
|||
|
Leasehold improvements
|
635
|
|
554
|
|
|||
|
Furniture and fixtures
|
178
|
|
102
|
|
|||
|
Total
|
3,263
|
|
2,438
|
|
|||
|
Less accumulated depreciation
|
(1,203
|
)
|
(909
|
)
|
|||
|
Property and equipment, net
|
$
|
2,060
|
|
$
|
1,529
|
|
|
Depreciation expense was recorded in the statements of operations and comprehensive income (loss) as follows (in thousands):
|
Years Ended December 31,
|
|||||||
|
|
2019
|
2018
|
|||||
|
Cost of sales
|
$
|
277
|
|
$
|
233
|
|
|
|
Research and development
|
7
|
|
4
|
|
|||
|
Selling, general and administrative
|
70
|
|
50
|
|
|||
|
Total
|
$
|
354
|
|
$
|
287
|
|
|
5. Intangible Assets, Net
Intangible assets consist of capitalized license costs as follows (in thousands):
|
As of December 31,
|
|||||||||||
|
|
2019
|
2018
|
|||||||||
|
|
Value
|
Weighted-Average Remaining Life (Years)
|
Value
|
Weighted-Average Remaining Life (Years)
|
|||||||
|
Licenses
|
$
|
275
|
|
0
|
$
|
275
|
|
0
|
|||
|
Accumulated amortization
|
(275
|
)
|
(271
|
)
|
|||||||
|
Intangible assets, net
|
$
|
—
|
|
$
|
4
|
|
|||||
Amortization expense was
$4,000
and
$36,000
, for the
years ended December 31, 2019
and
2018
, respectively.
F-16
6. Other Accrued Liabilities
Other accrued liabilities consisted of the following
(in thousands)
:
|
As of December 31,
|
|||||||
|
|
2019
|
2018
|
|||||
|
Accrued state income taxes
|
$
|
79
|
|
$
|
9
|
|
|
|
Accrued interest
|
184
|
|
185
|
|
|||
|
Accrued royalties
|
169
|
|
240
|
|
|||
|
Accrued service fees
|
1,162
|
|
281
|
|
|||
|
Employee stock purchase plan contributions
|
218
|
|
—
|
|
|||
|
Total
|
$
|
1,812
|
|
$
|
715
|
|
|
7. Convertible Promissory Notes
Q1 2019 Notes
In January and February 2019, the Company issued
$11,770,000
principal amount of unsecured convertible promissory notes (the “Q1 2019 Notes”), of which
$4,756,000
was with related parties (executive officers, members of the Company’s Board of Directors or entities affiliated with them). The Q1 2019 Notes bore simple interest at a rate of
8%
per annum. Originally, the Q1 2019 Notes had a maturity date of January 31, 2020, but on July 3, 2019, the Company entered into an amendment with the holders of the Q1 2019 Notes to extend the maturity to June 30, 2020. Such amendment was treated as a modification of the existing debt and therefore
no
extinguishment gain or loss was recognized in connection with the amendment.
Prior to the actual conversion of the Q1 2019 Notes on July 29, 2019 (discussed below), on or before the maturity date, the entire outstanding principal amount of and accrued interest on the Q1 2019 Notes (the “Conversion Amount”), was automatically convertible into shares of the Company’s equity securities issued and sold in a single or series of related transactions, with the principal purpose of raising capital, in which the Company sold shares of such equity securities for aggregate gross proceeds of at least
$10.0 million
(the “Next Equity Financing”). The number of shares of such equity securities issuable in the Next Equity Financing was equal to the quotient of the Conversion Amount as of the closing date of the Next Equity Financing divided by a per share price that is equal to
80%
of the lowest per share purchase price of the equity securities sold in the Next Equity Financing. If the Q1 2019 Notes had not been repaid or converted prior to the maturity date, then, at the request of the holders of a majority of the then-outstanding principal amount of and accrued interest on the Q1 2019 Notes, the Conversion Amount as of the maturity date would have converted into shares of the Company’s Series F redeemable convertible preferred stock, or any senior equity security issued by the Company after the first issuance of the Q1 2019 Notes, in each case at a conversion price equal to the price at which such security was last sold (which was
$5.8208
for shares of the Company’s Series F redeemable convertible preferred stock). If a change of control of the Company would have occurred while the Q1 2019 Notes were outstanding, the Company would have been required to repurchase each note from each holder at a repurchase price equal to
two
times the principal amount of such Note, plus any accrued and unpaid interest on such note as of the date of such repurchase.
The Company determined that the Q1 2019 Notes contained embedded derivatives that required bifurcation and separate accounting under ASC 815-15,
Embedded Derivatives
. The Company determined that two such features in the Q1 2019 Notes were not considered clearly and closely related to the host debt instrument and therefore required separate accounting: (i) the automatic conversion feature in connection with the Next Equity Financing and (ii) the acceleration upon a change of control feature. Under ASC 815-15, these features are bundled together and accounted for as a single, compound embedded derivative. The Company determined the fair value of the embedded derivative liability at the issuance date, creating a discount to the carrying value of the Q1 2019 Notes, which was being amortized over the life of the debt using the effective interest method. The embedded derivative was recorded at fair value each reporting period, with changes in fair value recorded as “other expense, net” in the statements of operations and comprehensive income (loss). No hedge accounting treatment was applied. For details regarding the fair value measurement of the embedded derivative, see Note 10.
The Company also assessed the optional conversion feature into Series F redeemable convertible preferred stock at maturity and determined that this feature did not meet the definition of a derivative instrument because the settlement terms involved the gross delivery of the underlying shares, which were not readily convertible to cash. The Company then assessed whether this feature caused the Q1 2019 Notes to be subject to ASC 470-20,
Debt with Conversion and Other Options
(“ASC 470-20”)
,
and determined that the beneficial conversion feature guidance was applicable to the Q1 2019 Notes. At issuance, the Company concluded that the Q1 2019 Notes had a beneficial conversion feature because the fair value of the Series F preferred stock
F-17
exceeded the conversion price of
$5.8208
per share that would have been applicable under the optional conversion at maturity, assuming no other equity securities senior to Series F preferred stock were sold. Under ASC 470-20, this beneficial conversion feature was measured at intrinsic value as of the issuance date of the Q1 2019 Notes and was recognized as additional paid-in capital, creating a discount to the carrying value of the Q1 2019 Notes that was being amortized over the life of the debt using the effective interest method.
The closing of the IPO on July 29, 2019 was considered to be the Next Equity Financing under the terms of the Q1 2019 Notes. Accordingly, on July 29, 2019, the Conversion Amount of the Q1 2019 Notes as of such date converted into
954,074
shares of common stock based on a price of
$12.80
per share, or
80%
of the IPO price of
$16.00
per share. The conversion of the Q1 2019 Notes was considered an extinguishment for accounting purposes. The Company recognized an extinguishment gain of
$5,213,000
in connection with the conversion with extinguishment consideration measured at
$15,265,000
, which is calculated as the number of shares issued upon conversion multiplied by the IPO price of
$16.00
per share. All of this consideration was allocated to additional paid-in capital to redeem the beneficial conversion feature.
The following table summarizes the aggregate values recorded for the Q1 2019 Notes as of their original issuance dates. As noted above, the Q1 2019 Notes were converted into shares of common stock in connection with the closing of the IPO on July 29, 2019
(in thousands)
.
|
At Original Issuance
(1)
|
||||
|
Liability component:
|
||||
|
Principal (including $4,756 with related parties)
|
$
|
11,770
|
|
|
|
Unamortized issuance costs
|
(75
|
)
|
||
|
Unamortized discount from beneficial conversion feature
|
(8,378
|
)
|
||
|
Unamortized discount from embedded derivative
|
(2,816
|
)
|
||
|
Net carrying amount of the liability component
|
$
|
501
|
|
|
|
Embedded derivative liability
|
$
|
2,816
|
|
|
|
Equity Component:
|
||||
|
Carrying value of beneficial conversion feature recorded in additional paid-in capital
|
$
|
8,378
|
|
|
(1) The Q1 2019 Notes were issued on January 31, 2019, February 12, 2019 and February 27, 2019.
Amortization of discounts and issuance costs on the Q1 2019 Notes totaled
$1,216,000
for the year ended December 31, 2019, and were included in interest expense.
The amounts recognized in net income for the year ended December 31, 2019 for the embedded derivative liability are as follows
(in thousands)
:
|
Gain (Loss) Recognized in Net Income
|
|||||
|
Statement of Operations and Comprehensive Income (Loss) Location
|
Year Ended
December 31, 2019
|
||||
|
Derivatives Not Classified as Hedging Instruments
|
|||||
|
Embedded derivative in convertible promissory notes
|
Other expense, net
|
$
|
(237
|
)
|
|
July 2019 Note
On July 12, 2019, the Company issued an unsecured convertible promissory note having a principal amount of
$10,000,000
(the ‘‘July 2019 Note’’) to an investor. The July 2019 Note bore simple interest at a rate of
8%
per annum and had an original maturity date of June 30, 2020. The IPO triggered an automatic conversion feature of the July 2019 Note under which the outstanding principal amount plus accrued interest converted into
707,032
shares of common stock in connection with the closing of the IPO on July 29, 2019, based on a price derived from a valuation calculated pursuant to the terms of the July 2019 Note. In connection with the July 2019 Note issuance, the Company issued the purchaser of the July 2019 Note a warrant to
F-18
purchase up to
209,243
shares of common stock at an exercise price of approximately
$0.001
per share (the “July 2019 Warrant”), as discussed further in Note 13.
The Company elected to account for the July 2019 Note under the fair value option in accordance with ASC 825,
Financial Instruments.
Absent the election of the fair value option, there were several embedded features of the July 2019 Note which would have required separate accounting as an embedded derivative. Given the complexity of these features and the short time period the July 2019 Note was actually outstanding, the Company elected the fair value option to simplify the accounting for the July 2019 Note. Under the fair value option, changes in fair value are recorded in the statements of operations and comprehensive income (loss) each period as “Other expense, net.”
The Company received
$10,000,000
from the purchaser and incurred
$764,000
in issuance costs, resulting in net proceeds of
$9,236,000
. The Company subsequently adjusted the fair value of the July 2019 Note to its conversion date fair value of
$11,313,000
, which was calculated as the number of common shares into which the July 2019 Note became actually convertible in connection with the IPO multiplied by the IPO price of
$16.00
per share.
No
portion of the change in fair value was deemed to be associated with changes in instrument-specific credit risk, due to the short period of time the July 2019 Note was outstanding. Interest expense and the issuance costs associated with the July 2019 Note were included as part of the change in fair value recorded in “Other expense, net.” Because the initial fair value of the July 2019 Note exceeded the proceeds received, the Company did not allocate any portion of the proceeds to the July 2019 Warrant.
8. Long-Term Debt
The Company’s long-term debt consists of term debt and a revolving line of credit and are presented in the table below (in thousands):
|
As of December 31,
|
|||||||
|
|
2019
|
2018
|
|||||
|
Term debt
|
$
|
26,688
|
|
$
|
21,350
|
|
|
|
Revolving line of credit
|
—
|
|
5,000
|
|
|||
|
Total principal amount
|
26,688
|
|
26,350
|
|
|||
|
Unamortized discount and issuance costs
|
(1,566
|
)
|
(1,850
|
)
|
|||
|
Total long-term debt
|
25,122
|
|
24,500
|
|
|||
|
Less: Current portion of long-term debt
|
(5,833
|
)
|
—
|
|
|||
|
Total long-term debt, less current portion
|
$
|
19,289
|
|
$
|
24,500
|
|
|
Future maturities of principal amounts on long-term debt as of December 31, 2019 are as follows (in thousands):
|
Years Ending December 31,
|
||||
|
2020
|
$
|
5,833
|
|
|
|
2021
|
10,000
|
|
||
|
2022
|
10,855
|
|
||
|
2023
|
—
|
|
||
|
2024
|
—
|
|
||
|
Total
|
$
|
26,688
|
|
|
F-19
Term Debt
On November 30, 2018 (the ‘‘Closing Date’’), the Company entered into a new Loan and Security Agreement (the ‘‘2018 LSA’’) with Oxford Finance LLC (‘‘Oxford’’), as collateral agent, and Oxford and Silicon Valley Bank (‘‘SVB’’) as equal syndicated lenders (collectively, the ‘‘Lenders’’). The 2018 LSA replaced the Company’s previous lending arrangement and provided for a
$20.0 million
secured term loan credit facility (the ‘‘2018 Term Loan’’) and a credit line of up to
$5.0 million
(discussed in the ‘‘Revolving Line of Credit’’ section below), prior to amendment of the 2018 LSA on June 13, 2019, as discussed below. The Company’s obligations under the 2018 LSA are secured by substantially all of its assets, excluding intellectual property and subject to certain other exceptions and limitations. The Company has the right to prepay the 2018 Term Loan in whole or in part at any time, subject to a prepayment fee of
1.50%
prior to November 30, 2020 and
0.75%
thereafter. Upon prepayment, the Company is also obligated to pay a non-refundable early termination fee of
$497,000
. Amounts prepaid or repaid under the 2018 Term Loan may not be reborrowed. Initially, the 2018 LSA contained a financial covenant that required the Company to achieve a monthly trailing six-month revenue target each month throughout the term of the agreement, but the covenant was amended on June 13, 2019 and changed to a monthly trailing three-month target, as discussed further below. As of
December 31, 2019
and December 31, 2018, the Company was in compliance with this covenant.
On June 13, 2019, the Company entered into an amendment to the 2018 LSA (the “First Amendment”), which, among other things, (i) eliminated the
$5.0 million
revolving line and increased the 2018 Term Loan by
$5.0 million
and (ii) amended the financial covenant to require the Company to achieve a monthly trailing three-month revenue target each month throughout the term of the agreement. The revenue targets were amended primarily to align with a more current reflection of the Company’s revenue projections after taking into account the impact of ASC 606 on the Company’s revenue recognition following the Company’s early adoption of ASC 606. The First Amendment was accounted for as a modification of the 2018 LSA, and therefore
no
extinguishment gain or loss was recognized.
For each month through December 31, 2019, the trailing three-month revenue requirements were calculated as a percentage of the Company’s previously approved applicable monthly revenue projections. In February 2020, the Company entered into an amendment of the 2018 LSA (the “Second Amendment”) that, among other things, changed the covenant from being tested monthly to quarterly testing. In March 2020, the Company entered into an amendment of the 2018 LSA (the “Third Amendment”) with the Lenders to establish revenue targets for the year ending December 31, 2020. For quarterly periods ending after December 31, 2020, the trailing three-month revenue requirements will be determined by the Lenders upon receipt and review of the Company’s quarterly financial projections for the year, subject to certain specified criteria regarding minimum requirements. Revenues, if any, that the Company recognizes as a result of an ALJ appeal process from consolidated claims initiatives for DecisionDx-Melanoma do not count toward the minimum revenue requirements.
In addition, the 2018 LSA contains customary conditions of borrowing, events of default and covenants, including covenants that restrict the Company’s ability to dispose of assets, merge with or acquire other entities, incur indebtedness and make distributions to holders of the Company’s capital stock. Should an event of default occur, including the occurrence of a material adverse change, the Company could be liable for immediate repayment of all obligations under the 2018 LSA. The Second Amendment included a waiver, by the Lenders, of an event of default of the Company attributable to maintaining a balance in a certain third-party deposit account, beyond the maximum level permitted, without obtaining a control agreement for such deposit account in favor of the collateral agent, Oxford. In addition to the waiver, the Second Amendment also provided a modification to increase the maximum balance permitted for this deposit account. The Company is currently in compliance with this provision of the 2018 LSA.
Should the Company seek to further amend the terms of the 2018 LSA, the consent of Oxford and SVB would be required.
The 2018 Term Loan bears interest at a floating rate equal to the greater of (1)
8.55%
and (2) the 30-day U.S. LIBOR rate as reported in the Wall Street Journal on the last business day of the month that precedes the month in which the interest will accrue, plus
6.48%
. The applicable interest rate on the 2018 Term Loan was
8.55%
and
8.98%
at
December 31, 2019
and
December 31, 2018
, respectively. Interest on the 2018 Term Loan is payable monthly in arrears. The Company is permitted to make interest-only payments on the 2018 Term Loan for the
18 months
following the Closing Date. The principal is required to be repaid in
30
equal monthly installments beginning on June 1, 2020. All unpaid principal and accrued and unpaid interest are due on November 1, 2022 (the “2018 Term Loan Maturity Date”). The Company is also obligated to make an additional final payment of
6.75%
of the aggregate original principal amount, or
$1,687,500
as of
December 31, 2019
, upon any prepayment or on the 2018 Term Loan Maturity Date. The final payment amount is being amortized as additional interest expense using the effective interest method over the term of the debt.
The 2018 Term Loan was fully funded on the Closing Date and the 2018 Revolving Line (defined and discussed below) was fully drawn upon on the Closing Date. Proceeds from the 2018 LSA were used to repay all outstanding obligations under the
F-20
Company’s previous lending arrangement and to provide working capital. As a condition of the loan, the Company issued Series F preferred stock warrants to the Lenders with an aggregate initial fair value of
$158,000
. In accordance with ASC 480-10,
Distinguishing Liabilities from Equity
(“ASC 480-10”), the warrants were liability-classified as the underlying to the warrant was a puttable security. The initial recognition of the warrant liability created a discount to the debt, which is being amortized over the debt term using the effective interest method. The 2018 LSA was accounted for as a modification of the previous lending arrangement with SVB and Oxford, and therefore
no
extinguishment gain or loss was recognized.
Revolving Line of Credit
Under the 2018 LSA, the Company had a
$5.0 million
revolving line of credit (the ‘‘2018 Revolving Line’’), contingent on the Company’s satisfaction of borrowing base eligibility requirements. The 2018 Revolving Line bore interest at a floating per annum rate equal to the greater of (1)
6.25%
and (2)
5.48%
above the U.S. LIBOR rate. The applicable interest rate on the 2018 Revolving Line
December 31, 2018
was
7.98%
. The 2018 Revolving Line was to be due in full no later than November 30, 2020, but was eliminated in connection with the First Amendment, as discussed above.
9. Operating Leases
Friendswood Leases
The Company leases its office headquarters in Friendswood, Texas (the “820 Friendswood Lease”). As of December 31, 2019, the Company’s commitment under the 820 Friendswood Lease extends through June 30, 2020 and the Company has a one-year renewal option thereafter. If this option is exercised, the term of the 820 Friendswood Lease would extend through June 30, 2021. In December 2019, the Company entered into an agreement to lease new office space in Friendswood, Texas (the “550 Friendswood Lease”) with the intent to replace the 820 Friendswood Lease office space. The 550 Friendswood Lease is expected to commence on or prior to August 1, 2020 and has a
60
-month term, with an option to renew for
one
additional five-year period.
Phoenix Leases
In April 2016, the Company took occupancy of a newly constructed office and laboratory facility located in Phoenix, Arizona (the “3737 Phoenix Lease”), replacing its previous facility. On December 16, 2019, the Company entered into an amendment to the 3737 Phoenix Lease and extended the term by
48 months
, such that the expiration date is now July 31, 2027. Additionally, the amendment provides the Company with options to extend the term of the 3737 Phoenix Lease for
two
additional renewal periods of
five years
each.
On December 16, 2019, the Company entered into a lease (the “3707 Phoenix Lease”) of certain additional office space, in Phoenix, Arizona that the Company intends to use such space for clinical and research laboratory purposes as well as general office use. The 3707 Phoenix Lease commenced in January 2020 and has an initial term of
91 months
, or through approximately July 31, 2027. The 3707 Phoenix Lease provides the Company with options to extend the initial term for
two
additional renewal periods of
five years
each.
Other leasing arrangements include office copiers and a corporate apartment.
All leases have been classified as operating leases. Rent expense is recognized on a straight-line basis over the term of the leases.
Future non-cancellable commitments under all operating leases are as follows (in thousands):
|
Years Ending December 31,
|
||||
|
2020
|
$
|
754
|
|
|
|
2021
|
995
|
|
||
|
2022
|
993
|
|
||
|
2023
|
1,029
|
|
||
|
2024
|
999
|
|
||
|
Thereafter
|
1,625
|
|
||
|
$
|
6,395
|
|
||
Rent expense was
$395,000
and
$315,000
for the years ended December 31, 2019 and 2018, respectively.
F-21
10. Fair Value Measurements
Fair value is defined as the price that would be received to sell an asset or paid to transfer a liability (an exit price) in the principal or most advantageous market in an orderly transaction between market participants at the measurement date. The fair value hierarchy prioritizes the inputs to valuation techniques used in measuring fair value. There are three levels to the fair value hierarchy based on the reliability of inputs, as follows:
Level 1 – Observable inputs that reflect quoted prices (unadjusted) for identical assets or liabilities in active markets.
Level 2 – Inputs other than quoted prices included in Level 1 that are observable for the asset or liability, either directly or indirectly.
Level 3 – Unobservable inputs in which little or no market data exists, therefore requiring the Company to develop its own assumptions.
Financial instruments measured at fair value are classified in their entirety based on the lowest level of input that is significant to the fair value measurement. The Company’s assessment of the significance of a particular input to the fair value measurement in its entirety requires management to make judgments and consider factors specific to the asset or liability. The use of different assumptions and/or estimation methodologies may have a material effect on estimated fair values. Accordingly, the fair value estimates disclosed, or amounts recorded may not be indicative of the amount that the Company or holders of the instruments could realize in a current market exchange.
The table below provides information (in thousands), by level within the fair value hierarchy, of the Company’s financial assets and liabilities that are accounted for at fair value on a recurring basis as of
December 31, 2018
. There were no financial assets and liabilities accounted for at fair value on a recurring basis as of
December 31, 2019
.
|
|
As of December 31, 2018
|
||||||||||||||
|
|
Quoted Prices in Active Markets for Identical Items (Level 1)
|
Significant Other Observable Inputs (Level 2)
|
Significant Unobservable Inputs (Level 3)
|
Total
|
|||||||||||
|
Liabilities:
|
|
|
|
|
|
|
|
|
|||||||
|
Preferred stock warrants
|
$
|
—
|
|
$
|
—
|
|
$
|
1,194
|
|
$
|
1,194
|
|
|||
The following table discloses the summary of changes in the fair value of the Level 3 fair value measurements (in thousands):
|
|
Preferred stock warrant liability
|
Embedded derivative liability in the Q1 2019 Notes
|
The
July 2019 Note
|
||||||||
|
Balance, January 1, 2018
|
$
|
525
|
|
$
|
—
|
|
$
|
—
|
|
||
|
Issuance of warrants
|
632
|
|
—
|
|
—
|
|
|||||
|
Change in fair value included in net loss
|
272
|
|
—
|
|
—
|
|
|||||
|
Exercised warrants
|
(235
|
)
|
—
|
|
—
|
|
|||||
|
Balance, December 31, 2018
|
$
|
1,194
|
|
$
|
—
|
|
$
|
—
|
|
||
|
Issuance of convertible promissory notes
|
—
|
|
2,816
|
|
9,236
|
|
|||||
|
Change in fair value included in net income
|
619
|
|
237
|
|
2,077
|
|
|||||
|
Extinguishment of convertible promissory notes and exercise of warrants
|
(68
|
)
|
(3,053
|
)
|
(11,313
|
)
|
|||||
|
Reclassification of preferred stock warrant liability to stockholders’ equity
|
(1,745
|
)
|
—
|
|
—
|
|
|||||
|
Balance, December 31, 2019
|
$
|
—
|
|
$
|
—
|
|
$
|
—
|
|
||
The changes in fair value of the preferred stock warrant liability, the embedded derivative liability and the July 2019 Note were recorded as ‘‘Other expense, net’’ in the statements of operations and comprehensive income (loss).
F-22
The fair value of the warrants to purchase shares of Series A, Series B, Series E-1, Series E-2, Series E-2A, Series E-3, and Series F redeemable convertible preferred stock was estimated by management using the Black-Scholes option pricing model with the following assumptions:
|
|
December 31, 2018
|
|
|
Average expected life (years)
|
9
|
|
|
Expected stock price volatility
|
64%
|
|
|
Risk-free interest rate
|
2.51% - 2.69%
|
|
|
Dividend yield
|
—%
|
|
In connection with the IPO, all outstanding preferred stock warrants became exercisable for shares of common stock. The Company recorded a final fair value adjustment on the preferred stock warrant liability as of immediately prior to the closing of the IPO based on the IPO price of
$16.00
per share. The preferred stock warrant liability was then reclassified to stockholders’ equity and is no longer recorded at fair value on a recurring basis.
Certain features of the Q1 2019 Notes were determined to be an embedded derivative requiring bifurcation and separate accounting, as discussed in Note 7. The fair value of the embedded derivative was determined based on a probability-weighted income approach discounted at an interest rate that is consistent with the appropriate market interest rate (ranging from
8.93%
to
11.40%
) considering management’s estimates of the probability of the possible settlement outcomes. At inception of the Q1 2019 Notes, management assessed the probability of the occurrence of the Next Equity Financing at
90%
. The final fair value adjustment was based upon the actual settlement of the Q1 2019 Notes in connection with the IPO.
The Company elected the fair value option for the July 2019 Note, as discussed in Note 7. The change in fair value recorded for the July 2019 Note represents the difference between the net proceeds received and the fair value of the shares issued upon conversion of the July 2019 Note in connection with the IPO, valued at the IPO price of
$16.00
per share.
11. Commitments and Contingencies
From time to time, the Company may be involved in legal proceedings arising in the ordinary course of business. The Company believes there is no threatened litigation or litigation pending that could have, individually or in the aggregate, a material adverse effect on the Company’s financial position, results of operations or cash flows.
12. Convertible Preferred Stock and Preferred Stock Warrants
Convertible Preferred Stock
As discussed further below, in connection with the IPO, on July 29, 2019, all outstanding shares of convertible preferred stock automatically converted into shares of common stock at a rate of one common share for each 1.219 shares of convertible preferred stock. The Company’s convertible preferred stock was classified outside of stockholders’ equity in accordance with authoritative guidance for the classification and measurement of potentially redeemable securities. The preferred stock was contingently redeemable upon events that are outside of the Company’s control including liquidation, sale, or transfer of control of the Company. The Company had determined not to adjust the carrying values of the convertible preferred stock to liquidation preferences of such shares because of the uncertainty of whether or when such events would occur. Further, except for Series C preferred stock, the preferred stock was redeemable upon the majority vote of specified holders of the preferred stock. Information on liquidation and redemption terms applicable prior to the IPO are discussed further under
Liquidation Provisions
and
Redemption Rights
, respectively, below.
On January 12, 2018, the Company issued
940,605
shares of Series F redeemable convertible preferred stock in exchange for
$5.475 million
in cash. In two subsequent closings on May 31, 2018 and June 8, 2018, the Company issued
783,248
and
85,711
additional shares, respectively, in exchange for
$4,599,000
and
$499,000
, respectively, in cash. The designations, rights and preferences that were associated with the Series F redeemable convertible preferred stock prior to the IPO are provided below. Proceeds of
$94,000
from the sale of
16,127
of these shares were received in 2017 prior to issuance. These proceeds were initially recorded as a liability, but in in 2018 these proceeds were reclassified to convertible preferred stock when the shares were ultimately issued. In conjunction with the January 12, 2018 issuance of the Series F redeemable convertible preferred shares, the Company also issued warrants to purchase
67,233
additional shares of redeemable convertible preferred stock at
$0.01
per share with an initial fair value of
$473,000
.
As a result of a 1-for-1.219 reverse stock split effected on July 11, 2019, the conversion price for each series of preferred stock was adjusted to be the original issue price multiplied by
1.219
. Immediately prior to the closing of the IPO,
9,973,884
shares of
F-23
outstanding convertible preferred stock were automatically converted into
8,181,992
shares of common stock. In connection with the conversion, the Company derecognized the convertible preferred stock at their carrying values and allocated such amounts to common stock and additional paid-in capital effective July 29, 2019.
Convertible preferred stock consisted of the following (in thousands, except share and per share data):
Convertible preferred stock
|
As of December 31, 2018
|
|||||||||||||||||||||||||
|
Shares Authorized
|
Shares Issued and Outstanding
|
Original Issue Price per Share
|
Original Issue Value
|
Accumulated and Undeclared Dividends
|
Aggregate Liquidation Preference
|
Carrying Value
|
|||||||||||||||||||
|
Series C
|
503,056
|
|
503,056
|
|
|
$3.4800
|
|
$
|
1,751
|
|
$
|
667
|
|
$
|
2,417
|
|
$
|
1,501
|
|
||||||
Redeemable convertible preferred stock
|
As of December 31, 2018
|
|||||||||||||||||||||||||
|
Shares Authorized
|
Shares Issued and Outstanding
|
Original Issue Price per Share
|
Original Issue Value
|
Accumulated and Undeclared Dividends
|
Aggregate Liquidation Preference
|
Carrying Value
|
|||||||||||||||||||
|
Series A
|
533,711
|
|
533,711
|
|
|
$2.1400
|
|
$
|
1,142
|
|
$
|
713
|
|
$
|
1,856
|
|
$
|
1,142
|
|
||||||
|
Series B
|
816,654
|
|
816,654
|
|
|
$2.2500
|
|
1,837
|
|
983
|
|
2,820
|
|
1,932
|
|
||||||||||
|
Series D
|
756,416
|
|
756,416
|
|
|
$3.7700
|
|
2,852
|
|
1,340
|
|
4,191
|
|
2,852
|
|
||||||||||
|
Series E-1
|
842,641
|
|
829,642
|
|
|
$3.7700
|
|
3,128
|
|
1,095
|
|
4,223
|
|
3,099
|
|
||||||||||
|
Series E-2
|
949,725
|
|
934,433
|
|
|
$4.5776
|
|
4,277
|
|
1,503
|
|
5,780
|
|
4,277
|
|
||||||||||
|
Series E-2A
|
27,306
|
|
27,306
|
|
|
$4.5776
|
|
125
|
|
39
|
|
164
|
|
125
|
|
||||||||||
|
Series E-3
|
830,554
|
|
824,000
|
|
|
$5.3405
|
|
4,401
|
|
1,364
|
|
5,764
|
|
4,394
|
|
||||||||||
|
Series F
|
4,883,486
|
|
4,734,613
|
|
|
$5.8208
|
|
27,559
|
|
5,212
|
|
32,772
|
|
27,174
|
|
||||||||||
|
Total
|
9,640,493
|
|
9,456,775
|
|
$
|
45,321
|
|
$
|
12,249
|
|
$
|
57,570
|
|
$
|
44,995
|
|
|||||||||
Any discount to the original issue price was being accreted with a charge to additional paid-in capital over the period through the earliest date the redeemable convertible preferred stock could become redeemable. See the
Redemption Rights
section below for additional information. Unpaid cumulative accruing dividends were included in calculating the aggregate liquidation preference, but such dividends were not recorded in the financial statements since a liquidation event or a deemed liquidation did not become probable of occurring. See the
Liquidation Provisions
section below for additional information.
The rights, preferences and privileges of the Series A, Series B, Series C, Series D, Series E-1, Series E-2, Series E-2A, Series E-3, and Series F convertible preferred stock that existed prior to the IPO are as follows:
Dividends
The holders of the outstanding shares of Series A, Series B, Series C, Series D, Series E-1, Series E-2, Series E-2A, Series E-3, and Series F convertible preferred stock were entitled to receive, when and if declared by the Board of Directors, a cash dividend in the following order of preference and at the rates per annum noted:
|
Convertible Preferred Stock Class
|
Annual Dividend Rate
|
|||
|
Series F
|
$
|
0.46570
|
|
|
|
Series E-3
|
$
|
0.42720
|
|
|
|
Series E-2A
|
$
|
0.36620
|
|
|
|
Series E-2
|
$
|
0.36620
|
|
|
|
Series E-1
|
$
|
0.30160
|
|
|
|
Series D
|
$
|
0.30160
|
|
|
|
Series C
|
$
|
0.27840
|
|
|
|
Series B
|
$
|
0.18000
|
|
|
|
Series A
|
$
|
0.17120
|
|
|
F-24
The right to receive dividends on shares of convertible preferred stock was not cumulative, and no right to such dividends accrued to holders of convertible preferred stock by reason of the fact that dividends on said shares were not declared or paid in any calendar year. However, refer to
Liquidation Provisions
below for information regarding cumulative dividends that would have been payable upon a liquidation event or a deemed liquidation event.
Conversion Rights
Each share of Series A, Series B, Series C, Series D, Series E-1, Series E-2, Series E-2A, Series E-3, and Series F convertible preferred stock was, at the option of the holder, convertible at any time into that number of fully paid and non-assessable shares of common stock determined by dividing the original issue price by the conversion price. The conversion price for each series of convertible preferred stock was initially the original issue price of such series of convertible preferred stock and was subject to adjustment in accordance with the conversion provisions contained in the Company’s Amended and Restated Certificate of Incorporation. As a result of a 1-for-1.219 reverse stock split effected on July 11, 2019, the conversion price for each series of convertible preferred stock was the original issue price multiplied by
1.219
. Each share of convertible preferred stock could have been automatically be converted into shares of common stock based on the then effective conversion price (i) upon the affirmative election of the holders of at least a majority of the outstanding shares of Series E-1, Series E-2, Series E-2A, Series E-3, and Series F convertible preferred stock or (ii) immediately upon the closing of a firmly underwritten public offering filed under the Securities Act of 1933, as amended, covering the offer and sale of common stock for the account of the Company in which the gross cash proceeds to the Company are at least
$30 million
. The closing of the Company’s IPO satisfied the conditions for an automatic conversion of the shares of convertible preferred stock into shares of common stock.
Liquidation Provisions
Upon a liquidation event (any liquidation, dissolution or winding up on the Company, whether voluntary or involuntary) or a deemed liquidation event (generally, a change of control of the Company or the sale of substantially all the assets or intellectual property of the Company), the holders of Series A, Series B, Series C, Series D, Series E-1, Series E-2, Series E-2A, Series E-3, and Series F convertible preferred stock would have been entitled to distributions based on the liquidation value of the stock, which was initially set equal to the original issue price for the series of convertible preferred stock, plus any unpaid cumulative accruing dividends, at the annual dividend rates provided above, accruing from the date of issuance of the shares of convertible preferred stock, plus any other declared and unpaid dividends.
Regarding liquidation preferences, the holders of each successive series of preferred stock would have been entitled to receive on a pari passu basis and prior and in preference to any distribution of any of the assets or surplus funds of the Company to the holders of any prior-issued preferred stock, or common stock, the liquidation preference specified for each share of preferred stock.
Voting Rights
Each holder of convertible preferred stock was entitled to the number of votes equal to the number of shares of common stock into which the shares of convertible preferred stock could have been converted. Holders of the convertible preferred stock were entitled to vote on all matters on which the holders of common stock were entitled to vote.
Redemption Rights
The holders of at least a majority (voting together as a single class and not as a separate series, and on an as-converted basis) of the then-outstanding shares of Series A preferred stock, Series B preferred stock, Series D preferred stock, Series E-1 preferred stock, Series E-2 preferred stock, Series E-2A preferred stock, Series E-3 preferred stock and Series F preferred stock (the “Redemption Stock”), and the holders of at least a majority (voting together as a single class and not as a separate series, and on an as-converted basis) of the then-outstanding shares of Series E-1 preferred stock, Series E-2 preferred stock, Series E-2A preferred stock, Series E-3 preferred stock and Series F preferred stock could have requested, in writing, and any time after
five years
from the date of first issuance of Series F preferred stock (i.e.,
five years
from July 15, 2015), the redemption of all outstanding shares of the Redemption Stock. However, on July 10, 2019, the earliest redemption date was effectively changed to July 15, 2025, in connection with an amendment to the Company’s Amended and Restated Certificate of Incorporation. The Company, upon such written request, would have been required to redeem all outstanding shares in
three
equal annual installments beginning on the date specified in the redemption request, which date could not have been less than
90 days
after the Company’s receipt of such request. The redemption price would have been the original issue price of the preferred stock plus an amount for all declared and unpaid dividends thereon.
Preferred Stock Warrant Liabilities
The Company previously issued warrants to purchase shares of its convertible preferred stock. The warrant provided the holder the option to purchase a specified number of shares of a particular series of the Company’s convertible preferred stock for a
F-25
specified price. The holder may exercise the warrant in cash or exercise pursuant to a cashless exercise whereby a calculated number of shares are withheld upon exercise to satisfy the exercise price. The warrants do not provide the holder any voting rights until the warrants are exercised. In accordance with their terms, in connection with the IPO, all outstanding warrants to purchase shares of convertible preferred stock became exercisable for shares of common stock at a rate of one common stock warrant for every
1.219
preferred stock warrants. Exercise prices of the warrants were also adjusted upon conversion by multiplying each of the exercise prices by
1.219
. Immediately prior to the closing of the IPO, certain outstanding warrants to purchase shares of Series F convertible redeemable preferred stock were net exercised for an aggregate of
27,207
shares of common stock.
In accordance with ASC 480-10, the Company accounted for preferred stock warrants outstanding as a liability at fair value and adjusted the instruments to fair value at each reporting period. This liability was subject to re-measurement at each balance sheet date until exercised, and any change in fair value was recognized in the Company’s statements of operations and comprehensive loss as other income (expense), net. The fair value of the warrants issued by the Company was estimated using a Black-Scholes model at each measurement date. Refer to Note 10 for additional information on the fair value measurement assumptions and changes in the fair value of the preferred stock warrants recorded on the Company’s balance sheets.
Warrants to purchase redeemable convertible preferred shares consisted of the following:
|
As of December 31, 2018
|
||||||||||||||||||||
|
Warrants
|
Year of First Issuance
|
Shares
|
Exercise Price
|
Year of Expiration
|
Exercised
|
Expired
|
Outstanding
|
|||||||||||||
|
Series A Preferred Stock
|
2008
|
108,057
|
|
|
$2.1400
|
|
2015
|
(96,375
|
)
|
(11,682
|
)
|
—
|
|
|||||||
|
Series B Preferred Stock
|
2010
|
86,667
|
|
|
$2.2500
|
|
2017
|
(86,667
|
)
|
—
|
|
—
|
|
|||||||
|
Series E-1 Preferred Stock
|
2014
|
16,249
|
|
|
$3.7700
|
|
2024
|
(3,250
|
)
|
—
|
|
12,999
|
|
|||||||
|
Series E-2 Preferred Stock
|
2014
|
15,292
|
|
|
$4.5776
|
|
2024
|
—
|
|
—
|
|
15,292
|
|
|||||||
|
Series E-3 Preferred Stock
|
2015
|
6,554
|
|
|
$5.3405
|
|
2024
|
—
|
|
—
|
|
6,554
|
|
|||||||
|
Series F Preferred Stock
|
2016
|
103,090
|
|
|
$5.8208
|
|
2026-2028
|
—
|
|
—
|
|
103,090
|
|
|||||||
|
Series F Preferred Stock
|
2018
|
67,233
|
|
|
$0.0100
|
|
2023
|
(32,951
|
)
|
—
|
|
34,282
|
|
|||||||
|
Total
|
403,142
|
|
(219,243
|
)
|
(11,682
|
)
|
172,217
|
|
||||||||||||
In connection with the preferred stock warrants becoming exercisable for common stock, the Company reclassified the preferred stock warrant liability balance to additional paid-in capital effective July 29, 2019 due to meeting the criteria under U.S. GAAP for classification in stockholders’ equity. See Note 13 for information on outstanding common stock warrants at
December 31, 2019
.
13. Stockholders’ Equity (Deficit)
Common Stock
The Company’s Amended and Restated Certificate of Incorporation, dated July 29, 2019, authorizes the Company to issue up to
200,000,000
shares of common stock with a par value of
$0.001
per share. The holders of common stock shall have
one
vote for each share. The Company is also authorized to issue up to
10,000,000
shares of preferred stock with a par value of
$0.001
per share. The preferred stock may be issued from time to time in one or more series, with rights, preferences, limitations and restrictions as determined by the Company’s Board of Directors.
No
dividends were declared or paid during the years ended December 31, 2019 or 2018. The terms of the 2018 LSA restrict the Company’s ability to pay dividends on common stock without prior consent of the Lenders.
On July 11, 2019, the Company effected a 1-for-1.219 reverse stock split of its common stock. The par value and the authorized number of shares of the common stock were not affected by the reverse stock split. The reverse stock split resulted in an adjustment to the Series A, B, C, D, E-1, E-2, E-2A, E-3, and F preferred stock conversion prices to reflect a proportional decrease in the number of shares of common stock to be issued upon conversion. The accompanying financial statements and notes to the financial statements give retroactive effect to the reverse stock split for all periods presented.
In connection with the issuance of the July 2019 Note, the Company issued
the purchaser of the July 2019 Note a warrant to purchase up to
209,243
shares of common stock at an exercise price of approximately
$0.001
per share. The July 2019 Warrant, which expires on July 12, 2026, was initially exercisable for
50%
of the shares subject to the warrant and became exercisable for the remaining
50%
of the shares subject to the warrant upon the holder’s satisfaction of a requirement to purchase a certain amount of equity securities of the Company. The holder satisfied such requirement on July 29, 2019 in connection with a purchase of common stock in the IPO.
F-26
On July 29, 2019, the Company completed the initial public offering of its common stock. In connection with the IPO, the Company issued and sold
4,600,000
shares of its common stock, including
600,000
shares associated with the full exercise of the underwriters’ option to purchase additional shares, at a price to the public of
$16.00
per share. The Company received approximately
$65.9 million
in net proceeds from the IPO, after deducting underwriting discounts and commissions and other offering expenses payable by the Company.
Common Stock Warrants
Information about common stock warrants outstanding as of
December 31, 2019
is presented in the table below:
|
As of December 31, 2019
|
|||||||
|
Expiration date
|
Number of shares
|
Exercise price
|
|||||
|
July 12, 2026
|
209,243
|
|
$
|
0.001
|
|
||
|
March 31, 2027
|
26,428
|
|
$
|
7.10
|
|
||
|
November 30, 2028
|
8,809
|
|
$
|
7.10
|
|
||
|
Total
|
244,480
|
|
|||||
The common stock warrants are classified as stockholders’ equity and no adjustments are recorded for changes in fair value. There were
no
common stock warrants outstanding as of
December 31, 2018
.
14. Stock Incentive Plans and Stock Based Compensation
Stock Incentive Plans
The Company’s stock incentive plans provide for the granting of options to purchase common stock and other equity-based awards to employees, directors and consultants of the Company. On September 6, 2008, the Company adopted the 2008 Stock Plan (the “2008 Plan”), on August 15, 2018, the Company adopted the 2018 Stock Plan (the “2018 Plan”) and on July 24, 2019, the Company adopted the 2019 Equity Incentive Plan (the “2019 Plan”). Following the adoption of the 2018 Plan, no additional stock awards were granted under the 2008 Plan and following the adoption of the 2019 Plan, no additional stock awards were granted under the 2018 Plan.
Options under the plans may be granted as incentive stock options (“ISOs”) or non-statutory stock options (“NSOs”). ISOs may only be granted to Company employees (including directors who are also considered employees). NSOs may be granted to Company employees, directors and consultants. Options may be granted for terms up to
ten years
from the date of grant, as determined by the Board of Directors; provided, however, that with respect to an ISO granted to a person who owns stock representing more than
10%
of the voting power of all classes of stock of the Company, the terms shall be for no more than
five years
from the date of grant. The exercise price of options granted must be no less than
100%
of the fair market value of the shares on the date of grant, provided, however, that with respect to an ISO granted to an employee who at the time of grant of such options owns stock representing more than
10%
of the voting power of all classes of stock of the Company, the exercise price shall not be less than
110%
of the fair market value of the shares on the date of grant. Options generally vest over
four years
(generally
25%
after
one year
and monthly thereafter), subject to the option holder’s continued service with the Company. The Company issues new shares to satisfy option exercises.
F-27
Activity under the Company’s stock plans for the
years ended December 31, 2019
and
2018
is set forth below:
|
|
|
|
Weighted-Average
|
|
|||||||||||
|
|
Shares
Available for
Grant
|
Stock Options
Outstanding
|
Exercise
Price
|
Remaining
Contractual
Term (Years)
|
Aggregate
Intrinsic
Value
(in thousands)
|
||||||||||
|
Balance as of December 31, 2017
|
551,918
|
|
1,175,987
|
|
$
|
1.79
|
|
||||||||
|
Additional options authorized
|
410,172
|
|
—
|
|
—
|
|
|||||||||
|
Granted
|
(580,402
|
)
|
580,402
|
|
2.39
|
|
|||||||||
|
Exercised
|
—
|
|
(19,755
|
)
|
1.91
|
|
|||||||||
|
Forfeited/Cancelled
|
77,038
|
|
(77,038
|
)
|
1.82
|
|
|||||||||
|
Balance as of December 31, 2018
|
458,726
|
|
1,659,596
|
|
$
|
1.99
|
|
||||||||
|
Additional options authorized
|
2,075,898
|
|
—
|
|
—
|
|
|||||||||
|
Granted
|
(1,711,325
|
)
|
1,711,325
|
|
19.41
|
|
|||||||||
|
Exercised
|
—
|
|
(693,127
|
)
|
1.70
|
|
|||||||||
|
Forfeited/Cancelled
|
39,828
|
|
(39,828
|
)
|
6.36
|
|
|||||||||
|
Balance as of December 31, 2019
|
863,127
|
|
2,637,966
|
|
$
|
13.30
|
|
8.64
|
$
|
55,578
|
|
||||
|
Exercisable at December 31, 2019
(1
)
|
590,104
|
|
$
|
2.20
|
|
6.11
|
$
|
18,984
|
|
||||||
|
(1)
|
Vested and exercisable options. Additionally, outstanding unvested options to purchase an aggregate of
126,044
shares of common stock with a weighted-average exercise price of
$2.39
per share may be exercised prior to vesting as of
December 31, 2019
under early-exercise provisions. In the event of such exercise, the shares obtained upon exercise would be restricted and subject to forfeiture prior to vesting. No such early exercises have occurred as of
December 31, 2019
.
|
On July 11, 2019, the Company’s Board of Directors approved an increase of
144,878
in the number of shares authorized for issuance under the 2018 Plan.
On July 24, 2019, the 2019 Plan became effective. The 2019 Plan authorized
1,931,020
new shares plus the number of shares (not to exceed
1,976,756
shares) that remained available under the 2018 Stock Plan at the time the 2019 Plan became effective and any shares underlying outstanding stock awards granted under the 2018 Plan and 2008 Stock Plan that expire or are repurchased, forfeited, cancelled or withheld. The 2019 Plan also provides for certain automatic increases in the number of shares of common stock reserved for issuance, which resulted in an additional
856,545
shares becoming available effective January 1, 2020.
Employee Stock Purchase Plan
The ESPP became effective July 24, 2019. Under the ESPP,
411,935
shares of common stock are reserved for future issuance. The ESPP also provides for certain automatic increases in the number of shares of common stock reserved for issuance, which resulted in an additional
171,309
shares becoming available under the ESPP effective January 1, 2020. The Company commenced a series of offerings under the ESPP on October 1, 2019. The initial offering began October 1, 2019, ends on August 31, 2021 (unless terminated earlier, as described below) and consists of
four
purchase periods. The purchase periods end on the last trading day of February and August 31 of each year. Eligible employees who enroll in the initial offering or any subsequent offering will be able to purchase shares of the Company’s common stock at a discount through payroll deductions, subject to certain limitations. The purchase price of the shares of common stock will be the lesser of (i)
85%
of the fair market value of such shares on the offering date and (ii)
85%
of the fair market value of such shares on the purchase date. Following the commencement of the initial offering, a new
24
-month offering with
four
six-month purchase periods will automatically begin approximately every six months thereafter over the term of the ESPP. Offerings will be concurrent, but in the event the fair market value of a share of common stock on the first day of any purchase period during an offering (the “New Offering”) is less than or equal to the fair market value of a share of common stock on the offering date for an ongoing offering (the “Ongoing Offering”), then the Ongoing Offering terminates immediately following the purchase of shares on the purchase date immediately preceding the New Offering and the participants in the terminated Ongoing Offering are automatically enrolled in the New Offering. Notwithstanding the above, the Company’s Board of Directors (or an authorized committee thereof) may modify the terms of or suspend any future offerings prior to their commencement. The Company issues new shares for purchases of stock made pursuant to the ESPP.
F-28
Determining Fair Value - Summary of Assumptions
The Company uses the Black-Scholes option pricing model to estimate the fair value of each option grant or ESPP offering on the date of grant or any other measurement date. Following is a description of the significant assumptions used in the option pricing model:
|
•
|
Expected term
. The expected term is the period of time that granted options are expected to be outstanding. For stock options, the Company has set the expected term using the simplified method based on the weighted average of both the period to vesting and the period to maturity for each option, as the Company has concluded that its stock option exercise history does not provide a reasonable basis upon which to estimate the expected term. For the ESPP, the expected term is the period of time from the offering date to the purchase date.
|
|
•
|
Expected volatility
. Because of the limited period of time the Company’s stock has been traded in an active market, the Company calculates volatility by using the historical stock price volatility of a group of similar companies looking back over the estimated life of the option or the ESPP purchase right and averaging the volatilities of these companies.
|
|
•
|
Risk-free interest rate
. The Company bases the risk-free interest rate used in the Black-Scholes valuation model on the market yield in effect at the time of option grant and at the offering date for the ESPP, provided from the Federal Reserve Board’s Statistical Releases and historical publications from the Treasury constant maturities rates for the equivalent remaining terms.
|
|
•
|
Dividend yield
. The Company has not paid, and does not have plans to pay, cash dividends. Therefore, the Company use an expected dividend yield of zero in the Black-Scholes option valuation model.
|
The fair value of the Company’s common stock is also an assumption used to determine the fair value of stock options. Prior to the IPO, our common stock was not publicly traded, therefore the Company estimated the fair value of its common stock. Following the IPO, the fair value of the Company’s common stock is the closing selling price per share of its common stock as reported on the Nasdaq Global Market on the date of grant or other relevant determination date.
The Company uses the Black-Scholes option pricing model to estimate the fair value of each option grant on the date of grant or any other measurement date. The following table sets forth the assumptions used to determine the fair value of stock options:
|
|
Years Ended December 31,
|
||
|
2019
|
2018
|
||
|
Average expected term (years)
|
6
|
6
|
|
|
Expected stock price volatility
|
56.74% - 60.17%
|
57.77% - 58.29%
|
|
|
Risk-free interest rate
|
1.63% - 2.47%
|
2.77% - 3.13%
|
|
|
Dividend yield
|
—%
|
—%
|
|
The following table sets forth assumptions used to determine the fair value of the purchase rights issued under the ESPP:
|
|
Years Ended December 31,
|
||
|
2019
|
2018
|
||
|
Average expected term (years)
|
1.2
|
Not applicable
|
|
|
Expected stock price volatility
|
61.12% - 68.89%
|
Not applicable
|
|
|
Risk-free interest rate
|
1.56% - 1.80%
|
Not applicable
|
|
|
Dividend yield
|
—%
|
Not applicable
|
|
F-29
Stock-Based Compensation Expense
Stock-based compensation expense related to stock options and the ESPP is included in the statements of operations and comprehensive income (loss) as follows (in thousands):
|
|
Years Ended December 31,
|
||||||
|
|
2019
|
2018
|
|||||
|
Cost of sales
|
$
|
170
|
|
$
|
24
|
|
|
|
Research and development
|
165
|
|
56
|
|
|||
|
Selling, general and administrative
|
914
|
|
214
|
|
|||
|
Total stock-based compensation expense
|
$
|
1,249
|
|
$
|
294
|
|
|
For the
years ended December 31, 2019
and 2018, the weighted-average grant date fair value of options was
$10.89
and
$1.35
per option, respectively, and the weighted-average grant date fair value for the ESPP granted was
$7.32
and
nil
, respectively. As of
December 31, 2019
, the total unrecognized compensation cost related to stock options and the ESPP was
$18,417,000
and
$678,000
, respectively, which is expected to be recognized on a straight-line basis over a weighted-average period of
3.4
years and
1.6
years, respectively. The total unrecognized compensation costs will be adjusted for forfeitures in future periods as they occur.
The intrinsic value of stock options exercised during the year ended
December 31, 2019
was
$5,151,000
and was
no
t material for the year ended
December 31, 2018
.
No
tax benefits related to stock-based compensation were recorded in the statements of operations and comprehensive income (loss) during the years ended December 31, 2019 and 2018 due to the valuation allowance on net deferred tax assets.
15. Income Taxes
The components of income tax expense are as follows (in thousands):
|
Years Ended December 31,
|
||||||||
|
2019
|
2018
|
|||||||
|
Current tax expense
|
||||||||
|
U.S. Federal
|
$
|
—
|
|
$
|
—
|
|
||
|
State and local
|
72
|
|
9
|
|
||||
|
Total current
|
72
|
|
9
|
|
||||
|
Deferred tax expense
|
||||||||
|
U.S. Federal
|
—
|
|
—
|
|
||||
|
State and local
|
—
|
|
—
|
|
||||
|
Total deferred
|
—
|
|
—
|
|
||||
|
Total income tax expense
|
$
|
72
|
|
$
|
9
|
|
||
F-30
The differences between income taxes expected at the U.S. federal statutory rate (21%) and the reported income tax expense are summarized as follows (in thousands):
|
Years Ended December 31,
|
||||||||
|
2019
|
2018
|
|||||||
|
Pre-tax income (loss)
|
$
|
5,349
|
|
$
|
(6,358
|
)
|
||
|
U.S. federal taxes at statutory rate
|
1,123
|
|
(1,335
|
)
|
||||
|
State income taxes
|
958
|
|
(1,174
|
)
|
||||
|
Mark-to-market losses
|
566
|
|
57
|
|
||||
|
Non-deductible meals
|
224
|
|
119
|
|
||||
|
Convertible debt interest
|
95
|
|
—
|
|
||||
|
Research and development (“R&D”) tax credit
|
(251
|
)
|
—
|
|
||||
|
Change in valuation allowance
|
(2,747
|
)
|
2,278
|
|
||||
|
Stock-based compensation
|
65
|
|
53
|
|
||||
|
Other
|
39
|
|
11
|
|
||||
|
Total income tax expense
|
$
|
72
|
|
$
|
9
|
|
||
Significant components of deferred tax assets and liabilities are as follows (in thousands):
|
As of December 31,
|
||||||||
|
2019
|
2018
|
|||||||
|
Deferred tax assets:
|
||||||||
|
Net operating loss (“NOL”) carryforwards
|
$
|
14,077
|
|
$
|
16,184
|
|
||
|
Accounts payable
|
456
|
|
390
|
|
||||
|
Accrued liabilities
|
1,817
|
|
1,432
|
|
||||
|
R&D tax credit
|
993
|
|
715
|
|
||||
|
Intangible assets
|
50
|
|
61
|
|
||||
|
Stock-based compensation
|
127
|
|
12
|
|
||||
|
Charitable contributions
|
2
|
|
4
|
|
||||
|
Total deferred tax assets
|
17,522
|
|
18,798
|
|
||||
|
Less valuation allowance
|
(12,420
|
)
|
(14,375
|
)
|
||||
|
Deferred tax assets, net
|
$
|
5,102
|
|
$
|
4,423
|
|
||
|
Deferred tax liabilities:
|
||||||||
|
Accounts receivable
|
$
|
(3,796
|
)
|
$
|
(3,249
|
)
|
||
|
Prepaid expenses
|
(757
|
)
|
(378
|
)
|
||||
|
Property and equipment
|
(246
|
)
|
(131
|
)
|
||||
|
Section 481(a) adjustment (cash to accrual)
|
(303
|
)
|
(665
|
)
|
||||
|
Total deferred tax liabilities
|
(5,102
|
)
|
(4,423
|
)
|
||||
|
Net deferred tax asset (liability)
|
$
|
—
|
|
$
|
—
|
|
||
At December 31, 2019, the Company had NOL carryforwards for federal income tax purposes of approximately
$57,429,000
of which
$43,536,000
will begin to expire in 2028 if not utilized to offset taxable income, and
$13,893,000
may be carried forward indefinitely. Future changes in ownership, as defined by Section 382 of the IRC, could limit the amount of NOL carryforwards used in any one year. Also, as of December 31, 2019, the Company had state net operating loss carryforwards of approximately
$42,211,000
, which begin to expire in 2028 if not utilized to offset state taxable income.
In general, under Section 382 and 383 of the IRC, a corporation that undergoes an “ownership change” is subject to limitations on its ability to utilize its pre-change NOLs and certain tax credits, to offset future taxable income and tax. In general, an ownership change occurs if the aggregate stock ownership of certain stockholders changes by more than 50 percentage points
F-31
over such stockholders’ lowest percentage of ownership during the testing period (generally three years). The Company performed a Section 382 analysis from inception through the year ended December 31, 2019 and concluded the Company had experienced an ownership change in 2011 and 2014. These changes in ownership did not result in the expiration of any NOLs or R&D credits. However, future changes in ownership may further limit the ability of the Company to utilize its NOL carryforwards and R&D tax credit carryforwards.
At December 31, 2019 and 2018, the Company placed a valuation allowance of
$12,420,000
and
$14,375,000
, respectively, against the entirety of its net deferred tax asset balance, as the Company has not determined that it is more likely than not to be realized.
The Company assessed whether it had any significant uncertain tax positions related to open tax years and concluded there were none. Accordingly, no reserve for uncertain tax positions has been recorded as of December 31, 2019 and 2018. The Company is generally no longer subject to tax examinations for U.S. federal income tax purposes for fiscal years prior to 2016 and fiscal years prior to 2014 for multiple state jurisdictions. However, since the Company has been in an NOL position since 2008, the Company’s 2008 to 2015 federal tax returns and its 2008 to 2013 state tax returns are potentially subject to examination adjustments to the extent of those NOL carryforwards.
16. Selected Quarterly Financial Data (Unaudited)
The following is a summary of selected unaudited quarterly financial data for the years ended December 31, 2019 and 2018 (in thousands, except per share data):
|
Year Ended December 31, 2019
|
||||||||||||||||||||
|
First Quarter
|
Second Quarter
|
Third Quarter
|
Fourth Quarter
|
Total Year
|
||||||||||||||||
|
Net revenues
|
$
|
8,717
|
|
$
|
10,739
|
|
$
|
14,774
|
|
$
|
17,635
|
|
$
|
51,865
|
|
|||||
|
Gross margin
|
$
|
7,119
|
|
$
|
8,746
|
|
$
|
13,066
|
|
$
|
15,624
|
|
$
|
44,555
|
|
|||||
|
Net income (loss)
(1)
|
$
|
(1,358
|
)
|
$
|
(1,269
|
)
|
$
|
5,849
|
|
$
|
2,055
|
|
$
|
5,277
|
|
|||||
|
Net income (loss) attributable to common shareholders
(1)
|
$
|
(2,342
|
)
|
$
|
(2,265
|
)
|
$
|
5,543
|
|
$
|
2,055
|
|
$
|
2,991
|
|
|||||
|
Earnings (loss) per share
(3)
:
|
||||||||||||||||||||
|
Basic
|
$
|
(1.22
|
)
|
$
|
(1.05
|
)
|
$
|
0.43
|
|
$
|
0.12
|
|
$
|
0.35
|
|
|||||
|
Diluted
|
$
|
(1.22
|
)
|
$
|
(1.05
|
)
|
$
|
0.05
|
|
$
|
0.11
|
|
$
|
(0.21
|
)
|
|||||
|
Year Ended December 31, 2018
|
||||||||||||||||||||
|
First Quarter
|
Second Quarter
|
Third Quarter
|
Fourth Quarter
|
Total Year
|
||||||||||||||||
|
Net revenues
(2)
|
$
|
3,659
|
|
$
|
3,979
|
|
$
|
3,712
|
|
$
|
11,436
|
|
$
|
22,786
|
|
|||||
|
Gross margin
(2)
|
$
|
2,406
|
|
$
|
2,652
|
|
$
|
2,361
|
|
$
|
10,070
|
|
$
|
17,489
|
|
|||||
|
Net income (loss)
(2)
|
$
|
(3,630
|
)
|
$
|
(3,155
|
)
|
$
|
(3,450
|
)
|
$
|
3,868
|
|
$
|
(6,367
|
)
|
|||||
|
Net income (loss) attributable to common shareholders
(2)
|
$
|
(4,489
|
)
|
$
|
(4,080
|
)
|
$
|
(4,456
|
)
|
$
|
2,862
|
|
$
|
(10,163
|
)
|
|||||
|
Earnings (loss) per share
(3)
:
|
||||||||||||||||||||
|
Basic
|
$
|
(2.37
|
)
|
$
|
(2.15
|
)
|
$
|
(2.33
|
)
|
$
|
1.49
|
|
$
|
(5.33
|
)
|
|||||
|
Diluted
|
$
|
(2.37
|
)
|
$
|
(2.15
|
)
|
$
|
(2.33
|
)
|
$
|
0.38
|
|
$
|
(5.33
|
)
|
|||||
(1) For the third quarter of 2019, includes gain on extinguishment of debt of (in thousands)
$5,213
.
|
(2)
|
For the fourth quarter of 2018, includes revenue recognized of (in thousands)
$5,191
for tests delivered during the first three quarters of 2018 for which the requirements to release the constraint on variable consideration were not met until the fourth quarter of 2018 in connection with the issuance of the LCD for DecisionDx-Melanoma and establishment of a Medicare reimbursement rate.
|
|
(3)
|
Basic and diluted earnings (loss) per share are computed independently for each quarterly and annual period presented. Therefore, t
he sum of the quarterly basic and diluted earnings (loss) per share amounts may not equal annual basic and diluted earnings (loss) per share.
|
F-32
17. Subsequent Events
On January 15, 2020 and February 14, 2020, the Company granted to various employees, options to purchase an aggregate of
17,500
and
135,000
shares, respectively, of our common stock at an exercise price of
$31.97
and
$31.80
per share, respectively. The option awards were granted pursuant to the 2019 Plan, have a
ten
-year term and vest over a
four
-year period (with
25%
vesting after
one year
from the vesting start date and the remainder vesting in
36
equal monthly installments thereafter).
On February 28, 2020, the Company issued
39,987
shares of its common stock under a scheduled purchase under the ESPP. The shares were purchased at a price of
$15.09
and funded through employee payroll deductions.
On February 28, 2020 and March 4, 2020, the Compa
ny and the Lenders amended the 2018 LSA, as discussed in Note 8.
F-33
TABLE OF CONTENTS
Part IItem 1. BusinessItem 1A. Risk FactorsItem 1B. Unresolved Staff CommentsItem 2. PropertiesItem 3. Legal ProceedingsItem 4. Mine Safety DisclosuresPart IIItem 5. Market For Registrant S Common Equity, Related Stockholder Matters and Issuer Purchases Of Equity SecuritiesItem 6. Selected Financial DataItem 7. Management S Discussion and Analysis Of Financial Condition and Results Of OperationsItem 7A. Qualitative and Quantitative Disclosures About Market RiskItem 8. Financial Statements and Supplementary DataItem 9. Changes in and Disagreements with Accountants on Accounting and Financial DisclosureItem 9A. Controls and ProceduresItem 9B. Other InformationPart IIIItem 10. Directors, Executive Officers and Corporate GovernanceItem 11. Executive CompensationItem 12. Security Ownership Of Certain Beneficial Owners and Management and Related Stockholder MattersItem 13. Certain Relationships and Related Transactions, and Director IndependenceItem 14. Principal Accounting Fees and ServicesPart IVItem 15. Exhibits, Financial Statement SchedulesItem 16. Form 10-k Summary