UNITED STATES
SECURITIES AND EXCHANGE COMMISSION
Washington, D.C. 20549
__________________________________________________________________________
FORM 20-F
__________________________________________________________________________
|
☐
|
REGISTRATION STATEMENT PURSUANT TO SECTION 12(b) OR (g) OF THE SECURITIES EXCHANGE ACT OF 1934
|
|
x
|
ANNUAL REPORT PURSUANT TO SECTION 13 OR 15(d) OF THE SECURITIES EXCHANGE ACT OF 1934
|
For the fiscal year ended
December 31, 2019
OR
|
☐
|
TRANSITION REPORT PURSUANT TO SECTION 13 OR 15(d) OF THE SECURITIES EXCHANGE ACT OF 1934
|
OR
|
☐
|
SHELL COMPANY REPORT PURSUANT TO SECTION 13 OR 15(d) OF THE SECURITIES EXCHANGE ACT OF 1934
|
Commission File Number 001-35931
__________________________________________________________________________
Constellium SE
(Exact Name of Registrant as Specified in its Charter)
__________________________________________________________________________
Constellium SE
(Translation of Registrant’s name into English)
__________________________________________________________________________
France
(Jurisdiction of incorporation or organization)
__________________________________________________________________________
Washington Plaza,
40-44 rue Washington
75008 Paris, France
(Address of principal executive offices)
__________________________________________________________________________
Securities registered or to be registered pursuant to Section 12(b) of the Act.
|
Title of each class
|
Trading Symbol
|
Name of each exchange on which registered
|
||
|
Ordinary Shares
|
CSTM
|
New York Stock Exchange
|
||
Securities registered or to be registered pursuant to Section 12(g) of the Act:
None
Securities for which there is a reporting obligation pursuant to Section 15(d) of the Act:
None
_____________________________
Indicate the number of outstanding shares of each of the issuer’s classes of capital or common stock as of the period covered by the annual report:
137,867,418
Ordinary Shares, Nominal Value €0.02 per share
Indicate by check mark if the registrant is a well-known seasoned issuer, as defined in Rule 405 of the Securities Act.
x
Yes ☐ No
If this report is an annual or transition report, indicate by check mark if the registrant is not required to file reports pursuant to Section 13 or 15(d) of the Securities Exchange Act of 1934. ☐ Yes
x
No
Note—Checking the box above will not relieve any registrant required to file reports pursuant to Section 13 or 15(d) of the Securities Exchange Act of 1934 from their obligations under those Sections.
Indicate by check mark whether the registrant (1) has filed all reports required to be filed by Section 13 or 15(d) of the Securities Exchange Act of 1934 during the preceding 12 months (or for such shorter period that the registrant was required to file such reports), and (2) has been subject to such filing requirements for the past 90 days.
x
Yes ☐ No
Indicate by check mark whether the registrant has submitted electronically every Interactive Data File required to be submitted pursuant to Rule 405 of Regulation S-T (§ 232.405 of this chapter) during the preceding 12 months (or for such shorter period that the registrant was required to submit such files).
x
Yes ☐ No
Indicate by check mark whether the registrant is a large accelerated filer, an accelerated filer, or a non-accelerated filer. See definition of “accelerated filer and large accelerated filer” in Rule 12b-2 of the Exchange Act. (Check one):
Large accelerated filer
x
Accelerated filer ☐ Non-accelerated filer ☐ Emerging growth company ☐
If an emerging growth company that prepares its financial statements in accordance with U.S. GAAP, indicate by check mark if the registrant has elected not to use the extended transition period for complying with any new or revised financial accounting standards provided pursuant to Section 13(a) of the Exchange Act. ☐
† The term “new or revised financial accounting standard” refers to any update issued by the Financial Accounting Standards Board to its Accounting Standards Codification after April 5, 2012.
Indicate by check mark which basis of accounting the registrant has used to prepare the financial statements included in this filing:
|
U.S. GAAP ☐
|
International Financial Reporting Standards as issued by the
International Accounting Standards Board
x
|
Other ☐
|
||
If “Other” has been checked in response to the previous question, indicate by check mark which financial statement item the registrant has elected to follow: Item 17 ☐ Item 18 ☐
If this is an annual report, indicate by check mark whether the registrant is a shell company (as defined in Rule 12b-2 of the Exchange Act). ☐ Yes
x
No
TABLE OF CONTENTS
|
Page
|
|
-
i
-
SPECIAL NOTE ABOUT FORWARD-LOOKING STATEMENTS
This annual report on Form 20-F (this “Annual Report”) of Constellium SE ("Constellium" or "the Company", and when referred to together with its subsidiaries, "the Group") contains “forward-looking statements” with respect to our business, results of operations and financial condition, and our expectations or beliefs concerning future events and conditions. You can identify certain forward-looking statements because they contain words such as, but not limited to, “believes,” “expects,” “may,” “should,” “approximately,” “anticipates,” “estimates,” “intends,” “plans,” “targets,” “likely,” “will,” “would,” “could” and similar expressions (or the negative of these terminologies or expressions). All forward-looking statements involve risks and uncertainties. Many risks and uncertainties are inherent in our industry and markets. Others are more specific to our business and operations. The occurrence of the events described and the achievement of the expected results depend on many events, some or all of which are not predictable or within our control. Actual results may differ materially from the forward-looking statements contained in this Annual Report.
Important factors that could cause actual results to differ materially from those expressed or implied by the forward-looking statements are disclosed under “Item 3. Key Information—D. Risk Factors” and elsewhere in this Annual Report, including, without limitation, in conjunction with the forward-looking statements included in this Annual Report. All forward-looking statements in this Annual Report and subsequent written and oral forward-looking statements attributable to us, or persons acting on our behalf, are expressly qualified in their entirety by the cautionary statements. Some of the factors that we believe could materially affect our results include:
|
•
|
We may not be able to compete successfully in the highly competitive markets in which we operate, and new competitors could emerge, which could negatively impact our share of industry sales, sales volumes and selling prices.
|
|
•
|
Aluminium may become less competitive with alternative materials, which could reduce our sales volumes, or lower our selling prices.
|
|
•
|
A significant portion of our revenue is derived from international operations, which exposes us to certain risks inherent in doing business globally.
|
|
•
|
The cyclical and seasonal nature of the metals industry, our end-use markets and our customers’ industries could adversely affect our financial condition and results of operations.
|
|
•
|
If we fail to implement or execute our business strategy, our financial condition and results of operations could be materially adversely affected.
|
|
•
|
Our failure to meet customer manufacturing and quality requirements, standards and demand, or changing market conditions could have a material adverse impact on our business, reputation and financial results.
|
|
•
|
We are dependent on a limited number of customers for a substantial portion of our sales and a failure to successfully renew or renegotiate our agreements with such customers may adversely affect our results of operations, financial condition and cash flows.
|
|
•
|
If we are unable to substantially pass on to our customers the cost of price increases of our raw materials, which may be subject to volatility, our profitability could be adversely affected.
|
|
•
|
We are dependent on a limited number of suppliers for a substantial portion of our aluminium supply and a failure to successfully renew or renegotiate our agreements with our suppliers may adversely affect our results of operations, financial condition and cash flows.
|
|
•
|
The price volatility of energy costs may adversely affect our profitability.
|
|
•
|
Disruptions or failures in our IT systems, or failure to protect our IT systems against cyber-attacks or information security breaches, could have a material adverse effect on our business and financial results.
|
|
•
|
The loss of certain key members of our management team may have a material adverse effect on our operating results.
|
|
•
|
Our level of indebtedness could limit cash flow available for our operations and capital expenditures and could adversely affect our net income, our ability to service our debt or obtain additional financing, and our business relationships.
|
|
•
|
We are a foreign private issuer under the U.S. securities laws and within the meaning of the New York Stock Exchange (“NYSE”) rules. As a result, we qualify for and rely on exemptions from certain corporate governance requirements and may rely on other exemptions available to us in the future.
|
|
•
|
Any inability of the Company to continue to benefit from French provisions applicable to registered intermediaries (“
intermédiaires inscrits
”) could adversely affect the rights of shareholders.
|
|
•
|
The other factors presented under “Item 3. Key Information-D. Risk Factors.”
|
-
ii
-
We caution you that the foregoing list may not contain all of the factors that are important to you. In addition, in light of these risks and uncertainties, the matters referred to in the forward-looking statements contained in this Annual Report may not in fact occur. We undertake no obligation to publicly update or revise any forward-looking statement as a result of new information, future events or otherwise, except as required by law.
-
iii
-
Not applicable.
Not applicable.
|
A.
|
Selected Financial Data
|
The following tables set forth our selected historical financial and operating data.
The selected historical financial information as of December 31, 2019 and 2018 and for each of the three years in the period ended December 31, 2019 has been derived from our audited consolidated financial statements (the “Consolidated Financial Statements”) included elsewhere in this Annual Report. The selected historical financial information as of December 31, 2017, 2016 and 2015 and for each of the two years in the period ended December 31, 2016 have been derived from our audited consolidated financial statements not included in this Annual Report.
The audited Consolidated Financial Statements included elsewhere in this Annual Report have been prepared in a manner that complies, in all material respects, with the International Financial Reporting Standards (“IFRS”), as issued by the International Accounting Standards Board (the “IASB”), and as endorsed by the European Union (“EU”).
References to “tons” throughout this Annual Report are to metric tons.
|
As of and for the year ended
December 31,
|
|||||||||||||||
|
(€ in millions other than per share and per ton data)
|
2019
|
2018
|
2017
|
2016
|
2015
|
||||||||||
|
Statement of income data:
|
|||||||||||||||
|
Revenue
|
5,907
|
|
5,686
|
|
5,237
|
|
4,743
|
|
5,153
|
|
|||||
|
Gross profit
|
602
|
|
538
|
|
555
|
|
535
|
|
468
|
|
|||||
|
Income / (Loss) from operations
|
255
|
|
404
|
|
338
|
|
267
|
|
(406
|
)
|
|||||
|
Net income / (loss) for the period
|
64
|
|
190
|
|
(31
|
)
|
(4
|
)
|
(552
|
)
|
|||||
|
Earnings / (loss) per share—basic
|
0.43
|
|
1.40
|
|
(0.28
|
)
|
(0.04
|
)
|
(5.27
|
)
|
|||||
|
Earnings / (loss) per share—diluted
|
0.41
|
|
1.37
|
|
(0.28
|
)
|
(0.04
|
)
|
(5.27
|
)
|
|||||
|
Weighted average number of shares outstanding (diluted)
|
142,645,619
|
|
138,145,914
|
|
110,164,320
|
|
105,500,327
|
|
105,097,442
|
|
|||||
|
Dividends per ordinary share (Euro)
|
—
|
|
—
|
|
—
|
|
—
|
|
—
|
|
|||||
-
1
-
|
As of and for the year ended
December 31,
|
|||||||||||||||
|
(€ in millions other than per share and per ton data)
|
2019
|
2018
|
2017
|
2016
|
2015
|
||||||||||
|
Balance sheet data:
|
|||||||||||||||
|
Total assets
|
4,184
|
|
3,901
|
|
3,711
|
|
3,787
|
|
3,628
|
|
|||||
|
Net (liabilities)/assets or total invested equity
|
(85
|
)
|
(114
|
)
|
(319
|
)
|
(570
|
)
|
(540
|
)
|
|||||
|
Share capital
|
3
|
|
3
|
|
3
|
|
2
|
|
2
|
|
|||||
|
Other operational and financial data (unaudited):
|
|||||||||||||||
|
Capital expenditure
(1)
|
271
|
|
277
|
|
276
|
|
355
|
|
350
|
|
|||||
|
Volumes (in kt)
|
1,589
|
|
1,534
|
|
1,482
|
|
1,470
|
|
1,478
|
|
|||||
|
Revenue per ton (€ per ton)
|
3,717
|
|
3,707
|
|
3,534
|
|
3,227
|
|
3,486
|
|
|||||
__________________
|
(1)
|
Represents purchases of property, plant, and equipment.
|
|
B.
|
Capitalization and Indebtedness
|
Not applicable.
|
C.
|
Reasons for the Offer and Use of Proceeds
|
Not applicable.
|
D.
|
Risk Factors
|
You should carefully consider the risks and uncertainties described below and the other information in this Annual Report. Our business, financial condition or results of operations could be materially and adversely affected if any of these risks occurs, and as a result, the market price of our outstanding securities could decline. This Annual Report also contains forward-looking statements that involve risks and uncertainties. See “Special Note About Forward-Looking Statements.” Our actual results could differ materially and adversely from those anticipated in these forward-looking statements as a result of certain factors.
BUSINESS AND OPERATIONAL RISKS
We may not be able to compete successfully in the highly competitive markets in which we operate, and new competitors could emerge, which could negatively impact our share of industry sales, sales volumes and selling prices.
We are engaged in a highly competitive industry and compete in the production and sale of rolled and extruded aluminium products with a number of other producers, some of which are larger and have greater financial and technical resources than we do. As a result, these competitors may have an advantage over us in their abilities to research and develop technology, pursue acquisition, investment and other business opportunities, market and sell their products and services, capitalize on market opportunities, enter new markets and withstand business interruptions, pricing reductions, or adverse industry or economic conditions. In addition, producers with a lower cost basis may, in certain circumstances, have a competitive pricing advantage. Further, a current or new competitor may add or build new capacity, which could diminish our profitability by decreasing prices in our markets. New competitors could emerge within aluminium, steel or other materials, that may seek to compete in our industry. Emerging or transitioning markets in regions with abundant natural resources, low-cost labor and energy, and lower environmental and other standards may pose a significant competitive threat to our business. Moreover, technological innovation is important to our customers who require us to lead or keep pace with new innovations to address their needs. If we do not compete successfully, our share of industry sales, sales volumes and selling prices may be
-
2
-
negatively impacted. Changes in regulation that have a disproportionately negative effect on us or our methods of production may also diminish our competitive advantage and industry position.
Aluminium may become less competitive with alternative materials, which could reduce our sales volumes, or lower our selling prices.
Our products compete with products made from other materials-such as steel, glass, plastics and composite materials-for various applications. Higher aluminium prices relative to substitute materials tend to make aluminium products less competitive with these alternative materials. Environmental and other regulations may also make our products less competitive as compared to materials that are subject to fewer regulations. Customers in our end-markets use and continue to evaluate the further use of alternative materials to aluminium in order to reduce the weight and increase the efficiency of their products. In addition, consumer demand and preferences also impact customer selection of packaging materials. While we believe that the recyclability of aluminium, coupled with increasing consumer focus on resource conservation, may reduce the impact of competition from certain alternative packaging sources, there is no guarantee that such competition will be reduced. The willingness of customers to accept substitutions for aluminium, or the ability of large customers to exert leverage in the market to reduce the pricing for our aluminium products, could materially adversely affect our financial position, results of operations and cash flows.
A significant portion of our revenue is derived from international operations, which exposes us to certain risks inherent in doing business globally.
We are a global company with our principal headquarters in Paris, France, with operations in France, the United States, Germany, Switzerland, the Czech Republic, Slovakia, China, Spain, Canada and Mexico, and we sell our products across Europe, North America and Asia. Economic downturns in regional and global economies, or a prolonged recession in our principal industry segments, have had a negative impact on our operations in the past by reducing overall demand of our products, and could have a negative impact on our future financial condition or results of operations.
We also continue to explore opportunities to expand our international operations. We generally are subject to financial, political, economic, regulatory and business risks in connection with our global operations, including:
|
•
|
changes in international governmental regulations, trade restrictions and laws, including those relating to taxes, employment and repatriation of earnings;
|
|
•
|
compliance with sanctions regimes and export control laws of multiple jurisdictions;
|
|
•
|
currency exchange rate fluctuations;
|
|
•
|
tariffs and other trade barriers;
|
|
•
|
the potential for nationalization of enterprises or government policies favoring local production;
|
|
•
|
renegotiation or nullification of existing agreements;
|
|
•
|
interest rate fluctuations;
|
|
•
|
high rates of inflation;
|
|
•
|
currency restrictions and limitations on repatriation of profits;
|
|
•
|
differing protections for intellectual property and enforcement thereof;
|
|
•
|
divergent environmental laws and regulations;
|
|
•
|
uncertain political and regulatory conditions (e.g. U.K. Brexit; U.S. duties, tariffs and trade negotiations);
|
|
•
|
sustained economic downturns, social instability; and
|
|
•
|
significant supply/demand imbalances impacting our industry.
|
In addition, public health crises, pandemics and epidemics, such as the outbreak of the contagious 2019-Novel Coronavirus (COVID-19), could have a material adverse effect on global, national and local economies, on the markets in which we operate, and on our business operations and financial results.
The occurrence of any of these events could cause our costs to rise, limit growth opportunities or have a negative effect on our operations and our ability to plan for future periods. In certain emerging markets, the degree of these risks may be higher due to more volatile economic conditions, less developed and predictable legal and regulatory regimes and increased potential for various types of adverse governmental action.
-
3
-
The cyclical and seasonal nature of the metals industry, our end-use markets and our customers’ industries could adversely affect our financial condition and results of operations.
Our end markets are cyclical and tend to directly correlate with changes in general and local economic conditions. These conditions include the level of economic growth, financing availability, the availability of affordable energy sources, employment levels, interest rates, consumer confidence and housing demand. We are particularly sensitive to cycles in the aerospace, defense, automotive, other transportation and general engineering end-markets, which are highly cyclical. During recessions or periods of low growth, these industries typically experience major cutbacks in production, resulting in decreased demand for aluminium products. This leads to significant fluctuations in demand and pricing for our products and services. Because our operations are capital intensive and we generally have high fixed costs and may not be able to reduce costs and production capacity on a sufficiently rapid basis, our near-term profitability may be significantly affected by decreased processing volumes. Customer demand is also affected by holiday seasons, seasonal slowdowns, weather conditions, economic and other factors beyond our control. Accordingly, cyclical fluctuations, reduced demand and pricing pressures may significantly reduce our profitability and materially adversely affect our financial condition, results of operations and cash flows.
Our business requires substantial capital investments that we may be unable to fulfill. We may be unable to execute and timely complete our expected capital investments, or may be unable to achieve the anticipated benefits of such investments.
Our operations are capital intensive. We may not generate sufficient operating cash flows and our external financing sources may not be available in sufficient amounts to enable us to make anticipated capital expenditures, or to complete them on a timely basis. If we are unable to, or determine not to, complete our expected investments, or such investments are delayed, we will not realize the anticipated benefits of such investments. In addition, if we are unable to make investments for upgrades, repairs or purchase new plants and equipment, our financial condition and results of operations could be materially adversely affected by higher maintenance costs, lower sales volumes due to the impact of reduced product quality, operational disruptions, reduced production capacity and other competitive factors. We may experience delays in materializing demand for our products, and we may not receive customer orders or revenue for such products as quickly as we may anticipate. Such delays could adversely affect our results of operations.
If we fail to implement or execute our business strategy, our financial condition and results of operations could be materially adversely affected.
Our future financial performance and success depend in large part on our ability to successfully implement and execute our business strategy, including investing in high-return opportunities in our core markets, focusing on higher-margin, technologically advanced products, differentiating our products, expanding our strategic relationships with customers, fixed-cost containment and cash management, and executing on our manufacturing productivity improvement programs. Any inability to execute on our strategy could reduce our expected earnings and could adversely affect our operations overall.
In January 2019
,
we purchased UACJ Corporation’s ("UACJ") indirectly held stake in Constellium-UACJ ABS, LLC, our joint venture with UACJ to manufacture Auto Body Sheet ("ABS") products in the United States. Following the completion of this transaction, we refer to this facility as Bowling Green. There can be no assurance that we will be able to successfully implement our business strategy with respect to the North American ABS market.
Bowling Green’s automotive line continues to ramp up production for original equipment manufacturer (“OEM”) products and our Muscle Shoals facility will continue to supply an increasing share of the cold coil needs at Bowling Green. Any significant delays incurred during the supply and production ramp up, could be detrimental to our financial performance and could adversely affect our North American ABS strategy. Similarly, we may not realize the intended benefits of the acquisition of Bowling Green, as rapidly as, or to the extent, anticipated by our management, which could have a material adverse effect on our business, results of operations and financial condition.
We may also not be able to successfully develop and implement new technology initiatives and other strategic investments in a timely manner.
Being at the forefront of technological development is important to remain competitive. We have invested in, and are involved with, a number of technology and process initiatives. Several technical aspects of certain of these initiatives are still unproven and/or the eventual commercial outcomes and feasibility cannot be assessed with any certainty. Even if we are successful with these initiatives, we may not be able to bring them to market as planned before our competitors or at all, and the initiatives may end up costing more than expected. As a result, the costs and benefits from our investments in new technologies and the impact on our financial results may vary from present expectations. In addition, we have undertaken and may continue
-
4
-
to undertake growth, streamlining and productivity initiatives to improve performance. We cannot assure you that these initiatives will be completed or that they will have their intended benefits. Capital investments in debottlenecking or other organic growth initiatives may not produce the returns we anticipate. Even if we are able to generate new efficiencies successfully in the short- to medium-term, we may not be able to continue to reduce cost and increase productivity over the long term.
Our failure to meet customer manufacturing and quality requirements, standards and demand, or changing market conditions could have a material adverse impact on our business, reputation and financial results
.
Product manufacturing in our business is a highly complex process. Our customers specify quality, performance and reliability standards that we must meet. If our products do not meet these standards or are defective, we may be required to replace or rework the products. We have experienced product quality, performance or reliability problems and defects from time to time and similar defects or failures may occur in the future.
Some additional factors that could adversely impact our ability to meet our customer requirements and demand, or changing market conditions include:
|
•
|
Meeting such demand may require us to make substantial capital investments to repair, maintain, upgrade, and expand our facilities and equipment. Notwithstanding our ongoing plans and investments to increase our capacity, we may not be able to expand our production capacity quickly enough to meet our customer requirements.
|
|
•
|
Our operations may experience unplanned business interruptions caused by events such as explosions, fires, inclement weather, natural disasters, accidents, equipment failure and breakdown, IT systems and process failures, electrical blackouts or outages, transportation and supply interruptions. Any such disruption at one or more of our production facilities could cause substantial losses or delays in our production capacity, increase our operating costs and have a negative financial impact on the Company and our customers. Business interruptions may also harm our reputation among actual and potential customers, and the reputation of our customers.
|
|
•
|
The qualification of our products by many of our customers can be lengthy and unpredictable as many of these customers have extensive sourcing and qualification processes, which require substantial time and financial resources, with no certainty of success or recovery of our related expenses. Failure to qualify or re-qualify our products may result in us losing such customers or customer contracts.
|
|
•
|
As we begin manufacturing processes in our new locations or for newly introduced products, we may experience difficulties, including operational and manufacturing disruptions, delays or other complications, which could adversely affect our ability to timely launch or ramp-up productions and serve our customers.
|
If these or any other similar manufacturing or quality failures occur, they could result in losses or product recalls, customer penalties, contract cancellation and product liability exposure. Further, they could adversely affect product demand, result in negative publicity, damage to our reputation and could lead to a loss of customer confidence in our products, which could have a material adverse impact on our business, financial position and results of operations.
We are dependent on a limited number of customers for a substantial portion of our sales and a failure to successfully renew or renegotiate our agreements with such customers may adversely affect our results of operations, financial condition and cash flows.
Our business is exposed to customer concentration risk. A significant downturn in the business, credit or financial condition of our largest customers could expose us to the risk of default on contractual agreements.
Some of our customer contracts and related arrangements have provisions that may become less favorable to us over time, are subject to renewal, renegotiation or re-pricing at periodic intervals or upon changes in competitive and regulatory supply conditions, or provide termination rights to our customers. If we fail to successfully renew or renegotiate these contracts or arrangements, or if we are not successful in replacing business lost from such customers, then our results of operations, financial condition and cash flows could be materially adversely affected. Any material deterioration in, or termination of, these customer relationships could result in a reduction or loss in sales volume or revenue which could materially adversely affect our results of operations, financial condition and cash flows.
Relatedly, we have dedicated facilities serving certain of our customers which subjects us to the inherent risk of increased dependence on such customers with respect to these facilities. In such cases, the loss of such a customer, or the reduction of that customer’s business at these facilities, or the deterioration of such customer’s credit or financial condition, could materially adversely affect our financial condition and results of operations, and we may be unable to timely replace, or replace at all, lost order volumes and revenue.
-
5
-
Customers in our end-markets, including the packaging, aerospace and automotive sectors, may consolidate and grow in a manner that could affect their relationships with us. For example, if one of our competitors’ customers acquires any of our customers, we may lose that acquired customer’s business. Additionally, if our customers become larger and more concentrated, they could exert financial pressure on all suppliers, including us. Accordingly, our ability to maintain or raise prices in the future may be limited, including during periods of raw material and other cost increases. If we are forced to reduce prices or maintain prices during periods of increased costs, or if we lose customers because of consolidation, pricing or other methods of competition, our financial position, results of operations and cash flows may be adversely affected. If as a result of consolidation in our industry, our competitors are able to exert financial pressure on suppliers, obtain more favorable terms or otherwise take actions that could increase their competitive strengths, our competitive position may be materially adversely affected.
If we are unable to substantially pass on to our customers the cost of price increases of our raw materials, which may be subject to volatility, our profitability could be adversely affected.
Prices for the raw materials we require are subject to continuous volatility and may increase from time to time. The overall price of primary aluminium consists of several components: (1) the underlying base metal component, which is typically based on quoted prices from the London Metal Exchange (“LME”); (2) the regional premium, which represents an incremental price over the base LME component that is associated with the physical delivery of metal to a particular region (e.g., the Midwest premium for metal sold in the United States or the Rotterdam premium for metal sold in Europe); and (3) the product premium, which represents a separate incremental price for receiving physical metal in a particular shape (e.g., billet, slab, rod, etc.), alloy, or purity.
Each of these three components has its own drivers of variability. The LME price is typically driven by macroeconomic factors, including the global supply and demand of aluminium. Regional premiums tend to vary based on the supply and demand for metal in a particular region, changes in tariffs and associated warehousing and transportation costs. Product premiums generally are a function of supply and demand as well as production and raw material costs for a given primary aluminium shape and alloy combination in a particular region.
Sustained high aluminium prices, increases in aluminium prices, the inability to meaningfully hedge our exposure to aluminium prices, or the inability to pass through any fluctuation in regional premiums or product premiums to our customers, could have a material adverse effect on our business, financial condition, and results of operations and cash flow.
In addition, although our sales are generally made on a “margin over metal price” basis, if metal prices increase, we may not be able to pass on the entire increase to our customers. There could also be a time lag between when changes in metal prices under our purchase contracts are effective and the point when we can implement corresponding changes under our sales contracts with our customers. As a result, we may be exposed to the effects of fluctuations in raw material prices, including metal, due to time lag. Further, although most of our contracts allow us to substantially pass through metal prices to our customers, we have certain contracts that are based on fixed metal pricing, where pass through is not available. Similarly, in certain contracts we have ineffective pass through mechanisms related to regional premium fluctuation. We attempt to mitigate these risks, through hedging, but we may not be able to successfully reduce or eliminate any resulting impact, which could have a material adverse effect on our financial results and cash flows.
We are dependent on a limited number of suppliers for a substantial portion of our aluminium supply and a failure to successfully renew or renegotiate our agreements with our suppliers may adversely affect our results of operations, financial condition and cash flows.
Our ability to produce competitively priced aluminium products depends on our ability to procure competitively priced supply of aluminium in a timely manner and in sufficient quantities to meet our production needs. We have supply arrangements with a limited number of suppliers for aluminium. Increasing aluminium demand levels have caused regional supply constraints in the industry, and further increases in demand could exacerbate these issues. We maintain long-term contracts for a majority of our supply requirements and depend on annual and spot purchases for the remainder of such requirements. There can be no assurance that we will be able to renew, or obtain replacements for, such contracts when they expire on terms that are as favorable as our existing agreements or at all. Additionally, if any of our key suppliers is unable to deliver sufficient quantities on a timely basis, our production may be disrupted, and we could be forced to purchase primary metal from alternative sources, which may not be available in sufficient quantities or may only be available on terms that are less favorable to us. An interruption in key supplies required for our operations could have a material adverse effect on our ability to produce and deliver products on a timely or cost-efficient basis and therefore on our financial condition, results of operations and cash flows. Moreover, a significant downturn in the business or financial condition of our significant suppliers exposes us to the risk of default by the supplier on our contractual agreements.
-
6
-
We depend on scrap aluminium for our operations and acquire our scrap inventory from numerous sources. Our suppliers generally are not bound by long-term contracts and have no obligation to sell scrap metal to us. In periods of low prices, suppliers may elect to hold scrap until they are able to charge higher prices. In addition, a decrease in the supply of used beverage containers could negatively impact our supply of aluminium. We seek to take advantage of the lower price of scrap aluminium compared to primary aluminium to provide a cost-competitive product. To the extent the discount between the primary aluminium price and scrap price narrows, our competitive advantage may be reduced. Consequently, if the difference between the price of primary and scrap aluminium is narrow for a considerable period of time or if an adequate supply of scrap aluminium is not available to us, we would be unable to recycle metals at desired volumes and our results of operations, financial condition and cash flows could be materially adversely affected.
The price volatility of energy costs may adversely affect our profitability.
Our operations use natural gas and electricity, which, excluding depreciation, represent the third largest component of our cost of sales, after metal and labor costs. We purchase part of our natural gas and electricity on a market basis. The volatility in costs of fuel, principally natural gas, and other utility services, principally electricity, used by our production facilities affects operating costs. Fuel and utility prices are affected by factors outside our control, such as supply and demand for fuel and utility services in both local and regional markets as well as governmental regulation and imposition of taxes on energy. As a significant purchaser of energy, existing and future regulations relating to the emissions by our energy suppliers could result in materially increased energy costs for our operations, which we may be unable to pass along to our customers. Although we have secured a large part of our natural gas and electricity under fixed price commitments or long-term contracts with suppliers, future increases in fuel and utility prices, or disruptions in energy supply, may have an adverse effect on our financial position, results of operations and cash flows.
Disruptions or failures in our IT systems, or failure to protect our IT systems against cyber-attacks or information security breaches, could have a material adverse effect on our business and financial results.
We rely on our IT systems to effectively manage and operate our business, including such processes as data, accounting, financial reporting, communications, supply chain, order entry and fulfillment, other business processes, and in operating our equipment. The failure of our IT systems to perform efficiently could disrupt our business and could result in transaction errors, processing inefficiencies, limited equipment utilization, and the loss of sales and customers, causing our business and financial results to suffer. A failure in, or breach of, our IT systems as a result of cyber-attacks or information security breaches could disrupt our business, result in the disclosure or misuse of confidential or proprietary information, damage our reputation, increase our costs or cause losses. As cyber threats continue to evolve, we are expending additional resources to continue to enhance our information security measures and be able to investigate and remediate promptly any information security vulnerabilities. We experienced a few security incidents in 2019, but they were successfully detected and handled and did not have a material negative impact on the Company, our business or our operations.
We continue to make investments and adopt measures designed to enhance our protection, detection, response, and recovery capabilities, and to mitigate potential risks to our technology, products, services and operations from potential cyber-attacks. However, given the unpredictability, nature and scope of cyber-attacks, it is possible that potential vulnerabilities could go undetected for an extended period. We could potentially be subject to production downtime, operational delays, other detrimental impacts on our operations or ability to provide products and services to our customers, the compromise of confidential or otherwise protected information, misappropriation, destruction or corruption of data, security breaches, other manipulation or improper use of our or third-party systems, networks or products, financial losses from remedial actions, loss of business or potential liability, and/or damage to our reputation, any of which could have a material adverse effect on our competitive position, results of operations, cash flows or financial condition.
Some of our IT systems are nearing obsolescence, in that the software versions they were developed on are no longer fully supported or kept up-to-date by the original vendors. While day-to-day operations are not at risk, any major new compliance requirements might need manual workarounds if the current software versions do not support those new functionalities. Information security risks have increased in recent years because of the proliferation of new technologies and the increased sophistication and activities of perpetrators of cyber-attacks. We continuously perform an evaluation of our IT systems and requirements and have implemented or plan to implement upgrades to our IT systems that support our business. These upgrades involve replacing legacy systems with state-of-the-art systems, making changes to such systems or acquiring new systems with new functionality. There are inherent risks associated with replacing, changing or acquiring new systems, including accurately capturing data and system disruptions. We may experience operational disruptions with our information systems as a result of system failures, viruses, computer “hackers” or other causes. Any material disruption or slowdown of our systems, including a disruption or slowdown caused by our failure to successfully upgrade our systems could cause information
-
7
-
losses, including data related to customer orders, limited utilization of our equipment, or operational outages. Such a disruption could adversely affect our business, financial condition or results of operations.
We could be required to make unexpected contributions to our defined benefit pension plans as a result of adverse changes in interest rates and the capital markets.
We have substantial pension and other post-employment benefit obligations. Most of our pension obligations relate to funded defined benefit pension plans for our employees in the United States and Switzerland, unfunded pension benefits in France and Germany, and lump sum indemnities payable to our employees in France and Germany upon retirement or termination. Our pension plan assets consist primarily of funds invested in diversified portfolios. Our estimates of liabilities and expenses for pensions and other post-retirement benefits incorporate a number of assumptions, including interest rates used to discount future benefits. Our liquidity or shareholders’ equity in a particular period could be materially adversely affected by capital market returns that are less than their assumed long-term rate of return or a decline in the rate used to discount future benefits. If the assets of our pension plans do not achieve assumed investment returns for any period, such deficiency could result in one or more charges against shareholders’ equity for that period. In addition, changing economic conditions, poor pension investment returns or other factors may require us to make unexpected cash contributions to the pension plans in the future, preventing the use of such cash for other purposes.
We also participate in various “multi-employer” pension plans in one of our facilities in the United States administered by labor unions representing some of our employees. Our withdrawal liability for any multi-employer plan would depend on the extent of the plan’s funding of vested benefits. In the ordinary course of our renegotiation of collective bargaining agreements with labor unions that maintain these plans, we could decide to discontinue participation in a plan, and in that event we could face a withdrawal liability. We could also be treated as withdrawing from participation in one of these plans if the number of our employees participating in these plans is reduced to a certain degree, or over certain periods of time. Such reductions in the number of our employees participating in these plans could occur as a result of changes in our business operations, such as facility closures or consolidations. Any withdrawal liability could have an adverse effect on our results of operations or financial condition.
We could experience labor disputes and work stoppages, or be unable to renegotiate collective bargaining agreements, which could disrupt our business and have a negative impact on our financial condition and results of operations.
A significant number of our employees are represented by unions or equivalent bodies or are covered by collective bargaining or similar agreements that are subject to periodic renegotiation. Although we believe that we will be able to successfully negotiate new collective bargaining agreements when the current agreements expire, these negotiations may not prove successful, and may result in a significant increase in the cost of labor, or may break down and result in the disruption or cessation of our operations.
From time to time, we may experience labor disputes and work stoppages at our facilities generally, and at times in connection with collective bargaining agreement negotiations. Reasons for stoppages include disapproval of governmental measures, solidarity with a dismissed employee, wage claims, protests against working conditions and/or strikes. These disruptions can have a duration ranging from hours to days. Existing collective bargaining agreements may not prevent a strike or work stoppage at our facilities. Any such stoppages or disturbances may adversely affect our financial condition and results of operations by limiting plant production, sales volumes, profitability and operating costs.
The loss of certain key members of our management team may have a material adverse effect on our operating results.
Our success depends, in part, on the efforts of our senior management and other key employees. These individuals, including our Chief Executive Officer and Chief Financial Officer, possess sales, marketing, engineering, technical, manufacturing, financial and administrative skills that are critical to the operation of our business. If we lose or suffer an extended interruption in the services of one or more of our senior officers or other key employees, our ability to operate and expand our business, improve our operations, develop new products, and, as a result, our financial condition and results of operations, may be adversely affected. Moreover, the hiring of qualified individuals is highly competitive in our industry, and we may not be able to attract and retain qualified personnel to replace or succeed members of our senior management or other key employees.
-
8
-
The insurance level that we maintain may not fully cover all potential exposures.
We maintain property, casualty, business interruption, workers’ compensation and other insurance in accordance with market practice and that are pertinent to our business, but such insurance may not fully cover all risks associated with the hazards of our business and is subject to limitations, including deductibles and maximum liabilities covered. We may incur losses beyond the limits, or outside the coverage, of our insurance policies, including, but not limited to, liabilities for breach of contract, environmental compliance or remediation. In addition, from time to time and depending on market conditions, various types of insurance coverage for companies in our industry may not be available on commercially acceptable terms or, in some cases, may not be available at all. In the future, we may not be able to obtain coverage at current levels, and our premiums may increase significantly on coverage that we maintain.
FINANCIAL RISKS
Our level of indebtedness could limit cash flow available for our operations and capital expenditures and could adversely affect our net income, our ability to service our debt or obtain additional financing, and our business relationships.
We have a significant amount of indebtedness. To service such debt, we will require a significant amount of cash. We believe that the cash provided by our operations will be sufficient to provide for our cash requirements for the foreseeable future. However, our ability to satisfy our obligations will depend on our future operating performance and financial results, which are subject, in part, to factors beyond our control, including interest rates and general economic, financial and business conditions. We cannot assure you that our business will generate sufficient cash flow from operations or that future borrowings will be available to us in an amount sufficient to enable us to pay our indebtedness or to fund our other liquidity needs.
In addition, our level of indebtedness could adversely affect our operations. Among other things, our substantial indebtedness could:
|
•
|
limit our ability to obtain additional financing for working capital, capital expenditures, research and development efforts, acquisitions and general corporate purposes;
|
|
•
|
make it more difficult for us to satisfy leverage and fixed charge coverage ratios required for us to incur additional indebtedness under our existing indebtedness;
|
|
•
|
make it more difficult for us to satisfy our financial obligations;
|
|
•
|
increase our vulnerability to general adverse economic and industry conditions;
|
|
•
|
require us to dedicate a substantial portion of our cash flow from operations to payments on our indebtedness, thereby reducing the availability of our cash flow to fund working capital, capital expenditures, research and development efforts and other general corporate purposes;
|
|
•
|
restrict us from making strategic acquisitions, introducing new technologies and exploiting business opportunities;
|
|
•
|
adversely affect the terms under which suppliers provide goods and services to us, and under which we supply products to our customers;
|
|
•
|
limit our flexibility in planning for, or reacting to, changes in our business and the markets in which we compete; and
|
|
•
|
place us at a competitive disadvantage compared to our competitors that have less debt.
|
If we are unable to meet our debt service obligations and pay our expenses, we may be forced to reduce or delay business activities and capital expenditures, sell assets, obtain additional debt or equity capital, restructure or refinance all or a portion of our debt before maturity or take other measures. Such measures may materially adversely affect our business. If these alternative measures are unsuccessful, we could default on our obligations, which could result in the acceleration of our outstanding debt obligations and could have a material adverse effect on our business, results of operations and financial condition.
A failure to comply with our debt covenants could result in an event of default. If we default under our indebtedness, we may not be able to borrow additional amounts, and our lenders could elect to declare all outstanding borrowings, plus accrued and unpaid interest and fees, to be due and payable, or take other remedial actions. Our indebtedness also contains cross-default provisions, which means that if an event of default occurs under certain material indebtedness, such event of default could
-
9
-
trigger an event of default under our other indebtedness. If our debt payments were to be accelerated, we cannot assure you that our assets would be sufficient to repay such debt in full and our lenders could consequently foreclose on our pledged assets.
In addition, a deterioration in our financial position or a downgrade of our credit ratings could adversely affect our financing levels, limit access to the capital or credit markets or our liquidity facilities, or otherwise adversely affect the availability of other new financing on favorable terms or at all, result in more restrictive covenants in agreements governing the terms of any future indebtedness that we incur, increase our borrowing costs, or otherwise impair our business, financial condition and results of operations. Such deterioration or downgrade of our credit ratings could also have an adverse effect on our business relationships with customers, suppliers and hedging counterparties.
Our results of operations, cash flows and liquidity could be adversely affected if we are unable to execute on our hedging policy, if counterparties to our derivative instruments fail to honor their agreements or if we are unable to enter into certain derivative instruments.
We purchase and sell forwards, futures and options contracts as part of our efforts to reduce our exposure to changes in currency exchange rates, aluminium prices and other raw materials and energy prices. If we are unable to enter into such derivative instruments to manage those risks due to the cost or availability of such instruments or other factors, or if we are not successful in passing through the costs of our risk management activities, our results of operations, cash flows and liquidity could be adversely affected. Our ability to realize the benefit of our hedging program is dependent upon many factors, including factors that are beyond our control. For example, our foreign exchange hedges are scheduled to mature on the expected payment date by the customer; therefore, if the customer fails to pay an invoice on time and does not warn us in advance, we may be unable to reschedule the maturity date of the foreign exchange hedge, which could result in an outflow of foreign currency that will not be offset until the customer makes the payment. We may realize a gain or a loss in unwinding such hedges. In addition, our metal-price hedging program depends on our ability to match our monthly exposure to sold and purchased metal, which can be made difficult by seasonal variations in metal demand, unplanned changes in metal delivery dates by either us or by our customers and other disruptions to our inventories. We may also be exposed to losses if the counterparties to our derivative instruments fail to honor their agreements.
To the extent our hedging transactions fix prices or exchange rates, and if primary aluminium prices, energy costs or foreign exchange rates are below the fixed prices or rates established by our hedging transactions, then our income and cash flows will be lower than they otherwise would have been. Similarly, if we do not effectively manage and adequately hedge our exposure to price and regional premium fluctuations on aluminium and other raw materials, our financial results may also be adversely affected. Further, with the exception of hedge accounting on certain long-term aerospace contracts and on our net investment in certain of our subsidiaries, we do not apply hedge accounting to our forwards, futures or option contracts. Unrealized gains and losses on our derivative financial instruments that do not qualify for hedge accounting are reported in our consolidated results of operations, or in the case of hedges relating to our indebtedness, in Finance cost, net. The inclusion of such unrealized gains and losses in earnings may produce significant period-over-period earnings volatility that is not necessarily reflective of our underlying operating performance. In addition, in certain scenarios when market price movements result in a decline in value of our current derivatives position, our mark-to-market expense may exceed our credit line and counterparties may request the posting of cash collateral which, in turn, can be a significant demand on our liquidity.
At certain times, hedging instruments may simply be unavailable or not available on terms acceptable to us. In addition, current legislation increases the regulatory oversight of over-the-counter derivatives markets and derivative transactions. The companies and transactions that are subject to these regulations may change. If future regulations subject us to additional capital or margin requirements or other restrictions on our trading and commodity positions, this could have an adverse effect on our financial condition and results of operations.
Our cash flows and liquidity could be adversely affected as a result of the maturity mismatch between certain of our derivative instruments and the underlying exposure.
We use financial derivatives to hedge the foreign currency risk associated with the repayment of a portion of our U.S. Dollar-denominated debt. These financial derivatives may have a shorter maturity than either the maturity or call date of the hedged debt instrument. This could result in an adverse impact on our cash flows and liquidity as the impact from changes in foreign exchange rates on the hedging instruments could result in a cash outflow before the corresponding favorable impact on the underlying hedged debt results in a positive cash flow.
-
10
-
Changes in income tax rates or income tax laws, additional income tax liabilities due to unfavorable resolution of tax audits, and challenges to our tax position could have a material adverse impact on our financial results.
We operate in multiple tax jurisdictions and believe that we file our tax returns in compliance with the tax laws and regulations of these jurisdictions. Various factors determine our effective tax rate and/or the amount we are required to pay, including changes in or interpretations of tax laws and regulations in any given jurisdiction or global- and EU-based initiatives. Some such tax laws and regulations aim, among other things, to address tax avoidance by multinational companies, changes in geographical allocation of income and expense, the ability to use net operating loss and other tax attributes, and the evaluation of deferred tax assets that requires significant judgment. Any resulting changes to our effective tax rate could materially adversely affect our financial position, liquidity, results of operations and cash flows.
In addition, due to the size and nature of our business, we are subject to ongoing reviews by tax authorities on various tax matters, including challenges to positions we assert on our income tax and withholding tax returns. We accrue income tax liabilities and tax contingencies based upon our best estimate of the taxes ultimately expected to be paid after considering our knowledge of all relevant facts and circumstances, existing tax laws and regulations and how the tax authorities and courts view certain issues. Such amounts are included in income taxes payable or deferred income tax liabilities, as appropriate, and updated over time. Any material adverse review could impact our financial position and result of operations.
LEGAL, GOVERNANCE AND COMPLIANCE RISKS
We may be exposed to significant legal proceedings and investigations, proprietary claims, regulatory and compliance costs, including on environmental matters, which could increase our operating costs and adversely affect our financial condition and results of operations.
We may from time-to-time be involved in, or be the subject of, disputes, proceedings and investigations with respect to a variety of matters, including matters related to personal injury and product liability, intellectual property rights or defending claims of infringement, employees, taxes, contracts, anti-competitive or anti-corruption practices as well as other disputes and proceedings that arise in the ordinary course of business. It could be costly to address these claims or any investigations involving them, whether meritorious or not, and legal proceedings and investigations could divert management’s attention as well as operational resources, adversely affecting our financial position, results of operations and cash flows.
If any of the products that we sell are defective or cause harm to any of our customers, we could be exposed to product liability lawsuits and/or warranty claims. If we were found liable under product liability claims or are obligated under warranty claims, we could be required to pay substantial monetary damages. Even if we successfully defend ourselves against these types of claims, we could incur substantial litigation expenses, our management could be required to devote significant time and attention to defending against these claims, and our reputation could suffer, any of which could harm our business.
We believe that our intellectual property has significant value and is important to the marketing of our products and maintaining our competitive advantage. Although we attempt to protect our intellectual property rights both in the United States and in foreign countries through a combination of patent, trademark, trade secret and copyright laws, as well as through confidentiality and nondisclosure agreements and other measures, these measures may not be adequate to fully protect our rights. For example, we have a presence in China, which historically has afforded less protection to intellectual property rights than the United States or Europe. Our failure to obtain or maintain adequate protection of our intellectual property rights for any reason could have a material adverse effect on our business, results of operations and financial condition, we therefore may incur significant costs protecting such rights. Our operations are subject to international, national, state and local laws and regulations in the jurisdictions where we do business, which govern, among other things, air emissions, wastewater discharges, the handling, storage and disposal of hazardous substances and wastes, the remediation of contaminated sites, and employee health and safety. At December 31, 2019, we had close-down and environmental remediation costs provisions of €90 million. Future environmental regulations, requirements or more aggressive enforcement of existing regulations could impose stricter compliance requirements on us and on the industries in which we operate, such as legislative efforts to limit greenhouse gas emissions, including carbon dioxide. If we are unable to comply with these laws and regulations, we could incur substantial costs, including fines and civil or criminal sanctions, or costs associated with upgrades to our facilities or changes in our manufacturing processes in order to achieve and maintain compliance.
-
11
-
We are a foreign private issuer under the U.S. securities laws and within the meaning of the New York Stock Exchange (“NYSE”) rules. As a result, we qualify for and rely on exemptions from certain corporate governance requirements and may rely on other exemptions available to us in the future.
As a “foreign private issuer,” as such term is defined in Rule 405 under the Securities Act of 1933, as amended (the “Securities Act”), we are permitted to follow our home country practice in lieu of certain corporate governance requirements of the NYSE. Foreign private issuers are also exempt from certain U.S. securities law requirements applicable to U.S. domestic issuers, including the requirement to file quarterly reports on Form 10-Q, to distribute a proxy statement pursuant to Section 14 of the Securities Exchange Act of 1934, as amended (the “Exchange Act”), in connection with the solicitation of proxies for shareholder meetings, and Section 16 filings.
We rely on the exemptions for foreign private issuers in lieu of some of the NYSE corporate governance rules. We may change the home country corporate governance practices we follow, and, accordingly, which exemptions we rely on from the NYSE requirements. So long as we qualify as a foreign private issuer, you may not have the same protections applicable to companies that are subject to all of the NYSE corporate governance requirements.
If we were to lose our status as a foreign private issuer or otherwise not be considered a foreign private issuer, the regulatory and compliance costs to the Company could be significantly more than the costs we incur as a foreign private issuer. We would be required to file periodic reports and registration statements on U.S. domestic issuer forms with the U.S. Securities and Exchange Commission ("the SEC"), including proxy statements pursuant to Section 14 of the Exchange Act, which are more detailed and extensive than the forms available to a foreign private issuer. Furthermore, if we were not a foreign private issuer, we would be required to meet such filing requirements on a more abbreviated timetable than is applicable to our current filings with the SEC. In addition, our directors, executive officers and 10% owners would become subject to insider short-swing profit disclosure and recovery rules under Section 16 of the Exchange Act. In addition, we would lose our ability to rely upon exemptions from certain NYSE corporate governance requirements that are available to foreign private issuers. Any of these changes would likely increase our regulatory and compliance costs and expenses, which could have a material adverse effect on our business, financial condition and results of operations.
In addition, we must meet other continuing listing requirements to maintain the listing of our ordinary shares on the NYSE. If we fail to meet certain NYSE listing standards, our ordinary shares may be subject to delisting unless any such non-compliance is remediated. There can be no assurance that our ordinary shares will remain listed on the NYSE. Any involuntary or voluntary delisting of our ordinary shares could adversely affect a shareholder’s ability to dispose, or obtain quotations as to the market value, of such shares and the market price and liquidity of such shares.
The Company may be required to appoint directors to its Board to represent employees.
If the number of permanent employees of the Company exceeds 1,000 (including its direct and indirect French subsidiaries) or 5,000 (including its direct and indirect subsidiaries worldwide) for two consecutive fiscal years following the completion of the Company's transfer of its corporate seat from the Netherlands to France, which occurred on December 12, 2019, the Board, if made up of more than eight directors, may be required to include two directors representing the employees. In such a case, the Company’s Articles of Association will be changed within six months following the end of the second year of the Company's transfer of its corporate seat to France to allow for such appointment of employees to serve in such director capacity and to indicate how they will be elected/appointed, choosing from among the methods available under French law involving election/appointment by employees, trade unions and/or works councils. The employee directors, if required, must be selected within six months following the aforementioned change in the Articles of Association.
While we do not anticipate any specific governance issues as a result of employee representation on our Board, we have not previously been subject to these requirements and cannot determine how or whether employee representation on our Board will affect our future governance or operations. Having directors representing employees may allow the interests of employees to be voiced and taken into account in Board discussions and decision-making, in addition to, and potentially in conflict with, the interests of shareholders.
Any shareholder acquiring 30% or more of our voting rights may be required to make a mandatory takeover bid or be subject to claims for damages.
According to the Articles of Association, any person, acting alone or in concert within the meaning of Article L. 233-10 of the French Commercial Code, who comes into possession, other than following a voluntary takeover bid, directly or indirectly, of more than 30% of the capital or voting rights of the Company, shall launch a takeover bid on all the shares and securities granting access to the shares or voting rights, and on terms that comply with applicable U.S. securities laws, and SEC and
-
12
-
NYSE rules and regulations. The same requirement applies to persons, acting alone or in concert, who directly or indirectly own a number between 30% and half of the total number of equity securities or voting rights of the Company and who, in less than twelve consecutive months, increase the holding, in capital or voting rights, of at least 1% of the total number of equity securities or voting rights of the Company.
Provisions of our organizational documents and applicable law may impede or discourage a takeover, which could deprive our investors of the opportunity to receive a premium for their ordinary shares or to make changes in our Board
.
Several provisions of the Articles of Association and the laws of France may discourage, delay or prevent a merger, consolidation or acquisition that shareholders may consider favorable, such as the obligation to disclose the crossing of ownership thresholds or the possibility for our Board to issue equity securities, including during a takeover bid. Under French law, our general meeting of shareholders may empower our Board to issue shares, or warrants to subscribe new shares, and restrict or exclude preemptive rights on those shares.
These provisions could impede the ability of our shareholders to benefit from a change in control and, as a result, may materially adversely affect the market price of our ordinary shares and your ability to realize any potential change of control premium.
The rights of our shareholders may be different from the rights of shareholders governed by the laws of U.S. jurisdictions.
Our corporate affairs are governed by the Articles of Association and by the laws governing companies incorporated in France. The rights of shareholders and the responsibilities of members of our Board may be different from the rights and obligations of shareholders in companies governed by the laws of U.S. jurisdictions. In the performance of its duties, our Board is required by French law to consider the interests of the Company, its shareholders, its employees and other stakeholders, in all cases with due consideration to the principles of reasonableness and fairness. It is possible that some of these parties could have interests that are different from, or in addition to, your interests as a shareholder.
Although shareholders have the right to approve legal mergers (
fusions
) or demergers (
scissions
), French law does not grant appraisal rights to a company’s shareholders who wish to challenge the consideration to be paid upon a domestic legal merger or demerger of a company.
In addition, if a third party is liable to a French company, under French law, shareholders generally do not have the right to bring a derivative action on behalf of a company or to bring an action on their own behalf to recover damages sustained as a result of a decrease in value, or loss of an increase in value, of their stock.
Only in the event that the cause of liability of such third party to the company also constitutes a tortious act directly against such shareholder causing him direct, personal and definite harm, may such shareholder have an individual right of action against such third party on its own behalf to recover damages.
The French Consumer Code provides for the possibility to initiate class actions (
actions en représentation conjointe
) to seek recovery for economic loss suffered by consumers due to one or more defendants’ breach of their legal or contractual obligations in the context of a sale of goods or provision of services or due to their infringement of competition law. However, such class action is not applicable to acts which can affect the rights of shareholders.
Approved associations of shareholders or investors are allowed to bring claims in respect of wrongful acts harming the “collective interest” of the investors or of certain categories of investors (Article L. 452-1 of the French Monetary and Financial Code). Such associations may request that the court orders the responsible person to comply with the legal provisions to end the irregularity or eliminate its effects. They may seek indemnification in the name of individual investors who have suffered individual damages if mandated by at least two such investors (Article L. 452-2 of the French Monetary and Financial Code).
The provisions of French corporate law and the Articles of Association have the effect of concentrating control over certain corporate decisions and transactions in the hands of our Board. As a result, holders of our shares may have more difficulty in protecting their interests in the face of actions by members of the Board than if we were incorporated in the United States.
-
13
-
United States civil liabilities may not be enforceable against the Company.
We are incorporated under the laws of France and a substantial portion of our assets are located outside the United States. In addition, certain of our directors and officers, and experts named herein, reside outside the United States. As a result, it may be difficult for investors to effect service of process within the United States upon the Company or other persons residing outside the United States. It may also be difficult to enforce judgments obtained against persons in U.S. courts in any action, including actions predicated upon the civil liability provisions of the U.S. federal securities laws, outside the United States. In addition, it may be difficult for investors to enforce, in original actions brought in courts in jurisdictions located outside the United States, rights predicated upon the U.S. federal securities laws.
There is no treaty between the United States and France for the mutual recognition and enforcement of judgments (other than arbitration awards) in civil and commercial matters. Therefore, a final judgment for the payment of money rendered by any federal or state court in the United States based on civil liability, whether or not predicated solely upon the U.S. federal securities laws, would not be enforceable in France unless it is recognized by French courts. Moreover, an SEC decision ordering the payment of a fine would not be enforceable in France as it constitutes a foreign decision of a public law authority. However, under current practice, the courts of France may be expected to recognize and enforce a U.S. judgment, provided that such judgment (i) is a final judgment and has been rendered by a court which has established its jurisdiction on the basis of internationally accepted grounds of jurisdiction, (ii) is not the result of a fraud, and (iii) complies with French international public policy. A U.S. judgment may be found to be contrary to French international public policy in various situations, for example, if the judgment has been rendered in violation of elementary principles of a fair trial and if the judgment is incompatible with (a) a prior judgment of a French court rendered in a dispute between the same parties, or (b) a prior judgment of a foreign court rendered in a dispute between the same parties, concerning the same subject matter and based on the same cause of action, provided that such prior judgement has been recognized in France.
If the U.S. judgment is not recognized in France, the parties would have to re-litigate their dispute before a French court, provided such court has jurisdiction over the dispute.
Based on the foregoing, there can be no assurance that U.S. investors will be able to enforce any judgments obtained in U.S. courts in civil and commercial matters, including judgments under the U.S. federal securities laws, against the Company, members of our Board, officers or certain experts named herein, who are residents of France or countries other than the United States.
In addition, there is doubt as to whether a French court would impose civil liability on the Company, the members of our Board, our officers or certain experts named herein in an original action predicated solely upon the U.S. federal securities laws brought in a court of competent jurisdiction in France against us or such members, officers or experts, respectively.
Any inability of the Company to continue to benefit from French provisions applicable to registered intermediaries (“
intermédiaires inscrits
”) could adversely affect the rights of shareholders.
The Pacte Act, which was adopted by the French Parliament in 2019, includes in its Article 198 an amendment to existing French law, that allows an intermediary to be registered for the account of holders of shares of companies which are admitted to trading solely on a market in a non-EU country that is considered equivalent to a regulated market pursuant to paragraph (a) of Article 25(4) of Directive EC2014/65/EU (which, pursuant to the European Commission decision dated December 13, 2017, includes the NYSE). Article 198 of the Pacte Act came into full force and effect on June 10, 2019 and allows us to maintain our current shareholder ownership structure in the United States.
We use a French registered intermediary for the account of our beneficial owners (the “French Intermediary”). If the French Intermediary fails to comply with the French provisions applicable to registered intermediaries (
intermédiaires inscrits
), and if we are unable to find an appropriate substitute, or if the European Commission decided to abrogate its decision and no longer considered the NYSE as equivalent to a regulated market as described above, we might not be able to comply with existing French laws regarding the holding of shares in the “
au porteur
” (bearer) form, and shares would have to be held in “
au nominatif
” (registered) form. In such a case, the Company would need to maintain at all times a register with the name of (and number of shares held by) each shareholder, which could adversely affect the rights of our shareholders, including potentially the right to exercise their voting rights as Company shareholders as only shareholders registered on the register held by the Company would be entitled to vote.
-
14
-
Transactions in our ordinary shares could be subject to the European financial transaction tax, if adopted.
On February 14, 2013, the European Commission adopted a proposal for a directive on a common financial transaction tax (the “FTT”) to be implemented under the enhanced cooperation procedure by several Member States (Austria, Belgium, France, Germany, Greece, Italy, Portugal, Slovenia, Slovakia and Spain (the “Participating Member States”). The proposed FTT has a very broad scope and could, if introduced in its current form, apply to certain dealings in our ordinary shares (including secondary market transactions) in certain circumstances. The mechanism by which the tax would be applied and collected is not yet known, but if the proposed directive or any similar tax is adopted, transactions in our ordinary shares would be subject to higher costs, and the liquidity of the market for our ordinary shares may be diminished.
Under the 2013 FTT proposal, the FTT could apply in certain circumstances to persons both within and outside of the Participating Member States. Generally, it would apply to certain dealings in our ordinary shares where at least one party is a financial institution, and at least one party is established in a Participating Member State. A financial institution may be, or be deemed to be, “established” in a Participating Member State in a broad range of circumstances, including (a) by transacting with a person established in a Participating Member State, or (b) where the financial instrument which is subject to the dealings is issued in a Participating Member State.
However, the FTT proposal remains subject to negotiation between the Participating Member States. It may therefore still be altered prior to any implementation, the timing of which remains unclear. Additional EU Member States may decide to participate and/or certain of the Participating Member States may decide to withdraw. Prospective holders of our ordinary shares are advised to seek their own professional advice in relation to the consequences of the FTT.
In the case where dividends are paid by our Company, it is uncertain whether our shareholders will actually obtain the elimination or reduction of the French domestic dividend withholding tax to which they are entitled.
General comments on the French withholding tax treatment of dividends paid on our ordinary shares are set out under section “Item 10. Additional Information - E - Taxation - French Withholding Tax Treatment of Dividends Distributed by the Company” herein.
In accordance with domestic or double tax treaty provisions, shareholders may be entitled to an elimination or reduction of the default French withholding tax on dividends distributed by the Company (
i.e.
, 30% or 75% in the case where the dividends are paid in non-cooperative States or territories within the meaning of article 238-0 A 1, 2 and 2 bis-1° of the French tax code , subject to the French paying agent of the dividends being provided with the required information and documentation relating to the tax status of the shareholders.
Numerous intermediaries would be involved in the process of transmitting the relevant information and documentation from our shareholders to the French paying agent in case of distribution of dividends by the Company. As a result, this process may potentially jeopardize the ability for our shareholders to obtain the elimination or reduction of French withholding tax to which they are entitled.
The French Ruling could be revoked if the description and legal analysis of the holding structure of the shares of the Company after the completion of the Transfer was inaccurate.
The various confirmations obtained from the French tax authorities on October 11, 2019 (the “French Ruling”) (set forth under section “Item 10. Additional Information - E - Taxation” below) are based on the description and legal analysis of the holding structure of the shares of the Company made by the Company to the French tax authorities in its ruling request. If the French tax authorities were to consider that the description or legal analysis in the ruling request with regards to the holding structure of the shares of the Company is inaccurate, notably to the extent that such description and analysis are based on US securities law notions that are foreign to French law, the French tax authorities could decide to revoke the French ruling and such decision could have adverse tax consequences to our shareholders.
-
15
-
Purchases of our ordinary shares could be subject to the French financial transaction tax, if the NYSE were to be formally recognized as a foreign regulated market by the French Financial Market Authority or the applicable provisions of the French tax code are amended.
Pursuant to Article 235 ter ZD of the French tax code, purchases of equity instruments or similar securities of a French company listed on a regulated market of the EU or on a foreign regulated market formally recognized as such by the French Financial Market Authority (the “AMF”) are subject to a 0.3% French tax on financial transactions provided that the issuer’s market capitalization exceeds 1 billion euros as of December 1 of the year preceding the taxation year (See “Item 10. Additional Information - E - Taxation - French Financial Transaction Tax and Registration Duties on Disposition of our Shares”). On the date hereof, the NYSE is not formally recognized as a foreign regulated market by the AMF.
If the NYSE were to be formally recognized as a foreign regulated market by the AMF in the future, or if Article 235 ter ZD of the French tax code were amended to include the NYSE as a foreign regulated market, the French financial transaction tax could be due on purchases of ordinary shares of the Company.
-
16
-
|
A.
|
History and Development of the Company
|
Constellium Holdco B.V. (formerly known as Omega Holdco B.V.) was incorporated as a Dutch private limited liability company on May 14, 2010 (incorporated and governed under the Dutch Civil Code). Constellium Holdco B.V. was formed to serve as the holding company for various entities comprising Alcan's Engineered Aluminum Product business unit, which Constellium acquired from affiliates of Rio Tinto on January 4, 2011 (the “Acquisition”). On May 21, 2013, Constellium Holdco B.V. was converted into a Dutch public limited liability company and renamed Constellium N.V. On May 29, 2013, we completed our initial public offering and began trading our shares as Constellium N.V., a Dutch company, on the New York Stock Exchange (the “NYSE”) under the symbol “CSTM”.
On June 28, 2019, Constellium N.V. converted its corporate form from a Dutch public limited liability company (
Naamloze Vennootschap
) into a Societas Europaea (SE) and changed its name to Constellium SE, with its head office remaining in Amsterdam, the Netherlands (the “Conversion”).
On December 12, 2019, Constellium SE completed its re-domicile and the relocation of its head office to Paris, France (the “Transfer”). The Conversion and the Transfer were each approved by the Company’s shareholders. Effective as of December 12, 2019, the Company’s existing Articles of Association were amended by means of a deed of amendment to reflect the Company’s re-domicile to Paris, France (“Articles of Association”).
As of the effectiveness of the Transfer, each outstanding Class A ordinary share of Constellium SE with its head office in Amsterdam, the Netherlands, automatically became an ordinary share of Constellium SE with its head office in Paris, France. The Company’s ordinary shares continue to be listed on the NYSE under the symbol “CSTM” and we began trading our shares under Constellium SE, a French company, on December 13, 2019.
Since the Transfer, any references to French law and the Articles of Association herein are references to French law and the Articles of Association of the Company, respectively, following the Conversion and Transfer.
For information on our historical capital expenditures, see “Item 5. Operating and Financial Review and Prospects—Cash Flows—Historical Capital Expenditures.” For information on our capital expenditures currently in process, see “—B. Business Overview—Our Operating Segments.” We expect to finance our capital expenditures currently in process with a combination of internal and external financing sources.
The business address (head office) of Constellium SE is Washington Plaza, 40-44 rue Washington, 75008 Paris, France, and our telephone number is +33 1 73 01 46 20. The address for our agent for service of process in the United States is Corporation Service Company, 80 State Street, Albany, New York 12207-2543, and its telephone number is + 1(302) 636-5400.
The SEC maintains an Internet website that contains reports and other information about issuers, like us, that file electronically with the SEC. The address of that site is www.sec.gov. We also make available on our website, free of charge, our annual reports on Form 20-F and the text of our reports on Form 6-K, including any amendments to these reports, as well as certain other SEC filings, as soon as reasonably practicable after they are electronically filed with or furnished to the SEC. Our website address is www.constellium.com. The information contained on our website is not incorporated by reference in this document.
-
17
-
|
B.
|
Business Overview
|
The Company
Overview
We are a global leader in the design and manufacture of a broad range of innovative rolled and extruded aluminium products, serving primarily the packaging, aerospace and automotive end-markets. Our business model is to add value by converting aluminium into semi-fabricated and in some instances fabricated products. We supply numerous blue-chip customers with many value-added products for performance-critical applications. Our product portfolio generally commands higher margins as compared to less differentiated, more commoditized fabricated aluminium products, such as common alloy coils, paintstock, foilstock and soft alloys for construction and distribution.
As of December 31, 2019, we operated 28 production facilities, we had three administrative centers in Baltimore, Maryland, Paris, France and Zürich, Switzerland, and had three R&D centers. Additionally, we are building a new facility in China to serve our automotive structures customers. We believe our portfolio of flexible, integrated and strategically located facilities is among the most technologically advanced in the industry and that the significant growth investments we have made now position us well to capture expected demand growth in each of our end markets. It is our view that our established presence in Europe, North America and China combined with more than 50 years of manufacturing experience, quality and innovation, strategically position us to be a leading supplier to our global customer base. The Company had approximately 13,200 employees as of December 31, 2019.
We seek to sell to end-markets that have attractive characteristics for aluminium, including (i) stability through economic cycles as seen in our North American and European packaging businesses, (ii) rigorous and complex technical requirements as seen in global aerospace and automotive businesses, and (iii) favorable growth fundamentals supported by the vehicle lightweighting trend seen in global automotive business, and the growth in electric vehicles.
We have invested capital not only to maintain the condition of our assets which have significant replacement values, but also to grow a number of attractive opportunities including: (i) Auto Body Sheet capabilities in Muscle Shoals, Alabama, in Bowling Green, Kentucky, in Neuf-Brisach, France, and in Singen, Germany (ii) new Automotive Structures operations in Nanjing, China, in San Luis Potosi, Mexico, in White, Georgia, in Vigo, Spain, and in Zilina, Slovakia and facility expansions to produce battery enclosures for electric vehicles in Gottmadingen, Germany and advanced body structure capabilities in Dahenfeld, Germany and in Van Buren, Michigan and (iii) new cast houses and additional extrusion capability in Děčín, Czech Republic as well as a number of growth initiatives through R&D and debottlenecking efforts.
Our unique platform has enabled us to develop a stable and diversified customer base and to enjoy long-standing relationships with our largest customers. Our customer base includes market leading firms in packaging, aerospace, and automotive, such as AB InBev, Ball Corporation, Crown Holdings, Inc., Airbus, Boeing, and several premium automotive OEMs, including BMW AG, Daimler AG and Ford Motor Company. We believe that we are a critical supplier to many of our customers due to our technological and R&D capabilities as well as the long and complex qualification process required for many of our products. Our core products require close collaboration and, in many instances, joint development with our customers. We believe that this integrated collaboration with our customers for high value-added products reduces substitution risk, supports our competitive position and creates high barriers to entry.
For the years ended December 31, 2019, 2018 and 2017, the Company’s main key figures were as follows:
|
For the years ended December 31,
|
|||||||||
|
2019
|
2018
|
2017
|
|||||||
|
Shipments (kT)
|
1,589
|
|
1,534
|
|
1,482
|
|
|||
|
Revenue (in € millions)
|
5,907
|
|
5,686
|
|
5,237
|
|
|||
|
Net income/(loss) (in € millions)
|
64
|
|
190
|
|
(31
|
)
|
|||
|
Adjusted EBITDA (in € millions)
|
562
|
|
498
|
|
448
|
|
|||
Adjusted EBITDA is not a measure defined under IFRS. Adjusted EBITDA is defined and discussed in “Item 5. Operating and Financial Review and Prospects—Segment Results.”
-
18
-
Our Strategy
Our primary objectives are to expand our leading position as a supplier-of-choice of high value-added, technologically advanced fabricated aluminium products and to maximize the returns in our business. To achieve these objectives, we have built a business strategy centered around six core principles:
|
(i)
|
Focus on High Value-added Product Focus
|
We are primarily focused on our three strategic end-markets—packaging, aerospace and automotive—in which we have market leading positions and established relationships with many of the main manufacturers. These are also markets where we believe that we can differentiate ourselves through our high value-added and specialty products which make up the majority of our product portfolio. We have made substantial investments to develop unique R&D and technological capabilities, which we believe give us a competitive advantage in designs and innovations. We believe our differentiated products provide significant benefits to our customers in many areas such as weight reduction, higher strength and better formability. In addition, these products typically command higher margins than more commoditized products, and are supplied to end-markets that we believe have highly attractive characteristics and long-term growth trends. We intend to continue to invest in our R&D and technological capabilities and develop high value-added product portfolio.
|
(ii)
|
Increase Customer Connectivity
|
We aim to deepen our ties with our customers by consistently providing best-in-class quality products, joint product development projects, market leading supply chain integration, customer technical support and scrap and recycling solutions. We regard our relationships with our customers as partnerships in which we work closely together to utilize our unique R&D and technological capabilities to develop customized solutions in order to meet evolving customer requirements. The close collaboration to develop best-in-class and tailored solutions, as well as significant effort and investment to adhere to rigorous qualification procedures, enables us to foster long-term relationships with our customers. In addition, through supply chain integration we are able to better anticipate customer demands, optimize supply and more efficiently manage our working capital needs. We also seek to strengthen customer connectivity through customer technical support and closed-loop scrap management programs. We will aim to continue to further foster and enhance the relations with our customers and position our company as a preferred supplier to our customers.
|
(iii)
|
Optimize Margins and Asset Utilization Through Product Portfolio Management
|
We believe there are significant opportunities to enhance our profitability through rigorous focus on the products we choose to make and optimizing the throughput of these products in our facilities. For example, given our manufacturing configurations, there are certain products that our facilities are better equipped to manufacture. As a consequence, we can manufacture them more efficiently and at a lower cost. In addition, we are highly focused on maximizing the throughput of our facilities to increase the tons per machine hour and profitability per machine hour. We strive to achieve this through our investments in asset integrity, and through continuous improvements in our operations such as debottlenecking and optimizing equipment uptime, recovery and mill speed.
|
(iv)
|
Harvest Returns from Recent Investments
|
We have invested capital in a number of attractive growth opportunities. While these investments have attractive return profiles, many of them are still in the ramp-up phase and are not yet making a significant contribution to our earnings. We are highly focused on completing these startups and realizing the expected earnings contributions. We believe these investments leave us well positioned to capture expected growth in our end markets and to enhance the returns in our business.
|
(v)
|
Strictly Control Cost and Continuously Improve
|
We believe that there are significant opportunities to improve the services and quality that we provide to our customers and to reduce our operating costs by implementing manufacturing excellence initiatives and other cost reduction initiatives. We aim to establish best-in-class operations and achieve cost reductions by standardizing manufacturing processes and the associated upstream and downstream production elements where possible, while still allowing the flexibility to respond to local market demands.
-
19
-
|
(vi)
|
Increase Financial Flexibility
|
We are focused on increasing our financial flexibility through earnings growth, strict cost control, working capital management and disciplined capital spending, which we believe will collectively drive free cash flow generation and deleveraging. We believe having increased financial flexibility is a key pillar in achieving our long-term objective of being the supplier-of-choice of high value-added, specialized and technologically-advanced products.
Our Operating Segments
Our business is organized into three operating segments:
(i)
Packaging & Automotive Rolled Products
(P&ARP)
includes the production of rolled aluminium products in our European and North American facilities. We supply the packaging market with canstock and closure stock for the beverage and food industry, as well as foil stock for the flexible packaging market. In addition, we supply the automotive market with a number of technically sophisticated applications such as ABS and heat exchanger materials.
(ii)
Aerospace & Transportation
(A&T)
includes the production of rolled aluminium products in our European and North American facilities (and very limited volumes of extruded products) for the aerospace market, as well as rolled products for transport, industry and defense end-uses.
(iii)
Automotive Structures & Industry
(AS&I)
includes the production of extruded products and technologically advanced structures for the automotive industry including crash-management systems, body structures, side impact beams and battery enclosures in our European, North American and Chinese facilities. In addition, we fabricate hard and soft aluminium alloy extruded profiles in a number of our other European facilities for a range of high demand industry applications in the automotive, engineering, rail and other transportation end markets.
-
20
-
Table: Overview of Operating Segments (as of December 31, 2019)
|
Packaging & Automotive
Rolled Products
|
Aerospace &
Transportation
|
Automotive Structures &
Industry
|
||||
|
Manufacturing Facilities
1
|
•
4 (France, Germany, U.S.)
|
•
6 (France, U.S., Switzerland)
|
•
18 (France, Germany, Switzerland, Czech Republic, Slovakia, Spain, U.S., Canada, Mexico, China)
|
|||
|
Employees
|
•
4,000
|
•
4,000
|
•
4,800
|
|||
|
Key Products
|
•
Can stock
•
Can end stock
•
Closure stock
•
Auto Body Sheet
•
Rolled products for heat exchangers
•
Specialty reflective sheet (Bright)
|
•
Aerospace plates, sheets and extrusions
•
Aerospace wing skins
•
Plate and sheet for transportation, industry and defense applications
|
•
Automotive structures
•
Other extruded products including:
•
Soft alloys
•
Hard alloys
•
Large profiles
|
|||
|
Key Customers
|
•
Packaging
: AB InBev, Ball Corporation, Can-Pack, Amcor, Ardagh Group, Coca-Cola, Crown
•
Automotive
: Audi, BMW AG, Daimler AG, Groupe PSA, Valeo, Volkswagen
|
•
Aerospace
: Airbus, Boeing, Bombardier, Dassault
•
Transportation
,
Industry, Defense and Distribution:
Amari, Nexter Systems, Ryerson, ThyssenKrupp
|
•
Automotive
: Audi, BMW AG, Daimler AG, FCA Group, Ford, Porsche, Groupe PSA
•
Rail
: CAF, Hitachi, Stadler
|
|||
|
Select Key Facilities
|
•
Neuf-Brisach (France)
•
Singen (Germany)
•
Muscle Shoals (Alabama, U.S.)
•
Bowling Green (Kentucky, U.S.)
|
•
Issoire (France)
•
Ravenswood (West Virginia, U.S.)
•
Sierre (Switzerland)
|
•
Gottmadingen (Germany)
•
Van Buren (Michigan, U.S.)
•
Děčín (Czech Republic)
•
Singen (Germany)
|
|||
|
% of total Revenue
2
(for the twelve months ended December 31, 2019)
|
53%
|
24%
|
23%
|
|||
|
% of Adjusted EBITDA
3
(for the twelve months ended December 31, 2019)
|
49%
|
36%
|
19%
|
|||
|
1
|
Our 28 manufacturing facilities are located in 26 sites, two of which are shared between two operating segments.
|
|
2
|
Holdings & Corporate not included.
|
|
3
|
The difference between the sum of Adjusted EBITDA for our three segments and the Company’s Adjusted EBITDA is attributable to our fourth segment Holdings and Corporate which is not presented here.
|
-
21
-
The following table presents our shipments by product lines:
|
(in thousand metric tons)
|
For the year ended
December 31,
|
||||||||
|
2019
|
2018
|
2017
|
|||||||
|
Packaging rolled products
|
822
|
|
799
|
|
807
|
|
|||
|
Automotive rolled products
|
234
|
|
196
|
|
158
|
|
|||
|
Specialty and other thin-rolled products
|
41
|
|
44
|
|
43
|
|
|||
|
Aerospace rolled products
|
120
|
|
111
|
|
106
|
|
|||
|
Transportation, industry, and other rolled products
|
122
|
|
135
|
|
132
|
|
|||
|
Automotive extruded products
|
123
|
|
114
|
|
109
|
|
|||
|
Other extruded products
|
127
|
|
135
|
|
127
|
|
|||
|
Other
|
—
|
|
—
|
|
—
|
|
|||
|
Total shipments
|
1,589
|
|
1,534
|
|
1,482
|
|
|||
Packaging & Automotive Rolled Products Operating Segment
In our Packaging & Automotive Rolled Products operating segment, we develop and produce customized aluminium sheet and coil solutions. For the year ended December 31, 2019:
|
•
|
approximately 75% of operating segment volume was in packaging rolled products, which primarily includes beverage and food canstock as well as closure stock and foil stock,
|
|
•
|
approximately 21% of operating segment volume was in automotive rolled products,
|
|
•
|
and approximately 4% of operating segment volume was in specialty and other thin-rolled products, which include technologically advanced products for the industrial sector.
|
We are a leading European and North American supplier of canstock and the leading worldwide supplier of closure stock. We are also a major player in automotive rolled products for ABS in both Europe and North America, and for heat exchangers in Europe. These products are subject to the exacting requirements and qualification processes of our customers which we consider to provide us with a competitive advantage and to represent a barrier to entry for new competitors. We have a diverse customer base, consisting of many of the world’s largest beverage and food can manufacturers, specialty packaging producers, leading automotive firms and global industrial companies. Our customer base includes AB InBev, Ball Corporation, Crown Holdings, Inc., Ardagh Group S.A., Can-Pack S.A., Coca-Cola, Amcor Ltd., VW Group, Daimler AG, Ford, and Groupe PSA . Our customer contracts in packaging usually have a duration of three to five years. Our customer contracts in automotive are usually valid for the lifetime of a model, which is typically five to seven years.
We have two integrated rolling operations located in Europe and one in the U.S. Neuf-Brisach, our facility on the border of France and Germany, is a fully integrated aluminium recycling, rolling and finishing facility producing both canstock and ABS. Singen, located in Germany, is specialized in high-margin niche applications and has an integrated hot/cold rolling line and high-grade cold mills with special surfaces capabilities that facilitate unique metallurgy and lower production costs. Muscle Shoals, Alabama, is a fully integrated aluminium recycling, rolling and finishing facility producing both can stock and ABS. We also operate a finishing line for ABS in Bowling Green, Kentucky.
Our Packaging & Automotive Rolled Products operating segment serves the packaging market which has historically been relatively resilient during periods of economic downturn and has had relatively limited exposure to economic cycles and periods of financial instability. See “-Our Key End-Markets- Packaging.”
-
22
-
The following table summarizes our volume, revenue and Adjusted EBITDA for our Packaging & Automotive Rolled Products operating segment for the periods presented:
|
For the year ended December 31,
|
|||||||||
|
(€ in millions, unless otherwise noted)
|
2019
|
2018
|
2017
|
||||||
|
Packaging & Automotive Rolled Products:
|
|||||||||
|
Segment Revenue
|
3,149
|
|
3,059
|
|
2,812
|
|
|||
|
Segment Shipments (kt)
|
1,097
|
|
1,039
|
|
1,008
|
|
|||
|
Segment Revenue (€/ton)
|
2,871
|
|
2,944
|
|
2,789
|
|
|||
|
Segment Adjusted EBITDA
(1)
|
273
|
|
243
|
|
204
|
|
|||
|
Segment Adjusted EBITDA(€/ton)
|
249
|
|
234
|
|
202
|
|
|||
|
Segment Adjusted EBITDA margin
|
9
|
%
|
8
|
%
|
7
|
%
|
|||
__________________
|
(1)
|
Adjusted EBITDA is not a measure defined under IFRS. Adjusted EBITDA is defined and discussed in “Item 5. Operating and Financial Review and Prospects—Segment Results.”
|
Aerospace & Transportation Operating Segment
Our Aerospace & Transportation operating segment has market leadership positions in technologically advanced aluminium and specialty material products with wide applications across the global aerospace, defense, transportation, and industrial sectors. We offer a wide range of products including plate, sheet, extrusions and a few precision cast products which allow us to offer tailored solutions to our customers. We seek to differentiate our products and act as a key partner to our customers through our broad product range, supply-chain solutions, advanced R&D capabilities, extensive recycling capabilities and portfolio of plants with an extensive range of capabilities across Europe and North America. In order to reinforce the competitiveness of our metal solutions, we design our processes and alloys with a view to optimizing our customers’ operations and costs. This includes offering services such as customizing alloys to our customers’ processing requirements, processing short lead time orders and providing vendor managed inventories or tolling arrangements.
Our most significant facilities in the Aerospace & Transportation Operating Segment are located in Issoire, France, Ravenswood, West Virginia and Sierre, Switzerland and offer a broad spectrum of products required by the aerospace industry and have strong capabilities such as producing wide and very high gauge plates required for certain civil and commercial aerospace programs.
Downstream aluminium products for the aerospace market require relatively high levels of R&D investment and advanced technological capabilities, and therefore tend to command higher margins compared to more commoditized products. We work in close collaboration with our customers to develop highly engineered solutions to fulfill their specific requirements. For example, we developed Airware
®
, a lightweight specialty aluminium-lithium alloy, for our aerospace customers to address increasing demand for lighter and more environmentally friendly aircraft.
Aerospace products are typically subject to long development and supply lead times and the majority of our contracts with our largest aerospace customers have a term of five years or longer, which provides visibility on volumes and profitability. In addition, we expect demand for our aerospace products to directly correlate with aircraft backlogs and build rates. As of December 2019, the backlog reported by Airbus and Boeing for commercial aircraft reached 12,888 units on a combined basis, representing approximately eight to nine years of production at current build rates.
Additionally, aerospace products are generally subject to long qualification periods. Aerospace production sites are regularly audited by external certification organizations including the National Aerospace and Defense Contractors Accreditation Program (“
NADCAP
”) and/or the International Organization for Standardization. NADCAP is a cooperative organization of a number of aerospace OEMs that defines industry-wide manufacturing standards. NADCAP appoints private auditors who grant suppliers like Constellium a NADCAP certification, which customers tend to require. New products or alloys are separately certified by the OEM that uses the product. Our sites have been qualified by external certification organizations and our products have been qualified by our customers. We are typically able to obtain qualification within 6
-
23
-
months to one year mainly because: (i) due to our long history of working with the main aircraft OEMs, we have an existing range of qualifications including in excess of 100 specifications regarding alloy, temper or shape, which we can build on to obtain new product qualifications; and (ii) we have invested in a number of capital intensive equipment and R&D programs to be able to qualify to the current industry norms and standards.
We also serve the transportation and defense industries. Our product portfolio in these segments include both specialty products as well as standard products. Specialty products are differentiated products, which are engineered to meet specific customer needs and as such have specific properties (e.g., mechanical properties, dimensions, surface aspect, etc.). Standard products typically face higher levels of competition in the marketplace, in the regions that we serve.
The following table summarizes our volume, revenue and Adjusted EBITDA for our Aerospace & Transportation operating segment for the periods presented:
|
For the year ended December 31,
|
|||||||||
|
(€ in millions, unless otherwise noted)
|
2019
|
2018
|
2017
|
||||||
|
Aerospace & Transportation:
|
|||||||||
|
Segment Revenue
|
1,462
|
|
1,389
|
|
1,335
|
|
|||
|
Segment Shipments (kt)
|
242
|
|
246
|
|
238
|
|
|||
|
Segment Revenue (€/ton)
|
6,041
|
|
5,646
|
|
5,618
|
|
|||
|
Segment Adjusted EBITDA
(1)
|
204
|
|
152
|
|
146
|
|
|||
|
Segment Adjusted EBITDA(€/ton)
|
843
|
|
619
|
|
614
|
|
|||
|
Segment Adjusted EBITDA margin
|
14
|
%
|
11
|
%
|
11
|
%
|
|||
__________________
|
(1)
|
Adjusted EBITDA is not a measure defined under IFRS. Adjusted EBITDA is defined and discussed in “Item 5. Operating and Financial Review and Prospects—Segment Results.”
|
Automotive Structures & Industry Operating Segment
Our Automotive Structures & Industry operating segment produces (i) technologically advanced structures for the automotive industry including crash management systems, body structures, side impact beams and battery enclosures and (ii) soft and hard alloy extrusions for automotive, road, energy and building and large profiles for rail and industrial applications. We complement our products with a comprehensive offering of downstream technology and services, which include pre-machining, surface treatment, R&D and technical support services. Approximately 49% of the segment volume for the year ended December 31, 2019 was in automotive extruded products and approximately 51% was in other extruded product applications.
In our automotive structures business, a series of aluminium extrusions are consolidated into a system for specific automotive applications. Due to the unique combination of strength and weight, aluminium extrusions are increasingly favored in this segment. We believe that we are one of the largest providers of aluminium automotive crash management systems globally. We manufacture automotive structural products for some of the largest European and North American car manufacturers supplying the global market, including Daimler AG, BMW AG, VW Group, FCA Group and Ford. Our automotive structures contracts are typically five to seven years in duration.
We are a leading supplier of hard alloys for the automotive market and of large structural profiles for rail, industrial and other transportation markets in Europe. We also produce soft alloy extrusions for customers primarily in Germany and France, with customized solutions for a diverse number of end markets. Our other extruded products business is tied to contracts that averagely last up to one year.
Eighteen of our facilities, located in Germany, North America, the Czech Republic, Slovakia, France, Switzerland, China, Spain, and Mexico manufacture products sold in our Automotive Structures & Industry operating segment. We believe our local presence, downstream services and industry leading cycle times help to ensure that we respond to our customer demands in a timely and consistent fashion. Our two integrated remelt and casting centers in Switzerland and the Czech Republic utilize
-
24
-
significant amounts of recycled aluminium and help provide security of metal supply. We also operate the largest extrusion press in Western Europe at our Singen facility, in Germany, which allows us to produce specialized large profile products for our rail and transportation customers. In addition, we operate a strategic network of five soft alloys facilities with strong technical capabilities, across Europe to better serve primarily our automotive and industrial customers as well as customers in other diversified market segments.
We operate a joint venture, Astrex Inc., which produces automotive extruded profiles in Ontario, Canada, for our North American operations, and a joint venture, Engley Automotive Structures Co., Ltd., which is currently producing aluminium crash management systems in China.
We believe that we have strong market positions given our R&D and manufacturing capability in Automotive Structures. Led by our partnership with Brunel University, London we have proprietary alloy and manufacturing technology which enables us to deliver differentiated design, engineering and manufacturing capabilities to our customers, and to accelerate time to market.
The following table summarizes our volume, revenue and Adjusted EBITDA for our Automotive Structures & Industry operating segment for the periods presented:
|
For the year ended December 31,
|
|||||||||
|
(€ in millions, unless otherwise noted)
|
2019
|
2018
|
2017
|
||||||
|
Automotive Structures & Industry:
|
|||||||||
|
Segment Revenue
|
1,351
|
|
1,290
|
|
1,123
|
|
|||
|
Segment Shipments (kt)
|
250
|
|
249
|
|
236
|
|
|||
|
Segment Revenue (€/ton)
|
5,404
|
|
5,181
|
|
4,756
|
|
|||
|
Segment Adjusted EBITDA
(1)
|
106
|
|
125
|
|
120
|
|
|||
|
Segment Adjusted EBITDA(€/ton)
|
423
|
|
502
|
|
510
|
|
|||
|
Segment Adjusted EBITDA margin
|
8
|
%
|
10
|
%
|
11
|
%
|
|||
__________________
|
(1)
|
Adjusted EBITDA is not a measure defined under IFRS. Adjusted EBITDA is defined and discussed in “Item 5. Operating and Financial Review and Prospects—Segment Results.”
|
Our Industry
Aluminium Sector Value Chain
The global aluminium industry consists of (i) mining companies that produce bauxite, the ore from which aluminium is ultimately derived, (ii) primary aluminium producers that refine bauxite into alumina and smelt alumina into aluminium, (iii) aluminium semi-fabricated products manufacturers, including aluminium casters, extruders and rollers, (iv) aluminium recyclers and remelters and (v) integrated companies that are present across multiple stages of the aluminium production chain.
Our business is primarily focused on rolling and extruding semi-fabricated products for a variety of value added end markets. We recycle aluminium, both for our own use and as a service to our customers. We do not smelt aluminium, nor do we participate in other upstream activities such as mining or refining bauxite.
-
25
-
Constellium’s Position in the Aluminium Sector Value Chain
Aluminium value chain

Rolled and extruded aluminium product prices are based generally on the price of aluminium (which is quoted on LME) plus a conversion margin (i.e., the cost incurred to convert the aluminium into a semi-finished product). The price of aluminium is not a significant driver of our financial performance. Instead, the financial performance of producers of rolled and extruded aluminium products, such as Constellium, is driven by the dynamics in the end markets that they serve, their relative positioning in those markets and the efficiency of their industrial operations.
The aluminium rolled products industry is characterized by economies of scale, as significant capital investments are required to achieve and maintain technological capabilities and demanding customer qualification standards. The service and efficiency demands of large customers have encouraged consolidation among suppliers of aluminium rolled products.
The aluminium extruded product industry is relatively fragmented and generally more regional. The business requires as well significant capital investments in order to achieve and maintain technological capabilities and demanding customer qualification standards.
The supply of aluminium rolled and extruded products has historically been affected by production capacity, alternative technology substitution and trade flows between regions. The demand for these products has historically been affected by economic growth, substitution trends, cyclicality and seasonality and aluminium rolled products in particular by down-gauging.
There are two main sources of input metal for our aluminium rolled or extruded products:
|
•
|
Slabs or billets we cast from a combination of primary and recycled aluminium. The primary aluminium is typically in form of standard ingots. The recycled aluminium comes either from scrap from fabrication processes, known as recycled process material, or from recycled end products in their end of life phase, such as used beverage cans.
|
|
•
|
Slabs or billets purchased from smelters or metal trading companies.
|
Primary aluminium, sheet ingot and extrusion billets can generally be purchased at prices set on the LME plus a premium that varies by geographic region on delivery, alloying material, form (ingot or molten metal) and purity.
Recycled aluminium is also tied to the LME pricing (typically sold at a discount to LME). Aluminium is infinitely recyclable and recycling aluminium requires only approximately 5% of the energy required to produce primary aluminium. As a result, in regions where aluminium is widely used, manufacturers and customers are active in setting up collection processes in which used beverage cans and other end-of-life aluminium products are collected for remelting at purpose-built plants. Manufacturers may also enter into agreements with customers who return recycled process material and pay to have it re-melted and rolled into the same product again.
-
26
-
Aluminium Rolled Products Overview
The rolling process consists of passing aluminium through a hot-rolling mill and then transferring it to a cold-rolling mill, which can gradually reduce the thickness of the metal down to approximately 6 mm for plates and to approximately 0.2-6 mm for sheet.
Aluminium rolled products, including sheet, plate and foil, are semi-finished products that provide the raw material for the manufacture of finished goods ranging from packaging to automotive body panels to fuselage sheet to aircraft wing parts. The packaging industry is a major consumer of the majority of sheet and foil for making beverage cans, foil containers and foil wrapping. Sheet is also used extensively in transport for airframes, road and rail vehicles, in marine applications, including offshore platforms, and superstructures and hulls of boats and in building for roofing and siding. Plate is used for airframes, military vehicles and bridges, ships and other large vessels and as tooling plate for the production of plastic products. Foil applications outside packaging include electrical equipment, insulation for buildings and foil for heat exchangers.
The following chart illustrates expected global demand for aluminium rolled products according to CRU International Limited ("CRU"). The compound annual growth rate ("CAGR") between 2019 and 2024 for the flat rolled products market is expected to be 3.3% according to CRU.
Projected Aluminium Flat Rolled Products Demand 2019-2024 (in kt)
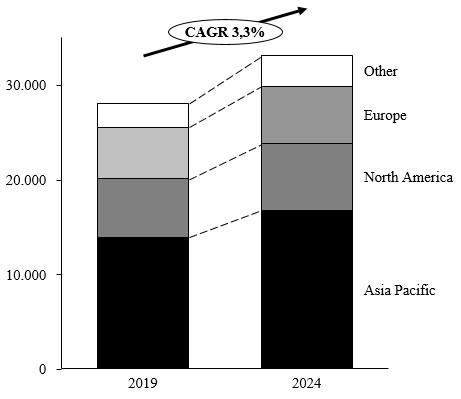
Source: CRU International Ltd.
(Asia Pacific includes Japan, China, India, South Korea, Australia, Middle East and other Asia. Other includes Central and South America, and Africa)
Aluminium Extrusions and Automotive Structures Overview
Aluminium extrusion is a technique used to transform aluminium billets into objects with a defined cross-sectional profile for a wide range of uses. In the extrusion process, heated aluminium is forced through a die. Extrusions can be manufactured in many sizes and in almost any shape for which a die can be created. The extrusion process makes the most of aluminium’s unique combination of physical characteristics. Its malleability allows it to be easily machined and cast, and yet aluminium is one-third the density and stiffness of steel so the resulting products offer strength and stability, particularly when alloyed with other metals.
Extruded profiles can be produced in solid or hollow form, while additional complexities can be applied using advanced die designs. After the extrusion process, a variety of options are available to adjust the color, texture and brightness of the aluminium’s finish. This may include aluminium anodizing or painting.
Today, aluminium extrusions are used for a wide range of purposes, including building, transportation and industrial markets. Virtually every type of vehicle contains aluminium extrusions, including cars, boats, bicycles and trains. Home appliances and tools take advantage of aluminium’s excellent strength-to-weight ratio. The increased focus on green building is also leading contractors and architects to use more extruded aluminium products, as aluminium extrusions are flexible and corrosion-resistant. These diverse applications are possible due to the advantageous attributes of aluminium, including its
-
27
-
particular blend of strength and ductility its conductivity, its non-magnetic properties and its ability to be recycled repeatedly without loss of integrity. We believe that all of these capabilities make aluminium extrusions a viable and adaptable solution for a growing number of manufacturing needs.
CRU is cautiously optimistic about the consumption of aluminium extruded products in the United States in 2020, mostly driven by the construction sector. In Europe, CRU expects the demand for aluminium extruded products to remain weak with the European automotive sector's difficulties expected to continue in 2020.
Our Key End-markets
We have a significant presence in (i) the packaging end-markets, which have proved to be relatively stable and historically recession-resilient, (ii) the automotive and the aerospace end-markets, which are driven by global demand trends, and (iii) a number of niche specialty end markets including transportation (trucks, rail, space), industry, defense and bright products which diversify our exposure to economic trends.
Packaging
Aluminium beverage cans represented approximately 18% of the total European aluminium flat rolled demand by volume and 32% of total U.S. and Canada aluminium flat rolled demand in 2019. According to CRU, aluminium demand for the canstock market in Europe and North America is expected to grow by 2.7% and 2% per year between 2019 and 2024, respectively.
Aluminium is a preferred material for beverage packaging as it allows drinks to chill faster, can be stacked for transportation and storage more densely than competing formats (such as glass bottles), is highly formable for unique or differentiated branding, and offers the environmental advantage of easy, cost- and energy-efficient recycling. As a result of these benefits, aluminium is displacing tinplate, glass and may displace plastics as the preferred packaging material in certain markets. In Europe, aluminium is replacing tinplate (steel) as the standard for beverage cans and we believe that aluminium's penetration of the canstock market versus tinplate will be close to 100% by 2023. In the United States, we believe aluminium’s penetration has been at 100% for many years. In addition, we are benefiting from increased can consumption in Eastern Europe and Mexico and from growth in specialty products such as cans used for energy drinks.
|
Total European Rolled Products Consumption
Can Stock (Kt)
|
Total North American Rolled Products
Consumption Can Stock (Kt)
|
|

|
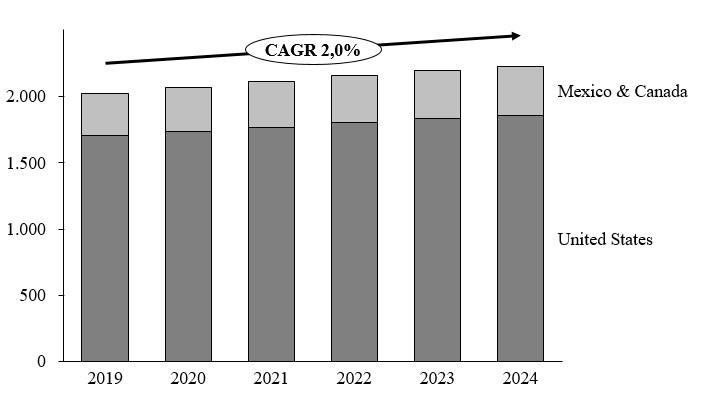
|
|
|
Source: CRU International Ltd., Aluminium Rolled Products Market Outlook November 2019
|
Source: CRU International Ltd., Aluminium Products Market Outlook November 2019
|
|
-
28
-
In addition, demand for can sheet has been highly resilient across economic cycles. Between 2007 and 2011, the US and Europe can stock consumption was flat compared to the material decline for total flat rolled product volumes.
U.S. and Europe Metal Beverage Can Consumption
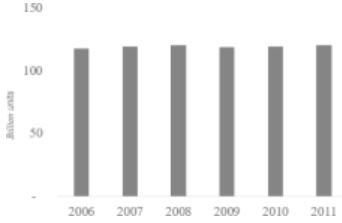
Source: Republished under license from Global Data
Automotive
We supply the automotive sector with rolled products out of our Packaging & Automotive Rolled Products operating segment and extruded and fabricated products out of our Automotive Structures & Industry operating segment. Our automotive products are predominantly used in premium models, light trucks and sport utility vehicles manufactured by the European and North American OEMs.
In our view, the main drivers of automotive sales are overall economic growth, credit availability, consumer prices and consumer confidence. According to CRU, global vehicle production is expected to grow by approximately 1.9% per annum from 2019 to 2024.
Vehicle Production
(1)

Source: CRU International Ltd
Global & Economic Outlook December 2019
(1) Represents both car and commercial vehicle production, includinglight trucks, heavy trucks and, except in the U.S. and Canada, coaches
Within the automotive sector, the demand for aluminium has been increasing faster than the underlying demand for light vehicles due to recent growth in the use of aluminium products in automotive applications. We believe the main reasons for this are aluminium’s high strength-to-weight ratio in comparison to steel and a need for increased energy efficiency. This lightweighting facilitates better fuel economy, improves emissions performance and enhances vehicle safety. As a result,
-
29
-
manufacturers are seeking additional applications where aluminium can be used in place of steel and an increased number of cars are being manufactured with aluminium panels and crash management systems.
We believe that the vehicle lightweighting trend will continue as increasingly stringent EU and U.S. regulations relating to reductions in carbon emissions will force the automotive industry to increase its use of aluminium to “lightweight” vehicles. In Europe, European Union legislation has set mandatory emission reduction targets for new cars such that by 2021, the fleet average to be achieved by all new cars is 95 grams of CO2 emissions per kilometer compared to an average target of 130g/km in 2015. In the United States, we expect that U.S. regulations requiring reductions in carbon emissions and fuel efficiency, as well as fluctuating fuel prices, will continue to drive aluminium demand in the automotive industry.
In the longer term, to the extent electric vehicles become more prevalent, we believe the demand for aluminium in the automotive industry will increase due to the greater importance of lightweighting. Aluminium thermal conductivity is a significant inherent advantage for battery boxes and aluminium also has superior energy absorption as compared to steel. Whereas growth in aluminium use in vehicles has historically been driven by increased use of aluminium castings, we anticipate that future growth will be primarily in the kinds of extruded and rolled products that we supply to the OEMs.
According to CRU, the consumption of ABS between 2019 and 2024 will grow 9% per annum in Europe, 9% per annum in North America and 23% per annum in China.
Automotive Body Sheet Flat Rolled Products Consumption (kt)
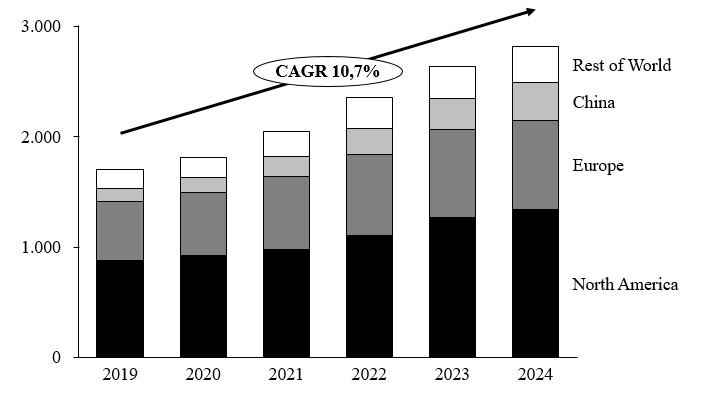
Source: CRU International Ltd.,
Aluminium Rolled Products Market Outlook November 2019
Aerospace
Demand for aerospace plates is primarily driven by the build rate of aircraft, which we believe will be supported for the foreseeable future by (i) necessary replacement of aging fleets by airline operators, particularly in the United States and Western Europe, and (ii) increasing global passenger air traffic (the aerospace industry publication The Airline Monitor estimates that global revenue passenger miles will grow at a compound annual growth rate of approximately 6% from 2019 to 2025). In 2019, Boeing and Airbus predicted respectively approximately 44,040 and 39,210 new aircraft over the next 20 years across all categories of large commercial aircraft. Boeing estimates that between 2019 and 2038, 39% of sales of new airplanes will be to Asia Pacific, 41% to Europe and North America and the remaining 20% delivered to the Middle East, Latin America, the Commonwealth of Independent States and Africa. Demand for aluminium aerospace plates is also influenced by alternative materials becoming more mature in the aerospace market (e.g., composites). According to CRU, aluminium demand for the aerospace rolled products markets in North America and Europe is expected to grow by 3.3% per year between 2019 and 2024.
-
30
-
|
World’s Commercial Aircraft Fleet (thousands)
|
Fleet Development Driven by Passenger Demand and Aging Fleet (units)
|
|
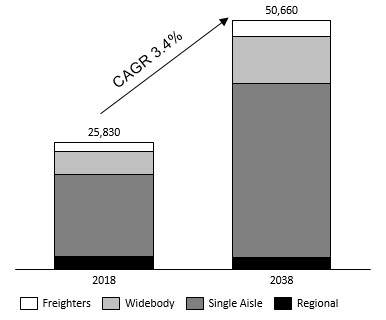
|

|
|
|
Source: Boeing 2019 current market outlook
|
Source: Boeing 2019 current market outlook
|
|
Aerospace Flat Rolled Products Consumption (kt)
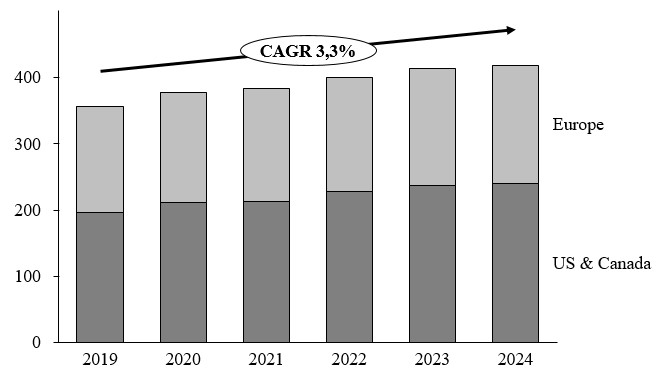
Source: CRU International Ltd.,
Aluminium Rolled Products Market Outlook November 2019
-
31
-
Our Business Operations
Our business model is to add value by converting aluminium into semi-fabricated products. It is our policy not to speculate on metal price movements.
Managing Our Metal Price Exposure
For all contracts, we seek to minimize the impact of aluminium price fluctuations in order to protect our cash flows against variations in the LME price and regional premiums that we buy and sell, with the following methods:
|
•
|
In cases where we are able to align the price and quantity of physical aluminium purchases with that of physical aluminium sales to our customers, we enter into back-to-back arrangements with our customers.
|
|
•
|
When we are unable to align the price and quantity of physical aluminium purchases with that of physical aluminium sales to our customers, we enter into derivative financial instruments to pass through the exposure to financial institutions at the time the price is set.
|
|
•
|
For a small portion of our volumes, the aluminium we process is owned by our customers and we bear no aluminium price risk.
|
The price of the aluminium that we buy includes other premiums on top of the LME price. These premiums relate to specific features of the metal being purchased, such as its location, purity, shape, etc.
Where possible, we align premium formulas in order to pass through the vast majority of our premium exposure to our customers, and in certain instances we enter into over-the-counter hedge instruments with third-parties to mitigate our exposure. We seek to apply the same policy and methods to minimize the impact of geographical premium price fluctuations that we do for the LME aluminium price variations.
Sales and Marketing
Our sales force is based in Europe (France, Germany, Czech Republic, United Kingdom and Switzerland), the United States and Asia (Tokyo, Shanghai and Seoul). We serve our customers either directly or through distributors.
Raw Materials and Supplies
Approximately 72% of our rolling slab demand and 52% of our billet demand is produced in our own internal cast-houses. In addition, our external rolling slab supply is secured through long-term contracts with several upstream companies. All of our top 10 overall metal suppliers (covering rolling slabs, extrusion billets, primary, high purity, scrap and hardeners) have been long-standing suppliers to our plants (in many cases for more than 10 years) and, in aggregate, accounted for approximately 55% of our total metal purchases (in terms of volumes) for the year ended December 31, 2019. We typically enter into multi-year contracts with these metal suppliers pursuant to which we purchase various types of metal, including:
|
•
|
Primary metal from smelters or metal traders in the form of ingots, rolling slabs or extrusion billets.
|
|
•
|
Remelted metal in the form of rolling slabs or extrusion billets from external cast-houses, as an addition to our own internal cast-houses.
|
|
•
|
Production scrap from customers and scrap traders.
|
|
•
|
End-of-life scrap (e.g., used beverage cans) from customers, collectors and scrap traders.
|
|
•
|
Specific alloying elements and primary ingots from producers and metal traders.
|
Our operations use natural gas and electricity, which represents the fourth largest component of our cost of sales, after metal, labor costs and depreciation. We purchase natural gas and electricity from the market and typically secure a large part of our natural gas and electricity needs pursuant to fixed-price commitments. To reduce the risks associated with our natural gas and electricity requirements, we use forward contracts or financial futures with our suppliers to fix the commodity component of the energy costs. Furthermore, in our longer-term sales contracts, we try to include indexation clauses on energy prices.
-
32
-
Our Customers
Our customer base includes some of the largest leading manufacturers in the packaging, aerospace and automotive end-markets. We have a relatively diverse customer base with our 10 largest customers representing approximately 50% of our revenue for year ended December 31, 2019. We generally have long-term relationships with our significant customers, many of which span decades.
A substantial portion of our volumes is sold under multi-year contracts, as we generally have three- to five-year terms in contracts with our packaging customers, five-year terms in contracts with our largest aerospace customers, and five- to seven-year terms in our “life of a car platform/car model” contracts with our automotive customers. This provides us with significant visibility into our future volumes and earnings.
We see our relationships with our customers as partnerships where we work together to find customized solutions to meet their evolving requirements. In addition, we collaborate with our customers to complete a rigorous process for qualifying our products in each of our end-markets, which requires substantial time and investment and creates high switching costs, resulting in longer-term, mutually beneficial relationships with our customers. For example, in the packaging industry, where qualification occurs on a plant-by-plant basis, we are currently one of the qualified suppliers to several facilities of our customers.
Our product portfolio is predominantly focused on high value-added products, which we believe are particularly well-suited to developing and manufacturing for our customers. These products tend to require close collaboration with our customers to develop tailored solutions, as well as significant effort and investment to adhere to rigorous qualification procedures, which enables us to foster long-term relationships with our customers. Our customized products typically command higher margins than more commoditized products, and are supplied to end-markets that we believe have highly attractive characteristics and long-term growth trends.
Competition
The worldwide rolled and extruded aluminium industry is highly competitive and we expect this dynamic to continue for the foreseeable future. We believe the most important competitive factors in our industry are: product quality, price, timeliness of delivery and customer service, geographic coverage and product innovation. Aluminium competes with other materials such as steel, plastic, composite materials and glass for various applications. Our key competitors in our Packaging & Automotive Rolled Products operating segment are Novelis Inc., Norsk Hydro ASA, Alcoa Corporation, Arconic Inc. and Tri-Arrows Aluminum Inc. Our key competitors in our Aerospace & Transportation operating segment are Arconic Inc., Aleris International, Inc., Kaiser Aluminum Corp., Austria Metall AG, and Universal Alloy Corporation. Our key competitors in our Automotive Structures & Industry operating segment are Norsk Hydro ASA, Sankyo Tateyama, Inc., Eural Gnutti S.p.A., Gestamp, Otto Fuchs KG, Impol Aluminium Corp., Benteler International AG, Whitehall Industries, Step-G, and Metra Aluminum.
Seasonality
Customer demand in the aluminium industry is seasonal due to a variety of factors, including holiday seasons, weather conditions, economic and other factors beyond our control. Our volumes are impacted by the timing of the holiday seasons in particular, with the lowest volumes typically delivered in August and December and highest volumes delivered in January to June. Our business is also impacted by seasonal slowdowns and upturns in certain of our customers’ industries. Historically, the can industry is strongest in the spring and summer seasons and the automotive and aerospace sectors encounter slowdowns in both the third and fourth quarters of the calendar year.
Research and Development (“R&D”)
We believe that our research and development capabilities coupled with our integrated, longstanding customer relationships create a distinctive competitive advantage versus our competition. Our three R&D centers are based in Voreppe, France; Plymouth, Michigan, and Brunel University, London, United Kingdom.
Our R&D center based in Voreppe, France provides services and support to all of our facilities, focusing on product and process development, providing technical assistance to our plants and working with our customers to develop new products. In developing new products, we focus on increased performance that aims to lower the total cost of ownership for the end users of our products, for example, by developing materials that decrease maintenance costs of aircraft or increase fuel efficiency in cars.Within the Voreppe facility, we also work on the development, improvement, and testing of processes used in our plants
-
33
-
such as melting, casting, rolling, extruding, finishing and recycling. We also develop and test technologies used by our customers, such as friction stir welding, and provide technological support to our customers.
The key contributors to our success in establishing our R&D capabilities include:
|
•
|
Close interaction with key customers, including through formal partnerships or joint development teams—examples include Strongalex®, Formalex® and Surfalex®, which were developed with automotive customers (mainly Daimler and Audi) and the Fusion bottle, a drawn and ironed technology created in partnership with Ball Corporation.
|
|
•
|
Technologically advanced equipment—for example, full-size casthouse for rapid prototyping of new Airware® low density alloys, innovative joining technologies for aerospace alloys (friction stir welding), forming technologies for automotive body sheets.
|
|
•
|
Long-term partnerships with universities worldwide. For example Michigan University in the U.S., Stuttgart University in Germany or Manchester University in the United Kingdom which generate significant innovation opportunities and foster new ideas.
|
Our R&D center located in Plymouth, Michigan opened in 2016 in order to improve our support to North American automotive customers by addressing specific market requirements related to our aluminium based light weighting solutions.
Additionally, in the Constellium University Technology Center inaugurated in 2016 at Brunel University London, a dedicated team of R&D engineers and project managers translate technology from the lab to new customer programs and to our plants for production. The facility features industrial scale casting and extrusion equipment, forming technology and extensive joining methods, enabling us to leverage on our proprietary alloys and strong manufacturing innovation capabilities to develop engineered solutions adapted to customer needs, and accelerate time to market.
As of December 31, 2019, the research and development center in Voreppe employed 248 people, of which 201 are scientists and technicians. The research and development center in Plymouth employed 8 people. The research technology center in Brunel employed 35 people. We invested €48 million in R&D in the year ended December 31, 2019
,
€40 million in R&D in the year ended December 31, 2018
and €36 million in R&D in the year ended December 31, 2017.
Trademarks, Patents, Licenses and IT
We actively review intellectual property arising from our operations and our research and development activities and, when appropriate, apply for patents in the appropriate jurisdictions. We currently hold approximately 200 active patent families and regularly apply for new ones. While these patents and patent applications are important to the business on an aggregate basis, we do not believe any single patent family or patent application is critical to the business.
We are from time to time involved in opposition and re-examination proceedings that we consider to be part of the ordinary course of our business, in particular at the European Patent Office and the U.S. Patent and Trademark Office. We believe that the outcome of existing proceedings would not have a material adverse effect on our financial position, results of operations or cash flows.
In connection with our collaborations with universities and other third parties, we occasionally obtain royalty-bearing licenses for the use of third-party technologies in the ordinary course of business.
Insurance
We have implemented a corporate-wide insurance program consisting of both corporate-wide master policies with worldwide coverage and local policies where required by applicable regulations. Our insurance coverage includes: (i) property damage and business interruption; (ii) general liability including operation, professional, product and environment liability; (iii) aviation product liability; (iv) marine cargo (transport); (v) business travel and personal accident; (vi) construction all risk; (vii) automobile liability; (viii) trade credit; (ix) cyber risk; (x) workers' compensation in the U.S.; and (xi) other specific coverages for executive and special risks.
-
34
-
We believe that our insurance coverage terms and conditions are customary for a business such as Constellium and are sufficient to protect us against catastrophic losses.
We also purchase and maintain insurance on behalf of our directors and officers.
Governmental Regulations and Environmental, Health and Safety Matters
Our operations are subject to a number of international, national, state and local regulations relating to the protection of the environment and to workplace health and safety. Our operations involve the use, handling, storage, transportation and disposal of hazardous substances, and accordingly we are subject to extensive laws and regulations governing emissions to air, discharges to water emissions, the generation, storage, transportation, treatment or disposal of hazardous materials or wastes and employee health and safety matters. In addition, prior operations at certain of our properties have resulted in contamination of soil and groundwater which we are required to investigate and remediate pursuant to applicable environmental, health and safety (“EHS”) laws and regulations. Environmental compliance at our key facilities is supervised by the Direction Régionale de l’Environnement de l’Aménagement et du Logement in France, the Umweltbundesamt in Germany, the Service de la Protection de l’Environnement du Canton du Valais in Switzerland, the United States Environmental Protection Agency, West Virginia Department of Environmental Protection, the Alabama Department of the Environmental Management, the Kentucky Department for Environmental Protection,
Georgia Environmental Protection Division
and Michigan Department of Environment, Great Lakes and Energy in the United States, the Regional Authority of the Usti Region in the Czech Republic, the Slovenká Ins
v
pekcia z
v
ivotného prostredia in Slovakia, Secretaria de Medio Ambiente y Recursos Naturales in Mexico,the Environmental Monitoring Agency in China, Consellería de Medioambiente, Territorio y Vivienda in Spain and Enforcement Branch Ontario region in Canada. Violations of EHS laws and regulations, and remediation obligations arising under such laws and regulations, may result in restrictions being imposed on our operating activities as well as fines, penalties, damages or other costs. Accordingly, we have implemented EHS policies and procedures to protect the environment and ensure compliance with these laws, and incorporate EHS considerations into our planning for new projects. We perform regular risk assessments and EHS reviews. We closely and systematically monitor and manage situations of noncompliance with EHS laws and regulations and cooperate with authorities to redress any noncompliance issues. We believe that we have made adequate reserves with respect to our remediation and compliance obligations. Nevertheless, new regulations or other unforeseen increases in the number of our non-compliant situations may impose costs on us that may have a material adverse effect on our financial condition, results of operations or liquidity.
Our operations also result in the emission of substantial quantities of carbon dioxide, a greenhouse gas that is regulated under the EU’s Emissions Trading System (“ETS”). Although compliance with ETS to date has not resulted in material costs to our business, compliance with ETS requirements currently being developed for the 2021-2030 period, and increased energy costs due to ETS requirements imposed on our energy suppliers, could have a material adverse effect on our business, financial condition or results of operations. We may also be liable for personal injury claims or workers’ compensation claims relating to exposure to hazardous substances. In addition, we are, from time to time, subject to environmental reviews and investigations by relevant governmental authorities.
E.U. Directive 2010/75 titled “Industrial Emissions” regulates some of our European activities as recycling or melting/casting. With the revision of the Best Available Technics Reference of Non Ferrous Metals in 2016, which defines associated emissions limits values for these activities applicable in 2020 at the latest, staying in compliance with the law, could require significant expenditures to tune our processes or implement abatement installations.
Additionally, some of the chemicals we use in our fabrication processes are subject to REACH in the EU. Under REACH, we are required to register some of the substances contained in our products with the European Chemicals Agency, and this process could cause significant delays or costs. We are currently compliant with REACH, and expect to stay in compliance, but if the nature of the regulation changes in the future, or if the perimeter of REACH is changing (e.g. Brexit) or if substances we use currently in our process, considered as Substances of Very High Concern, fall under need of authorization for use, we may be required to make significant expenditures to reformulate the chemicals that we use in our products and materials or incur costs to register such chemicals to gain and/or regain compliance. Future noncompliance could also subject us to significant fines or other civil and criminal penalties. Obtaining regulatory approvals for chemical products used in our facilities is an important part of our operations.
We accrue for costs associated with environmental investigations and remedial efforts when it becomes probable that we are liable and the associated costs can be reasonably estimated. The aggregate close down and environmental remediation costs provisions at December 31, 2019 were €90 million. All accrued amounts have been recorded without giving effect to any possible future recoveries. With respect to ongoing environmental compliance costs, including maintenance and monitoring, we expense the costs when incurred.
-
35
-
We have incurred, and in the future will continue to incur, operating expenses related to environmental compliance. As part of the general capital expenditure plan, we expect to incur capital expenditures for other capital projects that may, in addition to improving operations, reduce certain environmental impacts as energy consumption, air emissions, water releases, waste streams optimization.
Litigation and Legal Proceedings
The Company is involved, and may become involved, in various lawsuits, claims and proceedings relating to customer claims, product liability, employee and retiree benefit matters, and other commercial matters. The Company records provisions for pending litigation matters when it determines that it is probable that an outflow of resources will be required to settle the obligation, and such amounts can be reasonably estimated. In some proceedings, the issues raised are or can be highly complex and subject to significant uncertainties and amounts claimed are and can be substantial. As a result, the probability of loss and an estimation of damages are and can be difficult to ascertain. The Company is currently subject to an arbitration by a customer claiming that Constellium supplied defective products as a result of which the customer alleges it has suffered significant damages. The Company considers that the claim is without merit on both technical and legal grounds and is vigorously defending the action. For this matter and in respect of others which the Company considers are without merit, while it is possible that an unfavorable outcome may result, after assessing the information available, the Company has concluded that it is not probable that a loss has been incurred. From time to time, asbestos-related claims are also filed against us, relating to historic asbestos exposure in our production process. We have made reserves for potential occupational disease claims for a total of €4 million as of December 31, 2019. It is not anticipated that any of our currently pending litigation and proceedings will have a material effect on the future results of the Company.
-
36
-
|
C.
|
Organizational Structure
|
The following diagram reflects our simplified corporate legal entity structure as of December 31, 2019. Percentages reflect ownership interest where ownership interest is less than 100%. The country listed for each legal entity below depicts such entity’s jurisdiction of incorporation.

-
37
-
|
D.
|
Property, Plant and Equipment
|
At December 31, 2019, we operated 28 manufacturing facilities serving both global and local customers, three R&D centers, two in Europe and one in the United States. In addition, we are building a new facility in Nanjing, China. Among our production sites, we have seven major facilities (Muscle Shoals, Alabama, Neuf-Brisach, France, Issoire, France, Ravenswood, West Virginia, Singen, Germany, Déčín, Czech Republic and Sierre, Switzerland) catering to the needs of our Aerospace & Transportation, Packaging & Automotive Rolled Products and Automotive Structures & Industry operating segments:
|
•
|
The Muscle Shoals, Alabama facility operates one of the largest and most efficient can reclamation facilities in the world. In addition, the facility utilizes multi-station electromagnetic casting, houses the widest hot line in North America and has the fastest can end stock coating line in the world. Production capabilities include body stock, tab stock, and end stock. In addition, we are producing automotive cold coils for body sheet. The capital expenditures invested in the facility were €40 million for the year ended December 31, 2019 and €44 million in the year ended December 31, 2018.
|
|
•
|
The Neuf-Brisach, France facility is an integrated aluminium rolling, finishing and recycling facility in Europe. Our investments in a can body stock slitter and recycling furnace has enabled us to secure long-term can stock contracts. Additionally, our latest investment in a new state-of-the-art automotive finishing line has further strengthened the plant’s position as a significant supplier of aluminium Auto Body Sheet in the automotive market. The capital expenditures invested in the facility were €31 million in the year ended December 31, 2019 and €32 million in the year ended December 31, 2018.
|
|
•
|
The Issoire, France facility is one of the world’s two leading aerospace plate mills based on volumes. The plant operates two Airware
®
industrial casthouses and currently uses recycling capabilities to take back scrap along the entire fabrication chain. Issoire works as an integrated platform with Ravenswood, West Virginia and Sierre, Switzerland, providing a significant competitive advantage for us as a global supplier to the aerospace industry. The capital expenditures invested in the facility were €32 million in the year ended December 31, 2019 and €32 million in the year ended December 31, 2018.
|
|
•
|
The Ravenswood, West Virginia facility has significant assets for producing aerospace plates, transportation coil and is a recognized supplier to the defense industry. The facility has stretchers and wide-coil capabilities that make it one of the few facilities in the world capable of producing plates of a size needed for the largest commercial airplanes. The capital expenditures invested in the facility were €31 million for the year ended December 31, 2019 and €28 million in the year ended December 31, 2018.
|
|
•
|
The Singen, Germany rolling plant has more than 100 years’ experience, industry leading cycle times and high-grade cold mills with special surfaces capabilities to serve automotive and other markets. The extrusion part has one of the largest extrusion presses in Europe as well as advanced and highly productive integrated automotive bumper manufacturing lines. A dedicated unit allows the production of crash management applications, battery enclosures for electric vehicles as well as other automotive structural parts ready for the OEM assembly lines. The capital expenditures invested in the facility were €38 million in the year ended December 31, 2019 and €45 million in the year ended December 31, 2018.
|
|
•
|
The Děčín, Czech Republic facility is a large extrusion facility, mainly focusing on hard alloy extrusions for automotive and industrial applications, with significant recycling capabilities. It is located near the German border, strategically positioning it to supply the German, Czech and French Tier1s and OEMs. Its integrated casthouse allows it to offer high value-add customized hard alloys to our customers. The capital expenditures invested in the facility were €13 million in the year ended December 31, 2019 and €21 million in the year ended December 31, 2018.
|
|
•
|
The Sierre, Switzerland facility is dedicated to precision plates for general engineering, aerospace plates and slabs and is a leading supplier of extruded products for high-speed train railway manufacturers and a wide range of applications. The Sierre facility includes the Steg casthouse that produces automotive, general engineering and aerospace slabs and the Chippis casthouse that has the capacity to produce non-standard billets for a wide range of extrusions. Its qualification as an aerospace plate and slabs plant increases our aerospace production capabilities. The capital expenditures invested in the facility were €15 million in the year ended December 31, 2019 and €12 million in the year ended December 31, 2018.
|
-
38
-
Our current production facilities are listed below by operating segment:
|
Operating Segment
|
Location
|
Country
|
Owned/
Leased
|
|||
|
Packaging & Automotive Rolled Products
|
Biesheim, Neuf-Brisach
|
France
|
Owned
|
|||
|
Packaging & Automotive Rolled Products
|
Singen
|
Germany
|
Owned
|
|||
|
Packaging & Automotive Rolled Products
|
Muscle Shoals, AL
|
United States
|
Owned
|
|||
|
Packaging & Automotive Rolled Products
|
Bowling Green, KY
|
United States
|
Owned
|
|||
|
Aerospace & Transportation
|
Ravenswood, WV
|
United States
|
Owned
|
|||
|
Aerospace & Transportation
|
Issoire
|
France
|
Owned
|
|||
|
Aerospace & Transportation
|
Montreuil-Juigné
|
France
|
Owned
|
|||
|
Aerospace & Transportation
|
Ussel
|
France
|
Owned
|
|||
|
Aerospace & Transportation
|
Steg
|
Switzerland
|
Owned
|
|||
|
Aerospace & Transportation
|
Sierre
|
Switzerland
|
Owned
|
|||
|
Automotive Structures & Industry
|
Van Buren, MI
|
United States
|
Leased
|
|||
|
Automotive Structures & Industry
|
Changchun, Jilin Province (JV)
(1)
|
China
|
Leased
|
|||
|
Automotive Structures & Industry
|
Děčín
|
Czech Republic
|
Owned
|
|||
|
Automotive Structures & Industry
|
Nuits-Saint-Georges
|
France
|
Owned
|
|||
|
Automotive Structures & Industry
|
Burg
|
Germany
|
Owned
|
|||
|
Automotive Structures & Industry
|
Crailsheim
|
Germany
|
Owned
|
|||
|
Automotive Structures & Industry
|
Neckarsulm
|
Germany
|
Owned
|
|||
|
Automotive Structures & Industry
|
Gottmadingen
|
Germany
|
Owned
|
|||
|
Automotive Structures & Industry
|
Landau/Pfalz
|
Germany
|
Owned
|
|||
|
Automotive Structures & Industry
|
Singen
|
Germany
|
Owned
|
|||
|
Automotive Structures & Industry
|
Levice
|
Slovakia
|
Owned
|
|||
|
Automotive Structures & Industry
|
Chippis
|
Switzerland
|
Owned
|
|||
|
Automotive Structures & Industry
|
Sierre
|
Switzerland
|
Owned
|
|||
|
Automotive Structures & Industry
|
White, GA
|
United States
|
Leased
|
|||
|
Automotive Structures & Industry
|
Lakeshore, Ontario (JV)
(2)
|
Canada
|
Leased
|
|||
|
Automotive Structures & Industry
|
San Luis Potosi
|
Mexico
|
Leased
|
|||
|
Automotive Structures & Industry
|
Zilina
|
Slovakia
|
Leased
|
|||
|
Automotive Structures & Industry
|
Vigo
|
Spain
|
Leased
|
|||
|
(1)
|
Engley is a Constellium Joint Venture with Changchun Engley Auto Parts Co. Ltd.
|
|
(2)
|
Astrex is a Constellium Joint Venture with Can Art Aluminum Extrusion Inc.
|
-
39
-
The production capacity and utilization rate for our main plants as of December 31, 2019 are listed below:
|
Plant
|
Capacity
|
Utilization Rate
|
||
|
Neuf-Brisach
|
450 kt
|
95-100%
|
||
|
Muscle Shoals
|
500-550 kt
|
80-90%
|
||
|
Issoire
|
110 kt
|
90%
|
||
|
Ravenswood
|
175 kt
|
90%
|
||
|
Děčín
|
92 kt
|
78%
|
||
|
Singen
|
290-310 kt
|
90-95%
|
||
|
Sierre
|
70-75 kt
|
50%
|
||
__________________
Production capacity and utilization rates presented above are estimates based in a theoretical output capacity assuming the plant operates with currently operating equipment and current staffing levels and product mix.
For information concerning the material plans to construct, expand or improve facilities, see “Item 5. Operating and Financial Review and Prospects—Liquidity and Capital Resources.”
None.
The following discussion and analysis is based principally on our audited Consolidated Financial Statements as of December 31, 2019 and 2018 and for each of the three years in the period ended December 31, 2019 included elsewhere in this Annual Report and is provided to supplement the audited Consolidated Financial Statements and the related notes to help provide an understanding of our financial condition, changes in financial condition, results of our operations, and liquidity. The following discussion is to be read in conjunction with Selected Financial Data and our audited Consolidated Financial Statements and the notes thereto, included elsewhere in this Annual Report.
The following discussion and analysis includes forward-looking statements. These forward-looking statements are subject to risks, uncertainties and other factors that could cause our actual results to differ materially from those expressed or implied by our forward-looking statements. Factors that could cause or contribute to these differences include, but are not limited to, those discussed below and elsewhere in this Annual Report. See in particular “Special Note about Forward-Looking Statements” and “Item 3. Key Information—D. Risk Factors.”
Company Overview
We are a global leader in the development, manufacture and sale of a broad range of highly engineered, value-added specialty rolled and extruded aluminium products to the packaging, aerospace, automotive, other transportation and industrial end-markets. As of December 31, 2019, we had approximately 13,200 employees, 28 production facilities, three administrative centers, and three R&D centers.
Our Operating Segments
We serve a diverse set of customers across a broad range of end-markets with very different product needs, specifications and requirements. As a result, we have organized our business into three segments to better serve our customer base.
Packaging & Automotive Rolled Products Segment
Our Packaging & Automotive Rolled Products segment produces aluminium sheet and coils. Approximately 75% of segment volume for the year ended December 31, 2019 was packaging rolled products, which primarily includes beverage and food can stock as well as closure stock and foil stock. Approximately 21% of the segment volume for this period was automotive rolled products and the balance of the segment volume was specialty and other thin-rolled products.
-
40
-
Our Packaging & Automotive Rolled Products segment accounted for 53% of revenue and 49% of Adjusted EBITDA for the year ended December 31, 2019.
Aerospace & Transportation Segment
Our Aerospace & Transportation segment has market leadership positions in technologically advanced aluminium and specialty materials products with applications across the global aerospace, defense, transportation, and industrial sectors. We offer a wide range of products, including plate and sheet. Approximately 50% of the segment volume for the year ended December 31, 2019 was aerospace rolled products and approximately 50% was transportation industry and other rolled products. Our Aerospace & Transportation segment accounted for 24% of revenue and 36% of Adjusted EBITDA for the year ended December 31, 2019.
Automotive Structures & Industry Segment
Our Automotive Structures & Industry segment produces technologically advanced structures for the automotive industry, (including crash-management systems, body structures, side impact beams and battery enclosures), soft and hard alloy extrusions and large extruded profiles for automotive, railroad, energy, building and industrial applications. Approximately 49% of the segment volume for the year ended December 31, 2019 was automotive extruded products and approximately 51% was other extruded products. Our Automotive Structures & Industry segment accounted for 23% of revenue and 19% of Adjusted EBITDA for the year ended December 31, 2019.
Acquisitions
On January 10, 2019, pursuant to a purchase agreement with UACJ and its U.S. subsidiary, Tri-Arrows Aluminum Holding Inc. (“TAAH”), we acquired TAAH’s 49% stake in Constellium-UACJ ABS, LLC, which was renamed Constellium Bowling Green LLC, ("Bowling Green"), for $100 million plus the assumption of 49% of approximately $80 million of third party debt at Bowling Green. In connection with the agreement with UACJ and TAAH, we and TAAH agreed to certain transitional commercial arrangements connected to the continuing operations and the business, including an agreement for a multiyear supply of cold coils. Bowling Green, which was previously accounted for under the equity method, is now consolidated and its results are reflected in our 2019 consolidated results.
Discontinued Operations and Disposals
In July 2018, we completed the sale of the North Building Assets of our Sierre plant in Switzerland (which have been leased to and operated by Novelis since 2005) and we contributed the plant’s shared infrastructure to a 50-50 joint venture with Novelis, in exchange for cash consideration of €200 million. This transaction generated a €190 million net gain and also resulted in the termination of the existing lease agreement . We continue to own and operate our cast houses, plate and extrusion manufacturing plants and other manufacturing assets in Sierre. As part of this agreement, we also entered into long-term production and metal supply agreements with Novelis.
Key Factors Influencing Constellium’s Financial Condition and Results from Operations
The financial performance of our operations is dependent on several factors, the most critical of which are as follows:
Economic Conditions and Markets
We are directly impacted by the economic conditions that affect our customers and the markets in which they operate. General economic conditions such as the level of disposable income, the level of inflation, the rate of economic growth, the rate of unemployment, exchange rates and currency devaluation or revaluation—influence consumer confidence and consumer purchasing power. These factors, in turn, influence the demand for our products in terms of total volumes and prices that can be charged. In some cases we are able to mitigate the risk of a downturn in our customers’ businesses by building committed minimum volume thresholds into our commercial contracts. We further seek to mitigate the risk of a downturn by utilizing a temporary workforce for certain operations, which allows us to match our resources with the demand for our services.
-
41
-
Although the metals industry and our end-markets are cyclical in nature and expose us to related risks, we believe that our portfolio is relatively resilient to these economic cycles in each of our three main end-markets of packaging, aerospace and automotive:
|
•
|
Can packaging tends not to be highly correlated to the general economic cycle. In addition, we believe European canstock has an attractive long-term growth outlook due to ongoing trends in (i) growth in beer, soft drinks and energy drinks consumption, (ii) increasing use of cans versus glass in the beer market, and (iii) increasing penetration of aluminium in canstock at the expense of tinplate.
|
|
•
|
We believe that the aerospace industry is currently insulated from economic cycles by a combination of growth drivers. These drivers include increasing passenger traffic and the fleet replacement towards newer and more fuel efficient aircrafts. These factors have materialized in the form of historically high backlogs for the aircraft manufacturers. The combined order backlog for Boeing and Airbus represents approximately eight- to nine-years of manufacturing at current build rates.
|
|
•
|
Although the automotive industry is a cyclical industry, its demand for aluminium has been increasing in recent years. This has been triggered by a light-weighting trend for new car models and electric vehicles, which drives substitution of heavier metals in favor of aluminium.
|
Aluminium Consumption
The aluminium industry is cyclical and is affected by global economic conditions, industry competition and product development. Aluminium is increasingly seen as the material of choice in a number of applications, including packaging, aerospace and automotive. Aluminium is lightweight, has a high strength-to-weight ratio and is resistant to corrosion. It compares favorably to several alternative materials, such as steel, in these respects. Aluminium is also unique in that it recycles repeatedly without any material decline in performance or quality. The recycling of aluminium delivers energy and capital investment savings relative to the cost of producing both primary aluminium and many other competing materials. Due to these qualities, the penetration of aluminium into a wide variety of applications continues to increase. We believe that long-term growth in aluminium consumption generally, and demand for those products we produce specifically, will be supported by factors that include growing populations, greater purchasing power and increasing focus on sustainability and environmental issues, globally.
Aluminium Prices
Aluminium prices are determined by worldwide forces of supply and demand and, as a result they are volatile. We operate a pass–through model and therefore to the extent possible avoid taking aluminium price risk. Significant sustained increases in the price of aluminium, however, may over time affect the demand for our products.
The price we pay for aluminium includes regional premiums, such as the Rotterdam premium for metal purchased in Europe or the Midwest premium for metal purchased in the U.S. The regional premiums, which had historically been fairly stable, have been more volatile in recent years. Although our business model seeks to minimize the impact of aluminium price fluctuations on our cash flows, we are not always able to pass through the cost of regional premiums to our customers or adequately hedge the impact of regional premium differentials. See “Item 3. Key Information—D. Risk Factors—Risks Related to Our Industry—If we are unable to substantially pass on to our customers the cost of price increases of our raw materials, which may be subject to volatility, our profitability could be adversely affected.”
We believe our cash flows are largely protected from variations in LME prices due to the fact that we hedge our sales based on their replacement cost, by
matching the price paid for our aluminium purchases with the price received from our aluminium sales, at a given time, using hedges when necessary
. As a result, when LME prices increase, we have limited additional cash requirements to finance the increased replacement cost of our inventory.
The average LME transaction price, Midwest Premium and Rotterdam Premium per ton of primary aluminium in the years ended December 31, 2019, 2018 and 2017 are presented below:
-
42
-
Average quarterly LME per ton using U.S. dollar prices converted to Euros at the applicable European Central Bank rates:
|
(Euros/ton)
|
2019
|
2018
|
2017
|
||||||
|
First Quarter
|
1,637
|
|
1,757
|
|
1,737
|
|
|||
|
Second Quarter
|
1,595
|
|
1,896
|
|
1,736
|
|
|||
|
Third Quarter
|
1,585
|
|
1,769
|
|
1,714
|
|
|||
|
Fourth Quarter
|
1,583
|
|
1,726
|
|
1,786
|
|
|||
|
Average for the year
|
1,600
|
|
1,786
|
|
1,743
|
|
|||
Average quarterly Midwest Premium per ton using U.S. dollar prices converted to Euros at the applicable European Central Bank rates:
|
(Euros/ton)
|
2019
|
2018
|
2017
|
||||||
|
First Quarter
|
375
|
|
246
|
|
198
|
|
|||
|
Second Quarter
|
371
|
|
404
|
|
180
|
|
|||
|
Third Quarter
|
355
|
|
390
|
|
144
|
|
|||
|
Fourth Quarter
|
329
|
|
376
|
|
176
|
|
|||
|
Average for the year
|
357
|
|
354
|
|
175
|
|
|||
Average quarterly Rotterdam Premium per ton using U.S. dollar prices converted to Euros at the applicable European Central Bank rates:
|
(Euros/ton)
|
2019
|
2018
|
2017
|
||||||
|
First Quarter
|
116
|
|
134
|
|
137
|
|
|||
|
Second Quarter
|
130
|
|
170
|
|
131
|
|
|||
|
Third Quarter
|
137
|
|
135
|
|
120
|
|
|||
|
Fourth Quarter
|
123
|
|
116
|
|
135
|
|
|||
|
Average for the year
|
127
|
|
139
|
|
131
|
|
|||
Product Price and Margin
Our products are typically priced based on three components: (i) LME, (ii) regional premiums and (iii) a conversion margin. We seek to minimize the impact of aluminium price fluctuations in order to protect our cash flows against the LME and regional price fluctuations with the following methods:
|
•
|
In cases where we are able to align the price and quantity of physical aluminium purchases with that of physical aluminium sales to customers, we enter back-to-back arrangements with our customers.
|
|
•
|
However, when we are unable to align the price and quantity of physical aluminium purchases with that of physical aluminium sales to our customers, we enter into derivative financial instruments to pass through the exposure to financial institutions at the time the price is set.
|
|
•
|
For a small portion of our volumes, the aluminium we process is owned by our customers and we bear no aluminium price risk.
|
Our risk management practices aim to reduce, but do not entirely eliminate, our exposure to changing primary aluminium and regional premium prices. Moreover, while we limit our exposure to unfavorable price changes, we also limit our ability to benefit from favorable price changes. As we do not apply hedge accounting for the derivative instruments entered into to hedge our exposure to changes in metal prices, mark-to-market movements for these instruments are recognized in “Other gains/(losses)—net.”
-
43
-
Our results are also impacted by differences between changes in the prices of primary and scrap aluminium. As we price our product using the prevailing price of primary aluminium but purchase large amounts of scrap aluminium to manufacture our products, we benefit when primary aluminium price increases exceed scrap price increases. Conversely, when scrap price increases exceed primary aluminium price increases, our results are negatively impacted. The difference between the price of primary aluminium and scrap prices is referred to as the “scrap spread” and is impacted by the effectiveness of our scrap purchasing activities, the supply of scrap available and movements in the terminal commodity markets.
The conversion margin is the margin we earn over the cost of our metal inputs. We seek to maximize our conversion margins based on the value-added product capabilities we provide and the supply/demand dynamics in the market.
Volumes
The profitability of our businesses is determined, in part, by the volume of tons processed and sold. Increased production volumes will generally result in lower per unit costs, while higher sold volumes of tons will generally result in additional revenue and associated margins.
Personnel Costs
Our operations are labor intensive and, as a result, our personnel costs represent 18%, 17% and 18% of our cost of sales, selling and administrative expenses and R&D expenses for the years ended December 31, 2019, 2018, and 2017, respectively.
Personnel costs generally increase and decrease proportionately with the expansion, addition or closing of operating facilities. Personnel costs include the salaries, wages and benefits of our employees, as well as costs related to temporary labor. During our seasonal peaks and especially during the summer months, we have historically increased our temporary workforce to compensate for staff on vacation and increased volume of activity.
Currency
We are a global company with operations in France, the United States, Germany, Switzerland, the Czech Republic, Slovakia, Spain, Mexico, Canada and China, as of December 31, 2019. As a result, our revenue and earnings have exposure to a number of currencies, primarily the euro, the U.S. dollar and the Swiss Franc. As our presentation currency is the euro, and the functional currencies of the businesses located outside of the Eurozone are primarily the U.S. dollar and the Swiss franc, the results of the businesses located outside of the Eurozone must be translated each period to euros. Accordingly, fluctuations in the exchange rate of the functional currencies of our businesses located outside of the Eurozone against the euro impacts our results of operations.
We engage in significant hedging activity to attempt to mitigate the effects of foreign currency transactions on our profitability. Transaction impacts arise when our businesses transact in a currency other than their own functional currency. As a result, we are exposed to foreign exchange risk on payments and receipts in multiple currencies. In Europe, a portion of our revenue is denominated in U.S. dollars while the majority of our costs incurred are denominated in local currencies. Where we have multiple-year sales agreements for the sale of fabricated metal products in U.S. dollars by euro-functional currency entities, we have entered into derivative contracts to forward sell U.S. dollars to match these future sales. With the exception of certain derivative instruments entered into to hedge the foreign currency risk associated with the cash flows of certain highly probable forecasted sales, which we have designated for hedge accounting, hedge accounting is not applied to such ongoing commercial transactions and therefore the mark-to-market impact is recorded in “Other gains/(losses)—net”.
-
44
-
Results of Operations
Results of Operations for the years ended December 31, 2019 and 2018
|
For the year ended December 31,
|
||||||||||||
|
2019
|
2018
|
|||||||||||
|
(€ in millions and as a % of revenue)
|
||||||||||||
|
%
|
%
|
|||||||||||
|
Revenue
|
5,907
|
|
100
|
%
|
5,686
|
|
100
|
%
|
||||
|
Cost of sales
|
(5,305
|
)
|
90
|
%
|
(5,148
|
)
|
91
|
%
|
||||
|
Gross profit
|
602
|
|
10
|
%
|
538
|
|
9
|
%
|
||||
|
Selling and administrative expenses
|
(276
|
)
|
5
|
%
|
(247
|
)
|
4
|
%
|
||||
|
Research and development expenses
|
(48
|
)
|
1
|
%
|
(40
|
)
|
1
|
%
|
||||
|
Restructuring costs
|
(4
|
)
|
—
|
%
|
(1
|
)
|
—
|
%
|
||||
|
Other gains / (losses) net
|
(19
|
)
|
—
|
%
|
154
|
|
3
|
%
|
||||
|
Income from operations
|
255
|
|
4
|
%
|
404
|
|
7
|
%
|
||||
|
Finance costs, net
|
(175
|
)
|
3
|
%
|
(149
|
)
|
3
|
%
|
||||
|
Share of income / (loss) of joint ventures
|
2
|
|
—
|
%
|
(33
|
)
|
1
|
%
|
||||
|
Income before income taxes
|
82
|
|
1
|
%
|
222
|
|
4
|
%
|
||||
|
Income tax expense
|
(18
|
)
|
—
|
%
|
(32
|
)
|
1
|
%
|
||||
|
Net income / (loss)
|
64
|
|
1
|
%
|
190
|
|
3
|
%
|
||||
|
Shipment volumes (in kt)
|
1,589
|
|
n/a
|
|
1,534
|
|
n/a
|
|
||||
|
Revenue per ton (€ per ton)
|
3,717
|
|
n/a
|
|
3,707
|
|
n/a
|
|
||||
Revenue
Revenue increased by 4%, or €221 million, to €5,907 million for the year ended December 31, 2019, from €5,686 million for the year ended December 31, 2018. This increase reflects a 4% increase in shipments, improved price and a better mix, despite lower metal prices.
Sales volumes increased by 4%, or 55 kt, to 1,589 kt for the year ended December 31, 2019 compared to 1,534 kt for the year ended December 31, 2018. This increase is mostly driven by higher shipment volumes in P&ARP, in large part due to the consolidation of Bowling Green in 2019.
Average sales prices increased by €10 per ton, from €3,707 to €3,717, reflecting improved price and a better mix offset by lower metal prices.
Our revenue is discussed in more detail in the “Segment Results” section.
Cost of Sales
Cost of sales increased by 3%, or €157 million, to €5,305 million for the year ended December 31, 2019, from €5,148 million for the year ended December 31, 2018. This increase in cost of sales reflected the consolidation of Bowling Green and was primarily driven by an increase of €91 million, or 12%, in labor costs compared to the prior year, a €54 million increase in depreciation (of which €18 million was attributable to the implementation of IFRS 16) and a €23 million increase in energy costs.
Selling and Administrative Expenses
Selling and administrative expenses increased by 12% from €247 million for the year ended December 31, 2018 to €276 million for the year ended December 31, 2019 resulting from i) a €20 million increase in employee benefit expenses reflecting an increased headcount in the U.S. and Europe for €8 million and the consolidation of Bowling Green for €5 million and ii) a €9 million increase due to professional fees for process improvements and IT projects.
-
45
-
Research and Development Expenses
Research and development expenses increased by 20% or €8 million, to €48 million for the year ended December 31, 2019, from €40 million for the year ended December 31, 2018. Research and development expenses are presented net of €12 million and €10 million of research and development tax credits received in France for the years ended December 31, 2019 and 2018, respectively. Research and development expenses, excluding tax credits received were €22 million, €19 million, €15 million and €4 million for the P&ARP, A&T, AS&I and Holding & Corporate segments, respectively, in the year ended December 31, 2019.
Restructuring Costs
In the year ended December 31, 2019, restructuring costs amounted to €4 million and were primarily related to restructuring activities in our AS&I segment. Restructuring costs amounted to €1 million in the year ended December 31, 2018, and were primarily incurred in connection with restructuring activities at our German operations.
Other Gains / (losses), net
|
For the year ended December 31,
|
||||||
|
2019
|
2018
|
|||||
|
(€ in millions)
|
||||||
|
Realized (losses) / gains on derivatives
|
(49
|
)
|
14
|
|
||
|
Unrealized gains / (losses) on derivatives at fair value through profit and loss—net
|
33
|
|
(84
|
)
|
||
|
Unrealized exchange gains / (losses) from the remeasurement of monetary assets and liabilities—net
|
—
|
|
—
|
|
||
|
Gains on pension plan amendments
|
1
|
|
36
|
|
||
|
(Losses) / gains on disposal
|
(3
|
)
|
186
|
|
||
|
Other—net
|
(1
|
)
|
2
|
|
||
|
Total other gains / (losses), net
|
(19
|
)
|
154
|
|
||
Other gains / (losses), net were €(19) million for the year ended December 31, 2019 compared to Other gains—net of €154 million for the year ended December 31, 2018. The company uses financial derivatives to hedge underlying commercial transactions. The realized gains / (losses) recognized in Other gains / (losses), net are offset by the commercial transactions accounted for in Cost of sales. In the year ended December 31, 2019, realized losses recognized upon the settlement of derivative instruments amounted to €49 million, of which realized losses on metal derivatives were €56 million and realized gains on foreign exchange derivatives were €7 million. In the year ended December 31, 2018, realized gains recognized upon the settlement of derivative instruments amounted to €14 million, of which realized gains on metal derivatives were €7 million and realized gains on foreign exchange derivatives were €7 million.
The Company uses financial derivatives to also hedge forecasted commercial transactions. These unrealized gains / (losses) recognized in Other gains / (losses), net are offset by the change in the value of forecasted transactions which are not yet accounted for. Unrealized gains on derivative instruments amounted to €33 million in the year ended December 31, 2019 and were primarily comprised of gains of €31 million related to metal derivatives and of gains of €2 million related to foreign exchange derivatives. Unrealized losses on derivative instruments amounted to €84 million in the year ended December 31, 2018 and were primarily comprised of €83 million of losses related to metal derivatives and €1 million of losses related to foreign exchange derivatives.
In the year ended December 31, 2018, we recognized a €36 million net gain relating to an OPEB plan amendment in the United States.
Gains on disposal recognized in the year ended December 31, 2018 primarily related to the sale of North Building Assets of our Sierre plant in Switzerland.
-
46
-
Finance Costs, net
Finance costs, net increased by €26 million, to €175 million for the year ended December 31, 2019, from €149 million for the year ended December 31, 2018. This increase primarily reflects higher interest expense as a result of the implementation of IFRS 16 -
Leases
for €8 million, and the effect of a a stronger dollar. In addition, Finance costs, net in the year ended December 31, 2018 included €7 million of interest received from Bowling Green which was accounted for at the time under the equity method. There was no interest received from Bowling Green in the year ended December 31, 2019 as the entity was consolidated.
In the year ended December 31, 2019, foreign exchange net losses from the revaluation of the portion of our U.S. dollar-denominated debt held by Euro functional currency entities amounted to €3 million and were offset by gains on derivative instruments entered into to hedge this exposure. In the year ended December 31, 2018, foreign exchange net losses from the revaluation of the portion of our U.S. dollar-denominated debt held by Euro functional currency entities amounted to €22 million and were offset by gains on derivative instruments entered into to hedge this exposure.
Share of loss of joint-ventures
Our share of loss of joint-ventures for the year ended December 31, 2018 amounted to €33 million and was comprised primarily of our share in the net results of Bowling Green, which was accounted for under the equity method until January 10, 2019. On January 10, 2019, we acquired the 49% of Bowling Green that we did not previously own, and we began consolidating the entity as of that date.
Income Tax
Income tax expense was €18 million for the year ended December 31, 2019 compared to €32 million for the year ended December 31, 2018.
Our effective tax rate represented 22% of our income before income tax for the year ended December 31, 2019 and 14% of our income before income tax for the year ended December 31, 2018. This change in our effective tax rate primarily reflects an increase in the composite statutory tax rate applicable by tax jurisdiction (the “blended tax rate”) and the impact of significant reconciling items between the blended tax rate and the effective tax rate in both years.
Our blended tax rate increased from 24% in the year ended December 31, 2018 to 30% in the year ended December 31, 2019 primarily as a result of changes in the geographical mix of our pre-tax results.
The effective tax rate for the year ended December 31, 2019 applies to €82 million of pre-tax income and is lower than our blended statutory tax rate primarily as a result of the impact of the Swiss Tax Reform, partially offset by the effect of unrecognized deferred tax assets in jurisdictions where we believe it is more likely than not that those assets will not be used.
The effective tax rate for the year ended December 31, 2018 applies to €222 million of pre-tax income and is lower than our blended statutory tax rate primarily as a result of the favorable effect of previously unrecognized tax losses carried forward in Switzerland which were used in the year ended December 31, 2018 to offset the taxable profit generated by the sale of the North Building Assets of our Sierre plant in Switzerland.
Net Income / loss
As a result of the factors above, we recognized a net income of €64 million, in the year ended December 31, 2019 compared to €190 million in the year ended December 31, 2018.
-
47
-
Results of Operations for the years ended December 31, 2018 and 2017
|
For the year ended December 31,
|
||||||||||||
|
2018
|
2017
|
|||||||||||
|
(€ in millions and as a % of revenue)
|
||||||||||||
|
%
|
%
|
|||||||||||
|
Revenue
|
5,686
|
|
100
|
%
|
5,237
|
|
100
|
%
|
||||
|
Cost of sales
|
(5,148
|
)
|
91
|
%
|
(4,682
|
)
|
89
|
%
|
||||
|
Gross profit
|
538
|
|
9
|
%
|
555
|
|
11
|
%
|
||||
|
Selling and administrative expenses
|
(247
|
)
|
4
|
%
|
(247
|
)
|
5
|
%
|
||||
|
Research and development expenses
|
(40
|
)
|
1
|
%
|
(36
|
)
|
1
|
%
|
||||
|
Restructuring costs
|
(1
|
)
|
—
|
%
|
(4
|
)
|
—
|
%
|
||||
|
Other gains net
|
154
|
|
3
|
%
|
70
|
|
1
|
%
|
||||
|
Income from operations
|
404
|
|
7
|
%
|
338
|
|
6
|
%
|
||||
|
Finance costs, net
|
(149
|
)
|
3
|
%
|
(260
|
)
|
5
|
%
|
||||
|
Share of loss of joint ventures
|
(33
|
)
|
1
|
%
|
(29
|
)
|
1
|
%
|
||||
|
Income before income taxes
|
222
|
|
4
|
%
|
49
|
|
1
|
%
|
||||
|
Income tax expense
|
(32
|
)
|
1
|
%
|
(80
|
)
|
2
|
%
|
||||
|
Net income / (loss)
|
190
|
|
3
|
%
|
(31
|
)
|
1
|
%
|
||||
|
Shipment volumes (in kt)
|
1,534
|
|
n/a
|
|
1,482
|
|
n/a
|
|
||||
|
Revenue per ton (€ per ton)
|
3,707
|
|
n/a
|
|
3,534
|
|
n/a
|
|
||||
Revenue
Revenue increased by 9% or €449 million to €5,686 million for the year ended December 31, 2018, from €5,237 million for the year ended December 31, 2017. This increase reflects a 3% increase in shipments and higher average revenue per ton.
Sales volumes increased by 3%, or 52 kt, to 1,534 kt for the year ended December 31, 2018 compared to 1,482 kt for the year ended December 31, 2017. This increase is driven by higher shipment volumes across all of our three segments.
Average sales prices increased by €173 per ton, or 5%, from €3,534 to €3,707, mainly attributable to the year-over-year increase in aluminium market prices, coupled with the rise in regional premium primarily in North America.
Our revenue is discussed in more detail in the “Segment Results” section.
Cost of Sales
Cost of sales increased by 10%, or €466 million, to €5,148 million for the year ended December 31, 2018, from €4,682 million for the year ended December 31, 2017. This increase in cost of sales was primarily driven by an increase of €364 million, or 11%, in the total cost of raw material and consumables used primarily as a result of higher LME prices and regional premiums, compared to the prior year, a €24 million increase in depreciation, a €17 million increase in labor costs and a €19 million increase in freight out costs.
Selling and Administrative Expenses
Selling and administrative expenses were stable and amounted to €247 million for the years ended December 31, 2018 and December 31, 2017.
Research and Development Expenses
Research and development expenses increased by 11% or €4 million, to €40 million for the year ended December 31, 2018, from €36 million for the year ended December 31, 2017. Research and development expenses are presented net of €10 million and €11 million of research and development tax credits received in France for the years ended December 31, 2018
-
48
-
and 2017, respectively. Research and development expenses, excluding tax credits received were €18 million, €21 million, and €11 million for the P&ARP, A&T, and AS&I segments, respectively, in the year ended December 31, 2018.
Restructuring Costs
In the year ended December 31, 2018, restructuring costs amounted to €1 million and were primarily related to our restructuring activities of German operations. Restructuring costs amounted to €4 million in the year ended December 31, 2017, and were primarily incurred in connection with restructuring activities at our German and Swiss operations.
Other Gains / (losses), net
|
For the year ended December 31,
|
||||||
|
2018
|
2017
|
|||||
|
(€ in millions)
|
||||||
|
Realized gains on derivatives
|
14
|
|
—
|
|
||
|
Unrealized (losses)/gains on derivatives at fair value through profit and loss—net
|
(84
|
)
|
57
|
|
||
|
Unrealized exchange (losses) from the remeasurement of monetary assets and liabilities—net
|
—
|
|
(4
|
)
|
||
|
Gains on pension plan amendments
|
36
|
|
20
|
|
||
|
Gains /(losses) on disposal
|
186
|
|
(3
|
)
|
||
|
Other—net
|
2
|
|
—
|
|
||
|
Total other gains / (losses), net
|
154
|
|
70
|
|
||
Other gains / (losses)—net were €154 million for the year ended December 31, 2018 compared to Other gains—net of €70 million for the year ended December 31, 2017. In the year ended December 31, 2018, realized gains recognized upon the settlement of derivative instruments amounted to €14 million, of which realized gains on metal derivatives were €7 million and realized gains on foreign exchange derivatives were €7 million. In the year ended December 31, 2017, realized gains recognized upon the settlement of derivative instruments amounted to €0 million, of which realized gains recognized upon the settlement of derivative instruments amounted to €16 million and realized losses on foreign exchange derivatives were €16 million.
Unrealized losses on derivative instruments amounted to €84 million in the year ended December 31, 2018 and were primarily comprised of €83 million of losses related to metal derivatives and of €1 million of losses related to foreign exchange derivatives. Unrealized gains on derivative instruments amounted to €57 million in the year ended December 31, 2017 and were primarily comprised of €41 million of gains related to metal derivatives and of €16 million of gains related to foreign exchange derivatives.
In the year ended December 31, 2018, we recognized a €36 million net gain relating to an OPEB plan amendment in the United States. In the year ended December 31, 2017, we recognized a €20 million net gain relating to benefit plan amendments in Switzerland and in the United States.
Gains on disposal recognized in the year ended December 31, 2018 primarily related to the sale of North Building Assets of our Sierre plant in Switzerland. Losses on disposal recognized in the year ended December 31, 2017 primarily related to the write-off of abandoned development projects in the A&T segment.
Finance Costs, net
Finance costs, net decreased by €111 million, to €149 million for the year ended December 31, 2018, from €260 million for the year ended December 31, 2017. Of this decrease, €91 million reflects net losses on the settlement of debt incurred in February 2017 and November 2017 in connection with refinancing transactions and €29 million reflects the benefits of lower interest rates as a result of these refinancing transactions.
In the year ended December 31, 2018, foreign exchange net losses from the revaluation of the portion of our U.S. dollar-denominated debt held by Euro functional currency entities amounted to €22 million and were offset by gains on derivative instruments entered into to hedge this exposure. In the year ended December 31, 2017, foreign exchange net gains from the
-
49
-
revaluation of the portion of our U.S. dollar-denominated debt held by Euro functional currency entities amounted to €91 million and were largely offset by losses on derivative instruments entered into to hedge this exposure.
Share of loss of joint-ventures
Our share of loss of joint-ventures for the year ended December 31, 2018 amounted to €33 million compared to €29 million for the year ended December 31, 2017 and is comprised primarily of our share in the net results of Constellium-UACJ ABS LLC, which is accounted for under the equity method. On January 10, 2019, we acquired the 49% of Constellium-UACJ ABS LLC that we did not previously own.
Income Tax
Income tax was an expense of €32 million for the year ended December 31, 2018 compared to an income tax expense of €80 million for the year ended December 31, 2017.
Our effective tax rate represented 14% of our income before income tax for the year ended December 31, 2018 and 163% of our income before income tax for the year ended December 31, 2017. This change in our effective tax rate primarily reflects a decrease in the composite statutory tax rate applicable by tax jurisdiction (the “blended tax rate”), from 32% in 2017 to 24% in 2018 and the impact of significant reconciling items between the blended tax rate and the effective tax rate in both years.
The change in our blended rate mainly resulted from changes in the geographical mix of our pre-tax results, the decrease of the U.S. tax rate from 40% in 2017 to 26% in 2018 and decrease in the tax rate in France from 39.2% in 2017 to 34.4% for fiscal year 2018.
The effective tax rate for the year ended December 31, 2018 applied to €222 million of pre-tax income and was lower than our blended statutory tax rate primarily as a result of the favorable effect of previously unrecognized tax losses carried forward in Switzerland which were used in the year ended December 31, 2018 to offset the taxable profit generated by the sale of the North Building Assets of our Sierre plant in Switzerland.
The effective tax rate for the year ended December 31, 2017 applies to €49 million of pre-tax income and is significantly higher than our projected blended statutory tax rate primarily as a result of the unfavorable effect of unrecognized tax benefits for losses in jurisdictions where we believe it is more likely than not that we will not be able to utilize those losses and a €16 million unfavorable impact from the U.S. tax reform on deferred taxes.
Net Income / loss
As a result of the factors above, we recognized a net income of €190 million, in the year ended December 31, 2018 compared to a net loss of €31 million in the year ended December 31, 2017.
-
50
-
Segment Results
Segment Revenue
The following table sets forth the revenue for our operating segments for the periods presented:
|
For the year ended December 31,
|
||||||||||||||||||
|
2019
|
2018
|
2017
|
||||||||||||||||
|
(millions of € and as a % of revenue)
|
||||||||||||||||||
|
P&ARP
|
3,149
|
|
53
|
%
|
3,059
|
|
54
|
%
|
2,812
|
|
54
|
%
|
||||||
|
A&T
|
1,462
|
|
24
|
%
|
1,389
|
|
23
|
%
|
1,335
|
|
25
|
%
|
||||||
|
AS&I
|
1,351
|
|
23
|
%
|
1,290
|
|
23
|
%
|
1,123
|
|
21
|
%
|
||||||
|
Holdings and Corporate
|
—
|
|
—
|
%
|
10
|
|
—
|
%
|
13
|
|
—
|
%
|
||||||
|
Inter-segment eliminations
|
(55
|
)
|
n.m.
|
|
(62
|
)
|
n.m.
|
|
(46
|
)
|
n.m.
|
|
||||||
|
Total revenue
|
5,907
|
|
100
|
%
|
5,686
|
|
100
|
%
|
5,237
|
|
100
|
%
|
||||||
n.m. not meaningful
P&ARP
. Revenue in our P&ARP segment increased by 3%, or €90 million, to €3,149 million in the year ended December 31, 2019, from €3,059 million for the year ended December 31, 2018, reflecting primarily higher shipments partially due to the consolidation of Bowling Green, despite lower revenue per ton driven by lower metal prices. P&ARP shipments were up 58 kt, reflecting a 38 kt, or 19%, increase in Automotive rolled products shipments partially due to the consolidation of Bowling Green and a 23kt, or 3% increase in Packaging rolled products shipments. Revenue per ton decreased by 3% to €2,871 per ton in the year ended December 31, 2019 from €2,944 per ton in the year ended December 31, 2018, primarily as a result of lower metal prices.
Revenue in our P&ARP segment increased by 9%, or €247 million, to €3,059 million in the year ended December 31, 2018, from €2,812 million for the year ended December 31, 2017, reflecting primarily higher shipments and revenue per ton driven by higher metal prices. P&ARP shipments were up 31 kt, reflecting a 38 kt, or 24%, increase in Automotive rolled products shipments offsetting lower shipments in Packaging rolled products. Revenue per ton increased by 6% to €2,944 per ton in the year ended December 31, 2018 from €2,789 per ton in the year ended December 31, 2017, primarily as a result of higher metal prices.
A&T
. Revenue at our A&T segment increased by €73 million, or 5% to €1,462 million in the year ended December 31, 2019 from €1,389 million in the year ended December 31, 2018, reflecting higher revenue per ton driven by improved price and a better mix despite lower metal prices. A&T shipments decreased by 2% or 4kt, reflecting a 9kt increase in Aerospace rolled products shipments offset by a 13kt decrease in Transportation, industry and other rolled products shipments. Revenue per ton increased by 7% to €6,041 per ton in the year ended December 31, 2019 from €5,646 per ton in the year ended December 31, 2018, primarily reflecting better Aerospace rolled products mix, and higher prices on Transportation, industry and other rolled products despite lower metal prices.
Revenue at our A&T segment increased by €54 million, or 4% to €1,389 million in the year ended December 31, 2018 from €1,335 million in the year ended December 31, 2017, reflecting increasing shipments and higher revenue per ton driven by higher metal prices. A&T shipments increased by 3% or 8kt, reflecting a 5kt increase in Aerospace rolled products shipments and a 3kt increase in shipments in Transportation, industry and other rolled products. Revenue per ton increased by 1% to €5,646 per ton in the year ended December 31, 2018 from €5,618 per ton in the year ended December 31, 2017, primarily reflecting higher metal prices partially offset by foreign exchange translation.
AS&I
. Revenue in our AS&I segment increased by 5%, or €61 million, to €1,351 million for the year ended December 31, 2019, from €1,290 million for the year ended December 31, 2018, reflecting higher revenue per ton driven by improved price and a better mix partially offset by lower metal prices. AS&I shipments were stable with a 1kt increase, reflecting a 8% or 9kt increase in Automotive extruded products shipments partially offset by a 6% or 8kt decrease in Other extruded products shipments. Revenue per ton increased by 4% to €5,404 per ton in the year ended December 31, 2019 from €5,181 per ton in the year ended December 31, 2018, reflecting improved Automotive extruded product mix.
-
51
-
Revenue in our AS&I segment increased by 15%, or €167 million, to €1,290 million for the year ended December 31, 2018, from €1,123 million for the year ended December 31, 2017, reflecting higher shipments and higher revenue per ton driven by improved price and mix. AS&I shipments increased 6%, or 13kt, reflecting a 5% or 5kt increase in Automotive extruded products shipments and a 7% or 8kt increase in Other extruded products shipments. Revenue per ton increased by 9% to €5,181 per ton in the year ended December 31, 2018 from €4,756 per ton in the year ended December 31, 2017, reflecting higher metal prices, and improved product mix.
Holdings and Corporate
. Revenue in the Holdings and Corporate segment for the year ended 2018 was primarily related to metal sales that were incidental to our core business.
Adjusted EBITDA
Adjusted EBITDA is not a measure defined by IFRS. We believe the most directly comparable IFRS measure to Adjusted EBITDA is our net income or loss for the relevant period.
In considering the financial performance of the business, management analyzes the primary financial performance measure of Adjusted EBITDA in all of our business segments. Our Chief Operating Decision Maker (“CODM”) measures the profitability and financial performance of our operating segments based on Adjusted EBITDA. Adjusted EBITDA is defined as income/(loss) from continuing operations before income taxes, results from joint ventures, net finance costs, other expenses and depreciation and amortization as adjusted to exclude restructuring costs, impairment charges, unrealized gains or losses on derivatives and on foreign exchange differences on transactions that do not qualify for hedge accounting, metal price lag, share-based compensation expense, effects of certain purchase accounting adjustments, start-up and development costs or acquisition, integration and separation costs, certain incremental costs and other exceptional, unusual or generally non-recurring items.
We believe Adjusted EBITDA, as defined above, is useful to investors as it illustrates the underlying performance of continuing operations by excluding non-recurring and non-operating items. Similar concepts of adjusted EBITDA are frequently used by securities analysts, investors and other interested parties in their evaluation of our company and in comparison to other companies, many of which present an adjusted EBITDA-related performance measure when reporting their results.
Adjusted EBITDA has limitations as an analytical tool. It is not a measure defined by IFRS and therefore does not purport to be an alternative to operating profit or net income as a measure of operating performance or to cash flows from operating activities as a measure of liquidity. Adjusted EBITDA is not necessarily comparable to similarly titled measures used by other companies. As a result, you should not consider Adjusted EBITDA in isolation from, or as a substitute analysis for, our results prepared in accordance with IFRS.
The following table shows Constellium’s consolidated Adjusted EBITDA for the years ended December 31, 2019, 2018 and 2017:
|
For the year ended December 31,
|
||||||||||||||||||
|
2019
|
2018
|
2017
|
||||||||||||||||
|
(millions of € and as a % of revenue)
|
||||||||||||||||||
|
P&ARP
|
273
|
|
9
|
%
|
243
|
|
8
|
%
|
204
|
|
7
|
%
|
||||||
|
A&T
|
204
|
|
14
|
%
|
152
|
|
11
|
%
|
146
|
|
11
|
%
|
||||||
|
AS&I
|
106
|
|
8
|
%
|
125
|
|
10
|
%
|
120
|
|
11
|
%
|
||||||
|
Holdings and Corporate
|
(21
|
)
|
n.m.
|
|
(22
|
)
|
n.m.
|
|
(22
|
)
|
n.m.
|
|
||||||
|
Total Adjusted EBITDA
|
562
|
|
10
|
%
|
498
|
|
9
|
%
|
448
|
|
8
|
%
|
||||||
n.m. not meaningful
Total Adjusted EBITDA for the year ended December 31, 2019 was €562 million, which represented a €64 million, or 13% increase compared to €498 million of total Adjusted EBITDA for the year ended December 31, 2018. This increase mainly reflected improved results in the Aerospace and Transportation and the Packaging and Automotive Rolled Products segments, a €22 million accounting impact from the implementation of IFRS16, partially offset by a €15 million impact from the consolidation of Bowling Green and weaker results in the Automotive Structures and Industry segment.
-
52
-
Total Adjusted EBITDA for the year ended December 31, 2018 was €498 million, which represented a €50 million, or 11% increase compared to €448 million of total Adjusted EBITDA for the year ended December 31, 2017. This increase mainly reflected improved results in each of our three business segments.
The following table presents the primary drivers for changes in Adjusted EBITDA from the year ended December 31, 2018 to the year ended December 31, 2019 for each one of our three segments:
|
P&ARP
|
A&T
|
AS&I
|
|||||||
|
(millions of €)
|
|||||||||
|
Adjusted EBITDA for the year ended December 31, 2018
|
243
|
|
152
|
|
125
|
|
|||
|
Volume
|
27
|
|
(5
|
)
|
24
|
|
|||
|
Price and product mix
|
(10
|
)
|
65
|
|
(1
|
)
|
|||
|
Costs
|
21
|
|
(14
|
)
|
(51
|
)
|
|||
|
Consolidation of Bowling Green
|
(15
|
)
|
—
|
|
—
|
|
|||
|
Impact of IFRS 16 adoption
|
6
|
|
2
|
|
12
|
|
|||
|
Foreign exchange and other
|
1
|
|
4
|
|
(3
|
)
|
|||
|
Adjusted EBITDA for the year ended December 31, 2019
|
273
|
|
204
|
|
106
|
|
|||
P&ARP
. Adjusted EBITDA at our P&ARP segment was €273 million for the year ended December 31, 2019, a 12% increase from €243 million in the year ended December 31, 2018 reflecting primarily higher volumes, favorable metal costs partially offset by weaker price and mix, incremental costs from maintenance and the ramp up of our automotive programs and the consolidation of Bowling Green. Adjusted EBITDA per metric ton for the year ended December 31, 2019 was 6% higher at €249 for the year ended December 31, 2019 compared to €234 for the year ended December 31, 2018.
A&T
. Adjusted EBITDA was €204 million for the year ended December 31, 2019, an increase of 34% from the year ended December 31, 2018, primarily reflecting better price and mix, partially offset by higher costs. Adjusted EBITDA per metric ton increased 36% to €843 from €619 in the year ended December 31, 2018.
AS&I
. Adjusted EBITDA was €106 million for the year ended December 31, 2019, a 15% decrease from the prior year, reflecting higher costs largely related to our footprint expansion and operational challenges on some of our newer automotive programs despite strong automotive shipments. Adjusted EBITDA per ton decreased 16% to €423 per ton in the year ended December 31, 2019 as compared to the prior year.
The following table presents the primary drivers for changes in Adjusted EBITDA from the year ended December 31, 2017 to the year ended December 31, 2018 for each one of our three segments:
|
P&ARP
|
A&T
|
AS&I
|
|||||||
|
(millions of €)
|
|||||||||
|
Adjusted EBITDA for the year ended December 31, 2017
|
204
|
|
146
|
|
120
|
|
|||
|
Volume
|
14
|
|
14
|
|
14
|
|
|||
|
Price and product mix
|
17
|
|
(2
|
)
|
11
|
|
|||
|
Costs
|
7
|
|
(3
|
)
|
(21
|
)
|
|||
|
Foreign exchange and other
|
1
|
|
(3
|
)
|
1
|
|
|||
|
Adjusted EBITDA for the year ended December 31, 2018
|
243
|
|
152
|
|
125
|
|
|||
P&ARP
. Adjusted EBITDA at our P&ARP segment was €243 million for the year ended December 31, 2018, a 19% increase from €204 million in the year ended December 31, 2017 reflecting primarily higher volumes and better price and mix, favorable metal costs partially offset by incremental costs from maintenance and by the ramp up of our automotive programs. Adjusted EBITDA per metric ton for the year ended December 31, 2018 was 16% higher at €234 for the year ended December 31, 2018 compared to €202 for the year ended December 31, 2017.
-
53
-
A&T
. Adjusted EBITDA was €152 million for the year ended December 31, 2018, an increase of 4% from the year ended December 31, 2017 primarily reflecting higher shipments and strong management of operating costs, partially offset by weaker price and mix. Adjusted EBITDA per metric ton increased 1% to €619 from €614 in the year ended December 31, 2017.
AS&I
. Adjusted EBITDA was €125 million for the year ended December 31, 2018, a 4% increase from the prior year, reflecting higher volumes and improved price and mix, partially offset by higher costs largely related to maintenance, new product launches and our footprint expansion. Adjusted EBITDA per ton decreased 2% to €502 per ton in the year ended December 31, 2018 as compared to the prior year.
Holdings and Corporate
. Our Holdings and Corporate segment generated Adjusted EBITDA losses of €21 million,
€22 million
and €22 million in the years ended December 31, 2019
, 2018 and 2017, respectively.
The following table reconciles our net income / (loss) for each of the three years in the period ending December 31, 2019, 2018 and 2017 to our Adjusted EBITDA for the years presented:
|
For the year ended December 31,
|
|||||||||
|
2019
|
2018
|
2017
|
|||||||
|
(€ in millions)
|
|||||||||
|
Net income / (loss)
|
64
|
|
190
|
|
(31
|
)
|
|||
|
Net income from discontinued operations
|
—
|
|
—
|
|
—
|
|
|||
|
Income tax expense
|
18
|
|
32
|
|
80
|
|
|||
|
Finance costs, net
|
175
|
|
149
|
|
260
|
|
|||
|
Share of loss of joint ventures
|
(2
|
)
|
33
|
|
29
|
|
|||
|
Depreciation and amortization
|
256
|
|
197
|
|
171
|
|
|||
|
Restructuring costs
|
4
|
|
1
|
|
4
|
|
|||
|
Unrealized losses / (gains) on derivatives
|
(33
|
)
|
84
|
|
(57
|
)
|
|||
|
Unrealized exchange losses / (gains) from remeasurement of monetary assets and liabilities—net
|
—
|
|
—
|
|
4
|
|
|||
|
Gains on pension plan amendments
(a)
|
(1
|
)
|
(36
|
)
|
(20
|
)
|
|||
|
Share-based compensation
|
16
|
|
12
|
|
8
|
|
|||
|
Metal price lag
(b)
|
46
|
|
—
|
|
(22
|
)
|
|||
|
Start-up and development costs
(c)
|
11
|
|
21
|
|
17
|
|
|||
|
Manufacturing system and process transformation costs
|
—
|
|
—
|
|
2
|
|
|||
|
(Gains) / Losses on disposals
(d)
|
3
|
|
(186
|
)
|
3
|
|
|||
|
Bowling Green one-time costs related to the acquisition
(e)
|
5
|
|
—
|
|
—
|
|
|||
|
Other
(f)
|
—
|
|
1
|
|
—
|
|
|||
|
Adjusted EBITDA
|
562
|
|
498
|
|
448
|
|
|||
__________________
|
(a)
|
For the year ended December 31, 2018, the Company amended one of its OPEB plans in the U.S., which resulted in a €36 million gain. For the year ended December 31, 2017, amendments to certain Swiss pension plans, U.S. pension plans and OPEB resulted in a €20 million net gain.
|
|
(b)
|
Metal price lag represents the financial impact of the timing difference between when aluminium prices included within Constellium revenue are established and when aluminium purchase prices included in Cost of sales are established. The Company accounts for inventory using a weighted average price basis and this adjustment aims to remove the effect of volatility in LME prices. The calculation of the Company’s metal price lag adjustment is based on an internal standardized methodology calculated at each of Constellium’s manufacturing sites and is primarily calculated as the average value of product recorded in inventory, which approximates the spot price in the market, less the average value transferred out of inventory, which is the weighted average of the metal element of cost of sales, based on the quantity sold in the period.
|
-
54
-
|
(c)
|
For the years ended December 31, 2019, 2018 and 2017, start-up and development costs include €11 million, €21 million and €16 million, respectively, related to new projects in our AS&I operating segment.
|
|
(d)
|
In July 2018, Constellium completed the sale of the North Building assets of its Sierre plant in Switzerland to Novelis and contributed the Sierre site shared infrastructure to a joint-venture with Novelis, in exchange for cash consideration of €200 million. This transaction also resulted in the termination of the existing lease agreement for the North Building assets which had been leased and operated by Novelis since 2005. For the year ended December 31, 2018, the transaction generated a €190 million net gain.
|
|
(e)
|
For the year ended December 2019, Bowling Green one-time costs related to the acquisition include the non-cash reversal of the inventory step-up.
|
|
(f)
|
For the year ended December 31, 2017, other includes €3 million of legal fees and lump-sum payments in connection with the renegotiation of a new 5-year collective bargaining agreement offset by accrual reversals of unused provisions related to one-time loss contingencies.
|
Liquidity and Capital Resources
Our primary sources of cash flow have historically been cash flows from operating activities and funding or borrowings from external parties.
Based on our current and anticipated levels of operations, and the condition in our markets and industry, we believe that our cash flows from operations, cash on hand, new debt issuances or refinancing of existing debt facilities, and availability under our factoring and revolving credit facilities will enable us to meet our working capital, capital expenditures, debt service and other funding requirements for the foreseeable future. However, our ability to fund working capital needs, debt payments and other obligations depends on our future operating performance and cash flows and many factors outside of our control, including the costs of raw materials, the state of the overall industry and financial and economic conditions and other factors
, including those described under the following risk factors within “Item 3. Key Information—D. Risk Factors.”
|
•
|
Our level of indebtedness could limit cash flow available for our operations and capital expenditures and could adversely affect our net income, our ability to service our debt or obtain additional financing, and our business relationships;
|
|
•
|
Our results of operations, cash flows and liquidity could be adversely affected if we are unable to execute on our hedging policy, if counterparties to our derivative instruments fail to honor their agreements or if we are unable to purchase derivative instruments;
|
|
•
|
Our cash flows and liquidity could be adversely affected as a result of the maturity mismatch between certain of our derivative instruments and the underlying exposure.
|
It is our policy to hedge all highly probable or committed foreign currency operating cash flows. As we have significant third party future receivables denominated in U.S. dollars, we generally enter into combinations of forward contracts with financial institutions, selling forward U.S. dollars against Euros.
In addition, as discussed in “Item 4. Information on the Company—B. Business Overview—Managing our Metal Price Exposure,”
when we are unable to align the price and quantity of physical aluminium purchases with that of physical aluminium sales, we enter into derivative financial instruments to pass through the exposure to metal price fluctuations to financial institutions at the time the price is set. As the U.S. dollar appreciates versus the Euro or the LME price for aluminium falls, the derivative contracts related to transactional hedging entered into with financial institution counterparties will have a negative mark-to-market. We borrow in a combination of Euros and U.S. Dollars. When the external currency mix of our debt does not match exactly the mix of our assets, we use a combination of cross-currency interest rate swaps and cross-currency swaps to balance the risk. We have bought forward significant U.S. Dollars versus the Euro for this purpose. As the U.S. Dollar depreciates against the Euro, the derivative contracts entered into with financial institutions will have a negative mark-to-market.
Our financial institution counterparties may require margin calls should our negative mark-to-market exceed a pre-agreed contractual limit. In order to protect the Company from the potential margin calls for significant market movements, we maintain additional cash or availability under our various borrowing facilities, we enter into derivatives with a large number of financial counterparties and we monitor potential margin requirements on a daily basis for adverse movements in the U.S. dollar versus the Euro and in aluminium prices. No margin calls were posted at December 31, 2019. A €5 million margin call was posted at December 31, 2018.
-
55
-
At December 31, 2019, we had €516 million of total liquidity, comprised of €184 million in cash and cash equivalents, €199 million of undrawn credit facilities under our Pan-U.S. ABL Facility, €82 million of undrawn credit facilities under our French Inventory Facility, €38 million available under our factoring arrangements, and €13 million under other credit facilities of which €7 million credit facility was with Bpifrance Financement, a related party.
Cash Flows
The following table summarizes our operating, investing and financing activities for the years ended December 31, 2019, 2018 and 2017:
|
For the year ended December 31,
|
|||||||||
|
2019
|
2018
|
2017
|
|||||||
|
(€ in millions)
|
|||||||||
|
Net Cash Flows from / (used) in:
|
|||||||||
|
Operating activities
|
447
|
|
66
|
|
160
|
|
|||
|
Investing activities
|
(353
|
)
|
(91
|
)
|
(292
|
)
|
|||
|
Financing activities
|
(76
|
)
|
(82
|
)
|
61
|
|
|||
|
Net increase / (decrease) in cash and cash equivalents, excluding the effect of exchange rate changes
|
18
|
|
(107
|
)
|
(71
|
)
|
|||
Net cash Flows from Operating Activities
Net cash flows from operating activities in the year ended December 31, 2019 increased by €381 million to €447 million, from €66 million in the year ended December 31, 2018. This increase in operating cash flows reflects a €378 million increase in cash flows from changes in working capital and stable cash flows from operating activities before working capital changes. Factored receivables under non-recourse arrangements increased by €17 million in the year ended December 31, 2019.
Net cash flows from operating activities in the year ended December 31, 2018 decreased by €94 million to €66 million, from €160 million in the year ended December 31, 2017. This decrease in operating cash flows is attributable to a €161 million increase in cash flows used in working capital partially offset by a €67 million increase in cash flows from operating activities before working capital changes. Factored receivables under non-recourse arrangements decreased by €27 million in the year ended December 31, 2018.
Net Cash Flows used in Investing Activities
Net cash flows used in investing activities in the year ended December 31, 2019 was €353 million compared to €91 million for the year ended December 31, 2018, reflecting stable capital expenditures and the impact of one-off transactions in both 2019 and 2018. Capital expenditures were €271 million for the year ended December 31, 2019 compared to €277 million for the year ended December 31, 2018 and related primarily to recurring investment in our manufacturing facilities and our growth projects. In 2019, net cash flows used in investing activities include the acquisition of Bowling Green for a cash consideration of €83 million. In 2018, net cash flows used in investing activities include net proceeds from the sale of our assets in Sierre for €198 million. In addition, cash flows used in investing activities in the year ended December 31, 2018 also included €24 million of equity contributions and loans to joint ventures, related to our 51% share in Bowling Green prior to our acquisition of our partner's 49% stake in January 2019.
Net cash flows used in investing activities in the year ended December 31, 2018 decreased by €201 million to €91 million from €292 million for the year ended December 31, 2017, mainly driven by the proceeds from the sale of our assets in Sierre in July 2018. Capital expenditures of €277 million for the year ended December 31, 2018 were stable from €276 million for the year ended December 31, 2017 and related primarily to recurring investment in our manufacturing facilities and our growth projects. Net cash flows used in investing activities in the year ended December 31, 2018 also included €24 million of equity contributions and loans to joint ventures, related to Constellium – UACJ ABS LLC, our joint venture with UACJ.
Net cash flows used in investing activities in the year ended December 31, 2017 decreased by €73 million to €292 million from €365 million for the year ended December 31, 2016, mainly driven by lower capital expenditures. Capital expenditures of €276 million for the year ended December 31, 2017 decreased by €79 million from €355 million for the year ended December 31, 2016 and related primarily to recurring investment in our manufacturing facilities and our growth projects.
-
56
-
Net cash flows used in investing activities in the year ended December 31, 2017 also included €41 million of equity contributions and loans to joint ventures, related to Constellium – UACJ ABS LLC, our joint venture with UACJ.
For further details on capital expenditures projects, see the “—Historical Capital Expenditures” section below.
Net Cash flows used in Financing Activities
Net cash flows used in financing activities were €76 million for the year ended December 31, 2019, compared to cash outflows of €82 million for the year ended December 31, 2018.
In 2019, net cash flows used in financing activities primarily reflect proceeds from revolving credit facilities and other loans for €109 million, offset by the €100 million partial redemption of the €300 million 4.625% Senior Note due 2021 in August 2019 and the €54 million lease repayment upon the acquisition of Bowling Green. In 2018, net cash used in financing activities reflected €68 million in repayments made on the Pan-US ABL Facility and other loans.
Net cash flows used in financing activities were €82 million for the year ended December 31, 2018, compared to cash inflows of €61 million for the year ended December 31, 2017. The €143 million change results from the 2017 refinancing operations described below.
Net cash flows from financing activities were €61 million for the year ended December 31, 2017, compared to €145 million for the year ended December 31, 2016.
Net cash flows from financing activities in the year ended December 31, 2017 reflect i) €610 million of net proceeds from the issuance, in February 2017, of our $650 million 6.625% Senior Notes due 2025, ii) €830 million of net proceeds from the issuance, in November 2017, of our $500 million 5.875% Senior Notes due 2026 and our €400 million 4,250% Senior Notes due 2026 and iv) €259 of net proceeds from the issuance of shares in November 2017. The net proceeds received from these transactions were partially offset by i) a €610 million outflow from the redemption in February 2017 of the $650 million 8.750% Wise Senior Secured Notes due 2018, ii) a €949 million outflow from the redemption, in November 2017, of the $425 million 7.875% Senior Secured Notes due 2021, the $400 million 8.000% Senior Notes due 2023 and the €240 million 7.000% Senior Notes due 2023 and iii) deferred financing costs and exit fees relating to these transactions for an amount of €118 million.
Historical Capital Expenditures
The following table provides a breakdown of the historical capital expenditures by segment for the periods indicated:
|
For the year ended December 31,
|
|||||||||
|
2019
|
2018
|
2017
|
|||||||
|
(€ in millions)
|
|||||||||
|
P&ARP
|
96
|
|
97
|
|
115
|
|
|||
|
A&T
|
72
|
|
70
|
|
73
|
|
|||
|
AS&I
|
97
|
|
105
|
|
83
|
|
|||
|
Holdings and Corporate
|
6
|
|
5
|
|
5
|
|
|||
|
Total capital expenditures
|
271
|
|
277
|
|
276
|
|
|||
Our capital expenditures for the year ended December 31, 2019 related primarily to asset-sustaining investments and selective growth projects, across all segments.
The main projects undertaken during the year ended December 31, 2019 were to support our growth and reliability initiatives and included our auto body sheet investments in Europe and in the U.S., within the P&ARP segment, automotive structures and industry investments in our AS&I segment and manufacturing efficiency investments in our A&T segment.
As of December 31, 2019, we had €203 million of construction in progress which primarily related to our continued maintenance, modernization and expansion projects at our Neuf Brisach, Děčín, Ravenswood, Levice, Issoire, Singen and Muscle Shoals facilities.
-
57
-
As of December 31, 2018, we had €194 million of construction in progress which primarily related to our continued maintenance, modernization and expansion projects at our Děčín, Muscle Shoals, Neuf Brisach, Ravenswood, Issoire, Singen and Van Buren facilities.
As of December 31, 2017, we had €198 million of construction in progress which primarily related to our continued maintenance, modernization and expansion projects at our Muscle Shoals, Ravenswood, Neuf Brisach, Singen, Van Buren, Děčín, and Issoire facilities.
Our capital expenditures are expected to total approximately €1,300 million in the years ended December 31, 2020 to 2024, in the aggregate. We currently expect all of our capital expenditures to be financed with cash on hand and external financing.
Covenant Compliance
The indentures governing our outstanding debt securities contain no maintenance covenants but contain customary affirmative and negative covenants that, among other things, restrict, subject to certain exceptions, our ability and the ability of our subsidiaries, to incur or guarantee indebtedness, sell assets, make investments, engage in acquisitions, mergers or consolidations and make dividends and other restricted payments.
The Pan-U.S. ABL Facility contains a financial covenant that provides that at any time during which borrowing availability thereunder is below 10% of the aggregate commitments under the Pan-U.S. ABL Facility, we will be required to maintain a minimum fixed charge coverage ratio of 1.0 to 1.0 and a minimum Borrower EBITDA Contribution of 25%, in each case calculated on a trailing twelve month basis. “Borrower EBITDA Contribution” means, for any period, the ratio of (x) the combined EBITDA of the borrowers under the Pan-U.S. ABL Facility and their subsidiaries for such period, to (y) the consolidated EBITDA of the Company and its subsidiaries for such period. The Pan-U.S. ABL Facility also contains customary negative covenants on liens, investments and restricted payments related to Ravenswood, Muscle Shoals, and Bowling Green.
The Wise Factoring Facility contains customary covenants and the factors’ commitment to purchase the receivables is subject to the maintainance of certain credit rating levels.
The European Factoring Facilities contain customary covenants.
We were in compliance with our covenants at and for the years ended December 31, 2019 and 2018.
See “Item 10. Additional Information—C. Material Contracts” for a description of our significant financing arrangements.
Off-Balance Sheet Arrangements
As of December 31, 2019, except as otherwise disclosed in our consolidated financial statements, we have no significant off-balance sheet arrangements.
-
58
-
Contractual Obligations
The following table summarizes our estimated material contractual cash obligations and other commercial commitments at December 31, 2019:
|
Cash payments due by period
|
|||||||||||||||
|
Total
|
Less
than
1 year
|
1-3
years
|
3-5
years
|
After 5
years
|
|||||||||||
|
(€ in millions)
|
|||||||||||||||
|
Borrowings
(1)
|
2,166
|
|
139
|
|
221
|
|
368
|
|
1,438
|
|
|||||
|
Interest
(2)
|
601
|
|
112
|
|
209
|
|
195
|
|
85
|
|
|||||
|
Derivatives relating to currencies and metal
|
56
|
|
31
|
|
24
|
|
1
|
|
—
|
|
|||||
|
Capital expenditures
|
71
|
|
62
|
|
9
|
|
—
|
|
—
|
|
|||||
|
Leases
|
241
|
|
40
|
|
58
|
|
55
|
|
88
|
|
|||||
|
Operating lease obligations
(3)
|
16
|
|
5
|
|
7
|
|
3
|
|
1
|
|
|||||
|
Total
(4)
|
3,151
|
|
389
|
|
528
|
|
622
|
|
1,612
|
|
|||||
__________________
|
(1)
|
Borrowings include our Pan-U.S. ABL Facility which is considered short-term in nature and is included in the category “Less than 1 year.”
|
|
(2)
|
Interests accrue under the May 2014 Notes denominated in U.S. dollars at a rate of 5.750% per annum, under the May 2014 Notes denominated in euros at a rate of 4.625% per annum, under the February 2017 Notes at a rate of 6.625% per annum, under the November 2017 Notes denominated in U.S. dollars at a rate of 5.875%, per annum, and under the November 2017 Notes denominated in euros at a rate of 4.250% per annum.
|
|
(3)
|
Operating leases relate to buildings, machinery and equipment leased under short term leases or low-value asset leases.
|
|
(4)
|
Estimating when pension and other post-employment obligations will require settlement is not practicable and therefore these have not been included in the Contractual Obligations table above.
|
Environmental Contingencies
Our operations, like those of many other basic industries, are subject to federal, state, local and international laws, regulations and ordinances. These laws and regulations (i) govern activities or operations that may have adverse environmental effects, such as discharges to air and water, as well as waste handling and disposal practices and (ii) impose liability for costs of cleaning up, and certain damages resulting from, spills, disposals or other releases or regulated materials. From time to time, our operations have resulted, or may result, in certain noncompliance with applicable requirements under such environmental laws. To date, any such noncompliance with such environmental laws has not had a material adverse effect on our financial position or results of operations.
Pension Obligations
Constellium operates various pension plans for the benefit of its employees across a number of countries. Some of these plans are defined benefit plans and others are defined contribution plans. The largest of these plans are in the United States, Switzerland, Germany and France. Pension benefits are generally based on the employee’s service and highest average eligible compensation before retirement, and are periodically adjusted for cost of living increases, either by practice, collective agreement or statutory requirement. Finally, we also participate in various multi-employer pension plans in one of our facilities in the United States.
We also provide health and life insurance benefits to retired employees and in some cases to their beneficiaries and covered dependents. These plans are predominantly in the United States.
For the year ended December 31, 2019, the total expense recognized in the income statement in relation to all our pension and post-retirement benefits was €43 million (compared to €5 million for the year ended December 31, 2018). In 2018, we amended one of our OPEB plans in the U.S. which resulted in the recognition of a €36 million gain. At December 31, 2019, the fair value of the plans assets was €445 million (compared to €380 million as of December 31, 2018). At December 31, 2019,
-
59
-
the present value of our obligations amounted to €1,115 million (compared to €990 million as of December 31, 2018), resulting in an aggregate plan deficit of €670 million and €610 million as of December 31, 2019 and 2018, respectively.
Our estimated funding for our funded pension plans and other post-retirement benefit plans is based on actuarial estimates using benefit assumptions for discount rates, rates of compensation increases, and health care cost trend rates. The deficit related to the funded pension plan and the present value of the unfunded obligations as of December 31, 2019 were €323 million and €347 million, respectively. The deficit related to the funded pension plan and the present value of the unfunded obligations as of December 31, 2018 were €294 million and €316 million, respectively.
Contributions to pension and other benefit plans totaled €50 million for the year ended December 31, 2019, compared to €46 million for the year ended December 31, 2018.
Contributions to our multi-employer plans amounted to approximately €2 million and €2 million for the years ended December 31, 2019 and 2018, respectively.
Principal Accounting Policies, Critical Accounting Estimates and Key Judgments
Our principal accounting policies are set out in Note 2 to the audited Consolidated Financial Statements, which appear elsewhere in this Annual Report. New standards and interpretations not yet adopted are also disclosed in Note 2.3 to our audited Consolidated Financial Statements.
|
A.
|
Directors and Senior Management
|
According to the Articles of Association, our Board of Directors is composed of natural or legal persons between 3 and 18 in number, appointed by the general meeting.
The following table provides information regarding the members of our board of directors as of the date of this Annual Report (ages are given as of December 31, 2019). One of our non-executive directors, Phillippe Guillemot, resigned as a Director of the Company, effective December 13, 2019. The business address of each of our directors listed below is c/o Constellium, Washington Plaza, 40-44 rue Washington, 75008 Paris, France.
|
Name
|
Age
|
Position
|
Date of Appointment
|
Current Term
|
||||
|
Richard B. Evans
|
72
|
Chairman
|
January 5, 2011
|
2019-2022
|
||||
|
Guy Maugis
|
66
|
Director
|
January 5, 2011
|
2019-2020
|
||||
|
Philippe Guillemot
|
60
|
Director
|
May 21, 2013
|
2019-2020
|
||||
|
Werner P. Paschke
|
69
|
Director
|
May 21, 2013
|
2019-2021
|
||||
|
Michiel Brandjes
|
65
|
Director
|
June 11, 2014
|
2019-2021
|
||||
|
Peter F. Hartman
|
70
|
Director
|
June 11, 2014
|
2019-2020
|
||||
|
John Ormerod
|
70
|
Director
|
June 11, 2014
|
2019-2021
|
||||
|
Lori A. Walker
|
62
|
Director
|
June 11, 2014
|
2019-2022
|
||||
|
Martha Brooks
|
60
|
Director
|
June 15, 2016
|
2019-2022
|
||||
|
Jean-Marc Germain
|
53
|
Director and CEO
|
June 15, 2016
|
2017-2020
|
||||
|
Stéphanie Frachet
|
42
|
Director
|
May 24, 2018
|
2019-2022
|
||||
Pursuant to a shareholders agreement between the Company and Bpifrance Participations (f/k/a Fonds Stratégique d'Investissement) ("Bpifrance"), in 2018, Ms. Frachet was designated by Bpifrance as a nominee to serve as a director of the Company, subject to shareholder approval.
-
60
-
Richard B. Evans
.
Mr. Evans has served as a director since January 2011 and as our Chairman of the Board of Directors since December 2012. Mr. Evans is currently an independent director of CGI, an IT consulting and outsourcing company. In 2016, Mr. Evans resigned as a non-executive Director of Noranda Aluminum Holding Corporation following its successful liquidation through the Chapter 11 bankruptcy process. He retired in May 2013 as non-executive Chairman of Resolute Forest Products, a Forest Products company based in Montreal. He retired in April 2009 as an executive director of London-based Rio Tinto plc and Melbourne-based Rio Tinto Ltd., and as Chief Executive Officer of Rio Tinto Alcan Inc., a wholly owned subsidiary of Rio Tinto. Previously, Mr. Evans was President and Chief Executive Officer of Montreal based Alcan Inc. from March 2006 to October 2007, and led the negotiation of the acquisition of Alcan by Rio Tinto in October 2007. He was Alcan’s Executive Vice President and Chief Operating Officer from September 2005 to March 2006. Prior to joining Alcan in 1997, he held various senior management positions with Kaiser Aluminum and Chemical Company during his 27 years with that company. Mr. Evans is a past Chairman of the International Aluminum Institute (IAI) and is a past Chairman of the Washington, DC-based U.S. Aluminum Association. He previously served as Co-Chairman of the Environmental and Climate Change Committee of the Canadian Council of Chief Executives and as a member of the Board of USCAP, a Washington, DC-based coalition concerned with climate change.
Guy Maugis
. Mr. Maugis has served as a non-executive director since 2011. Mr. Maugis served as advisor of the Board of Robert Bosch GmbH from 2016 to 2018, after being President of Robert Bosch France SAS for 12 years. The French subsidiary covers all the activities of the Bosch Group, a leader in the domains of Automotive Equipments, Industrial Techniques and Consumer Goods and Building Techniques. He is also President of the French-German Chamber of Commerce and Industry. Mr. Maugis serves as a senior advisor to Alixio, IAC Partners and Progress Search, and is a member of the European Advisory Board of KPS Capital Partners. Mr. Maugis worked for several years at the Equipment Ministry. At Pechiney, he managed the flat rolled products factory of Rhenalu Neuf-Brisach. At PPG Industries, he became President of the European Flat Glass activities. With the purchase of PPG Glass Europe by ASAHI Glass, Mr. Maugis assumed the function of Vice-President in charge of the business development and European activities of the automotive branch of the Japanese group. Mr. Maugis is a graduate of Ecole Polytechnique, Engineer of “Corps des Ponts et Chaussées.”
Philippe Guillemot
. Mr. Guillemot served as a non-executive director from May 2013 through December 13, 2019. Mr. Guillemot serves since December 2017 as CEO of Elior Group, a concession and contract catering leader. Since July 2017, Mr. Guillemot serves as a Director of the Sonoco Board and as a member of its Audit Committee. He has nearly thirty-five years of experience in Automotive, Energy and the Telecom industry, where he held CEO and COO positions leading many successful transformations. Mr. Guillemot served as Chief Operating Officer of Alcatel-Lucent until a successful turnaround led to Nokia’s full acquisition at the end of 2016. From April 2010 to February 2012, he served as Chief Executive Officer of Europcar Group. From 2010 to 2012, Mr. Guillemot served as a director and audit committee member of Visteon Corp. Mr. Guillemot also served as Chairman and CEO of Areva T&D from 2004 to 2010, and as division Vice President at Valeo and then Faurecia from 1998 to 2003. Mr. Guillemot began his career at Michelin, where he held various positions in quality and production at sites in Canada, France and Italy. He was a member of Booz Allen Hamilton’s Automotive Practice from 1991 to 1993 before returning to Michelin to serve as an operations manager, director of Michelin Group’s restructuring in 1995-1996, Group Quality Executive Vice-President, Chief Information Officer and member of the Group Executive Committee. Mr. Guillemot received his undergraduate degree in 1982 from Ecole des Mines in Nancy and received his MBA from Harvard Business School in Cambridge, MA in 1991.
Werner P. Paschke
. Mr. Paschke has served as a non-executive director since May 2013. From 2008 until April 2017, he served as an independent director of Braas Monier Building Group, Luxembourg, where he chaired the Audit Committee. In previous years, he served on the Supervisory Boards of Conergy Aktiengesellschaft, Hamburg, Coperion GmbH, Stuttgart and several smaller companies. From 2003 to 2006, he was Managing Director and Chief Financial Officer of Demag Holding in Luxembourg, where he enhanced the value of seven former Siemens and Mannesmann units. From 1992 to 2003, he worked for Continental Aktiengesellschaft in Hannover/Germany, and since 1993 as Generalbevollmächtigter responsible for corporate controlling plus later, accounting. From 1989 to 1992, he served as Chief Financial Officer for General Tire Inc., in Akron/Ohio, USA. From 1973 to 1987, he held different positions at Continental AG in finance, distribution, marketing and controlling. Mr. Paschke is an Advisory Board Member for Weber Automotive GmbH. Mr. Paschke studied economics at Universities Hannover, Hamburg and Münster/Westphalia, where he graduated as Diplomkaufmann in 1973. He is a 1993 graduate of the International Senior Management Program at Harvard Business School.
Michiel Brandjes
. Mr. Brandjes has served as a non-executive director since June 2014. He served as Company Secretary and General Counsel Corporate of Royal Dutch Shell plc from 2005 to 2017. Mr. Brandjes formerly served as Company Secretary and General Counsel Corporate of Royal Dutch Petroleum Company. He served for 25 years on numerous legal and non-legal jobs in the Shell Group within the Netherlands and abroad, including as head of the legal department in Singapore and as head of the legal department for North East Asia based in Beijing and Hong Kong. Before he joined Shell, Mr. Brandjes worked at a law firm in Chicago. Mr. Brandjes serves in a number of advisory and director positions of charitable foundations.
-
61
-
He has published a number of articles on legal and business topics, is a regular speaker on corporate legal and governance topics. Mr. Brandjes graduated from law school at the University of Rotterdam and at Berkeley, California.
Peter F.
Hartman
. Mr. Hartman has served as a non-executive director since June 2014. He served as Vice Chairman of Air France KLM from July 2013 until May 2017. Mr. Hartman has been a member of the Supervisory Board of Royal KPN N.V. since April 2015 and is currently chair of the Remuneration Committee and a member of the Nominating & Corporate Governance Committee. Previously, Mr. Hartman served as President and CEO of KLM Royal Dutch Airlines from 2007 to 2013, and as member of the supervisory boards of Kenya Airways from 2004 to 2013, Stork B.V. from 2008 to 2013, CAI Compagnia Aerea Italiana S.p.A. from 2009 to January 2014, Delta Lloyd Group N.V. from 2010 to May 2014 and Royal Ten Cate N.V. from July 2013 to February 2016. He served as Vice Chairman of Air France KLM from July 2013 until May 2017. Mr. Hartman served as member of the supervisory board of Air France KLM S.A. from 2010, and as member of the audit committee from July 2016, until May 2017. Mr. Hartman serves as Chairman of the Supervisory Boards of Fokker Technologies Group B.V and of Texel Airport N.V. and is a member of the Advisory Board of Aviation Glass & Technology. Mr. Hartman received a Bachelor’s degree in Mechanical Engineering from HTS Amsterdam, Amsterdam and a Master’s degree in Business Economics from Erasmus University, Rotterdam.
John Ormerod
. Mr. Ormerod has served as a non-executive director since June 2014. Mr. Ormerod is a chartered accountant and worked for over 30 years in public accounting firms. He served for 32 years at Arthur Andersen, serving in various client service and management positions, with last positions held from 2001 to 2002 serving as Regional Managing Partner UK and Ireland, and Managing Partner (UK). From 2002 to 2004, he was Practice Senior Partner for London at Deloitte (UK) and was member of the UK executives and Board. Until May 2018, Mr. Ormerod served in the following director positions: since 2006, as a non-executive director, member of the audit committee (of which he also served as its Chairman until September 2017), and as member of the compensation committee of Gemalto N.V.; since 2008, as non-executive director of ITV plc, and as member of the remuneration and nominations committees, and as Chairman of the audit committee since 2010. Until December 31, 2015, Mr. Ormerod served as a non-executive director of Tribal Group plc., as member of the audit, remuneration and nominations committees and as Chairman of the board. Mr. Ormerod served as non-executive director and Chairman of the audit committee of Computacenter plc., and as member of the remuneration and nominations committees until April 1, 2015. Mr. Ormerod also served as a senior independent director of Misys plc. from 2006 to 2012, and as Chairman of the audit committee from 2005 to 2012. Mr. Ormerod is Chairman of Bloodwise, a UK charity. Mr. Ormerod is a graduate of Oxford University.
Lori A. Walker
. Ms. Walker has served as a non-executive director since June 2014. Ms. Walker previously served as Chief Financial Officer and Senior Vice President of The Valspar Corporation from 2008 to 2013, where she led the Finance, IT and Communications teams. Prior to that position, Ms. Walker served as Valspar’s Vice President, Controller and Treasurer from 2004 to 2008, and as Vice President and Controller from 2001 to 2004. Prior to joining Valspar, Ms. Walker held a number of roles with progressively increasing responsibility at Honeywell Inc. during a 20-year tenure, with her last position there serving as director of Global Financial Risk Management. Ms. Walker currently serves as the audit committee chair of Southwire and Compass Minerals. Ms. Walker is also a member of the compensation committee of Compass Minerals. Ms. Walker holds a Bachelor of Science of Finance from Arizona State University and attended the Executive Institute Program and the Director’s College at Stanford University.
Martha Brooks
. Ms. Brooks has served as a non-executive director since June 2016. Ms. Brooks was until her retirement in May 2009, President and Chief Operating Officer of Novelis, Inc, where she held senior positions since 2005. From 2002 to 2005, she served as Corporate Senior Vice President and President and Chief Executive Officer of Alcan Rolled Products, Americas and Asia. Before she joined Alcan, Ms. Brooks served 16 years with Cummins, the global leader in diesel engine and power generation from 1986 to 2002, ultimately running the truck and bus engine business. She is currently a director at Bombardier Inc., where she serves as co-chair of the Finance and Risk Committee and as a member of the Audit Committee; and a director at Jabil Circuit Inc., where she serves as a member of the Compensation Committee, and the Nominating and Governance Committee. She has previously served as a director of Harley Davidson and International Paper. Ms. Brooks holds a BA in Economics and Political Science and a Master’s in Public and Private Management from Yale University.
Jean-Marc Germain
. Mr. Germain has served as an executive director since June 2016 and as our Chief Executive Officer since July 2016. Prior to joining Constellium, Mr. Germain was Chief Executive Officer of Algeco Scotsman, a Baltimore-based leading global business services provider focused on modular space and secure portable storages. Previously, Mr. Germain held numerous leadership positions in the aluminium industry, including senior executive roles in operations, sales & marketing, financial planning and strategy with Pechiney, Alcan and Novelis. His last position with Novelis from 2008 to 2012 was as President for North American operations. Earlier in his career, he held a number of international positions with Bain & Company and GE Capital. Mr. Germain is a graduate of Ecole Polytechnique in Paris, France and a dual French and American citizen.
-
62
-
Stéphanie Frachet.
Ms. Frachet has served as a non-executive director since May 2018. Ms. Frachet is currently Managing Director and member of the Bpifrance Capital Development Executive Committee at Bpifrance Investissement that she joined in 2009. Ms. Frachet is also, as permanent representative of Bpifrance, a director of Eutelsat Communications, Valeo, and Sulo, and a director of Sabena Technics, as well as an observer on the Board of Paprec. Until recently, she was also an observer on the Board of Horizon Parent Holdings Sarl (from 2015 to 2017). Previously, Ms. Frachet served for Bpifrance as a member of the Board of Carso (from 2013 to 2016), Cylande (from 2010 to 2017) and Sarenza (from 2014 to 2018), and as an Independent Director of Eurosic (from 2015 to 2017). From 2002 to 2009, Ms. Frachet held various positions in auditing and financial consulting on mergers & acquisitions and LBOs at Ernst &Young, Pricewaterhouse Coopers and Société Générale CIB in Paris. Ms. Frachet graduated from ESSEC Business School in Paris in 2002.
The following persons are our executive officers as of the date of this Annual Report (ages are given as of December 31, 2019). The business address of each of our officers listed below is c/o Constellium, Washington Plaza, 40-44 rue Washington, 75008 Paris, France.
|
Name
|
Age
|
Title
|
|||
|
Jean-Marc Germain
|
53
|
|
Chief Executive Officer
|
||
|
Peter R. Matt
|
57
|
|
Executive Vice President and Chief Financial Officer
|
||
|
Peter Basten
|
44
|
|
President, Packaging and Automotive Rolled Products business unit
|
||
|
Ingrid Joerg
|
50
|
|
President, Aerospace and Transportation business unit
|
||
|
Paul Warton
|
58
|
|
President, Automotive Structures and Industry business unit
|
||
|
Jack Clark
|
60
|
|
Senior Vice President Manufacturing Excellence and Chief Technical Officer
|
||
|
Philip Ryan Jurkovic
|
48
|
|
Senior Vice President and Chief Human Resources Officer
|
||
|
Nicolas Brun
|
53
|
|
Senior Vice President, Public Affairs, Communications and Sustainability
|
||
|
Jeremy Leach
|
57
|
|
Senior Vice President and Group General Counsel
|
||
The following paragraphs set forth biographical information regarding our officers (other than Mr. Germain, whose biographical information is set forth above in the description of biographical information of our directors):
Peter R. Matt
. Mr. Matt has served as our Executive Vice President and Chief Financial Officer since January 1, 2017. From November 2016 to December 2016 he served as our Chief Financial Officer Designate. Prior to joining Constellium, he spent 30 years in investment banking at First Boston/Credit Suisse where he built leading Metals and Diversified Industrials coverage practices. From 2010-2015, he was the Managing Director and Group Head at First Boston/Credit Suisse responsible for managing the firm’s Global Industrials business in the Americas. He is a graduate of Amherst College.
Peter Basten
. Mr. Basten has served as President of our Packaging and Automotive Rolled Products business unit since September 2017. He previously served as our Executive Vice President, Strategy, Business Development, Research & Development since 2016, and prior to that as our Vice President, Strategy and Business Planning, the Managing Director of Soft Alloys Europe at our Automotive Structures and Industry Business Unit and our Vice President Strategic Planning & Business Development. Mr. Basten joined Alcan in 2005 as the Director of Strategy and Business Planning at Alcan Specialty Sheet, and became Director of Sales and Marketing in 2008, responsible for the aluminium packaging applications markets. Prior to joining Alcan, Mr. Basten worked as a consultant at Monitor Group, a Strategy Consulting firm. His assignments ranged from developing marketing, corporate, pricing and competitive strategy to M&A and optimizing manufacturing operations. Mr. Basten holds degrees in Applied Physics (Delft University of Technology, Netherlands) and Economics & Corporate Management (ENSPM, France).
Ingrid Joerg
. Ms. Joerg has served as President of our Aerospace and Transportation business unit since June 2015. Previously, Ms. Joerg served as Chief Executive Officer of Aleris Rolled Products Europe. Prior to joining Aleris, Ms. Joerg held leadership positions with Alcoa where she was President of its European and Latin American Mill Products business unit, and commercial positions with Amag Austria. Ms. Joerg joined the Board of voestalpine AG in July 2019. She received a Master’s Degree in Business Administration from the University of Linz, Austria.
Paul Warton
. Mr. Warton has served as President of our Automotive Structures & Industry business unit since January 2011, and previously held the same role at Alcan Engineered Products since November 2009. Mr. Warton joined Alcan Engineered Aluminum Products in November 2009. Following manufacturing, sales and management positions in the automotive and construction industries, he spent 17 years managing aluminium extrusion companies across Europe and in
-
63
-
China. He has held the positions of President Sapa Building Systems & President Sapa North Europe Extrusions during the integration process with Alcoa soft alloy extrusions. Mr. Warton served on the Building Board of the European Aluminium Association (“EAA”) and was Chairman of the EAA Extruders Division. He holds an MBA from London Business School.
Jack Clark
. Mr. Clark has served as our Senior Vice President Manufacturing Excellence and Chief Technical Officer since October 2016. In this role, Mr. Clark is responsible for research and technology at Constellium and supervises all EHS, Lean Continuous Improvement activities as well as Engineering, Reliability and CAPEX planning and execution. Prior to joining Constellium, Mr. Clark was Senior Vice President and Chief Technical Officer of Novelis. Mr. Clark graduated from Purdue University in Engineering and has more than 30 years of industry experience with Alcoa and Novelis on three continents.
Philip Ryan Jurkovic
. Mr. Jurkovic has served as our Senior Vice President and Chief Human Resources Officer since November 2016. Prior to joining Constellium, Mr. Jurkovic was Senior Vice President and Chief Human Resources Officer of Algeco Scotsman. He started his career as a financial analyst before taking on various HR leadership roles in Europe, Asia and the U.S. with United Technologies and Novelis. Mr. Jurkovic has a BS from Allegheny College and an MBA from Purdue University.
Nicolas Brun
. Mr. Brun has served as our Senior Vice President, Public Affairs, Communications and Sustainability since January 2018, and was previously Senior Vice President, Communications from September 2017 to January 2018, and Vice President, Communications from January 2011 to January 2017. He previously held the same role at Alcan Engineered Products since June 2008. From 2005 through June 2008, Mr. Brun served in the roles of Vice President, Communications for Thales Alenia Space and also as Head of Communications for Thales’ Space division. Prior to 2005, Mr. Brun held senior global communications positions as Vice President External Communications with Alcatel, Vice President Communications Framatome ANP/AREVA, and with the Carlson Wagonlit Travel Group. Mr. Brun currently serves as President of Constellium Neuf Brisach SAS since January 2015, and was appointed President of Constellium France Holdco on December 30, 2019. Mr. Brun attended University of Paris-La Sorbonne and received a degree in economics. He has a master’s degree in corporate communications from Ecole Française des Attachés de Presse and a certificate in marketing management for distribution networks from the Ecole Supérieure de Commerce in Paris.
Jeremy Leach
. Mr. Leach has served as our Senior Vice President and Group General Counsel and Secretary to the Board of Constellium since January 2011 and previously was Vice President and General Counsel at Alcan Engineered Products. Mr. Leach joined Pechiney in 1991 from the international law firm Richards Butler (now Reed Smith). Prior to becoming General Counsel at Alcan Engineered Products, he was the General Counsel of Alcan Packaging and held various senior legal positions in Rio Tinto, Alcan and Pechiney. He has been admitted in a number of jurisdictions, holds a law degree from Oxford University (MA Jurisprudence) and an MBA from the London Business School.
|
B.
|
Compensation
|
Non-Executive Director Compensation
In 2019, the compensation structure for our non-executive directors was revised. Prior to the annual general meeting on June 27, 2019, the compensation structure as in the past was applied. As of June 27, 2019, a new compensation structure is in place.
Compensation prior to June 27, 2019
Each of our non-executive directors was paid an annual retainer of €60,000 and received €2,000 for each meeting of the Board of Directors they attended in person and €1,000 for each meeting they attended by telephone.
In addition, Mr. Evans, as Chairman of the Board received an additional annual retainer of €60,000; the Chairman of the Audit Committee received an additional annual retainer of €15,000; and the Chairman of each of the Human Resources and Remuneration Committee, the EHS and the Nominating and Governance Committee received an additional annual retainer of €8,000.
On April 1, 2019, our non-executive directors received a grant of Restricted Stock Units (an “RSU”) having a grant date fair value equal to $50,000 for the Chairman of the Board and $40,000 for each other non-executive director.
-
64
-
Fifty percent (50%) of the RSUs (“April Tranche I”) granted on April 1, 2019 will vest on the earlier of (i) April 1, 2020 or (ii) the date of the annual general meeting of shareholders of that year, subject to continued service.
Fifty percent (50%) of the RSUs (“April Tranche II”) granted on April 1, 2019 will vest on the earlier of (i) April 1, 2021 or (ii) the date of the annual general meeting of shareholders of that year, subject to continued service.
Compensation as of June 27, 2019
The changes made to the non-executive director compensation structure are that (i) meeting attendance fees are no longer paid to our non-executive directors, (ii) Committee membership fees were implemented, (iii) Committee Chair fees follow a formulaic approach (of 2X the Committee membership fee), and (iv) annual equity-based compensation was increased. These changes were made after an external independent compensation consultant reviewed the design and competitiveness of our non-executive compensation. The overall conclusion was that the level of non-executive compensation was below market and the recommendation was to redesign the compensation structure in a way that (i) simplified the cash fees, while keeping them the same or lower for each of the non-executive directors, and (ii) increased the annual equity grant to be more competitive with the market. For these reasons, the Human Resources and Remuneration Committee suggested to the Board of Directors a change in the compensation for the non-executive directors. It was then approved during the annual general meeting of shareholders on June 27, 2019. The new structure is outlined as follows:
Annual Retainer
- an annual fee of €65,000 for the Chairman of the Board and €70,000 for each other non-executive director
- an additional annual fee of €65,000 for the Chairman of the Board
Audit Committee
- an annual fee of €12,000 for members of the Audit Committee
- an additional annual fee of €12,000 for the Chair of the Audit Committee
Human Resources and Remuneration Committee
- an annual fee of €8,000 for members of the Human Resources and Remuneration Committee
- an additional annual fee of €8,000 for the Chair of the Human Resources and Remuneration Committee
Nomination and Governance Committee
- an annual fee of €6,000 for members of the Nominating and Governance Committee
- an additional annual fee of €6,000 for the Chair of the Nominating and Governance Committee
Environment, Health and Safety Committee
- an annual fee of €4,000 for members of the Environment, Health and Safety Committee
- an additional annual fee of €4,000 for the Chair of the Environment, Health and Safety Committee
Annual RSU Equity Grants
- annual RSU equity grants of $95,000 for the Chairman of the Board
- annual RSU equity grants of $75,000 for our other non-executive directors
As described below under “Constellium SE 2013 Equity Incentive Plan” section, any equity grants made following the Transfer to non-executive directors will be cash-settled. Following the Transfer, grants to the Chairman of the Board of Directors may be settled in cash or in shares.
In order to reflect the value of the new RSU equity grants, a catch-up grant was made. Therefore, on August 14, 2019, our non-executive directors received a grant of RSUs having a grant date fair value equal to $45,000 for the Chairman of the Board and $35,000 for each other non-executive director.
Fifty percent (50%) of the RSUs (“August Tranche I”) granted on August 14, 2019 will vest on the earlier of (i) August 14, 2020 or (ii) the date of the annual general meeting of shareholders of that year, subject to continued service.
Fifty percent (50%) of the RSUs (“August Tranche II”) granted on August 14, 2019 will vest on the earlier of (i) August 14, 2021 or (ii) the date of the annual general meeting of shareholders of that year, subject to continued service.
-
65
-
The non-executive directors of the Board have not entered into any service contracts with the Company that provide either for benefits upon termination of employment or pension-related benefits.
The following table sets forth the remuneration due in respect of our 2019 fiscal year to our non-executive directors:
|
Name
|
Annual
Director
Fees
|
Attendance/Membership Fees
|
Equity
Award
April 1,
2019
(1)
|
Equity
Award
August 14, 2019
(2)
|
Total
|
|||||||||||||||
|
Richard B. Evans
|
€
|
96,500
|
|
€
|
56,500
|
|
€
|
44,505
|
|
€
|
40,100
|
|
€
|
237,605
|
|
|||||
|
Guy Maugis
|
€
|
69,000
|
|
€
|
20,000
|
|
€
|
35,604
|
|
€
|
31,189
|
|
€
|
155,793
|
|
|||||
|
Philippe Guillemot
(3)
|
€
|
65,000
|
|
€
|
9,000
|
|
€
|
35,604
|
|
€
|
31,189
|
|
€
|
140,793
|
|
|||||
|
Michiel Brandjes
|
€
|
65,000
|
|
€
|
14,000
|
|
€
|
35,604
|
|
€
|
31,189
|
|
€
|
145,793
|
|
|||||
|
Werner P. Paschke
|
€
|
72,500
|
|
€
|
18,000
|
|
€
|
35,604
|
|
€
|
31,189
|
|
€
|
157,293
|
|
|||||
|
Peter F. Hartman
|
€
|
69,000
|
|
€
|
16,000
|
|
€
|
35,604
|
|
€
|
31,189
|
|
€
|
151,793
|
|
|||||
|
John Ormerod
|
€
|
65,000
|
|
€
|
25,000
|
|
€
|
35,604
|
|
€
|
31,189
|
|
€
|
156,793
|
|
|||||
|
Lori A. Walker
|
€
|
65,000
|
|
€
|
29,000
|
|
€
|
35,604
|
|
€
|
31,189
|
|
€
|
160,793
|
|
|||||
|
Martha Brooks
|
€
|
65,000
|
|
€
|
30,000
|
|
€
|
35,604
|
|
€
|
31,189
|
|
€
|
161,793
|
|
|||||
|
Stéphanie Frachet
(4)
|
€
|
—
|
|
€
|
—
|
|
€
|
—
|
|
€
|
—
|
|
€
|
—
|
|
|||||
|
Total
|
€
|
632,000
|
|
€
|
217,500
|
|
€
|
329,337
|
|
€
|
289,612
|
|
€
|
1,468,449
|
|
|||||
__________________
|
(1)
|
The amount reported in this column represents the grant date fair value of RSU awards granted on April 1, 2019, computed in accordance with IFRS 2. On April 1, 2019, Mr. Evans was granted 6,266 RSUs and each of the other non-executive directors, except for Ms. Frachet, was granted 5,013 RSUs. 50% of the RSUs (“April Tranche I”) granted on April 1, 2019 will vest on the earlier of (i) April 1, 2020 or (ii) the date of the annual general meeting of shareholders of that year, subject to continued service. 50% of the RSUs (“April Tranche II”) granted on April 1, 2019 will vest on the earlier of (i) April 1, 2021 or (ii) the date of the annual general meeting of shareholders of that year, subject to continued service. Amounts have been converted to Euros based on an exchange rate of 0.8901 Dollars to Euros to reflect the equivalent of $ 50,000 for the Chairman and $ 40,000 for each other non-executive director, except for Ms. Frachet. See also Note 31 of the Consolidated Financial Statements.
|
|
(2)
|
The amount reported in this column represents the grant date fair value of the RSU awards granted on August 14, 2019, computed in accordance with IFRS 2. Mr. Evans was granted 3,797 RSUs and each of the other non-executive directors, except for Ms. Frachet, was granted 2,954 RSUs. 50% of the RSUs (“August Tranche I”) granted on August 14, 2019 will vest on the earlier of (i) August 14, 2020 or (ii) the date of the annual general meeting of shareholders of that year, subject to continued service. 50% of the RSUs (“August Tranche II”) granted on August 14, 2019 will vest on the earlier of (i) August 14, 2021 or (ii) the date of the annual general meeting of shareholders of that year, subject to continued service. Amounts have been converted to Euros based on an exchange rate of 0.8911 Dollars to Euros to reflect the equivalent of $45,000 for the Chairman and $35,000 for each other non-executive director, except for Ms. Frachet. See also Note 31 of the Consolidated Financial Statements.
|
|
(3)
|
Mr. Guillemot resigned as a non-executive director effective December 13, 2019.
|
|
(4)
|
Ms. Frachet did not receive any fees for her services.
|
Share Ownership Guidelines for Non-Executive Directors
In 2019, we adopted Share-Ownership Guidelines (SOGs) for our non-executive directors to further encourage minimum levels of ownership and to further foster alignment between the non-executive directors and shareholder interests, which do not apply to Ms Frachet. The SOGs are as follows:
|
•
|
$500,000 Chairman of the Board
|
|
•
|
$250,000 Other non-executive directors
|
-
66
-
The SOGs give the non-executive directors five years from appointment to achieve guideline percentages. All of our non-executive directors met the SOGs in 2019, other than Ms Frachet.
Officer Compensation
The table below sets forth the remuneration paid during our 2019 fiscal year to certain of our executive officers. They include Jean-Marc Germain, our Chief Executive Officer, Peter Matt, our Chief Financial Officer, Paul Warton, our President Automotive Structures & Industry, Ingrid Joerg, our President Aerospace & Transportation and Peter Basten, our President Packaging & Automotive Rolled Products. The remuneration information for our executive officers other than our Chief Executive Officer Jean-Marc Germain (which include Peter Matt, Peter Basten, Ingrid Joerg and Paul Warton) is presented on an aggregate basis in the row “Other Executive Officers” in the table below.
|
Name
|
Base Salary
Paid
|
Bonus EPA
Paid
|
Equity
Awards
(1)
|
Pension
(2)
|
Other
Compensation
(3)
|
Total
(4)
|
||||||||||||||||||
|
Jean-Marc Germain
|
€
|
959,288
|
|
€
|
1,259,908
|
|
€
|
4,095,081
|
|
€
|
22,514
|
|
€
|
221,436
|
|
€
|
6,558,227
|
|
||||||
|
Other Executive Officers
|
€
|
2,148,159
|
|
€
|
2,033,260
|
|
€
|
3,330,613
|
|
€
|
196,157
|
|
€
|
172,868
|
|
€
|
7,881,057
|
|
||||||
__________________
|
(1)
|
The amount reported as Equity Awards represents the grant date fair value of the awards granted in 2019, computed in accordance with IFRS 2. Jean-Marc Germain was granted the following in April 2019: (a) 291,219 performance-based restricted stock units (“PSUs”) (which can become a maximum of 582,438 shares); and (b) 148,557 RSUs. Our other executive officers listed were granted, in the aggregate, 236,854 PSUs (which can become a maximum of 473,708) and 120,825 RSUs. The PSUs vest on the third anniversary of the date of grant, subject to continued service and certain market-related performance conditions being satisfied, and have a vesting range of 0-200%. RSUs vest 100% on the third anniversary of the date of grant, subject to continued service. See hereafter “2019 Long-Term Incentive Plan” for description of market-related performance conditions. See also Note 31 of the Consolidated Financial Statements for more information.
|
|
(2)
|
Pension represents amounts contributed by the Company during the 2019 fiscal year to the U.S. and Swiss governments as part of the employer overall pension requirements apportioned to the base salary of these individuals.
|
|
(3)
|
Other compensation for Jean-Marc Germain includes car allowance, parking and premium for health, life and long-term disability insurance as well as non-qualified restoration contributions under the Constellium US Holdings I, LLC U.S. Non-qualified Deferred Compensation and Restoration Plan (new in 2019, see below). Other compensation for Ms. Joerg as well as for Messrs. Matt, Warton and Basten includes flights (including for family members), car allowance, lunch allowance, tax and medical services, relocation and premiums for life and long-term disability insurance.
|
|
(4)
|
The total remuneration paid to such executive officers, including Mr. Germain and Mr. Matt, during our 2019 fiscal year amounted to €7,013,590, consisting of (a) an aggregate base salary of €3,107,447, (b) aggregate short-term incentive compensation of €3,293,168, and (c) aggregate other compensation in an amount equal to €394,304. The total amount contributed to the value of the pensions for such executive officers was €218,671.
|
Below is a brief description of the compensation and benefit plans as well as share ownership guidelines in which our executive officers participate.
Share Ownership Guidelines for Executive Officers
In 2018, we adopted Share-Ownership Guidelines (SOGs) for our executive officers to further encourage minimum levels of ownership and to further foster alignment between the Executive Committee and shareholder interests. The SOGs are as follows:
|
•
|
400% of base salary CEO
|
|
•
|
200% of base salary CFO and Business Unit Presidents
|
|
•
|
100% of base salary Other executive officers
|
-
67
-
The SOGs give the executive officers five years from appointment to achieve guideline percentages. All of our executive officers met the SOGs in 2019.
Non-qualified Deferred Compensation and Restoration Plan
A select group of highly compensated employees of Constellium US Holdings I, LLC and certain other subsidiaries and affiliates (including Messrs. Germain and Matt) are eligible to participate in the Constellium US Holdings I, LLC U.S. Non-qualified Deferred Compensation and Restoration Plan (“DCRP”). The DCRP allows such employees to defer up to 85% of their annual Employee Performance Award. The DCRP is also a non-qualified restoration plan for employer contributions that cannot be made to our 401(k) plan due to the Code Section 401(a)(17) annual limit on compensation paid under a qualified plan. The restoration contribution equals 9% of total eligible 2019 pay (base salary plus bonus award paid in 2019) in excess of this limit. The 9% consists of the 6% employer matching contribution and the 3% non-elective retirement contribution. Restoration contributions are 100% vested.
Distributions are made as a lump sum after separation from service, unless the participant elects to receive one to 10 annual payments beginning at least one year after separation from service.
Each participant directs investment of his or her individual account under the DCRP. The Plan provides a broad range of market-based investments that may be changed daily. Benefits due under the Plan are paid from our general assets, although we also maintain a rabbi trust that may be used to pay benefits. The trust and the funds held in it are Company assets. In the event of our bankruptcy, DCRP participants would be unsecured general creditors.
2019 Employee Performance Award Plan
Each of our executive officers, among other selected employees, participates in the Employee Performance Award Plan (which we refer to as the “EPA”). The EPA is an annual cash bonus plan intended to provide performance-related award opportunities to employees contributing substantially to the success of Constellium. Under the EPA, participants are provided opportunities to earn cash bonuses (expressed as a percentage of base salary, and paid in the year following the performance period) based on the level of achievement of certain Financial and EHS Objectives as approved by our human resources and remuneration committee for the applicable annual performance period, as well as Individual Objectives established by the applicable participant’s supervisor (as described below).
The three components of bonuses awarded under the EPA for 2019 had the following weights:
|
•
|
Financial Objectives — 70%
|
|
•
|
EHS Objective — 10%
|
|
•
|
Individual Objectives — 20%
|
The
Financial Objectives
are calculated on an annual basis and take into account two components as defined and reported by the Company’s corporate controller: Adjusted EBITDA (50%) and Trade Working Capital Days (20%). To promote synergies throughout the Company, the EPA is designed to encourage individual plants, business units and our corporate division to work closely together to achieve common strategic, operating and financial goals. Therefore, the Financial Objectives are defined, depending on the level of the employee, as a combination of the financial results of the Company, the business unit and / or operating unit/site. The threshold performance level for the Financial Objectives is set at 80% of the target level. If threshold performance is not achieved, there is no payout for the Financial Objectives. Between threshold performance and target performance, payouts increase linearly from 0% to 100%. The maximum performance level is set at 120% of the target level. Achieving 120% of the target level results in a payout of 200%, with linear interpolation (meaning each percentage point higher than 100% adds additional payout of 5%).
The
EHS Objective
is measured on a quarterly basis for Constellium and its subsidiaries. In case of a fatality or type I (major) environmental event, the payout for the EHS Objective is zero for (i) employees of the operating site, (ii) the associated business unit leadership as well as (iii) the members of the Executive Committee. This substantial impact on EPA payout reflects the fact that the safety for our employees is our number one priority. Payout for EHS Objectives can range from 0% to 200%.
The Individual Objectives are evaluated annually via the Performance Management Program, and achievement against these objectives is used to determine the percentage attained of the Individual Objectives target.
-
68
-
The payout scale defines the performance levels and resulting payouts. Achieving target performance results in a payout at 100% of the target amount. Overall payout can range from 0% to 150% of the target amount.
The EPA 2019 was applicable to approximately 2,000 employees worldwide. For its payout in 2020, the following results were earned by our employees:
|
•
|
Financial Objectives: The payout ranged from 0% to 183%
|
|
•
|
EHS Objective: The payout ranged from 0% to 200%;
|
|
•
|
Individual Objectives: The payout ranged from 0% to 150%. The payout for Mr. Germain was 125%.
|
Constellium SE 2013 Equity Incentive Plan
The Company adopted the Constellium SE 2013 Equity Incentive Plan (the “Constellium 2013 Equity Plan”). The principal purposes of this plan are to focus directors, officers and other employees and consultants on business performance to help create shareholder value, to encourage innovative approaches to the business of the Company and to encourage ownership of our ordinary shares by directors, officers and other employees and consultants. It is also intended to recognize and retain our key employees and high potentials needed to sustain and ensure our future and business competitiveness.
The Constellium 2013 Equity Plan provides for a variety of awards, including “incentive stock options” (within the meaning of Section 422 of the Internal Revenue Code of 1986, as amended (the “Code”) (“ISOs”), nonqualified stock options, stock appreciation rights (“SARs”), restricted stock, restricted stock units, performance units, other stock-based awards or any combination of those awards. To date, we have only awarded restricted stock units and performance units under the Constellium 2013 Equity Plan.
The Constellium 2013 Equity Plan provides that awards may be made under the plan for 10 years following the Board of Directors’ approval of the Constellium 2013 Equity Plan. We have reserved a total of 14,292,291 ordinary shares (of which 7,292,291 ordinary shares were originally reserved, as well as 7,000,000 ordinary shares that were reserved, as approved in the annual general meeting of shareholders in 2018) to be awarded under the Constellium 2013 Equity Plan. The authorization to grant such shares is valid until January 24, 2022.
The number of ordinary shares authorized and available is subject to adjustment in certain circumstances to prevent dilution or enlargement.
At the Company’s shareholders meeting held on November 25, 2019, we ratified the 2018 authorization in order to make new awards under the Constellium 2013 Equity Plan following the Transfer. Awards made following such ratification and Transfer will be subject to compliance with mandatory provisions of the French Commercial Code that now apply, as further described below.
Administration
The Constellium 2013 Equity Plan is administered by our human resources and remuneration committee. The Board of Directors or the human resources and remuneration committee may delegate administration to one or more members of our Board of Directors. The human resources and remuneration committee has the power to interpret the Constellium 2013 Equity Plan and to adopt rules for the administration, interpretation and application of the Constellium 2013 Equity Plan according to its terms. The Board of Directors, acting on the recommendation of our human resources and remuneration committee determines the number of our ordinary shares that will be subject to each award granted under the Constellium 2013 Equity Plan and may take into account the recommendations of our senior management in determining the award recipients and the terms and conditions of such awards. Subject to certain exceptions as may be required pursuant to Rule 16b-3 under the Exchange Act, if applicable, our Board of Directors may, at any time and from time to time, exercise any and all rights and duties of the human resources and remuneration committee under the Constellium 2013 Equity Plan.
Following the Transfer, in accordance with the French Commercial Code:
|
•
|
the human resources and remuneration committee no longer has the power to make awards of any type;
|
|
•
|
the Board of Directors has exclusive power to make awards that are to be settled with shares;
|
|
•
|
the Board of Directors has exclusive power to make awards to the Company’s CEO and other executive corporate officers (mandataires sociaux dirigeants), if any, irrespective of the form of settlement; and
|
|
•
|
the Company’s senior management has exclusive power to make awards that are cash-settled (other than to the Company’s CEO and other executive corporate officers (mandataires sociaux dirigeants), if any).
|
-
69
-
Eligibility
Certain directors, officers, employees and consultants are eligible to be granted awards under the Constellium 2013 Equity Plan. Our human resources and remuneration committee makes recommendations regarding:
|
•
|
which directors, officers, employees and consultants are to be granted awards;
|
|
•
|
the type of award that is granted;
|
|
•
|
the number of our ordinary shares subject to the awards; and
|
|
•
|
the terms and conditions of such awards, consistent with the Constellium 2013 Equity Plan.
|
Following the Transfer, the power to make new grants and set their terms are as described above under “
Administration
.” Furthermore, in accordance with the French Commercial Code, following the Transfer, the Company is no longer permitted to grant restricted stock, and only officers (including the CEO (“
Directeur Général
”) and the Chairman of the Board of Directors (“
Président du conseil d’administration
”), in their respective capacities, and employees are eligible to receive share-settled awards in respect of grants made after the Transfer. Except for the Chairman, other non-executive members of the Board of Directors and consultants are no longer eligible to receive awards that are to be settled with shares.
Stock Options
Subject to the terms and provisions of the Constellium 2013 Equity Plan, stock options to purchase our ordinary shares may be granted to eligible individuals at any time and from time to time as determined by our human resources and remuneration committee. Stock options may be granted as ISOs, which are intended to qualify for favorable treatment to the recipient under U.S. federal tax law, or as nonqualified stock options, which do not qualify for this favorable tax treatment. Subject to the limits provided in the Constellium 2013 Equity Plan, our Board of Directors has the authority to determine the number of stock options granted to each recipient. Each stock option grant is evidenced by a stock option agreement that specifies the stock option exercise price, whether the stock options are intended to be incentive stock options or nonqualified stock options, the duration of the stock options, the number of shares to which the stock options pertain, and such additional limitations, terms and conditions as our Board of Directors may determine.
Our Board of Directors determines the exercise price for each stock option granted, except that the stock option exercise price may not be less than 100% of the fair market value of an ordinary share on the date of grant. All stock options granted under the Constellium 2013 Equity Plan expire no later than 10 years from the date of grant. Stock options are nontransferable except by will or by the laws of descent and distribution or, in the case of nonqualified stock options, as otherwise expressly permitted by our Board of Directors. The granting of a stock option does not accord the recipient the rights of a shareholder, and such rights accrue only after the exercise of a stock option and the registration of ordinary shares in the recipient’s name. Following the Transfer, stock options may only be granted if the Company’s shareholders specifically authorize the Board of Directors to make such grants. We did not request such authorization at the Company’s shareholders meeting held on November 25, 2019, but may do so at a future date.
Stock Appreciation Rights
The Company's senior management may grant SARs under the Constellium 2013 Equity Plan. SARs may be “tandem SARs,” which are granted in conjunction with a stock option, or “free-standing SARs,” which are not granted in conjunction with a stock option. A SAR entitles the holder to receive from us, upon exercise, an amount equal to the excess, if any, of the aggregate fair market value of a specified number of our ordinary shares to which such SAR pertains over the aggregate exercise price for the underlying shares. The exercise price of a free-standing SAR may not be less than 100% of the fair market value of an ordinary share on the date of grant.
A tandem SAR may be granted at the grant date of the related stock option. A tandem SAR may be exercised only at such time or times and to the extent that the related stock option is exercisable and has the same exercise price as the related stock option. A tandem SAR terminates or is forfeited upon the exercise or forfeiture of the related stock option, and the related stock option terminates or is forfeited upon the exercise or forfeiture of the tandem SAR.
Each SAR is evidenced by an award agreement that specifies the exercise price, the number of ordinary shares to which the SAR pertains and such additional limitations, terms and conditions as the Company's senior management may determine. We may make payment of the amount to which the participant exercising the SARs is entitled by delivering ordinary shares, cash or a combination of stock and cash as set forth in the award agreement relating to the SARs. SARs are not transferable except by will or the laws of descent and distribution or, with respect to SARs that are not granted in “tandem” with a stock option, as expressly permitted by the Company’s senior management.
-
70
-
Following the Transfer, the power to make new grants of free-standing SARs and set the terms of free-standing SARs are as described above under “
Administration
” with respect to cash-settled awards. No tandem SARs may be granted unless the shareholders specifically authorize the Board of Directors to make grants of stock options, as described above under “
Stock Options
”.
Restricted Stock
The Constellium 2013 Equity Plan provides for the award of ordinary shares that are subject to forfeiture and restrictions on transferability to the extent permitted by applicable law and as set forth in the Constellium 2013 Equity Plan, the applicable award agreement and as may be otherwise determined by our human resources and remuneration committee. Except for these restrictions and any others imposed by our human resources and remuneration committee to the extent permitted by applicable law, upon the grant of restricted stock, the recipient will have rights of a shareholder with respect to the restricted stock, including the right to vote the restricted stock and to receive all dividends and other distributions paid or made with respect to the restricted stock on such terms as set forth in the applicable award agreement. During the restriction period set by our human resources and remuneration committee, the recipient is prohibited from selling, transferring, pledging, exchanging or otherwise encumbering the restricted stock to the extent permitted by applicable law.
Following the Transfer, under the terms of the French commercial code, the Company is no longer permitted to grant restricted stock.
Restricted Stock Units
The Constellium 2013 Equity Plan authorizes our human resources and remuneration committee to grant RSUs. RSUs are not ordinary shares and do not entitle the recipient to the rights of a shareholder, although the award agreement may provide for rights with respect to dividend equivalents. The recipient may not sell, transfer, pledge or otherwise encumber RSUs granted under the Constellium 2013 Equity Plan prior to their vesting. RSUs may be settled in cash, ordinary shares or a combination thereof as provided in the applicable award agreement, in an amount based on the fair market value of an ordinary share on the settlement date.
Following the Transfer, the Board of Directors has exclusive power to make new grants of restricted stock units and set their terms, in accordance with the French Commercial Code and as described above under “
Administration
” and “
Eligibility
” with respect to share-settled awards. Restricted Stock Units may only be granted to the extent approved by the Company’s shareholders.
Performance-Based Restricted Stock Units
The Constellium 2013 Equity Plan provides for the award of PSUs that are valued by reference to a designated amount of cash or to property other than ordinary shares. The payment of the value of a PSU is conditioned upon the achievement of performance goals set by our human resources and remuneration committee in granting the PSUs and may be paid in cash, ordinary shares, other property or a combination thereof. Any terms relating to the termination of a participant’s employment will be set forth in the applicable award agreement.
Following the Transfer, the Board of Directors has exclusive power to make new grants of PSUs and set their terms, in accordance with the French Commercial Code and as described above under “
Administration
” and “
Eligibility
” with respect to share-settled awards. Furthermore, in accordance with the French Commercial Code, only officers and employees are eligible to receive share-settled awards.
Other Stock-Based Awards
The Constellium 2013 Equity Plan provides for the award of ordinary shares and other awards that are valued by reference to our ordinary shares, including unrestricted stock, dividend equivalents and convertible debentures.
Following the Transfer, in accordance with the French Commercial Code, only officers and employees are eligible to receive share-settled awards, and the power to make new grants and set their terms are as described above under “
Administration
” and “
Eligibility
.”
-
71
-
Performance Goals
The Constellium 2013 Equity Plan provides that performance goals may be established by our human resources and remuneration committee in connection with the grant of any award under the Constellium 2013 Equity Plan.
Following the Transfer, the grant of the new awards is subject to the allocation of powers as described above under “
Administration
.”
Termination without Cause Following a Change in Control
Upon a termination of employment of a plan participant occurring upon or during the two years immediately following the date of a “change in control” (as defined in the Constellium 2013 Equity Plan) by the Company without “cause” (as defined in the Constellium 2013 Equity Plan), unless otherwise provided in the applicable award agreement, (i) all awards held by such participant will vest in full (in the case of any awards that are subject to performance goals, at target) and be free of restrictions, and (ii) any option or SAR held by the participant as of the date of the change in control that remains outstanding as of the date of such termination of employment may thereafter be exercised until (A) in the case of ISOs, the last date on which such ISOs would otherwise be exercisable or (B) in the case of nonqualified options and SARs, the later of (x) the last date on which such nonqualified option or SAR would otherwise be exercisable and (y) the earlier of (I) the second anniversary of such change in control and (II) the expiration of the term of such nonqualified option or SAR. With respect to new share-settled awards made following the Transfer, the Company’s ability to deliver shares is subject to the minimum vesting and, if applicable, holding period requirements set forth under the French Commercial Code, as described below.
Application of the French Commercial Code
Following the Transfer, the French Commercial Code applies to new share-settled grants and requires in particular that:
|
•
|
grants be made by the Board of Directors only, and only pursuant to an authorization of the shareholders which may not have a validity of more than 38 months;
|
|
•
|
no such shareholder authorization may exceed 10% of share capital;
|
|
•
|
only officers and employees are eligible to receive share-settled awards (as described above under “Eligibility”); and
|
|
•
|
persons holding more than 10% of the share capital prior to grant or as a result of the grant are ineligible.
|
There must be a minimum period between grant and delivery of two years, or one year followed by a mandatory one year holding period, subject in both cases to exceptions for death and disability. Furthermore, the total number of shares that are subject to vesting plus the total number subject to mandatory holding at any given time may not exceed 10% of share capital.
Amendments
Our Board of Directors or our human resources and remuneration committee may amend, alter or discontinue the Constellium 2013 Equity Plan, but no amendment, alteration or discontinuation will be made that would materially impair the rights of a participant with respect to a previously granted award without such participant’s consent, unless such an amendment is made to comply with applicable law, including, without limitation, Section 409A of the Code, stock exchange rules or accounting rules. In addition, no such amendment will be made without the approval of the Company’s shareholders to the extent such approval is required by applicable law or the listing standards of the applicable stock exchange.
2019 Long-Term Incentive Plan
The 2019 Long-Term Incentive Plan (which we refer to as the “2019 LTIP”) had mainly the same plan design as the 2017 and 2018 Long-Term Incentive Plans. For our executive officers, as well as for other selected employees, awards consisted of PSUs and RSUs. These awards were granted on April 1, 2019, and are subject to a three-year cliff vesting period, subject to the participant’s continued service through the applicable vesting date, and for PSUs, certain market-related performance conditions being satisfied. For other selected employees, awards consisted of RSUs only.
With regard to PSUs, for the purposes of computing the Constellium Total Shareholder Return (the “Constellium TSR”), (i) the stock price at the beginning of the performance period is deemed to be the average closing share price for the 20 trading days preceding the grant date, and (ii) the stock price at the end of the performance period is deemed to be the average closing share price for the 20 trading days preceding the third anniversary of the grant date. Constellium measures itself against a peer group consisting of the S&P MidCap 400 Materials Index and the S&P SmallCap 600 Materials Index (the “Comparator
-
72
-
Group”), which represents approximately
60
constituents. The 20-day average starting point of a Constellium share for the April 1, 2019 grant date is $8.68. The level of achievement shall be determined by comparing the Constellium TSR to the average of the TSRs of the two indices indicated above as follows:
|
•
|
If the Constellium TSR is below the average of the two 25th percentile TSRs of the Comparator Group, no PSUs will vest.
|
|
•
|
If the Constellium TSR is at the average of the two 25th percentile TSRs of the Comparator Group, 25% of the target PSUs will vest.
|
|
•
|
If the Constellium TSR is at the average of the two median TSRs of the Comparator Group, 100% of the target PSUs will vest.
|
|
•
|
If the Constellium TSR is between the average of the two 25th percentile TSRs and the average of the two median TSRs of the Comparator Group, then the number of PSUs will be determined by linear interpolation on a straight line basis.
|
|
•
|
If the Constellium TSR is at or above the average of the two 75th percentile TSRs of the Comparator Group, 200% of the target PSUs will vest.
|
|
•
|
If the Constellium TSR is between the average of the two median TSRs and the average of the two 75th percentile TSRs of the Comparator Group, then the number of PSUs will be determined by linear interpolation on a straight line basis.
|
|
•
|
If the Constellium TSR is negative, the number of PSUs that vest will be capped at 100% of target.
|
Same as the 2018
Long-Term Incentive Plan (the “2018 LTIP”)
, the 2019 LTIP contains a double trigger with respect to the vesting of RSUs and PSUs upon a change in control (i.e., accelerated vesting requires two triggers: (i) change in control as well as (ii) termination of employment without cause or voluntary termination for good reason). In the event of such a double trigger being applied at any time prior to vesting, unvested RSUs and PSUs will be converted into cash-denominated rights that vest on the date of employment termination. For both RSUs and PSUs, the reference date for the share price will be the date immediately preceding the change in control. For PSUs, the rights will be based on the higher of (I) the base amount (i.e., at target) or (II) the measured TSR on the reference date.
For the 2019 LTIP, 1,028,342 PSUs at target (which can become 2,056,684 shares at maximum) and 899,926 RSUs were granted on April 1, 2019. Under the 2019 LTIP, 101 participants were granted both PSUs and RSUs and an additional 99 participants were granted RSUs only. On December 31, 2019, 1,025,142 PSUs at target (which can become 2,050,284 shares at maximum) and 889,012 RSUs were outstanding. Under the 2019 LTIP, 100 participants held both PSUs and RSUs and an additional 94 participants held RSUs only.
For the 2018 LTIP, 701,109 PSUs at target (which can become 1,402,218 shares at maximum) and 587,687 RSUs were granted on May 25, 2018. Under the 2018 LTIP, 90 participants were granted both PSUs and RSUs and an additional 74 participants were granted RSUs only. On December 31, 2019, 685,204 PSUs at target (which can become 1,370,408 shares at maximum) and 559,396 RSUs were outstanding. Under the 2018 LTIP, 83 participants held both PSUs and RSUs and an additional 64 participants held RSUs only.
For the 2017 Long-Term Incentive Plan (the “2017 LTIP”), 892,781 PSUs at target (which can become 1,785,562 shares at maximum) and 703,180 RSUs were granted on July 31, 2017. Under the 2017 LTIP, 82 participants were granted both PSUs and RSUs and an additional 32 participants were granted RSUs only. On December 31, 2019, 808,948 PSUs at target (which can become 1,617,896 shares at maximum) and 610,095 RSUs were outstanding. Under the 2017 LTIP, 71 participants held both PSUs and RSUs and an additional 21 participants held RSUs only.
Employment and Service Arrangements
Constellium is party to employment or services agreements with each of its officers. In general, the Company may terminate its officers’ employment or services for “cause” upon advance written notice, without compensation, for certain acts of the officer. Each officer may terminate his or her employment at any time upon advance written notice to Constellium. In the event that the officer’s employment or services is terminated by Constellium without cause or, in the case of certain executives, by him for “good reason,” the officer is entitled to certain payments as provided by applicable laws or collective bargaining agreements or as otherwise provided under the applicable employment or services agreements. Except for the foregoing, our officers are not entitled to any severance payments upon the termination of their employment or services for any reason.
-
73
-
Under such employment and services agreements, each of the officers has also agreed not to engage or participate in any business activities that compete with Constellium or solicit its employees or customers for (depending on the officer) up to two years after the termination of the employment or services. The officers have further agreed not to use or disseminate any confidential information concerning Constellium as a result of performing their duties or using Constellium resources during their employment or services.
Contracts with certain of our executive officers are described below.
Employment Agreement with Jean-Marc Germain
Jean-Marc Germain's employment agreement is dated April 25, 2016. The employment agreement with Mr. Germain provides for an annual base salary of $1,040,000 per year until March 31, 2019, which amount was raised to $1,085,000 per year as of April 1, 2019, a target annual bonus of 120% of base salary (equal to $1,302,000), and a maximum annual bonus of 180% of base salary (equal to $1,953,000). In addition, as described above, Mr. Germain was granted the following equity awards in April 2019: (1) 291,219 PSUs (which can become a maximum of 582,438 shares) and (2) 148,557 RSUs. The PSUs vest on the third anniversary of the grant date, subject to continued service and certain market-related performance conditions being satisfied, and have a vesting range of 0-200%. RSUs vest 100% on the third anniversary of the date of grant, subject to continued service.
If Mr. Germain is terminated without “cause” or he resigns for “good reason” (each as defined in the employment agreement), he will be entitled to receive, subject to his execution and non-revocation of a general release of claims, cash severance in an amount equal to the product of (1) one (two, if such termination occurs within the 12-month period following a “change in control” (as defined in the employment agreement)) multiplied by (2) the sum of his base salary and target annual bonus, which severance will be payable over the 12-month (24-month, in the case of a termination within the 12-month period following a change in control) period following his termination of employment. The employment agreement also includes a perpetual confidentiality covenant, a perpetual mutual non-disparagement covenant, and 12-month post-termination non-competition and non-solicitation covenants.
Employment Agreement with Peter Matt
Peter Matt's employment agreement is dated as of October 26, 2016. The employment agreement with Mr. Matt provides for an annual base salary of $625,000 per year until March 31, 2019, which amount was raised to $650,000 per year as of April 1, 2019, a target annual bonus of 90% of base salary (equal to $585,000), and a maximum annual bonus of 135% (equal to $877,500) of base salary. In addition, Mr. Matt was granted the following equity awards in April 2019: (1) 99,847 (which can become a maximum of 199,694 shares) PSUs and (2) 50,934 RSUs. The PSUs vest on the third anniversary of the grant date, subject to continued service and certain market-related performance conditions being satisfied, and have a vesting range of 0-200%. RSUs vest 100% on the third anniversary of the date of grant, subject to continued service.
If Mr. Matt is terminated without “cause” or he resigns for “good reason” (each as defined in the employment agreement), he will be entitled to receive, subject to his execution and non-revocation of a general release of claims, (1) cash severance in an amount equal to the sum of his base salary and target annual bonus and (2) six months of continued welfare benefits. The employment agreement also includes a perpetual confidentiality covenant and 12-month post-termination non-competition and non-solicitation covenants. If Mr. Matt’s employment is terminated without “cause”, Mr. Matt will be offered an additional amount equal to 50% of the sum of his base salary, target annual bonus, and vacation pay in consideration for his agreeing to not compete.
|
C.
|
Board Practices
|
Our Board of Directors currently consists of 10 directors, less than a majority of whom are citizens or residents of the United States. The Board held six meetings in 2019.
Upon the effectiveness of the Transfer, the Company ceased to be governed by the laws of the Netherlands and its pre-Transfer governing documents but instead became governed by the laws of France and the Articles of Association that became effective upon the Transfer. The Transfer resulted in changes to the rights of shareholders and the governance of the Company.
-
74
-
Directors
In France, a company organized as a "
Societas Europaea
" and "
Société anonyme
" can have a two-tier board structure: a management board comprising managing directors (
Directoire
) and a supervisory board comprising the non-executive directors (
Conseil de Surveillance
), or a single-tier board of directors (
Conseil d’Administration
). The single-tier board of directors of such French company will be comprised of non-executive directors and, if any, executive directors (see “Management” below).
Under French law, the board of directors supervises the management of the executive officers, sets the guidelines for the company’s activities and oversees their implementation. Subject to the powers expressly assigned by law to the shareholders’ meetings and within the limit of the corporate purpose, it hears any issue relevant to the company’s smooth operation and, by means of its deliberations, settles the matters of concern to it, taking into consideration the social and environmental impact of the company's activity. The board of directors proceeds with the controls and checks what it deems advisable. Moreover, the board of directors exercises the special powers conferred on it by law.
We currently have a one tier Board of Directors consisting of one executive director (the CEO) and nine non-executive directors. For a listing of the current terms of service of our Directors, see “A. Directors and Senior Management” above.
Under French law, each director has a duty towards the company to properly perform his/her duties. Furthermore, each director has a duty to act in the corporate interest of the company.
The corporate interest extends to the interests of all corporate stakeholders, such as shareholders, creditors, employees, customers and suppliers.
In its relations with third parties, the company shall be bound even by the decisions of the board of directors that do not come under the corporate purpose, unless the company can prove that the third party knew that the decision exceeded that purpose or that it could not have been unaware of this in light of the circumstances; publication of the articles of association alone does not constitute sufficient proof.
Any board resolution regarding a change in the company’s Articles of Association requires shareholders’ approval. The board of directors may decide in its sole discretion, within the confines of French law and the Articles of Association, to incur additional indebtedness subject to any contractual restrictions pursuant to existing financing arrangements.
There is no obligation for directors to hold shares in the company unless required by the articles of association. According to our Articles of Association, there is no such obligation.
Management
Following the Transfer, our Board of Directors has maintained the separation of the functions of Chairman of the Board of Directors (
Président du conseil d’administration
) and Chief Executive Officer (
Directeur Général
).
The Chief Executive Officer is appointed by the board of directors and may (but is not required to) be a director. He or she is vested with the broadest powers to act in all circumstances in the company's name. He or she exercises his or her powers within the scope of the corporate purpose and subject to those that the law expressly assigns to shareholders' meetings and the board of directors.
He or she represents the company in its relations with third parties. The company is bound by the actions of its Chief Executive Officer, even if such actions are not in line with the corporate purpose, unless it can be proven that the third party knew that the decision exceeded that purpose or that it could not have been aware of this in light of the circumstances; publication of the articles of association alone does not constitute sufficient proof.
According to our Articles of Association, our Chief Executive Officer shall not be more than seventy (70) years of age. If our Chief Executive Officer reaches that age limit, he or she shall be considered to have resigned. However, his or her term of office shall be extended until the next meeting of the Board of Directors during which a new Chief Executive Officer shall be appointed.
On a proposal made by the Chief Executive Officer, the Board of Directors may appoint one or more natural persons to assist the Chief Executive Officer as Deputy Chief Executive Officer(s) (
Directeur Général Délégué
), who may (but are not required to) be Directors. The Chief Executive Officer and, if any, the Deputy Chief Executive Officer(s) would be the executive corporate officers ("
mandataires sociaux dirigeants
"), under French law.
-
75
-
In agreement with the Chief Executive Officer, theBoard of Directors shall define the scope and duration of the powers conferred on the Deputy Chief Executive Officer(s). The Board of Directors shall define such Deputy Chief Executive Officer ’s additional compensation. If a Deputy Chief Executive Officer is a director, his or her duties as Deputy Chief Executive Officer cannot outlast his or her directorship.
With regard to representation
vis-à-vis
third parties, Deputy Chief Executive Officers may have the same powers as the Chief Executive Officer. The number of Deputy Chief Executive Officers may not exceed five at the same time.
Director Terms and Remuneration
Under French law, a director of a company is appointed for a maximum term of six years. In practice, the articles of association set the directors’ precise term. According to our Articles of Association, the term of office of a Director is of three (3) years and can be renewed without limitation. Directors may be appointed for a shorter term so that the renewal of the Directors’ terms of office may be spread out over time. According to our Articles of Association, the number of Directors who are more than seventy-five (75) years old may not exceed one third of the directors in office.
The board of directors determines the remuneration of executive directors (i.e. the CEO (“
Directeur Général
”) and, if any, Deputy Chief Executive Officers (“
Directeurs Généraux Délégués
”), who may (but are not required to) be directors). French law does not provide for any specific rules on remuneration of executive directors for French companies not listed on a EU-regulated market. Executive directors may be granted free shares and stock options of the Company.
With respect to the remuneration of non-executive directors, the ordinary shareholders’ meeting votes an envelope of fixed annual fees to be allocated to directors for each year. The board of directors will then decide the allocation of these fees among directors. These fees include all cash remunerations granted to directors in such capacity. Non-executive directors may not be granted any share-settled awards (such as free shares or stock options) in such capacity. In addition to the fixed amount of fees approved at the shareholders meeting, the board of directors may grant fees to the chairman of the board in such capacity, and may also, exceptionally, grant additional fees to certain directors in remuneration for separate, specific missions or tasks assigned to them. Non-executive directors are not eligible to receive awards that are to be settled with shares. However, the board of directors may grant share-settled awards (such as free shares or stock options) to the chairman of the board in such capacity.
Removal of Directors
Under French law, directors may be removed from office, with or without cause, at any shareholders’ meeting without notice or justification, by a simple majority vote of shareholders.
Directors cannot be suspended or removed by the board of directors.
An executive corporate officer appointed by the board of directors (CEO (
Directeur Général
) or, if any, deputy chief executive officer (
Directeur Général Délégué
) can have his executive duties suspended at any time by the board of directors. If such executive corporate officer is also a director, he will remain non-executive director as his or her duties as a director can only be removed by a shareholders’ meeting.
Director Election and Vacancies
Under French law, new members of the board of directors of a company are appointed by the general meeting of shareholders by a simple majority. The board of directors which convenes the shareholders' meeting proposes candidates; shareholders may also propose candidates under certain conditions. The shareholders at the meeting may vote for other candidates than those proposed on the agenda, by a simple majority.
Vacancies on the board of directors occurring between shareholders’ meetings may be filled at a board meeting by a majority of the remaining directors, subject to ratification at the next shareholders’ meeting.
Conflict of Interest Transactions
Pursuant to French law and the Articles of Association, any agreement between (directly or through an intermediary) a company and any of its directors, its executive corporate officers ("
mandataires sociaux dirigeants
"), its shareholders holding more than 10% of its voting rights or companies controlling such shareholders, that is not entered into (i) in the ordinary course of business and (ii) under normal terms and conditions, is subject to a prior authorization of the board of directors, excluding
-
76
-
the participation and vote of the interested director. Such agreement is also subject to approval at the next ordinary shareholders’ meeting (by a simple majority), excluding the votes of any interested persons. The foregoing requirements also apply to agreements between the company and another entity if one of the company’s directors, or executive corporate officers ("
mandataires sociaux dirigeants
") is an owner, a general partner, manager, director, general manager, member of the executive or supervisory board of the other entity, as well as to agreements in which one of the company’s directors, executive corporate officers ("
mandataires sociaux dirigeants
"), shareholders holding more than 10% of its voting rights or companies controlling such shareholders has an indirect interest. If the transaction has not been pre-approved by the board of directors, it can be nullified if it has prejudicial consequences for the company. If an agreement is not then approved by the shareholders, the interested person may be held liable for any prejudicial consequences for the company of the unapproved transaction; such transaction will nevertheless remain valid unless it is nullified in case of fraud. Aside from the above rule, there are no specific provisions prohibiting conflicted directors to participate or vote at board meetings. However, as a general rule, directors must act in the interest of the company.
Action by Written Consent and Quorum Requirements
According to French law and the Articles of Association, certain decisions of the Board of Directors may be adopted in writing. These decisions include interim appointment of directors, authorization of certain security interests and guarantees, amendment of the articles of association to comply with legal provisions, convening of shareholder meetings and decisions to transfer the registered office within the same department. According to French law and our Articles of Association, a director may grant to another director a proxy to represent him or her at a meeting of the board of directors. No director can hold more than one proxy at any meeting.
According to French law and the Articles of Association, for the board’s deliberations to be valid, more than half of the board members must be present or represented. The board of directors’ decisions shall be taken by a majority vote; if the votes are tied, the chairman’s vote shall be decisive.
Board Composition and Diversity
According to Article L. 225-17 of the French Commercial Code, the appointment of members of the board of directors must seek to achieve a balanced representation of men and women. If the number of permanent employees of the company exceeds 1,000 (including its direct and indirect French subsidiaries) or 5,000 (including its direct and indirect subsidiaries worldwide) for two consecutive fiscal years, an amendment of the articles of association may be required for the board of directors to include at least two directors representing the employees (in companies having more than eight directors) or at least one director representing the employees (in companies having no more than eight directors).
Chairman of the Board
Pursuant to French law, companies with a single-tier board of directors can choose between the separation of functions of the chairman of the board of directors (
Président du conseil d'administration
) and chief executive officer (
Directeur Général
) of the company and the aggregation of such duties. According to our Articles of Association, our Board of Directors can decide to or not to separate the functions of the Chairman of the Board of Directors and Chief Executive Officer.
Under French law, the board of directors elects a chairman among its members who must be a natural person. The board of directors determines the term of office of the chairman, which cannot exceed his or her tenure as director, and may revoke him or her at any time.
The chairman organizes and directs the work of the board of directors, on which he or she reports to the general shareholders’ meeting, and ensures the proper functioning of the corporate bodies and, in particular, that the directors are able to fulfill their mission.
According to our Articles of Association, our Chairman of the Board cannot be older than seventy-five (75) years. If our Chairman of the Board reaches this age limit during his or her term as Chairman, he or she is automatically deemed to have resigned from his or her directorship. His or her mandate would extend however, until the next meeting of the Board of Directors during which his or her successor is appointed. Subject to this provision, the Chairman of the Board is always eligible for re-election.
-
77
-
Director Independence
Under French law, there are no director independence requirements for French companies not listed on an EU-regulated market, so we defer to the NYSE requirements. As a foreign private issuer under the NYSE rules, we are not required to have independent Directors on our Board, except to the extent that our audit committee is required to consist of independent Directors. However, our Board has determined that, under current NYSE listing standards regarding independence (which we are not currently subject to), and taking into account any applicable committee standards, as of December 31, 2019, Messrs. Evans, Brandjes, Hartman, Maugis, Ormerod, Paschke and Mmes. Walker, Brooks and Frachet are deemed independent directors. Under these standards, Mr. Germain is not deemed independent as he serves as the CEO of the Company.
Committees
Under French law, the board of directors may appoint, from within, one or more special committees, of which it sets the composition and powers and which carry out their activity under its responsibility. Each committee shall report on its missions at meetings of the board of directors. Our Board of Directors has currently four committees: the Audit Committee, the Human Resources and Remuneration Committee, the Nominating/Governance Committee and the Environment, Health and Safety Committee.
Audit Committee
As of December 31, 2019, our audit committee consisted of four independent directors under the NYSE requirements: Lori Walker (Chair), Martha Brooks, John Ormerod and Werner Paschke. Our Board has determined that at least one member is an “audit committee financial expert” as defined by the SEC and also meets the additional criteria for independence of audit committee members set forth in Rule 10A-3(b)(1) under the Exchange Act. The audit committee held 8 meetings in 2019.
The principal duties and responsibilities of our audit committee are to oversee and monitor the following:
|
•
|
our financial reporting process and internal control system;
|
|
•
|
the integrity of our consolidated financial statements;
|
|
•
|
the independence, qualifications and performance of our independent registered public accounting firm;
|
|
•
|
the performance of our internal audit function; and
|
|
•
|
our compliance with legal, ethical and regulatory matters.
|
Human Resources and Remuneration Committee
As of December 31, 2019, our human resources and remuneration committee consisted of four directors: Martha Brooks (Chair), Peter Hartman, Richard Evans and Guy Maugis. The human resources and remuneration committee held 4 meetings in 2019.
The principal duties of our human resources and remuneration committee are as follows:
|
•
|
to review, evaluate and make recommendations to the full Board regarding our compensation policies and establish performance-based incentives that support our long-term goals, objectives and interests;
|
|
•
|
to review and approve the compensation of our Chief Executive Officer, all employees who report directly to our Chief Executive Officer and other members of our senior management;
|
|
•
|
to review and approve the departure conditions of employees who reported directly to our CEO and who have left Constellium;
|
|
•
|
to review and approve compensation structure and level of any new employee who reports directly to our CEO;
|
|
•
|
to review and make recommendations to the Board with respect to our incentive compensation plans and equity-based compensation plans;
|
|
•
|
to set and review the compensation of and reimbursement policies for members of the Board;
|
|
•
|
to provide oversight concerning selection of officers, management succession planning, expense accounts, indemnification and insurance matters, and separation packages; and
|
|
•
|
to provide regular reports to the Board and take such other actions as are necessary and consistent with our Articles of Association.
|
-
78
-
Nominating/Governance Committee
As of December 31, 2019, our nominating/governance committee consisted of four directors: Richard Evans (Chair), Michiel Brandjes, John Ormerod, and Lori Walker. The nominating/governance committee held 4 meetings in 2019.
The principal duties and responsibilities of the nominating/governance committee are as follows:
|
•
|
to establish criteria for Board and committee membership and recommend to our Board proposed nominees for election to the Board and for membership on committees of our Board; and
|
|
•
|
to make recommendations to our Board regarding board governance matters and practices; and
|
|
•
|
to review conflicts of interest, related party matters and director independence.
|
Environment, Health and Safety Committee
As of December 31, 2019, our environment, health and safety committee consisted of three directors: Guy Maugis (Chair), Michiel Brandjes and Peter Hartman. The environment, health and safety committee held 2 meetings in 2019.
The principal duties and responsibilities of the environment, health and safety committee are to review and monitor the following:
|
•
|
the Company’s policies, practices and programs with respect to the management of EHS affairs, including sustainability;
|
|
•
|
the adequacy of the Company’s policies, practices and programs for ensuring compliance with EHS laws and regulations; and
|
|
•
|
any significant EHS litigation and regulatory proceedings in which the Company is or may become involved.
|
|
D.
|
Employees
|
As of December 31, 2019, we employed approximately 13,200 employees, including approximately 800 fixed-term contractors as well as approximately 700 temporary employees. Approximately 89% of our employees were engaged in production and maintenance activities and approximately 11% were employed in support functions. Approximately 35% of our permanent employees were employed in France, 29% in the United States, 20% in Germany, 6% in Switzerland, and 10% in Eastern Europe and other regions, which percentages are comparable to the distribution of employees geographically in 2018.
A vast majority of non-U.S. employees and approximately 42% of U.S. employees are covered by collective bargaining agreements. These agreements are negotiated on site, regionally or on a national level, and are of different durations.
|
E.
|
Share Ownership
|
Information with respect to share ownership of members of our board of directors and our senior management is included in “Item 7. Major Shareholders and Related Party Transactions.”
Equity Incentive Plans
The Company has adopted the Constellium 2013 Equity Plan and the 2018 Long Term Incentive Award Agreement thereunder pursuant to which certain of our directors, executive officers, employees, and consultants are eligible to receive equity awards. See “—Constellium SE 2013 Equity Incentive Plan” and “—2019 Long-Term Incentive Plan” above.
-
79
-
|
A.
|
Major Shareholders
|
The following table sets forth the major shareholders of Constellium SE as known by us or ascertained from public filings made by our major shareholders (each person or group of affiliated persons who is known to be the beneficial owner of more than 5% of ordinary shares) and the number and percentage of ordinary shares owned by each such shareholder, in each case as of March 6, 2020.
Under the rules of the SEC, a person is deemed to be a “beneficial owner” of a security if that person has or shares “voting power,” which includes the power to vote or to direct the voting of such security, or “investment power,” which includes the power to dispose of or to direct the disposition of such security. A person is also deemed to be a beneficial owner of any securities of which that person has a right to acquire beneficial ownership within 60 days. Under these rules, more than one person may be deemed to be a beneficial owner of such securities as to which such person has voting or investment power.
The beneficial ownership percentages in this table have been calculated on the basis of the total number of ordinary shares.
|
Name of beneficial owner
|
Number of
ordinary
shares
|
Beneficial
ownership
percentage
|
||||||
|
Caisse des Dépôts (f/k/a Caisse des Dépôts et Consignations),
Bpifrance Participations S.A., Bpifrance S.A. (f/k/a BPI-Groupe), EPIC Bpifrance (f/k/a EPIC BPI-Groupe)
|
16,393,903
|
|
(1)
|
11.9
|
%
|
|||
|
T. Rowe Price Associates, Inc.
|
9,840,684
|
|
(2)
|
7.1
|
%
|
|||
|
Directors and Senior Management
|
||||||||
|
Richard B. Evans
|
236,219
|
|
(3)
|
*
|
|
|||
|
Guy Maugis
|
22,799
|
|
(4)
|
*
|
|
|||
|
Philippe Guillemot
|
23,957
|
|
(5)
|
*
|
|
|||
|
Werner P. Paschke
|
102,382
|
|
(6)
|
*
|
|
|||
|
Michiel Brandjes
|
34,748
|
|
(7)
|
*
|
|
|||
|
Peter F. Hartman
|
24,570
|
|
(8)
|
*
|
|
|||
|
John Ormerod
|
26,435
|
|
(9)
|
*
|
|
|||
|
Lori A. Walker
|
24,274
|
|
(10)
|
*
|
|
|||
|
Martha Brooks
|
28,642
|
|
(11)
|
*
|
|
|||
|
Stéphanie Frachet
|
—
|
|
(12)
|
*
|
|
|||
|
Jean-Marc Germain
|
355,000
|
|
(13)
|
|||||
|
Peter R. Matt
|
213,382
|
|
(14)
|
*
|
|
|||
|
Ingrid Joerg
|
140,840
|
|
(15)
|
*
|
|
|||
|
Paul Warton
|
166,276
|
|
(16)
|
*
|
|
|||
|
Peter Basten
|
174,150
|
|
(17)
|
*
|
|
|||
__________________
|
*
|
Represents beneficial ownership of less than 1%.
|
|
(1)
|
This information is based on a Schedule 13D/A filed with the SEC on November 8, 2017. Bpifrance Participations S.A. (f/k/a Fonds Stratégique d'Investissement, “Bpifrance”) is a French public investment fund specializing in the business of equity financing via direct investments or fund and a wholly owned subsidiary of Bpifrance S.A., a French financial institution (“Bpifrance S.A.”). Caisse des Dépôts (“CDC”) and EPIC Bpifrance (“EPIC”) each hold 50% of the share capital of Bpifrance S.A. and jointly control Bpifrance S.A. CDC is principally engaged in the business of long-term investments. EPIC is principally engaged in the business of banking finance. Bpifrance holds directly 16,393,903 ordinary shares of the Company. As of the date hereof, neither Bpifrance S.A., CDC nor EPIC holds any ordinary shares
|
-
80
-
directly. Bpifrance S.A. may be deemed to be the beneficial owner of 16,393,903 ordinary shares of the Company, indirectly through its sole ownership of Bpifrance. CDC and EPIC may be deemed to be the beneficial owners of 16,393,903 ordinary shares of the Company, indirectly through their joint ownership and control of Bpifrance S.A. The principal address for CDC is 56, rue de Lille, 75007 Paris, France and for Bpifrance, Bpifrance S.A. and EPIC is 27-31 avenue du Général Leclerc 94700 Maisons-Alfort, France.
|
(2)
|
This information is based on a Schedule 13G filed with the SEC on February 14, 2020 reporting beneficial ownership as of December 31, 2019. T.Rowe Price Associates, Inc. has sole dispositive power with respect to 9,840,684 ordinary shares and sole voting power with respect to 2,287,839 ordinary shares.
|
|
(3)
|
Consists of 236,219 ordinary shares held indirectly by Mr. Evans through the Evans Family Inter Vivos Revocable Trust. Excludes the remaining portions of previous grants: 3,133 ordinary shares underlying unvested RSUs that will vest on the earlier of (i) April 1, 2020 or (ii) the date of the annual general meeting of shareholders of that year; 2,074 ordinary shares underlying unvested RSUs that will vest on the earlier of (i) May 25, 2020 or (ii) the date of the annual general meeting of shareholders of that year; 1,899 ordinary shares underlying unvested RSUs that will vest on the earlier of (i) August 14, 2020 or (ii) the date of the annual general meeting of shareholders of that year; 3,133 ordinary shares underlying unvested RSUs that will vest on the earlier of (i) April 1, 2021 or (ii) the date of the annual general meeting of shareholders of that year; and 1,898 ordinary shares underlying unvested RSUs that will vest on the earlier of (i) August 14, 2021 or (ii) the date of the annual general meeting of shareholders of that year, subject to continued service.
|
|
(4)
|
Consists of 22,799 ordinary shares held directly by Mr. Maugis. Excludes the remaining portions of previous grants: 2,507 ordinary shares underlying unvested RSUs that will vest on the earlier of (i) April 1, 2020 or (ii) the date of the annual general meeting of shareholders of that year; 1,660 ordinary shares underlying unvested RSUs that will vest on the earlier of (i) May 25, 2020 or (ii) the date of the annual general meeting of shareholders of that year; 1,477 ordinary shares underlying unvested RSUs that will vest on the earlier of (i) August 14, 2020 or (ii) the date of the annual general meeting of shareholders of that year; 2,506 ordinary shares underlying unvested RSUs that will vest on the earlier of (i) April 1, 2021 or (ii) the date of the annual general meeting of shareholders of that year; and 1,477 ordinary shares underlying unvested RSUs that will vest on the earlier of (i) August 14, 2021 or (ii) the date of the annual general meeting of shareholders of that year, subject to continued service.
|
|
(5)
|
Consists of 23,957 ordinary shares held directly by Mr. Guillemot. Excludes the remaining unvested portions of grants which were canceled due to the resignation of Mr. Guillemot effective December 13, 2019.
|
|
(6)
|
Consists of 102,382 ordinary shares held directly by Mr. Paschke. Excludes the remaining portions of previous grants: 2,507 ordinary shares underlying unvested RSUs that will vest on the earlier of (i) April 1, 2020 or (ii) the date of the annual general meeting of shareholders of that year; 1,660 ordinary shares underlying unvested RSUs that will vest on the earlier of (i) May 25, 2020 or (ii) the date of the annual general meeting of shareholders of that year; 1,477 ordinary shares underlying unvested RSUs that will vest on the earlier of (i) August 14, 2020 or (ii) the date of the annual general meeting of shareholders of that year; 2,506 ordinary shares underlying unvested RSUs that will vest on the earlier of (i) April 1, 2021 or (ii) the date of the annual general meeting of shareholders of that year; and 1,477 ordinary shares underlying unvested RSUs that will vest on the earlier of (i) August 14, 2021 or (ii) the date of the annual general meeting of shareholders of that year, subject to continued service.
|
|
(7)
|
Consists of 34,748 ordinary shares held directly by Mr. Brandjes. Excludes the remaining portions of previous grants: 2,507 ordinary shares underlying unvested RSUs that will vest on the earlier of (i) April 1, 2020 or (ii) the date of the annual general meeting of shareholders of that year; 1,660 ordinary shares underlying unvested RSUs that will vest on the earlier of (i) May 25, 2020 or (ii) the date of the annual general meeting of shareholders of that year; 1,477 ordinary shares underlying unvested RSUs that will vest on the earlier of (i) August 14, 2020 or (ii) the date of the annual general meeting of shareholders of that year; 2,506 ordinary shares underlying unvested RSUs that will vest on the earlier of (i) April 1, 2021 or (ii) the date of the annual general meeting of shareholders of that year; and 1,477 ordinary shares underlying unvested RSUs that will vest on the earlier of (i) August 14, 2021 or (ii) the date of the annual general meeting of shareholders of that year, subject to continued service.
|
|
(8)
|
Consists of 24,570 ordinary shares held directly by Mr. Hartman. Excludes the remaining portions of previous grants: 2,507 ordinary shares underlying unvested RSUs that will vest on the earlier of (i) April 1, 2020 or (ii) the date of the annual general meeting of shareholders of that year; 1,660 ordinary shares underlying unvested RSUs that will vest on the earlier of (i) May 25, 2020 or (ii) the date of the annual general meeting of shareholders of that year; 1,477 ordinary shares underlying unvested RSUs that will vest on the earlier of (i) August 14, 2020 or (ii) the date of the annual general meeting of shareholders of that year; 2,506 ordinary shares underlying unvested RSUs that will vest on the earlier of
|
-
81
-
(i) April 1, 2021 or (ii) the date of the annual general meeting of shareholders of that year; and 1,477 ordinary shares underlying unvested RSUs that will vest on the earlier of (i) August 14, 2021 or (ii) the date of the annual general meeting of shareholders of that year, subject to continued service.
|
(9)
|
Consists of 26,435 ordinary shares held by Mr. Ormerod. Excludes the remaining portions of previous grants: 2,507 ordinary shares underlying unvested RSUs that will vest on the earlier of (i) April 1, 2020 or (ii) the date of the annual general meeting of shareholders of that year; 1,660 ordinary shares underlying unvested RSUs that will vest on the earlier of (i) May 25, 2020 or (ii) the date of the annual general meeting of shareholders of that year; 1,477 ordinary shares underlying unvested RSUs that will vest on the earlier of (i) August 14, 2020 or (ii) the date of the annual general meeting of shareholders of that year; 2,506 ordinary shares underlying unvested RSUs that will vest on the earlier of (i) April 1, 2021 or (ii) the date of the annual general meeting of shareholders of that year; and 1,477 ordinary shares underlying unvested RSUs that will vest on the earlier of (i) August 14, 2021 or (ii) the date of the annual general meeting of shareholders of that year, subject to continued service.
|
|
(10)
|
Consists of 24,274 ordinary shares held directly by Ms. Walker. Excludes the remaining portions of previous grants: 2,507 ordinary shares underlying unvested RSUs that will vest on the earlier of (i) April 1, 2020 or (ii) the date of the annual general meeting of shareholders of that year; 1,660 ordinary shares underlying unvested RSUs that will vest on the earlier of (i) May 25, 2020 or (ii) the date of the annual general meeting of shareholders of that year; 1,477 ordinary shares underlying unvested RSUs that will vest on the earlier of (i) August 14, 2020 or (ii) the date of the annual general meeting of shareholders of that year; 2,506 ordinary shares underlying unvested RSUs that will vest on the earlier of (i) April 1, 2021 or (ii) the date of the annual general meeting of shareholders of that year; and 1,477 ordinary shares underlying unvested RSUs that will vest on the earlier of (i) August 14, 2021 or (ii) the date of the annual general meeting of shareholders of that year, subject to continued service.
|
|
(11)
|
Consists of 28,642 ordinary shares held directly by Ms. Brooks. Excludes the remaining portions of previous grants: 2,507 ordinary shares underlying unvested RSUs that will vest on the earlier of (i) April 1, 2020 or (ii) the date of the annual general meeting of shareholders of that year; 1,660 ordinary shares underlying unvested RSUs that will vest on the earlier of (i) May 25, 2020 or (ii) the date of the annual general meeting of shareholders of that year; 1,477 ordinary shares underlying unvested RSUs that will vest on the earlier of (i) August 14, 2020 or (ii) the date of the annual general meeting of shareholders of that year; 2,506 ordinary shares underlying unvested RSUs that will vest on the earlier of (i) April 1, 2021 or (ii) the date of the annual general meeting of shareholders of that year; and 1,477 ordinary shares underlying unvested RSUs that will vest on the earlier of (i) August 14, 2021 or (ii) the date of the annual general meeting of shareholders of that year, subject to continued service.
|
|
(12)
|
No ordinary shares are held directly by Ms. Frachet and no RSUs or PSUs were granted in 2019.
|
|
(13)
|
Consists of 355,000 ordinary shares held directly by Mr. Germain. Excludes the remaining portions of previous grants: 216,943 ordinary shares underlying unvested PSUs that could vest ranging from 0% to 200% of target on July 31, 2020, subject to continued service and certain market-related performance conditions being satisfied at the end of the three-year vesting period; 110,667 ordinary shares underlying unvested RSUs that will vest on July 31, 2020, subject to continued service; 197,531 ordinary shares underlying unvested PSUs that could vest ranging from 0% to 200% of target on May 25, 2021, subject to continued service and certain market-related performance conditions being satisfied at the end of the three-year vesting period; 100,765 ordinary shares underlying unvested RSUs that will vest on May 25, 2021, subject to continued service; 291,219 ordinary shares underlying unvested PSUs that could vest ranging from 0% to 200% of target on April 1, 2022, subject to continued service and certain market-related performance conditions being satisfied at the end of the three-year vesting period; and 148,557 ordinary shares underlying unvested RSUs that will vest on April 1, 2022, subject to continued service.
|
|
(14)
|
Consists of 213,382 ordinary shares held directly by Mr. Matt. Excludes the remaining portions of previous grants: 71,946 ordinary shares underlying unvested PSUs that could vest ranging from 0% to 200% of target on July 31, 2020, subject to continued service and certain market-related performance conditions being satisfied at the end of the three-year vesting period; 36,701 ordinary shares underlying unvested RSUs that will vest on July 31, 2020, subject to continued service; 67,901 ordinary shares underlying unvested PSUs that could vest ranging from 0% to 200% of target on May 25, 2021, subject to continued service and certain market-related performance conditions being satisfied at the end of the three-year vesting period; 34,638 ordinary shares underlying unvested RSUs that will vest on May 25, 2021, subject to continued service; 99,847 ordinary shares underlying unvested PSUs that could vest ranging from 0% to 200% of target on April 1, 2022, subject to continued service and certain market-related performance conditions being satisfied at the end of the three-year vesting period; and 50,934 ordinary shares underlying unvested RSUs that will vest on April 1, 2022, subject to continued service.
|
-
82
-
|
(15)
|
Consists of 140,840 ordinary shares held directly by Ms. Joerg. Excludes the remaining portions of previous grants: 47,214 ordinary shares underlying unvested PSUs that could vest ranging from 0% to 200% of target on July 31, 2020, subject to continued service and certain market-related performance conditions being satisfied at the end of the three-year vesting period; 24,085 ordinary shares underlying unvested RSUs that will vest on July 31, 2020, subject to continued service; 34,462 ordinary shares underlying unvested PSUs that could vest ranging from 0% to 200% of target on May 25, 2021, subject to continued service and certain market-related performance conditions being satisfied at the end of the three-year vesting period; 17,580 ordinary shares underlying unvested RSUs that will vest on May 25, 2021, subject to continued service; 45,669 ordinary shares underlying unvested PSUs that could vest ranging from 0% to 200% of target on April 1, 2022, subject to continued service and certain market-related performance conditions being satisfied at the end of the three-year vesting period; and 23,297 ordinary shares underlying unvested RSUs that will vest on April 1, 2022, subject to continued service.
|
|
(16)
|
Consists of 166,276 ordinary shares held directly by Mr. Warton. Excludes the remaining portions of previous grants: 42,170 ordinary shares underlying unvested PSUs that could vest ranging from 0% to 200% of target on July 31, 2020, subject to continued service and certain market-related performance conditions being satisfied at the end of the three-year vesting period; 21,512 ordinary shares underlying unvested RSUs that will vest on July 31, 2020, subject to continued service; 34,462 ordinary shares underlying unvested PSUs that could vest ranging from 0% to 200% of target on May 25, 2021, subject to continued service and certain market-related performance conditions being satisfied at the end of the three-year vesting period; 17,580 ordinary shares underlying unvested RSUs that will vest on May 25, 2021, subject to continued service; 45,669 ordinary shares underlying unvested PSUs that could vest ranging from 0% to 200% of target on April 1, 2022, subject to continued service and certain market-related performance conditions being satisfied at the end of the three-year vesting period; and 23,297 ordinary shares underlying unvested RSUs that will vest on April 1, 2022, subject to continued service.
|
|
(17)
|
Consists of 174,150 ordinary shares held directly by Mr. Basten. Excludes the remaining portions of previous grants: 31,485 ordinary shares underlying unvested PSUs that could vest ranging from 0% to 200% of target on July 31, 2020, subject to continued service and certain market-related performance conditions being satisfied at the end of the three-year vesting period; 16,061 ordinary shares underlying unvested RSUs that will vest on July 31, 2020, subject to continued service; 34,462 ordinary shares underlying unvested PSUs that could vest ranging from 0% to 200% of target on May 25, 2021, subject to continued service and certain market-related performance conditions being satisfied at the end of the three-year vesting period; 17,580 ordinary shares underlying unvested RSUs that will vest on May 25, 2021, subject to continued service; 45,669 ordinary shares underlying unvested PSUs that could vest ranging from 0% to 200% of target on April 1, 2022, subject to continued service and certain market-related performance conditions being satisfied at the end of the three-year vesting period; and 23,297 ordinary shares underlying unvested RSUs that will vest on April 1, 2022, subject to continued service.
|
None of our principal shareholders have voting rights different from those of our other shareholders.
|
B.
|
Related Party Transactions
|
Amended and Restated Shareholders Agreement and Related Transactions
The Company, Apollo Omega, Rio Tinto and Bpifrance entered into an amended and restated shareholders agreement on May 29, 2013 (the “Shareholders Agreement”). The Shareholders Agreement terminated with respect to Apollo Omega and Rio Tinto in connection with certain of their respective sales of our ordinary shares described elsewhere in this Annual Report. The Shareholders Agreement provides for, among other things, piggyback registration rights and demand registration rights for Bpifrance for so long as Bpifrance owns any of our ordinary shares.
In addition, the Shareholders Agreement provides that, except as otherwise required by applicable law, Bpifrance will be entitled to designate for binding nomination one director to our Board of Directors so long as its percentage ownership interest is equal to or greater than 4% or it continues to hold all of the ordinary shares it subscribed for at the closing of the acquisition (such share number adjusted for the pro rata share issuance). Our directors will be elected by our shareholders acting at a general meeting upon a binding nomination by the Board of Directors as described in “Item 6. Directors, Senior Management and Employees—A. Directors and Senior Management.” A shareholder’s percentage ownership interest is derived by dividing (i) the total number of ordinary shares owned by such shareholder and its affiliates by (ii) the total number of outstanding ordinary shares.The Company agreed to share financial and other information with Bpifrance to the extent reasonably required to comply with its tax, investor or regulatory obligations and with a view to keeping Bpifrance properly informed about the financial and business affairs of the Company. The Shareholders Agreement contains provisions to the effect that Bpifrance is
-
83
-
obliged to treat all information provided to it as confidential, and to comply with all applicable rules and regulations in relation to the use and disclosure of such information. Stéphanie Frachet, was appointed as a non-executive Director of the Company in May 2018, is currently Managing Director and member of the Bpifrance Capital Development Executive Committee of Bpifrance Investissement which she joined in 2009.
Bpifrance Investissement is a subsidiary of Bpifrance, which is a wholly owned subsidiary of Bpifrance S.A. (f/k/a BPI Groupe), a French financial institution jointly owned and controlled by the Caisse des Dépôts et Consignations, a French special public entity (
établissement special
) and EPIC Bpifrance (f/k/a EPIC BPI-Groupe), a French public institution of industrial and commercial nature. As of March 6, 2020, Bpifrance owns approximately 11.9% of the Company’s outstanding ordinary shares. In January 2015, Bpifrance Financement, an affiliate of Bpifrance Investissement, entered into a three-year revolving credit facility with Constellium Issoire (f/k/a Constellium France) for an aggregate amount of €10 million. The facility was subject to automatic reduction of 33% of the aggregate amount per year. The facility was undrawn and in 2018 the amount available for drawing was €3.3 million, subject to a commitment fee of 1% per year. Should any amount have been drawn under this facility, it would have borne interest at a rate equal to 3 months Euribor plus 2.5%. This facility matured on January 12, 2018. On March 28, 2018, Bpifrance Financement entered into a new three-year revolving credit facility with Constellium Issoire for an aggregate amount of €10 million for the purpose of financing various investments, subject to a commitment fee of 1% per year. The maximum amount of authorized ceiling is to be reduced each quarter by €833,333.33. Any amount drawn under this facility will bear interest at a rate equal to 3 months Euribor (with a floor of 0%) plus 2.5%. The facility may be drawn upon from time to time. As of December 31, 2019, the facility was undrawn.
Transactions with Joint Venture
On January 10, 2019, pursuant to a purchase agreement with UACJ Corporation (“UACJ”) and its U.S. subsidiary, Tri-Arrows Aluminum Holding Inc. (“TAAH”), we acquired TAAH’s 49% stake in Constellium-UACJ ABS, LLC (“CUA”), for $100 million plus the assumption of 49% of approximately $80 million of third party debt at CUA. In connection with the agreement with UACJ and TAAH, we and TAAH agreed to certain transitional commercial arrangements connected to the continuing operations and the business, including an agreement for a multiyear supply of cold coils. See Note 19 in the Consolidated Financial Statements attached hereto starting on Page F-1 for additional information about our transactions with CUA. Following the acquisition described above, CUA was renamed Constellium Bowling Green LLC.
|
C.
|
Interests of Experts and Counsel
|
Not applicable.
|
A.
|
Consolidated Statements and Other Financial Information
|
Our Consolidated Financial Statements as of December 31, 2018 and 2019 and for the years ended December 31, 2017 2018 and 2019 are included in this Annual Report at “Item 18. Financial Statements.”
Legal Proceedings
Legal proceedings are disclosed in “Item 4. Information on the Company—B. Business Overview—Litigation and Legal Proceedings.”
Dividend Policy
Our Board of Directors periodically explores the potential adoption of a dividend program; however, no assurances can be made that any future dividends will be paid on the ordinary shares. Any declaration and payment of future dividends to holders of our ordinary shares will be at the discretion of our Board of Directors and will depend on many factors, including our financial condition, earnings, capital requirements, level of indebtedness, statutory future prospects and contractual restrictions applying to the payment of dividends and other considerations that our Board of Directors deems relevant. In general, any payment of dividends must be made in accordance with the requirements of French law. Under French law, payment of dividends and other distributions to shareholders may be made only if our shareholders’ equity exceeds the sum of our called up and paid-in share capital plus the reserves required to be maintained by law and by our Articles of Association.
-
84
-
Under French law, dividends are approved by the shareholders’ meeting. Dividends may only be paid by a French
Societas Europaea
out of “distributable profits,” plus any distributable reserves and “distributable premium” that the shareholders decide to make available for distribution, other than those reserves that are specifically required by law.
“Distributable profits” consist of the unconsolidated net profits of the relevant company for each fiscal year, as increased or reduced by any profit or loss carried forward from prior years.
“Distributable premium” refers to the contribution paid by the shareholders in addition to the par value of their shares for their subscription that the shareholders decide to make available for distribution.
Except in the case of a share capital reduction, no distribution can be made to the shareholders when the net equity is, or would become, lower than the amount of the share capital plus the reserves which cannot be distributed in accordance with the law or the by-laws.
Dividends may be paid in cash or, if the shareholders’ meeting so decides, in kind, provided that all the shareholders receive a whole number of assets of the same nature paid in lieu of cash.
Our Articles of Association provide that each shareholder may be given the choice to receive his dividend in cash or in shares subject to a decision of the shareholders’ meeting taken by ordinary resolution.
Under French law, the board of directors may distribute interim dividends after the end of the fiscal year but before the approval by the shareholders of the financial statements for the relevant fiscal year when the interim balance sheet, established during such year and certified by an auditor, reflects that the company has earned distributable profits since the close of the last fiscal year, after recognizing the necessary depreciation and provisions and after deducting prior losses, if any, and the sums to be allocated to reserves, as required by French law or articles of association, and including any retained earnings. The amount of such interim dividends may not exceed the amount of the profit so defined.
Generally, we rely on dividends paid to Constellium SE, or funds otherwise distributed or advanced to Constellium SE by its subsidiaries to fund the payment of dividends, if any, to our shareholders. In addition, restrictions contained in the agreements governing our outstanding indebtedness limit our ability to pay dividends on our ordinary shares and limit the ability of our subsidiaries to pay dividends to us. Future indebtedness that we may incur may contain similar restrictions.
|
B.
|
Significant Changes
|
Except as otherwise disclosed within this annual report, no significant change has occurred since the date of the Consolidated Financial Statements.
|
A.
|
Offer and Listing Details
|
Our ordinary shares are listed on the NYSE under the symbol CSTM.
|
B.
|
Plan of Distribution
|
Not applicable.
|
C.
|
Markets
|
We began trading on the NYSE on May 23, 2013 and on the professional segment of Euronext Paris on May 27, 2013 through a public offering in the United States. Trading on the NYSE is under the symbol “CSTM.” In February 2018, we voluntarily delisted our ordinary shares from Euronext Paris to reduce costs and complexity associated with listing in multiple
-
85
-
jurisdictions. We continue to be listed on the NYSE. For more information on our shares see “Item 10. Additional Information—B. Memorandum and Articles of Association.”
|
D.
|
Selling Shareholders
|
Not applicable.
|
E.
|
Dilution
|
Not applicable.
|
F.
|
Expenses of the Issue
|
Not applicable.
|
A.
|
Share Capital
|
Not applicable.
|
B.
|
Memorandum and Articles of Association
|
The information called for by this Item has been reported previously under the heading “Description of French SE Ordinary Shares” in the final prospectus filed pursuant to Rule 424(b) under the Securities Act, on October 23, 2019, in connection with Constellium SE’s Registration Statement on Form F-4 filed on June 3, 2019 (File No. 333-231906), as amended by Amendment No. 1 thereto on October 21, 2019, and amended thereafter from time to time, filed with the Securities and Exchange Commission, which description is incorporated by reference into this Annual Report, as supplemented by the following:
|
•
|
on November 3, 2017 the Company issued 25,000,000 Class A ordinary shares, each with a nominal value of €0.02;
|
|
•
|
on November 3, 2017 the Company issued 3,750,000 Class A ordinary shares, each with a nominal value of €0.02;
|
|
•
|
on November 15, 2017 the Company issued 25,000 Class A ordinary shares, each with a nominal value of €0.02;
|
|
•
|
on March 28, 2018 the Company issued 34,580 Class A ordinary shares, each with a nominal value of €0.02;
|
|
•
|
on May 17, 2018 the Company issued 80,000 Class A ordinary shares, each with a nominal value of €0.02;
|
|
•
|
on June 20, 2018 the Company issued 68,136 Class A ordinary shares, each with a nominal value of €0.02;
|
|
•
|
on August 6, 2018 the Company issued 50,000 Class A ordinary shares, each with a nominal value of €0.02; and
|
|
•
|
on November 15, 2018 the Company issued 1,256,055 Class A ordinary shares, each with a nominal value of €0.02;
|
|
•
|
on March 28, 2019 the Company issued 645,732 Class A ordinary shares, each with a nominal value of €0.02;
|
|
•
|
on May 29, 2019 the Company issued 144,691 Class A ordinary shares, each with a nominal value of €0.02;
|
|
•
|
on June 15, 2019 the Company issued 27,204 Class A ordinary shares, each with a nominal value of €0.02;
|
|
•
|
on August 7, 2019 the Company issued 534,256 Class A ordinary shares, each with a nominal value of €0.02; and
|
|
•
|
on November 18, 2019 the Company issued 516,141 Class A ordinary shares, each with a nominal value of €0.02.
|
-
86
-
|
C.
|
Material Contracts
|
The following is a summary of each material contract, other than material contracts entered into in the ordinary course of business, to which we are a party, for the two years immediately preceding the date of this Annual Report:
|
•
|
Employment Agreements and Benefit Plans
. See “Item 6. Directors, Senior Management and Employees—E. Share Ownership” for a description of the material terms of our employment agreements and benefits plans.
|
|
•
|
Amended and Restated Shareholders Agreement
. See “Item 7. Major Shareholders and Related Party Transactions” for a description of material terms of this contract.
|
|
•
|
Notes, Pan-U.S. ABL Facility, French Inventory Facility and Factoring Agreements
. As disclosed below.
|
|
•
|
Metal Supply Agreement
. As disclosed below.
|
May 2014 Notes
On May 7, 2014, the Company completed a private offering of $400 million in aggregate principal amount of 5.750% Senior Notes due 2024 (the “2024 U.S. Dollar Notes”) and €300 million in aggregate principal amount of 4.625% Senior Notes due 2021 (the “2021 Euro Notes,” and together with the 2024 U.S. Dollar Notes, the “May 2014 Notes”) pursuant to indentures among the Company, the guarantors party thereto, and Deutsche Bank Trust Company Americas, as trustee. A portion of the net proceeds of the May 2014 Notes were used to repay amounts outstanding under our senior secured term loan B facility, including related transaction fees, expenses, and prepayment premium thereon. We used the remaining net proceeds for general corporate purposes, including to put additional cash on our balance sheet.
Interest on the 2024 U.S. Dollar Notes and 2021 Euro Notes accrues at rates of 5.750% and 4.625% per annum, respectively, and is payable semi-annually beginning November 15, 2014. The 2024 U.S. Dollar Notes mature on May 15, 2024, and the 2021 Euro Notes mature on May 15, 2021.
Prior to May 15, 2019, we were permitted to redeem some or all of the 2024 U.S. Dollar Notes at a price equal to 100% of the principal amount of the 2024 U.S. Dollar Notes redeemed plus accrued and unpaid interest, if any, to the redemption date plus a “make-whole” premium. On or after May 15, 2019, we may redeem the 2024 U.S. Dollar Notes at redemption prices (expressed as a percentage of the principal amount thereof) equal to 102.875% during the 12-month period commencing on May 15, 2019, 101.917% during the 12-month period commencing on May 15, 2020, 100.958% during the 12-month period commencing on May 15, 2021, and par on or after May 15, 2022, in each case plus accrued and unpaid interest, if any, to the redemption date.
Prior to May 15, 2017, we were permitted to redeem some or all of the 2021 Euro Notes at a price equal to 100% of the principal amount of the 2021 Euro Notes redeemed plus accrued and unpaid interest, if any, to the redemption date plus a “make-whole” premium. On or after May 15, 2017, we may redeem the 2021 Euro Notes at redemption prices (expressed as a percentage of the principal amount thereof) equal to 102.313% during the 12-month period commencing on May 15, 2017, 101.156% during the 12-month period commencing on May 15, 2018, and par on or after May 15, 2019, in each case plus accrued and unpaid interest, if any, to the redemption date. On August 8, 2019, we redeemed €100 million plus accrued and unpaid interest.
In addition, at any time or from time to time prior to May 15, 2017, we were permitted to, within 90 days of a qualified equity offering, redeem May 2014 Notes of either series in an aggregate amount equal to up to 35% of the original aggregate principal amount of the May 2014 Notes of the applicable series (after giving effect to any issuance of additional May 2014 Notes of such series) at a redemption price equal to 100% of the principal amount thereof plus a premium (expressed as a percentage of the principal amount thereof) equal to 5.750% for the 2024 U.S. Dollar Notes and 4.625% for the 2021 Euro Notes, plus accrued and unpaid interest thereon (if any) to the redemption date, with the net cash proceeds of such qualified equity offering, provided that at least 50% of the original aggregate principal amount of May 2014 Notes of the series being redeemed would remain outstanding immediately after giving effect to such redemption.
Within 30 days of the occurrence of specific kinds of changes of control, the Company is required to make an offer to purchase all outstanding May 2014 Notes at a price in cash equal to 101% of the principal amount of the May 2014 Notes, plus accrued and unpaid interest, if any, to the purchase date.
-
87
-
The May 2014 Notes are senior unsecured obligations of Constellium and are guaranteed on a senior unsecured basis by Constellium International, Constellium France Holdco, Constellium Neuf Brisach, Constellium Issoire, Constellium Finance, Engineered Products International, Constellium W, Constellium Germany Holdco GmbH & Co. KG, Constellium Deutschland GmbH, Constellium Singen GmbH, Constellium Rolled Products Singen GmbH & Co. KG, Constellium Switzerland AG, Constellium US Holdings I, LLC, Ravenswood, Constellium Holdings Muscle Shoals LLC (f/k/a Wise Metal Group LLC), Constellium Muscle Shoals LLC (f/k/a Wise Alloys LLC), Constellium Bowling Green LLC, and Constellium Property and Equipment Company, LLC. Each of Constellium’s existing or future restricted subsidiaries (other than receivables subsidiaries) that guarantees certain indebtedness of Constellium or certain indebtedness of any of the guarantors of the May 2014 Notes must also guarantee the May 2014 Notes.
The indentures governing the May 2014 Notes contain customary terms and conditions, including, among other things, negative covenants limiting our and our restricted subsidiaries’ ability to incur debt, grant liens, enter into sale and lease-back transactions, make investments, loans and advances, make acquisitions, sell assets, pay dividends and other restricted payments, prepay certain debt, merge, consolidate or amalgamate and engage in affiliate transactions.
The indentures governing the May 2014 Notes also contain customary events of default.
February 2017 Notes
On February 16, 2017, the Company completed a private offering of $650 million in aggregate principal amount of 6.625% Senior Notes due 2025 (the “February 2017 Notes”) pursuant to an indenture among the Company, the guarantors party thereto, and Deutsche Bank Trust Company Americas, as trustee. The Company used the net proceeds from the offering, together with cash on hand, to retire all of the outstanding 8.75% Senior Secured Notes due 2018 (the “Wise Senior Secured Notes”) and used the remaining net proceeds, if any, for general corporate purposes.
Interest on the February 2017 Notes accrues at rate of 6.625% per annum and is payable semi-annually beginning September 1, 2017. The February 2017 Notes mature on March 1, 2025.
Prior to March 1, 2020, we may redeem some or all of the February 2017 Notes at a price equal to 100% of the principal amount of the February 2017 Notes redeemed plus accrued and unpaid interest, if any, to the redemption date plus a “make-whole” premium. On or after March 1, 2020, we may redeem the February 2017 Notes at redemption prices (expressed as a percentage of the principal amount thereof) equal to 103.313% during the 12-month period commencing on March 1, 2020, 101.656% during the 12-month period commencing on March 1, 2021, and par on or after March 1, 2022, in each case plus accrued and unpaid interest, if any, to the redemption date.
In addition, at any time or from time to time prior to March 1, 2020, we may, within 90 days of a qualified equity offering, redeem February 2017 Notes in an aggregate amount equal to up to 35% of the original aggregate principal amount thereof (after giving effect to any issuance of additional February 2017 Notes) at a redemption price equal to 100% of the principal amount thereof plus a premium (expressed as a percentage of the principal amount thereof) equal to 6.625%, plus accrued and unpaid interest thereon (if any) to the redemption date, with the net cash proceeds of such qualified equity offering, provided that at least 50% of the original aggregate principal amount of February 2017 Notes would remain outstanding immediately after giving effect to such redemption.
Within 30 days of the occurrence of specific kinds of changes of control, the Company is required to make an offer to purchase all outstanding February 2017 Notes at a price in cash equal to 101% of the principal amount of the February 2017 Notes, plus accrued and unpaid interest, if any, to the purchase date.
The February 2017 Notes are senior unsecured obligations of Constellium and are guaranteed on a senior unsecured basis by each of its restricted subsidiaries that guarantees the May 2014 Notes. Each of Constellium’s existing or future restricted subsidiaries (other than receivables subsidiaries) that guarantees certain indebtedness of Constellium (including the May 2014 Notes) or certain indebtedness of any of the guarantors of the February 2017 Notes must also guarantee the February 2017 Notes.
The indenture governing the February 2017 Notes contains customary terms and conditions, including, among other things, negative covenants limiting our and our restricted subsidiaries’ ability to incur debt, grant liens, enter into sale and lease-back transactions, make investments, loans and advances, make acquisitions, sell assets, pay dividends and other restricted payments, prepay certain debt, merge, consolidate or amalgamate and engage in affiliate transactions.
The indenture governing the February 2017 Notes also contains customary events of default.
-
88
-
November 2017 Notes
On November 9, 2017, the Company completed a private offering (the “November 2017 Notes Offering”) of $500 million in aggregate principal amount of 5.875% Senior Notes due 2026 (the “2026 U.S. Dollar Notes”) and €400 million in aggregate principal amount of 4.250% Senior Notes due 2026 (the “2026 Euro Notes,” and together with the 2026 U.S. Dollar Notes, the “November 2017 Notes”; and the November 2017 Notes, together with the May 2014 Notes and the February 2017 Notes, the “Notes”) pursuant to indentures among the Company, the guarantors party thereto, and Deutsche Bank Trust Company Americas, as trustee. The Company used the net proceeds from the Equity Offering (as defined below) and the November 2017 Notes Offering, together with cash on hand, to fund the cash tender offers (the “Tender Offers”) for any and all of the $400 million in aggregate principal amount of 8.00% Senior Notes due 2023 (the “2023 U.S. Dollar Notes”), €240 million in aggregate principal amount of 7.00% Senior Notes due 2023 (the “2023 Euro Notes,”), and $425 million in aggregate principal amount of 7.875% Senior Secured Notes due 2021 (the “Senior Secured Notes”, and together with the 2023 Euro Notes and the 2023 U.S. Dollar Notes, the “Tender Offer Notes”) and the redemption (the “Redemption”) of the Tender Offer Notes not purchased in the Tender Offers, with the remaining net proceeds being used for general corporate purposes.
Interest on the 2026 U.S. Dollar Notes and 2026 Euro Notes accrues at rates of 5.875% and 4.250% per annum, respectively, and is payable semi-annually beginning February 15, 2018. The February 2017 Notes mature on February 15, 2026.
Prior to November 15, 2020, we may redeem some or all of the 2026 U.S. Dollar Notes at a price equal to 100% of the principal amount of the 2026 U.S. Dollar Notes redeemed plus accrued and unpaid interest, if any, to the redemption date plus a “make-whole” premium. On or after November 15, 2020, we may redeem the 2026 U.S. Dollar Notes at redemption prices (expressed as a percentage of the principal amount thereof) equal to 102.938% during the 12-month period commencing on November 15, 2020, 101.469% during the 12-month period commencing on November 15, 2021, and par on or after November 15, 2022, in each case plus accrued and unpaid interest, if any, to the redemption date.
Prior to November 15, 2020, we may redeem some or all of the 2026 Euro Notes at a price equal to 100% of the principal amount of the 2026 Euro Notes redeemed plus accrued and unpaid interest, if any, to the redemption date plus a “make-whole” premium. On or after November 15, 2020, we may redeem the 2026 Euro Notes at redemption prices (expressed as a percentage of the principal amount thereof) equal to 102.125% during the 12-month period commencing on November 15, 2020, 101.063% during the 12-month period commencing on November 15, 2021, and par on or after November 15, 2022, in each case plus accrued and unpaid interest, if any, to the redemption date.
In addition, at any time or from time to time prior to November 15, 2020, we may, within 90 days of a qualified equity offering, redeem November 2017 Notes of either series in an aggregate amount equal to up to 35% of the original aggregate principal amount of the November 2017 Notes of the applicable series (after giving effect to any issuance of additional February 2017 Notes of such series) at a redemption price equal to 100% of the principal amount thereof plus a premium (expressed as a percentage of the principal amount thereof) equal to 5.875% for the 2026 U.S. Dollar Notes and 4.250% for the 2026 Euro Notes, plus accrued and unpaid interest thereon (if any) to the redemption date, with the net cash proceeds of such qualified equity offering, provided that at least 50% of the original aggregate principal amount of February 2017 Notes of the series being redeemed would remain outstanding immediately after giving effect to such redemption.
Within 30 days of the occurrence of specific kinds of changes of control, the Company is required to make an offer to purchase all outstanding February 2017 Notes at a price in cash equal to 101% of the principal amount of the February 2017 Notes, plus accrued and unpaid interest, if any, to the purchase date.
The February 2017 Notes are senior unsecured obligations of Constellium and are guaranteed on a senior unsecured basis by each of its restricted subsidiaries that guarantees the May 2014 Notes and the February 2017 Notes. Each of Constellium’s existing or future restricted subsidiaries (other than receivables subsidiaries) that guarantees certain indebtedness of Constellium (including the May 2014 Notes and the February 2017 Notes) or certain indebtedness of any of the guarantors of the November 2017 Notes must also guarantee the November 2017 Notes.
The indentures governing the November 2017 Notes contain customary terms and conditions, including, among other things, negative covenants limiting our and our restricted subsidiaries’ ability to incur debt, grant liens, enter into sale and lease-back transactions, make investments, loans and advances, make acquisitions, sell assets, pay dividends and other restricted payments, prepay certain debt, merge, consolidate or amalgamate and engage in affiliate transactions.
The indentures governing the November 2017 Notes also contain customary events of default.
-
89
-
Pan-U.S. ABL Facility
On June 21, 2017, Ravenswood and Wise Alloys, since renamed Constellium Muscle Shoals LLC, entered into a $300 million asset-based revolving credit facility (the “Pan-U.S. ABL Facility”), with the lenders from time to time party thereto and Wells Fargo Bank, National Association as administrative agent (the “Pan-U.S. ABL Administrative Agent”) and collateral agent. Concurrently with Ravenswood and Wise Alloys’ entry into the Pan-U.S. ABL Facility, (i) $100 million asset-based revolving credit facility entered into by Ravenswood on May 25, 2012 and (ii) asset-based revolving credit facility entered into by Wise Alloys, since renamed Constellium Muscle Shoals LLC, as borrower, and Wise Metals Group LLC, since renamed Constellium Holdings Muscle Shoals LLC, Listerhill Total Maintenance Center, LLC, Wise Alloys Finance Corporation, and Alabama Electric Motor Services, LLC, as guarantors, on December 11, 2013, were each terminated. On February 20, 2019, we amended and restated the Pan-U.S. ABL Facility to, among other things, (i) join Constellium Bowling Green LLC as an additional borrower and Constellium Property and Equipment Company LLC as an additional guarantor, (ii) increase the available commitments thereunder to $350 million, and (iii) make certain changes to the covenants, terms, and conditions thereof.
On May 10, 2019, we amended the Pan-U.S. ABL Facility to (i) increase the available commitments thereunder to $400 million and (ii) make certain other changes to the covenants, terms and/or conditions thereof.
The Pan-U.S. ABL Facility provides Ravenswood, Wise Alloys, and Bowling Green a working capital facility for their respective operations. The Pan-U.S. ABL Facility has sublimits of $35 million for letters of credit and $35 million for swingline loans. At the option of Ravenswood, Wise Alloys, and Bowling Green, the maximum borrowings under the Pan-U.S. ABL Facility may be increased by up to an additional $200 million subject to, among other things, payment of a fee in the amount of 0.125% of such increase and the granting of a lien in favor of the Pan-U.S. ABL Administrative Agent over certain accounts receivable (and termination of any factoring facilities with respect to such receivables). The lenders under the Pan-U.S. ABL Facility have provided commitments with respect to such increase (the “Pan-U.S. ABL Incremental Commitments”).
The Pan-U.S. ABL Facility matures on June 21, 2022.
Ravenswood, Wise Alloys, and Bowling Green’s ability to borrow under the Pan-U.S. ABL Facility is limited to a borrowing base equal to the sum of (a) 85% of eligible accounts plus (b) up to the lesser of (i) 80% of the lesser of cost or market value of eligible inventory and (ii) 85% of the net orderly liquidation value of eligible inventory minus (c) applicable reserves, and is subject to other conditions, limitations and reserve requirements.
Interest under the Pan-U.S. ABL Facility is calculated, at the applicable borrower’s election, based on either the LIBOR or base rate (as calculated by the Pan-U.S. ABL Administrative Agent in accordance with the Pan-U.S. ABL Facility). LIBOR loans accrue interest at a rate of LIBOR plus a margin of 1.50-2.00% per annum (determined based on average quarterly excess availability). Base rate loans accrue interest at the base rate plus a margin of 0.50-1.00% per annum (determined based on average quarterly excess availability). Ravenswood, Wise Alloys, and Bowling Green are required to pay a commitment fee on the unused portion of the Pan-U.S. ABL Facility of 0.25% or 0.375% per annum (determined on a ratio of unutilized revolving credit commitments to available revolving credit commitments). Ravenswood, Wise Alloys, and Bowling Green are also required to pay a commitment fee on the unused Pan-U.S. ABL Incremental Commitments of 0.25% per annum.
Subject to customary “breakage” costs with respect to LIBOR loans, borrowings under the Pan-U.S. ABL Facility may be repaid from time to time without premium or penalty.
Ravenswood, Wise Alloys, and Bowling Green’s obligations under the Pan-U.S. ABL Facility are guaranteed by Constellium U.S. Holdings I, LLC, Wise Metals Group, CPEC, and Constellium International (as successor to Holdco II). Ravenswood, Wise Alloys, and Bowling Green’s obligations under the Pan-U.S. ABL Facility are, subject to certain permitted liens, secured by substantially all assets of Ravenswood, Wise Alloys, and Bowling Green. The guarantee by Constellium International of the Pan-U.S. ABL Facility is unsecured.
The Pan-U.S. ABL Facility contains customary terms and conditions, including, among other things, negative covenants limiting Ravenswood, Wise Alloys, and Bowling Green’s ability to incur debt, grant liens, enter into sale and lease-back transactions, make investments, loans and advances (including to other Constellium group companies), make acquisitions, sell assets, pay dividends and other restricted payments, prepay certain debt, merge, consolidate or amalgamate and engage in affiliate transactions.
The Pan-U.S. ABL Facility also contains a financial maintenance covenant that provides that at any time during which borrowing availability thereunder is below 10% of the aggregate commitments under the Pan-U.S. ABL Facility, the Company will be required to maintain a minimum fixed charge coverage ratio of 1.0 to 1.0 and a minimum Borrower EBITDA Contribution of 25%, in each case calculated on a trailing twelve-month basis. “Borrower EBITDA Contribution” means, for
-
90
-
any period, the ratio of (x) the combined EBITDA of Ravenswood, Wise Alloys, Bowling Green, and their respective subsidiaries for such period, to (y) the consolidated EBITDAS of the Company and its subsidiaries for such period.
The Pan-U.S. ABL Facility also contains customary events of default.
French Inventory Facility
On April 21, 2017, Constellium Issoire and Constellium Neuf Brisach (the “French Borrowers”) entered into a €100 million asset-based revolving credit facility (the “French Inventory Facility”) with the lenders from time to time party thereto and Factofrance as agent. The French Inventory Facility was amended on June 13, 2017 to, among other things, make certain changes to the procedure for calculating the Turn Ratio (as defined below). The French Inventory Facility provides the French Borrowers a working capital facility for their operations. The French Inventory Facility was amended on March 29, 2018 to, among other things, make certain changes to the inventory included in the borrowing base. The French Inventory Facility was further amended on March 15, 2019 to, among other things, extend the maturity
to April 21, 2021.
The French Borrowers’ ability to borrow under the French Inventory Facility is limited to a borrowing base equal to the lesser of (i) the sum of (A) 90% of the net orderly liquidation value of eligible inventory of the applicable French Borrower pledged and in possession of an escrow agent (the “Inventory Pledged With Dispossession” by such French Borrower), plus (B) 70% of the net orderly liquidation value of eligible inventory of the applicable French Borrower pledged without possession by the escrow agent (the “Inventory Pledged Without Dispossession” by such French Borrower), and (ii) the product of 90% of the net orderly liquidation value of the Inventory Pledged With Dispossession by the applicable French Borrower, multiplied by four.
Notwithstanding the foregoing, if on any quarterly test date the ratio of a French Borrower’s aggregate sales for the previous 365 days to the average book value of the eligible inventory pledged by such French Borrower under the French Inventory Facility (the “Turn Ratio” for such French Borrower) is less than 3, in the case of Constellium Issoire, or 6, in the case of Constellium Neuf Brisach, the borrowing base for such French Borrower will equal 70% of the net orderly liquidation value of the Inventory Pledged With Dispossession by such French Borrower until the next quarterly test date on which such French Borrower’s Turn Ratio is greater than or equal to 3, in the case of Constellium Issoire, or 6, in the case of Constellium Neuf Brisach (such period, a “Borrowing Base Event”).
Loans not in excess of 90% of the net orderly liquidation value of the Inventory Pledged with Dispossession of the applicable French Borrower at the time of borrowing bear interest at a rate of EURIBOR plus 2% per annum (“Tranche A Loans”), and loans in excess of that amount at the time of borrowing bear (“Tranche B Loans”) interest at a rate of EURIBOR plus 2.75% per annum. The French Borrowers are also required to pay a commitment fee on the unused portion of the French Inventory Facility of 0.80% per annum. Borrowings of Tranche B Loans by a French Borrower are subject to a minimum EBITDA for such French Borrower, calculated on a trailing twelve months of €40 million in the case of Constellium Issoire, and €65 million in the case of Constellium Neuf Brisach.
Subject to customary “breakage” costs, borrowings under the French Inventory Facility are permitted to be repaid from time to time without premium or penalty.
The French Borrowers’ obligations under the French Inventory Facility are guaranteed by Constellium International (as successor to Holdco II) and are secured by possessory and non-possessory pledges of the eligible inventory of the French Borrowers.
European Factoring Agreements
On January 4, 2011, certain of our French subsidiaries (the “French Sellers”) entered into a factoring agreement with GE Factofrance S.A.S., as factor (the “French Factor”), which has been amended from time to time, and has been fully restated on December 3, 2015 (the “French Factoring Agreement”). On December 16, 2010, certain of our German and Swiss subsidiaries (the “German/Swiss Sellers”) entered into factoring agreements with GE Capital Bank AG, as factor (the “German/Swiss Factor”), which have been amended from time to time or replaced with a factoring agreement entered into on March 26, 2014 (the “Original German/Swiss Factoring Agreements”). On June 26, 2015, our Czech subsidiary (the “Czech Seller,” and together with the German/Swiss Sellers and the French Sellers, the “European Factoring Sellers”) entered into a factoring agreement with GE Capital Bank AG, as factor (the “Czech Factor,” and together with the German/Swiss Factor and the French Factor, the “European Factors”), as amended from time to time (the “Czech Factoring Agreement,” and together with the German/Swiss Factoring Agreements and the French Factoring Agreement, the “European Factoring Agreements”). On May 27, 2016, one of our German subsidiaries, Constellium Rolled Products Singen GmbH & Co. KG (another “German/Swiss
-
91
-
Seller”), entered into a factoring agreement with the German/Swiss Factor (the “Additional German/Swiss Factoring Agreement” and, together with the Original German/Swiss Factoring Agreements, the “German/Swiss Factoring Agreements”) while certain of the Original German/Swiss Factoring Agreements were amended.
On July 20, 2016, the Banque Fédérative du Crédit Mutuel purchased the Equipment Finance and Receivable Finance businesses of GE. Pursuant to this transaction, GE Factofrance S.A.S. was renamed Factofrance and GE Capital Bank AG was renamed Targo Commercial Financing AG. On August 1, 2018, Targo Commercial Finance AG was merged into Targobank AG. Both transactions had no other impact on the European Factoring Agreements.
The European Factoring Agreements provide for the sale by the European Factoring Sellers to the European Factors of receivables originated by the European Factoring Sellers, subject to a maximum financing amount of €235 million available to the French Sellers under the French Factoring Agreement and €150 million available to the German/Swiss Sellers and the Czech Seller under the German/Swiss Factoring Agreements and the Czech Factoring Agreement, respectively. The funding made available to the European Factoring Sellers by the European Factors is used by the Sellers for general corporate purposes.
The German/Swiss Factoring Agreements were amended on December 21, 2016 to, among other things, increase the maximum financing amount from €115 million to €150 million, extend the termination date from June 15, 2017 to October 29, 2021, and reduce the fees payable by the German/Swiss Sellers. The French Factoring Agreement was amended and restated on April 19, 2017 to, among other things, extend the commitment period thereunder from December 2018 to October 2021.
Generally speaking, receivables sold to the European Factors under the European Factoring Agreements are with no recourse to the European Factoring Sellers in the event of a payment default by the relevant customer. The European Factors are entitled to claim the repayment of any amount financed by them in respect of a receivable by withdrawing the financing provided against such assigned receivable or requiring the European Factoring Sellers to repurchase/unwind the purchase of such receivable under certain circumstances, including when (i) the nonpayment of that receivable arises from a dispute between a European Factoring Seller and the relevant customer or (ii) the receivable proves not to have satisfied the eligibility criteria set forth in the European Factoring Agreements. Constellium International (as successor to Holdco II) has provided a performance guaranty for the Sellers’ obligations under the European Factoring Agreements.
Subject to some exceptions, the European Factoring Sellers will collect the transferred receivables on behalf of the European Factors pursuant to a receivables collection mandate under the European Factoring Agreements. The receivables collection mandate may be terminated upon the occurrence of certain events. In the event that the receivables collection mandate is terminated, the European Factors will be entitled to notify the account debtors of the assignment of receivables and collect directly from the account debtors the assigned receivables.
The European Factoring Agreements contain customary fees, including (i) a financing fee on the outstanding amount financed in respect of the assigned receivables, (ii) a non-utilization fee on the portion of the facilities not utilized by the European Factors and (iii) a factoring fee on all assigned receivables in the case of the German/Swiss Factoring Agreements and sold receivables, which were approved by the French Factor in the case of the French Factoring Agreement. In addition, the European Factoring Sellers incur the cost of maintaining the necessary credit insurance (as stipulated in the European Factoring Agreements) on assigned receivables.
The European Factoring Agreements contain certain affirmative and negative covenants, including relating to the administration and collection of the assigned receivables, the terms of the invoices and the exchange of information, but do not contain restrictive financial covenants. As of and for the fiscal year ended December 31, 2019, the European Factoring Sellers were in compliance with all applicable covenants under the European Factoring Agreements.
Wise Factoring Facility
On March 16, 2016, Wise Alloys, since renamed Constellium Muscle Shoals LLC, entered into a Receivables Purchase Agreement (the “Wise Factoring Facility”) with Wise Alloys Funding II, LLC, since renamed Constellium Muscle Shoals Funding II LLC (“New RPA Seller”), Hitachi Capital America Corp. (“Hitachi”), and Greensill Capital Inc., as purchaser agent, providing for the sale of certain receivables of Wise Alloys to Hitachi. The Wise Factoring Facility was amended on November 22, 2016 to join Intesa Sanpaolo S.p.A., New York Branch (together with Hitachi, the “Wise Factoring Purchasers”) as a purchaser. As of December 31, 2017, the Wise Factoring Facility provides for the sale of receivables to the Wise Factoring Purchasers in an amount not to exceed $325 million in the aggregate outstanding at any time. Receivables under the Wise Factoring Facility are sold at a discount based on a rate equal to a LIBOR rate plus 2.00-2.50% (based on the credit rating of the account debtor) per annum. The New Wise RPA Seller is required to pay a commitment fee in the amount of $20,000 per annum plus 1% per annum of the total commitments under the Wise Factoring Facility.
-
92
-
Subject to certain customary exceptions, each purchase under the Wise Factoring Facility is made without recourse to the New Wise RPA Seller. The New Wise RPA Seller has no liability to the Wise Factoring Purchasers, and the Wise Factoring Purchasers are solely responsible for the account debtor’s failure to pay any purchased receivable when it is due and payable under the terms applicable thereto. Constellium International (as successor to Holdco II) has provided a guaranty for the New Wise RPA Seller’s and Wise Alloys’ performance obligations under the Wise Factoring Facility.
The Wise Factoring Facility contains customary covenants. The Wise Factoring Purchasers’ obligation to purchase receivables under the Wise Factoring Facility is subject to certain conditions, including without limitation that certain changes of control shall not have occurred, that there shall not have occurred a material adverse change in the business condition, operations or performance of the New Wise RPA Seller, Wise Alloys, or Constellium International, and that Constellium’s corporate credit rating shall not have been withdrawn by either Standard & Poor’s or Moody’s or downgraded below B- by Standard & Poor’s and B3 by Moody’s.
On June 28, 2016, the Wise Factoring Facility was amended to, among other things, change the maximum commitments thereunder to $250 million in the aggregate outstanding at any time.
On January 25, 2017, the Wise Factoring Facility was amended to extend the date on which the Wise Factoring Purchasers’ obligation to purchase receivables under the Wise Factoring Facility will terminate to January 24, 2018.
On May 12, 2017, the Wise Factoring Facility was amended to permit the sale of certain receivables with due dates up to 115 days after the invoice date (increased from 90 days).
On January 2, 2018, the Wise Factoring Facility was amended to, among other things, increase the commitments thereunder to $375 million in the aggregate outstanding at any time, reduce the discount at which receivables are sold to a rate equal to a LIBOR rate plus 1.75-2.25% (based on the credit rating of the account debtor) per annum, and extend the date on which the Wise Factoring Purchasers’ obligation to purchase receivables under the Wise Factoring Facility will terminate to January 24, 2020.
On October 22, 2018, the Wise Factoring Facility was amended to make certain changes to the eligibility requirements for receivables sold pursuant to the Wise Factoring Facility.
On September 30, 2019, the Wise Factoring Facility was amended to, among other things, join Deutsche Bank
Trust Company America
as a Wise Factoring Purchaser, release Hitachi from its commitment and remove Hitachi as a purchaser under the facility, decrease the commitments thereunder to $300 million in the aggregate outstanding at any time, reduce the discount at which receivables are sold to a rate equal to a LIBOR rate plus 1.65% per annum, permit the sale of certain receivables with due dates up to 180 days after the invoice date (increased from 135 days) and extend the date on which the Wise Factoring Purchasers’ obligation to purchase receivables under the Wise Factoring Facility will terminate to September 30, 2021.
Metal Supply Agreement
In connection with the Acquisition, Constellium Switzerland, a wholly owned indirect subsidiary of Constellium N.V., entered into certain agreements dated as of January 4, 2011 with Rio Tinto Alcan Inc. (“Rio Tinto Alcan”), Aluminium Pechiney and Alcan Holdings Switzerland AG (“AHS”), each of which is an affiliate of Rio Tinto, which provided for, among other things, the supply of metal by Rio Tinto affiliates to Constellium Switzerland, the provision of certain technical assistance and other services relating to aluminium-lithium, a covenant by Rio Tinto Alcan to refrain from producing, supplying or selling aluminium-lithium alloys to third parties and certain cost reimbursement obligations of AHS. Constellium provided a guarantee to Rio Tinto Alcan and Aluminium Pechiney in respect of Constellium Switzerland’s obligations under the supply agreements. Constellium Switzerland and Rio Tinto Alcan had a multi-year supply agreement for the supply of sheet ingot. The agreement provided for certain representations and warranties, audit and inspection rights, on-time shipment requirements and other customary terms and conditions. Each party was required to pay certain penalty or reimbursement amounts in the event it fails or is unable to purchase or supply, as applicable, specified minimum annual quantities of metal. This agreement was terminated effective as of December 31, 2017 on December 14, 2018.
-
93
-
|
D.
|
Exchange Controls
|
French exchange control regulations currently do not limit the amount of payments that we may remit to non-residents of France. Laws and regulations concerning foreign exchange controls do require, however, that all payments or transfers of funds made by a French resident to a non-resident be handled by an accredited intermediary.
|
E.
|
Taxation
|
General
The
following is a description of certain French, Dutch and U.S. tax considerations applicable to shareholders
purchasing, owning and disposing of our ordinary shares. This discussion is intended only as a descriptive summary and does not purport to be a complete analysis or listing of all potential tax effects of the purchase, ownership or disposition of ordinary shares of the Company.
This summary is based on the laws in force in France, the Netherlands and the U.S. on the date hereof, as applied and construed by the French, Dutch and U.S. tax authorities, subject to any changes in law or in interpretation.
This summary does not constitute a legal opinion or tax advice. Holders are urged to consult their own tax advisers regarding the tax consequences or the purchase, ownership and disposition of our ordinary shares, in light of their particular circumstances.
French Withholding Tax Treatment of Dividends Distributed by the Company
The comments below (i) relate exclusively to the situation of the shareholders holding ordinary shares of the Company registered on the register maintained by our transfer agent in the U.S., Computershare Trust Company (the “U.S. Register”) that are eligible for listing (“DTC-eligible”) through The Depository Trust Company (“DTC”), and (ii) are notably based on the
confirmation obtained from the French tax authorities on October 11, 2019 (the “
French Ruling”). Any shareholder holding our ordinary shares in a different manner should seek advice from their tax advisor to determine the taxation mechanism applicable to them in connection with the shares of the Company.
In the case of a distribution of dividends by the Company, the French withholding tax treatment described below would apply subject to the French financial intermediary in its capacity as French paying agent of the dividends (such French paying agent and any of its successors acting in the same capacity, the “French Paying Agent”) being provided with the required information and documentation relating to the tax status of the shareholders. Failing that, the withholding tax would be levied at the rate of 30% (except in the case where the dividends are paid in non-cooperative States or territories within the meaning of article 238-0 A 1, 2 and 2 bis-1° of the French tax code, in which case a 75% withholding tax would apply). Any tax to be withheld at source will be calculated on the amount in euros of the distribution attributable to the shareholder.
Withholding tax on dividends paid to shareholders who are residents of France
French tax resident individuals
Personal income tax
The following would only apply to individual shareholders resident of France for tax purposes, holding their shares in the Company as part of their private estate, who do not hold their shares in the Company through an equity savings plan (plan d’épargne en actions or PEA), and who do not conduct stock market transactions under conditions similar to those which define an activity carried out by a person conducting such operations on a professional basis.
Under Article 117 quater of the French tax code, subject to certain exceptions mentioned below, dividends paid to individuals who are French tax residents are subject to a withholding tax equal to 12.8% of the gross amount distributed. This withholding tax would be levied by the French Paying Agent.
However, individuals belonging to a tax household whose reference fiscal income, as defined in 1° of IV of Article 1417 of the French tax code, for the second year preceding the year of payment of the dividends is less than €50,000 for taxpayers who are single, divorced or widowed, or €75,000 for couples filing jointly, may request an exemption from this withholding tax under the terms and conditions of Article 242 quater of the French tax code, i.e., by providing to the French Paying Agent, no later than November 30 of the year preceding the year of the payment of the dividends, a sworn statement that their reference
-
94
-
fiscal income shown on their taxation notice (avis d’imposition) issued in respect of the second year preceding the year of payment was below the above-mentioned taxable income thresholds. Taxpayers who acquire new shares after the deadline for providing the aforementioned exemption request could provide such exemption request to the French Paying Agent upon acquisition of such new shares pursuant to paragraph 320 of the administrative guidelines BOI-RPPM-RCM-30-20-10-20191220.
The 12.8% withholding constitutes an installment on account of the taxpayer’s final income tax and is creditable against the final personal income tax due by the taxpayer with respect to the year during which it is withheld, the surplus, if any, being refunded to the taxpayer.
The taxpayer is then subject to income tax at a flat rate of 12.8% on the dividends (except if he elects to be taxed
at the progressive income tax rates). Because the rate of the withholding tax is aligned on the rate of the final personal income tax due by the recipient of the dividend (except if he elects to be taxed at the progressive income tax rates), the total amount of the personal income tax charge related to the dividend is in practice withheld at source.
Shareholders concerned should seek advice from their usual tax advisor to determine the taxation mechanism applicable to them in connection with dividends paid on the shares of the Company.
Moreover, regardless of the shareholder’s tax residence or place of residence, pursuant to Article 119 bis 2 of the French tax code, if dividends are paid outside France in a non-cooperative State or territory within the meaning of Article 238-0 A 1, 2 and 2 bis-1° of the French tax code, a 75% withholding tax would be applicable on the gross dividend distributed unless the shareholder provides evidence that the distributions have neither the object nor the effect to enable, for tax evasion purpose, the location of income in such a State or territory.
Relevant shareholders are advised to consult their usual tax advisor to determine the method by which this withholding tax will be credited against the amount of their income tax.
Social security contributions
Whether or not the 12.8% withholding tax described above is applicable, the gross amount of the dividends paid by the Company to French tax resident individuals would also be subject to social security contributions at an overall rate of 17.2%, which breaks down as follows:
•
the
contribution sociale généralisée
at a rate of 9.2%;
•
the
contribution pour le remboursement de la dette sociale
at a rate of 0.5%; and
•
the
prélèvement de solidarité
at a rate of 7.5%.
The social security contributions are levied in the same manner as the 12.8% withholding tax described above.
French tax resident entities that are subject to French corporate income tax under standard conditions
Dividends paid by the Company to legal entities that are French tax residents
subject to French corporate income tax under standard conditions
will not, in principle, be liable to any withholding tax.
However, if the dividends distributed by the Company are paid outside France in a non-cooperative State or jurisdiction within the meaning of Article 238-0 A 1, 2 and 2 bis-1° of the French tax code, a 75% withholding tax will apply, unless the concerned shareholder provides evidence that the distributions have neither the object nor the effect to enable, for tax evasion purpose, the location of income in such a State or territory.
Shareholders are advised to consult their usual tax advisor to determine the tax regime that will apply to their own situation.
-
95
-
Other French tax residents
French tax resident shareholders who are in a different situation than those described above should seek professional advice from their usual tax advisor as to the tax treatment that will apply to their own situation.
Withholding tax on dividends paid to shareholders who are not resident of France
Dividends paid to non-residents of France for French tax purposes would generally be subject to French withholding tax at a rate of (i) 12.8% on payments to individuals, (ii) 15% on payments to not-for-profit organizations which have their registered office in a Member State of the European Union or in another State party to the European Economic Area Agreement which has entered into a convention on administrative assistance with France to fight tax evasion and fraud, and (iii) 28% as from January 1, 2020, 26.5% as from January 1, 2021, 25% as from January 1, 2022, on payments to legal persons or organizations other than those mentioned under (ii). The withholding tax rate would be increased to 75% on dividends paid in a non-cooperative State or territory within the meaning of Article 238-0 A 1, 2 and 2 bis-1° of the French tax code, unless the concerned shareholder provides evidence that the distributions have neither the object nor the effect to enable, for tax evasion purpose, the location of income in such a State or territory.
Double tax treaties entered into between France and the States of residence of shareholders may provide for an exemption or a reduction of the French dividend withholding tax, subject to (i) certain requirements set forth therein being met and (ii) the shareholders duly completing and providing the required information and documentation. The exemptions or reduced rates of withholding tax provided for in double tax treaties may be applied to the benefit of the shareholders of our Company, as effective beneficiaries of the income, provided that they are identified and are entitled to the benefits provided by the double tax treaty which they avail themselves.
Dividends paid to eligible shareholders may be subject to the reduced rates from the outset provided, as the case may be, by the applicable double tax treaties if the French Paying Agent has received before the date of payment of the dividend the required information and documentation.
Shareholders who failed to file the required information and documentation with the French Paying Agent prior to the payment of the dividend may claim to the French tax authorities or the French Paying Agent the refund of the excess withholding tax by filing such information and documentation before December 31 of the second calendar year following the year during which the dividend is paid.
Dutch dividend withholding tax
General
Since the Company was initially incorporated under Dutch law it is deemed to be resident of the Netherlands for Dutch dividend withholding tax purposes. Dividends paid on our ordinary shares following migration are therefore, based on Dutch domestic law, still subject to Dutch dividend withholding tax at a rate of 15%. However, s
ince our Corporate Seat has been transferred to France as of December 12, 2019, our dividends paid on our ordinary shares generally should be subject to French dividend withholding tax and not to Dutch dividend withholding tax on the basis of the double tax treaty between the Netherlands and France. However, both French and Dutch dividend withholding tax may be required to be withheld from any such dividends paid, if and when paid to Dutch resident holders of our ordinary shares (and non-Dutch resident holders of our ordinary shares that have a permanent establishment in the Netherlands to which the ordinary shares are attributable). We have approached Dutch Revenue to apply for a tax ruling confirming that no withholding of any Dutch dividend withholding tax is applicable to any dividends paid by us even if we are no more Dutch tax resident. However, Dutch Revenue is not willing to confirm this until now. We will therefore be required to identify our shareholders in order to assess whether there are Dutch resident holders of our ordinary shares or non-Dutch resident holders of our ordinary shares with a permanent establishment in the Netherlands to which the ordinary shares are attributable in respect of which Dutch dividend withholding tax has to be withheld on dividends paid. Such identification may not always be possible in practice. According to Dutch Revenue, Dutch dividend withholding tax must also be withheld on dividends paid in as far as the identity of our shareholders cannot be assessed. Withholding of both French and Dutch dividend withholding tax may occur in certain scenarios. Once we anticipate distributing a dividend, identification of our shareholders (by ourselves or a paying agent) is typically required in order to effectuate such dividend payments and could limit the Dutch dividend withholding tax that may need to be withheld.
Generally, the Dutch dividend withholding tax will not be borne by us, but will be withheld from the gross dividends paid on our ordinary shares. A 15% Dutch dividend withholding tax will in principle be levied on the gross amount of dividend. The term “dividends” for Dutch dividend withholding tax purposes includes, but is not limited to:
-
96
-
|
•
|
distributions in cash or in kind, deemed and constructive distributions and repayments of paid-in capital not recognized for Dutch dividend withholding tax purposes;
|
|
•
|
liquidation proceeds, proceeds of redemption of ordinary shares or, generally, consideration for the repurchase of ordinary shares by us in excess of the average paid-in capital of those ordinary shares recognized for Dutch dividend withholding tax purposes;
|
|
•
|
the nominal value of ordinary shares issued to a shareholder or an increase of the nominal value of ordinary shares, as the case may be, to the extent that it does not appear that a contribution to the capital recognized for Dutch dividend withholding tax purposes was made or will be made; and
|
|
•
|
partial repayment of paid-in capital, recognized for Dutch dividend withholding tax purposes, if and to the extent that there are net profits (zuivere winst), within the meaning of the Dutch Dividend Withholding Tax Act 1965 (Wet op de dividendbelasting 1965), unless the general meeting of shareholders has resolved in advance to make such a repayment and provided that the nominal value of the ordinary shares concerned has been reduced by a corresponding amount by way of an amendment of our articles of association.
|
Notwithstanding the above, as part of the Multilateral Instrument of the Action Plan on Base Erosion and Profit Shifting of the OECD, a principal purpose test (“PPT”) should be applied alongside the double tax treaty between the Netherlands and France as of 1 January 2020. This PPT requires that the benefits of a tax treaty should not be available if it is reasonable to conclude, having regard to all relevant facts and circumstances, that obtaining that benefit was one of the principal purposes of any arrangement or transaction that resulted directly or indirectly in that benefit, unless it is established that granting that benefit in these circumstances would be in accordance with the object and purpose of the relevant provisions of that treaty.
In theory, the Dutch Revenue may take the position that one of the principal purposes of the transfer of the place of effective management of the Company to France was to obtain a tax benefit under the double tax treaty between the Netherlands and France, being the benefit that the Netherlands cannot levy a dividend withholding tax anymore (except for the cases as stated above). On this basis, they could argue that the PPT is met and, hence, that the treaty would effectively not apply and that the Netherlands would be allowed to levy Dutch dividend withholding tax on dividends distributed, irrespective to which shareholder. Considering the background of the Corporate Seat Transfer it seems unlikely that the Dutch Revenue would be able to successfully take the position.
French Financial Transaction Tax and Registration Duties on Disposition of our Shares
In its decision of 13 December 2017 on the equivalence of the legal and supervisory framework of the United States of America for national securities exchanges and alternative trading systems in accordance with Directive 2014/65/EU of the European Parliament and of the Council, the European Commission decided that for the purposes of Article 23, paragraph 1, of Regulation (EU) No 600/2014, the legal and supervisory framework of the United States applicable to the NYSE are considered equivalent to the requirements applicable to regulated markets, within the meaning of Directive 2014/65/EU, as they result from Regulation (EU) No 596/214, Title III of Directive 2014/65/EU, Title II of Regulation (EU) No 600/2014 and Directive 2004/109/EC, together with effective supervision and sanctions regime.
Article 198 of the Pacte Act came into force on June 10, 2019 and modified Article L. 228-1 paragraph 7 of the French Commercial Code to allow an intermediary to be registered as the “registered intermediary” (intermédiaire inscrit) on behalf of any holders of shares of companies which are admitted to trading solely on a market in a non-EU country considered equivalent to a regulated market pursuant to paragraph (a) of Article 25(4) of Directive EC2014/65/EU (which includes the NYSE).
However, the NYSE is not formally recognized as a foreign regulated market by the French Financial Market Authority (the “AMF”).
French financial transaction tax
The comments below (i) relate exclusively to the book-entry transfers of our ordinary shares within DTC and (ii) are notably based on the French Ruling.
Pursuant to Article 235 ter ZD of the French tax code, purchases of equity instruments or similar securities (such as American Depositary Receipts) of a French company listed on a regulated market of the EU or on a foreign regulated market formally recognized as such by the AMF are subject to a 0.3% French tax on financial transactions provided that the issuer’s market capitalization exceeds 1 billion euros as of December 1 of the year preceding the taxation year.
-
97
-
The French financial transaction tax will not be due on the purchases of ordinary shares of the Company as long as the NYSE is not a foreign regulated market formally recognized as such by the AMF and Article 235 ter ZD of the French tax code is not modified.
French registration duties
The comments below (i) relate exclusively to the book-entry transfers of our ordinary shares within DTC and (ii) are notably based on the French Ruling.
Transfers of shares issued by a French corporation for consideration are generally subject to registration duties at the rate of 0.1% (i) when the French corporation is listed on a regulated market within the meaning of Article L 421-1 of the French Monetary Code, on a multilateral trading facility within the meaning of Article L 424-1 of the French Monetary Code, or on any foreign equivalent market operating under similar conditions, when the transfer is evidenced by a written agreement, and (ii) when the French corporation is not listed on any the above mentioned markets, irrespective of whether the transfer is evidenced by a written agreement.
The NYSE has been considered equivalent to a regulated market pursuant to paragraph (a) of Article 25(4) of Directive EC2014/65/EU. Thus, we believe that the NYSE should be deemed to be a foreign market operating under similar conditions to regulated markets within the meaning of Article L 421-1 of the French Monetary Code or multilateral trading facilities within the meaning of Article L 424-1 of the French Monetary Code.
Therefore, the following transactions on ordinary shares of the Company should not give rise to the duty provided for in Article 726 of the French tax code:
|
•
|
transactions on shares of the Company realized on the NYSE;
|
|
•
|
over the counter sales of ordinary shares of the Company published on the market or communicated to the regulator in application of the MIF Directive or foreign provisions equivalent to the MIF Directive, provided that they are not evidenced by a written agreement; and
|
|
•
|
over the counter transactions carried out on ordinary shares of the Company in connection with transactions that are the subject of the same publishing or communication obligations, provided that they are not evidenced by a written agreement.
|
French withholding tax treatment of the sale or other disposition of the rights on our ordinary shares
French tax residents
No French withholding tax will apply on the sale, exchange, repurchase or redemption (other than redemption proceeds which may, under certain circumstances be partially or fully characterized as dividends under French domestic tax law or administrative guidelines) of their rights on the ordinary shares of the Company by French tax residents.
Non-French tax residents
A shareholder who is not a French resident for French tax purposes will not be subject to French tax on capital gain from the sale, exchange, repurchase or redemption (other than redemption proceeds which may, under certain circumstances be partially or fully characterized as dividends under French domestic tax law or administrative guidelines) of its rights on the ordinary shares of the Company, unless (i) the shareholder is domiciled, established or incorporated out of France in a non-cooperative State or territory as defined in Article 238-0 A 1, 2 and 2 bis-1° of the French tax code, (ii) the rights on the shares of the Company form part of the property of a permanent establishment that the shareholder has in France or (iii) the shareholder has held, directly or indirectly, at any time during the past years preceding the date of disposal, and as relates to individuals together with his spouse, ascendants and descendants, rights to more than 25% of the profits of the Company.
Material U.S. Federal Income Tax Consequences
The following discussion describes the material U.S. federal income tax consequences relating to acquiring, owning and disposing of our ordinary shares by a U.S. Holder (as defined below) that holds the ordinary shares as “capital assets” (generally, property held for investment) under the Code. This discussion is based upon existing U.S. federal income tax law, including the Code, U.S. Treasury regulations thereunder, rulings and court decisions, all of which are subject to differing
-
98
-
interpretations or change, possibly with retroactive effect. No ruling from the Internal Revenue Service (the “IRS”) has been sought with respect to any U.S. federal income tax consequences described below, and there can be no assurance that the IRS or a court will not take a contrary position.
This discussion does not address all aspects of U.S. federal income taxation that may be relevant to particular investors in light of their individual circumstances, including investors subject to special tax rules (for example, financial institutions, insurance companies, regulated investment companies, real estate investment trusts, broker-dealers, traders in securities that elect mark-to-market treatment, any entity or arrangement treated as a partnership or pass-through entity for U.S. federal income tax purposes and any investor therein, tax-exempt organizations (including private foundations), individual retirement and other tax-deferred accounts, U.S. expatriates, investors who are not U.S. Holders, U.S. Holders who at any time own or owned (directly, indirectly or constructively) 10% or more of our stock (by vote or value), U.S. Holders that acquire their ordinary shares pursuant to any employee share option or otherwise as compensation, U.S. Holders that hold their ordinary shares as part of a straddle, hedge, conversion, wash sale, constructive sale or other integrated transaction for U.S. federal income tax purposes, U.S. Holders that have a functional currency other than the U.S. dollar or persons required to accelerate the recognition of any item of gross income with respect to our ordinary shares as a result of such income being recognized on an applicable financial statement, all of whom may be subject to tax rules that differ significantly from those summarized below). In addition, this discussion does not discuss any U.S. federal estate, gift or alternative minimum tax consequences, any tax consequences of the Medicare tax on certain investment income pursuant to the Health Care and Education Reconciliation Act of 2010, any considerations with respect to FATCA (which for this purpose means Sections 1471 through 1474 of the Code, the Treasury regulations and administrative guidance promulgated thereunder, any intergovernmental agreement entered in connection therewith, and any non-U.S. laws, rules or directives implementing or relating to any of the foregoing), or any state, local or non-U.S. tax consequences.
General
For purposes of this discussion, a “U.S. Holder” is a beneficial owner of our ordinary shares that is, for U.S. federal income tax purposes, (i) an individual who is a citizen or resident of the United States, (ii) a corporation (or other entity treated as a corporation for U.S. federal income tax purposes) created in, or organized under the law of, the United States or any state thereof or the District of Columbia, (iii) an estate the income of which is includable in gross income for U.S. federal income tax purposes regardless of its source, or (iv) a trust (A) the administration of which is subject to the primary supervision of a U.S. court and which has one or more U.S. persons who have the authority to control all substantial decisions of the trust or (B) that has otherwise validly elected to be treated as a U.S. person under the Code.
If an entity or arrangement treated as a partnership or pass-through entity for U.S. federal income tax purposes is a beneficial owner of our ordinary shares, the tax treatment of an investor therein will generally depend upon the status of such investor, the activities of the entity or arrangement, and certain determinations made at the investor level or the level of the entity or arrangement. Such entities or arrangements, and investors therein, are urged to consult their own tax advisors regarding their investment in our ordinary shares.
Passive Foreign Investment Company Consequences
We believe that we will not be a “passive foreign investment company” for U.S. federal income tax purposes (“PFIC”) for the current taxable year and that we have not been a PFIC for prior taxable years and we expect that we will not become a PFIC in the foreseeable future, although there can be no assurance in this regard. Because PFIC status is a fact-intensive determination, no assurance can be given that we are not, have not been, or will not become, classified as a PFIC.
If we are a PFIC for any taxable year, U.S. Holders generally will be subject to special tax rules that could result in materially adverse U.S. federal income tax consequences. In such event, a U.S. Holder may be subject to U.S. federal income tax at the highest applicable ordinary income tax rates on (i) any “excess distribution” that we make to the U.S. Holder (which generally means any distribution paid during a taxable year to a U.S. Holder that is greater than 125% of the average annual distributions paid in the three preceding taxable years or, if shorter, the U.S. Holder’s holding period for the ordinary shares), or (ii) any gain realized on the disposition of our ordinary shares. In addition, a U.S. Holder may be subject to an interest charge on such tax. Furthermore, the favorable dividend tax rates that may apply to certain U.S. Holders on our dividends will not apply if we are a PFIC during the taxable year in which such dividend was paid, or the preceding taxable year.
As an alternative to the foregoing rules, if we are a PFIC for any taxable year, a U.S. Holder may make a mark-to-market election with respect to our ordinary shares, provided that the ordinary shares are regularly traded. Although no assurances may be given, we expect that our ordinary shares should qualify as being regularly traded. If a U.S. Holder makes a valid mark-to-market election, the U.S. Holder will generally (i) include as ordinary income for each taxable year that we are a PFIC the
-
99
-
excess, if any, of the fair market value of our ordinary shares held at the end of the taxable year over the adjusted tax basis of such ordinary shares and (ii) deduct as an ordinary loss the excess, if any, of the adjusted tax basis of the ordinary shares over the fair market value of such ordinary shares held at the end of the taxable year, but only to the extent of the net amount previously included in income as a result of the mark-to-market election. The U.S. Holder’s tax basis in the ordinary shares would be adjusted to reflect any income or loss resulting from the mark-to-market election. Gain on the sale or other disposition of our ordinary shares would be treated as ordinary income, and loss on the sale or other disposition of our ordinary shares would be treated as an ordinary loss, but only to the extent of the amount previously included in income as a result of the mark-to-market election. If a U.S. Holder makes a mark-to-market election in respect of a corporation classified as a PFIC and such corporation ceases to be classified as a PFIC, the holder will not be required to take into account the gain or loss described above during any period that such corporation is not classified as a PFIC. Because a mark-to-market election cannot be made for any lower-tier PFICs that we may own, a U.S. Holder may continue to be subject to the PFIC rules with respect to such U.S. Holder’s indirect interest in any investment held by us that is treated as an equity interest in a PFIC for U.S. federal income tax purposes.
A “qualified electing fund” election (“QEF election”), in certain limited circumstances, could serve as a further alternative to the foregoing rules with respect to an investment in a PFIC. However, in order for a U.S. Holder to be able to make a QEF election, we would need to provide such U.S. Holder with certain information. Because we do not intend to provide U.S. Holders with the information they would need to make such an election, prospective investors should assume that the QEF election will not be available in respect of an investment in our ordinary shares.
Each U.S. Holder is urged to consult its tax advisor concerning the U.S. federal income tax consequences of acquiring, owning or disposing of our ordinary shares if we are or become classified as a PFIC, including the possibility of making a mark-to-market election.
The remainder of the discussion below assumes that we are not a PFIC, have not been a PFIC and will not become a PFIC in the future.
Distributions
The gross amount of distributions with respect to our ordinary shares (including the amount of any non-U.S. withholding taxes) will be taxable as dividends, to the extent paid out of our current or accumulated earnings and profits, as determined under U.S. federal income tax principles. Such distributions will be includable in a U.S. Holder’s gross income as ordinary dividend income on the day actually or constructively received by the U.S. Holder. Such dividends will not be eligible for the dividends-received deduction generally allowed to U.S. corporations in respect of dividends received from other U.S. corporations.
To the extent that the amount of the distribution exceeds our current and accumulated earnings and profits for a taxable year, as determined under U.S. federal income tax principles, the distribution will be treated first as a tax-free return of capital to the extent of the U.S. Holder’s tax basis in our ordinary shares, and to the extent the amount of the distribution exceeds the U.S. Holder’s tax basis, the excess will be taxed as capital gain recognized on a sale or exchange of such ordinary shares. Because we do not expect to determine our earnings and profits in accordance with U.S. federal income tax principles, U.S. Holders should expect that a distribution will generally be reported as a dividend for U.S. federal income tax purposes, even if that distribution would otherwise be treated as a tax-free return of capital or as capital gain under the rules described above.
With respect to noncorporate U.S. Holders, certain dividends received from a “qualified foreign corporation” may be subject to reduced rates of U.S. federal income taxation. A non-U.S. corporation is treated as a qualified foreign corporation with respect to dividends paid by that corporation on shares that are readily tradable on an established securities market in the United States. We believe our ordinary shares, which are listed on the NYSE, are considered to be readily tradable on an established securities market in the United States, although there can be no assurance that this will continue to be the case in the future. Noncorporate U.S. Holders that do not meet a minimum holding period requirement during which they are not protected from the risk of loss, or that elect to treat the dividend income as “investment income” pursuant to Section 163(d)(4) of the Code, will not be eligible for the reduced rates of taxation regardless of our status as a qualified foreign corporation. In addition, even if the minimum holding period requirement has been met, the rate reduction will not apply to dividends if the recipient of a dividend is obligated to make related payments with respect to positions in substantially similar or related property. You should consult your own tax advisors regarding the application of these rules given your particular circumstances.
-
100
-
In the event that a U.S. Holder is subject to non-U.S. withholding taxes on dividends paid to such U.S. Holder with respect to our ordinary shares, such U.S. Holder may be eligible, subject to certain conditions and limitations, to claim a foreign tax credit for such non-U.S. withholding taxes against the U.S. Holder’s U.S. federal income tax liability or alternatively deduct such non-U.S. withholding taxes in computing such U.S. Holder’s U.S. federal income tax liability. Dividends paid to a U.S. Holder with respect to our ordinary shares are expected to generally constitute “foreign source income” and to generally be treated as “passive category income,” for purposes of the foreign tax credit, except that a portion of such dividends may be treated as income from U.S. sources if (i) U.S. persons (as defined in the Code and applicable Treasury regulations) own, directly or indirectly, 50% or more of our ordinary shares (by vote or value) and (ii) we receive more than a
de minimis
amount of income from U.S. sources. The rules governing the foreign tax credit and ability to deduct such non-U.S. withholding taxes are complex and involve the application of rules that depend upon your particular circumstances. You are urged to consult your own tax advisors regarding the availability of, and any limits or conditions to, the foreign tax credit or deduction under your particular circumstances.
Sale, Exchange or Other Disposition
For U.S. federal income tax purposes, a U.S. Holder generally will recognize taxable gain or loss on any sale, exchange or other taxable disposition of our ordinary shares in an amount equal to the difference between the amount realized for our ordinary shares and the U.S. Holder’s tax basis in such ordinary shares. Such gain or loss will generally be capital gain or loss. Capital gains of individuals derived with respect to capital assets held for more than one year generally are eligible for reduced rates of U.S. federal income taxation. The deductibility of capital losses is subject to limitations. Any gain or loss recognized by a U.S. Holder will generally be treated as U.S. source gain or loss. You are urged to consult your tax advisors regarding the tax consequences if a non-U.S. tax is imposed on a sale, exchange or other disposition of our ordinary shares, if any, including the availability of the foreign tax credit or deduction under your particular circumstances.
Information Reporting and Backup Withholding
A U.S. Holder with interests in “specified foreign financial assets” (including, among other assets, our ordinary shares, unless such shares were held on such U.S. Holder’s behalf through certain financial institutions) may be required to file an information report with the IRS if the aggregate value of all such assets exceeds certain threshold amounts. You should consult your own tax advisor as to the possible obligation to file such information reports in light of your particular circumstances.
Moreover, information reporting generally will apply to dividends in respect of our ordinary shares and the proceeds from the sale, exchange or other disposition of our ordinary shares, in each case, that are paid to a U.S. Holder within the United States (and in certain cases, outside the United States or through certain U.S. intermediaries), unless the U.S. Holder is an exempt recipient. Backup withholding (currently at a rate of 24% for payments made before January 1, 2026) may also apply to such payments, unless the U.S. Holder provides a correct taxpayer identification number, certifies as to no loss of exemption from backup withholding by providing a properly completed IRS Form W-9 and otherwise complies with applicable requirements of the backup withholding rules, or otherwise establishes an exemption. Backup withholding is not an additional tax. Any amounts withheld under the backup withholding rules generally will be allowed as a refund or a credit against a U.S. Holder’s U.S. federal income tax liability provided the required information is timely furnished to the IRS. You should consult your tax advisors regarding the application of the U.S. information reporting and backup withholding rules to your particular circumstances.
|
F.
|
Dividends and Paying Agents
|
Not applicable.
|
G.
|
Statement of Experts
|
Not applicable.
-
101
-
|
H.
|
Documents on Display
|
The SEC maintains an Internet website that contains reports and other information about issuers, like us, that file electronically with the SEC. The address of that site is www.sec.gov.
We also make available on our website, free of charge, our annual reports on Form 20-F and the text of our reports on Form 6-K, including any amendments to these reports, as well as certain other SEC filings, as soon as reasonably practicable after they are electronically filed with or furnished to the SEC. Our website address is www.constellium.com. The information contained on our website is not incorporated by reference in this document.
|
I.
|
Subsidiary Information
|
Not applicable.
Refer to the information set forth under the Notes to the Consolidated Financial Statements at “Item 18. Financial Statements”:
|
•
|
Note 2—Summary of Significant Accounting Policies—2.6— Principles governing the preparation of the Consolidated Financial Statements— Financial Instruments; and
|
|
•
|
|
Not applicable.
None.
|
A.
|
Material Modifications to the Rights of Security Holders
|
The information called for by this Item has been reported in the Current Report on Form 6-K filed on December 12, 2019, with the Securities and Exchange Commission, and all exhibits attached thereto, which is incorporated by reference into this Annual Report.
|
B.
|
Use of Proceeds
|
None.
-
102
-
|
A.
|
Disclosure Controls and Procedures
|
Our Chief Executive Officer and principal financial officer, after evaluating the effectiveness of our disclosure controls and procedures (as defined in Exchange Act Rule 13a-15(e)) as of the end of the period covered by this Form 20-F, have concluded that, as of such date, our disclosure controls and procedures were effective.
|
B.
|
Management’s Annual Report on Internal Control over Financial Reporting
|
The management of the Company, including the Chief Executive Officer and Chief Financial Officer, is responsible for establishing and maintaining adequate internal control over financial reporting, as defined in the Securities Exchange Act of 1934, as amended, Rule 13a-15(f).
The Company’s internal control over financial reporting is a process designed to provide reasonable assurance regarding the reliability of financial reporting and the preparation of financial statements for external purposes in accordance with International Financial Reporting Standards (IFRS) as issued by the International Accounting Standards Board (IASB) and as endorsed by the European Union (EU).
The Company’s internal control over financial reporting includes those policies and procedures that (i) pertain to the maintenance of records that, in reasonable detail, accurately and fairly reflect the transactions and dispositions of the assets of the Company; (ii) provide reasonable assurance that transactions are recorded as necessary to permit preparation of financial statements in accordance with IFRS, and that receipts and expenditures of the Company are being made only in accordance with authorizations of management and directors of the Company; and (iii) provide reasonable assurance regarding prevention or timely detection of unauthorized acquisition, use, or disposition of the Company’s assets that could have a material effect on the financial statements.
Because of its inherent limitations, internal control over financial reporting may not prevent or detect misstatements. Also, projections of any evaluation of the effectiveness of internal control to future periods are subject to the risk that controls may become inadequate because of changes in conditions, or that the degree of compliance with the policies or procedures may deteriorate.
Constellium’s management has assessed the effectiveness of the Company’s internal controls over financial reporting as of December 31, 2019 based on the criteria established in Internal Control—Integrated Framework (2013) issued by the Committee of Sponsoring Organizations of the Treadway Commission (COSO) and, based on such criteria, Constellium’s management has concluded that, as of December 31, 2019, the Company´s internal control over financial reporting is effective.
|
C.
|
Attestation report of the registered public accounting firm.
|
The effectiveness of the Company’s internal control over financial reporting as of December 31, 2019 has been audited by PricewaterhouseCoopers Audit, an independent registered public accounting firm, as stated in their report which appears herein.
|
D.
|
Changes in Internal Control over Financial Reporting
|
During the period covered by this report, we have not made any change to our internal control over financial reporting that have materially affected, or are reasonably likely to materially affect, our internal control over financial reporting.
-
103
-
Item 16.
Our board of directors has determined that the members of our audit committee, Mmes. Walker and Brooks and Messrs. Paschke and Ormerod satisfy the “independence” requirements set forth in Rule 10A-3 under the Exchange Act. Our board of directors has also determined that each of Ms. Walker and Messrs. Paschke and Ormerod is an “audit committee financial expert” as defined in Item 16A of Form 20-F under the Exchange Act.
We have adopted a Worldwide Code of Employee and Business Conduct that applies to all our employees, officers and directors, including our principal executive, principal financial and principal accounting officers. Our Worldwide Code of Employee and Business Conduct addresses, among other things, competition and fair dealing, conflicts of interest, financial integrity, government relations, confidentiality and corporate opportunity requirements and the process for reporting violations of the Worldwide Code of Business Conduct and Ethics, employee misconduct, conflicts of interest or other violations. Our Worldwide Code of Employee and Business Conduct is intended to meet the definition of “code of ethics” under Item 16B of Form 20-F under the Exchange Act.
A copy of our Worldwide Code of Employee and Business Conduct is available on our website at www.constellium.com. Any amendments to the Worldwide Code of Employee and Business Conduct, or any waivers of its requirements, will be disclosed on our website.
PricewaterhouseCoopers Audit has served as our independent registered public accounting firm for each of the fiscal years in the three-year period ended December 31, 2019.
The following table sets out the aggregate fees for professional services and other services rendered to us by PricewaterhouseCoopers in the years ended December 31, 2019 and 2018, and breaks down these amounts by category of service:
|
For the year ended December 31,
|
||||||
|
2019
|
2018
|
|||||
|
(€ in thousands)
|
||||||
|
Audit fees
|
3,948
|
|
4,048
|
|
||
|
Audit-related fees
|
448
|
|
224
|
|
||
|
Tax fees
|
202
|
|
276
|
|
||
|
All other fees
|
2
|
|
3
|
|
||
|
Total
(1)
|
4,600
|
|
4,551
|
|
||
__________________
(1)
Including out-of-pocket expenses amounting to €423,000 and €439,000 for the years ended December 31, 2019 and 2018, respectively.
Audit Fees
Audit fees consist of fees related to the annual audit of our Consolidated Financial Statements, and our statutory financial statements, the audit of the statutory financial statements of our subsidiaries, other audit or interim review services provided in connection with statutory and regulatory filings or engagements.
Audit-Related Fees
Audit-related fees consist of fees rendered for assurance and related services that are reasonably related to the performance of the audit or review of the company’s financial statements, or that are traditionally performed by the independent auditor, and include consultations concerning financial accounting and reporting standards; advice and assistance in connection with local statutory accounting requirements and due diligence related to acquisitions or disposals.
-
104
-
Tax Fees
Tax fees relate to tax compliance, including the preparation of tax returns and assistance with tax audits.
Pre-Approval Policies and Procedures
The advance approval of the audit committee or members thereof, to whom approval authority has been delegated, is required for all audit and non-audit services provided by our auditors.
None.
None.
None.
As a foreign private issuer listed on the NYSE, we are subject to NYSE corporate governance listing standards. However, NYSE rules permit a foreign private issuer like us to follow the corporate governance practices of its home country. Following the Transfer, we intend to rely on the NYSE Listed Company Manual with respect to our corporate governance to the extent possible under French law.
The following are the significant ways in which our corporate governance practices differ from those required for U.S. companies listed on the NYSE following the Transfer.
|
•
|
Audit Committee
-The Board’s audit committee is responsible for selecting our statutory auditors and making a recommendation to our Board regarding the terms of their compensation. As required by French law, the actual appointment of the statutory auditors has to be made by the shareholders at a general meeting of the shareholders. Such appointment was made at our last shareholders' meeting held on November 25, 2019 and became effective on December 12, 2019.
|
|
•
|
Committee Powers
-While the NYSE Listed Company Manual empowers board committees with decision-making authority that can be delegated by a company’s board, under French law, committees of the Company recommend to the full Board, which will be the decision-making body (not its committees).
|
|
•
|
Executive Sessions/Communications with Independent Directors
-French law does not require for our independent directors to meet regularly without management, nor does it require the independent directors to meet alone in executive session at least once a year, as required by the NYSE Listed Company Manual. However, if our independent directors decide to engage in either or both of these activities, they will be permitted to do so. In practice, our independent directors regularly meet among themselves for discussions, but we do not expect them to be under any requirement to do so under our Articles of Association or French law. In addition, French law does not require a method for interested parties to communicate with our independent directors.
|
|
•
|
Equity Compensation Plans
-French law requires shareholder approval at a general meeting of the shareholders to adopt an equity compensation plan, which is consistent with the shareholder vote required by the NYSE Listed Company Manual. It is common practice after obtaining such shareholder approval for the shareholders of a French company to then delegate to such company’s board the authority to decide on the specific terms of the granting of equity compensation, within the limits of the shareholders’ authorization. The shareholders of the Company at the general meeting held on November 25, 2019 voted on such an authorization (effective as of December 12, 2019) to delegate such authority to the Board, and going forward we expect our Board to perform such functions for the Company.
|
-
105
-
|
•
|
Corporate Governance Guidelines
-A Board Internal Charter is required by the NYSE Listed Company Manual for U.S. companies listed on the NYSE that would set forth certain corporate governance practices of a listed company’s board. Our Board Internal Charter after the Transfer covers all items required by the NYSE Listed Company Manual subject to certain differences set forth by French law, particularly with respect to Committee powers (as described above) and conflict of interest transactions (as described below).
|
|
•
|
Conflicts of Interest
-Pursuant to French law and the Articles of Association, any agreement (directly or through an intermediary) between the Company and any director of the Company that is not entered into (i) in the ordinary course of business and (ii) under normal terms and conditions will be subject to the prior authorization of the Board, excluding the participation and vote of the interested director. As required by French law, any such agreement will also be subject to approval at the next ordinary shareholders’ meeting (by a simple majority, excluding the vote of interested persons). If the transaction has not been pre-approved by the Board, it can be nullified if it has prejudicial consequences for the Company. If it is not approved by the shareholders, interested directors may be held liable for any prejudicial consequences for the Company of the unapproved transaction; such transaction will nevertheless remain valid, unless it is nullified in case of fraud. The foregoing requirements also apply to agreements between the Company and another entity if one of the Company’s directors is an owner, a general partner, manager, director, general manager, member of the executive or supervisory board of the other entity, as well as to agreements in which one of the Company’s directors has an indirect interest. Aside from the foregoing requirements, there are no specific provisions prohibiting conflicted directors to participate or vote at a Board meeting. However, as a general rule under French law, directors must act in the interest of the Company.
|
In addition to the above differences, the following are corporate governance provisions applicable to the Company under French law and our Articles of Association:
Rights of Shareholders and Shareholder Meetings
Under French law and in general, each shareholder is entitled to one vote per share at any general shareholders’ meeting. A general shareholders meeting is held annually to, inter alia, approve the annual accounts. General shareholders meeting (including annual meetings) can be ordinary and/or extraordinary, depending upon the resolutions submitted to the vote.
At an extraordinary general shareholders’ meeting (which votes upon any proposal to change the articles of association), majority is 2/3 of the votes validly cast. The quorum necessary for such a meeting to be validly held on the date set by the first convening notice is 1/4 of the voting shares. If this quorum is not reached, a second meeting is convened with an agenda identical to the first meeting. If the quorum at the second meeting is not reached, the second meeting can be postponed to a date no later than two months after the date on which the second meeting was convened. The quorum for such second or postponed meeting, as the case may be, to be validly held is 1/5 of the voting shares.
At an ordinary shareholders’ meeting (which votes upon any proposal within the competence of a general shareholders’ meeting other than an extraordinary shareholders meeting such as approval of annual financial statements or appointment of directors), majority is simple majority (more than 50%) of the votes validly cast. Majority at special meetings is 2/3 of the votes validly cast. The quorum necessary for such a meeting to be validly held on the date set by the first convening notice is 1/5 of the voting shares. If this quorum is not reached, a second meeting is convened with an agenda identical to the first meeting; no quorum is required for such second meeting.
Special meetings bring together the holders of shares of a specified class, should it be created, to decide on an amendment to the rights relating to the shares of this class. The quorum necessary for such a meeting to be validly held on the date set by the first convening notice is 1/3 of the voting shares, and, failing which, 1/5 for the meeting held on the date set by the second convening notice or in the case of postponement of the second meeting.
French law does not provide for cumulative voting. The right to participate in a shareholders’ meeting is granted to all the shareholders whose shares are fully paid up and for whom a right to attend shareholders’ meetings has been established by registration of their shares in their names or names of the authorized intermediary acting on their behalf on the second business day prior to the shareholders’ meeting at midnight (Paris time) (the “French Record Date”), either in the “
au nominatif
” shares accounts held by the company (or an agent acting on its behalf) or in the “
au porteur
” shares accounts held by the authorized intermediary.
-
106
-
Shareholders holding shares registered on the U.S. Register (which include all shares which are listed on the NYSE, held through a DTC participant and shares directly recorded in the name of their holder with Computershare) will continue to vote through a process similar to the one currently in place, with the following main differences:
|
•
|
their voting instructions will be transmitted to the Company via the French Intermediary, acting as intermediary for the account of all shareholders registered on the U.S. Register, in accordance with articles L. 228-1 et seq. of the French Commercial Code;
|
|
•
|
the French Record Date will be set;
|
|
•
|
an additional record date will be fixed for all shareholders registered on the U.S. Register, which date will be the 25th day before the meeting (the “U.S. Mailing Record Date”); and
|
|
•
|
shareholders who purchase shares between the U.S. Mailing Record Date and the French Record Date will be entitled to participate and vote at the shareholders’ meeting as long as they continue to be shareholders on the French Record Date. However, given the short time between the French Record Date and the shareholders’ meeting date, shareholders as of the French Record Date may not have received the notices and information received by shareholders holding shares registered on the U.S. Register as of the U.S. Mailing Record Date. To the extent that shareholders as of the U.S. Mailing Record Date have sent voting instructions and sold or otherwise transferred their shares as of the French Record Date, such voting instructions will be invalidated or modified by the Company, as the case may be, in accordance with articles R. 225-85 and R. 225-86 of the French Commercial Code.
|
Shareholder Proposals and Action by Written Consent
Pursuant to French law, the board of directors is required to convene an annual ordinary general meeting of shareholders for approval of the annual accounts. This meeting must be held within six months after the end of each prior fiscal year.
The board of directors may also convene an ordinary or extraordinary meeting of shareholders upon proper notice at any time during the year. If the board of directors fails to convene a shareholders’ meeting, the independent auditors may call the meeting. In a bankruptcy, the liquidator or court-appointed agent may also call a shareholders’ meeting in some instances. Any of the following may request the court to appoint an agent:
|
•
|
one or several shareholders holding at least 5% of the share capital, or
|
|
•
|
any interested party or the workers committee in cases of urgency.
|
Shareholders holding a majority of the capital or voting rights after a public take-over bid or exchange offer or the transfer of a controlling block of shares may also convene a shareholders’ meeting. In general, shareholders can only take action at shareholders’ meetings on matters listed on the agenda for the meeting. As an exception to this rule, shareholders may take action with respect to the dismissal and appointment of directors.
Additional resolutions to be submitted for approval by the shareholders at the meeting may be proposed to the board of directors within 10 days of the publication of the convening notice (
avis de reunion
) by one or several shareholders holding a specified percentage of shares. The percentage required to be held depends on the amount of the share capital of the Company; based on the Company’s issued share capital of €2,757,348.36 as of December 31, 2019, this percentage would be 2.91%. Under French law, shareholders’ action by written consent is not permitted in a
Societas Europaea
.
Shareholder Suits
French law provides that a shareholder, or a group of shareholders, may initiate a legal action to seek indemnification from the directors of a company in the company’s interest if it fails to bring such legal action itself. If so, any damages awarded by the court are paid to the company and any legal fees relating to such action are borne by the relevant shareholder or the group of shareholders. The plaintiff must remain a shareholder throughout the duration of the legal action. There is no other case where shareholders may initiate a derivative action to enforce a right of a company.
A shareholder may alternatively or cumulatively bring an individual legal action against the directors, provided he or she has suffered distinct damages from those suffered by the company. In this case, any damages awarded by the court are paid to the relevant shareholder.
-
107
-
Repurchase of Shares; Pre-emptive Rights; Shareholder Vote on Certain Reorganizations
Under French law, a private company (which our company is for French law purposes for so long as it is listed on the NYSE only) may not subscribe for newly issued shares in its capital but may, however, acquire its own shares for the following purposes only:
|
•
|
With a view to distributing within one year of their repurchase the relevant shares to employees or managers under a profit-sharing, restricted free share or share option plan, not to exceed 10% of the share capital;
|
|
•
|
In payment or in exchange for assets acquired by the company within two years of their repurchase, not to exceed 5% of the share capital;
|
|
•
|
To sell the relevant shares to any shareholders willing to purchase them as part of a process organized by the company within five years, not to exceed 10% of the share capital.
|
Shares acquired but not used in accordance with the above purposes must be cancelled.
As of today, the Company does not have in place an authorization granted to the Board of Directors to purchase its own shares.
The Company may also acquire its own shares to decrease its share capital, provided that such decision is not driven by losses and that a purchase offer is made to all shareholders on a pro rata basis, with the approval of the shareholders at the extraordinary general meeting deciding the capital reduction.
Under French law, in case of issuance of additional shares or other securities giving right, immediately or in the future, to new shares for cash or set-off against cash debts, the existing shareholders have preferential subscription rights to these securities on a pro rata basis unless such rights are waived by a two-thirds majority of the votes held by the shareholders present, represented by proxy or voting by mail at the extraordinary meeting deciding or authorizing the capital increase. In case such rights are not waived by the extraordinary general meeting, each shareholder may individually either exercise, or assign or not exercise its preferential rights.
Generally, under French law, completion of a legal merger (fusion), demerger (scission), dissolution, sale, lease or exchange of all or substantially all of a company’s assets, requires:
|
•
|
the approval of the board of directors; and
|
|
•
|
the approval by a two-thirds majority of the votes held by the shareholders present, represented by proxy or voting by mail at the relevant meeting, or in the case of a legal merger (fusion) with a non-EU company, approval of all the shareholders of the company.
|
Anti-Takeover Provisions and Shareholder Disclosure Thresholds
Anti-Takeover Provisions
French law does not contain provisions restricting or making difficult to change the composition of the board of directors following a change of control.
French law allows shareholders at general meetings to delegate the authority to the board of directors to issue shares or warrants to subscribe for shares, which may make it more difficult for a shareholder to obtain control over our general meeting of shareholders.
Crossing of Threshold Notifications
According to the Articles of Association, any natural persons or legal entities acting alone or in concert, who come to own, directly or indirectly, a number of shares equal to or greater than 5%, 10%, 15%, 20%, 25%, 30%, 33 1/3%, 50%, 66 2/3% or 90% of the total number of shares or voting rights must, within five (5) trading days after the shareholding threshold is crossed, upwards or downwards, notify the Company, by certified letter with acknowledgment of receipt, of the total number of shares or voting rights that they own alone, directly or indirectly, or in concert.
-
108
-
The notification includes information on (i) the number of securities held giving deferred rights to the shares to be issued and the corresponding voting rights, and (ii) the number of shares already issued or the voting rights they may acquire.
Furthermore, according to the Articles of Association, any persons or entities who hold a number of shares equal to or greater than 10%, 15%, 20% or 25% of the total number of shares or voting rights in the Company shall inform the Company of the objectives they intend to pursue over the six (6) months to come.
Following a period of six (6) months, any persons or entities who continue to hold a number of shares or voting rights equal to or greater than the fractions mentioned hereinabove, shall renew their statement of intent, in compliance with the aforementioned terms, for each new period of six (6) months.
This statement shall specify whether the shareholder is acting alone or in concert, if he plans to discontinue or continue his purchases, to acquire or not the control of the Company, to request his appointment or that of one or several persons as director.
The Company reserves the right to share with the public and shareholders either the objectives that it has been notified of, or the relevant person’s failure to comply with the aforementioned obligation.
For the application of the preceding subparagraphs, the shares or voting rights listed in paragraphs 1 to 8 of Article L. 233-9 I of the French Commercial Code shall be considered equivalent to the shares or voting rights held by a shareholder.
Mandatory Takeover Bid
According to the Articles of Association, any natural or legal persons, acting alone or in concert under Article L. 233-10 of the French Commercial Code, who comes into possession, otherwise than following a voluntary takeover bid, directly or indirectly, of more than 30% of the capital or voting rights of the Company, shall file a draft takeover bid on all the capital and securities granting access to the capital or voting rights, and on terms that comply with applicable United States securities law, rules of the SEC and NYSE rules.
The same requirement applies to natural or legal persons, acting alone or in concert, who directly or indirectly own a number between 30% and half of the total number of equity securities or voting rights of the company and who, in less than twelve consecutive months, increase the holding, in capital or voting rights, of at least 1% of the total number of equity securities or voting rights of the Company.
When a draft offer is submitted, the price proposed must be at least equal to the highest price paid by the offeror, acting alone or in concert within the meaning of Article L. 233-10 of the French Commercial Code, over a period of twelve (12) months preceding the event giving rise to the obligation to submit the draft offer.
In the event of a clear change in the characteristics of the Company, if the market for its securities so justifies or in the absence of a transaction by the offeror, acting alone or in concert, over the Company’s shares during the twelve-month period mentioned in the first paragraph, the price will be fixed by an expert appointed in accordance with Article 1592 of the French Civil Code and determined according to objective evaluation criteria usually used, the characteristics of the Company and the market of its securities, it being specified that the expert will be required to take into account, in its assessment, the criteria identified by the Commission des Opérations de Bourse, the AMF and the French courts.
The obligation to file a draft public offer does not apply if the person or persons concerned justify to the Company the fulfillment of one of the conditions listed in Articles 234-7 and 234-9 of the AMF General Regulations. In the event of disagreement between the parties, an expert will be appointed by the president of the commercial court, ruling in the form of interim relief, for the purpose of determining whether or not it is necessary to file a draft public offer, it being specified that the expert will be required to apply the relevant provisions of the AMF General Regulations as well as the criteria issued by the French
Conseil des Marchés Financiers
, the AMF and the French courts.
Any breach of the obligation to file a takeover bid as provided in the Articles of Association may give rise to claims for damages or, as the case may be, action for injunctive relief.
Not applicable.
-
109
-
See “Item 18. Financial Statements.”
The audited Consolidated Financial Statements as required under Item 18 are attached hereto starting on page F-1 of this Annual Report. The audit report of PricewaterhouseCoopers Audit, an independent registered public accounting firm, is included herein preceding the audited Consolidated Financial Statements.
Parent Company Condensed Financial Information is included herein in Note 33 to the Consolidated Financial Statements.
The Financial Statements of Constellium-UACJ ABS LLC are included herein as Exhibit 10.31 of this Annual Report pursuant to Rule 3-09 of Regulation S-X promulgated by the United States Securities and Exchange Commission.
The following exhibits are filed as part of this Annual Report:
EXHIBIT INDEX
|
4.1
|
|
|
4.2
|
|
|
4.3
|
|
|
4.4
|
|
|
4.5
|
|
|
4.6
|
|
|
4.7
|
|
|
4.8
|
|
-
110
-
|
4.9
|
|
|
4.10
|
|
|
4.11
|
|
|
4.12
|
|
|
4.12.1
|
|
|
4.13
|
|
|
4.14
|
|
|
4.15
|
|
|
4.16
|
|
|
4.17
|
|
|
4.17.2
|
|
|
4.18
|
|
|
4.19
|
|
|
4.20
|
|
-
111
-
|
4.21
|
|
|
4.22
|
|
|
4.23
|
|
|
4.24
|
|
|
4.25
|
|
|
4.26
|
|
|
4.27
|
|
|
4.28
|
|
|
4.29
|
|
|
4.30
|
|
|
4.31
|
|
|
4.32
|
|
|
4.33
|
|
|
4.34
|
|
-
112
-
|
4.35
|
|
|
4.36
|
|
|
4.37
|
|
|
4.38
|
|
|
4.39
|
|
|
4.40
|
|
|
4.41
|
|
|
4.42
|
|
|
4.43
|
|
|
4.43.1
|
|
|
4.44
|
|
|
4.45
|
|
|
4.45.1
|
|
-
113
-
|
4.46
|
|
|
4.46.1
|
|
|
4.46.2
|
|
|
4.47
|
|
|
4.48
|
|
|
4.48.1
|
|
|
10.1
|
|
|
10.2
|
|
|
10.3
|
|
|
10.4
|
|
|
10.5
|
|
|
10.6
|
|
|
10.7
|
|
-
114
-
|
10.8
|
|
|
10.8.1
|
|
|
10.8.2
|
|
|
10.9
|
|
|
10.9.1
|
|
|
10.9.2
|
|
|
10.9.3
|
|
|
10.10
|
|
|
10.10.1
|
|
|
10.11
|
|
|
10.11.1
|
|
|
10.12
|
|
|
10.12.1
|
|
|
10.12.2
|
|
|
10.13
|
|
|
10.13.1
|
|
|
10.13.2
|
|
-
115
-
|
10.14
|
|
|
10.15
|
|
|
10.15.1
|
|
|
10.15.2
|
|
|
10.15.3
|
|
|
10.16
|
|
|
10.17
|
|
|
10.18
|
|
|
10.19
|
|
|
10.20
|
|
|
10.22
|
|
|
10.23
|
|
|
10.24
|
|
|
10.24.1
|
|
|
10.25
|
|
|
10.25.1
|
|
|
10.25.2
|
|
-
116
-
|
10.25.3
|
|
|
10.25.4
|
|
|
10.25.5
|
|
|
10.25.6
|
|
|
10.28
|
|
|
10.29
|
|
|
10.30
|
|
|
10.30.1
|
|
|
10.30.2
|
|
|
10.30.3
|
|
|
10.30.4
|
|
|
10.30.5
|
|
|
10.30.6
|
|
|
10.31
|
|
|
10.32
|
|
|
10.33
|
|
|
12.1
|
|
|
12.2
|
|
|
13.1
|
|
-
117
-
|
13.2
|
|
|
15.1
|
|
|
15.2
|
|
|
21.1
|
|
|
101.INS
|
XBRL Instance Document**
|
|
101.SCH
|
XBRL Taxonomy Extension Schema Document**
|
|
101.CAL
|
XBRL Taxonomy Extension Calculation Linkbase Document**
|
|
101.DEF
|
XBRL Taxonomy Extension Definition Linkbase Document**
|
|
101.LAB
|
XBRL Taxonomy Extension Label Linkbase Document**
|
|
101.PRE
|
XBRL Taxonomy Extension Presentation Linkbase Document**
|
__________________
** Filed herein.
+ Confidential treatment granted as to certain portions, which portions have been provided separately to the Securities and Exchange Commission.
‡ Translated in part.
-
118
-
SIGNATURES
The registrant hereby certifies that it meets all of the requirements for filing on Form 20-F and that it has duly caused and authorized the undersigned to sign this Annual Report on its behalf.
|
CONSTELLIUM SE
|
||
|
By:
|
/s/ Jean-Marc Germain
|
|
|
Name:
|
Jean-Marc Germain
|
|
|
Title:
|
Chief Executive Officer
|
|
Date: March 9, 2020
-
119
-
INDEX TO FINANCIAL STATEMENTS
Constellium SE Audited Consolidated Financial Statements as of December 31,
2019
and
2018
and for the years ended December 31,
2019
,
2018
and
2017
F-1
Report of Independent Registered Public Accounting Firm
To the Board of Directors and Shareholders of Constellium SE
Opinions on the Financial Statements and Internal Control over Financial Reporting
We have audited the accompanying consolidated statement of financial position of Constellium SE and its subsidiaries (the “Company”) as of December 31, 2019 and 2018, and the related consolidated statements of income, comprehensive income/ (loss), changes in equity, and cash flows for each of the three years in the period ended December 31, 2019, including the related notes (collectively referred to as the “consolidated financial statements”). We also have audited the Company's internal control over financial reporting as of December 31, 2019, based on criteria established in Internal Control - Integrated Framework (2013) issued by the Committee of Sponsoring Organizations of the Treadway Commission (COSO).
In our opinion, the consolidated financial statements referred to above present fairly, in all material respects, the financial position of the Company as of December 31, 2019 and 2018, and the results of its operations and its cash flows for each of the three years in the period ended December 31, 2019 in conformity with International Financial Reporting Standards as issued by the International Accounting Standards Board and in conformity with International Financial Reporting Standards as endorsed by the European Union. Also in our opinion, the Company maintained, in all material respects, effective internal control over financial reporting as of December 31, 2019, based on criteria established in Internal Control - Integrated Framework (2013) issued by the COSO.
Change in Accounting Principle
As discussed in Note 2.2 to the consolidated financial statements, the Company changed the manner in which it accounts for leases in 2019.
Basis for Opinions
The Company's management is responsible for these consolidated financial statements, for maintaining effective internal control over financial reporting, and for its assessment of the effectiveness of internal control over financial reporting, included in Management's Annual Report on Internal Control over Financial Reporting, appearing under Item 15B. Our responsibility is to express opinions on the Company’s consolidated financial statements and on the Company's internal control over financial reporting based on our audits. We are a public accounting firm registered with the Public Company Accounting Oversight Board (United States) ("PCAOB") and are required to be independent with respect to the Company in accordance with the U.S. federal securities laws and the applicable rules and regulations of the Securities and Exchange Commission and the PCAOB.
We conducted our audits in accordance with the standards of the PCAOB. Those standards require that we plan and perform the audits to obtain reasonable assurance about whether the consolidated financial statements are free of material misstatement, whether due to error or fraud, and whether effective internal control over financial reporting was maintained in all material respects.
Our audits of the consolidated financial statements included performing procedures to assess the risks of material misstatement of the consolidated financial statements, whether due to error or fraud, and performing procedures that respond to those risks. Such procedures included examining, on a test basis, evidence regarding the amounts and disclosures in the consolidated financial statements. Our audits also included evaluating the accounting principles used and significant estimates made by management, as well as evaluating the overall presentation of the consolidated financial statements. Our audit of internal control over financial reporting included obtaining an understanding of internal control over financial reporting, assessing the risk that a material weakness exists, and testing and evaluating the design and operating effectiveness of internal control based on the assessed risk. Our audits also included performing such other procedures as we considered necessary in the circumstances. We believe that our audits provide a reasonable basis for our opinions.
Definition and Limitations of Internal Control over Financial Reporting
A company’s internal control over financial reporting is a process designed to provide reasonable assurance regarding the reliability of financial reporting and the preparation of financial statements for external purposes in accordance with generally accepted accounting principles. A company’s internal control over financial reporting includes those policies and procedures that (i) pertain to the maintenance of records that, in reasonable detail, accurately and fairly reflect the transactions and dispositions of the assets of the company; (ii) provide reasonable assurance that transactions are recorded as necessary to permit preparation of financial statements in accordance with generally accepted accounting principles, and that receipts and
F-2
expenditures of the company are being made only in accordance with authorizations of management and directors of the company; and (iii) provide reasonable assurance regarding prevention or timely detection of unauthorized acquisition, use, or disposition of the company’s assets that could have a material effect on the financial statements.
Because of its inherent limitations, internal control over financial reporting may not prevent or detect misstatements. Also, projections of any evaluation of effectiveness to future periods are subject to the risk that controls may become inadequate because of changes in conditions, or that the degree of compliance with the policies or procedures may deteriorate.
Critical Audit Matters
The critical audit matters communicated below are matters arising from the current period audit of the consolidated financial statements that were communicated or required to be communicated to the audit committee and that (i) relate to accounts or disclosures that are material to the consolidated financial statements and (ii) involved our especially challenging, subjective, or complex judgments. The communication of critical audit matters does not alter in any way our opinion on the consolidated financial statements, taken as a whole, and we are not, by communicating the critical audit matters below, providing separate opinions on the critical audit matters or on the accounts or disclosures to which they relate.
Goodwill Impairment Assessment - Packaging and Automotive Rolled Products (“P&ARP”) group of cash-generating units
As described in Notes 2 and 18 to the consolidated financial statements, the Company’s consolidated goodwill balance was €455 million at December 31, 2019, and the goodwill associated with the P&ARP group of cash-generating units (the “CGU Group”) was €448 million. Management conducts an impairment test as of December 31 of each year, or more frequently if events or circumstances indicate that the carrying value of goodwill may be impaired. Potential impairment is identified by comparing the recoverable amount of the group of cash-generating units, being the higher of value-in-use and fair value less costs of disposal, to the carrying amount. At December 31, 2019, the recoverable value of the CGU Group has been determined based on its value-in-use. This value is estimated from cash flow projections based on the financial budget approved by management and covering a 5-year period. Cash flows beyond this period are estimated using a perpetual long-term growth rate for the subsequent years. The value-in-use is the sum of discounted cash flows over the projected period and the terminal value. Discount rates are determined based on the weighted-average cost of capital of each cash-generating unit.
The principal consideration for our determination that performing procedures relating to the goodwill impairment assessment of the CGU Group is a critical audit matter is that there was significant judgment by management when developing the value-in-use of the CGU Group. This in turn led to a high degree of auditor judgment, subjectivity, and effort in performing procedures to evaluate management’s cash flow projections and significant assumptions, including perpetual growth rates and the discount rate. In addition, the audit required the involvement of professionals with specialized skills and knowledge to assist in performing these procedures and evaluating the audit evidence obtained.
Addressing the matter involved performing procedures and evaluating audit evidence in connection with forming our overall opinion on the financial statements. These procedures included testing the effectiveness of controls relating to management’s goodwill impairment assessment, including controls over the valuation of the Company’s group of cash-generating units. These procedures also included, among others, understanding and testing management’s process for developing the estimate; evaluating the appropriateness of the discounted cash flow model; testing the completeness, accuracy, and relevance of underlying data used in the model; and evaluating the significant assumptions used by management, including the discount rate, perpetual growth rates, and projected cash flows. Evaluating management’s assumptions related to perpetual growth rates and projected cash flows involved the consideration of (i) the current and past performance of the group of cash-generating units, (ii) the consistency with external market and industry data, and (iii) whether these assumptions were consistent with evidence obtained in other areas of the audit. Professionals with specialized skills and knowledge were used to assist in the evaluation of the Company’s discounted cash flow model and certain significant assumptions, including the discount rate. The procedures also included assessment of the adequacy of the company’s disclosures on goodwill impairment assessment and assumptions used.
Recoverability of deferred tax assets
As described in Notes 2 and 20 to the consolidated financial statements, the Company recognized deferred income tax assets in relation to recoverable tax losses and temporary differences between the accounting base and the tax base of assets and liabilities at December 31, 2019 amounting to €161 million. Of this amount, €75 million is recognized related to recoverable tax losses. Deferred income tax assets are recognized only to the extent that it is probable that future taxable profit will be available, against which the temporary differences can be utilized. The deferred income tax assets related to recoverable tax losses were determined based on the expected future taxable income per tax jurisdiction, the applicable tax rates and local
F-3
expiry periods of tax losses. Management exercised significant judgment in determining that, based on the expected taxable income of the entities, it is more likely than not that a total of €1,009 million of unused tax losses and deductible temporary differences, with a related tax impact of €259 million at December 31, 2019, will not be used.
The principal consideration for our determination that performing procedures relating to the recoverability of deferred income tax assets is a critical audit matter is the significant management judgement involved in considering whether or not it is likely that deferred income tax assets will be utilized. This in turn led to a high degree of auditor judgment and effort in evaluating management’s assessment of the underlying trends and assumptions in the forecasts of taxable profit.
Addressing the matter involved performing procedures and evaluating audit evidence in connection with forming our overall opinion on the financial statements. These procedures included, among others, understanding the controls relating to management’s assessment of the recoverability of deferred income tax assets and testing their effectiveness, examining the deferred income tax assets by jurisdiction and agreeing the forecasted future taxable profits with approved business plans for each entity. They also included assessing whether the underlying trends and assumptions in the forecasts of taxable profit were consistent with those used in the impairment tests, and the past performance against the expected future tax profits in the business plans used by the company. The procedures also included consideration of the applicable tax rates and local expiry periods of tax losses together with any applicable restrictions in recovery for each individual jurisdiction, and assessment of the adequacy of the company’s disclosures on deferred tax assets and assumptions used.
Neuilly-sur-Seine, France
PricewaterhouseCoopers Audit
/s/ Pierre Marty
Pierre Marty
Partner
March 9, 2020
We have served as the Company’s auditor since 2011.
F-4
|
(in millions of Euros)
|
Notes
|
Year ended December 31, 2019
|
Year ended December 31, 2018
|
Year ended December 31, 2017
|
|||||||
|
Revenue
|
4
|
5,907
|
|
5,686
|
|
5,237
|
|
||||
|
Cost of sales
|
(5,305
|
)
|
(5,148
|
)
|
(4,682
|
)
|
|||||
|
Gross profit
|
602
|
|
538
|
|
555
|
|
|||||
|
Selling and administrative expenses
|
(276
|
)
|
(247
|
)
|
(247
|
)
|
|||||
|
Research and development expenses
|
(48
|
)
|
(40
|
)
|
(36
|
)
|
|||||
|
Restructuring costs
|
(4
|
)
|
(1
|
)
|
(4
|
)
|
|||||
|
Other gains / (losses) - net
|
9
|
(19
|
)
|
154
|
|
70
|
|
||||
|
Income from operations
|
255
|
|
404
|
|
338
|
|
|||||
|
Finance costs - net
|
11
|
(175
|
)
|
(149
|
)
|
(260
|
)
|
||||
|
Share of income / (loss) of joint-ventures
|
19
|
2
|
|
(33
|
)
|
(29
|
)
|
||||
|
Income before income tax
|
82
|
|
222
|
|
49
|
|
|||||
|
Income tax expense
|
12
|
(18
|
)
|
(32
|
)
|
(80
|
)
|
||||
|
Net income / (loss)
|
64
|
|
190
|
|
(31
|
)
|
|||||
|
Income attributable to:
|
|||||||||||
|
Equity holders of Constellium
|
59
|
|
188
|
|
(31
|
)
|
|||||
|
Non-controlling interests
|
5
|
|
2
|
|
—
|
|
|||||
|
Net income / (loss)
|
64
|
|
190
|
|
(31
|
)
|
|||||
Earnings per share attributable to the equity holders of Constellium
|
(in Euros per share)
|
Notes
|
Year ended December 31, 2019
|
Year ended December 31, 2018
|
Year ended December 31, 2017
|
|||||||
|
Basic
|
13
|
0.43
|
|
1.40
|
|
(0.28
|
)
|
||||
|
Diluted
|
13
|
0.41
|
|
1.37
|
|
(0.28
|
)
|
||||
The accompanying Notes are an integral part of these Consolidated Financial Statements.
F-5
CONSOLIDATED STATEMENT OF COMPREHENSIVE INCOME / (LOSS)
|
(in millions of Euros)
|
Notes
|
Year ended December 31, 2019
|
Year ended December 31, 2018
|
Year ended December 31, 2017
|
|||||||
|
Net income / (loss)
|
64
|
|
190
|
|
(31
|
)
|
|||||
|
Other comprehensive income / (loss)
|
|||||||||||
|
Items that will not be reclassified subsequently to the consolidated income statement
|
|||||||||||
|
Remeasurement on post-employment benefit obligations
|
(61
|
)
|
24
|
|
12
|
|
|||||
|
Income tax on remeasurement on post-employment benefit obligations
|
13
|
|
(6
|
)
|
(8
|
)
|
|||||
|
Items that may be reclassified subsequently to the consolidated income statement
|
|||||||||||
|
Cash flow hedges
|
24
|
(8
|
)
|
(25
|
)
|
46
|
|
||||
|
Net investment hedges
|
24
|
4
|
|
(4
|
)
|
—
|
|
||||
|
Income tax on hedges
|
20
|
2
|
|
8
|
|
(15
|
)
|
||||
|
Currency translation differences
|
1
|
|
10
|
|
(20
|
)
|
|||||
|
Other comprehensive (loss) / income
|
(49
|
)
|
7
|
|
15
|
|
|||||
|
Total comprehensive income / (loss)
|
15
|
|
197
|
|
(16
|
)
|
|||||
|
Attributable to:
|
|||||||||||
|
Equity holders of Constellium
|
10
|
|
195
|
|
(15
|
)
|
|||||
|
Non-controlling interests
|
5
|
|
2
|
|
(1
|
)
|
|||||
|
Total comprehensive income / (loss)
|
15
|
|
197
|
|
(16
|
)
|
|||||
The accompanying Notes are an integral part of these Consolidated Financial Statements.
F-6
|
(in millions of Euros)
|
Notes
|
At December 31, 2019
|
At December 31, 2018
|
|||||
|
Assets
|
||||||||
|
Current assets
|
||||||||
|
Cash and cash equivalents
|
14
|
184
|
|
164
|
|
|||
|
Trade receivables and other
|
15
|
474
|
|
587
|
|
|||
|
Inventories
|
16
|
670
|
|
660
|
|
|||
|
Other financial assets
|
23
|
22
|
|
30
|
|
|||
|
1,350
|
|
1,441
|
|
|||||
|
Non-current assets
|
||||||||
|
Property, plant and equipment
|
17
|
2,056
|
|
1,666
|
|
|||
|
Goodwill
|
18
|
455
|
|
422
|
|
|||
|
Intangible assets
|
18
|
70
|
|
70
|
|
|||
|
Investments accounted for under the equity method
|
19
|
1
|
|
1
|
|
|||
|
Deferred income tax assets
|
20
|
185
|
|
163
|
|
|||
|
Trade receivables and other
|
15
|
60
|
|
64
|
|
|||
|
Other financial assets
|
23
|
7
|
|
74
|
|
|||
|
2,834
|
|
2,460
|
|
|||||
|
Total Assets
|
4,184
|
|
3,901
|
|
||||
|
Liabilities
|
||||||||
|
Current liabilities
|
||||||||
|
Trade payables and other
|
21
|
999
|
|
968
|
|
|||
|
Borrowings
|
22
|
201
|
|
57
|
|
|||
|
Other financial liabilities
|
23
|
35
|
|
60
|
|
|||
|
Income tax payable
|
14
|
|
8
|
|
||||
|
Provisions
|
26
|
23
|
|
46
|
|
|||
|
1,272
|
|
1,139
|
|
|||||
|
Non-current liabilities
|
||||||||
|
Trade payables and other
|
21
|
21
|
|
27
|
|
|||
|
Borrowings
|
22
|
2,160
|
|
2,094
|
|
|||
|
Other financial liabilities
|
23
|
23
|
|
29
|
|
|||
|
Pension and other post-employment benefit obligations
|
25
|
670
|
|
610
|
|
|||
|
Provisions
|
26
|
99
|
|
94
|
|
|||
|
Deferred income tax liabilities
|
20
|
24
|
|
22
|
|
|||
|
2,997
|
|
2,876
|
|
|||||
|
Total Liabilities
|
4,269
|
|
4,015
|
|
||||
|
Equity
|
||||||||
|
Share capital
|
28
|
3
|
|
3
|
|
|||
|
Share premium
|
28
|
420
|
|
420
|
|
|||
|
Retained deficit and other reserves
|
(519
|
)
|
(545
|
)
|
||||
|
Equity attributable to equity holders of Constellium
|
(96
|
)
|
(122
|
)
|
||||
|
Non controlling interests
|
11
|
|
8
|
|
||||
|
Total Equity
|
(85
|
)
|
(114
|
)
|
||||
|
Total Equity and Liabilities
|
4,184
|
|
3,901
|
|
||||
The accompanying Notes are an integral part of these Consolidated Financial Statements.
F-7
CONSOLIDATED STATEMENT OF CHANGES IN EQUITY
|
(in millions of Euros)
|
|
Share capital
|
|
Share premium
|
|
Re-
measurement |
|
Cash flow hedges and net investment hedges
|
|
Foreign currency translation reserve
|
|
Other reserves
|
|
Retained losses
|
|
Total Equity holders of Constellium
|
|
Non-controlling interests
|
|
Total equity
|
||||||||||
|
At January 1, 2019
|
|
3
|
|
|
420
|
|
|
(129
|
)
|
|
(8
|
)
|
|
3
|
|
|
37
|
|
|
(448
|
)
|
|
(122
|
)
|
|
8
|
|
|
(114
|
)
|
|
Net income
|
|
—
|
|
|
—
|
|
|
—
|
|
|
—
|
|
|
—
|
|
|
—
|
|
|
59
|
|
|
59
|
|
|
5
|
|
|
64
|
|
|
Other comprehensive (loss) / income
|
|
—
|
|
|
—
|
|
|
(48
|
)
|
|
(2
|
)
|
|
1
|
|
|
—
|
|
|
—
|
|
|
(49
|
)
|
|
—
|
|
|
(49
|
)
|
|
Total comprehensive (loss) / income
|
|
—
|
|
|
—
|
|
|
(48
|
)
|
|
(2
|
)
|
|
1
|
|
|
—
|
|
|
59
|
|
|
10
|
|
|
5
|
|
|
15
|
|
|
Transactions with equity holders
|
|
|
|
|
|
|
|
|
|
|
|
|
|
|
|
|
|
|
|
|
|
|
|
|
|
|
|
|
|
|
|
Share-based compensation
|
|
—
|
|
|
—
|
|
|
—
|
|
|
—
|
|
|
—
|
|
|
16
|
|
|
—
|
|
|
16
|
|
|
—
|
|
|
16
|
|
|
Transactions with non-controlling interests
|
|
—
|
|
|
—
|
|
|
—
|
|
|
—
|
|
|
—
|
|
|
—
|
|
|
—
|
|
|
—
|
|
|
(2
|
)
|
|
(2
|
)
|
|
At December 31, 2019
|
|
3
|
|
|
420
|
|
|
(177
|
)
|
|
(10
|
)
|
|
4
|
|
|
53
|
|
|
(389
|
)
|
|
(96
|
)
|
|
11
|
|
|
(85
|
)
|
|
(in millions of Euros)
|
|
Share capital
|
|
Share premium
|
|
Re-
measurement |
|
Cash flow hedges and net investment hedges
|
|
Foreign currency translation reserve
|
|
Other reserves
|
|
Retained losses
|
|
Total Equity holders of Constellium
|
|
Non-controlling interests
|
|
Total equity
|
||||||||||
|
At January 1, 2018
|
|
3
|
|
|
420
|
|
|
(147
|
)
|
|
13
|
|
|
(7
|
)
|
|
25
|
|
|
(634
|
)
|
|
(327
|
)
|
|
8
|
|
|
(319
|
)
|
|
Change in accounting policies
|
|
—
|
|
|
—
|
|
|
—
|
|
|
—
|
|
|
—
|
|
|
—
|
|
|
(2
|
)
|
|
(2
|
)
|
|
—
|
|
|
(2
|
)
|
|
At January 1, 2018, restated
|
|
3
|
|
|
420
|
|
|
(147
|
)
|
|
13
|
|
|
(7
|
)
|
|
25
|
|
|
(636
|
)
|
|
(329
|
)
|
|
8
|
|
|
(321
|
)
|
|
Net income
|
|
—
|
|
|
—
|
|
|
—
|
|
|
—
|
|
|
—
|
|
|
—
|
|
|
188
|
|
|
188
|
|
|
2
|
|
|
190
|
|
|
Other comprehensive income / (loss)
|
|
—
|
|
|
—
|
|
|
18
|
|
|
(21
|
)
|
|
10
|
|
|
—
|
|
|
—
|
|
|
7
|
|
|
—
|
|
|
7
|
|
|
Total comprehensive income / (loss)
|
|
—
|
|
|
—
|
|
|
18
|
|
|
(21
|
)
|
|
10
|
|
|
—
|
|
|
188
|
|
|
195
|
|
|
2
|
|
|
197
|
|
|
Transactions with equity holders
|
|
|
|
|
|
|
|
|
|
|
|
|
|
|
|
|
|
|
|
|
|
|
|
|
|
|
|
|
|
|
|
Share issuance
|
|
—
|
|
|
—
|
|
|
—
|
|
|
—
|
|
|
—
|
|
|
—
|
|
|
—
|
|
|
—
|
|
|
—
|
|
|
—
|
|
|
Share-based compensation
|
|
—
|
|
|
—
|
|
|
—
|
|
|
—
|
|
|
—
|
|
|
12
|
|
|
—
|
|
|
12
|
|
|
—
|
|
|
12
|
|
|
Transactions with non-controlling interests
|
|
—
|
|
|
—
|
|
|
—
|
|
|
—
|
|
|
—
|
|
|
—
|
|
|
—
|
|
|
—
|
|
|
(2
|
)
|
|
(2
|
)
|
|
At December 31, 2018
|
|
3
|
|
|
420
|
|
|
(129
|
)
|
|
(8
|
)
|
|
3
|
|
|
37
|
|
|
(448
|
)
|
|
(122
|
)
|
|
8
|
|
|
(114
|
)
|
|
(in millions of Euros)
|
Share capital
|
Share premium
|
Re-
measurement |
Cash flow hedges
|
Foreign currency translation reserve
|
Other reserves
|
Retained losses
|
Total Equity holders of Constellium
|
Non-controlling interests
|
Total equity
|
||||||||||||||||||||
|
At January 1, 2017
|
2
|
|
162
|
|
(151
|
)
|
(18
|
)
|
12
|
|
17
|
|
(603
|
)
|
(579
|
)
|
9
|
|
(570
|
)
|
||||||||||
|
Net loss
|
—
|
|
—
|
|
—
|
|
—
|
|
—
|
|
—
|
|
(31
|
)
|
(31
|
)
|
—
|
|
(31
|
)
|
||||||||||
|
Other comprehensive income / (loss)
|
—
|
|
—
|
|
4
|
|
31
|
|
(19
|
)
|
—
|
|
—
|
|
16
|
|
(1
|
)
|
15
|
|
||||||||||
|
Total comprehensive income / (loss)
|
—
|
|
—
|
|
4
|
|
31
|
|
(19
|
)
|
—
|
|
(31
|
)
|
(15
|
)
|
(1
|
)
|
(16
|
)
|
||||||||||
|
Transactions with equity holders
|
|
|
|
|
|
|
|
|
|
|
|
|
|
|
|
|
|
|
|
|
||||||||||
|
Share issuance
|
1
|
|
258
|
|
—
|
|
—
|
|
—
|
|
—
|
|
—
|
|
259
|
|
—
|
|
259
|
|
||||||||||
|
Share-based compensation
|
—
|
|
—
|
|
—
|
|
—
|
|
—
|
|
8
|
|
—
|
|
8
|
|
—
|
|
8
|
|
||||||||||
|
Transactions with non-controlling interests
|
—
|
|
—
|
|
—
|
|
—
|
|
—
|
|
—
|
|
—
|
|
—
|
|
—
|
|
—
|
|
||||||||||
|
At December 31, 2017
|
3
|
|
420
|
|
(147
|
)
|
13
|
|
(7
|
)
|
25
|
|
(634
|
)
|
(327
|
)
|
8
|
|
(319
|
)
|
||||||||||
The accompanying Notes are an integral part of these Consolidated Financial Statements.
F-8
|
(in millions of Euros)
|
Notes
|
Year ended December 31, 2019
|
Year ended December 31, 2018
|
Year ended December 31, 2017
|
|||||||
|
Net income / (loss)
|
64
|
|
190
|
|
(31
|
)
|
|||||
|
Adjustments
|
|||||||||||
|
Depreciation and amortization
|
17, 18
|
256
|
|
197
|
|
171
|
|
||||
|
Finance costs - net
|
11
|
175
|
|
149
|
|
260
|
|
||||
|
Income tax expense
|
12
|
18
|
|
32
|
|
80
|
|
||||
|
Share of (income) / loss of joint-ventures
|
19
|
(2
|
)
|
33
|
|
29
|
|
||||
|
Unrealized (gains) / losses on derivatives - net and from remeasurement of monetary assets and liabilities - net
|
(33
|
)
|
86
|
|
(54
|
)
|
|||||
|
Losses / (gains) on disposal
|
9
|
3
|
|
(186
|
)
|
3
|
|
||||
|
Other - net
|
16
|
|
14
|
|
7
|
|
|||||
|
Interest paid
|
(158
|
)
|
(129
|
)
|
(185
|
)
|
|||||
|
Income tax paid
|
(6
|
)
|
(23
|
)
|
(18
|
)
|
|||||
|
Change in trade working capital
|
|||||||||||
|
Inventories
|
57
|
|
(9
|
)
|
(99
|
)
|
|||||
|
Trade receivables
|
104
|
|
(145
|
)
|
(91
|
)
|
|||||
|
Trade payables
|
(31
|
)
|
(27
|
)
|
124
|
|
|||||
|
Margin calls
|
5
|
|
(5
|
)
|
—
|
|
|||||
|
Change in provisions and pension obligations
|
(25
|
)
|
(58
|
)
|
(24
|
)
|
|||||
|
Other working capital
|
4
|
|
(53
|
)
|
(12
|
)
|
|||||
|
Net cash flows from operating activities
|
447
|
|
66
|
|
160
|
|
|||||
|
Purchases of property, plant and equipment
|
5
|
(271
|
)
|
(277
|
)
|
(276
|
)
|
||||
|
Acquisition of subsidiaries net of cash acquired
|
(83
|
)
|
—
|
|
—
|
|
|||||
|
Proceeds from disposals, net of cash
|
2
|
|
200
|
|
2
|
|
|||||
|
Equity contribution and loan to joint ventures
|
—
|
|
(24
|
)
|
(41
|
)
|
|||||
|
Other investing activities
|
(1
|
)
|
10
|
|
23
|
|
|||||
|
Net cash flows used in investing activities
|
(353
|
)
|
(91
|
)
|
(292
|
)
|
|||||
|
Net proceeds received from issuance of shares
|
—
|
|
—
|
|
259
|
|
|||||
|
Proceeds from issuance of Senior Notes
|
22
|
—
|
|
—
|
|
1,440
|
|
||||
|
Repayment of Senior Notes
|
22
|
(100
|
)
|
—
|
|
(1,559
|
)
|
||||
|
Lease repayments
|
22
|
(86
|
)
|
(15
|
)
|
(13
|
)
|
||||
|
Proceeds / (repayments) from revolving credit facilities and other loans
|
22
|
109
|
|
(68
|
)
|
29
|
|
||||
|
Payment of deferred financing costs and exit fees
|
—
|
|
—
|
|
(118
|
)
|
|||||
|
Transactions with non-controlling interests
|
(4
|
)
|
—
|
|
—
|
|
|||||
|
Other financing activities
|
5
|
|
1
|
|
23
|
|
|||||
|
Net cash flows (used in) / from financing activities
|
(76
|
)
|
(82
|
)
|
61
|
|
|||||
|
Net increase / (decrease) in cash and cash equivalents
|
18
|
|
(107
|
)
|
(71
|
)
|
|||||
|
Cash and cash equivalents - beginning of year
|
164
|
|
269
|
|
347
|
|
|||||
|
Effect of exchange rate changes on cash and cash equivalents
|
2
|
|
2
|
|
(7
|
)
|
|||||
|
Cash and cash equivalents - end of year
|
14
|
184
|
|
164
|
|
269
|
|
||||
The accompanying Notes are an integral part of these Consolidated Financial Statements.
F-9
Notes to the Consolidated Financial Statements
Constellium is a global leader in the design and manufacture of a broad range of innovative specialty rolled and extruded aluminium products, serving primarily the packaging, aerospace and automotive end-markets. The Group has a strategic footprint of manufacturing facilities located in North America, Europe and China and operates
28
production facilities,
3
administrative centers and
3
R&D centers. The Group has approximately
13,200
employees.
Constellium SE (formerly Constellium N.V.) is a parent company of the Group. On June 28, 2019, the Company was converted from a Dutch public limited liability company (
Naamloze Vennootschap
, N.V.) into a Dutch
Societas Europaea
(SE) and changed its name from Constellium N.V. to Constellium SE. On December 12, 2019, Constellium SE completed the transfer of its head office from the Netherlands to France and became a French
Societas Europaea
(SE).
The business address (head office) of Constellium SE is
Washington Plaza, 40-
44 rue Washington, 75008 Paris, France.
Unless the context indicates otherwise, when we refer to “we”, “our”, “us”, “Constellium”, the “Group” and the “Company” in this document, we are referring to Constellium SE and its subsidiaries.
2.1 Statement of compliance
The Consolidated Financial Statements of Constellium SE and its subsidiaries have been prepared in accordance with International Financial Reporting Standards (IFRS) as issued by the International Accounting Standards Board (IASB) and as endorsed by the European Union (EU). The Group’s application of IFRS results in no difference between IFRS as issued by the IASB and IFRS as endorsed by the EU (https://ec.europa.eu/info/law/international-accounting-standards-regulation-ec-no-1606-2002_en).
The Consolidated Financial Statements were authorized for issue by the Board of Directors on March 9, 2020.
2.2 Application of new and revised IFRS
The Group has adopted IFRS 16 -
Leases
and IFRIC 23 -
Uncertainty over Income Tax treatment
effective January 1,
2019
.
Several other amendments and interpretations apply for the first time in
2019
, but do not have any impact on the Consolidated Financial Statements of the Group. The Group has not early adopted any other standard, interpretation or amendment that has been issued but is not yet effective.
IFRS 16 -
Leases
IFRS 16 -
Leases
deals with principles for the recognition, measurement, presentation and disclosures of leases. The standard provides an accounting model, requiring a lessee to recognize assets and liabilities for leases.
Right-of-use assets
The Group recognizes right-of-use assets at the commencement date of the lease. Right-of-use assets are measured at cost, less any accumulated depreciation and impairment losses, and are adjusted for remeasurement of lease liabilities resulting from a change in future lease payments arising from a change in an index or a rate, or a change in the assessment of whether the purchase, extension or termination options will be exercised.
The cost of right-of-use assets includes the amount of lease liabilities recognized, initial direct costs incurred, and lease payments made at or before the commencement date less any lease incentives received. Unless the Group is reasonably certain to obtain ownership of the leased asset at the end of the lease term, the recognized right-of-use assets are depreciated on a straight-line basis over the shorter of its estimated useful life and the lease term. Right-of-use assets are subject to impairment.
Lease liabilities
F-10
At the commencement date of the lease, the Group recognizes a lease liability measured at the present value of lease payments to be made over the lease term. The lease payments include fixed payments less any lease incentive receivables, variable lease payments that depend on an index or a rate, and amounts expected to be paid under residual value guarantees. The lease payments also include the exercise price of a purchase option reasonably certain to be exercised by the Group and payments of penalties for terminating a lease, if the lease term reflects the Group exercising the option to terminate. Variable lease payments that do not depend on an index or a rate are recognized as expense in the period in which the event or condition that triggers the payment occurs.
In calculating the present value of lease payments, the Group uses the incremental borrowing rate at the lease commencement date if the implicit interest rate in the lease is not readily determinable. After the commencement date, the amount of lease liabilities is increased to reflect the accretion of interest and reduced by the lease payments made. In addition, the carrying amount of lease liabilities is remeasured if there is a modification, a change in the lease term, or a change in the assessment to purchase the underlying asset.
Short-term leases and leases of low-value assets
The Group applies the short-term lease recognition exemption to leases that have a lease term of 12 months or less from the commencement date and which do not contain a purchase option. The Group also applies the low-value asset recognition exemption to leases of assets with a value below
€5,000
. Lease payments on short-term leases and low-value asset leases are recognized as expense on a straight-line basis over the lease term.
The standard replaced IAS 17 -
Leases
and is effective for accounting periods beginning on or after January 1, 2019. The Group adopted IFRS 16 retrospectively with the cumulative effect of initially applying the standard recognized at the initial date of application. The Group elected to apply the practical expedients for low-value assets, short-term leases and lease and non-lease components as a single component. In addition, the Group elected for the relief provision of IFRS 16 and did not apply IFRS 16 to contracts that were not previously identified as containing a lease under IAS 17 and IFRIC 4.
On January 1, 2019, the Group recognized lease liabilities for
€102 million
and corresponding right-of-use assets for
€102 million
for leases previously accounted for as operating leases, excluding initial direct costs, based on an average incremental borrowing rate of
7.6%
and
no
cumulative effect adjustment to the opening balance of retained earnings was recognized.
|
(in millions of Euros)
|
Carrying amount
December 31, 2018 |
IFRS16 impact
|
Carrying amount
January 1, 2019 |
||||||
|
Property, plant and equipment
|
1,666
|
|
102
|
|
1,768
|
|
|||
|
Borrowings
|
(2,151
|
)
|
(102
|
)
|
(2,253
|
)
|
|||
As of December 31, 2018, commitments for leases previously accounted for as operating leases amounted to
€133 million
. The difference compared to the lease liabilities recognized as of January 1, 2019 is primarily explained by the impact of discounting and the recognition of short-term leases and low-value asset leases on a straight-line basis as expense, partially offset by adjustments as a result of extension options.
IFRIC 23 -
Uncertainty over Income Tax treatment
This interpretation provides guidance on how to determine an entity’s taxable result where there is uncertainty over whether tax positions taken by an entity will be accepted by the tax authority. The recognition criteria is based on the assessment of whether the tax authority will accept a tax treatment, on a more-likely-than-not basis, assuming that the tax authority has full knowledge of all relevant information. Uncertain tax positions recognized are measured using either (i) the most likely amount between two possible outcomes or (ii) the weighted average amount of several possible outcomes (expected value), depending on which is thought to give a better prediction of the resolution of the uncertainty.
The Group adopted IFRIC 23 using the cumulative effect method of adoption at the date of initial application. There was
no
cumulative effect adjustment to the opening balance of retained earnings as of January 1, 2019.
The adoption of IFRIC 23 resulted in the reduction of provisions by
€20 million
to increase Income tax payable and reduce deferred income tax assets and current tax receivables at January 1, 2019.
F-11
2.3 New standards and interpretations not yet mandatorily applicable
The Group has not applied the following new standards and interpretations that have been issued but are not yet effective and which could affect the Group’s future Consolidated Financial Statements:
Amendments to IFRS 3: Definition of a Business
In October 2018, the IASB issued amendments to the definition of a business in IFRS 3 Business Combinations to help entities determine whether an acquired set of activities and assets is a business or not. They clarify the minimum requirements for a business, remove the assessment of whether market participants are capable of replacing any missing elements, add guidance to help entities assess whether an acquired process is substantive, narrow the definitions of a business and of outputs, and introduce an optional fair value concentration test.
Since the amendments apply prospectively to transactions or other events that occur on or after the date of first application, the Group will not be affected by these amendments on the date of transition.
Amendments to IAS 1 and IAS 8: Definition of Material
In October 2018, the IASB issued amendments to IAS 1 Presentation of Financial Statements and IAS 8 Accounting Policies, Changes in Accounting Estimates and Errors to align the definition of ‘material’ across the standards and to clarify certain aspects of the definition. The new definition states that, 'Information is material if omitting, misstating or obscuring it could reasonably be expected to influence decisions that the primary users of general purpose financial statements make on the basis of those financial statements, which provide financial information about a specific reporting entity.' The amendments to the definition of material is not expected to have a significant impact on the Group’s Consolidated Financial Statements.
The Group plans to adopt the new standards and interpretations on their required effective dates.
2.4 Basis of preparation
In accordance with IAS 1-
Presentation of Financial Statements
, the Consolidated Financial Statements are prepared on the assumption that Constellium is a going concern and will continue in operation for the foreseeable future.
The Group's financial position, its cash flows, liquidity position and borrowing facilities are described in the Consolidated Financial Statements in
NOTE 14 - Cash and Cash Equivalent
,
NOTE 22 - Borrowings
and
NOTE 24 - Financial Risk Management
.
The Group’s forecasts and projections, taking account of reasonably possible changes in trading performance, including an assessment of the current macroeconomic environment, indicate that the Group should be able to operate within the level of its current facilities and related covenants.
Accordingly, the Group continues to adopt the going concern basis in preparing the Consolidated Financial Statements. Management considers that this assumption is not invalidated by the Group’s negative equity at December 31, 2019. This assessment was confirmed by the Board of Directors on March 5, 2020.
2.5 Presentation of the operating performance of each operating segment and of the Group
In accordance with IFRS 8 -
Operating Segments
, operating segments are based upon the product lines, markets and industries served, and are reported in a manner consistent with the internal reporting provided to the chief operating decision-maker (“CODM”). The CODM, who is responsible for allocating resources and assessing performance of the operating segments, has been identified as the Chief Executive Officer.
Constellium’s CODM measures the profitability and financial performance of its operating segments based on Adjusted EBITDA as it illustrates the underlying performance of continuing operations by excluding certain non-recurring and non-operating items. Adjusted EBITDA is defined as income / (loss) from continuing operations before income taxes, results from joint ventures, net finance costs, other expenses and depreciation and amortization as adjusted to exclude restructuring costs, impairment charges, unrealized gains or losses on derivatives and on foreign exchange differences on transactions that do not qualify for hedge accounting, metal price lag, share-based compensation expense, effects of certain purchase accounting adjustments, start-up and development costs or acquisition, integration and separation costs, certain incremental costs and other exceptional, unusual or generally non-recurring items.
F-12
2.6 Principles governing the preparation of the Consolidated Financial Statement
Basis of consolidation
These Consolidated Financial Statements include all the assets, liabilities, equity, revenues, expenses and cash flows of the entities and businesses controlled by Constellium. All intercompany transactions and balances are eliminated.
Subsidiaries are entities over which the Group has control. The Group controls an entity when the Group has power over the investee, is exposed to, or has rights to variable returns from its involvement in the entity and has the ability to affect those returns through its power over the entity.
Subsidiaries are fully consolidated from the date on which control is transferred to the Group. They are deconsolidated from the date that control ceases.
Investments over which the Group has significant influence are accounted for under the equity method. Investments over which the Group has joint control are accounted for either as joint ventures under the equity method or as joint arrangements in relation to their interest in the joint operation.
Joint venture investments are initially recorded at cost. They are subsequently increased or decreased by the Group’s share in the profit or loss, or by other movements reflected directly in the equity of the entity.
Business combinations
The Group applies the acquisition method to account for business combinations.
The consideration transferred for the acquisition of a subsidiary is the fair value of the assets transferred, the liabilities assumed and the equity interests issued by the Group. The consideration transferred includes the fair value of any asset or liability resulting from a contingent consideration arrangement. Identifiable assets acquired and liabilities and contingent liabilities assumed in a business combination are measured initially at their fair values at the acquisition date. The amount of non-controlling interests is determined for each business combination and is either based on the fair value (full goodwill method) or the present ownership instruments’ proportionate share in the recognized amounts of the acquiree’s identifiable net assets, resulting in recognition of only the share of goodwill attributable to equity holders of the parent (partial goodwill method).
Goodwill is initially measured as the excess of the aggregate of the consideration transferred and the amount of non-controlling interest over the net identifiable assets acquired and liabilities assumed. If this consideration is lower than the fair value of the net assets of the subsidiary acquired, the difference is recognized as a gain in Other gains / (losses) - net in the Consolidated Income Statement.
At the acquisition date, the Group recognizes the identifiable acquired assets, liabilities and contingent liabilities (identifiable net assets) of the subsidiaries on the basis of fair value at the acquisition date.
Recognized assets and liabilities may be adjusted during a maximum of 12 months from the acquisition date, depending on new information obtained about the facts and circumstances existing at the acquisition date.
Significant assumptions used in determining allocation of fair value include the following valuation techniques: the cost approach, the income approach and the market approach which are determined based on cash flow projections and related discount rates, industry indices, market prices regarding replacement cost and comparable market transactions.
Acquisition related costs are expensed as incurred and are included in
Other gains / (losses) - net
in the Consolidated Income Statement.
Cash-generating units
The reporting units, which generally correspond to industrial sites, are the lowest level of the Group’s internal reporting and have been identified as cash-generating units.
F-13
Goodwill
Goodwill arising from a business combination is carried at cost as established at the date of the business combination less accumulated impairment losses, if any.
Goodwill is allocated at the operating segment levels which are the groups of cash-generating units that are expected to benefit from the synergies of the combination. The operating segments represent the lowest level within the Group at which goodwill is monitored for internal management purposes.
Gains and losses on the disposal of a cash-generating unit include the carrying amount of goodwill relating to the cash-generating unit sold.
Impairment of goodwill
A group of cash-generating units to which goodwill is allocated is tested for impairment annually, or more frequently when there is an indication that the group of units may be impaired.
The net carrying value of a group of cash-generating units is compared to its recoverable amount, which is the higher of the value in use and the fair value less cost of disposal.
Value in use calculations use cash flow projections based on financial budgets approved by management and usually covering a 5-year period. Cash flows beyond this period are estimated using a perpetual long-term growth rate for the subsequent years.
The value in use is the sum of discounted cash flows over the projected period and the terminal value. Discount rates are determined based on the weighted-average cost of capital of each operating segment.
The fair value is the price that would be received for the group of cash-generating units, in an orderly transaction, from a market participant. This value is estimated on the basis of available and relevant market data or a discounted cash flow model reflecting market participant assumptions.
An impairment loss is recognized for the amount by which the group of units carrying amount exceeds its recoverable amount.
Any impairment loss is allocated first to reduce the carrying amount of any goodwill allocated to the group of cash-generating units and then, to the other assets of the group of units pro rata on the basis of the carrying amount of each asset in the group of units.
Any impairment loss is recognized in the line Impairment in the Consolidated Income Statement. An impairment loss recognized for goodwill cannot be reversed in subsequent years.
Non-current assets and disposal groups classified as held for sale & Discontinued operations
IFRS 5 -
Non-current Assets Held for Sale and Discontinued Operations
defines a discontinued operation as a component of an entity that (i) generates cash flows that are largely independent from cash flows generated by other components, (ii) is classified as held for sale or has been disposed of, and (iii) represents a separate major line of business or geographic areas of operations.
Assets and liabilities are classified as held for sale when their carrying amount will be recovered principally through a sale transaction rather than through continuing use. This condition is regarded as met only when the sale is highly probable and the non-current asset or disposal group is available for immediate sale in its present condition.
Assets and liabilities are stated at the lower of carrying amount and fair value less costs to sell if their carrying amount is to be recovered principally through a sale transaction rather than through continuing use.
Assets and liabilities held for sale are presented in separate lines in the Consolidated Statement of Financial Position of the year during which the decision to sell is made.
F-14
The results of discontinued operations are shown separately in the Consolidated Income Statement and Consolidated Statement of Cash Flows.
Foreign currency transactions and foreign operations
Functional currency
Items included in the Consolidated Financial Statements of each of the entities and businesses of Constellium are measured using the currency of the primary economic environment in which each of them operates (their functional currency).
Foreign currency transactions
Transactions denominated in currencies other than the functional currency are recorded in the functional currency at the exchange rate in effect at the date of the transaction. Foreign exchange gains and losses resulting from the settlement of such transactions and from the translation at year-end exchange rates of monetary assets and liabilities denominated in foreign currencies are recognized in the Consolidated Income Statement, except when deferred in other comprehensive income as qualifying cash flow hedges and qualifying net investment hedges. Foreign exchange gains and losses that relate to borrowings and cash and cash equivalents are presented within
Finance costs - net
.
Realized foreign exchange gains and losses that relate to commercial transactions are presented in
Cost of sales
. All other foreign exchange gains and losses, including those that relate to foreign currency derivatives hedging commercial transactions where hedge accounting has not been applied, are presented within
Other gains / (losses) - net
.
Foreign operations: presentation currency and foreign currency translation
In the preparation of the Consolidated Financial Statements, the year-end balances of assets, liabilities and components of equity of Constellium’s entities and businesses are translated from their functional currencies into Euros, the presentation currency of the Group, at their respective year-end exchange rates. Revenue, expenses and cash flows of Constellium’s entities and businesses are translated from their functional currencies into Euros using their respective average exchange rates for the year.
The net differences arising from exchange rate translation are recognized in the Consolidated Statement of Comprehensive Income / (Loss).
The following table summarizes the main exchange rates used for the preparation of the Consolidated Financial Statements :
|
Foreign exchange rate for 1 Euro
|
Year ended December 31, 2019
|
Year ended December 31, 2018
|
Year ended December 31, 2017
|
|||||||||||||||
|
Average rate
|
Closing rate
|
Average rate
|
Closing rate
|
Average rate
|
Closing rate
|
|||||||||||||
|
U.S. Dollars
|
USD
|
1.1193
|
|
1.1234
|
|
1.1798
|
|
1.1450
|
|
1.1273
|
|
1.1993
|
|
|||||
|
Swiss Francs
|
CHF
|
1.1121
|
|
1.0854
|
|
1.1546
|
|
1.1269
|
|
1.1103
|
|
1.1702
|
|
|||||
|
Czech Koruna
|
CZK
|
25.6698
|
|
25.4080
|
|
25.6452
|
|
25.7240
|
|
26.3151
|
|
25.5349
|
|
|||||
Revenue from Contracts with Customers
Under IFRS 15, revenue is recognized in an amount that reflects the consideration to which an entity expects to be entitled in exchange for transferring goods or services to a customer.
The Group primarily contracts with customers for the sale of rolled or extruded aluminium products. For the majority of our business, performance obligations with customers begin when we acknowledge a purchase order for a specific customer order of product to be delivered in the near-term. These purchase orders are short-term in nature, although they may be governed by long-term multi-year frame agreements.
F-15
Revenue from product sales, measured at the fair value of the consideration received or receivable, should be recognized at the point in time when control of the asset is transferred to the customer, generally upon delivery. In certain limited circumstances, the Group may be required to recognize revenue over time for products that have no alternative use and for which the Group has an enforceable right to payment for production completed to date.
Revenue from product sales, net of trade discounts, allowances and volume-based incentives, is recognized for the amount the Group expects to be entitled to, generally upon delivery, and provided persuasive evidence that control has transferred.
Contract liabilities consist of expected volume discounts, rebates, incentives, refunds and penalties and price concessions. Contract liabilities are presented in Trade payables and other.
Research and development costs
Costs incurred on development projects are recognized as intangible assets when the following criteria are met:
|
–
|
It is technically feasible to complete the intangible asset so that it will be available for use;
|
|
–
|
Management intends to complete and use the intangible asset;
|
|
–
|
There is an ability to use the intangible asset;
|
|
–
|
It can be demonstrated how the intangible asset will generate probable future economic benefits;
|
|
–
|
Adequate technical, financial and other resources to complete the development and use or sell the intangible asset are available; and
|
|
–
|
The expenditure attributable to the intangible asset during its development can be reliably measured.
|
Development expenditures that do not meet these criteria are expensed as incurred. Development costs previously recognized as expenses cannot be recognized as an asset in a subsequent period.
Other gains / (losses) - net
Other gains / (losses) - net include: (i) realized and unrealized gains and losses on derivatives contracted for commercial purposes and accounted for at fair value through profit or loss, (ii) unrealized exchange gains and losses from the remeasurement of monetary assets and liabilities and (iii) the ineffective portion of changes in fair value of derivatives, which are designated for hedge accounting.
Other gains / (losses) - net separately identifies other unusual, infrequent or non-recurring items. Such items are those that, in management’s judgment, need to be disclosed by virtue of their size, nature or incidence. In determining whether an event or transaction is specific, management considers quantitative as well as qualitative factors such as the frequency or predictability of occurrence.
Interest income and expense
Interest income is recorded using the effective interest rate method on loans receivables and on the interest bearing components of cash and cash equivalents.
Interest expense on short and long-term financing is recorded at the relevant rates on the various borrowing agreements.
Borrowing costs (including interest) incurred for the construction of any qualifying asset are capitalized during the period of time required to complete and prepare the asset for its intended use.
Share-based payment arrangements
Equity-settled share-based payments to employees and Board members providing similar services are measured at the fair value of the equity instruments at the grant date.
F-16
The fair value determined at the grant date is expensed on a straight-line basis over the vesting period, based on the Group’s estimate of equity instruments that will eventually vest, with a corresponding increase in equity. At the end of each reporting year, the Group revises its estimate of the number of equity instruments expected to vest.
Property, plant and equipment
Recognition and measurement
Property, plant and equipment acquired by the Company are recorded at cost, which comprises the purchase price, including import duties and non-refundable purchase taxes, any costs directly attributable to bringing the asset to the location and condition necessary for it to be capable of operating in the manner intended by management and the estimated close down and restoration costs associated with the asset. Borrowing costs, including interests, directly attributable to the acquisition or construction of a Property, plant and equipment are included in the cost. Subsequent to the initial recognition, Property, plant and equipment are measured at cost less accumulated depreciation and impairment, if any. Costs are capitalized into construction work-in-progress until such projects are completed and the assets are available for use.
Subsequent costs
Enhancements and replacements are capitalized as additions to Property, plant and equipment only when it is probable that future economic benefits associated with them will flow to the Company and the cost of the item can be measured with reliability. Ongoing regular maintenance costs related to Property, plant and equipment are expensed as incurred.
Depreciation
Land is not depreciated. Property, plant and equipment are depreciated over the estimated useful lives of the related assets using the straight-line method as follows:
|
–
|
Buildings
10
–
50
years;
|
|
–
|
Machinery and equipment
3
–
40
years;
|
|
–
|
Vehicles
5
–
8
years.
|
Intangible assets
Recognition and measurement
Technology and customer relationships acquired in a business combination are recognized at fair value at the acquisition date. Following initial recognition, intangible assets are carried at cost less any accumulated amortization and impairment losses. The useful lives of the Group intangible assets are assessed to be finite.
Amortization
Intangible assets are amortized over the estimated useful lives of the related assets using the straight-line method as follows:
|
–
|
Technology
20
years;
|
|
–
|
Customer relationships
25
years;
|
|
–
|
Software
3
–
5
years.
|
Impairment of property, plant and equipment and intangible assets
Property, plant and equipment and intangible assets subject to amortization are reviewed for impairment if there is any indication that the carrying amount of the asset (or cash-generating unit to which it belongs) may not be recoverable. The recoverable amount is based on the higher of fair value less cost of disposal (market value) and value in use (determined using estimates of discounted future net cash flows of the asset or group of assets to which it belongs).
F-17
Any impairment loss is recognized in the line Impairment in the Consolidated Income Statement.
Financial Instruments
|
i.
|
Classification and measurement
|
|
•
|
Financial assets
|
Financial assets are classified either: (a) at amortized cost, (b) at fair value through other comprehensive income (FVOCI), or (c) at fair value through profit or loss (FVPL). The classification depends on the financial asset’s contractual cash flow characteristics and the Group’s business model for managing the financial assets. Management determines the classification of Constellium’s financial assets at initial recognition.
|
i.
|
Assets at amortized cost are comprised of other receivables, non-current loans receivable and current loans receivable in the Consolidated Statement of Financial Position. They are held within a business model whose objective is to hold assets in order to collect contractual cash flows provided they give rise to cash flows that are ‘solely payments of principal and interest’ on the principal amount outstanding. They are carried at amortized cost using the effective interest rate method, less any impairment. They are classified as current or non-current assets based on their maturity date.
|
|
ii.
|
Assets at fair value through OCI are comprised of trade receivables in the Consolidated Statement of Financial Position. The business model is to maintain liquidity for the Group, should the need arise, which leads to sales through factoring agreements that are more than infrequent and significant in value. Therefore, trade receivables are managed under an objective that results in both collecting the contractual cash flows and selling the receivables to the factors. The portfolio of trade receivables is therefore classified as measured at fair value through OCI. Foreign exchange revaluation and impairment losses or reversals are recognized in profit or loss and computed in the same manner as for financial assets measured at amortized cost. The remaining fair value changes are recognized in OCI. Upon derecognition, the cumulative fair value change recognized in OCI is recycled to profit or loss. These assets are classified as current or non-current assets based on their maturity date.
|
|
iii.
|
Assets at fair value through profit or loss are comprised of derivatives except when designated as hedging instruments in a hedging relationship that qualifies for hedge accounting in accordance with IAS 39, ‘Financial instruments’. Financial assets carried at fair value through profit or loss are initially recognized at fair value and transaction costs are expensed in the Consolidated Income Statement.
|
|
•
|
Financial liabilities
|
Borrowings and other financial liabilities (excluding derivative liabilities) are recognized initially at fair value, net of transaction costs incurred and directly attributable to the issuance of the liability. These financial liabilities are subsequently measured at amortized cost using the effective interest rate method. Any difference between the amounts originally received (net of transaction costs) and the redemption value is recognized in the Consolidated Income Statement using the effective interest rate method.
|
ii.
|
Impairment of financial assets
|
Financial assets subject to IFRS 9’s expected credit loss model includes: cash and cash equivalents, trade receivables and other and loans to joint ventures.
|
iii.
|
Offsetting financial instruments
|
Financial assets and liabilities are offset and the net amount reported in the Consolidated Statement of Financial Position when there is a legally enforceable right to offset the recognized amounts and there is an intention to settle on a net basis or realize the asset and settle the liability simultaneously.
Derivatives financial instruments
Derivatives are initially recognized at fair value on the date a derivative contract is entered into and are subsequently re-measured to their fair value at the end of each reporting period. The accounting for subsequent changes in fair value depends on
F-18
whether the derivative is designated as a hedging instrument for accounting purposes, and if so, the nature of the item being hedged.
Fair value is the price that would be received to sell an asset or paid to transfer a liability in an orderly transaction between market participants at the measurement date. Where available, relevant market prices are used to determine fair values. The Group periodically estimates the impact of credit risk on its derivatives instruments aggregated by counterparties and takes it into account when estimating the fair value of its derivatives.
Credit Value Adjustments are calculated for asset derivatives based on Constellium counterparties credit risk. Debit Value Adjustments are calculated for credit derivatives based on Constellium's own credit risk. The fair value method used is based on historical probability of default, provided by leading rating agencies.
For derivative instruments that do not qualify for hedge accounting, changes in the fair value are recognized immediately in profit or loss and are included in ‘
Other gains / (losses) - net
’.
The Group did not adopt the disposition of IFRS 9 on hedging and will therefore continue to apply the provisions of IAS 39. For derivative instruments that are designated for hedge accounting, the group documents at the inception of the hedging transaction the relationship between hedging instruments and hedged items, as well as its risk management objective and strategy for undertaking the hedge transaction. The group also documents its assessment, both at hedge inception and on an ongoing basis, of whether the derivatives that are used in hedging transactions have been and will continue to be highly effective in offsetting changes in cash flows of hedged items.
The effective portion of changes in the fair value of derivatives that are designated and qualify as cash flow hedges is recognized in Other Comprehensive Income and accumulated in reserves in equity. The gain or loss relating to the ineffective portion is recognized immediately in the Consolidated Income Statement in ‘
Other gains / (losses) - net
’.
Amounts accumulated in equity are reclassified to the Consolidated Income Statement when the hedged item affects the Consolidated Income Statement. The gain or loss relating to the effective portion of derivative instruments hedging forecasted cash-flows under customer agreements is recognized in ‘
Revenue
’. When the forecasted transaction that is hedged results in the recognition of a non-financial asset, the gains and losses previously deferred in equity are reclassified from equity and included in the initial measurement of the cost of the asset. The deferred amounts would ultimately be recognized in the Consolidated Income Statement upon the sale, depreciation or impairment of the asset.
When a hedging instrument expires or is sold or terminated, or when a hedge no longer meets the criteria for hedge accounting, any cumulative gain or loss existing in equity at that time remains in equity and is recognized when the forecasted transaction is ultimately recognized in the Consolidated Income Statement. When a forecasted transaction is no longer expected to occur, the cumulative gain or loss that was recognized in equity is immediately reclassified to the Consolidated Income Statement.
Leases (Prior to January 1, 2019)
Constellium as the lessee
Leases in which a significant portion of the risks and rewards of ownership are retained by the lessor are classified as operating leases. Various buildings, machinery and equipment are leased from third parties under operating lease agreements. Under operating leases, lease payments are recognized as rent expense on a straight-line basis over the term of the lease agreement, and are included in Cost of sales or Selling and administrative expenses, depending on the nature of the leased assets.
Leases of property, plant and equipment under which the Group has substantially all the risks and rewards of ownership are classified as finance leases. Various buildings and equipment are leased from third parties under finance lease agreements. Under such finance leases, the asset financed is recognized in Property, plant and equipment and the financing is recognized as a financial liability, in Borrowings.
Constellium as the lessor
Certain land, buildings, machinery and equipment are leased to third parties under finance lease agreements. At lease inception, the net book value of the related assets is removed from Property, plant and equipment and a Finance lease receivable is recorded at the lower of the fair value and the aggregate future cash payments to be received from the lessee
F-19
computed at an interest rate implicit in the lease. As the Finance lease receivable from the lessee is due, interest income is recognized.
Inventories
Inventories are valued at the lower of cost and net realizable value, primarily on a weighted-average cost basis.
Weighted-average costs for raw materials, stores, work in progress and finished goods are calculated using the costs experienced in the current period based on normal operating capacity (and include the purchase price of materials, freight, duties and customs, the costs of production, which includes labor costs, materials and other expenses, that are directly attributable to the production process and production overheads).
Trade account receivables
Recognition and measurement
Trade account receivables are recognized at fair value through OCI since they are managed under an objective that results in both collecting the contractual cash flows and selling the receivables to the factors. The group applies the IFRS 9 simplified approach to measuring expected credit losses which uses a lifetime expected loss allowance for all trade receivables and contract assets.
Factoring arrangements
In non-recourse factoring arrangements, under which the Group has transferred substantially all the risks and rewards of ownership of the receivables, the receivables are derecognized from the Consolidated Statement of Financial Position. When trade account receivables are sold with limited recourse, and substantially all the risks and rewards associated with these receivables are not transferred, receivables are not derecognized. Where the entity does not derecognize the receivables, the cash received from the Factor is classified as a financing cash inflow, the derecognition of the related liability as a financing cash outflow and the settlement of the receivables as an operating cash inflow. Arrangements in which the Group derecognizes receivables result in changes in trade receivables which are reflected as cash flows from operating activities.
Cash and cash equivalents
Cash and cash equivalents are comprised of cash in bank accounts and on hand, short-term deposits held on call with banks and other short-term highly liquid investments with original maturities of three months or less that are readily convertible into known amounts of cash and are subject to insignificant risk of changes in value, less bank overdrafts that are repayable on demand, provided there is an offset right.
Share capital
Ordinary shares are classified as equity. Incremental costs directly attributable to the issue of new ordinary shares or options are shown in equity as a deduction, net of tax, from the proceeds.
Trade payables
Trade payables are initially recorded at fair value and classified as current liabilities if payment is due in one year or less.
Provisions
Provisions are recorded for the best estimate of expenditures required to settle liabilities of uncertain timing or amount when management determines that a legal or constructive obligation exists as a result of past events, it is probable that an outflow of resources will be required to settle the obligation, and such amounts can be reasonably estimated. Provisions are measured at the present value of the expected expenditures to be required to settle the obligation.
The ultimate cost to settle such liabilities is uncertain, and cost estimates can vary in response to many factors. The settlement of these liabilities could materially differ from recorded amounts. In addition, the expected timing of expenditure can also change. As a result, there could be significant adjustments to provisions, which could result in additional charges or recoveries affecting future financial results.
F-20
Types of liabilities for which the Group establishes provisions include:
Close down and restoration costs
Estimated close down and restoration costs are accounted for in the year when the legal or constructive obligation arising from the related disturbance occurs and it is probable that an outflow of resources will be required to settle the obligation. These costs are based on the net present value of estimated future costs. Provisions for close down and restoration costs do not include any additional obligations which are expected to arise from future disturbance. The costs are estimated on the basis of a closure plan including feasibility and engineering studies, are updated annually during the life of the operation to reflect known developments (e.g. revisions to cost estimates and to the estimated lives of operations) and are subject to formal review at regular intervals each year.
The initial closure provision together with subsequent movements in the provisions for close down and restoration costs, including those resulting from new disturbance, updated cost estimates, changes to the estimated lives of operations and revisions to discount rates are capitalized within Property, plant and equipment. These costs are then depreciated over the remaining useful lives of the related assets. The amortization or unwinding of the discount applied in establishing the net present value of the provisions is charged to the Consolidated Income Statement as a financing cost.
Environmental remediation costs
Environmental remediation costs are accounted for based on the estimated present value of the costs of the Group’s environmental clean-up obligations. Movements in the environmental clean-up provisions are presented as an operating cost within
Cost of sales
. Remediation procedures may commence soon after the time at which the disturbance, remediation process and estimated remediation costs become known, and can continue for many years depending on the nature of the disturbance and the technical remediation.
Restructuring costs
Provisions for restructuring are recorded when Constellium’s management is demonstrably committed to the restructuring plan and where such liabilities can be reasonably estimated. The Group recognizes liabilities that primarily include one-time termination benefits, or severance, and contract termination costs, primarily related to equipment and facility lease obligations. These amounts are based on the remaining amounts due under various contractual agreements, and are periodically adjusted for any anticipated or unanticipated events or changes in circumstances that would reduce or increase these obligations.
Legal, tax and other potential claims
Provisions for legal claims are made when it is probable that liabilities will be incurred and when such liabilities can be reasonably estimated. For asserted claims and assessments, liabilities are recorded when an unfavorable outcome of a matter is deemed to be probable and the loss is reasonably estimable. Management determines the likelihood of an unfavorable outcome based on many factors such as the nature of the matter, available defenses and case strategy, progress of the matter, views and opinions of legal counsel and other advisors, applicability and success of appeals, process and outcomes of similar historical matters, amongst others. Once an unfavorable outcome is considered probable, management weights the probability of possible outcomes and the most likely loss is recorded. Legal matters are reviewed on a regular basis to determine if there have been changes in management’s judgment regarding the likelihood of an unfavorable outcome or the estimate of a potential loss. Depending on their nature, these costs may be charged to the line
Cost of sales
or
Other gains / (losses) - net
in the Consolidated Income Statement. Included in other potential claims are provisions for product warranties and guarantees to settle the net present value portion of any settlement costs for potential future legal actions, claims and other assertions that may be brought by Constellium’s customers or the end-users of products. Provisions for product warranty and guarantees are charged to the line Cost of sales in the Consolidated Income Statement. When any legal action, claim or assertion related to product warranty or guarantee is settled, the net settlement amount incurred is charged against the provision established in the Consolidated Statement of Financial Position. The outstanding provision is reviewed periodically for adequacy and reasonableness by Constellium management.
Management establishes tax reserves and accrues interest thereon, if deemed appropriate, in expectation that certain tax positions other than income tax may be challenged and that the Group might not succeed in defending such positions, despite management’s belief that the positions taken were fully supportable.
F-21
Pension, other post-employment plans and other long-term employee benefits
For defined contribution plans, the contribution paid in respect of service rendered over the service year is recognized in the Consolidated Income Statement. This expense is included in
Cost of sales
,
Selling and administrative expenses
or
Research and development expenses
, depending on its nature.
For defined benefit plans, the retirement benefit obligation recognized in the Consolidated Statement of Financial Position represents the present value of the defined benefit obligation as reduced by the fair value of plan assets. The effects of changes in actuarial assumptions and experience adjustments are presented in the Consolidated Statement of Comprehensive Income / (Loss).
The amount charged to the Consolidated Income Statement in respect of these plans is included within the Income / (loss) from operations except for the net Interest costs, which are included within
Finance costs - net
.
The defined benefit obligations are assessed using the projected unit credit method. The most significant assumption is the discount rate.
Other post-employment benefit plans mainly relate to health and life insurance benefits to retired employees and in some cases to their beneficiaries and covered dependents. Eligibility for coverage is dependent upon certain age and service criteria. These benefit plans are unfunded and are accounted for as defined benefit obligations, as described above.
Other long-term employee benefits mainly include jubilees and other long-term disability benefits. For these plans, actuarial gains and losses arising in the year are recognized immediately in the Consolidated Income Statement.
Taxation
The current Income tax (expense) / benefit is calculated on the basis of the tax laws enacted or substantively enacted at the Consolidated Statement of Financial Position date in the countries where the Company and its subsidiaries operate and generate taxable income.
The Group is subject to income taxes in the Netherlands, France, United States and numerous other jurisdictions. Certain of Constellium’s businesses may be included in consolidated tax returns within the Company. In certain circumstances, these businesses may be jointly and severally liable with the entity filing the consolidated return, for additional taxes that may be assessed.
Deferred income tax assets and liabilities are recognized for the estimated future tax consequences attributable to temporary differences between the Consolidated Financial Statement carrying amounts of existing assets and liabilities and their respective tax bases. This approach also requires the recognition of deferred income tax assets for operating loss carryforwards and tax credit carryforwards.
The effect on deferred tax assets and liabilities of a change in tax rates and laws is recognized as income tax benefit/ (expense) in the year when the rate change is substantively enacted. Deferred income tax assets and liabilities are measured using tax rates that are expected to apply in the year when the asset is realized or the liability is settled, based on the tax rates and laws that have been enacted or substantively enacted at the date of the Consolidated Statement of Financial Position. Deferred income tax assets are recognized only to the extent that it is probable that future taxable profit will be available against which the temporary differences can be utilized.
Presentation of financial statements
The Consolidated Financial Statements are presented in millions of Euros, except Earnings per share in Euros. Certain reclassifications may have been made to prior year amounts to conform to the current year presentation.
2.7 Judgments in applying accounting policies and key sources of estimation uncertainty
Many of the amounts included in the Consolidated Financial Statements involve the use of judgment and/or estimation. These judgments and estimates are based on management’s best knowledge of the relevant facts and circumstances, giving consideration to previous experience. However, actual results may differ from the amounts included in the Consolidated Financial Statements. Key sources of estimation uncertainty that have a significant risk of causing a material adjustment to the carrying amounts of assets and liabilities within the next financial year include the items presented below.
F-22
Impairment tests for goodwill, intangible assets and property, plant and equipment
The determination of fair value and value in use of cash-generating units or groups of cash-generating units depends on a number of assumptions, in particular market data, estimated future cash flows and discount rates.
These assumptions are subject to risk and uncertainty. Any material changes in these assumptions could result in a significant change in a cash-generating units’ recoverable value or in a goodwill impairment. Details of the key assumptions applied are set out in
NOTE 18 - Intangible Assets (including Goodwill)
.
Pension, other post-employment benefits and other long-term employee benefits
The present value of the defined benefit obligations depends on a number of factors that are determined on an actuarial basis using a number of assumptions and its determination requires the application of judgment. Assumptions used and judgments made in determining the defined benefit obligations and net pension costs include discount rates, rates of future compensation increase as well as the criteria considered to determine, in the context of a plan amendment, when the plan amendment has occurred.
Any material changes in these assumptions could result in a significant change in employee benefit expenses recognized in the Consolidated Income Statement or actuarial gains and losses recognized in Equity and prepaid and accrued benefits. Details of the key assumptions made and judgments applied are set out in
NOTE 25 - Pensions and Other Post-Employment Benefit Obligations
.
Income Taxes
Significant judgment is sometimes required in determining the accrual for income taxes as there are many transactions and calculations for which the ultimate tax determination is uncertain during the ordinary course of business. The Group recognizes liabilities based on estimates of whether additional taxes will be due. Where the final tax outcome of these matters is different from the amounts that were recorded, such differences will impact the current and deferred income tax provisions, results of operations and possibly cash flows in the year in which such determination is made.
Management judgment is required to determine the extent to which deferred tax assets can be recognized. In assessing the recognition of deferred tax assets, management considers whether it is more likely than not that the deferred tax assets will be utilized. The deferred tax assets will be ultimately utilized to the extent that sufficient taxable profits will be available in the years in which the temporary differences become deductible. This assessment is conducted through a detailed review of deferred tax assets by jurisdiction and takes into account the scheduled reversals of taxable and deductible temporary differences, past, current and expected future performance deriving from the budget, the business plan and tax planning strategies. Deferred tax assets are not recognized in the jurisdictions where it is less likely than not that sufficient taxable profits will be available against which the deductible temporary differences can be utilized.
Provisions
Provisions have been recorded for: (a) close-down and restoration costs; (b) environmental remediation and monitoring costs; (c) restructuring programs; (d) legal and other potential claims including provisions for tax risks other than income tax, product warranty and guarantees, at amounts which represent management’s best estimates of the expenditure required to settle the obligation at the date of the Consolidated Statement of Financial Position. Expectations are revised each year until the actual liability is settled, with any difference accounted for in the year in which the revision is made. Main assumptions used are described in
NOTE 26 - Provisions
.
F-23
Constellium-UACJ ABS LLC was a joint venture in which Constellium held a
51%
interest and was created in 2014. The joint venture started its operations in 2016, operating a facility located in Bowling Green, Kentucky and supplying aluminium sheet to the North American automotive industry. At creation date, we determined that, under the terms of the joint venture agreement, we did not control Constellium- UACJ ABS LLC because our existing rights associated with the decision-making process did not give us the ability to direct the relevant activities of the joint venture unilaterally and as a result, Constellium did not have power over the joint venture until January 10, 2019.
The acquisition of
49%
of Constellium-UACJ ABS LLC was completed on January 10, 2019, strengthening our position in the North American Auto Body Sheet market. The entity was renamed Constellium Bowling Green LLC ("Bowling Green") and is fully consolidated in 2019.
In accordance with IFRS 3 -
Business combinations
, Constellium has recognized the assets acquired and liabilities assumed, measured at fair value at the acquisition date. The following table reflects the goodwill arising as a result of the allocation of purchase price to the Bowling Green assets acquired and liabilities assumed at January 10, 2019:
|
(in millions of Euros)
|
Fair Value
|
||
|
Cash and cash equivalents
|
4
|
|
|
|
Trade receivables and other
|
49
|
|
|
|
Inventories
|
65
|
|
|
|
Property, plant and equipment
|
165
|
|
|
|
Deferred tax assets
|
3
|
|
|
|
Trade payables and other
|
(41
|
)
|
|
|
Borrowings
|
(75
|
)
|
|
|
Net asset acquired at fair value
|
170
|
|
|
|
Goodwill
|
24
|
|
|
|
Total Consideration
|
194
|
|
|
Total consideration includes
€87 million
of cash consideration paid for the
49%
stake in Constellium-UACJ ABS LLC,
€69 million
for the fair value of Constellium’s previously held interest in Constellium-UACJ ABS LLC and
€38 million
from the effective settlement of preexisting trade receivables with Constellium-UACJ ABS LLC.
Property, Plant and Equipment, Inventories and Borrowings were remeasured at fair value. The
€24 million
of goodwill is the result of expected synergies and will be amortized over 15 years for tax purposes.
Considering the industries served, its major customers and product lines, Bowling Green and its related assets and liabilities are included in the Packaging and Automotive Rolled Products (P&ARP) operating segment.
Acquisition costs were recognized as expenses in Other gains / (losses) - net in the Consolidated Income Statement (
€1 million
in 2019).
For the year-ended
December 31, 2019
, Bowling Green revenue was
€333 million
and net loss of
€48 million
.
F-24
4.1 Disaggregation of revenue
The following table presents our revenue by product line:
|
(in millions of Euros)
|
Year ended
December 31, 2019 |
Year ended
December 31, 2018 |
Year ended
December 31, 2017 |
||||||
|
Packaging rolled products
|
2,172
|
|
2,245
|
|
2,146
|
|
|||
|
Automotive rolled products
|
816
|
|
636
|
|
483
|
|
|||
|
Specialty and other thin-rolled products
|
151
|
|
169
|
|
176
|
|
|||
|
Aerospace rolled products
|
863
|
|
773
|
|
760
|
|
|||
|
Transportation, Industry and other rolled products
|
557
|
|
566
|
|
541
|
|
|||
|
Automotive extruded products
|
797
|
|
714
|
|
614
|
|
|||
|
Other extruded products
|
551
|
|
573
|
|
504
|
|
|||
|
Other
|
—
|
|
10
|
|
13
|
|
|||
|
Total Revenue
|
5,907
|
|
5,686
|
|
5,237
|
|
|||
The following table presents our revenue by destination of shipment:
|
(in millions of Euros)
|
Year ended
December 31, 2019 |
Year ended
December 31, 2018 |
Year ended
December 31, 2017 |
||||||
|
France
|
563
|
|
554
|
|
557
|
|
|||
|
Germany
|
1,260
|
|
1,339
|
|
1,217
|
|
|||
|
United Kingdom
|
194
|
|
175
|
|
188
|
|
|||
|
Switzerland
|
68
|
|
77
|
|
123
|
|
|||
|
Other Europe
|
1,078
|
|
1,038
|
|
940
|
|
|||
|
United States
|
2,175
|
|
1,897
|
|
1,691
|
|
|||
|
Canada
|
89
|
|
107
|
|
78
|
|
|||
|
Asia and Other Pacific
|
277
|
|
300
|
|
270
|
|
|||
|
All Other
|
203
|
|
199
|
|
173
|
|
|||
|
Total Revenue
|
5,907
|
|
5,686
|
|
5,237
|
|
|||
Revenue is recognized at a point in time, except for certain products representing less than
1%
of total revenue with no alternative use for which we have a right to payment.
F-25
Management has defined Constellium’s operating segments based upon the product lines, markets and industries it serves, and prepares and reports operating segment information to Constellium’s chief operating decision maker (CODM) (see
NOTE 2 - Summary of Significant Accounting Policies
) on that basis.
Packaging and Automotive Rolled Products (P&ARP)
P&ARP produces thin-gauge rolled products for customers in the beverage and closures, automotive, customized industrial sheet solutions and high-quality bright surface product markets. P&ARP operates
four
facilities, in
three
countries and had approximately
4,000
employees at
December 31, 2019
.
Aerospace and Transportation (A&T)
A&T focuses on thick-gauge rolled high value-added products for customers in the aerospace, defense and mass-transportation markets and engineering industries. A&T operates
six
facilities in
three
countries and had approximately
4,000
employees at
December 31, 2019
.
Automotive Structures and Industry (AS&I)
AS&I focuses on specialty products and supplies a variety of hard and soft alloy extruded products, including a range of technically advanced products, to the automotive, rail, industrial, energy and building industries, and to manufacturers of mass transport vehicles and shipbuilders. AS&I operates
eighteen
facilities in
ten
countries and had approximately
4,800
employees at
December 31, 2019
.
Holdings & Corporate
Holdings & Corporate includes the net cost of Constellium’s head office and corporate support functions (including our technology centers).
Intersegment elimination
Intersegment transactions are conducted on an arm’s length basis and reflects market prices.
The accounting principles used to prepare the Group’s operating segment information are the same as those used to prepare the Group’s Consolidated Financial Statements.
5.1 Segment Revenue
|
Year ended December 31, 2019
|
Year ended December 31, 2018
|
Year ended December 31, 2017
|
|||||||||||||||||||||||||
|
(in millions of Euros)
|
Segment revenue
|
Inter-segment elimination
|
External revenue
|
Segment revenue
|
Inter-segment elimination
|
External revenue
|
Segment revenue
|
Inter-segment elimination
|
External revenue
|
||||||||||||||||||
|
P&ARP
|
3,149
|
|
(10
|
)
|
3,139
|
|
3,059
|
|
(9
|
)
|
3,050
|
|
2,812
|
|
(7
|
)
|
2,805
|
|
|||||||||
|
A&T
|
1,462
|
|
(42
|
)
|
1,420
|
|
1,389
|
|
(50
|
)
|
1,339
|
|
1,335
|
|
(34
|
)
|
1,301
|
|
|||||||||
|
AS&I
|
1,351
|
|
(3
|
)
|
1,348
|
|
1,290
|
|
(3
|
)
|
1,287
|
|
1,123
|
|
(5
|
)
|
1,118
|
|
|||||||||
|
Holdings & Corporate (A)
|
—
|
|
—
|
|
—
|
|
10
|
|
—
|
|
10
|
|
13
|
|
—
|
|
13
|
|
|||||||||
|
Total
|
5,962
|
|
(55
|
)
|
5,907
|
|
5,748
|
|
(62
|
)
|
5,686
|
|
5,283
|
|
(46
|
)
|
5,237
|
|
|||||||||
|
(A)
|
For the years ended
December 31, 2018
and
2017
, the Holdings & Corporate segment included revenue from supplying metal to third parties.
|
F-26
5.2 Segment Adjusted EBITDA and reconciliation of Adjusted EBITDA to Net Income
|
(in millions of Euros)
|
Notes
|
Year ended December 31, 2019
|
Year ended December 31, 2018
|
Year ended December 31, 2017
|
|||||||
|
P&ARP
|
273
|
|
243
|
|
204
|
|
|||||
|
A&T
|
204
|
|
152
|
|
146
|
|
|||||
|
AS&I
|
106
|
|
125
|
|
120
|
|
|||||
|
Holdings & Corporate
|
(21
|
)
|
(22
|
)
|
(22
|
)
|
|||||
|
Adjusted EBITDA
|
562
|
|
498
|
|
448
|
|
|||||
|
Metal price lag (A)
|
(46
|
)
|
—
|
|
22
|
|
|||||
|
Start-up and development costs (B)
|
(11
|
)
|
(21
|
)
|
(17
|
)
|
|||||
|
Manufacturing system and process transformation costs
|
—
|
|
—
|
|
(2
|
)
|
|||||
|
Bowling Green one-time costs related to the acquisition (C)
|
(5
|
)
|
—
|
|
—
|
|
|||||
|
Share based compensation costs
|
(16
|
)
|
(12
|
)
|
(8
|
)
|
|||||
|
Gains on pensions plan amendments (D)
|
25
|
1
|
|
36
|
|
20
|
|
||||
|
Depreciation and amortization
|
17,18
|
(256
|
)
|
(197
|
)
|
(171
|
)
|
||||
|
Restructuring costs
|
(4
|
)
|
(1
|
)
|
(4
|
)
|
|||||
|
Unrealized gains / (losses) on derivatives
|
9
|
33
|
|
(84
|
)
|
57
|
|
||||
|
Unrealized exchange (losses) / gains from the remeasurement of monetary assets and liabilities – net
|
9
|
—
|
|
—
|
|
(4
|
)
|
||||
|
(Losses) / gains on disposals (E)
|
9
|
(3
|
)
|
186
|
|
(3
|
)
|
||||
|
Other (F)
|
—
|
|
(1
|
)
|
—
|
|
|||||
|
Income from operations
|
255
|
|
404
|
|
338
|
|
|||||
|
Finance costs - net
|
11
|
(175
|
)
|
(149
|
)
|
(260
|
)
|
||||
|
Share of income / (loss) of joint-ventures
|
19
|
2
|
|
(33
|
)
|
(29
|
)
|
||||
|
Income before income tax
|
82
|
|
222
|
|
49
|
|
|||||
|
Income tax expense
|
12
|
(18
|
)
|
(32
|
)
|
(80
|
)
|
||||
|
Net income / (loss)
|
64
|
|
190
|
|
(31
|
)
|
|||||
|
(A)
|
Metal price lag represents the financial impact of the timing difference between when aluminium prices included within Constellium Revenues are established and when aluminium purchase prices included in Cost of sales are established. The Group accounts for inventory using a weighted average price basis and this adjustment aims to remove the effect of volatility in LME prices. The calculation of the Group metal price lag adjustment is based on an internal standardized methodology calculated at each of Constellium’s manufacturing sites and is primarily calculated as the average value of product recorded in inventory, which approximates the spot price in the market, less the average value transferred out of inventory, which is the weighted average of the metal element of cost of sales, based on the quantity sold in the year.
|
|
(B)
|
For the years ended
December 31, 2019
,
2018
and
2017
, start-up and development costs include
€11 million
,
€21 million
and
€16 million
, respectively, related to new projects in our AS&I operating segment.
|
|
(C)
|
For the year ended
December 31, 2019
, Bowling Green one-time costs related to the acquisition include the non-cash reversal of the inventory step-up.
|
|
(D)
|
For the year ended
December 31, 2018
, the Group amended one of its OPEB plans in the U.S., which resulted in a
€36 million
gain. For the year ended
December 31, 2017
, amendments to certain Swiss pension plans, U.S. pension plans and OPEB resulted in a
€20 million
gain.
|
|
(E)
|
In July 2018, Constellium completed the sale of the North Building assets of its Sierre plant in Switzerland to Novelis and contributed the Sierre site shared infrastructure to a joint-venture with Novelis, in exchange for cash consideration of
€200 million
. This transaction also resulted in the termination of the existing lease agreement for the North Building assets which had been leased and operated by Novelis since 2005. For the year ended
December 31, 2018
, the transaction generated a
€190 million
net gain (See
NOTE 32 - Subsidiaries and Operating Segments
).
|
F-27
|
(F)
|
For the year ended
December 31, 2017
, other includes
€3 million
of legal fees and lump-sum payments in connection with the renegotiation of a new
5
-year collective bargaining agreement offset by accrual reversals of unused provisions related to one-time loss contingencies.
|
5.3 Segment capital expenditure
|
(in millions of Euros)
|
Year ended December 31, 2019
|
Year ended December 31, 2018
|
Year ended December 31, 2017
|
||||||
|
P&ARP
|
(96
|
)
|
(97
|
)
|
(115
|
)
|
|||
|
A&T
|
(72
|
)
|
(70
|
)
|
(73
|
)
|
|||
|
AS&I
|
(97
|
)
|
(105
|
)
|
(83
|
)
|
|||
|
Holdings & Corporate
|
(6
|
)
|
(5
|
)
|
(5
|
)
|
|||
|
Capital expenditures
|
(271
|
)
|
(277
|
)
|
(276
|
)
|
|||
5.4 Segment assets
Segment assets are comprised of total assets of Constellium by segment, less deferred income tax assets, cash and cash equivalents and other financial assets.
|
(in millions of Euros)
|
At December 31, 2019
|
At December 31, 2018
|
||||
|
P&ARP
|
1,951
|
|
1,791
|
|
||
|
A&T
|
856
|
|
831
|
|
||
|
AS&I
|
703
|
|
544
|
|
||
|
Holdings & Corporate
|
276
|
|
304
|
|
||
|
Segment assets
|
3,786
|
|
3,470
|
|
||
|
Deferred income tax assets
|
185
|
|
163
|
|
||
|
Cash and cash equivalents
|
184
|
|
164
|
|
||
|
Other financial assets
|
29
|
|
104
|
|
||
|
Total Assets
|
4,184
|
|
3,901
|
|
||
5.5 Information about major customers
No
single customer contributed 10% or more to the Group's revenue for the year ended
December 31, 2019
. Revenue in the P&ARP segment from sales to the Group’s largest customer was
€812 million
for the year ended
December 31, 2018
. Revenue in the P&ARP segment from sales to the Group’s two largest customers was
€1,364 million
for the year ended
December 31, 2017
.
No other single customer contributed 10% or more to the Group’s revenue for
2018
and
2017
.
Property, plant and equipment are reported based on the physical location of the assets:
|
(in millions of Euros)
|
At December 31, 2019
|
At December 31, 2018
|
||||
|
United States
|
926
|
|
740
|
|
||
|
France
|
656
|
|
613
|
|
||
|
Germany
|
250
|
|
181
|
|
||
|
Czech Republic
|
106
|
|
84
|
|
||
|
Other
|
118
|
|
48
|
|
||
|
Total
|
2,056
|
|
1,666
|
|
||
F-28
|
(in millions of Euros)
|
Year ended December 31, 2019
|
Year ended December 31, 2018
|
Year ended December 31, 2017
|
||||||
|
Raw materials and consumables used
|
(3,535
|
)
|
(3,561
|
)
|
(3,197
|
)
|
|||
|
Employee benefit expenses
|
(1,038
|
)
|
(927
|
)
|
(907
|
)
|
|||
|
Energy costs
|
(162
|
)
|
(140
|
)
|
(138
|
)
|
|||
|
Sub-contractors
|
(100
|
)
|
(92
|
)
|
(99
|
)
|
|||
|
Freight out costs
|
(156
|
)
|
(143
|
)
|
(124
|
)
|
|||
|
Professional fees
|
(97
|
)
|
(74
|
)
|
(77
|
)
|
|||
|
Lease expenses
|
(13
|
)
|
(31
|
)
|
(27
|
)
|
|||
|
Depreciation and amortization
|
(256
|
)
|
(197
|
)
|
(171
|
)
|
|||
|
Other operating expenses
|
(276
|
)
|
(271
|
)
|
(229
|
)
|
|||
|
Other gains / (losses) - net
|
(19
|
)
|
154
|
|
70
|
|
|||
|
Total operating expenses
|
(5,652
|
)
|
(5,282
|
)
|
(4,899
|
)
|
|||
|
(in millions of Euros)
|
Notes
|
Year ended December 31, 2019
|
Year ended December 31, 2018
|
Year ended December 31, 2017
|
|||||||
|
Wages and salaries
|
(994
|
)
|
(889
|
)
|
(872
|
)
|
|||||
|
Pension costs - defined benefit plans
|
25
|
(19
|
)
|
(20
|
)
|
(21
|
)
|
||||
|
Other post-employment benefits
|
25
|
(9
|
)
|
(6
|
)
|
(6
|
)
|
||||
|
Share-based compensation
|
31
|
(16
|
)
|
(12
|
)
|
(8
|
)
|
||||
|
Total employee benefit expenses
|
(1,038
|
)
|
(927
|
)
|
(907
|
)
|
|||||
|
(in millions of Euros)
|
Notes
|
Year ended December 31, 2019
|
Year ended December 31, 2018
|
Year ended December 31, 2017
|
|||||||
|
Realized (losses) / gains on derivatives (A)
|
(49
|
)
|
14
|
|
—
|
|
|||||
|
Unrealized gains / (losses) on derivatives at fair value through profit and loss - net (A)
|
5
|
33
|
|
(84
|
)
|
57
|
|
||||
|
Unrealized exchange losses from the remeasurement of monetary assets and liabilities - net
|
5
|
—
|
|
—
|
|
(4
|
)
|
||||
|
Gains on pension plan amendments (B)
|
25
|
1
|
|
36
|
|
20
|
|
||||
|
(Losses) / gains on disposal (C)
|
(3
|
)
|
186
|
|
(3
|
)
|
|||||
|
Other
|
(1
|
)
|
2
|
|
—
|
|
|||||
|
Total other gains / (losses) - net
|
(19
|
)
|
154
|
|
70
|
|
|||||
|
(A)
|
Realized gains and losses are related to derivatives entered into with the purpose of mitigating exposure to volatility in foreign currencies and commodity prices. Unrealized gains and losses are related to derivatives that do not qualify for hedge accounting.
|
|
(B)
|
For the year ended
December 31, 2018
, the Group amended one of its OPEB plans in the U.S., which resulted in a
€36 million
gain. For the year ended
December 31, 2017
, amendments to certain Swiss pension plans, U.S. pension plans and OPEB resulted in a
€20 million
gain.
|
F-29
|
(C)
|
In July 2018, Constellium completed the sale of the North Building assets of its Sierre plant in Switzerland to Novelis and contributed the Sierre site shared infrastructure to a joint-venture with Novelis, in exchange for cash consideration of
€200 million
. This transaction also resulted in the termination of the existing lease agreement for the North Building assets which had been leased and operated by Novelis since 2005. For the year ended
December 31, 2018
, the transaction generated a
€190 million
net gain (See
NOTE 32 - Subsidiaries and Operating Segments
).
|
Currency gains and losses, which are included in Income from operations, are as follows:
|
(in millions of Euros)
|
Notes
|
Year ended December 31, 2019
|
Year ended December 31, 2018
|
Year ended December 31, 2017
|
|||||||
|
Included in Revenue
|
24
|
(7
|
)
|
2
|
|
2
|
|
||||
|
Included in Cost of sales
|
1
|
|
2
|
|
(4
|
)
|
|||||
|
Included in Other gains / (losses) - net
|
9
|
|
7
|
|
(4
|
)
|
|||||
|
Total
|
3
|
|
11
|
|
(6
|
)
|
|||||
|
Realized exchange gains / (losses) on foreign currency derivatives - net
|
24
|
1
|
|
11
|
|
(15
|
)
|
||||
|
Unrealized gains / (losses) on foreign currency derivatives - net
|
24
|
1
|
|
(3
|
)
|
17
|
|
||||
|
Exchange gains / (losses) from the remeasurement of monetary assets and liabilities - net
|
1
|
|
3
|
|
(8
|
)
|
|||||
|
Total
|
3
|
|
11
|
|
(6
|
)
|
|||||
See
NOTE 23 - Financial Instruments
and
NOTE 24 - Financial Risk Management
for further information regarding the Company’s foreign currency derivatives and hedging activities.
Foreign currency translation reserve
|
(in millions of Euros)
|
At December 31, 2019
|
At December 31, 2018
|
||||
|
Foreign currency translation reserve at January 1
|
3
|
|
(7
|
)
|
||
|
Effect of currency translation differences
|
1
|
|
10
|
|
||
|
Foreign currency translation reserve at December 31
|
4
|
|
3
|
|
||
F-30
|
(in millions of Euros)
|
Year ended December 31, 2019
|
Year ended December 31, 2018
|
Year ended December 31, 2017
|
||||||
|
Interest received
|
—
|
|
7
|
|
7
|
|
|||
|
Finance income
|
—
|
|
7
|
|
7
|
|
|||
|
Interest expense on borrowings (A)
|
(124
|
)
|
(118
|
)
|
(147
|
)
|
|||
|
Expenses on factoring arrangements
|
(19
|
)
|
(18
|
)
|
(16
|
)
|
|||
|
Interest expense on leases
|
(13
|
)
|
(5
|
)
|
(3
|
)
|
|||
|
Net loss on settlement of debt (B)
|
—
|
|
—
|
|
(91
|
)
|
|||
|
Realized and unrealized gains / (losses) on debt derivatives at fair value (C)
|
13
|
|
28
|
|
(79
|
)
|
|||
|
Realized and unrealized exchange (losses) / gains on financing activities - net (C)
|
(3
|
)
|
(22
|
)
|
91
|
|
|||
|
Interest cost on pension and other benefits
|
(16
|
)
|
(15
|
)
|
(17
|
)
|
|||
|
Other finance expenses (D)
|
(16
|
)
|
(10
|
)
|
(12
|
)
|
|||
|
Capitalized borrowing costs (E)
|
3
|
|
4
|
|
7
|
|
|||
|
Finance expenses
|
(175
|
)
|
(156
|
)
|
(267
|
)
|
|||
|
Finance costs - net
|
(175
|
)
|
(149
|
)
|
(260
|
)
|
|||
|
(A)
|
For the year ended
December 31, 2019
, the Group incurred mainly (i)
€115 million
of interest related to Constellium SE Senior Notes and (ii)
€7 million
of interest expense and fees related to the Muscle Shoals and Ravenswood ABL Facility (“Pan-U.S. ABL”). For the year ended
December 31, 2018
, the Group incurred (i)
€113 million
of interest related to Constellium SE Senior Notes, (ii)
€4 million
of interest expense and fees related to the Pan US ABL.
|
|
(B)
|
For the year ended
December 31, 2017
, net loss on settlement of debt related to (i) the Muscle Shoals Senior Notes redemption in February 2017 for
€13 million
and (ii) the Constellium SE Senior Notes redemption in November 2017 for
€78 million
. The total exit fees incurred and paid related to refinancings in
2017
amounted to
€88 million
.
|
|
(C)
|
The Group hedges the dollar exposure relating to the principal of its Constellium SE U.S. Dollar Senior Notes, for the portion that has not been used to finance directly or indirectly U.S. Dollar functional currency entities. Changes in the fair value of these hedging derivatives are recognized within Finance costs – net in the Consolidated Income Statement and largely offset the unrealized results related to Constellium SE U.S. Dollar Senior Notes revaluation.
|
|
(D)
|
For the year ended
December 31, 2018
, other finance expenses include a
€6 million
net loss resulting from the modification of our loan to Constellium-UACJ ABS LLC in February 2018.
|
|
(E)
|
Borrowing costs directly attributable to the construction of assets are capitalized. The capitalization rate was
6%
for the years ended
December 31, 2019
,
2018
and
2017
.
|
F-31
The current and deferred components of income tax are as follows:
|
(in millions of Euros)
|
Year ended December 31, 2019
|
Year ended December 31, 2018
|
Year ended December 31, 2017
|
||||||
|
Current tax expense
|
(32
|
)
|
(30
|
)
|
(26
|
)
|
|||
|
Deferred tax expense
|
14
|
|
(2
|
)
|
(54
|
)
|
|||
|
Total income tax expense
|
(18
|
)
|
(32
|
)
|
(80
|
)
|
|||
Using a composite statutory income tax rate applicable by tax jurisdiction, the income tax can be reconciled as follows:
|
(in millions of Euros)
|
Year ended December 31, 2019
|
Year ended December 31, 2018
|
Year ended December 31, 2017
|
||||||
|
Income before income tax
|
82
|
|
222
|
|
49
|
|
|||
|
Composite statutory income tax rate applicable by tax jurisdiction
|
30.3
|
%
|
24.1
|
%
|
31.9
|
%
|
|||
|
Income tax expense calculated at composite statutory tax rate applicable by tax jurisdiction
|
(25
|
)
|
(53
|
)
|
(16
|
)
|
|||
|
Tax effect of:
|
|||||||||
|
Changes in recognized and unrecognized deferred tax assets (A)
|
(10
|
)
|
30
|
|
(61
|
)
|
|||
|
Change in tax laws and rates (B)
|
21
|
|
—
|
|
(11
|
)
|
|||
|
Other
|
(4
|
)
|
(9
|
)
|
8
|
|
|||
|
Income tax expense
|
(18
|
)
|
(32
|
)
|
(80
|
)
|
|||
|
Effective income tax rate
|
22
|
%
|
14
|
%
|
163
|
%
|
|||
|
(A)
|
For the year ended December 31, 2018, changes mainly relate to non-recurring transactions, especially the gain on the sale of the North Building of the Sierre plant and termination of an existing lease agreement, that generated a significant taxable profit compensated by the use of previously unrecognized tax losses carried forward. For the year ended December 31, 2017, changes mainly relate to unrecognized tax losses carried forward.
|
|
(B)
|
For the year ended December 31, 2019, the change in tax laws and rates relates mainly to the application of the Swiss Federal Tax Reform voted in May 2019 and enacted in the Canton where one of our entities is located. For the year ended December 31, 2017, the change in tax laws and rates relates mainly to the decrease in the U.S. income tax rate from
40%
to
27%
for
€16 million
and to the gradual decrease in the French tax rate to
25.82%
starting 2022.
|
Our composite statutory income tax rate of
30.3%
for the year ended
December 31, 2019
,
24.1%
for the year ended
December 31, 2018
and
31.9%
for the year ended
December 31, 2017
resulted from the statutory tax rates (i) in the United States of
26%
in 2019 and 2018, and
40%
in 2017, (ii) in France of
34.43%
in 2019 and 2018, and
39.2%
in 2017 (iii) in Germany of
29%
, for each of the last three years (iv) in the Netherlands of
25%
, for each of the last three years and (v) in Czech Republic of
19%
, for each of the last three years.
The variation in our composite tax rate mainly results from the geographical mix of our pre-tax results.
The
increase
in our composite tax rate from
24.1%
in
2018
to
30.3%
in
2019
is mostly related to the gain on the sale of the North Building of the Sierre plant in Switzerland in 2018. The
decrease
in our composite tax rate from
31.9%
in
2017
to
24.1%
in
2018
is mostly related to the gain on the sale of the North Building of the Sierre plant.
F-32
|
(in millions of Euros)
|
Year ended December 31, 2019
|
Year ended December 31, 2018
|
Year ended December 31, 2017
|
||||||
|
Earnings attributable to equity holders of the parent used to calculate basic and diluted earnings per share
|
59
|
|
188
|
|
(31
|
)
|
|||
Number of shares attributable to equity holders of Constellium
|
(number of shares)
|
Year ended December 31, 2019
|
Year ended December 31, 2018
|
Year ended December 31, 2017
|
||||||
|
Weighted average number of ordinary shares used to calculate basic earnings per share
|
136,856,978
|
|
134,761,736
|
|
110,164,320
|
|
|||
|
Effect of other dilutive potential ordinary shares (A)
|
5,788,641
|
|
3,384,178
|
|
—
|
|
|||
|
Weighted average number of ordinary shares used to calculate diluted earnings per share
|
142,645,619
|
|
138,145,914
|
|
110,164,320
|
|
|||
|
(A)
|
For the year ended
December 31, 2017
there were
3,291,875
potential ordinary shares that could have a dilutive impact but were considered antidilutive due to negative earnings.
|
Earnings per share attributable to the equity holders of Constellium
|
(in Euro per share)
|
Year ended December 31, 2019
|
Year ended December 31, 2018
|
Year ended December 31, 2017
|
||||||
|
Basic
|
0.43
|
|
1.40
|
|
(0.28
|
)
|
|||
|
Diluted
|
0.41
|
|
1.37
|
|
(0.28
|
)
|
|||
|
(in millions of Euros)
|
At December 31, 2019
|
At December 31, 2018
|
||||
|
Cash in bank and on hand
|
184
|
|
164
|
|
||
|
Total Cash and cash equivalent
|
184
|
|
164
|
|
||
At
December 31, 2019
, cash in bank and on hand includes a total of
€22 million
held by subsidiaries that operate in countries where capital control restrictions prevent the balances from being immediately available for general use by the other entities within the Group. At
December 31, 2018
the amount subject to these restrictions was
€18 million
.
F-33
Trade receivables and other are comprised of the following:
|
At December 31, 2019
|
At December 31, 2018
|
|||||||||||
|
(in millions of Euros)
|
Non-current
|
Current
|
Non-current
|
Current
|
||||||||
|
Trade receivables - gross
|
—
|
|
395
|
|
—
|
|
483
|
|
||||
|
Impairment
|
—
|
|
(2
|
)
|
—
|
|
(2
|
)
|
||||
|
Total trade receivables - net
|
—
|
|
393
|
|
—
|
|
481
|
|
||||
|
Income tax receivables
|
35
|
|
22
|
|
28
|
|
43
|
|
||||
|
Other taxes
|
—
|
|
35
|
|
—
|
|
33
|
|
||||
|
Contract assets
|
16
|
|
2
|
|
28
|
|
2
|
|
||||
|
Prepaid expenses
|
1
|
|
8
|
|
1
|
|
12
|
|
||||
|
Other
|
8
|
|
14
|
|
7
|
|
16
|
|
||||
|
Total other receivables
|
60
|
|
81
|
|
64
|
|
106
|
|
||||
|
Total trade receivables and other
|
60
|
|
474
|
|
64
|
|
587
|
|
||||
15.1 Contract assets
|
At December 31, 2019
|
At December 31, 2018
|
|||||||||||
|
(in millions of Euros)
|
Non-current
|
Current
|
Non-current
|
Current
|
||||||||
|
Unbilled tooling costs
|
16
|
|
—
|
|
26
|
|
—
|
|
||||
|
Other
|
—
|
|
2
|
|
2
|
|
2
|
|
||||
|
Total Contract assets
|
16
|
|
2
|
|
28
|
|
2
|
|
||||
15.2 Aging
The aging of total trade receivables - net is as follows:
|
(in millions of Euros)
|
At December 31, 2019
|
At December 31, 2018
|
||||
|
Not past due
|
380
|
|
453
|
|
||
|
1 – 30 days past due
|
10
|
|
23
|
|
||
|
31 – 60 days past due
|
3
|
|
2
|
|
||
|
61 – 90 days past due
|
—
|
|
2
|
|
||
|
Greater than 90 days past due
|
—
|
|
1
|
|
||
|
Total trade receivables - net
|
393
|
|
481
|
|
||
Impairment allowance
Revisions to the impairment allowance arising from changes in estimates are included as either additional allowance or recoveries. An allowance was recognized for
€0.4 million
during the year ended
December 31, 2019
(
€1.1 million
reversal of allowance recognized during the year ended
December 31, 2018
).
None of the other amounts included in Other receivables were deemed to be impaired.
The maximum exposure to credit risk at the reporting date is the carrying value of each class of receivable shown above. The Group does not hold any collateral from its customers or debtors as security.
F-34
15.3 Currency concentration
The composition of the carrying amounts of total Trade receivables – net by currency is shown in Euro equivalents as follows:
|
(in millions of Euros)
|
At December 31, 2019
|
At December 31, 2018
|
||||
|
Euro
|
126
|
|
177
|
|
||
|
U.S. Dollar
|
251
|
|
284
|
|
||
|
Swiss franc
|
3
|
|
4
|
|
||
|
Other currencies
|
13
|
|
16
|
|
||
|
Total trade receivables - net
|
393
|
|
481
|
|
||
15.4 Factoring arrangements
The Group factors trade receivables in France by entering into factoring agreements with a third party for a maximum capacity of
€235 million
. This agreement matures on
October 29, 2021
.
The Group factors trade receivables in Germany, Switzerland and Czech Republic by entering into factoring agreements with a third party for a maximum capacity of
€150 million
. This agreement matures on
October 29, 2021
. In addition, the Group sells receivables from one of its German customers under an uncommitted factoring facility whereby receivables sold are confirmed by the customer.
Constellium Automotive USA LLC entered into a factoring agreement which provides for the sale of specific account receivables up to a maximum capacity of
$33 million
. The facility was amended, on December 10, 2019, to decrease its maximum capacity to
$25 million
and to extend its maturity to December 10, 2020.
Muscle Shoals entered into a factoring agreement that provides for the sale of specific trade receivables up to a maximum capacity of
$375 million
. The facility was amended, on September 30, 2019, to decrease its maximum capacity to
$300 million
and to extend its maturity to September 30, 2021.
Under the Group’s factoring agreements, most of the trade receivables are sold without recourse. Where the Group has transferred substantially all the risks and rewards of ownership of the receivables, the receivables are derecognized. Some remaining receivables do not qualify for derecognition under IFRS 9 -
Financial Instruments,
as the Group retains substantially all the associated risks and rewards.
Under the agreements, at
December 31, 2019
, the total carrying amount of the original assets factored is
€574 million
(
December 31, 2018
:
€601 million
) of which:
|
•
|
€463 million
(
December 31, 2018
:
€446 million
) have been derecognized from the Consolidated Statement of Financial Position as the Group transferred substantially all of the associated risks and rewards to the factor;
|
|
•
|
€111 million
(
December 31, 2018
:
€155 million
) were recognized on the Consolidated Statement of Financial Position.
|
There was
no
debt due to the factor relating to trade account receivables sold at
December 31, 2019
and
2018
.
Covenants
The factoring arrangements contain certain customary affirmative and negative covenants, including some relating to the administration and collection of the assigned receivables, the terms of the invoices and the exchange of information, but do not contain maintenance financial covenants.
The commitment of the factor to buy receivables under the Muscle Shoals factoring agreement is subject to certain credit ratings being maintained.
The Group was in compliance with all applicable covenants at
December 31, 2019
and
2018
.
F-35
|
(in millions of Euros)
|
At December 31, 2019
|
At December 31, 2018
|
||||
|
Finished goods
|
203
|
|
165
|
|
||
|
Work in progress
|
321
|
|
347
|
|
||
|
Raw materials
|
106
|
|
112
|
|
||
|
Stores and supplies
|
74
|
|
67
|
|
||
|
Inventories write down
|
(34
|
)
|
(31
|
)
|
||
|
Total inventories
|
670
|
|
660
|
|
||
Constellium records inventories at the lower of cost and net realizable value. Any change in the net realizable value adjustment on inventories is included in Cost of sales in the Consolidated Income Statement.
|
(in millions of Euros)
|
Notes
|
Land and Property Rights
|
Buildings
|
Machinery and Equipment
|
Construction Work in Progress
|
Other
|
Total
|
|||||||||||||
|
Net balance at December 31, 2018
|
18
|
|
217
|
|
1,227
|
|
194
|
|
10
|
|
1,666
|
|
||||||||
|
IFRS 16 application
|
—
|
|
82
|
|
17
|
|
—
|
|
3
|
|
102
|
|
||||||||
|
Net balance at January 1, 2019
|
18
|
|
299
|
|
1,244
|
|
194
|
|
13
|
|
1,768
|
|
||||||||
|
Property, plant and equipment acquired through business combination
|
3
|
—
|
|
40
|
|
120
|
|
4
|
|
1
|
|
165
|
|
|||||||
|
Additions
|
1
|
|
22
|
|
81
|
|
245
|
|
3
|
|
352
|
|
||||||||
|
Disposals
|
—
|
|
—
|
|
(5
|
)
|
—
|
|
—
|
|
(5
|
)
|
||||||||
|
Depreciation expense
|
—
|
|
(27
|
)
|
(208
|
)
|
—
|
|
(11
|
)
|
(246
|
)
|
||||||||
|
Transfer during the year
|
—
|
|
28
|
|
203
|
|
(242
|
)
|
11
|
|
—
|
|
||||||||
|
Effects of changes in foreign exchange rates
|
—
|
|
4
|
|
16
|
|
2
|
|
—
|
|
22
|
|
||||||||
|
Net balance at December 31, 2019
|
19
|
|
366
|
|
1,451
|
|
203
|
|
17
|
|
2,056
|
|
||||||||
|
Cost
|
35
|
|
527
|
|
2,407
|
|
213
|
|
46
|
|
3,228
|
|
||||||||
|
Less accumulated depreciation and impairment
|
(16
|
)
|
(161
|
)
|
(956
|
)
|
(10
|
)
|
(29
|
)
|
(1,172
|
)
|
||||||||
|
Net balance at December 31, 2019
|
19
|
|
366
|
|
1,451
|
|
203
|
|
17
|
|
2,056
|
|
||||||||
F-36
|
(in millions of Euros)
|
Land and Property Rights
|
Buildings
|
Machinery and Equipment
|
Construction Work in Progress
|
Other
|
Total
|
||||||||||||
|
Net balance at January 1, 2018
|
14
|
|
206
|
|
1,089
|
|
198
|
|
10
|
|
1,517
|
|
||||||
|
Additions
|
1
|
|
5
|
|
98
|
|
195
|
|
4
|
|
303
|
|
||||||
|
Disposals
|
—
|
|
—
|
|
(6
|
)
|
—
|
|
—
|
|
(6
|
)
|
||||||
|
Depreciation expense
|
(4
|
)
|
(13
|
)
|
(161
|
)
|
—
|
|
(6
|
)
|
(184
|
)
|
||||||
|
Transfer during the year
|
6
|
|
16
|
|
181
|
|
(202
|
)
|
2
|
|
3
|
|
||||||
|
Effects of changes in foreign exchange rates
|
1
|
|
3
|
|
26
|
|
3
|
|
—
|
|
33
|
|
||||||
|
Net balance at December 31, 2018
|
18
|
|
217
|
|
1,227
|
|
194
|
|
10
|
|
1,666
|
|
||||||
|
Cost
|
33
|
|
349
|
|
2,000
|
|
200
|
|
35
|
|
2,617
|
|
||||||
|
Less accumulated depreciation and impairment
|
(15
|
)
|
(132
|
)
|
(773
|
)
|
(6
|
)
|
(25
|
)
|
(951
|
)
|
||||||
|
Net balance at December 31, 2018
|
18
|
|
217
|
|
1,227
|
|
194
|
|
10
|
|
1,666
|
|
||||||
Right of use assets
Right of use have been included within the same line item as that within which the corresponding underlying assets would be presented if they were owned.
|
(in millions of Euros)
|
Buildings
|
Machinery and Equipment
|
Other
|
Total
|
||||||||
|
Net balance at December 31, 2018
|
24
|
|
53
|
|
—
|
|
77
|
|
||||
|
IFRS 16 application (A)
|
82
|
|
17
|
|
3
|
|
102
|
|
||||
|
Net balance at January 1, 2019
|
106
|
|
70
|
|
3
|
|
179
|
|
||||
|
Additions
|
20
|
|
21
|
|
2
|
|
43
|
|
||||
|
Disposals
|
—
|
|
—
|
|
—
|
|
—
|
|
||||
|
Depreciation expense
|
(11
|
)
|
(18
|
)
|
(2
|
)
|
(31
|
)
|
||||
|
Transfer during the period
|
—
|
|
(3
|
)
|
—
|
|
(3
|
)
|
||||
|
Effects of changes in foreign exchange rates
|
1
|
|
1
|
|
—
|
|
2
|
|
||||
|
Net balance at December 31, 2019
|
116
|
|
71
|
|
3
|
|
190
|
|
||||
|
Cost
|
134
|
|
113
|
|
5
|
|
252
|
|
||||
|
Less accumulated depreciation and impairment
|
(18
|
)
|
(42
|
)
|
(2
|
)
|
(62
|
)
|
||||
|
Net balance at December 31, 2019
|
116
|
|
71
|
|
3
|
|
190
|
|
||||
|
(A)
|
The IFRS 16 application included assets acquired through finance leases reclassified as right-of-use assets of
€77 million
and operating leases recognized as right-of-use assets of
€102 million
at January 1, 2019.
|
The total expense relating to short-term leases, low value asset leases and variable lease payments that are still recognized as operating expenses was
€13 million
for the year ended
December 31, 2019
.
F-37
Depreciation expense and impairment losses
Total depreciation expense and impairment losses relating to property, plant and equipment and intangible assets are presented in the Consolidated Income Statement as follows:
|
(in millions of Euros)
|
Year ended December 31, 2019
|
Year ended December 31, 2018
|
Year ended December 31, 2017
|
||||||
|
Cost of sales
|
(237
|
)
|
(184
|
)
|
(160
|
)
|
|||
|
Selling and administrative expenses
|
(13
|
)
|
(9
|
)
|
(8
|
)
|
|||
|
Research and development expenses
|
(6
|
)
|
(4
|
)
|
(3
|
)
|
|||
|
Total
|
(256
|
)
|
(197
|
)
|
(171
|
)
|
|||
The amount of contractual commitments for the acquisition of property, plant and equipment is disclosed in
NOTE 29 - Commitments
.
Impairment tests for property, plant and equipment and intangibles assets
A triggering event was identified at December 31, 2019 for Automotive Structure USA cash-generating units due to the fact that
actual operating profit and net cash flows were impacted by higher than expected costs related to operational challenges on some of the newer automotive programs.
In accordance with the accounting policies described in Note 2.6 of the Consolidated Financial Statements, the Automotive Structure USA cash- generating units were tested for impairment at December 31, 2019 and management concluded that
no
impairment charge was required. No triggering events were identified at December 31, 2019 for our other cash-generating units.
No triggering events were identified at
December 31, 2018
and
2017
for our cash-generating units.
|
(in millions of Euros)
|
Notes
|
Goodwill
|
Technology
|
Computer Software
|
Customer relationships
|
Work in Progress
|
Other
|
Total intangible assets (excluding goodwill)
|
|||||||||||||||
|
Net balance at January 1, 2019
|
422
|
|
22
|
|
18
|
|
15
|
|
13
|
|
2
|
|
70
|
|
|||||||||
|
Intangible assets acquired through business combination
|
3
|
24
|
|
—
|
|
—
|
|
—
|
|
—
|
|
—
|
|
—
|
|
||||||||
|
Additions
|
—
|
|
—
|
|
1
|
|
—
|
|
8
|
|
—
|
|
9
|
|
|||||||||
|
Amortization expense
|
—
|
|
(1
|
)
|
(8
|
)
|
(1
|
)
|
—
|
|
—
|
|
(10
|
)
|
|||||||||
|
Transfer during the year
|
—
|
|
—
|
|
7
|
|
—
|
|
(7
|
)
|
—
|
|
—
|
|
|||||||||
|
Effects of changes in foreign exchange rates
|
9
|
|
—
|
|
1
|
|
—
|
|
—
|
|
—
|
|
1
|
|
|||||||||
|
Net balance at December 31, 2019
|
455
|
|
21
|
|
19
|
|
14
|
|
14
|
|
2
|
|
70
|
|
|||||||||
|
Cost
|
455
|
|
87
|
|
73
|
|
39
|
|
16
|
|
2
|
|
217
|
|
|||||||||
|
Less accumulated depreciation and impairment
|
—
|
|
(66
|
)
|
(54
|
)
|
(25
|
)
|
(2
|
)
|
—
|
|
(147
|
)
|
|||||||||
|
Net balance at December 31, 2019
|
455
|
|
21
|
|
19
|
|
14
|
|
14
|
|
2
|
|
70
|
|
|||||||||
F-38
|
(in millions of Euros)
|
Goodwill
|
Technology
|
Computer Software
|
Customer relationships
|
Work in Progress
|
Other
|
Total intangible assets (excluding goodwill)
|
||||||||||||||
|
Net balance at January 1, 2018
|
403
|
|
24
|
|
18
|
|
15
|
|
9
|
|
2
|
|
68
|
|
|||||||
|
Additions
|
—
|
|
—
|
|
2
|
|
—
|
|
8
|
|
1
|
|
11
|
|
|||||||
|
Amortization expense
|
—
|
|
(3
|
)
|
(8
|
)
|
(1
|
)
|
—
|
|
(1
|
)
|
(13
|
)
|
|||||||
|
Transfer during the year
|
—
|
|
—
|
|
5
|
|
—
|
|
(5
|
)
|
—
|
|
—
|
|
|||||||
|
Effects of changes in foreign exchange rates
|
19
|
|
1
|
|
1
|
|
1
|
|
1
|
|
—
|
|
4
|
|
|||||||
|
Net balance at December 31, 2018
|
422
|
|
22
|
|
18
|
|
15
|
|
13
|
|
2
|
|
70
|
|
|||||||
|
Cost
|
422
|
|
84
|
|
65
|
|
39
|
|
13
|
|
3
|
|
204
|
|
|||||||
|
Less accumulated depreciation and impairment
|
—
|
|
(62
|
)
|
(47
|
)
|
(24
|
)
|
—
|
|
(1
|
)
|
(134
|
)
|
|||||||
|
Net balance at December 31, 2018
|
422
|
|
22
|
|
18
|
|
15
|
|
13
|
|
2
|
|
70
|
|
|||||||
Impairment tests for goodwill
Goodwill in the amount of
€455 million
has been allocated to the Group’s operating segment Packaging and Automotive Rolled Products (“P&ARP”) for
€448 million
, Aerospace and Transportation (“A&T”) for
€5 million
and Automotive Structures and Industry (“AS&I”) for
€2 million
.
At December 31, 2019
, the recoverable amount of our operating segments has been determined based on value in use calculations.
The recoverable amount of the A&T and AS&I operating segments significantly exceeded their carrying value. No reasonable change in the assumptions used could lead to a potential impairment charge.
For the P&ARP operating segment, the terminal value assumes a normative cash flow and a long term growth rate ranging from
0%
to
1.5%
. The discount rates applied to cash flows projections range between
9%
and
9.5%
. It was concluded that the carrying value (
€1,763 million
) did not exceed the recoverable value (
€2,653 million
) at
December 31, 2019
. Accordingly, the impairment test carried out at the P&ARP operating segment level did not lead to a goodwill impairment.
The key assumptions used in the determination of the value in use for the P&ARP operating segment are the discount rates and the perpetual growth rates used to extrapolate cash-flows beyond the forecast year.
|
–
|
Discount rates used represent the current market assessment of the risks specific to the P&ARP operating segment taking into consideration the time value of money and the risks associated with the underlying assets.
|
|
–
|
The growth rates used to extrapolate cash-flows beyond the forecast year were developed internally and are consistent with external sources of information.
|
The calculation of the recoverable value of the P&ARP operating segment is most sensitive to the following assumptions:
|
–
|
Discount rate: an increase in the discount rate by
5%
would result in the recoverable value equaling the carrying value.
|
|
–
|
Perpetual growth rate: a decrease in the perpetual growth rate by
9%
would result in the recoverable value equaling the carrying value.
|
F-39
The acquisition of
49%
of Constellium-UACJ ABS LLC was completed on January 10, 2019 and the entity is consolidated since the acquisition date. The remeasurement of the
51%
previously held equity interest in Constellium-UACJ ABS LLC at the acquisition date resulted in the recognition of a
€2 million
profit presented in Share of income / (loss) of joint ventures in the Consolidated Income Statement.
The Group's investment accounted for under the Equity method is Rhenaroll S.A.
|
(in millions of Euros)
|
Year ended December 31, 2019
|
Year ended December 31, 2018
|
||||
|
At January 1
|
1
|
|
1
|
|
||
|
Group share in loss
|
—
|
|
(33
|
)
|
||
|
Reclassified to non-current other financial assets (A)
|
—
|
|
33
|
|
||
|
At December 31
|
1
|
|
1
|
|
||
|
(A)
|
At December 31, 2018, the loan to Constellium-UACJ ABS LLC was, in substance, part of Constellium’s investment in the joint-venture. Thus, Constellium’s accumulated share of the losses of joint-ventures, in excess of the initial investment, was recognized against other financial assets for a cumulative amount of
€49 million
at December 31, 2018, of which
€33 million
was recognized during the year ended December 31, 2018.
|
|
Group share of joint venture’s net assets
|
Group share of joint venture’s profit/ (loss)
|
||||||||||||||
|
(in millions of Euros)
|
% interest
|
At December 31, 2019
|
At December 31, 2018
|
At December 31, 2019
|
At December 31, 2018
|
||||||||||
|
Constellium-UACJ ABS LLC
|
51.00
|
%
|
—
|
|
(49
|
)
|
—
|
|
(33
|
)
|
|||||
|
Rhenaroll S.A. (A)
|
49.85
|
%
|
1
|
|
1
|
|
—
|
|
—
|
|
|||||
|
Group share
|
1
|
|
(48
|
)
|
—
|
|
(33
|
)
|
|||||||
|
Reclassified to non-current other financial assets
|
—
|
|
49
|
|
—
|
|
—
|
|
|||||||
|
Investment in joint venture
|
1
|
|
1
|
|
—
|
|
(33
|
)
|
|||||||
|
(A)
|
The Group holds a
49.85%
interest in a joint venture named Rhenaroll S.A. (located in Biesheim, France), specialized in the chrome-plating, grinding and repairing of rolling mills’ roll and rollers. Rhenaroll S.A. is a private company with no quoted market price available for its shares. The investment is included in P&ARP segment assets.
|
Constellium-UACJ ABS LLC financial statements as of and for the year ended December 31, 2018
The information presented hereafter reflects the amounts included in the Consolidated Financial Statements of the relevant entity in accordance with Group accounting principles and not the Company’s share of those amounts.
F-40
|
(in millions of Euros)
|
At December 31, 2018
|
||
|
Current assets
|
|||
|
Cash and cash equivalents
|
8
|
|
|
|
Trade receivables and other
|
49
|
|
|
|
Inventories
|
68
|
|
|
|
Non-current assets
|
|||
|
Property, plant and equipment
|
166
|
|
|
|
Intangible assets
|
—
|
|
|
|
Total Assets
|
291
|
|
|
|
Current liabilities
|
|||
|
Trade payables and other
|
79
|
|
|
|
Borrowings (A)
|
36
|
|
|
|
Non-current liabilities
|
|||
|
Borrowings (A)
|
271
|
|
|
|
Equity
|
(95
|
)
|
|
|
Total Equity and Liabilities
|
291
|
|
|
|
(A)
|
In February 2018, the shareholders had agreed to modify the terms of their loan to Constellium-UACJ ABS LLC by reducing the interest rate and extending the maturity to March 31, 2023.
|
|
(in millions of Euros)
|
Year ended December 31, 2018
|
||
|
Revenue
|
262
|
|
|
|
Cost of sales
|
(309
|
)
|
|
|
Selling and administrative expenses
|
(10
|
)
|
|
|
Loss from operations
|
(57
|
)
|
|
|
Finance costs (A)
|
(7
|
)
|
|
|
Net loss
|
(64
|
)
|
|
|
(A)
|
Finance costs include a
€11 million
gain related to the shareholders’ loan modification for the year ended December 31, 2018.
|
F-41
|
(in millions of Euros)
|
At December 31, 2019
|
At December 31, 2018
|
||||
|
Deferred income tax assets
|
185
|
|
163
|
|
||
|
Deferred income tax liabilities
|
(24
|
)
|
(22
|
)
|
||
|
Net deferred income tax assets
|
161
|
|
141
|
|
||
The following tables show the changes in net deferred income tax assets / (liabilities) for the years ended
December 31, 2019
and
2018
.
|
(in millions of Euros)
|
At January 1, 2019
|
Acquisitions
|
Recognized in
|
FX and reclassifications
|
At December 31, 2019
|
|||||||||||||
|
Profit or loss
|
OCI
|
|||||||||||||||||
|
Long-term assets
|
(94
|
)
|
1
|
|
(3
|
)
|
—
|
|
(3
|
)
|
(99
|
)
|
||||||
|
Inventories
|
5
|
|
—
|
|
2
|
|
—
|
|
1
|
|
8
|
|
||||||
|
Pensions
|
116
|
|
—
|
|
(4
|
)
|
13
|
|
2
|
|
127
|
|
||||||
|
Derivative valuation
|
12
|
|
—
|
|
(8
|
)
|
2
|
|
—
|
|
6
|
|
||||||
|
Tax losses carried forward (A)
|
61
|
|
—
|
|
27
|
|
—
|
|
(13
|
)
|
75
|
|
||||||
|
Other (B)
|
41
|
|
2
|
|
—
|
|
—
|
|
1
|
|
44
|
|
||||||
|
Total
|
141
|
|
3
|
|
14
|
|
15
|
|
(12
|
)
|
161
|
|
||||||
|
(A)
|
The reclassifications resulted primarily from the adoption of IFRIC 23.
|
|
(B)
|
Other results mainly from non-deductible provisions and interest.
|
|
(in millions of Euros)
|
At January 1, 2018
|
Recognized in
|
FX
|
At December 31, 2018
|
|||||||||||
|
Profit or loss
|
OCI
|
||||||||||||||
|
Long-term assets
|
(76
|
)
|
(15
|
)
|
—
|
|
(3
|
)
|
(94
|
)
|
|||||
|
Inventories
|
4
|
|
1
|
|
—
|
|
—
|
|
5
|
|
|||||
|
Pensions
|
130
|
|
(12
|
)
|
(7
|
)
|
5
|
|
116
|
|
|||||
|
Derivative valuation
|
(20
|
)
|
22
|
|
8
|
|
2
|
|
12
|
|
|||||
|
Tax losses carried forward
|
78
|
|
(13
|
)
|
—
|
|
(4
|
)
|
61
|
|
|||||
|
Other (A)
|
23
|
|
15
|
|
—
|
|
3
|
|
41
|
|
|||||
|
Total
|
139
|
|
(2
|
)
|
1
|
|
3
|
|
141
|
|
|||||
|
(A)
|
Other results mainly from non-deductible provisions and interest.
|
Recognized Deferred Tax Assets
Some deferred tax assets in respect of temporary differences and tax losses unused were recognized without being offset by deferred tax liabilities. In accordance with the accounting policies described in Note 2.6 of the Consolidated Financial Statements, a detailed assessment was performed based on expected future performance and taxable income. It concludes that it is more likely than not that the net deferred tax asset balance of
€161 million
(
€141 million
at
December 31, 2018
) will be recoverable.
F-42
Unrecognized Deferred Tax Assets
Based on the expected taxable income of the entities, the Group believes that it is more likely than not that a total of
€1,009 million
(
€1,257 million
at
December 31, 2018
) of unused tax losses and deductible temporary differences, will not be used. Consequently, net deferred tax assets have not been recognized. The related tax impact of
€259 million
(
€321 million
at
December 31, 2018
) is attributable to the following:
|
(in millions of Euros)
|
At December 31, 2019
|
At December 31, 2018
|
||||
|
Expiring within 5 years
|
(2
|
)
|
(45
|
)
|
||
|
Expiring after 5 years and limited
|
(62
|
)
|
(89
|
)
|
||
|
Unlimited
|
(20
|
)
|
(19
|
)
|
||
|
Tax losses
|
(84
|
)
|
(153
|
)
|
||
|
Long-term assets
|
(104
|
)
|
(107
|
)
|
||
|
Pensions
|
(20
|
)
|
(18
|
)
|
||
|
Other
|
(51
|
)
|
(43
|
)
|
||
|
Deductible temporary differences
|
(175
|
)
|
(168
|
)
|
||
|
Total
|
(259
|
)
|
(321
|
)
|
||
Substantially all of the tax losses not expected to be used reside in the United States as of
December 31, 2019
.
As of December 31, 2018, the holding company in the Netherlands was not expecting to generate sufficient qualifying taxable profits in a foreseeable future to utilize its tax losses. At December 31, 2019, these tax losses were forfeited following the transfer of the head office from the Netherlands to France.
The tax loss carryforwards limited to 20 years generated at one of our main operating entities in the United States are not expected to be utilized. Although this entity is expected to be profitable in the medium or long-term, considering notably the anticipated development of the Automotive Body Sheet business, it has significant non-cash depreciation and financial interest expenses that will result in generating additional tax losses in the coming years. Accordingly, it is not probable that the entity will be able to use at its level, given the absence of an overall U.S. tax group, these tax losses before they expire. Consequently, the related deferred tax assets have not been recognized.
At
December 31, 2019
and
2018
, most of the unrecognized deferred tax assets on deductible temporary differences on long-term assets and other differences relate to the U.S. An assessment has been performed on the recoverability of the deferred tax assets on deductible temporary differences. The related deferred tax assets on long term assets and on other differences have not been recognized.
F-43
|
At December 31, 2019
|
At December 31, 2018
|
|||||||||||
|
(in millions of Euros)
|
Non-current
|
Current
|
Non-current
|
Current
|
||||||||
|
Trade payables
|
—
|
|
711
|
|
—
|
|
685
|
|
||||
|
Fixed assets payables
|
—
|
|
43
|
|
—
|
|
30
|
|
||||
|
Employees' entitlements
|
—
|
|
171
|
|
—
|
|
160
|
|
||||
|
Taxes payable other than income tax
|
—
|
|
14
|
|
—
|
|
16
|
|
||||
|
Contract liabilities and other liabilities to customers
|
6
|
|
54
|
|
9
|
|
68
|
|
||||
|
Other payables
|
15
|
|
6
|
|
18
|
|
9
|
|
||||
|
Total Other
|
21
|
|
288
|
|
27
|
|
283
|
|
||||
|
Total Trade payables and other
|
21
|
|
999
|
|
27
|
|
968
|
|
||||
Contract liabilities
|
At December 31, 2019
|
At December 31, 2018
|
|||||||||||
|
(in millions of Euros)
|
Non-current
|
Current
|
Non-current
|
Current
|
||||||||
|
Deferred tooling revenue
|
2
|
|
—
|
|
—
|
|
—
|
|
||||
|
Advance payment from customers
|
2
|
|
5
|
|
7
|
|
9
|
|
||||
|
Unrecognized variable consideration (A)
|
2
|
|
46
|
|
2
|
|
57
|
|
||||
|
Other
|
—
|
|
3
|
|
—
|
|
2
|
|
||||
|
Total contract liabilities and other liabilities to customers
|
6
|
|
54
|
|
9
|
|
68
|
|
||||
|
(A)
|
Unrecognized variable consideration consists of expected volume rebates, discounts, incentives, refunds penalties and price concessions.
|
For the twelve months ended
December 31, 2019
,
€57 million
of revenue that related to contract liabilities at
December 31, 2018
was recognized. Revenue of
€62 million
generated in the year ended
December 31, 2019
was deferred.
For the twelve months ended
December 31, 2018
,
€55 million
of revenue that related to contract liabilities at January 1, 2018 was recognized.
F-44
22.1 Analysis by nature
|
(in millions of Euros)
|
December 31, 2019
|
December 31, 2018
|
|||||||||||||||||||||||
|
Nominal Value in Currency
|
Nominal rate
|
Effective rate
|
Nominal Value In Euros
|
(Arrangement fees)
|
Accrued interests
|
Carrying value
|
Carrying value
|
||||||||||||||||||
|
Secured Pan-U.S. ABL (due 2022) (A)
|
$
|
142
|
|
Floating
|
|
4.2
|
%
|
127
|
|
—
|
|
—
|
|
127
|
|
—
|
|
||||||||
|
Secured Inventory Based Facility (due 2021) (B)
|
—
|
|
Floating
|
|
—
|
|
—
|
|
—
|
|
—
|
|
—
|
|
—
|
|
|||||||||
|
Senior Unsecured Notes
|
|
|
|
|
|
|
|
|
|||||||||||||||||
|
Constellium SE
(Issued May 2014, due 2024) |
$
|
400
|
|
5.75
|
%
|
6.26
|
%
|
356
|
|
(3
|
)
|
2
|
|
355
|
|
348
|
|
||||||||
|
Constellium SE
(Issued May 2014, due 2021) |
€
|
200
|
|
4.63
|
%
|
5.16
|
%
|
200
|
|
(1
|
)
|
1
|
|
200
|
|
300
|
|
||||||||
|
Constellium SE
(Issued February 2017, due 2025) |
$
|
650
|
|
6.63
|
%
|
7.13
|
%
|
579
|
|
(10
|
)
|
13
|
|
582
|
|
568
|
|
||||||||
|
Constellium SE
(Issued November 2017, due 2026) |
$
|
500
|
|
5.88
|
%
|
6.26
|
%
|
445
|
|
(6
|
)
|
10
|
|
449
|
|
440
|
|
||||||||
|
Constellium SE
(Issued November 2017, due 2026) |
€
|
400
|
|
4.25
|
%
|
4.57
|
%
|
400
|
|
(6
|
)
|
6
|
|
400
|
|
399
|
|
||||||||
|
Unsecured Revolving Credit Facility (due 2021) (C)
|
—
|
|
Floating
|
|
—
|
|
—
|
|
—
|
|
—
|
|
—
|
|
—
|
|
|||||||||
|
Lease liabilities
|
187
|
|
—
|
|
1
|
|
188
|
|
73
|
|
|||||||||||||||
|
Other loans (D)
|
59
|
|
—
|
|
1
|
|
60
|
|
23
|
|
|||||||||||||||
|
Total Borrowings
|
2,353
|
|
(26
|
)
|
34
|
|
2,361
|
|
2,151
|
|
|||||||||||||||
|
Of which non-current
|
2,160
|
|
2,094
|
|
|||||||||||||||||||||
|
Of which current
|
201
|
|
57
|
|
|||||||||||||||||||||
Constellium SE Senior Notes are guaranteed by certain subsidiaries.
|
(A)
|
On February 20, 2019, the Pan-U.S. ABL was amended to include Bowling Green and increased to
$350 million
. The Pan-U.S. ABL was increased to
$400 million
on May 10, 2019.
|
|
(B)
|
On March 15, 2019, the French secured Inventory Based Facility maturity was extended to 2021.
|
|
(C)
|
The Unsecured Revolving Credit Facility has a
€7 million
borrowing base and is provided by Bpifrance Financement, a related party.
|
|
(D)
|
Other loans include
€36 million
of financial liabilities relating to the sale and leaseback of assets that were considered to be financing arrangements in substance.
|
F-45
22.2 Movements in borrowings
|
(in millions of Euros)
|
Notes
|
Year ended December 31, 2019
|
Year ended December 31, 2018
|
|||||
|
At December 31, prior period
|
2,151
|
|
2,127
|
|
||||
|
IFRS 16 application
|
102
|
|
—
|
|
||||
|
At January 1
|
2,253
|
|
2,127
|
|
||||
|
Cash flows
|
||||||||
|
Repayment of Senior Notes (A)
|
(100
|
)
|
—
|
|
||||
|
Proceeds / (repayments) from revolving credit facilities and other loans
|
109
|
|
(68
|
)
|
||||
|
Lease repayments
|
(86
|
)
|
(15
|
)
|
||||
|
Non-cash changes
|
||||||||
|
Borrowings assumed through business combination
|
3
|
75
|
|
—
|
|
|||
|
Movement in interests accrued or capitalized
|
1
|
|
12
|
|
||||
|
New leases and other loans
|
75
|
|
28
|
|
||||
|
Deferred arrangement fees, step-up amortization and other
|
5
|
|
2
|
|
||||
|
Effects of changes in foreign exchange rates
|
29
|
|
65
|
|
||||
|
At December 31
|
2,361
|
|
2,151
|
|
||||
|
(A)
|
On August 8, 2019,
€100 million
of the
€300 million
outstanding aggregate principal amount of the
4.63%
Senior Notes due 2021 were redeemed.
|
22.3 Currency concentration
The composition of the carrying amounts of total borrowings in Euro equivalents is denominated in the currencies shown below:
|
(in millions of Euros)
|
At December 31, 2019
|
At December 31, 2018
|
||||
|
U.S. Dollar
|
1,597
|
|
1,408
|
|
||
|
Euro
|
746
|
|
726
|
|
||
|
Other currencies
|
18
|
|
17
|
|
||
|
Total borrowings
|
2,361
|
|
2,151
|
|
||
Covenants
The Group was in compliance with all applicable debt covenants at and for the years ended
December 31, 2019
and
2018
.
Constellium SE Senior Notes
The indentures for our outstanding Senior Notes contain customary terms and conditions, including amongst other things, limitations on incurring or guaranteeing additional indebtedness, on paying dividends, on making other restricted payments, on creating restriction on dividend and other payments to us from certain of our subsidiaries, on incurring certain liens, on selling assets and subsidiary stock, and on merging.
Pan-U.S. ABL Facility
This facility contains a fixed charge coverage ratio covenant and an EBITDA contribution ratio covenant along with customary affirmative and negative covenants. Evaluation of compliance with the maintenance covenants is only required if the excess availability falls below
10%
of the aggregate revolving loan commitment.
F-46
23.1 Financial assets and liabilities by categories
|
At December 31, 2019
|
At December 31, 2018
|
|||||||||||||||||||||||||
|
(in millions of Euros)
|
Notes
|
At amortized cost
|
At Fair Value through Profit and loss
|
At Fair Value through OCI
|
Total
|
At amortized cost
|
At Fair Value through Profit and loss
|
At Fair Value through OCI
|
Total
|
|||||||||||||||||
|
Cash and cash equivalents
|
14
|
184
|
|
—
|
|
—
|
|
184
|
|
164
|
|
—
|
|
—
|
|
164
|
|
|||||||||
|
Trade receivables
|
15
|
—
|
|
—
|
|
393
|
|
393
|
|
—
|
|
—
|
|
481
|
|
481
|
|
|||||||||
|
Other financial assets
|
—
|
|
29
|
|
—
|
|
29
|
|
74
|
|
30
|
|
—
|
|
104
|
|
||||||||||
|
Total
|
184
|
|
29
|
|
393
|
|
606
|
|
238
|
|
30
|
|
481
|
|
749
|
|
||||||||||
|
At December 31, 2019
|
At December 31, 2018
|
|||||||||||||||||||||||||
|
(in millions of Euros)
|
Notes
|
At amortized cost
|
At Fair Value through Profit and loss
|
At Fair Value through OCI
|
Total
|
At amortized cost
|
At Fair Value through Profit and loss
|
At Fair Value through OCI
|
Total
|
|||||||||||||||||
|
Trade payables and fixed assets payables
|
21
|
754
|
|
—
|
|
—
|
|
754
|
|
715
|
|
—
|
|
—
|
|
715
|
|
|||||||||
|
Borrowings
|
22
|
2,361
|
|
—
|
|
—
|
|
2,361
|
|
2,151
|
|
—
|
|
—
|
|
2,151
|
|
|||||||||
|
Other financial liabilities
|
—
|
|
44
|
|
14
|
|
58
|
|
—
|
|
79
|
|
10
|
|
89
|
|
||||||||||
|
Total
|
3,115
|
|
44
|
|
14
|
|
3,173
|
|
2,866
|
|
79
|
|
10
|
|
2,955
|
|
||||||||||
The table below details other financial assets and other financial liabilities positions:
|
At December 31, 2019
|
At December 31, 2018
|
|||||||||||||||||
|
(in millions of Euros)
|
Non-current
|
Current
|
Total
|
Non-current
|
Current
|
Total
|
||||||||||||
|
Derivatives
|
7
|
|
22
|
|
29
|
|
7
|
|
23
|
|
30
|
|
||||||
|
Aluminium and premium future contracts
|
1
|
|
8
|
|
9
|
|
2
|
|
7
|
|
9
|
|
||||||
|
Energy future contracts
|
—
|
|
—
|
|
—
|
|
—
|
|
—
|
|
—
|
|
||||||
|
Other future contracts
|
—
|
|
—
|
|
—
|
|
—
|
|
—
|
|
—
|
|
||||||
|
Currency commercial contracts
|
5
|
|
12
|
|
17
|
|
3
|
|
12
|
|
15
|
|
||||||
|
Currency net debt derivatives
|
1
|
|
2
|
|
3
|
|
2
|
|
4
|
|
6
|
|
||||||
|
Loans (A)
|
—
|
|
—
|
|
—
|
|
67
|
|
2
|
|
69
|
|
||||||
|
Margin call
|
—
|
|
—
|
|
—
|
|
—
|
|
5
|
|
5
|
|
||||||
|
Other financial assets
|
7
|
|
22
|
|
29
|
|
74
|
|
30
|
|
104
|
|
||||||
|
Derivatives
|
23
|
|
35
|
|
58
|
|
29
|
|
60
|
|
89
|
|
||||||
|
Aluminium and premium future contracts
|
4
|
|
10
|
|
14
|
|
6
|
|
38
|
|
44
|
|
||||||
|
Energy future contracts
|
—
|
|
1
|
|
1
|
|
—
|
|
—
|
|
—
|
|
||||||
|
Other future contracts
|
2
|
|
4
|
|
6
|
|
5
|
|
3
|
|
8
|
|
||||||
|
Currency commercial contracts
|
12
|
|
16
|
|
28
|
|
7
|
|
12
|
|
19
|
|
||||||
|
Net investment hedge
|
—
|
|
—
|
|
—
|
|
—
|
|
4
|
|
4
|
|
||||||
|
Currency net debt derivatives
|
5
|
|
4
|
|
9
|
|
11
|
|
3
|
|
14
|
|
||||||
|
Other financial liabilities
|
23
|
|
35
|
|
58
|
|
29
|
|
60
|
|
89
|
|
||||||
|
(A)
|
At December 31, 2018, Loans corresponds to a loan facility to Constellium-UACJ ABS LLC (See
|
F-47
23.2 Fair values
All derivatives are presented at fair value in the Consolidated Statement of Financial Position.
The carrying value of the Group’s borrowings at maturity is the redemption value.
The fair value of Constellium SE Senior Notes issued in May 2014, February 2017 and November 2017 account for
102%
,
104%
and
105%
respectively of the nominal value and amount to
€570 million
,
€603 million
and
€887 million
, respectively, at
December 31, 2019
. The fair value was classified as a Level 1 measurement under the fair value hierarchy provided by IFRS 13 –
Fair Value Measurement
.
The fair values of the other financial assets and liabilities approximate their carrying values, as a result of their liquidity or short maturity.
23.3 Valuation hierarchy
The following table provides an analysis of derivatives measured at fair value, grouped into levels based on the degree to which the fair value is observable:
|
•
|
Level 1 valuation is based on a quoted price (unadjusted) in active markets for identical financial instruments. Level 1 includes aluminium, copper and zinc futures that are traded on the LME.
|
|
•
|
Level 2 valuation is based on inputs other than quoted prices included within Level 1 that are observable for the assets or liabilities, either directly (i.e. prices) or indirectly (i.e. derived from prices). Level 2 includes foreign exchange derivatives;
|
|
•
|
Level 3 valuation is based on inputs for the asset or liability that are not based on observable market data (unobservable inputs). Trade receivables are classified as a Level 3 measurement under the fair value hierarchy.
|
|
At December 31, 2019
|
At December 31, 2018
|
|||||||||||||||||||||||
|
(in millions of Euros)
|
Level 1
|
Level 2
|
Level 3
|
Total
|
Level 1
|
Level 2
|
Level 3
|
Total
|
||||||||||||||||
|
Other financial assets - derivatives
|
8
|
|
21
|
|
—
|
|
29
|
|
9
|
|
21
|
|
—
|
|
30
|
|
||||||||
|
Other financial liabilities - derivatives
|
19
|
|
39
|
|
—
|
|
58
|
|
50
|
|
39
|
|
—
|
|
89
|
|
||||||||
There was no material transfer of asset and liability categories into or out of Level 1, Level 2 or Level 3 during the years ended
December 31, 2019
and
2018
.
The Group’s financial risk management strategy focuses on minimizing the cash flow impacts of volatility in foreign currency exchange rates, metal prices and interest rates, while maintaining the financial flexibility the Group requires in order to successfully execute the Group’s business strategy.
Due to Constellium’s capital structure and the nature of its operations, the Group is exposed to the following financial risks: (i) market risk (including foreign exchange risk, commodity price risk and interest rate risk); (ii) credit risk and (iii) liquidity and capital management risk.
F-48
24.1 Market risk
i. Foreign exchange risk
Net assets, earnings and cash flows are influenced by multiple currencies due to the geographic diversity of sales and the countries in which the Group operates.
Constellium is exposed to foreign exchange risk in the following areas:
|
•
|
Transaction exposures, which include:
|
|
◦
|
Commercial transactions related to forecasted sales and purchases and on-balance sheet receivables/payables resulting from such transactions;
|
|
◦
|
Financing transactions, related to external and internal net debt;
|
|
•
|
Translation exposures, which relate to net investments in foreign entities that are converted in Euros in the Consolidated Financial Statements.
|
Commercial transaction exposures
The Group policy is to hedge committed and highly probable forecasted foreign currency operational transactions. The Group uses foreign exchange forwards and foreign exchange swaps for this purpose.
The following tables outline the nominal value (converted to millions of Euros at the closing rate) of derivatives for Constellium’s most significant foreign exchange exposures as at
December 31, 2019
.
|
Forward derivative sales
|
Maturity Year
|
Less than 1 year
|
Over 1 year
|
|||||
|
USD/EUR
|
2020-2024
|
446
|
|
157
|
|
|||
|
EUR/CHF
|
2020-2023
|
79
|
|
35
|
|
|||
|
Other currencies
|
2020
|
10
|
|
—
|
|
|||
|
Forward derivative purchases
|
Maturity Year
|
Less than 1 year
|
Over 1 year
|
|||||
|
USD/EUR
|
2020-2024
|
473
|
|
77
|
|
|||
|
EUR/CHF
|
2020-2024
|
130
|
|
61
|
|
|||
|
EUR/CZK
|
2020
|
81
|
|
—
|
|
|||
|
Other currencies
|
2020
|
2
|
|
—
|
|
|||
Forward derivative sales mean that the Group sells currency 1 versus currency 2. Forward derivative purchases mean that the Group buys currency 1 versus currency 2.
In 2016, the Group agreed with a major customer for the sale of fabricated metal products in U.S. Dollars to be supplied from a Euro functional currency entity. In line with its hedging policy, the Group entered into significant foreign exchange derivatives which match related highly probable future conversion sales by selling U.S. Dollars against Euros. The Group designated these derivatives for hedge accounting, with total nominal amount of
$233 million
, as of
December 31, 2019
(
$369 million
as of
December 31, 2018
), and maturities of
2020
to
2022
.
For hedges that do not qualify for hedge accounting, any mark-to-market movements are recognized in Other gains / (losses) - net.
F-49
The table below details the effect of foreign currency derivatives in the Consolidated Income Statement and the Consolidated Statement of Comprehensive Income / (Loss):
|
(in millions of Euros)
|
Notes
|
Year ended December 31, 2019
|
Year ended December 31, 2018
|
Year ended December 31, 2017
|
|||||||
|
Derivatives that do not qualify for hedge accounting
|
|||||||||||
|
Included in Other gains / (losses) - net
|
|||||||||||
|
Realized gains / (losses) on foreign currency derivatives - net
|
10
|
7
|
|
7
|
|
(16
|
)
|
||||
|
Unrealized gains / (losses) on foreign currency derivatives - net (A)
|
10
|
2
|
|
(1
|
)
|
16
|
|
||||
|
Derivatives that qualify for hedge accounting
|
|||||||||||
|
Included in Revenue
|
|||||||||||
|
Realized (losses) / gains on foreign currency derivatives - net
|
10
|
(6
|
)
|
4
|
|
1
|
|
||||
|
Unrealized (losses) / gains on foreign currency derivatives - net
|
10
|
(1
|
)
|
(2
|
)
|
1
|
|
||||
|
Included in Other gains / (losses) - net
|
|||||||||||
|
Realized gains / (losses) in ineffective portion of derivatives
|
—
|
|
—
|
|
—
|
|
|||||
|
Included in Other comprehensive income / (loss)
|
|||||||||||
|
Unrealized (losses) / gains on foreign currency derivatives - net
|
(15
|
)
|
(23
|
)
|
48
|
|
|||||
|
Gains / (losses) reclassified from cash flow hedge reserve to Consolidated Income Statement
|
7
|
|
(2
|
)
|
(2
|
)
|
|||||
|
(A)
|
Gains or losses on the hedging instruments are expected to offset losses or gains on the underlying hedged forecasted sales that will be reflected in future years when these sales are recognized.
|
Financing transaction exposures
When the Group enters into intercompany loans and deposits, the financing is generally provided in the functional currency of the subsidiary. The foreign currency exposure of the Group’s external funding and liquid assets is systematically hedged either naturally through external foreign currency loans and deposits or through cross currency basis swaps and simple foreign currency swaps.
At
December 31, 2019
, the net position hedged related to loans and deposits was
$334 million
versus the Euro. This comprised of a forward purchase of
$415 million
versus the Euro, a forward sale of
$125 million
versus the Euro, both using cross currency basis swaps, and a forward purchase of
$44 million
versus the Euro using simple foreign exchange forward contracts.
The table below details the effect of foreign currency derivatives in the Consolidated Income Statement:
|
(in millions of Euros)
|
Year ended December 31, 2019
|
Year ended December 31, 2018
|
Year ended December 31, 2017
|
||||||
|
Derivatives
|
|
|
|||||||
|
Included in Finance costs - net
|
|
|
|||||||
|
Realized gains / (losses) on foreign currency derivatives - net
|
9
|
|
5
|
|
31
|
|
|||
|
Unrealized gains / (losses) on foreign currency derivatives - net
|
4
|
|
23
|
|
(110
|
)
|
|||
|
Total
|
13
|
|
28
|
|
(79
|
)
|
|||
In accordance with the Group policy, the net foreign exchange result related to financing activities is expected to be balanced at any time.
F-50
Net debt derivatives settled during the year are presented in ‘Other financing activities’ in the Consolidated Statement of Cash Flows.
Foreign exchange sensitivity on commercial and financing transaction exposures
The largest exposures of the Group are related to the Euro/U.S. Dollar exchange rate. The table below summarizes the impact on profit and Equity (before tax effect) of a 10% strengthening of the U.S. Dollar versus the Euro for non U.S. Dollar functional currency entities.
|
(in millions of Euros)
|
Effect on profit before tax
|
Effect on pretax equity
|
||||
|
Trade receivables
|
2
|
|
—
|
|
||
|
Trade payables
|
(1
|
)
|
—
|
|
||
|
Derivatives on commercial transaction (A)
|
(4
|
)
|
(23
|
)
|
||
|
Commercial transaction exposure
|
(3
|
)
|
(23
|
)
|
||
|
Cash in Bank and intercompany loans
|
120
|
|
—
|
|
||
|
Borrowings
|
(153
|
)
|
—
|
|
||
|
Derivatives on financing transaction
|
33
|
|
—
|
|
||
|
Financing transaction exposure
|
—
|
|
—
|
|
||
|
Total
|
(3
|
)
|
(23
|
)
|
||
|
(A)
|
Gains or losses on the hedging instruments are expected to offset losses or gains on the underlying hedged forecasted sales that will be reflected in future years when these sales are recognized. The impact on pretax equity (
€23 million
) relates to derivatives hedging future sales spread from 2020 to 2022 which are designated as cash flow hedges.
|
The amounts shown in the table above may not be indicative of future results since the balances of financial assets and liabilities may change.
Translation exposures
Foreign exchange impacts related to the translation to Euro of net investments in foreign subsidiaries, and related revenues and expenses are not hedged as the Group operates in these various countries on permanent basis (except as described below).
In June 2018, the Group entered into forward contracts with nominal amount of CHF
174 million
to hedge the currency risk associated with the translation of the net assets of its Swiss operations into the Group’s presentation currency. The Group designated these derivatives as a net investment hedge. The loss of the net investment hedge realized in 2019 is included in Currency translation differences within Other comprehensive income for
€3 million
.
Foreign exchange sensitivity
The exposure relates to foreign currency translation of net investments in foreign subsidiaries and arises mainly from operations conducted by U.S. Dollar functional currency subsidiaries.
The table below summarizes the impact on profit and Equity (before tax effect) of a 10% strengthening of the U.S. Dollar versus the Euro (on average rate for profit before tax and closing rate for pretax equity) for U.S. Dollar functional currency entities.
|
(in millions of Euros)
|
Effect on profit before tax
|
Effect on pretax equity
|
||||
|
10% strengthening U.S. Dollar/Euro
|
(4
|
)
|
16
|
|
||
The amounts shown in the table above may not be indicative of future results since the balances of financial assets and liabilities may change.
F-51
Margin calls
Our financial counterparties may require margin calls should our mark-to-market exceed a pre-agreed contractual limit. In order to protect from the potential margin calls for significant market movements, the Group ensures that financial counterparts hedging the transactional exposure are also hedging the foreign currency loan and deposit exposure. Further, the Group holds a significant liquidity buffer in cash or in availability under its various borrowing facilities, enters into derivatives with a large number of financial counterparties and monitors margin requirements on a daily basis.
At
December 31, 2019
and
2018
, the margin requirement related to foreign exchange hedges was not material and the Group was not exposed to material margin call risk.
ii. Commodity price risk
The Group is subject to the effects of market fluctuations in the price of aluminium, which is the Group’s primary metal input and a significant component of its output. The Group is also exposed to variation in the regional premium and in the price of zinc, natural gas, silver and copper but in a less significant way.
The Group policy is to minimize exposure to aluminium price volatility by passing through the aluminium price risk to customers and using derivatives where necessary. For most of its aluminium price exposure, sales and purchases of aluminium are converted to be on the same floating basis and then the same quantities are bought and sold at the same (market) price. The Group also purchases fixed price aluminium forwards to offset the exposure of LME volatility on its fixed price sales agreements for the supply of metal.
The group also purchases fixed price copper, aluminium premium, silver and zinc forwards to offset the commodity exposure where sales contracts have embedded fixed price agreements for the relevant commodity.
In addition, the Group also purchases natural gas fixed price forwards to lock in energy costs where a fixed price purchase contract is not possible.
At
December 31, 2019
, the nominal amount of commodity derivatives is as follows:
|
(in millions of Euros)
|
Maturity
|
Less than 1 year
|
Over 1 year
|
|||||
|
Aluminium
|
2020-2023
|
283
|
|
33
|
|
|||
|
Premium
|
2020-2021
|
11
|
|
2
|
|
|||
|
Copper
|
2020-2022
|
10
|
|
7
|
|
|||
|
Silver
|
2020-2021
|
6
|
|
—
|
|
|||
|
Zinc
|
2020-2022
|
9
|
|
9
|
|
|||
|
Natural gas
|
2020-2021
|
5
|
|
2
|
|
|||
The value of the contracts will fluctuate due to changes in market prices but the hedge strategy helps protecting the Group’s margin on future conversion and fabrication activities. At
December 31, 2019
, these contracts were directly entered into with external counterparties.
The Group does not apply hedge accounting on commodity derivatives and therefore any mark-to-market movements are recognized in Other gains / (losses) - net.
|
(in millions of Euros)
|
Year ended December 31, 2019
|
Year ended December 31, 2018
|
Year ended December 31, 2017
|
||||||
|
Derivatives
|
|||||||||
|
Included in Other gains / (losses) - net
|
|||||||||
|
Realized (losses) / gains on commodity derivatives - net
|
(56
|
)
|
7
|
|
16
|
|
|||
|
Unrealized gains / (losses) on commodity derivatives - net
|
31
|
|
(83
|
)
|
41
|
|
|||
F-52
Commodity price sensitivity: risks associated with derivatives
The net impact on earnings and equity of a 10% increase in the market price of aluminium, based on the aluminium derivatives held by the Group at
December 31, 2019
(before tax effect), with all other variables held constant was estimated to be a
€28 million
gain. The balances of such financial instruments may change in future years however, and therefore the amounts shown may not be indicative of future results.
Margin Calls
As the LME price for aluminium falls, the derivative contracts entered into with financial institution counterparties have a negative mark-to-market. The Group’s financial institution counterparties may require margin calls should the negative mark-to-market exceed a pre-agreed contractual limit. In order to protect from the potential margin calls for significant market movements, the Group enters into derivatives with a large number of financial counterparties and monitors margin requirements on a daily basis for adverse movements in aluminium prices. At
December 31, 2019
, there was
no
margin requirement related to aluminium or any other commodity hedges. At
December 31, 2018
, the margin requirement related to aluminium or any other commodity hedges was
€5 million
. Margins call supported by the Group was to be partially offset by advance payments received from customers and the Group was not exposed to any other material margin call risk.
iii. Interest rate risk
Interest rate risk refers to the risk that the value of financial instruments held by the Group and that are subject to variable rates will fluctuate, or the cash flows associated with such instruments will be impacted due to changes in market interest rates. The Group’s interest rate risk arises principally from borrowings. Borrowings issued at variable rates expose the Group to cash flow interest rate risk, which is partially offset by cash and cash equivalent deposits (including short-term investments) earning interest at variable interest rates. Borrowings issued at fixed rates expose the Group to fair value interest rate risk. (See
NOTE 23 - Financial Instruments
). At
December 31, 2019
, Group’s borrowings were mainly at fixed rate.
Interest rate sensitivity: risks associated with variable-rate financial instruments
The impact on income before income tax for the year of a 50 basis point increase or decrease in the LIBOR or EURIBOR interest rates, based on the variable rate financial instruments held by the Group at
December 31, 2019
, with all other variables held constant, was estimated to be less than
€1 million
for the years ended
December 31, 2019
and
2018
. However, the balances of such financial instruments may not remain constant in future years, and therefore the amounts shown may not be indicative of future results.
24.2 Credit risk
Credit risk is the risk that a counterparty will not meet its obligations under a financial instrument or customer contract, leading to a financial loss. The Group is exposed to credit risk with financial institutions and other parties as a result of cash-in-bank, cash deposits, mark-to-market on derivative transactions and customer trade receivables arising from the Group’s operating activities. The maximum exposure to credit risk for the year ended
December 31, 2019
is the carrying value of each class of financial asset as described in
NOTE 23 - Financial Instruments
. The Group does not generally hold any collateral as security.
Credit risk related to transactions with financial institutions
Credit risk with financial institutions is managed by the Group’s Treasury department in accordance with a Board approved policy. Management is not aware of any significant risks associated with financial institutions as a result of cash and cash equivalent deposits, including short-term investments, and financial derivative transactions.
F-53
The number of financial counterparties is tabulated below showing our exposure to the counterparty by rating type (Parent company ratings from Moody’s Investor Services):
|
At December 31, 2019
|
At December 31, 2018
|
|||||||||||
|
Number of financial counterparties (A)
|
Exposure (in millions of Euros)
|
Number of financial counterparties (A)
|
Exposure (in millions of Euros)
|
|||||||||
|
Rated Aa or better
|
2
|
|
83
|
|
2
|
|
22
|
|
||||
|
Rated A
|
9
|
|
81
|
|
8
|
|
110
|
|
||||
|
Rated Baa
|
3
|
|
5
|
|
2
|
|
4
|
|
||||
|
Total
|
14
|
|
169
|
|
12
|
|
136
|
|
||||
|
(A)
|
Financial Counterparties for which the Group’s exposure is below
€0.25 million
have been excluded from the analysis.
|
Credit risks related to customer trade receivables
The Group has a diverse customer base geographically and by industry. The responsibility for customer credit risk management rests with management. Payment terms vary and are set in accordance with practices in the different geographies and end-markets served. Credit limits are typically established based on internal or external rating criteria, which take into account such factors as the financial condition of the customers, their credit history and the risk associated with their industry segment.
Trade receivables are actively monitored and managed, at the business unit or site level. Business units report credit exposure information to Constellium management on a regular basis. Over
82%
of the Group’s trade account receivables are insured by insurance companies
rated A3
or better, or sold to a factor on a non-recourse basis. In situations where collection risk is considered to be above acceptable levels, risk is mitigated through the use of advance payments, bank guarantees or letters of credit.
Historically, we have a very low level of customer default as a result of long history of dealing with our customer base and an active credit monitoring function. See
NOTE 15 - Trade Receivables and Other
for the aging of trade receivables.
24.3 Liquidity and capital risk management
The Group’s capital structure includes shareholder’s equity, borrowings and various third-party financing arrangements (such as credit facilities and factoring arrangements). Constellium’s total capital is defined as total equity plus net debt. Net debt includes borrowings due to third parties less cash and cash equivalents.
Constellium’s overriding objectives when managing capital are to safeguard the business as a going concern, to maximize returns for its owners and to maintain an optimal capital structure in order to minimize the weighted cost of capital.
All activities around cash funding, borrowings and financial instruments are centralized within Constellium’s Treasury department. Direct external funding or transactions with banks at the operating entity level are generally not permitted, and exceptions must be approved by Constellium’s Treasury department.
The liquidity requirements of the overall Company are funded by drawing on available credit facilities, while the internal management of liquidity is optimized by means of cash pooling agreements and/or intercompany loans and deposits between the Company’s operating entities and central Treasury.
At
December 31, 2019
, the borrowing base for the Pan-U.S. ABL facility and the French Inventory Based Facility were
$375 million
and
€82 million
respectively. After deduction of amount drawn and letters of credit, the Group had
€281 million
outstanding availability under these secured revolving credit facilities at
December 31, 2019
.
At
December 31, 2019
, liquidity was
€516 million
, comprised of
€184 million
of cash and cash equivalents and
€332 million
of available undrawn facilities, including the
€281 million
described above.
F-54
The tables below show undiscounted contractual financial assets and financial liabilities values by relevant maturity groupings based on the remaining periods from
December 31, 2019
and
December 31, 2018
respectively to the contractual maturity date.
|
At December 31, 2019
|
At December 31, 2018
|
|||||||||||||||||
|
(in millions of Euros)
|
Less than 1 year
|
Between 1- 5 years
|
Over 5 years
|
Less than 1 year
|
Between 1 - 5 years
|
Over 5 years
|
||||||||||||
|
Financial assets
|
||||||||||||||||||
|
Net debt derivatives
|
3
|
|
4
|
|
—
|
|
5
|
|
12
|
|
—
|
|
||||||
|
Net cash flows from derivative assets related to currencies and commodities
|
21
|
|
9
|
|
—
|
|
22
|
|
12
|
|
—
|
|
||||||
|
Total
|
24
|
|
13
|
|
—
|
|
27
|
|
24
|
|
—
|
|
||||||
|
At December 31, 2019
|
At December 31, 2018
|
|||||||||||||||||||
|
(in millions of Euros)
|
Notes
|
Less than 1 year
|
Between 1 - 5 years
|
After 5 years
|
Less than 1 year
|
Between 1 - 5 Years
|
After 5 years
|
|||||||||||||
|
Financial liabilities
|
||||||||||||||||||||
|
Borrowings (A)
|
139
|
|
589
|
|
1,438
|
|
6
|
|
315
|
|
1,754
|
|
||||||||
|
Leases
|
40
|
|
113
|
|
88
|
|
20
|
|
50
|
|
16
|
|
||||||||
|
Interest (B)
|
112
|
|
404
|
|
85
|
|
114
|
|
422
|
|
173
|
|
||||||||
|
Net debt derivatives
|
4
|
|
—
|
|
—
|
|
3
|
|
4
|
|
—
|
|
||||||||
|
Net cash flows from derivative liabilities related to currencies and commodities
|
31
|
|
25
|
|
—
|
|
56
|
|
35
|
|
—
|
|
||||||||
|
Trade payables and other (excluding contract liabilities)
|
21
|
945
|
|
15
|
|
—
|
|
900
|
|
18
|
|
—
|
|
|||||||
|
Total
|
1,271
|
|
1,146
|
|
1,611
|
|
1,079
|
|
794
|
|
1,927
|
|
||||||||
|
(A)
|
Borrowings include the Pan-U.S. ABL facility, which is considered short-term in nature and is included in the category “Less than 1 year”.
|
|
(B)
|
Interest disclosed is an undiscounted forecast interest amount and excludes interest on leases.
|
F-55
The Group operates a number of pensions, other post-employment benefits and other long-term employee benefit plans. Some of these plans are defined contribution plans and some are defined benefit plans, with assets held in separate trustee-administered funds. Benefits paid through pension trusts are sufficiently funded to ensure the payment of benefits to retirees when they become due.
Actuarial valuations are reflected in the Consolidated Financial Statements as described in NOTE 2.6 - Principles governing the preparation of the Consolidated Financial Statements.
25.1 Description of the plans
Pension plans
Constellium’s pension obligations are in the U.S., Switzerland, Germany and France. Pension benefits are generally based on the employee’s service and highest average eligible compensation before retirement and are periodically adjusted for cost of living increases, either by company practice, collective agreement or statutory requirement. U.S., Swiss and France benefit plans are funded through long-term employee benefit funds.
Other post-employment benefits (OPEB)
The Group provides health care and life insurance benefits to retired employees and in some cases to their beneficiaries and covered dependents, mainly in the U.S. Eligibility for coverage depends on certain age and service criteria. These benefit plans are unfunded.
Other long-term employee benefits
Other long term employee benefits mainly include jubilees in France, Germany and Switzerland and other long-term disability benefits in the U.S. These benefit plans are unfunded.
25.2 Description of risks
Our estimates of liabilities and expenses for pensions and other post-employment benefits incorporate a number of assumptions, including discount rate, longevity estimate and inflation rate. The defined benefit obligations expose the Group to a number of risks, including longevity, inflation, interest rate, medical cost inflation, investment performance, and change in law governing the employee benefit obligations. These risks are mitigated when possible by applying an investment strategy for the funded schemes which aims to minimize the long-term costs. This is achieved by investing in a diversified selection of asset classes, which aims to reduce the volatility of returns and also achieves a level of matching with the underlying liabilities.
Investment performance risk
Our pension plan assets consist primarily of funds invested in listed stocks and bonds.
The present value of funded defined benefit obligations is calculated using a discount rate determined by reference to high quality corporate bond yields. If the return on plan asset is below this rate, it will increase the plan deficit.
F-56
Interest rate risk
A decrease in the discount rate will increase the defined benefit obligation. At
December 31, 2019
, impacts of the change on the defined benefit obligation of a
0.50%
increase / decrease in the discount rates are calculated by using a proxy based on the duration of each scheme:
|
(in millions of Euros)
|
0.50% increase in
discount rates |
0.50% decrease in
discount rates |
||||
|
France
|
(10
|
)
|
10
|
|
||
|
Germany
|
(9
|
)
|
11
|
|
||
|
Switzerland
|
(25
|
)
|
26
|
|
||
|
United States
|
(32
|
)
|
35
|
|
||
|
Total sensitivity on Defined Benefit Obligations
|
(76
|
)
|
82
|
|
||
Longevity risk
The present value of the defined benefit obligation is calculated by reference to the best estimate of the mortality of plan participants. An increase in the life expectancy of the plan participants will increase the plan’s liability.
25.3 Actuarial assumptions
Pension and other post-employment benefit obligations were updated based on the discount rates applicable at
December 31, 2019
. The principal actuarial assumptions used at
December 31, 2019
and
2018
were as follows:
|
|
||||||||||||
|
At December 31, 2019
|
At December 31, 2018
|
|||||||||||
|
Rate of increase in salaries
|
Rate of increase in pensions
|
Discount rate
|
Rate of increase in salaries
|
Rate of increase in pensions
|
Discount rate
|
|||||||
|
Switzerland
|
1.50%
|
—
|
0.15%
|
1.50%
|
—
|
0.80%
|
||||||
|
US
|
—
|
—
|
—
|
—
|
—
|
—
|
||||||
|
Hourly pension
|
2.20%
|
—
|
3.15% - 3.25%
|
2.20%
|
—
|
4.40% - 4.45%
|
||||||
|
Salaried pension
|
3.80%
|
—
|
3.25%
|
3.80%
|
—
|
4.45%
|
||||||
|
OPEB (A)
|
3.80%
|
—
|
3.20% - 3.40%
|
3.80%
|
—
|
4.40% - 4.55%
|
||||||
|
Other benefits
|
3.80%
|
—
|
3.00% - 3.20%
|
3.80%
|
—
|
4.25% - 4.40%
|
||||||
|
France
|
1.50% - 3.50%
|
2.00%
|
—
|
1.50% - 2.50%
|
2.00%
|
—
|
||||||
|
Retirements
|
—
|
—
|
0.95%
|
—
|
—
|
1.65%
|
||||||
|
Other benefits
|
—
|
—
|
0.80%
|
—
|
—
|
1.35%
|
||||||
|
Germany
|
2.75%
|
1.70%
|
1.00%
|
2.75%
|
1.70%
|
1.70%
|
||||||
|
(A)
|
The other main financial assumptions used for the OPEB (healthcare plans, which are predominantly in the U.S.) were:
|
|
•
|
Medical trend rate: pre 65:
6.40%
starting in
2020
decreasing gradually to
4.50%
until 2026 and stable onwards and post 65:
5.60%
starting in 2020 decreasing gradually to
4.50%
until 2026 and stable onwards, and
|
|
•
|
Claims costs are based on individual company experience.
|
For both pension and healthcare plans, the post-employment mortality assumptions allow for future improvements in life expectancy.
F-57
25.4 Amounts recognized in the Consolidated Statement of Financial Position
|
At December 31, 2019
|
At December 31, 2018
|
|||||||||||||||||
|
(in millions of Euros)
|
Pension Benefits
|
Other Benefits
|
Total
|
Pension Benefits
|
Other Benefits
|
Total
|
||||||||||||
|
Present value of funded obligation
|
768
|
|
—
|
|
768
|
|
674
|
|
—
|
|
674
|
|
||||||
|
Fair value of plan assets
|
(445
|
)
|
—
|
|
(445
|
)
|
(380
|
)
|
—
|
|
(380
|
)
|
||||||
|
Deficit of funded plans
|
323
|
|
—
|
|
323
|
|
294
|
|
—
|
|
294
|
|
||||||
|
Present value of unfunded obligation
|
127
|
|
220
|
|
347
|
|
115
|
|
201
|
|
316
|
|
||||||
|
Net liability arising from defined benefit obligation
|
450
|
|
220
|
|
670
|
|
409
|
|
201
|
|
610
|
|
||||||
25.5 Movement in net defined benefit obligations
|
At December 31, 2019
|
|||||||||||||||
|
Defined benefit obligations
|
Plan Assets
|
Net defined benefit liability
|
|||||||||||||
|
(in millions of Euros)
|
Pension benefits
|
Other benefits
|
Total
|
||||||||||||
|
At January 1, 2019
|
789
|
|
201
|
|
990
|
|
(380
|
)
|
610
|
|
|||||
|
Included in the Consolidated Income Statement
|
|||||||||||||||
|
Current service cost
|
17
|
|
7
|
|
24
|
|
—
|
|
24
|
|
|||||
|
Interest cost / (income)
|
18
|
|
8
|
|
26
|
|
(10
|
)
|
16
|
|
|||||
|
Past service cost
|
(2
|
)
|
1
|
|
(1
|
)
|
—
|
|
(1
|
)
|
|||||
|
Immediate recognition of gains / (losses) arising over the year
|
—
|
|
2
|
|
2
|
|
—
|
|
2
|
|
|||||
|
Administration expenses
|
—
|
|
—
|
|
—
|
|
2
|
|
2
|
|
|||||
|
Included in the Statement of Comprehensive Income / (Loss)
|
|||||||||||||||
|
Remeasurements due to:
|
|||||||||||||||
|
—actual return less interest on plan assets
|
—
|
|
—
|
|
—
|
|
(54
|
)
|
(54
|
)
|
|||||
|
—changes in financial assumptions
|
101
|
|
25
|
|
126
|
|
—
|
|
126
|
|
|||||
|
—changes in demographic assumptions
|
(2
|
)
|
(2
|
)
|
(4
|
)
|
—
|
|
(4
|
)
|
|||||
|
—experience losses
|
(3
|
)
|
(6
|
)
|
(9
|
)
|
—
|
|
(9
|
)
|
|||||
|
Effects of changes in foreign exchange rates
|
16
|
|
3
|
|
19
|
|
(11
|
)
|
8
|
|
|||||
|
Included in the Consolidated Statement of Cash Flows
|
|||||||||||||||
|
Benefits paid
|
(43
|
)
|
(20
|
)
|
(63
|
)
|
38
|
|
(25
|
)
|
|||||
|
Contributions by the Group
|
—
|
|
—
|
|
—
|
|
(25
|
)
|
(25
|
)
|
|||||
|
Contributions by the plan participants
|
4
|
|
1
|
|
5
|
|
(5
|
)
|
—
|
|
|||||
|
At December 31, 2019
|
895
|
|
220
|
|
1,115
|
|
(445
|
)
|
670
|
|
|||||
F-58
|
At December 31, 2018
|
|||||||||||||||
|
Defined benefit obligations
|
Plan Assets
|
Net defined benefit liability
|
|||||||||||||
|
(in millions of Euros)
|
Pension benefits
|
Other benefits
|
Total
|
||||||||||||
|
At January 1, 2018
|
801
|
|
250
|
|
1,051
|
|
(387
|
)
|
664
|
|
|||||
|
Included the Consolidated Income Statement
|
|
|
|
|
|
||||||||||
|
Current service cost
|
18
|
|
6
|
|
24
|
|
—
|
|
24
|
|
|||||
|
Interest cost / (income)
|
16
|
|
8
|
|
24
|
|
(9
|
)
|
15
|
|
|||||
|
Past service cost
|
—
|
|
(36
|
)
|
(36
|
)
|
—
|
|
(36
|
)
|
|||||
|
Immediate recognition of gains / (losses) arising over the year
|
—
|
|
—
|
|
—
|
|
—
|
|
—
|
|
|||||
|
Administration expenses
|
—
|
|
—
|
|
—
|
|
2
|
|
2
|
|
|||||
|
Included in the Statement of Comprehensive Income / (Loss)
|
|
|
|
|
|
||||||||||
|
Remeasurements due to:
|
|
|
|
|
|
||||||||||
|
—actual return less interest on plan assets
|
—
|
|
—
|
|
—
|
|
26
|
|
26
|
|
|||||
|
—changes in financial assumptions
|
(30
|
)
|
(15
|
)
|
(45
|
)
|
—
|
|
(45
|
)
|
|||||
|
—changes in demographic assumptions
|
(5
|
)
|
(1
|
)
|
(6
|
)
|
—
|
|
(6
|
)
|
|||||
|
—experience losses
|
(1
|
)
|
(2
|
)
|
(3
|
)
|
—
|
|
(3
|
)
|
|||||
|
Effects of changes in foreign exchange rates
|
22
|
|
9
|
|
31
|
|
(16
|
)
|
15
|
|
|||||
|
Included in the Consolidated Statement of Cash Flows
|
|
|
|
|
|
||||||||||
|
Benefits paid
|
(35
|
)
|
(19
|
)
|
(54
|
)
|
31
|
|
(23
|
)
|
|||||
|
Contributions by the Group
|
—
|
|
—
|
|
—
|
|
(23
|
)
|
(23
|
)
|
|||||
|
Contributions by the plan participants
|
3
|
|
1
|
|
4
|
|
(4
|
)
|
—
|
|
|||||
|
At December 31, 2018
|
789
|
|
201
|
|
990
|
|
(380
|
)
|
610
|
|
|||||
25.6 Benefit plan amendments
In the third quarter of
2018
, the Group announced a plan to transfer certain participants in the Constellium Rolled Products Ravenswood Retiree Medical and Life Insurance Plan (“the Plan”) from a company sponsored program to a third-party health network that provides similar benefits at a lower cost. This change in benefits was accounted for as a plan amendment and resulted in a reduction of the defined benefit obligation and the recognition of a
€36 million
gain from negative past service cost. In 2019, the defined benefit obligation was adjusted and corresponding past service costs of
€3 million
were recorded, to reflect delays in the estimated implementation timetable (see
25.7 Ravenswood OPEB dispute
).
During the year ended December 31, 2019, the Group decided to terminate the medical care plan for the active participants of one of its French entities effective October 1, 2019. This resulted in both a decrease of the defined benefit obligation and the recognition of a
€2 million
gain from negative past service cost. In addition, the Group offered lump sum option to Constellium Rolled Products Ravenswood former employees with deferred benefits. This resulted in both a decrease of the defined benefit obligation and the recognition of a
€3 million
gain from negative past service cost.
25.7 Ravenswood OPEB dispute
s
The United Steelworkers Local Union 5668 (the “Union”) is contesting the OPEB Amendments and filed a lawsuit against Constellium Rolled Products Ravenswood, LLC ("Ravenswood") in a federal district court in West Virginia (the “Court”) seeking to enjoin the Plan changes and to compel arbitration. The Court issued an order in December 2018, enjoining Ravenswood from implementing the OPEB Amendments pending resolution in arbitration. In September 2019, the arbitrator issued a decision ruling against Ravenswood and sustaining the Union’s grievance. Ravenswood filed a motion to vacate this decision, which is still pending, and will continue to vigorously defend this case. The Group believes it has a strong legal position and that it is probable that Ravenswood will ultimately prevail and be able to implement the OPEB amendments.
F-59
Additionally, during 2019, the Union filed a grievance disputing the existing limitation of Ravenswood’s liability for the healthcare costs of pre-Medicare retirees. This matter is scheduled to be arbitrated in the coming months and the Group believes it is without merit and intends to defend it vigorously.
25.8 Net defined benefit obligations by country
|
At December 31, 2019
|
At December 31, 2018
|
|||||||||||||||||
|
(in millions of Euros)
|
Defined benefit obligations
|
Plan assets
|
Net defined benefit liability
|
Defined benefit obligations
|
Plan assets
|
Net defined benefit liability
|
||||||||||||
|
France
|
161
|
|
(3
|
)
|
158
|
|
151
|
|
(3
|
)
|
148
|
|
||||||
|
Germany
|
144
|
|
(1
|
)
|
143
|
|
136
|
|
(1
|
)
|
135
|
|
||||||
|
Switzerland
|
299
|
|
(214
|
)
|
85
|
|
251
|
|
(178
|
)
|
73
|
|
||||||
|
United States
|
510
|
|
(227
|
)
|
283
|
|
451
|
|
(198
|
)
|
253
|
|
||||||
|
Other countries
|
1
|
|
—
|
|
1
|
|
1
|
|
—
|
|
1
|
|
||||||
|
Total
|
1,115
|
|
(445
|
)
|
670
|
|
990
|
|
(380
|
)
|
610
|
|
||||||
25.9 Plan asset categories
|
At December 31, 2019
|
At December 31, 2018
|
|||||||||||||||||
|
(in millions of Euros)
|
Quoted in an active market
|
Unquoted in an active market
|
Total
|
Quoted in an active market
|
Unquoted in an active market
|
Total
|
||||||||||||
|
Cash & cash equivalents
|
5
|
|
—
|
|
5
|
|
6
|
|
—
|
|
6
|
|
||||||
|
Equities
|
119
|
|
51
|
|
170
|
|
95
|
|
40
|
|
135
|
|
||||||
|
Bonds
|
92
|
|
115
|
|
207
|
|
71
|
|
110
|
|
181
|
|
||||||
|
Property
|
14
|
|
37
|
|
51
|
|
10
|
|
33
|
|
43
|
|
||||||
|
Other
|
—
|
|
12
|
|
12
|
|
5
|
|
10
|
|
15
|
|
||||||
|
Total fair value of plan assets
|
230
|
|
215
|
|
445
|
|
187
|
|
193
|
|
380
|
|
||||||
25.10 Cash flows
Expected contributions to pension and other benefits amount to
€32 million
and
€18 million
, respectively, for the year ending December 31, 2020.
Future benefit payments expected to be paid either by pension funds or directly by the Company to beneficiaries are as follows:
|
(in millions of Euros)
|
Estimated benefits payments
|
||
|
Year ended December 31,
|
|||
|
2020
|
54
|
|
|
|
2021
|
51
|
|
|
|
2022
|
52
|
|
|
|
2023
|
53
|
|
|
|
2024
|
58
|
|
|
|
2025 to 2029
|
289
|
|
|
At
December 31, 2019
, the weighted-average maturity of the defined benefit obligations was
14.1 years
(
2018
:
13.3 years
).
F-60
|
(in millions of Euros)
|
Notes
|
Close down and environmental remediation costs
|
Restructuring
costs |
Legal claims
and other costs |
Total
|
|||||||||
|
At January 1, 2019
|
83
|
|
3
|
|
54
|
|
140
|
|
||||||
|
IFRIC 23 application
|
2
|
—
|
|
—
|
|
(20
|
)
|
(20
|
)
|
|||||
|
Allowance
|
1
|
|
2
|
|
6
|
|
9
|
|
||||||
|
Amounts used
|
(2
|
)
|
(1
|
)
|
(4
|
)
|
(7
|
)
|
||||||
|
Unused amounts reversed
|
(1
|
)
|
—
|
|
(4
|
)
|
(5
|
)
|
||||||
|
Unwinding of discounts
|
4
|
|
—
|
|
—
|
|
4
|
|
||||||
|
Effects of changes in foreign exchange rates
|
2
|
|
—
|
|
—
|
|
2
|
|
||||||
|
Transfer
|
3
|
|
—
|
|
(4
|
)
|
(1
|
)
|
||||||
|
At December 31, 2019
|
90
|
|
4
|
|
28
|
|
122
|
|
||||||
|
Current
|
7
|
|
2
|
|
14
|
|
23
|
|
||||||
|
Non-Current
|
83
|
|
2
|
|
14
|
|
99
|
|
||||||
|
Total Provisions
|
90
|
|
4
|
|
28
|
|
122
|
|
||||||
|
(in millions of Euros)
|
Notes
|
Close down and environmental remediation costs
|
Restructuring
costs |
Legal claims
and other costs |
Total
|
|||||||||
|
At January 1, 2018
|
81
|
|
5
|
|
67
|
|
153
|
|
||||||
|
Transfer from provision to contract liability
|
—
|
|
—
|
|
(23
|
)
|
(23
|
)
|
||||||
|
Allowance
|
3
|
|
1
|
|
15
|
|
19
|
|
||||||
|
Amounts used
|
(2
|
)
|
(2
|
)
|
(4
|
)
|
(8
|
)
|
||||||
|
Unused amounts reversed
|
—
|
|
(1
|
)
|
(6
|
)
|
(7
|
)
|
||||||
|
Unwinding of discounts
|
(1
|
)
|
—
|
|
—
|
|
(1
|
)
|
||||||
|
Effects of changes in foreign exchange rates
|
2
|
|
—
|
|
1
|
|
3
|
|
||||||
|
Transfer
|
—
|
|
—
|
|
4
|
|
4
|
|
||||||
|
At December 31, 2018
|
83
|
|
3
|
|
54
|
|
140
|
|
||||||
|
Current
|
5
|
|
1
|
|
40
|
|
46
|
|
||||||
|
Non-Current
|
78
|
|
2
|
|
14
|
|
94
|
|
||||||
|
Total Provisions
|
83
|
|
3
|
|
54
|
|
140
|
|
||||||
Close down, environmental and remediation costs
The Group records provisions for the estimated present value of the costs of its environmental clean-up obligations and close down and restoration efforts based on the net present value of estimated future costs of the dismantling and demolition of infrastructure and the removal of residual material of disturbed areas, using an average discount rate of
0.28%
. A change in the discount rate of
0.5%
would change the provision by
€3 million
.
It is expected that these provisions will be settled over the next
40 years
depending on the nature of the disturbance and the technical remediation plans.
Restructuring costs
The Group records provisions for restructuring costs when management has a detailed formal plan, is demonstrably committed to its execution and can reasonably estimate the associated liabilities. The related expenses are presented as Restructuring costs in the Consolidated Income Statement.
F-61
Legal claims and other costs
|
(in millions of Euros)
|
At December 31, 2019
|
At December 31, 2018
|
||||
|
Litigation (A)
|
21
|
|
45
|
|
||
|
Disease claims (B)
|
4
|
|
4
|
|
||
|
Other
|
3
|
|
5
|
|
||
|
Total Provisions for legal claims and other costs
|
28
|
|
54
|
|
||
|
(A)
|
The decrease in provisions for litigation is mainly explained by the
€20 million
reclassification upon the adoption of IFRIC 23.
|
|
(B)
|
Since the early 1990s, certain activities of the Group’s businesses have been subject to claims and lawsuits in France relating to occupational diseases resulting from alleged asbestos exposure, such as mesothelioma and asbestosis. It is not uncommon for the investigation and resolution of such claims to go on over many years as the latency period for acquiring such diseases is typically between
25
and
40
years. For any such claim, it is up to the social security authorities in each jurisdiction to determine if a claim qualifies as an occupational illness claim. If so determined, the Group must settle the case or defend its position in court. At
December 31, 2019
,
seven
cases in which gross negligence is alleged (“faute inexcusable”) remain outstanding (
six
at
December 31, 2018
), the average amount per claim being less than
€0.1 million
. The average settlement amount per claim in
2019
and
2018
was less than
€0.1 million
. It is not anticipated that the resolution of such litigation and proceedings will have a material effect on the future results from continuing operations, financial position, or cash flows of the Group.
|
Contingencies
The Group is involved, and may become involved, in various lawsuits, claims and proceedings relating to customer claims, product liability, employee and retiree benefit matters and other commercial matters. The Group records provisions for pending litigation matters when it determines that it is probable that an outflow of resources will be required to settle the obligation, and such amounts can be reasonably estimated. In some proceedings, the issues raised are or can be highly complex and subject to significant uncertainties and amounts claimed are and can be substantial. As a result, the probability of loss and an estimation of damages are and can be difficult to ascertain. In exceptional cases, when the Group considers that disclosures relating to provisions and contingencies may prejudice its position, disclosures are limited to the general nature of the dispute.
The Group is currently subject to an arbitration by a customer claiming that Constellium supplied defective products as a result of which the customer alleges it has suffered significant damages. The Group considers that the claim is without merit on both technical and legal grounds and is vigorously defending the action. For this matter and in respect of others which the Group considers are without merit, while it is possible that an unfavorable outcome may result, after assessing the information available, the Group has concluded that it is not probable that a loss has been incurred.
Property, plant and equipment acquired through leases or financed by third parties amounted to
€75 million
,
€28 million
and
€17 million
for the years ended
December 31, 2019
,
2018
and
2017
, respectively. These leases and financings are excluded from the Statement of Cash Flow as they are non-cash investing transactions.
Fair values of vested Restricted Stock Units and Performance Stock Units amounted to
€8 million
,
€8 million
and
€1 million
for the years ended
December 31, 2019
,
2018
and
2017
, respectively. They are excluded from the Statement of Cash flows as non-cash financing activities.
F-62
At December 31, 2019
, the share capital amounted to
€2,757,348.36
divided into
137,867,418
ordinary shares, each with a nominal value of
two cents
, fully paid-up and of the same class. All shares have the right to
one
vote.
|
(in millions of Euros)
|
|||||||||
|
Number of shares
|
Share capital
|
Share premium
|
|||||||
|
At January 1, 2019
|
135,999,394
|
|
3
|
|
420
|
|
|||
|
New shares issued (A)
|
1,868,024
|
|
—
|
|
—
|
|
|||
|
At December 31, 2019
|
137,867,418
|
|
3
|
|
420
|
|
|||
|
(A)
|
Constellium SE issued and granted
1,868,024
ordinary shares to certain employees related to share-based compensation plans.
|
Non-cancellable lease commitments
The future aggregate minimum lease payments under non-cancellable leases not capitalized are as follows:
|
(in millions of Euros)
|
At December 31, 2019
|
||
|
Less than 1 year
|
5
|
|
|
|
1 to 5 years
|
10
|
|
|
|
More than 5 years
|
1
|
|
|
|
Total non-cancellable lease minimum payments
|
16
|
|
|
Tangible and intangible asset commitments
|
(in millions of Euros)
|
At December 31, 2019
|
At December 31, 2018
|
||||
|
Computer Software
|
2
|
|
1
|
|
||
|
Property, plant and equipment
|
89
|
|
123
|
|
||
|
Total tangible and intangible asset commitments
|
91
|
|
124
|
|
||
Subsidiaries and affiliates
A list of the principal companies controlled by the Group is presented in
NOTE 32 - Subsidiaries and Operating Segments
. Transactions between fully consolidated companies are eliminated when preparing the Consolidated Financial Statements.
Shareholders
On March 28, 2018, Constellium Issoire entered into a
three
-year
€10 million
unsecured revolving credit facility with Bpifrance Financement, an affiliate of one the shareholders of Constellium SE, Bpifrance Participations S.A., a related party.
At December 31, 2019
, the revolving credit facility has a
€7 million
borrowing base.
Key management remuneration
The Group’s key management comprises the Board members and the Executive committee members effectively present during
2019
.
F-63
Executive committee members are those persons having authority and responsibility for planning, directing and controlling the activities of the entity, directly reporting to the CEO.
The costs reported below are compensation and benefits for key management:
|
–
|
Short term employee benefits include their base salary plus bonus;
|
|
–
|
Directors’ fees include annual director fees, Board and committees’ attendance fees;
|
|
–
|
Share-based compensation includes the portion of the IFRS 2 expense as allocated to key management;
|
|
–
|
Post-employment benefits mainly include pension costs;
|
|
–
|
Termination benefits include departure costs.
|
As a result, the aggregate compensation for the Group’s key management is comprised of the following:
|
(in millions of Euros)
|
Year ended December 31, 2019
|
Year ended December 31, 2018
|
Year ended December 31, 2017
|
||||||
|
Short-term employee benefits
|
9
|
|
9
|
|
8
|
|
|||
|
Directors' fees
|
1
|
|
1
|
|
1
|
|
|||
|
Share-based compensation
|
10
|
|
6
|
|
4
|
|
|||
|
Post-employments benefits
|
—
|
|
—
|
|
—
|
|
|||
|
Termination benefits
|
—
|
|
—
|
|
1
|
|
|||
|
Employer social contribution
|
1
|
|
1
|
|
1
|
|
|||
|
Total
|
21
|
|
17
|
|
15
|
|
|||
Description of the plans
Performance-Based Restricted Stock Units (equity-settled)
The Company granted Performance Stock Units (PSUs) to selected employees. These units will vest after three years from the grant date if the following conditions are met:
|
•
|
A vesting condition under which the beneficiaries must be continuously employed by the Company through the end of the vesting period (
3 years
); and
|
|
•
|
For PSUs granted in 2016, a performance condition, contingent on the Total Stockholder Return (TSR) performance of Constellium over the measurement periods compared to the TSR of a specified group of peer companies. PSUs will ultimately vest, depending on the TSR performance at each testing period, based on a vesting multiplier in a range from
0%
to
300%
;
|
|
•
|
For PSUs granted from 2017 to 2019, a performance condition, contingent on the Total Stockholder Return (TSR) performance of Constellium shares over the vesting period compared to the TSR of specified indices. PSUs will ultimately vest based on a vesting multiplier which ranges from
0%
to
200%
.
|
The PSUs granted in March 2016, May 2016, August 2016 and November 2016 achieved, respectively, a TSR performance of
115.9%
,
98.1%
,
191.6%
and
223.8%
at their first testing period,
229.9%
,
217.2%
,
282.2%
and
148.7%
at their second testing period, and
108.4%
,
125.4%
,
230.4%
and
286.4%
at their third testing period, which represented respectively
184,469
potential additional shares in 2017,
433,032
potential additional shares in 2018, and
248,230
potential additional shares in 2019.
The PSUs vested respectively in March 2019, May 2019, August 2019 and November 2019 and
684,329
shares,
123,336
shares,
434,256
shares and
516,141
shares were respectively granted to beneficiaries.
F-64
The following table lists the inputs to the model used for the PSUs granted in
2019
and
2018
:
|
Year ended December 31, 2019
|
Year ended December 31, 2018
|
|||||
|
Fair value at grant date (in euros)
|
10.44
|
|
15.31
|
|
||
|
Share price at grant date (in euros)
|
7.1
|
|
10.27
|
|
||
|
Dividend yield
|
—
|
|
—
|
|
||
|
Expected volatility (A)
|
52
|
%
|
75
|
%
|
||
|
Risk-free interest rate (US government bond yield)
|
2.29
|
%
|
2.6
|
%
|
||
|
Model used
|
Monte Carlo
|
|
Monte Carlo
|
|
||
|
(A)
|
Volatilities for the Company and companies included in indices were estimated based on observed historical volatilities over period equal to PSU vesting period.
|
Restricted Stock Units Award Agreements (equity-settled)
The Company granted Restricted Stock Units (RSUs) to a certain number of employees’ subject to the beneficiaries remaining continuously employed within the Group from the grant date through the end of the vesting period. Vesting period is
three years
.
The fair value of RSUs awarded under the plans described above is the quoted market price at grant date.
Equity Awards Plans (equity-settled)
In 2019, our Company Board members were granted
two
RSU awards. These RSUs vest in equal installments on the earlier of (i) the first anniversary or (ii) the date of the annual general meeting of shareholders of that year, and on the earlier of (i) the second anniversary or (ii) the date of the annual general meeting of shareholders of that year, subject to continued service.
The fair value of RSUs awarded under the plan is the quoted market price at grant date.
Expense recognized during the year
In accordance with IFRS 2, share-based compensation is recognized as an expense over the vesting period. The estimate of this expense is based upon the fair value of a potential ordinary share at the grant date. The total expense related to the potential ordinary shares for the year ended
December 31, 2019
,
2018
and
2017
amounted to
€16 million
,
€12 million
and
€8 million
respectively.
F-65
Movement of potential shares
The following table illustrates the number and movements in potential shares:
|
Performance-Based RSU
|
Restricted Stock Units
|
Equity Award Plans
|
|||||||||||||||||||
|
Potential Shares
|
Weighted-Average Grant-Date Fair Value per Share
|
Potential Shares
|
Weighted-Average Grant-Date Fair Value per Share
|
Potential Shares
|
Weighted-Average Grant-Date Fair Value per Share
|
||||||||||||||||
|
At January 1, 2018
|
3,257,840
|
|
€
|
8.56
|
|
944,500
|
|
€
|
7.76
|
|
95,340
|
|
€
|
5.20
|
|
||||||
|
Granted
|
701,109
|
|
€
|
15.31
|
|
595,687
|
|
€
|
10.23
|
|
30,709
|
|
€
|
10.27
|
|
||||||
|
Over-performance
|
633,670
|
|
€
|
7.28
|
|
—
|
|
€
|
—
|
|
—
|
|
€
|
—
|
|
||||||
|
Vested
|
(1,265,635
|
)
|
€
|
7.09
|
|
(155,000
|
)
|
€
|
10.83
|
|
(68,136
|
)
|
€
|
4.85
|
|
||||||
|
Forfeited
|
(241,820
|
)
|
€
|
8.40
|
|
(72,663
|
)
|
€
|
8.57
|
|
—
|
|
€
|
—
|
|
||||||
|
At December 31, 2018
|
3,085,164
|
|
€
|
10.45
|
|
1,312,524
|
|
€
|
8.47
|
|
57,913
|
|
€
|
8.31
|
|
||||||
|
Granted (A)
|
1,028,342
|
|
€
|
10.44
|
|
899,926
|
|
€
|
7.10
|
|
73,799
|
|
€
|
8.39
|
|
||||||
|
Over-performance (B)
|
248,230
|
|
€
|
8.94
|
|
—
|
|
€
|
—
|
|
—
|
|
€
|
—
|
|
||||||
|
Vested
|
(1,758,062
|
)
|
€
|
7.97
|
|
(106,000
|
)
|
€
|
4.55
|
|
(42,559
|
)
|
€
|
7.60
|
|
||||||
|
Forfeited (C)
|
(84,380
|
)
|
€
|
8.02
|
|
(39,947
|
)
|
€
|
8.31
|
|
(9,627
|
)
|
€
|
8.71
|
|
||||||
|
At December 31, 2019
|
2,519,294
|
|
€
|
12.11
|
|
2,066,503
|
|
€
|
8.08
|
|
79,526
|
|
€
|
8.71
|
|
||||||
|
(A)
|
For PSUs, the number of potential shares granted is presented using a vesting multiplier of
100%
.
|
|
(B)
|
When the achievement of TSR performance exceeds the vesting multiplier of
100%
, the additional potential shares are presented as over-performance shares.
|
|
(C)
|
For potential shares related to PSUs,
84,380
were forfeited following the departure of certain beneficiaries and
none
were forfeited in relation to the non-fulfilment of performance conditions.
|
The following Group’s affiliates are legal entities included in the Consolidated Financial Statements of the Group at
December 31, 2019
.
|
Entity
|
Country
|
% Group Interest
|
Consolidation
Method |
||||
|
Cross Operating Segment
|
|||||||
|
Constellium Singen GmbH (AS&I and P&ARP)
|
Germany
|
100
|
%
|
Full
|
|||
|
Constellium Valais S.A. (AS&I and A&T)
|
Switzerland
|
100
|
%
|
Full
|
|||
|
AS&I
|
|||||||
|
Constellium Automotive USA, LLC
|
U.S.
|
100
|
%
|
Full
|
|||
|
Constellium Engley (Changchun) Automotive Structures Co Ltd.
|
China
|
54
|
%
|
Full
|
|||
|
Constellium Extrusions Decin S.r.o.
|
Czech Republic
|
100
|
%
|
Full
|
|||
|
Constellium Extrusions Deutschland GmbH
|
Germany
|
100
|
%
|
Full
|
|||
|
Constellium Extrusions Landau GmbH
|
Germany
|
100
|
%
|
Full
|
|||
|
Constellium Extrusions Burg GmbH
|
Germany
|
100
|
%
|
Full
|
|||
|
Constellium Extrusions France S.A.S.
|
France
|
100
|
%
|
Full
|
|||
|
Constellium Extrusions Levice S.r.o.
|
Slovakia
|
100
|
%
|
Full
|
|||
|
Constellium Automotive Mexico, S. DE R.L. DE C.V.
|
Mexico
|
100
|
%
|
Full
|
|||
F-66
|
Constellium Automotive Mexico Trading, S. DE R.L. DE C.V.
|
Mexico
|
100
|
%
|
Full
|
|||
|
Astrex Inc
|
Canada
|
50
|
%
|
Full
|
|||
|
Constellium Automotive Zilina S.r.o.
|
Slovakia
|
100
|
%
|
Full
|
|||
|
Constellium Automotive Nanjing Co Ltd
|
China
|
100
|
%
|
Full
|
|||
|
Constellium Automotive Spain SL
|
Spain
|
100
|
%
|
Full
|
|||
|
A&T
|
|||||||
|
Constellium Issoire S.A.S.
|
France
|
100
|
%
|
Full
|
|||
|
Constellium Montreuil Juigné S.A.S.
|
France
|
100
|
%
|
Full
|
|||
|
Constellium China Limited
|
China
|
100
|
%
|
Full
|
|||
|
Constellium Japan KK
|
Japan
|
100
|
%
|
Full
|
|||
|
Constellium Rolled Products Ravenswood, LLC
|
U.S.
|
100
|
%
|
Full
|
|||
|
Constellium Southeast Asia PTE LTD
|
Singapore
|
100
|
%
|
Full
|
|||
|
Constellium Ussel S.A.S.
|
France
|
100
|
%
|
Full
|
|||
|
AluInfra Services SA (A)
|
Switzerland
|
50
|
%
|
Full
|
|||
|
P&ARP
|
|||||||
|
Constellium Deutschland GmbH
|
Germany
|
100
|
%
|
Full
|
|||
|
Constellium Rolled Products Singen GmbH KG
|
Germany
|
100
|
%
|
Full
|
|||
|
Constellium Property and Equipment Company, LLC
|
U.S.
|
100
|
%
|
Full
|
|||
|
Constellium Neuf Brisach S.A.S.
|
France
|
100
|
%
|
Full
|
|||
|
Constellium Muscle Shoals LLC
|
U.S.
|
100
|
%
|
Full
|
|||
|
Constellium Holding Muscle Shoals LLC
|
U.S.
|
100
|
%
|
Full
|
|||
|
Constellium Muscle Shoals Funding II LLC
|
U.S.
|
100
|
%
|
Full
|
|||
|
Listerhill Total Maintenance Center LLC
|
U.S.
|
100
|
%
|
Full
|
|||
|
Constellium Metal Procurement LLC
|
U.S.
|
100
|
%
|
Full
|
|||
|
Constellium Bowling Green LLC
|
U.S.
|
100
|
%
|
Full
|
|||
|
Rhenaroll
|
France
|
50
|
%
|
Equity
|
|||
|
Holdings & Corporate
|
|||||||
|
C-TEC Constellium Technology Center S.A.S.
|
France
|
100
|
%
|
Full
|
|||
|
Constellium Finance S.A.S.
|
France
|
100
|
%
|
Full
|
|||
|
Constellium France III
|
France
|
100
|
%
|
Full
|
|||
|
Constellium France Holdco S.A.S.
|
France
|
100
|
%
|
Full
|
|||
|
Constellium International
|
France
|
100
|
%
|
Full
|
|||
|
Constellium Paris S.A.S
|
France
|
100
|
%
|
Full
|
|||
|
Constellium Germany Holdco GmbH & Co. KG
|
Germany
|
100
|
%
|
Full
|
|||
|
Constellium Germany Verwaltungs GmbH
|
Germany
|
100
|
%
|
Full
|
|||
|
Constellium UK Limited
|
United Kingdom
|
100
|
%
|
Full
|
|||
|
Constellium U.S. Holdings I, LLC
|
U.S.
|
100
|
%
|
Full
|
|||
|
Constellium Switzerland AG
|
Switzerland
|
100
|
%
|
Full
|
|||
|
Constellium W S.A.S.
|
France
|
100
|
%
|
Full
|
|||
|
Constellium Treuhand UG
|
Germany
|
100
|
%
|
Full
|
|||
|
Engineered Products International S.A.S.
|
France
|
100
|
%
|
Full
|
|||
|
(A)
|
AluInfra Services SA, the joint venture created with Novelis in July 2018, is consolidated as a joint operation and is immaterial to the Group Consolidated Financial Statements.
|
F-67
Statement of Financial Position of Constellium SE (parent company only).
|
(in millions of Euros)
|
At December 31, 2019
|
At December 31, 2018
|
||||
|
Assets
|
||||||
|
Current assets
|
||||||
|
Cash and cash equivalents
|
—
|
|
—
|
|
||
|
Trade receivables and other
|
200
|
|
109
|
|
||
|
Other financial assets
|
37
|
|
38
|
|
||
|
237
|
|
147
|
|
|||
|
Non-current assets
|
||||||
|
Property, plant and equipment
|
—
|
|
—
|
|
||
|
Financial assets
|
2,002
|
|
2,106
|
|
||
|
Investments in subsidiaries
|
159
|
|
144
|
|
||
|
Trade receivables and other
|
27
|
|
—
|
|
||
|
Deferred income tax assets
|
1
|
|
2
|
|
||
|
2,189
|
|
2,252
|
|
|||
|
Total Assets
|
2,426
|
|
2,399
|
|
||
|
Liabilities
|
||||||
|
Current liabilities
|
||||||
|
Trade payables and other
|
6
|
|
5
|
|
||
|
Income tax payable
|
45
|
|
21
|
|
||
|
Other financial liabilities
|
33
|
|
33
|
|
||
|
84
|
|
59
|
|
|||
|
Non-current liabilities
|
||||||
|
Borrowings
|
1,954
|
|
2,022
|
|
||
|
Income tax payable
|
19
|
|
—
|
|
||
|
1,973
|
|
2,022
|
|
|||
|
Total Liabilities
|
2,057
|
|
2,081
|
|
||
|
Equity
|
||||||
|
Share capital
|
3
|
|
3
|
|
||
|
Share premium
|
429
|
|
429
|
|
||
|
Accumulated retained earnings
|
(153
|
)
|
(239
|
)
|
||
|
Other reserves
|
53
|
|
38
|
|
||
|
Net income
|
37
|
|
87
|
|
||
|
Total Equity
|
369
|
|
318
|
|
||
|
Total Equity and Liabilities
|
2,426
|
|
2,399
|
|
||
F-68
Statement of Comprehensive income / (loss) of Constellium SE (parent company only).
|
(in millions of Euros)
|
Year ended December 31, 2019
|
Year ended December 31, 2018
|
Year ended December 31, 2017
|
||||||
|
Revenue
|
3
|
|
3
|
|
1
|
|
|||
|
Gross profit
|
3
|
|
3
|
|
1
|
|
|||
|
Selling and administrative expenses
|
(19
|
)
|
(15
|
)
|
(5
|
)
|
|||
|
Employee benefit expenses
|
(3
|
)
|
(3
|
)
|
(1
|
)
|
|||
|
Loss from recurring operations
|
(19
|
)
|
(15
|
)
|
(5
|
)
|
|||
|
Other income
|
—
|
|
—
|
|
—
|
|
|||
|
Other expense
|
(3
|
)
|
(3
|
)
|
—
|
|
|||
|
Loss from operations
|
(22
|
)
|
(18
|
)
|
(5
|
)
|
|||
|
Financial result - net
|
41
|
|
80
|
|
(65
|
)
|
|||
|
Income / (loss) before income tax
|
19
|
|
62
|
|
(70
|
)
|
|||
|
Income tax
|
18
|
|
25
|
|
—
|
|
|||
|
Net income / (loss)
|
37
|
|
87
|
|
(70
|
)
|
|||
|
Other comprehensive income / (loss)
|
—
|
|
—
|
|
—
|
|
|||
|
Total comprehensive income / (loss)
|
37
|
|
87
|
|
(70
|
)
|
|||
F-69
Statement of Cash Flows of Constellium SE (parent company only)
|
(in millions of Euros)
|
Year ended December 31, 2019
|
Year ended December 31, 2018
|
Year ended December 31, 2017
|
||||||
|
Net income / (loss)
|
37
|
|
87
|
|
(70
|
)
|
|||
|
Adjustments
|
|||||||||
|
Finance cost - net
|
(41
|
)
|
(80
|
)
|
65
|
|
|||
|
Dividend received
|
—
|
|
—
|
|
—
|
|
|||
|
Income tax
|
(18
|
)
|
(25
|
)
|
—
|
|
|||
|
Interest paid
|
(115
|
)
|
(102
|
)
|
(148
|
)
|
|||
|
Interest received
|
143
|
|
134
|
|
149
|
|
|||
|
Changes in working capital
|
—
|
|
—
|
|
—
|
|
|||
|
Trade receivables and other
|
27
|
|
—
|
|
(1
|
)
|
|||
|
Income tax paid
|
50
|
|
—
|
|
—
|
|
|||
|
Trade payables and other
|
2
|
|
—
|
|
2
|
|
|||
|
Net cash flows from / (used in) operating activities
|
85
|
|
14
|
|
(3
|
)
|
|||
|
Investments in subsidiaries
|
—
|
|
(1
|
)
|
(11
|
)
|
|||
|
Current account with subsidiaries and related parties
|
(135
|
)
|
(13
|
)
|
180
|
|
|||
|
Loans granted to subsidiaries and related parties
|
—
|
|
—
|
|
(1,640
|
)
|
|||
|
Repayment of loans granted to subsidiaries and related parties
|
150
|
|
—
|
|
823
|
|
|||
|
Exit fees received from subsidiaries
|
—
|
|
—
|
|
9
|
|
|||
|
Net cash flows from / (used in) investing activities
|
15
|
|
(14
|
)
|
(639
|
)
|
|||
|
Net proceeds received from issuance of shares
|
—
|
|
—
|
|
259
|
|
|||
|
Proceeds from issuance of Senior Notes
|
—
|
|
—
|
|
1,440
|
|
|||
|
Payment of deferred financing costs
|
—
|
|
—
|
|
(29
|
)
|
|||
|
Repayment of Senior Notes
|
(100
|
)
|
—
|
|
(949
|
)
|
|||
|
Payment of exit fees
|
—
|
|
—
|
|
(61
|
)
|
|||
|
Realized foreign exchange gains / (losses)
|
—
|
|
—
|
|
(17
|
)
|
|||
|
Other
|
—
|
|
—
|
|
(1
|
)
|
|||
|
Net cash flows (used in) / from financing activities
|
(100
|
)
|
—
|
|
642
|
|
|||
|
Net increase in cash and cash equivalents
|
—
|
|
—
|
|
—
|
|
|||
|
Cash and cash equivalents - beginning of year
|
—
|
|
—
|
|
—
|
|
|||
|
Effect of exchange rate changes on cash and cash equivalents
|
—
|
|
—
|
|
—
|
|
|||
|
Cash and cash equivalents - end of year
|
—
|
|
—
|
|
—
|
|
|||
Basis of preparation
The parent company only financial information of Constellium SE, presented above, is prepared in accordance with International Financial Reporting Standards as issued by the International Accounting Standards Board and as endorsed by the European Union. Accounting policies adopted in the preparation of this condensed parent company only financial information are the same as those adopted in the consolidated financial statements and described in
NOTE 2 - Summary of Significant Accounting Policies
, except that the cost method has been used to account for investments in subsidiaries.
As at
December 31, 2019
, there were no material contingencies at Constellium SE.
A description of Constellium SE's parent company only borrowings and related maturity dates is provided in
NOTE 22 - Borrowings
. Other financial liabilities represent interest payable on borrowings.
Non-current financial assets represent loans to Constellium International and Constellium France Holdco, and current other financial assets represent related interest receivables.
F-70
No subsequent events identified.
F-71
TABLE OF CONTENTS
Part IItem 1. Identity Of Directors, Senior Management and AdvisersItem 2. Offer Statistics and Expected TimetableItem 3. Key InformationItem 4. Information on The CompanyItem 4A. Unresolved Staff CommentsItem 5. Operating and Financial Review and ProspectsItem 6. Directors, Senior Management and EmployeesItem 7. Major Shareholders and Related Party TransactionsItem 8. Financial InformationItem 9. The Offer and ListingItem 10. Additional InformationItem 11. Quantitative and Qualitative Disclosures About Market RiskNote 24 Financial Risk ManagementItem 12. Description Of Securities Other Than Equity SecuritiesPart IIItem 13. Defaults, Dividend Arrearages and DelinquenciesItem 14. Material Modifications To The Rights Of Security Holders and Use Of ProceedsItem 15. Controls and ProceduresItem 16A. Audit Committee Financial ExpertItem 16B. Code Of EthicsItem 16C. Principal Accountant Fees and ServicesItem 16D. Exemptions From The Listing Standards For Audit CommitteesItem 16E. Purchases Of Equity Securities By The Issuer and Affiliated PurchasersItem 16F. Change in Registrant S Certifying AccountantItem 16G. Corporate GovernanceItem 16H. Mine Safety DisclosurePart IIIItem 17. Financial StatementsItem 18. Financial StatementsItem 19. ExhibitsNote 1 - General InformationNote 2 - Summary Of Significant Accounting PoliciesNote 14 - Cash and Cash EquivalentNote 22 - BorrowingsNote 24 - Financial Risk ManagementNote 18 - Intangible Assets (including Goodwill)Note 25 - Pensions and Other Post-employment Benefit ObligationsNote 26 - ProvisionsNote 3 - Acquisition Of Constellium-bowling GreenNote 4 - RevenueNote 5 - Operating Segment InformationNote 32 - Subsidiaries and Operating SegmentsNote 6 - Information By Geographic AreaNote 7 - Expenses By NatureNote 8 - Employee Benefit ExpensesNote 9 - Other Gains / (losses) - NetNote 10 - Currency Gains / (losses)Note 23 - Financial InstrumentsNote 11 - Finance Costs - NetNote 12 - Income TaxNote 13 - Earnings Per ShareNote 14 - Cash and Cash EquivalentsNote 15 - Trade Receivables and OtherNote 16 - InventoriesNote 17 - Property, Plant and EquipmentNote 29 - CommitmentsNote 19 - Investments Accounted For Under The Equity MethodNote 20 - Deferred Income TaxesNote 21 - Trade Payables and OtherNote 27 - Non-cash Investing and Financing TransactionsNote 28 - Share CapitalNote 30 - Related PartiesNote 31 - Share-based CompensationNote 33 - Parent CompanyNote 34 - Subsequent Events